Embed Size (px)
Citation preview
DRAFT INTEGRATED DEVELOPMENT PLAN
2015/2016 REVIEW
MARCH 2015
VISION:
“A PROSPEROUS, SUSTAINABLE & COMMUNITY-ORIENTED CITY"
MISSION:
“TO PROVIDE QUALITY SERVICES TO OUR COMMUNITY THROUGH ACCOUNTABLE GOVERNANCE”
TABLE OF CONTENTS SECTION A: EXECUTIVE SUMMARY 1 – 7
1. Introduction 1 2. The Legislative Framework 1 2.1 Process Plan 2 2.2 Stakeholder Participation 2 2.3 IDP Assessment 3 2.4 National Development Plan 3 - 4 2.5 Government Priorities – 12 Outcomes 4 2.6 MEC Comments on 2013/14 Review IDP 4 2.7 Council and Council Committees 5 3. Components of the MCLM IDP Document 5 -7
SECTION B: SITUATIONAL ANALYSIS 8 - 72
1. Local profile 8 - 9 2. Demographics 10 2.1 Demographic Analysis 10 2.2 Population Data 10 2.3 Age and Gender Profile 10 2.4 Population 10 2.5 Population (age) Breakdown 10 2.6 Households 11 2.7 Income Levels 12 2.8 Percentage of households with access to full services 13 2.9 Water Service Delivery Levels 14 2.10 Access to sanitation 14 2.11 Access to waste removal 15 2.12 Access to Electricity 15 2.13 Percentage of households with access to basic housing 15 3. Socio-Economic Analysis 16 - 18 4. Economic Profile 19 - 22 5. Environmental Analysis 23 - 25 6. Natural Resources/ Economic Sectoral Production 26 7. Overview of Neighbourhoods within MCLM 27 8. Functional Mandate 28 9. Infrastructure Backlog and Norms & Standards 29 - 31 10. Community Priorities 32 - 39 11. Consolidated Infrastructure Plan 40 - 60 12. Institutional Structure and Vacancies 61 13. Financial Performance Overview 62 - 63 14. 12 Government Outcomes 64 - 67 15. Addressing MEC Comments 68 - 70 16. SWOT Analysis 71
SECTION C - F: VISION, MISSION AND STRATEGIC GOALS 72
1. Vision 72 2. Mission 72 3. Visioning (Core business Values) 72 4. Strategic goals & objectives framework 72
SECTION G: KEY PERFORMANCE AREAS 73 - 300 KEY PERFORMANCE AREA 1: BASIC SERVICE DELIVERY 74 Pre-Determined Objectives 74 - 82
Mini Business Plans 83 - 112 Budget and IDP Alignment 113 - 117 Project List 118 - 131
Khutsong Resettlement Plan 132 - 138
KEY PERFORMANCE AREA 2: To promote Local Economic Development 139 Mining Social Labour Plans 140
KEY PERFORMANCE AREA 3: To Promote Municipal Transformation & Organizational Development 141 - 143 KEY PERFORMANCE AREA 4:
To ensure Municipal Financial Viability & Management 144 Fiscal Plan 145 - 162
KEY PERFORMANCE AREA 5:
To ensure Good Governance and Public Participation 163 - 165
KEY PERFORMANCE AREA 6: Spatial Development Framework 166 - 300
SECTION H: PROVINCIAL SECTOR PROGRAMMES 301 - 305 SECTION I: ANNEXURES 306 J1: Detailed Spatial Development Framework J2: Integrated Waste Management J3: A. Water Service Development Plan (WSAs) B. Water Resources Plan J4: Integrated Transport Plan J5: Housing Plan J6: Detailed Disaster Management Plan J7: Growth and Development Strategy J8: Anti Corruption Strategy J9: HIV/Aids Strategy J10: Performance Management Framework Policy J11: Environmental Analysis J12: SDBIP J13: Risk Management Strategy J14: GEYODI Plan J15: Poverty Alleviation Plan
SECTION: A
EXECUTIVE SUMMARY
SECTION: B
SITUATIONAL ANALYSIS
SECTION: C - F
VISION, MISSION
& STRATEGIC GOALS OBJECTIVES
FRAMEWORK
SECTION: G
KEY PERFORMANCE AREAS
KPA 1: Basic Service Delivery
KPA 2: Local Economic Development
KPA 3: To Promote Municipal Transformation & Organizational Development
KPA 4: To Ensure Municipal Financial Viability & Management
KPA 5: To Ensure Good Governance & Public Participation
KPA 6: Spatial Rationale/Analysis.
SECTION: H
PROVINCIAL SECTOR PROGRAMMES
SECTION: I
ANNEXURES
SECTION A
EXECUTIVE SUMMARY
1. INTRODUCTION
An Integrated Development Plan, adopted by the council of a municipality is the key strategic planning tool for the municipality. It is described in the Municipal Systems Act (MSA) as: 35(1)(a)”…the principal strategic planning instrument which guides and informs all planning and development and all decisions with regard to planning, management and development in the municipality”. (b)”binds the municipality in the exercise of its executive authority”. The IDP serves as a single broad strategic guide of the broader community and residents of MCLM priority issues that government should implement in this term of Council. It also assists administration to prepare a medium term finance framework and annual budget that seek to allocate resources to address all these needs. In reviewing the five (5) year IDP plan, it is important to be mindful of alignment with all spheres of government i.e. National, Provincial and Local Government and also to ensure that there is a clear link between the strategic objectives agreed with the community, the IDP, the budget, SDBIP. The IDP is the delivery plan of the entire government plan. 2. THE LEGISLATIVE FRAMEWORK
The legislation governing the development, implementation and review of the Integrated Development Plan has been conceived in the constitutional spirit of a developmental state. In terms of the provisions of Local Government: Municipal Systems Act of 2000 Section 34 (a) (i) a municipal council must review its integrated development plan annually in accordance with an assessment of its performance measurement in terms of Section 41; and (ii) to the extent that changing circumstances so demand; (b) may amend its integrated development plan in accordance with prescribed process. The following National pieces of legislation and policy frameworks are binding on Merafong City Local Municipality’s planning process and thus guide the entire IDP process:
• The Constitution of the RSA of 1996 • RDP White Paper of 1994 • DFA of 1995 • White paper on Local Government of 1998 • Municipal Systems Act 2000 • Municipal Structures Act of 1998 • Municipal Financial Management Act of 2003 • Provincial Growth and Development Strategy Guidelines • IGR of Act 2005. • National Environmental Management Act of 1998. • MTSF (2009 – 2014). • LGTAS/MTAS (2010). • DORA. • National Development Plan (New)
Draft IDP Document 2015/2016 Page 1
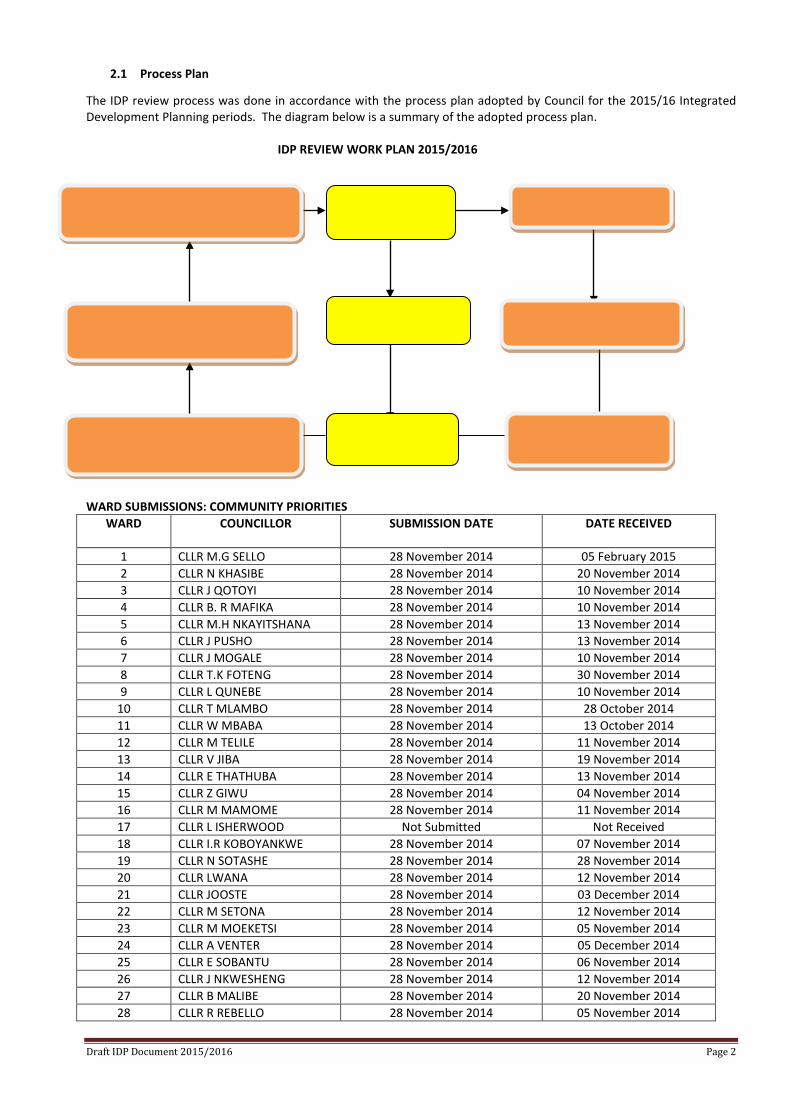
2.1 Process Plan
The IDP review process was done in accordance with the process plan adopted by Council for the 2015/16 Integrated Development Planning periods. The diagram below is a summary of the adopted process plan.
IDP REVIEW WORK PLAN 2015/2016 Multi Sectoral Steering Committee First Draft Public Comments November 2014– March 2015 March 2015 April 2015 Committee & Stakeholders Council Workshop Council IDP Adoption Priority submission May 2015 May/June 2015 October-November 2014
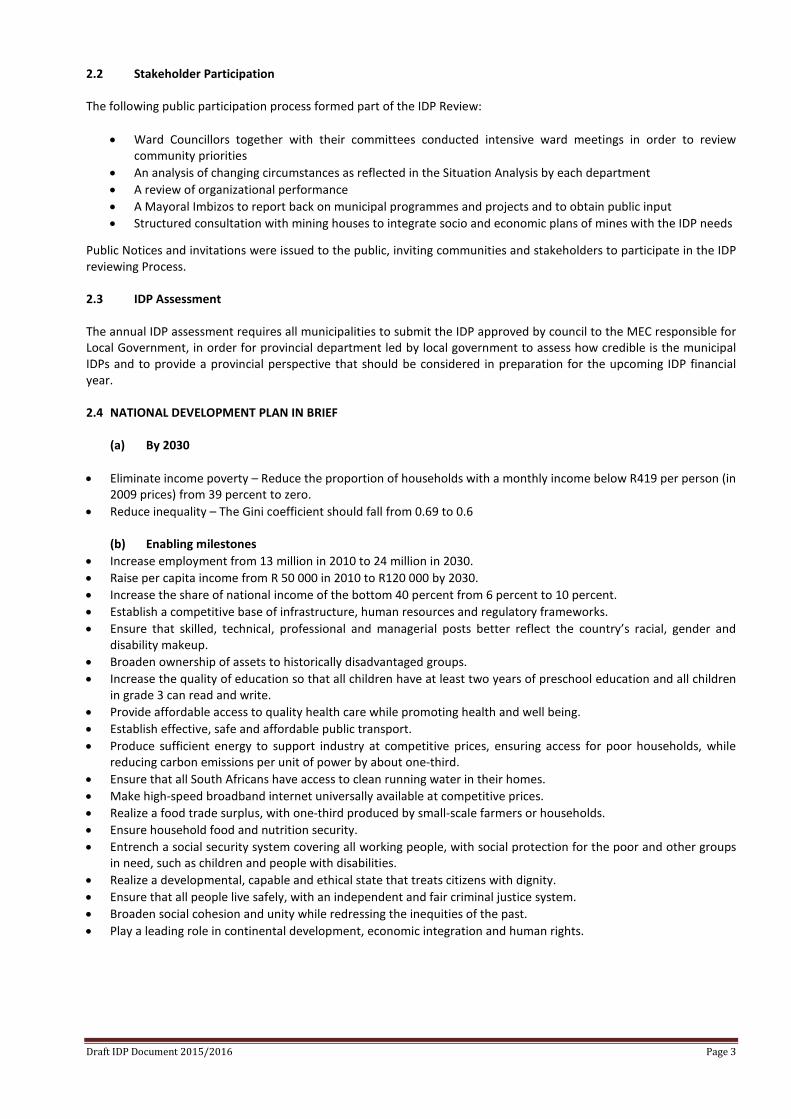
Ward Committee/ Councillor IDP Rep Forum Submission to MEC Notices/Public Notices May 2015 May/June 2015 November 2014 WARD SUBMISSIONS: COMMUNITY PRIORITIES
WARD COUNCILLOR SUBMISSION DATE
DATE RECEIVED
1 CLLR M.G SELLO 28 November 2014 05 February 2015 2 CLLR N KHASIBE 28 November 2014 20 November 2014 3 CLLR J QOTOYI 28 November 2014 10 November 2014 4 CLLR B. R MAFIKA 28 November 2014 10 November 2014 5 CLLR M.H NKAYITSHANA 28 November 2014 13 November 2014 6 CLLR J PUSHO 28 November 2014 13 November 2014 7 CLLR J MOGALE 28 November 2014 10 November 2014 8 CLLR T.K FOTENG 28 November 2014 30 November 2014 9 CLLR L QUNEBE 28 November 2014 10 November 2014
10 CLLR T MLAMBO 28 November 2014 28 October 2014 11 CLLR W MBABA 28 November 2014 13 October 2014 12 CLLR M TELILE 28 November 2014 11 November 2014 13 CLLR V JIBA 28 November 2014 19 November 2014 14 CLLR E THATHUBA 28 November 2014 13 November 2014 15 CLLR Z GIWU 28 November 2014 04 November 2014 16 CLLR M MAMOME 28 November 2014 11 November 2014 17 CLLR L ISHERWOOD Not Submitted Not Received 18 CLLR I.R KOBOYANKWE 28 November 2014 07 November 2014 19 CLLR N SOTASHE 28 November 2014 28 November 2014 20 CLLR LWANA 28 November 2014 12 November 2014 21 CLLR JOOSTE 28 November 2014 03 December 2014 22 CLLR M SETONA 28 November 2014 12 November 2014 23 CLLR M MOEKETSI 28 November 2014 05 November 2014 24 CLLR A VENTER 28 November 2014 05 December 2014 25 CLLR E SOBANTU 28 November 2014 06 November 2014 26 CLLR J NKWESHENG 28 November 2014 12 November 2014 27 CLLR B MALIBE 28 November 2014 20 November 2014 28 CLLR R REBELLO 28 November 2014 05 November 2014
Draft IDP Document 2015/2016 Page 2
2.2 Stakeholder Participation The following public participation process formed part of the IDP Review:
• Ward Councillors together with their committees conducted intensive ward meetings in order to review community priorities
• An analysis of changing circumstances as reflected in the Situation Analysis by each department • A review of organizational performance • A Mayoral Imbizos to report back on municipal programmes and projects and to obtain public input • Structured consultation with mining houses to integrate socio and economic plans of mines with the IDP needs
Public Notices and invitations were issued to the public, inviting communities and stakeholders to participate in the IDP reviewing Process. 2.3 IDP Assessment The annual IDP assessment requires all municipalities to submit the IDP approved by council to the MEC responsible for Local Government, in order for provincial department led by local government to assess how credible is the municipal IDPs and to provide a provincial perspective that should be considered in preparation for the upcoming IDP financial year. 2.4 NATIONAL DEVELOPMENT PLAN IN BRIEF
(a) By 2030
• Eliminate income poverty – Reduce the proportion of households with a monthly income below R419 per person (in
2009 prices) from 39 percent to zero. • Reduce inequality – The Gini coefficient should fall from 0.69 to 0.6
(b) Enabling milestones
• Increase employment from 13 million in 2010 to 24 million in 2030. • Raise per capita income from R 50 000 in 2010 to R120 000 by 2030. • Increase the share of national income of the bottom 40 percent from 6 percent to 10 percent. • Establish a competitive base of infrastructure, human resources and regulatory frameworks. • Ensure that skilled, technical, professional and managerial posts better reflect the country’s racial, gender and
disability makeup. • Broaden ownership of assets to historically disadvantaged groups. • Increase the quality of education so that all children have at least two years of preschool education and all children
in grade 3 can read and write. • Provide affordable access to quality health care while promoting health and well being. • Establish effective, safe and affordable public transport. • Produce sufficient energy to support industry at competitive prices, ensuring access for poor households, while
reducing carbon emissions per unit of power by about one-third. • Ensure that all South Africans have access to clean running water in their homes. • Make high-speed broadband internet universally available at competitive prices. • Realize a food trade surplus, with one-third produced by small-scale farmers or households. • Ensure household food and nutrition security. • Entrench a social security system covering all working people, with social protection for the poor and other groups
in need, such as children and people with disabilities. • Realize a developmental, capable and ethical state that treats citizens with dignity. • Ensure that all people live safely, with an independent and fair criminal justice system. • Broaden social cohesion and unity while redressing the inequities of the past. • Play a leading role in continental development, economic integration and human rights.
Draft IDP Document 2015/2016 Page 3
(c) Critical Actions 1. A social compact to reduce poverty and inequality, and raise employment and investment. 2. A strategy to address poverty and its impacts by broadening access to employment, strengthening the social wage,
improving public transport and raising rural incomes. 3. Steps by the state to professionalize the public service, strengthen accountability, improve coordination and
prosecute corruption. 4. Boost private investment in labour-intensive areas, competitiveness and exports, with adjustments to lower the risk
of hiring younger workers. 5. An education accountability chain, with lines of responsibility from state to classroom. 6. Phase in national health insurance, with a focus on upgrading public health facilities, producing more health
professionals and reducing the relative cost of private health care. 7. Public infrastructure investment at 10 percent of gross domestic product (GDP), financed through tariffs, public-
private partnerships, taxes and loans and focused on transport, energy and water. 8. Interventions to ensure environmental sustainability and resilience to future shocks. 9. New spatial norms and standards – densifying cities, improving transport, locating jobs where people live,
upgrading informal settlements and fixing housing market gaps. 10. Reduce crime by strengthening criminal justice and improving community environments.
2.5 GOVERNMENT PRIORITIES – 12 OUTCOMES The following are twelve (12) key outcomes that have been identified and agreed to by Cabinet:
1. Improved quality of basic education. 2. A long and healthy life for all South Africans. 3. All people in South Africa are and feel safe. 4. Decent employment through inclusive economic growth. 5. A skilled and capable workforce to support and inclusive growth path. 6. An efficient, competitive and responsive economic infrastructure network. 7. Vibrant, equitable and sustainable rural communities with food security for all. 8. Sustainable human settlements and improved quality of household life. 9. A responsive, accountable, effective and efficient local government system. 10. Environmental assets and natural resources those are well protected and continually enhanced. 11. Create a better South Africa and contribute to a better and safer Africa and world. 12. An efficient, effective and development orient public service and an empowered, fair and inclusive citizenship.
2.6 MEC Comments on the 2013/14 Reviewed Integrated Development Planning In terms of Municipal systems Act, 2000, municipality must submit a copy of the IDP approved by council to the office of the MEC for Local Government within ten (10) day of the adoption or amendment of the plan. A municipality must consider the MEC’s comments. The MEC comments provide guidance on the preparation of the IDP in the following year onwards. SECTION 1: Broad Observation – Key Generic Issues
GPG PRIORITIES • Poor use of data that compromises the integrity of IDPs • Free basic services • Need for a shift in Service Delivery Models • Poor Investment in infrastructure Maintenance • Land Audit • Cash Coverage Ratios • Outcome 9: Building effective & efficient local government • Planning for outcomes • Service Delivery Backlogs • Gender, youth and disability(GEYODI) Spatial Planning: • SDF makes no reference to the Capital Investment Framework • Development of the CIF by the municipality is essential. • SDF to indicate sustainable and phased development as part of a future development strategy. Draft IDP Document 2015/2016 Page 4
SECTION 2: Issues Specific to the Municipality
GPG PRIORITIES
Service Delivery Backlogs :
• Implementation of Merafong Revitalization Plan is key
Financial Viability :
• The municipality is urged to develop a comprehensive financial strategy coupled with a financial plan aligned to financial policies.
Spatial Planning:
• SDF makes no reference to the Capital Investment Framework • Development of the CIF by the municipality is essential.
2.7 Council and Council Committees Approval and adoption of the IDP and Budget are few of the non-delegated functions in the municipality. Thus only full council has the responsibility of approving the IDP and Budget. The IDP should be approved before end of the financial year by the MCLM. IDP Representative Forum has to review and recommend that Council approves the IDP prior to Council adoption. 3. COMPONENTS OF THE MCLM IDP DOCUMENT
The Merafong City Local Municipality IDP 2014/15 Document comprises of the following sections: SECTION A: Executive Summary which provides introduction, legislative framework and the context of preparing IDP. SECTION B: This Section consists of the following: the local profile of MCLM, location of the municipality within the Gauteng Province, wards breakdown map, demographic analysis, population and its breakdown according to age and gender, poverty levels and income levels, proportion of households with and without access to basic services, socio economic status, economic activities, natural resources, overview of neighbourhood, functional mandate, community priorities, Consolidated Infrastructure Plan which addresses the backlogs and status quo of the municipality and how best will these backlogs be eradicated, Institutional Structure and Vacancies, financial performance overview, Twelve (12) Government Outcomes, addressing of MEC comments and SWOT analysis SECTION C, D, E AND F: Section C – F comprises of MCLM Vision and Mission, core business values, strategic goals and objectives which will assist the municipalities to achieve the goals it has set. SECTION G: The Developmental Priorities and Objectives as well as Council’s Transformation needs have been identified through the IDP process in accordance with the legislative framework. The objectives and needs are categorized according to the six (6) Key Performance Areas (KPA’s) of the municipality. KPA’s 1, 2 and 6 deals with the Development Priorities and Local Economic Development objectives. KPA’s 3, 4 and 5 deals with the Internal Transformation needs, Financial Viability and Good Governance. KPA 1 AND 2 DEALS WITH DEVELOPMENTAL PRIORITIES AND OBJECTIVES
Draft IDP Document 2015/2016 Page 5
KPA 1: Basic Service Delivery:
Pre-determined Objectives Mini business plans Project list & Budget Summary (CIP) Budget and IDP alignment Khutsong Resettlement Plan and Projects Overview Social labour plans
KPA 2: Local Economic Development:
Pre-determined Objectives
KPA 3, 4 AND 5 DEALS WITH INSTITUTIONAL AND TRANSFORMATIONAL NEEDS: KPA 3: Municipal Transformation and Organizational Development
Pre-determined Objectives Organizational Structure Policies adopted by council Organizational Performance Plan
KPA 4: Financial Viability and Management:
Pre-determined Objectives Fiscal Plan: It is a financial plan over the MTREF period depicts the planned income and expenditure over a
three year term.
KPA 5: Good Governance and Public Participation
Pre-determined Objectives Community Consultation Audit and Risk Management Functioning of Council IDP Process Plan Structure.
KPA 6 DEALS WITH SPATIAL RATIONALE/ANALYSIS
Pre-determined Objectives • Spatial Development Framework.
The framework concentrates on the spatial aspects of development planning; it also attempts to take a more practical approach to strategic spatial planning with great emphasis on the development strategies of the municipality. The SDF takes a broad view on development aspects, with limited reference to the LSDF’s and Precinct Plans, still to be finalized for the Merafong City area.
SECTION H: Provincial Sector Development Programmes:
• Department of Education • Department of Health and Development • Department of Agriculture and Rural Development • Department of Infrastructure Development • Department of Local Government and Housing • Department of Roads and Transport
Draft IDP Document 2015/2016 Page 6
SECTION I: ANNEXURES ANNEXURES J.1 Detailed Spatial Development Framework J.2 Integrated Waste Management Plan
J.3 A. Water Service Development Plan (WSAs) B. Water Resources Plan
J.4 Integrated Transport Plan
J.5 Housing Plan J.6 Detailed Disaster Management Plan (Draft) J.7 A. Growth and Development Strategy
B. Tourism Strategy J.8 Anti Corruption Strategy J.9 HIV/Aids Strategy
J.10 Performance Management Strategy
J. 11 Environmental Analysis
J.12 SDBIP
J.13 Risk Management Strategy
J.14 GEYODI Plan
J.15 Poverty Alleviation Plan
Draft IDP Document 2015/2016 Page 7
SECTION B
SITUATIONAL ANALYSIS 1. LOCAL PROFILE
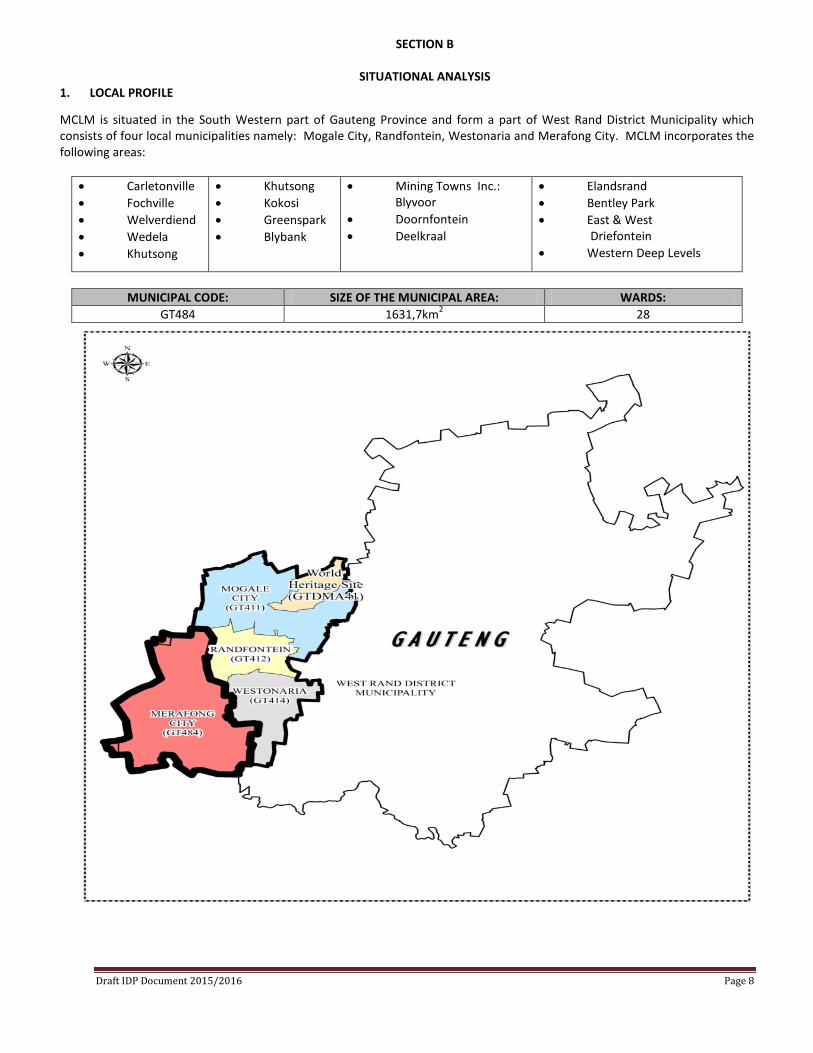
MCLM is situated in the South Western part of Gauteng Province and form a part of West Rand District Municipality which consists of four local municipalities namely: Mogale City, Randfontein, Westonaria and Merafong City. MCLM incorporates the following areas:
• Carletonville • Fochville • Welverdiend • Wedela • Khutsong
• Khutsong • Kokosi • Greenspark • Blybank
• Mining Towns Inc.: Blyvoor
• Doornfontein • Deelkraal
• Elandsrand • Bentley Park • East & West Driefontein • Western Deep Levels
MUNICIPAL CODE: SIZE OF THE MUNICIPAL AREA: WARDS:
GT484 1631,7km2 28
Draft IDP Document 2015/2016 Page 8
The West Rand District Municipality has an estimated population of 820 995. The estimation population of Merafong City Local Municipality is 197 520. (Source: Statistics S.A. 2011).
Merafong City Local Municipality is a Category B municipality with an Executive Mayor Governance system. The Executive Mayor is supported by 10 full time Mayoral committee members who are responsible for heading their respective portfolios. The Mayoral Committee members chair their respective Section 80 Committees to which specific departments report.
The Speaker is the Chairperson of Council and is responsible for overseeing the functioning of Council and its committees. The office of the Speaker is further responsible for the establishment and functioning of ward committees.
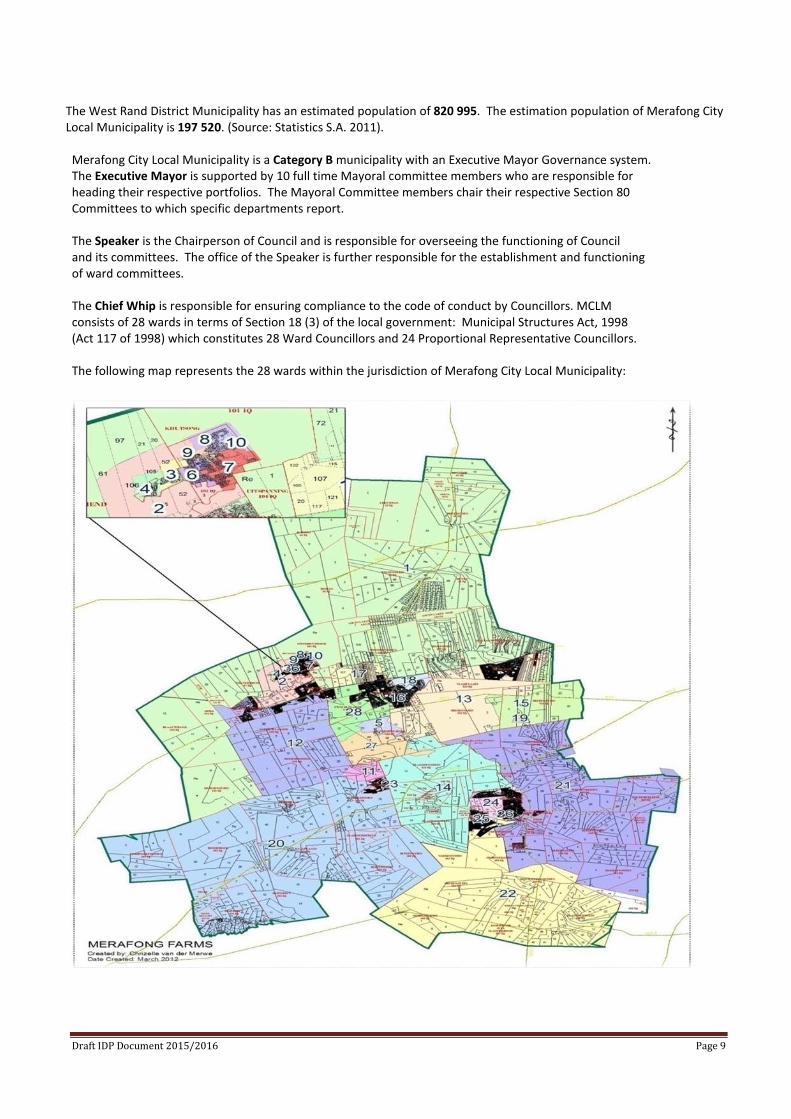
The Chief Whip is responsible for ensuring compliance to the code of conduct by Councillors. MCLM consists of 28 wards in terms of Section 18 (3) of the local government: Municipal Structures Act, 1998 (Act 117 of 1998) which constitutes 28 Ward Councillors and 24 Proportional Representative Councillors.
The following map represents the 28 wards within the jurisdiction of Merafong City Local Municipality:
Draft IDP Document 2015/2016 Page 9
2. DEMOGRAPHICS ANALYSIS
2.1 Demographic analysis
The population of any geographical area is the cornerstone of the development process, as it affects economic growth through the provision of labour and entrepreneurial skills, and determines the demand for production output. Examining population dynamics is essential to gaining an accurate perspective of those who are likely to be affected by any prospective development or project.
2.2 Population data
According to the Census 2011, Merafong’s population was 197 520, 24.1% of the district municipality’s population and 1.6% of the provincial total. The population has declined by 6.2% from 210 483 in 2001 to 197 520 in 2011. The municipality has a population density of 121.1 people per km2.
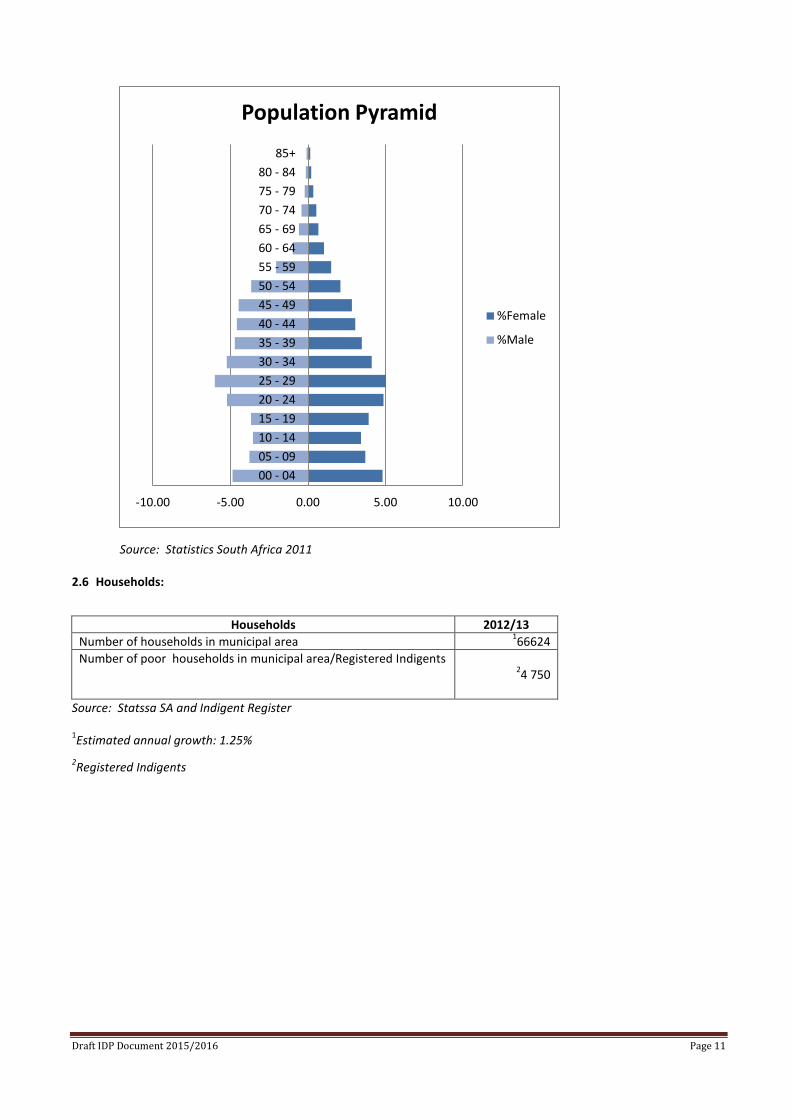
2.3 Age and gender profile
As shown in the pyramid below, the Merafong population profile is male-dominated with the males making up 54.3% of the total population while females make up the remaining 45.7%. This can be attributed to the in-migration of male workers in the mining industry. The population can be classified as a young population with 62.2% of the population being younger than 35.
2.4 POPULATION
STATISTIC SOUTH AFRICA Community Survey 2007 Census 2011
Total Population 215 865 197 520 Households 88 156 66 624
1Estimated annual growth: 1.25%
2.5 Population Details (Age Breakdown) : Age Gender
Male Female Total Age: 0 – 4 9 613 9 506 19 119 Age: 5 – 9 7 449 7 309 14 758 Age: 10 – 14 6 999 6 750 13 749 Age: 15 – 19 7 254 7 737 14 991 Age: 20 – 24 10 328 9 632 19 960 Age: 25 –29 11 872 9 919 21 791 Age: 30 – 34 10 349 8 111 18 460 Age: 35 – 39 9 323 6 867 16 190 Age: 40 – 44 9 068 6 017 15 085 Age: 45 – 49 8 844 5 606 14 450 Age:50 – 54 7 220 4 130 11 350 Age:55 – 59 4 052 2 946 6 998 Age:60 – 64 1 950 2 049 3 999 Age: 65 – 69 1 156 1 336 2 496 Age: 70 – 74 828 1 061 1 889 Age: 75 – 79 414 672 1 086 Age: 80 – 84 269 418 687 Age: 85 - 111 163 301 464
Source: Statistics South Africa 2011
Draft IDP Document 2015/2016 Page 10
Source: Statistics South Africa 2011 2.6 Households:
Households 2012/13
Number of households in municipal area 166624 Number of poor households in municipal area/Registered Indigents
24 750
Source: Statssa SA and Indigent Register
1Estimated annual growth: 1.25% 2Registered Indigents
-10.00 -5.00 0.00 5.00 10.00
00 - 0405 - 0910 - 1415 - 1920 - 2425 - 2930 - 3435 - 3940 - 4445 - 4950 - 5455 - 5960 - 6465 - 6970 - 7475 - 7980 - 84
85+
Population Pyramid
%Female
%Male
Draft IDP Document 2015/2016 Page 11
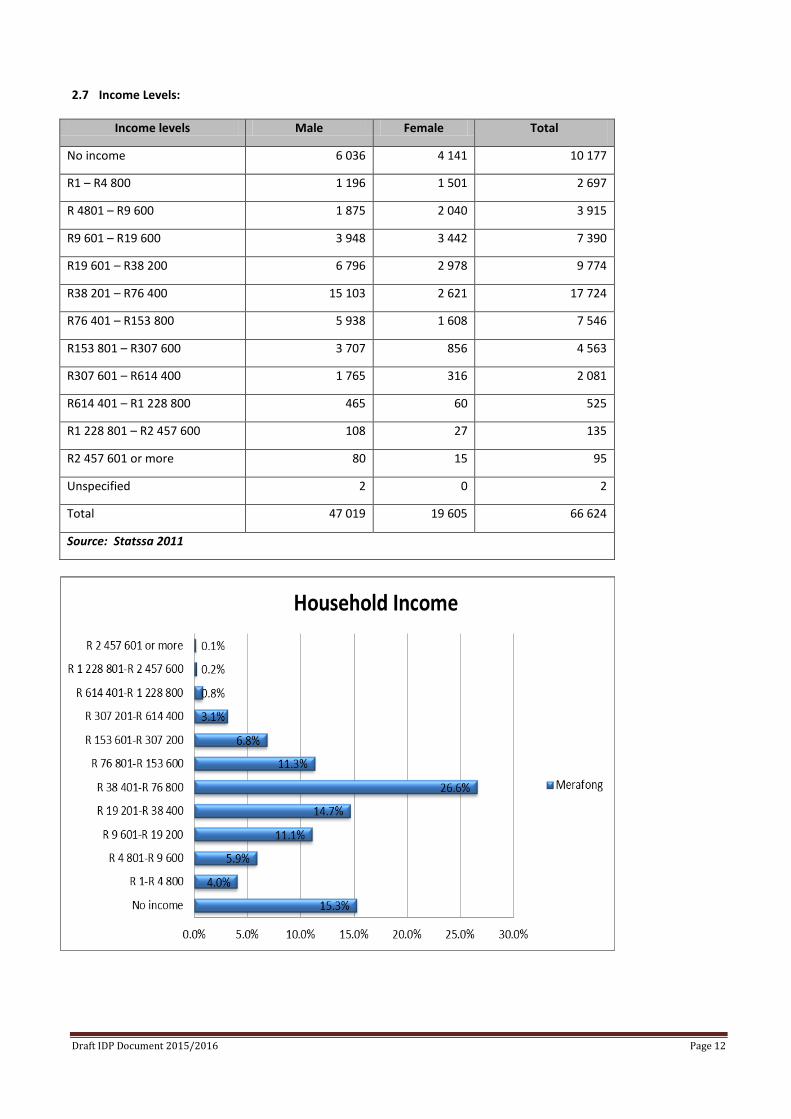
2.7 Income Levels:
Income levels Male Female Total
No income 6 036 4 141 10 177
R1 – R4 800 1 196 1 501 2 697
R 4801 – R9 600 1 875 2 040 3 915
R9 601 – R19 600 3 948 3 442 7 390
R19 601 – R38 200 6 796 2 978 9 774
R38 201 – R76 400 15 103 2 621 17 724
R76 401 – R153 800 5 938 1 608 7 546
R153 801 – R307 600 3 707 856 4 563
R307 601 – R614 400 1 765 316 2 081
R614 401 – R1 228 800 465 60 525
R1 228 801 – R2 457 600 108 27 135
R2 457 601 or more 80 15 95
Unspecified 2 0 2
Total 47 019 19 605 66 624
Source: Statssa 2011
Draft IDP Document 2015/2016 Page 12
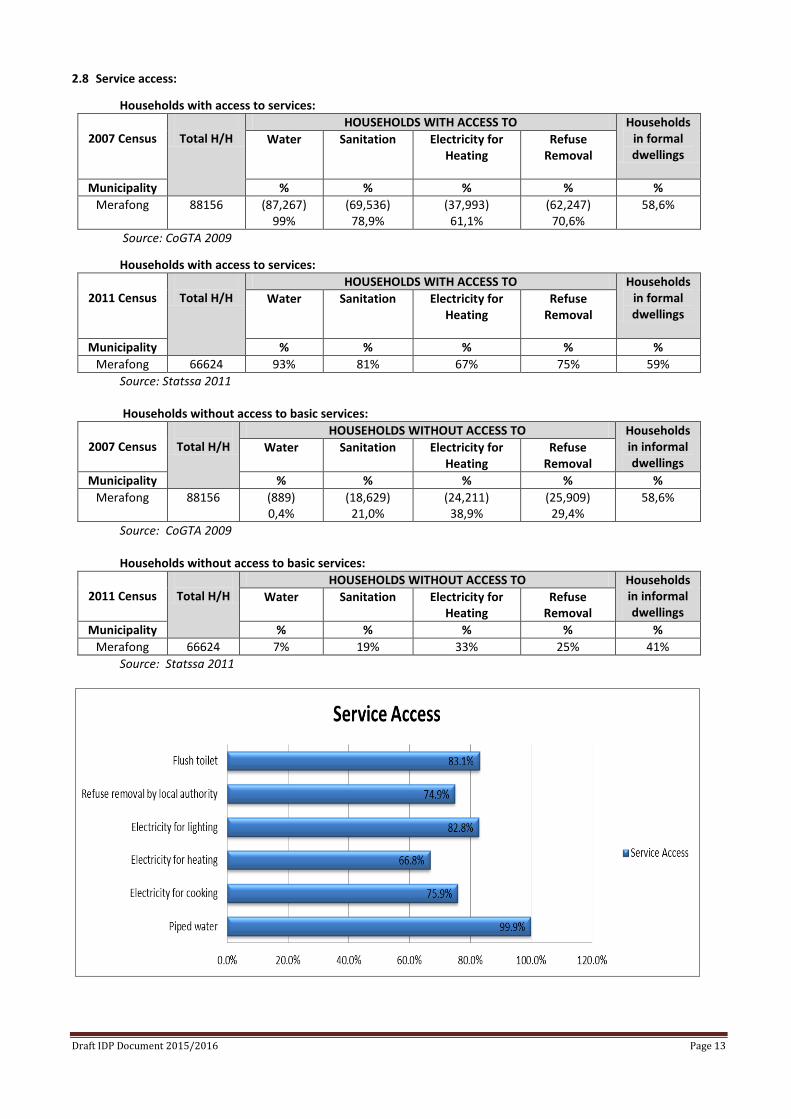
2.8 Service access:
Households with access to services:
2007 Census
Total H/H
HOUSEHOLDS WITH ACCESS TO Households in formal dwellings
Water Sanitation Electricity for Heating
Refuse Removal
Municipality % % % % % Merafong 88156 (87,267)
99% (69,536)
78,9% (37,993)
61,1% (62,247)
70,6% 58,6%
Source: CoGTA 2009
Households with access to services:
2011 Census
Total H/H
HOUSEHOLDS WITH ACCESS TO Households in formal dwellings
Water Sanitation Electricity for Heating
Refuse Removal
Municipality % % % % % Merafong 66624 93% 81% 67% 75% 59%
Source: Statssa 2011
Households without access to basic services:
2007 Census
Total H/H HOUSEHOLDS WITHOUT ACCESS TO Households
in informal dwellings
Water Sanitation Electricity for Heating
Refuse Removal
Municipality % % % % % Merafong 88156 (889)
0,4% (18,629)
21,0% (24,211)
38,9% (25,909)
29,4% 58,6%
Source: CoGTA 2009
Households without access to basic services:
2011 Census
Total H/H HOUSEHOLDS WITHOUT ACCESS TO Households
in informal dwellings
Water Sanitation Electricity for Heating
Refuse Removal
Municipality % % % % % Merafong 66624 7% 19% 33% 25% 41%
Source: Statssa 2011
Draft IDP Document 2015/2016 Page 13
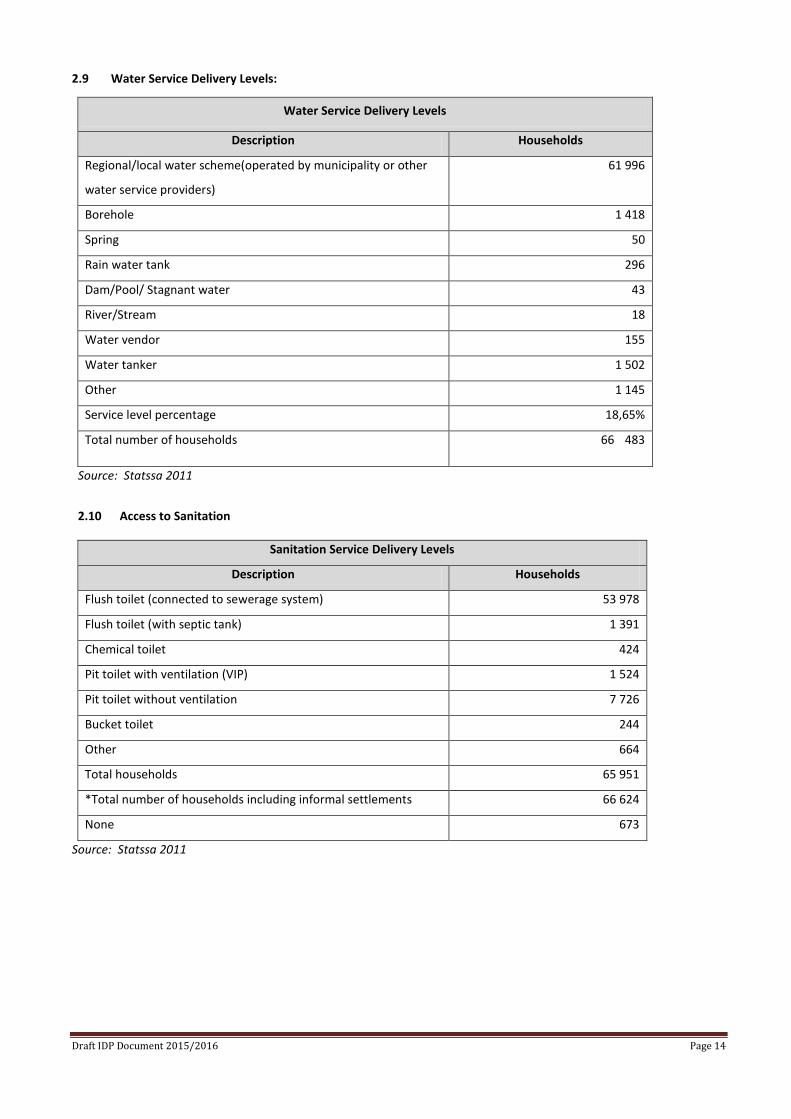
2.9 Water Service Delivery Levels:
Water Service Delivery Levels
Description Households
Regional/local water scheme(operated by municipality or other
water service providers)
61 996
Borehole 1 418
Spring 50
Rain water tank 296
Dam/Pool/ Stagnant water 43
River/Stream 18
Water vendor 155
Water tanker 1 502
Other 1 145
Service level percentage 18,65%
Total number of households 66 483
Source: Statssa 2011
2.10 Access to Sanitation
Sanitation Service Delivery Levels
Description Households
Flush toilet (connected to sewerage system) 53 978
Flush toilet (with septic tank) 1 391
Chemical toilet 424
Pit toilet with ventilation (VIP) 1 524
Pit toilet without ventilation 7 726
Bucket toilet 244
Other 664
Total households 65 951
*Total number of households including informal settlements 66 624
None 673
Source: Statssa 2011
Draft IDP Document 2015/2016 Page 14
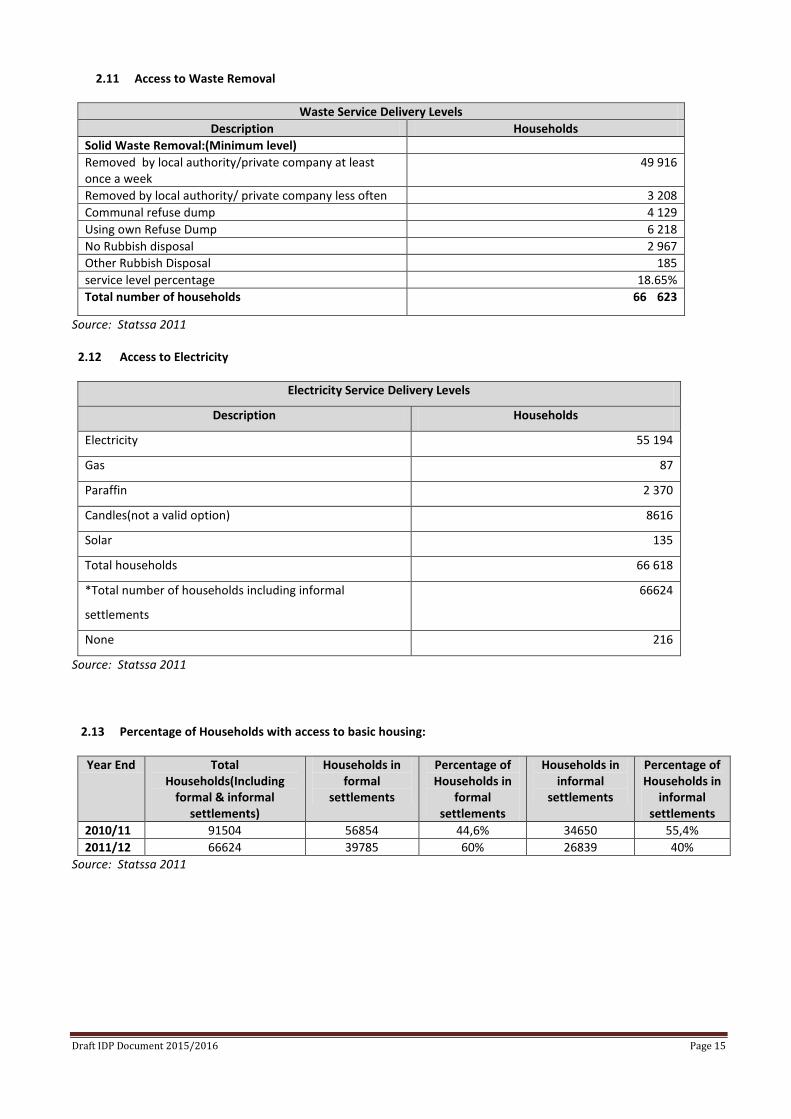
2.11 Access to Waste Removal
Waste Service Delivery Levels Description Households
Solid Waste Removal:(Minimum level) Removed by local authority/private company at least once a week
49 916
Removed by local authority/ private company less often 3 208 Communal refuse dump 4 129 Using own Refuse Dump 6 218 No Rubbish disposal 2 967 Other Rubbish Disposal 185 service level percentage 18.65% Total number of households 66 623
Source: Statssa 2011
2.12 Access to Electricity
Electricity Service Delivery Levels
Description Households
Electricity 55 194
Gas 87
Paraffin 2 370
Candles(not a valid option) 8616
Solar 135
Total households 66 618
*Total number of households including informal
settlements
66624
None 216
Source: Statssa 2011
2.13 Percentage of Households with access to basic housing: Year End Total
Households(Including formal & informal
settlements)
Households in formal
settlements
Percentage of Households in
formal settlements
Households in informal
settlements
Percentage of Households in
informal settlements
2010/11 91504 56854 44,6% 34650 55,4% 2011/12 66624 39785 60% 26839 40%
Source: Statssa 2011
Draft IDP Document 2015/2016 Page 15
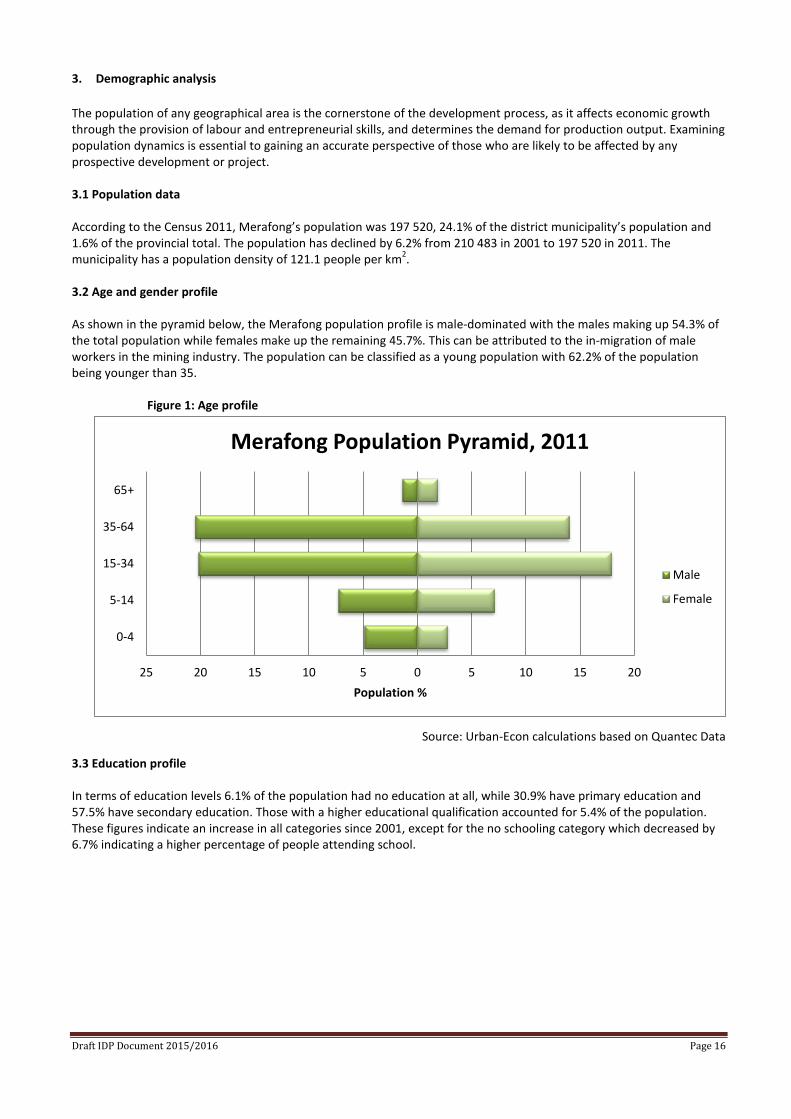
3. Demographic analysis The population of any geographical area is the cornerstone of the development process, as it affects economic growth through the provision of labour and entrepreneurial skills, and determines the demand for production output. Examining population dynamics is essential to gaining an accurate perspective of those who are likely to be affected by any prospective development or project. 3.1 Population data According to the Census 2011, Merafong’s population was 197 520, 24.1% of the district municipality’s population and 1.6% of the provincial total. The population has declined by 6.2% from 210 483 in 2001 to 197 520 in 2011. The municipality has a population density of 121.1 people per km2. 3.2 Age and gender profile As shown in the pyramid below, the Merafong population profile is male-dominated with the males making up 54.3% of the total population while females make up the remaining 45.7%. This can be attributed to the in-migration of male workers in the mining industry. The population can be classified as a young population with 62.2% of the population being younger than 35.
Figure 1: Age profile
Source: Urban-Econ calculations based on Quantec Data
3.3 Education profile In terms of education levels 6.1% of the population had no education at all, while 30.9% have primary education and 57.5% have secondary education. Those with a higher educational qualification accounted for 5.4% of the population. These figures indicate an increase in all categories since 2001, except for the no schooling category which decreased by 6.7% indicating a higher percentage of people attending school.
25 20 15 10 5 0 5 10 15 20
0-4
5-14
15-34
35-64
65+
Population %
Merafong Population Pyramid, 2011
Male
Female
Draft IDP Document 2015/2016 Page 16
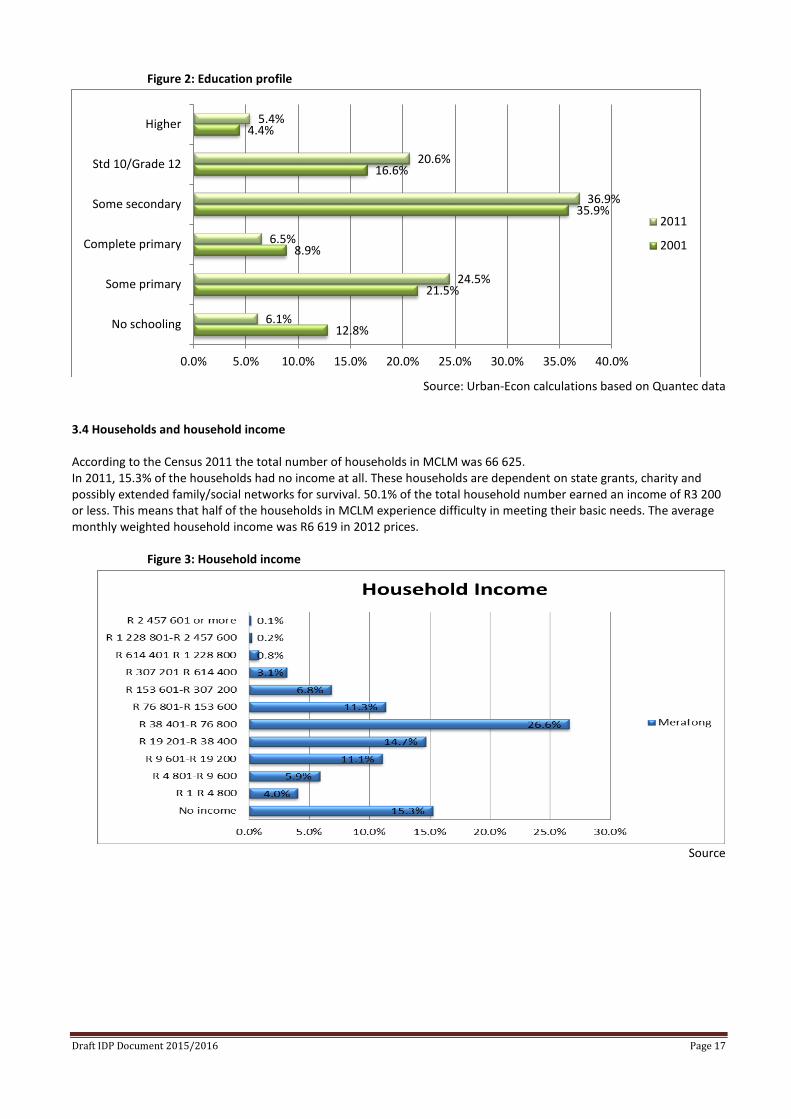
Figure 2: Education profile
Source: Urban-Econ calculations based on Quantec data
3.4 Households and household income According to the Census 2011 the total number of households in MCLM was 66 625. In 2011, 15.3% of the households had no income at all. These households are dependent on state grants, charity and possibly extended family/social networks for survival. 50.1% of the total household number earned an income of R3 200 or less. This means that half of the households in MCLM experience difficulty in meeting their basic needs. The average monthly weighted household income was R6 619 in 2012 prices.
Figure 3: Household income
Source
12.8%
21.5%
8.9%
35.9%
16.6%
4.4%
6.1%
24.5%
6.5%
36.9%
20.6%
5.4%
0.0% 5.0% 10.0% 15.0% 20.0% 25.0% 30.0% 35.0% 40.0%
No schooling
Some primary
Complete primary
Some secondary
Std 10/Grade 12
Higher
2011
2001
Draft IDP Document 2015/2016 Page 17
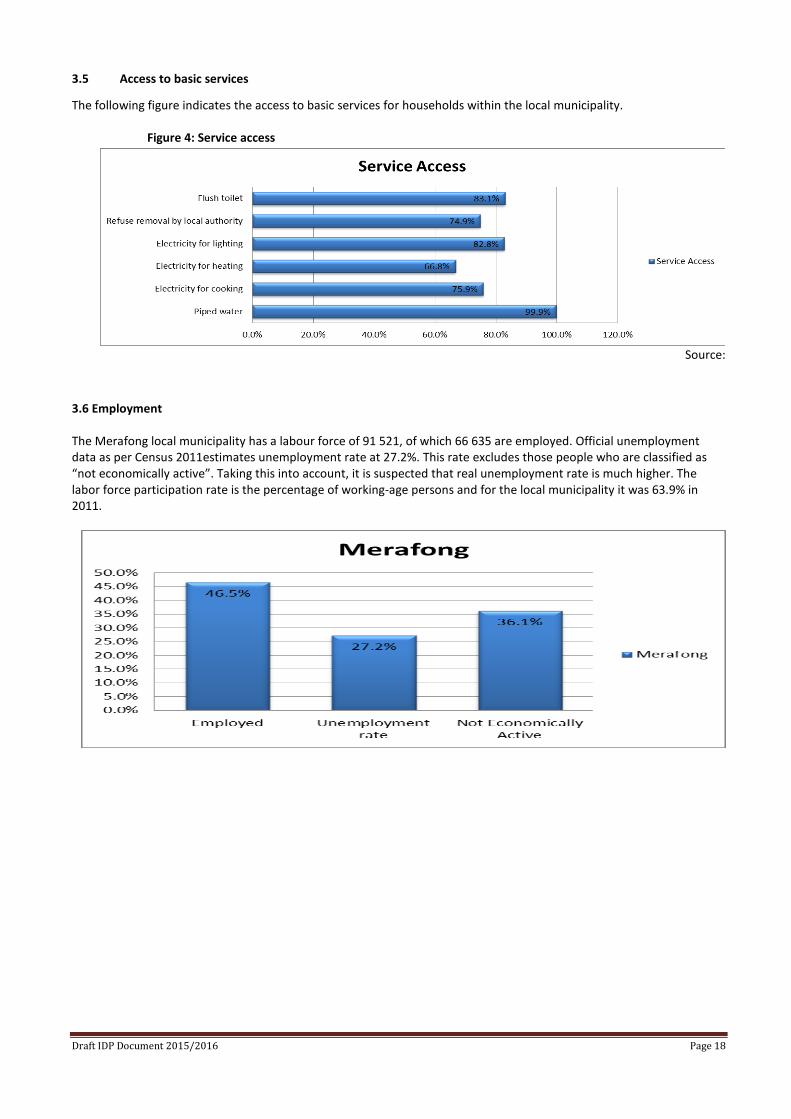
3.5 Access to basic services
The following figure indicates the access to basic services for households within the local municipality.
Figure 4: Service access
Source:
3.6 Employment The Merafong local municipality has a labour force of 91 521, of which 66 635 are employed. Official unemployment data as per Census 2011estimates unemployment rate at 27.2%. This rate excludes those people who are classified as “not economically active”. Taking this into account, it is suspected that real unemployment rate is much higher. The labor force participation rate is the percentage of working-age persons and for the local municipality it was 63.9% in 2011.
Draft IDP Document 2015/2016 Page 18
4. ECONOMIC PROFILE
4.1 Economic Performance
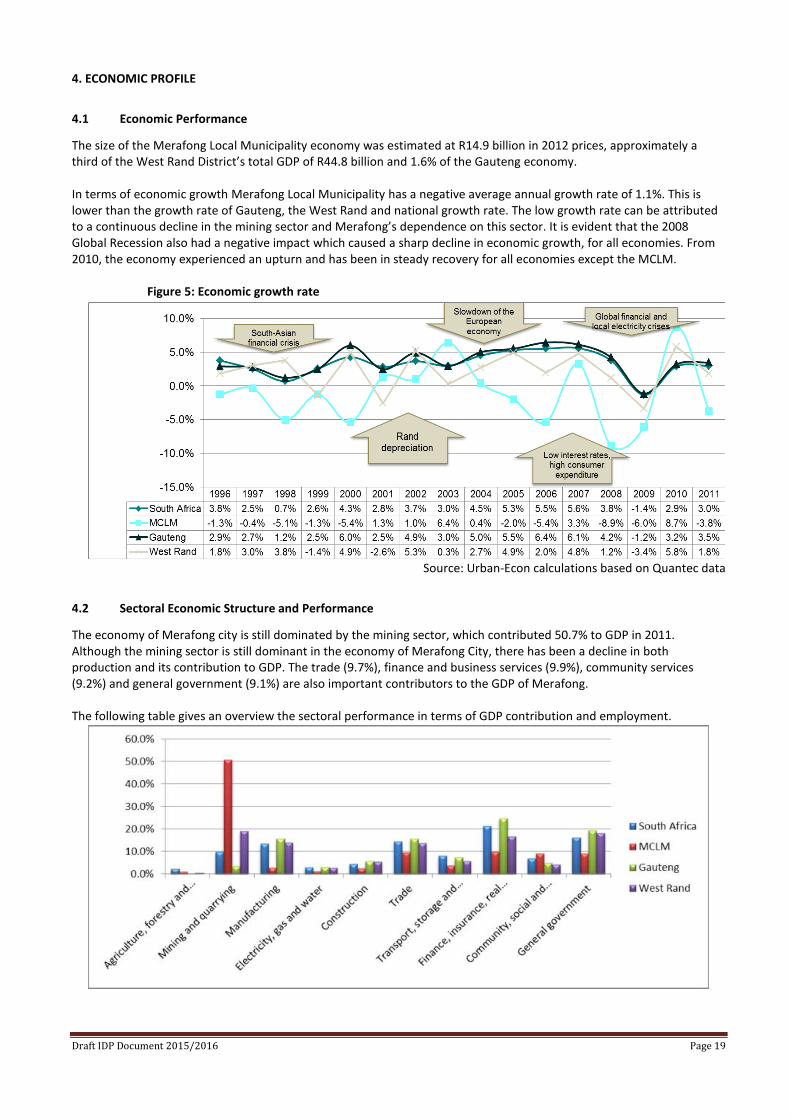
The size of the Merafong Local Municipality economy was estimated at R14.9 billion in 2012 prices, approximately a third of the West Rand District’s total GDP of R44.8 billion and 1.6% of the Gauteng economy. In terms of economic growth Merafong Local Municipality has a negative average annual growth rate of 1.1%. This is lower than the growth rate of Gauteng, the West Rand and national growth rate. The low growth rate can be attributed to a continuous decline in the mining sector and Merafong’s dependence on this sector. It is evident that the 2008 Global Recession also had a negative impact which caused a sharp decline in economic growth, for all economies. From 2010, the economy experienced an upturn and has been in steady recovery for all economies except the MCLM.
Figure 5: Economic growth rate
Source: Urban-Econ calculations based on Quantec data
4.2 Sectoral Economic Structure and Performance
The economy of Merafong city is still dominated by the mining sector, which contributed 50.7% to GDP in 2011. Although the mining sector is still dominant in the economy of Merafong City, there has been a decline in both production and its contribution to GDP. The trade (9.7%), finance and business services (9.9%), community services (9.2%) and general government (9.1%) are also important contributors to the GDP of Merafong. The following table gives an overview the sectoral performance in terms of GDP contribution and employment.
Draft IDP Document 2015/2016 Page 19
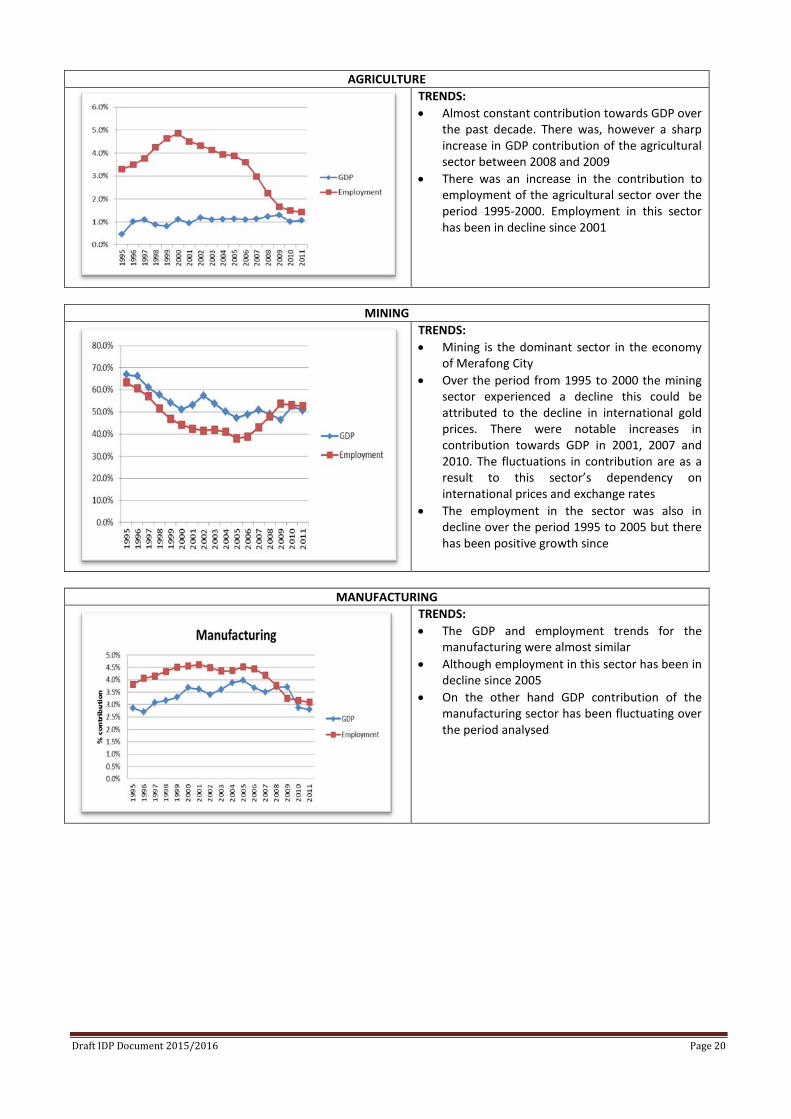
AGRICULTURE
TRENDS: • Almost constant contribution towards GDP over
the past decade. There was, however a sharp increase in GDP contribution of the agricultural sector between 2008 and 2009
• There was an increase in the contribution to employment of the agricultural sector over the period 1995-2000. Employment in this sector has been in decline since 2001
MINING
TRENDS: • Mining is the dominant sector in the economy
of Merafong City • Over the period from 1995 to 2000 the mining
sector experienced a decline this could be attributed to the decline in international gold prices. There were notable increases in contribution towards GDP in 2001, 2007 and 2010. The fluctuations in contribution are as a result to this sector’s dependency on international prices and exchange rates
• The employment in the sector was also in decline over the period 1995 to 2005 but there has been positive growth since
MANUFACTURING
TRENDS: • The GDP and employment trends for the
manufacturing were almost similar • Although employment in this sector has been in
decline since 2005 • On the other hand GDP contribution of the
manufacturing sector has been fluctuating over the period analysed
Draft IDP Document 2015/2016 Page 20
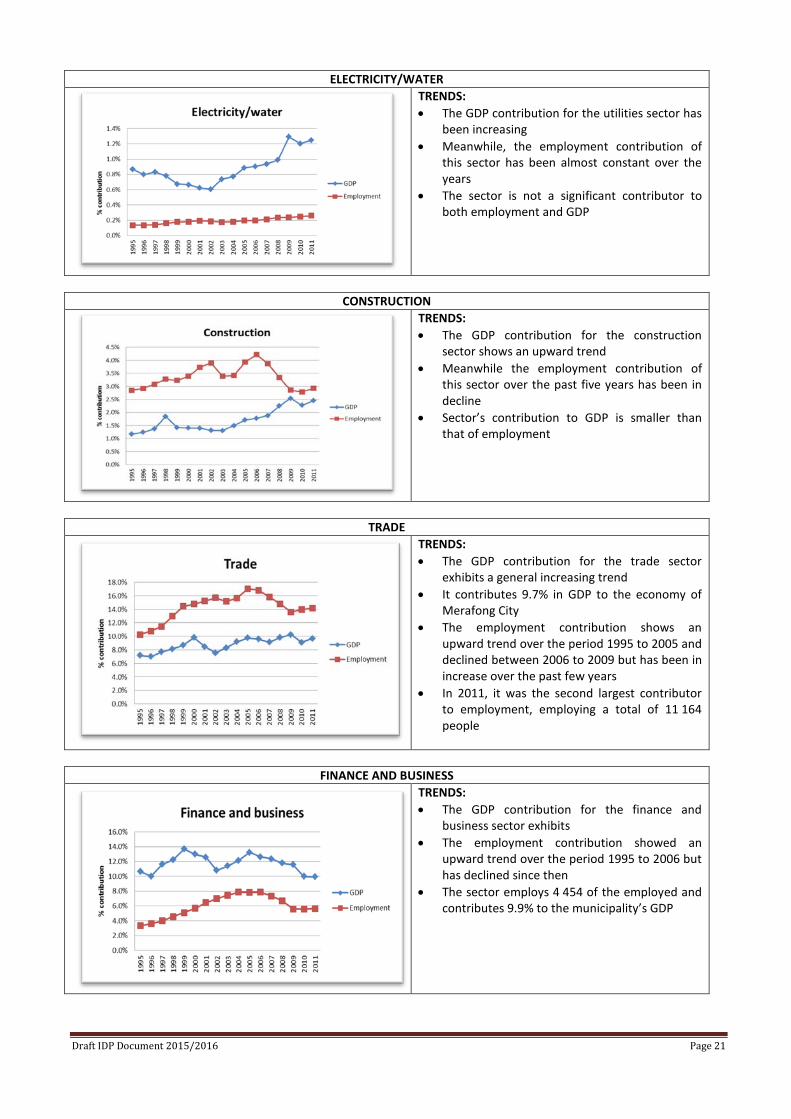
ELECTRICITY/WATER
TRENDS: • The GDP contribution for the utilities sector has
been increasing • Meanwhile, the employment contribution of
this sector has been almost constant over the years
• The sector is not a significant contributor to both employment and GDP
CONSTRUCTION
TRENDS: • The GDP contribution for the construction
sector shows an upward trend • Meanwhile the employment contribution of
this sector over the past five years has been in decline
• Sector’s contribution to GDP is smaller than that of employment
TRADE
TRENDS: • The GDP contribution for the trade sector
exhibits a general increasing trend • It contributes 9.7% in GDP to the economy of
Merafong City • The employment contribution shows an
upward trend over the period 1995 to 2005 and declined between 2006 to 2009 but has been in increase over the past few years
• In 2011, it was the second largest contributor to employment, employing a total of 11 164 people
FINANCE AND BUSINESS
TRENDS: • The GDP contribution for the finance and
business sector exhibits • The employment contribution showed an
upward trend over the period 1995 to 2006 but has declined since then
• The sector employs 4 454 of the employed and contributes 9.9% to the municipality’s GDP
Draft IDP Document 2015/2016 Page 21
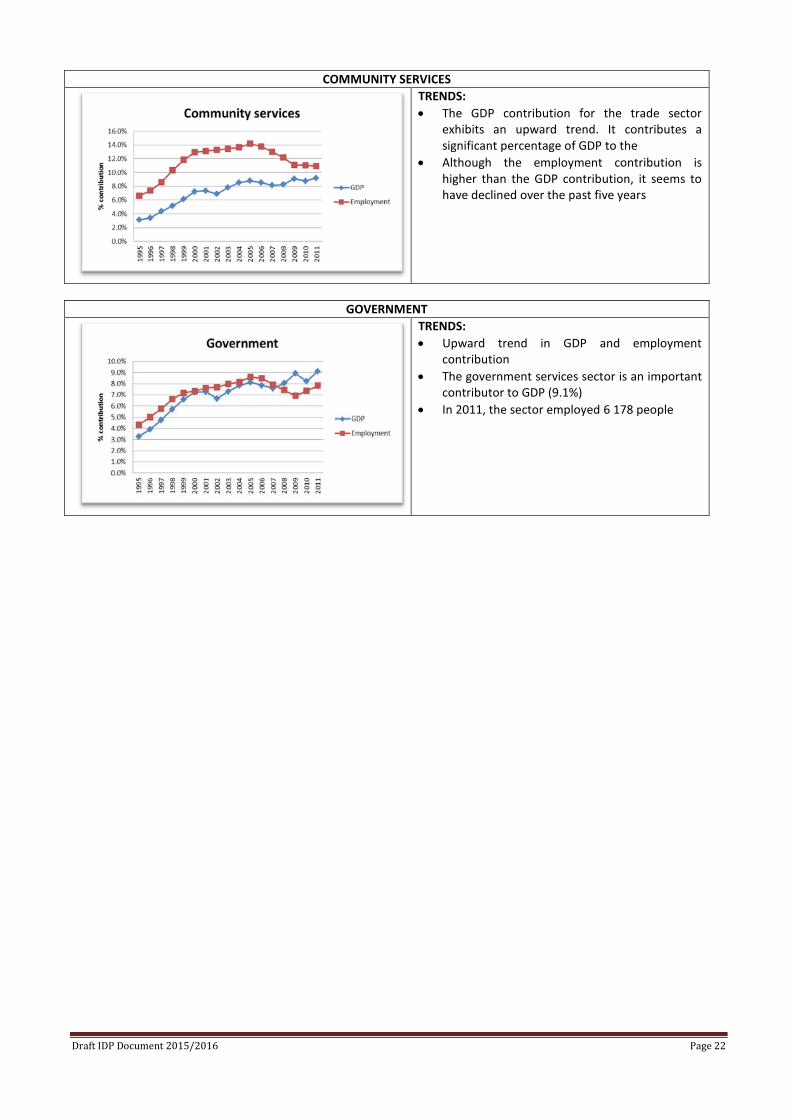
COMMUNITY SERVICES
TRENDS: • The GDP contribution for the trade sector
exhibits an upward trend. It contributes a significant percentage of GDP to the
• Although the employment contribution is higher than the GDP contribution, it seems to have declined over the past five years
GOVERNMENT
TRENDS: • Upward trend in GDP and employment
contribution • The government services sector is an important
contributor to GDP (9.1%) • In 2011, the sector employed 6 178 people
Draft IDP Document 2015/2016 Page 22
5. ENVIRONMENTAL ANALYSIS OF MERAFONG CITY LOCAL MUNICIPALITY
Executive Summary
The Merafong Local Municipality (MLM) is located in the western section of the West Rand District Municipality (WRDM). The WRDM’s jurisdiction comprises four local municipalities (Mogale City, Randfontein, Westonaria and Merafong City) and a district management area, which comprises a portion of the cradle of humankind world heritage site. Typical pressures exerted on the environment in the MLM include abiotic pressures such as climate changes, rainfall gradient, temperature, fire frequency, floods and drought (WRDM, 2005) and the following anthropogenic pressures:
• Agricultural practice (cultivated land, grazing);
• Mining and industrial development;
• Informal settlement;
• Poaching and plant harvesting (for medicinal and food purposes);
• Uncontrolled veld fires;
• Wetland destruction (including peat mining);
• Water pollution due to mining, industry, inadequate sewage management, agriculture and waste disposal;
• Flooding (inadequate storm water management, erosion due to unstable soil structures and underlying geology, retention feature failure, urbanisation and the increased need for roads); and
• Alien vegetation invasion;
• Inappropriate land-use planning where development has been allowed to take place in close proximity to sensitive environments and
The current state of the environment was investigated in terms of biodiversity, water, air quality, land use, socio-economic factors, governance, heritage and geology. The status quo of each of these aspects are summarised below. Biodiversity The biodiversity of the MLM did not change significantly since the compilations of the previous SoER. The percentage land in the MLM that is considered irreplaceable has decreased from 3.7% to 2.6% since the first version of the C-Plan. The vegetation type classification also changed from Low and Rebelo classification to Mucina & Rutherford (2006) and can therefore not be compared to the findings of the previous SoER. The MLM currently incorporates 6 veld types (Mucina & Rutherford, 2006) of which none are sufficiently conserved in the MLM, and 5 are not conserved in the MLM at all. According to the South African National Biodiversity Institute (SANBI, 2009) 62% of the MLM is still natural, but due to changes in scale and classification this cannot be compared to the previous SoER. No ridges in the MLM are currently conserved, while 9% of wetlands in the municipality are conserved. Alien species lists were not provided in the previous SoER, and could therefore not be compared to the current alien species occurrences. Endemic plant species were provided by SANBI (2010) and includes Erica alopecurus. Endemic invertebrates are the same as in the previous SoER. Red Data Listed (RDL) were provided by the Gauteng Department of Agriculture and Rural Development (GDARD). There are currently 4 RDL plant species, 1 RDL mammal species, 12 RDL bird species, 1 RDL invertebrate species and 1 RDL amphibian in the MLM. Water The data on water quantity has not been updated recently and no comparison can be made between this report and the previous SoER. Flow volumes obtained from DWA (2010) indicated that the flow in the Mooirivierloop at Blaauwbank has significantly reduced since the year 2000. The other rivers had a more constant flow. Data on water availability and requirements of the Downstream of Vaal Dam Subarea of the Upper Vaal Water Management Area (WMA), in which MLM is located, was obtained from DWAF (2003). This data was produced in the year 2000, and has not been updated yet. According to DWAF (2003) water requirements in the Downstream of Vaal Dam Subarea was predicted to range
Draft IDP Document 2015/2016 Page 23
between 2518-3458 million m3 per year by 2025. In the year 2000 only 2113 million m3/year was available for human consumption in the Downstream of Vaal Dam Subarea (DWAF, 3002). The environmental reserve was determined to be 57 million m3/year (DWAF, 2003). The previous SoER did not sufficiently report on water quality, therefore some of the data from this report cannot be compared with the previous SoER. Water quality was measured in terms of salinity, nutrient concentrations and Acid Mine Drainage (AMD) and radioactivity. Salinity of the water in MLM was generally high. The Loopspruit had the most significant increase in salinity levels. There has been no significant change in nutrient concentrations in the MLM over the past five years. PO4 concentrations are high in the surface water of the Loopspruit River, but do not pose any threats to human health. AMD in the MLM was measured in terms of uranium concentrations. Data on uranium concentrations in the MLM were not sufficient and can only be used as an approximate indication, but proper sampling must still be done. Available uranium concentration data were more or less constant for the past 5 years, but these concentrations exceeded domestic guideline values and are within toxic levels. According to the Brent Report by BC Associates (2007), more than 50% of sampled sites in the Wonderfontein Catchment that crosses the MLM may be exposed to radiation exceeding the effective dose limit of 1 mSv/a. Human exposure pathways are predominantly via pasture and crops irrigated with contaminated water, radioactive elements re-suspended in sediments of water bodies and the agricultural use of land contaminated with runoff from slimes dams. Aquatic ecosystem integrity was determined in terms of available data on the status of macro-invertebrates, riparian vegetation, fish assemblage and habitat integrity. Macro-invertebrate conditions up- and downstream of the Donaldson Dam were determined to be fair to very poor respectively. The macro-invertebrate condition for the Loopspruit is fair. The Habitat Index (HI) for the Donaldson Dam and Loopspruit is fair and good-fair respectively. Air No information on air quantity was given in the previous SoER and could not be compared to the limited air quality data available for this study. Dust fallout levels in the MLM is slight to moderate and fall below the residential threshold. It was determined that PM10 is the most significant pollutant in the MLM. It is recommended that additional data be collected in the future in order to determine trends and changes is air quality. Land Land use and land condition did not change significantly since the last SoER (2006). The information is continuously done on different scales, which causes discrepancies in the data. The most significant land uses in the MLM is mining, agriculture, residential and informal settlements. It is recommended that data is collected in a consistent way that could be compared to establish trends. Socio-economic The following socio-economic changes occurred from the 2001 to 2007 census:
• The population in MLM increased from 210 480 to 215 865.
• Informal settlements reduced from 32% to 23%, while formal housing percentages increased from 68% to
73%.
• The mining sector contributes 28% to the GGP, which is the highest contribution of all sectors.
• Employment showed a slight increase while unemployment slightly decreased. Employment increased in
all sectors, except agriculture. Employment increased most significantly in the electricity, gas and water
supply sector. While mining had a negative growth in the employment percentage, it still employs the
highest percentage of people.
• People older than 20 years with tertiary education increased, while those with Gr. 12 showed a slight
decrease. Secondary school attendance increased.
Draft IDP Document 2015/2016 Page 24
• Of the roads in the MLM 14% is in a very good condition and 39% is in a very poor condition. Busses, mini
busses and trains are used for public transport. Weekly refuse removal increased while private waste
dumps decreased. Use of electricity and candles for lightning increased. Piped water in dwellings
increased, while the use of boreholes and piped water in the yards decreased. The use of flush toilets
decreased while the use of pit toilets increased.
• Property related crime in the MLM increased, while other forms of crime reduced.
Governance The previous SoER (2006) did not report on the governance of the WRDM in order to compare with the current information. Cultural Heritage The cultural heritage did not change since the last SoER, 2006. Geology The geology did not change since the last SoER, 2006. Information gaps Several important gaps in the information were identified during the compilation of the SoER. Monitoring needs to be done in future in order to address these gaps. The gaps in the information include the following:
• Air quality data was determined to be the most important gap in information. Very little ambient air
quality monitoring data exists for the MLM in order to undertake an assessment of the air quality
situation in the Municipality as a whole. Ideally, continuous monitoring data over a five year period
would be needed for this purpose. The dust fallout data that was provided by some mines in the MLM
is only representative of the mine and not the overall air quality situation. The data also lack spatial
information, such as the latitude and longitude of each sampling point and the actual raw data results
(in an excel format) are required for this data to be usable.
• Regional geology map
• Regional dolomite map indicating dolomite groundwater compartments
• Dolomite land and cave network
• Dolomite groundwater information
• Provisional regional dolomite risk zonation
• The locations of existing mines and risks of shallow undermining
• The locations of cemeteries
• Land use and land availability
• Legal and illegal activities
• Data on mine spills and pollution events and investigate mining impacts and possible opportunities
• The presence, locations and values of heritage resources
Draft IDP Document 2015/2016 Page 25
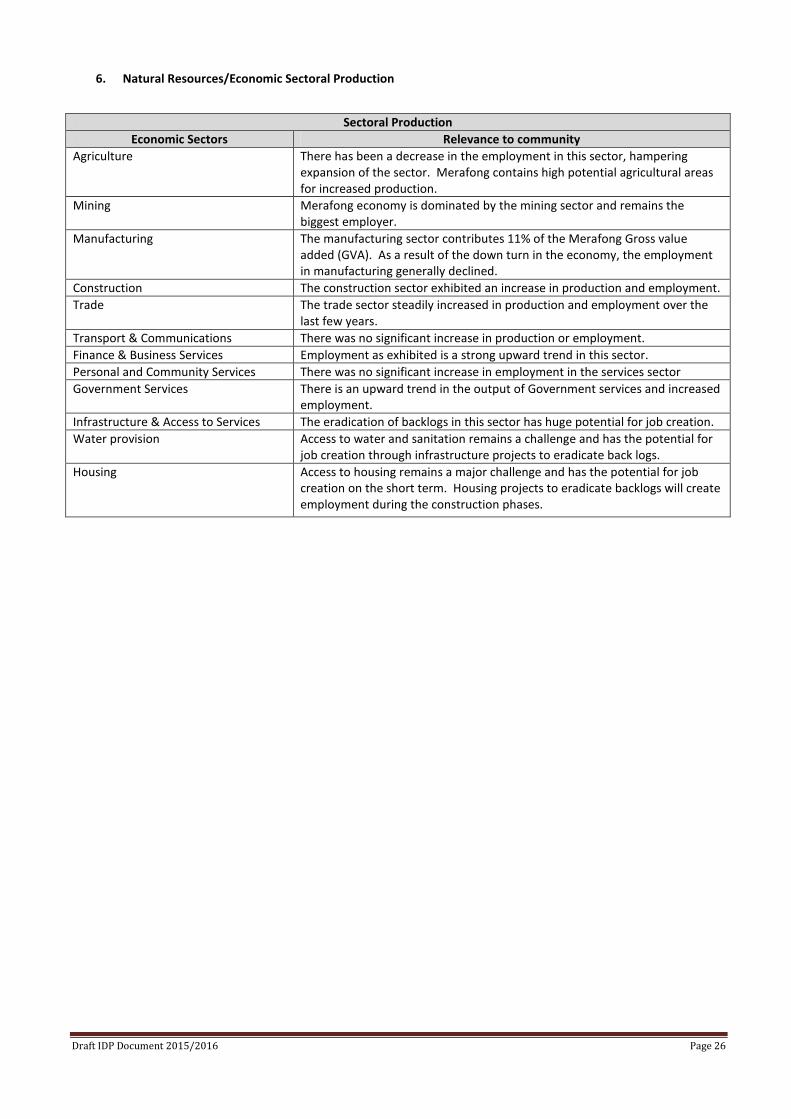
6. Natural Resources/Economic Sectoral Production
Sectoral Production
Economic Sectors Relevance to community Agriculture There has been a decrease in the employment in this sector, hampering
expansion of the sector. Merafong contains high potential agricultural areas for increased production.
Mining Merafong economy is dominated by the mining sector and remains the biggest employer.
Manufacturing The manufacturing sector contributes 11% of the Merafong Gross value added (GVA). As a result of the down turn in the economy, the employment in manufacturing generally declined.
Construction The construction sector exhibited an increase in production and employment. Trade The trade sector steadily increased in production and employment over the
last few years. Transport & Communications There was no significant increase in production or employment. Finance & Business Services Employment as exhibited is a strong upward trend in this sector. Personal and Community Services There was no significant increase in employment in the services sector Government Services There is an upward trend in the output of Government services and increased
employment. Infrastructure & Access to Services The eradication of backlogs in this sector has huge potential for job creation. Water provision Access to water and sanitation remains a challenge and has the potential for
job creation through infrastructure projects to eradicate back logs. Housing Access to housing remains a major challenge and has the potential for job
creation on the short term. Housing projects to eradicate backlogs will create employment during the construction phases.
Draft IDP Document 2015/2016 Page 26
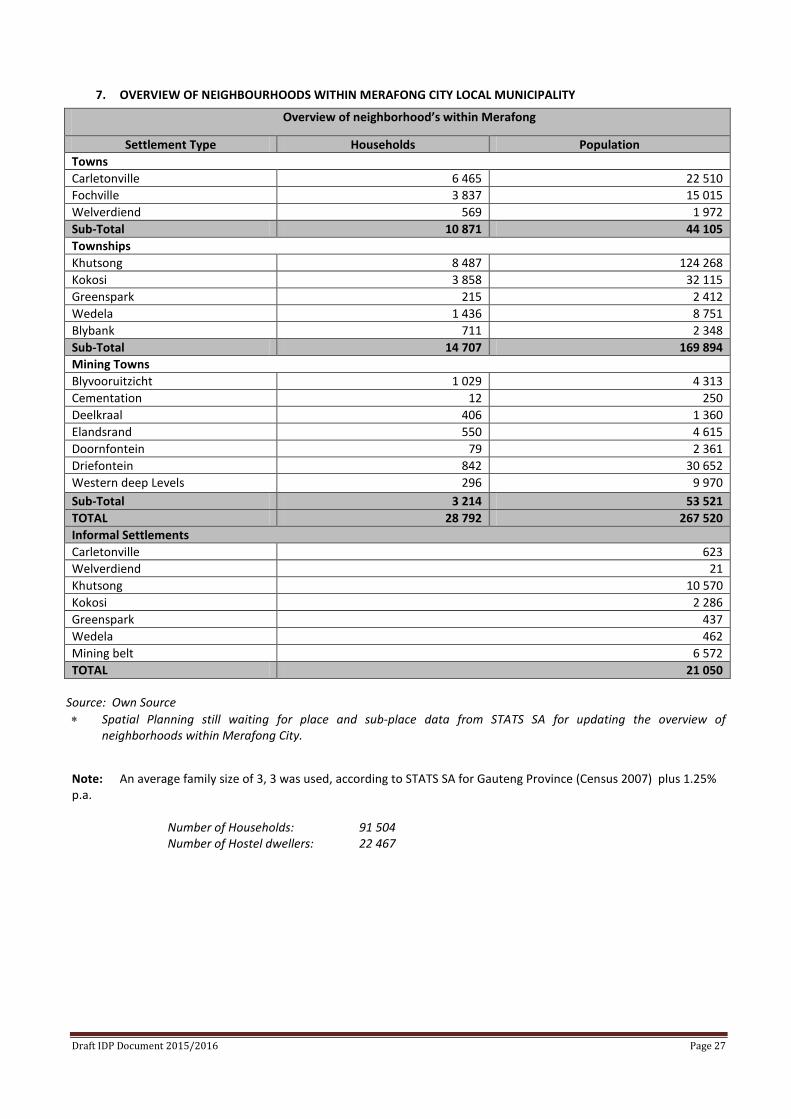
7. OVERVIEW OF NEIGHBOURHOODS WITHIN MERAFONG CITY LOCAL MUNICIPALITY
Source: Own Source
∗ Spatial Planning still waiting for place and sub-place data from STATS SA for updating the overview of neighborhoods within Merafong City.
Note: An average family size of 3, 3 was used, according to STATS SA for Gauteng Province (Census 2007) plus 1.25% p.a.
Number of Households: 91 504 Number of Hostel dwellers: 22 467
Overview of neighborhood’s within Merafong
Settlement Type Households Population Towns Carletonville 6 465 22 510 Fochville 3 837 15 015 Welverdiend 569 1 972 Sub-Total 10 871 44 105 Townships Khutsong 8 487 124 268 Kokosi 3 858 32 115 Greenspark 215 2 412 Wedela 1 436 8 751 Blybank 711 2 348 Sub-Total 14 707 169 894 Mining Towns Blyvooruitzicht 1 029 4 313 Cementation 12 250 Deelkraal 406 1 360 Elandsrand 550 4 615 Doornfontein 79 2 361 Driefontein 842 30 652 Western deep Levels 296 9 970 Sub-Total 3 214 53 521 TOTAL 28 792 267 520 Informal Settlements Carletonville 623 Welverdiend 21 Khutsong 10 570 Kokosi 2 286 Greenspark 437 Wedela 462 Mining belt 6 572 TOTAL 21 050
Draft IDP Document 2015/2016 Page 27
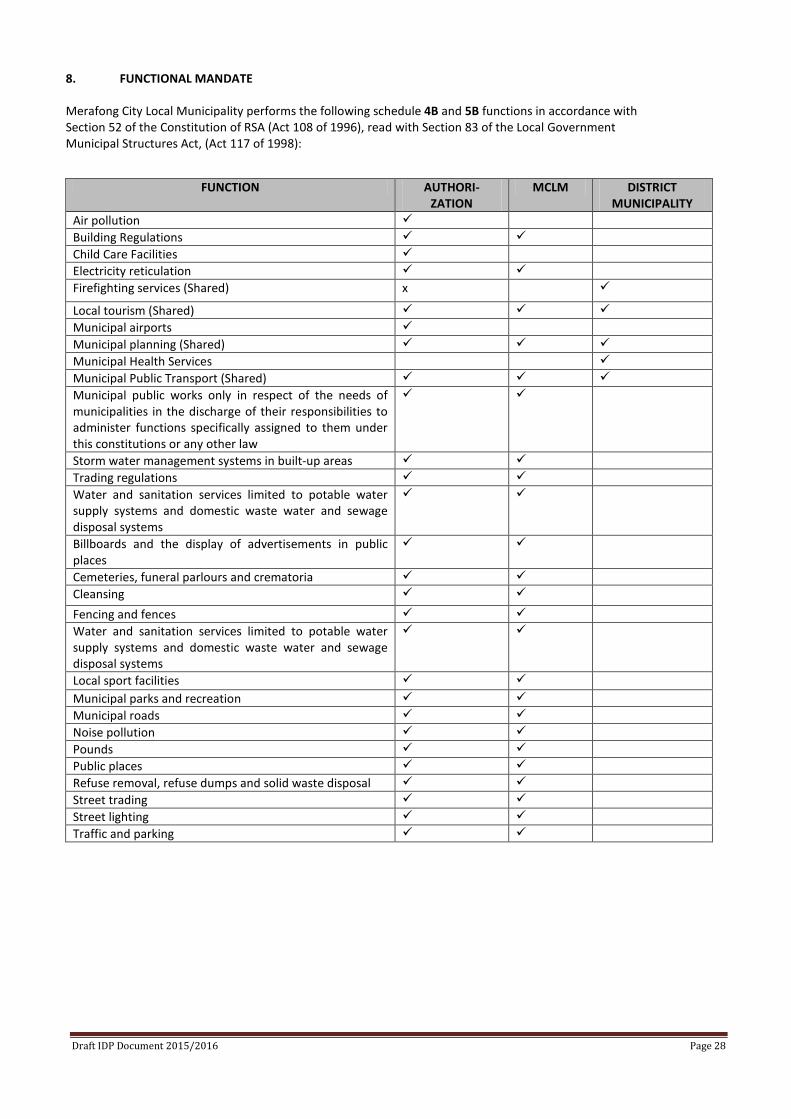
8. FUNCTIONAL MANDATE Merafong City Local Municipality performs the following schedule 4B and 5B functions in accordance with Section 52 of the Constitution of RSA (Act 108 of 1996), read with Section 83 of the Local Government Municipal Structures Act, (Act 117 of 1998):
FUNCTION AUTHORI- ZATION
MCLM DISTRICT MUNICIPALITY
Air pollution Building Regulations Child Care Facilities Electricity reticulation Firefighting services (Shared) x
Local tourism (Shared) Municipal airports Municipal planning (Shared) Municipal Health Services Municipal Public Transport (Shared) Municipal public works only in respect of the needs of municipalities in the discharge of their responsibilities to administer functions specifically assigned to them under this constitutions or any other law
Storm water management systems in built-up areas Trading regulations Water and sanitation services limited to potable water supply systems and domestic waste water and sewage disposal systems
Billboards and the display of advertisements in public places
Cemeteries, funeral parlours and crematoria Cleansing Fencing and fences Water and sanitation services limited to potable water supply systems and domestic waste water and sewage disposal systems
Local sport facilities Municipal parks and recreation Municipal roads Noise pollution Pounds Public places Refuse removal, refuse dumps and solid waste disposal Street trading Street lighting Traffic and parking
Draft IDP Document 2015/2016 Page 28
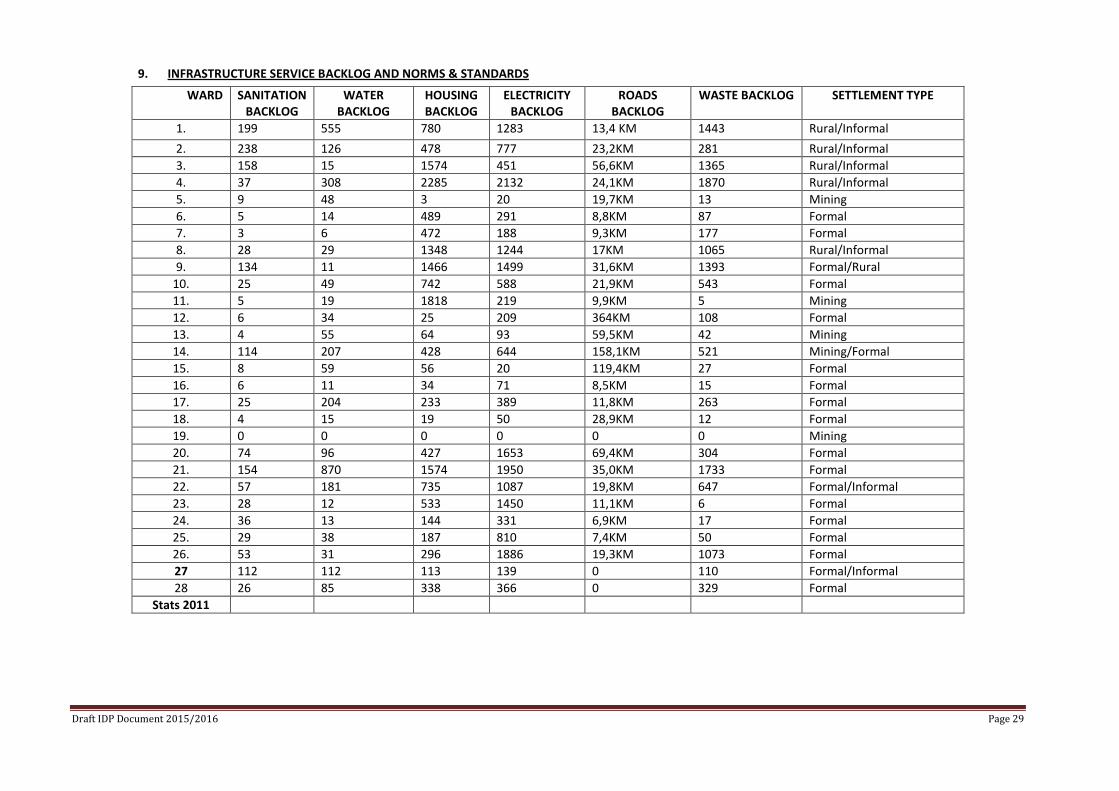
9. INFRASTRUCTURE SERVICE BACKLOG AND NORMS & STANDARDS
WARD SANITATION BACKLOG
WATER BACKLOG
HOUSING BACKLOG
ELECTRICITY BACKLOG
ROADS BACKLOG
WASTE BACKLOG SETTLEMENT TYPE
1. 199 555 780 1283 13,4 KM 1443 Rural/Informal 2. 238 126 478 777 23,2KM 281 Rural/Informal 3. 158 15 1574 451 56,6KM 1365 Rural/Informal 4. 37 308 2285 2132 24,1KM 1870 Rural/Informal 5. 9 48 3 20 19,7KM 13 Mining 6. 5 14 489 291 8,8KM 87 Formal 7. 3 6 472 188 9,3KM 177 Formal 8. 28 29 1348 1244 17KM 1065 Rural/Informal 9. 134 11 1466 1499 31,6KM 1393 Formal/Rural
10. 25 49 742 588 21,9KM 543 Formal 11. 5 19 1818 219 9,9KM 5 Mining 12. 6 34 25 209 364KM 108 Formal 13. 4 55 64 93 59,5KM 42 Mining 14. 114 207 428 644 158,1KM 521 Mining/Formal 15. 8 59 56 20 119,4KM 27 Formal 16. 6 11 34 71 8,5KM 15 Formal 17. 25 204 233 389 11,8KM 263 Formal 18. 4 15 19 50 28,9KM 12 Formal 19. 0 0 0 0 0 0 Mining 20. 74 96 427 1653 69,4KM 304 Formal 21. 154 870 1574 1950 35,0KM 1733 Formal 22. 57 181 735 1087 19,8KM 647 Formal/Informal 23. 28 12 533 1450 11,1KM 6 Formal 24. 36 13 144 331 6,9KM 17 Formal 25. 29 38 187 810 7,4KM 50 Formal 26. 53 31 296 1886 19,3KM 1073 Formal 27 112 112 113 139 0 110 Formal/Informal 28 26 85 338 366 0 329 Formal
Stats 2011
Draft IDP Document 2015/2016 Page 29
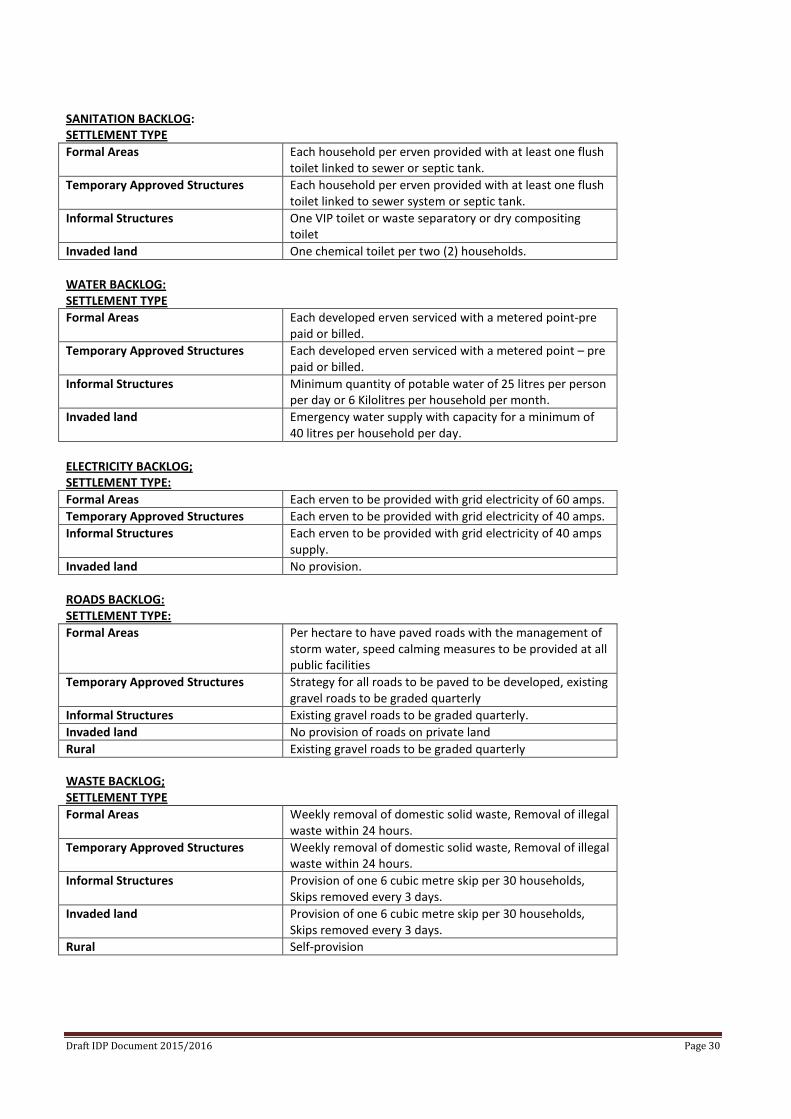
SANITATION BACKLOG: SETTLEMENT TYPE Formal Areas Each household per erven provided with at least one flush
toilet linked to sewer or septic tank. Temporary Approved Structures Each household per erven provided with at least one flush
toilet linked to sewer system or septic tank. Informal Structures One VIP toilet or waste separatory or dry compositing
toilet Invaded land One chemical toilet per two (2) households. WATER BACKLOG: SETTLEMENT TYPE Formal Areas Each developed erven serviced with a metered point-pre
paid or billed. Temporary Approved Structures Each developed erven serviced with a metered point – pre
paid or billed. Informal Structures Minimum quantity of potable water of 25 litres per person
per day or 6 Kilolitres per household per month. Invaded land Emergency water supply with capacity for a minimum of
40 litres per household per day. ELECTRICITY BACKLOG; SETTLEMENT TYPE: Formal Areas Each erven to be provided with grid electricity of 60 amps. Temporary Approved Structures Each erven to be provided with grid electricity of 40 amps. Informal Structures Each erven to be provided with grid electricity of 40 amps
supply. Invaded land No provision. ROADS BACKLOG: SETTLEMENT TYPE: Formal Areas Per hectare to have paved roads with the management of
storm water, speed calming measures to be provided at all public facilities
Temporary Approved Structures Strategy for all roads to be paved to be developed, existing gravel roads to be graded quarterly
Informal Structures Existing gravel roads to be graded quarterly. Invaded land No provision of roads on private land Rural Existing gravel roads to be graded quarterly WASTE BACKLOG; SETTLEMENT TYPE Formal Areas Weekly removal of domestic solid waste, Removal of illegal
waste within 24 hours. Temporary Approved Structures Weekly removal of domestic solid waste, Removal of illegal
waste within 24 hours. Informal Structures Provision of one 6 cubic metre skip per 30 households,
Skips removed every 3 days. Invaded land Provision of one 6 cubic metre skip per 30 households,
Skips removed every 3 days. Rural Self-provision
Draft IDP Document 2015/2016 Page 30
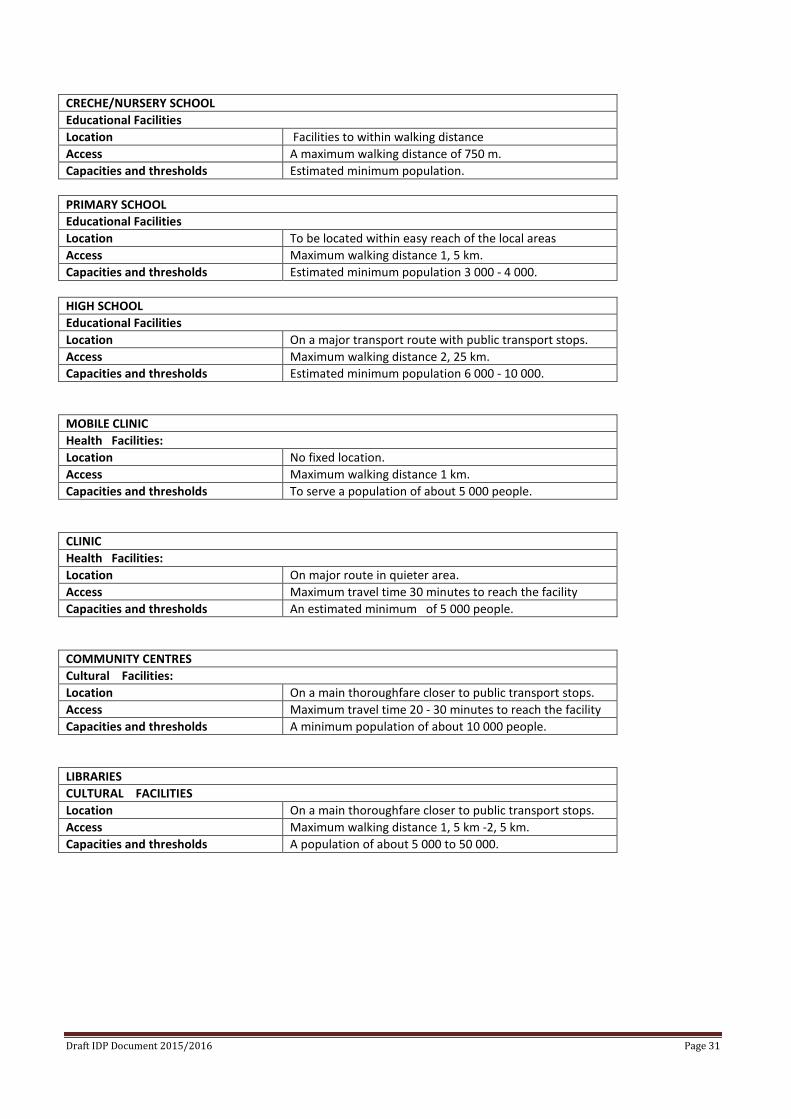
CRECHE/NURSERY SCHOOL Educational Facilities Location Facilities to within walking distance Access A maximum walking distance of 750 m. Capacities and thresholds Estimated minimum population. PRIMARY SCHOOL Educational Facilities Location To be located within easy reach of the local areas Access Maximum walking distance 1, 5 km. Capacities and thresholds Estimated minimum population 3 000 - 4 000. HIGH SCHOOL Educational Facilities Location On a major transport route with public transport stops. Access Maximum walking distance 2, 25 km. Capacities and thresholds Estimated minimum population 6 000 - 10 000. MOBILE CLINIC Health Facilities: Location No fixed location. Access Maximum walking distance 1 km. Capacities and thresholds To serve a population of about 5 000 people. CLINIC Health Facilities: Location On major route in quieter area. Access Maximum travel time 30 minutes to reach the facility Capacities and thresholds An estimated minimum of 5 000 people. COMMUNITY CENTRES Cultural Facilities: Location On a main thoroughfare closer to public transport stops. Access Maximum travel time 20 - 30 minutes to reach the facility Capacities and thresholds A minimum population of about 10 000 people. LIBRARIES CULTURAL FACILITIES Location On a main thoroughfare closer to public transport stops. Access Maximum walking distance 1, 5 km -2, 5 km. Capacities and thresholds A population of about 5 000 to 50 000.
Draft IDP Document 2015/2016 Page 31
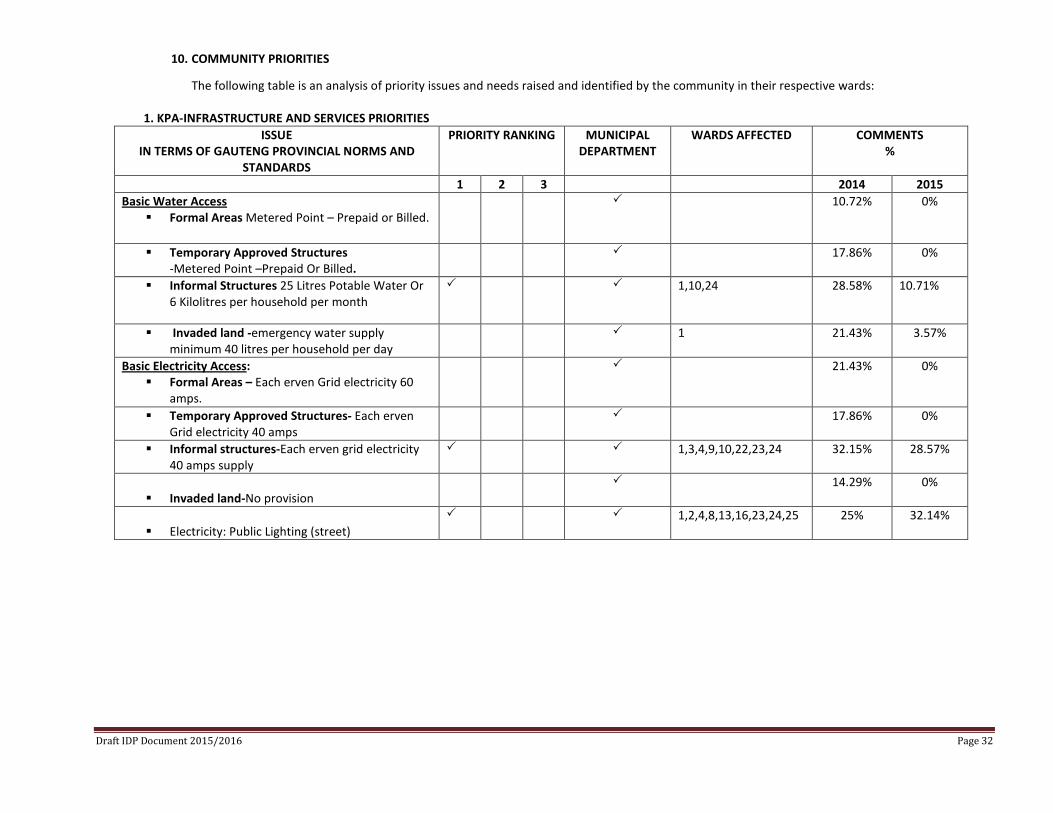
10. COMMUNITY PRIORITIES
The following table is an analysis of priority issues and needs raised and identified by the community in their respective wards:
1. KPA-INFRASTRUCTURE AND SERVICES PRIORITIES ISSUE
IN TERMS OF GAUTENG PROVINCIAL NORMS AND STANDARDS
PRIORITY RANKING MUNICIPAL DEPARTMENT
WARDS AFFECTED COMMENTS %
1 2 3 2014 2015 Basic Water Access
Formal Areas Metered Point – Prepaid or Billed. 10.72%
0%
Temporary Approved Structures -Metered Point –Prepaid Or Billed.
17.86%
0%
Informal Structures 25 Litres Potable Water Or 6 Kilolitres per household per month
1,10,24 28.58% 10.71%
Invaded land -emergency water supply minimum 40 litres per household per day
1 21.43% 3.57%
Basic Electricity Access: Formal Areas – Each erven Grid electricity 60
amps.
21.43%
0%
Temporary Approved Structures- Each erven Grid electricity 40 amps
17.86%
0%
Informal structures-Each erven grid electricity 40 amps supply
1,3,4,9,10,22,23,24 32.15% 28.57%
Invaded land-No provision
14.29% 0%
Electricity: Public Lighting (street)
1,2,4,8,13,16,23,24,25 25% 32.14%
Draft IDP Document 2015/2016 Page 32
ISSUE IN TERMS OF GAUTENG PROVINCIAL NORMS AND
STANDARDS
PRIORITY RANKING MUNICIPAL DEPARTMENT
WARDS AFFECTED COMMENTS %
1 2 3 2014 2015
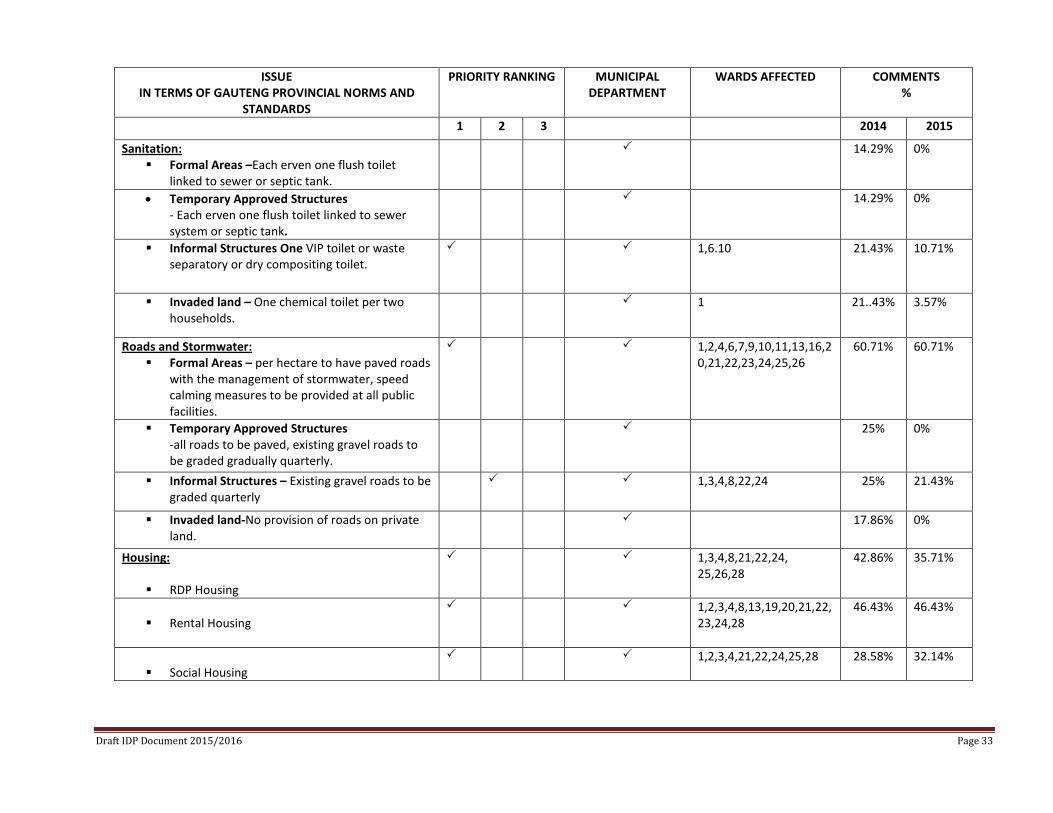
Sanitation: Formal Areas –Each erven one flush toilet
linked to sewer or septic tank.
14.29%
0%
• Temporary Approved Structures - Each erven one flush toilet linked to sewer system or septic tank.
14.29% 0%
Informal Structures One VIP toilet or waste separatory or dry compositing toilet.
1,6.10
21.43% 10.71%
Invaded land – One chemical toilet per two households.
1 21..43% 3.57%
Roads and Stormwater: Formal Areas – per hectare to have paved roads
with the management of stormwater, speed calming measures to be provided at all public facilities.
1,2,4,6,7,9,10,11,13,16,20,21,22,23,24,25,26
60.71%
60.71%
Temporary Approved Structures -all roads to be paved, existing gravel roads to be graded gradually quarterly.
25% 0%
Informal Structures – Existing gravel roads to be graded quarterly
1,3,4,8,22,24 25% 21.43%
Invaded land-No provision of roads on private land.
17.86% 0%
Housing:
RDP Housing
1,3,4,8,21,22,24, 25,26,28
42.86%
35.71%
Rental Housing
1,2,3,4,8,13,19,20,21,22,23,24,28
46.43% 46.43%
Social Housing
1,2,3,4,21,22,24,25,28 28.58% 32.14%
Draft IDP Document 2015/2016 Page 33
ISSUES IN TERMS OF GAUTENG PROVINCIAL NORMS AND
STANDARDS
PRIORITY RANKING MUNICIPAL DEPARTMENT
WARDS AFFECTED COMMENTS %
1 2 3 2014 2015
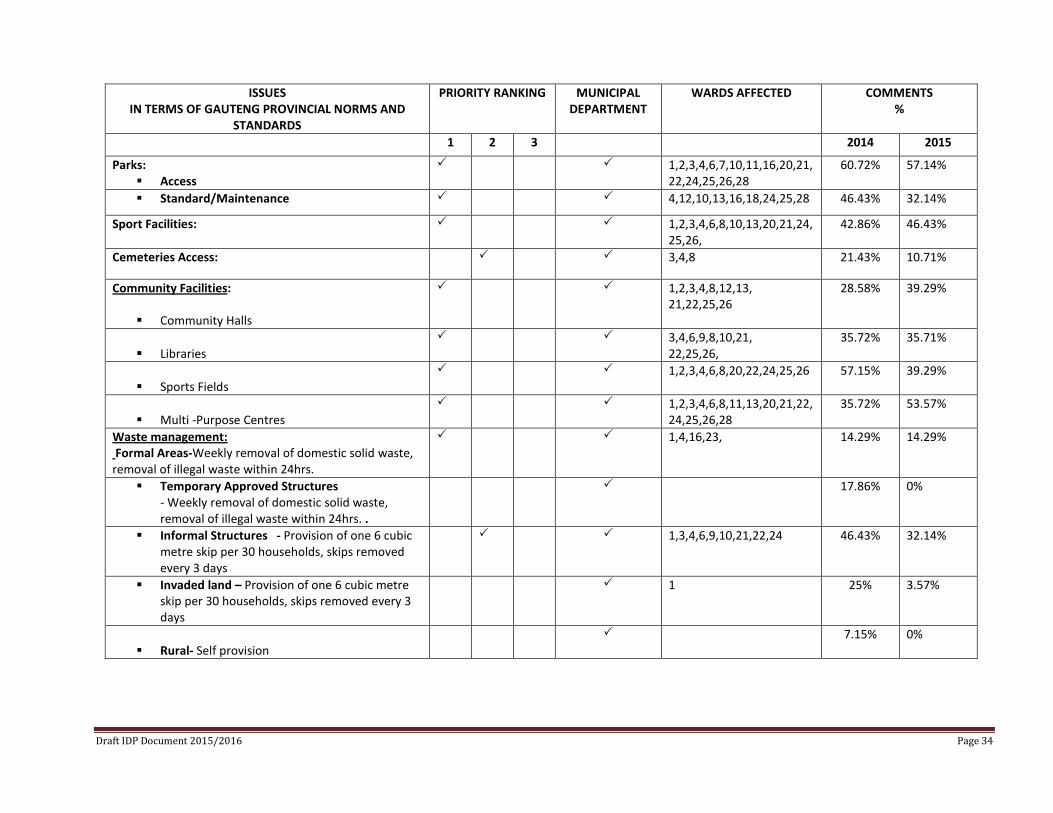
Parks: Access
1,2,3,4,6,7,10,11,16,20,21,22,24,25,26,28
60.72% 57.14%
Standard/Maintenance 4,12,10,13,16,18,24,25,28 46.43% 32.14%
Sport Facilities:
1,2,3,4,6,8,10,13,20,21,24,25,26,
42.86% 46.43%
Cemeteries Access:
3,4,8 21.43% 10.71%
Community Facilities:
Community Halls
1,2,3,4,8,12,13, 21,22,25,26
28.58%
39.29%
Libraries
3,4,6,9,8,10,21, 22,25,26,
35.72%
35.71%
Sports Fields
1,2,3,4,6,8,20,22,24,25,26 57.15% 39.29%
Multi -Purpose Centres
1,2,3,4,6,8,11,13,20,21,22,24,25,26,28
35.72% 53.57%
Waste management: Formal Areas-Weekly removal of domestic solid waste, removal of illegal waste within 24hrs.
1,4,16,23,
14.29%
14.29%
Temporary Approved Structures - Weekly removal of domestic solid waste, removal of illegal waste within 24hrs. .
17.86%
0%
Informal Structures - Provision of one 6 cubic metre skip per 30 households, skips removed every 3 days
1,3,4,6,9,10,21,22,24 46.43% 32.14%
Invaded land – Provision of one 6 cubic metre skip per 30 households, skips removed every 3 days
1 25% 3.57%
Rural- Self provision
7.15% 0%
Draft IDP Document 2015/2016 Page 34
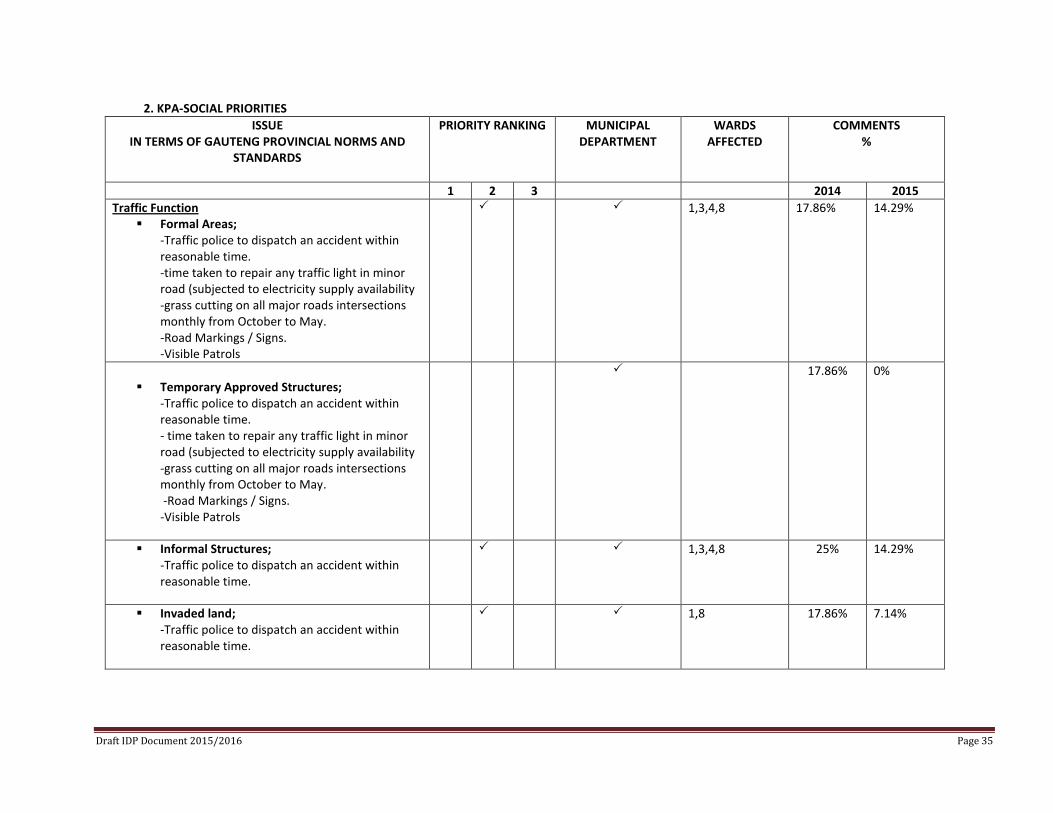
2. KPA-SOCIAL PRIORITIES ISSUE
IN TERMS OF GAUTENG PROVINCIAL NORMS AND STANDARDS
PRIORITY RANKING MUNICIPAL DEPARTMENT
WARDS AFFECTED
COMMENTS %
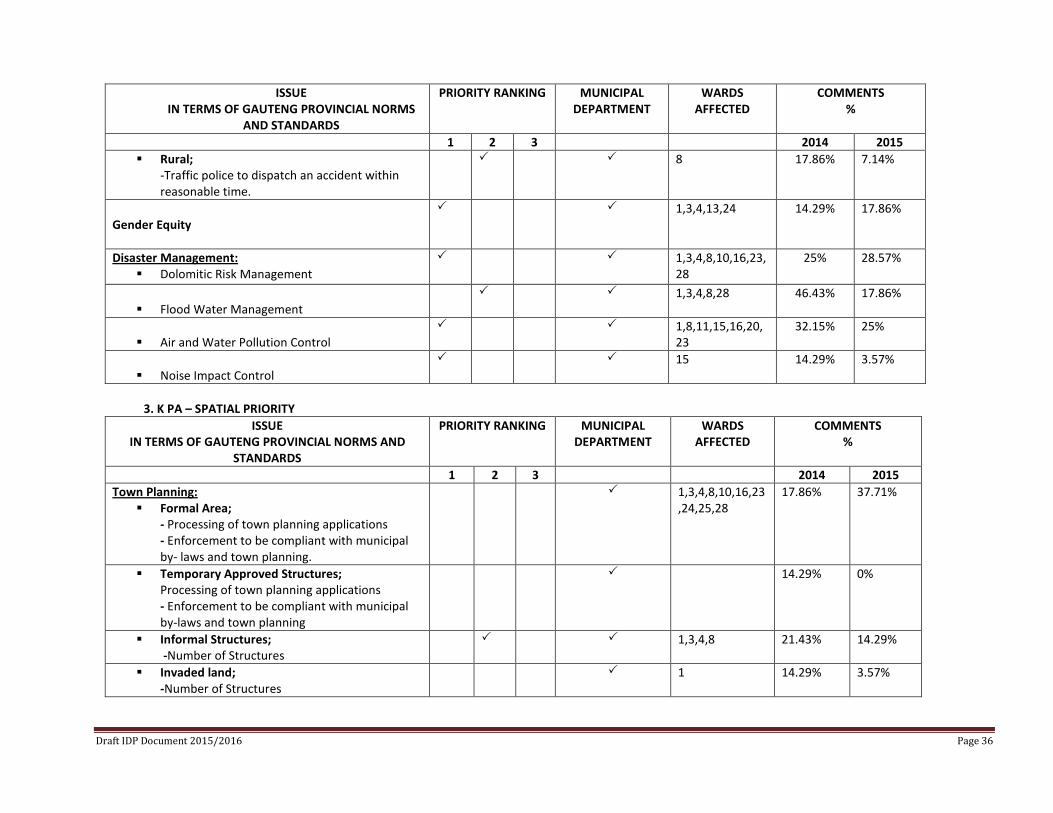
1 2 3 2014 2015 Traffic Function
Formal Areas; -Traffic police to dispatch an accident within reasonable time. -time taken to repair any traffic light in minor road (subjected to electricity supply availability -grass cutting on all major roads intersections monthly from October to May. -Road Markings / Signs. -Visible Patrols
1,3,4,8 17.86%
14.29%
Temporary Approved Structures;
-Traffic police to dispatch an accident within reasonable time. - time taken to repair any traffic light in minor road (subjected to electricity supply availability -grass cutting on all major roads intersections monthly from October to May. -Road Markings / Signs. -Visible Patrols
17.86% 0%
Informal Structures; -Traffic police to dispatch an accident within reasonable time.
1,3,4,8 25% 14.29%
Invaded land; -Traffic police to dispatch an accident within reasonable time.
1,8 17.86% 7.14%
Draft IDP Document 2015/2016 Page 35
ISSUE IN TERMS OF GAUTENG PROVINCIAL NORMS
AND STANDARDS
PRIORITY RANKING MUNICIPAL DEPARTMENT
WARDS AFFECTED
COMMENTS %
1 2 3 2014 2015 Rural;
-Traffic police to dispatch an accident within reasonable time.
8 17.86% 7.14%
Gender Equity
1,3,4,13,24 14.29% 17.86%
Disaster Management: Dolomitic Risk Management
1,3,4,8,10,16,23, 28
25%
28.57%
Flood Water Management
1,3,4,8,28 46.43%
17.86%
Air and Water Pollution Control
1,8,11,15,16,20,23
32.15% 25%
Noise Impact Control
15 14.29% 3.57%
3. K PA – SPATIAL PRIORITY
ISSUE IN TERMS OF GAUTENG PROVINCIAL NORMS AND
STANDARDS
PRIORITY RANKING MUNICIPAL DEPARTMENT
WARDS AFFECTED
COMMENTS %
1 2 3 2014 2015 Town Planning:
Formal Area; - Processing of town planning applications - Enforcement to be compliant with municipal by- laws and town planning.
1,3,4,8,10,16,23,24,25,28
17.86%
37.71%
Temporary Approved Structures; Processing of town planning applications - Enforcement to be compliant with municipal by-laws and town planning
14.29% 0%
Informal Structures; -Number of Structures
1,3,4,8 21.43% 14.29%
Invaded land; -Number of Structures
1 14.29% 3.57%
Draft IDP Document 2015/2016 Page 36
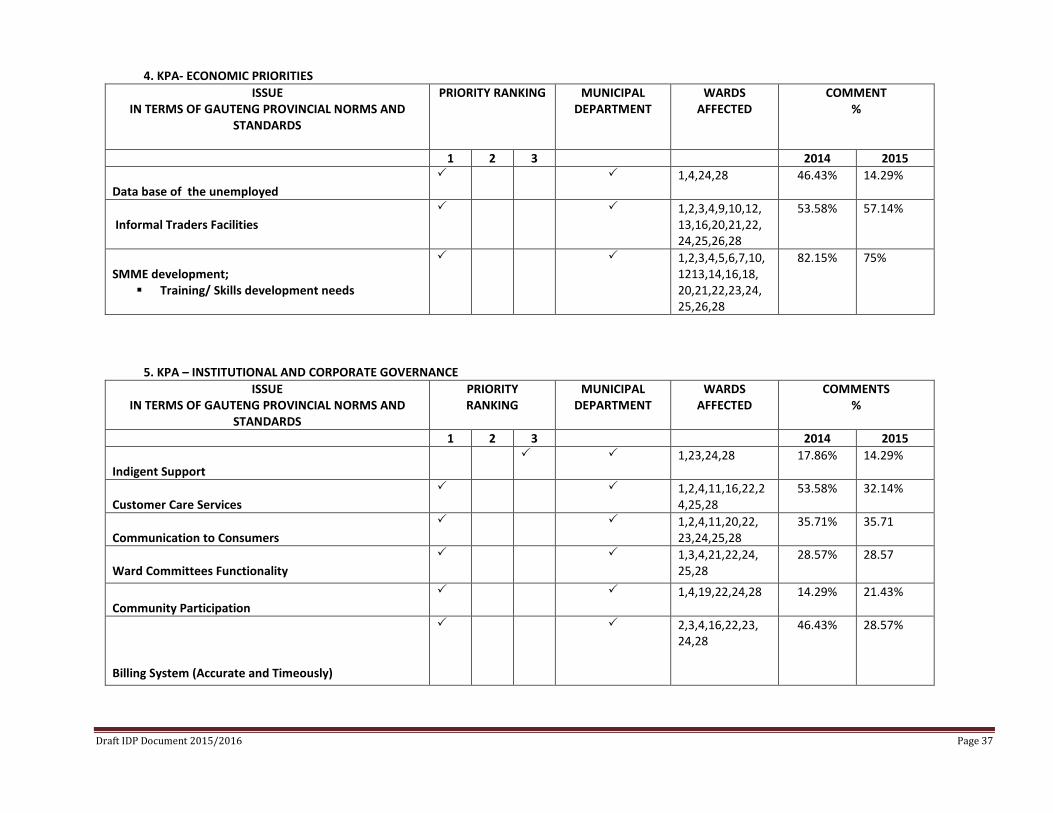
4. KPA- ECONOMIC PRIORITIES ISSUE
IN TERMS OF GAUTENG PROVINCIAL NORMS AND STANDARDS
PRIORITY RANKING MUNICIPAL DEPARTMENT
WARDS AFFECTED
COMMENT %
1 2 3 2014 2015 Data base of the unemployed
1,4,24,28 46.43% 14.29%
Informal Traders Facilities
1,2,3,4,9,10,12, 13,16,20,21,22, 24,25,26,28
53.58% 57.14%
SMME development;
Training/ Skills development needs
1,2,3,4,5,6,7,10,1213,14,16,18, 20,21,22,23,24, 25,26,28
82.15% 75%
5. KPA – INSTITUTIONAL AND CORPORATE GOVERNANCE ISSUE
IN TERMS OF GAUTENG PROVINCIAL NORMS AND STANDARDS
PRIORITY RANKING
MUNICIPAL DEPARTMENT
WARDS AFFECTED
COMMENTS %
1 2 3 2014 2015 Indigent Support
1,23,24,28 17.86% 14.29%
Customer Care Services
1,2,4,11,16,22,24,25,28
53.58% 32.14%
Communication to Consumers
1,2,4,11,20,22, 23,24,25,28
35.71% 35.71
Ward Committees Functionality
1,3,4,21,22,24, 25,28
28.57% 28.57
Community Participation
1,4,19,22,24,28 14.29% 21.43%
Billing System (Accurate and Timeously)
2,3,4,16,22,23, 24,28
46.43% 28.57%
Draft IDP Document 2015/2016 Page 37
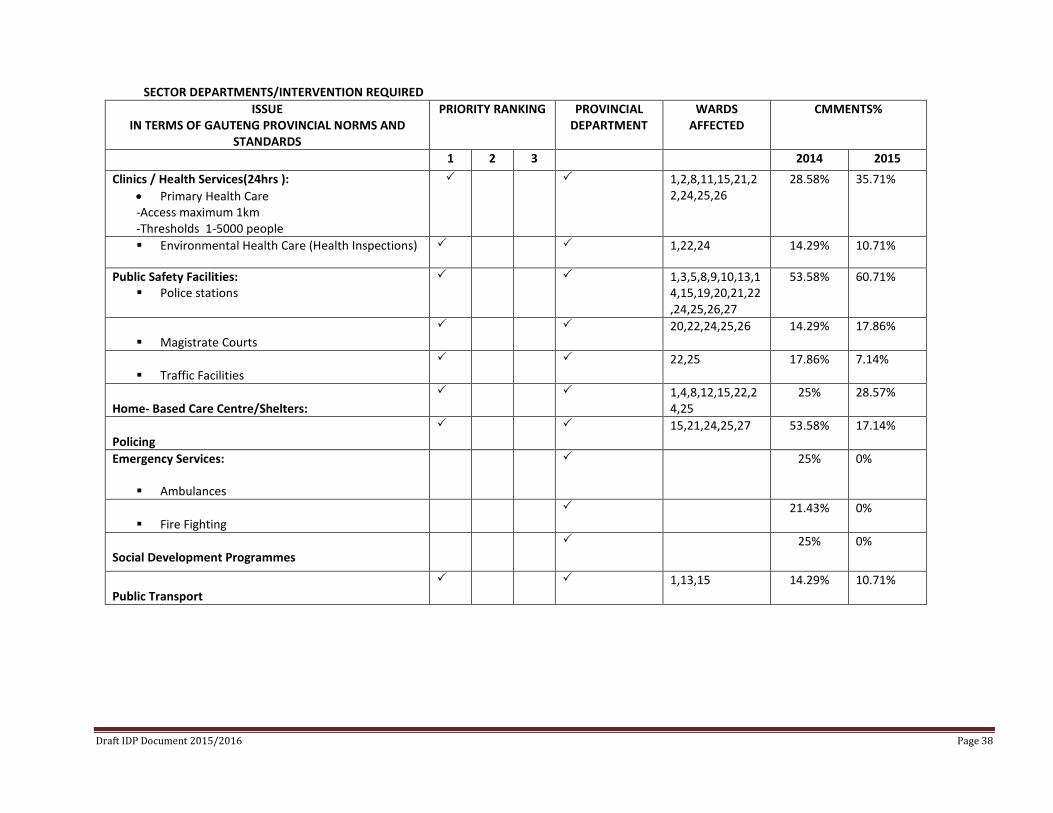
SECTOR DEPARTMENTS/INTERVENTION REQUIRED ISSUE
IN TERMS OF GAUTENG PROVINCIAL NORMS AND STANDARDS
PRIORITY RANKING PROVINCIAL DEPARTMENT
WARDS AFFECTED
CMMENTS%
1 2 3 2014 2015 Clinics / Health Services(24hrs ):
• Primary Health Care -Access maximum 1km -Thresholds 1-5000 people
1,2,8,11,15,21,22,24,25,26
28.58% 35.71%
Environmental Health Care (Health Inspections) 1,22,24 14.29% 10.71%
Public Safety Facilities: Police stations
1,3,5,8,9,10,13,14,15,19,20,21,22,24,25,26,27
53.58% 60.71%
Magistrate Courts
20,22,24,25,26 14.29% 17.86%
Traffic Facilities
22,25 17.86% 7.14%
Home- Based Care Centre/Shelters:
1,4,8,12,15,22,24,25
25% 28.57%
Policing
15,21,24,25,27 53.58% 17.14%
Emergency Services:
Ambulances
25% 0%
Fire Fighting
21.43% 0%
Social Development Programmes
25% 0%
Public Transport
1,13,15 14.29% 10.71%
Draft IDP Document 2015/2016 Page 38
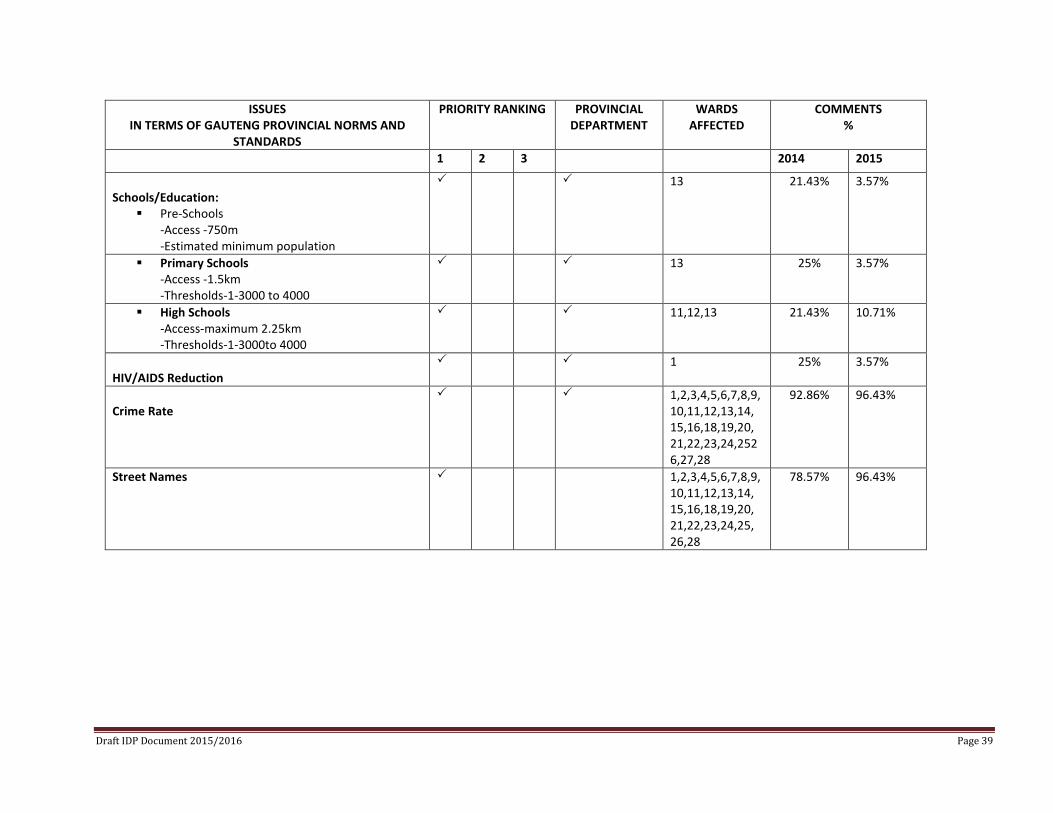
ISSUES IN TERMS OF GAUTENG PROVINCIAL NORMS AND
STANDARDS
PRIORITY RANKING PROVINCIAL DEPARTMENT
WARDS AFFECTED
COMMENTS %
1 2 3 2014 2015
Schools/Education:
Pre-Schools -Access -750m -Estimated minimum population
13 21.43%
3.57%
Primary Schools -Access -1.5km -Thresholds-1-3000 to 4000
13 25% 3.57%
High Schools -Access-maximum 2.25km -Thresholds-1-3000to 4000
11,12,13 21.43% 10.71%
HIV/AIDS Reduction
1 25% 3.57%
Crime Rate
1,2,3,4,5,6,7,8,9, 10,11,12,13,14, 15,16,18,19,20, 21,22,23,24,2526,27,28
92.86% 96.43%
Street Names 1,2,3,4,5,6,7,8,9, 10,11,12,13,14, 15,16,18,19,20, 21,22,23,24,25, 26,28
78.57% 96.43%
Draft IDP Document 2015/2016 Page 39
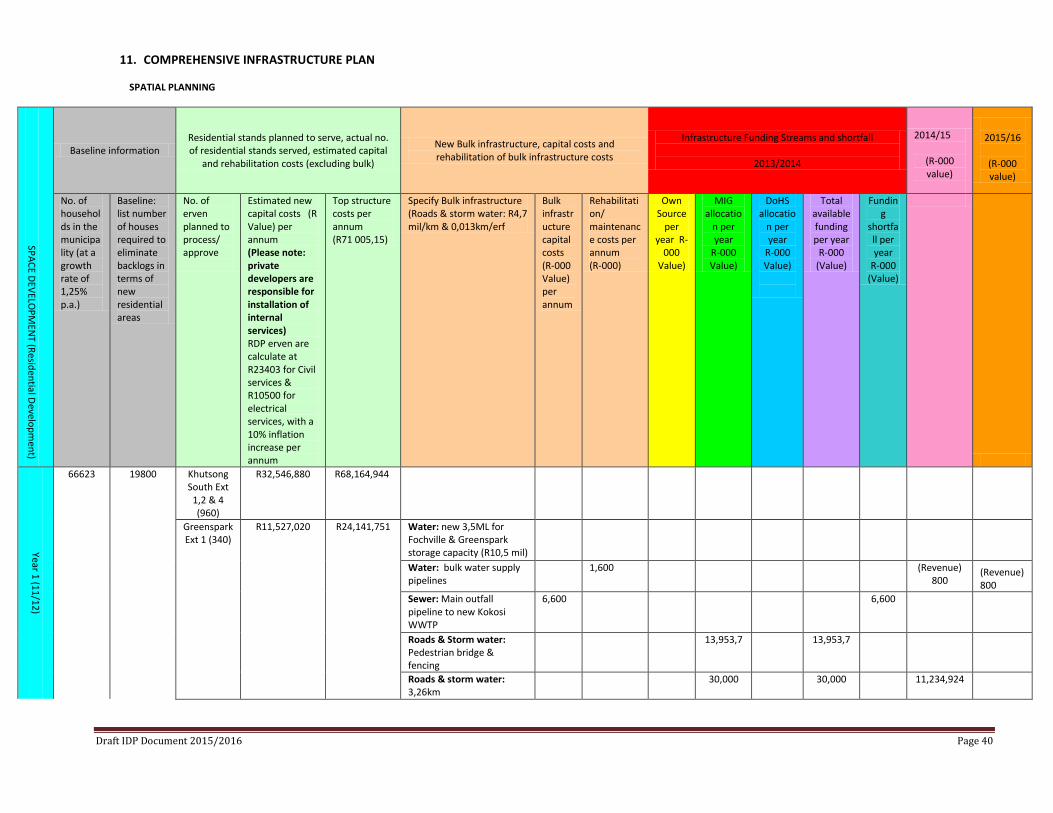
11. COMPREHENSIVE INFRASTRUCTURE PLAN SPATIAL PLANNING
SPACE DEVELOPM
ENT (Residential Development)
Baseline information Residential stands planned to serve, actual no. of residential stands served, estimated capital
and rehabilitation costs (excluding bulk)
New Bulk infrastructure, capital costs and rehabilitation of bulk infrastructure costs
Infrastructure Funding Streams and shortfall
2013/2014
2014/15
(R-000 value)
2015/16
(R-000 value)
No. of households in the municipality (at a growth rate of 1,25% p.a.)
Baseline: list number of houses required to eliminate backlogs in terms of new residential areas
No. of erven planned to process/ approve
Estimated new capital costs (R Value) per annum (Please note: private developers are responsible for installation of internal services) RDP erven are calculate at R23403 for Civil services & R10500 for electrical services, with a 10% inflation increase per annum
Top structure costs per annum (R71 005,15)
Specify Bulk infrastructure (Roads & storm water: R4,7 mil/km & 0,013km/erf
Bulk infrastructure capital costs (R-000 Value) per annum
Rehabilitation/ maintenance costs per annum (R-000)
Own Source
per year R-
000 Value)
MIG allocatio
n per year
R-000 Value)
DoHS allocatio
n per year
R-000 Value)
Total available funding per year
R-000 (Value)
Funding
shortfall per year
R-000 (Value)
Year 1 (11/12)
66623 19800 Khutsong South Ext
1,2 & 4 (960)
R32,546,880 R68,164,944
Greenspark Ext 1 (340)
R11,527,020 R24,141,751 Water: new 3,5ML for Fochville & Greenspark storage capacity (R10,5 mil)
Water: bulk water supply pipelines
1,600 (Revenue) 800
(Revenue) 800
Sewer: Main outfall pipeline to new Kokosi WWTP
6,600 6,600
Roads & Storm water: Pedestrian bridge & fencing
13,953,7 13,953,7
Roads & storm water: 3,26km
30,000 30,000 11,234,924
Draft IDP Document 2015/2016 Page 40
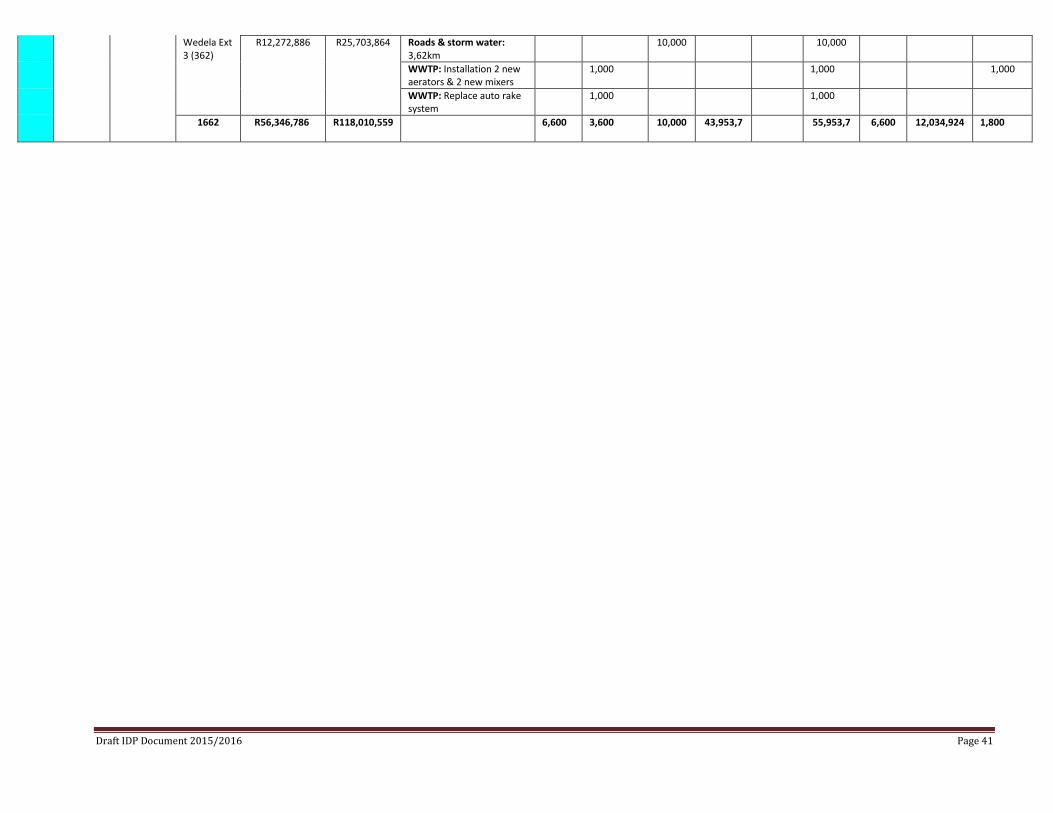
Wedela Ext 3 (362)
R12,272,886 R25,703,864 Roads & storm water: 3,62km
10,000 10,000
WWTP: Installation 2 new aerators & 2 new mixers
1,000 1,000 1,000
WWTP: Replace auto rake system
1,000 1,000
1662 R56,346,786 R118,010,559 6,600 3,600 10,000 43,953,7 55,953,7 6,600 12,034,924 1,800
Draft IDP Document 2015/2016 Page 41
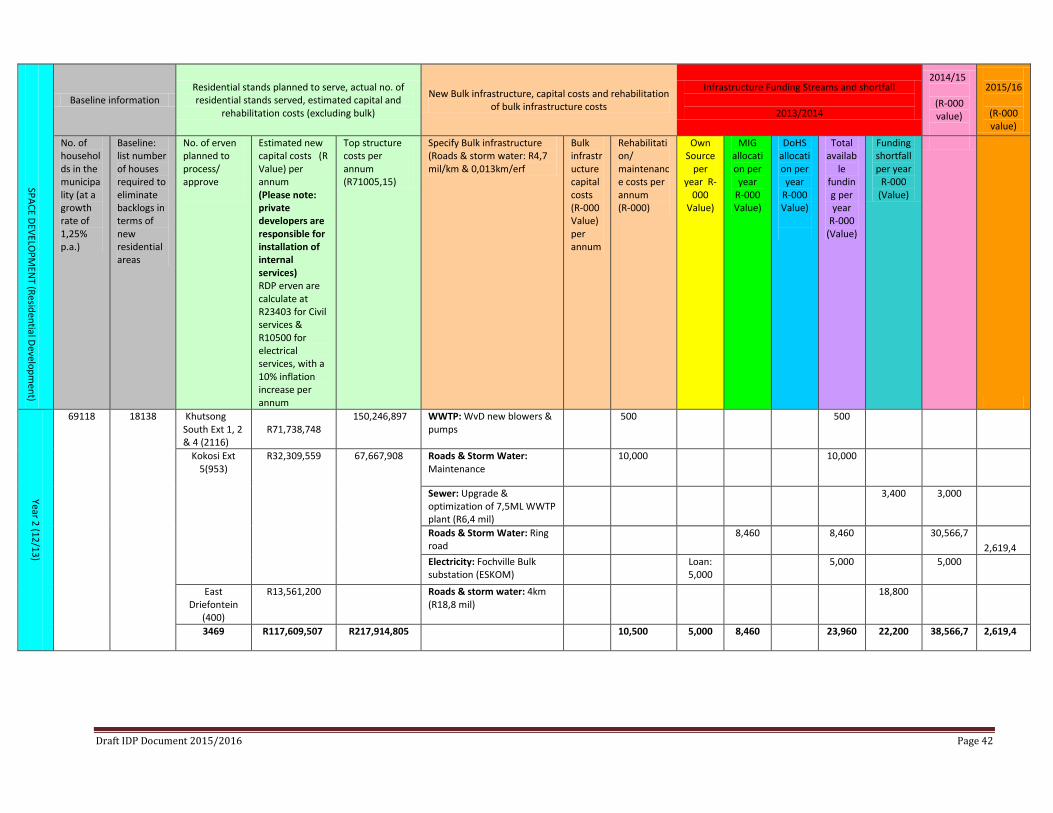
SPACE DEVELOPM
ENT (Residential Development)
Baseline information Residential stands planned to serve, actual no. of residential stands served, estimated capital and
rehabilitation costs (excluding bulk)
New Bulk infrastructure, capital costs and rehabilitation of bulk infrastructure costs
Infrastructure Funding Streams and shortfall
2013/2014
2014/15
(R-000 value)
2015/16
(R-000 value)
No. of households in the municipality (at a growth rate of 1,25% p.a.)
Baseline: list number of houses required to eliminate backlogs in terms of new residential areas
No. of erven planned to process/ approve
Estimated new capital costs (R Value) per annum (Please note: private developers are responsible for installation of internal services) RDP erven are calculate at R23403 for Civil services & R10500 for electrical services, with a 10% inflation increase per annum
Top structure costs per annum (R71005,15)
Specify Bulk infrastructure (Roads & storm water: R4,7 mil/km & 0,013km/erf
Bulk infrastructure capital costs (R-000 Value) per annum
Rehabilitation/ maintenance costs per annum (R-000)
Own Source
per year R-
000 Value)
MIG allocation per year
R-000 Value)
DoHS allocation per year
R-000 Value)
Total availab
le funding per year
R-000 (Value)
Funding shortfall per year
R-000 (Value)
Year 2 (12/13)
69118 18138 Khutsong South Ext 1, 2 & 4 (2116)
R71,738,748
150,246,897 WWTP: WvD new blowers & pumps
500 500
Kokosi Ext
5(953) R32,309,559 67,667,908 Roads & Storm Water:
Maintenance 10,000 10,000
Sewer: Upgrade & optimization of 7,5ML WWTP plant (R6,4 mil)
3,400 3,000
Roads & Storm Water: Ring road
8,460 8,460 30,566,7 2,619,4
Electricity: Fochville Bulk substation (ESKOM)
Loan: 5,000
5,000 5,000
East Driefontein
(400)
R13,561,200 Roads & storm water: 4km (R18,8 mil)
18,800
3469 R117,609,507 R217,914,805 10,500 5,000 8,460 23,960 22,200 38,566,7 2,619,4
Draft IDP Document 2015/2016 Page 42
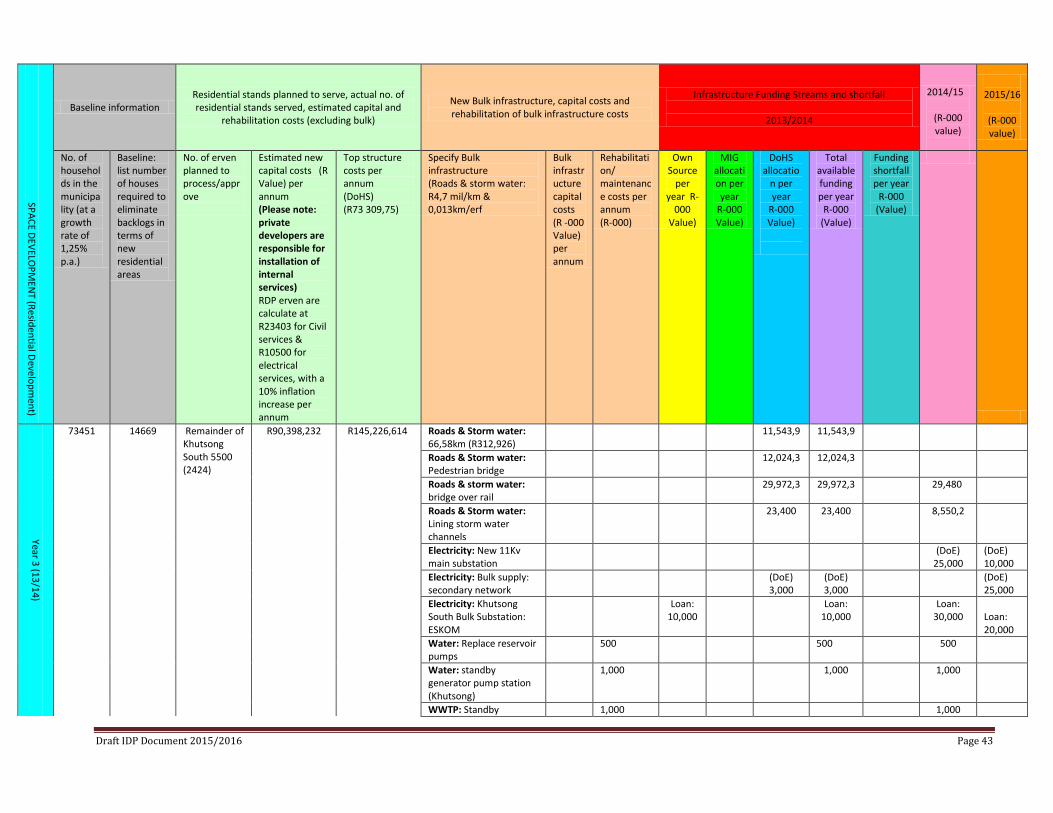
SPACE DEVELOPM
ENT (Residential Development)
Baseline information Residential stands planned to serve, actual no. of residential stands served, estimated capital and
rehabilitation costs (excluding bulk)
New Bulk infrastructure, capital costs and rehabilitation of bulk infrastructure costs
Infrastructure Funding Streams and shortfall
2013/2014
2014/15
(R-000 value)
2015/16
(R-000 value)
No. of households in the municipality (at a growth rate of 1,25% p.a.)
Baseline: list number of houses required to eliminate backlogs in terms of new residential areas
No. of erven planned to process/approve
Estimated new capital costs (R Value) per annum (Please note: private developers are responsible for installation of internal services) RDP erven are calculate at R23403 for Civil services & R10500 for electrical services, with a 10% inflation increase per annum
Top structure costs per annum (DoHS) (R73 309,75)
Specify Bulk infrastructure (Roads & storm water: R4,7 mil/km & 0,013km/erf
Bulk infrastructure capital costs (R -000 Value) per annum
Rehabilitation/ maintenance costs per annum (R-000)
Own Source
per year R-
000 Value)
MIG allocation per year
R-000 Value)
DoHS allocatio
n per year
R-000 Value)
Total available funding per year
R-000 (Value)
Funding shortfall per year
R-000 (Value)
Year 3 (13/14)
73451 14669 Remainder of Khutsong South 5500 (2424)
R90,398,232 R145,226,614 Roads & Storm water: 66,58km (R312,926)
11,543,9 11,543,9
Roads & Storm water: Pedestrian bridge
12,024,3 12,024,3
Roads & storm water: bridge over rail
29,972,3 29,972,3 29,480
Roads & Storm water: Lining storm water channels
23,400 23,400 8,550,2
Electricity: New 11Kv main substation
(DoE) 25,000
(DoE) 10,000
Electricity: Bulk supply: secondary network
(DoE) 3,000
(DoE) 3,000
(DoE) 25,000
Electricity: Khutsong South Bulk Substation: ESKOM
Loan: 10,000
Loan: 10,000
Loan: 30,000 Loan:
20,000 Water: Replace reservoir pumps
500 500 500
Water: standby generator pump station (Khutsong)
1,000 1,000 1,000
WWTP: Standby 1,000 1,000
Draft IDP Document 2015/2016 Page 43
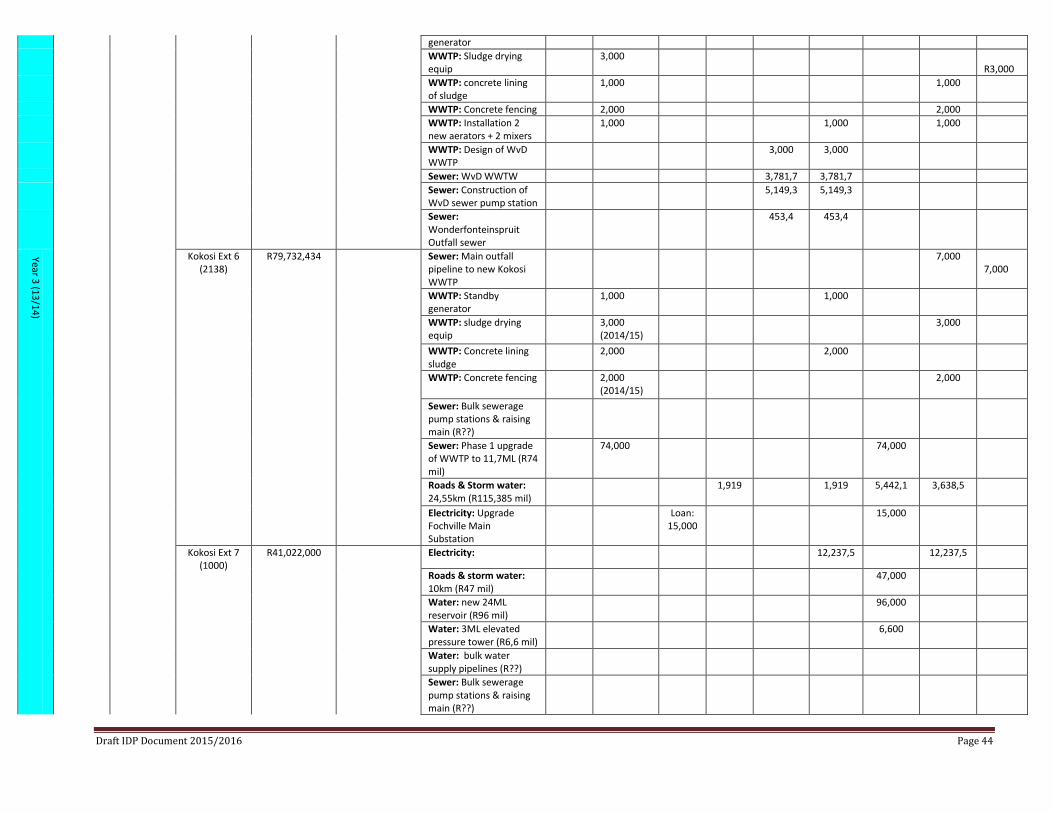
generator WWTP: Sludge drying equip
3,000 R3,000
WWTP: concrete lining of sludge
1,000 1,000
WWTP: Concrete fencing 2,000 2,000 WWTP: Installation 2 new aerators + 2 mixers
1,000 1,000 1,000
WWTP: Design of WvD WWTP
3,000 3,000
Sewer: WvD WWTW 3,781,7 3,781,7 Sewer: Construction of WvD sewer pump station
5,149,3 5,149,3
Sewer: Wonderfonteinspruit Outfall sewer
453,4 453,4
Year 3 (13/14)
Kokosi Ext 6 (2138)
R79,732,434 Sewer: Main outfall pipeline to new Kokosi WWTP
7,000 7,000
WWTP: Standby generator
1,000 1,000
WWTP: sludge drying equip
3,000 (2014/15)
3,000
WWTP: Concrete lining sludge
2,000 2,000
WWTP: Concrete fencing 2,000 (2014/15)
2,000
Sewer: Bulk sewerage pump stations & raising main (R??)
Sewer: Phase 1 upgrade of WWTP to 11,7ML (R74 mil)
74,000 74,000
Roads & Storm water: 24,55km (R115,385 mil)
1,919 1,919 5,442,1 3,638,5
Electricity: Upgrade Fochville Main Substation
Loan: 15,000
15,000
Kokosi Ext 7
(1000) R41,022,000 Electricity: 12,237,5 12,237,5
Roads & storm water: 10km (R47 mil)
47,000
Water: new 24ML reservoir (R96 mil)
96,000
Water: 3ML elevated pressure tower (R6,6 mil)
6,600
Water: bulk water supply pipelines (R??)
Sewer: Bulk sewerage pump stations & raising main (R??)
Draft IDP Document 2015/2016 Page 44
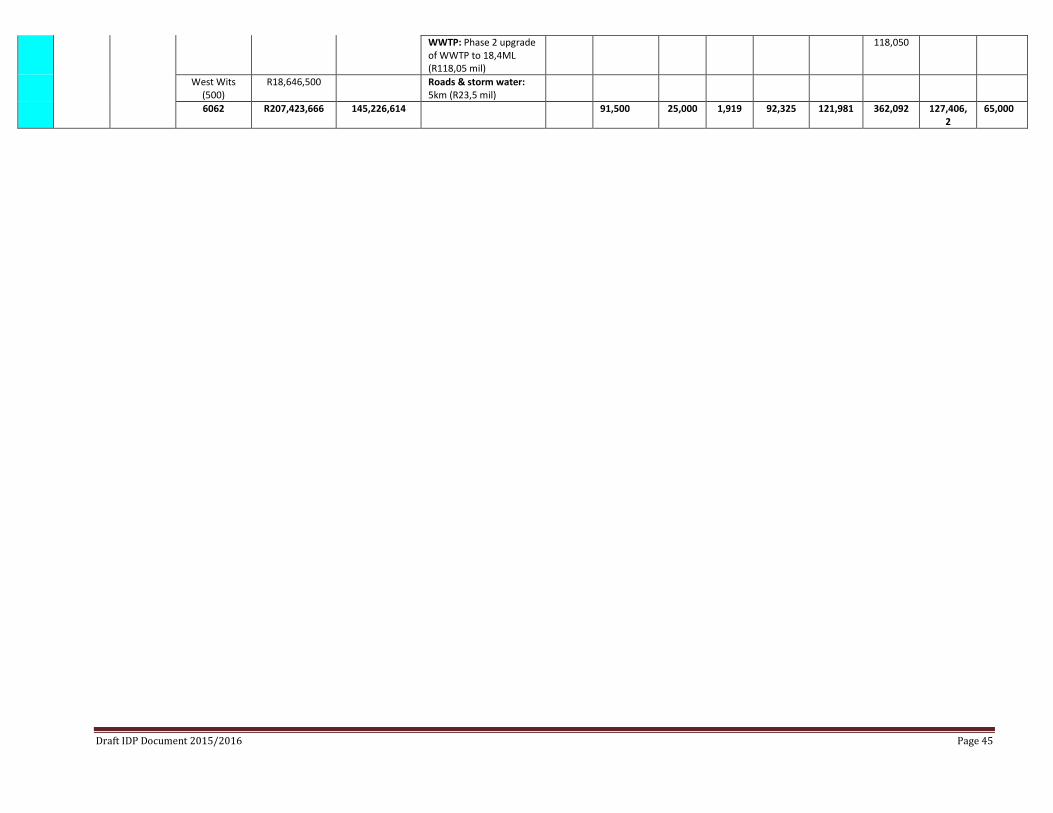
WWTP: Phase 2 upgrade of WWTP to 18,4ML (R118,05 mil)
118,050
West Wits
(500) R18,646,500 Roads & storm water:
5km (R23,5 mil)
6062 R207,423,666 145,226,614 91,500 25,000 1,919 92,325 121,981 362,092
127,406,
2 65,000
Draft IDP Document 2015/2016 Page 45
SPACE DEVELOPM
ENT (Residential Development)
Baseline information Residential stands planned to serve, actual no. of residential stands served, estimated capital and
rehabilitation costs (excluding bulk)
New Bulk infrastructure, capital costs and rehabilitation of bulk infrastructure costs
Infrastructure Funding Streams and shortfall
2013/2014
2014/15
(R-000 value)
2015/16
(R-000 value)
No. of households in the municipality (at a growth rate of 1,25% p.a.)
Baseline: list number of houses required to eliminate backlogs in terms of new residential areas
No. of erven planned to process/approve
Estimated new capital costs (R Value) per annum (Please note: private developers are responsible for installation of internal services) RDP erven are calculate at R23403 for Civil services & R10500 for electrical services, with a 10% inflation increase per annum
Top structure costs per annum (DoHS)
Specify Bulk infrastructure (Roads & storm water: R4,7 mil/km & 0,013km/erf
Bulk infrastructure capital costs (R-000 Value) per annum
Rehabilitation/ maintenance costs per annum (R-000)
Own Source
per year R-
000 Value)
MIG allocation per year R-
000 Valu
e)
DoHS allocation per year
R-000 Value)
Total available funding per year
R-000 (Value)
Funding shortfall per year
R-000 (Value)
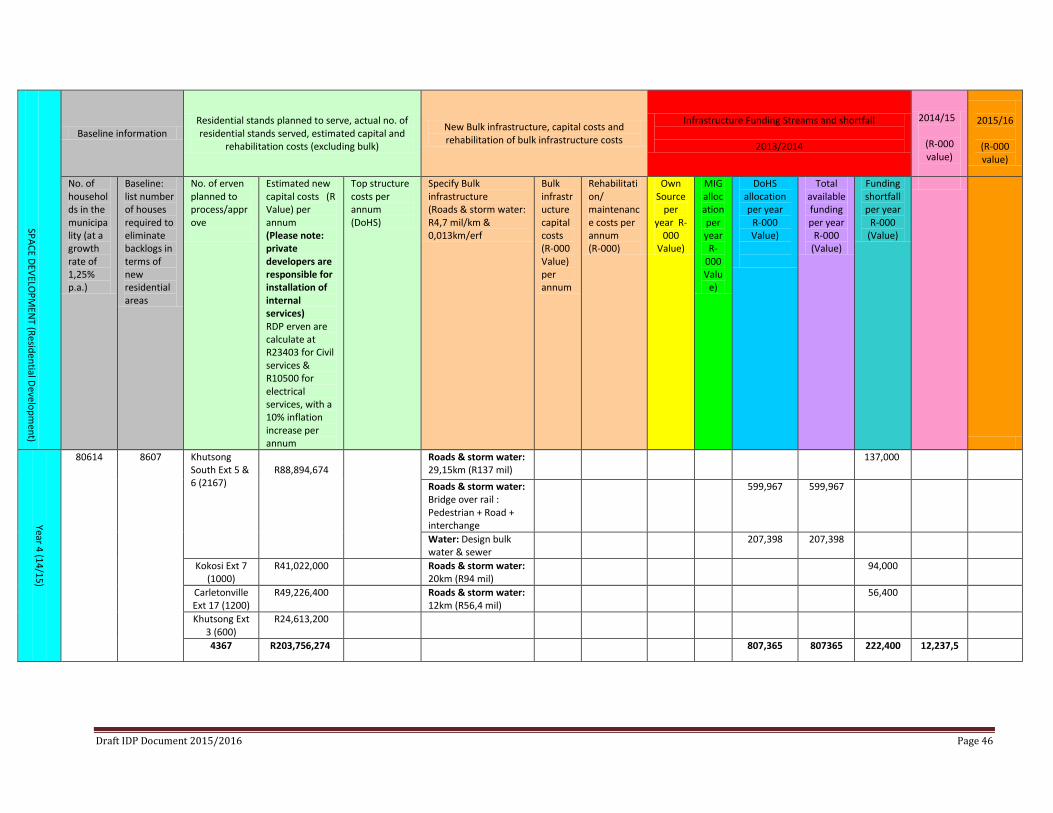
Year 4 (14/15)
80614 8607 Khutsong South Ext 5 & 6 (2167)
R88,894,674
Roads & storm water: 29,15km (R137 mil)
137,000
Roads & storm water: Bridge over rail : Pedestrian + Road + interchange
599,967 599,967
Water: Design bulk water & sewer
207,398 207,398
Kokosi Ext 7 (1000)
R41,022,000 Roads & storm water: 20km (R94 mil)
94,000
Carletonville Ext 17 (1200)
R49,226,400 Roads & storm water: 12km (R56,4 mil)
56,400
Khutsong Ext 3 (600)
R24,613,200
4367 R203,756,274 807,365 807365 222,400 12,237,5
Draft IDP Document 2015/2016 Page 46
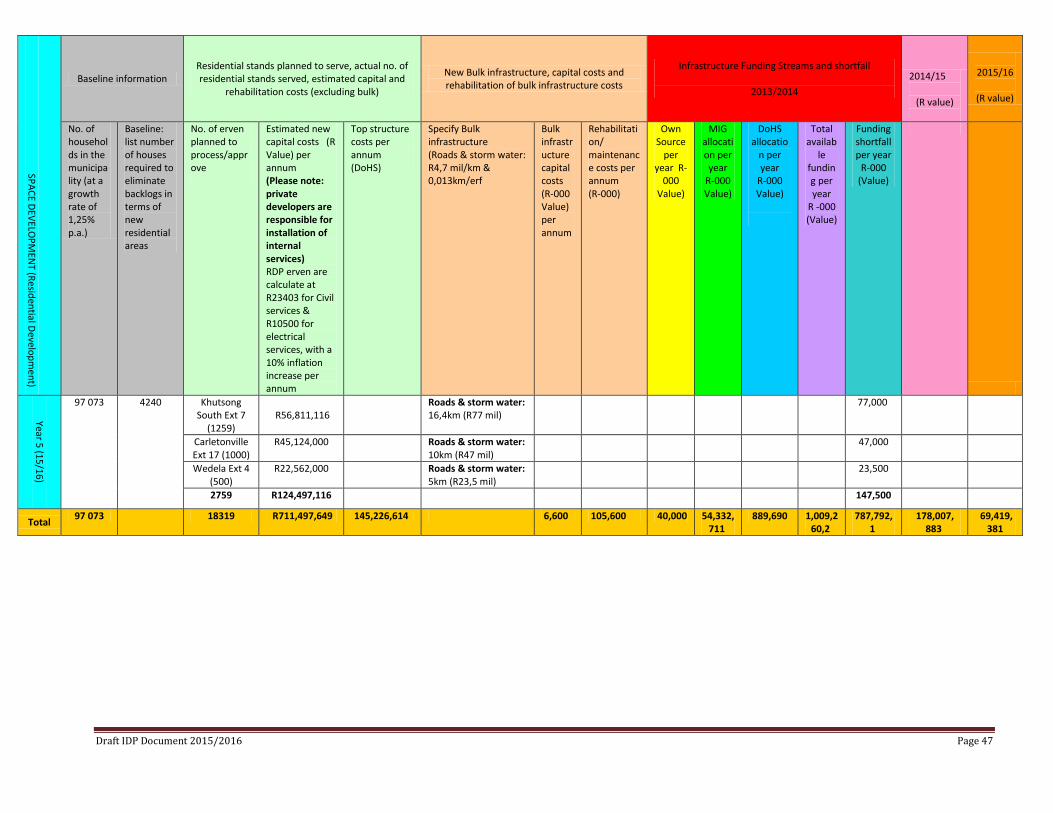
SPACE DEVELOPM
ENT (Residential Development)
Baseline information Residential stands planned to serve, actual no. of residential stands served, estimated capital and
rehabilitation costs (excluding bulk)
New Bulk infrastructure, capital costs and rehabilitation of bulk infrastructure costs
Infrastructure Funding Streams and shortfall
2013/2014 2014/15
(R value)
2015/16
(R value)
No. of households in the municipality (at a growth rate of 1,25% p.a.)
Baseline: list number of houses required to eliminate backlogs in terms of new residential areas
No. of erven planned to process/approve
Estimated new capital costs (R Value) per annum (Please note: private developers are responsible for installation of internal services) RDP erven are calculate at R23403 for Civil services & R10500 for electrical services, with a 10% inflation increase per annum
Top structure costs per annum (DoHS)
Specify Bulk infrastructure (Roads & storm water: R4,7 mil/km & 0,013km/erf
Bulk infrastructure capital costs (R-000 Value) per annum
Rehabilitation/ maintenance costs per annum (R-000)
Own Source
per year R-
000 Value)
MIG allocation per year
R-000 Value)
DoHS allocatio
n per year
R-000 Value)
Total availab
le funding per year
R -000 (Value)
Funding shortfall per year
R-000 (Value)
Year 5 (15/16)
97 073 4240 Khutsong South Ext 7
(1259)
R56,811,116
Roads & storm water: 16,4km (R77 mil)
77,000
Carletonville Ext 17 (1000)
R45,124,000 Roads & storm water: 10km (R47 mil)
47,000
Wedela Ext 4 (500)
R22,562,000 Roads & storm water: 5km (R23,5 mil)
23,500
2759 R124,497,116 147,500
Total 97 073 18319 R711,497,649 145,226,614 6,600 105,600 40,000 54,332,711
889,690 1,009,260,2
787,792,1
178,007, 883
69,419,381
Draft IDP Document 2015/2016 Page 47
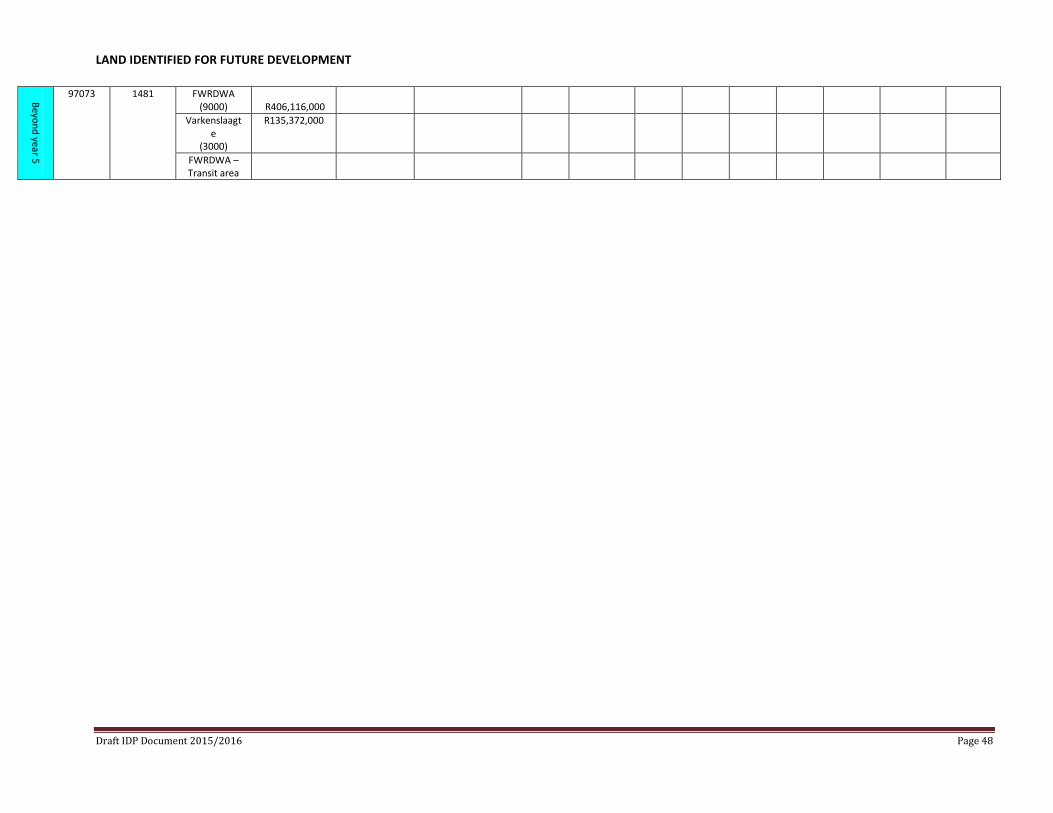
LAND IDENTIFIED FOR FUTURE DEVELOPMENT
Beyond year 5
97073 1481 FWRDWA (9000)
R406,116,000
Varkenslaagte
(3000)
R135,372,000
FWRDWA – Transit area
Draft IDP Document 2015/2016 Page 48
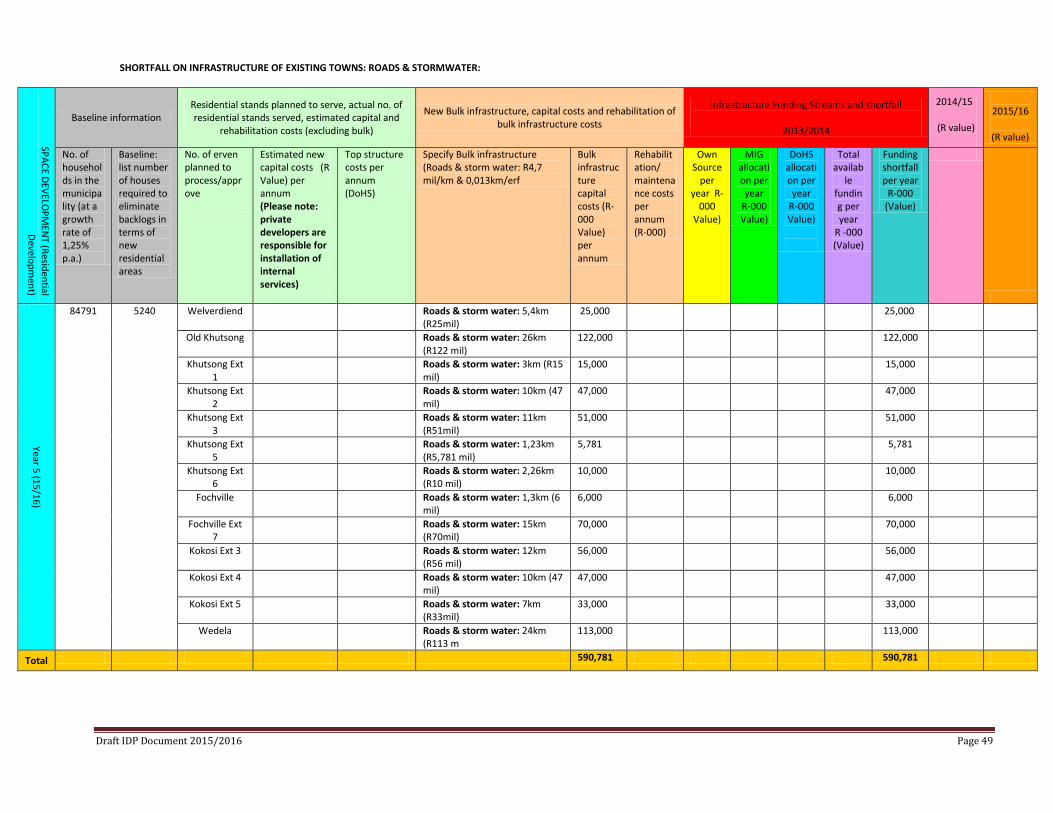
SHORTFALL ON INFRASTRUCTURE OF EXISTING TOWNS: ROADS & STORMWATER:
SPACE DEVELOPM
ENT (Residential Developm
ent)
Baseline information Residential stands planned to serve, actual no. of residential stands served, estimated capital and
rehabilitation costs (excluding bulk)
New Bulk infrastructure, capital costs and rehabilitation of bulk infrastructure costs
Infrastructure Funding Streams and shortfall
2013/2014
2014/15
(R value)
2015/16
(R value)
No. of households in the municipality (at a growth rate of 1,25% p.a.)
Baseline: list number of houses required to eliminate backlogs in terms of new residential areas
No. of erven planned to process/approve
Estimated new capital costs (R Value) per annum (Please note: private developers are responsible for installation of internal services)
Top structure costs per annum (DoHS)
Specify Bulk infrastructure (Roads & storm water: R4,7 mil/km & 0,013km/erf
Bulk infrastructure capital costs (R-000 Value) per annum
Rehabilitation/ maintenance costs per annum (R-000)
Own Source
per year R-
000 Value)
MIG allocation per year
R-000 Value)
DoHS allocation per year
R-000 Value)
Total availab
le funding per year
R -000 (Value)
Funding shortfall per year
R-000 (Value)
Year 5 (15/16)
84791 5240 Welverdiend Roads & storm water: 5,4km (R25mil)
25,000 25,000
Old Khutsong Roads & storm water: 26km (R122 mil)
122,000 122,000
Khutsong Ext 1
Roads & storm water: 3km (R15 mil)
15,000 15,000
Khutsong Ext 2
Roads & storm water: 10km (47 mil)
47,000 47,000
Khutsong Ext 3
Roads & storm water: 11km (R51mil)
51,000 51,000
Khutsong Ext 5
Roads & storm water: 1,23km (R5,781 mil)
5,781 5,781
Khutsong Ext 6
Roads & storm water: 2,26km (R10 mil)
10,000 10,000
Fochville Roads & storm water: 1,3km (6 mil)
6,000 6,000
Fochville Ext 7
Roads & storm water: 15km (R70mil)
70,000 70,000
Kokosi Ext 3 Roads & storm water: 12km (R56 mil)
56,000 56,000
Kokosi Ext 4 Roads & storm water: 10km (47 mil)
47,000 47,000
Kokosi Ext 5 Roads & storm water: 7km (R33mil)
33,000 33,000
Wedela Roads & storm water: 24km (R113 m
113,000 113,000
Total 590,781 590,781
Draft IDP Document 2015/2016 Page 49
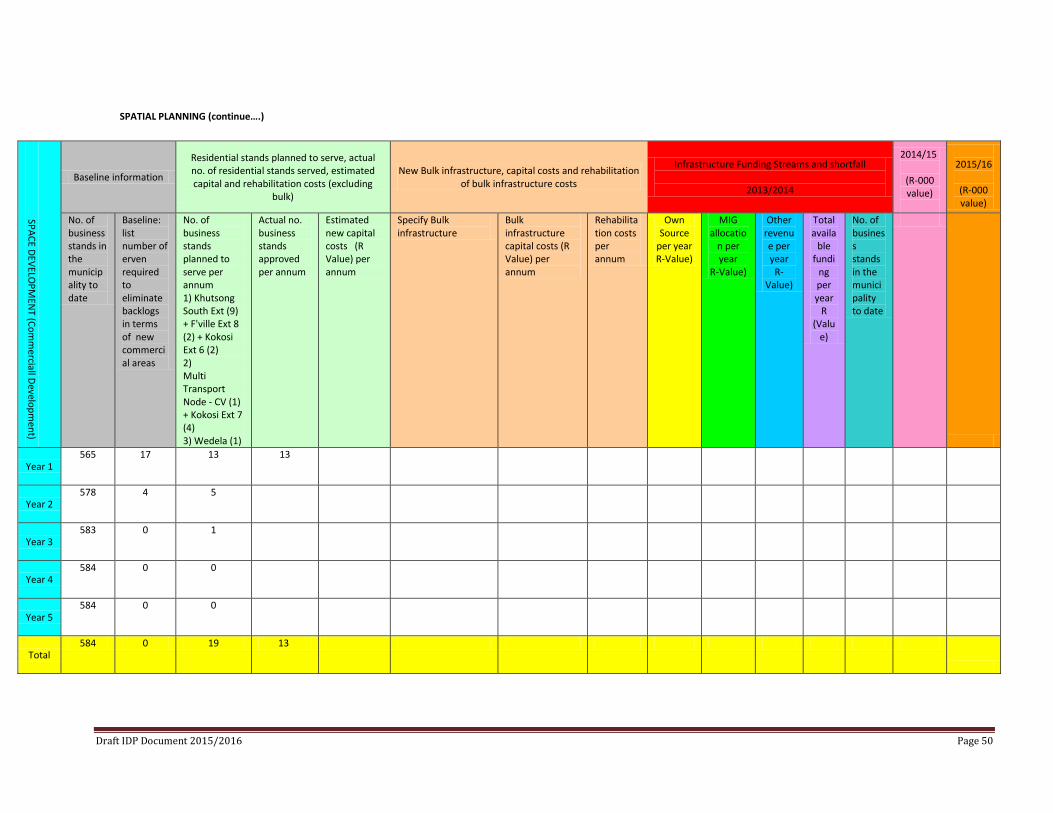
SPATIAL PLANNING (continue….)
SPACE DEVELOPM
ENT (Comm
erciall Development)
Baseline information
Residential stands planned to serve, actual no. of residential stands served, estimated capital and rehabilitation costs (excluding
bulk)
New Bulk infrastructure, capital costs and rehabilitation of bulk infrastructure costs
Infrastructure Funding Streams and shortfall
2013/2014
2014/15
(R-000 value)
2015/16
(R-000 value)
No. of business stands in the municipality to date
Baseline: list number of erven required to eliminate backlogs in terms of new commercial areas
No. of business stands planned to serve per annum 1) Khutsong South Ext (9) + F'ville Ext 8 (2) + Kokosi Ext 6 (2) 2) Multi Transport Node - CV (1) + Kokosi Ext 7 (4) 3) Wedela (1)
Actual no. business stands approved per annum
Estimated new capital costs (R Value) per annum
Specify Bulk infrastructure
Bulk infrastructure capital costs (R Value) per annum
Rehabilitation costs per annum
Own Source
per year R-Value)
MIG allocatio
n per year
R-Value)
Other revenue per year R-
Value)
Total availa
ble fundi
ng per year
R (Valu
e)
No. of business stands in the municipality to date
Year 1 565 17 13 13
Year 2 578 4 5
Year 3 583 0 1
Year 4 584 0 0
Year 5 584 0 0
Total 584 0 19 13
Draft IDP Document 2015/2016 Page 50
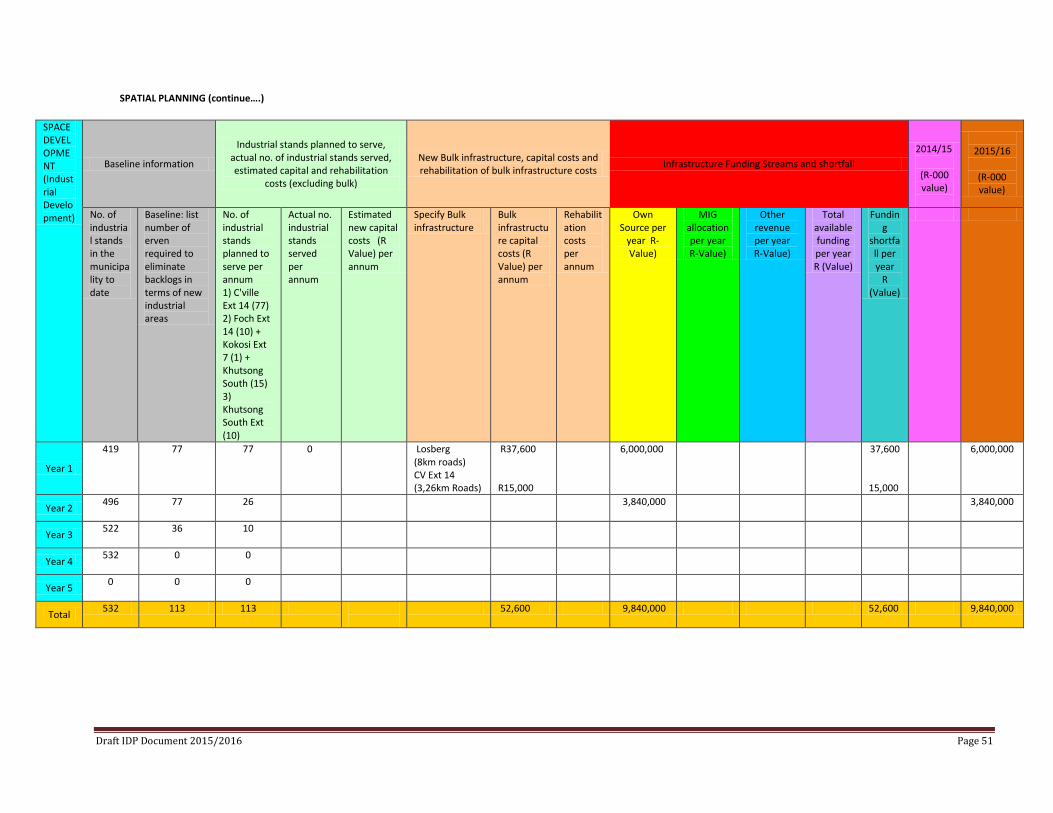
SPATIAL PLANNING (continue….)
SPACE DEVELOPMENT (Industrial Development)
Baseline information
Industrial stands planned to serve, actual no. of industrial stands served, estimated capital and rehabilitation
costs (excluding bulk)
New Bulk infrastructure, capital costs and rehabilitation of bulk infrastructure costs Infrastructure Funding Streams and shortfall
2014/15
(R-000 value)
2015/16
(R-000 value)
No. of industrial stands in the municipality to date
Baseline: list number of erven required to eliminate backlogs in terms of new industrial areas
No. of industrial stands planned to serve per annum 1) C'ville Ext 14 (77) 2) Foch Ext 14 (10) + Kokosi Ext 7 (1) + Khutsong South (15) 3) Khutsong South Ext (10)
Actual no. industrial stands served per annum
Estimated new capital costs (R Value) per annum
Specify Bulk infrastructure
Bulk infrastructure capital costs (R Value) per annum
Rehabilitation costs per annum
Own Source per
year R-Value)
MIG allocation per year R-Value)
Other revenue per year R-Value)
Total available funding per year R (Value)
Funding
shortfall per year
R (Value)
Year 1
419 77 77 0
Losberg (8km roads) CV Ext 14 (3,26km Roads)
R37,600 R15,000
6,000,000 37,600
15,000
6,000,000
Year 2 496 77 26
3,840,000 3,840,000
Year 3 522 36 10
Year 4 532 0 0
Year 5 0 0 0
Total 532 113 113
52,600 9,840,000 52,600 9,840,000
Draft IDP Document 2015/2016 Page 51
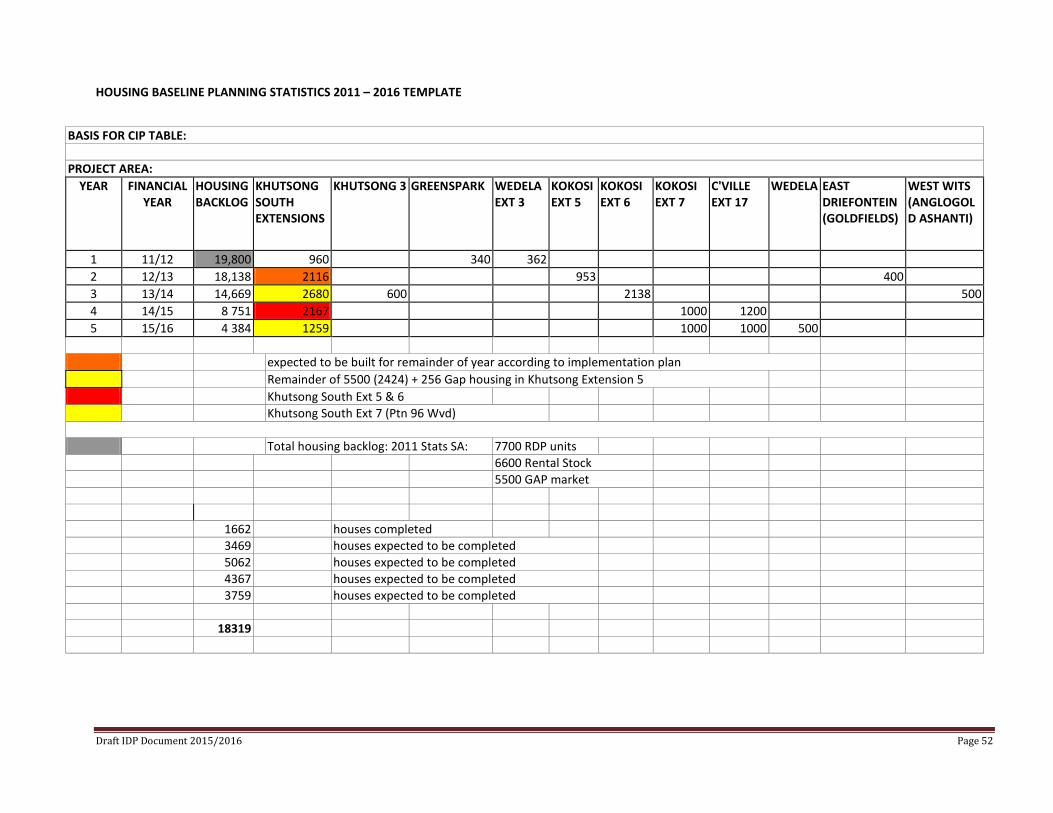
HOUSING BASELINE PLANNING STATISTICS 2011 – 2016 TEMPLATE
BASIS FOR CIP TABLE:
PROJECT AREA: YEAR FINANCIAL
YEAR HOUSING BACKLOG
KHUTSONG SOUTH EXTENSIONS
KHUTSONG 3 GREENSPARK WEDELA EXT 3
KOKOSI EXT 5
KOKOSI EXT 6
KOKOSI EXT 7
C'VILLE EXT 17
WEDELA EAST DRIEFONTEIN (GOLDFIELDS)
WEST WITS (ANGLOGOLD ASHANTI)
1 11/12 19,800 960 340 362 2 12/13 18,138 2116 953 400 3 13/14 14,669 2680 600 2138 500 4 14/15 8 751 2167 1000 1200 5 15/16 4 384 1259 1000 1000 500
expected to be built for remainder of year according to implementation plan Remainder of 5500 (2424) + 256 Gap housing in Khutsong Extension 5 Khutsong South Ext 5 & 6 Khutsong South Ext 7 (Ptn 96 Wvd)
Total housing backlog: 2011 Stats SA: 7700 RDP units 6600 Rental Stock 5500 GAP market 1662 houses completed 3469 houses expected to be completed 5062 houses expected to be completed 4367 houses expected to be completed 3759 houses expected to be completed 18319
Draft IDP Document 2015/2016 Page 52
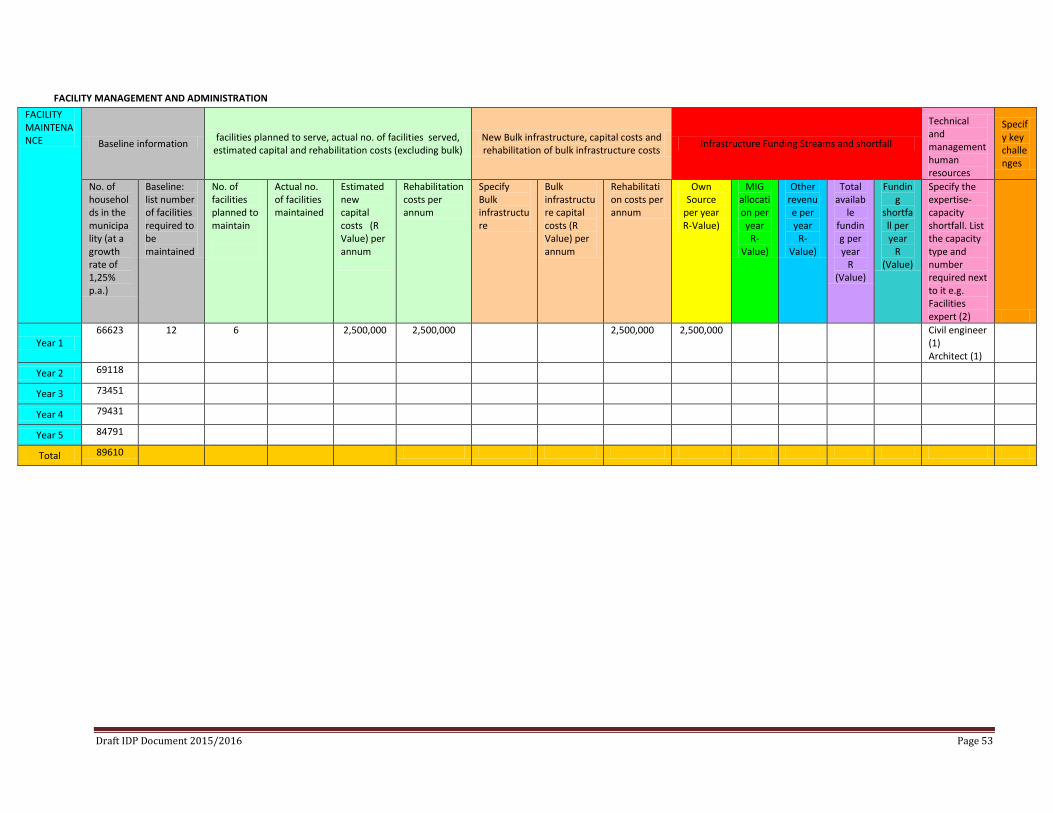
FACILITY MANAGEMENT AND ADMINISTRATION
FACILITY MAINTENANCE Baseline information facilities planned to serve, actual no. of facilities served,
estimated capital and rehabilitation costs (excluding bulk) New Bulk infrastructure, capital costs and rehabilitation of bulk infrastructure costs Infrastructure Funding Streams and shortfall
Technical and management human resources
Specify key challenges
No. of households in the municipality (at a growth rate of 1,25% p.a.)
Baseline: list number of facilities required to be maintained
No. of facilities planned to maintain
Actual no. of facilities maintained
Estimated new capital costs (R Value) per annum
Rehabilitation costs per annum
Specify Bulk infrastructure
Bulk infrastructure capital costs (R Value) per annum
Rehabilitation costs per annum
Own Source
per year R-Value)
MIG allocation per year
R-Value)
Other revenue per year
R-Value)
Total availab
le funding per year
R (Value)
Funding
shortfall per year
R (Value)
Specify the expertise- capacity shortfall. List the capacity type and number required next to it e.g. Facilities expert (2)
Year 1 66623 12 6 2,500,000 2,500,000 2,500,000 2,500,000 Civil engineer
(1) Architect (1)
Year 2 69118
Year 3 73451
Year 4 79431
Year 5 84791
Total 89610
Draft IDP Document 2015/2016 Page 53
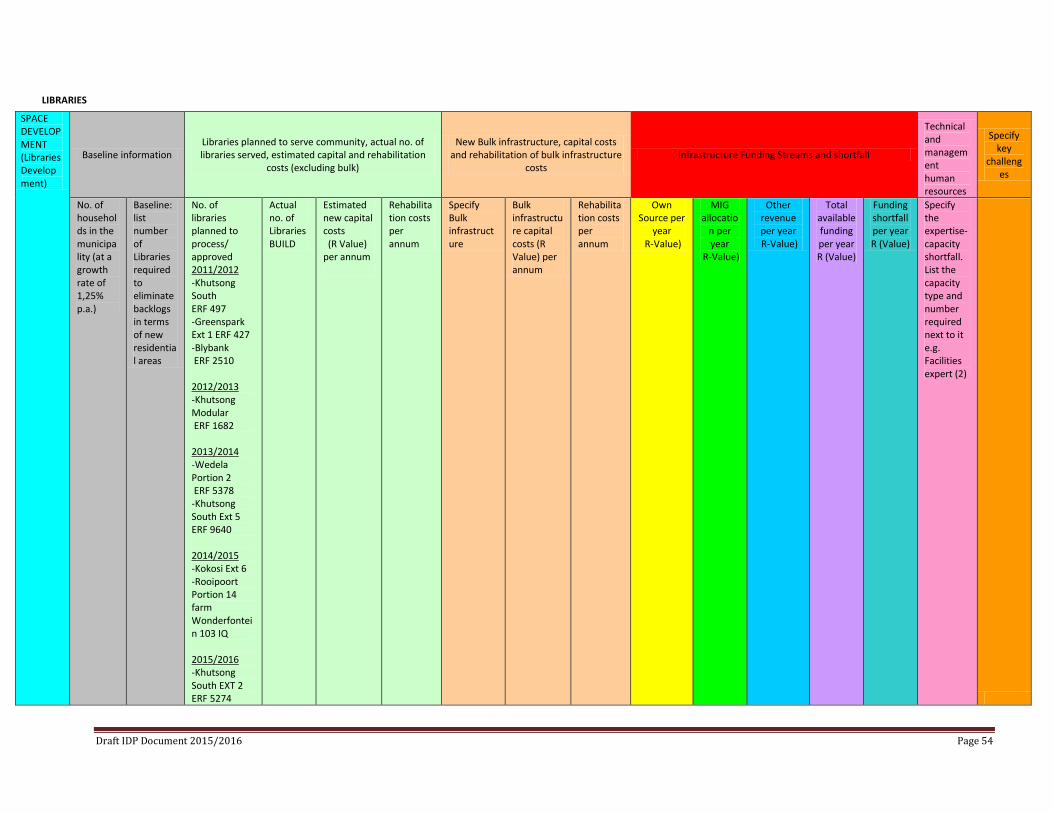
LIBRARIES
SPACE DEVELOPMENT (Libraries Development)
Baseline information Libraries planned to serve community, actual no. of libraries served, estimated capital and rehabilitation
costs (excluding bulk)
New Bulk infrastructure, capital costs and rehabilitation of bulk infrastructure
costs Infrastructure Funding Streams and shortfall
Technical and management human resources
Specify key
challenges
No. of households in the municipality (at a growth rate of 1,25% p.a.)
Baseline: list number of Libraries required to eliminate backlogs in terms of new residential areas
No. of libraries planned to process/ approved 2011/2012 -Khutsong South ERF 497 -Greenspark Ext 1 ERF 427 -Blybank ERF 2510 2012/2013 -Khutsong Modular ERF 1682 2013/2014 -Wedela Portion 2 ERF 5378 -Khutsong South Ext 5 ERF 9640 2014/2015 -Kokosi Ext 6 -Rooipoort Portion 14 farm Wonderfontein 103 IQ 2015/2016 -Khutsong South EXT 2 ERF 5274
Actual no. of Libraries BUILD
Estimated new capital costs (R Value) per annum
Rehabilitation costs per annum
Specify Bulk infrastructure
Bulk infrastructure capital costs (R Value) per annum
Rehabilitation costs per annum
Own Source per
year R-Value)
MIG allocatio
n per year
R-Value)
Other revenue per year R-Value)
Total available funding per year R (Value)
Funding shortfall per year R (Value)
Specify the expertise- capacity shortfall. List the capacity type and number required next to it e.g. Facilities expert (2)
Draft IDP Document 2015/2016 Page 54
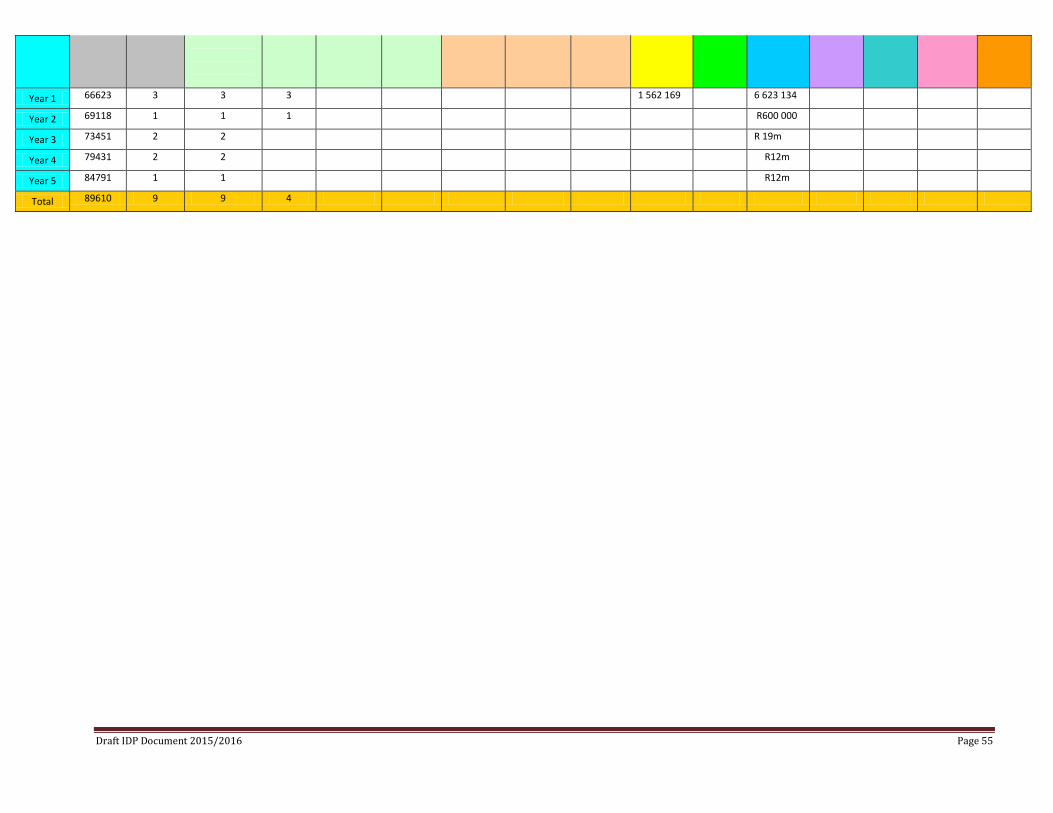
Year 1 66623 3 3 3 1 562 169 6 623 134
Year 2 69118 1 1 1 R600 000
Year 3 73451 2 2 R 19m
Year 4 79431 2 2 R12m
Year 5 84791 1 1 R12m
Total 89610 9 9 4
Draft IDP Document 2015/2016 Page 55
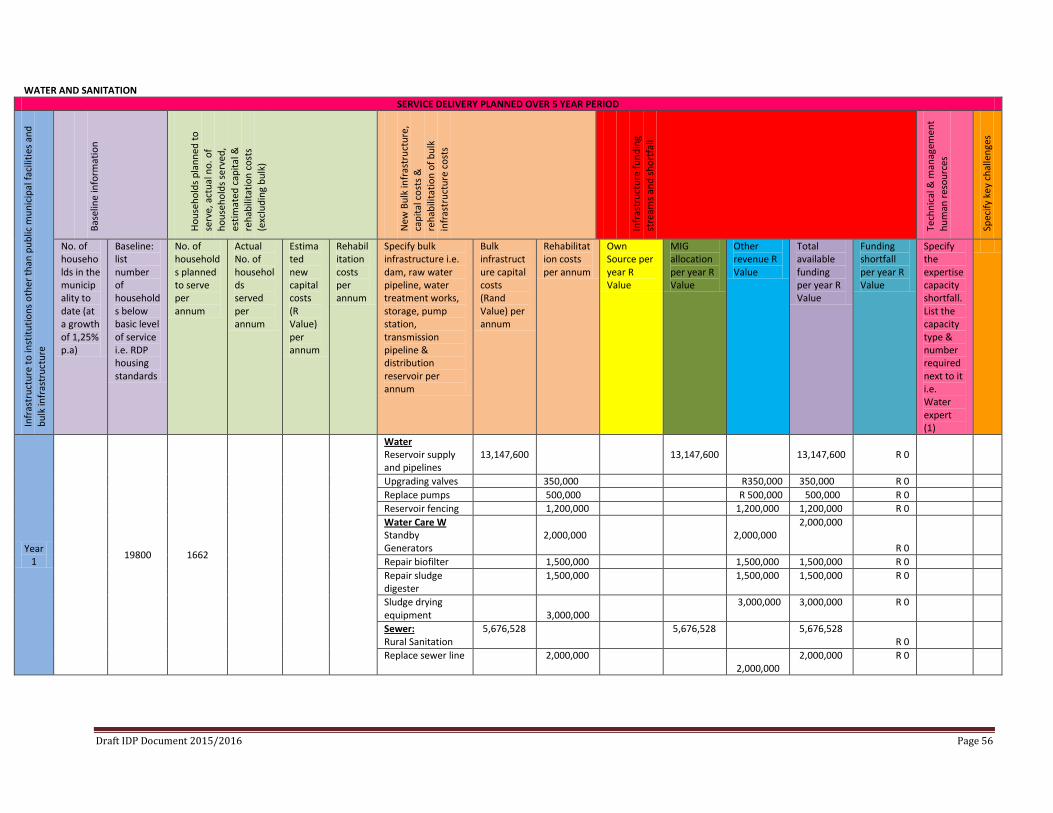
WATER AND SANITATION SERVICE DELIVERY PLANNED OVER 5 YEAR PERIOD
Infr
astr
uctu
re to
inst
itutio
ns o
ther
than
pub
lic m
unic
ipal
faci
litie
s and
bu
lk in
fras
truc
ture
Base
line
info
rmat
ion
Hous
ehol
ds p
lann
ed to
se
rve,
act
ual n
o. o
f ho
useh
olds
serv
ed,
estim
ated
cap
ital &
re
habi
litat
ion
cost
s (e
xclu
ding
bul
k)
New
Bul
k in
fras
truc
ture
, ca
pita
l cos
ts &
re
habi
litat
ion
of b
ulk
infr
astr
uctu
re c
osts
Infr
astr
uctu
re fu
ndin
g
stre
ams a
nd sh
ortfa
ll
Tech
nica
l & m
anag
emen
t hu
man
reso
urce
s
Spec
ify k
ey c
halle
nges
No. of households in the municipality to date (at a growth of 1,25% p.a)
Baseline: list number of households below basic level of service i.e. RDP housing standards
No. of households planned to serve per annum
Actual No. of households served per annum
Estimated new capital costs (R Value) per annum
Rehabilitation costs per annum
Specify bulk infrastructure i.e. dam, raw water pipeline, water treatment works, storage, pump station, transmission pipeline & distribution reservoir per annum
Bulk infrastructure capital costs (Rand Value) per annum
Rehabilitation costs per annum
Own Source per year R Value
MIG allocation per year R Value
Other revenue R Value
Total available funding per year R Value
Funding shortfall per year R Value
Specify the expertise capacity shortfall. List the capacity type & number required next to it i.e. Water expert (1)
Year 1 19800 1662
Water Reservoir supply and pipelines
13,147,600
13,147,600
13,147,600
R 0
Upgrading valves 350,000 R350,000 350,000 R 0 Replace pumps 500,000 R 500,000 500,000 R 0 Reservoir fencing 1,200,000 1,200,000 1,200,000 R 0 Water Care W Standby Generators
2,000,000
2,000,000
2,000,000
R 0
Repair biofilter 1,500,000 1,500,000 1,500,000 R 0 Repair sludge digester
1,500,000 1,500,000 1,500,000 R 0
Sludge drying equipment
3,000,000
3,000,000 3,000,000 R 0
Sewer: Rural Sanitation
5,676,528 5,676,528 5,676,528 R 0
Replace sewer line 2,000,000 2,000,000
2,000,000 R 0
Draft IDP Document 2015/2016 Page 56
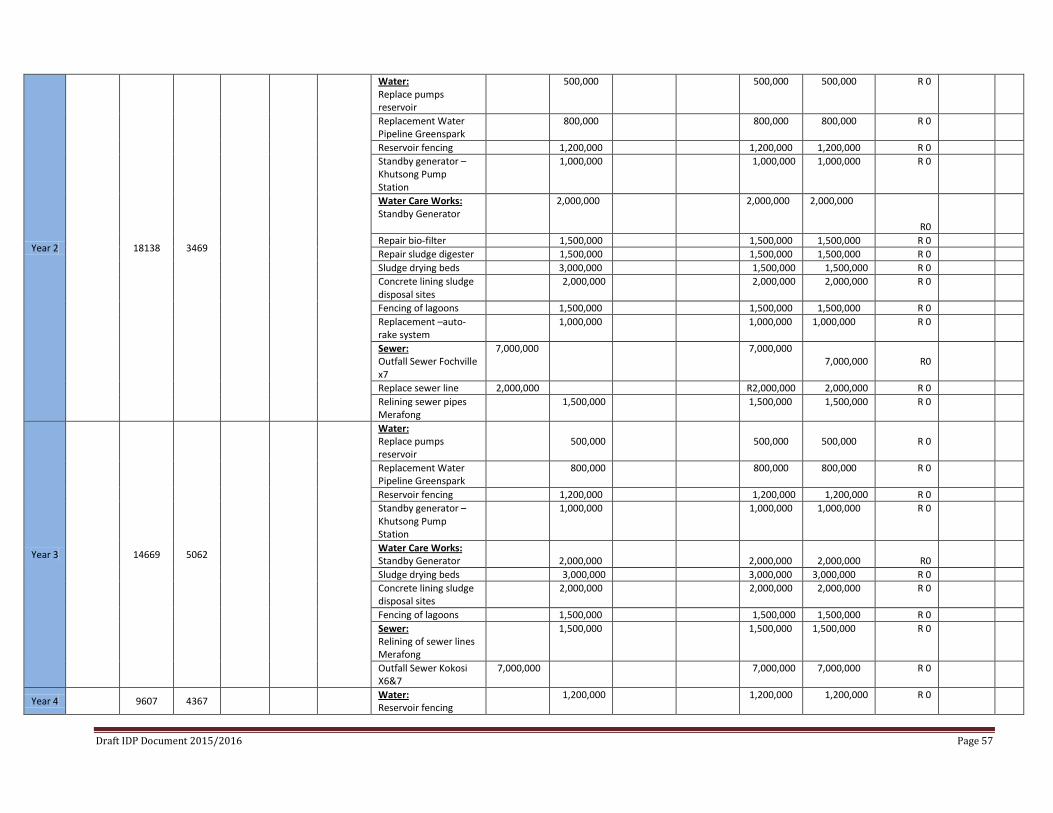
Year 2 18138 3469
Water: Replace pumps reservoir
500,000 500,000 500,000 R 0
Replacement Water Pipeline Greenspark
800,000 800,000 800,000 R 0
Reservoir fencing 1,200,000 1,200,000 1,200,000 R 0 Standby generator – Khutsong Pump Station
1,000,000 1,000,000 1,000,000 R 0
Water Care Works: Standby Generator
2,000,000 2,000,000 2,000,000
R0
Repair bio-filter 1,500,000 1,500,000 1,500,000 R 0 Repair sludge digester 1,500,000 1,500,000 1,500,000 R 0 Sludge drying beds 3,000,000 1,500,000 1,500,000 R 0 Concrete lining sludge disposal sites
2,000,000 2,000,000 2,000,000 R 0
Fencing of lagoons 1,500,000 1,500,000 1,500,000 R 0 Replacement –auto-rake system
1,000,000 1,000,000 1,000,000 R 0
Sewer: Outfall Sewer Fochville x7
7,000,000 7,000,000 7,000,000
R0
Replace sewer line 2,000,000 R2,000,000 2,000,000 R 0 Relining sewer pipes Merafong
1,500,000 1,500,000 1,500,000 R 0
Year 3 14669 5062
Water: Replace pumps reservoir
500,000
500,000
500,000
R 0
Replacement Water Pipeline Greenspark
800,000 800,000 800,000 R 0
Reservoir fencing 1,200,000 1,200,000 1,200,000 R 0 Standby generator – Khutsong Pump Station
1,000,000 1,000,000 1,000,000 R 0
Water Care Works: Standby Generator
2,000,000
2,000,000
2,000,000
R0
Sludge drying beds 3,000,000 3,000,000 3,000,000 R 0 Concrete lining sludge disposal sites
2,000,000 2,000,000 2,000,000 R 0
Fencing of lagoons 1,500,000 1,500,000 1,500,000 R 0 Sewer: Relining of sewer lines Merafong
1,500,000 1,500,000 1,500,000 R 0
Outfall Sewer Kokosi X6&7
7,000,000 7,000,000 7,000,000 R 0
Year 4 9607 4367 Water: Reservoir fencing
1,200,000 1,200,000 1,200,000 R 0
Draft IDP Document 2015/2016 Page 57
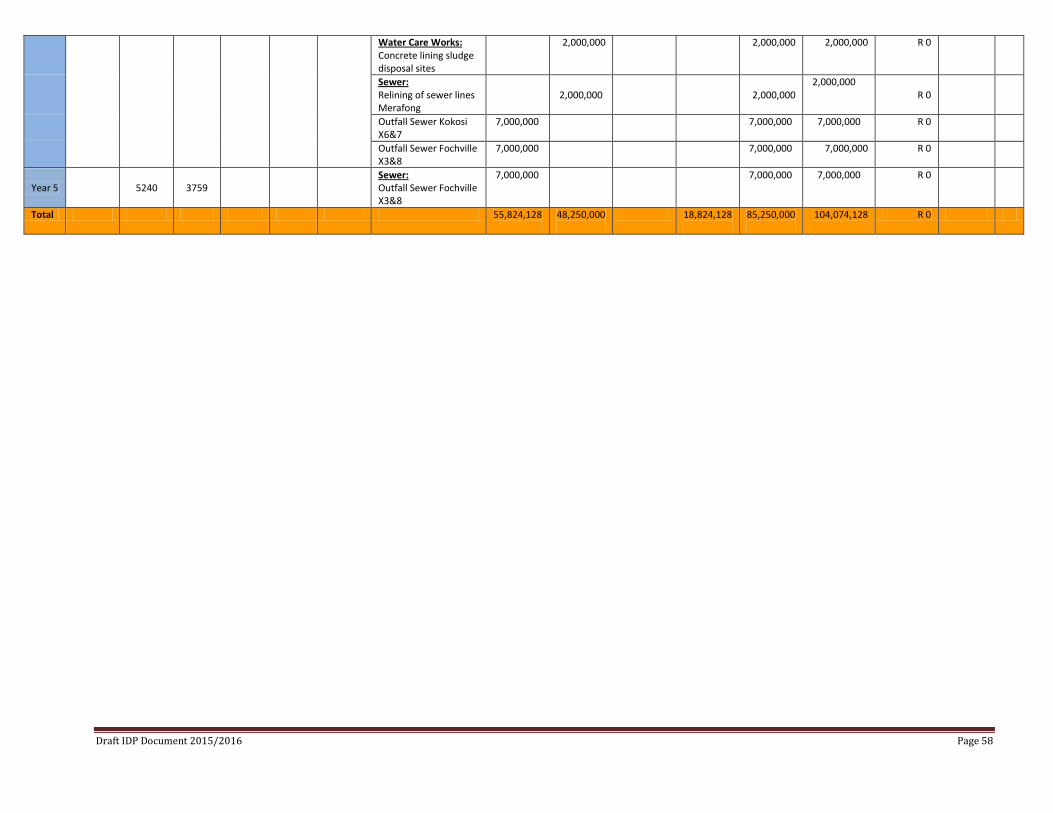
Water Care Works: Concrete lining sludge disposal sites
2,000,000 2,000,000 2,000,000 R 0
Sewer: Relining of sewer lines Merafong
2,000,000
2,000,000
2,000,000 R 0
Outfall Sewer Kokosi X6&7
7,000,000 7,000,000 7,000,000 R 0
Outfall Sewer Fochville X3&8
7,000,000 7,000,000 7,000,000 R 0
Year 5 5240 3759 Sewer: Outfall Sewer Fochville X3&8
7,000,000 7,000,000 7,000,000 R 0
Total 55,824,128
48,250,000
18,824,128
85,250,000
104,074,128
R 0
Draft IDP Document 2015/2016 Page 58
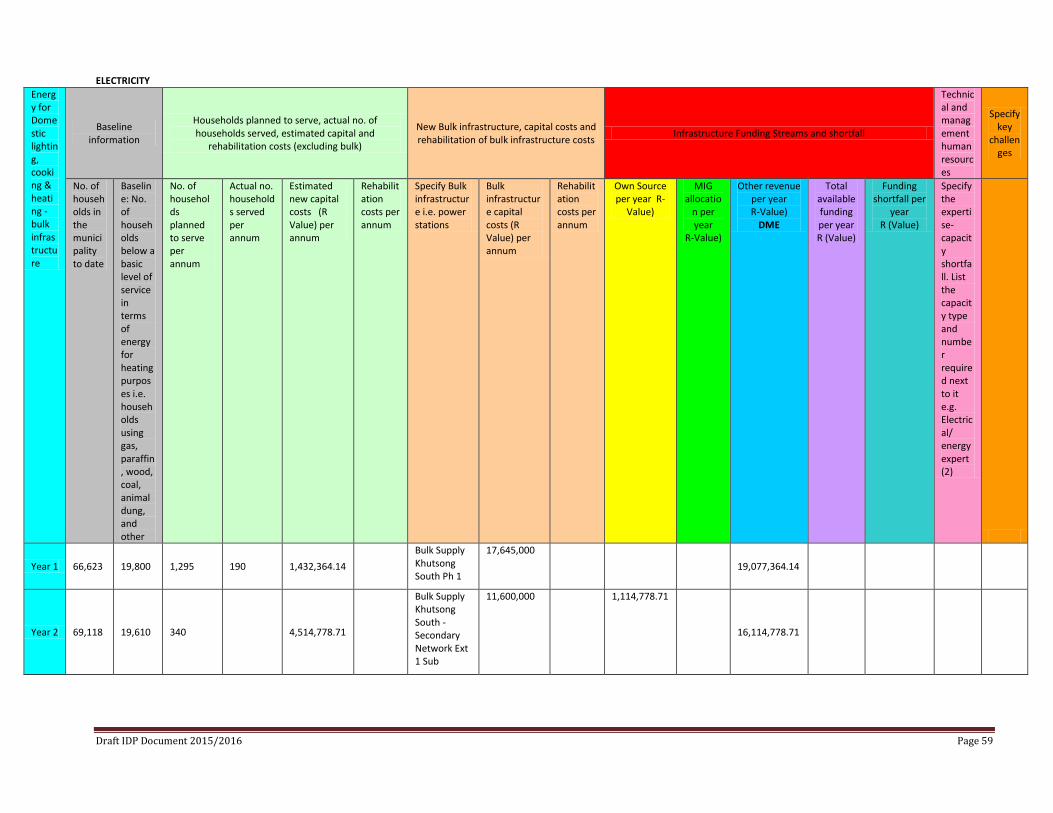
ELECTRICITY
Energy for Domestic lighting, cooking & heating - bulk infrastructure
Baseline information
Households planned to serve, actual no. of households served, estimated capital and
rehabilitation costs (excluding bulk)
New Bulk infrastructure, capital costs and rehabilitation of bulk infrastructure costs Infrastructure Funding Streams and shortfall
Technical and management human resources
Specify key
challenges
No. of households in the municipality to date
Baseline: No. of households below a basic level of service in terms of energy for heating purposes i.e. households using gas, paraffin, wood, coal, animal dung, and other
No. of households planned to serve per annum
Actual no. households served per annum
Estimated new capital costs (R Value) per annum
Rehabilitation costs per annum
Specify Bulk infrastructure i.e. power stations
Bulk infrastructure capital costs (R Value) per annum
Rehabilitation costs per annum
Own Source per year R-
Value)
MIG allocatio
n per year
R-Value)
Other revenue per year R-Value)
DME
Total available funding per year R (Value)
Funding shortfall per
year R (Value)
Specify the expertise- capacity shortfall. List the capacity type and number required next to it e.g. Electrical/ energy expert (2)
Year 1 66,623 19,800 1,295 190 1,432,364.14 Bulk Supply Khutsong South Ph 1
17,645,000 19,077,364.14
Year 2 69,118 19,610 340 4,514,778.71
Bulk Supply Khutsong South - Secondary Network Ext 1 Sub
11,600,000 1,114,778.71
16,114,778.71
Draft IDP Document 2015/2016 Page 59
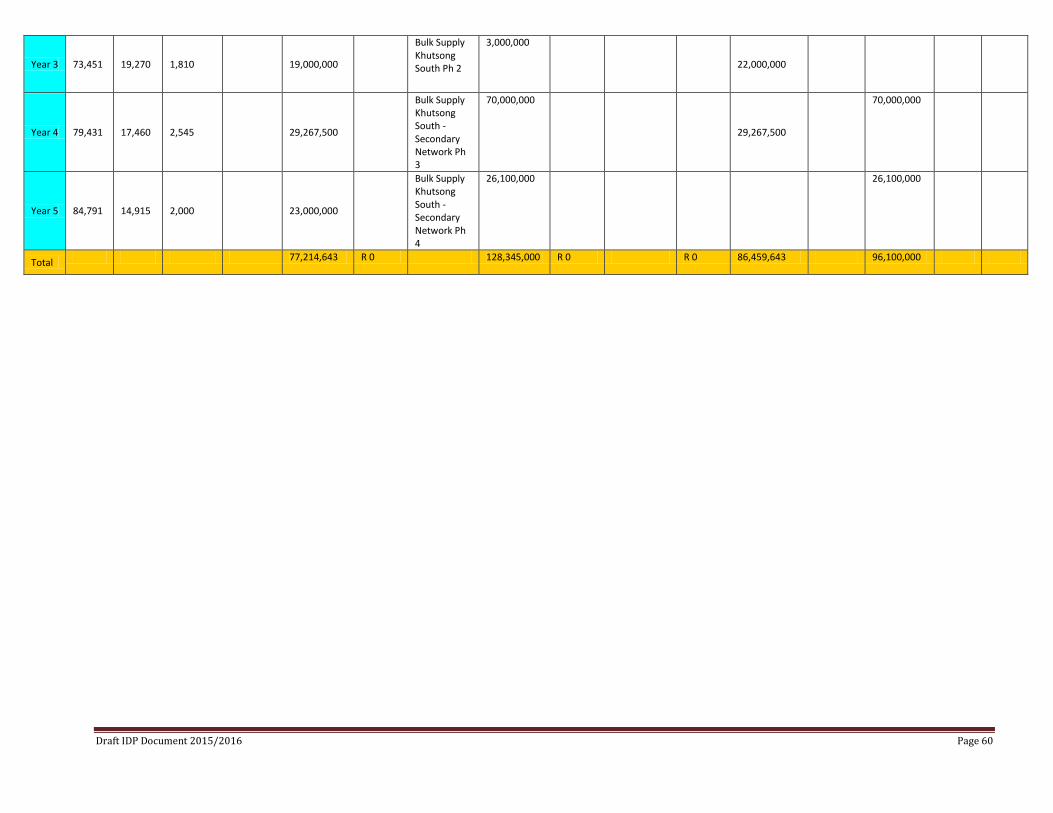
Year 3 73,451 19,270 1,810 19,000,000
Bulk Supply Khutsong South Ph 2
3,000,000
22,000,000
Year 4 79,431 17,460 2,545 29,267,500
Bulk Supply Khutsong South - Secondary Network Ph 3
70,000,000
29,267,500
70,000,000
Year 5 84,791 14,915 2,000 23,000,000
Bulk Supply Khutsong South - Secondary Network Ph 4
26,100,000 26,100,000
Total 77,214,643 R 0 128,345,000 R 0 R 0 86,459,643 96,100,000
Draft IDP Document 2015/2016 Page 60
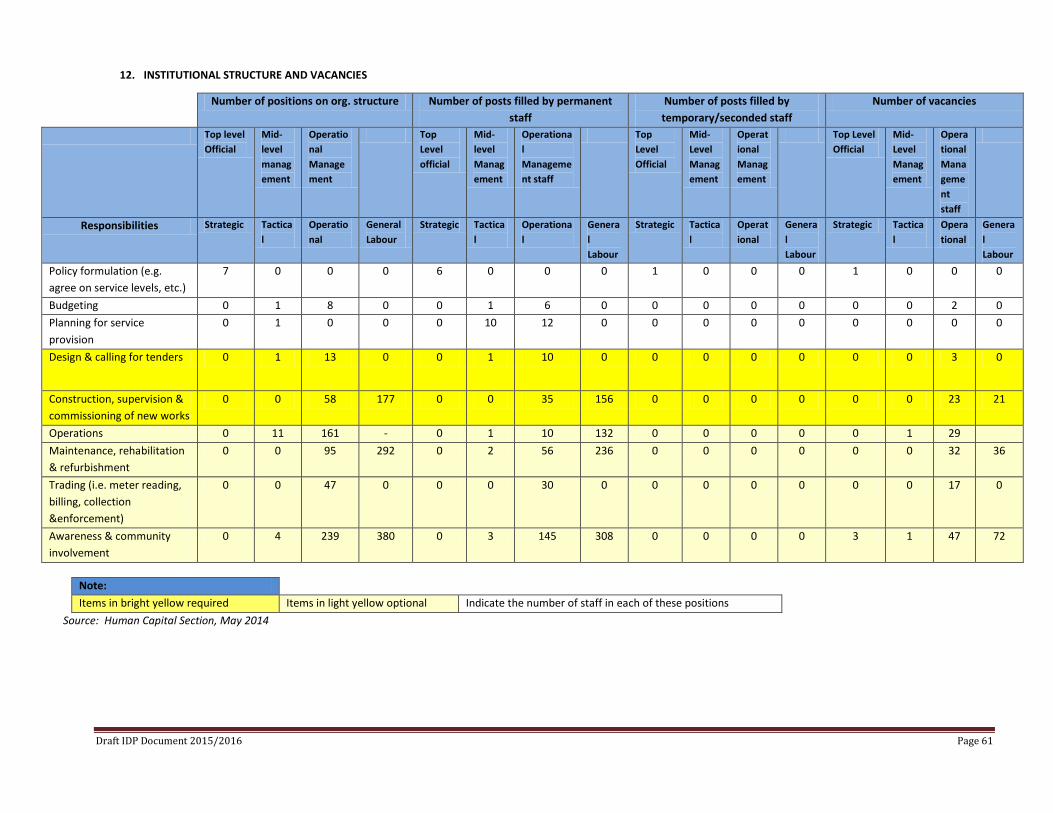
12. INSTITUTIONAL STRUCTURE AND VACANCIES
Number of positions on org. structure Number of posts filled by permanent staff
Number of posts filled by temporary/seconded staff
Number of vacancies
Top level Official
Mid-level management
Operational Management
Top Level official
Mid-level Management
Operational Management staff
Top Level Official
Mid-Level Management
Operational Management
Top Level Official
Mid-Level Management
Operational Management staff
Responsibilities Strategic Tactical
Operational
General Labour
Strategic Tactical
Operational
General Labour
Strategic Tactical
Operational
General Labour
Strategic Tactical
Operational
General Labour
Policy formulation (e.g. agree on service levels, etc.)
7 0 0 0 6 0 0 0 1 0 0 0 1 0 0 0
Budgeting 0 1 8 0 0 1 6 0 0 0 0 0 0 0 2 0 Planning for service provision
0 1 0 0 0 10 12 0 0 0 0 0 0 0 0 0
Design & calling for tenders 0 1 13 0 0 1 10 0 0 0 0 0 0 0 3 0
Construction, supervision & commissioning of new works
0 0 58 177 0 0 35 156 0 0 0 0 0 0 23 21
Operations 0 11 161 - 0 1 10 132 0 0 0 0 0 1 29 Maintenance, rehabilitation & refurbishment
0 0 95 292 0 2 56 236 0 0 0 0 0 0 32 36
Trading (i.e. meter reading, billing, collection &enforcement)
0 0 47 0 0 0 30 0 0 0 0 0 0 0 17 0
Awareness & community involvement
0 4 239 380 0 3 145 308 0 0 0 0 3 1 47 72
Note: Items in bright yellow required Items in light yellow optional Indicate the number of staff in each of these positions
Source: Human Capital Section, May 2014
Draft IDP Document 2015/2016 Page 61
13. FINANCIAL PERFORMANCE OVERVIEW
Operating Surplus and Bank, Cash And Overdraft Balances Council is a going concern and is professionally managing and has achieved a major financial turnaround. During the 2010/2011 financial year council budgeted for a deficit of R72 Million but closed off with a surplus of R7 Million. This was achieved through strong cost cutting exercises and strict credit control and debt collection processes. Councils Cash and cash equivalents had improved from R245 Million in 2009/2010 to R278 Million in 2010/2011. Council’s liquidity ratio has increased constantly over the past years with a slight decrease in the 2010/11 financial year. The reason for the decrease is that council’s fleet contract expires at the end of October 2011. Salaries and Allowances as a percentage of the total expenditure have improved from 25.65% to 25.16% which is far below the norm of 35%. Payment Levels Council’s average payment levels for the past six months were 85.58%. Council budgeted for a payment level of 89% for the financial year. There was an improvement from the average payment levels of the past six months as the payment level for January 2012 was 92%. The biggest concern is the non - payment by Blyvooruitzicht mine on a portion of their water account. This matter was referred to the High Court. The High Court had found in favour off Council but Blyvooruitzicht had appealed against the judgment. Council awaits a date for the case to be heard in the Appeal Court. The non-payment of the account by Blyvooruitzicht will result in that council will face cash flow difficulties in the last six months of the financial year if preventative measures are not implemented. The department had commenced with an outreach program to promote the payment of services. Council had commenced with serious credit control actions in all areas of Merafong. This was communicated to the community and ward committees during the outreach program. Monthly meetings are conducted with all ward committees by the Portfolio head of Finance to inform them off council’s resolutions with regard to financial matters. A revenue enhancement strategy was approved and the roll out plan has commenced. This will have serious ramifications for defaulters of consumer accounts who have not registered as an indigent. A no tolerance approach in terms of council’s credit control policy will be enforced. The pay points are addressed and the demarcation issue is no longer acceptable. Financial Ratios The Councils cash and cash equivalents held at financial year end were as follows over the last three years:
2009/10 2010/11 2011/12 Cash and Cash Equivalents 245 490 000 278 937 257 305 164 499 Current Ratio 1:1.06 1:1.04 1:1 Current ratio measures the ability of the Municipality to pay its current liabilities out of the current assets. The industry usually looks for a ratio of 2:1, however the acceptable current ratio is1:1 for municipalities. The current ratio is 1:1 which means that the Municipality will be able to meet its short term obligation if the trend continues. Acid Test Ratio 1:1.04 1:0.9887 1:1 Outstanding debtors to Revenue This ratio gives an indication of how liquid customer’s debtors are. The benchmark is 8.3%. The benchmark is exceeded. The municipality needs to look at ways of improving their credit control. The average for the Gauteng Municipalities for the past two years was 37,7% and 24,2% respectively. Outstanding Debtors to Revenue
2009/2010 2010/2011 2011/2012 28.7% 27% 37.7%
Draft IDP Document 2015/2016 Page 62
Creditors System Efficiency The ratio gives an indication of average creditor’s payment period. The benchmark is 30 Days and is a contravention of Section 65(2) (e) if creditors are not paid in 30 days.
2009/2010 2010/2011 2011/2012 30 days 30 days 30 days
Employee costs The ratio indicates a percentage of salary costs to total expenditure and this ratio could illustrate the risk of salary costs being unmanageable.
2009/2010 2010/2011 2011/2012 30.2% 25.65% 25.16% Cost coverage This ratio indicates the availability of cash plus short term investments to cover the monthly fixed operating expenditure. Governance Council received for the second year in a row an unqualified audit opinion. There was once again a major improvement from the previous financial year. Council had implemented an operation clean audit strategy and plan during the year and are strongly striving for a clean audit by 2014, as per the instruction from Government. Council viability remains a concern to council.
Draft IDP Document 2015/2016 Page 63
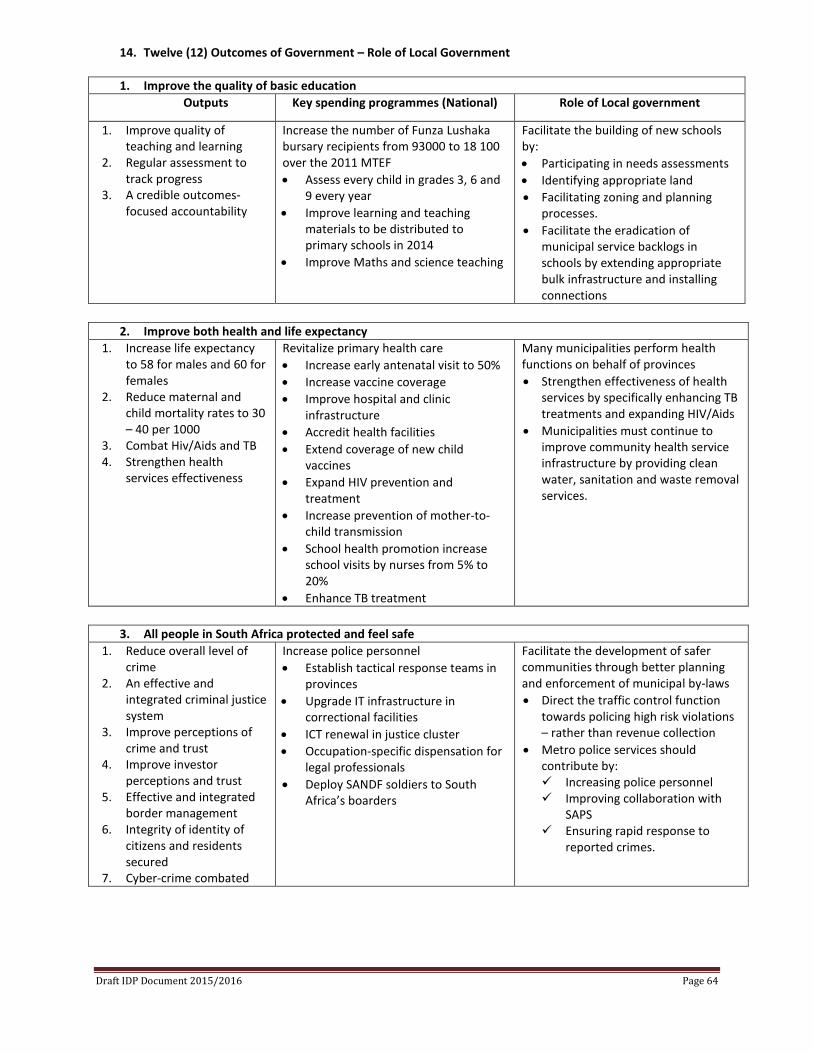
14. Twelve (12) Outcomes of Government – Role of Local Government
1. Improve the quality of basic education Outputs Key spending programmes (National) Role of Local government
1. Improve quality of teaching and learning
2. Regular assessment to track progress
3. A credible outcomes-focused accountability
Increase the number of Funza Lushaka bursary recipients from 93000 to 18 100 over the 2011 MTEF • Assess every child in grades 3, 6 and
9 every year • Improve learning and teaching
materials to be distributed to primary schools in 2014
• Improve Maths and science teaching
Facilitate the building of new schools by: • Participating in needs assessments • Identifying appropriate land • Facilitating zoning and planning
processes. • Facilitate the eradication of
municipal service backlogs in schools by extending appropriate bulk infrastructure and installing connections
2. Improve both health and life expectancy
1. Increase life expectancy to 58 for males and 60 for females
2. Reduce maternal and child mortality rates to 30 – 40 per 1000
3. Combat Hiv/Aids and TB 4. Strengthen health
services effectiveness
Revitalize primary health care • Increase early antenatal visit to 50% • Increase vaccine coverage • Improve hospital and clinic
infrastructure • Accredit health facilities • Extend coverage of new child
vaccines • Expand HIV prevention and
treatment • Increase prevention of mother-to-
child transmission • School health promotion increase
school visits by nurses from 5% to 20%
• Enhance TB treatment
Many municipalities perform health functions on behalf of provinces • Strengthen effectiveness of health
services by specifically enhancing TB treatments and expanding HIV/Aids
• Municipalities must continue to improve community health service infrastructure by providing clean water, sanitation and waste removal services.
3. All people in South Africa protected and feel safe
1. Reduce overall level of crime
2. An effective and integrated criminal justice system
3. Improve perceptions of crime and trust
4. Improve investor perceptions and trust
5. Effective and integrated border management
6. Integrity of identity of citizens and residents secured
7. Cyber-crime combated
Increase police personnel • Establish tactical response teams in
provinces • Upgrade IT infrastructure in
correctional facilities • ICT renewal in justice cluster • Occupation-specific dispensation for
legal professionals • Deploy SANDF soldiers to South
Africa’s boarders
Facilitate the development of safer communities through better planning and enforcement of municipal by-laws • Direct the traffic control function
towards policing high risk violations – rather than revenue collection
• Metro police services should contribute by: Increasing police personnel Improving collaboration with
SAPS Ensuring rapid response to
reported crimes.
Draft IDP Document 2015/2016 Page 64
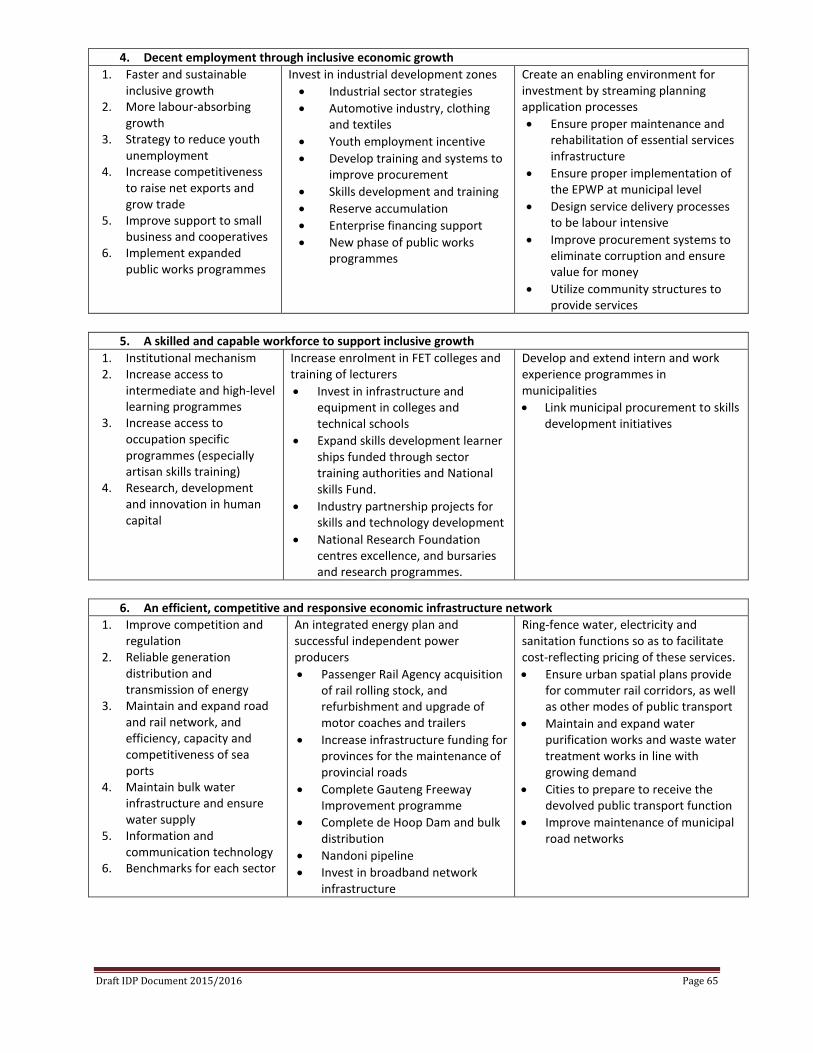
4. Decent employment through inclusive economic growth 1. Faster and sustainable
inclusive growth 2. More labour-absorbing
growth 3. Strategy to reduce youth
unemployment 4. Increase competitiveness
to raise net exports and grow trade
5. Improve support to small business and cooperatives
6. Implement expanded public works programmes
Invest in industrial development zones • Industrial sector strategies • Automotive industry, clothing
and textiles • Youth employment incentive • Develop training and systems to
improve procurement • Skills development and training • Reserve accumulation • Enterprise financing support • New phase of public works
programmes
Create an enabling environment for investment by streaming planning application processes • Ensure proper maintenance and
rehabilitation of essential services infrastructure
• Ensure proper implementation of the EPWP at municipal level
• Design service delivery processes to be labour intensive
• Improve procurement systems to eliminate corruption and ensure value for money
• Utilize community structures to provide services
5. A skilled and capable workforce to support inclusive growth
1. Institutional mechanism 2. Increase access to
intermediate and high-level learning programmes
3. Increase access to occupation specific programmes (especially artisan skills training)
4. Research, development and innovation in human capital
Increase enrolment in FET colleges and training of lecturers • Invest in infrastructure and
equipment in colleges and technical schools
• Expand skills development learner ships funded through sector training authorities and National skills Fund.
• Industry partnership projects for skills and technology development
• National Research Foundation centres excellence, and bursaries and research programmes.
Develop and extend intern and work experience programmes in municipalities • Link municipal procurement to skills
development initiatives
6. An efficient, competitive and responsive economic infrastructure network
1. Improve competition and regulation
2. Reliable generation distribution and transmission of energy
3. Maintain and expand road and rail network, and efficiency, capacity and competitiveness of sea ports
4. Maintain bulk water infrastructure and ensure water supply
5. Information and communication technology
6. Benchmarks for each sector
An integrated energy plan and successful independent power producers • Passenger Rail Agency acquisition
of rail rolling stock, and refurbishment and upgrade of motor coaches and trailers
• Increase infrastructure funding for provinces for the maintenance of provincial roads
• Complete Gauteng Freeway Improvement programme
• Complete de Hoop Dam and bulk distribution
• Nandoni pipeline • Invest in broadband network
infrastructure
Ring-fence water, electricity and sanitation functions so as to facilitate cost-reflecting pricing of these services. • Ensure urban spatial plans provide
for commuter rail corridors, as well as other modes of public transport
• Maintain and expand water purification works and waste water treatment works in line with growing demand
• Cities to prepare to receive the devolved public transport function
• Improve maintenance of municipal road networks
Draft IDP Document 2015/2016 Page 65
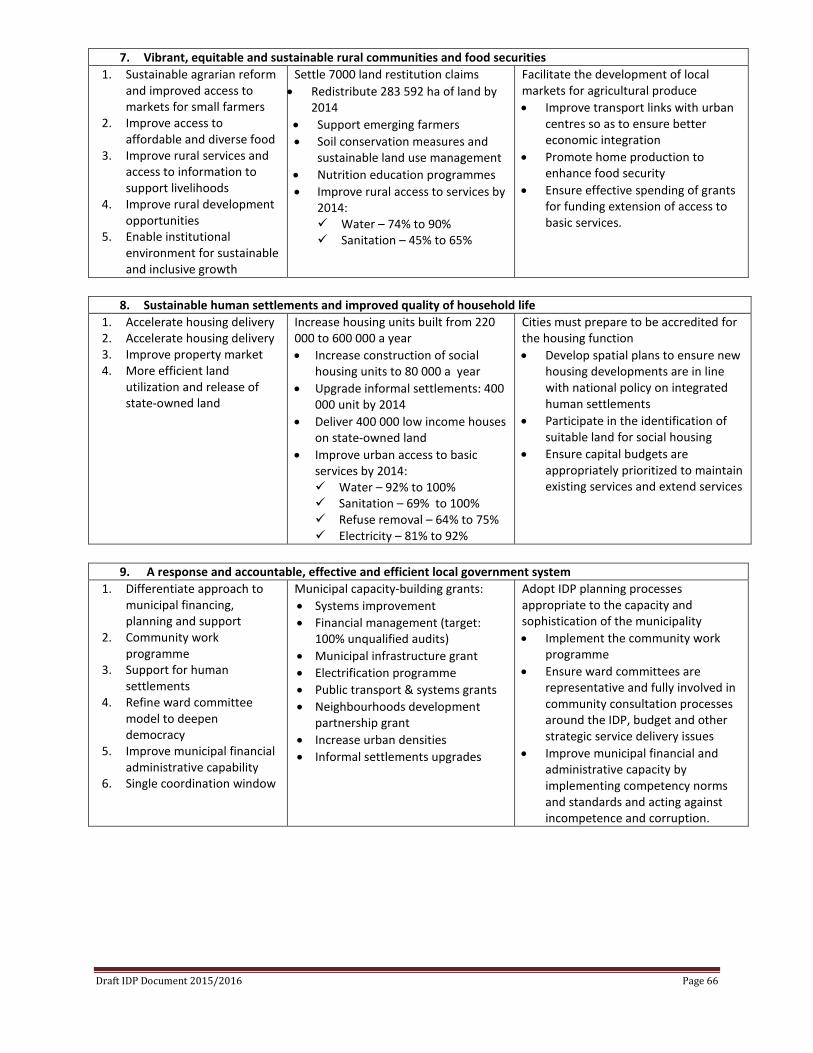
7. Vibrant, equitable and sustainable rural communities and food securities 1. Sustainable agrarian reform
and improved access to markets for small farmers
2. Improve access to affordable and diverse food
3. Improve rural services and access to information to support livelihoods
4. Improve rural development opportunities
5. Enable institutional environment for sustainable and inclusive growth
Settle 7000 land restitution claims • Redistribute 283 592 ha of land by
2014 • Support emerging farmers • Soil conservation measures and
sustainable land use management • Nutrition education programmes • Improve rural access to services by
2014: Water – 74% to 90% Sanitation – 45% to 65%
Facilitate the development of local markets for agricultural produce • Improve transport links with urban
centres so as to ensure better economic integration
• Promote home production to enhance food security
• Ensure effective spending of grants for funding extension of access to basic services.
8. Sustainable human settlements and improved quality of household life
1. Accelerate housing delivery 2. Accelerate housing delivery 3. Improve property market 4. More efficient land
utilization and release of state-owned land
Increase housing units built from 220 000 to 600 000 a year • Increase construction of social
housing units to 80 000 a year • Upgrade informal settlements: 400
000 unit by 2014 • Deliver 400 000 low income houses
on state-owned land • Improve urban access to basic
services by 2014: Water – 92% to 100% Sanitation – 69% to 100% Refuse removal – 64% to 75% Electricity – 81% to 92%
Cities must prepare to be accredited for the housing function • Develop spatial plans to ensure new
housing developments are in line with national policy on integrated human settlements
• Participate in the identification of suitable land for social housing
• Ensure capital budgets are appropriately prioritized to maintain existing services and extend services
9. A response and accountable, effective and efficient local government system
1. Differentiate approach to municipal financing, planning and support
2. Community work programme
3. Support for human settlements
4. Refine ward committee model to deepen democracy
5. Improve municipal financial administrative capability
6. Single coordination window
Municipal capacity-building grants: • Systems improvement • Financial management (target:
100% unqualified audits) • Municipal infrastructure grant • Electrification programme • Public transport & systems grants • Neighbourhoods development
partnership grant • Increase urban densities • Informal settlements upgrades
Adopt IDP planning processes appropriate to the capacity and sophistication of the municipality • Implement the community work
programme • Ensure ward committees are
representative and fully involved in community consultation processes around the IDP, budget and other strategic service delivery issues
• Improve municipal financial and administrative capacity by implementing competency norms and standards and acting against incompetence and corruption.
Draft IDP Document 2015/2016 Page 66
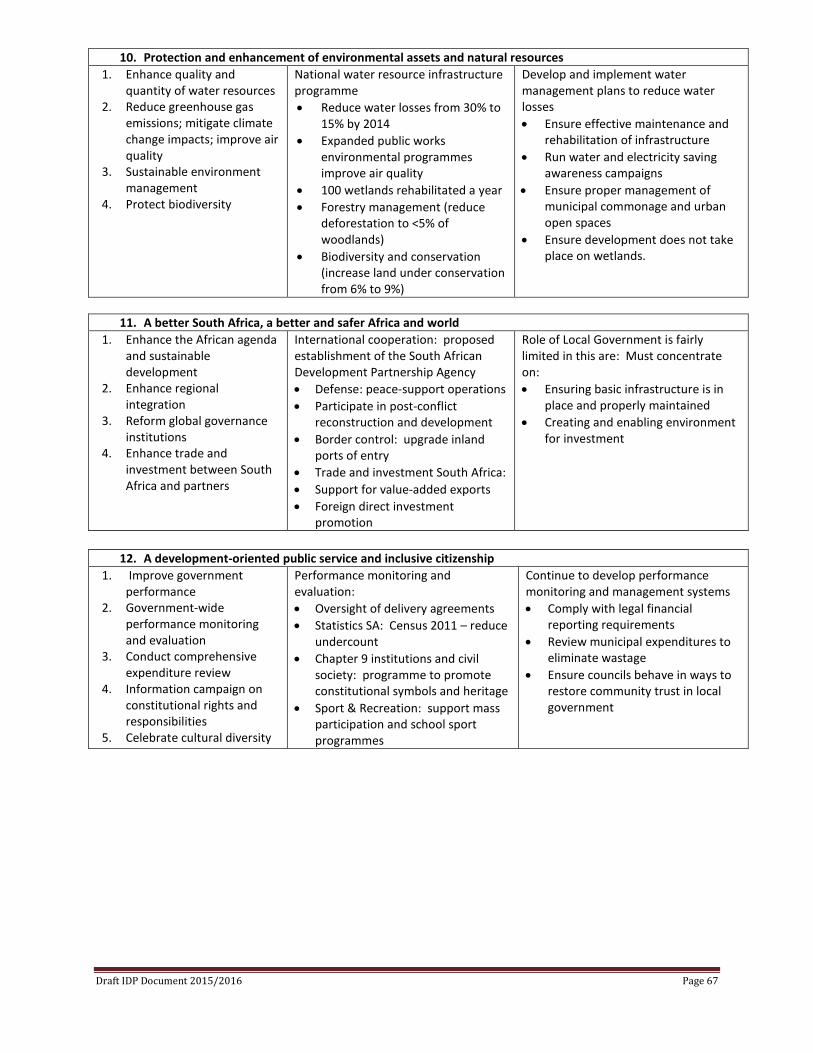
10. Protection and enhancement of environmental assets and natural resources 1. Enhance quality and
quantity of water resources 2. Reduce greenhouse gas
emissions; mitigate climate change impacts; improve air quality
3. Sustainable environment management
4. Protect biodiversity
National water resource infrastructure programme • Reduce water losses from 30% to
15% by 2014 • Expanded public works
environmental programmes improve air quality
• 100 wetlands rehabilitated a year • Forestry management (reduce
deforestation to <5% of woodlands)
• Biodiversity and conservation (increase land under conservation from 6% to 9%)
Develop and implement water management plans to reduce water losses • Ensure effective maintenance and
rehabilitation of infrastructure • Run water and electricity saving
awareness campaigns • Ensure proper management of
municipal commonage and urban open spaces
• Ensure development does not take place on wetlands.
11. A better South Africa, a better and safer Africa and world
1. Enhance the African agenda and sustainable development
2. Enhance regional integration
3. Reform global governance institutions
4. Enhance trade and investment between South Africa and partners
International cooperation: proposed establishment of the South African Development Partnership Agency • Defense: peace-support operations • Participate in post-conflict
reconstruction and development • Border control: upgrade inland
ports of entry • Trade and investment South Africa: • Support for value-added exports • Foreign direct investment
promotion
Role of Local Government is fairly limited in this are: Must concentrate on: • Ensuring basic infrastructure is in
place and properly maintained • Creating and enabling environment
for investment
12. A development-oriented public service and inclusive citizenship
1. Improve government performance
2. Government-wide performance monitoring and evaluation
3. Conduct comprehensive expenditure review
4. Information campaign on constitutional rights and responsibilities
5. Celebrate cultural diversity
Performance monitoring and evaluation: • Oversight of delivery agreements • Statistics SA: Census 2011 – reduce
undercount • Chapter 9 institutions and civil
society: programme to promote constitutional symbols and heritage
• Sport & Recreation: support mass participation and school sport programmes
Continue to develop performance monitoring and management systems • Comply with legal financial
reporting requirements • Review municipal expenditures to
eliminate wastage • Ensure councils behave in ways to
restore community trust in local government
Draft IDP Document 2015/2016 Page 67
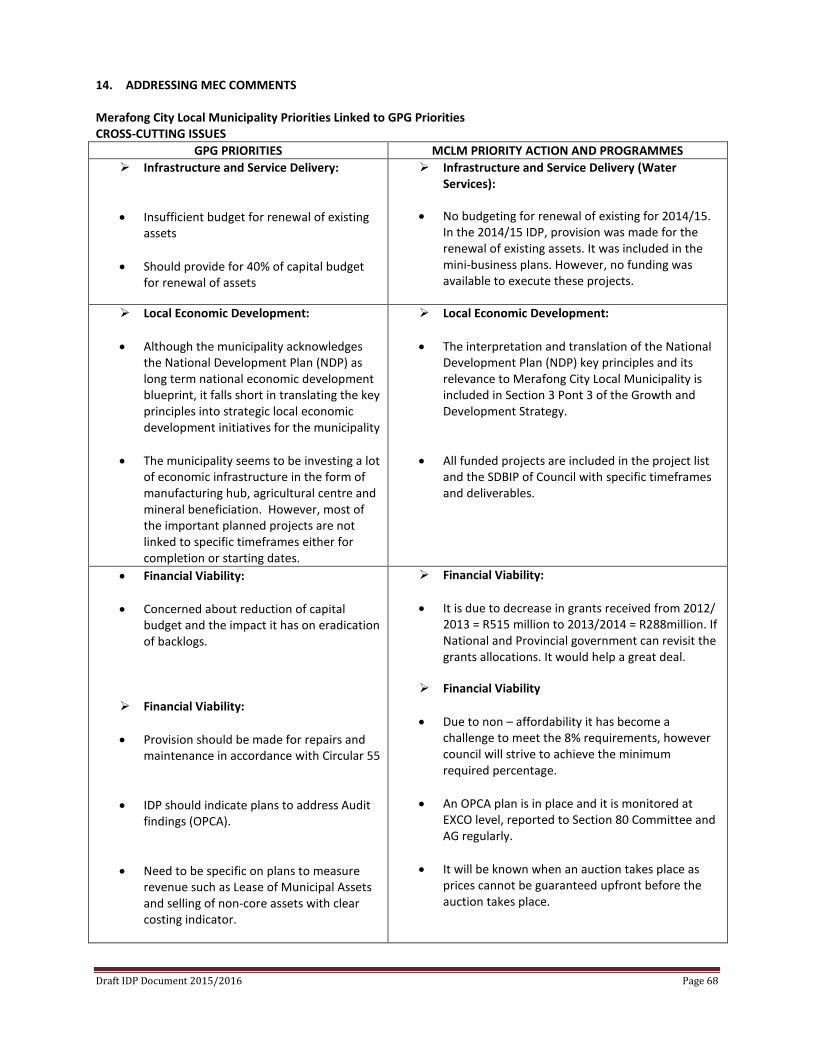
14. ADDRESSING MEC COMMENTS Merafong City Local Municipality Priorities Linked to GPG Priorities CROSS-CUTTING ISSUES
GPG PRIORITIES MCLM PRIORITY ACTION AND PROGRAMMES Infrastructure and Service Delivery:
• Insufficient budget for renewal of existing assets
• Should provide for 40% of capital budget for renewal of assets
Infrastructure and Service Delivery (Water Services):
• No budgeting for renewal of existing for 2014/15.
In the 2014/15 IDP, provision was made for the renewal of existing assets. It was included in the mini-business plans. However, no funding was available to execute these projects.
Local Economic Development:
• Although the municipality acknowledges
the National Development Plan (NDP) as long term national economic development blueprint, it falls short in translating the key principles into strategic local economic development initiatives for the municipality
• The municipality seems to be investing a lot
of economic infrastructure in the form of manufacturing hub, agricultural centre and mineral beneficiation. However, most of the important planned projects are not linked to specific timeframes either for completion or starting dates.
Local Economic Development:
• The interpretation and translation of the National Development Plan (NDP) key principles and its relevance to Merafong City Local Municipality is included in Section 3 Pont 3 of the Growth and Development Strategy.
• All funded projects are included in the project list and the SDBIP of Council with specific timeframes and deliverables.
• Financial Viability: • Concerned about reduction of capital
budget and the impact it has on eradication of backlogs.
Financial Viability:
• Provision should be made for repairs and maintenance in accordance with Circular 55
• IDP should indicate plans to address Audit findings (OPCA).
• Need to be specific on plans to measure revenue such as Lease of Municipal Assets and selling of non-core assets with clear costing indicator.
Financial Viability:
• It is due to decrease in grants received from 2012/ 2013 = R515 million to 2013/2014 = R288million. If National and Provincial government can revisit the grants allocations. It would help a great deal.
Financial Viability
• Due to non – affordability it has become a
challenge to meet the 8% requirements, however council will strive to achieve the minimum required percentage.
• An OPCA plan is in place and it is monitored at
EXCO level, reported to Section 80 Committee and AG regularly.
• It will be known when an auction takes place as prices cannot be guaranteed upfront before the auction takes place.
Draft IDP Document 2015/2016 Page 68
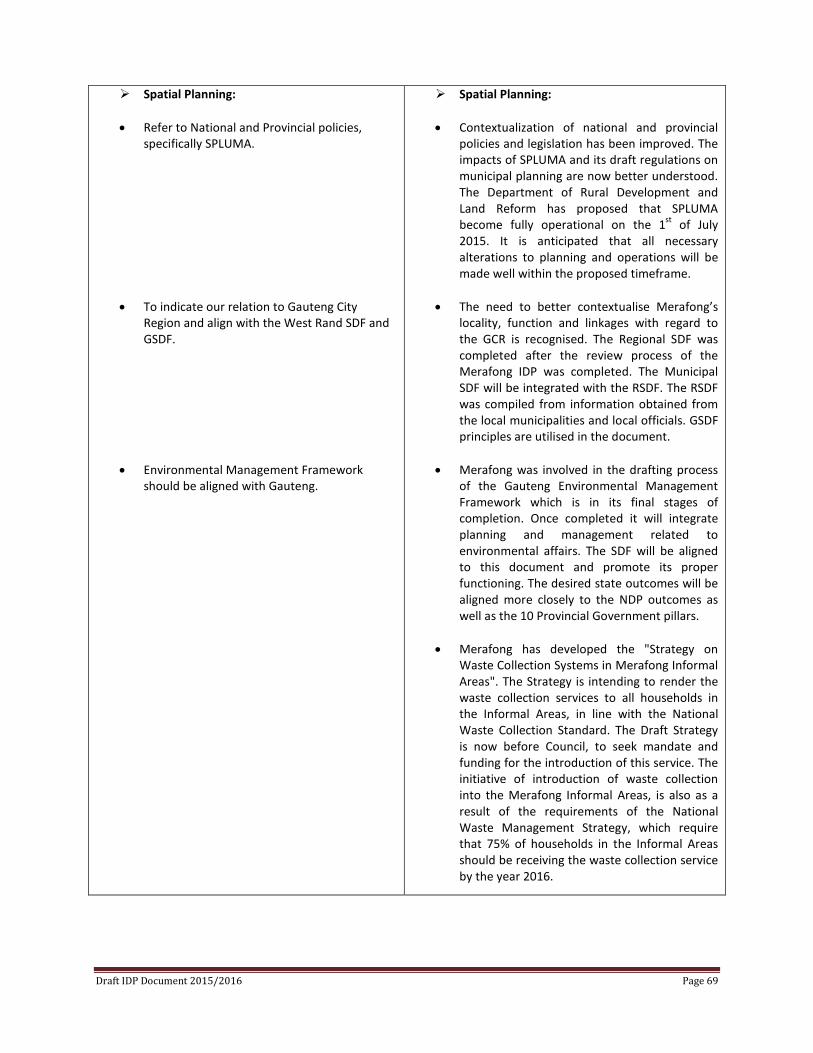
Spatial Planning:
• Refer to National and Provincial policies, specifically SPLUMA.
• To indicate our relation to Gauteng City Region and align with the West Rand SDF and GSDF.
• Environmental Management Framework should be aligned with Gauteng.
Spatial Planning:
• Contextualization of national and provincial policies and legislation has been improved. The impacts of SPLUMA and its draft regulations on municipal planning are now better understood. The Department of Rural Development and Land Reform has proposed that SPLUMA become fully operational on the 1st of July 2015. It is anticipated that all necessary alterations to planning and operations will be made well within the proposed timeframe.
• The need to better contextualise Merafong’s
locality, function and linkages with regard to the GCR is recognised. The Regional SDF was completed after the review process of the Merafong IDP was completed. The Municipal SDF will be integrated with the RSDF. The RSDF was compiled from information obtained from the local municipalities and local officials. GSDF principles are utilised in the document.
• Merafong was involved in the drafting process of the Gauteng Environmental Management Framework which is in its final stages of completion. Once completed it will integrate planning and management related to environmental affairs. The SDF will be aligned to this document and promote its proper functioning. The desired state outcomes will be aligned more closely to the NDP outcomes as well as the 10 Provincial Government pillars.
• Merafong has developed the "Strategy on Waste Collection Systems in Merafong Informal Areas". The Strategy is intending to render the waste collection services to all households in the Informal Areas, in line with the National Waste Collection Standard. The Draft Strategy is now before Council, to seek mandate and funding for the introduction of this service. The initiative of introduction of waste collection into the Merafong Informal Areas, is also as a result of the requirements of the National Waste Management Strategy, which require that 75% of households in the Informal Areas should be receiving the waste collection service by the year 2016.
Draft IDP Document 2015/2016 Page 69
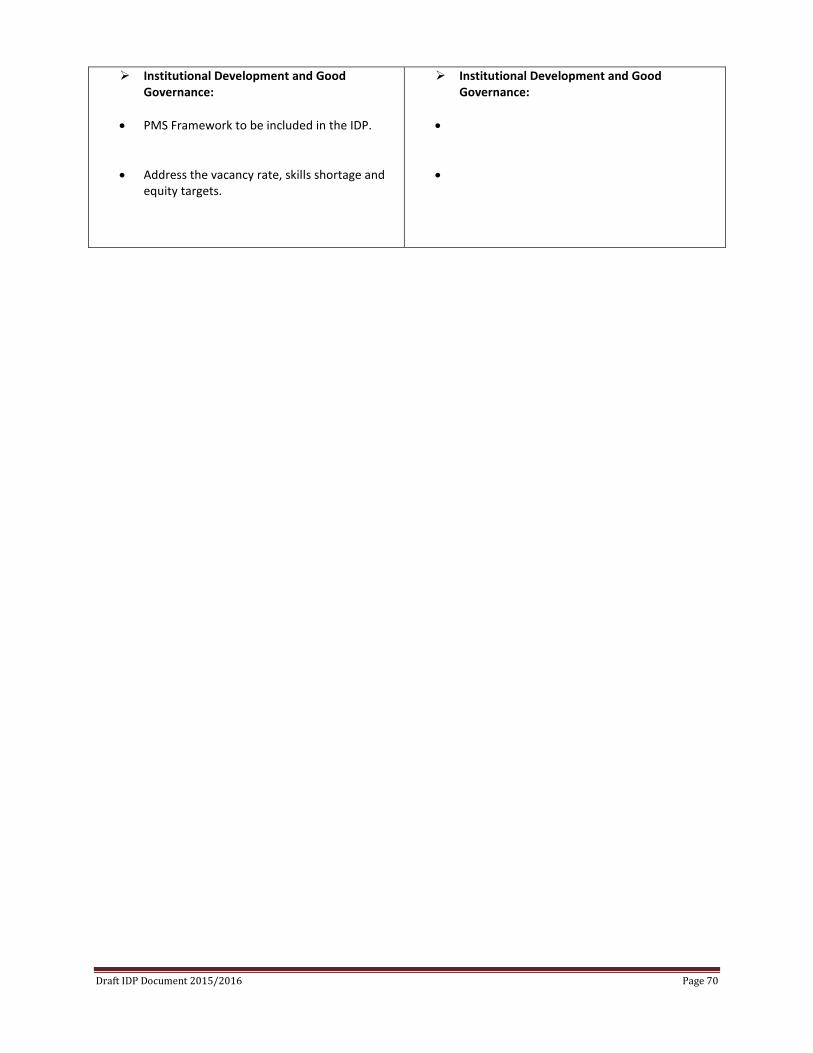
Institutional Development and Good Governance:
• PMS Framework to be included in the IDP.
• Address the vacancy rate, skills shortage and equity targets.
Institutional Development and Good Governance:
•
•
Draft IDP Document 2015/2016 Page 70
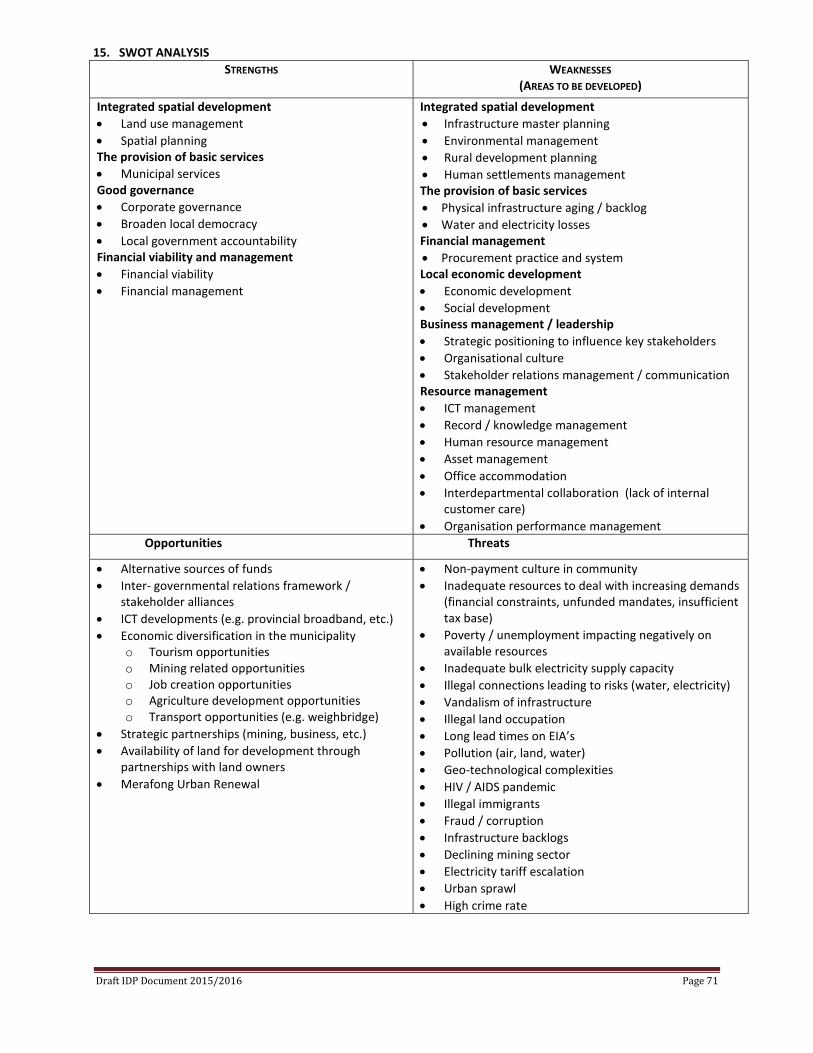
15. SWOT ANALYSIS STRENGTHS
WEAKNESSES
(AREAS TO BE DEVELOPED)
Integrated spatial development • Land use management • Spatial planning The provision of basic services • Municipal services Good governance • Corporate governance • Broaden local democracy • Local government accountability Financial viability and management • Financial viability • Financial management
Integrated spatial development • Infrastructure master planning • Environmental management • Rural development planning • Human settlements management The provision of basic services • Physical infrastructure aging / backlog • Water and electricity losses Financial management • Procurement practice and system Local economic development • Economic development • Social development Business management / leadership • Strategic positioning to influence key stakeholders • Organisational culture • Stakeholder relations management / communication Resource management • ICT management • Record / knowledge management • Human resource management • Asset management • Office accommodation • Interdepartmental collaboration (lack of internal
customer care) • Organisation performance management
Opportunities Threats
• Alternative sources of funds • Inter- governmental relations framework /
stakeholder alliances • ICT developments (e.g. provincial broadband, etc.) • Economic diversification in the municipality
o Tourism opportunities o Mining related opportunities o Job creation opportunities o Agriculture development opportunities o Transport opportunities (e.g. weighbridge)
• Strategic partnerships (mining, business, etc.) • Availability of land for development through
partnerships with land owners • Merafong Urban Renewal
• Non-payment culture in community • Inadequate resources to deal with increasing demands
(financial constraints, unfunded mandates, insufficient tax base)
• Poverty / unemployment impacting negatively on available resources
• Inadequate bulk electricity supply capacity • Illegal connections leading to risks (water, electricity) • Vandalism of infrastructure • Illegal land occupation • Long lead times on EIA’s • Pollution (air, land, water) • Geo-technological complexities • HIV / AIDS pandemic • Illegal immigrants • Fraud / corruption • Infrastructure backlogs • Declining mining sector • Electricity tariff escalation • Urban sprawl • High crime rate
Draft IDP Document 2015/2016 Page 71
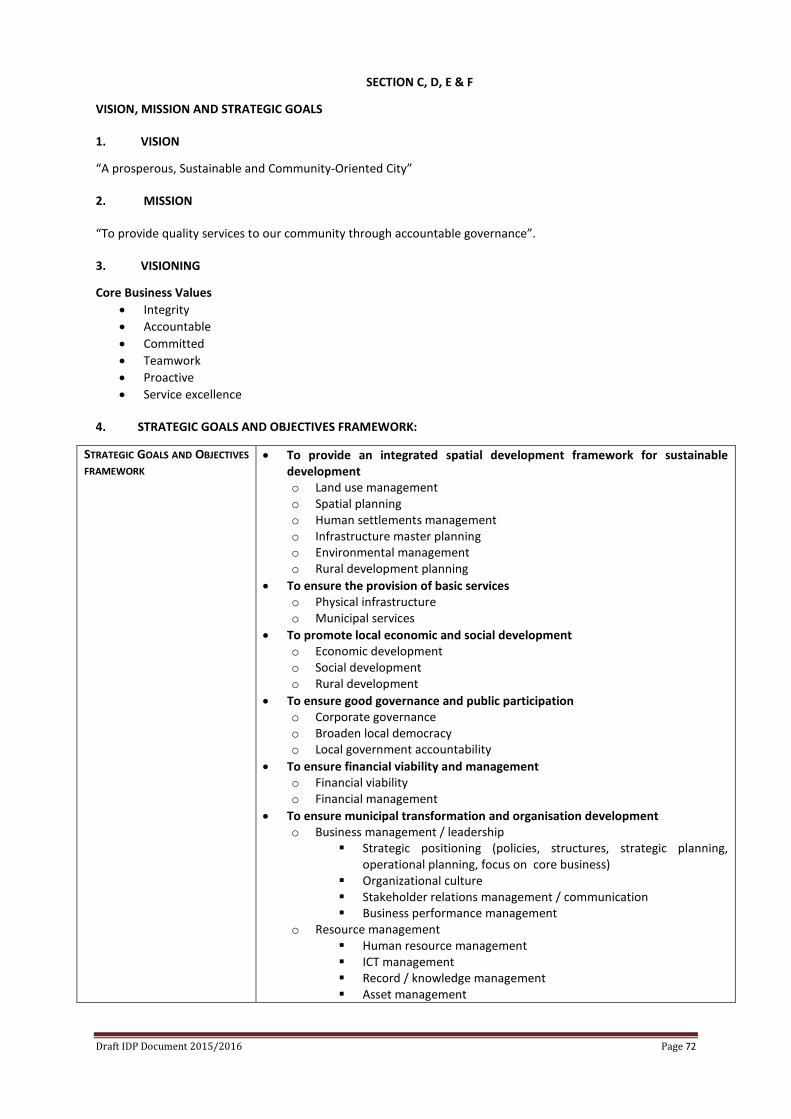
SECTION C, D, E & F
VISION, MISSION AND STRATEGIC GOALS 1. VISION
“A prosperous, Sustainable and Community-Oriented City” 2. MISSION “To provide quality services to our community through accountable governance”. 3. VISIONING
Core Business Values • Integrity • Accountable • Committed • Teamwork • Proactive • Service excellence
4. STRATEGIC GOALS AND OBJECTIVES FRAMEWORK:
STRATEGIC GOALS AND OBJECTIVES FRAMEWORK
• To provide an integrated spatial development framework for sustainable development o Land use management o Spatial planning o Human settlements management o Infrastructure master planning o Environmental management o Rural development planning
• To ensure the provision of basic services o Physical infrastructure o Municipal services
• To promote local economic and social development o Economic development o Social development o Rural development
• To ensure good governance and public participation o Corporate governance o Broaden local democracy o Local government accountability
• To ensure financial viability and management o Financial viability o Financial management
• To ensure municipal transformation and organisation development o Business management / leadership
Strategic positioning (policies, structures, strategic planning, operational planning, focus on core business)
Organizational culture Stakeholder relations management / communication Business performance management
o Resource management Human resource management ICT management Record / knowledge management Asset management
Draft IDP Document 2015/2016 Page 72
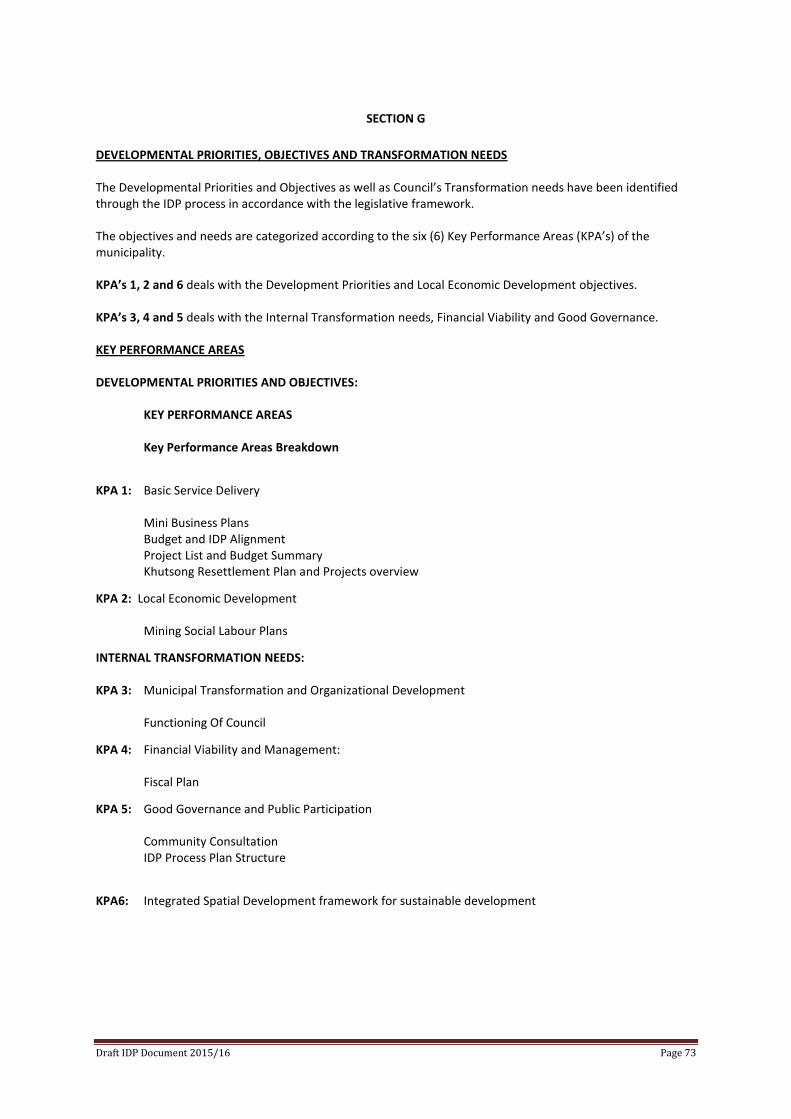
Draft IDP Document 2015/16 Page 73
SECTION G
DEVELOPMENTAL PRIORITIES, OBJECTIVES AND TRANSFORMATION NEEDS The Developmental Priorities and Objectives as well as Council’s Transformation needs have been identified through the IDP process in accordance with the legislative framework. The objectives and needs are categorized according to the six (6) Key Performance Areas (KPA’s) of the municipality. KPA’s 1, 2 and 6 deals with the Development Priorities and Local Economic Development objectives. KPA’s 3, 4 and 5 deals with the Internal Transformation needs, Financial Viability and Good Governance. KEY PERFORMANCE AREAS DEVELOPMENTAL PRIORITIES AND OBJECTIVES:
KEY PERFORMANCE AREAS Key Performance Areas Breakdown
KPA 1: Basic Service Delivery
Mini Business Plans Budget and IDP Alignment Project List and Budget Summary Khutsong Resettlement Plan and Projects overview
KPA 2: Local Economic Development
Mining Social Labour Plans
INTERNAL TRANSFORMATION NEEDS: KPA 3: Municipal Transformation and Organizational Development
Functioning Of Council
KPA 4: Financial Viability and Management:
Fiscal Plan
KPA 5: Good Governance and Public Participation
Community Consultation IDP Process Plan Structure
KPA6: Integrated Spatial Development framework for sustainable development
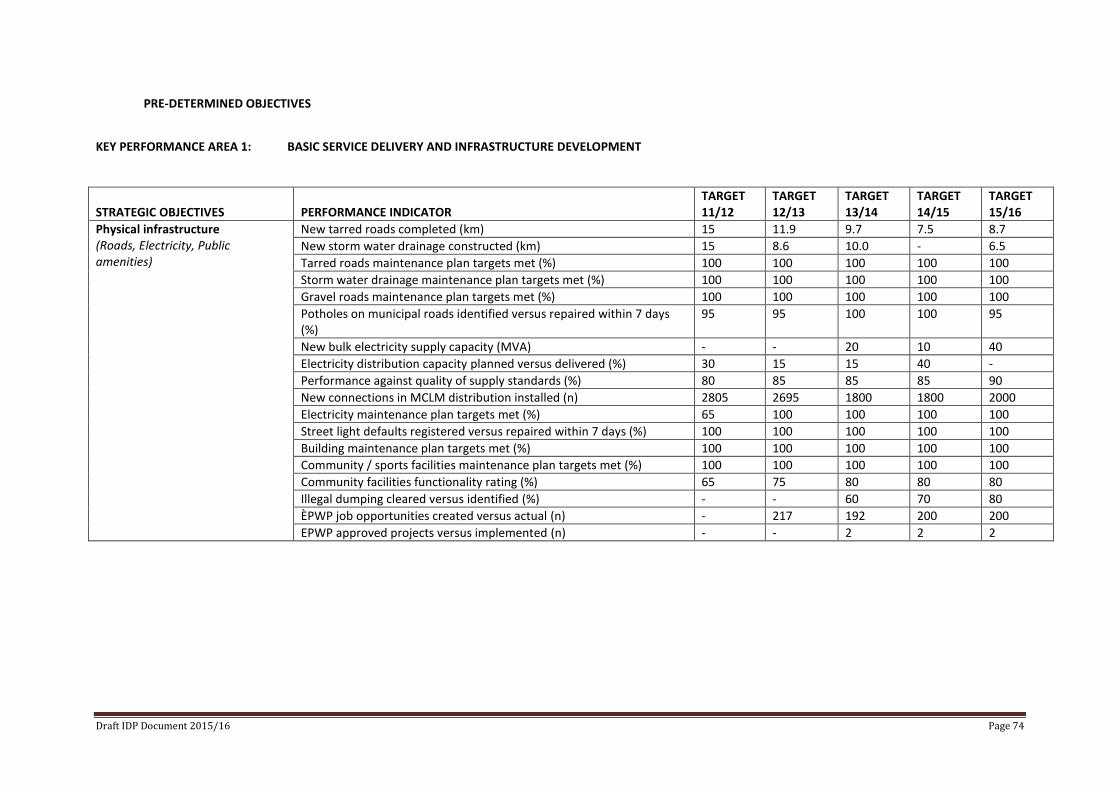
Draft IDP Document 2015/16 Page 74
PRE-DETERMINED OBJECTIVES
KEY PERFORMANCE AREA 1: BASIC SERVICE DELIVERY AND INFRASTRUCTURE DEVELOPMENT
STRATEGIC OBJECTIVES
PERFORMANCE INDICATOR
TARGET 11/12
TARGET 12/13
TARGET 13/14
TARGET 14/15
TARGET 15/16
Physical infrastructure (Roads, Electricity, Public amenities)
New tarred roads completed (km) 15 11.9 9.7 7.5 8.7
New storm water drainage constructed (km) 15 8.6 10.0 - 6.5
Tarred roads maintenance plan targets met (%) 100 100 100 100 100
Storm water drainage maintenance plan targets met (%) 100 100 100 100 100
Gravel roads maintenance plan targets met (%) 100 100 100 100 100
Potholes on municipal roads identified versus repaired within 7 days (%)
95 95 100 100 95
New bulk electricity supply capacity (MVA) - - 20 10 40
Electricity distribution capacity planned versus delivered (%) 30 15 15 40 -
Performance against quality of supply standards (%) 80 85 85 85 90
New connections in MCLM distribution installed (n) 2805 2695 1800 1800 2000
Electricity maintenance plan targets met (%) 65 100 100 100 100
Street light defaults registered versus repaired within 7 days (%) 100 100 100 100 100
Building maintenance plan targets met (%) 100 100 100 100 100
Community / sports facilities maintenance plan targets met (%) 100 100 100 100 100
Community facilities functionality rating (%) 65 75 80 80 80
Illegal dumping cleared versus identified (%) - - 60 70 80
ÈPWP job opportunities created versus actual (n) - 217 192 200 200
EPWP approved projects versus implemented (n) - - 2 2 2
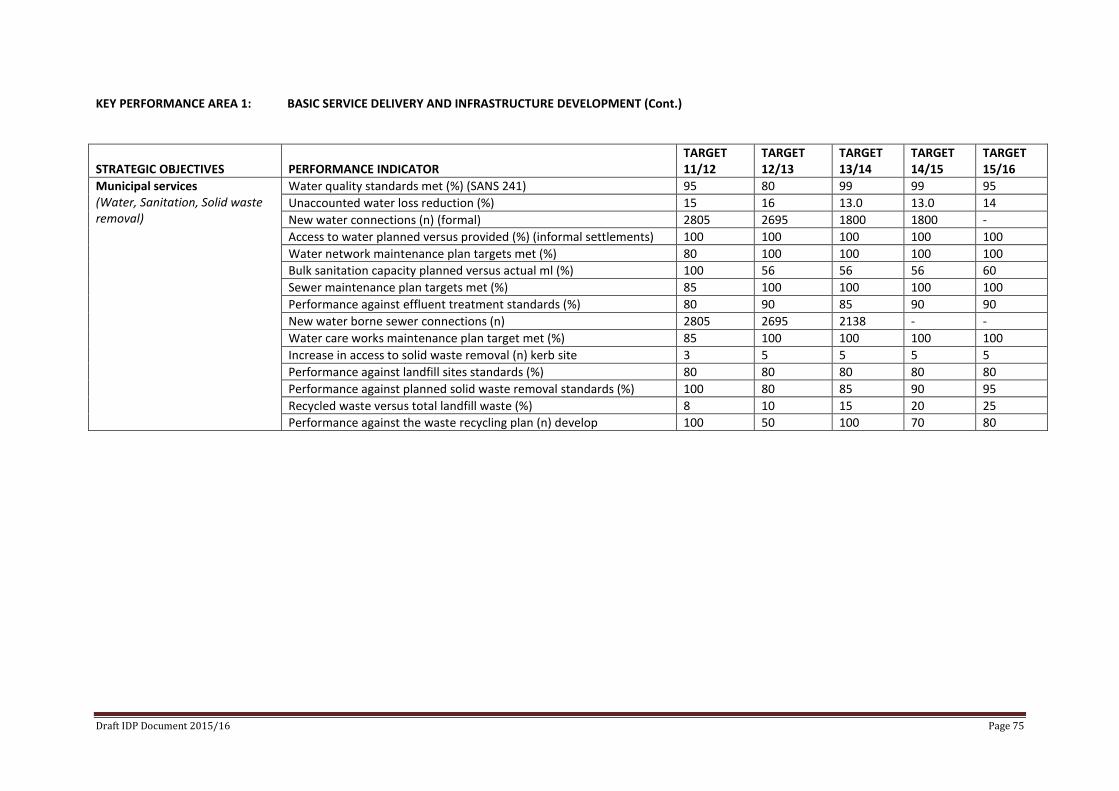
Draft IDP Document 2015/16 Page 75
KEY PERFORMANCE AREA 1: BASIC SERVICE DELIVERY AND INFRASTRUCTURE DEVELOPMENT (Cont.)
STRATEGIC OBJECTIVES
PERFORMANCE INDICATOR
TARGET 11/12
TARGET 12/13
TARGET 13/14
TARGET 14/15
TARGET 15/16
Municipal services (Water, Sanitation, Solid waste removal)
Water quality standards met (%) (SANS 241) 95 80 99 99 95
Unaccounted water loss reduction (%) 15 16 13.0 13.0 14
New water connections (n) (formal) 2805 2695 1800 1800 -
Access to water planned versus provided (%) (informal settlements) 100 100 100 100 100
Water network maintenance plan targets met (%) 80 100 100 100 100
Bulk sanitation capacity planned versus actual ml (%) 100 56 56 56 60
Sewer maintenance plan targets met (%) 85 100 100 100 100
Performance against effluent treatment standards (%) 80 90 85 90 90
New water borne sewer connections (n) 2805 2695 2138 - -
Water care works maintenance plan target met (%) 85 100 100 100 100
Increase in access to solid waste removal (n) kerb site 3 5 5 5 5
Performance against landfill sites standards (%) 80 80 80 80 80
Performance against planned solid waste removal standards (%) 100 80 85 90 95
Recycled waste versus total landfill waste (%) 8 10 15 20 25
Performance against the waste recycling plan (n) develop 100 50 100 70 80
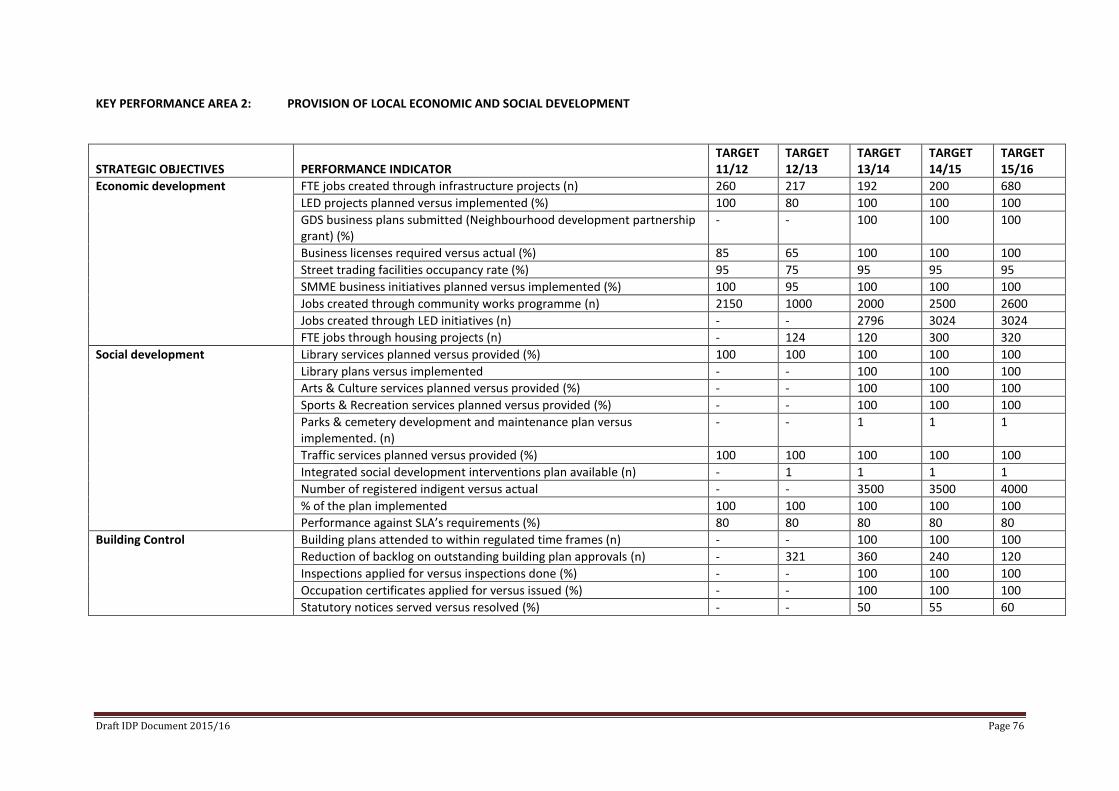
Draft IDP Document 2015/16 Page 76
KEY PERFORMANCE AREA 2: PROVISION OF LOCAL ECONOMIC AND SOCIAL DEVELOPMENT
STRATEGIC OBJECTIVES
PERFORMANCE INDICATOR
TARGET 11/12
TARGET 12/13
TARGET 13/14
TARGET 14/15
TARGET 15/16
Economic development FTE jobs created through infrastructure projects (n) 260 217 192 200 680
LED projects planned versus implemented (%) 100 80 100 100 100
GDS business plans submitted (Neighbourhood development partnership grant) (%)
- - 100 100 100
Business licenses required versus actual (%) 85 65 100 100 100
Street trading facilities occupancy rate (%) 95 75 95 95 95
SMME business initiatives planned versus implemented (%) 100 95 100 100 100
Jobs created through community works programme (n) 2150 1000 2000 2500 2600
Jobs created through LED initiatives (n) - - 2796 3024 3024
FTE jobs through housing projects (n) - 124 120 300 320
Social development Library services planned versus provided (%) 100 100 100 100 100
Library plans versus implemented - - 100 100 100
Arts & Culture services planned versus provided (%) - - 100 100 100
Sports & Recreation services planned versus provided (%) - - 100 100 100
Parks & cemetery development and maintenance plan versus implemented. (n)
- - 1 1 1
Traffic services planned versus provided (%) 100 100 100 100 100
Integrated social development interventions plan available (n) - 1 1 1 1
Number of registered indigent versus actual - - 3500 3500 4000
% of the plan implemented 100 100 100 100 100
Performance against SLA’s requirements (%) 80 80 80 80 80
Building Control Building plans attended to within regulated time frames (n) - - 100 100 100
Reduction of backlog on outstanding building plan approvals (n) - 321 360 240 120
Inspections applied for versus inspections done (%) - - 100 100 100
Occupation certificates applied for versus issued (%) - - 100 100 100
Statutory notices served versus resolved (%) - - 50 55 60
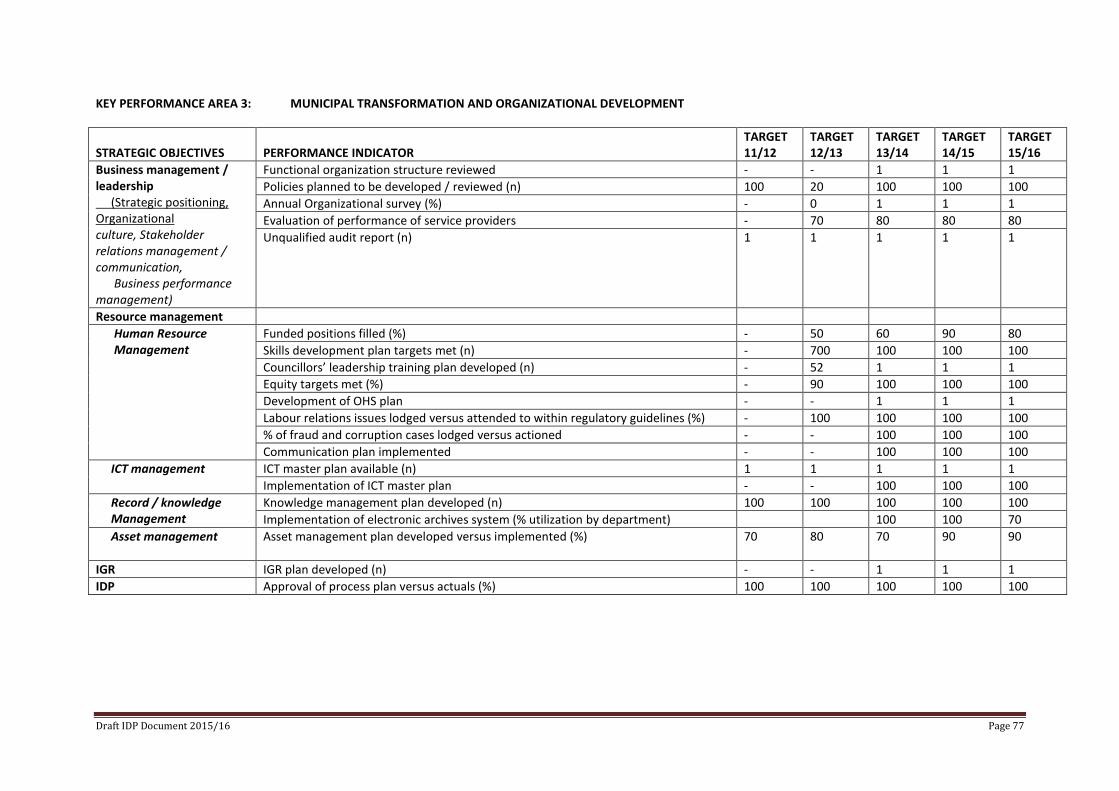
Draft IDP Document 2015/16 Page 77
KEY PERFORMANCE AREA 3: MUNICIPAL TRANSFORMATION AND ORGANIZATIONAL DEVELOPMENT
STRATEGIC OBJECTIVES
PERFORMANCE INDICATOR
TARGET 11/12
TARGET 12/13
TARGET 13/14
TARGET 14/15
TARGET 15/16
Business management / leadership (Strategic positioning, Organizational culture, Stakeholder relations management / communication, Business performance management)
Functional organization structure reviewed - - 1 1 1
Policies planned to be developed / reviewed (n) 100 20 100 100 100
Annual Organizational survey (%) - 0 1 1 1
Evaluation of performance of service providers - 70 80 80 80
Unqualified audit report (n) 1 1 1 1 1
Resource management
Human Resource Management
Funded positions filled (%) - 50 60 90 80
Skills development plan targets met (n) - 700 100 100 100
Councillors’ leadership training plan developed (n) - 52 1 1 1
Equity targets met (%) - 90 100 100 100
Development of OHS plan - - 1 1 1
Labour relations issues lodged versus attended to within regulatory guidelines (%) - 100 100 100 100
% of fraud and corruption cases lodged versus actioned - - 100 100 100
Communication plan implemented - - 100 100 100
ICT management ICT master plan available (n) 1 1 1 1 1
Implementation of ICT master plan - - 100 100 100
Record / knowledge Management
Knowledge management plan developed (n) 100 100 100 100 100
Implementation of electronic archives system (% utilization by department) 100 100 70
Asset management
Asset management plan developed versus implemented (%) 70 80 70 90 90
IGR IGR plan developed (n) - - 1 1 1
IDP Approval of process plan versus actuals (%) 100 100 100 100 100
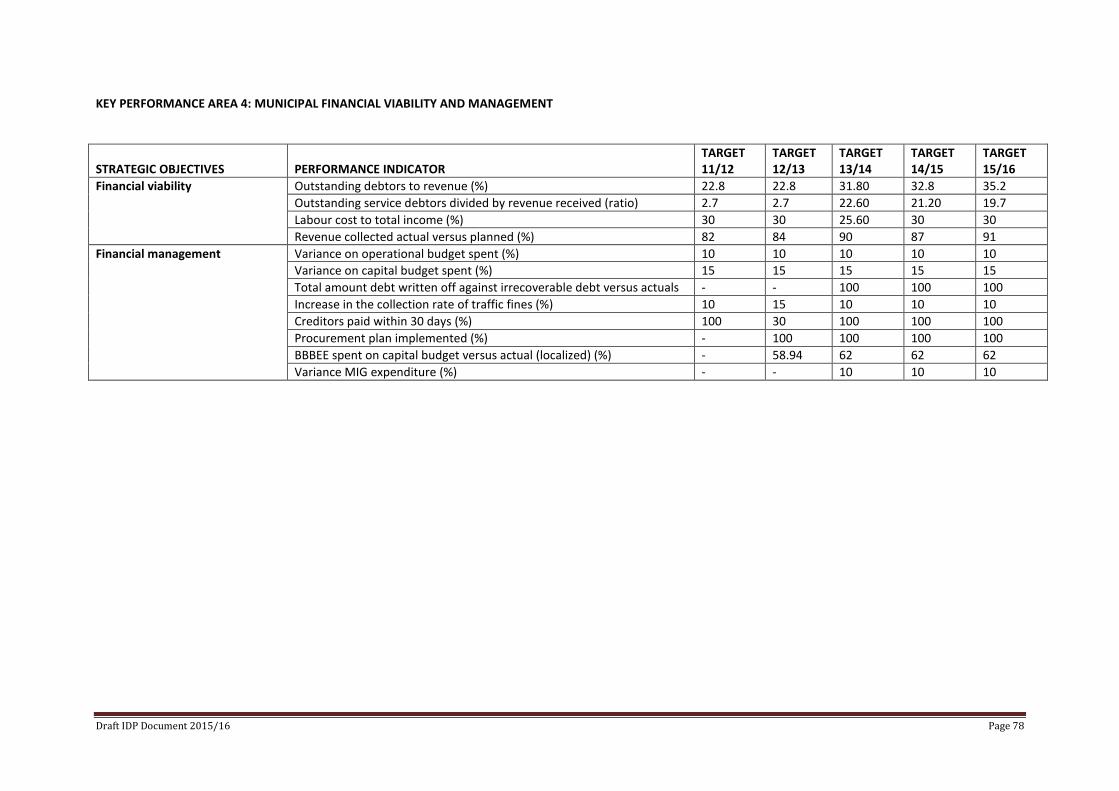
Draft IDP Document 2015/16 Page 78
KEY PERFORMANCE AREA 4: MUNICIPAL FINANCIAL VIABILITY AND MANAGEMENT
STRATEGIC OBJECTIVES
PERFORMANCE INDICATOR
TARGET 11/12
TARGET 12/13
TARGET 13/14
TARGET 14/15
TARGET 15/16
Financial viability Outstanding debtors to revenue (%) 22.8 22.8 31.80 32.8 35.2
Outstanding service debtors divided by revenue received (ratio) 2.7 2.7 22.60 21.20 19.7
Labour cost to total income (%) 30 30 25.60 30 30
Revenue collected actual versus planned (%) 82 84 90 87 91
Financial management Variance on operational budget spent (%) 10 10 10 10 10
Variance on capital budget spent (%) 15 15 15 15 15
Total amount debt written off against irrecoverable debt versus actuals - - 100 100 100
Increase in the collection rate of traffic fines (%) 10 15 10 10 10
Creditors paid within 30 days (%) 100 30 100 100 100
Procurement plan implemented (%) - 100 100 100 100
BBBEE spent on capital budget versus actual (localized) (%) - 58.94 62 62 62
Variance MIG expenditure (%) - - 10 10 10
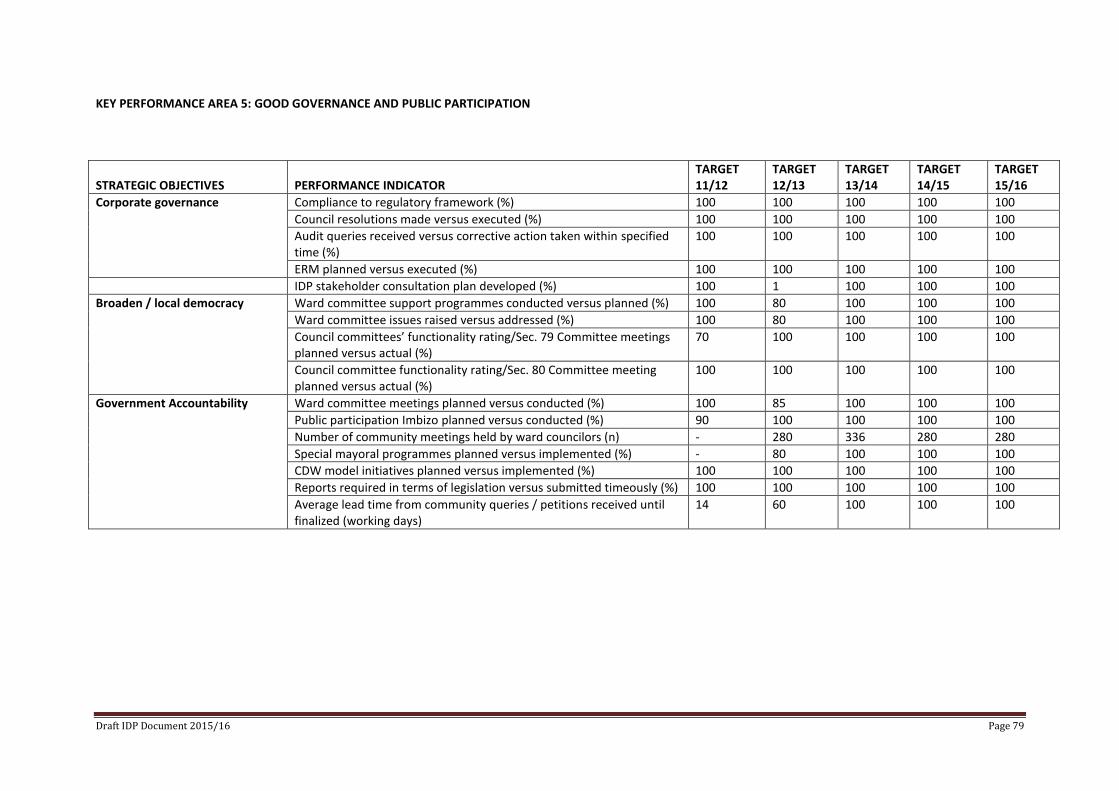
Draft IDP Document 2015/16 Page 79
KEY PERFORMANCE AREA 5: GOOD GOVERNANCE AND PUBLIC PARTICIPATION
STRATEGIC OBJECTIVES
PERFORMANCE INDICATOR
TARGET 11/12
TARGET 12/13
TARGET 13/14
TARGET 14/15
TARGET 15/16
Corporate governance Compliance to regulatory framework (%) 100 100 100 100 100
Council resolutions made versus executed (%) 100 100 100 100 100
Audit queries received versus corrective action taken within specified time (%)
100 100 100 100 100
ERM planned versus executed (%) 100 100 100 100 100
IDP stakeholder consultation plan developed (%) 100 1 100 100 100
Broaden / local democracy Ward committee support programmes conducted versus planned (%) 100 80 100 100 100
Ward committee issues raised versus addressed (%) 100 80 100 100 100
Council committees’ functionality rating/Sec. 79 Committee meetings planned versus actual (%)
70 100 100 100 100
Council committee functionality rating/Sec. 80 Committee meeting planned versus actual (%)
100 100 100 100 100
Government Accountability Ward committee meetings planned versus conducted (%) 100 85 100 100 100
Public participation Imbizo planned versus conducted (%) 90 100 100 100 100
Number of community meetings held by ward councilors (n) - 280 336 280 280
Special mayoral programmes planned versus implemented (%) - 80 100 100 100
CDW model initiatives planned versus implemented (%) 100 100 100 100 100
Reports required in terms of legislation versus submitted timeously (%) 100 100 100 100 100
Average lead time from community queries / petitions received until finalized (working days)
14 60 100 100 100
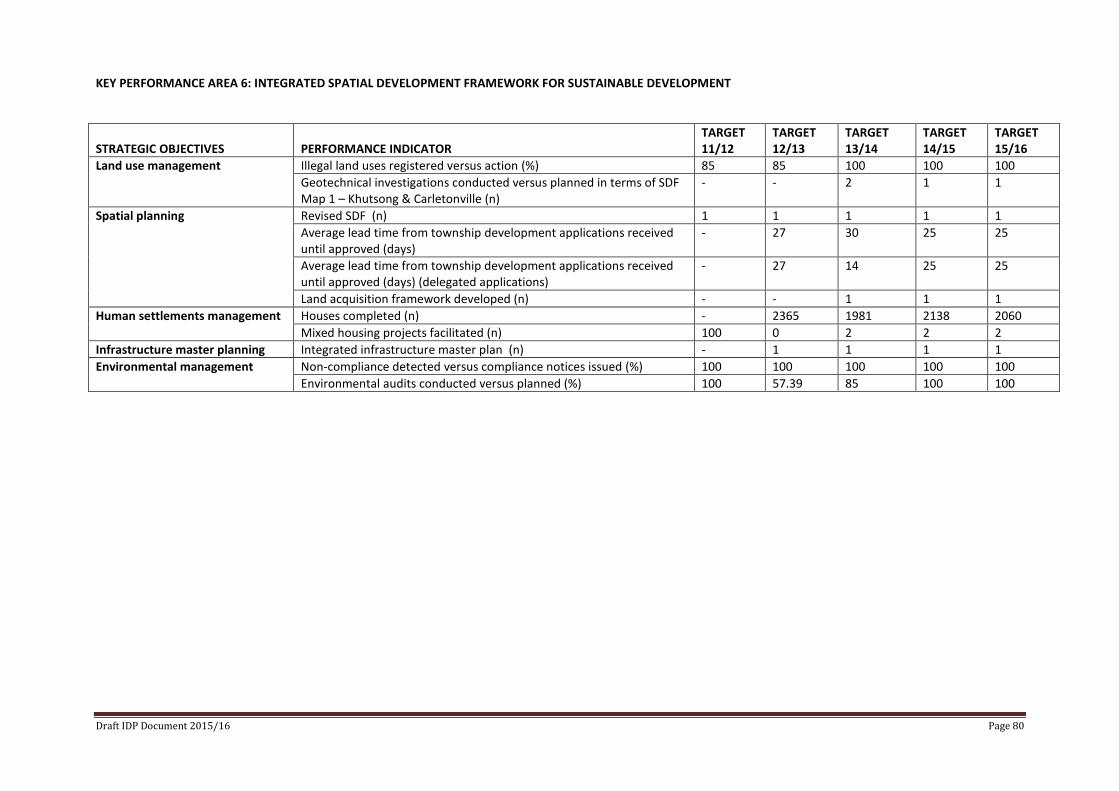
Draft IDP Document 2015/16 Page 80
KEY PERFORMANCE AREA 6: INTEGRATED SPATIAL DEVELOPMENT FRAMEWORK FOR SUSTAINABLE DEVELOPMENT
STRATEGIC OBJECTIVES
PERFORMANCE INDICATOR
TARGET 11/12
TARGET 12/13
TARGET 13/14
TARGET 14/15
TARGET 15/16
Land use management Illegal land uses registered versus action (%) 85 85 100 100 100
Geotechnical investigations conducted versus planned in terms of SDF Map 1 – Khutsong & Carletonville (n)
- - 2 1 1
Spatial planning Revised SDF (n) 1 1 1 1 1
Average lead time from township development applications received until approved (days)
- 27 30 25 25
Average lead time from township development applications received until approved (days) (delegated applications)
- 27 14 25 25
Land acquisition framework developed (n) - - 1 1 1
Human settlements management Houses completed (n) - 2365 1981 2138 2060
Mixed housing projects facilitated (n) 100 0 2 2 2
Infrastructure master planning Integrated infrastructure master plan (n) - 1 1 1 1
Environmental management Non-compliance detected versus compliance notices issued (%) 100 100 100 100 100
Environmental audits conducted versus planned (%) 100 57.39 85 100 100
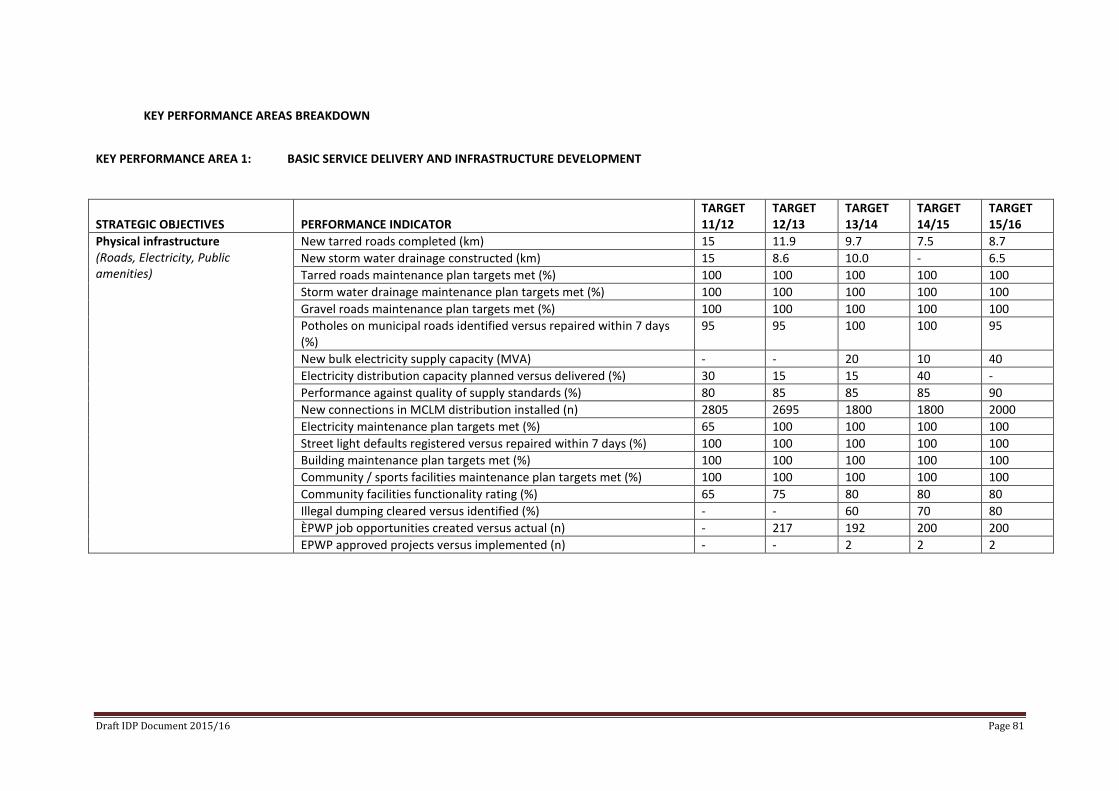
Draft IDP Document 2015/16 Page 81
KEY PERFORMANCE AREAS BREAKDOWN
KEY PERFORMANCE AREA 1: BASIC SERVICE DELIVERY AND INFRASTRUCTURE DEVELOPMENT
STRATEGIC OBJECTIVES
PERFORMANCE INDICATOR
TARGET 11/12
TARGET 12/13
TARGET 13/14
TARGET 14/15
TARGET 15/16
Physical infrastructure (Roads, Electricity, Public amenities)
New tarred roads completed (km) 15 11.9 9.7 7.5 8.7
New storm water drainage constructed (km) 15 8.6 10.0 - 6.5
Tarred roads maintenance plan targets met (%) 100 100 100 100 100
Storm water drainage maintenance plan targets met (%) 100 100 100 100 100
Gravel roads maintenance plan targets met (%) 100 100 100 100 100
Potholes on municipal roads identified versus repaired within 7 days (%)
95 95 100 100 95
New bulk electricity supply capacity (MVA) - - 20 10 40
Electricity distribution capacity planned versus delivered (%) 30 15 15 40 -
Performance against quality of supply standards (%) 80 85 85 85 90
New connections in MCLM distribution installed (n) 2805 2695 1800 1800 2000
Electricity maintenance plan targets met (%) 65 100 100 100 100
Street light defaults registered versus repaired within 7 days (%) 100 100 100 100 100
Building maintenance plan targets met (%) 100 100 100 100 100
Community / sports facilities maintenance plan targets met (%) 100 100 100 100 100
Community facilities functionality rating (%) 65 75 80 80 80
Illegal dumping cleared versus identified (%) - - 60 70 80
ÈPWP job opportunities created versus actual (n) - 217 192 200 200
EPWP approved projects versus implemented (n) - - 2 2 2
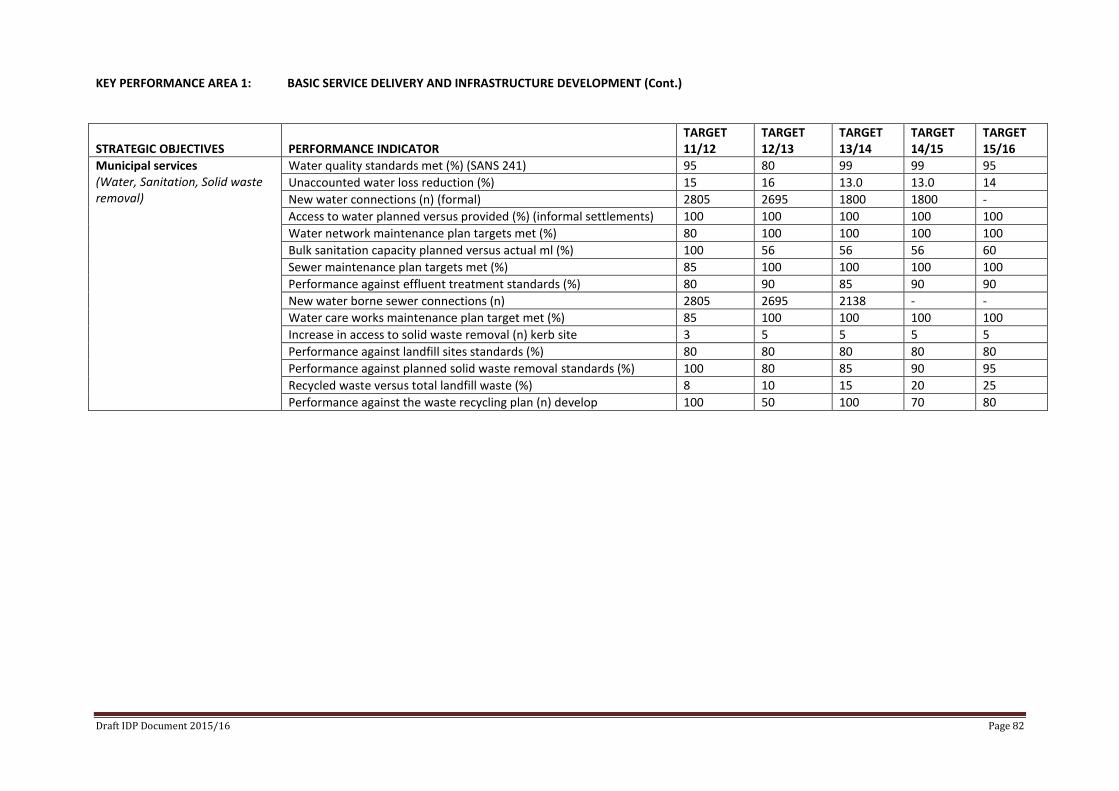
Draft IDP Document 2015/16 Page 82
KEY PERFORMANCE AREA 1: BASIC SERVICE DELIVERY AND INFRASTRUCTURE DEVELOPMENT (Cont.)
STRATEGIC OBJECTIVES
PERFORMANCE INDICATOR
TARGET 11/12
TARGET 12/13
TARGET 13/14
TARGET 14/15
TARGET 15/16
Municipal services (Water, Sanitation, Solid waste removal)
Water quality standards met (%) (SANS 241) 95 80 99 99 95
Unaccounted water loss reduction (%) 15 16 13.0 13.0 14
New water connections (n) (formal) 2805 2695 1800 1800 -
Access to water planned versus provided (%) (informal settlements) 100 100 100 100 100
Water network maintenance plan targets met (%) 80 100 100 100 100
Bulk sanitation capacity planned versus actual ml (%) 100 56 56 56 60
Sewer maintenance plan targets met (%) 85 100 100 100 100
Performance against effluent treatment standards (%) 80 90 85 90 90
New water borne sewer connections (n) 2805 2695 2138 - -
Water care works maintenance plan target met (%) 85 100 100 100 100
Increase in access to solid waste removal (n) kerb site 3 5 5 5 5
Performance against landfill sites standards (%) 80 80 80 80 80
Performance against planned solid waste removal standards (%) 100 80 85 90 95
Recycled waste versus total landfill waste (%) 8 10 15 20 25
Performance against the waste recycling plan (n) develop 100 50 100 70 80
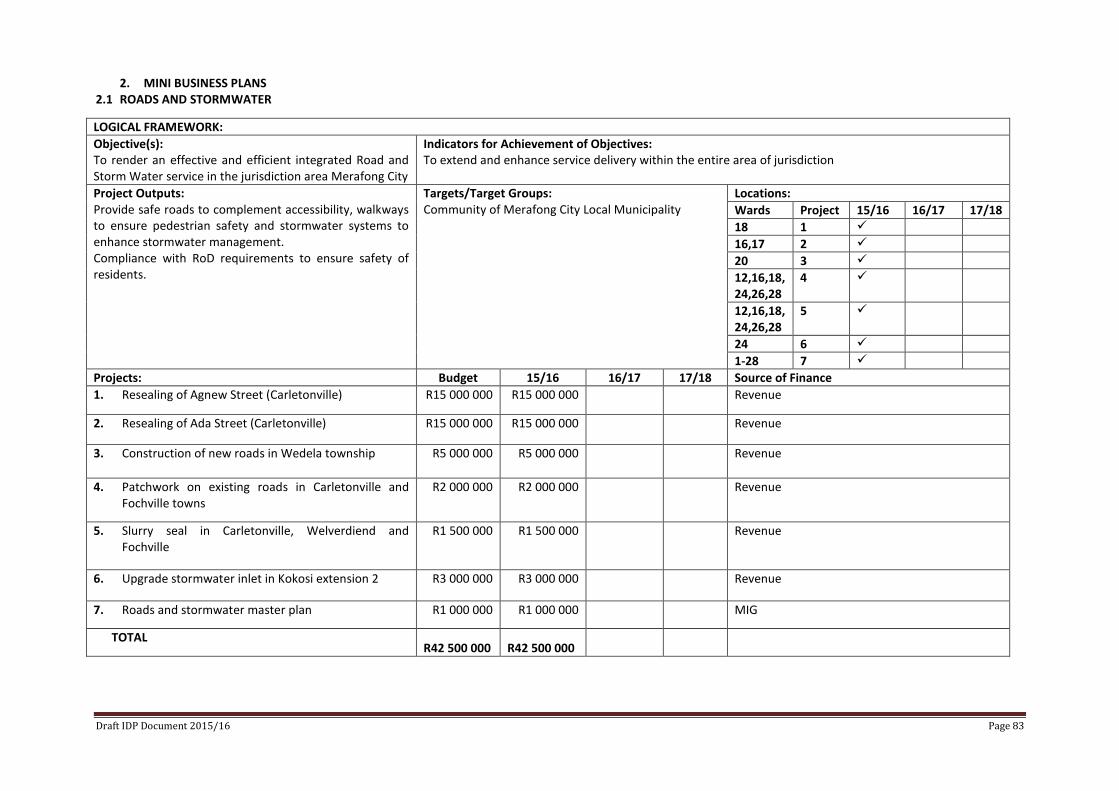
Draft IDP Document 2015/16 Page 83
2. MINI BUSINESS PLANS 2.1 ROADS AND STORMWATER
LOGICAL FRAMEWORK:
Objective(s): To render an effective and efficient integrated Road and Storm Water service in the jurisdiction area Merafong City
Indicators for Achievement of Objectives: To extend and enhance service delivery within the entire area of jurisdiction
Project Outputs: Provide safe roads to complement accessibility, walkways to ensure pedestrian safety and stormwater systems to enhance stormwater management. Compliance with RoD requirements to ensure safety of residents.
Targets/Target Groups: Community of Merafong City Local Municipality
Locations:
Wards Project 15/16 16/17 17/18
18 1
16,17 2
20 3
12,16,18,24,26,28
4
12,16,18,24,26,28
5
24 6
1-28 7
Projects: Budget 15/16 16/17 17/18 Source of Finance
1. Resealing of Agnew Street (Carletonville) R15 000 000 R15 000 000 Revenue
2. Resealing of Ada Street (Carletonville) R15 000 000 R15 000 000 Revenue
3. Construction of new roads in Wedela township R5 000 000 R5 000 000 Revenue
4. Patchwork on existing roads in Carletonville and Fochville towns
R2 000 000 R2 000 000 Revenue
5. Slurry seal in Carletonville, Welverdiend and Fochville
R1 500 000 R1 500 000 Revenue
6. Upgrade stormwater inlet in Kokosi extension 2 R3 000 000 R3 000 000 Revenue
7. Roads and stormwater master plan R1 000 000 R1 000 000 MIG
TOTAL R42 500 000 R42 500 000
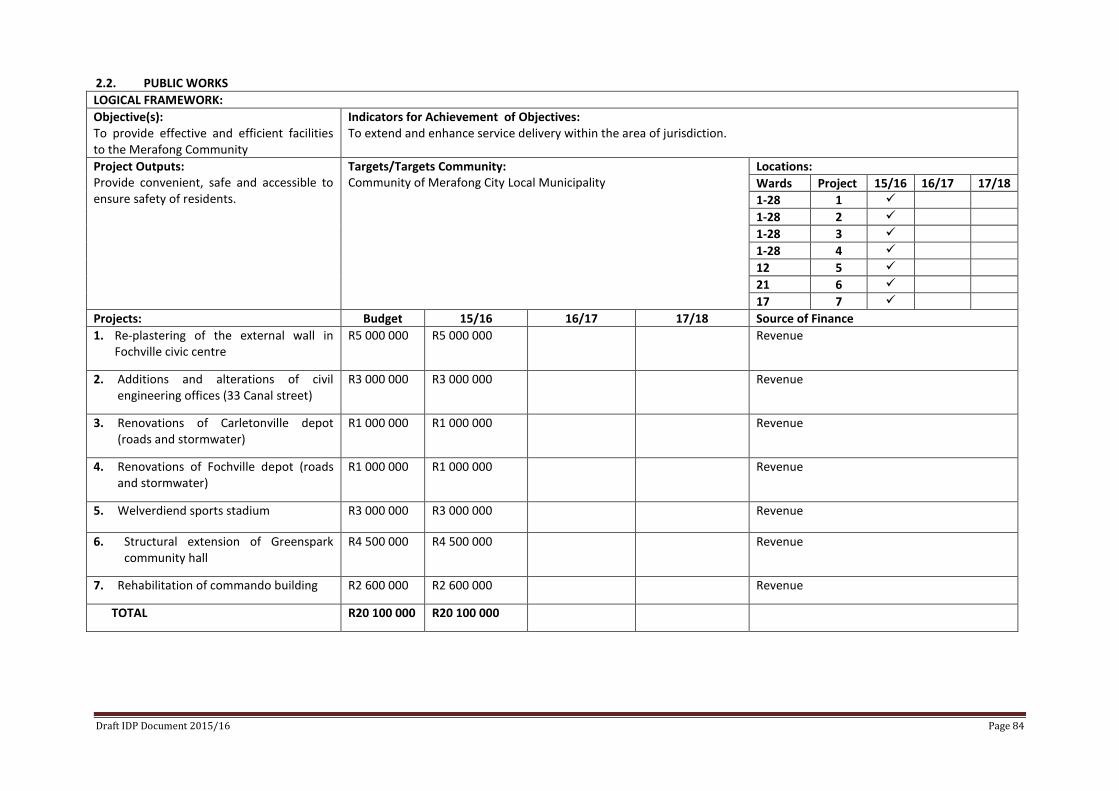
Draft IDP Document 2015/16 Page 84
2.2. PUBLIC WORKS
LOGICAL FRAMEWORK:
Objective(s): To provide effective and efficient facilities to the Merafong Community
Indicators for Achievement of Objectives: To extend and enhance service delivery within the area of jurisdiction.
Project Outputs: Provide convenient, safe and accessible to ensure safety of residents.
Targets/Targets Community: Community of Merafong City Local Municipality
Locations:
Wards Project 15/16 16/17 17/18
1-28 1
1-28 2
1-28 3
1-28 4
12 5
21 6
17 7
Projects: Budget 15/16 16/17 17/18 Source of Finance
1. Re-plastering of the external wall in Fochville civic centre
R5 000 000 R5 000 000
Revenue
2. Additions and alterations of civil engineering offices (33 Canal street)
R3 000 000 R3 000 000 Revenue
3. Renovations of Carletonville depot (roads and stormwater)
R1 000 000 R1 000 000 Revenue
4. Renovations of Fochville depot (roads and stormwater)
R1 000 000 R1 000 000 Revenue
5. Welverdiend sports stadium R3 000 000 R3 000 000 Revenue
6. Structural extension of Greenspark community hall
R4 500 000 R4 500 000 Revenue
7. Rehabilitation of commando building R2 600 000 R2 600 000 Revenue
TOTAL R20 100 000 R20 100 000
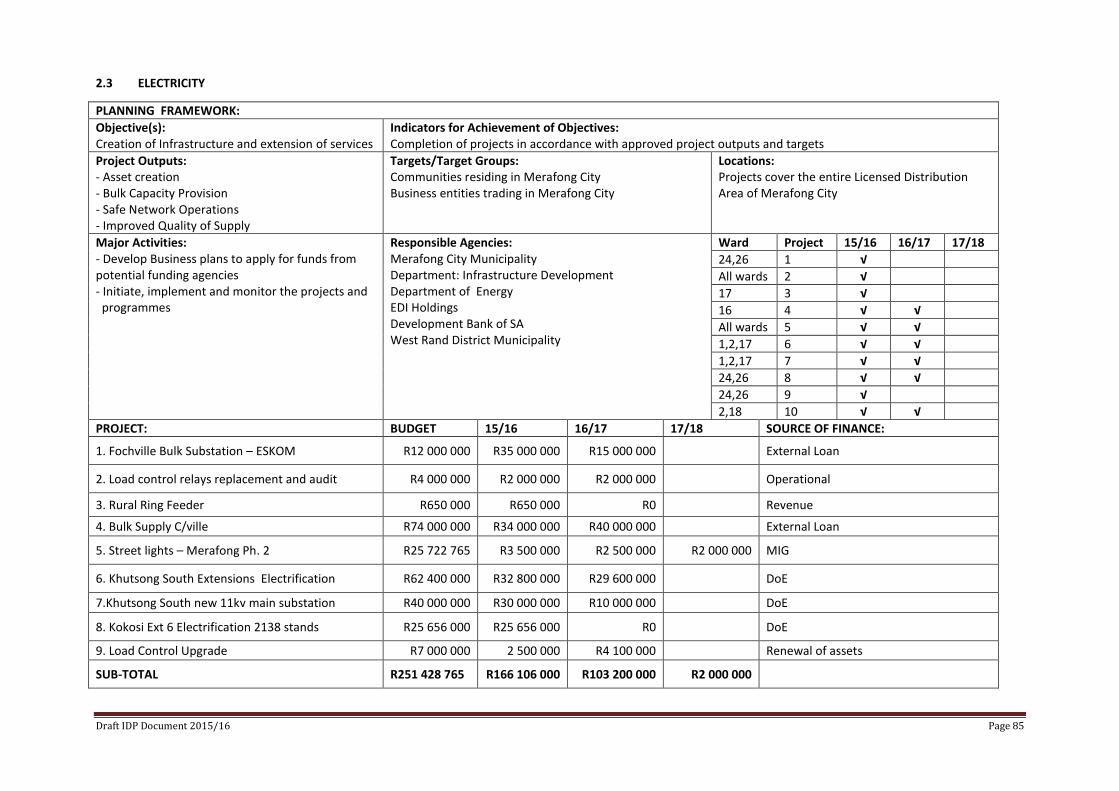
Draft IDP Document 2015/16 Page 85
2.3 ELECTRICITY
PLANNING FRAMEWORK:
Objective(s): Creation of Infrastructure and extension of services
Indicators for Achievement of Objectives: Completion of projects in accordance with approved project outputs and targets
Project Outputs: - Asset creation - Bulk Capacity Provision - Safe Network Operations - Improved Quality of Supply
Targets/Target Groups: Communities residing in Merafong City Business entities trading in Merafong City
Locations: Projects cover the entire Licensed Distribution Area of Merafong City
Major Activities: - Develop Business plans to apply for funds from potential funding agencies - Initiate, implement and monitor the projects and programmes
Responsible Agencies: Merafong City Municipality Department: Infrastructure Development Department of Energy EDI Holdings Development Bank of SA West Rand District Municipality
Ward Project 15/16 16/17 17/18
24,26 1 √
All wards 2 √
17 3 √
16 4 √ √
All wards 5 √ √
1,2,17 6 √ √
1,2,17 7 √ √
24,26 8 √ √
24,26 9 √
2,18 10 √ √
PROJECT: BUDGET 15/16 16/17 17/18 SOURCE OF FINANCE:
1. Fochville Bulk Substation – ESKOM R12 000 000 R35 000 000 R15 000 000 External Loan
2. Load control relays replacement and audit R4 000 000 R2 000 000 R2 000 000 Operational
3. Rural Ring Feeder R650 000 R650 000 R0 Revenue
4. Bulk Supply C/ville R74 000 000 R34 000 000 R40 000 000 External Loan
5. Street lights – Merafong Ph. 2 R25 722 765 R3 500 000 R2 500 000 R2 000 000 MIG
6. Khutsong South Extensions Electrification R62 400 000 R32 800 000 R29 600 000 DoE
7.Khutsong South new 11kv main substation R40 000 000 R30 000 000 R10 000 000 DoE
8. Kokosi Ext 6 Electrification 2138 stands R25 656 000 R25 656 000 R0 DoE
9. Load Control Upgrade R7 000 000 2 500 000 R4 100 000 Renewal of assets
SUB-TOTAL R251 428 765 R166 106 000 R103 200 000 R2 000 000
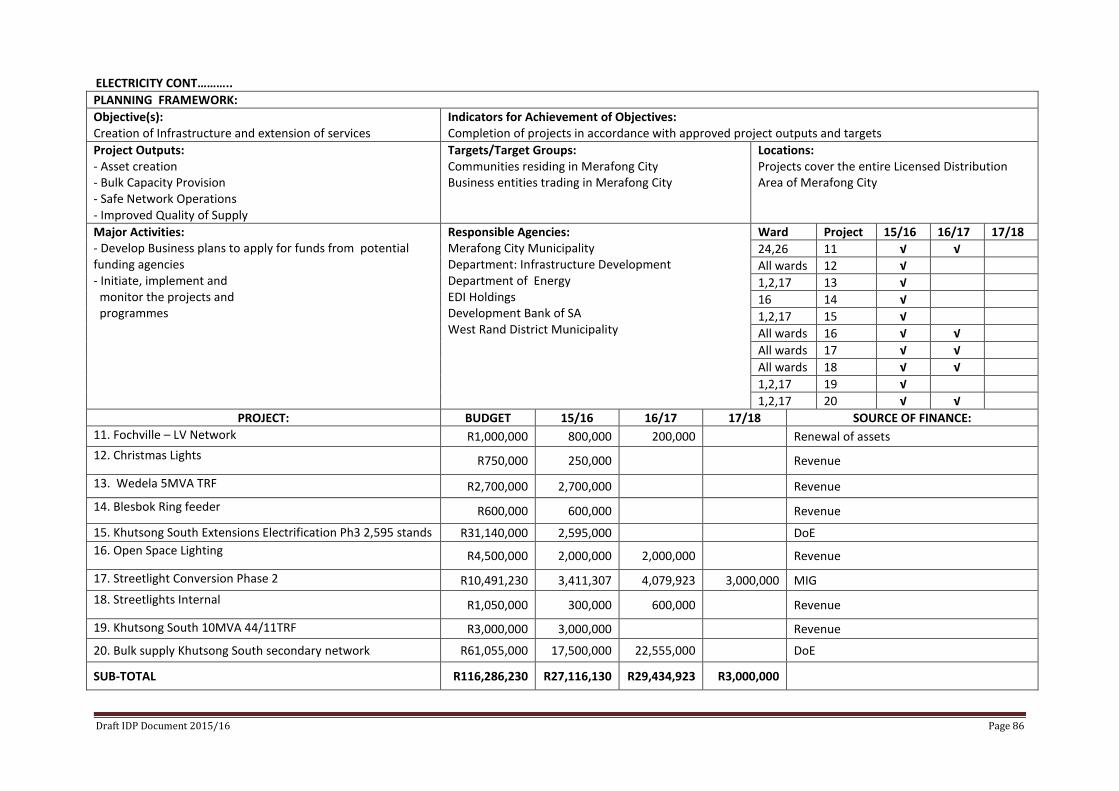
Draft IDP Document 2015/16 Page 86
ELECTRICITY CONT………..
PLANNING FRAMEWORK:
Objective(s): Creation of Infrastructure and extension of services
Indicators for Achievement of Objectives: Completion of projects in accordance with approved project outputs and targets
Project Outputs: - Asset creation - Bulk Capacity Provision - Safe Network Operations - Improved Quality of Supply
Targets/Target Groups: Communities residing in Merafong City Business entities trading in Merafong City
Locations: Projects cover the entire Licensed Distribution Area of Merafong City
Major Activities: - Develop Business plans to apply for funds from potential funding agencies - Initiate, implement and monitor the projects and programmes
Responsible Agencies: Merafong City Municipality Department: Infrastructure Development Department of Energy EDI Holdings Development Bank of SA West Rand District Municipality
Ward Project 15/16 16/17 17/18
24,26 11 √ √
All wards 12 √
1,2,17 13 √
16 14 √
1,2,17 15 √
All wards 16 √ √
All wards 17 √ √
All wards 18 √ √
1,2,17 19 √
1,2,17 20 √ √
PROJECT: BUDGET 15/16 16/17 17/18 SOURCE OF FINANCE:
11. Fochville – LV Network R1,000,000 800,000 200,000 Renewal of assets
12. Christmas Lights R750,000 250,000 Revenue
13. Wedela 5MVA TRF R2,700,000 2,700,000 Revenue
14. Blesbok Ring feeder R600,000 600,000 Revenue
15. Khutsong South Extensions Electrification Ph3 2,595 stands R31,140,000 2,595,000 DoE
16. Open Space Lighting R4,500,000 2,000,000 2,000,000 Revenue
17. Streetlight Conversion Phase 2 R10,491,230 3,411,307 4,079,923 3,000,000 MIG
18. Streetlights Internal R1,050,000 300,000 600,000 Revenue
19. Khutsong South 10MVA 44/11TRF R3,000,000 3,000,000 Revenue
20. Bulk supply Khutsong South secondary network R61,055,000 17,500,000 22,555,000 DoE
SUB-TOTAL R116,286,230 R27,116,130 R29,434,923 R3,000,000
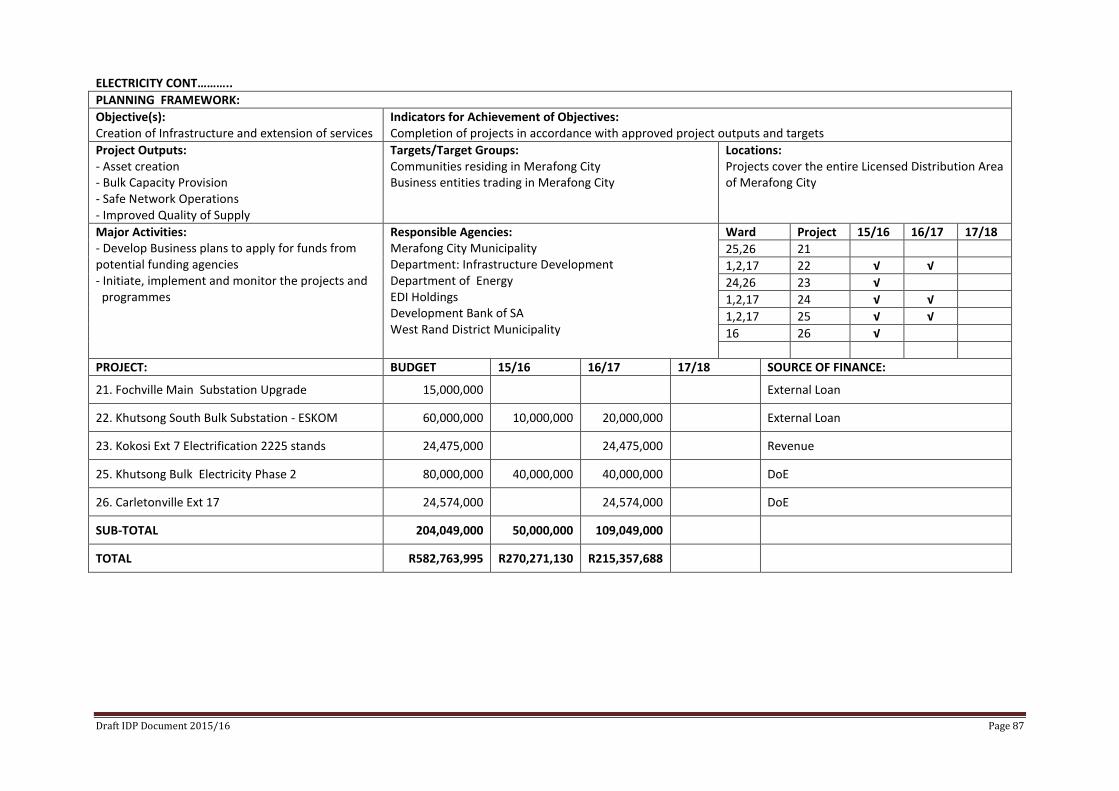
Draft IDP Document 2015/16 Page 87
ELECTRICITY CONT………..
PLANNING FRAMEWORK:
Objective(s): Creation of Infrastructure and extension of services
Indicators for Achievement of Objectives: Completion of projects in accordance with approved project outputs and targets
Project Outputs: - Asset creation - Bulk Capacity Provision - Safe Network Operations - Improved Quality of Supply
Targets/Target Groups: Communities residing in Merafong City Business entities trading in Merafong City
Locations: Projects cover the entire Licensed Distribution Area of Merafong City
Major Activities: - Develop Business plans to apply for funds from potential funding agencies - Initiate, implement and monitor the projects and programmes
Responsible Agencies: Merafong City Municipality Department: Infrastructure Development Department of Energy EDI Holdings Development Bank of SA West Rand District Municipality
Ward Project 15/16 16/17 17/18
25,26 21
1,2,17 22 √ √
24,26 23 √
1,2,17 24 √ √
1,2,17 25 √ √
16 26 √
PROJECT: BUDGET 15/16 16/17 17/18 SOURCE OF FINANCE:
21. Fochville Main Substation Upgrade 15,000,000 External Loan
22. Khutsong South Bulk Substation - ESKOM 60,000,000 10,000,000 20,000,000 External Loan
23. Kokosi Ext 7 Electrification 2225 stands 24,475,000 24,475,000 Revenue
25. Khutsong Bulk Electricity Phase 2 80,000,000 40,000,000 40,000,000 DoE
26. Carletonville Ext 17 24,574,000 24,574,000 DoE
SUB-TOTAL 204,049,000 50,000,000 109,049,000
TOTAL R582,763,995 R270,271,130 R215,357,688
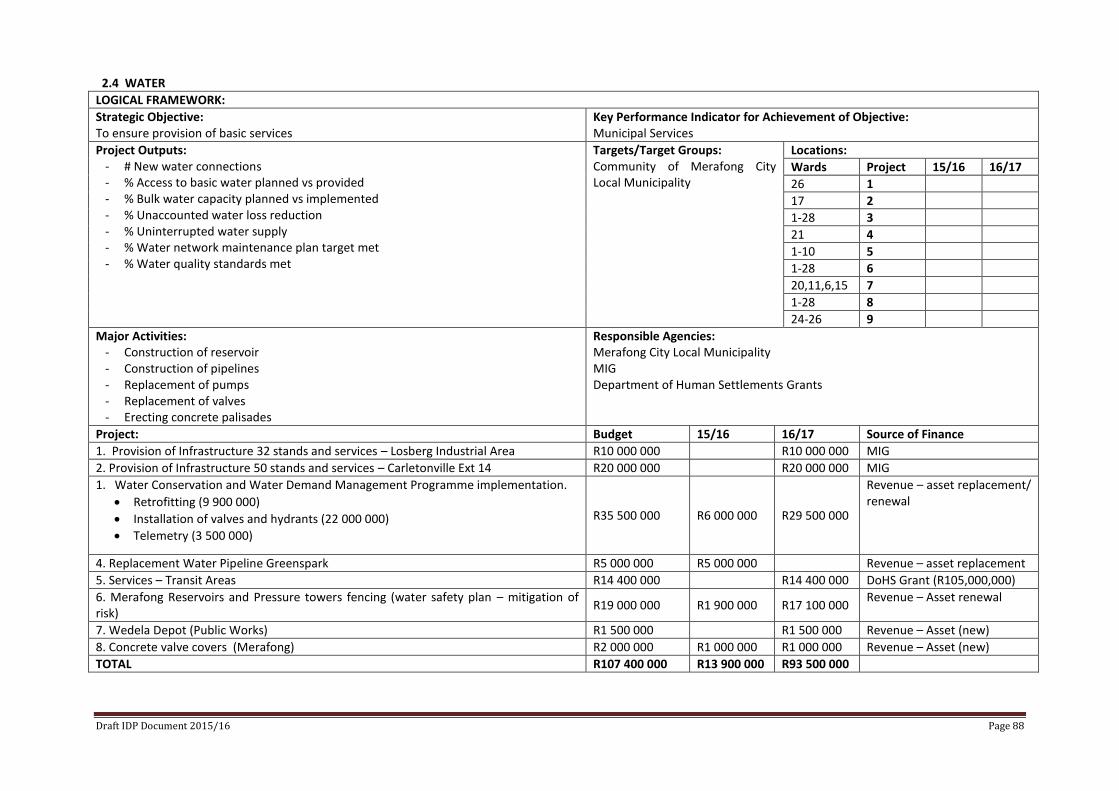
Draft IDP Document 2015/16 Page 88
2.4 WATER
LOGICAL FRAMEWORK:
Strategic Objective: To ensure provision of basic services
Key Performance Indicator for Achievement of Objective: Municipal Services
Project Outputs: - # New water connections - % Access to basic water planned vs provided - % Bulk water capacity planned vs implemented - % Unaccounted water loss reduction - % Uninterrupted water supply - % Water network maintenance plan target met - % Water quality standards met
Targets/Target Groups: Community of Merafong City Local Municipality
Locations:
Wards Project 15/16 16/17
26 1
17 2
1-28 3
21 4
1-10 5
1-28 6
20,11,6,15 7
1-28 8
24-26 9
Major Activities: - Construction of reservoir - Construction of pipelines - Replacement of pumps - Replacement of valves - Erecting concrete palisades
Responsible Agencies: Merafong City Local Municipality MIG Department of Human Settlements Grants
Project: Budget 15/16 16/17 Source of Finance
1. Provision of Infrastructure 32 stands and services – Losberg Industrial Area R10 000 000 R10 000 000 MIG
2. Provision of Infrastructure 50 stands and services – Carletonville Ext 14 R20 000 000 R20 000 000 MIG
1. Water Conservation and Water Demand Management Programme implementation.
Retrofitting (9 900 000)
Installation of valves and hydrants (22 000 000)
Telemetry (3 500 000)
R35 500 000 R6 000 000 R29 500 000
Revenue – asset replacement/ renewal
4. Replacement Water Pipeline Greenspark R5 000 000 R5 000 000 Revenue – asset replacement
5. Services – Transit Areas R14 400 000 R14 400 000 DoHS Grant (R105,000,000)
6. Merafong Reservoirs and Pressure towers fencing (water safety plan – mitigation of risk)
R19 000 000 R1 900 000 R17 100 000 Revenue – Asset renewal
7. Wedela Depot (Public Works) R1 500 000 R1 500 000 Revenue – Asset (new)
8. Concrete valve covers (Merafong) R2 000 000 R1 000 000 R1 000 000 Revenue – Asset (new)
TOTAL R107 400 000 R13 900 000 R93 500 000
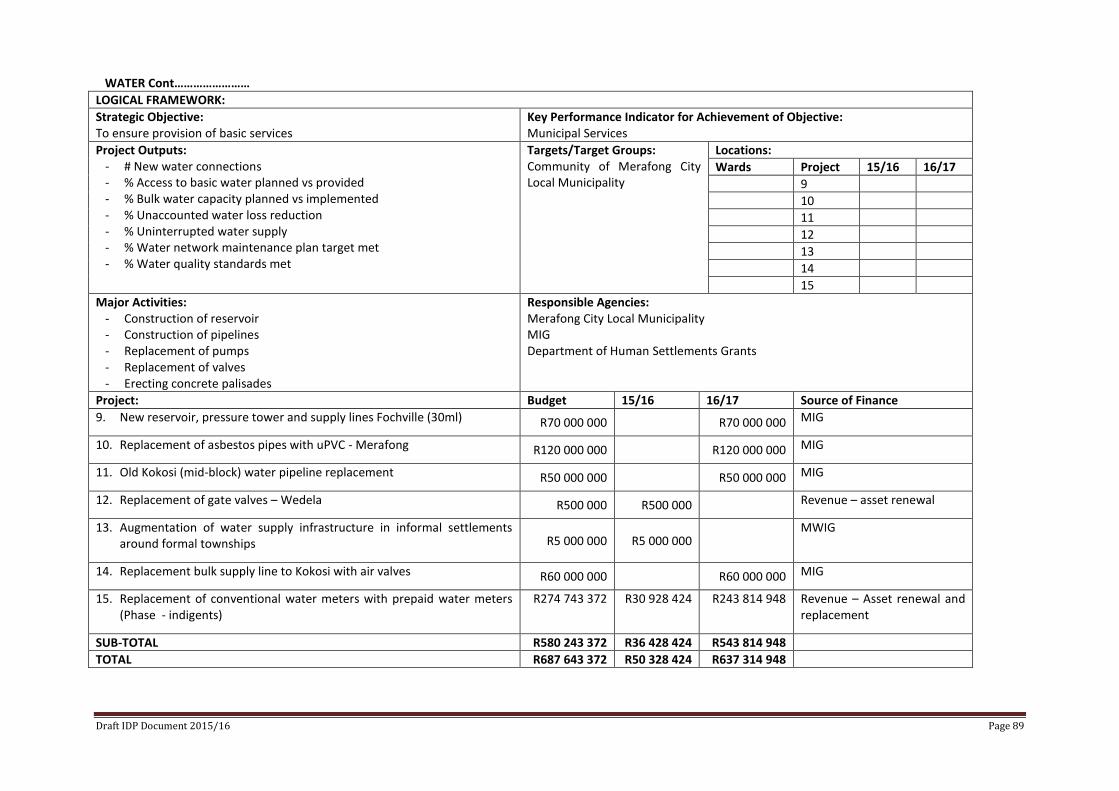
Draft IDP Document 2015/16 Page 89
WATER Cont……………………
LOGICAL FRAMEWORK:
Strategic Objective: To ensure provision of basic services
Key Performance Indicator for Achievement of Objective: Municipal Services
Project Outputs: - # New water connections - % Access to basic water planned vs provided - % Bulk water capacity planned vs implemented - % Unaccounted water loss reduction - % Uninterrupted water supply - % Water network maintenance plan target met - % Water quality standards met
Targets/Target Groups: Community of Merafong City Local Municipality
Locations:
Wards Project 15/16 16/17
9
10
11
12
13
14
15
Major Activities: - Construction of reservoir - Construction of pipelines - Replacement of pumps - Replacement of valves - Erecting concrete palisades
Responsible Agencies: Merafong City Local Municipality MIG Department of Human Settlements Grants
Project: Budget 15/16 16/17 Source of Finance
9. New reservoir, pressure tower and supply lines Fochville (30ml) R70 000 000 R70 000 000 MIG
10. Replacement of asbestos pipes with uPVC - Merafong R120 000 000 R120 000 000 MIG
11. Old Kokosi (mid-block) water pipeline replacement R50 000 000 R50 000 000 MIG
12. Replacement of gate valves – Wedela R500 000 R500 000 Revenue – asset renewal
13. Augmentation of water supply infrastructure in informal settlements around formal townships R5 000 000 R5 000 000
MWIG
14. Replacement bulk supply line to Kokosi with air valves R60 000 000 R60 000 000 MIG
15. Replacement of conventional water meters with prepaid water meters (Phase - indigents)
R274 743 372 R30 928 424 R243 814 948 Revenue – Asset renewal and replacement
SUB-TOTAL R580 243 372 R36 428 424 R543 814 948
TOTAL R687 643 372 R50 328 424 R637 314 948
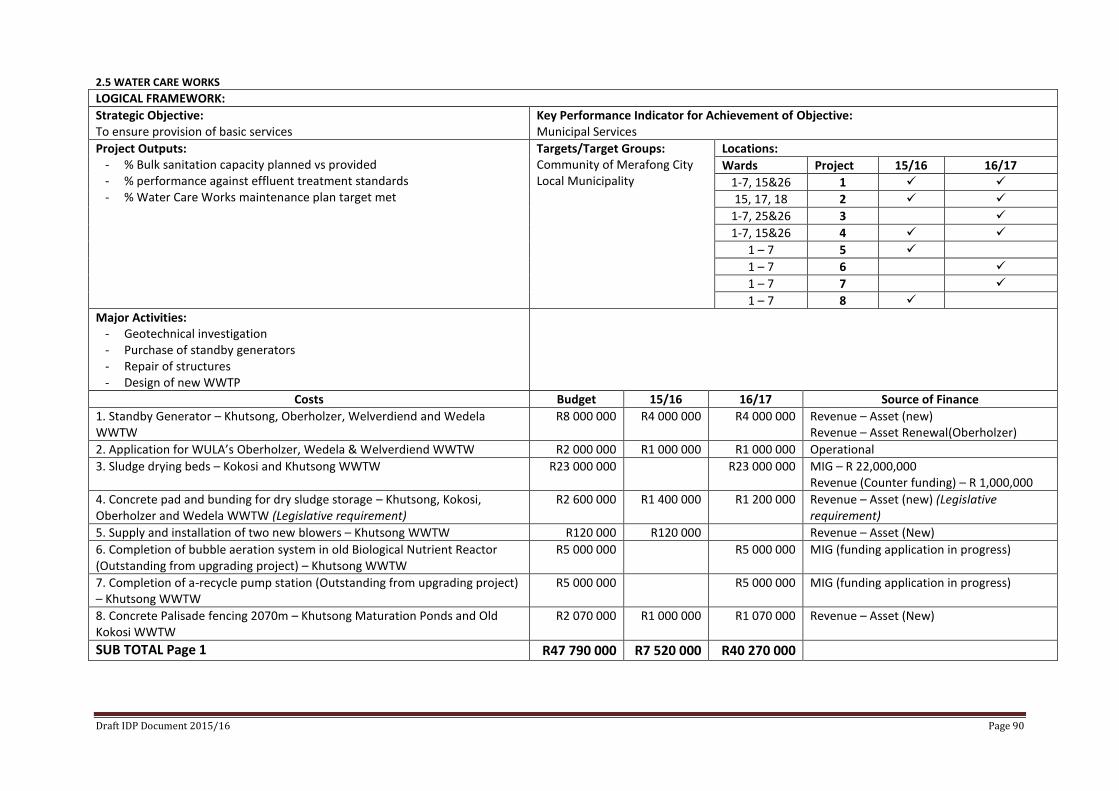
Draft IDP Document 2015/16 Page 90
2.5 WATER CARE WORKS
LOGICAL FRAMEWORK:
Strategic Objective: To ensure provision of basic services
Key Performance Indicator for Achievement of Objective: Municipal Services
Project Outputs: - % Bulk sanitation capacity planned vs provided - % performance against effluent treatment standards - % Water Care Works maintenance plan target met
Targets/Target Groups: Community of Merafong City Local Municipality
Locations:
Wards Project 15/16 16/17
1-7, 15&26 1
15, 17, 18 2
1-7, 25&26 3
1-7, 15&26 4
1 – 7 5
1 – 7 6
1 – 7 7
1 – 7 8
Major Activities: - Geotechnical investigation - Purchase of standby generators - Repair of structures - Design of new WWTP
Costs Budget 15/16 16/17 Source of Finance
1. Standby Generator – Khutsong, Oberholzer, Welverdiend and Wedela WWTW
R8 000 000 R4 000 000 R4 000 000 Revenue – Asset (new) Revenue – Asset Renewal(Oberholzer)
2. Application for WULA’s Oberholzer, Wedela & Welverdiend WWTW R2 000 000 R1 000 000 R1 000 000 Operational
3. Sludge drying beds – Kokosi and Khutsong WWTW R23 000 000 R23 000 000 MIG – R 22,000,000 Revenue (Counter funding) – R 1,000,000
4. Concrete pad and bunding for dry sludge storage – Khutsong, Kokosi, Oberholzer and Wedela WWTW (Legislative requirement)
R2 600 000 R1 400 000 R1 200 000 Revenue – Asset (new) (Legislative requirement)
5. Supply and installation of two new blowers – Khutsong WWTW R120 000 R120 000 Revenue – Asset (New)
6. Completion of bubble aeration system in old Biological Nutrient Reactor (Outstanding from upgrading project) – Khutsong WWTW
R5 000 000 R5 000 000 MIG (funding application in progress)
7. Completion of a-recycle pump station (Outstanding from upgrading project) – Khutsong WWTW
R5 000 000 R5 000 000 MIG (funding application in progress)
8. Concrete Palisade fencing 2070m – Khutsong Maturation Ponds and Old Kokosi WWTW
R2 070 000 R1 000 000 R1 070 000 Revenue – Asset (New)
SUB TOTAL Page 1 R47 790 000 R7 520 000 R40 270 000
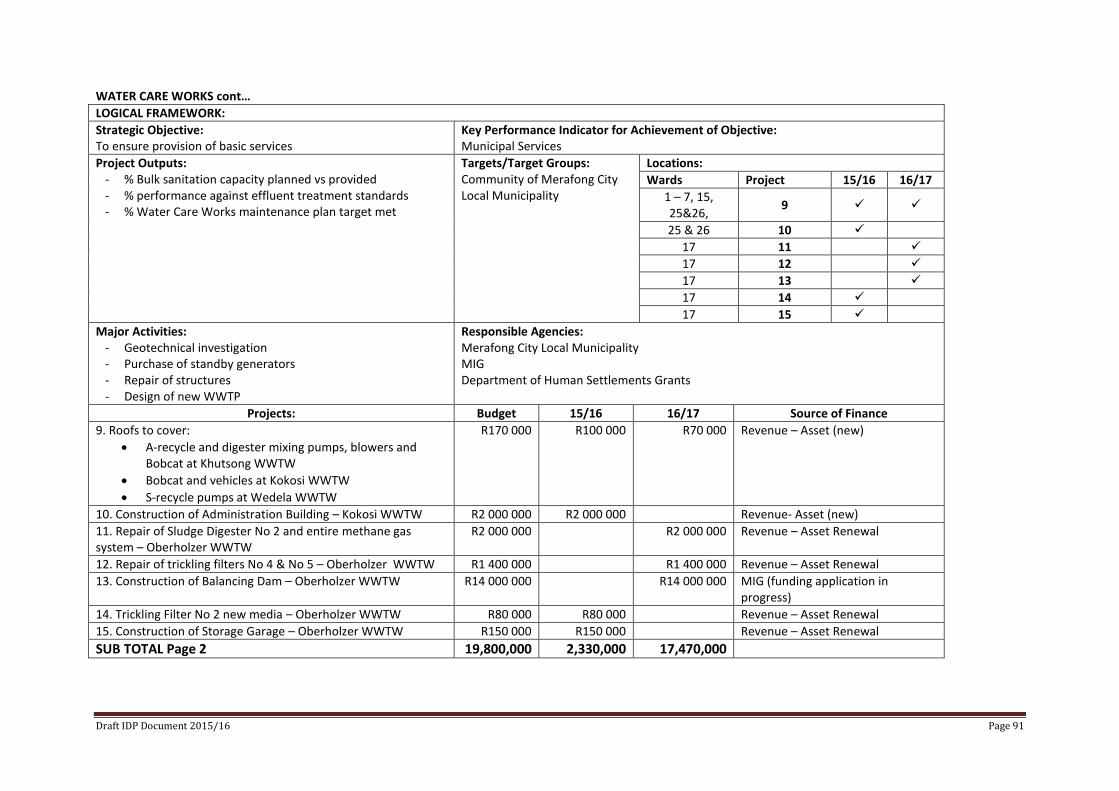
Draft IDP Document 2015/16 Page 91
WATER CARE WORKS cont…
LOGICAL FRAMEWORK:
Strategic Objective: To ensure provision of basic services
Key Performance Indicator for Achievement of Objective: Municipal Services
Project Outputs: - % Bulk sanitation capacity planned vs provided - % performance against effluent treatment standards - % Water Care Works maintenance plan target met
Targets/Target Groups: Community of Merafong City Local Municipality
Locations:
Wards Project 15/16 16/17
1 – 7, 15, 25&26,
9
25 & 26 10
17 11
17 12
17 13
17 14
17 15
Major Activities: - Geotechnical investigation - Purchase of standby generators - Repair of structures - Design of new WWTP
Responsible Agencies: Merafong City Local Municipality MIG Department of Human Settlements Grants
Projects: Budget 15/16 16/17 Source of Finance
9. Roofs to cover:
A-recycle and digester mixing pumps, blowers and Bobcat at Khutsong WWTW
Bobcat and vehicles at Kokosi WWTW
S-recycle pumps at Wedela WWTW
R170 000 R100 000 R70 000 Revenue – Asset (new)
10. Construction of Administration Building – Kokosi WWTW R2 000 000 R2 000 000 Revenue- Asset (new)
11. Repair of Sludge Digester No 2 and entire methane gas system – Oberholzer WWTW
R2 000 000 R2 000 000 Revenue – Asset Renewal
12. Repair of trickling filters No 4 & No 5 – Oberholzer WWTW R1 400 000 R1 400 000 Revenue – Asset Renewal
13. Construction of Balancing Dam – Oberholzer WWTW R14 000 000 R14 000 000 MIG (funding application in progress)
14. Trickling Filter No 2 new media – Oberholzer WWTW R80 000 R80 000 Revenue – Asset Renewal
15. Construction of Storage Garage – Oberholzer WWTW R150 000 R150 000 Revenue – Asset Renewal
SUB TOTAL Page 2 19,800,000 2,330,000 17,470,000
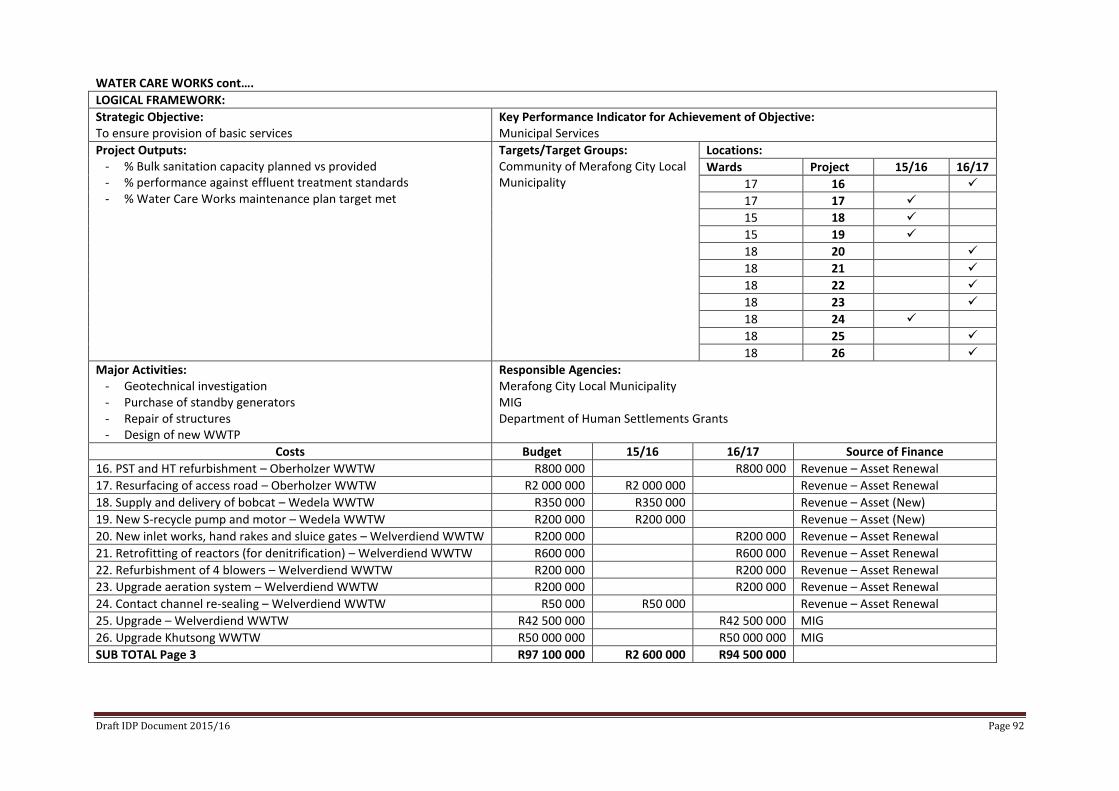
Draft IDP Document 2015/16 Page 92
WATER CARE WORKS cont….
LOGICAL FRAMEWORK:
Strategic Objective: To ensure provision of basic services
Key Performance Indicator for Achievement of Objective: Municipal Services
Project Outputs: - % Bulk sanitation capacity planned vs provided - % performance against effluent treatment standards - % Water Care Works maintenance plan target met
Targets/Target Groups: Community of Merafong City Local Municipality
Locations:
Wards Project 15/16 16/17
17 16
17 17
15 18
15 19
18 20
18 21
18 22
18 23
18 24
18 25
18 26
Major Activities: - Geotechnical investigation - Purchase of standby generators - Repair of structures - Design of new WWTP
Responsible Agencies: Merafong City Local Municipality MIG Department of Human Settlements Grants
Costs Budget 15/16 16/17 Source of Finance
16. PST and HT refurbishment – Oberholzer WWTW R800 000 R800 000 Revenue – Asset Renewal
17. Resurfacing of access road – Oberholzer WWTW R2 000 000 R2 000 000 Revenue – Asset Renewal
18. Supply and delivery of bobcat – Wedela WWTW R350 000 R350 000 Revenue – Asset (New)
19. New S-recycle pump and motor – Wedela WWTW R200 000 R200 000 Revenue – Asset (New)
20. New inlet works, hand rakes and sluice gates – Welverdiend WWTW R200 000 R200 000 Revenue – Asset Renewal
21. Retrofitting of reactors (for denitrification) – Welverdiend WWTW R600 000 R600 000 Revenue – Asset Renewal
22. Refurbishment of 4 blowers – Welverdiend WWTW R200 000 R200 000 Revenue – Asset Renewal
23. Upgrade aeration system – Welverdiend WWTW R200 000 R200 000 Revenue – Asset Renewal
24. Contact channel re-sealing – Welverdiend WWTW R50 000 R50 000 Revenue – Asset Renewal
25. Upgrade – Welverdiend WWTW R42 500 000 R42 500 000 MIG
26. Upgrade Khutsong WWTW R50 000 000 R50 000 000 MIG
SUB TOTAL Page 3 R97 100 000 R2 600 000 R94 500 000
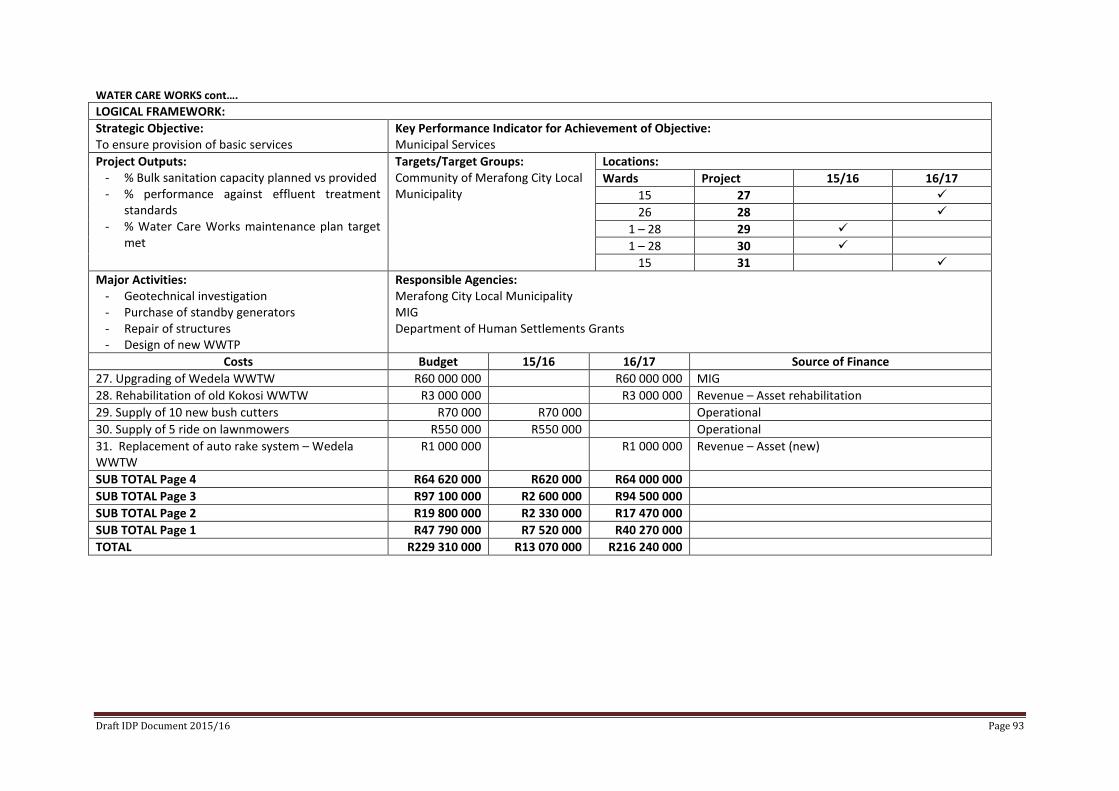
Draft IDP Document 2015/16 Page 93
WATER CARE WORKS cont….
LOGICAL FRAMEWORK:
Strategic Objective: To ensure provision of basic services
Key Performance Indicator for Achievement of Objective: Municipal Services
Project Outputs: - % Bulk sanitation capacity planned vs provided - % performance against effluent treatment
standards - % Water Care Works maintenance plan target
met
Targets/Target Groups: Community of Merafong City Local Municipality
Locations:
Wards Project 15/16 16/17
15 27
26 28
1 – 28 29
1 – 28 30
15 31
Major Activities: - Geotechnical investigation - Purchase of standby generators - Repair of structures - Design of new WWTP
Responsible Agencies: Merafong City Local Municipality MIG Department of Human Settlements Grants
Costs Budget 15/16 16/17 Source of Finance
27. Upgrading of Wedela WWTW R60 000 000 R60 000 000 MIG
28. Rehabilitation of old Kokosi WWTW R3 000 000 R3 000 000 Revenue – Asset rehabilitation
29. Supply of 10 new bush cutters R70 000 R70 000 Operational
30. Supply of 5 ride on lawnmowers R550 000 R550 000 Operational
31. Replacement of auto rake system – Wedela WWTW
R1 000 000 R1 000 000 Revenue – Asset (new)
SUB TOTAL Page 4 R64 620 000 R620 000 R64 000 000
SUB TOTAL Page 3 R97 100 000 R2 600 000 R94 500 000
SUB TOTAL Page 2 R19 800 000 R2 330 000 R17 470 000
SUB TOTAL Page 1 R47 790 000 R7 520 000 R40 270 000
TOTAL R229 310 000 R13 070 000 R216 240 000
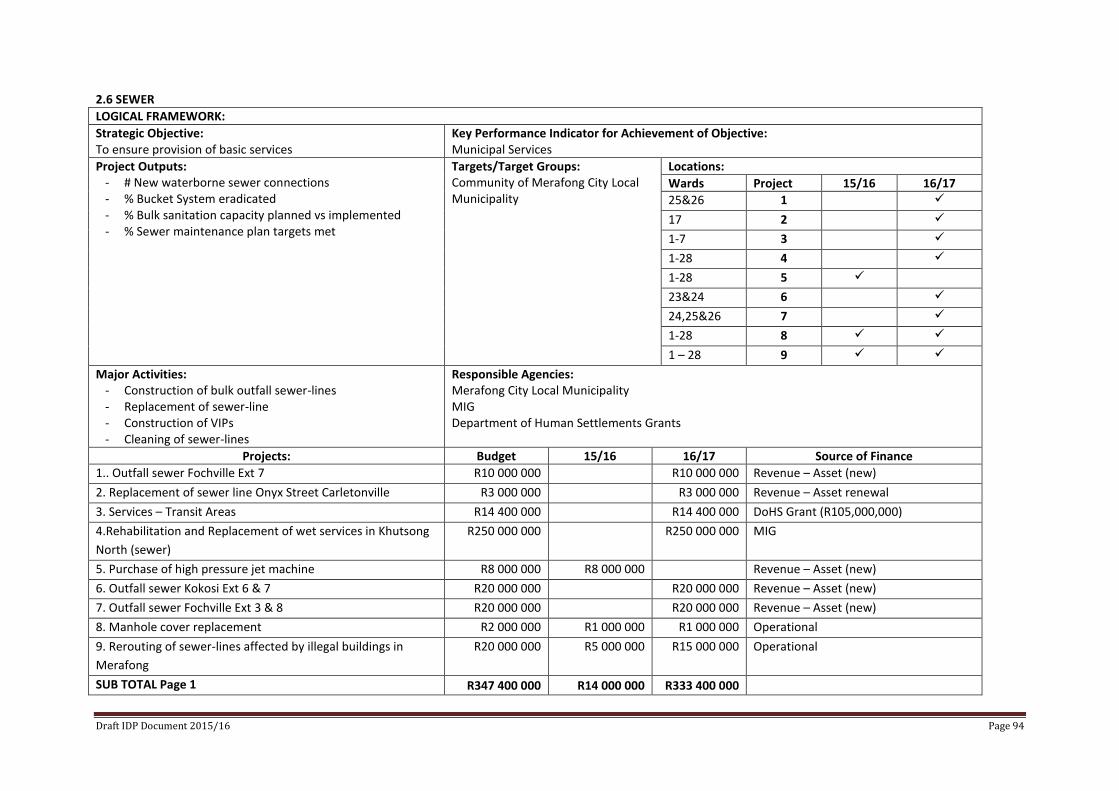
Draft IDP Document 2015/16 Page 94
2.6 SEWER
LOGICAL FRAMEWORK:
Strategic Objective: To ensure provision of basic services
Key Performance Indicator for Achievement of Objective: Municipal Services
Project Outputs: - # New waterborne sewer connections - % Bucket System eradicated - % Bulk sanitation capacity planned vs implemented - % Sewer maintenance plan targets met
Targets/Target Groups: Community of Merafong City Local Municipality
Locations:
Wards Project 15/16 16/17
25&26 1
17 2
1-7 3
1-28 4
1-28 5
23&24 6
24,25&26 7
1-28 8
1 – 28 9
Major Activities: - Construction of bulk outfall sewer-lines - Replacement of sewer-line - Construction of VIPs - Cleaning of sewer-lines
Responsible Agencies: Merafong City Local Municipality MIG Department of Human Settlements Grants
Projects: Budget 15/16 16/17 Source of Finance
1.. Outfall sewer Fochville Ext 7 R10 000 000 R10 000 000 Revenue – Asset (new)
2. Replacement of sewer line Onyx Street Carletonville R3 000 000 R3 000 000 Revenue – Asset renewal
3. Services – Transit Areas R14 400 000 R14 400 000 DoHS Grant (R105,000,000)
4.Rehabilitation and Replacement of wet services in Khutsong
North (sewer)
R250 000 000 R250 000 000 MIG
5. Purchase of high pressure jet machine R8 000 000 R8 000 000 Revenue – Asset (new)
6. Outfall sewer Kokosi Ext 6 & 7 R20 000 000 R20 000 000 Revenue – Asset (new)
7. Outfall sewer Fochville Ext 3 & 8 R20 000 000 R20 000 000 Revenue – Asset (new)
8. Manhole cover replacement R2 000 000 R1 000 000 R1 000 000 Operational
9. Rerouting of sewer-lines affected by illegal buildings in
Merafong
R20 000 000 R5 000 000 R15 000 000 Operational
SUB TOTAL Page 1 R347 400 000 R14 000 000 R333 400 000
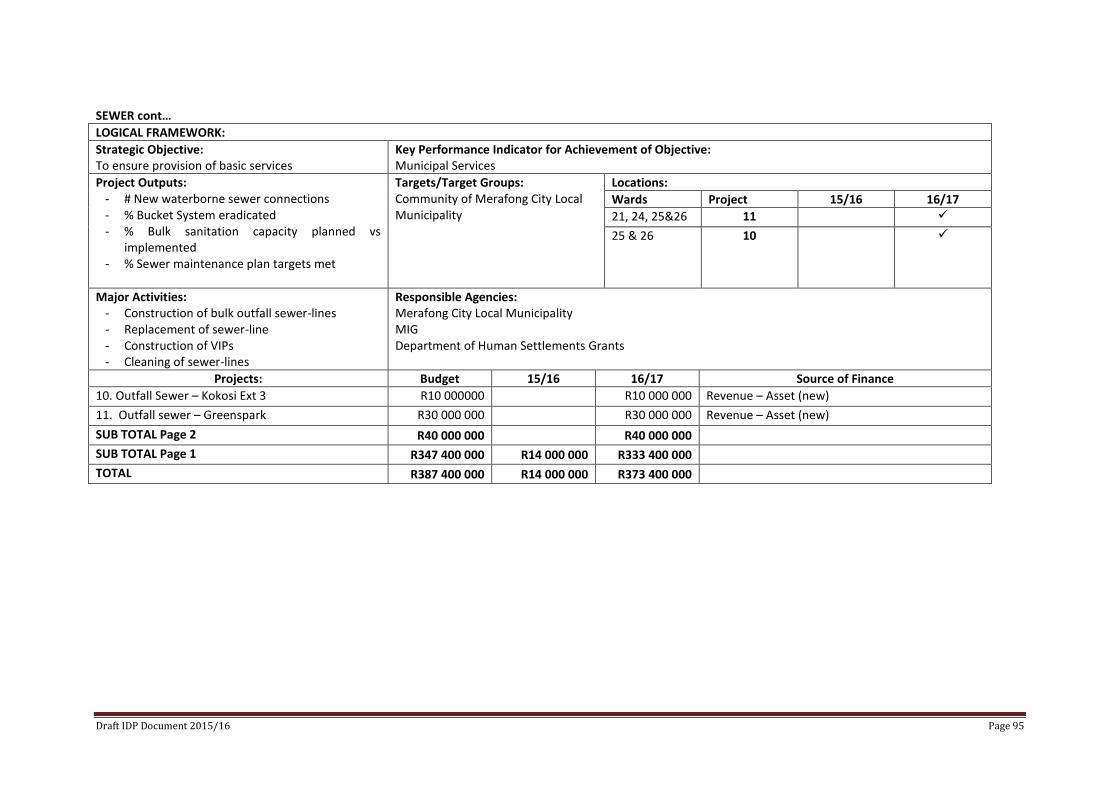
Draft IDP Document 2015/16 Page 95
SEWER cont…
LOGICAL FRAMEWORK:
Strategic Objective: To ensure provision of basic services
Key Performance Indicator for Achievement of Objective: Municipal Services
Project Outputs: - # New waterborne sewer connections - % Bucket System eradicated - % Bulk sanitation capacity planned vs
implemented - % Sewer maintenance plan targets met
Targets/Target Groups: Community of Merafong City Local Municipality
Locations:
Wards Project 15/16 16/17
21, 24, 25&26 11
25 & 26 10
Major Activities: - Construction of bulk outfall sewer-lines - Replacement of sewer-line - Construction of VIPs - Cleaning of sewer-lines
Responsible Agencies: Merafong City Local Municipality MIG Department of Human Settlements Grants
Projects: Budget 15/16 16/17 Source of Finance
10. Outfall Sewer – Kokosi Ext 3 R10 000000 R10 000 000 Revenue – Asset (new)
11. Outfall sewer – Greenspark R30 000 000 R30 000 000 Revenue – Asset (new)
SUB TOTAL Page 2 R40 000 000 R40 000 000
SUB TOTAL Page 1 R347 400 000 R14 000 000 R333 400 000
TOTAL R387 400 000 R14 000 000 R373 400 000
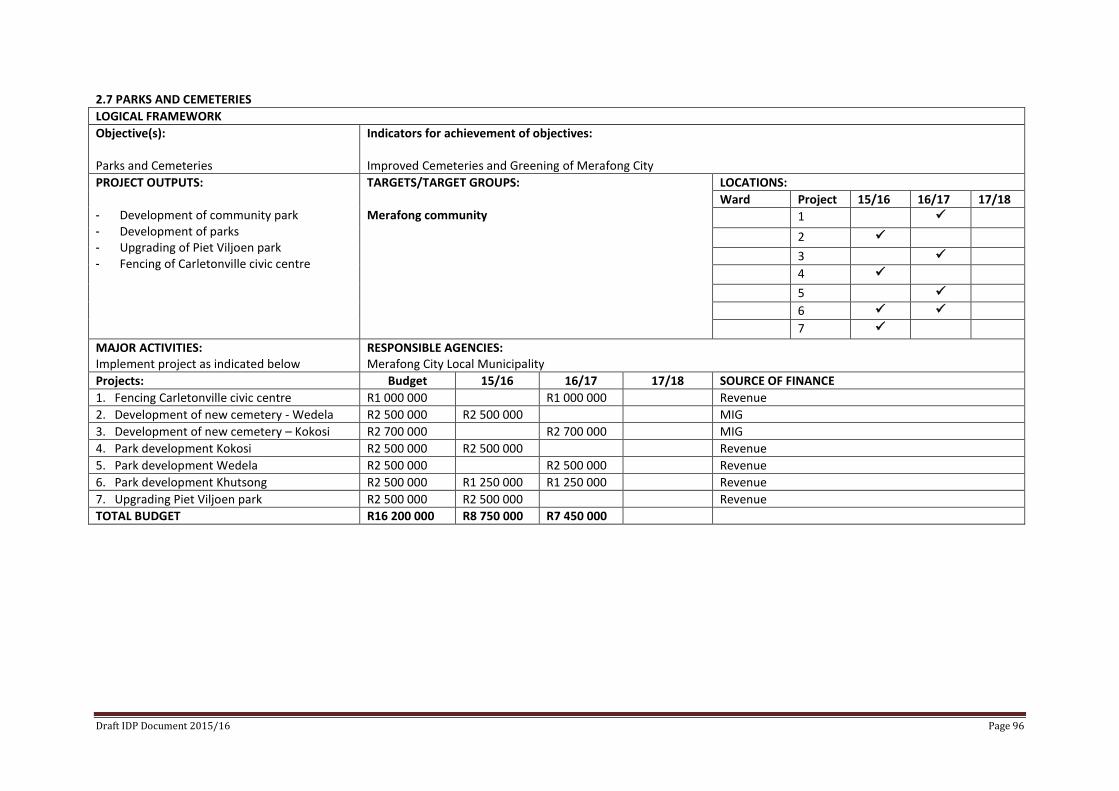
Draft IDP Document 2015/16 Page 96
2.7 PARKS AND CEMETERIES
LOGICAL FRAMEWORK
Objective(s): Parks and Cemeteries
Indicators for achievement of objectives: Improved Cemeteries and Greening of Merafong City
PROJECT OUTPUTS: - Development of community park - Development of parks - Upgrading of Piet Viljoen park - Fencing of Carletonville civic centre
TARGETS/TARGET GROUPS: Merafong community
LOCATIONS:
Ward Project 15/16 16/17 17/18
1
2
3
4
5
6
7
MAJOR ACTIVITIES: Implement project as indicated below
RESPONSIBLE AGENCIES: Merafong City Local Municipality
Projects: Budget 15/16 16/17 17/18 SOURCE OF FINANCE
1. Fencing Carletonville civic centre R1 000 000 R1 000 000 Revenue
2. Development of new cemetery - Wedela R2 500 000 R2 500 000 MIG
3. Development of new cemetery – Kokosi R2 700 000 R2 700 000 MIG
4. Park development Kokosi R2 500 000 R2 500 000 Revenue
5. Park development Wedela R2 500 000 R2 500 000 Revenue
6. Park development Khutsong R2 500 000 R1 250 000 R1 250 000 Revenue
7. Upgrading Piet Viljoen park R2 500 000 R2 500 000 Revenue
TOTAL BUDGET R16 200 000 R8 750 000 R7 450 000
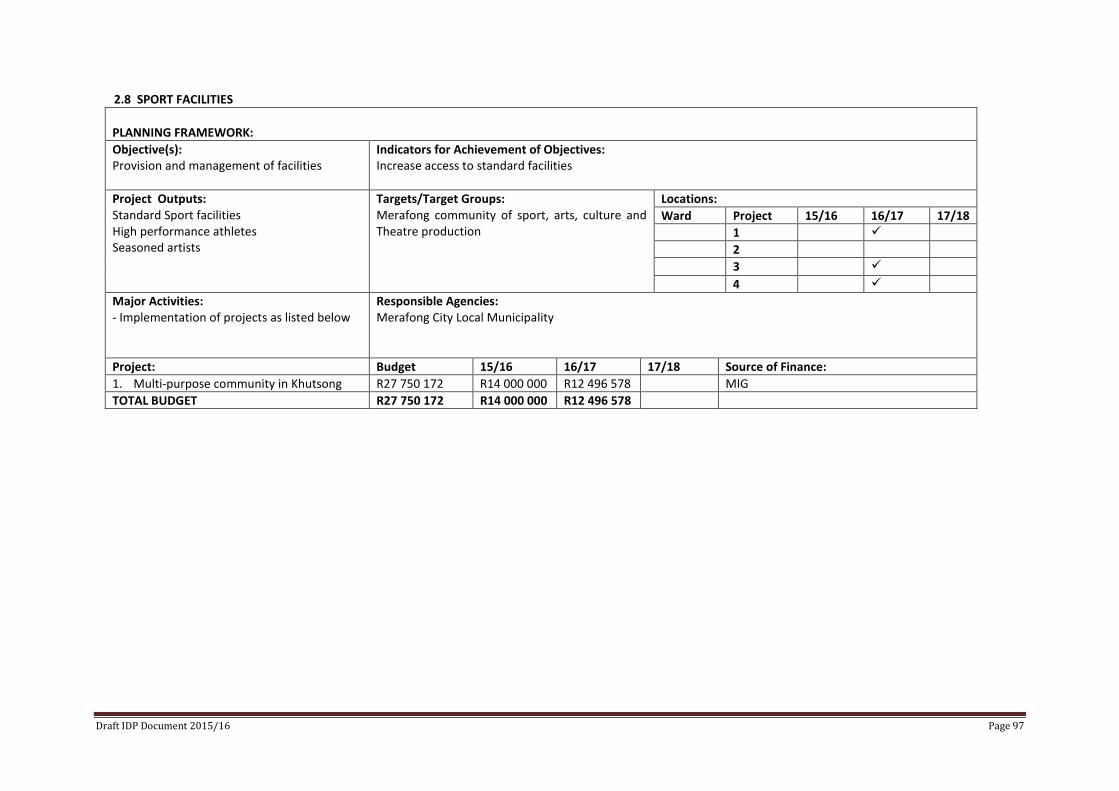
Draft IDP Document 2015/16 Page 97
2.8 SPORT FACILITIES
PLANNING FRAMEWORK:
Objective(s): Provision and management of facilities
Indicators for Achievement of Objectives: Increase access to standard facilities
Project Outputs: Standard Sport facilities High performance athletes Seasoned artists
Targets/Target Groups: Merafong community of sport, arts, culture and Theatre production
Locations:
Ward Project 15/16 16/17 17/18
1
2
3
4
Major Activities: - Implementation of projects as listed below
Responsible Agencies: Merafong City Local Municipality
Project: Budget 15/16 16/17 17/18 Source of Finance:
1. Multi-purpose community in Khutsong R27 750 172 R14 000 000 R12 496 578 MIG
TOTAL BUDGET R27 750 172 R14 000 000 R12 496 578
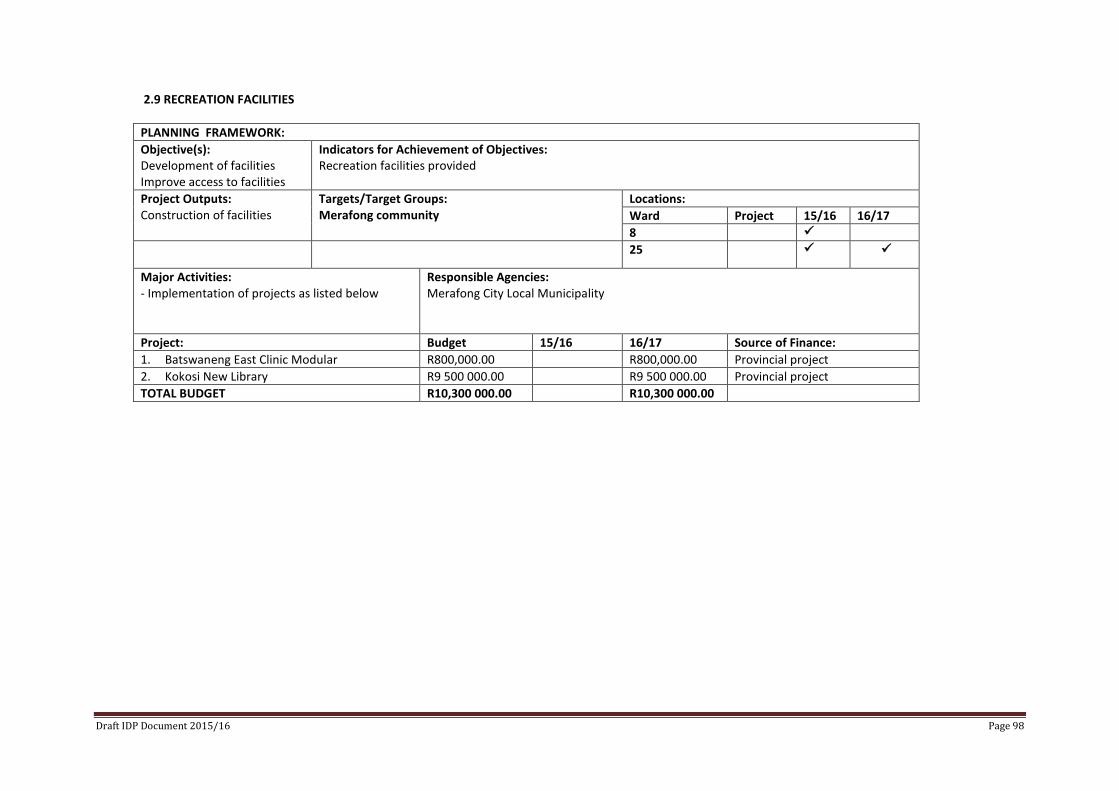
Draft IDP Document 2015/16 Page 98
2.9 RECREATION FACILITIES
PLANNING FRAMEWORK:
Objective(s): Development of facilities Improve access to facilities
Indicators for Achievement of Objectives: Recreation facilities provided
Project Outputs: Construction of facilities
Targets/Target Groups: Merafong community
Locations:
Ward Project 15/16 16/17
8
25
Major Activities: - Implementation of projects as listed below
Responsible Agencies: Merafong City Local Municipality
Project: Budget 15/16 16/17 Source of Finance:
1. Batswaneng East Clinic Modular R800,000.00 R800,000.00 Provincial project
2. Kokosi New Library R9 500 000.00 R9 500 000.00 Provincial project
TOTAL BUDGET R10,300 000.00 R10,300 000.00
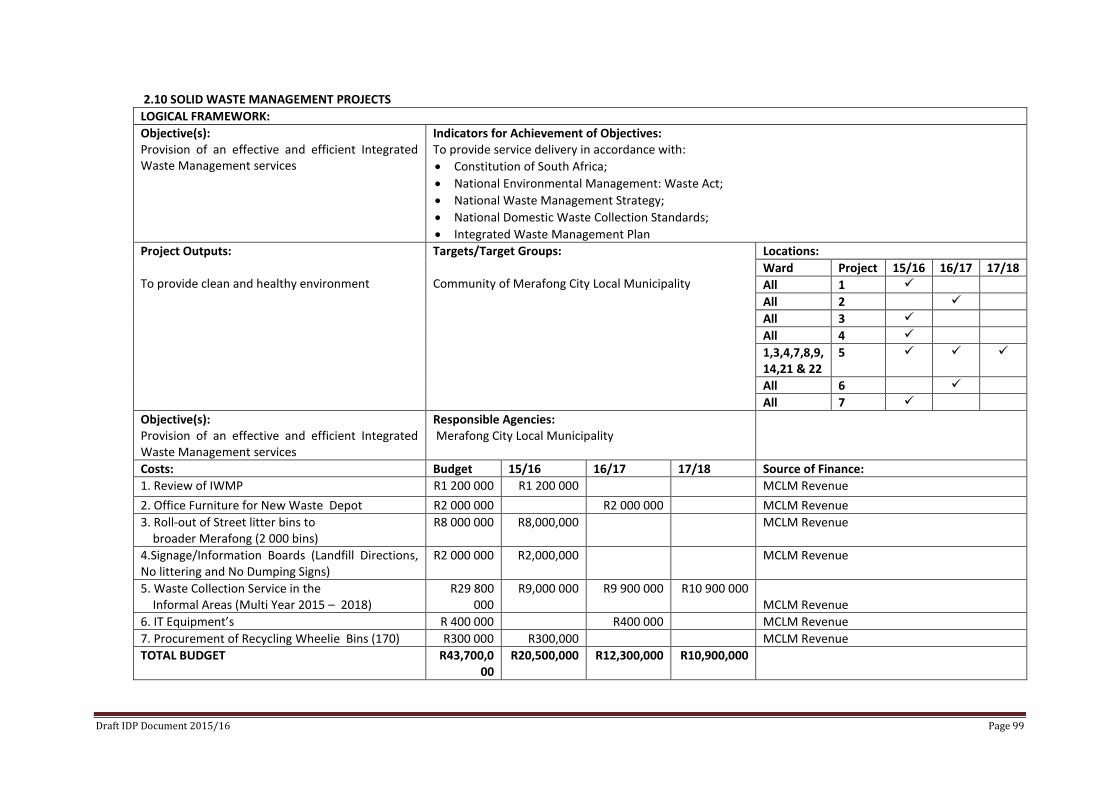
Draft IDP Document 2015/16 Page 99
2.10 SOLID WASTE MANAGEMENT PROJECTS
LOGICAL FRAMEWORK:
Objective(s): Provision of an effective and efficient Integrated Waste Management services
Indicators for Achievement of Objectives: To provide service delivery in accordance with:
Constitution of South Africa;
National Environmental Management: Waste Act;
National Waste Management Strategy;
National Domestic Waste Collection Standards;
Integrated Waste Management Plan
Project Outputs: To provide clean and healthy environment
Targets/Target Groups: Community of Merafong City Local Municipality
Locations:
Ward Project 15/16 16/17 17/18
All 1
All 2
All 3
All 4
1,3,4,7,8,9, 14,21 & 22
5
All 6
All 7
Objective(s): Provision of an effective and efficient Integrated Waste Management services
Responsible Agencies: Merafong City Local Municipality
Costs: Budget 15/16 16/17 17/18 Source of Finance:
1. Review of IWMP R1 200 000 R1 200 000 MCLM Revenue
2. Office Furniture for New Waste Depot R2 000 000 R2 000 000 MCLM Revenue
3. Roll-out of Street litter bins to broader Merafong (2 000 bins)
R8 000 000 R8,000,000 MCLM Revenue
4.Signage/Information Boards (Landfill Directions, No littering and No Dumping Signs)
R2 000 000 R2,000,000 MCLM Revenue
5. Waste Collection Service in the Informal Areas (Multi Year 2015 – 2018)
R29 800 000
R9,000 000 R9 900 000 R10 900 000 MCLM Revenue
6. IT Equipment’s R 400 000 R400 000 MCLM Revenue
7. Procurement of Recycling Wheelie Bins (170) R300 000 R300,000 MCLM Revenue
TOTAL BUDGET R43,700,000
R20,500,000 R12,300,000 R10,900,000
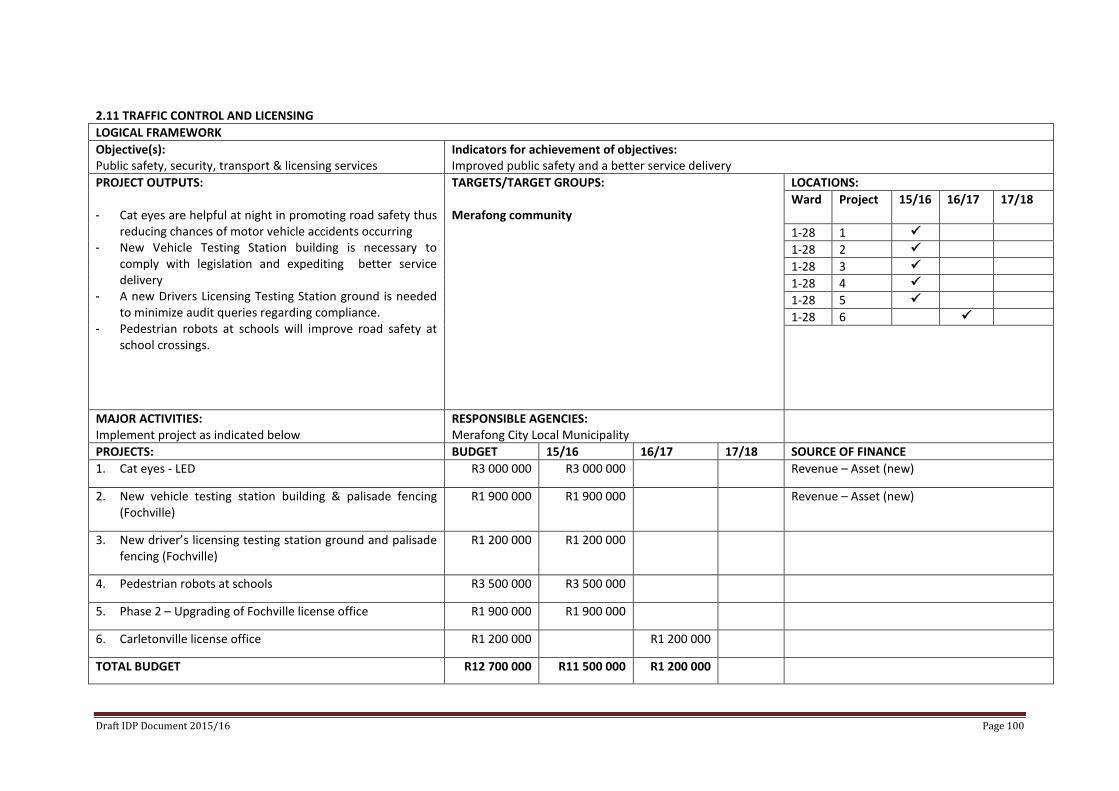
Draft IDP Document 2015/16 Page 100
2.11 TRAFFIC CONTROL AND LICENSING
LOGICAL FRAMEWORK
Objective(s): Public safety, security, transport & licensing services
Indicators for achievement of objectives: Improved public safety and a better service delivery
PROJECT OUTPUTS: - Cat eyes are helpful at night in promoting road safety thus
reducing chances of motor vehicle accidents occurring - New Vehicle Testing Station building is necessary to
comply with legislation and expediting better service delivery
- A new Drivers Licensing Testing Station ground is needed to minimize audit queries regarding compliance.
- Pedestrian robots at schools will improve road safety at school crossings.
TARGETS/TARGET GROUPS: Merafong community
LOCATIONS:
Ward Project
15/16 16/17 17/18
1-28 1
1-28 2
1-28 3
1-28 4
1-28 5
1-28 6
MAJOR ACTIVITIES: Implement project as indicated below
RESPONSIBLE AGENCIES: Merafong City Local Municipality
PROJECTS: BUDGET 15/16 16/17 17/18 SOURCE OF FINANCE
1. Cat eyes - LED R3 000 000 R3 000 000 Revenue – Asset (new)
2. New vehicle testing station building & palisade fencing (Fochville)
R1 900 000 R1 900 000 Revenue – Asset (new)
3. New driver’s licensing testing station ground and palisade fencing (Fochville)
R1 200 000 R1 200 000
4. Pedestrian robots at schools R3 500 000 R3 500 000
5. Phase 2 – Upgrading of Fochville license office R1 900 000 R1 900 000
6. Carletonville license office R1 200 000 R1 200 000
TOTAL BUDGET R12 700 000 R11 500 000 R1 200 000

Draft IDP Document 2015/16 Page 101
2.12 EMPLOYMENT EQUITY AND OCCUPATIONAL HEALTH AND SAFETY
LOGICAL FRAMEWORK:
Objective(s): Medical examination of all employees (cleansing, water, sanitation, civil engineering, and public works) is done according the Occupational Health and Safety Act No. 85 of 1993.
Indicators for Achievement of Objectives: To ensure that the health and safety of employees is protected through frequent medical examination.
Project Outputs:
Safe working environment
Targets/Target Groups: Merafong employees
Locations:
Project 15/16 16/17 17/18
1 2
Objective(s): Ensuring that Health and Safety regulations are practiced by all departments.
Responsible Agencies: Merafong City Local Municipality
Projects: Budget 15/16 16/17 17/18 Source of Finance:
1. Medical Examination R1 220 000 R380 000 R390 000 R450 000 MCLM Revenue
2. Replacements of fire extinguishers (All municipal buildings)
R337 360 R100 000 R112 360 R125 000 MCLM Revenue
TOTAL BUDGET R1 557 360 R480 000 R502 360 R575 000
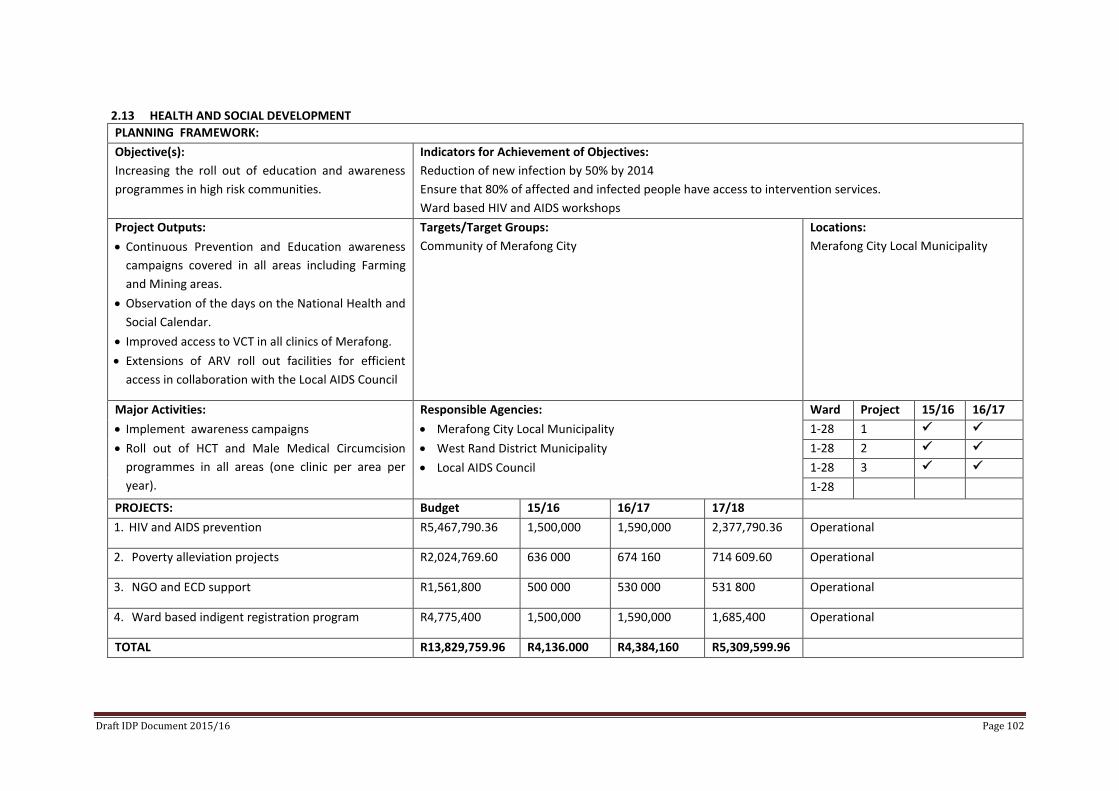
Draft IDP Document 2015/16 Page 102
2.13 HEALTH AND SOCIAL DEVELOPMENT
PLANNING FRAMEWORK:
Objective(s):
Increasing the roll out of education and awareness
programmes in high risk communities.
Indicators for Achievement of Objectives:
Reduction of new infection by 50% by 2014
Ensure that 80% of affected and infected people have access to intervention services.
Ward based HIV and AIDS workshops
Project Outputs:
Continuous Prevention and Education awareness
campaigns covered in all areas including Farming
and Mining areas.
Observation of the days on the National Health and
Social Calendar.
Improved access to VCT in all clinics of Merafong.
Extensions of ARV roll out facilities for efficient
access in collaboration with the Local AIDS Council
Targets/Target Groups:
Community of Merafong City
Locations:
Merafong City Local Municipality
Major Activities:
Implement awareness campaigns
Roll out of HCT and Male Medical Circumcision
programmes in all areas (one clinic per area per
year).
Responsible Agencies:
Merafong City Local Municipality
West Rand District Municipality
Local AIDS Council
Ward Project 15/16 16/17
1-28 1
1-28 2
1-28 3
1-28 PROJECTS: Budget 15/16 16/17 17/18
1. HIV and AIDS prevention R5,467,790.36 1,500,000 1,590,000 2,377,790.36 Operational
2. Poverty alleviation projects R2,024,769.60 636 000 674 160 714 609.60 Operational
3. NGO and ECD support R1,561,800 500 000 530 000 531 800 Operational
4. Ward based indigent registration program R4,775,400 1,500,000 1,590,000 1,685,400 Operational
TOTAL R13,829,759.96 R4,136.000 R4,384,160 R5,309,599.96
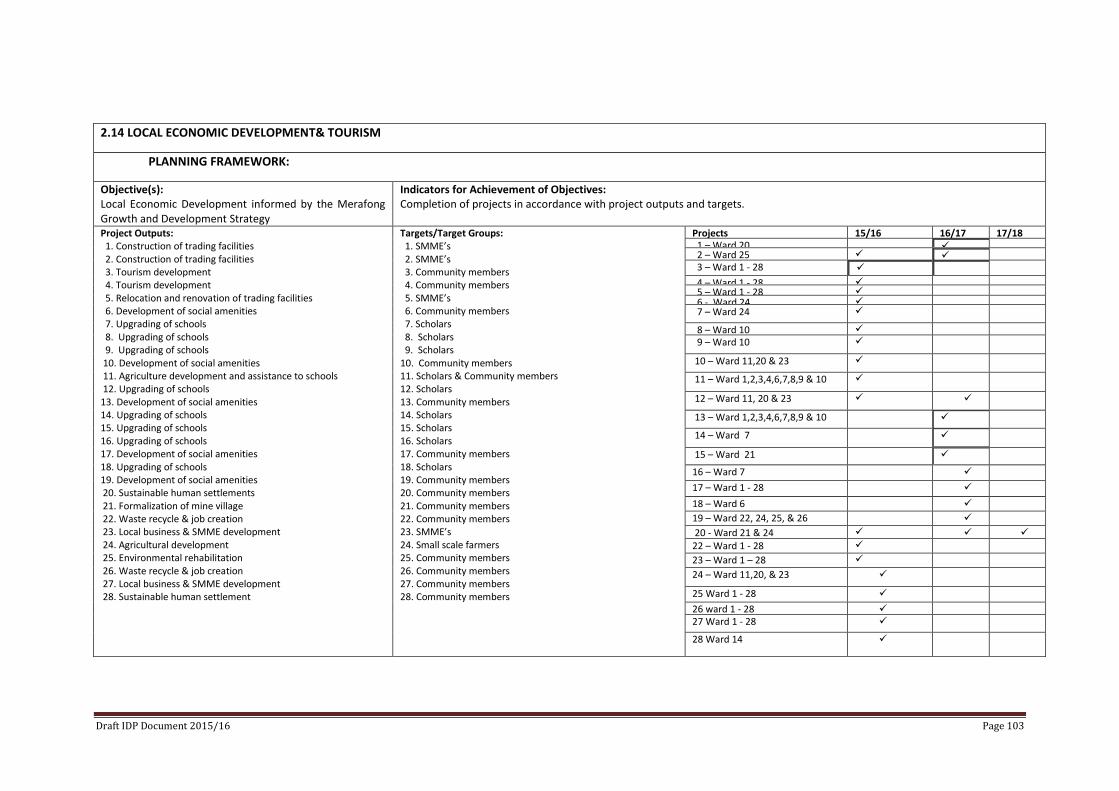
Draft IDP Document 2015/16 Page 103
2.14 LOCAL ECONOMIC DEVELOPMENT& TOURISM
PLANNING FRAMEWORK:
Objective(s): Local Economic Development informed by the Merafong Growth and Development Strategy
Indicators for Achievement of Objectives: Completion of projects in accordance with project outputs and targets.
Project Outputs: 1. Construction of trading facilities 2. Construction of trading facilities 3. Tourism development 4. Tourism development 5. Relocation and renovation of trading facilities 6. Development of social amenities 7. Upgrading of schools 8. Upgrading of schools 9. Upgrading of schools 10. Development of social amenities 11. Agriculture development and assistance to schools 12. Upgrading of schools 13. Development of social amenities 14. Upgrading of schools 15. Upgrading of schools 16. Upgrading of schools 17. Development of social amenities 18. Upgrading of schools 19. Development of social amenities 20. Sustainable human settlements 21. Formalization of mine village 22. Waste recycle & job creation 23. Local business & SMME development 24. Agricultural development 25. Environmental rehabilitation 26. Waste recycle & job creation 27. Local business & SMME development 28. Sustainable human settlement
Targets/Target Groups: 1. SMME’s 2. SMME’s 3. Community members 4. Community members 5. SMME’s 6. Community members 7. Scholars 8. Scholars 9. Scholars 10. Community members 11. Scholars & Community members 12. Scholars 13. Community members 14. Scholars 15. Scholars 16. Scholars 17. Community members 18. Scholars 19. Community members 20. Community members 21. Community members 22. Community members 23. SMME’s 24. Small scale farmers 25. Community members 26. Community members 27. Community members 28. Community members
Projects 15/16 16/17 17/18 1 – Ward 20
2 – Ward 25
3 – Ward 1 - 28
4 – Ward 1 - 28 5 – Ward 1 - 28 6 - Ward 24 7 – Ward 24
8 – Ward 10 9 – Ward 10
10 – Ward 11,20 & 23
11 – Ward 1,2,3,4,6,7,8,9 & 10
12 – Ward 11, 20 & 23
13 – Ward 1,2,3,4,6,7,8,9 & 10
14 – Ward 7
15 – Ward 21
16 – Ward 7
17 – Ward 1 - 28
18 – Ward 6
19 – Ward 22, 24, 25, & 26
20 - Ward 21 & 24 22 – Ward 1 - 28
23 – Ward 1 – 28
24 – Ward 11,20, & 23
25 Ward 1 - 28
26 ward 1 - 28 27 Ward 1 - 28
28 Ward 14
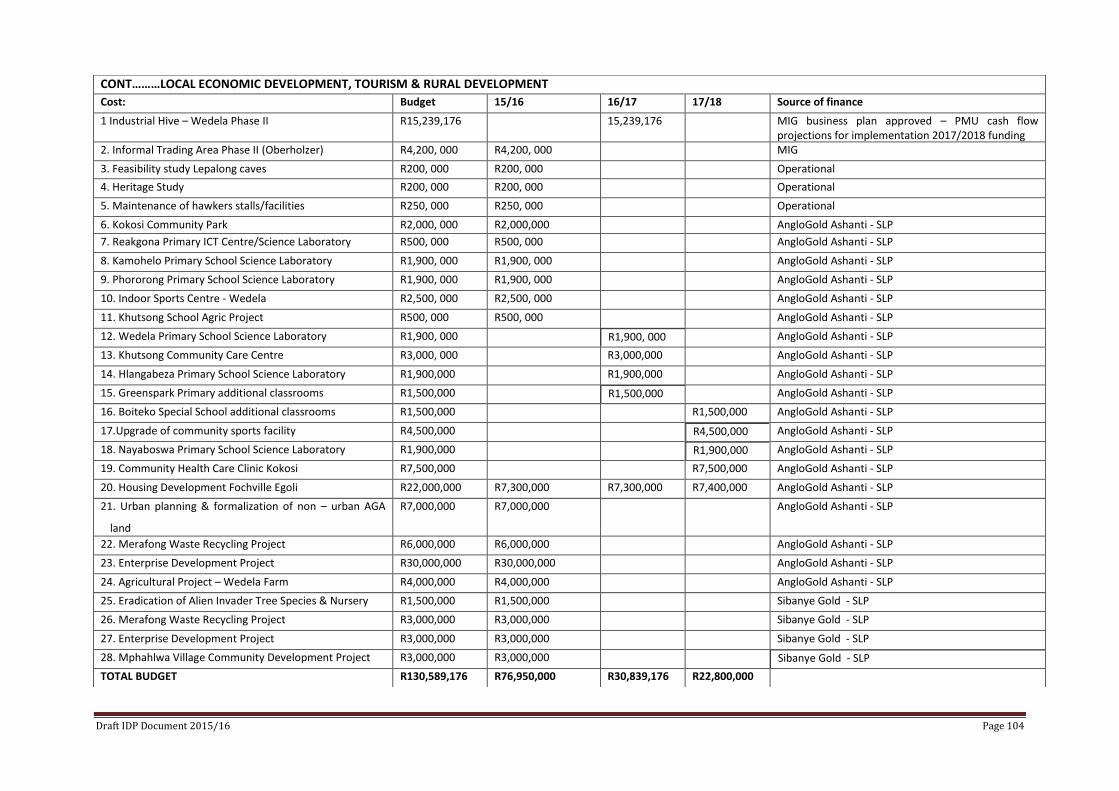
Draft IDP Document 2015/16 Page 104
CONT………LOCAL ECONOMIC DEVELOPMENT, TOURISM & RURAL DEVELOPMENT
Cost: Budget 15/16 16/17 17/18 Source of finance
1 Industrial Hive – Wedela Phase II R15,239,176 15,239,176 MIG business plan approved – PMU cash flow projections for implementation 2017/2018 funding 2. Informal Trading Area Phase II (Oberholzer) R4,200, 000 R4,200, 000 MIG
3. Feasibility study Lepalong caves R200, 000 R200, 000 Operational
4. Heritage Study R200, 000 R200, 000 Operational
5. Maintenance of hawkers stalls/facilities R250, 000 R250, 000 Operational
6. Kokosi Community Park R2,000, 000 R2,000,000 AngloGold Ashanti - SLP
7. Reakgona Primary ICT Centre/Science Laboratory R500, 000 R500, 000 AngloGold Ashanti - SLP
8. Kamohelo Primary School Science Laboratory R1,900, 000 R1,900, 000 AngloGold Ashanti - SLP
9. Phororong Primary School Science Laboratory R1,900, 000 R1,900, 000 AngloGold Ashanti - SLP
10. Indoor Sports Centre - Wedela R2,500, 000 R2,500, 000 AngloGold Ashanti - SLP
11. Khutsong School Agric Project R500, 000 R500, 000 AngloGold Ashanti - SLP
12. Wedela Primary School Science Laboratory R1,900, 000 R1,900, 000
AngloGold Ashanti - SLP
13. Khutsong Community Care Centre R3,000, 000 R3,000,000 AngloGold Ashanti - SLP
14. Hlangabeza Primary School Science Laboratory R1,900,000 R1,900,000 AngloGold Ashanti - SLP
15. Greenspark Primary additional classrooms R1,500,000 R1,500,000
AngloGold Ashanti - SLP
16. Boiteko Special School additional classrooms R1,500,000 R1,500,000 AngloGold Ashanti - SLP
17.Upgrade of community sports facility R4,500,000 R4,500,000
AngloGold Ashanti - SLP
18. Nayaboswa Primary School Science Laboratory R1,900,000 R1,900,000
AngloGold Ashanti - SLP
19. Community Health Care Clinic Kokosi R7,500,000 R7,500,000 AngloGold Ashanti - SLP
20. Housing Development Fochville Egoli R22,000,000 R7,300,000 R7,300,000 R7,400,000 AngloGold Ashanti - SLP
21. Urban planning & formalization of non – urban AGA
land
& property holdings
R7,000,000 R7,000,000 AngloGold Ashanti - SLP
22. Merafong Waste Recycling Project R6,000,000 R6,000,000 AngloGold Ashanti - SLP
23. Enterprise Development Project R30,000,000 R30,000,000 AngloGold Ashanti - SLP
24. Agricultural Project – Wedela Farm R4,000,000 R4,000,000 AngloGold Ashanti - SLP
25. Eradication of Alien Invader Tree Species & Nursery R1,500,000 R1,500,000 Sibanye Gold - SLP
26. Merafong Waste Recycling Project R3,000,000 R3,000,000 Sibanye Gold - SLP
27. Enterprise Development Project R3,000,000 R3,000,000 Sibanye Gold - SLP
28. Mphahlwa Village Community Development Project R3,000,000 R3,000,000 Sibanye Gold - SLP
TOTAL BUDGET R130,589,176 R76,950,000 R30,839,176 R22,800,000
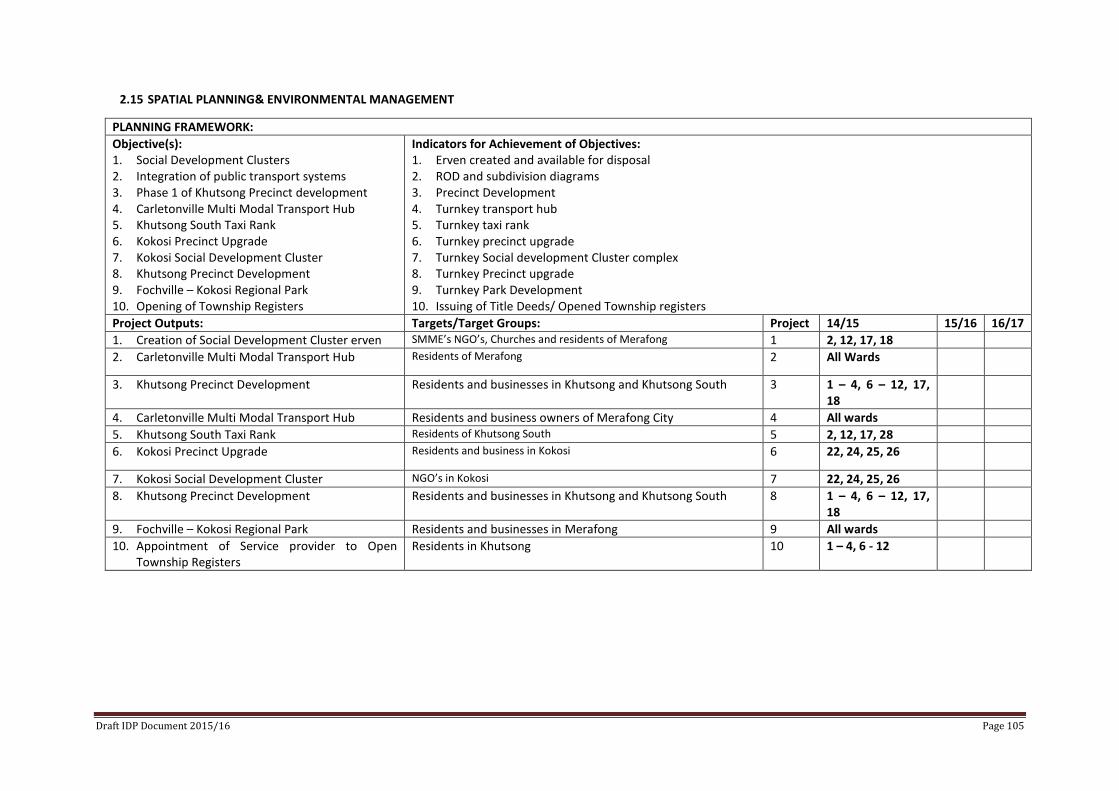
Draft IDP Document 2015/16 Page 105
2.15 SPATIAL PLANNING& ENVIRONMENTAL MANAGEMENT
PLANNING FRAMEWORK:
Objective(s): 1. Social Development Clusters 2. Integration of public transport systems 3. Phase 1 of Khutsong Precinct development 4. Carletonville Multi Modal Transport Hub 5. Khutsong South Taxi Rank 6. Kokosi Precinct Upgrade 7. Kokosi Social Development Cluster 8. Khutsong Precinct Development 9. Fochville – Kokosi Regional Park 10. Opening of Township Registers
Indicators for Achievement of Objectives: 1. Erven created and available for disposal 2. ROD and subdivision diagrams 3. Precinct Development 4. Turnkey transport hub 5. Turnkey taxi rank 6. Turnkey precinct upgrade 7. Turnkey Social development Cluster complex 8. Turnkey Precinct upgrade 9. Turnkey Park Development 10. Issuing of Title Deeds/ Opened Township registers
Project Outputs: Targets/Target Groups: Project 14/15 15/16 16/17
1. Creation of Social Development Cluster erven SMME’s NGO’s, Churches and residents of Merafong 1 2, 12, 17, 18
2. Carletonville Multi Modal Transport Hub Residents of Merafong 2 All Wards
3. Khutsong Precinct Development Residents and businesses in Khutsong and Khutsong South 3 1 – 4, 6 – 12, 17, 18
4. Carletonville Multi Modal Transport Hub Residents and business owners of Merafong City 4 All wards
5. Khutsong South Taxi Rank Residents of Khutsong South 5 2, 12, 17, 28
6. Kokosi Precinct Upgrade Residents and business in Kokosi 6 22, 24, 25, 26
7. Kokosi Social Development Cluster NGO’s in Kokosi 7 22, 24, 25, 26
8. Khutsong Precinct Development Residents and businesses in Khutsong and Khutsong South 8 1 – 4, 6 – 12, 17, 18
9. Fochville – Kokosi Regional Park Residents and businesses in Merafong 9 All wards
10. Appointment of Service provider to Open Township Registers
Residents in Khutsong 10 1 – 4, 6 - 12
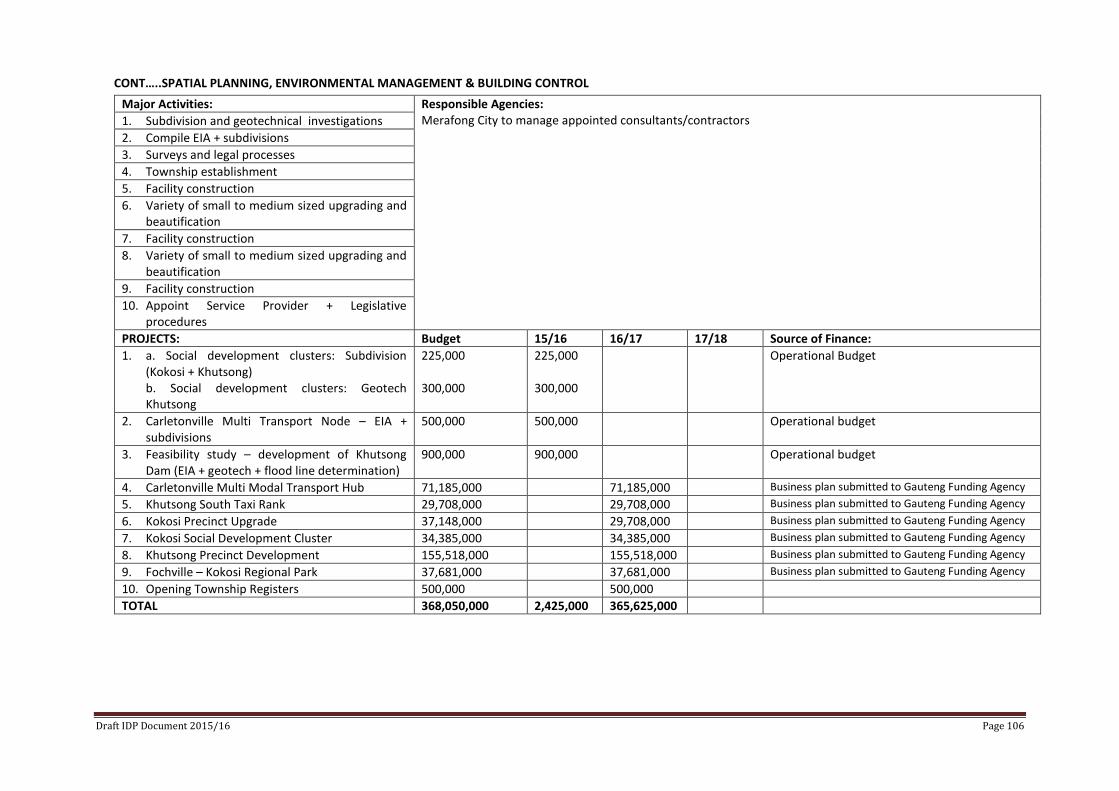
Draft IDP Document 2015/16 Page 106
CONT…..SPATIAL PLANNING, ENVIRONMENTAL MANAGEMENT & BUILDING CONTROL
Major Activities: Responsible Agencies: Merafong City to manage appointed consultants/contractors 1. Subdivision and geotechnical investigations
2. Compile EIA + subdivisions
3. Surveys and legal processes
4. Township establishment
5. Facility construction
6. Variety of small to medium sized upgrading and beautification
7. Facility construction
8. Variety of small to medium sized upgrading and beautification
9. Facility construction
10. Appoint Service Provider + Legislative procedures
PROJECTS: Budget 15/16 16/17 17/18 Source of Finance:
1. a. Social development clusters: Subdivision (Kokosi + Khutsong) b. Social development clusters: Geotech Khutsong
225,000 300,000
225,000 300,000
Operational Budget
2. Carletonville Multi Transport Node – EIA + subdivisions
500,000 500,000 Operational budget
3. Feasibility study – development of Khutsong Dam (EIA + geotech + flood line determination)
900,000 900,000 Operational budget
4. Carletonville Multi Modal Transport Hub 71,185,000 71,185,000 Business plan submitted to Gauteng Funding Agency
5. Khutsong South Taxi Rank 29,708,000 29,708,000 Business plan submitted to Gauteng Funding Agency
6. Kokosi Precinct Upgrade 37,148,000 29,708,000 Business plan submitted to Gauteng Funding Agency
7. Kokosi Social Development Cluster 34,385,000 34,385,000 Business plan submitted to Gauteng Funding Agency
8. Khutsong Precinct Development 155,518,000 155,518,000 Business plan submitted to Gauteng Funding Agency
9. Fochville – Kokosi Regional Park 37,681,000 37,681,000 Business plan submitted to Gauteng Funding Agency
10. Opening Township Registers 500,000 500,000
TOTAL 368,050,000 2,425,000 365,625,000
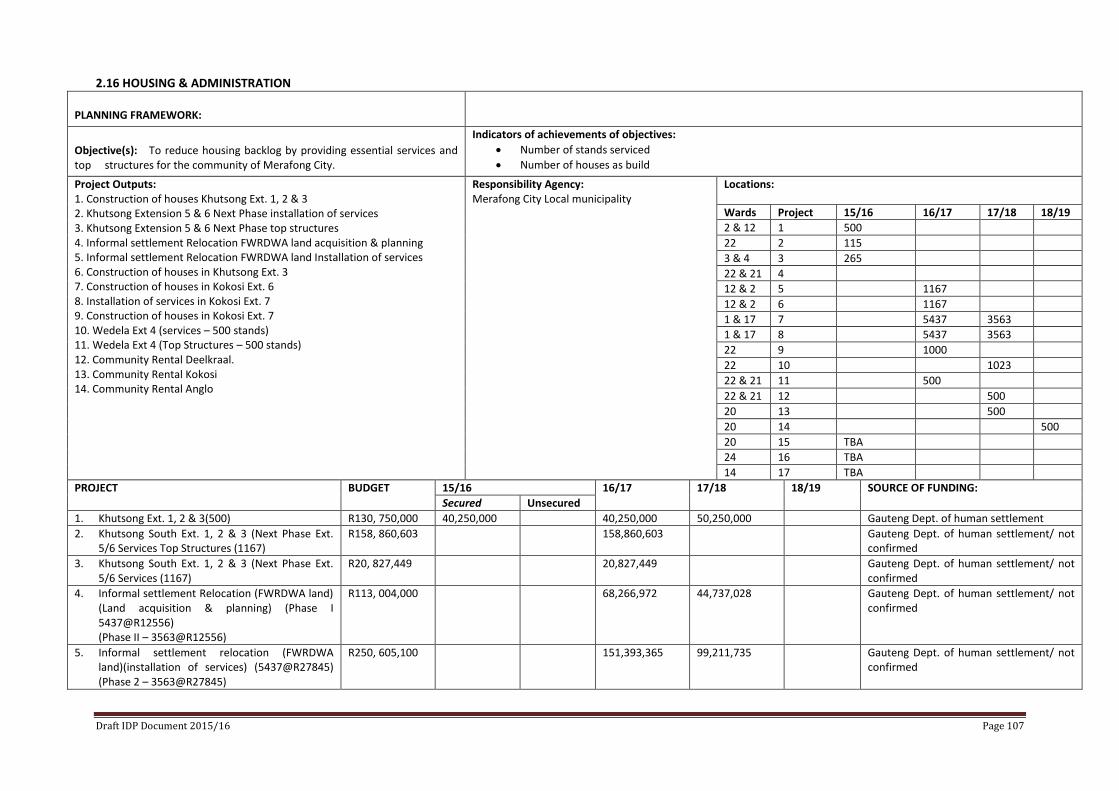
Draft IDP Document 2015/16 Page 107
2.16 HOUSING & ADMINISTRATION
PLANNING FRAMEWORK:
Objective(s): To reduce housing backlog by providing essential services and top structures for the community of Merafong City.
Indicators of achievements of objectives:
Number of stands serviced
Number of houses as build
Project Outputs: 1. Construction of houses Khutsong Ext. 1, 2 & 3 2. Khutsong Extension 5 & 6 Next Phase installation of services 3. Khutsong Extension 5 & 6 Next Phase top structures 4. Informal settlement Relocation FWRDWA land acquisition & planning 5. Informal settlement Relocation FWRDWA land Installation of services 6. Construction of houses in Khutsong Ext. 3 7. Construction of houses in Kokosi Ext. 6 8. Installation of services in Kokosi Ext. 7 9. Construction of houses in Kokosi Ext. 7 10. Wedela Ext 4 (services – 500 stands) 11. Wedela Ext 4 (Top Structures – 500 stands) 12. Community Rental Deelkraal. 13. Community Rental Kokosi 14. Community Rental Anglo
Responsibility Agency: Merafong City Local municipality
Locations:
Wards Project 15/16 16/17 17/18 18/19
2 & 12 1 500
22 2 115
3 & 4 3 265
22 & 21 4
12 & 2 5 1167
12 & 2 6 1167
1 & 17 7 5437 3563
1 & 17 8 5437 3563
22 9 1000
22 10 1023
22 & 21 11 500
22 & 21 12 500
20 13 500
20 14 500
20 15 TBA
24 16 TBA
14 17 TBA
PROJECT
BUDGET 15/16 16/17 17/18 18/19 SOURCE OF FUNDING:
Secured Unsecured
1. Khutsong Ext. 1, 2 & 3(500) R130, 750,000 40,250,000 40,250,000 50,250,000 Gauteng Dept. of human settlement
2. Khutsong South Ext. 1, 2 & 3 (Next Phase Ext. 5/6 Services Top Structures (1167)
R158, 860,603 158,860,603 Gauteng Dept. of human settlement/ not confirmed
3. Khutsong South Ext. 1, 2 & 3 (Next Phase Ext. 5/6 Services (1167)
R20, 827,449 20,827,449 Gauteng Dept. of human settlement/ not confirmed
4. Informal settlement Relocation (FWRDWA land) (Land acquisition & planning) (Phase I 5437@R12556) (Phase II – 3563@R12556)
R113, 004,000 68,266,972 44,737,028 Gauteng Dept. of human settlement/ not confirmed
5. Informal settlement relocation (FWRDWA land)(installation of services) (5437@R27845) (Phase 2 – 3563@R27845)
R250, 605,100 151,393,365 99,211,735 Gauteng Dept. of human settlement/ not confirmed
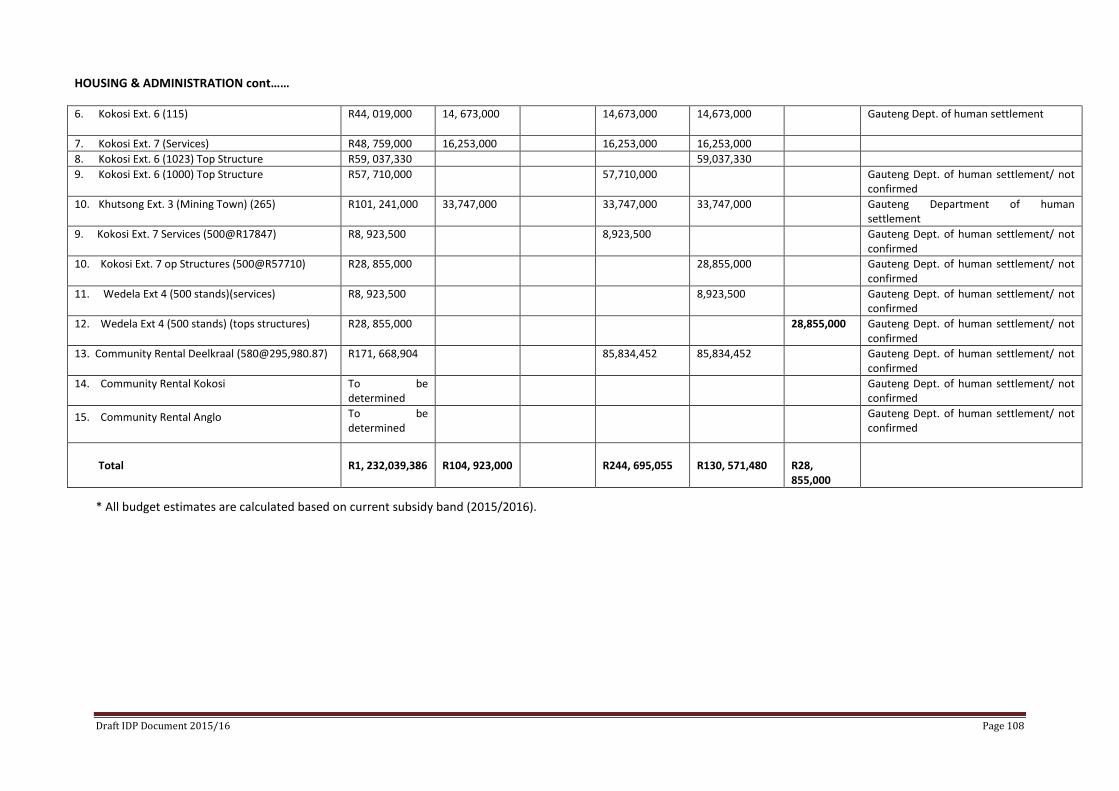
Draft IDP Document 2015/16 Page 108
HOUSING & ADMINISTRATION cont……
6. Kokosi Ext. 6 (115)
R44, 019,000 14, 673,000 14,673,000 14,673,000 Gauteng Dept. of human settlement
7. Kokosi Ext. 7 (Services) R48, 759,000 16,253,000 16,253,000 16,253,000
8. Kokosi Ext. 6 (1023) Top Structure R59, 037,330 59,037,330
9. Kokosi Ext. 6 (1000) Top Structure R57, 710,000 57,710,000 Gauteng Dept. of human settlement/ not confirmed
10. Khutsong Ext. 3 (Mining Town) (265) R101, 241,000 33,747,000 33,747,000 33,747,000 Gauteng Department of human settlement
9. Kokosi Ext. 7 Services (500@R17847)
R8, 923,500 8,923,500 Gauteng Dept. of human settlement/ not confirmed
10. Kokosi Ext. 7 op Structures (500@R57710)
R28, 855,000 28,855,000 Gauteng Dept. of human settlement/ not confirmed
11. Wedela Ext 4 (500 stands)(services) R8, 923,500 8,923,500 Gauteng Dept. of human settlement/ not confirmed
12. Wedela Ext 4 (500 stands) (tops structures) R28, 855,000 28,855,000 Gauteng Dept. of human settlement/ not confirmed
13. Community Rental Deelkraal (580@295,980.87) R171, 668,904 85,834,452 85,834,452 Gauteng Dept. of human settlement/ not confirmed
14. Community Rental Kokosi To be determined
Gauteng Dept. of human settlement/ not confirmed
15. Community Rental Anglo
To be determined
Gauteng Dept. of human settlement/ not confirmed
Total
R1, 232,039,386
R104, 923,000
R244, 695,055
R130, 571,480
R28, 855,000
* All budget estimates are calculated based on current subsidy band (2015/2016).
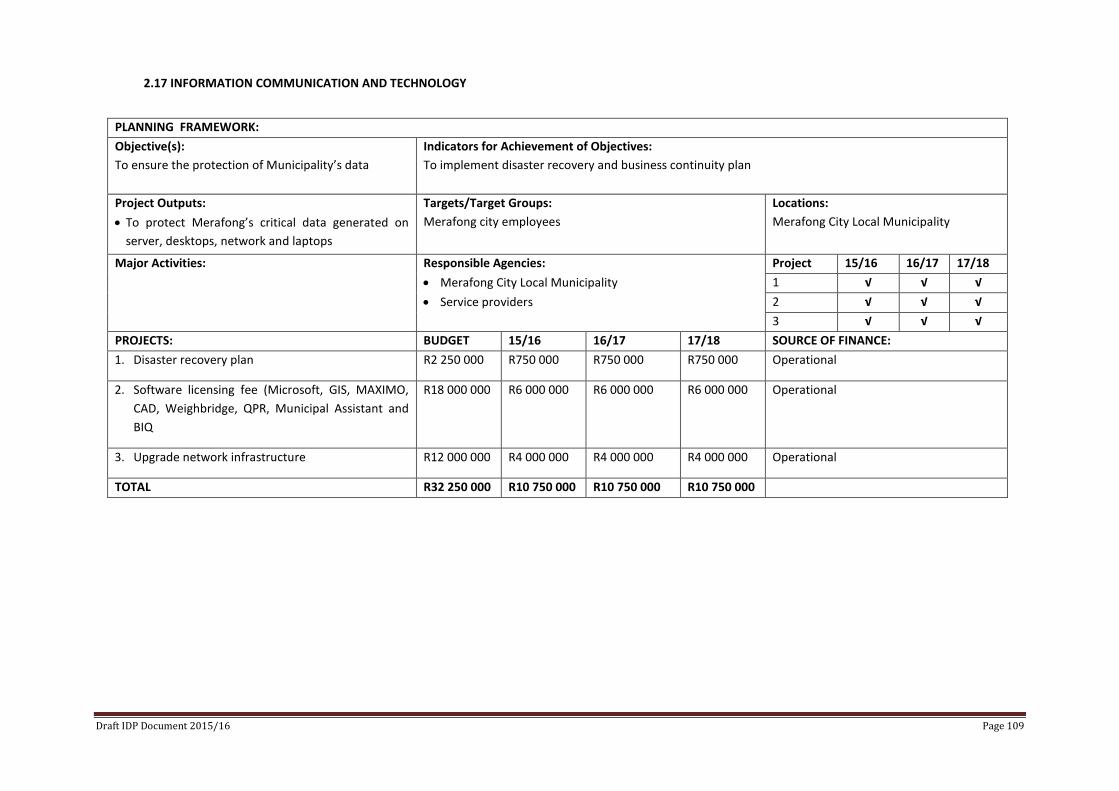
Draft IDP Document 2015/16 Page 109
2.17 INFORMATION COMMUNICATION AND TECHNOLOGY
PLANNING FRAMEWORK:
Objective(s):
To ensure the protection of Municipality’s data
Indicators for Achievement of Objectives:
To implement disaster recovery and business continuity plan
Project Outputs:
To protect Merafong’s critical data generated on
server, desktops, network and laptops
Targets/Target Groups:
Merafong city employees
Locations:
Merafong City Local Municipality
Major Activities:
Responsible Agencies:
Merafong City Local Municipality
Service providers
Project 15/16 16/17 17/18
1 √ √ √
2 √ √ √
3 √ √ √
PROJECTS: BUDGET 15/16 16/17 17/18 SOURCE OF FINANCE:
1. Disaster recovery plan R2 250 000 R750 000 R750 000 R750 000 Operational
2. Software licensing fee (Microsoft, GIS, MAXIMO,
CAD, Weighbridge, QPR, Municipal Assistant and
BIQ
R18 000 000 R6 000 000 R6 000 000 R6 000 000 Operational
3. Upgrade network infrastructure R12 000 000 R4 000 000 R4 000 000 R4 000 000 Operational
TOTAL R32 250 000 R10 750 000 R10 750 000 R10 750 000
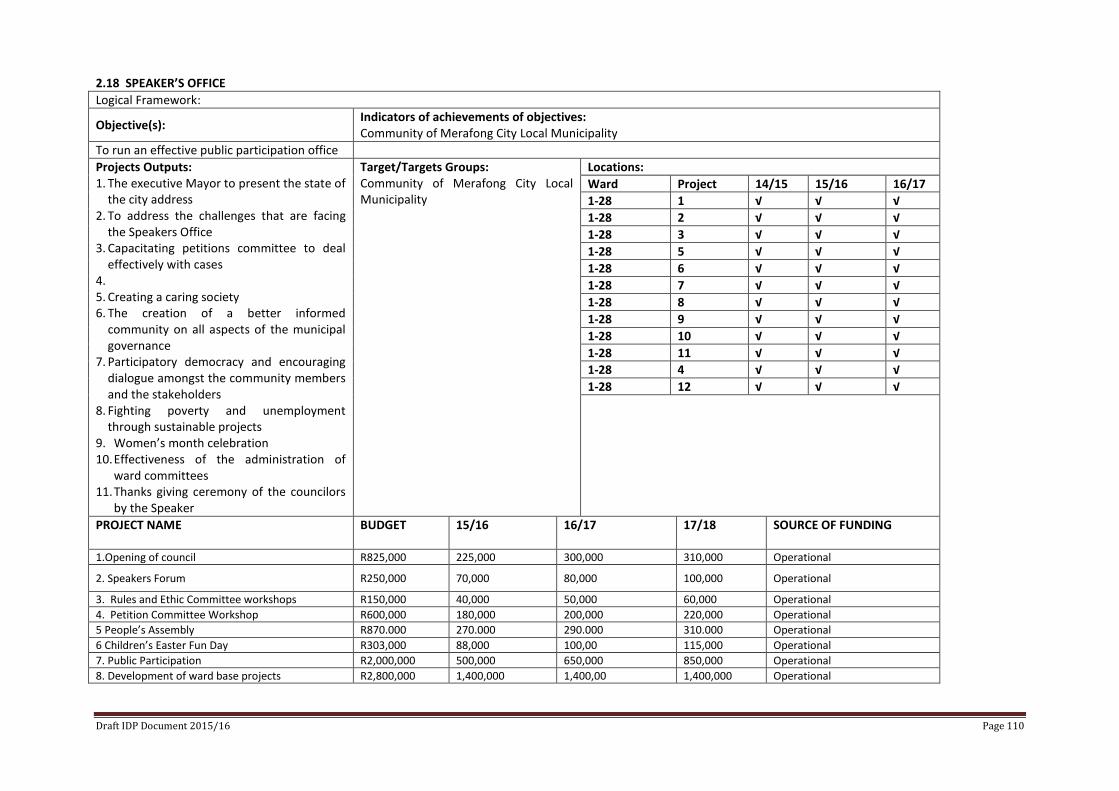
Draft IDP Document 2015/16 Page 110
2.18 SPEAKER’S OFFICE
Logical Framework:
Objective(s): Indicators of achievements of objectives: Community of Merafong City Local Municipality
To run an effective public participation office
Projects Outputs: 1. The executive Mayor to present the state of
the city address 2. To address the challenges that are facing
the Speakers Office 3. Capacitating petitions committee to deal
effectively with cases 4. 5. Creating a caring society 6. The creation of a better informed
community on all aspects of the municipal governance
7. Participatory democracy and encouraging dialogue amongst the community members and the stakeholders
8. Fighting poverty and unemployment through sustainable projects
9. Women’s month celebration 10. Effectiveness of the administration of
ward committees 11. Thanks giving ceremony of the councilors
by the Speaker
Target/Targets Groups: Community of Merafong City Local Municipality
Locations:
Ward Project 14/15 15/16 16/17
1-28 1 √ √ √
1-28 2 √ √ √
1-28 3 √ √ √
1-28 5 √ √ √
1-28 6 √ √ √
1-28 7 √ √ √
1-28 8 √ √ √
1-28 9 √ √ √
1-28 10 √ √ √
1-28 11 √ √ √
1-28 4 √ √ √
1-28 12 √ √ √
PROJECT NAME BUDGET 15/16 16/17 17/18 SOURCE OF FUNDING
1.Opening of council R825,000 225,000 300,000 310,000 Operational
2. Speakers Forum R250,000 70,000 80,000 100,000 Operational
3. Rules and Ethic Committee workshops R150,000 40,000 50,000 60,000 Operational
4. Petition Committee Workshop R600,000 180,000 200,000 220,000 Operational
5 People’s Assembly R870.000 270.000 290.000 310.000 Operational
6 Children’s Easter Fun Day R303,000 88,000 100,00 115,000 Operational
7. Public Participation R2,000,000 500,000 650,000 850,000 Operational
8. Development of ward base projects R2,800,000 1,400,000 1,400,00 1,400,000 Operational
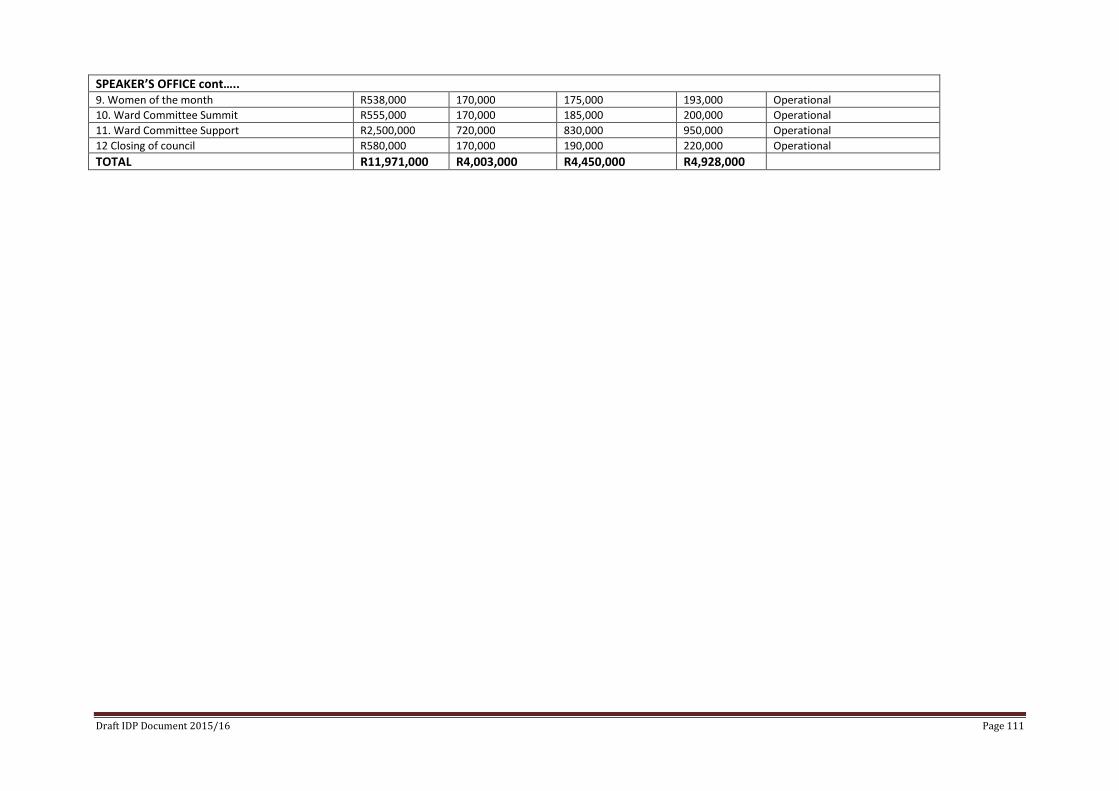
Draft IDP Document 2015/16 Page 111
SPEAKER’S OFFICE cont….. 9. Women of the month R538,000 170,000 175,000 193,000 Operational
10. Ward Committee Summit R555,000 170,000 185,000 200,000 Operational
11. Ward Committee Support R2,500,000 720,000 830,000 950,000 Operational
12 Closing of council R580,000 170,000 190,000 220,000 Operational
TOTAL R11,971,000 R4,003,000 R4,450,000 R4,928,000
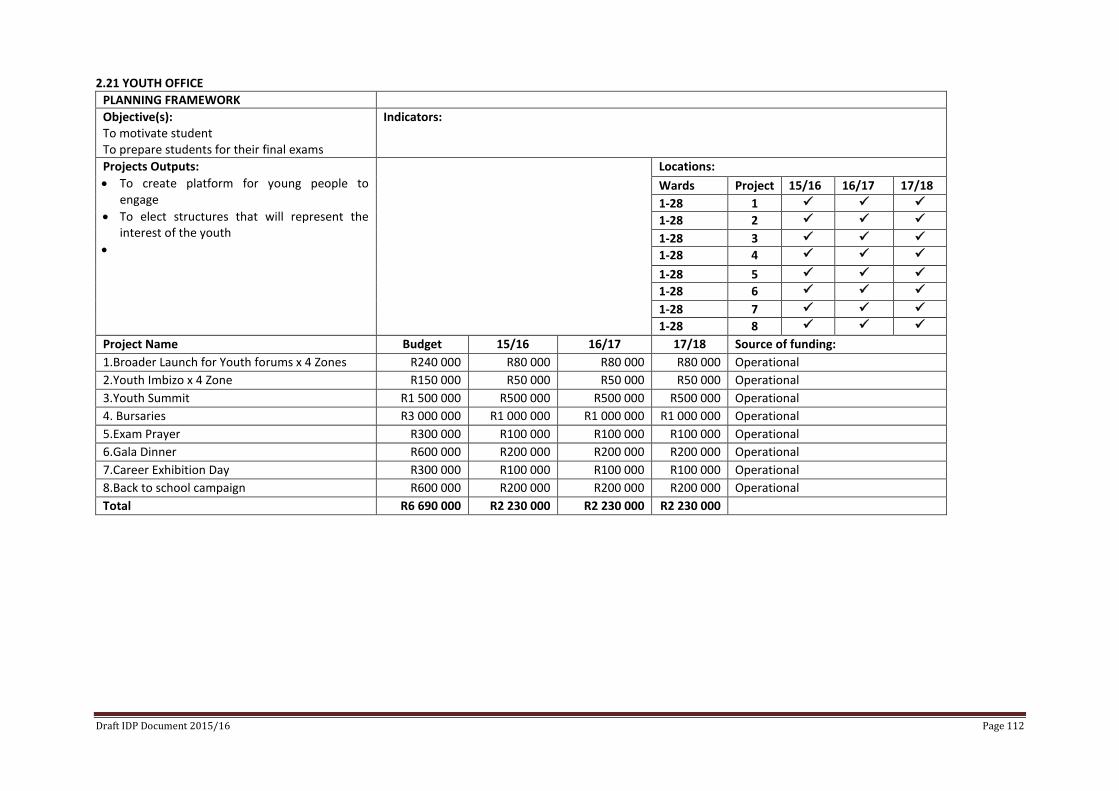
Draft IDP Document 2015/16 Page 112
2.21 YOUTH OFFICE
PLANNING FRAMEWORK
Objective(s): To motivate student To prepare students for their final exams
Indicators:
Projects Outputs:
To create platform for young people to engage
To elect structures that will represent the interest of the youth
Locations:
Wards Project 15/16 16/17 17/18
1-28 1 1-28 2 1-28 3 1-28 4 1-28 5 1-28 6 1-28 7 1-28 8
Project Name Budget 15/16 16/17 17/18 Source of funding:
1.Broader Launch for Youth forums x 4 Zones R240 000 R80 000 R80 000 R80 000 Operational
2.Youth Imbizo x 4 Zone R150 000 R50 000 R50 000 R50 000 Operational
3.Youth Summit R1 500 000 R500 000 R500 000 R500 000 Operational
4. Bursaries R3 000 000 R1 000 000 R1 000 000 R1 000 000 Operational
5.Exam Prayer R300 000 R100 000 R100 000 R100 000 Operational
6.Gala Dinner R600 000 R200 000 R200 000 R200 000 Operational
7.Career Exhibition Day R300 000 R100 000 R100 000 R100 000 Operational
8.Back to school campaign R600 000 R200 000 R200 000 R200 000 Operational
Total R6 690 000 R2 230 000 R2 230 000 R2 230 000
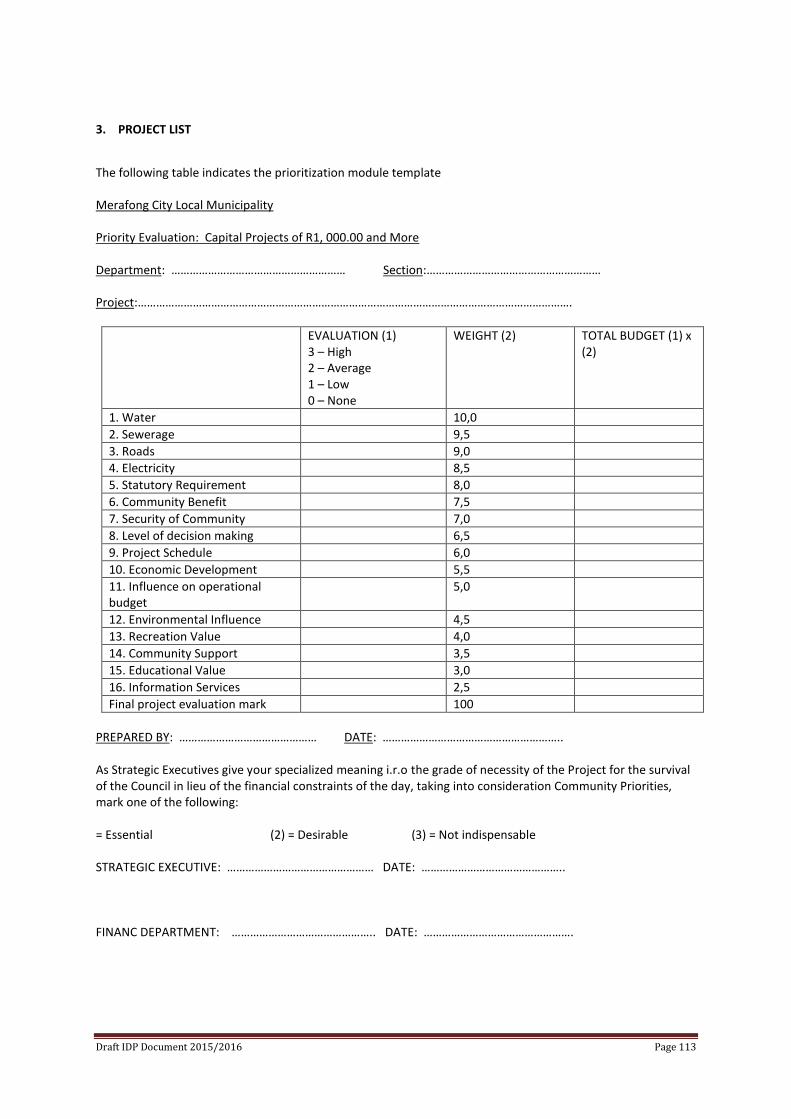
Draft IDP Document 2015/2016 Page 113
3. PROJECT LIST
The following table indicates the prioritization module template Merafong City Local Municipality Priority Evaluation: Capital Projects of R1, 000.00 and More Department: ………………………………………………… Section:………………………………………………… Project:…………………………………………………………………………………………………………………………….
EVALUATION (1) 3 – High 2 – Average 1 – Low 0 – None
WEIGHT (2) TOTAL BUDGET (1) x (2)
1. Water 10,0
2. Sewerage 9,5
3. Roads 9,0
4. Electricity 8,5
5. Statutory Requirement 8,0
6. Community Benefit 7,5
7. Security of Community 7,0
8. Level of decision making 6,5
9. Project Schedule 6,0
10. Economic Development 5,5
11. Influence on operational budget
5,0
12. Environmental Influence 4,5
13. Recreation Value 4,0
14. Community Support 3,5
15. Educational Value 3,0
16. Information Services 2,5
Final project evaluation mark 100
PREPARED BY: ……………………………………… DATE: ………………………………………………….. As Strategic Executives give your specialized meaning i.r.o the grade of necessity of the Project for the survival of the Council in lieu of the financial constraints of the day, taking into consideration Community Priorities, mark one of the following: = Essential (2) = Desirable (3) = Not indispensable STRATEGIC EXECUTIVE: ………………………………………… DATE: ……………………………………….. FINANC DEPARTMENT: ……………………………………….. DATE: ………………………………………….
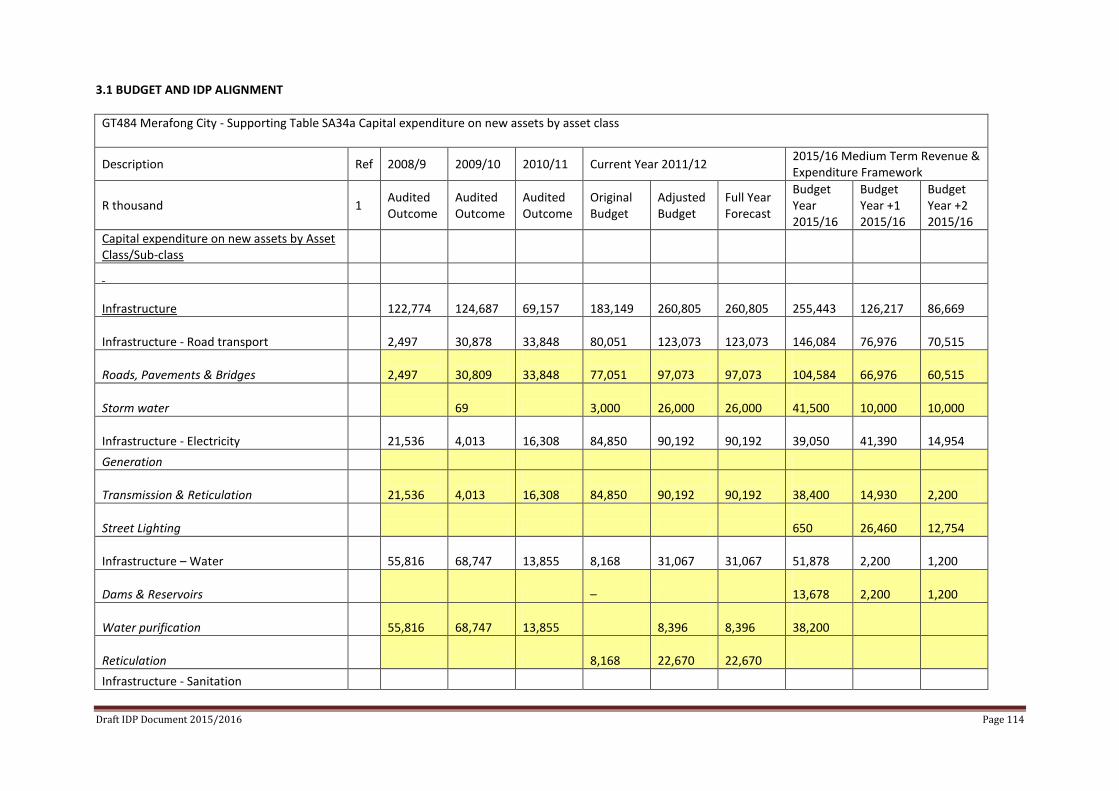
Draft IDP Document 2015/2016 Page 114
3.1 BUDGET AND IDP ALIGNMENT
GT484 Merafong City - Supporting Table SA34a Capital expenditure on new assets by asset class
Description Ref 2008/9 2009/10 2010/11 Current Year 2011/12 2015/16 Medium Term Revenue & Expenditure Framework
R thousand 1 Audited Outcome
Audited Outcome
Audited Outcome
Original Budget
Adjusted Budget
Full Year Forecast
Budget Year 2015/16
Budget Year +1 2015/16
Budget Year +2 2015/16
Capital expenditure on new assets by Asset Class/Sub-class
Infrastructure 122,774
124,687
69,157
183,149
260,805
260,805
255,443
126,217
86,669
Infrastructure - Road transport 2,497
30,878
33,848
80,051
123,073
123,073
146,084
76,976
70,515
Roads, Pavements & Bridges 2,497
30,809
33,848
77,051
97,073
97,073
104,584
66,976
60,515
Storm water 69
3,000
26,000
26,000
41,500
10,000
10,000
Infrastructure - Electricity 21,536
4,013
16,308
84,850
90,192
90,192
39,050
41,390
14,954
Generation
Transmission & Reticulation 21,536
4,013
16,308
84,850
90,192
90,192
38,400
14,930
2,200
Street Lighting 650
26,460
12,754
Infrastructure – Water 55,816
68,747
13,855
8,168
31,067
31,067
51,878
2,200
1,200
Dams & Reservoirs –
13,678
2,200
1,200
Water purification 55,816
68,747
13,855
8,396
8,396
38,200
Reticulation 8,168
22,670
22,670
Infrastructure - Sanitation
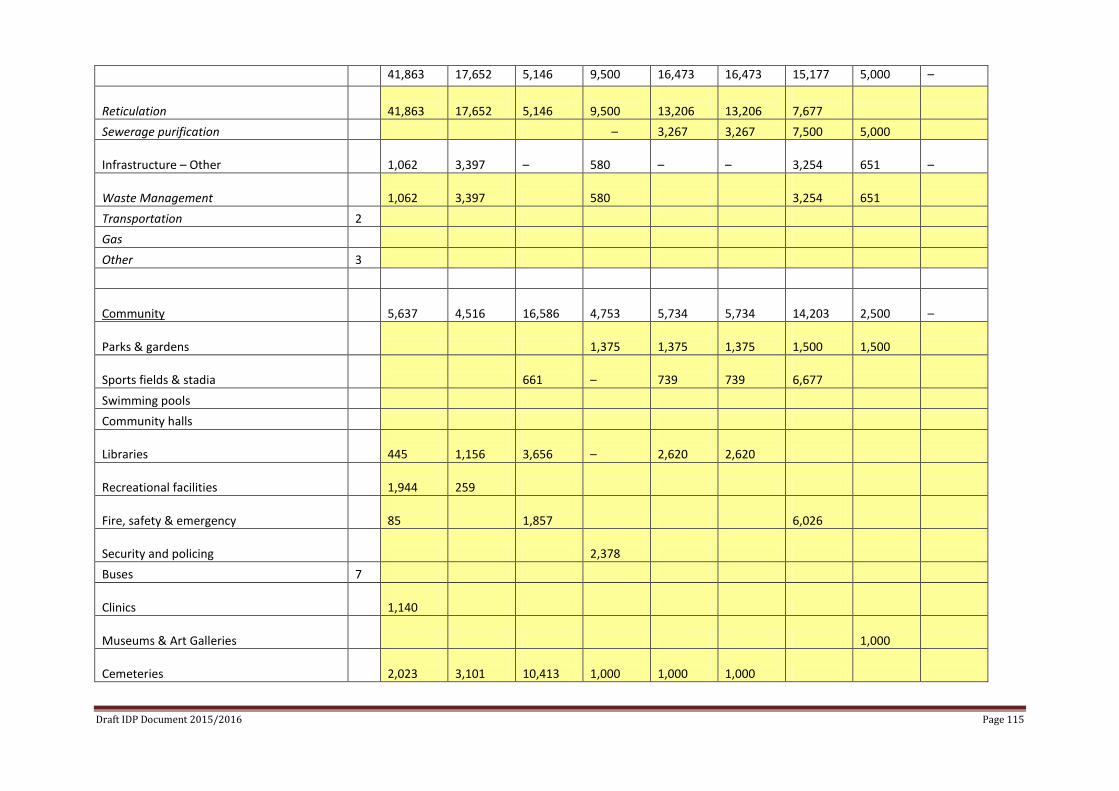
Draft IDP Document 2015/2016 Page 115
41,863 17,652 5,146 9,500 16,473 16,473 15,177 5,000 –
Reticulation 41,863
17,652
5,146
9,500
13,206
13,206
7,677
Sewerage purification – 3,267 3,267 7,500 5,000
Infrastructure – Other 1,062
3,397
–
580
–
–
3,254
651
–
Waste Management 1,062
3,397
580
3,254
651
Transportation 2
Gas
Other 3
Community 5,637
4,516
16,586
4,753
5,734
5,734
14,203
2,500
–
Parks & gardens 1,375
1,375
1,375
1,500
1,500
Sports fields & stadia 661
–
739
739
6,677
Swimming pools
Community halls
Libraries 445
1,156
3,656
–
2,620
2,620
Recreational facilities 1,944
259
Fire, safety & emergency 85
1,857
6,026
Security and policing 2,378
Buses 7
Clinics 1,140
Museums & Art Galleries 1,000
Cemeteries 2,023
3,101
10,413
1,000
1,000
1,000
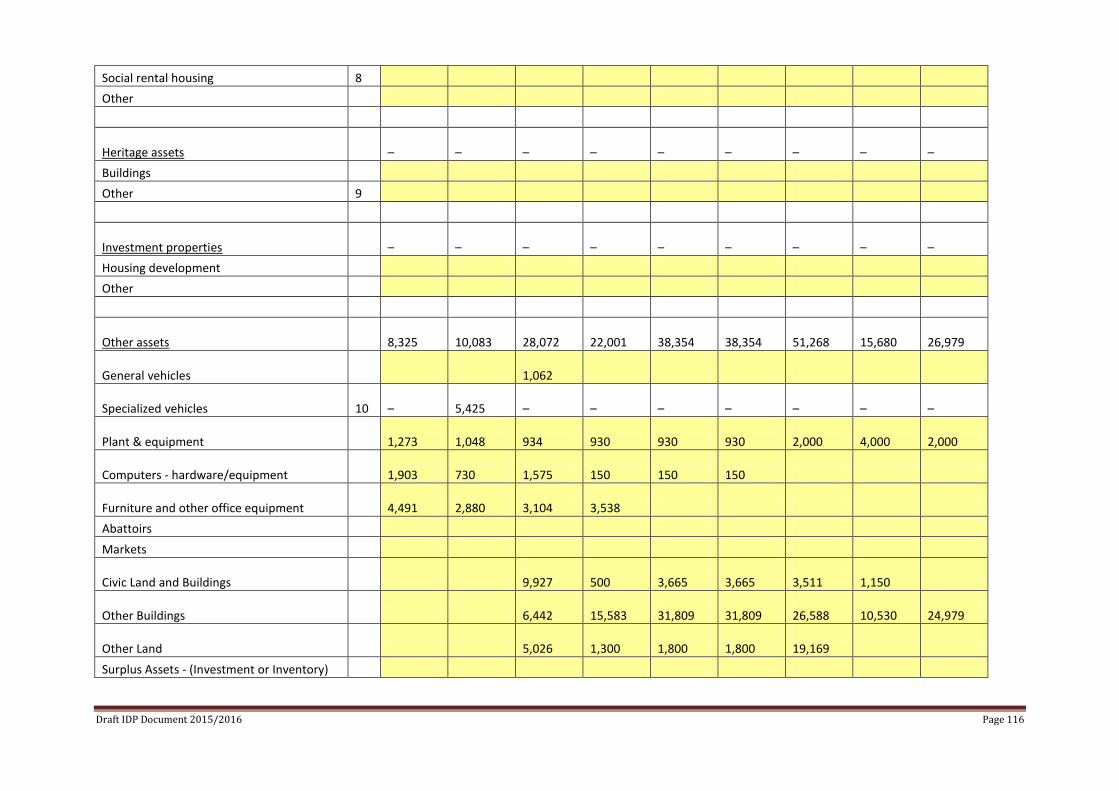
Draft IDP Document 2015/2016 Page 116
Social rental housing 8
Other
Heritage assets –
–
–
–
–
–
–
–
–
Buildings
Other 9
Investment properties –
–
–
–
–
–
–
–
–
Housing development
Other
Other assets 8,325
10,083
28,072
22,001
38,354
38,354
51,268
15,680
26,979
General vehicles 1,062
Specialized vehicles 10 –
5,425
–
–
–
–
–
–
–
Plant & equipment 1,273
1,048
934
930
930
930
2,000
4,000
2,000
Computers - hardware/equipment 1,903
730
1,575
150
150
150
Furniture and other office equipment 4,491
2,880
3,104
3,538
Abattoirs
Markets
Civic Land and Buildings 9,927
500
3,665
3,665
3,511
1,150
Other Buildings 6,442
15,583
31,809
31,809
26,588
10,530
24,979
Other Land 5,026
1,300
1,800
1,800
19,169
Surplus Assets - (Investment or Inventory)
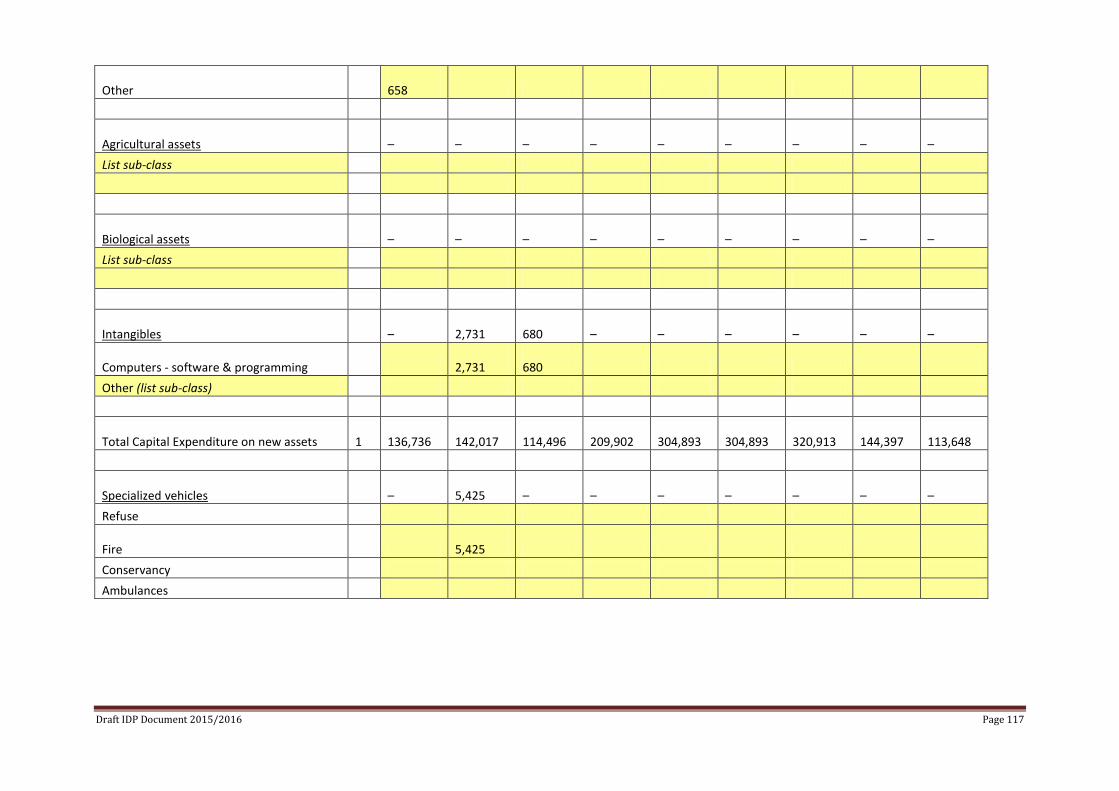
Draft IDP Document 2015/2016 Page 117
Other 658
Agricultural assets –
–
–
–
–
–
–
–
–
List sub-class
Biological assets –
–
–
–
–
–
–
–
–
List sub-class
Intangibles –
2,731
680
–
–
–
–
–
–
Computers - software & programming 2,731
680
Other (list sub-class)
Total Capital Expenditure on new assets 1 136,736
142,017
114,496
209,902
304,893
304,893
320,913
144,397
113,648
Specialized vehicles –
5,425
–
–
–
–
–
–
–
Refuse
Fire 5,425
Conservancy
Ambulances
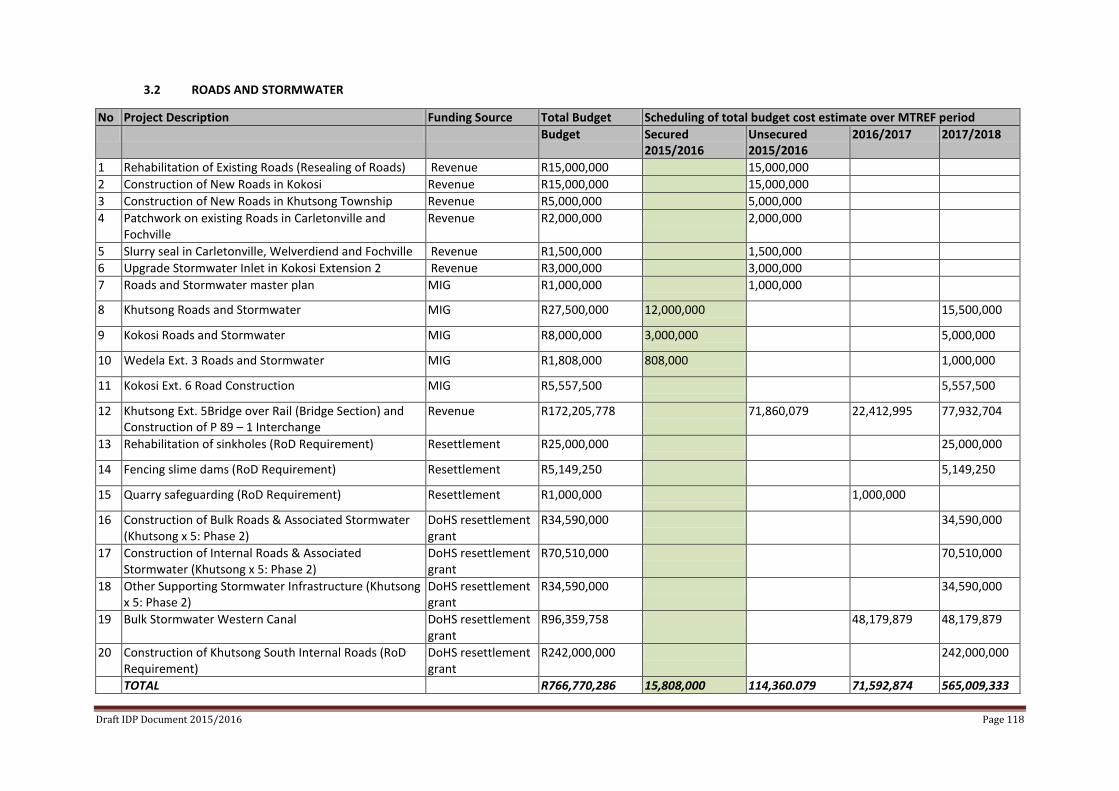
Draft IDP Document 2015/2016 Page 118
3.2 ROADS AND STORMWATER
No Project Description Funding Source Total Budget Scheduling of total budget cost estimate over MTREF period
Budget Secured 2015/2016
Unsecured 2015/2016
2016/2017 2017/2018
1 Rehabilitation of Existing Roads (Resealing of Roads) Revenue R15,000,000 15,000,000
2 Construction of New Roads in Kokosi Revenue R15,000,000 15,000,000
3 Construction of New Roads in Khutsong Township Revenue R5,000,000 5,000,000
4 Patchwork on existing Roads in Carletonville and Fochville
Revenue R2,000,000 2,000,000
5 Slurry seal in Carletonville, Welverdiend and Fochville Revenue R1,500,000 1,500,000
6 Upgrade Stormwater Inlet in Kokosi Extension 2 Revenue R3,000,000 3,000,000
7 Roads and Stormwater master plan MIG R1,000,000 1,000,000
8 Khutsong Roads and Stormwater MIG R27,500,000 12,000,000 15,500,000
9 Kokosi Roads and Stormwater MIG R8,000,000 3,000,000 5,000,000
10 Wedela Ext. 3 Roads and Stormwater MIG R1,808,000 808,000 1,000,000
11 Kokosi Ext. 6 Road Construction MIG R5,557,500 5,557,500
12 Khutsong Ext. 5Bridge over Rail (Bridge Section) and Construction of P 89 – 1 Interchange
Revenue R172,205,778 71,860,079 22,412,995 77,932,704
13 Rehabilitation of sinkholes (RoD Requirement) Resettlement R25,000,000 25,000,000
14 Fencing slime dams (RoD Requirement) Resettlement R5,149,250 5,149,250
15 Quarry safeguarding (RoD Requirement) Resettlement R1,000,000 1,000,000
16 Construction of Bulk Roads & Associated Stormwater (Khutsong x 5: Phase 2)
DoHS resettlement grant
R34,590,000 34,590,000
17 Construction of Internal Roads & Associated Stormwater (Khutsong x 5: Phase 2)
DoHS resettlement grant
R70,510,000 70,510,000
18 Other Supporting Stormwater Infrastructure (Khutsong x 5: Phase 2)
DoHS resettlement grant
R34,590,000 34,590,000
19 Bulk Stormwater Western Canal DoHS resettlement grant
R96,359,758 48,179,879 48,179,879
20 Construction of Khutsong South Internal Roads (RoD Requirement)
DoHS resettlement grant
R242,000,000 242,000,000
TOTAL R766,770,286 15,808,000 114,360.079 71,592,874 565,009,333
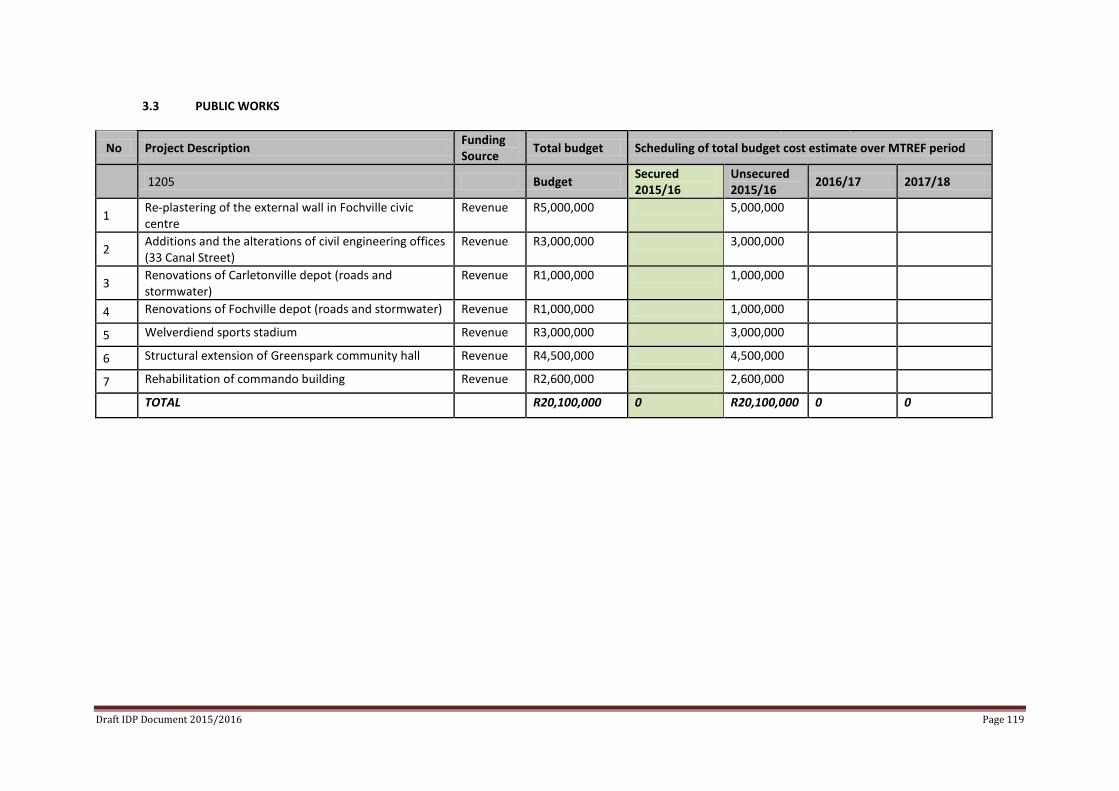
Draft IDP Document 2015/2016 Page 119
3.3 PUBLIC WORKS
No Project Description Funding Source
Total budget Scheduling of total budget cost estimate over MTREF period
1205 Budget
Secured 2015/16
Unsecured 2015/16
2016/17 2017/18
1 Re-plastering of the external wall in Fochville civic centre
Revenue R5,000,000 5,000,000
2 Additions and the alterations of civil engineering offices (33 Canal Street)
Revenue R3,000,000 3,000,000
3 Renovations of Carletonville depot (roads and stormwater)
Revenue R1,000,000 1,000,000
4 Renovations of Fochville depot (roads and stormwater) Revenue R1,000,000 1,000,000
5 Welverdiend sports stadium Revenue R3,000,000 3,000,000
6 Structural extension of Greenspark community hall Revenue R4,500,000 4,500,000
7 Rehabilitation of commando building Revenue R2,600,000 2,600,000
TOTAL R20,100,000 0 R20,100,000 0 0
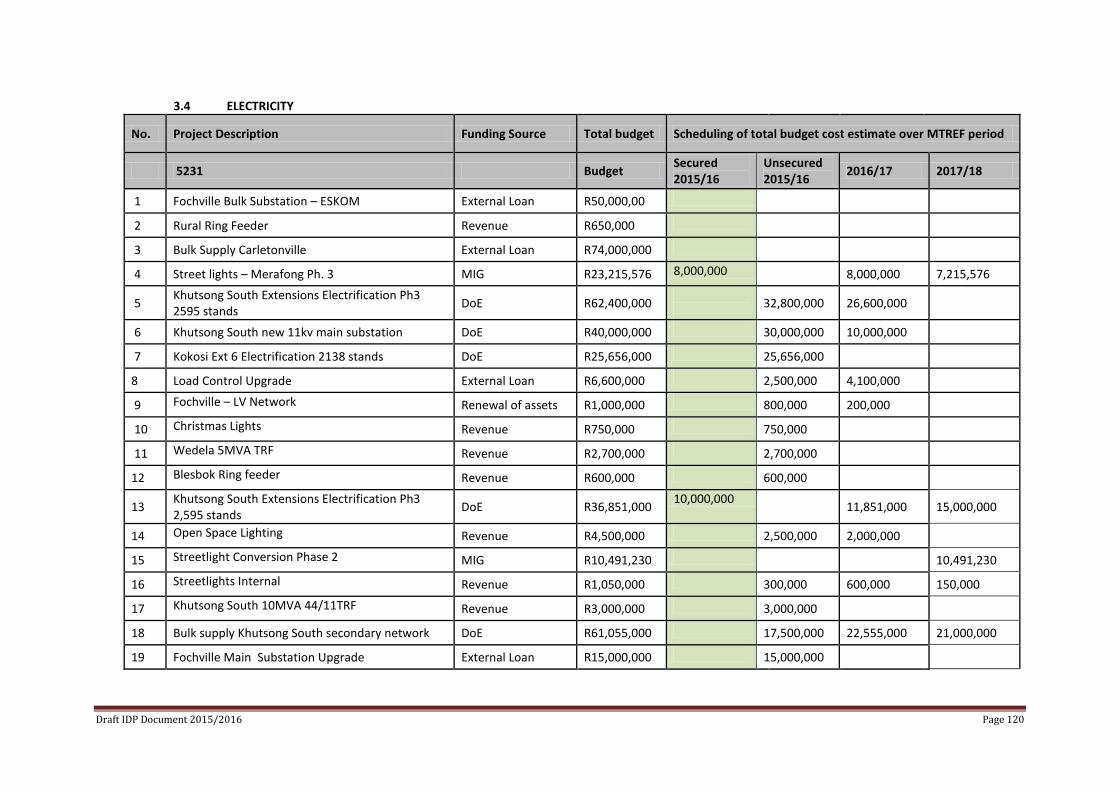
Draft IDP Document 2015/2016 Page 120
3.4 ELECTRICITY
No. Project Description Funding Source Total budget Scheduling of total budget cost estimate over MTREF period
5231 Budget
Secured 2015/16
Unsecured 2015/16
2016/17 2017/18
1 Fochville Bulk Substation – ESKOM External Loan R50,000,00
2 Rural Ring Feeder Revenue R650,000
3 Bulk Supply Carletonville External Loan R74,000,000
4 Street lights – Merafong Ph. 3 MIG R23,215,576 8,000,000 8,000,000 7,215,576
5
Khutsong South Extensions Electrification Ph3 2595 stands
DoE R62,400,000
32,800,000 26,600,000
6 Khutsong South new 11kv main substation DoE R40,000,000 30,000,000 10,000,000
7 Kokosi Ext 6 Electrification 2138 stands DoE R25,656,000 25,656,000
8 Load Control Upgrade External Loan R6,600,000 2,500,000 4,100,000
9 Fochville – LV Network Renewal of assets R1,000,000 800,000 200,000
10 Christmas Lights Revenue R750,000 750,000
11 Wedela 5MVA TRF Revenue R2,700,000 2,700,000
12 Blesbok Ring feeder Revenue R600,000 600,000
13
Khutsong South Extensions Electrification Ph3 2,595 stands
DoE R36,851,000 10,000,000
11,851,000 15,000,000
14 Open Space Lighting Revenue R4,500,000 2,500,000 2,000,000
15 Streetlight Conversion Phase 2 MIG R10,491,230 10,491,230
16 Streetlights Internal Revenue R1,050,000 300,000 600,000 150,000
17 Khutsong South 10MVA 44/11TRF Revenue R3,000,000 3,000,000
18 Bulk supply Khutsong South secondary network DoE R61,055,000 17,500,000 22,555,000 21,000,000
19 Fochville Main Substation Upgrade External Loan R15,000,000 15,000,000
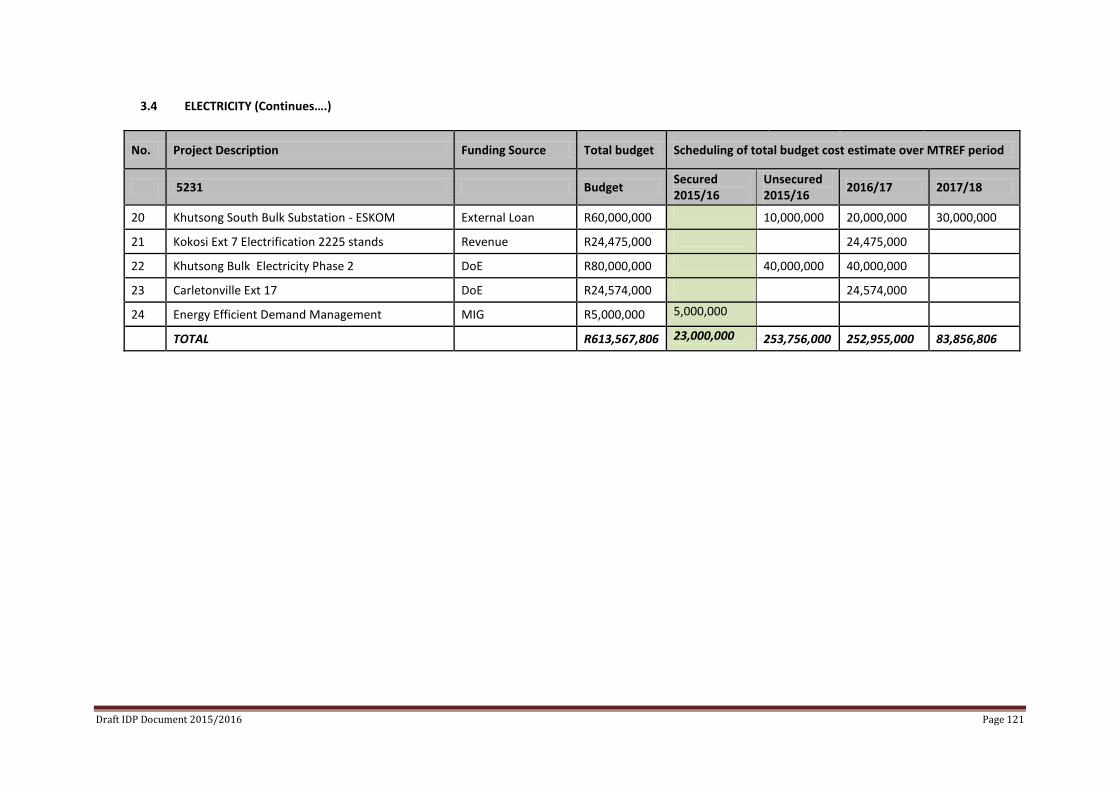
Draft IDP Document 2015/2016 Page 121
3.4 ELECTRICITY (Continues….)
No. Project Description Funding Source Total budget Scheduling of total budget cost estimate over MTREF period
5231 Budget
Secured 2015/16
Unsecured 2015/16
2016/17 2017/18
20 Khutsong South Bulk Substation - ESKOM External Loan R60,000,000 10,000,000 20,000,000 30,000,000
21 Kokosi Ext 7 Electrification 2225 stands Revenue R24,475,000 24,475,000
22 Khutsong Bulk Electricity Phase 2 DoE R80,000,000 40,000,000 40,000,000
23 Carletonville Ext 17 DoE R24,574,000 24,574,000
24 Energy Efficient Demand Management MIG R5,000,000 5,000,000
TOTAL R613,567,806 23,000,000 253,756,000 252,955,000 83,856,806
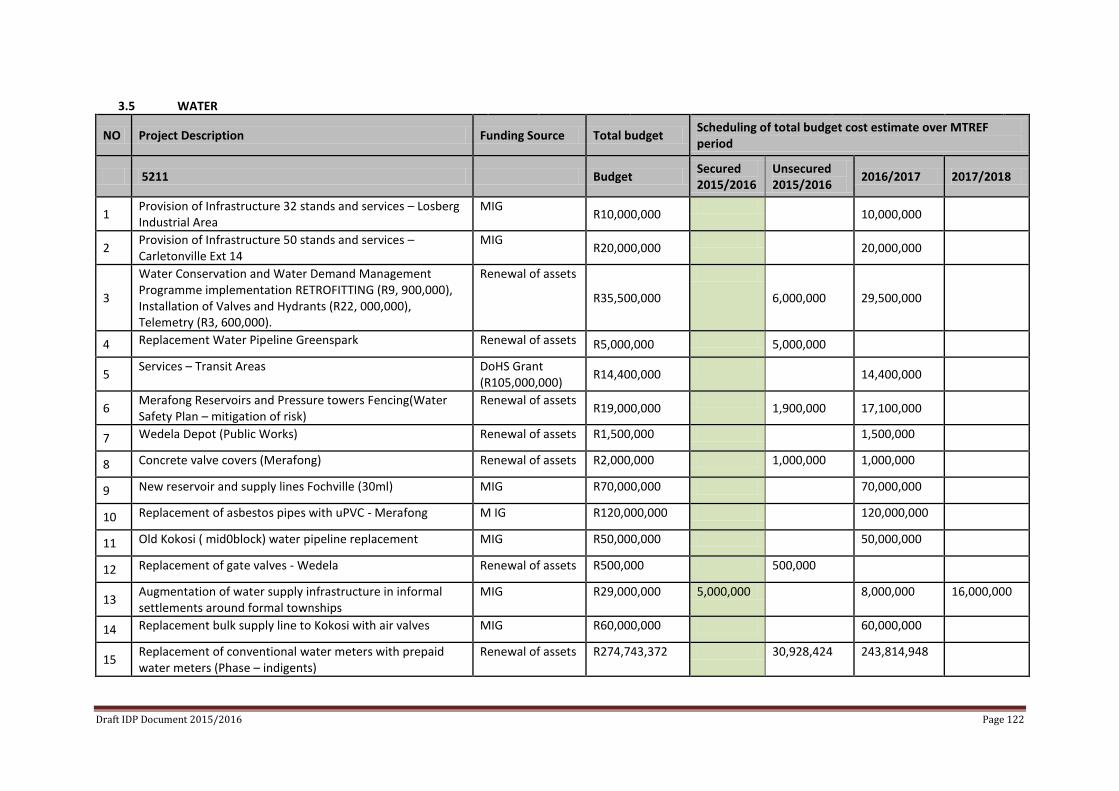
Draft IDP Document 2015/2016 Page 122
3.5 WATER
NO Project Description Funding Source Total budget Scheduling of total budget cost estimate over MTREF period
5211 Budget Secured 2015/2016
Unsecured 2015/2016
2016/2017 2017/2018
1 Provision of Infrastructure 32 stands and services – Losberg Industrial Area
MIG R10,000,000
10,000,000
2 Provision of Infrastructure 50 stands and services – Carletonville Ext 14
MIG R20,000,000
20,000,000
3
Water Conservation and Water Demand Management Programme implementation RETROFITTING (R9, 900,000), Installation of Valves and Hydrants (R22, 000,000), Telemetry (R3, 600,000).
Renewal of assets
R35,500,000
6,000,000 29,500,000
4 Replacement Water Pipeline Greenspark Renewal of assets R5,000,000 5,000,000
5 Services – Transit Areas DoHS Grant
(R105,000,000) R14,400,000
14,400,000
6 Merafong Reservoirs and Pressure towers Fencing(Water Safety Plan – mitigation of risk)
Renewal of assets R19,000,000
1,900,000 17,100,000
7 Wedela Depot (Public Works) Renewal of assets R1,500,000 1,500,000
8 Concrete valve covers (Merafong) Renewal of assets R2,000,000 1,000,000 1,000,000
9 New reservoir and supply lines Fochville (30ml) MIG R70,000,000 70,000,000
10 Replacement of asbestos pipes with uPVC - Merafong M IG R120,000,000 120,000,000
11 Old Kokosi ( mid0block) water pipeline replacement MIG R50,000,000 50,000,000
12 Replacement of gate valves - Wedela Renewal of assets R500,000 500,000
13 Augmentation of water supply infrastructure in informal settlements around formal townships
MIG R29,000,000 5,000,000 8,000,000 16,000,000
14 Replacement bulk supply line to Kokosi with air valves MIG R60,000,000 60,000,000
15 Replacement of conventional water meters with prepaid water meters (Phase – indigents)
Renewal of assets R274,743,372 30,928,424 243,814,948

Draft IDP Document 2015/2016 Page 123
16 Rehabilitation of Khutsong Water Services MIG R232,976,441 14,656,662 218,319,779
17 Khutsong Ext. 5 Construction of Bulk Water & Sewer HSG R31,000,000 31,000,000
18 Khutsong Ext. 5 Construction of Internal Water & Sewer Reticulation
HSG R57,551,884 19,000,000 38,551,884
TOTAL R1,033,171,697 55,000,000
45,328,424 698,523,494 234,319,779
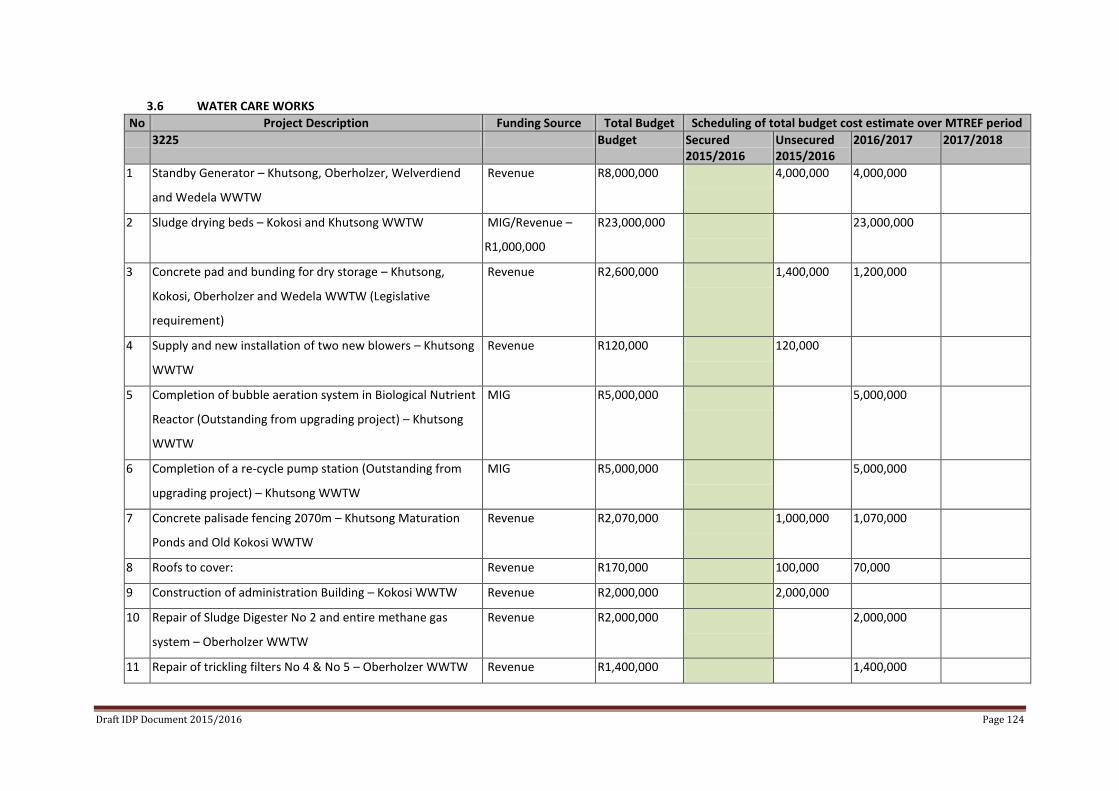
Draft IDP Document 2015/2016 Page 124
3.6 WATER CARE WORKS
No Project Description Funding Source Total Budget Scheduling of total budget cost estimate over MTREF period
3225 Budget Secured 2015/2016
Unsecured 2015/2016
2016/2017 2017/2018
1 Standby Generator – Khutsong, Oberholzer, Welverdiend
and Wedela WWTW
Revenue R8,000,000 4,000,000 4,000,000
2 Sludge drying beds – Kokosi and Khutsong WWTW MIG/Revenue –
R1,000,000
R23,000,000 23,000,000
3 Concrete pad and bunding for dry storage – Khutsong,
Kokosi, Oberholzer and Wedela WWTW (Legislative
requirement)
Revenue R2,600,000 1,400,000 1,200,000
4 Supply and new installation of two new blowers – Khutsong
WWTW
Revenue R120,000 120,000
5 Completion of bubble aeration system in Biological Nutrient
Reactor (Outstanding from upgrading project) – Khutsong
WWTW
MIG R5,000,000 5,000,000
6 Completion of a re-cycle pump station (Outstanding from
upgrading project) – Khutsong WWTW
MIG R5,000,000 5,000,000
7 Concrete palisade fencing 2070m – Khutsong Maturation
Ponds and Old Kokosi WWTW
Revenue R2,070,000 1,000,000 1,070,000
8 Roofs to cover: Revenue R170,000 100,000 70,000
9 Construction of administration Building – Kokosi WWTW Revenue R2,000,000 2,000,000
10 Repair of Sludge Digester No 2 and entire methane gas
system – Oberholzer WWTW
Revenue R2,000,000 2,000,000
11 Repair of trickling filters No 4 & No 5 – Oberholzer WWTW Revenue R1,400,000 1,400,000
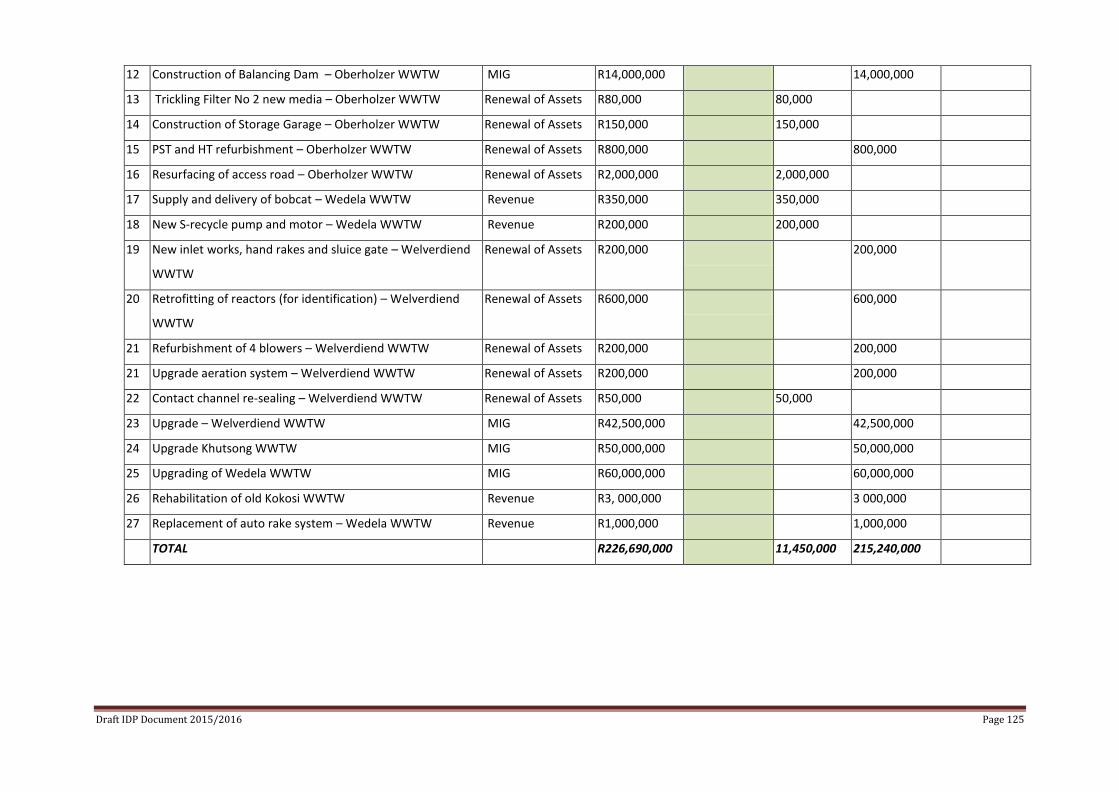
Draft IDP Document 2015/2016 Page 125
12 Construction of Balancing Dam – Oberholzer WWTW MIG R14,000,000 14,000,000
13 Trickling Filter No 2 new media – Oberholzer WWTW Renewal of Assets R80,000 80,000
14 Construction of Storage Garage – Oberholzer WWTW Renewal of Assets R150,000 150,000
15 PST and HT refurbishment – Oberholzer WWTW Renewal of Assets R800,000 800,000
16 Resurfacing of access road – Oberholzer WWTW Renewal of Assets R2,000,000 2,000,000
17 Supply and delivery of bobcat – Wedela WWTW Revenue R350,000 350,000
18 New S-recycle pump and motor – Wedela WWTW Revenue R200,000 200,000
19 New inlet works, hand rakes and sluice gate – Welverdiend
WWTW
Renewal of Assets R200,000 200,000
20 Retrofitting of reactors (for identification) – Welverdiend
WWTW
Renewal of Assets R600,000 600,000
21 Refurbishment of 4 blowers – Welverdiend WWTW Renewal of Assets R200,000 200,000
21 Upgrade aeration system – Welverdiend WWTW Renewal of Assets R200,000 200,000
22 Contact channel re-sealing – Welverdiend WWTW Renewal of Assets R50,000 50,000
23 Upgrade – Welverdiend WWTW MIG R42,500,000 42,500,000
24 Upgrade Khutsong WWTW MIG R50,000,000 50,000,000
25 Upgrading of Wedela WWTW MIG R60,000,000 60,000,000
26 Rehabilitation of old Kokosi WWTW Revenue R3, 000,000 3 000,000
27 Replacement of auto rake system – Wedela WWTW Revenue R1,000,000 1,000,000
TOTAL R226,690,000 11,450,000 215,240,000
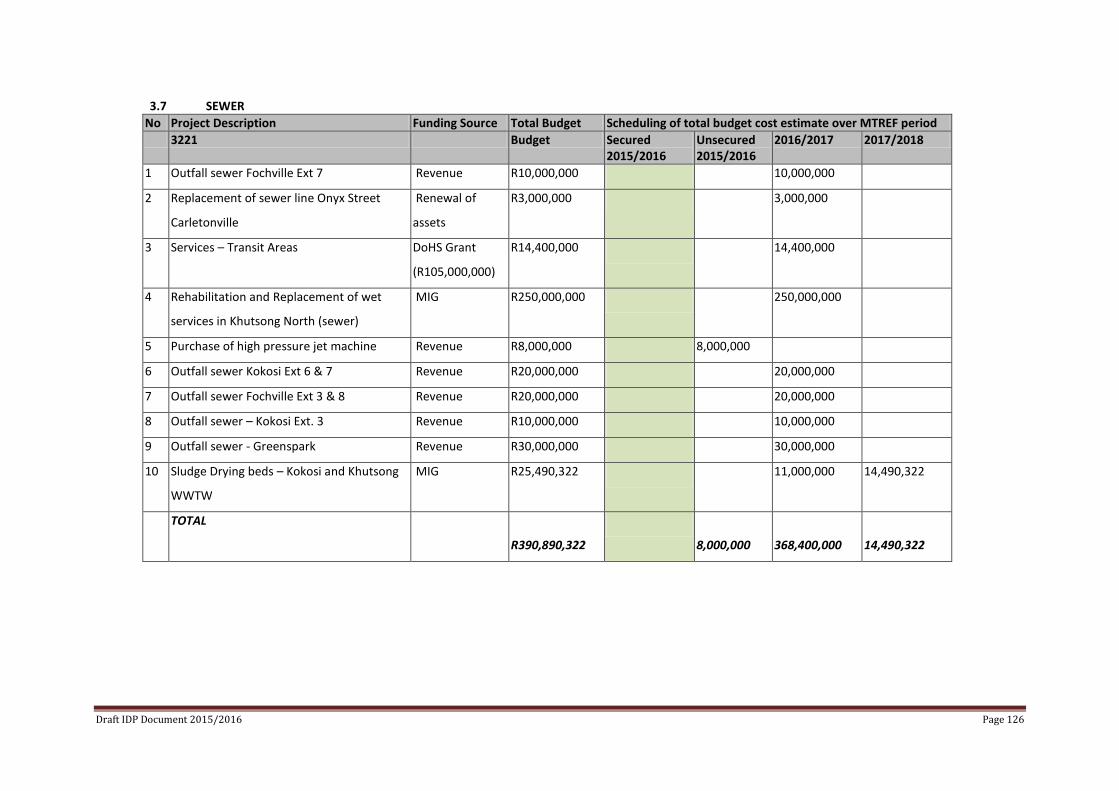
Draft IDP Document 2015/2016 Page 126
3.7 SEWER
No Project Description Funding Source Total Budget Scheduling of total budget cost estimate over MTREF period
3221 Budget Secured 2015/2016
Unsecured 2015/2016
2016/2017 2017/2018
1 Outfall sewer Fochville Ext 7 Revenue R10,000,000 10,000,000
2 Replacement of sewer line Onyx Street
Carletonville
Renewal of
assets
R3,000,000 3,000,000
3 Services – Transit Areas DoHS Grant
(R105,000,000)
R14,400,000 14,400,000
4 Rehabilitation and Replacement of wet
services in Khutsong North (sewer)
MIG R250,000,000 250,000,000
5 Purchase of high pressure jet machine Revenue R8,000,000 8,000,000
6 Outfall sewer Kokosi Ext 6 & 7 Revenue R20,000,000 20,000,000
7 Outfall sewer Fochville Ext 3 & 8 Revenue R20,000,000 20,000,000
8 Outfall sewer – Kokosi Ext. 3 Revenue R10,000,000 10,000,000
9 Outfall sewer - Greenspark Revenue R30,000,000 30,000,000
10 Sludge Drying beds – Kokosi and Khutsong
WWTW
MIG R25,490,322 11,000,000 14,490,322
TOTAL
R390,890,322
8,000,000 368,400,000
14,490,322
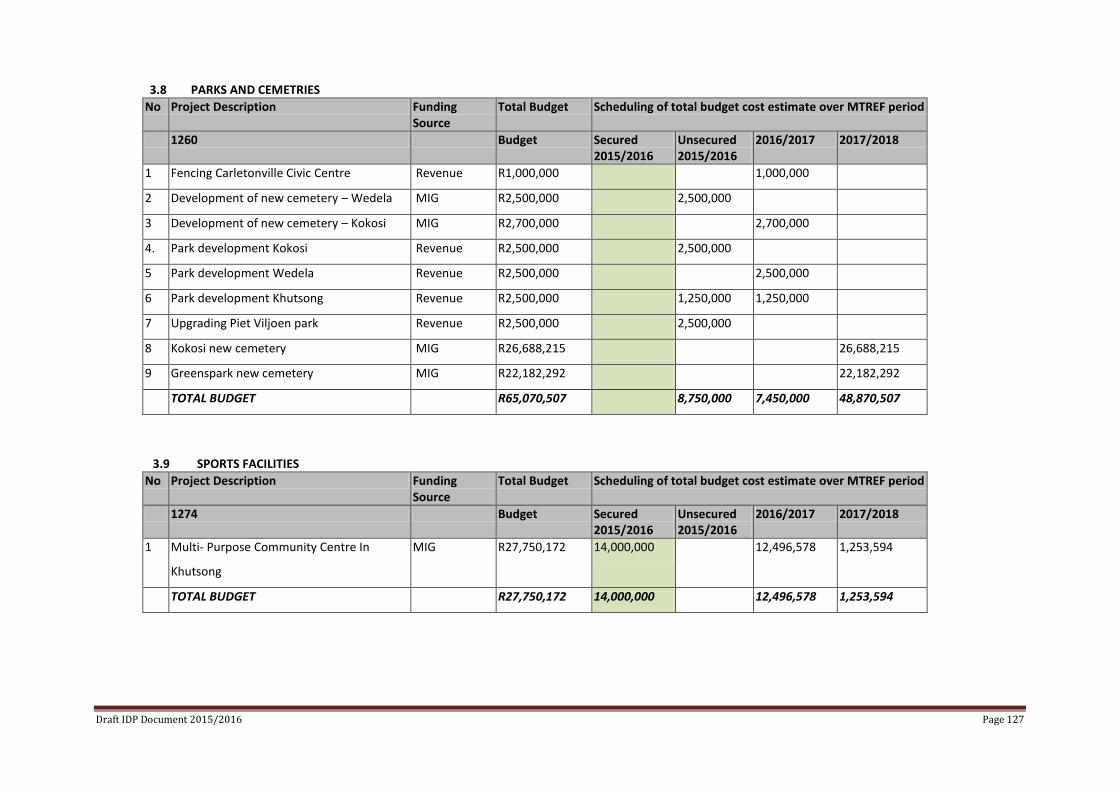
Draft IDP Document 2015/2016 Page 127
3.8 PARKS AND CEMETRIES
No Project Description Funding Source
Total Budget Scheduling of total budget cost estimate over MTREF period
1260 Budget Secured 2015/2016
Unsecured 2015/2016
2016/2017 2017/2018
1 Fencing Carletonville Civic Centre Revenue R1,000,000 1,000,000
2 Development of new cemetery – Wedela MIG R2,500,000 2,500,000
3 Development of new cemetery – Kokosi MIG R2,700,000 2,700,000
4. Park development Kokosi Revenue R2,500,000 2,500,000
5 Park development Wedela Revenue R2,500,000 2,500,000
6 Park development Khutsong Revenue R2,500,000 1,250,000 1,250,000
7 Upgrading Piet Viljoen park Revenue R2,500,000 2,500,000
8 Kokosi new cemetery MIG R26,688,215 26,688,215
9 Greenspark new cemetery MIG R22,182,292 22,182,292
TOTAL BUDGET R65,070,507 8,750,000 7,450,000 48,870,507
3.9 SPORTS FACILITIES
No Project Description Funding Source
Total Budget Scheduling of total budget cost estimate over MTREF period
1274 Budget Secured 2015/2016
Unsecured 2015/2016
2016/2017 2017/2018
1 Multi- Purpose Community Centre In
Khutsong
MIG R27,750,172 14,000,000 12,496,578 1,253,594
TOTAL BUDGET R27,750,172 14,000,000 12,496,578 1,253,594
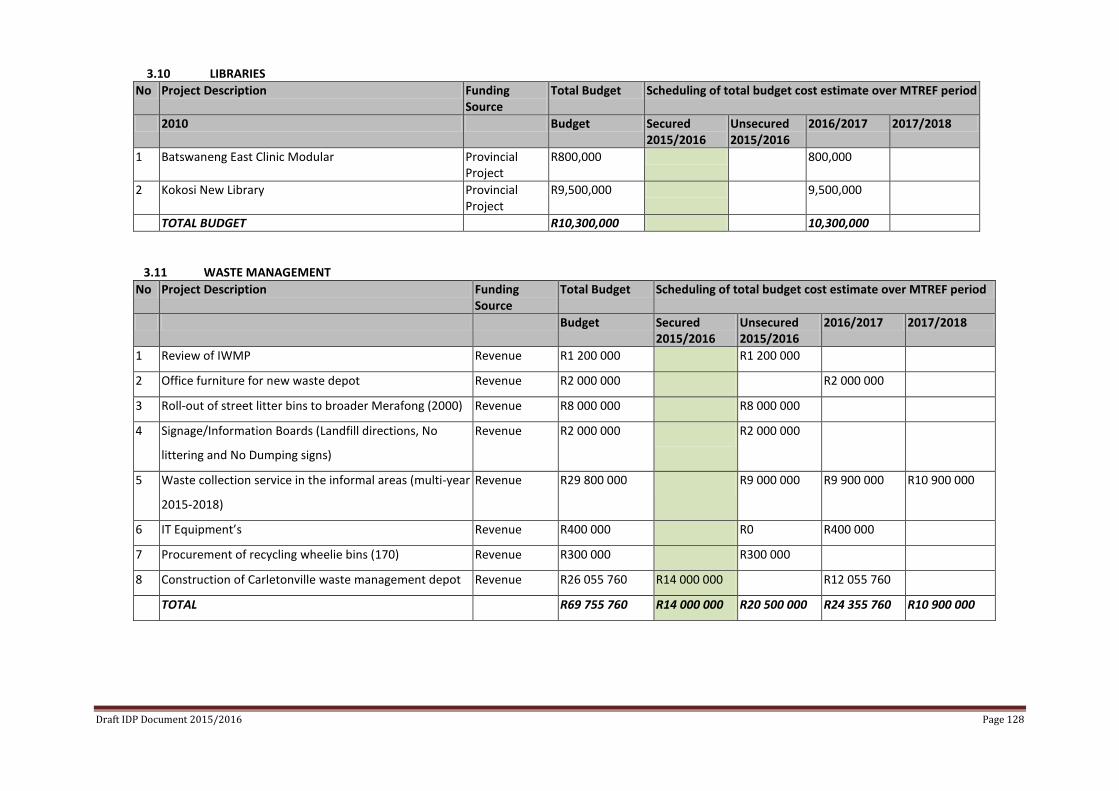
Draft IDP Document 2015/2016 Page 128
3.10 LIBRARIES
No Project Description Funding Source
Total Budget Scheduling of total budget cost estimate over MTREF period
2010 Budget Secured 2015/2016
Unsecured 2015/2016
2016/2017 2017/2018
1 Batswaneng East Clinic Modular Provincial Project
R800,000 800,000
2 Kokosi New Library Provincial Project
R9,500,000 9,500,000
TOTAL BUDGET R10,300,000 10,300,000
3.11 WASTE MANAGEMENT
No Project Description Funding Source
Total Budget Scheduling of total budget cost estimate over MTREF period
Budget Secured 2015/2016
Unsecured 2015/2016
2016/2017 2017/2018
1 Review of IWMP Revenue R1 200 000 R1 200 000
2 Office furniture for new waste depot Revenue R2 000 000 R2 000 000
3 Roll-out of street litter bins to broader Merafong (2000) Revenue R8 000 000 R8 000 000
4 Signage/Information Boards (Landfill directions, No
littering and No Dumping signs)
Revenue R2 000 000 R2 000 000
5 Waste collection service in the informal areas (multi-year
2015-2018)
Revenue R29 800 000 R9 000 000 R9 900 000 R10 900 000
6 IT Equipment’s Revenue R400 000 R0 R400 000
7 Procurement of recycling wheelie bins (170) Revenue R300 000 R300 000
8 Construction of Carletonville waste management depot Revenue R26 055 760 R14 000 000 R12 055 760
TOTAL R69 755 760 R14 000 000 R20 500 000 R24 355 760 R10 900 000
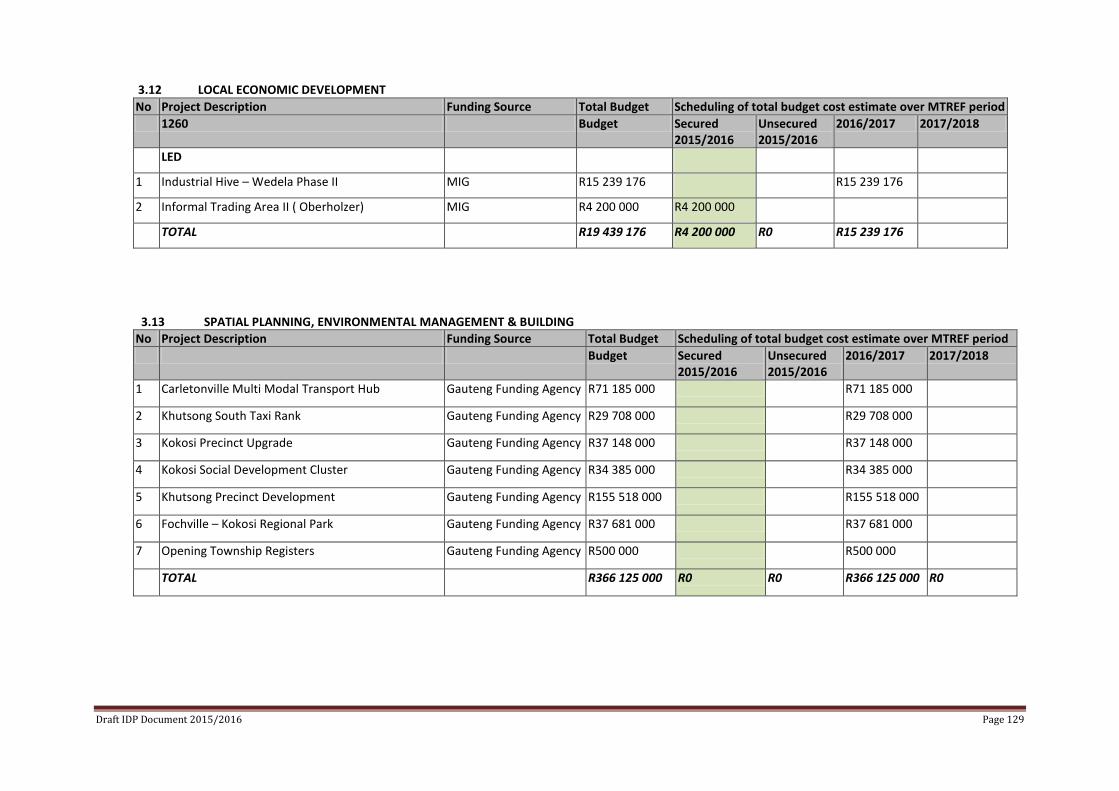
Draft IDP Document 2015/2016 Page 129
3.12 LOCAL ECONOMIC DEVELOPMENT
No Project Description Funding Source Total Budget Scheduling of total budget cost estimate over MTREF period
1260 Budget Secured 2015/2016
Unsecured 2015/2016
2016/2017 2017/2018
LED
1 Industrial Hive – Wedela Phase II MIG R15 239 176 R15 239 176
2 Informal Trading Area II ( Oberholzer) MIG R4 200 000 R4 200 000
TOTAL R19 439 176 R4 200 000 R0 R15 239 176
3.13 SPATIAL PLANNING, ENVIRONMENTAL MANAGEMENT & BUILDING
No Project Description Funding Source Total Budget Scheduling of total budget cost estimate over MTREF period
Budget Secured 2015/2016
Unsecured 2015/2016
2016/2017 2017/2018
1 Carletonville Multi Modal Transport Hub Gauteng Funding Agency R71 185 000 R71 185 000
2 Khutsong South Taxi Rank Gauteng Funding Agency R29 708 000 R29 708 000
3 Kokosi Precinct Upgrade Gauteng Funding Agency R37 148 000 R37 148 000
4 Kokosi Social Development Cluster Gauteng Funding Agency R34 385 000 R34 385 000
5 Khutsong Precinct Development Gauteng Funding Agency R155 518 000 R155 518 000
6 Fochville – Kokosi Regional Park Gauteng Funding Agency R37 681 000 R37 681 000
7 Opening Township Registers Gauteng Funding Agency R500 000 R500 000
TOTAL R366 125 000 R0 R0 R366 125 000 R0
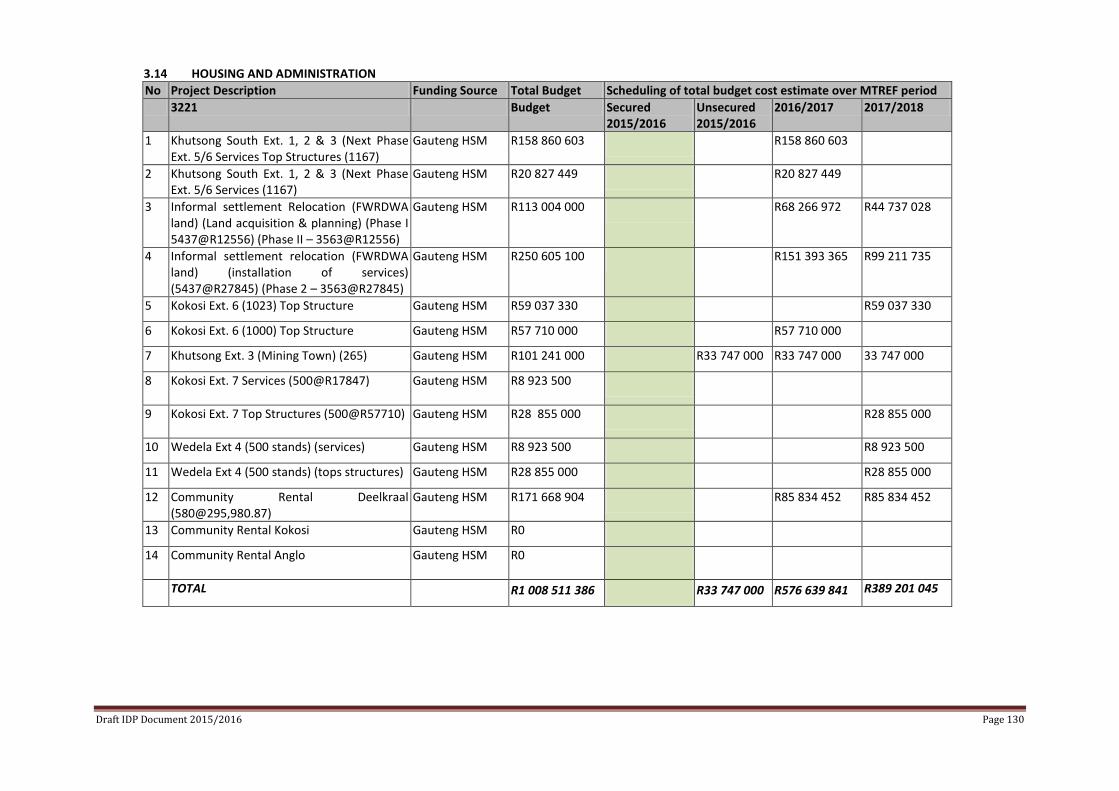
Draft IDP Document 2015/2016 Page 130
3.14 HOUSING AND ADMINISTRATION
No Project Description Funding Source Total Budget Scheduling of total budget cost estimate over MTREF period
3221 Budget Secured 2015/2016
Unsecured 2015/2016
2016/2017 2017/2018
1 Khutsong South Ext. 1, 2 & 3 (Next Phase Ext. 5/6 Services Top Structures (1167)
Gauteng HSM R158 860 603 R158 860 603
2 Khutsong South Ext. 1, 2 & 3 (Next Phase Ext. 5/6 Services (1167)
Gauteng HSM R20 827 449 R20 827 449
3 Informal settlement Relocation (FWRDWA land) (Land acquisition & planning) (Phase I 5437@R12556) (Phase II – 3563@R12556)
Gauteng HSM R113 004 000 R68 266 972 R44 737 028
4 Informal settlement relocation (FWRDWA land) (installation of services) (5437@R27845) (Phase 2 – 3563@R27845)
Gauteng HSM R250 605 100 R151 393 365 R99 211 735
5 Kokosi Ext. 6 (1023) Top Structure Gauteng HSM R59 037 330 R59 037 330
6 Kokosi Ext. 6 (1000) Top Structure Gauteng HSM R57 710 000 R57 710 000
7 Khutsong Ext. 3 (Mining Town) (265) Gauteng HSM R101 241 000 R33 747 000 R33 747 000 33 747 000
8 Kokosi Ext. 7 Services (500@R17847)
Gauteng HSM R8 923 500
9 Kokosi Ext. 7 Top Structures (500@R57710)
Gauteng HSM R28 855 000 R28 855 000
10 Wedela Ext 4 (500 stands) (services) Gauteng HSM R8 923 500 R8 923 500
11 Wedela Ext 4 (500 stands) (tops structures) Gauteng HSM R28 855 000 R28 855 000
12 Community Rental Deelkraal (580@295,980.87)
Gauteng HSM R171 668 904 R85 834 452 R85 834 452
13 Community Rental Kokosi Gauteng HSM R0
14 Community Rental Anglo
Gauteng HSM R0
TOTAL R1 008 511 386 R33 747 000 R576 639 841 R389 201 045
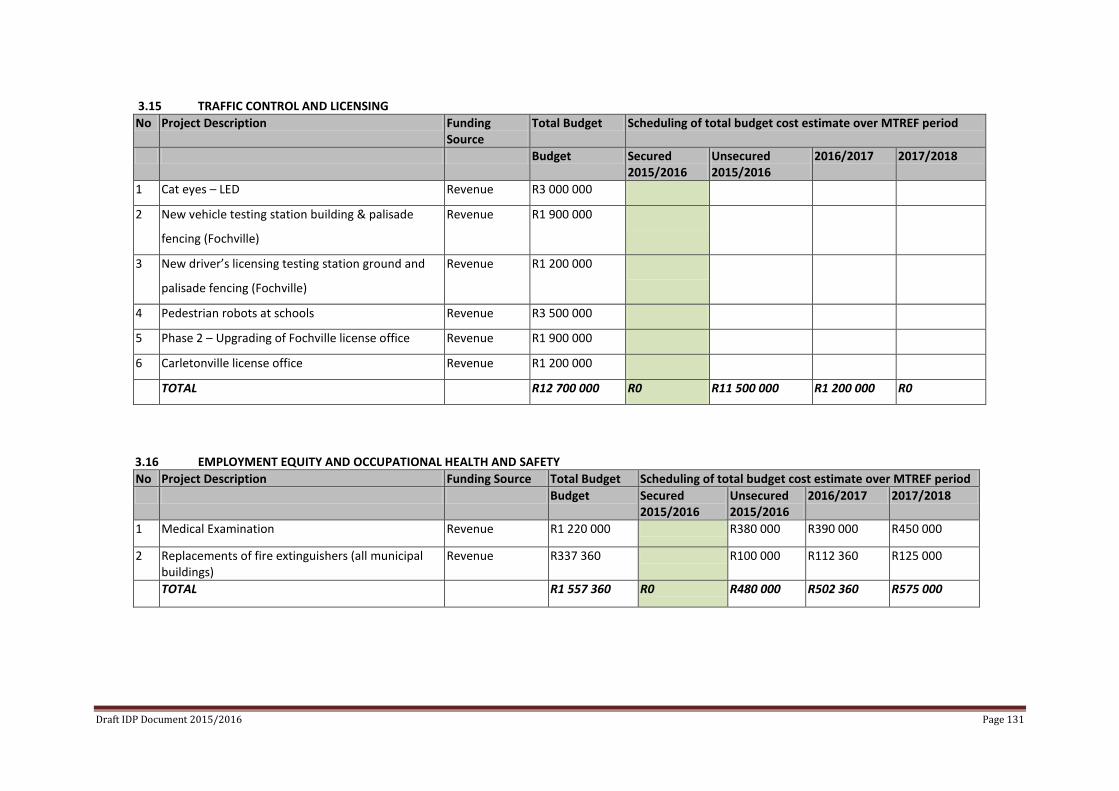
Draft IDP Document 2015/2016 Page 131
3.15 TRAFFIC CONTROL AND LICENSING
No Project Description Funding Source
Total Budget Scheduling of total budget cost estimate over MTREF period
Budget Secured 2015/2016
Unsecured 2015/2016
2016/2017 2017/2018
1 Cat eyes – LED Revenue R3 000 000
2 New vehicle testing station building & palisade
fencing (Fochville)
Revenue R1 900 000
3 New driver’s licensing testing station ground and
palisade fencing (Fochville)
Revenue R1 200 000
4 Pedestrian robots at schools Revenue R3 500 000
5 Phase 2 – Upgrading of Fochville license office Revenue R1 900 000
6 Carletonville license office Revenue R1 200 000
TOTAL R12 700 000 R0 R11 500 000 R1 200 000 R0
3.16 EMPLOYMENT EQUITY AND OCCUPATIONAL HEALTH AND SAFETY
No Project Description Funding Source Total Budget Scheduling of total budget cost estimate over MTREF period
Budget Secured 2015/2016
Unsecured 2015/2016
2016/2017 2017/2018
1 Medical Examination Revenue R1 220 000 R380 000 R390 000 R450 000
2 Replacements of fire extinguishers (all municipal buildings)
Revenue R337 360 R100 000 R112 360 R125 000
TOTAL R1 557 360 R0 R480 000 R502 360 R575 000
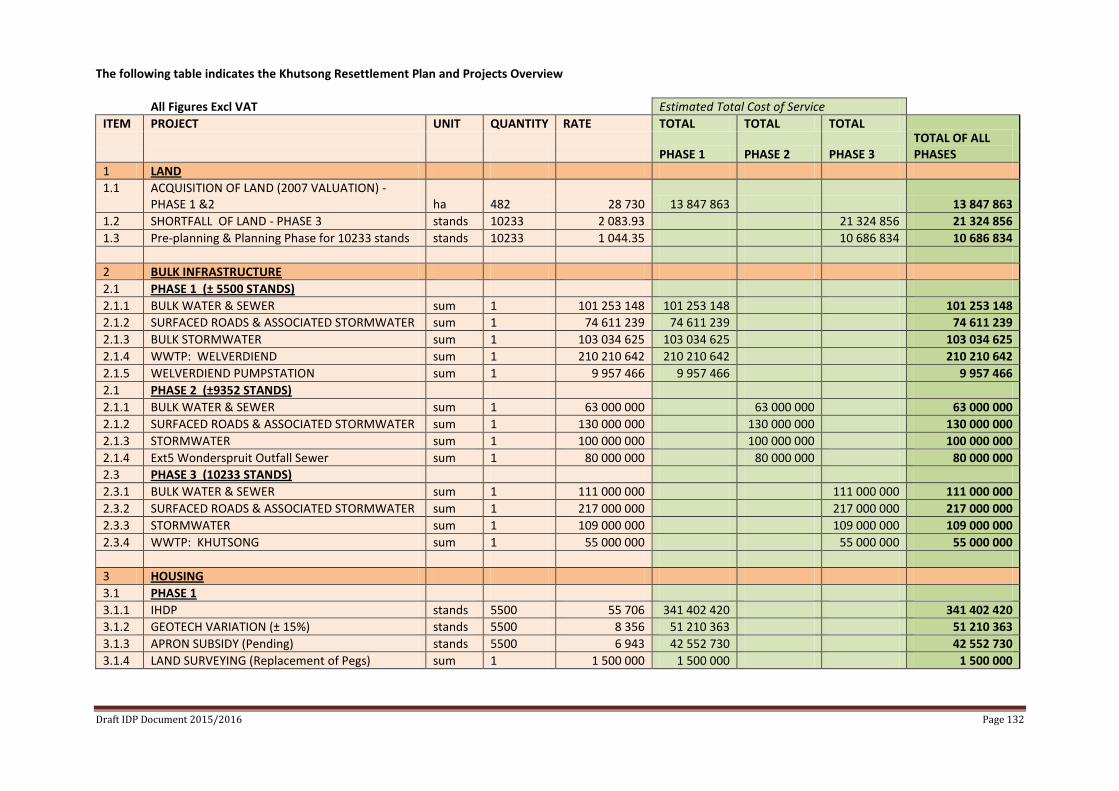
Draft IDP Document 2015/2016 Page 132
The following table indicates the Khutsong Resettlement Plan and Projects Overview
All Figures Excl VAT
Estimated Total Cost of Service ITEM PROJECT UNIT QUANTITY RATE TOTAL TOTAL TOTAL TOTAL OF ALL PHASES
PHASE 1 PHASE 2 PHASE 3
1 LAND
1.1 ACQUISITION OF LAND (2007 VALUATION) - PHASE 1 &2 ha 482 28 730 13 847 863 13 847 863
1.2 SHORTFALL OF LAND - PHASE 3 stands 10233 2 083.93 21 324 856 21 324 856
1.3 Pre-planning & Planning Phase for 10233 stands stands 10233 1 044.35 10 686 834 10 686 834
2 BULK INFRASTRUCTURE
2.1 PHASE 1 (± 5500 STANDS)
2.1.1 BULK WATER & SEWER sum 1 101 253 148 101 253 148 101 253 148
2.1.2 SURFACED ROADS & ASSOCIATED STORMWATER sum 1 74 611 239 74 611 239 74 611 239
2.1.3 BULK STORMWATER sum 1 103 034 625 103 034 625 103 034 625
2.1.4 WWTP: WELVERDIEND sum 1 210 210 642 210 210 642 210 210 642
2.1.5 WELVERDIEND PUMPSTATION sum 1 9 957 466 9 957 466 9 957 466
2.1 PHASE 2 (±9352 STANDS)
2.1.1 BULK WATER & SEWER sum 1 63 000 000 63 000 000 63 000 000
2.1.2 SURFACED ROADS & ASSOCIATED STORMWATER sum 1 130 000 000 130 000 000 130 000 000
2.1.3 STORMWATER sum 1 100 000 000 100 000 000 100 000 000
2.1.4 Ext5 Wonderspruit Outfall Sewer sum 1 80 000 000 80 000 000 80 000 000
2.3 PHASE 3 (10233 STANDS)
2.3.1 BULK WATER & SEWER sum 1 111 000 000 111 000 000 111 000 000
2.3.2 SURFACED ROADS & ASSOCIATED STORMWATER sum 1 217 000 000 217 000 000 217 000 000
2.3.3 STORMWATER sum 1 109 000 000 109 000 000 109 000 000
2.3.4 WWTP: KHUTSONG sum 1 55 000 000 55 000 000 55 000 000
3 HOUSING
3.1 PHASE 1
3.1.1 IHDP stands 5500 55 706 341 402 420 341 402 420
3.1.2 GEOTECH VARIATION (± 15%) stands 5500 8 356 51 210 363 51 210 363
3.1.3 APRON SUBSIDY (Pending) stands 5500 6 943 42 552 730 42 552 730
3.1.4 LAND SURVEYING (Replacement of Pegs) sum 1 1 500 000 1 500 000 1 500 000
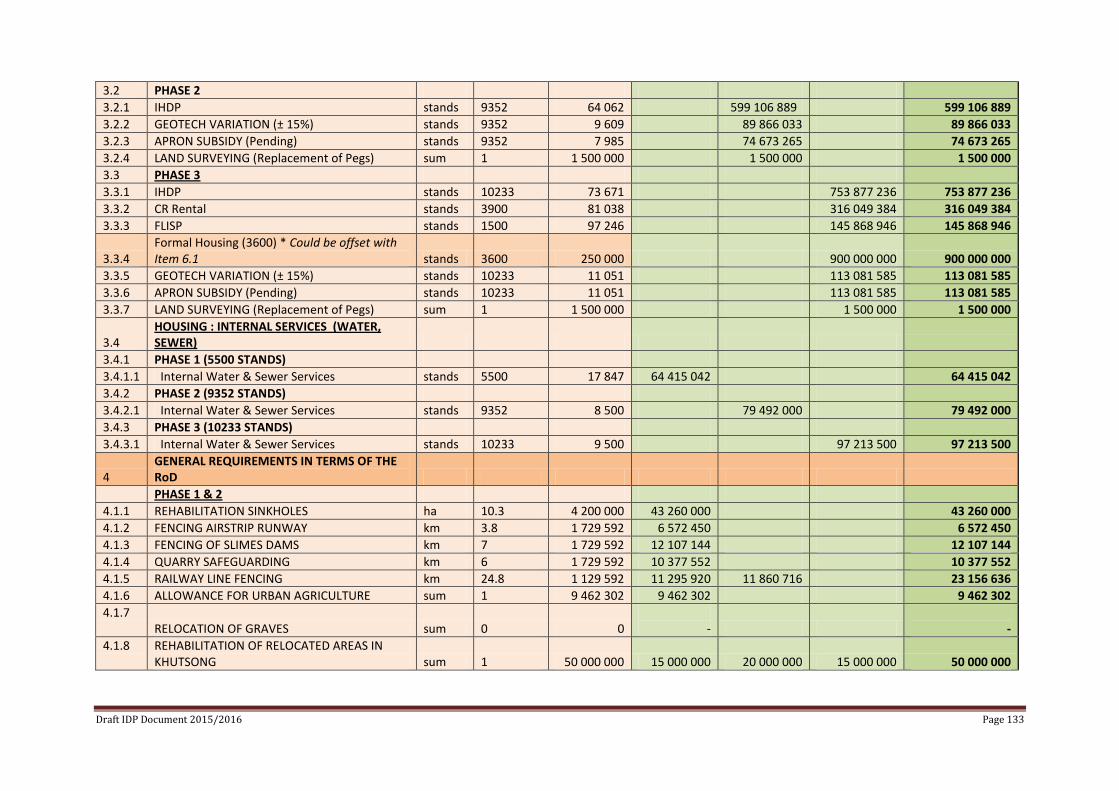
Draft IDP Document 2015/2016 Page 133
3.2 PHASE 2
3.2.1 IHDP stands 9352 64 062 599 106 889 599 106 889
3.2.2 GEOTECH VARIATION (± 15%) stands 9352 9 609 89 866 033 89 866 033
3.2.3 APRON SUBSIDY (Pending) stands 9352 7 985 74 673 265 74 673 265
3.2.4 LAND SURVEYING (Replacement of Pegs) sum 1 1 500 000 1 500 000 1 500 000
3.3 PHASE 3
3.3.1 IHDP stands 10233 73 671 753 877 236 753 877 236
3.3.2 CR Rental stands 3900 81 038 316 049 384 316 049 384
3.3.3 FLISP stands 1500 97 246 145 868 946 145 868 946
3.3.4 Formal Housing (3600) * Could be offset with Item 6.1 stands 3600 250 000 900 000 000 900 000 000
3.3.5 GEOTECH VARIATION (± 15%) stands 10233 11 051 113 081 585 113 081 585
3.3.6 APRON SUBSIDY (Pending) stands 10233 11 051 113 081 585 113 081 585
3.3.7 LAND SURVEYING (Replacement of Pegs) sum 1 1 500 000 1 500 000 1 500 000
3.4 HOUSING : INTERNAL SERVICES (WATER, SEWER)
3.4.1 PHASE 1 (5500 STANDS)
3.4.1.1 Internal Water & Sewer Services stands 5500 17 847 64 415 042 64 415 042
3.4.2 PHASE 2 (9352 STANDS)
3.4.2.1 Internal Water & Sewer Services stands 9352 8 500 79 492 000 79 492 000
3.4.3 PHASE 3 (10233 STANDS)
3.4.3.1 Internal Water & Sewer Services stands 10233 9 500 97 213 500 97 213 500
4 GENERAL REQUIREMENTS IN TERMS OF THE RoD
PHASE 1 & 2
4.1.1 REHABILITATION SINKHOLES ha 10.3 4 200 000 43 260 000 43 260 000
4.1.2 FENCING AIRSTRIP RUNWAY km 3.8 1 729 592 6 572 450 6 572 450
4.1.3 FENCING OF SLIMES DAMS km 7 1 729 592 12 107 144 12 107 144
4.1.4 QUARRY SAFEGUARDING km 6 1 729 592 10 377 552 10 377 552
4.1.5 RAILWAY LINE FENCING km 24.8 1 129 592 11 295 920 11 860 716 23 156 636
4.1.6 ALLOWANCE FOR URBAN AGRICULTURE sum 1 9 462 302 9 462 302 9 462 302
4.1.7 RELOCATION OF GRAVES sum 0 0
-
-
4.1.8 REHABILITATION OF RELOCATED AREAS IN KHUTSONG sum 1 50 000 000 15 000 000 20 000 000 15 000 000 50 000 000
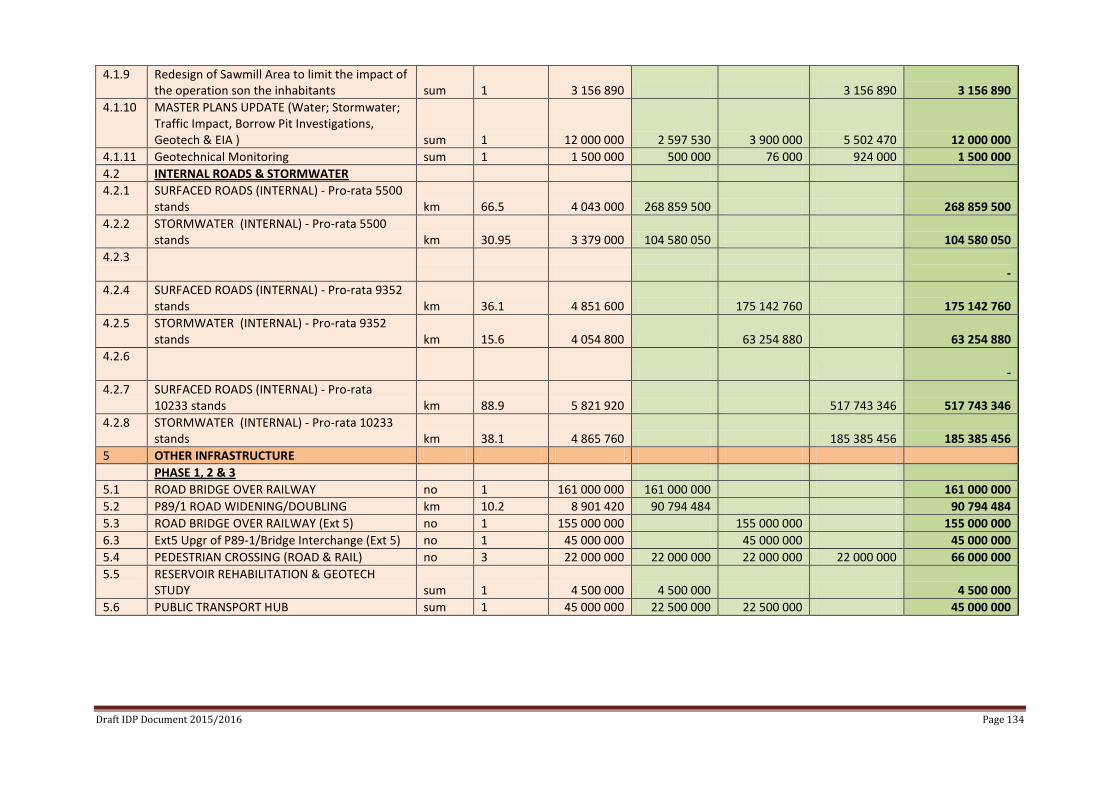
Draft IDP Document 2015/2016 Page 134
4.1.9 Redesign of Sawmill Area to limit the impact of the operation son the inhabitants sum 1 3 156 890 3 156 890 3 156 890
4.1.10 MASTER PLANS UPDATE (Water; Stormwater; Traffic Impact, Borrow Pit Investigations, Geotech & EIA ) sum 1 12 000 000 2 597 530 3 900 000 5 502 470 12 000 000
4.1.11 Geotechnical Monitoring sum 1 1 500 000 500 000 76 000 924 000 1 500 000
4.2 INTERNAL ROADS & STORMWATER
4.2.1 SURFACED ROADS (INTERNAL) - Pro-rata 5500 stands km 66.5 4 043 000 268 859 500 268 859 500
4.2.2 STORMWATER (INTERNAL) - Pro-rata 5500 stands km 30.95 3 379 000 104 580 050 104 580 050
4.2.3
-
4.2.4 SURFACED ROADS (INTERNAL) - Pro-rata 9352 stands km 36.1 4 851 600 175 142 760 175 142 760
4.2.5 STORMWATER (INTERNAL) - Pro-rata 9352 stands km 15.6 4 054 800 63 254 880 63 254 880
4.2.6
-
4.2.7 SURFACED ROADS (INTERNAL) - Pro-rata 10233 stands km 88.9 5 821 920 517 743 346 517 743 346
4.2.8 STORMWATER (INTERNAL) - Pro-rata 10233 stands km 38.1 4 865 760 185 385 456 185 385 456
5 OTHER INFRASTRUCTURE
PHASE 1, 2 & 3
5.1 ROAD BRIDGE OVER RAILWAY no 1 161 000 000 161 000 000 161 000 000
5.2 P89/1 ROAD WIDENING/DOUBLING km 10.2 8 901 420 90 794 484 90 794 484
5.3 ROAD BRIDGE OVER RAILWAY (Ext 5) no 1 155 000 000 155 000 000 155 000 000
6.3 Ext5 Upgr of P89-1/Bridge Interchange (Ext 5) no 1 45 000 000 45 000 000 45 000 000
5.4 PEDESTRIAN CROSSING (ROAD & RAIL) no 3 22 000 000 22 000 000 22 000 000 22 000 000 66 000 000
5.5 RESERVOIR REHABILITATION & GEOTECH STUDY sum 1 4 500 000 4 500 000 4 500 000
5.6 PUBLIC TRANSPORT HUB sum 1 45 000 000 22 500 000 22 500 000 45 000 000
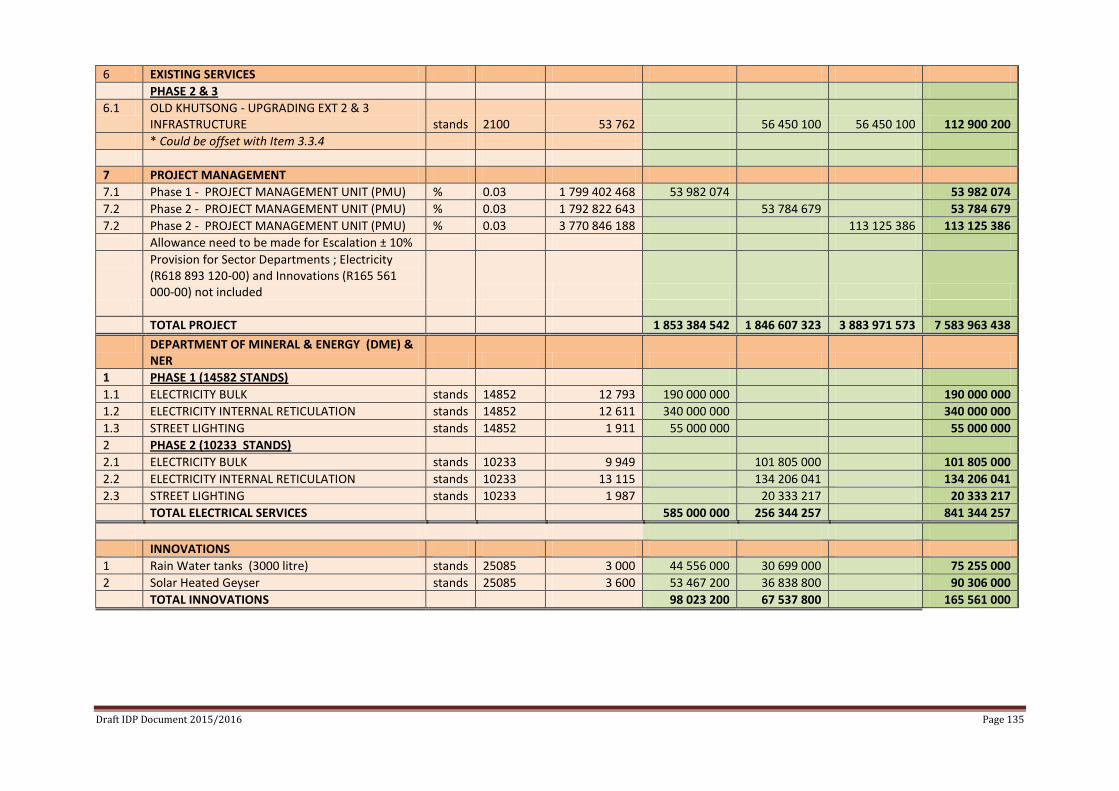
Draft IDP Document 2015/2016 Page 135
6 EXISTING SERVICES
PHASE 2 & 3
6.1 OLD KHUTSONG - UPGRADING EXT 2 & 3 INFRASTRUCTURE stands 2100 53 762 56 450 100 56 450 100 112 900 200
* Could be offset with Item 3.3.4
7 PROJECT MANAGEMENT
7.1 Phase 1 - PROJECT MANAGEMENT UNIT (PMU) % 0.03 1 799 402 468 53 982 074 53 982 074
7.2 Phase 2 - PROJECT MANAGEMENT UNIT (PMU) % 0.03 1 792 822 643 53 784 679 53 784 679
7.2 Phase 2 - PROJECT MANAGEMENT UNIT (PMU) % 0.03 3 770 846 188 113 125 386 113 125 386
Allowance need to be made for Escalation ± 10%
Provision for Sector Departments ; Electricity (R618 893 120-00) and Innovations (R165 561 000-00) not included
TOTAL PROJECT 1 853 384 542 1 846 607 323 3 883 971 573 7 583 963 438
DEPARTMENT OF MINERAL & ENERGY (DME) & NER
1 PHASE 1 (14582 STANDS)
1.1 ELECTRICITY BULK stands 14852 12 793 190 000 000 190 000 000
1.2 ELECTRICITY INTERNAL RETICULATION stands 14852 12 611 340 000 000 340 000 000
1.3 STREET LIGHTING stands 14852 1 911 55 000 000 55 000 000
2 PHASE 2 (10233 STANDS)
2.1 ELECTRICITY BULK stands 10233 9 949 101 805 000 101 805 000
2.2 ELECTRICITY INTERNAL RETICULATION stands 10233 13 115 134 206 041 134 206 041
2.3 STREET LIGHTING stands 10233 1 987 20 333 217 20 333 217
TOTAL ELECTRICAL SERVICES 585 000 000 256 344 257 841 344 257
INNOVATIONS
1 Rain Water tanks (3000 litre) stands 25085 3 000 44 556 000 30 699 000 75 255 000
2 Solar Heated Geyser stands 25085 3 600 53 467 200 36 838 800 90 306 000
TOTAL INNOVATIONS 98 023 200 67 537 800 165 561 000
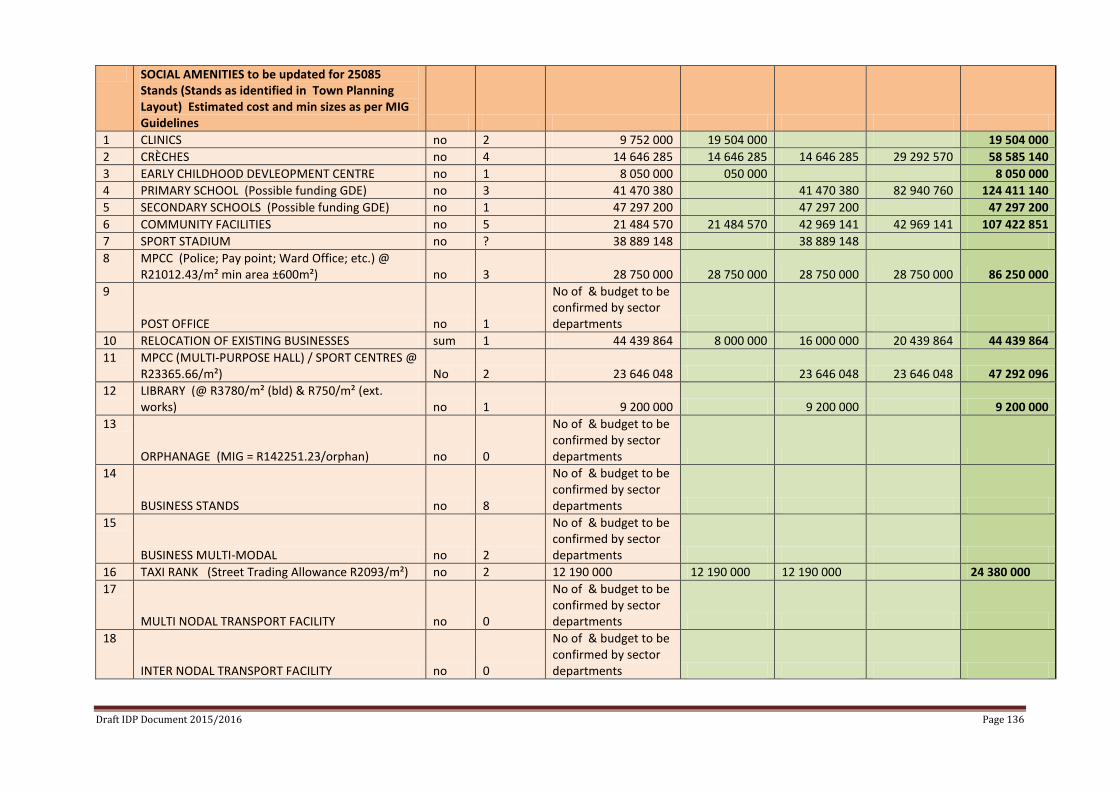
Draft IDP Document 2015/2016 Page 136
SOCIAL AMENITIES to be updated for 25085 Stands (Stands as identified in Town Planning Layout) Estimated cost and min sizes as per MIG Guidelines
1 CLINICS no 2 9 752 000 19 504 000 19 504 000
2 CRÈCHES no 4 14 646 285 14 646 285 14 646 285 29 292 570 58 585 140
3 EARLY CHILDHOOD DEVLEOPMENT CENTRE no 1 8 050 000 050 000 8 050 000
4 PRIMARY SCHOOL (Possible funding GDE) no 3 41 470 380 41 470 380 82 940 760 124 411 140
5 SECONDARY SCHOOLS (Possible funding GDE) no 1 47 297 200 47 297 200 47 297 200
6 COMMUNITY FACILITIES no 5 21 484 570 21 484 570 42 969 141 42 969 141 107 422 851
7 SPORT STADIUM no ? 38 889 148 38 889 148
8 MPCC (Police; Pay point; Ward Office; etc.) @ R21012.43/m² min area ±600m²) no 3 28 750 000 28 750 000 28 750 000 28 750 000 86 250 000
9
POST OFFICE no 1
No of & budget to be confirmed by sector departments
10 RELOCATION OF EXISTING BUSINESSES sum 1 44 439 864 8 000 000 16 000 000 20 439 864 44 439 864
11 MPCC (MULTI-PURPOSE HALL) / SPORT CENTRES @ R23365.66/m²) No 2 23 646 048 23 646 048 23 646 048 47 292 096
12 LIBRARY (@ R3780/m² (bld) & R750/m² (ext. works) no 1 9 200 000 9 200 000 9 200 000
13
ORPHANAGE (MIG = R142251.23/orphan) no 0
No of & budget to be confirmed by sector departments
14
BUSINESS STANDS no 8
No of & budget to be confirmed by sector departments
15
BUSINESS MULTI-MODAL no 2
No of & budget to be confirmed by sector departments
16 TAXI RANK (Street Trading Allowance R2093/m²) no 2 12 190 000 12 190 000 12 190 000 24 380 000
17
MULTI NODAL TRANSPORT FACILITY no 0
No of & budget to be confirmed by sector departments
18
INTER NODAL TRANSPORT FACILITY no 0
No of & budget to be confirmed by sector departments
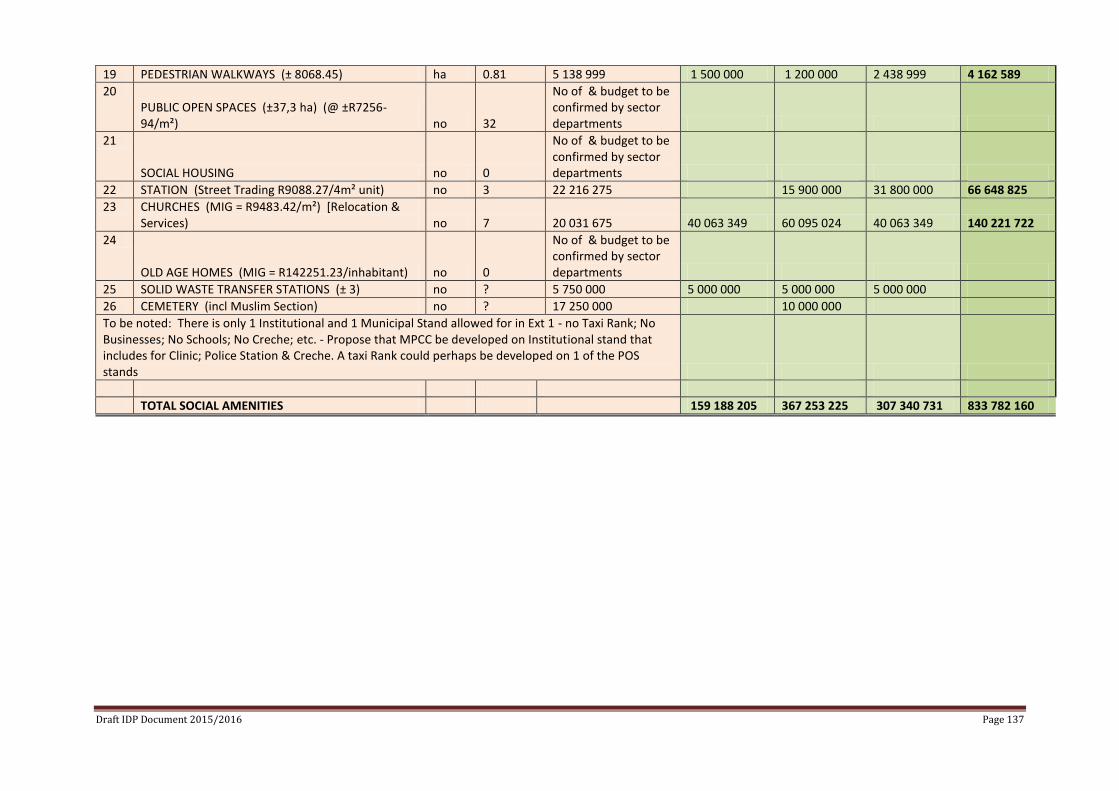
Draft IDP Document 2015/2016 Page 137
19 PEDESTRIAN WALKWAYS (± 8068.45) ha 0.81 5 138 999 1 500 000 1 200 000 2 438 999 4 162 589
20 PUBLIC OPEN SPACES (±37,3 ha) (@ ±R7256-94/m²) no 32
No of & budget to be confirmed by sector departments
21
SOCIAL HOUSING no 0
No of & budget to be confirmed by sector departments
22 STATION (Street Trading R9088.27/4m² unit) no 3 22 216 275 15 900 000 31 800 000 66 648 825
23 CHURCHES (MIG = R9483.42/m²) [Relocation & Services) no 7 20 031 675 40 063 349 60 095 024 40 063 349 140 221 722
24
OLD AGE HOMES (MIG = R142251.23/inhabitant) no 0
No of & budget to be confirmed by sector departments
25 SOLID WASTE TRANSFER STATIONS (± 3) no ? 5 750 000 5 000 000 5 000 000 5 000 000
26 CEMETERY (incl Muslim Section) no ? 17 250 000 10 000 000
To be noted: There is only 1 Institutional and 1 Municipal Stand allowed for in Ext 1 - no Taxi Rank; No Businesses; No Schools; No Creche; etc. - Propose that MPCC be developed on Institutional stand that includes for Clinic; Police Station & Creche. A taxi Rank could perhaps be developed on 1 of the POS stands
TOTAL SOCIAL AMENITIES 159 188 205 367 253 225 307 340 731 833 782 160
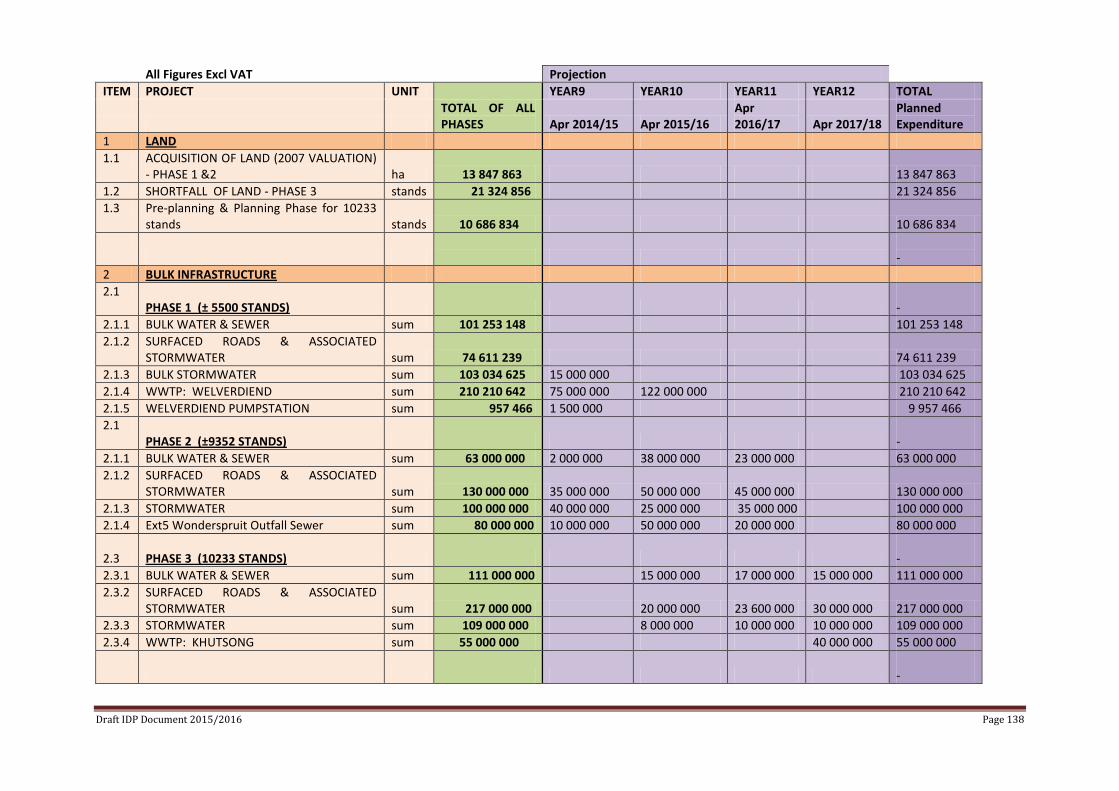
Draft IDP Document 2015/2016 Page 138
All Figures Excl VAT
Projection ITEM PROJECT UNIT
TOTAL OF ALL PHASES
YEAR9 YEAR10 YEAR11 YEAR12 TOTAL
Apr 2014/15 Apr 2015/16
Apr 2016/17 Apr 2017/18
Planned Expenditure
1 LAND
1.1 ACQUISITION OF LAND (2007 VALUATION) - PHASE 1 &2 ha 13 847 863 13 847 863
1.2 SHORTFALL OF LAND - PHASE 3 stands 21 324 856 21 324 856
1.3 Pre-planning & Planning Phase for 10233 stands stands 10 686 834 10 686 834
-
2 BULK INFRASTRUCTURE
2.1 PHASE 1 (± 5500 STANDS)
-
2.1.1 BULK WATER & SEWER sum 101 253 148 101 253 148
2.1.2 SURFACED ROADS & ASSOCIATED STORMWATER sum 74 611 239 74 611 239
2.1.3 BULK STORMWATER sum 103 034 625 15 000 000 103 034 625
2.1.4 WWTP: WELVERDIEND sum 210 210 642 75 000 000 122 000 000 210 210 642
2.1.5 WELVERDIEND PUMPSTATION sum 957 466 1 500 000 9 957 466
2.1 PHASE 2 (±9352 STANDS)
-
2.1.1 BULK WATER & SEWER sum 63 000 000 2 000 000 38 000 000 23 000 000 63 000 000
2.1.2 SURFACED ROADS & ASSOCIATED STORMWATER sum 130 000 000 35 000 000 50 000 000 45 000 000 130 000 000
2.1.3 STORMWATER sum 100 000 000 40 000 000 25 000 000 35 000 000 100 000 000
2.1.4 Ext5 Wonderspruit Outfall Sewer sum 80 000 000 10 000 000 50 000 000 20 000 000 80 000 000
2.3 PHASE 3 (10233 STANDS) -
2.3.1 BULK WATER & SEWER sum 111 000 000 15 000 000 17 000 000 15 000 000 111 000 000
2.3.2 SURFACED ROADS & ASSOCIATED STORMWATER sum 217 000 000 20 000 000 23 600 000 30 000 000 217 000 000
2.3.3 STORMWATER sum 109 000 000 8 000 000 10 000 000 10 000 000 109 000 000
2.3.4 WWTP: KHUTSONG sum 55 000 000 40 000 000 55 000 000
-
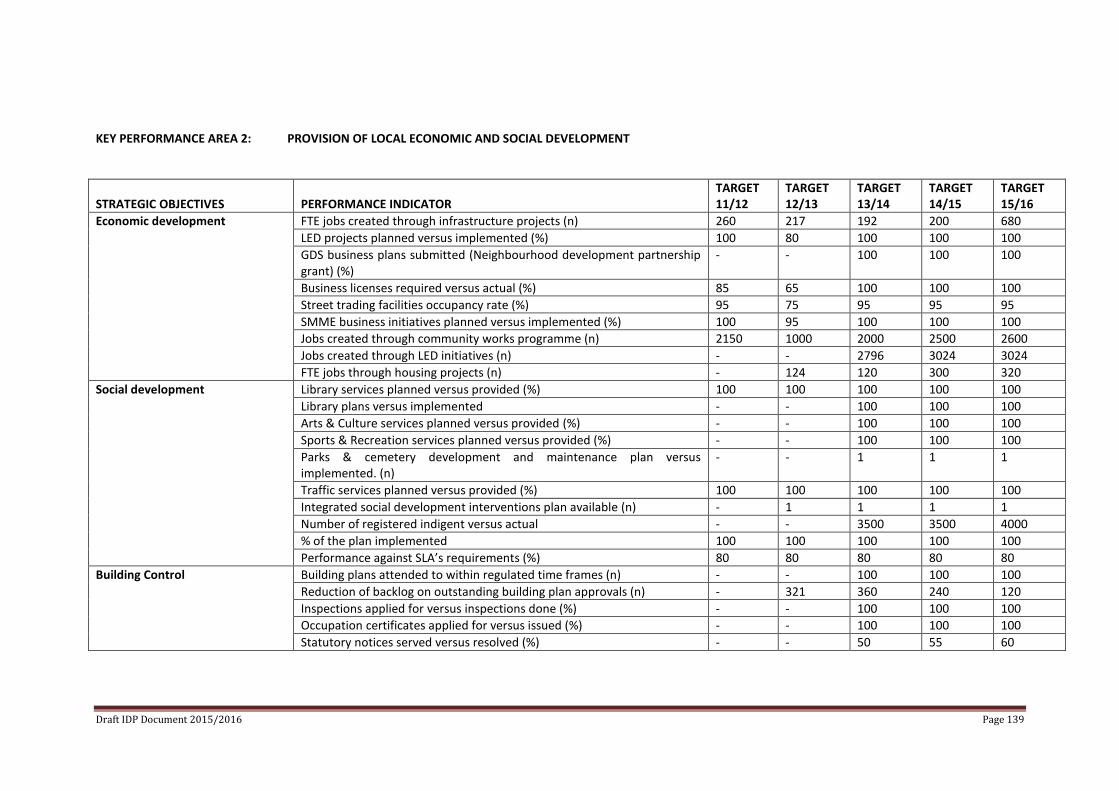
Draft IDP Document 2015/2016 Page 139
KEY PERFORMANCE AREA 2: PROVISION OF LOCAL ECONOMIC AND SOCIAL DEVELOPMENT
STRATEGIC OBJECTIVES
PERFORMANCE INDICATOR
TARGET 11/12
TARGET 12/13
TARGET 13/14
TARGET 14/15
TARGET 15/16
Economic development FTE jobs created through infrastructure projects (n) 260 217 192 200 680
LED projects planned versus implemented (%) 100 80 100 100 100
GDS business plans submitted (Neighbourhood development partnership grant) (%)
- - 100 100 100
Business licenses required versus actual (%) 85 65 100 100 100
Street trading facilities occupancy rate (%) 95 75 95 95 95
SMME business initiatives planned versus implemented (%) 100 95 100 100 100
Jobs created through community works programme (n) 2150 1000 2000 2500 2600
Jobs created through LED initiatives (n) - - 2796 3024 3024
FTE jobs through housing projects (n) - 124 120 300 320
Social development Library services planned versus provided (%) 100 100 100 100 100
Library plans versus implemented - - 100 100 100
Arts & Culture services planned versus provided (%) - - 100 100 100
Sports & Recreation services planned versus provided (%) - - 100 100 100
Parks & cemetery development and maintenance plan versus implemented. (n)
- - 1 1 1
Traffic services planned versus provided (%) 100 100 100 100 100
Integrated social development interventions plan available (n) - 1 1 1 1
Number of registered indigent versus actual - - 3500 3500 4000
% of the plan implemented 100 100 100 100 100
Performance against SLA’s requirements (%) 80 80 80 80 80
Building Control Building plans attended to within regulated time frames (n) - - 100 100 100
Reduction of backlog on outstanding building plan approvals (n) - 321 360 240 120
Inspections applied for versus inspections done (%) - - 100 100 100
Occupation certificates applied for versus issued (%) - - 100 100 100
Statutory notices served versus resolved (%) - - 50 55 60
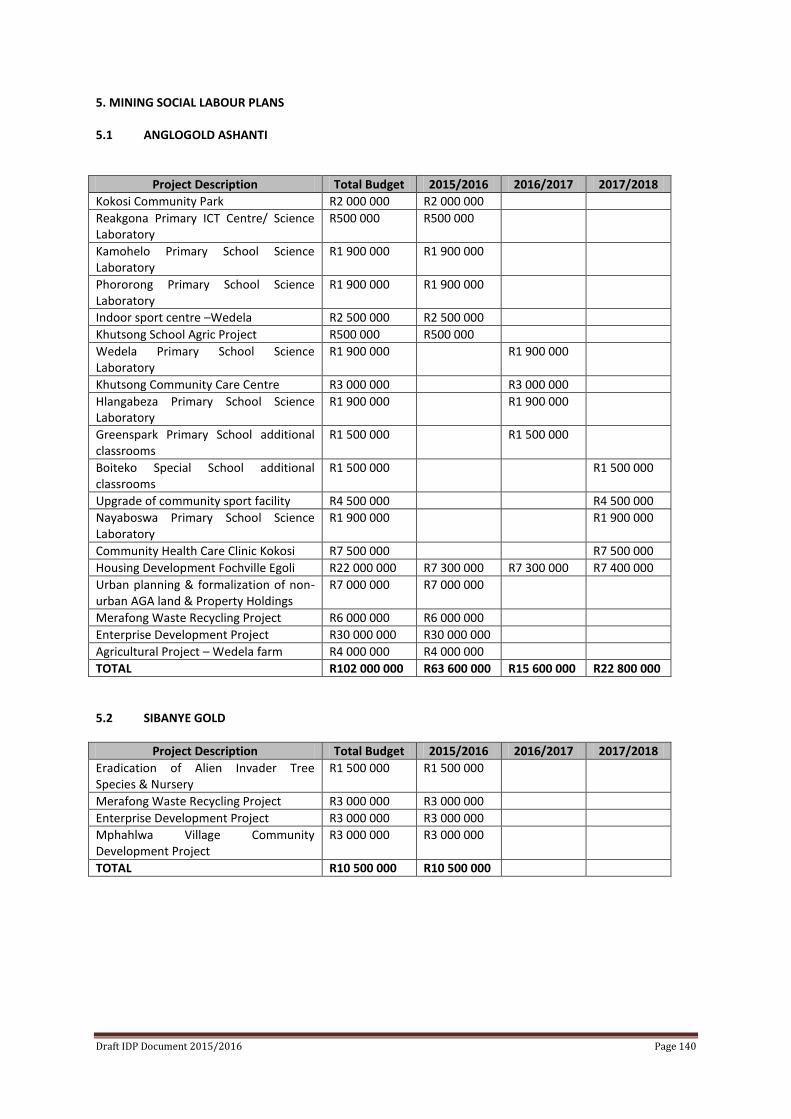
Draft IDP Document 2015/2016 Page 140
5. MINING SOCIAL LABOUR PLANS 5.1 ANGLOGOLD ASHANTI
Project Description Total Budget 2015/2016 2016/2017 2017/2018
Kokosi Community Park R2 000 000 R2 000 000
Reakgona Primary ICT Centre/ Science Laboratory
R500 000 R500 000
Kamohelo Primary School Science Laboratory
R1 900 000 R1 900 000
Phororong Primary School Science Laboratory
R1 900 000 R1 900 000
Indoor sport centre –Wedela R2 500 000 R2 500 000
Khutsong School Agric Project R500 000 R500 000
Wedela Primary School Science Laboratory
R1 900 000 R1 900 000
Khutsong Community Care Centre R3 000 000 R3 000 000
Hlangabeza Primary School Science Laboratory
R1 900 000 R1 900 000
Greenspark Primary School additional classrooms
R1 500 000 R1 500 000
Boiteko Special School additional classrooms
R1 500 000 R1 500 000
Upgrade of community sport facility R4 500 000 R4 500 000
Nayaboswa Primary School Science Laboratory
R1 900 000 R1 900 000
Community Health Care Clinic Kokosi R7 500 000 R7 500 000
Housing Development Fochville Egoli R22 000 000 R7 300 000 R7 300 000 R7 400 000
Urban planning & formalization of non-urban AGA land & Property Holdings
R7 000 000 R7 000 000
Merafong Waste Recycling Project R6 000 000 R6 000 000
Enterprise Development Project R30 000 000 R30 000 000
Agricultural Project – Wedela farm R4 000 000 R4 000 000
TOTAL R102 000 000 R63 600 000 R15 600 000 R22 800 000
5.2 SIBANYE GOLD
Project Description Total Budget 2015/2016 2016/2017 2017/2018
Eradication of Alien Invader Tree Species & Nursery
R1 500 000 R1 500 000
Merafong Waste Recycling Project R3 000 000 R3 000 000
Enterprise Development Project R3 000 000 R3 000 000
Mphahlwa Village Community Development Project
R3 000 000 R3 000 000
TOTAL R10 500 000 R10 500 000
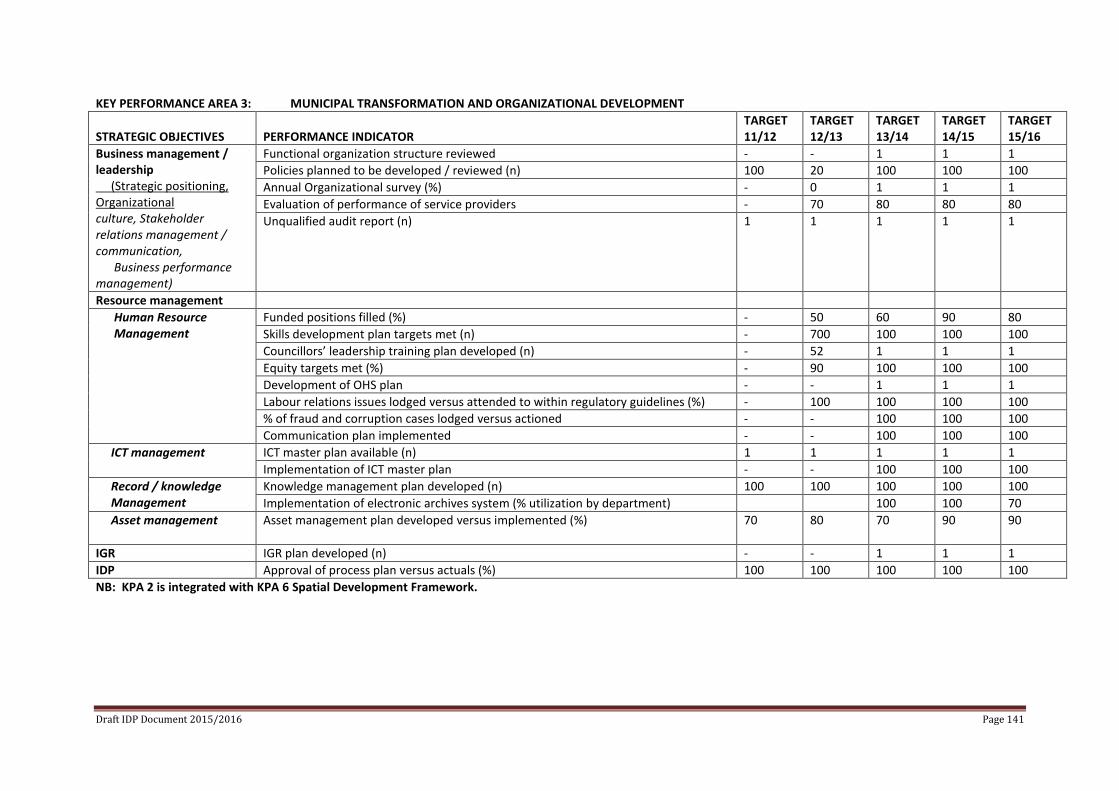
Draft IDP Document 2015/2016 Page 141
KEY PERFORMANCE AREA 3: MUNICIPAL TRANSFORMATION AND ORGANIZATIONAL DEVELOPMENT
STRATEGIC OBJECTIVES
PERFORMANCE INDICATOR
TARGET 11/12
TARGET 12/13
TARGET 13/14
TARGET 14/15
TARGET 15/16
Business management / leadership (Strategic positioning, Organizational culture, Stakeholder relations management / communication, Business performance management)
Functional organization structure reviewed - - 1 1 1
Policies planned to be developed / reviewed (n) 100 20 100 100 100
Annual Organizational survey (%) - 0 1 1 1
Evaluation of performance of service providers - 70 80 80 80
Unqualified audit report (n) 1 1 1 1 1
Resource management
Human Resource Management
Funded positions filled (%) - 50 60 90 80
Skills development plan targets met (n) - 700 100 100 100
Councillors’ leadership training plan developed (n) - 52 1 1 1
Equity targets met (%) - 90 100 100 100
Development of OHS plan - - 1 1 1
Labour relations issues lodged versus attended to within regulatory guidelines (%) - 100 100 100 100
% of fraud and corruption cases lodged versus actioned - - 100 100 100
Communication plan implemented - - 100 100 100
ICT management ICT master plan available (n) 1 1 1 1 1
Implementation of ICT master plan - - 100 100 100
Record / knowledge Management
Knowledge management plan developed (n) 100 100 100 100 100
Implementation of electronic archives system (% utilization by department) 100 100 70
Asset management
Asset management plan developed versus implemented (%) 70 80 70 90 90
IGR IGR plan developed (n) - - 1 1 1
IDP Approval of process plan versus actuals (%) 100 100 100 100 100
NB: KPA 2 is integrated with KPA 6 Spatial Development Framework.
Draft IDP Document 2015/2016 Page 142
Merafong City Local Municipality is a Category B municipality with an Executive Mayor Governance system. The Executive Mayor is supported by 10 full time Mayoral committee members who are responsible for heading their respective portfolios. The Mayoral Committee members chair their respective Section 80 Committees to which specific departments report. The Speaker is the Chairperson of Council and is responsible for overseeing the functioning of Council Merafong City Local Municipality is a Category B municipality with an Executive Mayor Governance system. The Executive Mayor is supported by 10 full time Mayoral committee members who are responsible for heading their respective portfolios. The Mayoral Committee members chair their respective Section 80 Committees to which specific departments report. The Speaker is the Chairperson of Council and is responsible for overseeing the functioning of Council and its committees. The office of the Speaker is further responsible for the establishment and functioning of ward committees. The Chief Whip is responsible for ensuring compliance to the code of conduct by Councillors. MCLM consists of 28 wards in terms of Section 18 (3) of the local government: Municipal Structures Act, 1998 (Act 117 of 1998) which constitutes 28 Ward Councillors and 24 Proportional Representative Councillors. and its committees. The office of the Speaker is further responsible for the establishment and functioning of ward committees. The Chief Whip is responsible for ensuring compliance to the code of conduct by Councillors. MCLM consists of 28 wards in terms of Section 18 (3) of the local government: Municipal Structures Act, 1998
(Act 117 of 1998) which constitutes 28 Ward Councillors and 24 Proportional Representative Councillors.
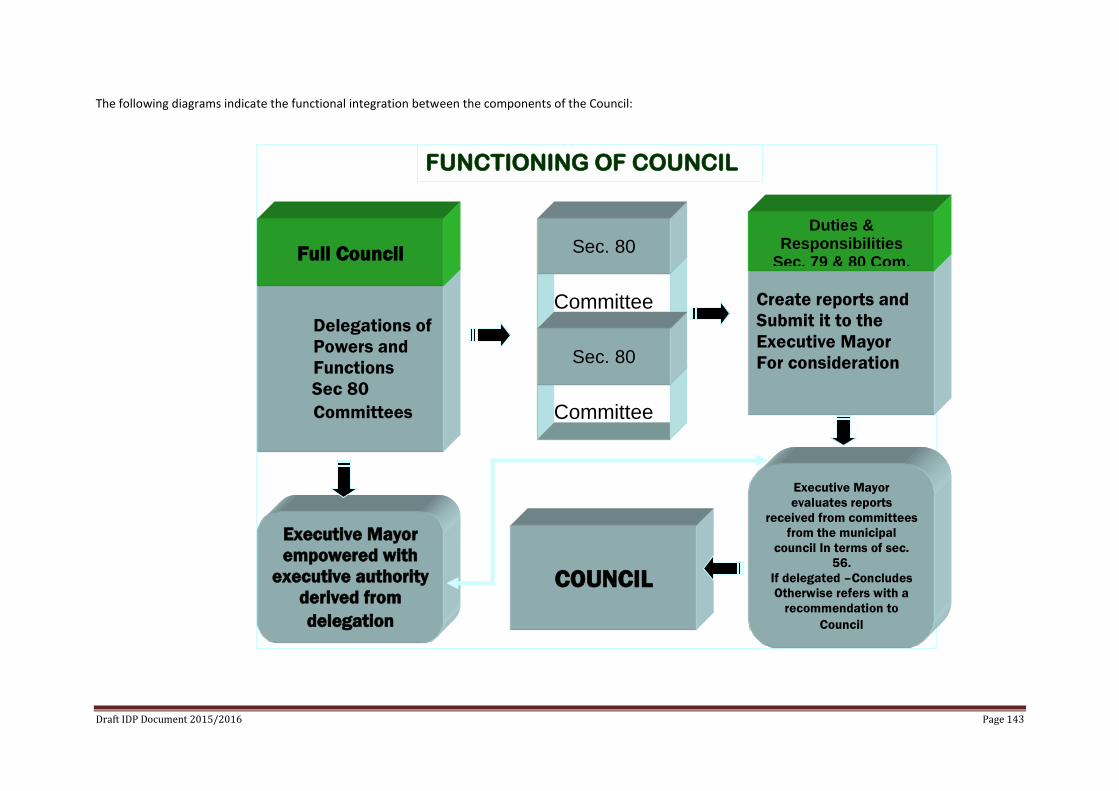
Draft IDP Document 2015/2016 Page 143
FUNCTIONING OF COUNCIL
Executive Mayor
empowered with
executive authority
derived from
delegation
Committee
COUNCIL
Executive Mayor
evaluates reports
received from committees
from the municipal
council In terms of sec.
56.
If delegated –Concludes
Otherwise refers with a
recommendation to
Council
Delegations of
Powers and
Functions
Sec 80
Committees
Full Council
Create reports and
Submit it to the
Executive Mayor
For consideration
Duties & Responsibilities
Sec. 79 & 80 Com.
Committee
Sec. 80
Sec. 80
The following diagrams indicate the functional integration between the components of the Council:

Draft IDP Document 2015/2016 Page 144
KEY PERFORMANCE AREA 4: MUNICIPAL FINANCIAL VIABILITY AND MANAGEMENT
STRATEGIC OBJECTIVES
PERFORMANCE INDICATOR
TARGET 11/12
TARGET 12/13
TARGET 13/14
TARGET 14/15
TARGET 15/16
Financial viability Outstanding debtors to revenue (%) 22.8 22.8 31.80 32.8 35.2
Outstanding service debtors divided by revenue received (ratio) 2.7 2.7 22.60 21.20 19.7
Labour cost to total income (%) 30 30 25.60 30 30
Revenue collected actual versus planned (%) 82 84 90 87 91
Financial management Variance on operational budget spent (%) 10 10 10 10 10
Variance on capital budget spent (%) 15 15 15 15 15
Total amount debt written off against irrecoverable debt versus actuals - - 100 100 100
Increase in the collection rate of traffic fines (%) 10 15 10 10 10
Creditors paid within 30 days (%) 100 30 100 100 100
Procurement plan implemented (%) - 100 100 100 100
BBBEE spent on capital budget versus actual (localized) (%) - 58.94 62 62 62
Variance MIG expenditure (%) - - 10 10 10
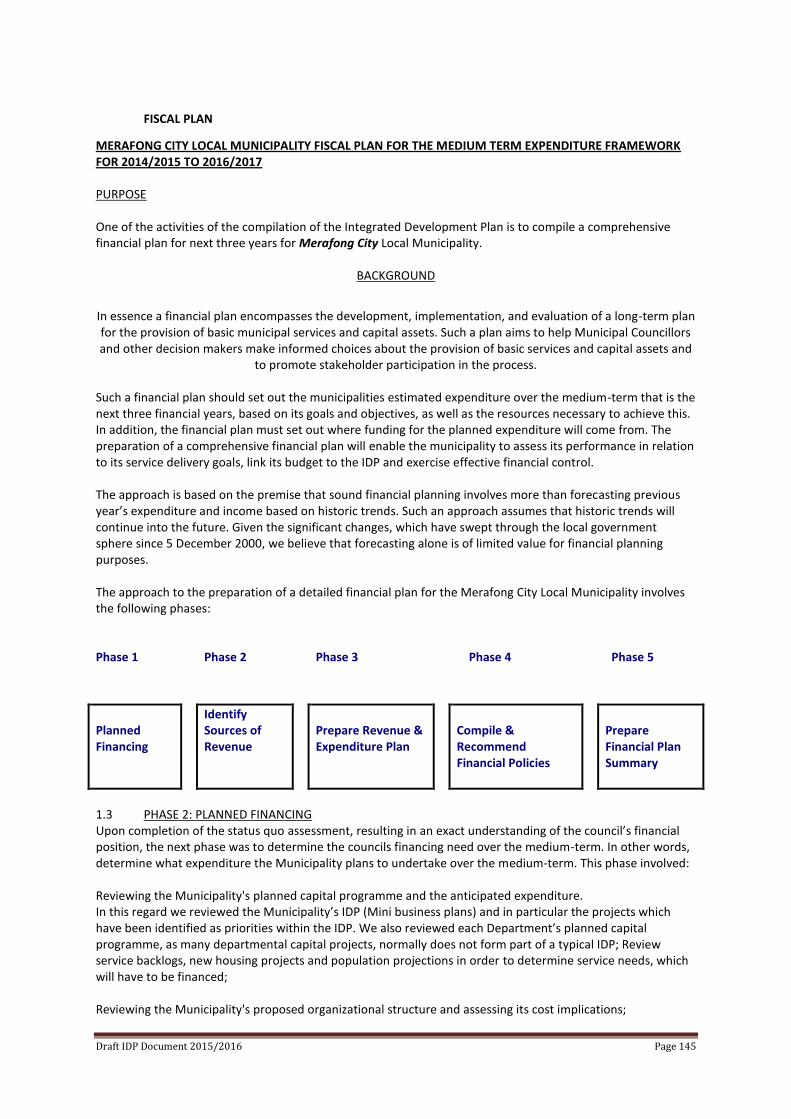
Draft IDP Document 2015/2016 Page 145
FISCAL PLAN
MERAFONG CITY LOCAL MUNICIPALITY FISCAL PLAN FOR THE MEDIUM TERM EXPENDITURE FRAMEWORK FOR 2014/2015 TO 2016/2017 PURPOSE One of the activities of the compilation of the Integrated Development Plan is to compile a comprehensive financial plan for next three years for Merafong City Local Municipality.
BACKGROUND
In essence a financial plan encompasses the development, implementation, and evaluation of a long-term plan for the provision of basic municipal services and capital assets. Such a plan aims to help Municipal Councillors and other decision makers make informed choices about the provision of basic services and capital assets and
to promote stakeholder participation in the process. Such a financial plan should set out the municipalities estimated expenditure over the medium-term that is the next three financial years, based on its goals and objectives, as well as the resources necessary to achieve this. In addition, the financial plan must set out where funding for the planned expenditure will come from. The preparation of a comprehensive financial plan will enable the municipality to assess its performance in relation to its service delivery goals, link its budget to the IDP and exercise effective financial control. The approach is based on the premise that sound financial planning involves more than forecasting previous year’s expenditure and income based on historic trends. Such an approach assumes that historic trends will continue into the future. Given the significant changes, which have swept through the local government sphere since 5 December 2000, we believe that forecasting alone is of limited value for financial planning purposes. The approach to the preparation of a detailed financial plan for the Merafong City Local Municipality involves the following phases: Phase 1 Phase 2 Phase 3 Phase 4 Phase 5
Planned Financing
Identify Sources of Revenue
Prepare Revenue & Expenditure Plan
Compile & Recommend Financial Policies
Prepare Financial Plan Summary
1.3 PHASE 2: PLANNED FINANCING Upon completion of the status quo assessment, resulting in an exact understanding of the council’s financial position, the next phase was to determine the councils financing need over the medium-term. In other words, determine what expenditure the Municipality plans to undertake over the medium-term. This phase involved: Reviewing the Municipality's planned capital programme and the anticipated expenditure. In this regard we reviewed the Municipality’s IDP (Mini business plans) and in particular the projects which have been identified as priorities within the IDP. We also reviewed each Department’s planned capital programme, as many departmental capital projects, normally does not form part of a typical IDP; Review service backlogs, new housing projects and population projections in order to determine service needs, which will have to be financed; Reviewing the Municipality's proposed organizational structure and assessing its cost implications;
Draft IDP Document 2015/2016 Page 146
Reviewing proposed community projects and programmes by Departments and assessing their cost implications; Identify factors, which influence expenditure levels; Compilation of an expenditure schedule relating to the day-to-day operations and needs of the Municipality (Operational Budget) PHASE 3: IDENTIFY SOURCES OF REVENUE The next step in the compilation of the financial plan was to identify the revenue base of the municipality. This phase included the following activities: Review alternative service delivery mechanisms, such as Municipal Service Partnerships and shared services and the relative merits and demerits of each alternative; Assess options for increasing user charges and fees based on factors such as the impact of inflation, other cost increases, the adequacy of the coverage of costs and current competitive rates. In addition we assessed the implications of increasing service charges and fees, including the financial impact on households, particularly poor ones; Review existing service charges and fees. Municipalities use service charges and fees to fund the provision of municipal services; Review the nature, extent, purpose and predictability of national and provincial grants and agency payments; Identify other revenue opportunities, such as leases, sale of non-core assets and the like; Identify revenue constraints, such as maximum service charges and poor payment levels; Identify potential threats to municipal revenue, including changes in grant allocations. Compilation of a revenue schedule based on daily operations and normal income sources. This process incorporates the tariff policy as the basis for determination of operational revenue; and Review findings from the Status Quo Report and adjust the revenue schedule accordingly. Overview of Budget Assumptions The 2014/15 – 2016/17 Medium Term Budget has been prepared within a highly volatile and highly uncertain economic environment, making the budgeting process even more challenging. Drastic changes have occurred within the global and domestic economy in the past two years, and these changes had a profound impact on the assumptions drawn to prepare the budget. The following aspects were taken into account in the preparation of the 2014/15– 2016/17 Medium Term Budget. The percentage increases of both Eskom and Rand Water bulk tariffs are far beyond the mentioned inflation target. Given that these tariff increases are determined by external agencies, these tariffs are largely outside the control of the Council. Discounting the impact of these price increases in lower consumer tariffs will erode the Council future financial position and viability
Draft IDP Document 2015/2016 Page 147
The large increases and the change of the local economic conditions such as the down turn in the property market, trends in household incomes and unemployment are counterproductive, resulting in higher levels of non-payment and increased bad debts. Council was advised to provide for increases related to salaries and wages for the 2014/15 budget and MTREF as follows: 2014/15 Financial Year – 6.79 per cent (5.79 per cent plus 1 per cent) 2015/16 Financial Year – 6.40 per cent (5.40 per cent plus 1 per cent) 2016/17 Financial Year – 6.40 per cent (5.40 per cent plus 1 per cent) With the introduction of the new equitable share formula and the updated 2011 Census data used in the formula, Merafong will experience large changes in their equitable share and MIG allocations. Council cannot with the existing filled employee component be in a position to execute the capital projects approved by council and rendering normal service delivery functions It was planned that repairs and maintenance must grow by 20% for the next 2 years to ensure that council will extend the life span of the existing assets and not needs to replace them. Due to the decrease in the equitable share council will not be in a position the increase the budget by 20% but only 11%. The effective implementation of the credit control policy of council remains a challenge. Credit control will be rolled out to all areas within Merafong. Council will have to consider establish an in house debt collection section. Where normal credit control actions are not effective council will have to make use of alternative mechanisms to collect its debt. Defaulters of assessment rates by property owners and farmers must be addressed. Council had commenced with the procurement process to procure pre-paid water meters. It’s critical that the project be rolled out in 2013/2014. Municipal Infrastructure Grant will decrease over the next three years. This will negatively affect council’s ability to render services and reduce backlogs. Programs planned for the outer years had to be cut back and reprioritised. Council had received R7 000 Million from Human Settlement Grant for the ROD requirements for Khutsong Ext 1, 2 and 3. In addition R6 000 Million was received from the National Electrification Programme for the electrification of the second phase of Khutsong Ext 1, 2 and 3. General inflation outlook and its impact on the municipal activities Headline inflation forecasts Municipalities must take the following inflation forecasts into consideration when preparing their budgets for 2014/15 and MTREF
Fiscal year 2012 2013 2014 2015 2016
Actual Estimate Forecast
Real GDP growth 2.5 1.8 2.7 3.2 3.5
CPI inflation 5.6 5.7 6.2 5.9 5.5
Draft IDP Document 2015/2016 Page 148
Summary of budget assumptions For the 2014/2015 financial year the Council, from the outset, based the guideline on the growth rates on 6% of the original budgeted amounts submitted to National Treasury for the 2013/2014 financial year. This was in line with the Reserve Banks inflation targets. However, during the 2014/2015 budgeting process, the main objective of the Council was to adhere to the prerequisite from National Treasury that Municipalities must pass budgets that are balanced and cash funded. PHASE 4: REVENUE AND EXPENDITURE PLAN The fourth phase involved finalizing a medium-term income and expenditure plan based on the various alternative service delivery options presented to Council, the financing need, the realistic level of revenue and the trade-offs made. A key component in determining future options, potential problems, and opportunities is the forecast of revenues and expenditures. The revenue and expenditure plan essentially involves combining the forecasting of revenues and the forecasting of expenditures into a single financial forecast. Background The application of sound financial management principles for the compilation of the Councils financial plan is essential and critical to ensure that the Council remains financially viable and that municipal services are provided sustainably, economically and equitably to all communities. The Councils business and service delivery priorities were reviewed as part of this year’s planning and budget process. Where appropriate, funds were transferred from low- to high-priority programmes so as to maintain sound financial stewardship. A critical review was also undertaken of expenditures on noncore and ‘nice to have’ items. The Council has embarked on implementing a range of revenue collection strategies to optimize the collection of debt owed by consumers. Furthermore, the Council has undertaken various customer care initiatives to ensure the municipality truly involves all citizens in the process of ensuring a people lead government. National Treasury’s MFMA Circular No. 66 and 67 were used to guide the compilation of the 2012/14 MTREF. The application of sound financial management principles for the compilation of the Councils financial plan is essential and critical to ensure that the Council remains financially viable and that municipal services are provided sustainably, economically and equitably to all communities. The Councils business and service delivery priorities were reviewed as part of this year’s planning and budget process. Where appropriate, funds were transferred from low- to high-priority programmes so as to maintain sound financial stewardship. A critical review was also undertaken of expenditures on noncore and ‘nice to have’ items. With the introduction of the new equitable share formula and the updated 2011 Census data used in the formula, Merafong experience large changes in their equitable share allocations. To smooth the impact of these changes and give Council time to adjust the new allocations it will be phased in over five years. This negatively affects council’s ability to render services and reduce backlogs. Programs planned for the outer years had to be cut back and reprioritised. Council has embarked on implementing a range of revenue collection strategies to optimize the collection of debt owed by consumers. Furthermore, the Council has undertaken various customer care initiatives to ensure the municipality truly involves all citizens in the process of ensuring a people lead government. National Treasury’s MFMA Circular No. 71 and 72 were used to guide the compilation of the 2014/15 MTREF. The main challenges experienced during the compilation of the 2014/15 MTREF can be summarised as follows:
Draft IDP Document 2015/2016 Page 149
The on-going difficulties in the national and local economy; The reduction in the allocation from the Division of Revenue Act in terms of equitable share and the Municipal Infrastructure Grant. Aging and poorly maintained water, roads and electricity infrastructure; The need to reprioritise projects and expenditure within the existing resource envelope; The increased cost of bulk water and electricity (due to tariff increases from Rand Water and Eskom), which is placing upward pressure on service tariffs to residents. Continuous high tariff increases are not sustainable - as there will be point where services will no-longer be affordable; Affordability of capital projects – original allocations had to be reduced and the operational expenditure associated with prior year’s capital investments needed to be factored into the budget as part of the 2014/15 MTREF process; and Availability of affordable capital/borrowing.
The need to reprioritise projects and expenditure within the existing resource envelope given the cash flow realities and declining cash position of the municipality; Wage increases for municipal staff that continue to exceed consumer inflation, as well as the need to fill critical vacancies;
The following budget principles and guidelines directly informed the compilation of the 2014/15 MTREF: • Producing a Balanced Budget – ensuring that the expenditure is aligned to the revenue and that the Council has sufficient cash to meet its debt obligations. • Sustainability – endure that the capital investment is within the financial capacity of Council and ensure that there is continuous investment on the infrastructure maintenance and replacement in a medium to long term period. • Budget needs to respond to basics service delivery. • Stabilise the balance sheet – creating cash reserves to support and improve the current ratio and future capital investment capacity. • Stabilisation and protection of the revenue base. • Need to produce savings to facilitate the implementation of new programmes. • On-going costs should be funded with on-going revenues – aligning continuing expenditures with continuing revenues, on a level that can be reasonably sustained and reduce reliance on onetime funding. • Review all Council services and programs for operational efficiencies to improve service levels and delivery / managing the cost down. The 2013/14 Adjustments Budget priorities and targets, as well as the base line allocations contained in the Adjustments Budget were adopted as the upper limits for the new baselines for the 2014/15 annual budget; Tariff and property rate increases should be affordable and should generally not exceed inflation as measured by the CPI, except where there are price increases in the inputs of services that are beyond the control of the municipality, for instance the cost of bulk water and electricity. In addition, tariffs need to remain or move towards being cost reflective, and should take into account the need to address infrastructure backlogs; With the reduction in the equitable share and the guideline approval of electricity tariffs General Expenses will have to be curtailed.
An upper limit must be set for the following items and allocations. They must be supported by a list and/or motivation setting out the intention and cost of the expenditure which was used to prioritise expenditures:
Entertainment, Travel and Subsistence, Attendance of Conferences, Catering at meetings, Telephones costs. The management of the fleet and usage of vehicles. The management of safety clothes. Furniture and Equipment Computer equipment.
Draft IDP Document 2015/2016 Page 150
There will be no budget allocated to national and provincial funded projects unless the necessary grants to the municipality are reflected in the national and provincial budget and have been gazetted as required by the annual Division of Revenue Act; In view of the aforementioned, the following table is a consolidated overview of the proposed 2014/15 Medium-term Revenue and Expenditure Framework: Table 1 Consolidated Overview of the 2014/2015 MTREF
R thousand Adjustment Budget 2013/14
Budget Year 2014/15
Budget Year 2015/16
Budget Year 2016/17
Total Operating Revenue 1 219 494 1 164 303 1 220 501 1 282 344
Total Operating Expenditure 1 324 325 1 240 624 1 296 821 1 358 664
(Surplus) / Deficit for the Year 104 831 76 320 76 320 76 320
Total Capital Expenditure 293 007 294 679 118 989 117 523
Total operating revenue has decreased by 4.53 per cent or R55.191 million for the 2014/15 financial year when compared to the 2013/14 Adjustments Budget. For the two outer years, operational revenue will increase by R56.198 and R61.843 Million respectively, equating to a total increase in revenue of R62.85 million over the MTREF when compared to the 2013/14 financial year. Total operating expenditure for the 2014/15 financial year has been appropriated at R1.241 million and translates into a budgeted deficit of R76.32 million. When compared to the 2013/14 Adjustments Budget, operational expenditure has decreased by 6.32 per cent in the 2014/15 budget and increase by R56.197 Million R61.843 Million for each of the respective outer years of the MTREF. The operating deficit for the two outer years will remains stable. These deficits are as of a result of depreciation costs on fair value adjustments on infrastructure assets. These deficits are funded from the accumulated surplus of R2.3 billion. The capital budget of 294.7 Million for 2014/15 is 0.79 per cent more when compared to the 2013/14 Adjustment Budget. A portion of the capital budget will be funded from borrowing over MTREF with anticipated borrowings of R55.9 Million in 2014/2015 and R35 Million in the 2015/2016 and R20 Million for the 2016/2017 financial years. Note that the Council has reached its prudential borrowing limits and so there is very little scope to substantially increase these borrowing levels over the medium-term. With the introduction of the new equitable share formula and the updated 2011 Census data used in the formula, Merafong will experience large changes in their equitable share allocations. To smooth the impact of these changes and give Council time to adjust the new allocations it will be phased in over five years. Municipal Infrastructure Grant will decrease over the next three years. This will negatively affect council’s ability to render services and reduce backlogs. Programs planned for the outer years had to be cut back and reprioritised. In addition in 2013/2014 DORA an amount of R25 Million was allocated in the 2014/2015 financial year for the Integrated National Electrification Programme. As can be seen from the above it was reduced to R6 000 000. Operating Revenue Framework For Merafong City to continue improving the quality of services provided to its citizens it needs to generate the required revenue. In these tough economic times strong revenue management is fundamental to the financial sustainability of every municipality. The reality is that we are faced with development backlogs and poverty. The expenditure required to address these challenges will inevitably always exceed available funding; hence difficult choices have to be made in relation to tariff increases and balancing expenditures against realistically anticipated revenues.
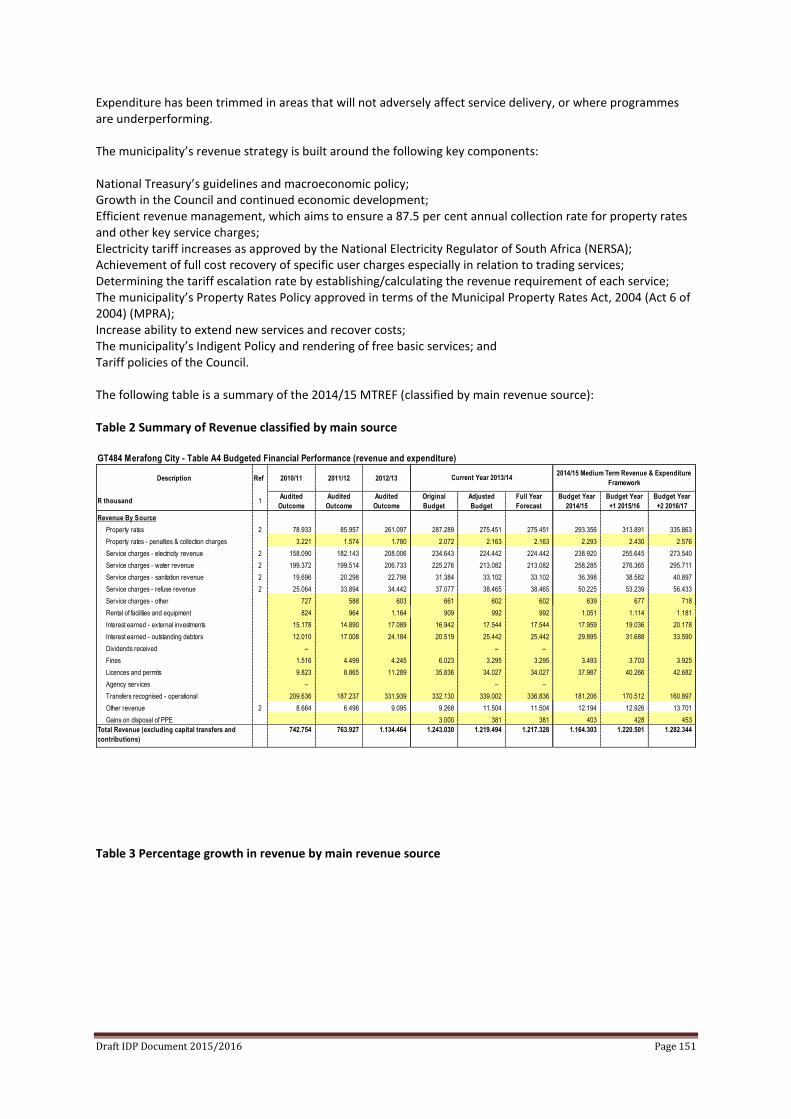
Draft IDP Document 2015/2016 Page 151
Expenditure has been trimmed in areas that will not adversely affect service delivery, or where programmes are underperforming. The municipality’s revenue strategy is built around the following key components: National Treasury’s guidelines and macroeconomic policy; Growth in the Council and continued economic development; Efficient revenue management, which aims to ensure a 87.5 per cent annual collection rate for property rates and other key service charges; Electricity tariff increases as approved by the National Electricity Regulator of South Africa (NERSA); Achievement of full cost recovery of specific user charges especially in relation to trading services; Determining the tariff escalation rate by establishing/calculating the revenue requirement of each service; The municipality’s Property Rates Policy approved in terms of the Municipal Property Rates Act, 2004 (Act 6 of 2004) (MPRA); Increase ability to extend new services and recover costs; The municipality’s Indigent Policy and rendering of free basic services; and Tariff policies of the Council. The following table is a summary of the 2014/15 MTREF (classified by main revenue source): Table 2 Summary of Revenue classified by main source
Table 3 Percentage growth in revenue by main revenue source
GT484 Merafong City - Table A4 Budgeted Financial Performance (revenue and expenditure)
Description Ref 2010/11 2011/12 2012/13
R thousand 1Audited
Outcome
Audited
Outcome
Audited
Outcome
Original
Budget
Adjusted
Budget
Full Year
Forecast
Budget Year
2014/15
Budget Year
+1 2015/16
Budget Year
+2 2016/17
Revenue By Source
Property rates 2 78.933 85.957 261.097 287.289 275.451 275.451 293.356 313.891 335.863
Property rates - penalties & collection charges 3.221 1.574 1.780 2.072 2.163 2.163 2.293 2.430 2.576
Service charges - electricity revenue 2 158.090 182.143 208.006 234.643 224.442 224.442 238.920 255.645 273.540
Service charges - water revenue 2 199.372 199.514 206.733 225.276 213.082 213.082 258.285 276.365 295.711
Service charges - sanitation revenue 2 19.696 20.298 22.798 31.384 33.102 33.102 36.398 38.582 40.897
Service charges - refuse revenue 2 25.064 33.894 34.442 37.077 38.465 38.465 50.225 53.239 56.433
Service charges - other 727 588 603 661 602 602 639 677 718
Rental of facilities and equipment 824 964 1.164 909 992 992 1.051 1.114 1.181
Interest earned - external investments 15.178 14.890 17.089 16.942 17.544 17.544 17.959 19.036 20.178
Interest earned - outstanding debtors 12.010 17.008 24.184 20.519 25.442 25.442 29.895 31.688 33.590
Dividends received – – –
Fines 1.516 4.499 4.245 6.023 3.295 3.295 3.493 3.703 3.925
Licences and permits 9.823 8.865 11.289 35.836 34.027 34.027 37.987 40.266 42.682
Agency services – – –
Transfers recognised - operational 209.636 187.237 331.939 332.130 339.002 336.836 181.206 170.512 160.897
Other revenue 2 8.664 6.496 9.095 9.268 11.504 11.504 12.194 12.926 13.701
Gains on disposal of PPE 3.000 381 381 403 428 453
Total Revenue (excluding capital transfers and
contributions)
742.754 763.927 1.134.464 1.243.030 1.219.494 1.217.328 1.164.303 1.220.501 1.282.344
2014/15 Medium Term Revenue & Expenditure
FrameworkCurrent Year 2013/14
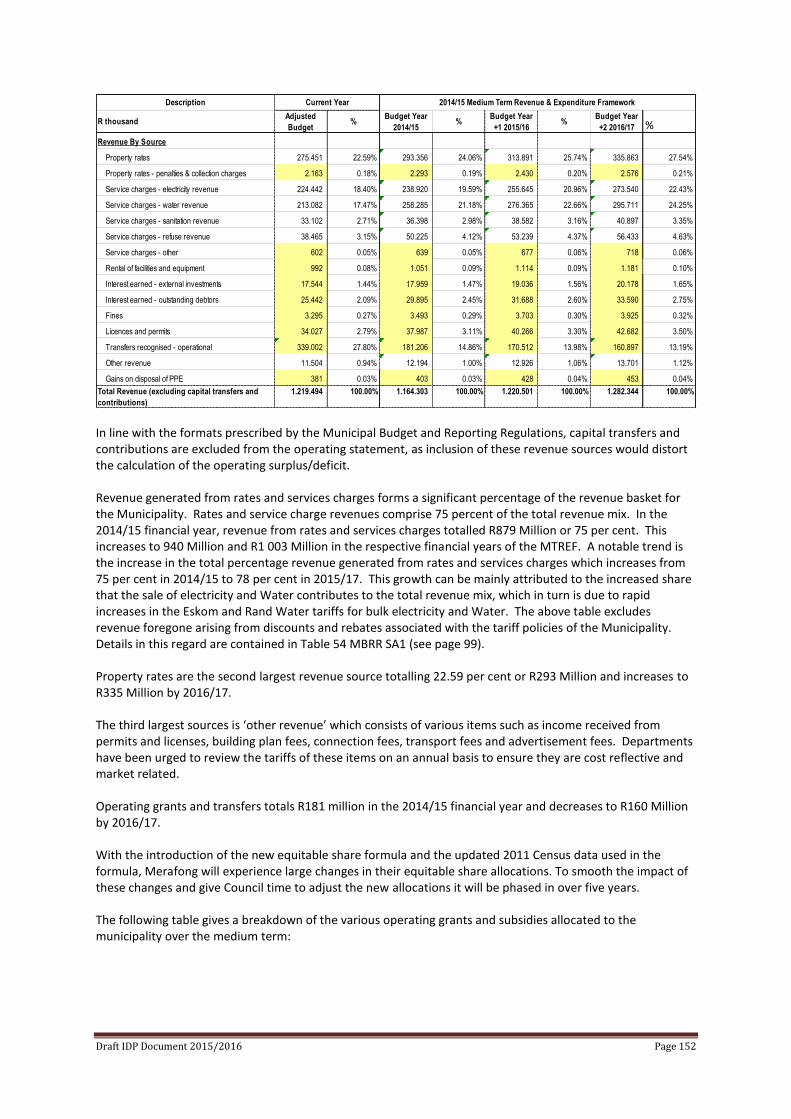
Draft IDP Document 2015/2016 Page 152
In line with the formats prescribed by the Municipal Budget and Reporting Regulations, capital transfers and contributions are excluded from the operating statement, as inclusion of these revenue sources would distort the calculation of the operating surplus/deficit. Revenue generated from rates and services charges forms a significant percentage of the revenue basket for the Municipality. Rates and service charge revenues comprise 75 percent of the total revenue mix. In the 2014/15 financial year, revenue from rates and services charges totalled R879 Million or 75 per cent. This increases to 940 Million and R1 003 Million in the respective financial years of the MTREF. A notable trend is the increase in the total percentage revenue generated from rates and services charges which increases from 75 per cent in 2014/15 to 78 per cent in 2015/17. This growth can be mainly attributed to the increased share that the sale of electricity and Water contributes to the total revenue mix, which in turn is due to rapid increases in the Eskom and Rand Water tariffs for bulk electricity and Water. The above table excludes revenue foregone arising from discounts and rebates associated with the tariff policies of the Municipality. Details in this regard are contained in Table 54 MBRR SA1 (see page 99). Property rates are the second largest revenue source totalling 22.59 per cent or R293 Million and increases to R335 Million by 2016/17. The third largest sources is ‘other revenue’ which consists of various items such as income received from permits and licenses, building plan fees, connection fees, transport fees and advertisement fees. Departments have been urged to review the tariffs of these items on an annual basis to ensure they are cost reflective and market related. Operating grants and transfers totals R181 million in the 2014/15 financial year and decreases to R160 Million by 2016/17. With the introduction of the new equitable share formula and the updated 2011 Census data used in the formula, Merafong will experience large changes in their equitable share allocations. To smooth the impact of these changes and give Council time to adjust the new allocations it will be phased in over five years. The following table gives a breakdown of the various operating grants and subsidies allocated to the municipality over the medium term:
Description
R thousandAdjusted
Budget%
Budget Year
2014/15%
Budget Year
+1 2015/16%
Budget Year
+2 2016/17 %
Revenue By Source
Property rates 275.451 22.59% 293.356 24.06% 313.891 25.74% 335.863 27.54%
Property rates - penalties & collection charges 2.163 0.18% 2.293 0.19% 2.430 0.20% 2.576 0.21%
Service charges - electricity revenue 224.442 18.40% 238.920 19.59% 255.645 20.96% 273.540 22.43%
Service charges - water revenue 213.082 17.47% 258.285 21.18% 276.365 22.66% 295.711 24.25%
Service charges - sanitation revenue 33.102 2.71% 36.398 2.98% 38.582 3.16% 40.897 3.35%
Service charges - refuse revenue 38.465 3.15% 50.225 4.12% 53.239 4.37% 56.433 4.63%
Service charges - other 602 0.05% 639 0.05% 677 0.06% 718 0.06%
Rental of facilities and equipment 992 0.08% 1.051 0.09% 1.114 0.09% 1.181 0.10%
Interest earned - external investments 17.544 1.44% 17.959 1.47% 19.036 1.56% 20.178 1.65%
Interest earned - outstanding debtors 25.442 2.09% 29.895 2.45% 31.688 2.60% 33.590 2.75%
Fines 3.295 0.27% 3.493 0.29% 3.703 0.30% 3.925 0.32%
Licences and permits 34.027 2.79% 37.987 3.11% 40.266 3.30% 42.682 3.50%
Transfers recognised - operational 339.002 27.80% 181.206 14.86% 170.512 13.98% 160.897 13.19%
Other revenue 11.504 0.94% 12.194 1.00% 12.926 1.06% 13.701 1.12%
Gains on disposal of PPE 381 0.03% 403 0.03% 428 0.04% 453 0.04%
Total Revenue (excluding capital transfers and
contributions)
1.219.494 100.00% 1.164.303 100.00% 1.220.501 100.00% 1.282.344 100.00%
Current Year 2014/15 Medium Term Revenue & Expenditure Framework
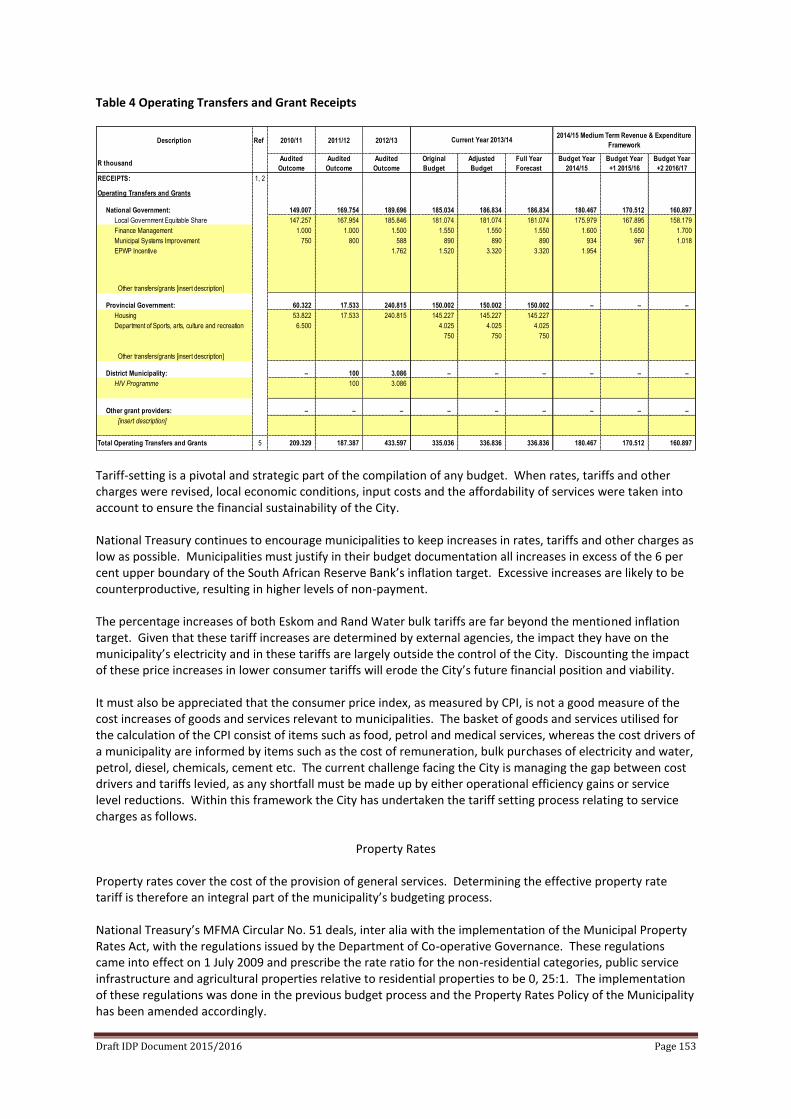
Draft IDP Document 2015/2016 Page 153
Table 4 Operating Transfers and Grant Receipts
Tariff-setting is a pivotal and strategic part of the compilation of any budget. When rates, tariffs and other charges were revised, local economic conditions, input costs and the affordability of services were taken into account to ensure the financial sustainability of the City. National Treasury continues to encourage municipalities to keep increases in rates, tariffs and other charges as low as possible. Municipalities must justify in their budget documentation all increases in excess of the 6 per cent upper boundary of the South African Reserve Bank’s inflation target. Excessive increases are likely to be counterproductive, resulting in higher levels of non-payment. The percentage increases of both Eskom and Rand Water bulk tariffs are far beyond the mentioned inflation target. Given that these tariff increases are determined by external agencies, the impact they have on the municipality’s electricity and in these tariffs are largely outside the control of the City. Discounting the impact of these price increases in lower consumer tariffs will erode the City’s future financial position and viability. It must also be appreciated that the consumer price index, as measured by CPI, is not a good measure of the cost increases of goods and services relevant to municipalities. The basket of goods and services utilised for the calculation of the CPI consist of items such as food, petrol and medical services, whereas the cost drivers of a municipality are informed by items such as the cost of remuneration, bulk purchases of electricity and water, petrol, diesel, chemicals, cement etc. The current challenge facing the City is managing the gap between cost drivers and tariffs levied, as any shortfall must be made up by either operational efficiency gains or service level reductions. Within this framework the City has undertaken the tariff setting process relating to service charges as follows.
Property Rates
Property rates cover the cost of the provision of general services. Determining the effective property rate tariff is therefore an integral part of the municipality’s budgeting process. National Treasury’s MFMA Circular No. 51 deals, inter alia with the implementation of the Municipal Property Rates Act, with the regulations issued by the Department of Co-operative Governance. These regulations came into effect on 1 July 2009 and prescribe the rate ratio for the non-residential categories, public service infrastructure and agricultural properties relative to residential properties to be 0, 25:1. The implementation of these regulations was done in the previous budget process and the Property Rates Policy of the Municipality has been amended accordingly.
Description Ref 2010/11 2011/12 2012/13
R thousandAudited
Outcome
Audited
Outcome
Audited
Outcome
Original
Budget
Adjusted
Budget
Full Year
Forecast
Budget Year
2014/15
Budget Year
+1 2015/16
Budget Year
+2 2016/17
RECEIPTS: 1, 2
Operating Transfers and Grants
National Government: 149.007 169.754 189.696 185.034 186.834 186.834 180.467 170.512 160.897
Local Government Equitable Share 147.257 167.954 185.846 181.074 181.074 181.074 175.979 167.895 158.179
Finance Management 1.000 1.000 1.500 1.550 1.550 1.550 1.600 1.650 1.700
Municipal Systems Improvement 750 800 588 890 890 890 934 967 1.018
EPWP Incentive 1.762 1.520 3.320 3.320 1.954
Other transfers/grants [insert description]
Provincial Government: 60.322 17.533 240.815 150.002 150.002 150.002 – – –
Housing 53.822 17.533 240.815 145.227 145.227 145.227
Department of Sports, arts, culture and recreation 6.500 4.025 4.025 4.025
750 750 750
Other transfers/grants [insert description]
District Municipality: – 100 3.086 – – – – – –
HIV Programme 100 3.086
Other grant providers: – – – – – – – – –
[insert description]
Total Operating Transfers and Grants 5 209.329 187.387 433.597 335.036 336.836 336.836 180.467 170.512 160.897
Current Year 2013/142014/15 Medium Term Revenue & Expenditure
Framework
Draft IDP Document 2015/2016 Page 154
For all residential properties, as defined per the Rates Policy, the first R 65 000 of property value will be
rebated by an amount equal to the rates payable on a property of R 65 000 in value.
All residential properties, as defined per the Rates Policy, will be levied a rate which is rebated by 10%.
Senior Citizens and Disabled Persons Rate Rebate
Registered owners of properties who are senior citizens and/or registered owners of properties who are disabled persons qualify for special rebates according to gross monthly household income. To qualify for the rebate(s) a property owner must be a natural person and the owner of a property which satisfies the requirements for the residential rebate and must on the 1 July of the financial year:
occupy the property as his/her normal residence and be at least 60 years of age or in receipt of a disability pension from the Department of Social Development and be in receipt of a total monthly income from all sources (including income of spouses of owners) not be the owner of more than one property and submit the application by 30 September for this rebate for the current financial year, failing which the rebate will not be granted.
The percentage rebate granted to different monthly household income levels will be determined according to the schedule below.
Sale of Electricity and Impact of Tariff Increases
NERSA had issued a guideline tariff increase and provide for an 8.06 per cent increase in the cost of bulk purchases for the tabled 2014/15 budgets and MTREF. Municipalities are advised to structure their 2014/15 electricity tariffs based on the approved 7.39 per cent. Considering the Eskom increases, the consumer tariff had to be increased by 7.21 per cent to offset the additional bulk purchase cost from 1 July 2014. Furthermore, it should be noted that given the magnitude of the tariff increase, it is expected to depress growth in electricity consumption, which will have a negative impact on the municipality’s revenue from electricity. Registered indigents will again be granted 50 kWh per 30-day period free of charge. It should further be noted that NERSA has advised that a stepped tariff structure needs to be implemented from 1 July 2011. The effect thereof will be that the higher the consumption, the higher the cost per kWh. The aim is to subsidise the lower consumption users (mostly the poor). The Council had already implemented block tariffs. The inadequate electricity bulk capacity and the impact on service delivery and development remains a challenge for the Municipality. The upgrading and extension of the municipalities’ electricity network has therefore become a strategic priority, especially the substations and transmission lines. Owing to the high increases in Eskom’s bulk tariffs, it is clearly not possible to fund these necessary upgrades through increases in the municipal electricity tariff – as the resultant tariff increases would be unaffordable for the consumers. It is therefore proposed that the taking up of loans as a strategy for funding of the infrastructure be considered and approved to spread the burden over the life span of the assets. As part of the 2014/15 medium-term capital programme, funding has been allocated to electricity infrastructure.
Sale of Water and Impact of Tariff Increases
Draft IDP Document 2015/2016 Page 155
Rand Water had advised council that they will increase their water tariffs to municipalities by 8.1% from the 1
July 2014.
Water tariffs must be on aggregate fully cost-reflective – inclusive of bulk cost of water, the cost of maintenance and renewal of purification/treatment plants and network infrastructure, and the cost of new infrastructure; Water tariffs must be structured to protect basic levels of service; and Water tariffs must be designed to encourage efficient and sustainable consumption (e.g. through inclining block tariffs). Merafong had implemented block tariffs in the past. A summary of the proposed tariffs for households (residential) and non-residential are as follows: The tariff structure of the 2013/14 financial year has not been changed. The tariff structure is designed to charge higher levels of consumption a higher rate, steadily increasing to a rate of R16.49 per kilo liter for consumption in excess of 50kℓ per 30 day period. Sanitation and Impact of Tariff Increases
The proposed increase is not in-line with the guideline of 6% as the function is not cost reflective in 2014/2015.
Sanitation tariffs must be on aggregate fully cost-reflective – inclusive of the cost of maintenance and renewal of purification/treatment plants and network infrastructure, and the cost of new infrastructure; Sanitation tariffs must be structured to protect basic levels of service; and Sanitation tariffs must be designed to encourage efficient and sustainable consumption (e.g. through inclining block tariffs). Merafong had implemented block tariffs in the past. The following factors also contribute to the proposed tariff increase: Sanitation charges are calculated according to the percentage water discharged as indicated in the table below; Free sanitation (6 kℓ water) will be applicable to registered indigents. Waste Removal and impact of Tariff Increases It’s of utmost importance that refuse removal must be cost reflective. Solid waste is not cost reflective for 2013/2014. Where this is the case, municipalities should aim to have appropriately structured, cost-reflective solid waste tariffs in place by 2015. A further aspect that has a serious influence on solid waste tariffs is the increase in fuel prices. The tariffs for solid waste management must take into account that it is good practice to maintain a cash-backed reserve to cover the future costs of rehabilitating landfill sites.
Currently solid waste removal is operating at a deficit. It is widely accepted that the rendering of this service should at least break even, which is currently not the case. The City will have to implement a solid waste
strategy to ensure that this service can be rendered in a sustainable manner over the medium to long-term. The main contributors to this deficit are repairs and maintenance on vehicles, increases in general expenditure
such as petrol and diesel and the cost of remuneration. Considering the deficit, it is recommended that a
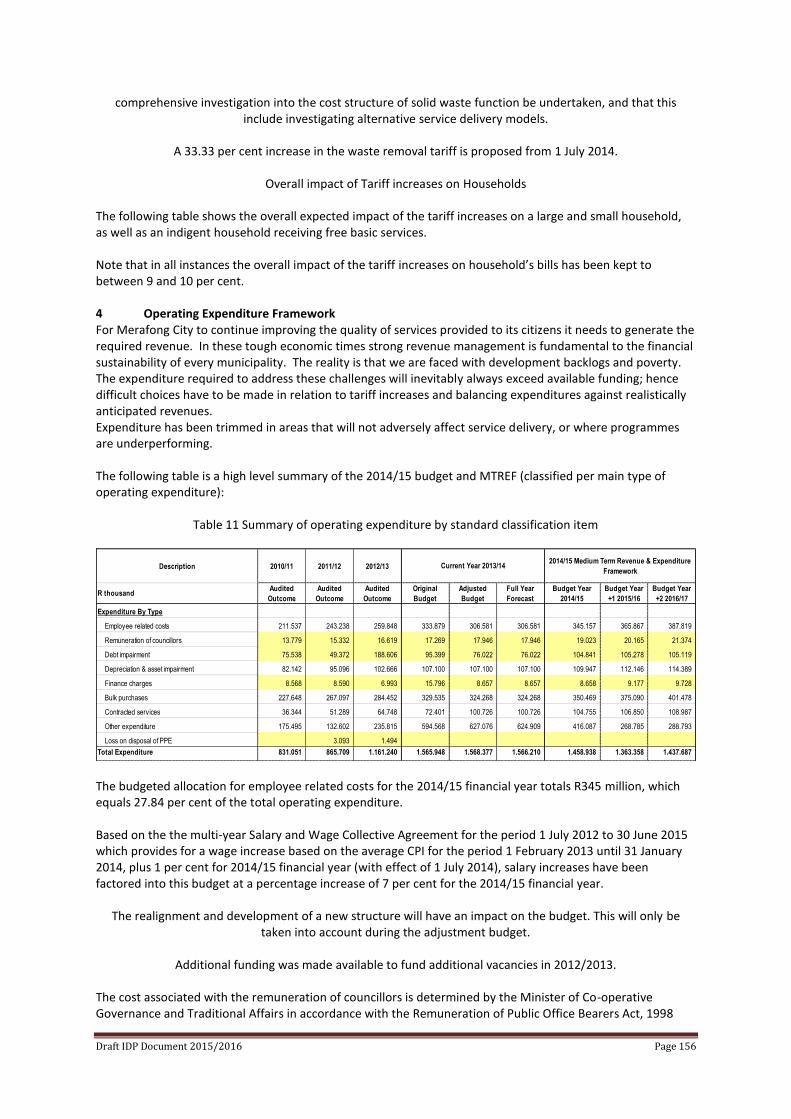
Draft IDP Document 2015/2016 Page 156
comprehensive investigation into the cost structure of solid waste function be undertaken, and that this include investigating alternative service delivery models.
A 33.33 per cent increase in the waste removal tariff is proposed from 1 July 2014.
Overall impact of Tariff increases on Households
The following table shows the overall expected impact of the tariff increases on a large and small household, as well as an indigent household receiving free basic services. Note that in all instances the overall impact of the tariff increases on household’s bills has been kept to between 9 and 10 per cent. 4 Operating Expenditure Framework For Merafong City to continue improving the quality of services provided to its citizens it needs to generate the required revenue. In these tough economic times strong revenue management is fundamental to the financial sustainability of every municipality. The reality is that we are faced with development backlogs and poverty. The expenditure required to address these challenges will inevitably always exceed available funding; hence difficult choices have to be made in relation to tariff increases and balancing expenditures against realistically anticipated revenues. Expenditure has been trimmed in areas that will not adversely affect service delivery, or where programmes are underperforming. The following table is a high level summary of the 2014/15 budget and MTREF (classified per main type of operating expenditure):
Table 11 Summary of operating expenditure by standard classification item
The budgeted allocation for employee related costs for the 2014/15 financial year totals R345 million, which equals 27.84 per cent of the total operating expenditure. Based on the the multi-year Salary and Wage Collective Agreement for the period 1 July 2012 to 30 June 2015 which provides for a wage increase based on the average CPI for the period 1 February 2013 until 31 January 2014, plus 1 per cent for 2014/15 financial year (with effect of 1 July 2014), salary increases have been factored into this budget at a percentage increase of 7 per cent for the 2014/15 financial year.
The realignment and development of a new structure will have an impact on the budget. This will only be taken into account during the adjustment budget.
Additional funding was made available to fund additional vacancies in 2012/2013.
The cost associated with the remuneration of councillors is determined by the Minister of Co-operative Governance and Traditional Affairs in accordance with the Remuneration of Public Office Bearers Act, 1998
Description 2010/11 2011/12 2012/13
R thousandAudited
Outcome
Audited
Outcome
Audited
Outcome
Original
Budget
Adjusted
Budget
Full Year
Forecast
Budget Year
2014/15
Budget Year
+1 2015/16
Budget Year
+2 2016/17
Expenditure By Type
Employee related costs 211.537 243.238 259.848 333.879 306.581 306.581 345.157 365.867 387.819
Remuneration of councillors 13.779 15.332 16.619 17.269 17.946 17.946 19.023 20.165 21.374
Debt impairment 75.538 49.372 188.606 95.399 76.022 76.022 104.841 105.278 105.119
Depreciation & asset impairment 82.142 95.096 102.666 107.100 107.100 107.100 109.947 112.146 114.389
Finance charges 8.568 8.590 6.993 15.796 8.657 8.657 8.658 9.177 9.728
Bulk purchases 227.648 267.097 284.452 329.535 324.268 324.268 350.469 375.090 401.478
Contracted services 36.344 51.289 64.748 72.401 100.726 100.726 104.755 106.850 108.987
Other expenditure 175.495 132.602 235.815 594.568 627.076 624.909 416.087 268.785 288.793
Loss on disposal of PPE 3.093 1.494
Total Expenditure 831.051 865.709 1.161.240 1.565.948 1.568.377 1.566.210 1.458.938 1.363.358 1.437.687
2014/15 Medium Term Revenue & Expenditure
FrameworkCurrent Year 2013/14
Draft IDP Document 2015/2016 Page 157
(Act 20 of 1998). The most recent proclamation in this regard has been taken into account in compiling the City’s budget. The provision of debt impairment was determined based on an annual collection rate of 87.5 per cent and the Debt Write-off Policy of the City. For the 2014/15 financial year this amount equates to R104.8 million. The large tariff increases, and the change of the local economic conditions such as the down turn in the property market, trends in household incomes and unemployment were counterproductive, resulting in higher levels of non-payment and increased bad debts. Council’s average payment levels for the past six months were 78%. Council budgeted for a payment level of 87.50% for the financial year. The department had commenced with an outreach program to promote the payment of services. Council had commenced with serious credit control actions in all areas of Merafong. This was communicated to the community and ward committees during the budget consultation program. A revenue enhancement strategy was developed and the roll out plan has commenced. A no tolerance approach in terms of council’s credit control policy will be enforced on non-indigent defaulters. Council will have to consider establish an in house debt collection section. Where normal credit control actions are not effective council will have to make use of alternative mechanisms to collect its debt. Defaulters of assessment rates by property owners and farmers must be addressed. Council had commenced with the procurement process to procure pre-paid water meters. It’s critical that the project be rolled out in 2014/2015. The biggest concern is the non - payment by Blyvooruitzicht mine of their water account. While this expenditure is considered to be a non-cash flow item, it informed the total cost associated with rendering the services of the municipality, as well as the municipality’s realistically anticipated revenues. Provision for depreciation and asset impairment has been informed by the Municipality’s Asset Management Policy. Depreciation is widely considered a proxy for the measurement of the rate asset consumption. Budget appropriations in this regard total R109 million for the 2014/15 financial year. Note that the implementation of GRAP 17 accounting standard has meant bringing a range of assets previously not included in the assets register onto the register. This has resulted in a significant increase in depreciation relative to previous years. Finance charges consist primarily of the repayment of interest on long-term borrowing (cost of capital). Finance charges make up 0.6 per cent (R8.6 million) of operating expenditure excluding annual redemption for 2014/15 and increases to R9.7 million by 2016/17. As previously noted, the municipality has reached its prudential limits for borrowing – hence the planned borrowing to finance the capital budget does not result in finance charges as a percentage of operational expenditure increasing.
The Eskom price increase of bulk electricity supplied to municipalities will increase by 8.06 per cent on 1 July 2014. NERSA approved an annual 8.06 per cent increase in the bulk price of electricity in terms of the third multi-year price determination application applicable for the period 2013/14 to 2017/18. Municipalities are urged to examine the cost structure of their electricity undertakings and apply to NERSA for electricity tariff increases that are cost reflective to ensure continued financial sustainability. Rand Water had advised council that they will increase their water tariffs to municipalities by 8.1% from the 1 July 2014. A water loss management strategy is approved and must be implemented during the 2014/2015 financial year. Water used by council own properties are levied and do not form part of unaccounted for water. Water losses are out of control and needs to be addressed.
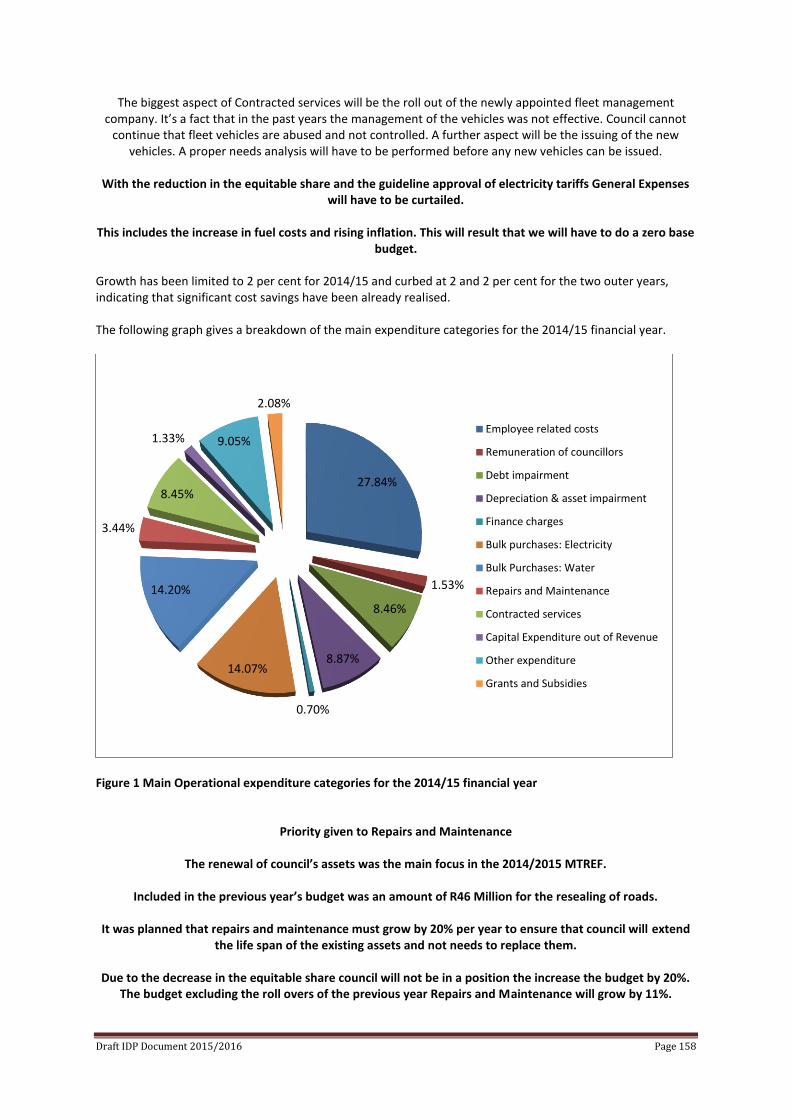
Draft IDP Document 2015/2016 Page 158
The biggest aspect of Contracted services will be the roll out of the newly appointed fleet management company. It’s a fact that in the past years the management of the vehicles was not effective. Council cannot
continue that fleet vehicles are abused and not controlled. A further aspect will be the issuing of the new vehicles. A proper needs analysis will have to be performed before any new vehicles can be issued.
With the reduction in the equitable share and the guideline approval of electricity tariffs General Expenses
will have to be curtailed.
This includes the increase in fuel costs and rising inflation. This will result that we will have to do a zero base budget.
Growth has been limited to 2 per cent for 2014/15 and curbed at 2 and 2 per cent for the two outer years, indicating that significant cost savings have been already realised. The following graph gives a breakdown of the main expenditure categories for the 2014/15 financial year.
Figure 1 Main Operational expenditure categories for the 2014/15 financial year
Priority given to Repairs and Maintenance
The renewal of council’s assets was the main focus in the 2014/2015 MTREF.
Included in the previous year’s budget was an amount of R46 Million for the resealing of roads.
It was planned that repairs and maintenance must grow by 20% per year to ensure that council will extend
the life span of the existing assets and not needs to replace them.
Due to the decrease in the equitable share council will not be in a position the increase the budget by 20%. The budget excluding the roll overs of the previous year Repairs and Maintenance will grow by 11%.
27.84%
1.53%
8.46%
8.87%
0.70%
14.07%
14.20%
3.44%
8.45%
1.33% 9.05%
2.08%
Employee related costs
Remuneration of councillors
Debt impairment
Depreciation & asset impairment
Finance charges
Bulk purchases: Electricity
Bulk Purchases: Water
Repairs and Maintenance
Contracted services
Capital Expenditure out of Revenue
Other expenditure
Grants and Subsidies
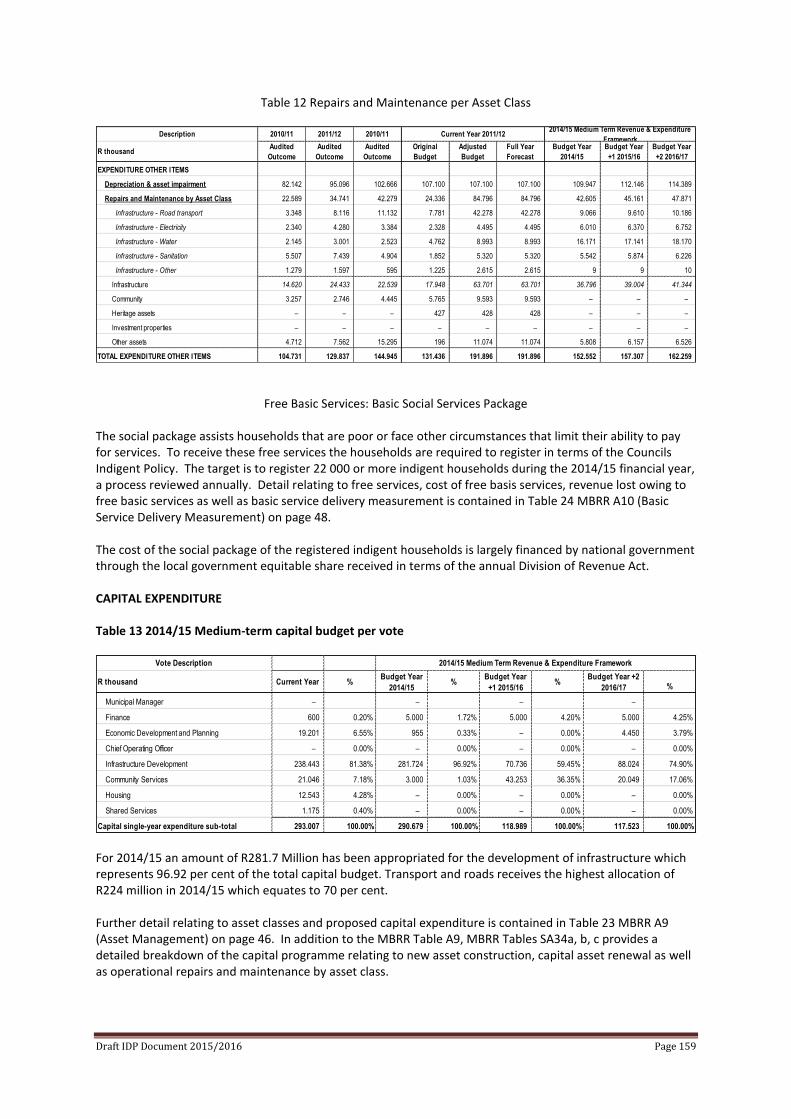
Draft IDP Document 2015/2016 Page 159
Table 12 Repairs and Maintenance per Asset Class
Free Basic Services: Basic Social Services Package
The social package assists households that are poor or face other circumstances that limit their ability to pay for services. To receive these free services the households are required to register in terms of the Councils Indigent Policy. The target is to register 22 000 or more indigent households during the 2014/15 financial year, a process reviewed annually. Detail relating to free services, cost of free basis services, revenue lost owing to free basic services as well as basic service delivery measurement is contained in Table 24 MBRR A10 (Basic Service Delivery Measurement) on page 48. The cost of the social package of the registered indigent households is largely financed by national government through the local government equitable share received in terms of the annual Division of Revenue Act. CAPITAL EXPENDITURE
Table 13 2014/15 Medium-term capital budget per vote
For 2014/15 an amount of R281.7 Million has been appropriated for the development of infrastructure which represents 96.92 per cent of the total capital budget. Transport and roads receives the highest allocation of R224 million in 2014/15 which equates to 70 per cent. Further detail relating to asset classes and proposed capital expenditure is contained in Table 23 MBRR A9 (Asset Management) on page 46. In addition to the MBRR Table A9, MBRR Tables SA34a, b, c provides a detailed breakdown of the capital programme relating to new asset construction, capital asset renewal as well as operational repairs and maintenance by asset class.
Description 2010/11 2011/12 2010/11
R thousandAudited
Outcome
Audited
Outcome
Audited
Outcome
Original
Budget
Adjusted
Budget
Full Year
Forecast
Budget Year
2014/15
Budget Year
+1 2015/16
Budget Year
+2 2016/17
EXPENDITURE OTHER ITEMS
Depreciation & asset impairment 82.142 95.096 102.666 107.100 107.100 107.100 109.947 112.146 114.389
Repairs and Maintenance by Asset Class 22.589 34.741 42.279 24.336 84.796 84.796 42.605 45.161 47.871
Infrastructure - Road transport 3.348 8.116 11.132 7.781 42.278 42.278 9.066 9.610 10.186
Infrastructure - Electricity 2.340 4.280 3.384 2.328 4.495 4.495 6.010 6.370 6.752
Infrastructure - Water 2.145 3.001 2.523 4.762 8.993 8.993 16.171 17.141 18.170
Infrastructure - Sanitation 5.507 7.439 4.904 1.852 5.320 5.320 5.542 5.874 6.226
Infrastructure - Other 1.279 1.597 595 1.225 2.615 2.615 9 9 10
Infrastructure 14.620 24.433 22.539 17.948 63.701 63.701 36.796 39.004 41.344
Community 3.257 2.746 4.445 5.765 9.593 9.593 – – –
Heritage assets – – – 427 428 428 – – –
Investment properties – – – – – – – – –
Other assets 4.712 7.562 15.295 196 11.074 11.074 5.808 6.157 6.526
TOTAL EXPENDITURE OTHER ITEMS 104.731 129.837 144.945 131.436 191.896 191.896 152.552 157.307 162.259
Current Year 2011/122014/15 Medium Term Revenue & Expenditure
Framework
Vote Description
R thousand Current Year %Budget Year
2014/15%
Budget Year
+1 2015/16%
Budget Year +2
2016/17 %
Municipal Manager – – – –
Finance 600 0.20% 5.000 1.72% 5.000 4.20% 5.000 4.25%
Economic Development and Planning 19.201 6.55% 955 0.33% – 0.00% 4.450 3.79%
Chief Operating Officer – 0.00% – 0.00% – 0.00% – 0.00%
Infrastructure Development 238.443 81.38% 281.724 96.92% 70.736 59.45% 88.024 74.90%
Community Services 21.046 7.18% 3.000 1.03% 43.253 36.35% 20.049 17.06%
Housing 12.543 4.28% – 0.00% – 0.00% – 0.00%
Shared Services 1.175 0.40% – 0.00% – 0.00% – 0.00%
Capital single-year expenditure sub-total 293.007 100.00% 290.679 100.00% 118.989 100.00% 117.523 100.00%
2014/15 Medium Term Revenue & Expenditure Framework
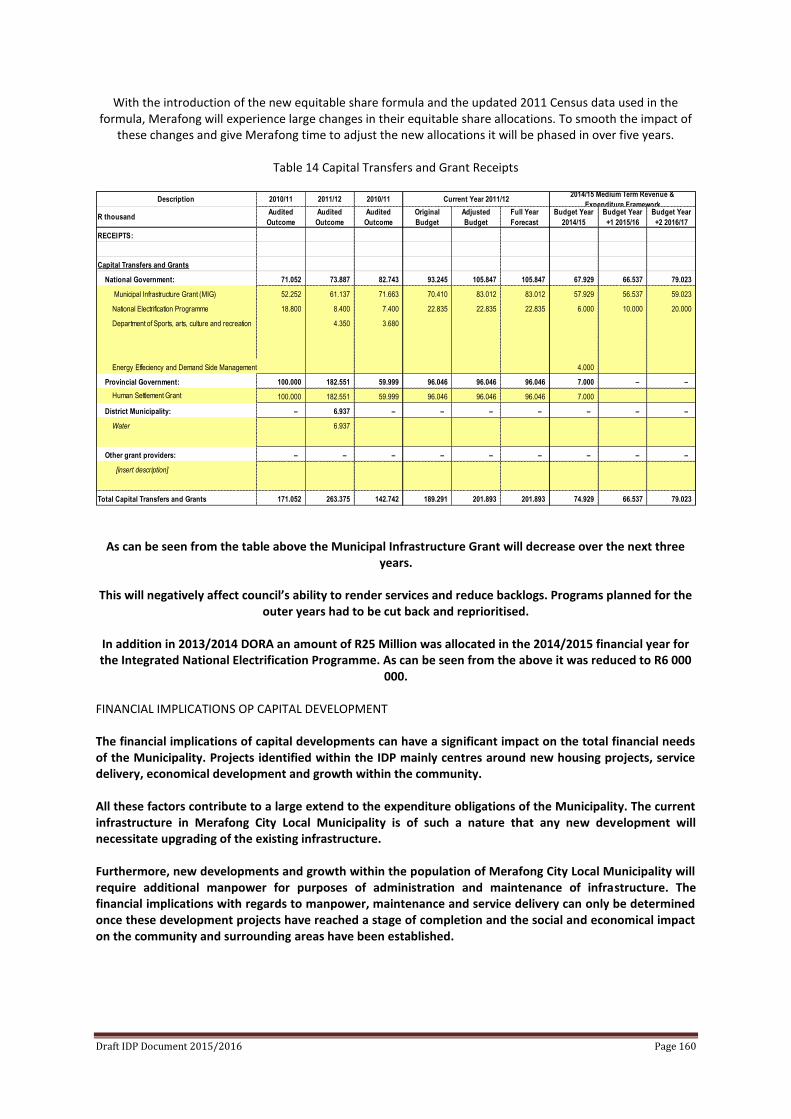
Draft IDP Document 2015/2016 Page 160
With the introduction of the new equitable share formula and the updated 2011 Census data used in the formula, Merafong will experience large changes in their equitable share allocations. To smooth the impact of
these changes and give Merafong time to adjust the new allocations it will be phased in over five years.
Table 14 Capital Transfers and Grant Receipts
As can be seen from the table above the Municipal Infrastructure Grant will decrease over the next three years.
This will negatively affect council’s ability to render services and reduce backlogs. Programs planned for the
outer years had to be cut back and reprioritised.
In addition in 2013/2014 DORA an amount of R25 Million was allocated in the 2014/2015 financial year for the Integrated National Electrification Programme. As can be seen from the above it was reduced to R6 000
000. FINANCIAL IMPLICATIONS OP CAPITAL DEVELOPMENT The financial implications of capital developments can have a significant impact on the total financial needs of the Municipality. Projects identified within the IDP mainly centres around new housing projects, service delivery, economical development and growth within the community. All these factors contribute to a large extend to the expenditure obligations of the Municipality. The current infrastructure in Merafong City Local Municipality is of such a nature that any new development will necessitate upgrading of the existing infrastructure. Furthermore, new developments and growth within the population of Merafong City Local Municipality will require additional manpower for purposes of administration and maintenance of infrastructure. The financial implications with regards to manpower, maintenance and service delivery can only be determined once these development projects have reached a stage of completion and the social and economical impact on the community and surrounding areas have been established.
Description 2010/11 2011/12 2010/11
R thousandAudited
Outcome
Audited
Outcome
Audited
Outcome
Original
Budget
Adjusted
Budget
Full Year
Forecast
Budget Year
2014/15
Budget Year
+1 2015/16
Budget Year
+2 2016/17
RECEIPTS:
Capital Transfers and Grants
National Government: 71.052 73.887 82.743 93.245 105.847 105.847 67.929 66.537 79.023
Municipal Infrastructure Grant (MIG) 52.252 61.137 71.663 70.410 83.012 83.012 57.929 56.537 59.023
National Electrification Programme 18.800 8.400 7.400 22.835 22.835 22.835 6.000 10.000 20.000
Department of Sports, arts, culture and recreation 4.350 3.680
Energy Effeciency and Demand Side Management 4.000
Provincial Government: 100.000 182.551 59.999 96.046 96.046 96.046 7.000 – –
Human Settlement Grant 100.000 182.551 59.999 96.046 96.046 96.046 7.000
District Municipality: – 6.937 – – – – – – –
Water 6.937
Other grant providers: – – – – – – – – –
[insert description]
Total Capital Transfers and Grants 171.052 263.375 142.742 189.291 201.893 201.893 74.929 66.537 79.023
Current Year 2011/122014/15 Medium Term Revenue &
Expenditure Framework
Draft IDP Document 2015/2016 Page 161
RECOMMENDATIONS Credit Control and Payment Levels It has unfortunately become a reality in our current economical environment to view an 85% payment level as acceptable. Due to increasing unemployment figures, people tend to look upon the other 15% of the community as those who cannot afford to pay. However, one has to consider the fact that there has already been provided for the less fortunate consumers by means of the indigent policy and the provision of free basic services (6kl free water and 50Kwh free electricity in the 2014/2015 financial year) to indigent consumers, these would include, pensioners, households with combined income of less than R1 500 per month and permanently disabled people as categorised by the policy. Strict credit control will have to be implemented and maintained to achieve a payment percentage of 87.5%. Water must be restricted and electricity installations will have to be removed. Sales in execution of movable and immovable assets will have to commence. Property owners cannot owe council money. Pre- paid water meters must be installed for all indigents and deposits must increase to minimise council’s risk. Financial Impact of Developments and Resettlements It has to be emphasised that all new projects entered into, whether financed by means of external loans, income or grants, will have an impact on the current infrastructure and manpower requirements of the Municipality. Although various Impact Assessments have been performed the actual financial impact cannot be calculated accurately. The construction of low cost housing must be looked at in the future. Council will have to develop high cost housing to offset the effects of low cost housing. The balance must be contained. Intervention is required to increase the equitable share to fund council’s indigents to ensure that services will be provided in an effective and efficient manner. Non-core Functions As discussed above, a formal investigation into the viability of non-core functions should be launched as these functions are currently financed by means of Assessment Rates. Various sporting codes are currently sourcing funds for development as part of a national drive to unify the nation by means of sport. CLOSURE Sound financial management demands that a municipality effectively control its level of revenue and expenditure and appropriately allocates public resources amongst its departments and programmes. To this end it is necessary for Merafong City Municipality to prepare and implement a comprehensive, accurate and transparent financial plan, which helps it to identifying its operating and capital financing needs and assists it to raise the revenue needed to meet these requirements. The key characteristics of the Financial Planning Process are that it: Incorporates a long-term perspective; Establishes linkages to organizational goals and objectives as outlined in the Integrated Development Plan (IDP); Focuses financial decisions on results and outcomes; Involves and promotes effective communication with stakeholders and local communities; and provides incentives to municipal management and employees.
Draft IDP Document 2015/2016 Page 162
It is council’s view that this financial plan includes the above characteristics. However, the plan can only be successful if all Councillors, employees and members of the community ensure that day-to-day operations and strategic planning are in accordance with this plan and that any changes be incorporated in an annual updated plan. CAPITAL INVESTMENT PROGRAMME Developmental Local Government - in essence - require extensive capital investments in infrastructure. The Capital Investment Program of Merafong City Local Municipality as outlined in the Spatial Development Framework and Fiscal Plan will guide private investment. To produce the desired urban form outlined in the Framework. The Capital Investment Program is captured and will be executed as indicated in the capital budget. Only secured funding forms part of the investment programme. The Capital Investment Framework underpins key principles of Merafong City’s strategies in realizing the full potential of the property market. By meeting its priorities, the CIF will create an enabling environment in which business can flourish. The CIF will also address the mayoral priorities of service delivery, excellence, economical growth and regeneration of the economy. The key principle of the CIF is the following: Infrastructure should support nodal development and a movement network. Infrastructure capacity within the urban development boundary should be augmented and upgraded to ensure efficient urban form and infill development; Where spare capacity exists, consolidation and intensification of existing urban development is most efficient; Development of vacant land in areas with spare capacity should be given first priority, with areas requiring extension of existing infrastructure as second priority; Balance should be struck in between investment in new infrastructure and maintenance and refurbishment of existing infrastructure; New infrastructure should be provided in areas, which are linked or can be linked directly to the movement network and can be promoted with social services; Medium- to high-density residential development is promoted to make for optimal use of infrastructure; Public investment in marginalized areas is essential to spur development and create an economic base; It is of apparent importance that no infrastructure investments will be made in areas that are geologically at risk for urban development.
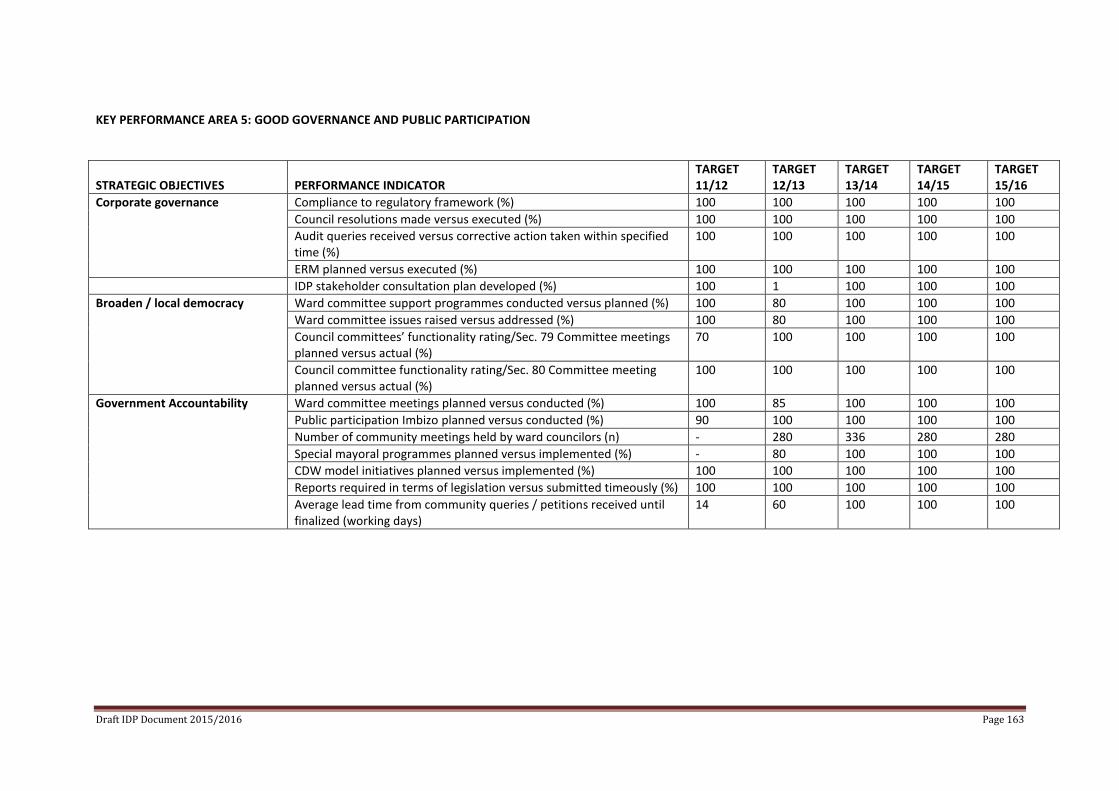
Draft IDP Document 2015/2016 Page 163
KEY PERFORMANCE AREA 5: GOOD GOVERNANCE AND PUBLIC PARTICIPATION
STRATEGIC OBJECTIVES
PERFORMANCE INDICATOR
TARGET 11/12
TARGET 12/13
TARGET 13/14
TARGET 14/15
TARGET 15/16
Corporate governance Compliance to regulatory framework (%) 100 100 100 100 100
Council resolutions made versus executed (%) 100 100 100 100 100
Audit queries received versus corrective action taken within specified time (%)
100 100 100 100 100
ERM planned versus executed (%) 100 100 100 100 100
IDP stakeholder consultation plan developed (%) 100 1 100 100 100
Broaden / local democracy Ward committee support programmes conducted versus planned (%) 100 80 100 100 100
Ward committee issues raised versus addressed (%) 100 80 100 100 100
Council committees’ functionality rating/Sec. 79 Committee meetings planned versus actual (%)
70 100 100 100 100
Council committee functionality rating/Sec. 80 Committee meeting planned versus actual (%)
100 100 100 100 100
Government Accountability Ward committee meetings planned versus conducted (%) 100 85 100 100 100
Public participation Imbizo planned versus conducted (%) 90 100 100 100 100
Number of community meetings held by ward councilors (n) - 280 336 280 280
Special mayoral programmes planned versus implemented (%) - 80 100 100 100
CDW model initiatives planned versus implemented (%) 100 100 100 100 100
Reports required in terms of legislation versus submitted timeously (%) 100 100 100 100 100
Average lead time from community queries / petitions received until finalized (working days)
14 60 100 100 100
Draft IDP Document 2015/2016 Page 164
Community Consultation Participation And Empowerment Twenty Eight (28) Ward Committees have been established and are chaired by specific ward councillors and are overseen by the office of the Speaker. On annual basis Ward Committee participate in the IDP Process by inputting through reviewing, prioritizing ward needs. To date 26 out of 28 wards (92%) have submitted their priorities to be considered by different municipal departments during the planning and budgeting process. Ward Public meetings are held quarterly and are monitored by the office of the Speaker. Each ward has a budget allocation from the MSIG (Municipal Systems Improvement Grant) The Merafong City Local Municipality has developed and approved a community participation plan overseen by the office of the Speaker. 2. Audit Committee and Risk Management The establishment of an internal audit unit is legislated by section 165 of the Municipal Finance Management Act (MFMA). The unit reports administratively to the Accounting Officer and functionally to an Audit Committee, which is a committee mandated by section 166 of the MFMA. Internal audit is an independent, objective assurance and consulting activity designed to add value and to improve an organization operations. It helps an organization accomplish its objectives by bringing a systematic, disciplined approach to evaluate and improve the effectiveness of risk management, control, and governance processes. The unit operates in terms of an annual risk-based internal audit plan as required by section 165 (2) (a) of the MFMA. The plan addresses risks identified by management and also includes compliance audits required by law e.g. the quarterly auditing of performance measurements required by section 45 of the Municipal Systems Act (MSA). Other responsibilities of the unit outlined in section 165 (2) (b) and (c) of the MFMA are to “advise the accounting officer and report to the audit committee on the implementation of the internal audit plan and matters relating to— (i) Internal audit; (ii) Internal controls; (iii) Accounting procedures and practices; (iv) Risk and risk management; (v) Performance management; (vi) Loss control; and (vii) Compliance with this Act, the annual Division of Revenue Act and any other applicable legislation; and (c) Perform such other duties as may be assigned to it by the accounting officer.”
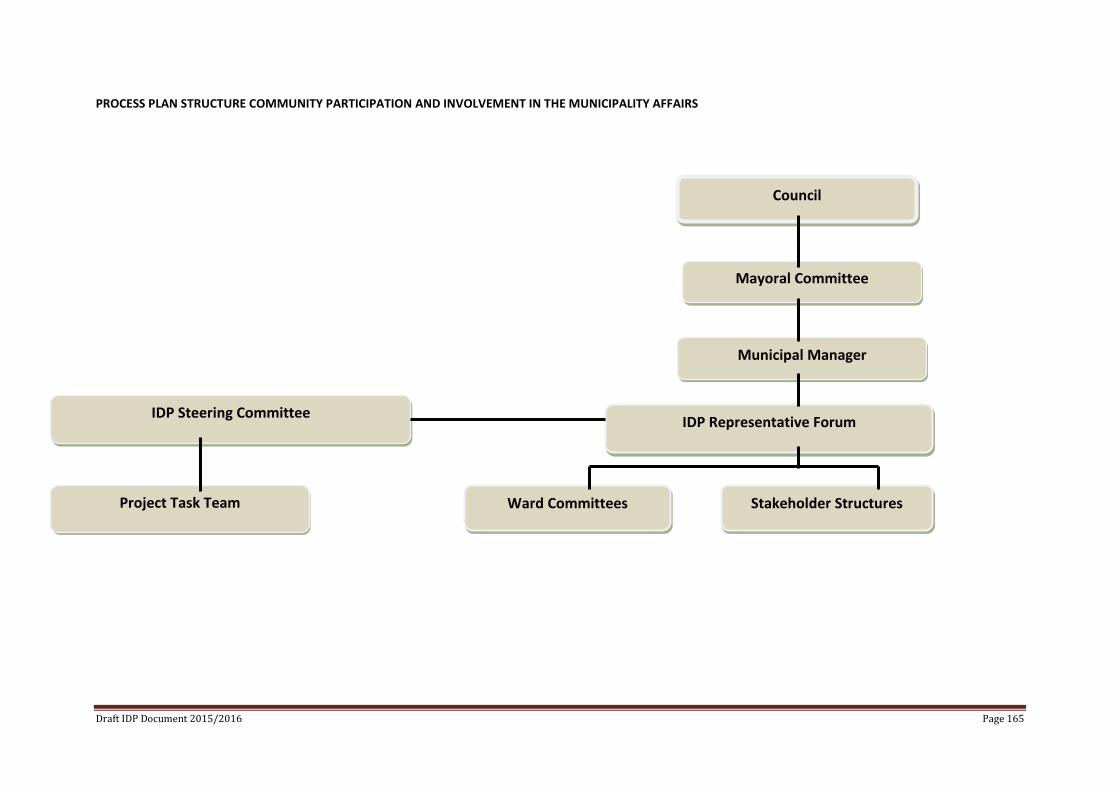
Draft IDP Document 2015/2016 Page 165
PROCESS PLAN STRUCTURE COMMUNITY PARTICIPATION AND INVOLVEMENT IN THE MUNICIPALITY AFFAIRS
Council
IDP Representative Forum IDP Steering Committee
Project Task Team Stakeholder Structures Ward Committees
Mayoral Committee
Municipal Manager
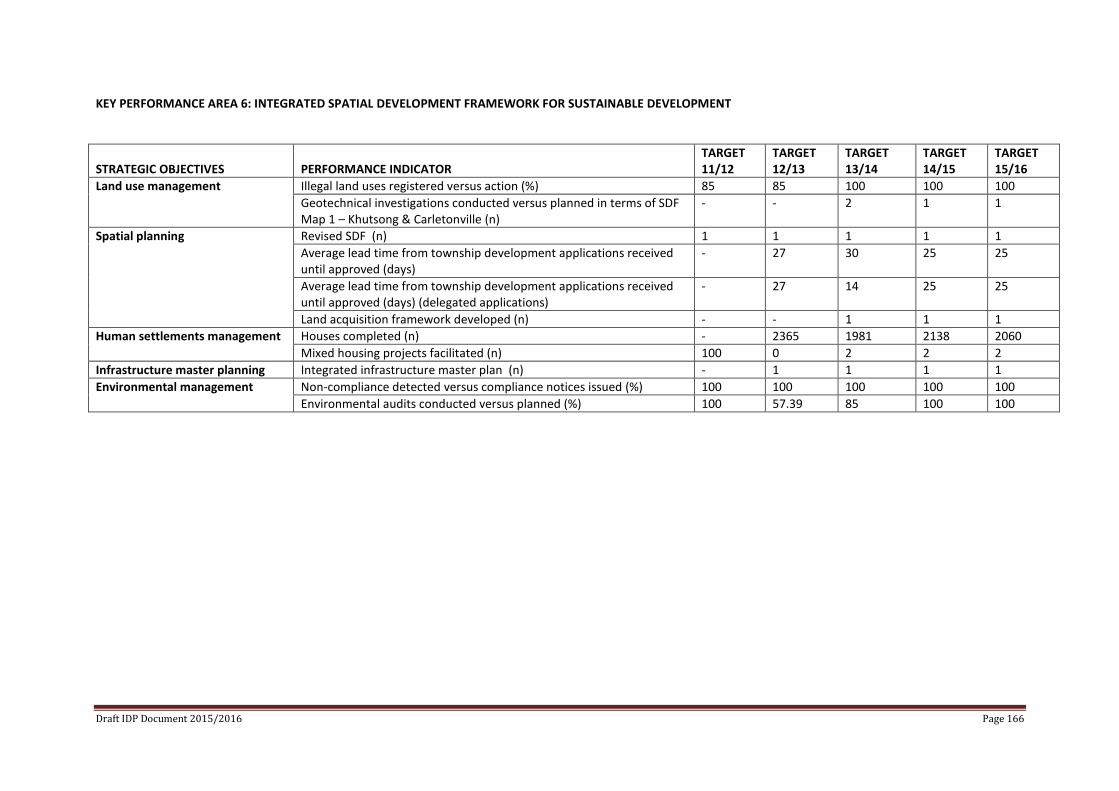
Draft IDP Document 2015/2016 Page 166
KEY PERFORMANCE AREA 6: INTEGRATED SPATIAL DEVELOPMENT FRAMEWORK FOR SUSTAINABLE DEVELOPMENT
STRATEGIC OBJECTIVES
PERFORMANCE INDICATOR
TARGET 11/12
TARGET 12/13
TARGET 13/14
TARGET 14/15
TARGET 15/16
Land use management Illegal land uses registered versus action (%) 85 85 100 100 100
Geotechnical investigations conducted versus planned in terms of SDF Map 1 – Khutsong & Carletonville (n)
- - 2 1 1
Spatial planning Revised SDF (n) 1 1 1 1 1
Average lead time from township development applications received until approved (days)
- 27 30 25 25
Average lead time from township development applications received until approved (days) (delegated applications)
- 27 14 25 25
Land acquisition framework developed (n) - - 1 1 1
Human settlements management Houses completed (n) - 2365 1981 2138 2060
Mixed housing projects facilitated (n) 100 0 2 2 2
Infrastructure master planning Integrated infrastructure master plan (n) - 1 1 1 1
Environmental management Non-compliance detected versus compliance notices issued (%) 100 100 100 100 100
Environmental audits conducted versus planned (%) 100 57.39 85 100 100
Draft IDP Document 2015/2016 Page 167
2015 Review
DRAFT Merafong Municipal Spatial
Development Framework
Draft IDP Document 2015/2016 Page 168
INTRODUCTION AND BACKGROUND In terms of chapter 5 of the Municipal Systems Act, 2000 (Act 32 of 2000), the municipality’s Integrated Development Plan “…must reflect a Spatial Development Framework which must include the provision for basic guidelines for a Land Use Management System for the municipality”. The Merafong Municipal Spatial Development Framework (MSDF), forms part of a hierarchy of plans feeding into the Integrated Development Plan (IDP). The Spatial Development Framework serves as an input into the IDP and concentrates on the spatial aspects of development planning, whereas the IDP focuses on broader developmental issues. Following the SDF in the hierarchy are Sector Plans. The approach followed to compile this document was to emphasise on strategic planning, taking into consideration the broader development strategies of the municipality. During 2013 the Spatial Planning & Land Use Management Act (Act 16 of 2013) (SPLUMA) was promulgated and comes into effect on 1 July 2014. This legislation puts forward principles to influence spatial planning, land use management and land development. It also provides for national and regional spatial frameworks as well as provincial and municipal frameworks, meaning that a package of plans will be undertaken from national to municipal level to direct spatial planning as well as land use management, while providing for uniform regulation of land use management. The general principles endorsed by this Act is that spatial planning, land use management and land development must promote and enhance five main Development Principles: Spatial Justice, Spatial Sustainability; Spatial Efficiency; Spatial Resilience, and Good Administration. Chapter 2 sect. 7 of SPLUMA. The following principles apply to spatial planning, land development and land use management:
(a) The principle of spatial justice, whereby— (i) Past spatial and other development imbalances must be redressed through improved access to and use of land; (ii) spatial development frameworks and policies at all spheres of government must address the inclusion of persons and areas that were previously excluded, with an emphasis on informal settlements, former homeland areas and areas characterised by widespread poverty and deprivation; (iii) spatial planning mechanisms, including land use schemes, must incorporate provisions that enable redress in access to land by disadvantaged communities and persons; (iv) land use management systems must include all areas of a municipality and specifically include provisions that are flexible and appropriate for the management of disadvantaged areas, informal settlements and former homeland areas; (v) land development procedures must include provisions that accommodate access to secure tenure and the incremental upgrading of informal areas; and (vi) a Municipal Planning Tribunal considering an application before it, may not be impeded or restricted in the exercise of its discretion solely on the ground that the value of land or property is affected by the outcome of the application;
(b) the principle of spatial sustainability, whereby spatial planning and land use management systems must—
(i) promote land development that is within the fiscal, institutional and administrative means of the Republic; (ii) ensure that special consideration is given to the protection of prime and unique agricultural land; (iii) uphold consistency of land use measures in accordance with environmental management instruments; (iv) promote and stimulate the effective and equitable functioning of land markets; (v) consider all current and future costs to all parties for the provision of infrastructure and social services in land developments; (vi) promote land development in locations that are sustainable and limit urban sprawl; and (vii) result in communities that are viable;
Draft IDP Document 2015/2016 Page 169
(c) the principle of efficiency, whereby—
(i) land development optimises the use of existing resources and infrastructure; (ii) decision-making procedures are designed to minimise negative financial, social, economic or environmental impacts; and (iii) development application procedures are efficient and streamlined and timeframes are adhered to by all parties; (d) the principle of spatial resilience, whereby flexibility in spatial plans, policies and land use management systems are accommodated to ensure sustainable livelihoods in communities most likely to suffer the impacts of economic and environmental shocks; and
(d) the principle of good administration, whereby— (i) all spheres of government ensure an integrated approach to land use and land development that is guided by the spatial planning and land use management systems as embodied in this Act; (ii) all government departments must provide their sector inputs and comply with any other prescribed requirements during the preparation or amendment of spatial development frameworks; (iii) the requirements of any law relating to land development and land use are met timeously; (iv) the preparation and amendment of spatial plans, policies, land use schemes as well as procedures for development applications, include transparent processes of public participation that afford all parties the opportunity to provide inputs on matters affecting them; and (v) policies, legislation and procedures must be clearly set in order to inform and empower members of the public. The Department of Rural Development & Land Reform (DRDLR) is drafting a Spatial Planning Outcomes Framework which will give much more details on the practical execution of these principles and will be included once available. NATIONAL, PROVINCIAL AND DISTRICT SCALE POLICY GUIDELINES National level National Development Plan, 2030 (NDP) and the national outcomes Chapter 3: Economy and Employment Spatially the focus is on reducing the cost of living whilst increasing the standard of living of poor households as well as removing constraints on economic growth and development. Chapter 4: Economic infrastructure In terms of spatial planning the emphasis is placed on consolidating and expanding transport and logistics infrastructure as well as improving public transport infrastructure. Chapter 5: Environmental sustainability and resilience The focus is on environmental sustainability and resilience in the face of change through an equitable transition to a low-carbon economy, which will also have implications on spatial planning and development in Merafong. Chapter 6: Inclusive rural economy A more inclusive rural economy can be established through integrated rural development. Spatially the focus is on research and the development of adaptation strategies for the protection of rural livelihoods and expansion of commercial agriculture. Chapter 8: Transforming Human Settlements Discusses the spatial planning system of South Africa and focusses on transforming SDFs into spatial contracts that are binding across national, provincial and local levels; encouraging cross border planning and
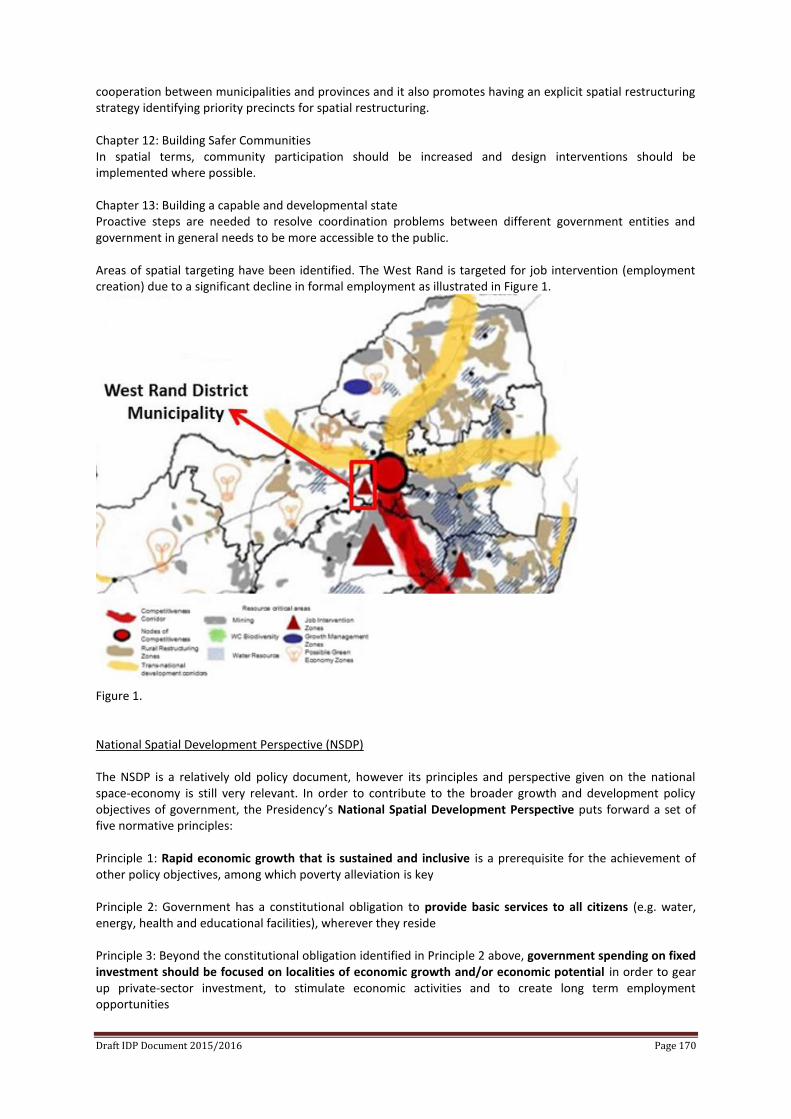
Draft IDP Document 2015/2016 Page 170
cooperation between municipalities and provinces and it also promotes having an explicit spatial restructuring strategy identifying priority precincts for spatial restructuring. Chapter 12: Building Safer Communities In spatial terms, community participation should be increased and design interventions should be implemented where possible. Chapter 13: Building a capable and developmental state Proactive steps are needed to resolve coordination problems between different government entities and government in general needs to be more accessible to the public. Areas of spatial targeting have been identified. The West Rand is targeted for job intervention (employment creation) due to a significant decline in formal employment as illustrated in Figure 1.
Figure 1. National Spatial Development Perspective (NSDP) The NSDP is a relatively old policy document, however its principles and perspective given on the national space-economy is still very relevant. In order to contribute to the broader growth and development policy objectives of government, the Presidency’s National Spatial Development Perspective puts forward a set of five normative principles: Principle 1: Rapid economic growth that is sustained and inclusive is a prerequisite for the achievement of other policy objectives, among which poverty alleviation is key Principle 2: Government has a constitutional obligation to provide basic services to all citizens (e.g. water, energy, health and educational facilities), wherever they reside Principle 3: Beyond the constitutional obligation identified in Principle 2 above, government spending on fixed investment should be focused on localities of economic growth and/or economic potential in order to gear up private-sector investment, to stimulate economic activities and to create long term employment opportunities
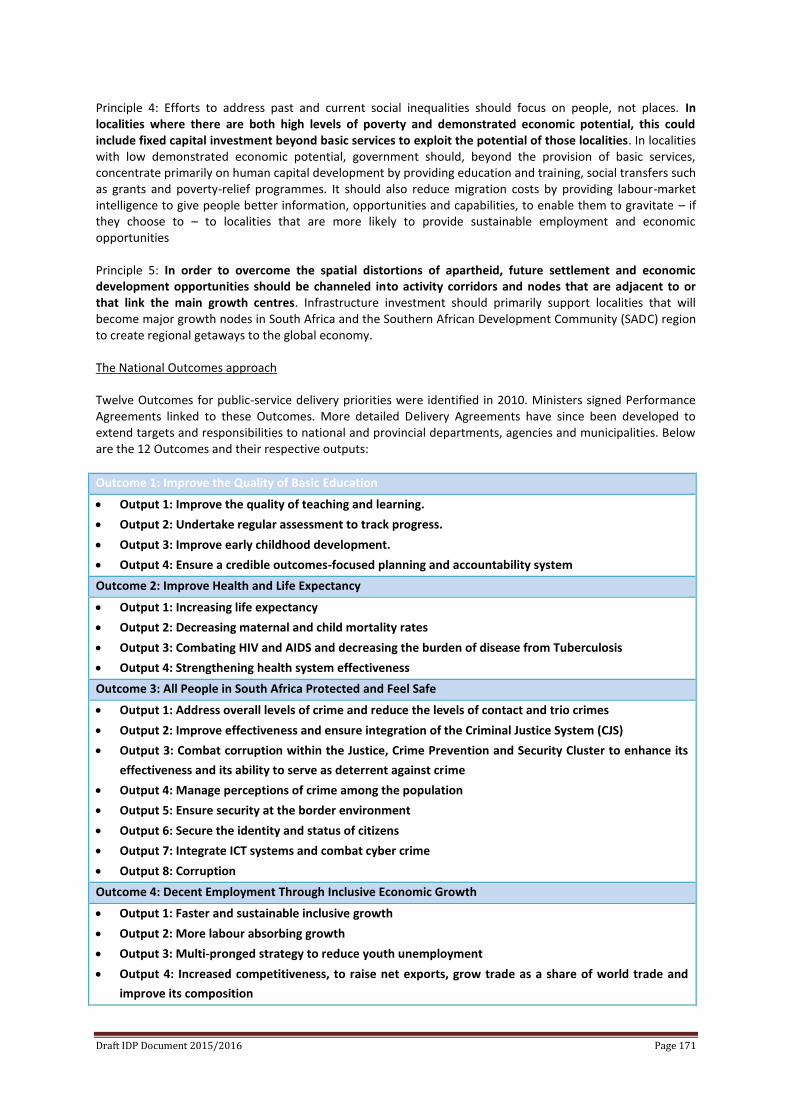
Draft IDP Document 2015/2016 Page 171
Principle 4: Efforts to address past and current social inequalities should focus on people, not places. In localities where there are both high levels of poverty and demonstrated economic potential, this could include fixed capital investment beyond basic services to exploit the potential of those localities. In localities with low demonstrated economic potential, government should, beyond the provision of basic services, concentrate primarily on human capital development by providing education and training, social transfers such as grants and poverty-relief programmes. It should also reduce migration costs by providing labour-market intelligence to give people better information, opportunities and capabilities, to enable them to gravitate – if they choose to – to localities that are more likely to provide sustainable employment and economic opportunities Principle 5: In order to overcome the spatial distortions of apartheid, future settlement and economic development opportunities should be channeled into activity corridors and nodes that are adjacent to or that link the main growth centres. Infrastructure investment should primarily support localities that will become major growth nodes in South Africa and the Southern African Development Community (SADC) region to create regional getaways to the global economy. The National Outcomes approach Twelve Outcomes for public-service delivery priorities were identified in 2010. Ministers signed Performance Agreements linked to these Outcomes. More detailed Delivery Agreements have since been developed to extend targets and responsibilities to national and provincial departments, agencies and municipalities. Below are the 12 Outcomes and their respective outputs:
Outcome 1: Improve the Quality of Basic Education
Output 1: Improve the quality of teaching and learning.
Output 2: Undertake regular assessment to track progress.
Output 3: Improve early childhood development.
Output 4: Ensure a credible outcomes-focused planning and accountability system
Outcome 2: Improve Health and Life Expectancy
Output 1: Increasing life expectancy
Output 2: Decreasing maternal and child mortality rates
Output 3: Combating HIV and AIDS and decreasing the burden of disease from Tuberculosis
Output 4: Strengthening health system effectiveness
Outcome 3: All People in South Africa Protected and Feel Safe
Output 1: Address overall levels of crime and reduce the levels of contact and trio crimes
Output 2: Improve effectiveness and ensure integration of the Criminal Justice System (CJS)
Output 3: Combat corruption within the Justice, Crime Prevention and Security Cluster to enhance its
effectiveness and its ability to serve as deterrent against crime
Output 4: Manage perceptions of crime among the population
Output 5: Ensure security at the border environment
Output 6: Secure the identity and status of citizens
Output 7: Integrate ICT systems and combat cyber crime
Output 8: Corruption
Outcome 4: Decent Employment Through Inclusive Economic Growth
Output 1: Faster and sustainable inclusive growth
Output 2: More labour absorbing growth
Output 3: Multi-pronged strategy to reduce youth unemployment
Output 4: Increased competitiveness, to raise net exports, grow trade as a share of world trade and
improve its composition
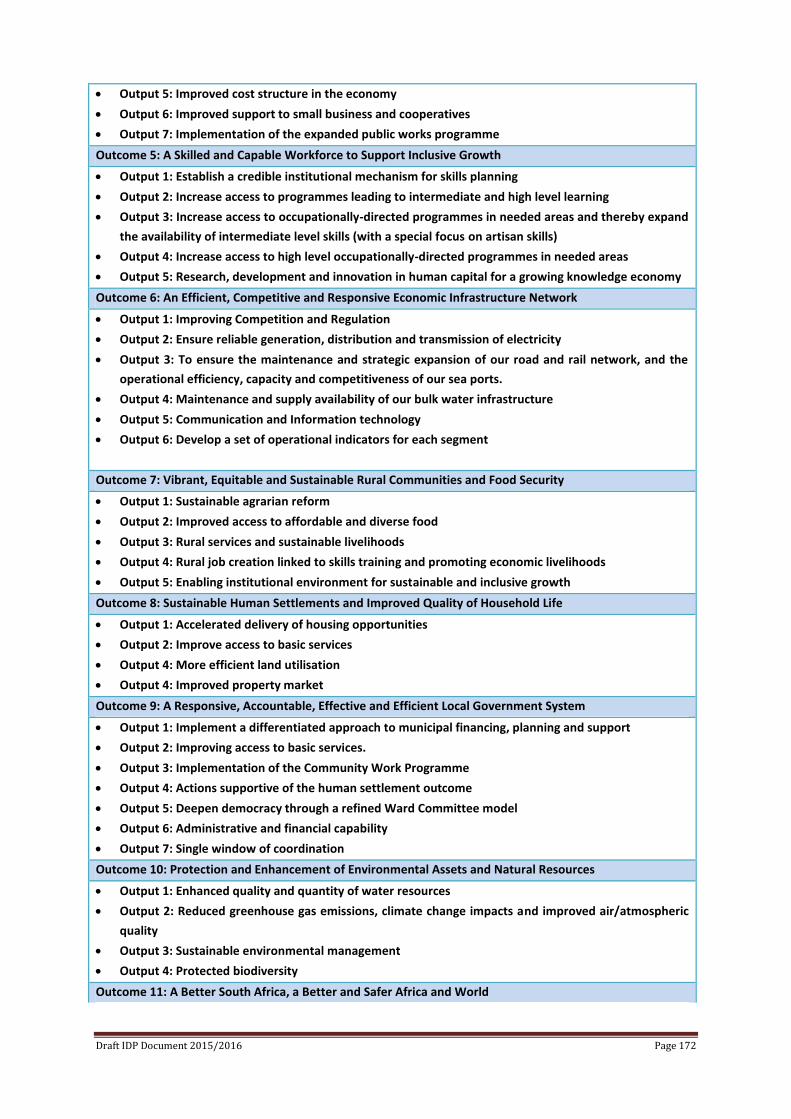
Draft IDP Document 2015/2016 Page 172
Output 5: Improved cost structure in the economy
Output 6: Improved support to small business and cooperatives
Output 7: Implementation of the expanded public works programme
Outcome 5: A Skilled and Capable Workforce to Support Inclusive Growth
Output 1: Establish a credible institutional mechanism for skills planning
Output 2: Increase access to programmes leading to intermediate and high level learning
Output 3: Increase access to occupationally-directed programmes in needed areas and thereby expand
the availability of intermediate level skills (with a special focus on artisan skills)
Output 4: Increase access to high level occupationally-directed programmes in needed areas
Output 5: Research, development and innovation in human capital for a growing knowledge economy
Outcome 6: An Efficient, Competitive and Responsive Economic Infrastructure Network
Output 1: Improving Competition and Regulation
Output 2: Ensure reliable generation, distribution and transmission of electricity
Output 3: To ensure the maintenance and strategic expansion of our road and rail network, and the
operational efficiency, capacity and competitiveness of our sea ports.
Output 4: Maintenance and supply availability of our bulk water infrastructure
Output 5: Communication and Information technology
Output 6: Develop a set of operational indicators for each segment
Outcome 7: Vibrant, Equitable and Sustainable Rural Communities and Food Security
Output 1: Sustainable agrarian reform
Output 2: Improved access to affordable and diverse food
Output 3: Rural services and sustainable livelihoods
Output 4: Rural job creation linked to skills training and promoting economic livelihoods
Output 5: Enabling institutional environment for sustainable and inclusive growth
Outcome 8: Sustainable Human Settlements and Improved Quality of Household Life
Output 1: Accelerated delivery of housing opportunities
Output 2: Improve access to basic services
Output 4: More efficient land utilisation
Output 4: Improved property market
Outcome 9: A Responsive, Accountable, Effective and Efficient Local Government System
Output 1: Implement a differentiated approach to municipal financing, planning and support
Output 2: Improving access to basic services.
Output 3: Implementation of the Community Work Programme
Output 4: Actions supportive of the human settlement outcome
Output 5: Deepen democracy through a refined Ward Committee model
Output 6: Administrative and financial capability
Output 7: Single window of coordination
Outcome 10: Protection and Enhancement of Environmental Assets and Natural Resources
Output 1: Enhanced quality and quantity of water resources
Output 2: Reduced greenhouse gas emissions, climate change impacts and improved air/atmospheric
quality
Output 3: Sustainable environmental management
Output 4: Protected biodiversity
Outcome 11: A Better South Africa, a Better and Safer Africa and World
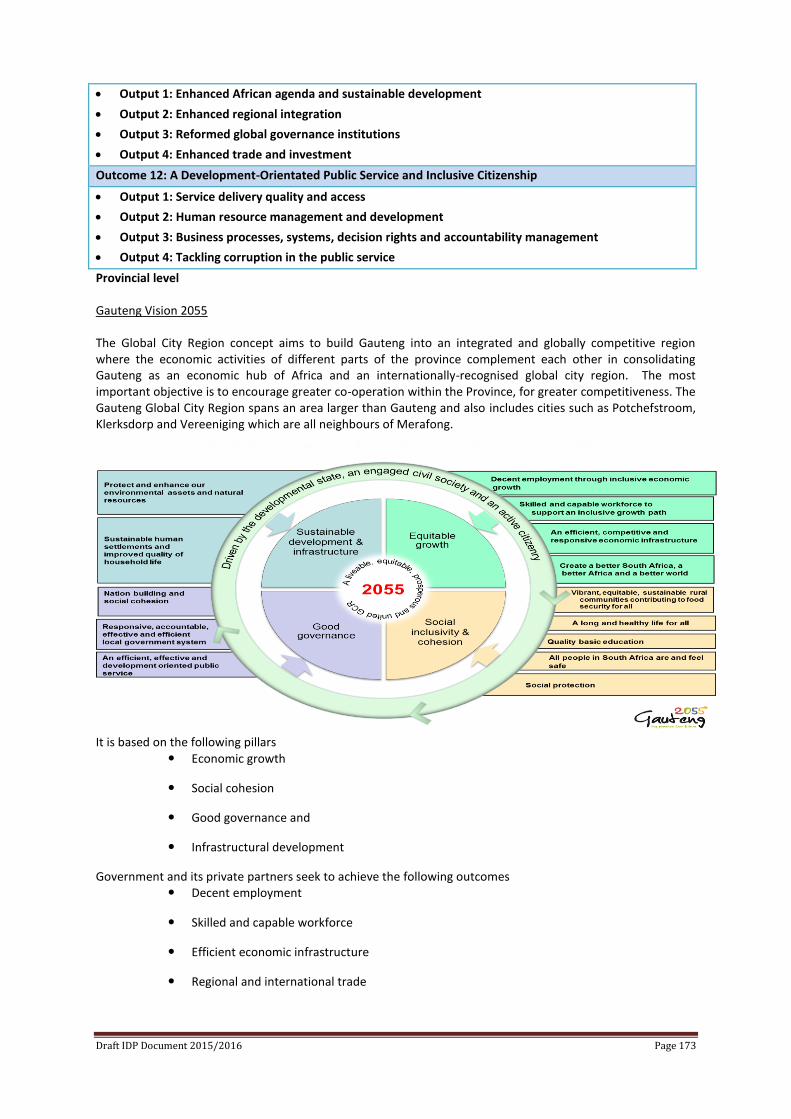
Draft IDP Document 2015/2016 Page 173
Output 1: Enhanced African agenda and sustainable development
Output 2: Enhanced regional integration
Output 3: Reformed global governance institutions
Output 4: Enhanced trade and investment
Outcome 12: A Development-Orientated Public Service and Inclusive Citizenship
Output 1: Service delivery quality and access
Output 2: Human resource management and development
Output 3: Business processes, systems, decision rights and accountability management
Output 4: Tackling corruption in the public service
Provincial level Gauteng Vision 2055 The Global City Region concept aims to build Gauteng into an integrated and globally competitive region where the economic activities of different parts of the province complement each other in consolidating Gauteng as an economic hub of Africa and an internationally-recognised global city region. The most important objective is to encourage greater co-operation within the Province, for greater competitiveness. The Gauteng Global City Region spans an area larger than Gauteng and also includes cities such as Potchefstroom, Klerksdorp and Vereeniging which are all neighbours of Merafong.
It is based on the following pillars Economic growth
Social cohesion
Good governance and
Infrastructural development
Government and its private partners seek to achieve the following outcomes Decent employment
Skilled and capable workforce
Efficient economic infrastructure
Regional and international trade
Draft IDP Document 2015/2016 Page 174
Key Challenges Insufficient Industrial Regional Growth
Poverty & Unemployment
Inadequate levels of foreign trade and investment
Crucial development in the Knowledge economy
Skills mismatch between secondary and Tertiary training institutions and labour market
Game changers/Interventions Development of powerful economic clusters and new growth sectors
Improving the GCR infrastructure to attract domestic business to the region and strengthen regional trade
Build private and public sector partnerships to match education outputs with sector needs
Gauteng Spatial Development Framework Other than recognizing the existence of Merafong City Local Municipality the GSDF does not say much about this municipality. Despite this there are principles in the document that are of use: The Case Principles are fundamental guidelines and set the basis for a sustainable future for the GCR and form the basis on how the GCR and forms the basis on how the GCR reacts spatially to the context in which it operates within. The principles are as follows:
Provide a long term vision for cities founded on sustainability; intergenerational, social, economic and political equity; and individuality.
Achieve long term economic and social security. Recognise the intrinsic value of biodiversity and natural ecosystems, protecting and restoring them. Enable communities to minimize their ecological footprints Build on the characteristics of ecosystems in the development and nurturing of healthy and
sustainable cities. Recognise and build on the distinctive characteristics of cities, including their human and cultural
values, historical and natural systems. Empower people and promote participation. Expand and enable cooperative networks to work towards a common, sustainable future. Promote sustainable production and consumption through appropriate use of environmentally sound
technologies and effective demand management. Enable continual improvement based on accountability, transparency, and good governance.
Draft Gauteng Growth Management Strategy Municipalities are ultimately responsible for the implementation of growth management in their respective jurisdictions, and will have to take responsibility for formulating and exercising a package of tools and mechanisms. Again, coordination of the actions of different municipal departments are key in successful growth management. This will require improved administrative procedures and collaboration. Typical responsibilities of municipalities include:
The formulation of Spatial Development Frameworks; The development of comprehensive, well-coordinated Integrated Development Plans that are aligned
with the growth management targets of the municipality; The levying of Bulk Services Contributions, Rates and Taxes; The application of Land Use Management mechanisms to either restrict development in certain areas
or facilitate development in others; and Investment in infrastructure and services that should be aligned with the growth management
objectives and targets. Given the massive gap in information on engineering services, a proper Growth Management Strategy for Merafong would be impossible. Therefore basic principles should be developed for the interim.
Draft IDP Document 2015/2016 Page 175
Gauteng Multi-Pillar Program of Radical Transformation The core mandate of the 5th administration of Gauteng is to elaborate and give practical and programmatic effect to the meaning of radical change in all aspects of governance in the province, as we build Gauteng into; “An integrated city-region, characterised by social cohesion and economic inclusion; the leading economy on the continent, underpinned by sustainable and socio-economic development.” Transform:
1. RADICAL ECONOMIC TRANSFORMATION: Interventions in key sectors of the economy to unlock growth and employment potential and bring in blacks, youth and women and revitalise township economy.
2. DECISIVE SPATIAL TRANSFORMATION: Through public transport and new sustainable and integrated human settlements and new cities.
3. ACCELERATING SOCIAL TRANSFORMATION: Modernise education and build smart schools; improve quality of care and modernise health institutions and rollout NHI; tackle urban poverty and social development challenges; dramatically improve community safety.
4. TRANSFORMATION OF THE STATE AND GOVERNANCE: Build developmental state capabilities through better organisation and professionalization; promote activist, purpose-driven and results-based government; active citizenry, sectoral engagement and community mobilisation.
Modernise: 1. MODERNISATION OF THE PUBLIC SERVICE: Build green and smart public services and infrastructure
to deliver services effectively and efficiently: build a connected government; vertically, horizontally, back office, intranet, and government to citizens, citizens to government etc.
2. MODERNISATION OF THE ECONOMY: Focus on economic modernisation through deployment of research, innovation science and green technology
3. PLANNING OF NEW HUMAN SETTLEMENTS: Modernisation of human settlements through green and high density settlements
4. MODERNISATION OF PUBLIC TRANSPORT: Planned urbanisation and urban development: Radically improve on better urban planning, public transport.
Industrialise: 1. RE-INDUSTRIALISE GAUTENG AND SOUTH AFRICA: re-build the manufacturing sector in Gauteng,
increasing manufacturing output and increasing employment in manufacturing and related up and downstream sectors.
2. TAKE THE LEAD IN AFRICA’S NEW INDUSTRIAL REVOLUTION: Entrench and expand on Gauteng’s status as the Gateway to Africa to realise the economic opportunities offered by the continent.
Draft IDP Document 2015/2016 Page 176
District Level West Rand Growth & Development Strategy
The vision of the WRDM Regional Growth and Development Strategy is to “develop and sustain an integrated, socio-economically and economically thriving and green environment with a unified society.” In order to achieve the above Vision, the Regional Growth and Development Strategy identified the following critical requirements:
Ensure the WRDM is connected – with more people enjoying the benefits of flourishing activity centres where shops, jobs, services and recreation are within walking and travelling distance of their homes, with fast and reliable travel to and from local centres and regional opportunities, with a comprehensive, efficient and networked public transport system and pedestrian routes and access to rural and tourism areas.
Ensure the WRDM is attractive – with quality urban and rural areas that are well-maintained, new developments which comply with high design standards, clean and safe environments and well-preserved heritage and natural areas.
Ensure the WRDM is sustainable – with resources well managed and planned for, viable and cost-effective service provision; and where the environment is valued as a vital resource and meaningful open space is provided for all.
Ensure the WRDM is well managed – where development decisions are predictable, fair and cost-effective, partnerships are developed, planning takes place on a continuous basis, formal systems for data collections are in place, and data is used to support and improve planning.
Subsequently, the study then identified the following six strategic priorities/key focus areas for the West Rand
District Area and these form the basis of the West Rand Regional Growth and Development Strategy:
Strategic Priority 1: Spatial Integration
Suitable development planning around dolomitic areas
Optimise opportunities/spin-offs from neighbouring areas’ initiatives:
Nodal densification
Corridor development and diversification
Mining rehabilitation to increase land availability
Informal Settlement Management
Development Incentive Schemes
Urban Renewal and Inner City Rejuvenation in the four main business areas
Strategic Priority 2: Physical Infrastructure
Promoting Information and Communication Technology (ICT)
Focus on strategic economic infrastructure programmes
Planning for current and future infrastructure
Maintenance of current infrastructure
Securing investment for infrastructure development
Strategic Objective 3: Economic Development
Expanding the Agriculture/Agro-processing industry in the District
Stimulating mining activity and mineral processing and -beneficiation activities in the District
Increasing manufacturing opportunities and activities in the District
Strengthening and promoting the tourism industry in the District
Strategic Objective 4: Environmental Management
Biofuel
Alternative energies (such as photovoltaic)
Hazardous and new waste types
Mine water pollution (e.g. Acid Mine Drainage)
Nanotechnology
Land Degradation
Creating a renewable energy sector
Draft IDP Document 2015/2016 Page 177
Managing and addressing mining-related environmental impacts
Waste Management and Recycling Programmes
Mitigate and prevent land degradation
Strategic Objective 5: Social Development
Reducing Poverty & Unemployment
Promoting Sustainable Human Settlements
Ensuring adequate education and training facilities
Ensuring efficient Health Care and Facilities
Promoting Safety and Security
Developing Sports, Recreation, Arts and Culture (SRAC) facilities
Strategic Objective 6: Governance
Promote Community Participation
Ensure Clean Audits
Effective implementation of Council policies
Maximise resources from other spheres
Regular Monitoring and evaluation
Promote easy and affordable business
(ADAPTED FROM THE WRDM SDF) WRDM Green IQ The WRDM Green IQ was compiled in (2012) and is a commitment to make the West Rand District the greenest district in South Africa and an African example of how sustainable development should be conducted. The Green IQ is a comprehensive strategy, built on 5 pillars, namely:
PEOPLE: To create a place where people come first, a place characterized by equity, dignity and possibility; where everyone has the opportunity to build a better life for themselves, their children.
ECONOMY: To restructure the economy to seize future development opportunities; to foster local resilience; to serve the people of the West Rand and to be an example of participatory prosperity.
ENVIRONMENT: To make the precious natural resources available for future generations; create a low-carbon built environment dedicated to quality of life; and regenerate rural areas with a new sense of purpose.
ENERGY: To facilitate the creation of new independent power producers to generate renewable, affordable and reliable energy to power new industries and create competitive advantages.
INNOVATION: To establish itself as a centre of excellence in green technology and green living; attract the best minds; and encourage and support the industries of the future.
Seven Key Programmes have been identified in the WRDM Green Economy Programme
Sector Description
Energy Efficiency Expanding off-grid options in rural and urban areas
Refit optimization for large scale renewable and localization, and
Up-scaling Solar Water Heater rollout
Food security Integrate sustainable agricultural production
Water and sanitation Water harvesting
Alternative technology for effluent management
Comprehensive municipal water metering (demand and management)
Reduce water losses in agriculture, municipalities and mining
Waste Waste beneficiation
Zero waste community programme for 500 000 households
Transportation
Promoting non-motorized transport and
Conversion to solar powered traffic lights
Spatial planning and land use
Investing in sustainable land use which will contribute to the WRDM economic vitality
Investing in the WRDM’s green space which creates opportunities to socialize and rest, fundamentally boost quality of life and socio-economic integration, and the associated economic benefits
Green buildings and the built environment
Greening of private and public buildings.
Draft IDP Document 2015/2016 Page 178
(ADAPTED FROM THE WRDM SDF)
WRDM Spatial Development Framework The following points are fundamental to the Vision for the future spatial structure of the West Rand District:
Containment of urban growth;
Densification of urban areas;
Eradicate large housing backlog in sustainable manner, integrating communities;
Incorporate environmental management principles in the management of land;
Protect high value agricultural land;
Improve and rehabilitate mining areas for future agricultural use;
Provide different typologies of housing;
Establish niche tourism opportunities; and
Address the large infrastructure backlog in the West Rand.
The key elements of alignment between the WRDM RGDS, Green IQ and IDP and which need to be incorporated into the WRDM SDF are summarised in the following table.
WRDM Regional Growth and Development Strategy
Green IQ WRDM Integrated Development Plan
Vision Elements Key Focus Areas Pillars Spatial Issues
Connected
Attractive
Sustainable
Well-Managed
Spatial Integration
Physical Infrastructure
Economic Development
Environmental Management
Social Development
Governance/Management
Innovation
Energy
Economy
Environment
People
Contain urban sprawl
Establish nodes and corridors
Improve eastward connectivity
Protect natural environment
Promote tourism
Sustainable utilisation of mining potential
Enhance agricultural production
Diversify industries
Manage rural residential use on small holdings
Consolidate rural infrastructure at nodes
Actively promote urban renewal
Upgrade/expand engineering services
(ADAPTED FROM THE WRDM SDF)
Synthesis of the primary policy documents on a national and provincial level From the National Development Plan, the National Outcomes and the Gauteng Multi Pillar Program, 5 broad themes are discernible namely:
1. Economy, Employment And Economic Infrastructure 2. Protection Of The Environment 3. Human settlements, Social Development And Urban Liveability 4. Rural Development 5. Development Oriented Public Service
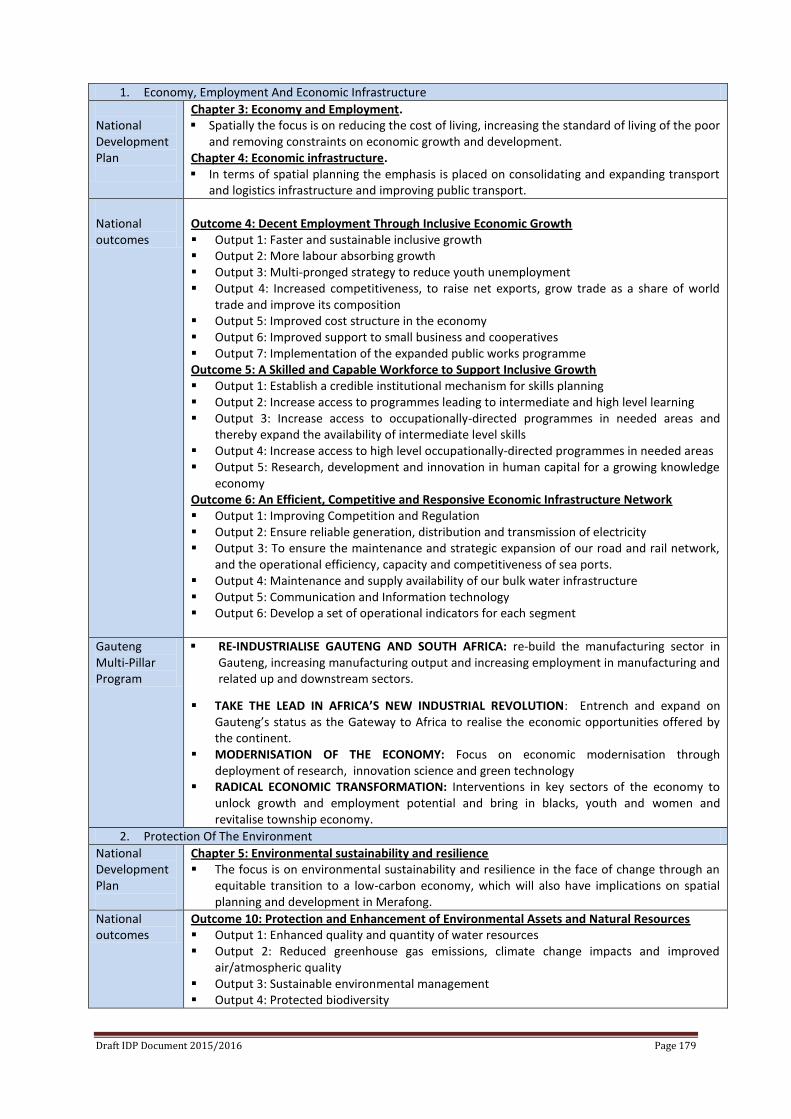
Draft IDP Document 2015/2016 Page 179
1. Economy, Employment And Economic Infrastructure
National Development Plan
Chapter 3: Economy and Employment. Spatially the focus is on reducing the cost of living, increasing the standard of living of the poor
and removing constraints on economic growth and development. Chapter 4: Economic infrastructure. In terms of spatial planning the emphasis is placed on consolidating and expanding transport
and logistics infrastructure and improving public transport.
National outcomes
Outcome 4: Decent Employment Through Inclusive Economic Growth Output 1: Faster and sustainable inclusive growth Output 2: More labour absorbing growth Output 3: Multi-pronged strategy to reduce youth unemployment Output 4: Increased competitiveness, to raise net exports, grow trade as a share of world
trade and improve its composition Output 5: Improved cost structure in the economy Output 6: Improved support to small business and cooperatives Output 7: Implementation of the expanded public works programme Outcome 5: A Skilled and Capable Workforce to Support Inclusive Growth Output 1: Establish a credible institutional mechanism for skills planning Output 2: Increase access to programmes leading to intermediate and high level learning Output 3: Increase access to occupationally-directed programmes in needed areas and
thereby expand the availability of intermediate level skills Output 4: Increase access to high level occupationally-directed programmes in needed areas Output 5: Research, development and innovation in human capital for a growing knowledge
economy Outcome 6: An Efficient, Competitive and Responsive Economic Infrastructure Network Output 1: Improving Competition and Regulation Output 2: Ensure reliable generation, distribution and transmission of electricity Output 3: To ensure the maintenance and strategic expansion of our road and rail network,
and the operational efficiency, capacity and competitiveness of sea ports. Output 4: Maintenance and supply availability of our bulk water infrastructure Output 5: Communication and Information technology Output 6: Develop a set of operational indicators for each segment
Gauteng Multi-Pillar Program
RE-INDUSTRIALISE GAUTENG AND SOUTH AFRICA: re-build the manufacturing sector in Gauteng, increasing manufacturing output and increasing employment in manufacturing and related up and downstream sectors.
TAKE THE LEAD IN AFRICA’S NEW INDUSTRIAL REVOLUTION: Entrench and expand on Gauteng’s status as the Gateway to Africa to realise the economic opportunities offered by the continent.
MODERNISATION OF THE ECONOMY: Focus on economic modernisation through deployment of research, innovation science and green technology
RADICAL ECONOMIC TRANSFORMATION: Interventions in key sectors of the economy to unlock growth and employment potential and bring in blacks, youth and women and revitalise township economy.
2. Protection Of The Environment
National Development Plan
Chapter 5: Environmental sustainability and resilience The focus is on environmental sustainability and resilience in the face of change through an
equitable transition to a low-carbon economy, which will also have implications on spatial planning and development in Merafong.
National outcomes
Outcome 10: Protection and Enhancement of Environmental Assets and Natural Resources Output 1: Enhanced quality and quantity of water resources Output 2: Reduced greenhouse gas emissions, climate change impacts and improved
air/atmospheric quality Output 3: Sustainable environmental management Output 4: Protected biodiversity
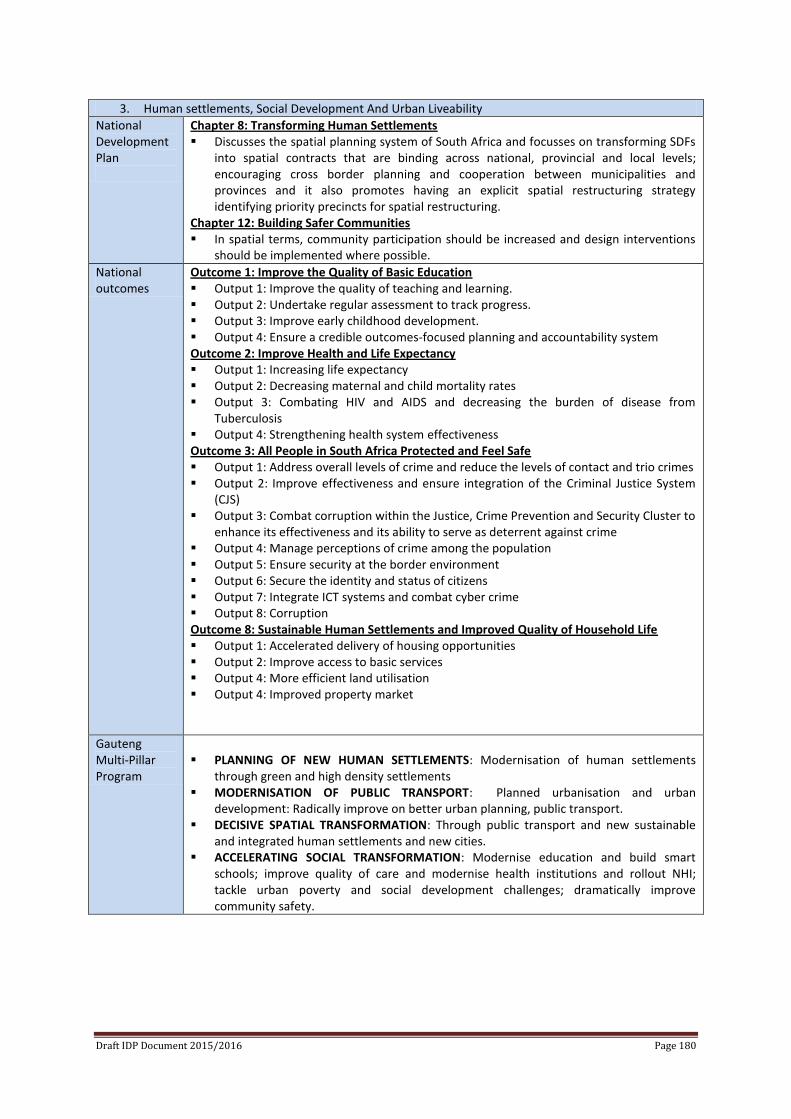
Draft IDP Document 2015/2016 Page 180
3. Human settlements, Social Development And Urban Liveability
National Development Plan
Chapter 8: Transforming Human Settlements Discusses the spatial planning system of South Africa and focusses on transforming SDFs
into spatial contracts that are binding across national, provincial and local levels; encouraging cross border planning and cooperation between municipalities and provinces and it also promotes having an explicit spatial restructuring strategy identifying priority precincts for spatial restructuring.
Chapter 12: Building Safer Communities In spatial terms, community participation should be increased and design interventions
should be implemented where possible.
National outcomes
Outcome 1: Improve the Quality of Basic Education Output 1: Improve the quality of teaching and learning. Output 2: Undertake regular assessment to track progress. Output 3: Improve early childhood development. Output 4: Ensure a credible outcomes-focused planning and accountability system Outcome 2: Improve Health and Life Expectancy Output 1: Increasing life expectancy Output 2: Decreasing maternal and child mortality rates Output 3: Combating HIV and AIDS and decreasing the burden of disease from
Tuberculosis Output 4: Strengthening health system effectiveness Outcome 3: All People in South Africa Protected and Feel Safe Output 1: Address overall levels of crime and reduce the levels of contact and trio crimes Output 2: Improve effectiveness and ensure integration of the Criminal Justice System
(CJS) Output 3: Combat corruption within the Justice, Crime Prevention and Security Cluster to
enhance its effectiveness and its ability to serve as deterrent against crime Output 4: Manage perceptions of crime among the population Output 5: Ensure security at the border environment Output 6: Secure the identity and status of citizens Output 7: Integrate ICT systems and combat cyber crime Output 8: Corruption Outcome 8: Sustainable Human Settlements and Improved Quality of Household Life Output 1: Accelerated delivery of housing opportunities Output 2: Improve access to basic services Output 4: More efficient land utilisation Output 4: Improved property market
Gauteng Multi-Pillar Program
PLANNING OF NEW HUMAN SETTLEMENTS: Modernisation of human settlements
through green and high density settlements MODERNISATION OF PUBLIC TRANSPORT: Planned urbanisation and urban
development: Radically improve on better urban planning, public transport. DECISIVE SPATIAL TRANSFORMATION: Through public transport and new sustainable
and integrated human settlements and new cities. ACCELERATING SOCIAL TRANSFORMATION: Modernise education and build smart
schools; improve quality of care and modernise health institutions and rollout NHI; tackle urban poverty and social development challenges; dramatically improve community safety.
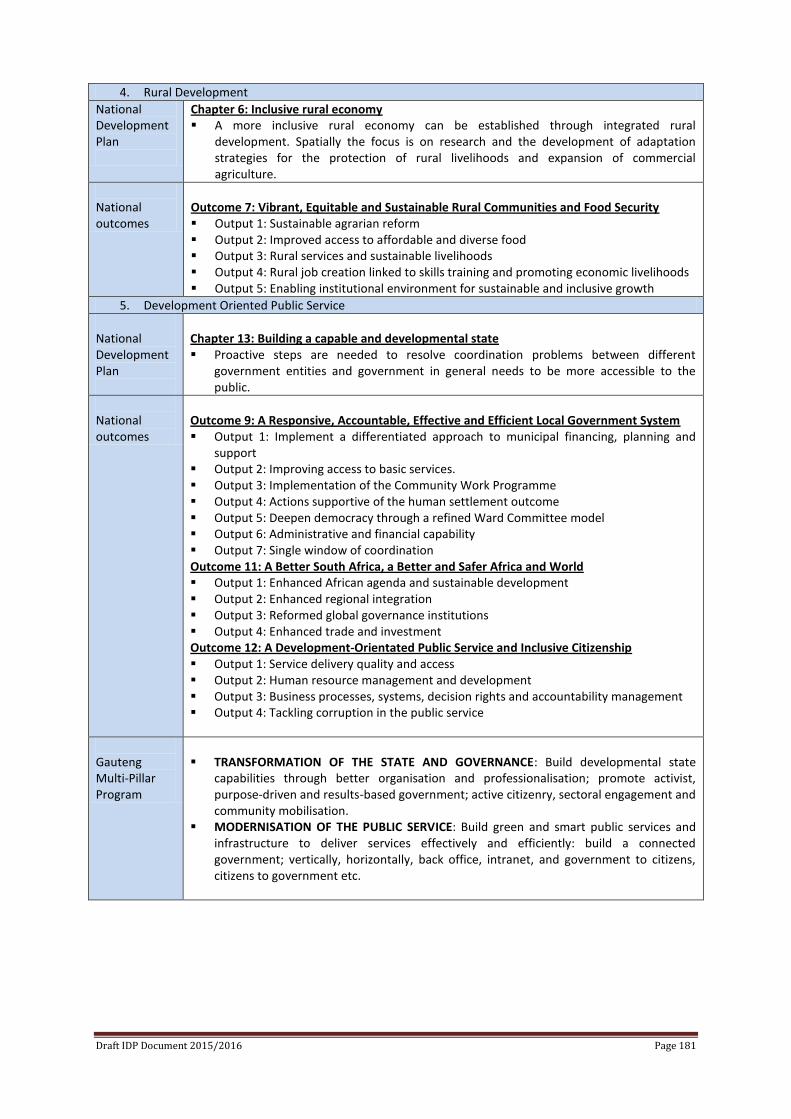
Draft IDP Document 2015/2016 Page 181
4. Rural Development
National Development Plan
Chapter 6: Inclusive rural economy A more inclusive rural economy can be established through integrated rural
development. Spatially the focus is on research and the development of adaptation strategies for the protection of rural livelihoods and expansion of commercial agriculture.
National outcomes
Outcome 7: Vibrant, Equitable and Sustainable Rural Communities and Food Security Output 1: Sustainable agrarian reform Output 2: Improved access to affordable and diverse food Output 3: Rural services and sustainable livelihoods Output 4: Rural job creation linked to skills training and promoting economic livelihoods Output 5: Enabling institutional environment for sustainable and inclusive growth
5. Development Oriented Public Service
National Development Plan
Chapter 13: Building a capable and developmental state Proactive steps are needed to resolve coordination problems between different
government entities and government in general needs to be more accessible to the public.
National outcomes
Outcome 9: A Responsive, Accountable, Effective and Efficient Local Government System Output 1: Implement a differentiated approach to municipal financing, planning and
support Output 2: Improving access to basic services. Output 3: Implementation of the Community Work Programme Output 4: Actions supportive of the human settlement outcome Output 5: Deepen democracy through a refined Ward Committee model Output 6: Administrative and financial capability Output 7: Single window of coordination Outcome 11: A Better South Africa, a Better and Safer Africa and World Output 1: Enhanced African agenda and sustainable development Output 2: Enhanced regional integration Output 3: Reformed global governance institutions Output 4: Enhanced trade and investment Outcome 12: A Development-Orientated Public Service and Inclusive Citizenship Output 1: Service delivery quality and access Output 2: Human resource management and development Output 3: Business processes, systems, decision rights and accountability management Output 4: Tackling corruption in the public service
Gauteng Multi-Pillar Program
TRANSFORMATION OF THE STATE AND GOVERNANCE: Build developmental state
capabilities through better organisation and professionalisation; promote activist, purpose-driven and results-based government; active citizenry, sectoral engagement and community mobilisation.
MODERNISATION OF THE PUBLIC SERVICE: Build green and smart public services and infrastructure to deliver services effectively and efficiently: build a connected government; vertically, horizontally, back office, intranet, and government to citizens, citizens to government etc.
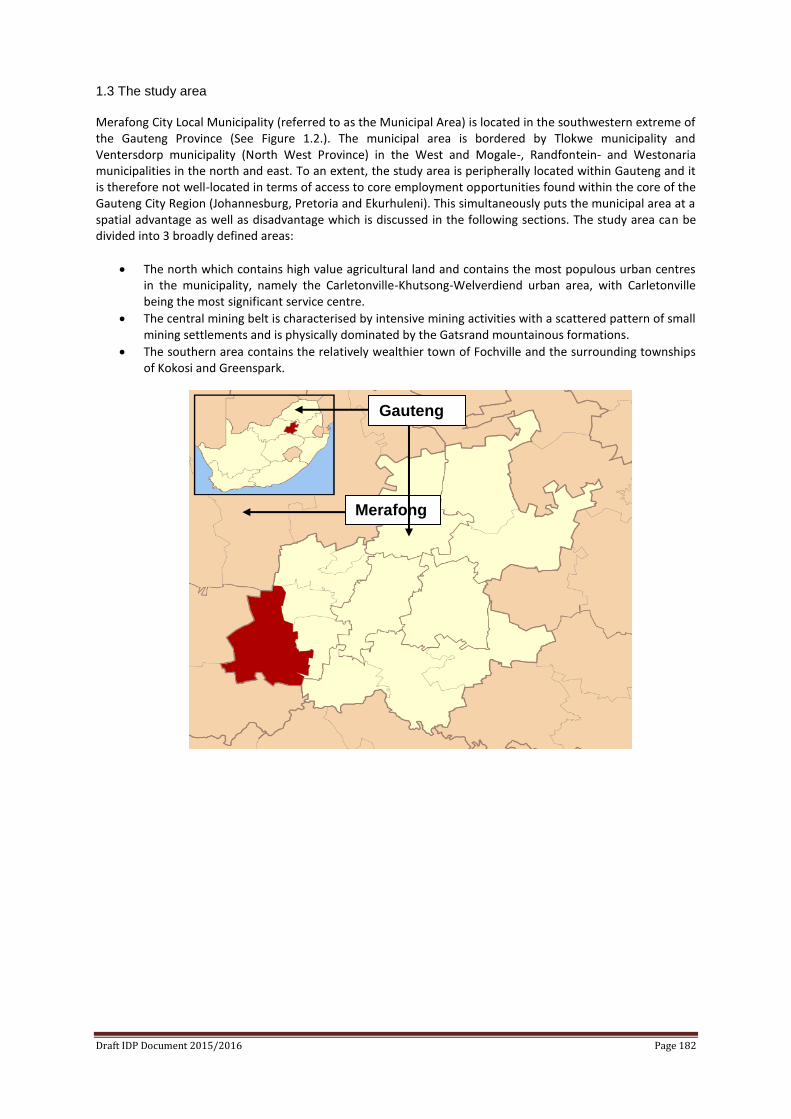
Draft IDP Document 2015/2016 Page 182
1.3 The study area
Merafong City Local Municipality (referred to as the Municipal Area) is located in the southwestern extreme of the Gauteng Province (See Figure 1.2.). The municipal area is bordered by Tlokwe municipality and Ventersdorp municipality (North West Province) in the West and Mogale-, Randfontein- and Westonaria municipalities in the north and east. To an extent, the study area is peripherally located within Gauteng and it is therefore not well-located in terms of access to core employment opportunities found within the core of the Gauteng City Region (Johannesburg, Pretoria and Ekurhuleni). This simultaneously puts the municipal area at a spatial advantage as well as disadvantage which is discussed in the following sections. The study area can be divided into 3 broadly defined areas:
The north which contains high value agricultural land and contains the most populous urban centres in the municipality, namely the Carletonville-Khutsong-Welverdiend urban area, with Carletonville being the most significant service centre.
The central mining belt is characterised by intensive mining activities with a scattered pattern of small mining settlements and is physically dominated by the Gatsrand mountainous formations.
The southern area contains the relatively wealthier town of Fochville and the surrounding townships of Kokosi and Greenspark.
Merafong
Gauteng
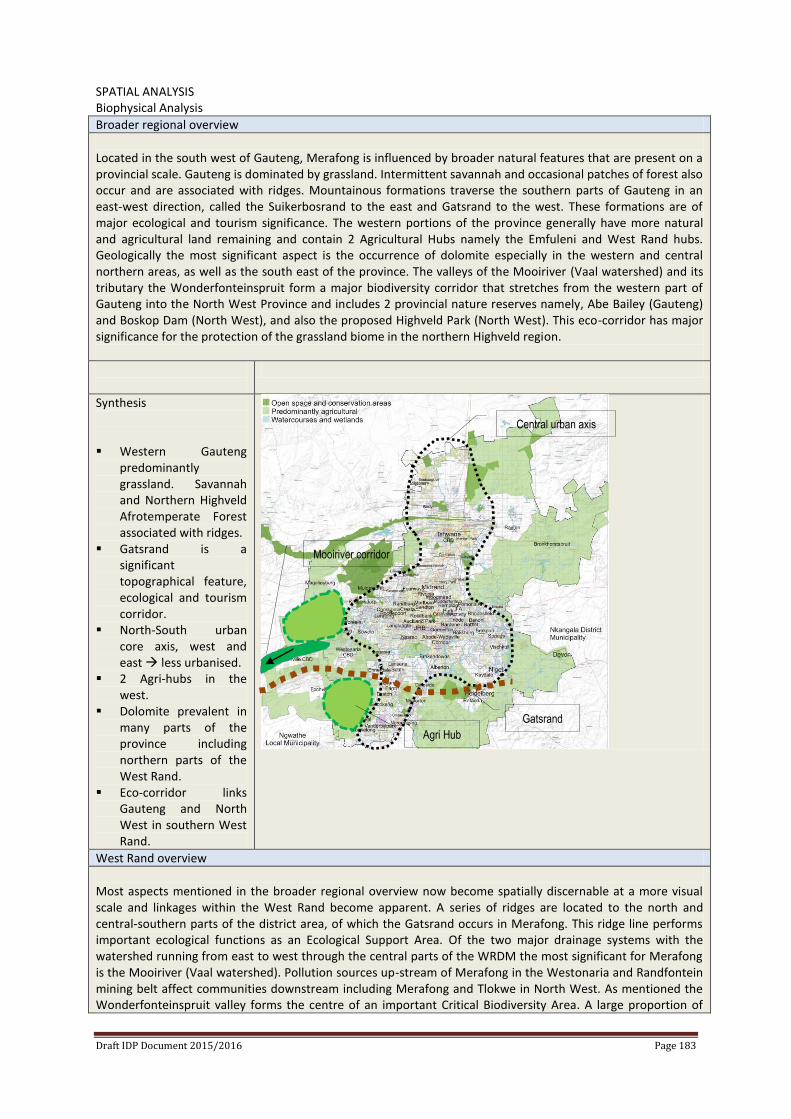
Draft IDP Document 2015/2016 Page 183
SPATIAL ANALYSIS Biophysical Analysis
Broader regional overview
Located in the south west of Gauteng, Merafong is influenced by broader natural features that are present on a provincial scale. Gauteng is dominated by grassland. Intermittent savannah and occasional patches of forest also occur and are associated with ridges. Mountainous formations traverse the southern parts of Gauteng in an east-west direction, called the Suikerbosrand to the east and Gatsrand to the west. These formations are of major ecological and tourism significance. The western portions of the province generally have more natural and agricultural land remaining and contain 2 Agricultural Hubs namely the Emfuleni and West Rand hubs. Geologically the most significant aspect is the occurrence of dolomite especially in the western and central northern areas, as well as the south east of the province. The valleys of the Mooiriver (Vaal watershed) and its tributary the Wonderfonteinspruit form a major biodiversity corridor that stretches from the western part of Gauteng into the North West Province and includes 2 provincial nature reserves namely, Abe Bailey (Gauteng) and Boskop Dam (North West), and also the proposed Highveld Park (North West). This eco-corridor has major significance for the protection of the grassland biome in the northern Highveld region.
Synthesis Western Gauteng
predominantly grassland. Savannah and Northern Highveld Afrotemperate Forest associated with ridges.
Gatsrand is a significant topographical feature, ecological and tourism corridor.
North-South urban core axis, west and east less urbanised.
2 Agri-hubs in the west.
Dolomite prevalent in many parts of the province including northern parts of the West Rand.
Eco-corridor links Gauteng and North West in southern West Rand.
West Rand overview
Most aspects mentioned in the broader regional overview now become spatially discernable at a more visual scale and linkages within the West Rand become apparent. A series of ridges are located to the north and central-southern parts of the district area, of which the Gatsrand occurs in Merafong. This ridge line performs important ecological functions as an Ecological Support Area. Of the two major drainage systems with the watershed running from east to west through the central parts of the WRDM the most significant for Merafong is the Mooiriver (Vaal watershed). Pollution sources up-stream of Merafong in the Westonaria and Randfontein mining belt affect communities downstream including Merafong and Tlokwe in North West. As mentioned the Wonderfonteinspruit valley forms the centre of an important Critical Biodiversity Area. A large proportion of
Gatsrand
Central urban axis
Agri Hub
Mooiriver corridor
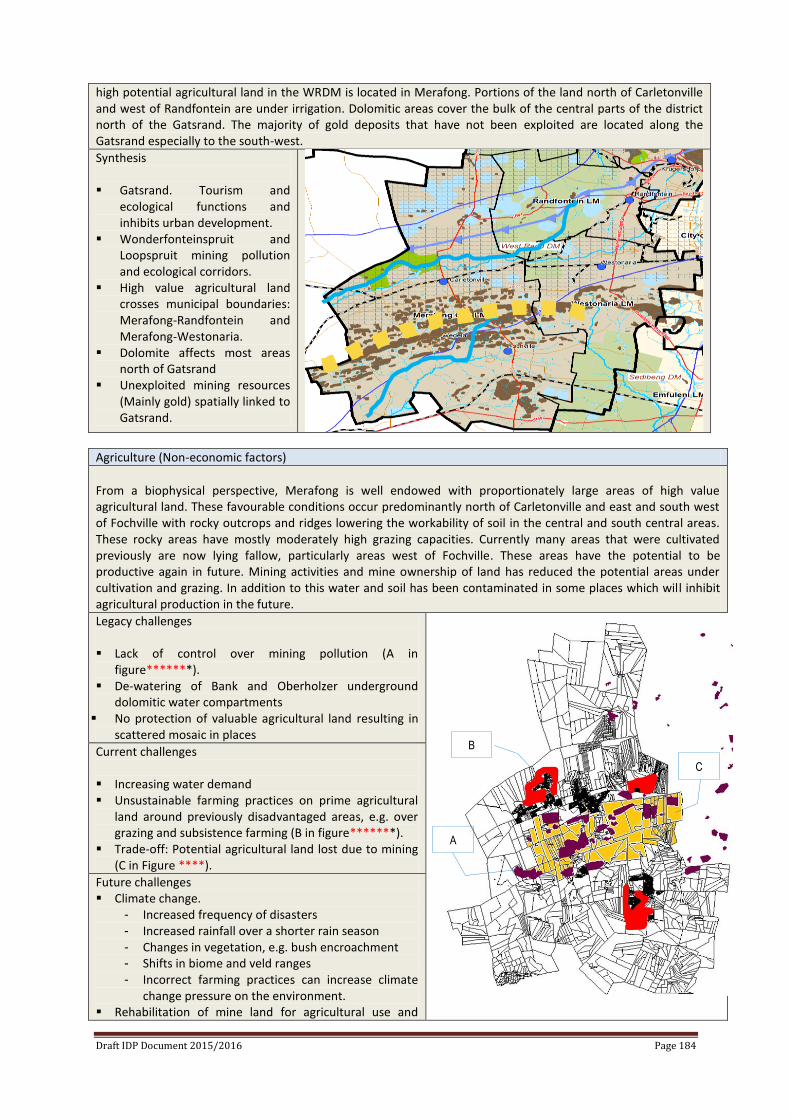
Draft IDP Document 2015/2016 Page 184
high potential agricultural land in the WRDM is located in Merafong. Portions of the land north of Carletonville and west of Randfontein are under irrigation. Dolomitic areas cover the bulk of the central parts of the district north of the Gatsrand. The majority of gold deposits that have not been exploited are located along the Gatsrand especially to the south-west.
Synthesis Gatsrand. Tourism and
ecological functions and inhibits urban development.
Wonderfonteinspruit and Loopspruit mining pollution and ecological corridors.
High value agricultural land crosses municipal boundaries: Merafong-Randfontein and Merafong-Westonaria.
Dolomite affects most areas north of Gatsrand
Unexploited mining resources (Mainly gold) spatially linked to Gatsrand.
Agriculture (Non-economic factors)
From a biophysical perspective, Merafong is well endowed with proportionately large areas of high value agricultural land. These favourable conditions occur predominantly north of Carletonville and east and south west of Fochville with rocky outcrops and ridges lowering the workability of soil in the central and south central areas. These rocky areas have mostly moderately high grazing capacities. Currently many areas that were cultivated previously are now lying fallow, particularly areas west of Fochville. These areas have the potential to be productive again in future. Mining activities and mine ownership of land has reduced the potential areas under cultivation and grazing. In addition to this water and soil has been contaminated in some places which will inhibit agricultural production in the future.
Legacy challenges Lack of control over mining pollution (A in
figure*******). De-watering of Bank and Oberholzer underground
dolomitic water compartments No protection of valuable agricultural land resulting in
scattered mosaic in places
Current challenges Increasing water demand Unsustainable farming practices on prime agricultural
land around previously disadvantaged areas, e.g. over grazing and subsistence farming (B in figure*******).
Trade-off: Potential agricultural land lost due to mining (C in Figure ****).
Future challenges Climate change.
- Increased frequency of disasters - Increased rainfall over a shorter rain season - Changes in vegetation, e.g. bush encroachment - Shifts in biome and veld ranges - Incorrect farming practices can increase climate
change pressure on the environment. Rehabilitation of mine land for agricultural use and
B
C
A
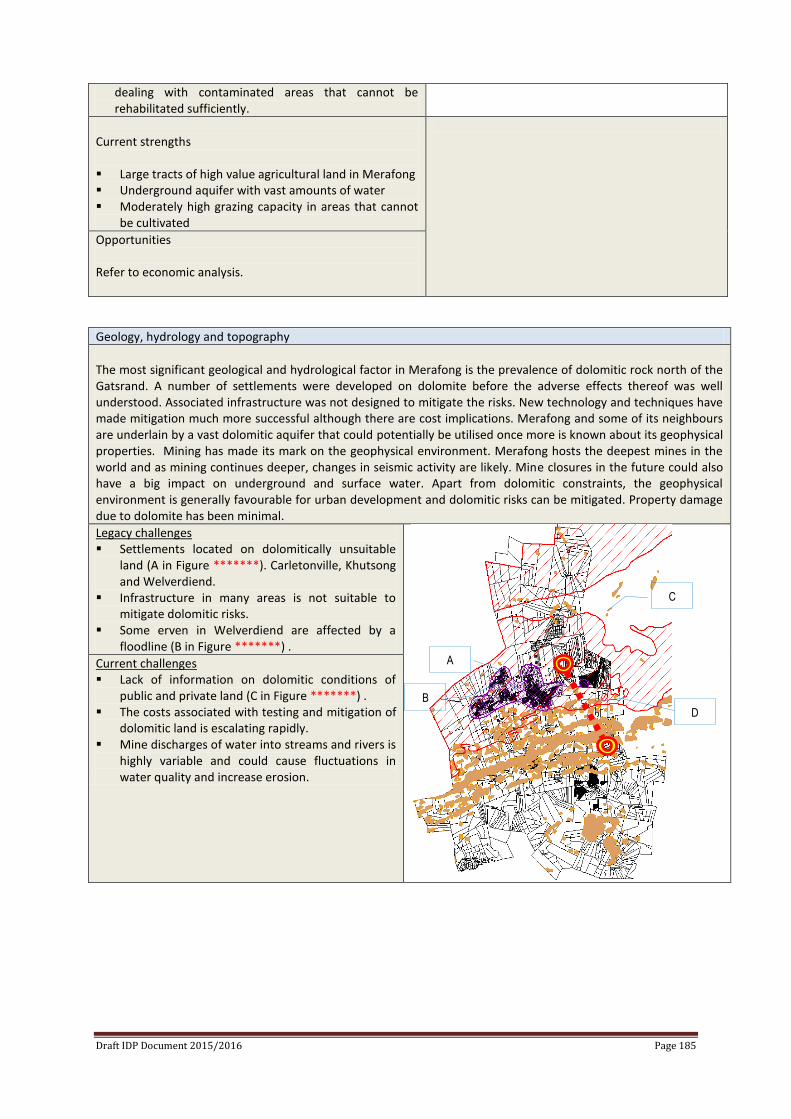
Draft IDP Document 2015/2016 Page 185
dealing with contaminated areas that cannot be rehabilitated sufficiently.
Current strengths Large tracts of high value agricultural land in Merafong Underground aquifer with vast amounts of water Moderately high grazing capacity in areas that cannot
be cultivated
Opportunities Refer to economic analysis.
Geology, hydrology and topography
The most significant geological and hydrological factor in Merafong is the prevalence of dolomitic rock north of the Gatsrand. A number of settlements were developed on dolomite before the adverse effects thereof was well understood. Associated infrastructure was not designed to mitigate the risks. New technology and techniques have made mitigation much more successful although there are cost implications. Merafong and some of its neighbours are underlain by a vast dolomitic aquifer that could potentially be utilised once more is known about its geophysical properties. Mining has made its mark on the geophysical environment. Merafong hosts the deepest mines in the world and as mining continues deeper, changes in seismic activity are likely. Mine closures in the future could also have a big impact on underground and surface water. Apart from dolomitic constraints, the geophysical environment is generally favourable for urban development and dolomitic risks can be mitigated. Property damage due to dolomite has been minimal.
Legacy challenges Settlements located on dolomitically unsuitable
land (A in Figure *******). Carletonville, Khutsong and Welverdiend.
Infrastructure in many areas is not suitable to mitigate dolomitic risks.
Some erven in Welverdiend are affected by a floodline (B in Figure *******) .
Current challenges Lack of information on dolomitic conditions of
public and private land (C in Figure *******) . The costs associated with testing and mitigation of
dolomitic land is escalating rapidly. Mine discharges of water into streams and rivers is
highly variable and could cause fluctuations in water quality and increase erosion.
B
A
C
D
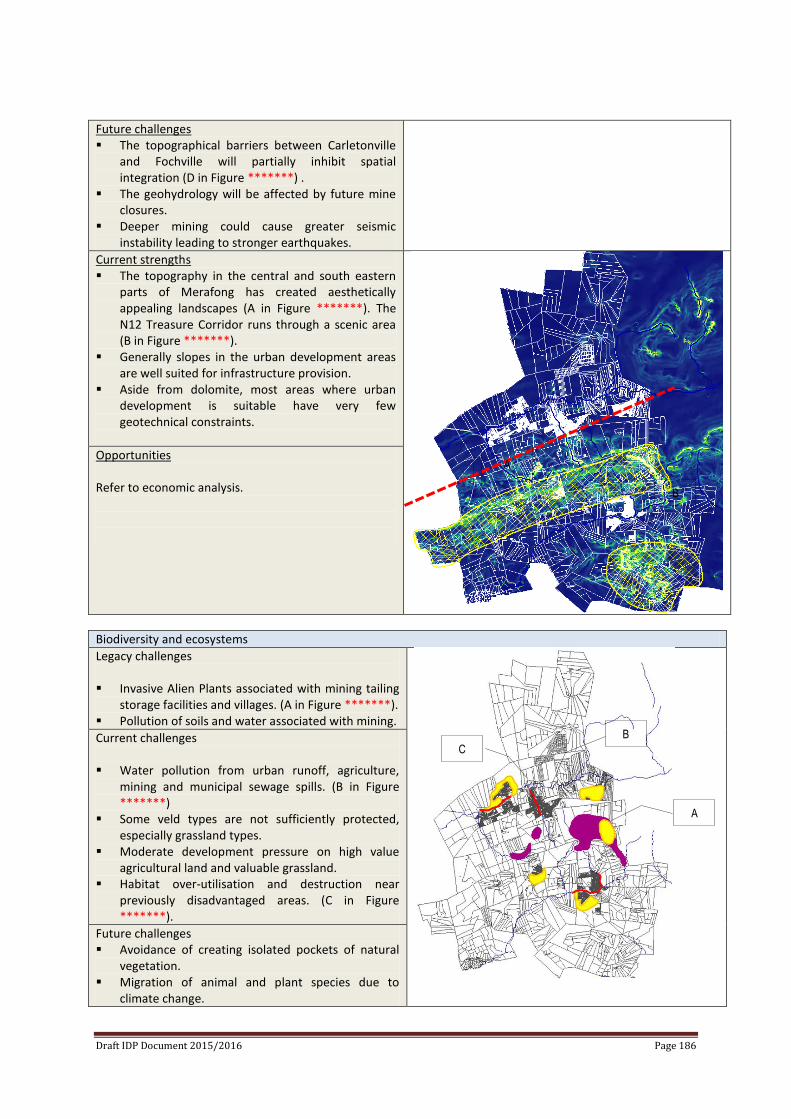
Draft IDP Document 2015/2016 Page 186
Future challenges The topographical barriers between Carletonville
and Fochville will partially inhibit spatial integration (D in Figure *******) .
The geohydrology will be affected by future mine closures.
Deeper mining could cause greater seismic instability leading to stronger earthquakes.
Current strengths The topography in the central and south eastern
parts of Merafong has created aesthetically appealing landscapes (A in Figure *******). The N12 Treasure Corridor runs through a scenic area (B in Figure *******).
Generally slopes in the urban development areas are well suited for infrastructure provision.
Aside from dolomite, most areas where urban development is suitable have very few geotechnical constraints.
Opportunities Refer to economic analysis.
Biodiversity and ecosystems
Legacy challenges Invasive Alien Plants associated with mining tailing
storage facilities and villages. (A in Figure *******). Pollution of soils and water associated with mining.
Current challenges Water pollution from urban runoff, agriculture,
mining and municipal sewage spills. (B in Figure *******)
Some veld types are not sufficiently protected, especially grassland types.
Moderate development pressure on high value agricultural land and valuable grassland.
Habitat over-utilisation and destruction near previously disadvantaged areas. (C in Figure *******).
Future challenges Avoidance of creating isolated pockets of natural
vegetation. Migration of animal and plant species due to
climate change.
A
B
C
A
B
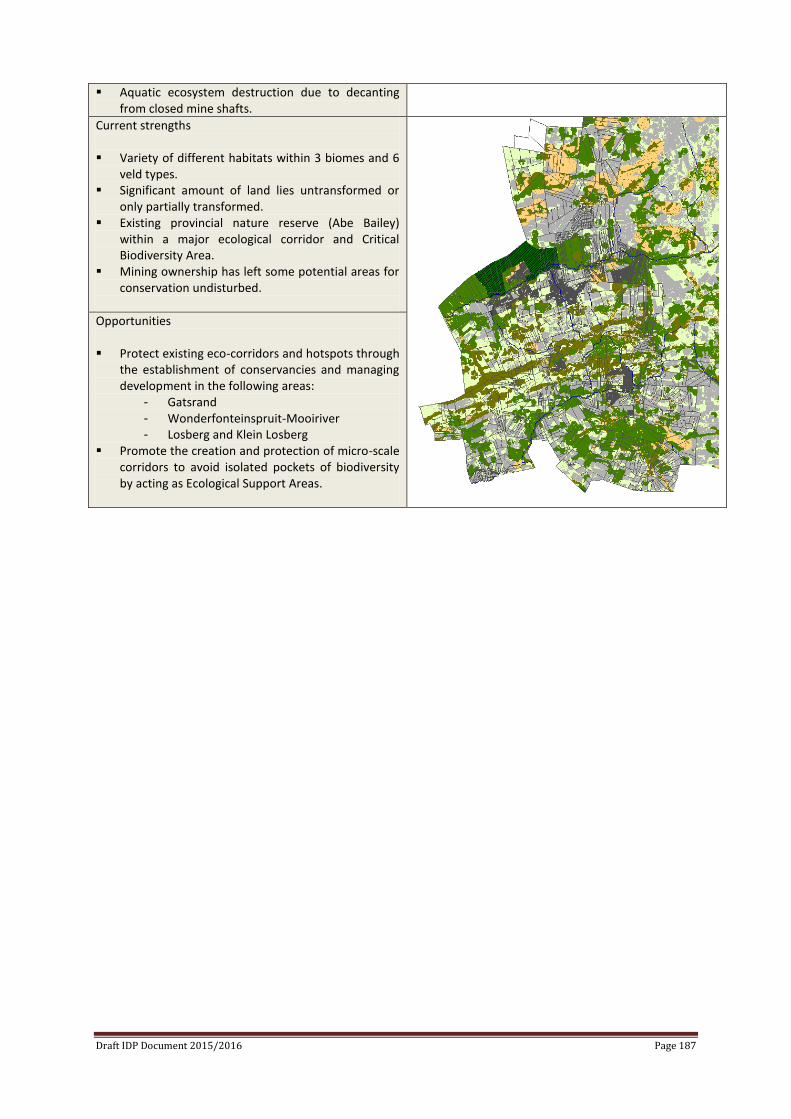
Draft IDP Document 2015/2016 Page 187
Aquatic ecosystem destruction due to decanting from closed mine shafts.
Current strengths Variety of different habitats within 3 biomes and 6
veld types. Significant amount of land lies untransformed or
only partially transformed. Existing provincial nature reserve (Abe Bailey)
within a major ecological corridor and Critical Biodiversity Area.
Mining ownership has left some potential areas for conservation undisturbed.
Opportunities Protect existing eco-corridors and hotspots through
the establishment of conservancies and managing development in the following areas:
- Gatsrand - Wonderfonteinspruit-Mooiriver - Losberg and Klein Losberg
Promote the creation and protection of micro-scale corridors to avoid isolated pockets of biodiversity by acting as Ecological Support Areas.
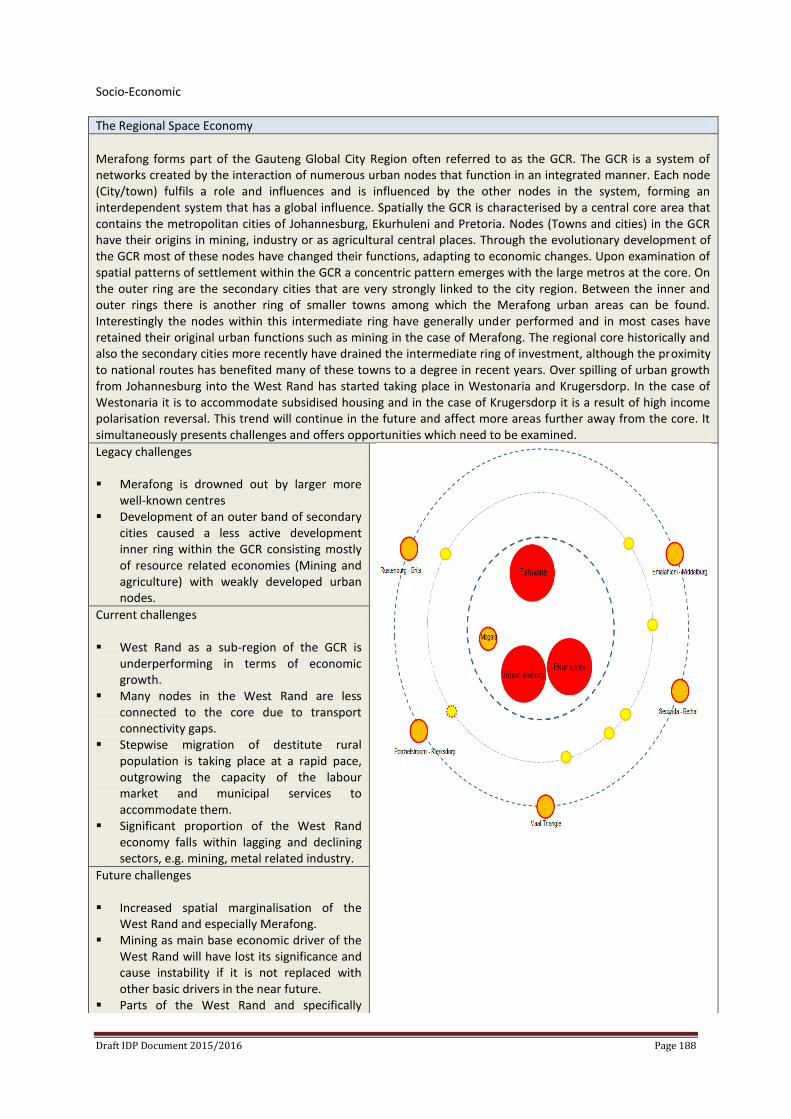
Draft IDP Document 2015/2016 Page 188
Socio-Economic
The Regional Space Economy
Merafong forms part of the Gauteng Global City Region often referred to as the GCR. The GCR is a system of networks created by the interaction of numerous urban nodes that function in an integrated manner. Each node (City/town) fulfils a role and influences and is influenced by the other nodes in the system, forming an interdependent system that has a global influence. Spatially the GCR is characterised by a central core area that contains the metropolitan cities of Johannesburg, Ekurhuleni and Pretoria. Nodes (Towns and cities) in the GCR have their origins in mining, industry or as agricultural central places. Through the evolutionary development of the GCR most of these nodes have changed their functions, adapting to economic changes. Upon examination of spatial patterns of settlement within the GCR a concentric pattern emerges with the large metros at the core. On the outer ring are the secondary cities that are very strongly linked to the city region. Between the inner and outer rings there is another ring of smaller towns among which the Merafong urban areas can be found. Interestingly the nodes within this intermediate ring have generally under performed and in most cases have retained their original urban functions such as mining in the case of Merafong. The regional core historically and also the secondary cities more recently have drained the intermediate ring of investment, although the proximity to national routes has benefited many of these towns to a degree in recent years. Over spilling of urban growth from Johannesburg into the West Rand has started taking place in Westonaria and Krugersdorp. In the case of Westonaria it is to accommodate subsidised housing and in the case of Krugersdorp it is a result of high income polarisation reversal. This trend will continue in the future and affect more areas further away from the core. It simultaneously presents challenges and offers opportunities which need to be examined.
Legacy challenges Merafong is drowned out by larger more
well-known centres Development of an outer band of secondary
cities caused a less active development inner ring within the GCR consisting mostly of resource related economies (Mining and agriculture) with weakly developed urban nodes.
Current challenges West Rand as a sub-region of the GCR is
underperforming in terms of economic growth.
Many nodes in the West Rand are less connected to the core due to transport connectivity gaps.
Stepwise migration of destitute rural population is taking place at a rapid pace, outgrowing the capacity of the labour market and municipal services to accommodate them.
Significant proportion of the West Rand economy falls within lagging and declining sectors, e.g. mining, metal related industry.
Future challenges Increased spatial marginalisation of the
West Rand and especially Merafong. Mining as main base economic driver of the
West Rand will have lost its significance and cause instability if it is not replaced with other basic drivers in the near future.
Parts of the West Rand and specifically
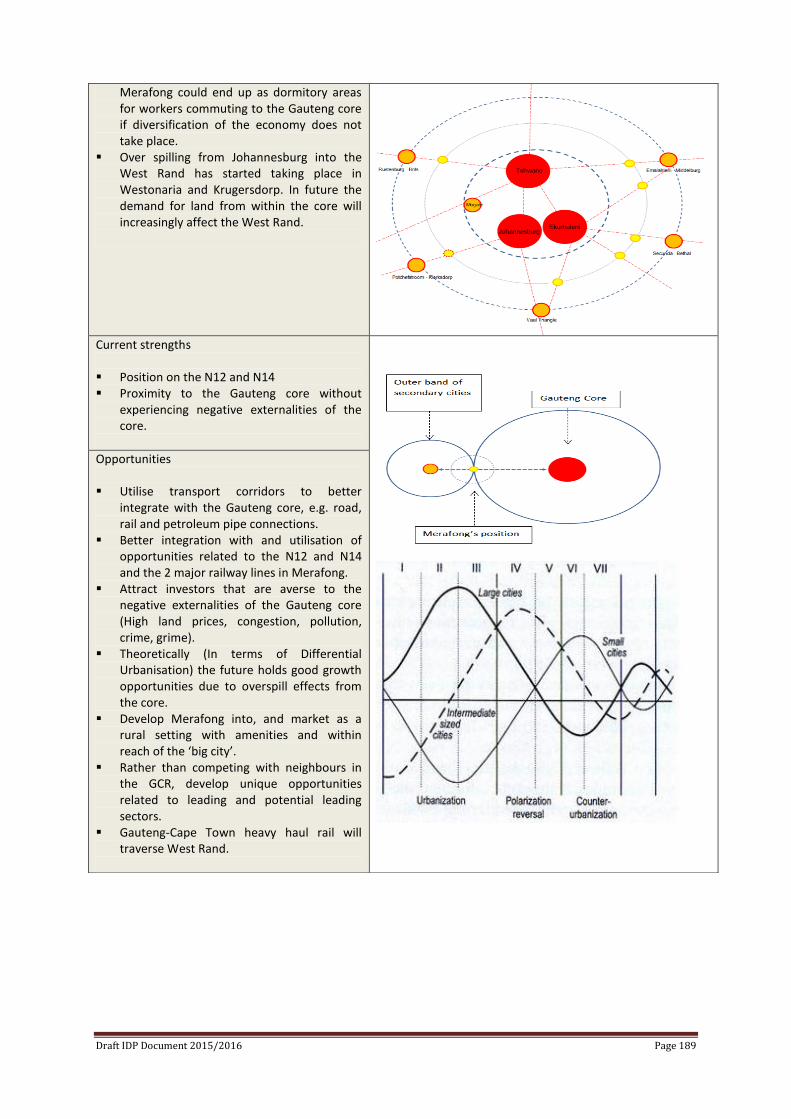
Draft IDP Document 2015/2016 Page 189
Merafong could end up as dormitory areas for workers commuting to the Gauteng core if diversification of the economy does not take place.
Over spilling from Johannesburg into the West Rand has started taking place in Westonaria and Krugersdorp. In future the demand for land from within the core will increasingly affect the West Rand.
Current strengths Position on the N12 and N14 Proximity to the Gauteng core without
experiencing negative externalities of the core.
Opportunities Utilise transport corridors to better
integrate with the Gauteng core, e.g. road, rail and petroleum pipe connections.
Better integration with and utilisation of opportunities related to the N12 and N14 and the 2 major railway lines in Merafong.
Attract investors that are averse to the negative externalities of the Gauteng core (High land prices, congestion, pollution, crime, grime).
Theoretically (In terms of Differential Urbanisation) the future holds good growth opportunities due to overspill effects from the core.
Develop Merafong into, and market as a rural setting with amenities and within reach of the ‘big city’.
Rather than competing with neighbours in the GCR, develop unique opportunities related to leading and potential leading sectors.
Gauteng-Cape Town heavy haul rail will traverse West Rand.
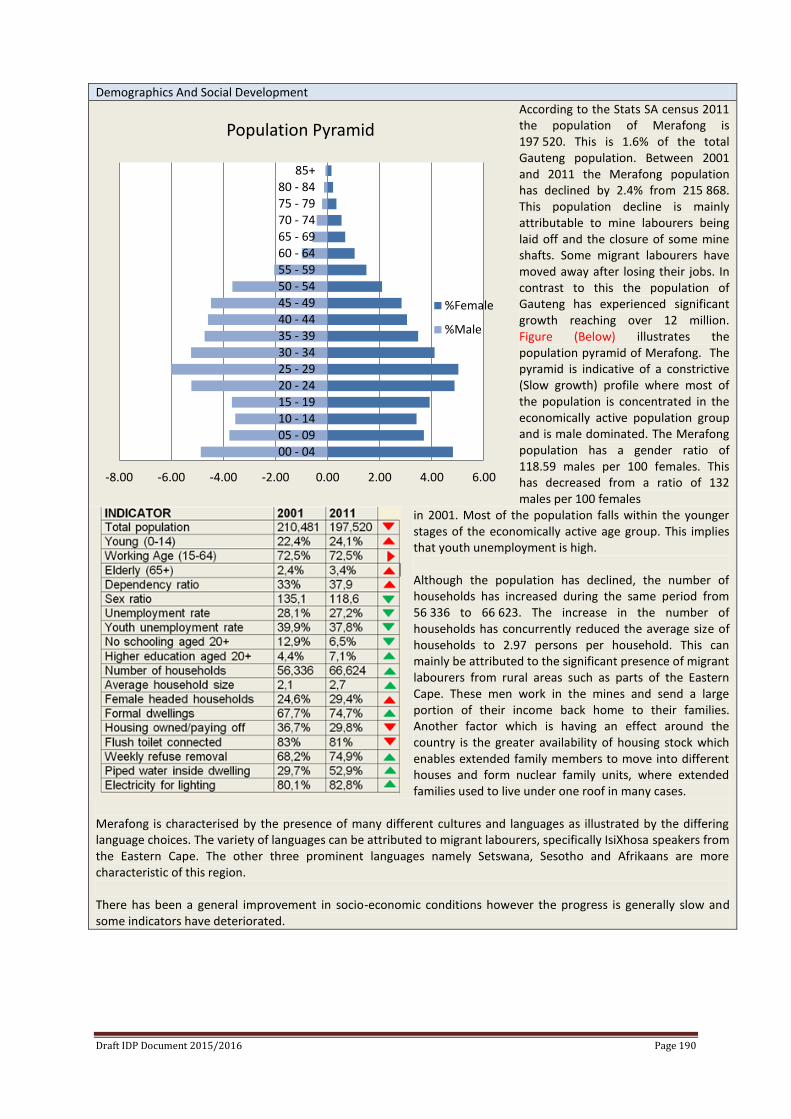
Draft IDP Document 2015/2016 Page 190
Demographics And Social Development
According to the Stats SA census 2011 the population of Merafong is 197 520. This is 1.6% of the total Gauteng population. Between 2001 and 2011 the Merafong population has declined by 2.4% from 215 868. This population decline is mainly attributable to mine labourers being laid off and the closure of some mine shafts. Some migrant labourers have moved away after losing their jobs. In contrast to this the population of Gauteng has experienced significant growth reaching over 12 million. Figure (Below) illustrates the population pyramid of Merafong. The pyramid is indicative of a constrictive (Slow growth) profile where most of the population is concentrated in the economically active population group and is male dominated. The Merafong population has a gender ratio of 118.59 males per 100 females. This has decreased from a ratio of 132 males per 100 females
in 2001. Most of the population falls within the younger stages of the economically active age group. This implies that youth unemployment is high. Although the population has declined, the number of households has increased during the same period from 56 336 to 66 623. The increase in the number of households has concurrently reduced the average size of households to 2.97 persons per household. This can mainly be attributed to the significant presence of migrant labourers from rural areas such as parts of the Eastern Cape. These men work in the mines and send a large portion of their income back home to their families. Another factor which is having an effect around the country is the greater availability of housing stock which enables extended family members to move into different houses and form nuclear family units, where extended families used to live under one roof in many cases.
Merafong is characterised by the presence of many different cultures and languages as illustrated by the differing language choices. The variety of languages can be attributed to migrant labourers, specifically IsiXhosa speakers from the Eastern Cape. The other three prominent languages namely Setswana, Sesotho and Afrikaans are more characteristic of this region. There has been a general improvement in socio-economic conditions however the progress is generally slow and some indicators have deteriorated.
-8.00 -6.00 -4.00 -2.00 0.00 2.00 4.00 6.00
00 - 0405 - 0910 - 1415 - 1920 - 2425 - 29
30 - 3435 - 3940 - 4445 - 49
50 - 5455 - 5960 - 6465 - 69
70 - 7475 - 7980 - 84
85+
Population Pyramid
%Female
%Male
Draft IDP Document 2015/2016 Page 191
Legacy challenges Separate social development during apartheid causing a lagging effect amongst the previously disadvantaged. Current challenges Decreasing population Increasing dependence ratio High unemployment especially amongst the youth In-migration of low education job seekers and out-migration of skilled labour in Merafong. Future challenges High probability of mass layoffs in the mining sector in the long term which will result in high unemployment and
social decay. The current lowering in unemployment and youth unemployment is not sustainable in the long term. Levels of dependency are increasing.
Current strengths Large pool of semi-skilled and technically skilled labour. Improvements in living conditions are discernible. The dependency ratio is relatively low. The gender ratio is improving which will lead to more sustainable family units. Opportunities Invest in infrastructure related to sectors that require technical knowledge such as agriculture and
manufacturing in order to retain the technical skills base. Build on the gains made in terms of human development by providing more social development opportunities.
Focus on allowing people to help themselves by providing resources for them to start Community Based Organisations and micro enterprises instead of trying to do it for them.
Dependency levels are low, however it is increasing. This opportunity should be utilised and basic services and social ‘buffers’ should be developed to face increasing levels of dependency.
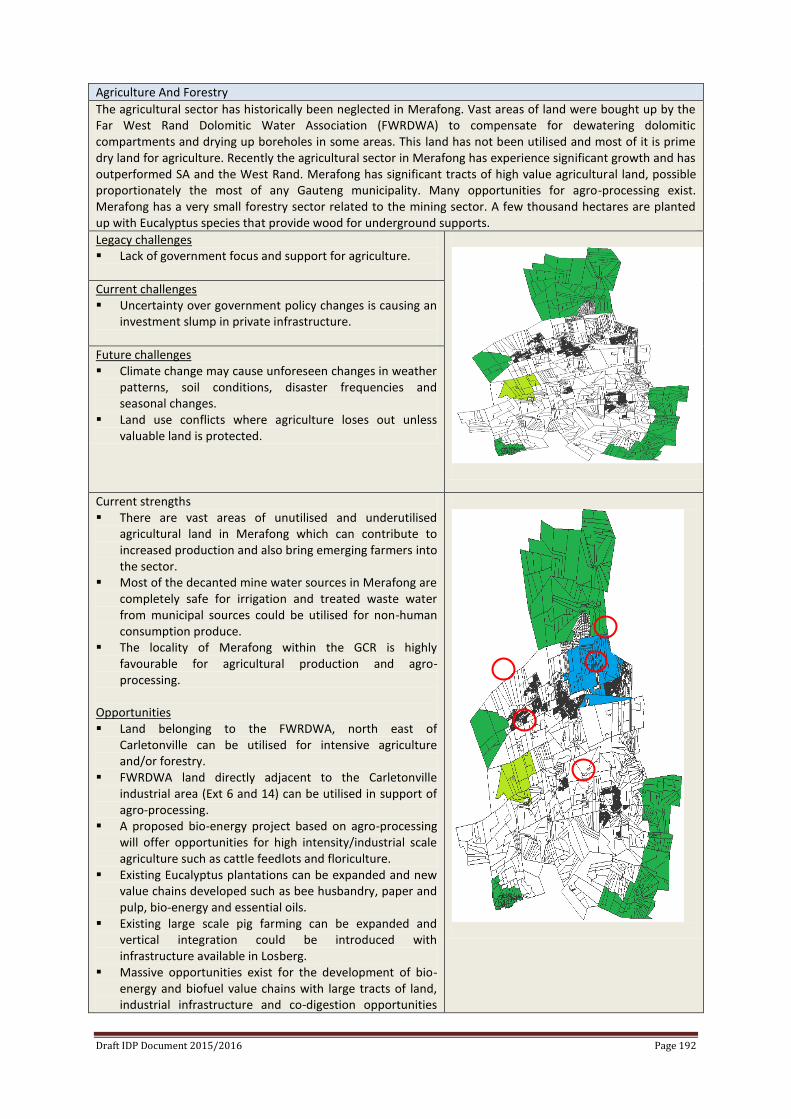
Draft IDP Document 2015/2016 Page 192
Agriculture And Forestry
The agricultural sector has historically been neglected in Merafong. Vast areas of land were bought up by the Far West Rand Dolomitic Water Association (FWRDWA) to compensate for dewatering dolomitic compartments and drying up boreholes in some areas. This land has not been utilised and most of it is prime dry land for agriculture. Recently the agricultural sector in Merafong has experience significant growth and has outperformed SA and the West Rand. Merafong has significant tracts of high value agricultural land, possible proportionately the most of any Gauteng municipality. Many opportunities for agro-processing exist. Merafong has a very small forestry sector related to the mining sector. A few thousand hectares are planted up with Eucalyptus species that provide wood for underground supports.
Legacy challenges Lack of government focus and support for agriculture.
Current challenges Uncertainty over government policy changes is causing an
investment slump in private infrastructure.
Future challenges Climate change may cause unforeseen changes in weather
patterns, soil conditions, disaster frequencies and seasonal changes.
Land use conflicts where agriculture loses out unless valuable land is protected.
Current strengths There are vast areas of unutilised and underutilised
agricultural land in Merafong which can contribute to increased production and also bring emerging farmers into the sector.
Most of the decanted mine water sources in Merafong are completely safe for irrigation and treated waste water from municipal sources could be utilised for non-human consumption produce.
The locality of Merafong within the GCR is highly favourable for agricultural production and agro-processing.
Opportunities Land belonging to the FWRDWA, north east of
Carletonville can be utilised for intensive agriculture and/or forestry.
FWRDWA land directly adjacent to the Carletonville industrial area (Ext 6 and 14) can be utilised in support of agro-processing.
A proposed bio-energy project based on agro-processing will offer opportunities for high intensity/industrial scale agriculture such as cattle feedlots and floriculture.
Existing Eucalyptus plantations can be expanded and new value chains developed such as bee husbandry, paper and pulp, bio-energy and essential oils.
Existing large scale pig farming can be expanded and vertical integration could be introduced with infrastructure available in Losberg.
Massive opportunities exist for the development of bio-energy and biofuel value chains with large tracts of land, industrial infrastructure and co-digestion opportunities
Draft IDP Document 2015/2016 Page 193
available. The concept of agro-ecology should be considered for new
projects in order to boost productivity and reduce environmental impacts.
New agri products such as Pecan nuts, Olives, herbs and expanding floriculture should be explored.
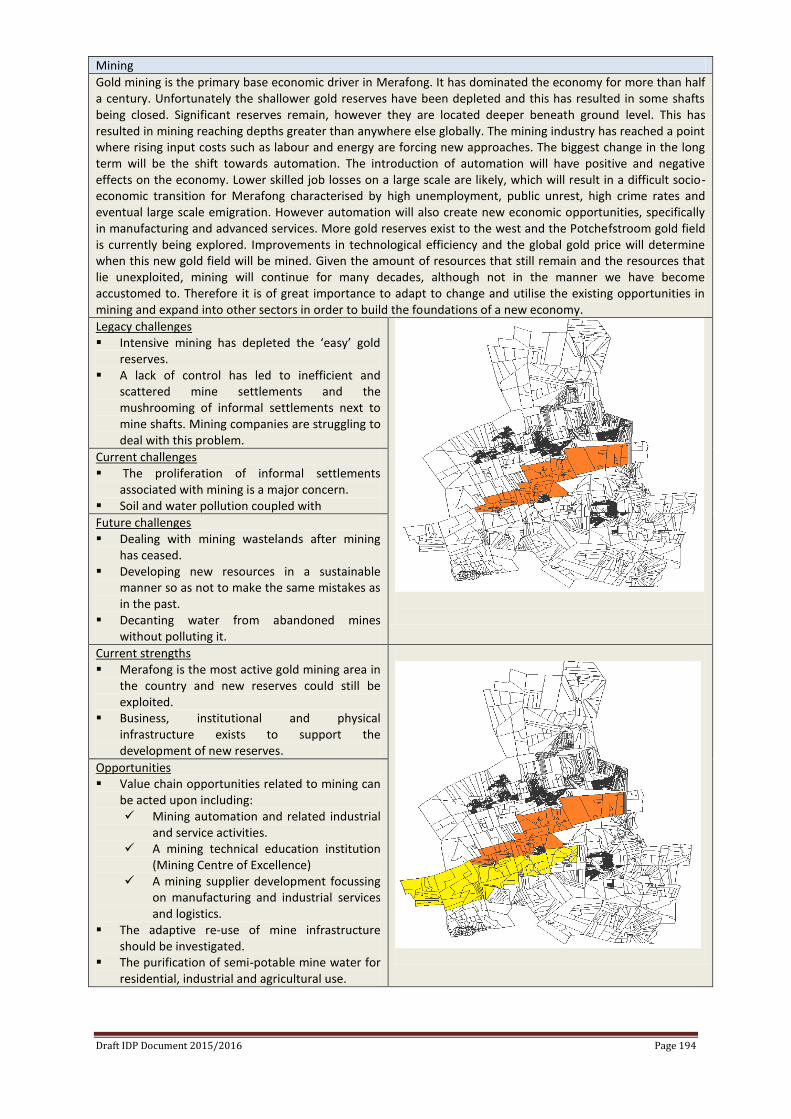
Draft IDP Document 2015/2016 Page 194
Mining
Gold mining is the primary base economic driver in Merafong. It has dominated the economy for more than half a century. Unfortunately the shallower gold reserves have been depleted and this has resulted in some shafts being closed. Significant reserves remain, however they are located deeper beneath ground level. This has resulted in mining reaching depths greater than anywhere else globally. The mining industry has reached a point where rising input costs such as labour and energy are forcing new approaches. The biggest change in the long term will be the shift towards automation. The introduction of automation will have positive and negative effects on the economy. Lower skilled job losses on a large scale are likely, which will result in a difficult socio-economic transition for Merafong characterised by high unemployment, public unrest, high crime rates and eventual large scale emigration. However automation will also create new economic opportunities, specifically in manufacturing and advanced services. More gold reserves exist to the west and the Potchefstroom gold field is currently being explored. Improvements in technological efficiency and the global gold price will determine when this new gold field will be mined. Given the amount of resources that still remain and the resources that lie unexploited, mining will continue for many decades, although not in the manner we have become accustomed to. Therefore it is of great importance to adapt to change and utilise the existing opportunities in mining and expand into other sectors in order to build the foundations of a new economy.
Legacy challenges Intensive mining has depleted the ‘easy’ gold
reserves. A lack of control has led to inefficient and
scattered mine settlements and the mushrooming of informal settlements next to mine shafts. Mining companies are struggling to deal with this problem.
Current challenges The proliferation of informal settlements
associated with mining is a major concern. Soil and water pollution coupled with
Future challenges Dealing with mining wastelands after mining
has ceased. Developing new resources in a sustainable
manner so as not to make the same mistakes as in the past.
Decanting water from abandoned mines without polluting it.
Current strengths Merafong is the most active gold mining area in
the country and new reserves could still be exploited.
Business, institutional and physical infrastructure exists to support the development of new reserves.
Opportunities Value chain opportunities related to mining can
be acted upon including: Mining automation and related industrial
and service activities. A mining technical education institution
(Mining Centre of Excellence) A mining supplier development focussing
on manufacturing and industrial services and logistics.
The adaptive re-use of mine infrastructure should be investigated.
The purification of semi-potable mine water for residential, industrial and agricultural use.
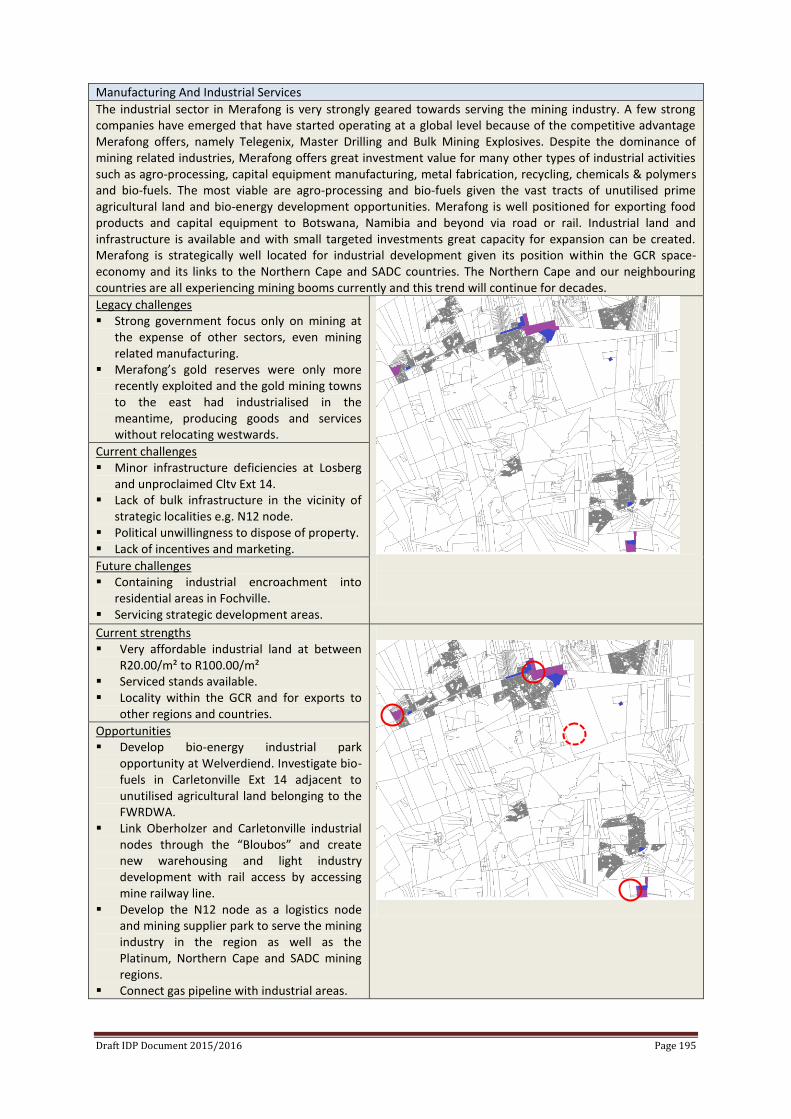
Draft IDP Document 2015/2016 Page 195
Manufacturing And Industrial Services
The industrial sector in Merafong is very strongly geared towards serving the mining industry. A few strong companies have emerged that have started operating at a global level because of the competitive advantage Merafong offers, namely Telegenix, Master Drilling and Bulk Mining Explosives. Despite the dominance of mining related industries, Merafong offers great investment value for many other types of industrial activities such as agro-processing, capital equipment manufacturing, metal fabrication, recycling, chemicals & polymers and bio-fuels. The most viable are agro-processing and bio-fuels given the vast tracts of unutilised prime agricultural land and bio-energy development opportunities. Merafong is well positioned for exporting food products and capital equipment to Botswana, Namibia and beyond via road or rail. Industrial land and infrastructure is available and with small targeted investments great capacity for expansion can be created. Merafong is strategically well located for industrial development given its position within the GCR space-economy and its links to the Northern Cape and SADC countries. The Northern Cape and our neighbouring countries are all experiencing mining booms currently and this trend will continue for decades.
Legacy challenges Strong government focus only on mining at
the expense of other sectors, even mining related manufacturing.
Merafong’s gold reserves were only more recently exploited and the gold mining towns to the east had industrialised in the meantime, producing goods and services without relocating westwards.
Current challenges Minor infrastructure deficiencies at Losberg
and unproclaimed Cltv Ext 14. Lack of bulk infrastructure in the vicinity of
strategic localities e.g. N12 node. Political unwillingness to dispose of property. Lack of incentives and marketing.
Future challenges Containing industrial encroachment into
residential areas in Fochville. Servicing strategic development areas.
Current strengths Very affordable industrial land at between
R20.00/m² to R100.00/m² Serviced stands available. Locality within the GCR and for exports to
other regions and countries.
Opportunities Develop bio-energy industrial park
opportunity at Welverdiend. Investigate bio-fuels in Carletonville Ext 14 adjacent to unutilised agricultural land belonging to the FWRDWA.
Link Oberholzer and Carletonville industrial nodes through the “Bloubos” and create new warehousing and light industry development with rail access by accessing mine railway line.
Develop the N12 node as a logistics node and mining supplier park to serve the mining industry in the region as well as the Platinum, Northern Cape and SADC mining regions.
Connect gas pipeline with industrial areas.
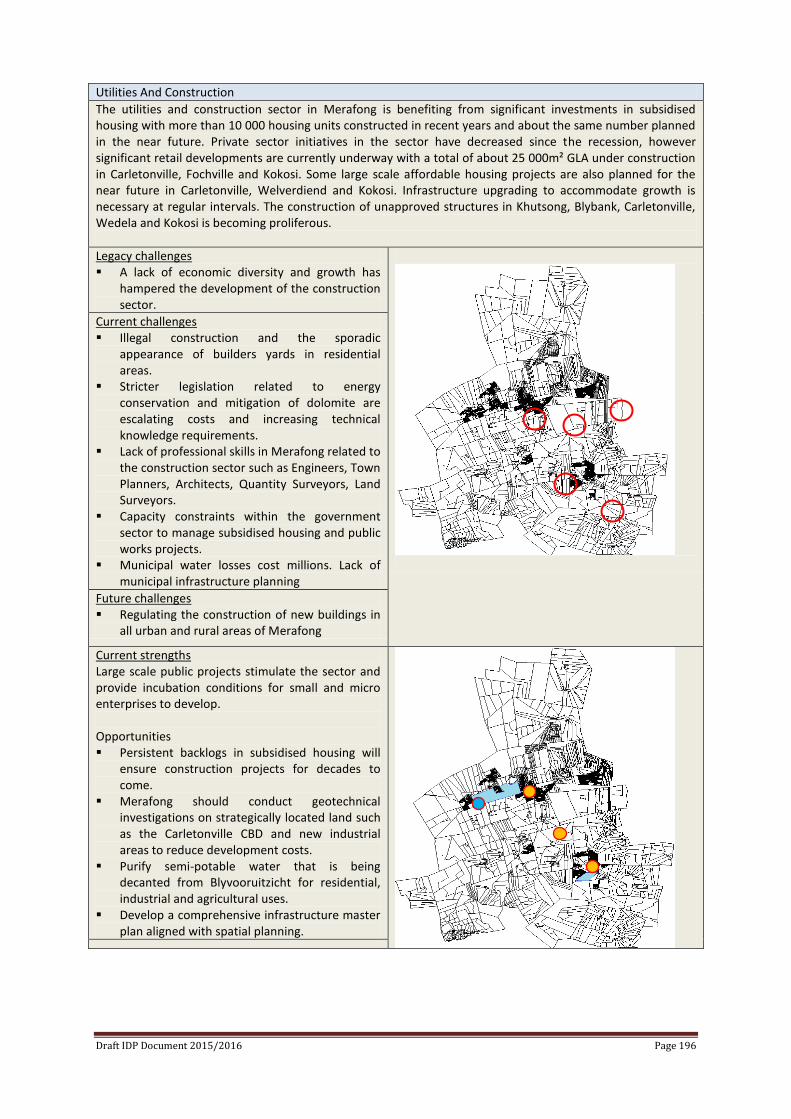
Draft IDP Document 2015/2016 Page 196
Utilities And Construction
The utilities and construction sector in Merafong is benefiting from significant investments in subsidised housing with more than 10 000 housing units constructed in recent years and about the same number planned in the near future. Private sector initiatives in the sector have decreased since the recession, however significant retail developments are currently underway with a total of about 25 000m² GLA under construction in Carletonville, Fochville and Kokosi. Some large scale affordable housing projects are also planned for the near future in Carletonville, Welverdiend and Kokosi. Infrastructure upgrading to accommodate growth is necessary at regular intervals. The construction of unapproved structures in Khutsong, Blybank, Carletonville, Wedela and Kokosi is becoming proliferous.
Legacy challenges A lack of economic diversity and growth has
hampered the development of the construction sector.
Current challenges Illegal construction and the sporadic
appearance of builders yards in residential areas.
Stricter legislation related to energy conservation and mitigation of dolomite are escalating costs and increasing technical knowledge requirements.
Lack of professional skills in Merafong related to the construction sector such as Engineers, Town Planners, Architects, Quantity Surveyors, Land Surveyors.
Capacity constraints within the government sector to manage subsidised housing and public works projects.
Municipal water losses cost millions. Lack of municipal infrastructure planning
Future challenges Regulating the construction of new buildings in
all urban and rural areas of Merafong
Current strengths Large scale public projects stimulate the sector and provide incubation conditions for small and micro enterprises to develop. Opportunities Persistent backlogs in subsidised housing will
ensure construction projects for decades to come.
Merafong should conduct geotechnical investigations on strategically located land such as the Carletonville CBD and new industrial areas to reduce development costs.
Purify semi-potable water that is being decanted from Blyvooruitzicht for residential, industrial and agricultural uses.
Develop a comprehensive infrastructure master plan aligned with spatial planning.
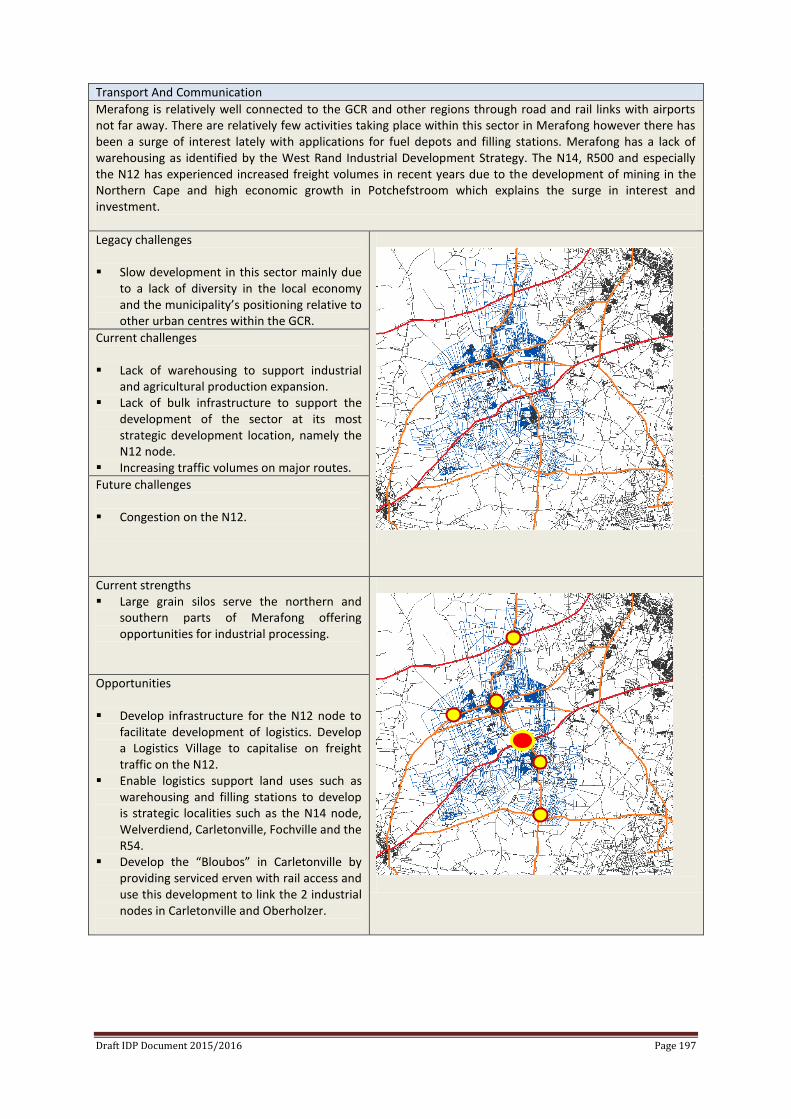
Draft IDP Document 2015/2016 Page 197
Transport And Communication
Merafong is relatively well connected to the GCR and other regions through road and rail links with airports not far away. There are relatively few activities taking place within this sector in Merafong however there has been a surge of interest lately with applications for fuel depots and filling stations. Merafong has a lack of warehousing as identified by the West Rand Industrial Development Strategy. The N14, R500 and especially the N12 has experienced increased freight volumes in recent years due to the development of mining in the Northern Cape and high economic growth in Potchefstroom which explains the surge in interest and investment.
Legacy challenges Slow development in this sector mainly due
to a lack of diversity in the local economy and the municipality’s positioning relative to other urban centres within the GCR.
Current challenges Lack of warehousing to support industrial
and agricultural production expansion. Lack of bulk infrastructure to support the
development of the sector at its most strategic development location, namely the N12 node.
Increasing traffic volumes on major routes.
Future challenges Congestion on the N12.
Current strengths Large grain silos serve the northern and
southern parts of Merafong offering opportunities for industrial processing.
Opportunities Develop infrastructure for the N12 node to
facilitate development of logistics. Develop a Logistics Village to capitalise on freight traffic on the N12.
Enable logistics support land uses such as warehousing and filling stations to develop is strategic localities such as the N14 node, Welverdiend, Carletonville, Fochville and the R54.
Develop the “Bloubos” in Carletonville by providing serviced erven with rail access and use this development to link the 2 industrial nodes in Carletonville and Oberholzer.
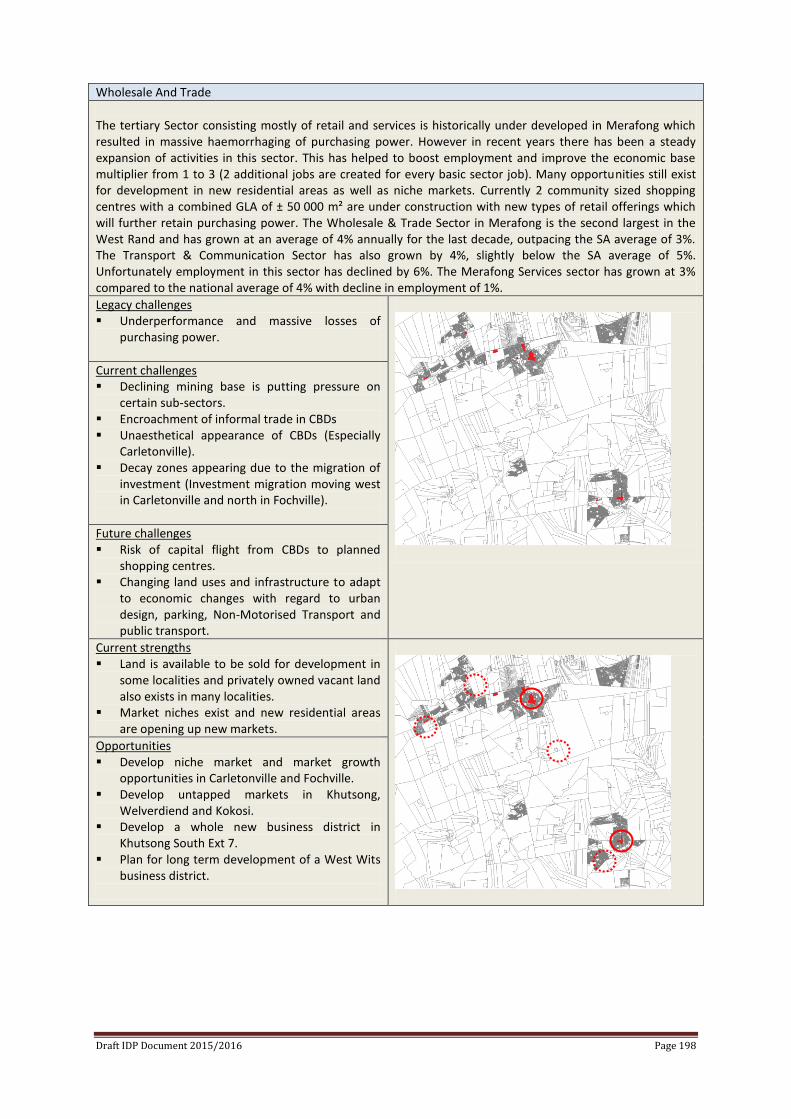
Draft IDP Document 2015/2016 Page 198
Wholesale And Trade
The tertiary Sector consisting mostly of retail and services is historically under developed in Merafong which resulted in massive haemorrhaging of purchasing power. However in recent years there has been a steady expansion of activities in this sector. This has helped to boost employment and improve the economic base multiplier from 1 to 3 (2 additional jobs are created for every basic sector job). Many opportunities still exist for development in new residential areas as well as niche markets. Currently 2 community sized shopping centres with a combined GLA of ± 50 000 m² are under construction with new types of retail offerings which will further retain purchasing power. The Wholesale & Trade Sector in Merafong is the second largest in the West Rand and has grown at an average of 4% annually for the last decade, outpacing the SA average of 3%. The Transport & Communication Sector has also grown by 4%, slightly below the SA average of 5%. Unfortunately employment in this sector has declined by 6%. The Merafong Services sector has grown at 3% compared to the national average of 4% with decline in employment of 1%.
Legacy challenges Underperformance and massive losses of
purchasing power.
Current challenges Declining mining base is putting pressure on
certain sub-sectors. Encroachment of informal trade in CBDs Unaesthetical appearance of CBDs (Especially
Carletonville). Decay zones appearing due to the migration of
investment (Investment migration moving west in Carletonville and north in Fochville).
Future challenges Risk of capital flight from CBDs to planned
shopping centres. Changing land uses and infrastructure to adapt
to economic changes with regard to urban design, parking, Non-Motorised Transport and public transport.
Current strengths Land is available to be sold for development in
some localities and privately owned vacant land also exists in many localities.
Market niches exist and new residential areas are opening up new markets.
Opportunities Develop niche market and market growth
opportunities in Carletonville and Fochville. Develop untapped markets in Khutsong,
Welverdiend and Kokosi. Develop a whole new business district in
Khutsong South Ext 7. Plan for long term development of a West Wits
business district.
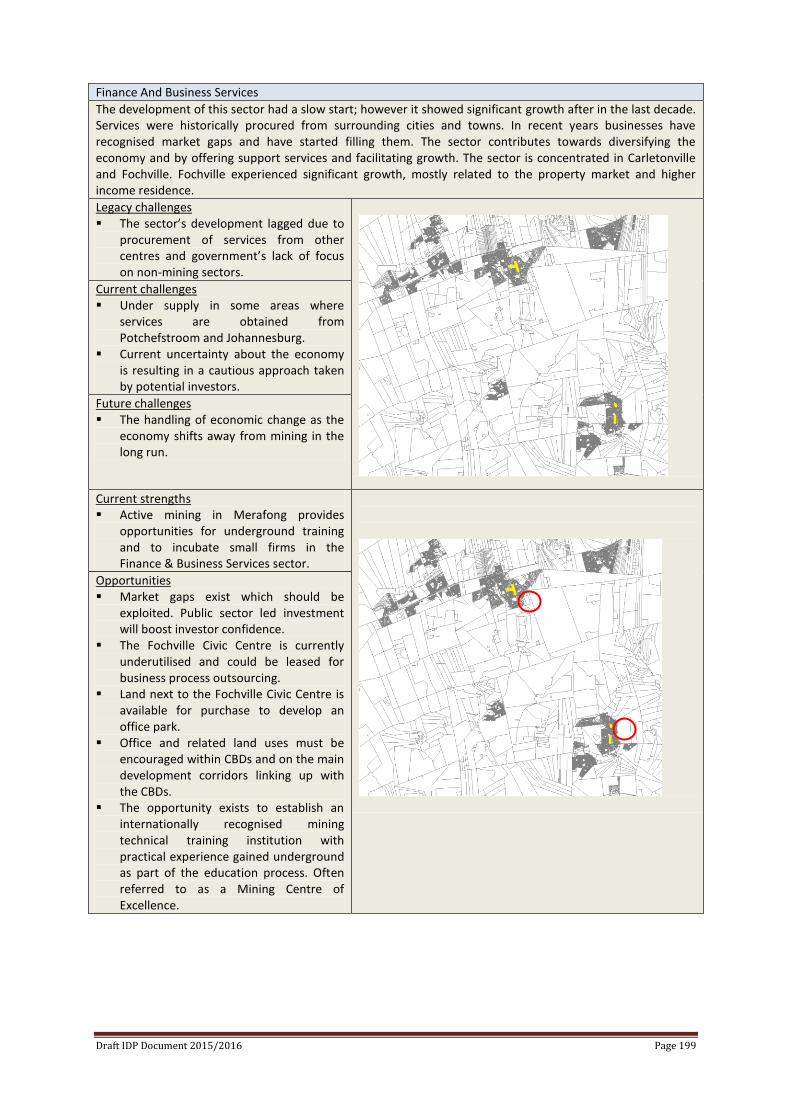
Draft IDP Document 2015/2016 Page 199
Finance And Business Services
The development of this sector had a slow start; however it showed significant growth after in the last decade. Services were historically procured from surrounding cities and towns. In recent years businesses have recognised market gaps and have started filling them. The sector contributes towards diversifying the economy and by offering support services and facilitating growth. The sector is concentrated in Carletonville and Fochville. Fochville experienced significant growth, mostly related to the property market and higher income residence.
Legacy challenges The sector’s development lagged due to
procurement of services from other centres and government’s lack of focus on non-mining sectors.
Current challenges Under supply in some areas where
services are obtained from Potchefstroom and Johannesburg.
Current uncertainty about the economy is resulting in a cautious approach taken by potential investors.
Future challenges The handling of economic change as the
economy shifts away from mining in the long run.
Current strengths Active mining in Merafong provides
opportunities for underground training and to incubate small firms in the Finance & Business Services sector.
Opportunities Market gaps exist which should be
exploited. Public sector led investment will boost investor confidence.
The Fochville Civic Centre is currently underutilised and could be leased for business process outsourcing.
Land next to the Fochville Civic Centre is available for purchase to develop an office park.
Office and related land uses must be encouraged within CBDs and on the main development corridors linking up with the CBDs.
The opportunity exists to establish an internationally recognised mining technical training institution with practical experience gained underground as part of the education process. Often referred to as a Mining Centre of Excellence.
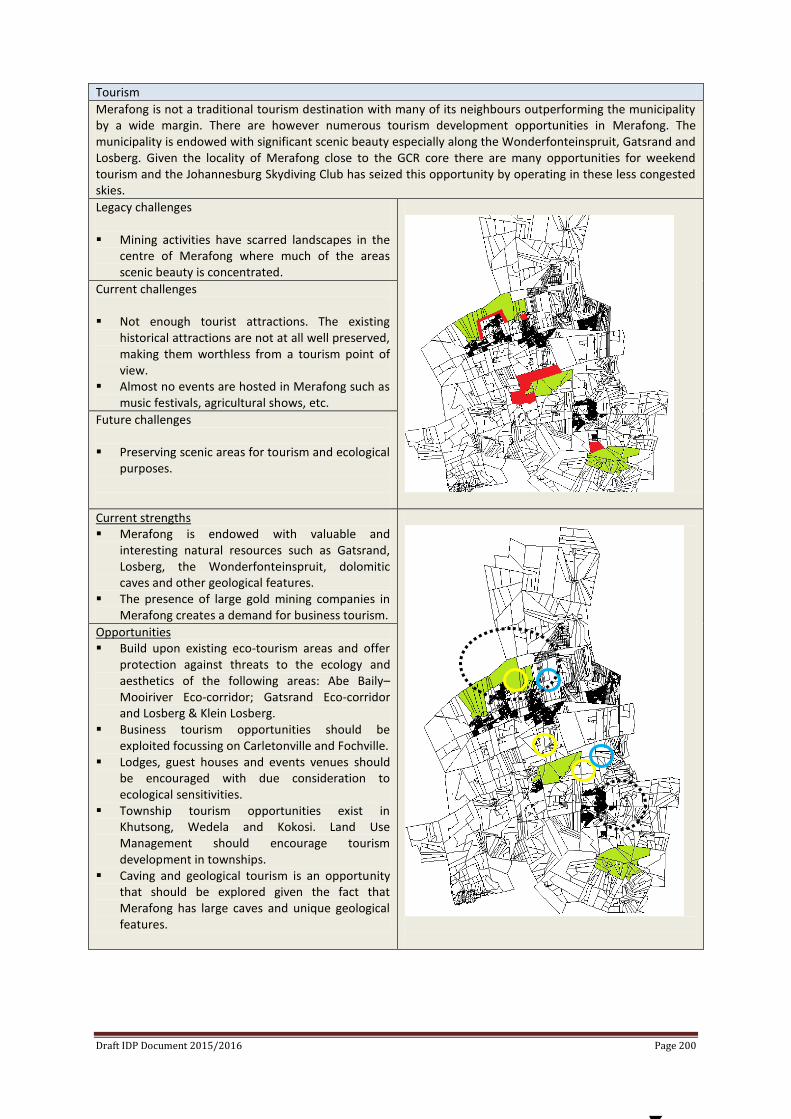
Draft IDP Document 2015/2016 Page 200
Tourism
Merafong is not a traditional tourism destination with many of its neighbours outperforming the municipality by a wide margin. There are however numerous tourism development opportunities in Merafong. The municipality is endowed with significant scenic beauty especially along the Wonderfonteinspruit, Gatsrand and Losberg. Given the locality of Merafong close to the GCR core there are many opportunities for weekend tourism and the Johannesburg Skydiving Club has seized this opportunity by operating in these less congested skies.
Legacy challenges Mining activities have scarred landscapes in the
centre of Merafong where much of the areas scenic beauty is concentrated.
Current challenges Not enough tourist attractions. The existing
historical attractions are not at all well preserved, making them worthless from a tourism point of view.
Almost no events are hosted in Merafong such as music festivals, agricultural shows, etc.
Future challenges Preserving scenic areas for tourism and ecological
purposes.
Current strengths Merafong is endowed with valuable and
interesting natural resources such as Gatsrand, Losberg, the Wonderfonteinspruit, dolomitic caves and other geological features.
The presence of large gold mining companies in Merafong creates a demand for business tourism.
Opportunities Build upon existing eco-tourism areas and offer
protection against threats to the ecology and aesthetics of the following areas: Abe Baily–Mooiriver Eco-corridor; Gatsrand Eco-corridor and Losberg & Klein Losberg.
Business tourism opportunities should be exploited focussing on Carletonville and Fochville.
Lodges, guest houses and events venues should be encouraged with due consideration to ecological sensitivities.
Township tourism opportunities exist in Khutsong, Wedela and Kokosi. Land Use Management should encourage tourism development in townships.
Caving and geological tourism is an opportunity that should be explored given the fact that Merafong has large caves and unique geological features.
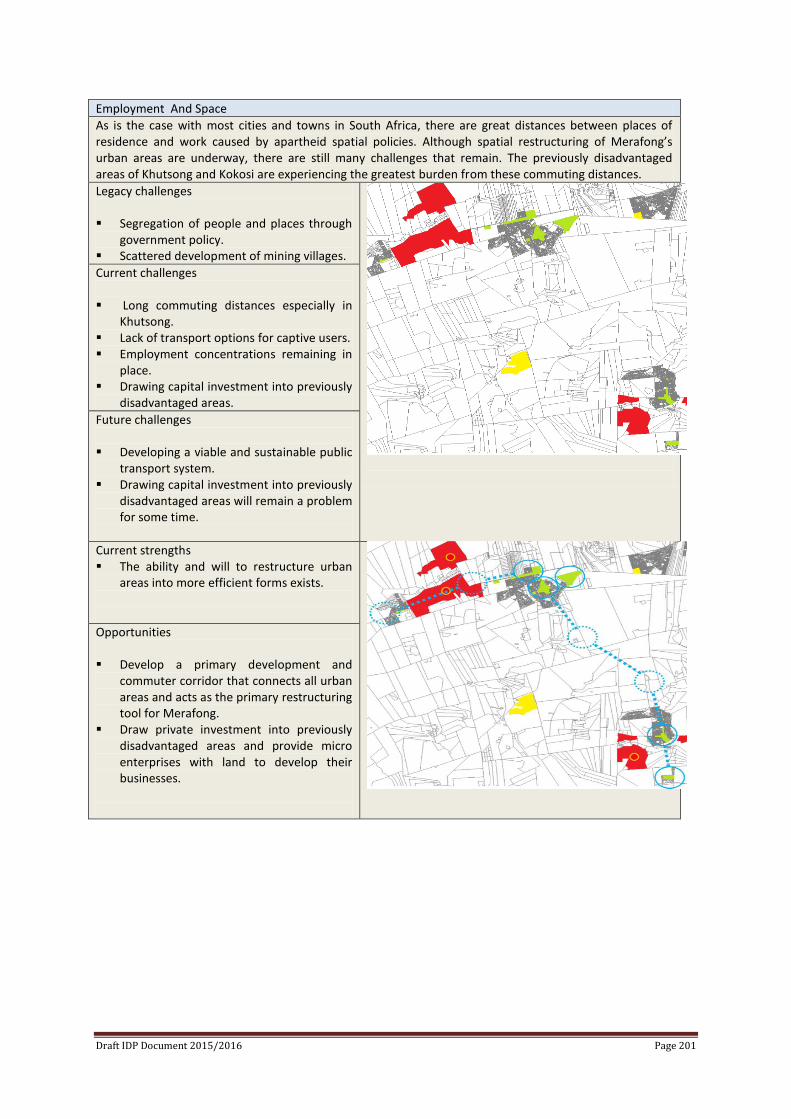
Draft IDP Document 2015/2016 Page 201
Employment And Space
As is the case with most cities and towns in South Africa, there are great distances between places of residence and work caused by apartheid spatial policies. Although spatial restructuring of Merafong’s urban areas are underway, there are still many challenges that remain. The previously disadvantaged areas of Khutsong and Kokosi are experiencing the greatest burden from these commuting distances.
Legacy challenges Segregation of people and places through
government policy. Scattered development of mining villages.
Current challenges Long commuting distances especially in
Khutsong. Lack of transport options for captive users. Employment concentrations remaining in
place. Drawing capital investment into previously
disadvantaged areas.
Future challenges Developing a viable and sustainable public
transport system. Drawing capital investment into previously
disadvantaged areas will remain a problem for some time.
Current strengths The ability and will to restructure urban
areas into more efficient forms exists.
Opportunities Develop a primary development and
commuter corridor that connects all urban areas and acts as the primary restructuring tool for Merafong.
Draw private investment into previously disadvantaged areas and provide micro enterprises with land to develop their businesses.
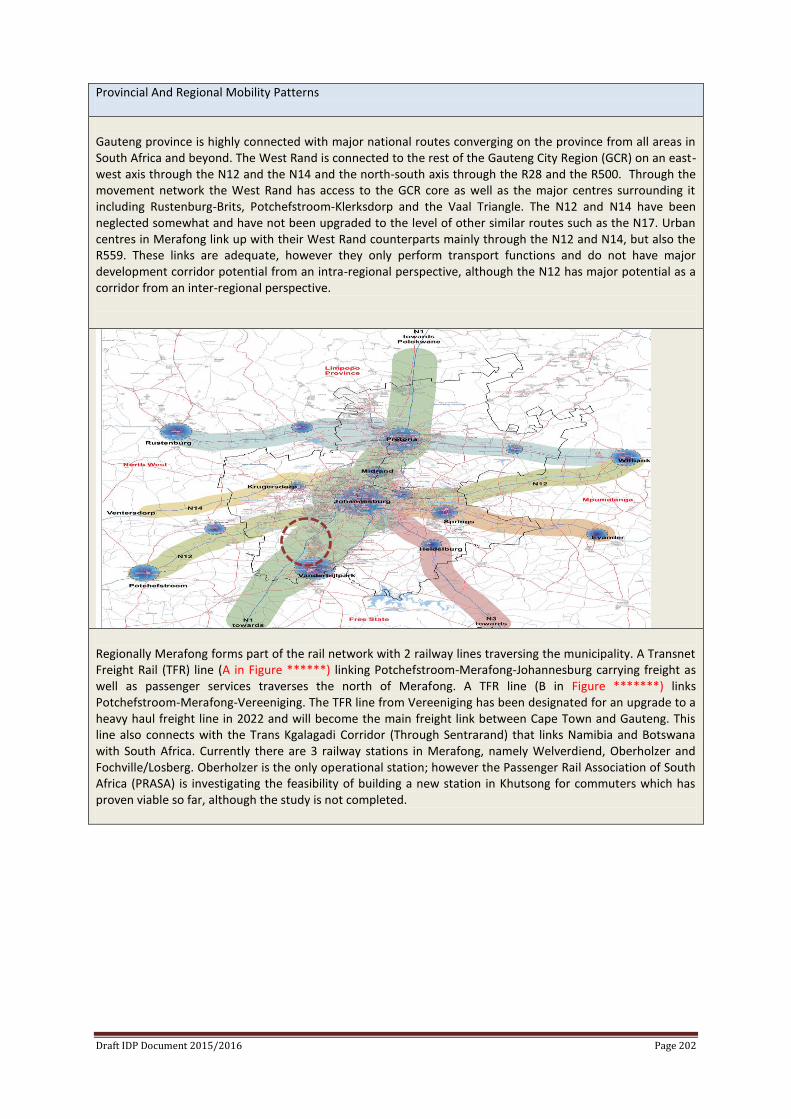
Draft IDP Document 2015/2016 Page 202
Provincial And Regional Mobility Patterns
Gauteng province is highly connected with major national routes converging on the province from all areas in South Africa and beyond. The West Rand is connected to the rest of the Gauteng City Region (GCR) on an east-west axis through the N12 and the N14 and the north-south axis through the R28 and the R500. Through the movement network the West Rand has access to the GCR core as well as the major centres surrounding it including Rustenburg-Brits, Potchefstroom-Klerksdorp and the Vaal Triangle. The N12 and N14 have been neglected somewhat and have not been upgraded to the level of other similar routes such as the N17. Urban centres in Merafong link up with their West Rand counterparts mainly through the N12 and N14, but also the R559. These links are adequate, however they only perform transport functions and do not have major development corridor potential from an intra-regional perspective, although the N12 has major potential as a corridor from an inter-regional perspective.
Regionally Merafong forms part of the rail network with 2 railway lines traversing the municipality. A Transnet Freight Rail (TFR) line (A in Figure ******) linking Potchefstroom-Merafong-Johannesburg carrying freight as well as passenger services traverses the north of Merafong. A TFR line (B in Figure *******) links Potchefstroom-Merafong-Vereeniging. The TFR line from Vereeniging has been designated for an upgrade to a heavy haul freight line in 2022 and will become the main freight link between Cape Town and Gauteng. This line also connects with the Trans Kgalagadi Corridor (Through Sentrarand) that links Namibia and Botswana with South Africa. Currently there are 3 railway stations in Merafong, namely Welverdiend, Oberholzer and Fochville/Losberg. Oberholzer is the only operational station; however the Passenger Rail Association of South Africa (PRASA) is investigating the feasibility of building a new station in Khutsong for commuters which has proven viable so far, although the study is not completed.
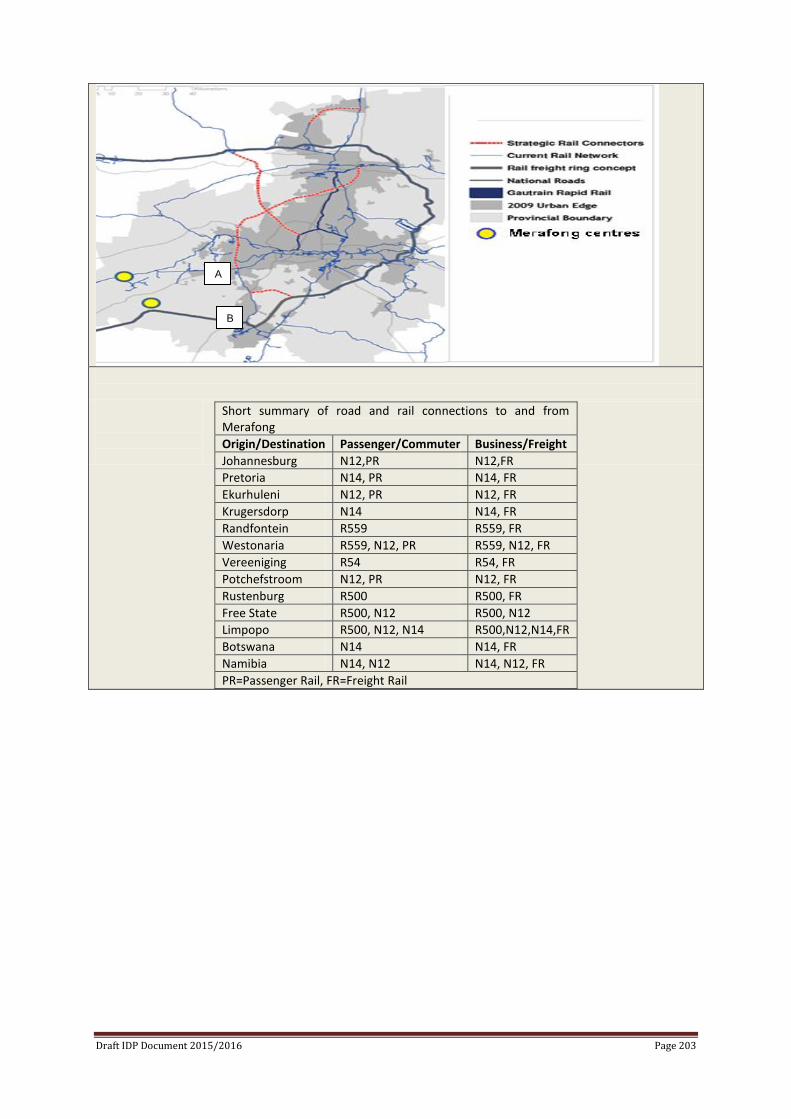
Draft IDP Document 2015/2016 Page 203
Short summary of road and rail connections to and from Merafong
Origin/Destination Passenger/Commuter Business/Freight
Johannesburg N12,PR N12,FR
Pretoria N14, PR N14, FR
Ekurhuleni N12, PR N12, FR
Krugersdorp N14 N14, FR
Randfontein R559 R559, FR
Westonaria R559, N12, PR R559, N12, FR
Vereeniging R54 R54, FR
Potchefstroom N12, PR N12, FR
Rustenburg R500 R500, FR
Free State R500, N12 R500, N12
Limpopo R500, N12, N14 R500,N12,N14,FR
Botswana N14 N14, FR
Namibia N14, N12 N14, N12, FR
PR=Passenger Rail, FR=Freight Rail
A
B
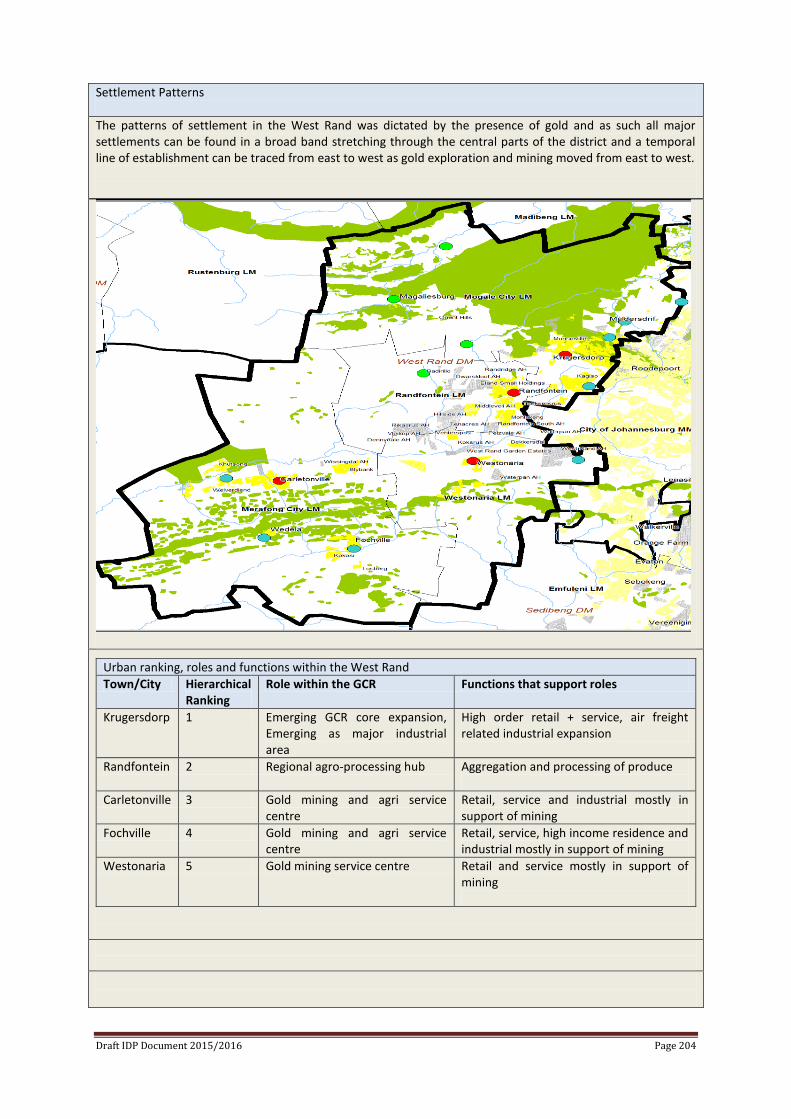
Draft IDP Document 2015/2016 Page 204
Settlement Patterns
The patterns of settlement in the West Rand was dictated by the presence of gold and as such all major settlements can be found in a broad band stretching through the central parts of the district and a temporal line of establishment can be traced from east to west as gold exploration and mining moved from east to west.
Urban ranking, roles and functions within the West Rand
Town/City Hierarchical Ranking
Role within the GCR Functions that support roles
Krugersdorp 1 Emerging GCR core expansion, Emerging as major industrial area
High order retail + service, air freight related industrial expansion
Randfontein 2 Regional agro-processing hub Aggregation and processing of produce
Carletonville 3 Gold mining and agri service centre
Retail, service and industrial mostly in support of mining
Fochville 4 Gold mining and agri service centre
Retail, service, high income residence and industrial mostly in support of mining
Westonaria 5 Gold mining service centre Retail and service mostly in support of mining
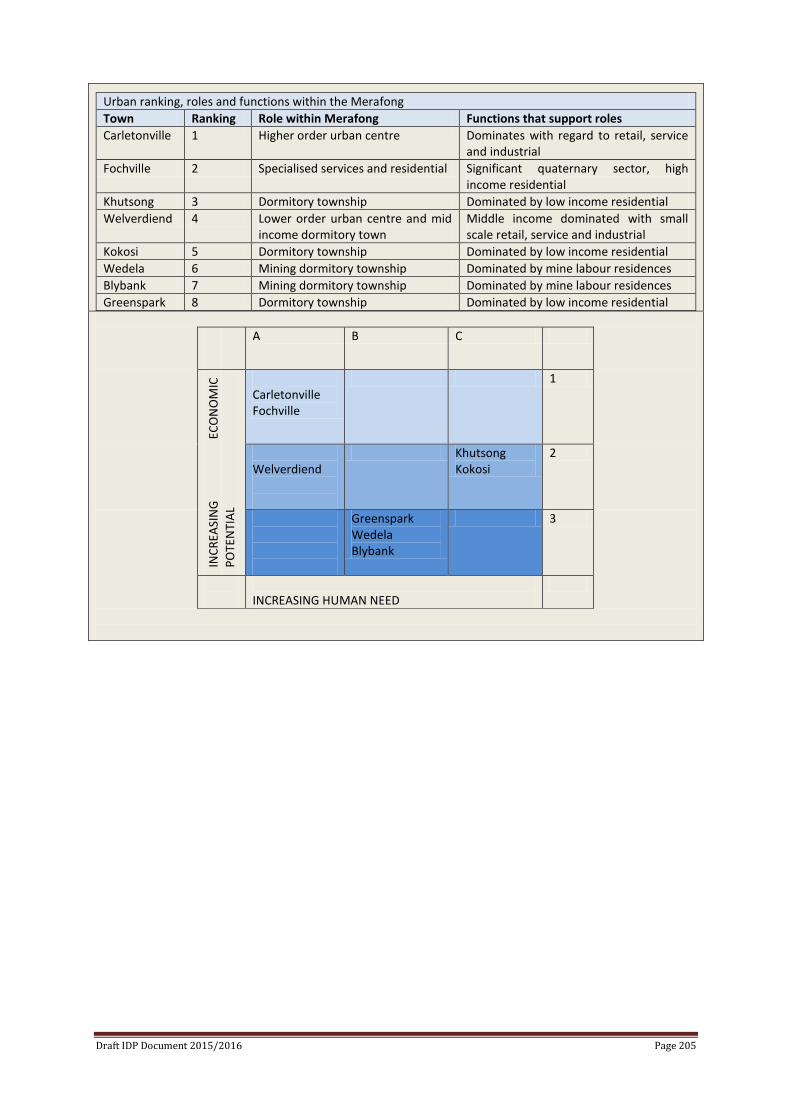
Draft IDP Document 2015/2016 Page 205
Urban ranking, roles and functions within the Merafong
Town Ranking Role within Merafong Functions that support roles
Carletonville 1 Higher order urban centre Dominates with regard to retail, service and industrial
Fochville 2 Specialised services and residential Significant quaternary sector, high income residential
Khutsong 3 Dormitory township Dominated by low income residential
Welverdiend 4 Lower order urban centre and mid income dormitory town
Middle income dominated with small scale retail, service and industrial
Kokosi 5 Dormitory township Dominated by low income residential
Wedela 6 Mining dormitory township Dominated by mine labour residences
Blybank 7 Mining dormitory township Dominated by mine labour residences
Greenspark 8 Dormitory township Dominated by low income residential
A B C
INC
REA
SIN
G
ECO
NO
MIC
PO
TEN
TIA
L
Carletonville Fochville
1
Welverdiend
Khutsong Kokosi
2
Greenspark Wedela Blybank
3
INCREASING HUMAN NEED
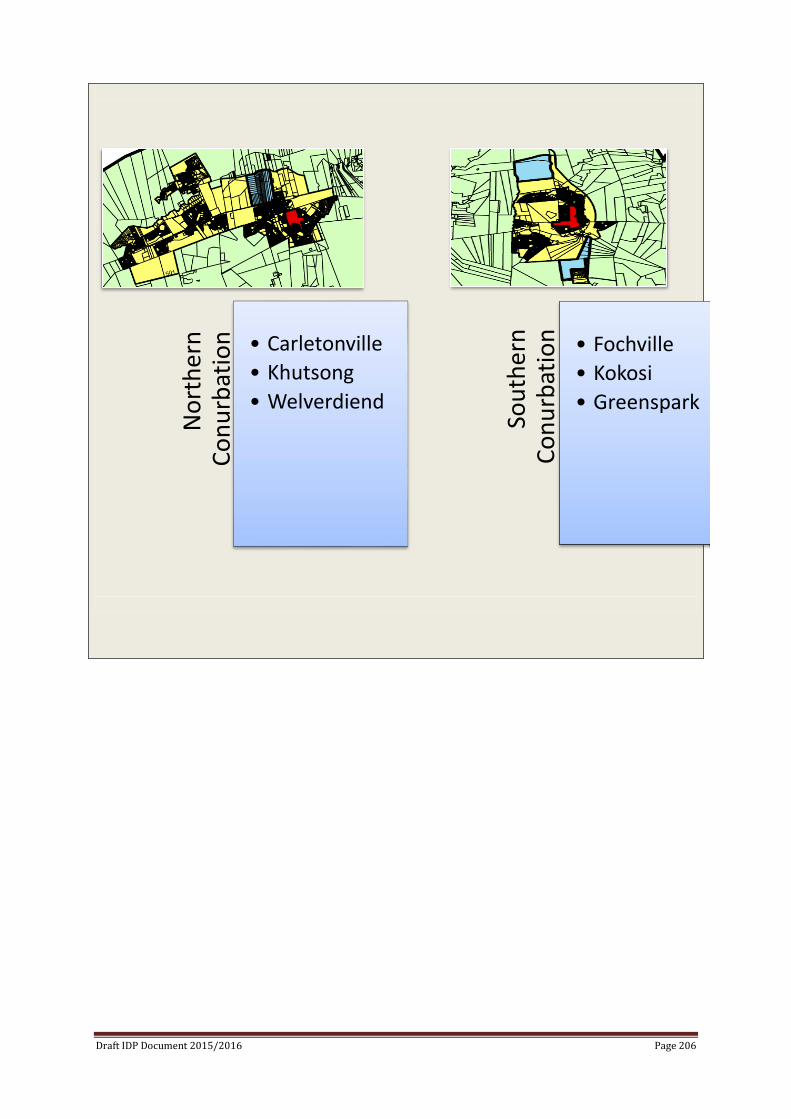
Draft IDP Document 2015/2016 Page 206
No
rth
ern
C
on
urb
atio
n
• Carletonville
• Khutsong
• Welverdiend
Sou
ther
n
Co
nu
rbat
ion
• Fochville
• Kokosi
• Greenspark
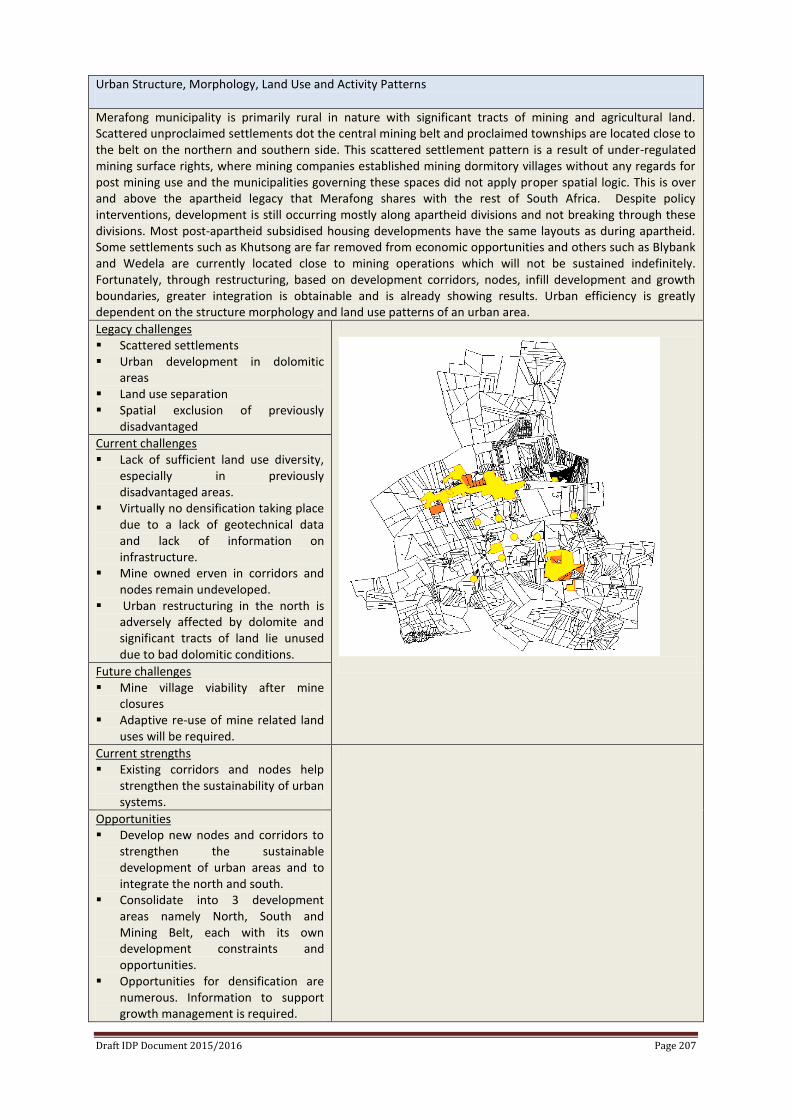
Draft IDP Document 2015/2016 Page 207
Urban Structure, Morphology, Land Use and Activity Patterns
Merafong municipality is primarily rural in nature with significant tracts of mining and agricultural land. Scattered unproclaimed settlements dot the central mining belt and proclaimed townships are located close to the belt on the northern and southern side. This scattered settlement pattern is a result of under-regulated mining surface rights, where mining companies established mining dormitory villages without any regards for post mining use and the municipalities governing these spaces did not apply proper spatial logic. This is over and above the apartheid legacy that Merafong shares with the rest of South Africa. Despite policy interventions, development is still occurring mostly along apartheid divisions and not breaking through these divisions. Most post-apartheid subsidised housing developments have the same layouts as during apartheid. Some settlements such as Khutsong are far removed from economic opportunities and others such as Blybank and Wedela are currently located close to mining operations which will not be sustained indefinitely. Fortunately, through restructuring, based on development corridors, nodes, infill development and growth boundaries, greater integration is obtainable and is already showing results. Urban efficiency is greatly dependent on the structure morphology and land use patterns of an urban area.
Legacy challenges Scattered settlements Urban development in dolomitic
areas Land use separation Spatial exclusion of previously
disadvantaged
Current challenges Lack of sufficient land use diversity,
especially in previously disadvantaged areas.
Virtually no densification taking place due to a lack of geotechnical data and lack of information on infrastructure.
Mine owned erven in corridors and nodes remain undeveloped.
Urban restructuring in the north is adversely affected by dolomite and significant tracts of land lie unused due to bad dolomitic conditions.
Future challenges Mine village viability after mine
closures Adaptive re-use of mine related land
uses will be required.
Current strengths Existing corridors and nodes help
strengthen the sustainability of urban systems.
Opportunities Develop new nodes and corridors to
strengthen the sustainable development of urban areas and to integrate the north and south.
Consolidate into 3 development areas namely North, South and Mining Belt, each with its own development constraints and opportunities.
Opportunities for densification are numerous. Information to support growth management is required.
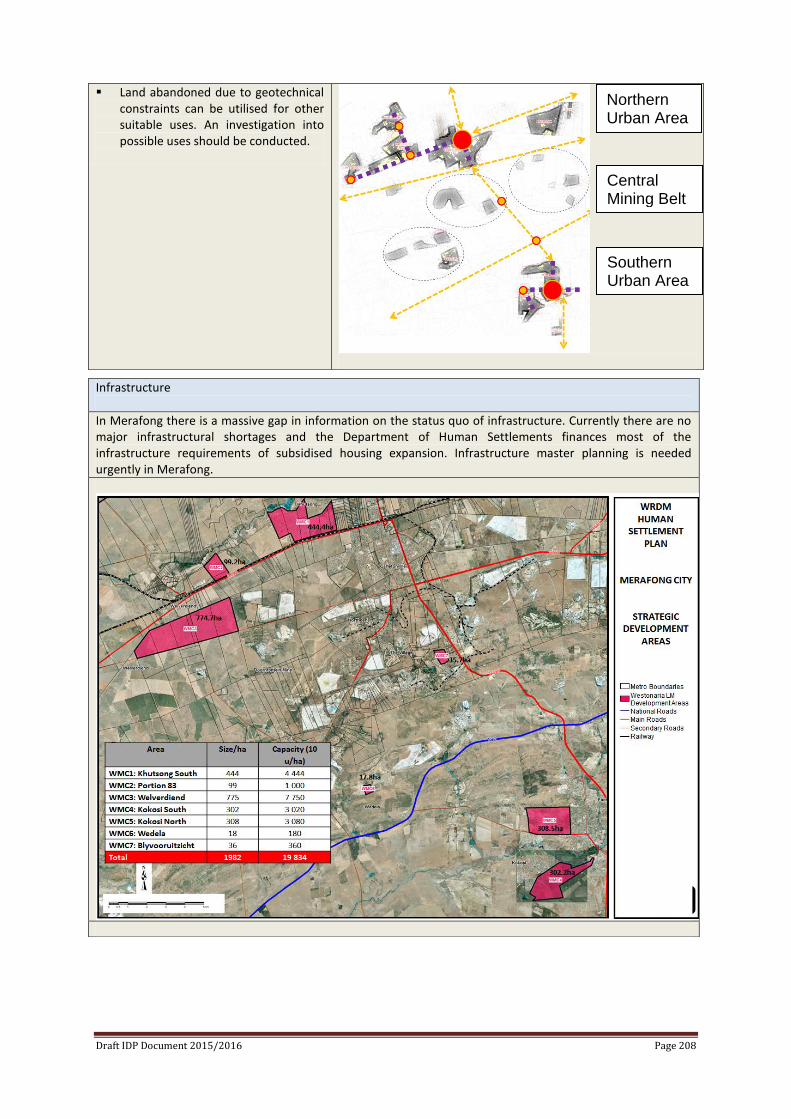
Draft IDP Document 2015/2016 Page 208
Land abandoned due to geotechnical constraints can be utilised for other suitable uses. An investigation into possible uses should be conducted.
Infrastructure
In Merafong there is a massive gap in information on the status quo of infrastructure. Currently there are no major infrastructural shortages and the Department of Human Settlements finances most of the infrastructure requirements of subsidised housing expansion. Infrastructure master planning is needed urgently in Merafong.
Northern Urban Area
Central Mining Belt
Southern Urban Area
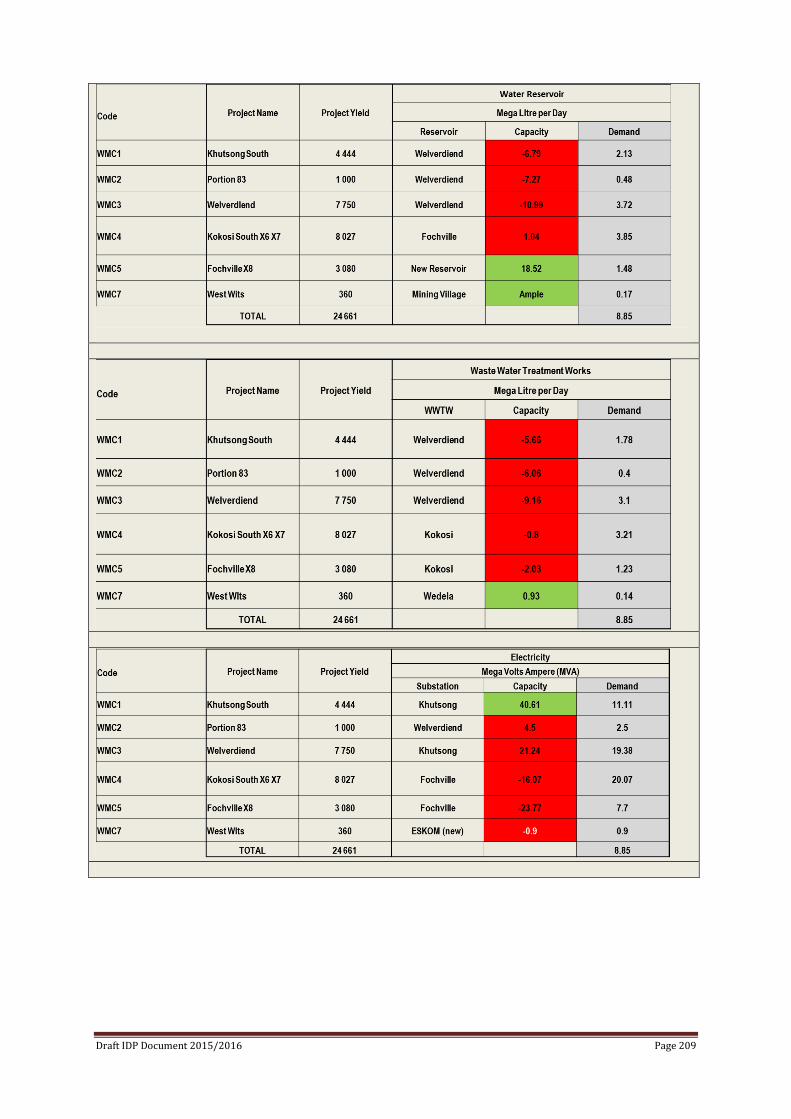
Draft IDP Document 2015/2016 Page 209
Draft IDP Document 2015/2016 Page 210
Legacy challenges Scattered settlements with uncoordinated infrastructure Urban development in dolomitic areas which impact on water and sanitation services. Under provision of services in previously disadvantaged areas Current challenges Lack of information on the status quo of existing infrastructure. Lack of planning and coordination in future
planning. Inefficient urban structure and low densities reduce economies of scale. Regulation standards with regard to infrastructure on dolomitic land are becoming stricter. Future challenges Mine village viability after mine closures Adaptive re-use of mine related land uses will be required. Current strengths Existing corridors and nodes help strengthen the sustainability of urban systems. Opportunities Develop new nodes and corridors to strengthen the sustainable development of urban areas and to integrate
the north and south. Consolidate into 3 development areas namely North, South and Mining Belt, each with its own development
conditions. Opportunities for densification are numerous. Information to support growth management is required. Land abandoned due to geotechnical constraints can be utilised for other suitable uses.
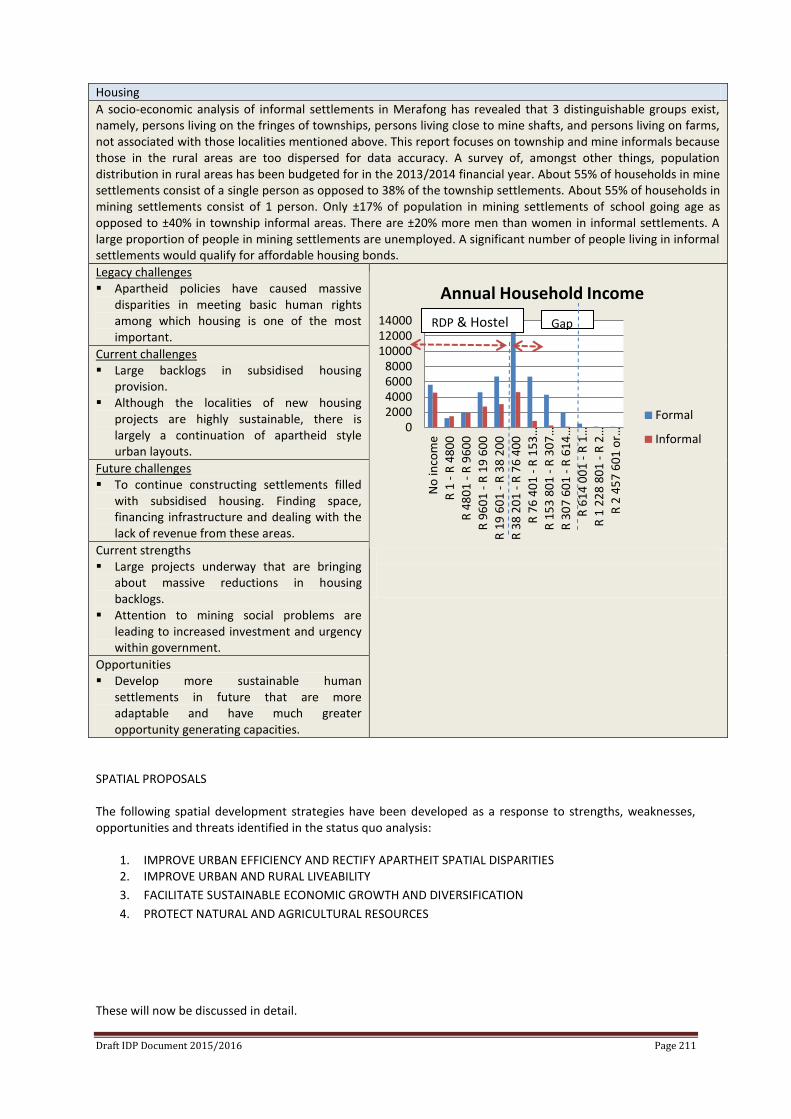
Draft IDP Document 2015/2016 Page 211
Housing
A socio-economic analysis of informal settlements in Merafong has revealed that 3 distinguishable groups exist, namely, persons living on the fringes of townships, persons living close to mine shafts, and persons living on farms, not associated with those localities mentioned above. This report focuses on township and mine informals because those in the rural areas are too dispersed for data accuracy. A survey of, amongst other things, population distribution in rural areas has been budgeted for in the 2013/2014 financial year. About 55% of households in mine settlements consist of a single person as opposed to 38% of the township settlements. About 55% of households in mining settlements consist of 1 person. Only ±17% of population in mining settlements of school going age as opposed to ±40% in township informal areas. There are ±20% more men than women in informal settlements. A large proportion of people in mining settlements are unemployed. A significant number of people living in informal settlements would qualify for affordable housing bonds.
Legacy challenges Apartheid policies have caused massive
disparities in meeting basic human rights among which housing is one of the most important.
Current challenges Large backlogs in subsidised housing
provision. Although the localities of new housing
projects are highly sustainable, there is largely a continuation of apartheid style urban layouts.
Future challenges To continue constructing settlements filled
with subsidised housing. Finding space, financing infrastructure and dealing with the lack of revenue from these areas.
Current strengths Large projects underway that are bringing
about massive reductions in housing backlogs.
Attention to mining social problems are leading to increased investment and urgency within government.
Opportunities Develop more sustainable human
settlements in future that are more adaptable and have much greater opportunity generating capacities.
SPATIAL PROPOSALS The following spatial development strategies have been developed as a response to strengths, weaknesses, opportunities and threats identified in the status quo analysis:
1. IMPROVE URBAN EFFICIENCY AND RECTIFY APARTHEIT SPATIAL DISPARITIES 2. IMPROVE URBAN AND RURAL LIVEABILITY
3. FACILITATE SUSTAINABLE ECONOMIC GROWTH AND DIVERSIFICATION
4. PROTECT NATURAL AND AGRICULTURAL RESOURCES
These will now be discussed in detail.
02000400060008000
100001200014000
No
inco
me
R 1
- R
48
00
R 4
80
1 -
R 9
60
0
R 9
60
1 -
R 1
9 6
00
R 1
9 6
01
- R
38
20
0
R 3
8 2
01
- R
76
40
0
R 7
6 4
01
- R
15
3…
R 1
53
80
1 -
R 3
07
…
R 3
07
60
1 -
R 6
14
…
R 6
14
00
1 -
R 1
…
R 1
22
8 8
01
- R
2…
R 2
45
7 6
01
or…
Annual Household Income
Formal
Informal
Gap RDP & Hostel
Draft IDP Document 2015/2016 Page 212
1. IMPROVE URBAN EFFICIENCY AND RECTIFY APARTHEIT SPATIAL DISPARITIES
PO
LIC
Y
Integrate segregated urban areas and restructure the urban form to meet current and future challenges with greater efficiency.
OU
TCO
MES
/
DES
IRED
STA
TE
An efficient system of towns functioning as an integrated network. Reduced costs of infrastructure provision. An urban system that offers convenience and choice to its inhabitants and users. An urban system that provides universal access to all users. An urban system that encourages business development by providing in the needs of all kinds of
enterprises.
IMP
LEM
ENTA
TIO
N S
TRA
TEG
IES
Re-align the urban structure of Merafong settlements into 3 distinct urban areas namely the northern, central and southern urban areas. Connect all 3 urban areas through a primary development corridor that will restructure settlements into the desired state.
Develop infrastructure in accordance with the restructuring strategies. Establish a hierarchy of nodes and corridors to facilitate restructuring. Implement 3 growth management boundaries in order to manage growth in a sustainable
manner: A land use intensification boundary, within which appropriate mixed land uses and
densification are encouraged. An urban development boundary, which contains urban development and indicates
where future urban expansion may take place. An Urban–Rural Interface boundary, within which appropriate mixed land uses are
allowed. Determine settlement viability of mine settlements and develop accordingly Integrated transport and mobility should form part of decision making processes.
PO
LIC
Y
ALI
GN
MEN
T
From the national and provincial primary policy synthesis: Grouping 2 and 5
1. Re-align the urban structure
The status quo of urbanization in Merafong lends itself to a future desired state where the scattered
settlements of today have developed into three distinct urban areas namely the northern, central/mining belt
and southern urban areas. The northern area comprises of Welverdiend, Khutsong, Khutsong South and
Carletonville. It is the most populous and economically active area in Merafong. For the most part this urban
area will restructure with more ease than the other areas because of its population size which enables nodal
development along the corridor. The central area comprises of Blyvooruitzicht, West Wits, Driefontein,
Elandsrand, Wedela and Deelkraal. Most urban areas are unproclaimed mine villages and occur in a scattered
pattern. This area will create the most problems because of the scattered nature of the mostly small
settlements and also the state of mine operated infrastructure. The southern area will comprise of Fochville,
Kokosi, Greenspark and Losberg Industrial. Settlements in this urban area are grouped closer together which
reduces the cost of services; however the combined populations of these settlements are smaller, offering
fewer opportunities for nodal development.
It is of great importance that even though these 3 urban areas are separated by topographical barriers and
each has its own distinct constraints and strengths, they are integrated with each other as much as possible. In
order to achieve the desired growth characteristics a hierarchical network of nodes and corridors will be
utilised as the main structuring tool. The network will be dominated by the primary development corridor that
connects all 3 urban areas. It will also form the backbone of future public transport. As such all major
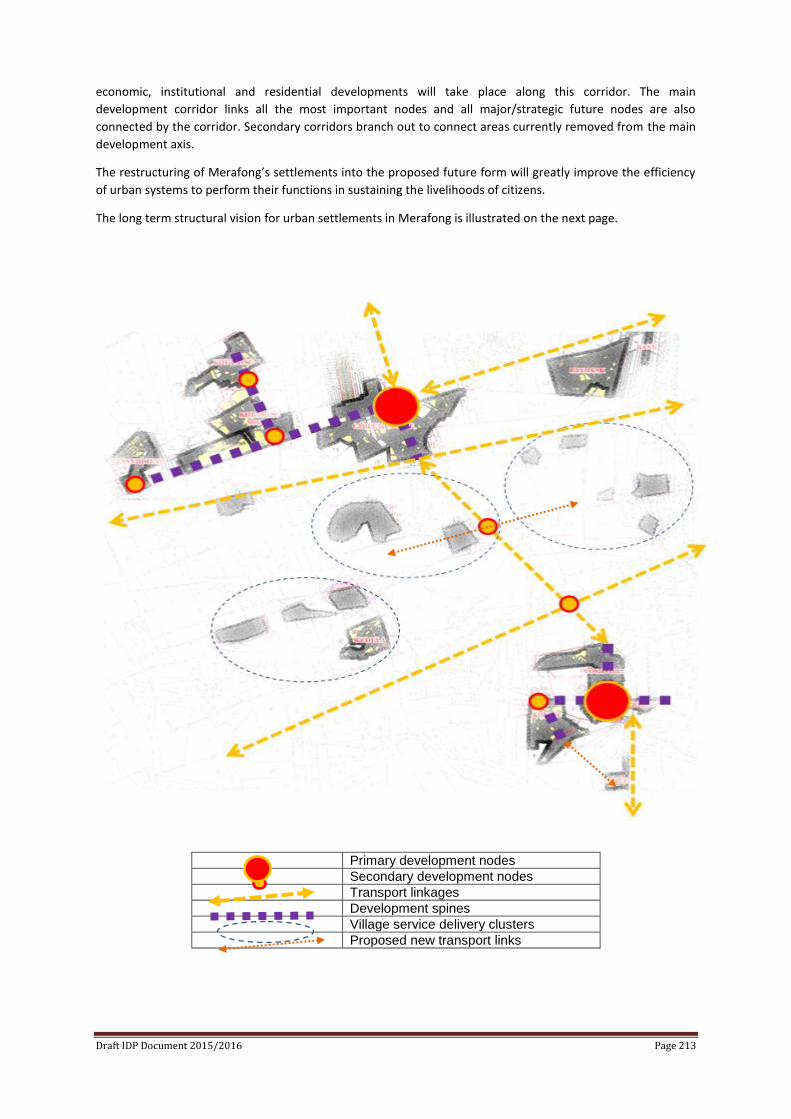
Draft IDP Document 2015/2016 Page 213
economic, institutional and residential developments will take place along this corridor. The main
development corridor links all the most important nodes and all major/strategic future nodes are also
connected by the corridor. Secondary corridors branch out to connect areas currently removed from the main
development axis.
The restructuring of Merafong’s settlements into the proposed future form will greatly improve the efficiency
of urban systems to perform their functions in sustaining the livelihoods of citizens.
The long term structural vision for urban settlements in Merafong is illustrated on the next page.
Primary development nodes
Secondary development nodes
Transport linkages
Development spines
Village service delivery clusters
Proposed new transport links
Draft IDP Document 2015/2016 Page 214
2. The hierarchy of nodes and corridors
Nodes These are areas where a higher intensity of land uses and activities will be supported and promoted. Nodal development improves efficiency as it provides easy access and creates thresholds for a variety of uses and public transport services. Typically any given municipal area would accommodate a hierarchy of nodes that indicates the relative intensity of development anticipated for the various nodes, the varying sizes of the nodes, and the dominant nature and activity of the nodes. Nodal types In terms of retail classifications by the South African Council of Shopping Centres (SACSC) centres (Nodes) can be divided into two types namely planned and incremental/unplanned. Planned centres include shopping centres and incremental include individual developments of erven that are not coordinated to complement adjacent or opposite erven developments, such as a CBD. For planning purposes the nodes in Merafong have been divided into 5 main types and each type can consist of different sized nodes. The 5 main types are:
Neighbourhood nodes
These nodes serve one or more neighbourhoods and are mostly focused on convenience and social services. They are predominantly located on Class 3 or 4 roads.
District nodes. These nodes serve sub regional/district areas, e.g. larger parts of a town. These nodes have developed more complicated morphologies and usually develop from an expanding neighbourhood node. They are predominantly located on Class 3 roads. All new developments should take parking requirements into account and design should favour pedestrian movement. Land use diversification and residential densification is encouraged within these nodes.
Regional nodes. Within Merafong the only regional nodes are the Central Business Districts (CBDs) of Carletonville and Fochville which have the highest level of complexity in the municipality with several different functions that serve the whole municipal area and in some instances even beyond. These are the most accessible nodes being linked by Class 2 roads and are the focus of economic activity. The following land uses are promoted:
Retail Services Service industries Entertainment High density residential Government offices should be established exclusively in CBDs
The provision of sufficient parking is very important. All redevelopments should provide on-site parking as prescribed in the relevant Town Planning Scheme. It is preferred that business activities be on the ground floor and residential and office uses on the floors above. Gap market housing projects should as far as possible be located in or near regional nodes and major transport interchanges.
Draft IDP Document 2015/2016 Page 215
Central Business Districts Merafong has 2 Central Business Districts (CBDs) namely Carletonville CBD and Fochville CBD. These nodes are the focus points of economic activities in Merafong with the highest order functions and also the greatest variety of functions including:
Retail of consumer goods, semi-durable and durable goods, A variety of services including personal and professional services, Government offices, and Entertainment.
The economic and land use morphology of the 2 CBDs is typical of towns where significant suburban shopping centre development has not yet taken off. A typical characteristic is national chain stores that are located within the CBD on street. The health of the 2 CBDs are currently under threat from 2 development trends:
1. Firstly, the proposals that have been tabled for suburban shopping centres like the Khutsong shopping centre on Erf 5706 Khutsong Extension 2 and the proposed Carletonville Extension 18. Although these centres are welcomed, especially the one in Khutsong, because they will bring much needed investment into previously disadvantaged areas and help to retain purchasing power they will inevitably cause decay in the CBD of Carletonville. Fortunately the proposed shopping centre development in Fochville will be an expansion of the existing President Hyper centre within the CBD.
2. Secondly, it seems as though a process of informal trade infiltration and succession is taking place from the taxi rank of Carletonville, spreading southwards. And to a lesser degree in Fochville. This is a process where informal traders infiltrate an area and cause formal businesses to move out and be replaced by formal businesses trading in lower end products and services (Typically shops owned by immigrants), directly in competition with the informal traders. If this happens on a large enough scale severe decay may start to set in because the healthy mix of retail and service gets disturbed. Such morphological disturbances leave gaps for further infiltration and can lead to increased levels of crime and physical decay, causing a reinforcing feedback loop of decay. This process could be sped up and partly be caused by the development of new suburban shopping centres.
Urban renewal initiatives are very important and planning should begin now before the problem becomes significant. The first step is the creation of an Urban Design Framework and an Infrastructure Master Plan. After these are in place, urban renewal projects will be easier to implement.
Speciality nodes. These nodes can have varying sizes and perform more specialised functions than other nodes and the following types are described for planning purposes:
Industrial nodes. These nodes accommodate all kinds of manufacturing and industrial services. Other land uses such as the sale of hazardous or unsightly goods such as liquid petroleum gas, transport depots and farming equipment as well as warehousing are also acceptable.
Light industry, transport and logistic nodes. These nodes focus on light industrial activities, industrial services such as car repairs, and the sale of hazardous or unsightly goods such as liquid petroleum gas, transport depots, warehousing and farming equipment. These are activities that are not noxious in nature (Except small scale activities like spray painting) and often tend to be less aesthetically pleasing. These activities mostly prefer good accessibility and good visibility.
Office nodes. These nodes are dominated by office uses that provide a variety of clerical, professional and personal services. Retail and other types of services are acceptable if complimentary and subservient to the primary use of the node, e.g. the sale of stationery or a cafeteria.
Health care nodes. The focus is on a health care institution such a public or private hospital or clinic surrounded by complimentary uses such as pharmacies, consulting rooms of medical practitioners, frail care/elderly housing, outpatient/recovery housing, medical laboratories, paramedic dispatch centres, etc.
Transport modal interchange nodes. In Merafong these nodes are predominantly associated with taxi ranks and commuter railway stations. Where different modes of transport interchange, opportunities
Draft IDP Document 2015/2016 Page 216
for increased business and residential densities are created. This is done in order to create transit oriented cities. Pedestrian accessibility and scale is important.
Social development nodes. Although social development should focus on public transport interchanges such as within modal interchange nodes, many localities are out of reach of such nodes. These nodes will usually encompass a cluster of facilities that are shared, e.g. library; pay point, social hall, informal trade area, park, crèche, sports fields, youth development centre, retail and services, post office, etc. Facility clustering is strongly recommended for the development of new facilities especially in previously disadvantaged areas.
Eco tourism nodes. There are good opportunities to develop tourism activities at these locations. These may include bird watching, game viewing, hiking, 4x4 trails, fishing, boating, canopy tours (In Northern Highveld Afro-temperate forest areas), camping, picnicking, rock climbing, etc. Accommodation establishments including conference and events venues are encouraged to locate in these areas. Residential eco estates can be considered where the environmental impact will be low. Residential developments on working farms are a preferable option (Especially game farming).
Rural development nodes. These nodes will have 2 main functions. Firstly to improve access to services for rural inhabitants and secondly to draw in and utilise latent economic potential. These nodes are situated at the most accessible points in rural areas. These nodes will need public and private sector investment in order to develop to their potential. Public sector investment in infrastructure for social and economic development purposes is required to stimulate private investment. Public investment in social development could include the following as illustrated in the figure below:
Nodal development and management guidelines General
Nodes should develop from directly around the intersection that forms the focus of the node.
Land uses that encourage 24 hour per day activity are encouraged.
Unless stated otherwise, nodal boundaries are situated mid-block and parallel to streets. The lateral
boundaries are set at the erf boundary of the furthest rezoned erf. When application is made to
change the land use of an erf on the premise that it forms part of the node the erf may not be
situated more than 1 erf away from the current nodal boundary.
These policy statements shall not be construed as permitting a land owner or any other person to use
a property in any way contrary to any restrictive conditions of title or any Act.
Architecture and urban design Each node should have its own unique sense of place created through public and private sector
initiatives related to construction and urban design.
All public and private spaces that are visible from the street reserves must be landscaped and
maintained. Land owners are encouraged to adopt parks and open spaces next to their properties in
order to improve appearances around their properties.
The municipality should use conditional linkages to make incremental infrastructure improvements
(Especially related to public landscaping) when large scale development applications are received.
Buildings and public space designs should take into account the needs of the elderly and disabled. All buildings must have street fronts in the form of windows and doors to the satisfaction of the
municipality.
Mobility and accessibility Nodes should receive priority attention in terms of road upgrading and major new developments will
require traffic impact studies as determined by the municipality. Traffic calming measures should be implemented on access streets, collector roads and lower order
distributors, with mobility receiving higher priority on higher order distributors.
Infrastructure provision Bulk infrastructure provision should be made in order to allow for residential densification
Draft IDP Document 2015/2016 Page 217
Corridors Corridors are links between nodes, along which an increased intensity of development will naturally be attracted and should be encouraged. Similar to nodes they improve access to opportunities. Corridors should provide an appropriate level of access to the opportunities along the corridor and would typically include public transport routes. There is differentiated between 4 different types of corridors:
Development Corridors
Future Development Corridors
Mobility Corridors
Ecological Corridors/zones
Development Corridors These are linear development areas where increased development intensity is encouraged. The following principles are applicable:
The development of economic activities is encouraged due to increased efficiency and improved thresholds.
Increased residential densities along the corridors are promoted in order to reduce traveling distances and times.
Bulk engineering services should be channeled through these corridors to serve increased densities and capture economies of scale.
In general mixed land uses are promoted in order to maximise economic and social interaction. With most corridors the focus is on mobility as well as accessibility. Provision should be made for public transport. Sufficient parking is important along a development corridor because it promotes improved mobility
and accessibility. Development corridors act as major structuring elements and must connect nodes in order to
function properly. In Merafong development corridors are utilised as major urban structuring elements that perform the dual role of rectifying apartheid spatial disparities and also improving the efficiency of urban systems and networks.
Each corridor must have specific development guidelines and controls to guide development. Where such guidelines do not yet exist, the general principles contained in this document will apply.
These policy statements shall not be construed as permitting a land owner or any other person to use a property in any way contrary to any restrictive conditions of title or any Act.
Future Development Corridors These are potential corridors, deemed to have future development potential. Currently these are not considered development corridors because the potential for development has not yet been unlocked. They are indicated on the SDF map to give direction on what is envisaged for the municipal area in the future. Mobility Corridors These are corridors where the mobility of traffic movement must be promoted, including public transport. These corridors are the primary commuter distributors within the municipality. The following is of importance:
Most of these roads are under the custodianship of Gauteng Province. The amount of intersections along these routes should be kept to a minimum. Provision should be made for safe stop areas for public transport that does not cause traffic to slow
down or become congested. As far as possible pedestrian and vehicular traffic must not mix along these routes. No traffic calming measures may be implemented unless it is a necessity, e.g. some parts of a CBD
where pedestrian safety is a problem. Planning and development along these routes should take possible future ‘bottlenecks’ into account. Provision for small to large scale modal interchanges has to be made at development nodes.
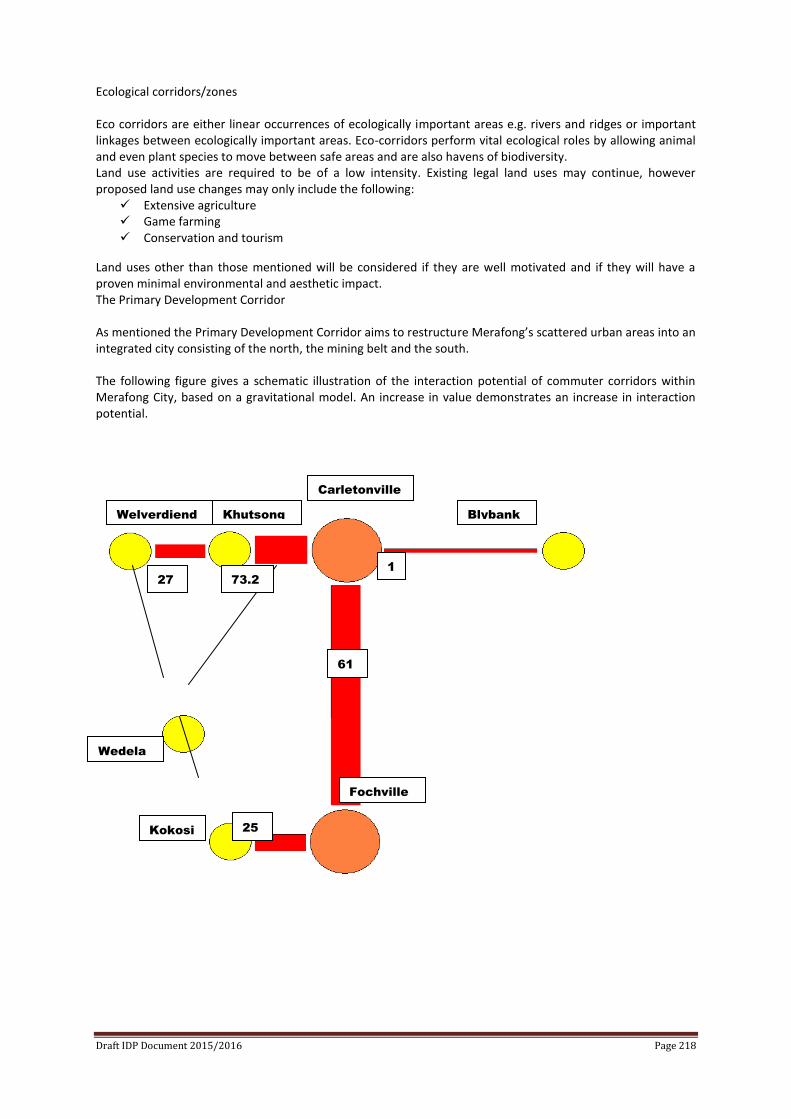
Draft IDP Document 2015/2016 Page 218
Ecological corridors/zones Eco corridors are either linear occurrences of ecologically important areas e.g. rivers and ridges or important linkages between ecologically important areas. Eco-corridors perform vital ecological roles by allowing animal and even plant species to move between safe areas and are also havens of biodiversity. Land use activities are required to be of a low intensity. Existing legal land uses may continue, however proposed land use changes may only include the following:
Extensive agriculture Game farming Conservation and tourism
Land uses other than those mentioned will be considered if they are well motivated and if they will have a proven minimal environmental and aesthetic impact. The Primary Development Corridor As mentioned the Primary Development Corridor aims to restructure Merafong’s scattered urban areas into an integrated city consisting of the north, the mining belt and the south. The following figure gives a schematic illustration of the interaction potential of commuter corridors within Merafong City, based on a gravitational model. An increase in value demonstrates an increase in interaction potential.
Carletonville
Khutsong Welverdiend
Kokosi
Fochville
Blybank
Wedela
27
1
25
61
73.2
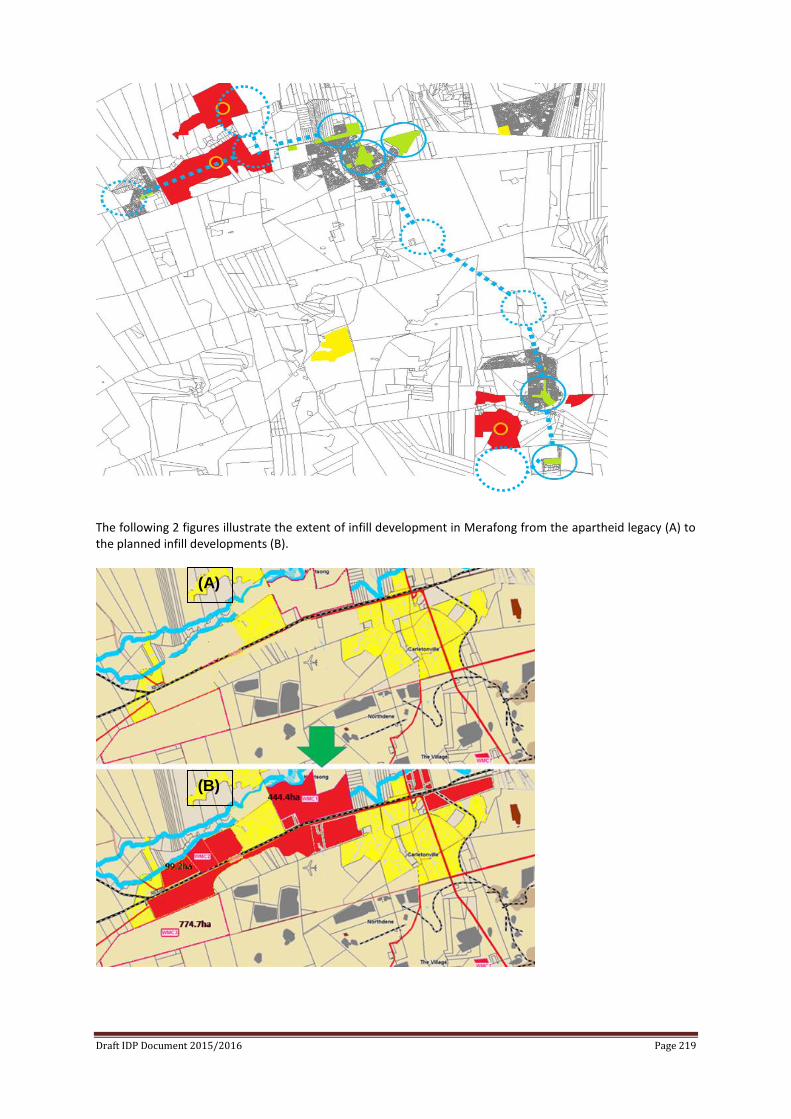
Draft IDP Document 2015/2016 Page 219
The following 2 figures illustrate the extent of infill development in Merafong from the apartheid legacy (A) to the planned infill developments (B).
(B)
(A)
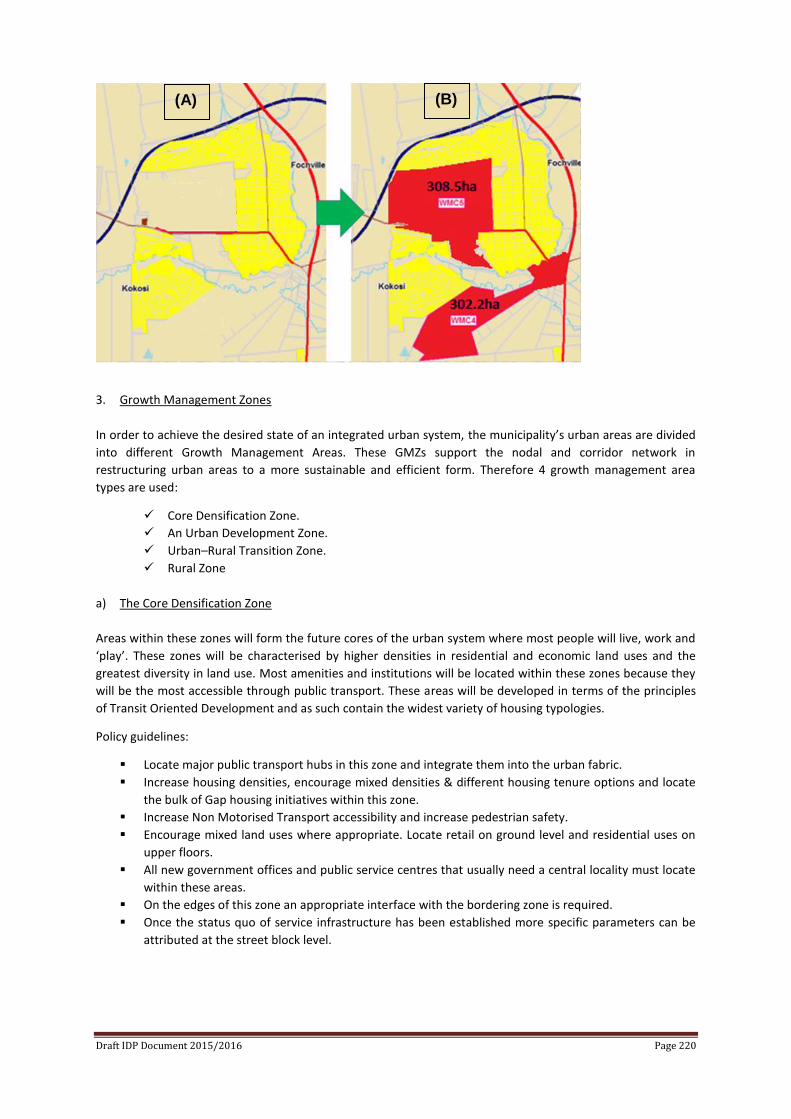
Draft IDP Document 2015/2016 Page 220
3. Growth Management Zones
In order to achieve the desired state of an integrated urban system, the municipality’s urban areas are divided
into different Growth Management Areas. These GMZs support the nodal and corridor network in
restructuring urban areas to a more sustainable and efficient form. Therefore 4 growth management area
types are used:
Core Densification Zone.
An Urban Development Zone.
Urban–Rural Transition Zone.
Rural Zone
a) The Core Densification Zone
Areas within these zones will form the future cores of the urban system where most people will live, work and
‘play’. These zones will be characterised by higher densities in residential and economic land uses and the
greatest diversity in land use. Most amenities and institutions will be located within these zones because they
will be the most accessible through public transport. These areas will be developed in terms of the principles
of Transit Oriented Development and as such contain the widest variety of housing typologies.
Policy guidelines:
Locate major public transport hubs in this zone and integrate them into the urban fabric.
Increase housing densities, encourage mixed densities & different housing tenure options and locate
the bulk of Gap housing initiatives within this zone.
Increase Non Motorised Transport accessibility and increase pedestrian safety.
Encourage mixed land uses where appropriate. Locate retail on ground level and residential uses on
upper floors.
All new government offices and public service centres that usually need a central locality must locate
within these areas.
On the edges of this zone an appropriate interface with the bordering zone is required.
Once the status quo of service infrastructure has been established more specific parameters can be
attributed at the street block level.
(A) (B)
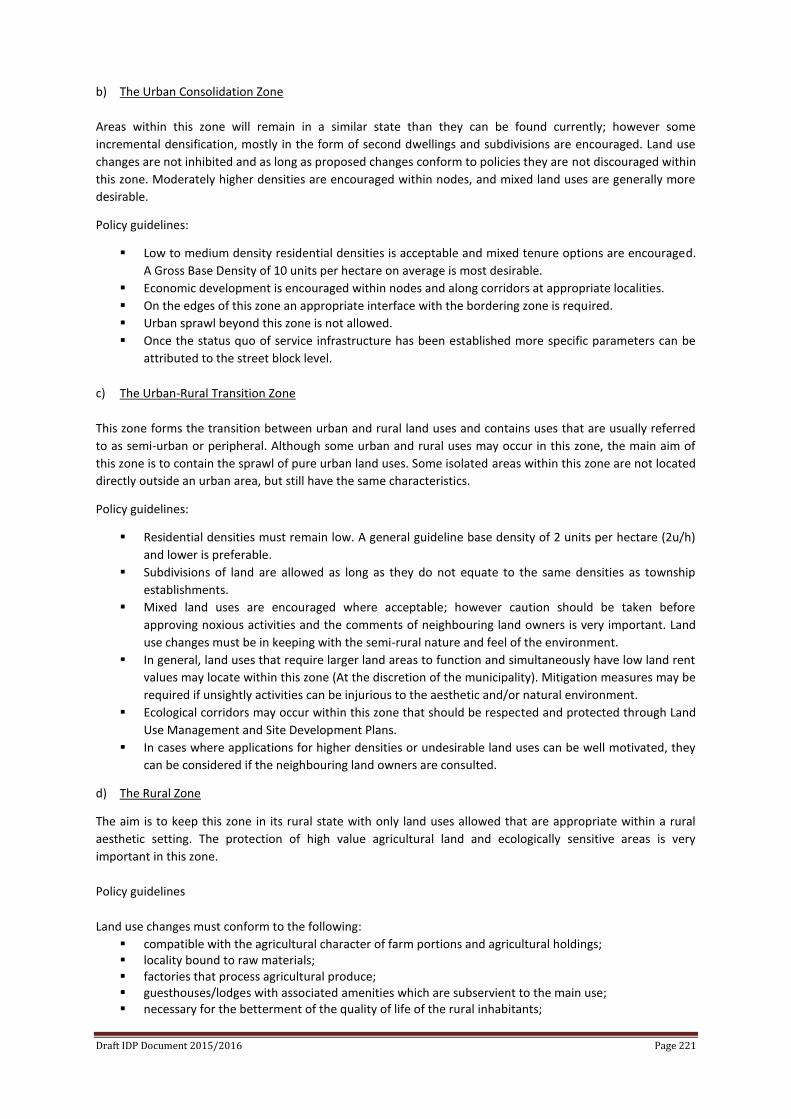
Draft IDP Document 2015/2016 Page 221
b) The Urban Consolidation Zone
Areas within this zone will remain in a similar state than they can be found currently; however some
incremental densification, mostly in the form of second dwellings and subdivisions are encouraged. Land use
changes are not inhibited and as long as proposed changes conform to policies they are not discouraged within
this zone. Moderately higher densities are encouraged within nodes, and mixed land uses are generally more
desirable.
Policy guidelines:
Low to medium density residential densities is acceptable and mixed tenure options are encouraged.
A Gross Base Density of 10 units per hectare on average is most desirable.
Economic development is encouraged within nodes and along corridors at appropriate localities.
On the edges of this zone an appropriate interface with the bordering zone is required.
Urban sprawl beyond this zone is not allowed.
Once the status quo of service infrastructure has been established more specific parameters can be
attributed to the street block level.
c) The Urban-Rural Transition Zone
This zone forms the transition between urban and rural land uses and contains uses that are usually referred
to as semi-urban or peripheral. Although some urban and rural uses may occur in this zone, the main aim of
this zone is to contain the sprawl of pure urban land uses. Some isolated areas within this zone are not located
directly outside an urban area, but still have the same characteristics.
Policy guidelines:
Residential densities must remain low. A general guideline base density of 2 units per hectare (2u/h)
and lower is preferable.
Subdivisions of land are allowed as long as they do not equate to the same densities as township
establishments.
Mixed land uses are encouraged where acceptable; however caution should be taken before
approving noxious activities and the comments of neighbouring land owners is very important. Land
use changes must be in keeping with the semi-rural nature and feel of the environment.
In general, land uses that require larger land areas to function and simultaneously have low land rent
values may locate within this zone (At the discretion of the municipality). Mitigation measures may be
required if unsightly activities can be injurious to the aesthetic and/or natural environment.
Ecological corridors may occur within this zone that should be respected and protected through Land
Use Management and Site Development Plans.
In cases where applications for higher densities or undesirable land uses can be well motivated, they
can be considered if the neighbouring land owners are consulted.
d) The Rural Zone
The aim is to keep this zone in its rural state with only land uses allowed that are appropriate within a rural
aesthetic setting. The protection of high value agricultural land and ecologically sensitive areas is very
important in this zone.
Policy guidelines
Land use changes must conform to the following:
compatible with the agricultural character of farm portions and agricultural holdings; locality bound to raw materials; factories that process agricultural produce; guesthouses/lodges with associated amenities which are subservient to the main use; necessary for the betterment of the quality of life of the rural inhabitants;
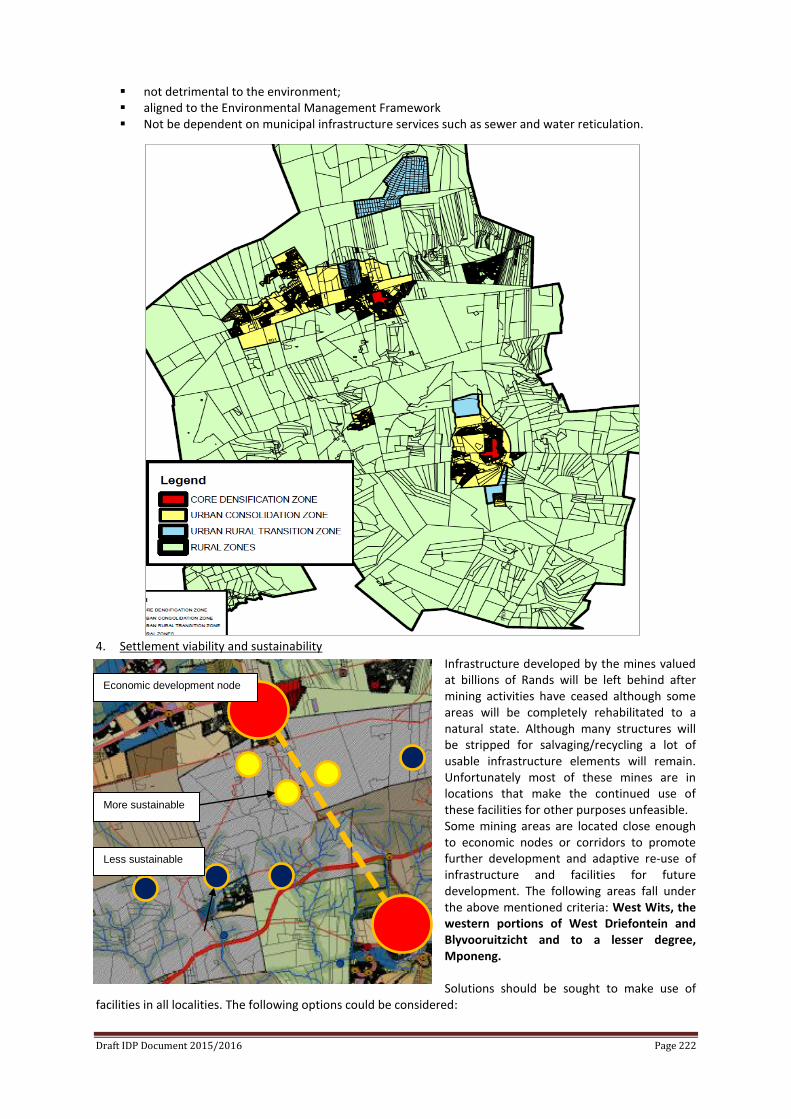
Draft IDP Document 2015/2016 Page 222
not detrimental to the environment; aligned to the Environmental Management Framework Not be dependent on municipal infrastructure services such as sewer and water reticulation.
4. Settlement viability and sustainability
Infrastructure developed by the mines valued at billions of Rands will be left behind after mining activities have ceased although some areas will be completely rehabilitated to a natural state. Although many structures will be stripped for salvaging/recycling a lot of usable infrastructure elements will remain. Unfortunately most of these mines are in locations that make the continued use of these facilities for other purposes unfeasible. Some mining areas are located close enough to economic nodes or corridors to promote further development and adaptive re-use of infrastructure and facilities for future development. The following areas fall under the above mentioned criteria: West Wits, the western portions of West Driefontein and Blyvooruitzicht and to a lesser degree, Mponeng. Solutions should be sought to make use of
facilities in all localities. The following options could be considered:
Economic development node
Less sustainable
More sustainable
Draft IDP Document 2015/2016 Page 223
Industrial businesses that are not locationally bound but that could use the existing infrastructure and
premises sold at reduced prices could settle in these locations, especially those sites with reasonable
accessibility. Rather than returning these areas to a natural state, mining companies can offer
incentives for companies to “set up shop” in these locations. However, not all locations will be
suitable.
The West Wits village has a marginally viable location near the Leslie Williams private hospital, an
aesthetically pleasing atmosphere and numerous facilities; therefore it could for example be
converted into an elderly retirement village.
The vast tracts of land owned by mining companies could be used for agriculture, game farming and
nature reserves. Additionally, sites of tailings dams that remain toxic after rehabilitation should be
considered for future land fill sites.
Apart from efforts to ‘green’ decommissioned slimes dams, options should be investigated regarding
the extent to which these large wastelands can be used for producing biofuels, which are lately
increasingly blamed for causing food prices to rise by occupying land formerly used for food
production. If conditions could be created allowing the growth of biofuel plants on slimes dams the
use of oilseed rape could be considered. As a major crop for bio-energy, it was recently found to
suffer from a sulphur deficiency owing to the successful desulphurisation of the atmosphere in efforts
to combat acid rain. Since sulphur is abundant in slimes dams this crop may be better suited than
others for this relatively hostile environment. The new mega tailings dams could be utilised for this
purpose. (Source: F. Winde & L. Stoch. Threats and opportunities for post-closure development in
dolomitic gold-mining areas of the West Rand and Far West Rand (South Africa) – a hydraulic
view)
The shallower parts of mining shafts could be used for mushroom farming. These environments are
perfect for growing mushrooms and this has been done at locations of old mines around the world.
Usually this is done in coal mines because they are shallow. If some mine shafts are shallow enough it
could be considered in Merafong.
Owing to the existence in the area of long-standing expertise on uranium-related aspects, including
mining, enrichment, nuclear power generation and environmental and health effects, it should also
be explored to what extent the area could benefit from a future uranium-based industry. With regard
to existing infrastructure, the area is suitable in terms of a number of aspects, including the presence
of the Nuclear Fuels Corporation (NUFCOR), the North-West University (NWU) and with researchers
at NWU specialising in environmental and geo-ecological aspects of uranium-mining. (Source: F.
Winde & L. Stoch. Threats and opportunities for post-closure development in dolomitic gold-mining
areas of the West Rand and Far West Rand)
With increasing implementation of financial instruments to counteract global warming through
curbing the emission of greenhouse gases, the mine void could also be used to commercially store
carbon dioxide from coal-based power stations. With proposed prices for emission certificates of
€30/t CO2 (±ZAR360/t CO2) and the likely continuation of coal-based power generation in a coal-rich
country such as South Africa, this could well be a commercially viable option. Possible technologies
include the transformation of gaseous CO2 into solid carbonate, storage in salt water, treatment of
coal ash with CO2 and others. (Source: F. Winde & L. Stoch. Threats and opportunities for post-closure
development in dolomitic gold-mining areas of the West Rand and Far West Rand)
Recent technological advancements in geothermal electricity generation have made geothermal
power viable in a vast number of new locations all over the world. The existing mine voids could be
used for geothermal power generation because the existing voids will reduce the amount of drilling
required to reach feasible temperatures and the existing infrastructure like buildings and power
cables would be useful.
Old mines could become tourist attractions.
Mining by-products like stone, water, etc. can be utilised
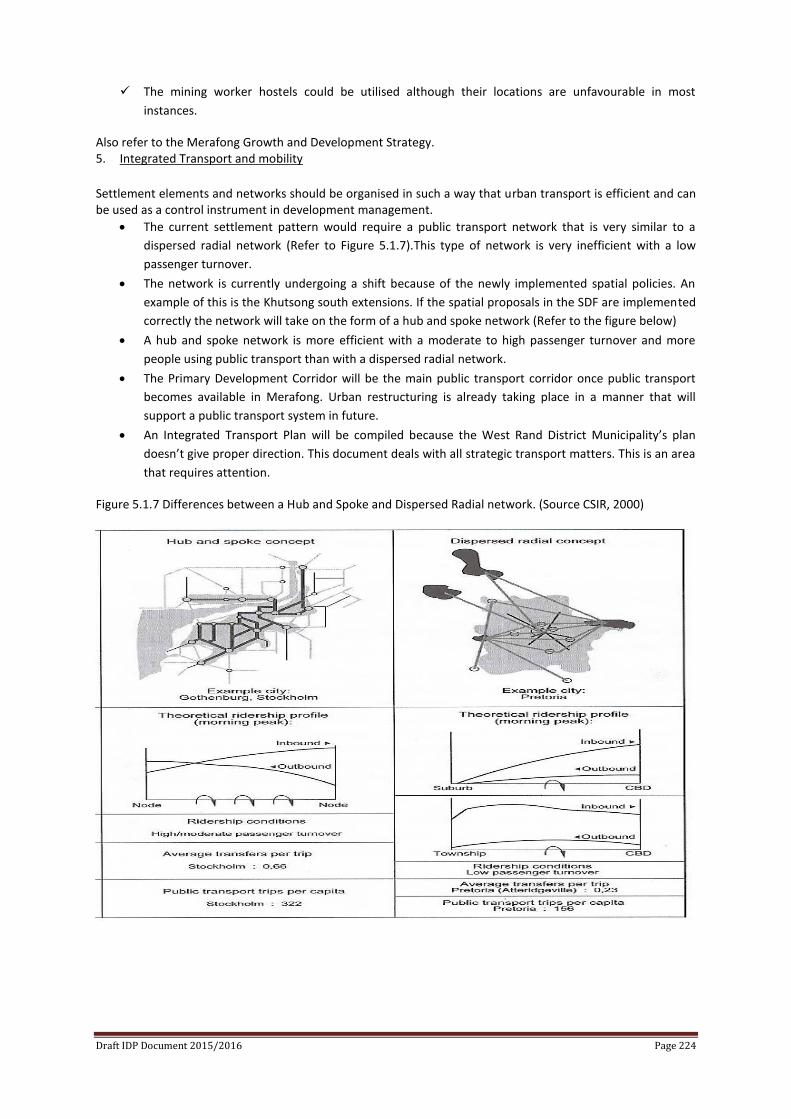
Draft IDP Document 2015/2016 Page 224
The mining worker hostels could be utilised although their locations are unfavourable in most
instances.
Also refer to the Merafong Growth and Development Strategy. 5. Integrated Transport and mobility
Settlement elements and networks should be organised in such a way that urban transport is efficient and can be used as a control instrument in development management.
The current settlement pattern would require a public transport network that is very similar to a
dispersed radial network (Refer to Figure 5.1.7).This type of network is very inefficient with a low
passenger turnover.
The network is currently undergoing a shift because of the newly implemented spatial policies. An
example of this is the Khutsong south extensions. If the spatial proposals in the SDF are implemented
correctly the network will take on the form of a hub and spoke network (Refer to the figure below)
A hub and spoke network is more efficient with a moderate to high passenger turnover and more
people using public transport than with a dispersed radial network.
The Primary Development Corridor will be the main public transport corridor once public transport
becomes available in Merafong. Urban restructuring is already taking place in a manner that will
support a public transport system in future.
An Integrated Transport Plan will be compiled because the West Rand District Municipality’s plan
doesn’t give proper direction. This document deals with all strategic transport matters. This is an area
that requires attention.
Figure 5.1.7 Differences between a Hub and Spoke and Dispersed Radial network. (Source CSIR, 2000)
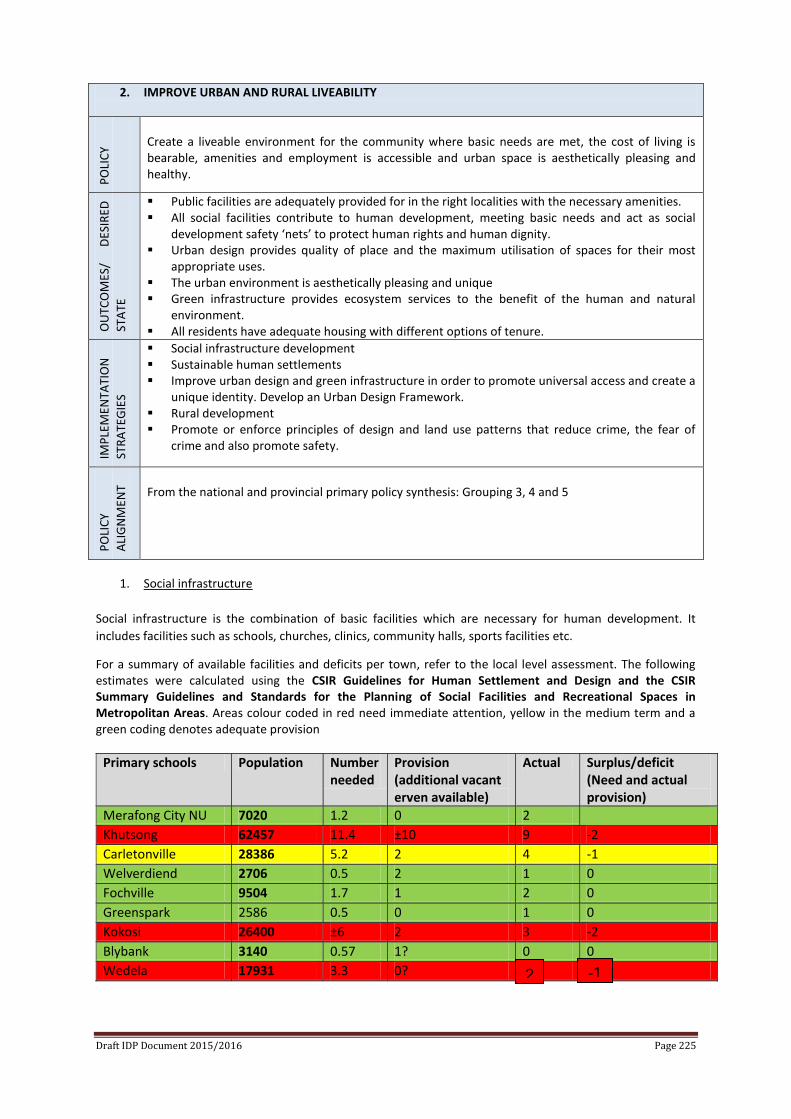
Draft IDP Document 2015/2016 Page 225
2. IMPROVE URBAN AND RURAL LIVEABILITY
PO
LIC
Y
Create a liveable environment for the community where basic needs are met, the cost of living is bearable, amenities and employment is accessible and urban space is aesthetically pleasing and healthy.
OU
TCO
MES
/ D
ESIR
ED
STA
TE
Public facilities are adequately provided for in the right localities with the necessary amenities. All social facilities contribute to human development, meeting basic needs and act as social
development safety ‘nets’ to protect human rights and human dignity. Urban design provides quality of place and the maximum utilisation of spaces for their most
appropriate uses. The urban environment is aesthetically pleasing and unique Green infrastructure provides ecosystem services to the benefit of the human and natural
environment. All residents have adequate housing with different options of tenure.
IMP
LEM
ENTA
TIO
N
STR
ATE
GIE
S
Social infrastructure development Sustainable human settlements Improve urban design and green infrastructure in order to promote universal access and create a
unique identity. Develop an Urban Design Framework. Rural development Promote or enforce principles of design and land use patterns that reduce crime, the fear of
crime and also promote safety.
PO
LIC
Y
ALI
GN
MEN
T
From the national and provincial primary policy synthesis: Grouping 3, 4 and 5
1. Social infrastructure
Social infrastructure is the combination of basic facilities which are necessary for human development. It
includes facilities such as schools, churches, clinics, community halls, sports facilities etc.
For a summary of available facilities and deficits per town, refer to the local level assessment. The following estimates were calculated using the CSIR Guidelines for Human Settlement and Design and the CSIR Summary Guidelines and Standards for the Planning of Social Facilities and Recreational Spaces in Metropolitan Areas. Areas colour coded in red need immediate attention, yellow in the medium term and a green coding denotes adequate provision
Primary schools Population Number needed
Provision (additional vacant erven available)
Actual Surplus/deficit (Need and actual provision)
Merafong City NU 7020 1.2 0 2
Khutsong 62457 11.4 ±10 9 -2
Carletonville 28386 5.2 2 4 -1
Welverdiend 2706 0.5 2 1 0
Fochville 9504 1.7 1 2 0
Greenspark 2586 0.5 0 1 0
Kokosi 26400 ±6 2 3 -2
Blybank 3140 0.57 1? 0 0
Wedela 17931 3.3 0? 1 -2
2 -1
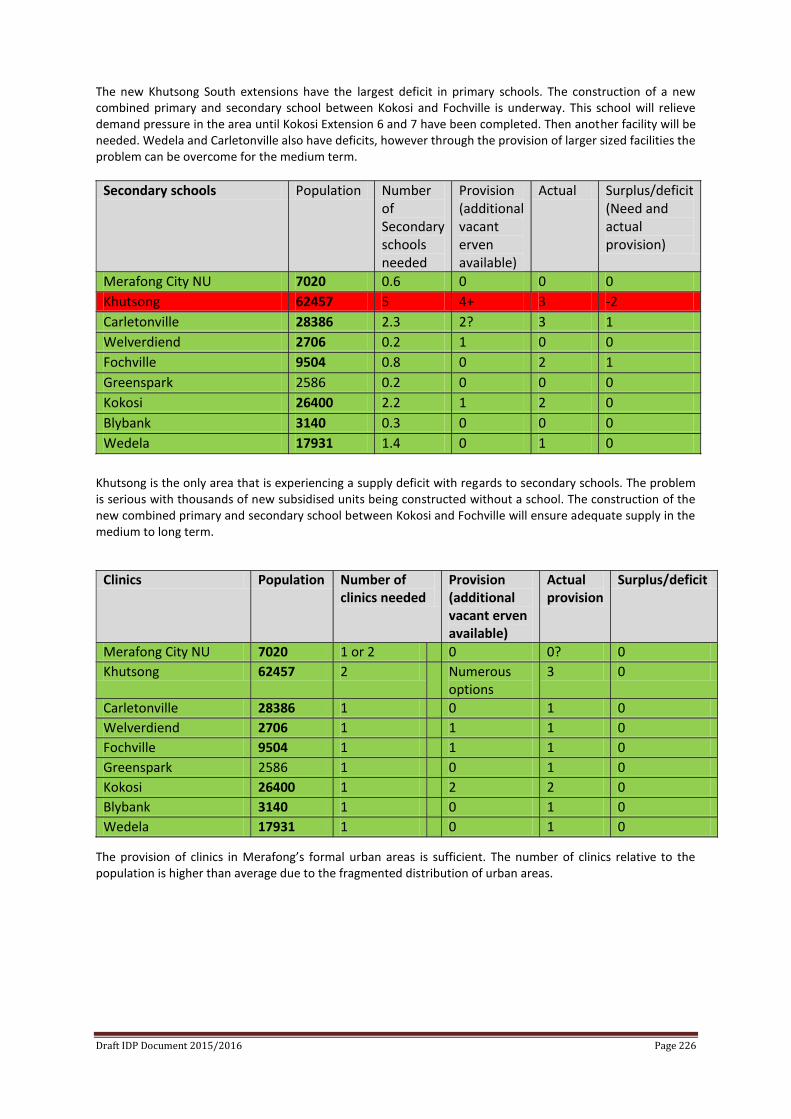
Draft IDP Document 2015/2016 Page 226
The new Khutsong South extensions have the largest deficit in primary schools. The construction of a new combined primary and secondary school between Kokosi and Fochville is underway. This school will relieve demand pressure in the area until Kokosi Extension 6 and 7 have been completed. Then another facility will be needed. Wedela and Carletonville also have deficits, however through the provision of larger sized facilities the problem can be overcome for the medium term.
Khutsong is the only area that is experiencing a supply deficit with regards to secondary schools. The problem is serious with thousands of new subsidised units being constructed without a school. The construction of the new combined primary and secondary school between Kokosi and Fochville will ensure adequate supply in the medium to long term.
The provision of clinics in Merafong’s formal urban areas is sufficient. The number of clinics relative to the population is higher than average due to the fragmented distribution of urban areas.
Secondary schools Population Number of Secondary schools needed
Provision (additional vacant erven available)
Actual Surplus/deficit (Need and actual provision)
Merafong City NU 7020 0.6 0 0 0
Khutsong 62457 5 4+ 3 -2
Carletonville 28386 2.3 2? 3 1
Welverdiend 2706 0.2 1 0 0
Fochville 9504 0.8 0 2 1
Greenspark 2586 0.2 0 0 0
Kokosi 26400 2.2 1 2 0
Blybank 3140 0.3 0 0 0
Wedela 17931 1.4 0 1 0
Clinics Population Number of clinics needed
Provision (additional vacant erven available)
Actual provision
Surplus/deficit
Merafong City NU 7020 1 or 2 0 0? 0
Khutsong 62457 2 Numerous options
3 0
Carletonville 28386 1 0 1 0
Welverdiend 2706 1 1 1 0
Fochville 9504 1 1 1 0
Greenspark 2586 1 0 1 0
Kokosi 26400 1 2 2 0
Blybank 3140 1 0 1 0
Wedela 17931 1 0 1 0
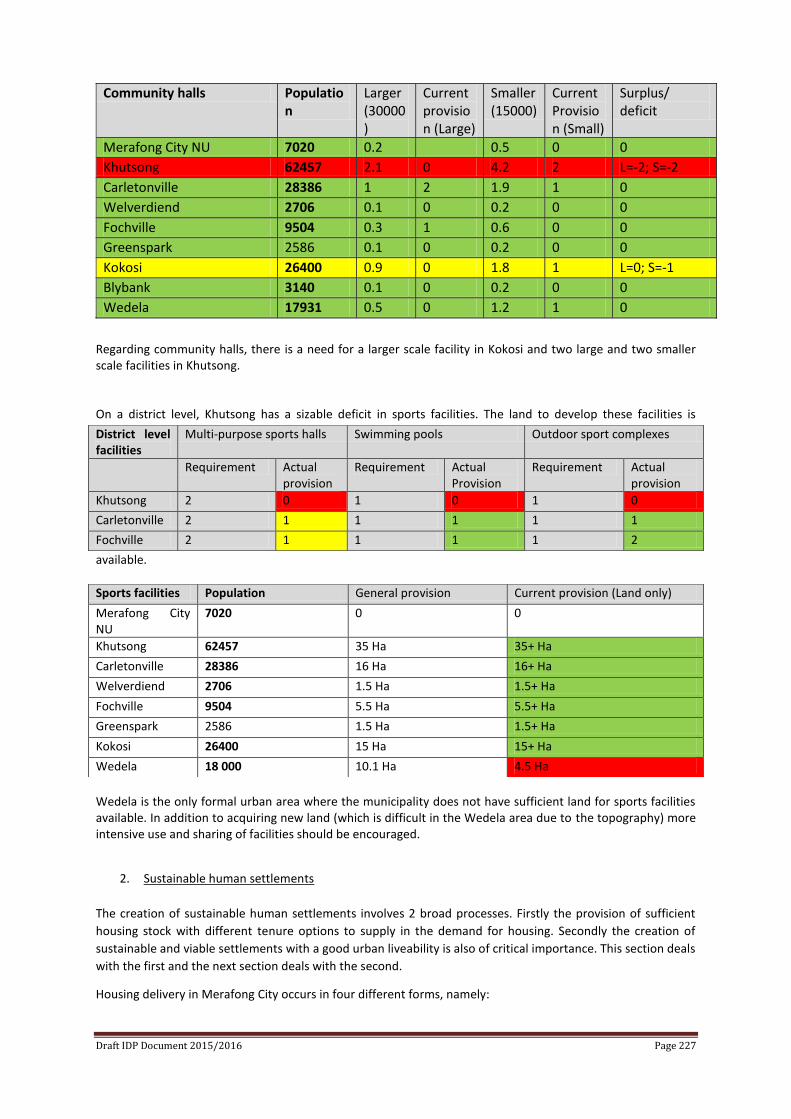
Draft IDP Document 2015/2016 Page 227
Regarding community halls, there is a need for a larger scale facility in Kokosi and two large and two smaller scale facilities in Khutsong. On a district level, Khutsong has a sizable deficit in sports facilities. The land to develop these facilities is
available.
Wedela is the only formal urban area where the municipality does not have sufficient land for sports facilities available. In addition to acquiring new land (which is difficult in the Wedela area due to the topography) more intensive use and sharing of facilities should be encouraged.
2. Sustainable human settlements
The creation of sustainable human settlements involves 2 broad processes. Firstly the provision of sufficient
housing stock with different tenure options to supply in the demand for housing. Secondly the creation of
sustainable and viable settlements with a good urban liveability is also of critical importance. This section deals
with the first and the next section deals with the second.
Housing delivery in Merafong City occurs in four different forms, namely:
Community halls Population
Larger (30000)
Current provision (Large)
Smaller (15000)
Current Provision (Small)
Surplus/ deficit
Merafong City NU 7020 0.2 0.5 0 0
Khutsong 62457 2.1 0 4.2 2 L=-2; S=-2
Carletonville 28386 1 2 1.9 1 0
Welverdiend 2706 0.1 0 0.2 0 0
Fochville 9504 0.3 1 0.6 0 0
Greenspark 2586 0.1 0 0.2 0 0
Kokosi 26400 0.9 0 1.8 1 L=0; S=-1
Blybank 3140 0.1 0 0.2 0 0
Wedela 17931 0.5 0 1.2 1 0
District level facilities
Multi-purpose sports halls Swimming pools Outdoor sport complexes
Requirement Actual provision
Requirement Actual Provision
Requirement Actual provision
Khutsong 2 0 1 0 1 0
Carletonville 2 1 1 1 1 1
Fochville 2 1 1 1 1 2
Sports facilities Population General provision Current provision (Land only)
Merafong City NU
7020 0 0
Khutsong 62457 35 Ha 35+ Ha
Carletonville 28386 16 Ha 16+ Ha
Welverdiend 2706 1.5 Ha 1.5+ Ha
Fochville 9504 5.5 Ha 5.5+ Ha
Greenspark 2586 1.5 Ha 1.5+ Ha
Kokosi 26400 15 Ha 15+ Ha
Wedela 18 000 10.1 Ha 4.5 Ha
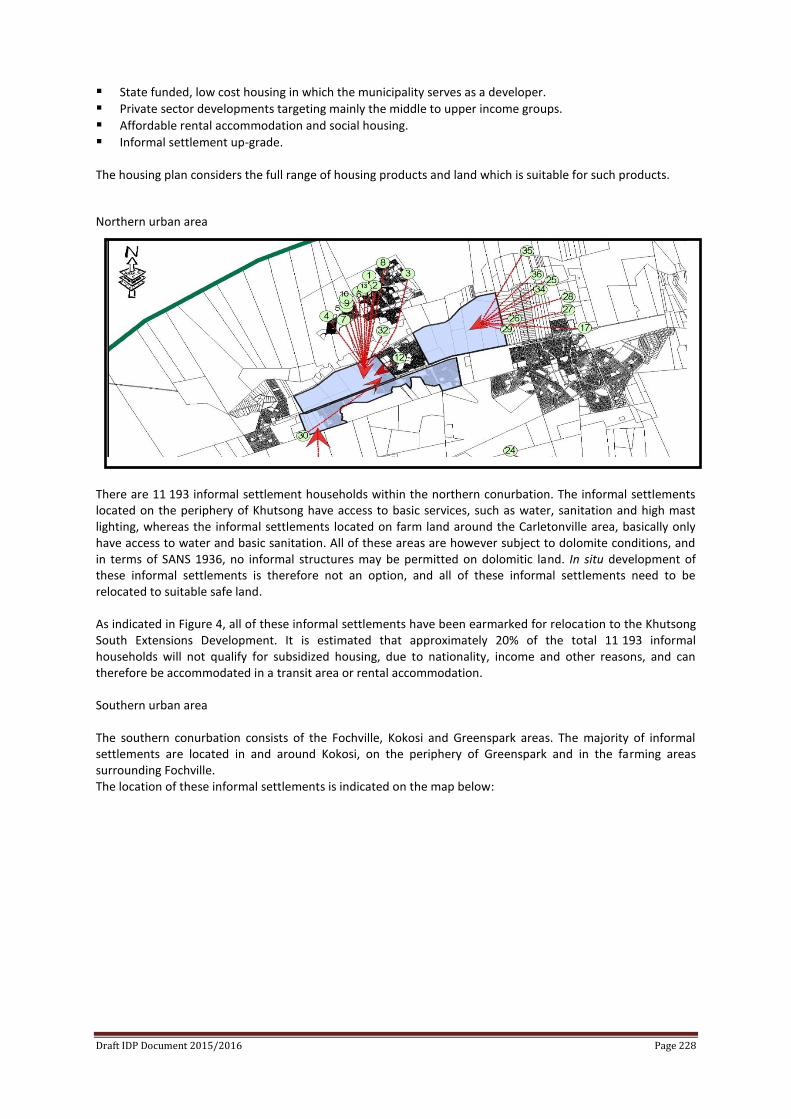
Draft IDP Document 2015/2016 Page 228
State funded, low cost housing in which the municipality serves as a developer.
Private sector developments targeting mainly the middle to upper income groups.
Affordable rental accommodation and social housing.
Informal settlement up-grade. The housing plan considers the full range of housing products and land which is suitable for such products.
Northern urban area
There are 11 193 informal settlement households within the northern conurbation. The informal settlements located on the periphery of Khutsong have access to basic services, such as water, sanitation and high mast lighting, whereas the informal settlements located on farm land around the Carletonville area, basically only have access to water and basic sanitation. All of these areas are however subject to dolomite conditions, and in terms of SANS 1936, no informal structures may be permitted on dolomitic land. In situ development of these informal settlements is therefore not an option, and all of these informal settlements need to be relocated to suitable safe land. As indicated in Figure 4, all of these informal settlements have been earmarked for relocation to the Khutsong South Extensions Development. It is estimated that approximately 20% of the total 11 193 informal households will not qualify for subsidized housing, due to nationality, income and other reasons, and can therefore be accommodated in a transit area or rental accommodation. Southern urban area The southern conurbation consists of the Fochville, Kokosi and Greenspark areas. The majority of informal settlements are located in and around Kokosi, on the periphery of Greenspark and in the farming areas surrounding Fochville. The location of these informal settlements is indicated on the map below:
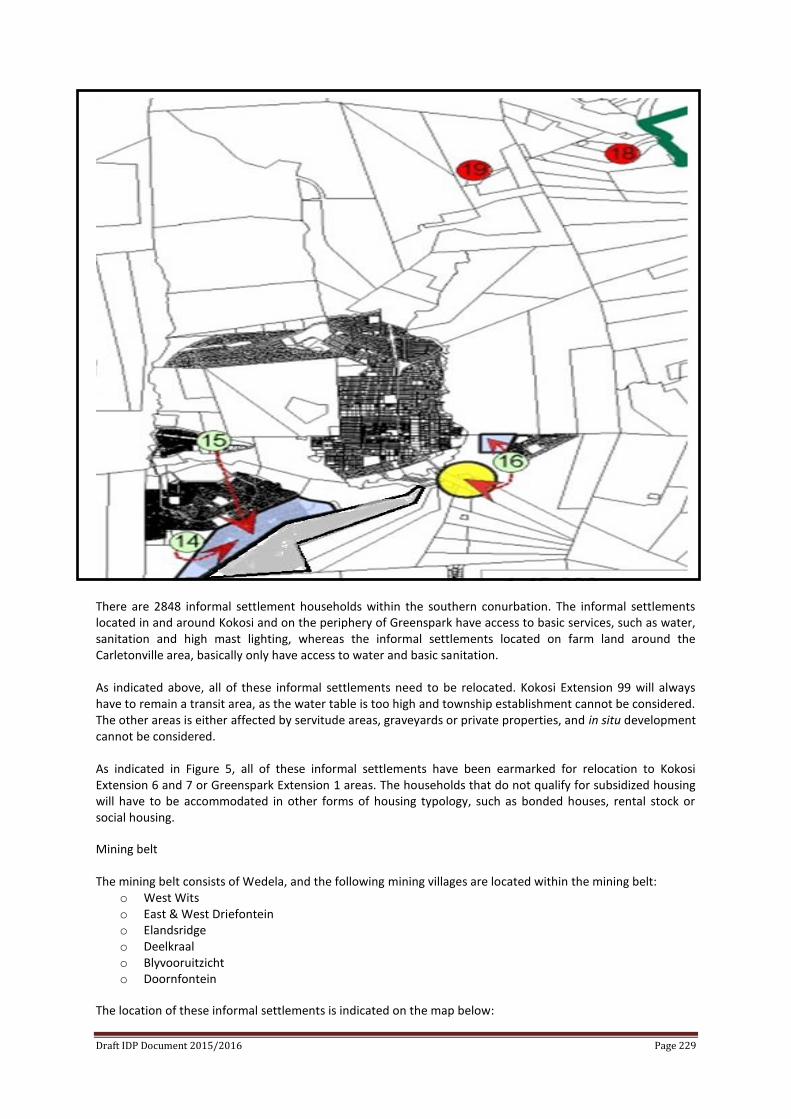
Draft IDP Document 2015/2016 Page 229
There are 2848 informal settlement households within the southern conurbation. The informal settlements located in and around Kokosi and on the periphery of Greenspark have access to basic services, such as water, sanitation and high mast lighting, whereas the informal settlements located on farm land around the Carletonville area, basically only have access to water and basic sanitation. As indicated above, all of these informal settlements need to be relocated. Kokosi Extension 99 will always have to remain a transit area, as the water table is too high and township establishment cannot be considered. The other areas is either affected by servitude areas, graveyards or private properties, and in situ development cannot be considered. As indicated in Figure 5, all of these informal settlements have been earmarked for relocation to Kokosi Extension 6 and 7 or Greenspark Extension 1 areas. The households that do not qualify for subsidized housing will have to be accommodated in other forms of housing typology, such as bonded houses, rental stock or social housing.
Mining belt The mining belt consists of Wedela, and the following mining villages are located within the mining belt:
o West Wits o East & West Driefontein o Elandsridge o Deelkraal o Blyvooruitzicht o Doornfontein
The location of these informal settlements is indicated on the map below:
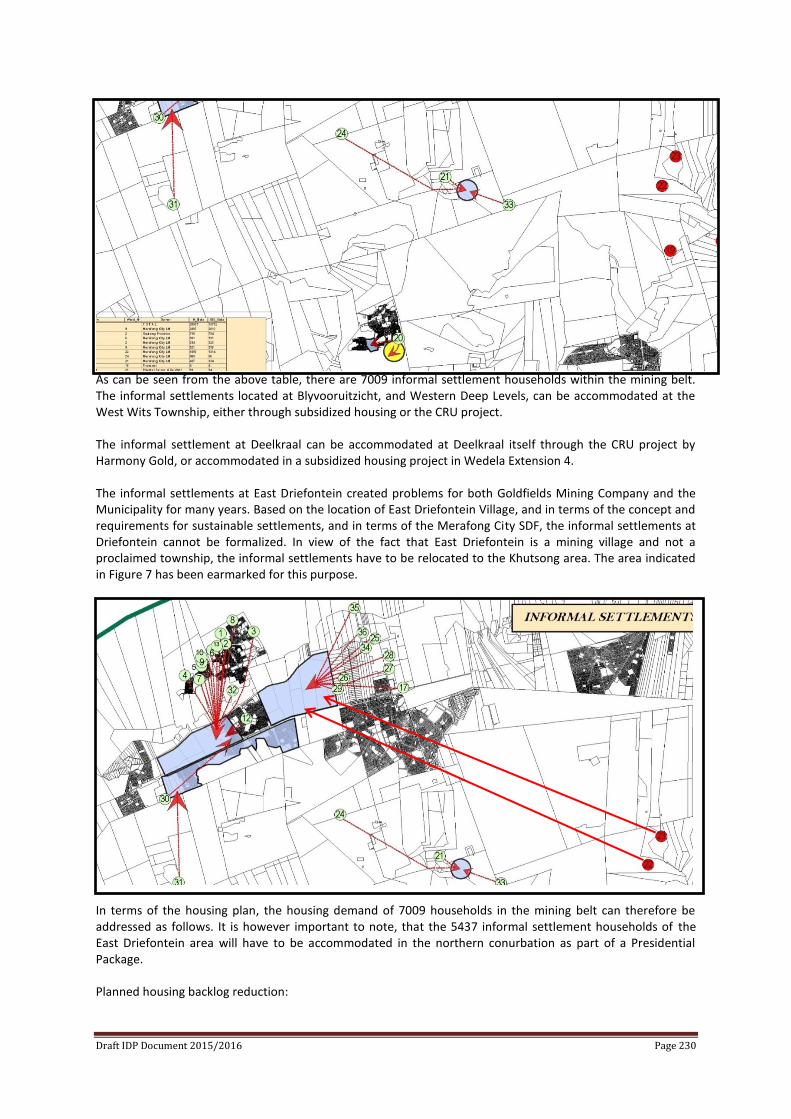
Draft IDP Document 2015/2016 Page 230
As can be seen from the above table, there are 7009 informal settlement households within the mining belt. The informal settlements located at Blyvooruitzicht, and Western Deep Levels, can be accommodated at the West Wits Township, either through subsidized housing or the CRU project. The informal settlement at Deelkraal can be accommodated at Deelkraal itself through the CRU project by Harmony Gold, or accommodated in a subsidized housing project in Wedela Extension 4. The informal settlements at East Driefontein created problems for both Goldfields Mining Company and the Municipality for many years. Based on the location of East Driefontein Village, and in terms of the concept and requirements for sustainable settlements, and in terms of the Merafong City SDF, the informal settlements at Driefontein cannot be formalized. In view of the fact that East Driefontein is a mining village and not a proclaimed township, the informal settlements have to be relocated to the Khutsong area. The area indicated in Figure 7 has been earmarked for this purpose.
In terms of the housing plan, the housing demand of 7009 households in the mining belt can therefore be addressed as follows. It is however important to note, that the 5437 informal settlement households of the East Driefontein area will have to be accommodated in the northern conurbation as part of a Presidential Package. Planned housing backlog reduction:
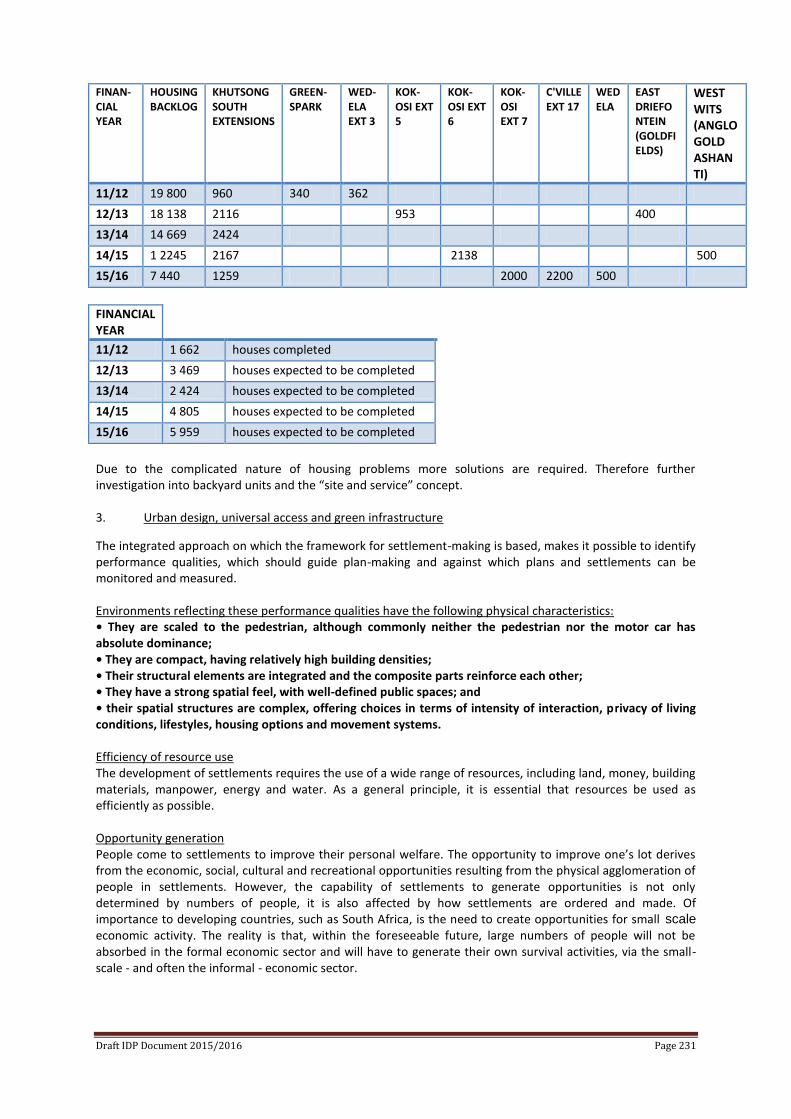
Draft IDP Document 2015/2016 Page 231
FINAN-CIAL YEAR
HOUSING BACKLOG
KHUTSONG SOUTH EXTENSIONS
GREEN-SPARK
WED-ELA EXT 3
KOK-OSI EXT 5
KOK-OSI EXT 6
KOK-OSI EXT 7
C'VILLE EXT 17
WEDELA
EAST DRIEFONTEIN (GOLDFIELDS)
WEST WITS (ANGLOGOLD ASHANTI)
11/12 19 800 960 340 362
12/13 18 138 2116 953 400
13/14 14 669 2424
14/15 1 2245 2167 2138 500
15/16 7 440 1259 2000 2200 500
Due to the complicated nature of housing problems more solutions are required. Therefore further investigation into backyard units and the “site and service” concept. 3. Urban design, universal access and green infrastructure
The integrated approach on which the framework for settlement-making is based, makes it possible to identify performance qualities, which should guide plan-making and against which plans and settlements can be monitored and measured. Environments reflecting these performance qualities have the following physical characteristics: • They are scaled to the pedestrian, although commonly neither the pedestrian nor the motor car has absolute dominance; • They are compact, having relatively high building densities; • Their structural elements are integrated and the composite parts reinforce each other; • They have a strong spatial feel, with well-defined public spaces; and • their spatial structures are complex, offering choices in terms of intensity of interaction, privacy of living conditions, lifestyles, housing options and movement systems. Efficiency of resource use The development of settlements requires the use of a wide range of resources, including land, money, building materials, manpower, energy and water. As a general principle, it is essential that resources be used as efficiently as possible. Opportunity generation People come to settlements to improve their personal welfare. The opportunity to improve one’s lot derives from the economic, social, cultural and recreational opportunities resulting from the physical agglomeration of people in settlements. However, the capability of settlements to generate opportunities is not only determined by numbers of people, it is also affected by how settlements are ordered and made. Of importance to developing countries, such as South Africa, is the need to create opportunities for small scale
economic activity. The reality is that, within the foreseeable future, large numbers of people will not be absorbed in the formal economic sector and will have to generate their own survival activities, via the small-scale - and often the informal - economic sector.
FINANCIAL YEAR
11/12 1 662 houses completed
12/13 3 469 houses expected to be completed
13/14 2 424 houses expected to be completed
14/15 4 805 houses expected to be completed
15/16 5 959 houses expected to be completed
Draft IDP Document 2015/2016 Page 232
There are a number of ways in which spatial conditions in settlements create opportunities for economic activity: • The first is intensification. This requires the promotion of higher unit densities than is the norm under the current model of settlement development. The case for increasing densities rests on a number of grounds. Higher densities create more opportunities for interaction, a climate in which economic activity - and small-scale economic activity, in particular - can thrive. A further effect of increased densities is an increased local demand for goods and services, promoting increasing specialisation and diversification in the small business sector. The promotion of economic activity is also affected by the efficiency of movement systems. Efficiency of movement creates higher levels of support for goods, services and social facilities, simultaneously ensuring a wider range of goods and social facilities and increasing the viability of the services provided. In this way higher densities play a crucial role in achieving higher levels of convenience. Higher densities lead to increased support for public transport systems, improving their viability. Higher densities, by lowering unit costs, can also contribute to the more efficient use of infrastructure. Finally, higher densities can contribute to the efficient utilisation of land, the counteracting of urban sprawl, a reduction in travelling and a reduction in energy consumption and pollution. • A second way in which settlements maximise opportunities is by the integration of the different parts of the settlement, so that they contribute to each other. When a settlement is fragmented into a number of smaller, inwardly orientated parts, each part is largely reliant on its own internally generated resources. Consequently, levels of service and convenience may be low. By contrast, when the parts of a settlement are integrated, each part benefits from a much larger area. New settlements should accordingly not be viewed as ends in themselves only. They should also be viewed as instruments of restructuring, in the sense that they can be used to integrate a fragmented settlement environment. The above has implications for our thinking about movement. The challenge is to establish and maximise a continuity of movement systems, tying local living areas together. Movement systems need to be viewed not just as movement channels, but as spatial structuring elements. This line of thought leads to the conclusion that maximising access is as important as maximising mobility. • A third way of increasing opportunities is by enabling the evolutionary development of more complex settlements. When this occurs, a diversity of large- and small-scale activities can find viable locations within the settlement system. • A fourth way of creating opportunities is by using the generating power of larger activities to attract smaller activities, both of which benefit from the movement flows that result from the presence of the other. Convenience Good urban environments are, by definition, convenient. They allow inhabitants to conduct daily activities quickly and easily. Inconvenient environments, on the other hand, impose on lifestyles, reduce choices and increase costs. Access lies at the heart of convenience. In this regard, access needs to be conceived of in terms of movement modes. The first mode is pedestrian movement, which is the lowest common denominator of movement and which describes the primary movement mode of large numbers of people in South Africa. The second is motorised movement in the form of public and private transport. Not all human activities and interaction opportunities exist within walking range. When this occurs, motorised transport becomes the more convenient movement mode. For millions of South Africans, who cannot afford a motor car, public transport is crucial to facilitate movement. Although this does not deny the need to accommodate motor vehicles in settlements, the structuring of settlements, particularly for those who cannot afford private transport, should encourage and facilitate pedestrian movement and public transport systems. Two forms of access are central to promoting convenience. • The first form is access to the economic, social, cultural and recreational benefits which result from the agglomeration of people. This requires the intensification of settlements, the generation of opportunities for a greater range of activities and choices promoting more complex levels of spatial order and encouraging a greater range of development processes. Movement is the integrating structural element underpinning the above.
Draft IDP Document 2015/2016 Page 233
• The second is access to nature. Since settlements are, as a rule, places of intense human activity, the opportunity to escape from this intensity and to experience nature is of great importance to people. For many, for reasons of affordability, contact with nature has to be collective contact as it cannot always be provided adequately within private gardens. In addition, the productive capacity of the land can be a vital settlement resource. For many settlement dwellers the opportunity to use the land productively, or to engage in lifestyles which incorporate dimensions of both urban and rural living, is crucial to their survival. Choice Settlements which perform well are multifaceted places. They offer a diversity, and thus choice, of places, lifestyles, activities and interaction opportunities. On the one hand, positively performing settlements offer opportunities for human contact and interaction. Their activities and events play a major part in shaping the identity of the settlements. Importantly, settlements provide opportunities where people can live on their own but not be alone. They also provide people with choices regarding the extent to which they wish to engage in social activity. On the other hand, people also require places which are private, particularly in the sense of knowing who “the locals” and who the strangers are. The degree to which people wish to live in intensive and vibrant environments - or quieter, more private, places - varies from person to person and over the lifecycle of households. The challenge is to promote environments which provide a diversity of choices, so that people do not have “either-or” choices, but rather choices which relate to relative degrees of privacy or exposure. The key to this lies in hierarchies of movement, public spaces and social institutions, and the design of living areas. Equality of access It is neither possible nor desirable for all parts of settlements to be the same. The reason for this is that clustering tendencies emerge in the structure of settlements as they grow. Activities requiring public support tend to cluster at the most accessible places. Nevertheless, it is important that all people have reasonably equal access to the opportunities and facilities which support living in settlements. Spatially, two issues are central to this: • The first is the recognition that balance is not so much a geographical as a structural concept. The issue is not one of attempting to achieve an even distribution of facilities over the surface of settlements. Rather, it is one of integrating public facilities and events with movement systems, so that access is equalised. • The second issue is that of creating the access preconditions for more intensive activities to spread in a logical way, consistent with the growth of the settlement. Quality of place Quality of place is attained by embracing uniqueness as opposed to standardisation. In terms of the natural environment it requires the identification, a response to and the emphasis of the distinguishing features and characteristics of landscapes. Different natural landscapes suggest different responses. Accordingly, settlement design should respond to nature. In addition, quality of place can be achieved by site making actions, including topographical moulding in areas where soil is easily movable, to create greater diversity in the land form; tree planting, to provide areas of shade and recreation; the use of supplementary sources of energy and building materials; wind protection and space definition; the creation of water bodies as recreational features, sites of aqua-culture and visual relief; and creating choices of living condition. In terms of the human-made environment, quality of place recognises that there are points where elements of settlement structure, particularly the movement system, come together to create places of high accessibility and special significance. These are the meeting places of the settlement. Business and commercial activities, schools, clinics, libraries, community halls and other facilities and activities requiring exposure to large numbers of people are associated with these places. In the best cases, the importance of these places is recognised in that they become the focus of public investment, aimed at making them attractive, user-friendly, and comfortable to experience. They also become the places that accommodate symbolic statements, such as objects of remembrance. These, then, become the memorable places, which shape lasting impressions of a settlement.
Draft IDP Document 2015/2016 Page 234
Their significance is strengthened by their dominant locations in terms of the movement network and from the significance of the social events or rituals they accommodate.
Sensory qualities Positively performing environments reflect powerful sensory qualities. They are places which are aesthetically appealing and which add to the quality of peoples’ lives. The quality of the public spatial environment plays a critical role as far as the sensory qualities of settlements are concerned. The public spaces and places are the primary areas within which people engage in, and experience, urban life. The role of public spaces in the lives of the urban poor is particularly critical. When people are poor, the full range of a household’s needs cannot be adequately met by the individual dwelling. Accordingly, a significant part of their lives is played out in public spaces. If properly made, these spaces can give dignity and a sense of permanence to environments. They are places where many social experiences occur and, in a real sense, they operate as extensions to the private dwelling. The implication is that all public spaces, of which the residential street is one of the important forms, should be viewed and constructed as social spaces. It is the integrated framework of public spaces that enhances the sensory qualities of settlements. Sustainability Sustainability has two main dimensions. The one relates to the relationship between the built environment and the natural landscape. The other is the degree to which the settlement reflects “timeless” qualities. • Settlements exist as adaptations of natural landscapes and are dependent on resources drawn from a much larger area. Two issues are central to achieving environmental sustainability. The first is the need to work harmoniously with the natural landscape, rather than causing breakdowns in natural systems, such as filling in wetlands to obtain developable land rather than developing higher lying ground. The second issue is the need to recycle wastes to the greatest possible degree. For example, storm water runoff can be used for irrigation purposes, and treated sewage as fertiliser. • The second dimension of sustainability is the degree to which the settlement reflects, in its structure and form, “timeless qualities”. Sustainable settlements accommodate growth and change well, and are in turn enriched by processes of change. They have three primary characteristics. They are scaled to the pedestrian. They reflect a structural order, which allows logical reinterpretation by successive generations. They have a strongly spatial feel, with defined and generously made public spaces, spaces not determined only by immediate development needs, but made with the recognition that public space is important in its own right.
4. Rural development
The following is an extract from the Draft Merafong Rural Development Framework: The framework has 6 goals based on the Gauteng Comprehensive Rural Development Strategy and the needs and potential of Merafong:
Promotion of Sustainable Land Reform in Merafong;
Support of Rural Infrastructure Development, Access to Services and Sustainable Livelihoods.
Job Creation Linked to Skills Training and Capacity Building.
Sustainable Use of Natural Resources and Protection of the Environment.
Good Governance
Risks and Vulnerability
Draft IDP Document 2015/2016 Page 235
Promotion of Sustainable Land Reform in Merafong
The categorisation of beneficiaries through targeted allocation is proposed by the national Comprehensive Rural Development Strategy. Land reform projects have often been criticized for ineffectual targeting primarily because the redistribution programme has been demand-driven. Beneficiaries will in future be stratified into 5 categories to target those with proven interest and skills in farming from the rural areas and farms so as to create developmental pathways appropriate to different target categories. The proposed categories are as follows:
Category 1: Landless households – those who have no space even for subsistence production and seek land for small-scale subsistence purposes, with or without settlement; including rights-based applicants such as farm dwellers
Category 2: Commercial-ready subsistence producers – those who wish and are capable of having a more commercial focus but need land and support, mostly on part-time basis; including rights-based applicants such as farm dwellers
Category 3: Expanding commercial smallholders – those who have already been farming commercially at a small scale and with aptitude to expand, but are constrained by land and other resources
Category 4: Well-established black commercial farmers – those who have been farming at a reasonable scale, but are disadvantaged by location and other circumstances, and with real potential to become large-scale commercial farmers
Category 5: Financially capable, aspirant black commercial farmers – established businesspeople who aspire to expand into commercial agriculture and who by and large will be part-time farmers
Merafong Municipality can do more to assist National and Provincial Government with land reform. A database should be compiled of existing emerging farmers and possible candidates living/working on farms in Merafong and categorized in terms of the CRDS categories in order to assist National Government to find households that have not been taken up in registers or databases. Significant tracts of land within Merafong are owned by the Far West Rand Dolomitic Water Association. Most of this land is currently underutilised. A study should be conducted to establish the productive potential of these farm portions with cognisance of the needs for urban expansion and conservation needs as well. Support of Rural Infrastructure Development, Access to Services and Sustainable Livelihoods The links between urban and rural areas are very important since they unlock latent economic and social opportunities by bringing dispersed economic and social functions together. The linkages within Merafong are better than in most other municipalities because of the well-developed road network. There are therefore no deep rural areas within Merafong. The need however always exists to improve on accessibility and interaction. This can be achieved in the following ways:
Improve more localized access links. Maintain and improve on existing infrastructure. Improve telecommunication penetration in the more remote areas. Develop service delivery centres at centralized points. Develop small markets at service delivery centre locations.
With regard to service delivery and infrastructure the municipality, the district and the province is to varying degrees responsible for the following:
1. providing basic services including administration, planning and evaluation, local roads, refuse and sewerage removal, water and sanitation, electricity, storm water drainage, housing, primary health services, protection and emergency services, security, transport, cemeteries, libraries and museums, and recreation facilities;
2. for rural development; i.e. interacting with the various parties involved, setting priorities for access to affordable services, infrastructure and local economic development;
3. identifying special local needs and applying to the relevant sources for the funds to meet them.
Draft IDP Document 2015/2016 Page 236
For the most part the municipality does not deliver services outside urban areas. The District Municipality, Gauteng Province and National Government are responsible for facilities like schools and clinics, roads, disaster management, etc.
Rural housing is quite a complex matter due to factors such as people living on land owned by others, communal land rights, viable locations for housing, the availability of services and access, the proximity of employment opportunities, etc. About 16% of rural households in Merafong do not live in formal housing structures. This should be brought under the attention of the National Department of Human Settlements and solutions sought with the assistance of the department.
Appropriate basic education Access to the national Qualifications Framework that will allow individuals to build on earlier
education and acquired skills and facilitate life-long learning Training for organisation, decision making and for involvement in local government and
other organisations Skills in planning, managing, monitoring and evaluating projects Information for effective decision making Facilitation and mediation skills Technical and entrepreneurial training in agriculture and income-earning activities Knowledge of appropriate technologies Financial and other support services Information on rights under the constitution and access to legal assistance Information on the conservation of the environment
The only remaining rural school in Merafong is Rooipoort Primary School. There is a Redora Primary School less than a kilometer outside of Merafong in Randfontein Municipality which also serves some pupils staying in the De Pan area in Merafong. There is also a primary school at Klipdrift less than 2 kilometers from the southern border of Merafong.
Social infrastructure. Social infrastructure plays a critical role in rural areas because of the marginalised nature of these areas. This includes the following:
Access to resourced clinics Sports and recreation facilities especially for women and youth development Rural libraries stocked with the appropriate books Rehabilitation and development of schools Community halls Skills training centres Support facilities for NGOs Mobile clinics
All of these facilities are accessible to rural people by traveling to urban areas. The rural population in Merafong is too dispersed to build dedicated rural facilities. Focus could rather be given to improving transport options for the inhabitants of rural areas. Job Creation Linked to Training and Capacity Building Rural development in Merafong should be based on the development of a vibrant agrarian production sector that includes the following:
Increased production which includes optimal and sustainable use of natural resources including land, grass, trees, water, etc.
Livestock farming with the associated beneficiation activities. Cropping with the associated beneficiation activities. The establishment and strengthening of rural livelihoods for vibrant LED. The use of appropriate technologies, modern approaches and knowledge systems.
Draft IDP Document 2015/2016 Page 237
There are several constraints on small scale farming and other entrepreneurial activities like a lack of funding, lack of skills and information, no access to land for farming and business, over centralization and competition with large companies, lack of access to markets, etc. Local Economic Development (LED) is very important and can be very effective in rural areas because it takes a self-selective approach where specific local opportunities are exploited.
A significant challenge is to clearly distinguish business development and social development. With the “project” approach to LED prevalent in South Africa, there tends to be a big confusion between economic and social objectives, and business and subsistence activities. One of the main problems is that promotion organisations are often not adequately organised.
Rural production, both agricultural and nonfarm, tends to involve rather complex value chains, both in terms of inputs and commercialisation. If critical elements of a value chain are weak or nonexistent, it will compromise the competitiveness of every business in the chain. Understanding value chains, analysing their bottlenecks and, together with businesses, defining measures to remedy the problems is an essential element of promoting rural entrepreneurship.
The lack of market access and over centralized markets are two of the major inhibitors to small scale farming development. Other economic activities apart from or in support of agrarian ones are important in order to diversify the rural economy. LED projects have to be identified in this regard.
The South African economy has entered a state where it is better at creating jobs for more skilled and educated labourers leaving unskilled and often semi-skilled workers marginalised. Agrarian based economic activities tend to be among the most labour intensive. There is however still room for increased labour intensity without compromising on efficiency and competitiveness. This is in the form of small scale farming in a cooperative manner. Smaller scale farming should be encouraged and opportunities created.
Sustainable Use of Natural Resources and Protection of the Environment Agrarian and other economic activities should make optimum use of natural resources without over exploiting them. In this regard a management plan for environmentally sustainable agrarian activities for Merafong should be considered in order to mitigate human impacts. By meeting basic human needs and creating economic opportunities the impact of poor rural dwellers on the environment will be greatly reduced. More environmentally sustainable farming practices like organic farming should be promoted, especially in LED projects. The relatively new practice of Agro ecology, where farmers use practices that are more in tune with nature can be used not only to reduce negative externalities but also to improve productivity. Good Governance It is important that the municipality recognise the principles of cooperative governance and the provisions of the Intergovernmental Relations Framework Act, 2005. Risks and Vulnerability Rural areas are vulnerable to droughts, floods, hail, heavy rainfall, strong wind gusts, violent thunderstorms, pests and disease. Large commercial farmers are more adaptable than smaller scale farmers. It is therefore necessary to implement mitigation and management plans that can take the form of:
An agricultural development management unit that provides assistance and information Disaster mitigation and management plans that go beyond geological risks and deal with
environmental disasters and how to minimise their effects. Good environmental management, agricultural and development practices also apply here
since the degradation of natural resources, specifically land degradation can exacerbate and even cause environmental disasters.
Draft IDP Document 2015/2016 Page 238
Safety and security are a precondition for social and economic development. The responsibility for the establishment of peace and harmony in the countryside lies with all citizens, but particularly with the local leadership. Elected councilors have a responsibility to the whole community. A community policing forum (CPF) should link up with every police station. In many urban areas, these have already become effective, breaking down suspicions and ensuring community involvement in policing. Other much needed improvements are a victim support programme, better information management, police training and motivation and improved infrastructure.
3. FACILITATE SUSTAINABLE ECONOMIC GROWTH AND DIVERSIFICATION
PO
LIC
Y
Facilitate the development of new economic drivers and the diversification of the economy and to revitalize stagnant economic activity nodes.
OU
TCO
MES
/
DES
IRED
STA
TE
A broader economic base consisting of a mix of mining, agriculture and manufacturing. A more diverse non-basic sector that absorbs local purchasing power. Accelerated economic growth in leading sectors that stimulates job creation. Provide for the needs of the informal economy and to facilitate harmonious co-existence with
the formal sector. A more developed economy will enlarge the tax base, which will in turn provide more capital for
municipal investment.
IMP
LEM
ENTA
TIO
N
STR
ATE
GIE
S
Enable industrial development through the provision of industrial land and infrastructure according to demand coupled with well researched incentives for investment. Develop an Industrial Development Strategy for Merafong to guide municipal actions in this regard.
Enable faster development and growth of the agricultural sector and its associated value chains. Target decaying areas within development nodes for urban renewal initiatives. Develop new strategic nodes with base economic potential in order to utilise their latent
potential. Continuously identify spatial threats and constraints to economic development and mitigate. Create an enabling environment for informal enterprises to thrive without adversely affecting
the formal sector.
GU
IDIN
G
PR
INC
IPLE
S
Enable non-basic economic expansion through land provision and Land Use Management. Designate more land for business and services expansion.
Economic development and job creation is of great importance and as such administrative processes related to Land Use Management, building plan assessment and property disposal should prioritise economic development activities.
PO
LIC
Y
ALI
GN
MEN
T
From the national and provincial primary policy synthesis: Grouping 1, 3, 4 and 5
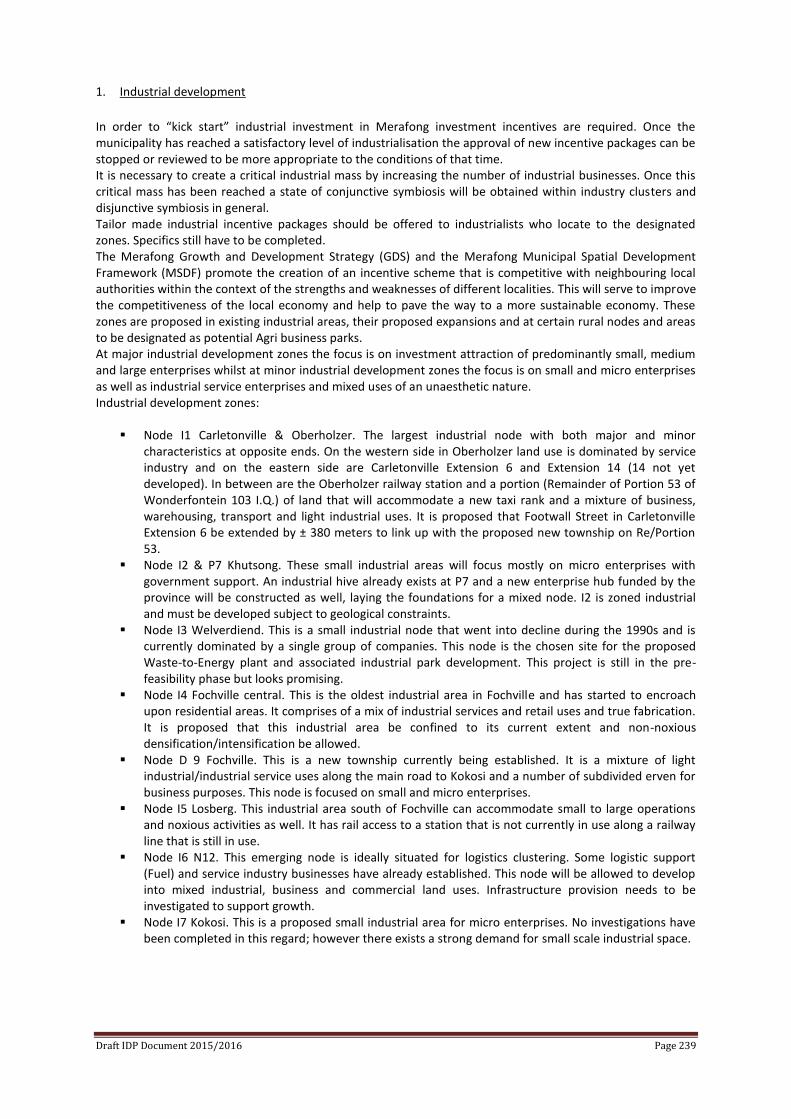
Draft IDP Document 2015/2016 Page 239
1. Industrial development
In order to “kick start” industrial investment in Merafong investment incentives are required. Once the municipality has reached a satisfactory level of industrialisation the approval of new incentive packages can be stopped or reviewed to be more appropriate to the conditions of that time. It is necessary to create a critical industrial mass by increasing the number of industrial businesses. Once this critical mass has been reached a state of conjunctive symbiosis will be obtained within industry clusters and disjunctive symbiosis in general. Tailor made industrial incentive packages should be offered to industrialists who locate to the designated zones. Specifics still have to be completed. The Merafong Growth and Development Strategy (GDS) and the Merafong Municipal Spatial Development Framework (MSDF) promote the creation of an incentive scheme that is competitive with neighbouring local authorities within the context of the strengths and weaknesses of different localities. This will serve to improve the competitiveness of the local economy and help to pave the way to a more sustainable economy. These zones are proposed in existing industrial areas, their proposed expansions and at certain rural nodes and areas to be designated as potential Agri business parks. At major industrial development zones the focus is on investment attraction of predominantly small, medium and large enterprises whilst at minor industrial development zones the focus is on small and micro enterprises as well as industrial service enterprises and mixed uses of an unaesthetic nature. Industrial development zones:
Node I1 Carletonville & Oberholzer. The largest industrial node with both major and minor characteristics at opposite ends. On the western side in Oberholzer land use is dominated by service industry and on the eastern side are Carletonville Extension 6 and Extension 14 (14 not yet developed). In between are the Oberholzer railway station and a portion (Remainder of Portion 53 of Wonderfontein 103 I.Q.) of land that will accommodate a new taxi rank and a mixture of business, warehousing, transport and light industrial uses. It is proposed that Footwall Street in Carletonville Extension 6 be extended by ± 380 meters to link up with the proposed new township on Re/Portion 53.
Node I2 & P7 Khutsong. These small industrial areas will focus mostly on micro enterprises with government support. An industrial hive already exists at P7 and a new enterprise hub funded by the province will be constructed as well, laying the foundations for a mixed node. I2 is zoned industrial and must be developed subject to geological constraints.
Node I3 Welverdiend. This is a small industrial node that went into decline during the 1990s and is currently dominated by a single group of companies. This node is the chosen site for the proposed Waste-to-Energy plant and associated industrial park development. This project is still in the pre-feasibility phase but looks promising.
Node I4 Fochville central. This is the oldest industrial area in Fochville and has started to encroach upon residential areas. It comprises of a mix of industrial services and retail uses and true fabrication. It is proposed that this industrial area be confined to its current extent and non-noxious densification/intensification be allowed.
Node D 9 Fochville. This is a new township currently being established. It is a mixture of light industrial/industrial service uses along the main road to Kokosi and a number of subdivided erven for business purposes. This node is focused on small and micro enterprises.
Node I5 Losberg. This industrial area south of Fochville can accommodate small to large operations and noxious activities as well. It has rail access to a station that is not currently in use along a railway line that is still in use.
Node I6 N12. This emerging node is ideally situated for logistics clustering. Some logistic support (Fuel) and service industry businesses have already established. This node will be allowed to develop into mixed industrial, business and commercial land uses. Infrastructure provision needs to be investigated to support growth.
Node I7 Kokosi. This is a proposed small industrial area for micro enterprises. No investigations have been completed in this regard; however there exists a strong demand for small scale industrial space.
Major industrial node
Minor industrial node
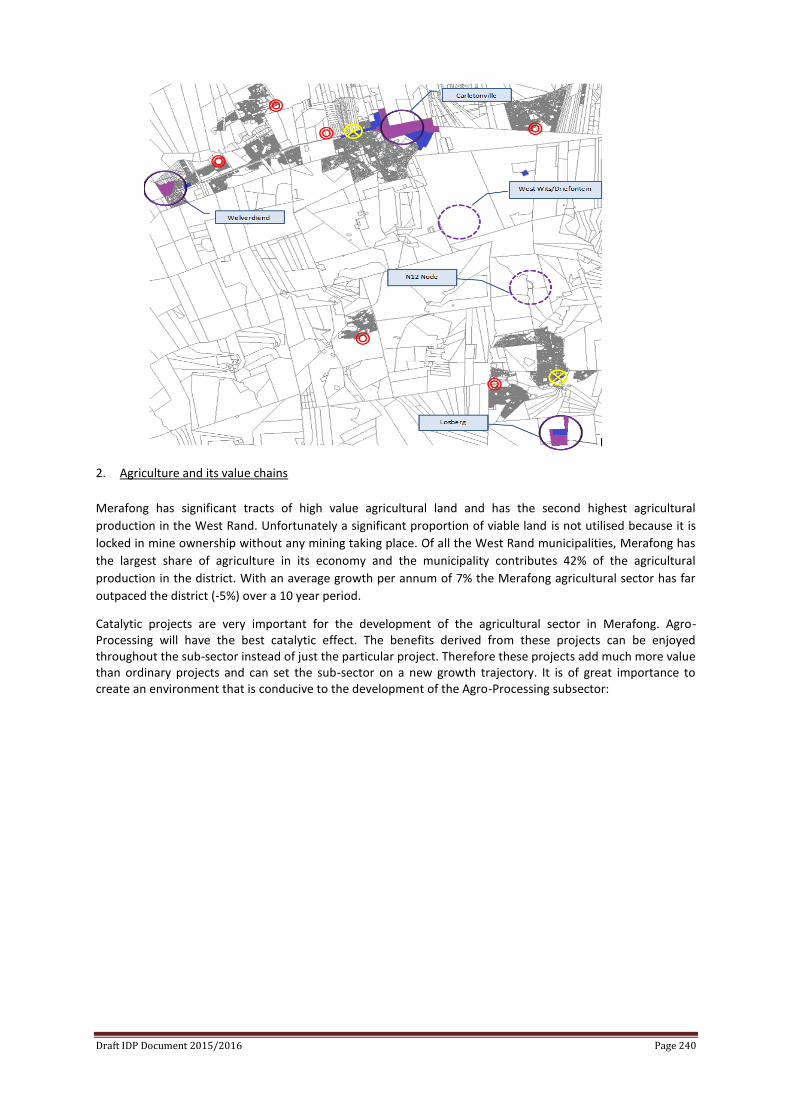
Draft IDP Document 2015/2016 Page 240
2. Agriculture and its value chains
Merafong has significant tracts of high value agricultural land and has the second highest agricultural
production in the West Rand. Unfortunately a significant proportion of viable land is not utilised because it is
locked in mine ownership without any mining taking place. Of all the West Rand municipalities, Merafong has
the largest share of agriculture in its economy and the municipality contributes 42% of the agricultural
production in the district. With an average growth per annum of 7% the Merafong agricultural sector has far
outpaced the district (-5%) over a 10 year period.
Catalytic projects are very important for the development of the agricultural sector in Merafong. Agro-Processing will have the best catalytic effect. The benefits derived from these projects can be enjoyed throughout the sub-sector instead of just the particular project. Therefore these projects add much more value than ordinary projects and can set the sub-sector on a new growth trajectory. It is of great importance to create an environment that is conducive to the development of the Agro-Processing subsector:
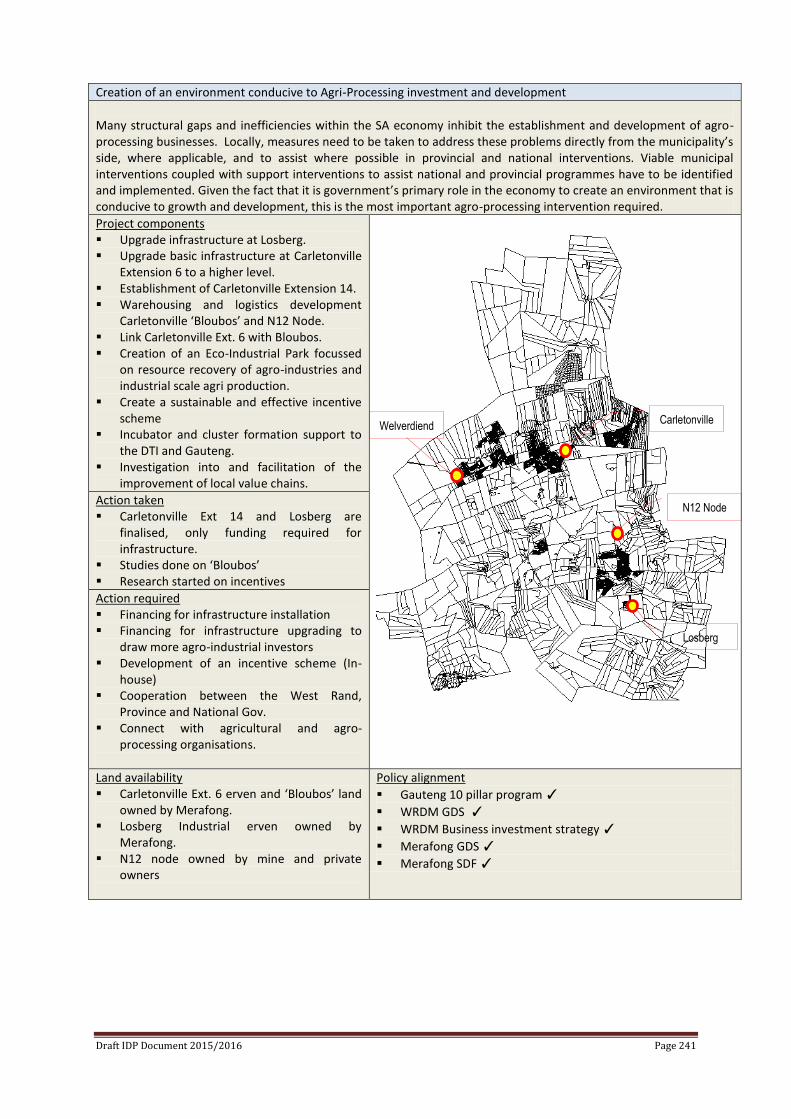
Draft IDP Document 2015/2016 Page 241
Creation of an environment conducive to Agri-Processing investment and development
Many structural gaps and inefficiencies within the SA economy inhibit the establishment and development of agro-processing businesses. Locally, measures need to be taken to address these problems directly from the municipality’s side, where applicable, and to assist where possible in provincial and national interventions. Viable municipal interventions coupled with support interventions to assist national and provincial programmes have to be identified and implemented. Given the fact that it is government’s primary role in the economy to create an environment that is conducive to growth and development, this is the most important agro-processing intervention required.
Project components Upgrade infrastructure at Losberg. Upgrade basic infrastructure at Carletonville
Extension 6 to a higher level. Establishment of Carletonville Extension 14. Warehousing and logistics development
Carletonville ‘Bloubos’ and N12 Node. Link Carletonville Ext. 6 with Bloubos. Creation of an Eco-Industrial Park focussed
on resource recovery of agro-industries and industrial scale agri production.
Create a sustainable and effective incentive scheme
Incubator and cluster formation support to the DTI and Gauteng.
Investigation into and facilitation of the improvement of local value chains.
Action taken Carletonville Ext 14 and Losberg are
finalised, only funding required for infrastructure.
Studies done on ‘Bloubos’ Research started on incentives
Action required Financing for infrastructure installation Financing for infrastructure upgrading to
draw more agro-industrial investors Development of an incentive scheme (In-
house) Cooperation between the West Rand,
Province and National Gov. Connect with agricultural and agro-
processing organisations.
Land availability Carletonville Ext. 6 erven and ‘Bloubos’ land
owned by Merafong. Losberg Industrial erven owned by
Merafong. N12 node owned by mine and private
owners
Policy alignment
Gauteng 10 pillar program ✓
WRDM GDS ✓
WRDM Business investment strategy ✓
Merafong GDS ✓
Merafong SDF ✓
Carletonville
Losberg
N12 Node
Welverdiend
Draft IDP Document 2015/2016 Page 242
3. Urban renewal and investment attraction
The local economy of Merafong is facing numerous challenges, some of what can be seen in most gold mining economies of South Africa. There is currently a trend of disinvestment in the mining sector which is having a negative effect on the rest of the economy due to over concentration in the mining sector. There are many problems faced by the towns of Merafong as in every other town and city in South Africa like high levels of poverty, unemployment, HIV/AIDS, social development, inequality, etc. These problems are however compounded by the structural disparities associated with a lack of economic diversity. Although some sectors have seen growth in recent years this growth has largely occurred of the mining base and some sectors are either stagnant or in decline. In order to turn around this trend investment in certain critical base sectors of the economy is required. Therefore Merafong Municipality has embarked on a process of turning Merafong into an investment friendly municipality. This document proposes several interventions to create an environment that is conducive to investment that will lead to job intensive economic growth. By doing a SWOT analysis the origins and symptoms of the problems as well as possible solutions become apparent. A SWOT analysis is a process where a problem is picked apart into different components. By asking what Strengths, Weaknesses, Opportunities and Threats are associated with the lack of investment in Merafong the following results were generated: Strengths
By far the biggest strength of Merafong in terms of investment is its location relative to the Gauteng City Region and its purchasing power. Merafong is close to the core region of Gauteng, however the cost of land and other production inputs is far less.
Merafong has large tracts of prime agricultural land. It should be mentioned that with regard to agri beneficiation a resource location is usually more profitable. Add to this the close proximity to large markets and the possibilities become numerous.
Land in Merafong is very cheap in comparison to most of Gauteng, for example industrial stands for sale by the municipality are available for six rand and twenty five rand per square meter in Losberg and Carletonville respectively.
The infrastructure capacity already exists to accommodate new investors in Merafong, e.g. serviced industrial erven, a dual carriageway to Johannesburg, operational rail infrastructure, etc.
A fledgling metal fabrication cluster already exists which provides agglomeration advantages to investors.
Weaknesses As mentioned the economy of Merafong is weakly diversified. In 2006 the Tress index value for
Merafong was calculated to be 88.9 which is extremely high. This degree of concentration makes the economy highly vulnerable to economic shocks and to change in general.
Merafong has a relatively small and shrinking consumer market which may deter certain investors. A weakness closely associated with the small consumer base is the loss of purchasing power to
surrounding cities like Potchefstroom, Soweto, Randfontein and Krugersdorp. The perceived risk of dolomite in the more economically active areas is greater than the actual risk.
Although some areas like the old parts of Khutsong are very risky, other areas like Carletonville are less risky, especially if the risks are managed. Additionally the costs of geological investigations are in many cases prohibitively expensive.
The appearance of the towns in Merafong is unaesthetic, due to factors associated with the municipality as well as the private sector. This has created a visual environment that is not conducive to investment attraction.
The availability of land and erven in existing towns is a very significant problem. Large tracts of land are controlled by the Far West Rand Dolomitic Water Association (FWRDWA) and a sizable proportion of erven are owned by mining companies who don’t seem interested in selling property. This inhibits investment because mining companies are generally not interested in property development and land owned by the FWRDWA lies unutilised.
A lack of management and enforcement has led to unfavourable conditions within the CBDs of Merafong. Most notably the infiltration of informal traders into unsuitable areas is causing problems. Although efforts have been made to address this problem it largely persists.
Slow response times and the beaurocracy of government also have the potential to scare off potential investors.
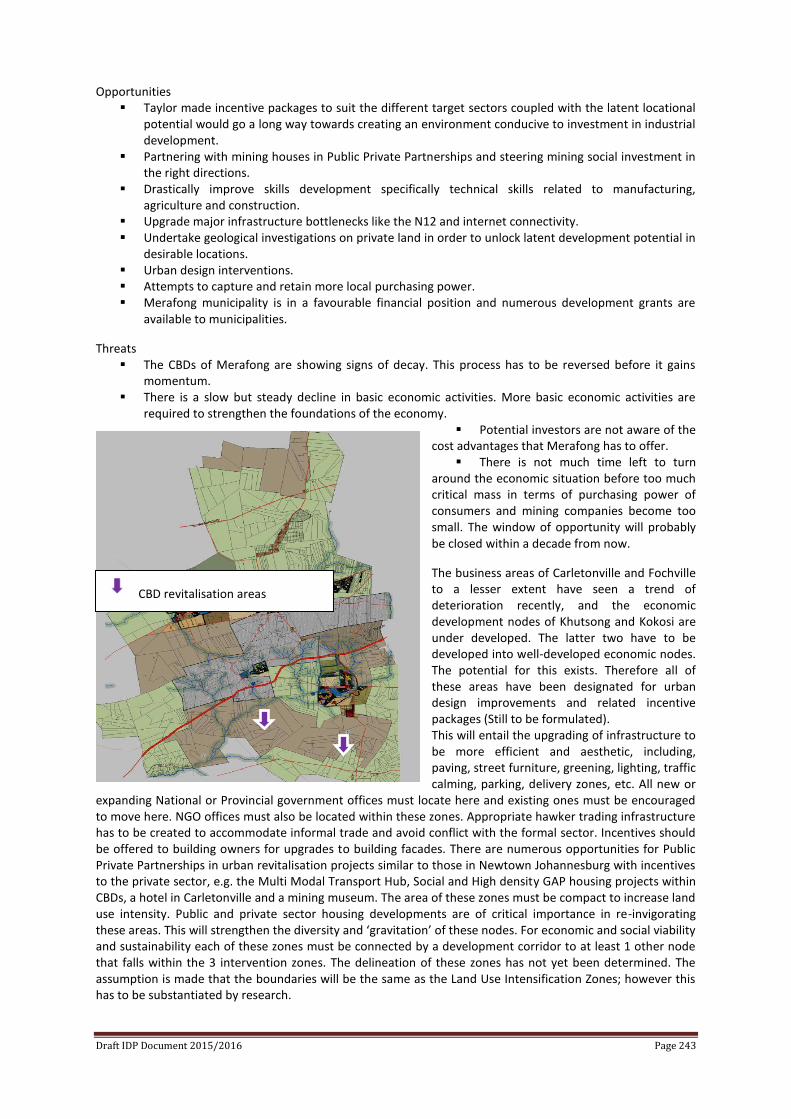
Draft IDP Document 2015/2016 Page 243
Opportunities Taylor made incentive packages to suit the different target sectors coupled with the latent locational
potential would go a long way towards creating an environment conducive to investment in industrial development.
Partnering with mining houses in Public Private Partnerships and steering mining social investment in the right directions.
Drastically improve skills development specifically technical skills related to manufacturing, agriculture and construction.
Upgrade major infrastructure bottlenecks like the N12 and internet connectivity. Undertake geological investigations on private land in order to unlock latent development potential in
desirable locations. Urban design interventions. Attempts to capture and retain more local purchasing power. Merafong municipality is in a favourable financial position and numerous development grants are
available to municipalities.
Threats The CBDs of Merafong are showing signs of decay. This process has to be reversed before it gains
momentum. There is a slow but steady decline in basic economic activities. More basic economic activities are
required to strengthen the foundations of the economy. Potential investors are not aware of the
cost advantages that Merafong has to offer. There is not much time left to turn
around the economic situation before too much critical mass in terms of purchasing power of consumers and mining companies become too small. The window of opportunity will probably be closed within a decade from now.
The business areas of Carletonville and Fochville to a lesser extent have seen a trend of deterioration recently, and the economic development nodes of Khutsong and Kokosi are under developed. The latter two have to be developed into well-developed economic nodes. The potential for this exists. Therefore all of these areas have been designated for urban design improvements and related incentive packages (Still to be formulated). This will entail the upgrading of infrastructure to be more efficient and aesthetic, including, paving, street furniture, greening, lighting, traffic calming, parking, delivery zones, etc. All new or
expanding National or Provincial government offices must locate here and existing ones must be encouraged to move here. NGO offices must also be located within these zones. Appropriate hawker trading infrastructure has to be created to accommodate informal trade and avoid conflict with the formal sector. Incentives should be offered to building owners for upgrades to building facades. There are numerous opportunities for Public Private Partnerships in urban revitalisation projects similar to those in Newtown Johannesburg with incentives to the private sector, e.g. the Multi Modal Transport Hub, Social and High density GAP housing projects within CBDs, a hotel in Carletonville and a mining museum. The area of these zones must be compact to increase land use intensity. Public and private sector housing developments are of critical importance in re-invigorating these areas. This will strengthen the diversity and ‘gravitation’ of these nodes. For economic and social viability and sustainability each of these zones must be connected by a development corridor to at least 1 other node that falls within the 3 intervention zones. The delineation of these zones has not yet been determined. The assumption is made that the boundaries will be the same as the Land Use Intensification Zones; however this has to be substantiated by research.
CBD revitalisation areas
Draft IDP Document 2015/2016 Page 244
Two primary areas of attention have been identified, namely the Carletonville CBD (Node CBD1) and the Fochville CBD (Node CBD 2). Node CBD 1 is the more important of the two and needs an intervention as soon as possible. The business audit that was conducted as part of the Merafong Growth and Development Strategy revealed that the city appearance is perceived as one of the factors contributing to an environment that is not conducive to the attraction and retention of business activities. The urban environment has a very significant impact on its residents on a physical, economic, social, cultural and psychological level. Furthermore the environmental quality of city spaces can have a big influence on aspects such as urban livability, crime, sense of community, aesthetics, etc. The quality of urban environments in Merafong City is a matter of concern and should be addressed. The urban regeneration will encompass all areas of cities and towns within Merafong City with varying degrees of intensity. Areas that need a lot of attention include the Central Business Districts (CBDs) and the previously disadvantaged townships. The following principles will be of importance:
Proposals and initiatives for creating a safe and secure environment in the urban areas. Accessibility with clear movement systems. Economic regeneration and growth of the urban areas. Diversification of land uses. Adaptive re-use of existing buildings and infrastructure, ensuring aesthetical urban upliftment. Proposals on the use of existing social facilities/amenities. Provision of employment opportunities for both formal and informal sector. The proposed nodal boundary delineation and definition of the urban areas. Optimal and suitable utilization of existing vacant land. Status quo analysis and provision of broad infrastructure implications of redevelopment and
investment. The basic design principles of sense of place, legibility, accessibility and sustainability, including
greening projects and development of parks. Geotechnical investigations and recommendations to the sustainability of developments. The proactive identification of hindrances and recommendations of mitigation measures in order to
realize the objective of the urban regeneration strategy. Infrastructure investment plan and funding model. Business plan development.
Regenerating the urban environment of Merafong City will have the following positive outcomes:
Economic integration. Improved economic diversity. Improved accessibility. Growth in tourism. Infrastructure development. Investment attraction. Better employment opportunities for the formal and informal sectors. More and better quality social facilities. Improved safety and security. Less wastage of resources. Improved economic, social and environmental sustainability. Better living environments for all. Lower ecological impact. Improved integration between urban and natural ecosystems. Better mitigation of disaster risks, geological and beyond. An improved sense of place and legibility
Erf 4698 Carletonville is a park in the Central Business District (CBD). It also forms part of a planned terminating vista (In urban design, a terminating vista is a building or monument that stands at the end or in the middle of a road, so that when one is looking up the street the view ends with the site). The site has an
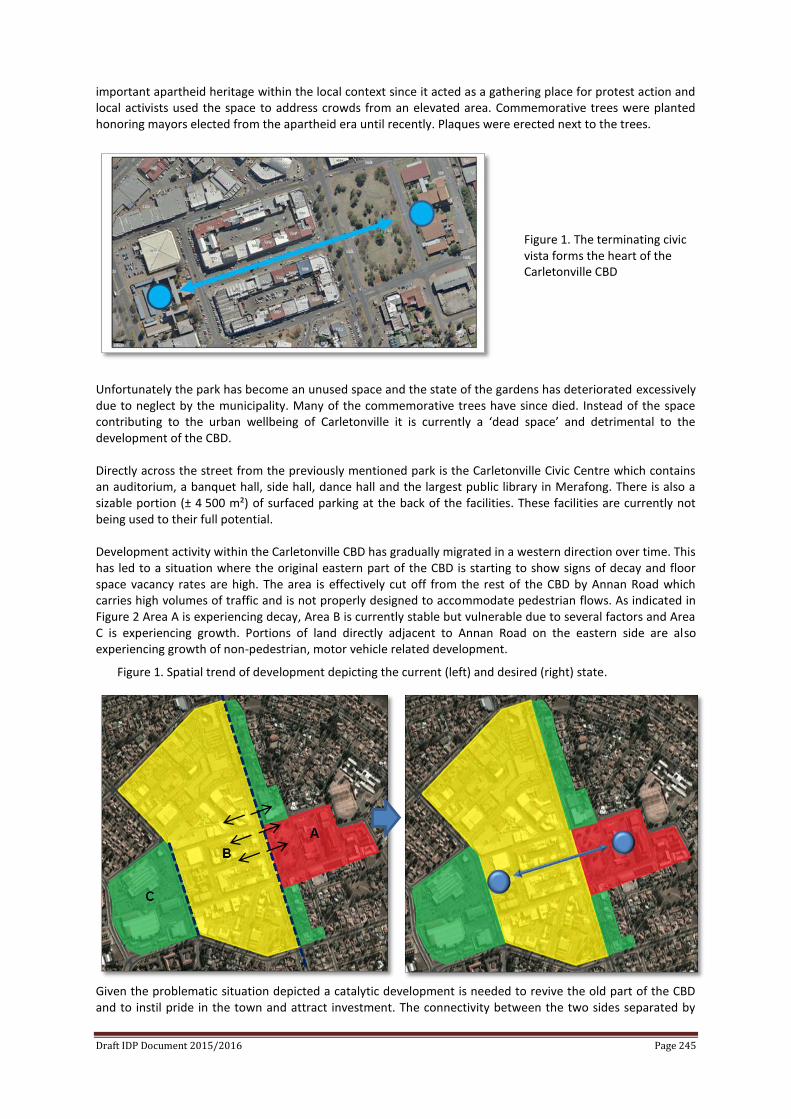
Draft IDP Document 2015/2016 Page 245
important apartheid heritage within the local context since it acted as a gathering place for protest action and local activists used the space to address crowds from an elevated area. Commemorative trees were planted honoring mayors elected from the apartheid era until recently. Plaques were erected next to the trees.
Unfortunately the park has become an unused space and the state of the gardens has deteriorated excessively due to neglect by the municipality. Many of the commemorative trees have since died. Instead of the space contributing to the urban wellbeing of Carletonville it is currently a ‘dead space’ and detrimental to the development of the CBD. Directly across the street from the previously mentioned park is the Carletonville Civic Centre which contains an auditorium, a banquet hall, side hall, dance hall and the largest public library in Merafong. There is also a sizable portion (± 4 500 m²) of surfaced parking at the back of the facilities. These facilities are currently not being used to their full potential. Development activity within the Carletonville CBD has gradually migrated in a western direction over time. This has led to a situation where the original eastern part of the CBD is starting to show signs of decay and floor space vacancy rates are high. The area is effectively cut off from the rest of the CBD by Annan Road which carries high volumes of traffic and is not properly designed to accommodate pedestrian flows. As indicated in Figure 2 Area A is experiencing decay, Area B is currently stable but vulnerable due to several factors and Area C is experiencing growth. Portions of land directly adjacent to Annan Road on the eastern side are also experiencing growth of non-pedestrian, motor vehicle related development.
Given the problematic situation depicted a catalytic development is needed to revive the old part of the CBD and to instil pride in the town and attract investment. The connectivity between the two sides separated by
Figure 1. The terminating civic vista forms the heart of the Carletonville CBD
Figure 1. Spatial trend of development depicting the current (left) and desired (right) state.
Draft IDP Document 2015/2016 Page 246
Annan road has to be improved and the entire area needs to be made more pedestrian friendly in order to draw in people. In order to improve the connectivity and pedestrianise the area it is proposed that the existing vista be strengthened. Terminating vistas are considered an important method of adding aesthetic appeal to a city/town, and to emphasise important structures or monuments. A significant development is required on the eastern side to act as an activity node where the vista terminates. An integrated mixed use development is proposed that utilises the existing strengths and opportunities of the area comprising of the following:
A. Convention centre
Re-purposed and rebranded civic centre offering more uses for the existing facilities. Many
corporate events related to mining and other types of business can be accommodated and given
the short distance from Johannesburg and O.R. Tambo International Airport major events could
also be hosted.
B. Hotel
Hotel built at the back of the convention centre. Currently no hotel exists within Merafong and
there are business tourism opportunities related to existing economic activities as well as the
proposed Convention Centre.
C. Heritage Square and vista
Public space with events infrastructure e.g. sunken amphitheatre
Heritage walk from the civic centre through Flint street to municipal head office – Themed: A
date line through history
Traffic calming at all street crossings
Tree lined walkway that strengthens the visual effect of the vista.
D. Mining heritage museum with theme park elements
Mining museum that celebrates mining history in Merafong and gold mining
Theme park elements in the form of an underground basement that simulates underground
mining and a mining train that offers rides. These theme park elements can boost the viability of
the museum because smaller museums tend to struggle if not boosted by additional attractions.
E. Niche retail/service and residential units
Niche market retail/service, partially associated with the museum, Convention Centre and
library.
Different sized sectional title residential units on the first floor above business, focused on
middle to higher income and younger market segments.

Draft IDP Document 2015/2016 Page 247
Proper feasibility studies are required, especially for the Convention Centre, Hotel and most of all the Mining Museum. 4. New strategic nodes
A number of strategic nodes have been identified that could be instrumental in unlocking latent economic
growth within the municipality. The following nodes have been identified:
- Bio energy eco-industrial Park. Located directly west of Welverdiend, this development has the potential to put Merafong on a new growth trajectory in the leading sectors of agro-processing, high value horticulture and the beef value chain. It will be based on resource recovery co-digestion to generate bio-energy.
- Khutsong South Business District. This future development will have the ability reach a development threshold large enough to draw in investment from the more established nodes and create significant employment.
- Carletonville Bloubos. This proposed development will have a massive positive impact on public transport in Merafong and will also create a link that integrates the Oberholzer and Carletonville industrial nodes and also better connects the Carletonville industrial node with the CBD. In addition to this new erven will become available for transport and logistics with rail access.
- N12 industrial and logistics node. This emerging node is Merafong’s best opportunity to capatalise on its strategic positioning within the GCR. A mine industry industrial park will be well located to serve the Gauteng, North West, Northern Cape and SADC mining regions.
- West Wits future node. This node will become important in the long term as a mixed use node. It will reinforce the restructuring efforts of the municipality and create a new centralised node for the mining belt, helping to integrate the most spatially disjunctive area in Merafong.
- Fochville Office Park future node. This potential node will have the ability to capatalise on the favourable conditions for the development of Quaternary Sector activities in Fochville and could accommodate Business Process Outsourcing activities.
Figure 3. Elements of the proposed development
A
E
D
C
B
C
Draft IDP Document 2015/2016 Page 248
- Kokosi Ext 7 mixed node. This future node will have the best ability to develop into a viable node to counter balance the Fochville CBD. Although it will be much smaller than the CBD it will draw in investment and create employment.
- Losberg expansion to heavy haul railway. Transnet plans to start upgrading the railway traversing the south of Merafong into a heavy haul railway line that links Gauteng with the Western Cape. This upgrade will enable massive savings on logistics costs and create huge opportunities for especially heavy industries which should be capatalised upon.
5. The informal sector
Informal trade should be considered as a positive economic activity as it contributes to the creation of jobs especially for people with little skills and has the potential to expand the municipality’s economic base. The informal sector includes employees, employers, self-employed people or family business workers who work for private sector enterprises with 20 or less employees and in enterprises that are not registered or incorporated and do not keep a set of accounts separate from the household budget. Informal Trading is defined as the economic activity undertaken by entrepreneurs who sell legal goods and services within a space deemed to be public property, within the informal sector. The implication is that informal trading management requires a public space management focus. The different types of informal trading that take place in Merafong are:
Street / kerbside trading
Markets (flea & craft markets as well as special markets, e.g. sector based)
Trading at transport interchanges
Trading in Public Open Spaces
Mobile Traders ·
Intersection Trading.
Special events Currently efforts by the municipality to control an facilitate the informal economy have been haphazard. A comprehensive informal economy strategy is required. The Gauteng Province will unveil its informal economy strategy which will give guidance on developing a local or West Rand strategy. The Spatial Planning Section has received a growing number of requests for land to be made available for NGOs, micro enterprises and especially churches. As the demand for such stands far exceeds the amount of stands normally provided in line with the National Integrated Human Settlement Guidelines for community purposes in the township layout stage, additional pressure is placed on Council to provide erven that currently do not exist. Therefore a process has been embarked on to create new erven available for social development through subdivisions, rezoning’s and new township proclamations. This could be considered the second phase of the identification process, thus completing the identification part of the endeavour to create an environment conducive to social development. Numerous applications have been received for the following land uses, for which there is not sufficient land/erven available:
Early Childhood Development Centres, crèches or places of child care Non-Government Organisations (NGOs)/ Community Based Organisations (CBOs) e.g frail care centre,
disabled centres Community gardens Government facilities Churches SMME’s Industrial hives and Micro enterprises.
Since the previous item focussed on the creation of Social Development Clusters, this item focuses primarily on churches, but also on spaces for micro enterprises, micro industrial enterprises and parks.
Draft IDP Document 2015/2016 Page 249
Provision for church erven Unlike business and most other institutional uses, churches function better and are more sustainable when situated in a scattered, non-centralised spatial pattern. Therefore land was sought in as many different localities as possible in areas of high demand. Unfortunately the supply of municipally owned land is limited and provision also has to be made for other land uses in order to improve the sustainability and viability of previously disadvantaged areas. The supply is further decreased by geotechnical constraints in the north as well as flood lines and topographical constraints in numerous areas. It is believed that the current high number of church institutions is unsustainable; however provision is made as far as possible with the knowledge that land uses can be changed as the land use market changes. All church erven will be zoned appropriately before being disposed of. The following minimum standards have been set for church erven:
Minimum erf size = 2 100 m² Parking = 1 per 10 seats (25m² per parking bay) Coverage = In terms of relevant scheme and 80% for Communities Development Act areas –
dependant on parking and external buildings provision. Provision of 30% coverage for external buildings. Furthermore all legislative and policy conditions have to be met.
Provision is made for 2 types of applicants. Firstly, churches that are able to purchase properties. These churches must have larger congregations in order to be able to afford the land. Erven will be made available at the standards discussed above. Secondly, churches that are not able to purchase properties. Communal areas will be made available for these institutions to rent spaces and erect marquis tents. Provision for micro enterprises This category includes non-noxious and non-intrusive micro enterprises. These types of businesses can benefit from being clustered together and consist of informal and formal enterprises. Providing spaces for these businesses to function in may help to formalise them and bring them into the main stream economy and create employment. Once the land has been identified it will be left to the discretion of the relevant social/economic development sections to determine how to manage these sites. It is proposed that demarcated ‘plots’ with minimal infrastructure such as basic service connections and fencing be made available for rent at minimal rates to pay only for running expenses. The design and layout has to be included in a Site Development Plan to be approved by the Spatial Planning & Environmental Management Section as well as the Fire department. As far as possible, centralised localities have been chosen and will be zoned appropriately. Provision for industrial micro enterprises This category includes more intrusive uses namely industrial and industrial service enterprises. These types of businesses can also be formal or informal and will benefit from being clustered together. Many neighbourhoods will also benefit from the removal of these activities from residential areas. Once the land has been identified it will be left to the discretion of the relevant social/economic development sections to determine how to manage these sites. It is proposed that demarcated ‘plots’ with minimal infrastructure such as basic service connections and fencing be made available for rent at minimal rates to pay only for running expenses. The design and layout has to be included in a Site Development Plan to be approved by the Spatial Planning & Environmental Management Section as well as the Fire department. Because these localities are not suitable for all types of noxious activities, new applications have to be approved by the Spatial Planning & Environmental Management Section.
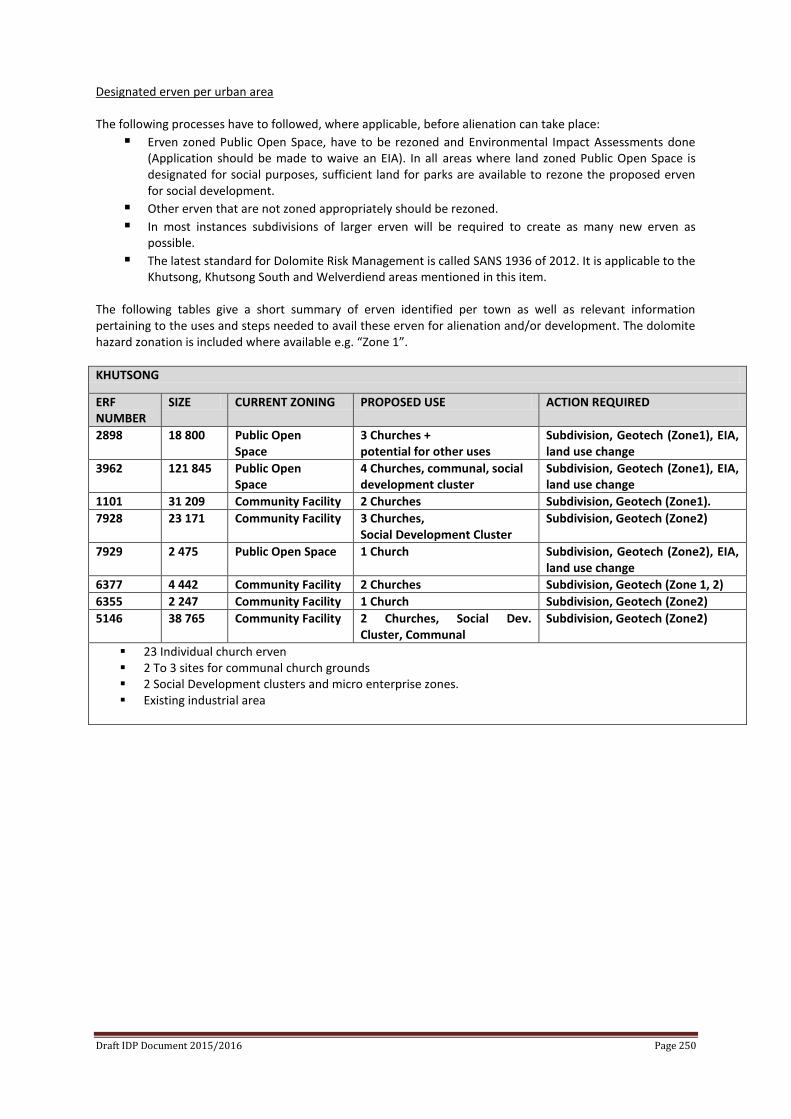
Draft IDP Document 2015/2016 Page 250
Designated erven per urban area The following processes have to followed, where applicable, before alienation can take place:
Erven zoned Public Open Space, have to be rezoned and Environmental Impact Assessments done (Application should be made to waive an EIA). In all areas where land zoned Public Open Space is designated for social purposes, sufficient land for parks are available to rezone the proposed erven for social development.
Other erven that are not zoned appropriately should be rezoned.
In most instances subdivisions of larger erven will be required to create as many new erven as possible.
The latest standard for Dolomite Risk Management is called SANS 1936 of 2012. It is applicable to the Khutsong, Khutsong South and Welverdiend areas mentioned in this item.
The following tables give a short summary of erven identified per town as well as relevant information pertaining to the uses and steps needed to avail these erven for alienation and/or development. The dolomite hazard zonation is included where available e.g. “Zone 1”.
KHUTSONG
ERF NUMBER
SIZE CURRENT ZONING PROPOSED USE ACTION REQUIRED
2898 18 800 Public Open Space
3 Churches + potential for other uses
Subdivision, Geotech (Zone1), EIA, land use change
3962 121 845 Public Open Space
4 Churches, communal, social development cluster
Subdivision, Geotech (Zone1), EIA, land use change
1101 31 209 Community Facility 2 Churches Subdivision, Geotech (Zone1).
7928 23 171 Community Facility 3 Churches, Social Development Cluster
Subdivision, Geotech (Zone2)
7929 2 475 Public Open Space 1 Church Subdivision, Geotech (Zone2), EIA, land use change
6377 4 442 Community Facility 2 Churches Subdivision, Geotech (Zone 1, 2)
6355 2 247 Community Facility 1 Church Subdivision, Geotech (Zone2)
5146 38 765 Community Facility 2 Churches, Social Dev. Cluster, Communal
Subdivision, Geotech (Zone2)
23 Individual church erven 2 To 3 sites for communal church grounds 2 Social Development clusters and micro enterprise zones. Existing industrial area
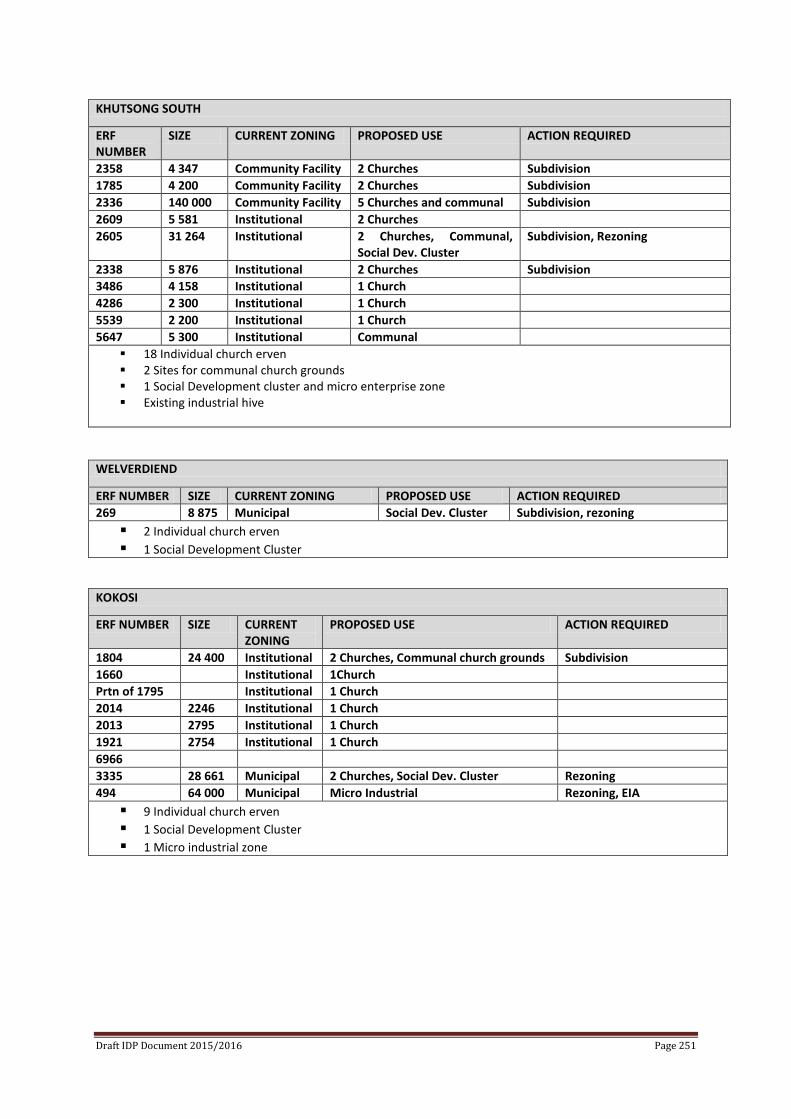
Draft IDP Document 2015/2016 Page 251
KHUTSONG SOUTH
ERF NUMBER
SIZE CURRENT ZONING PROPOSED USE ACTION REQUIRED
2358 4 347 Community Facility 2 Churches Subdivision
1785 4 200 Community Facility 2 Churches Subdivision
2336 140 000 Community Facility 5 Churches and communal Subdivision
2609 5 581 Institutional 2 Churches
2605 31 264 Institutional 2 Churches, Communal, Social Dev. Cluster
Subdivision, Rezoning
2338 5 876 Institutional 2 Churches Subdivision
3486 4 158 Institutional 1 Church
4286 2 300 Institutional 1 Church
5539 2 200 Institutional 1 Church
5647 5 300 Institutional Communal
18 Individual church erven 2 Sites for communal church grounds 1 Social Development cluster and micro enterprise zone Existing industrial hive
WELVERDIEND
ERF NUMBER SIZE CURRENT ZONING PROPOSED USE ACTION REQUIRED
269 8 875 Municipal Social Dev. Cluster Subdivision, rezoning
2 Individual church erven
1 Social Development Cluster
KOKOSI
ERF NUMBER SIZE CURRENT ZONING
PROPOSED USE ACTION REQUIRED
1804 24 400 Institutional 2 Churches, Communal church grounds Subdivision
1660 Institutional 1Church
Prtn of 1795 Institutional 1 Church
2014 2246 Institutional 1 Church
2013 2795 Institutional 1 Church
1921 2754 Institutional 1 Church
6966
3335 28 661 Municipal 2 Churches, Social Dev. Cluster Rezoning
494 64 000 Municipal Micro Industrial Rezoning, EIA
9 Individual church erven
1 Social Development Cluster
1 Micro industrial zone
Draft IDP Document 2015/2016 Page 252
WEDELA
ERF NUMBER
SIZE CURRENT ZONING
PROPOSED USE ACTION REQUIRED
3576 11 000 Community Facility
2 Churches and communal Donation (Anglo), subdivision
3005 3400 Community Facility
Church
3004 50 750 Community Facility
Donation (GP),
186 16 973 Community Facility
2 Churches Donation (Anglo), subdivision
1726 2 985 Community Facility
Micro Enterpr. Zone Rezoning, subdivision
5 Churches
1 Micro Enterprise zone
1 Communal church grounds
Existing industrial hive to be expanded
4. PROTECT NATURAL AND AGRICULTURAL RESOURCES
PO
LIC
Y
To protect and actively manage the natural environmental resources in Merafong in order to ensure a sustainable coexistence between urban, mining, agricultural and ecological land uses.
OU
TCO
MES
/
DES
IRED
STA
TE Sustainable development that will keep resources intact for future generations.
Urban and rural land uses and systems that will be resilient in the face of climate change.
GU
IDIN
G P
RIN
CIP
LES Protect and enable ecosystem services in urban and rural areas.
Actively expand green infrastructure for ecological, economic and social purposes. Minimise environmental impacts of developments. Mitigate impacts of local activities on neighbouring areas. Mitigate and manage impacts caused by climate change Urban pollution, especially storm water pollution, should be minimised. Mining pollution should be addressed. Improve on unsustainable farming practices near previously disadvantaged areas.
PO
LIC
Y
ALI
GN
MEN
T From the national and provincial primary policy synthesis: Grouping 2, 3 and 5
In most cases the protection of strategic resources are grouped into separate areas of concern like environmental, economic, cultural, etc. There is however a worldwide movement towards the integrated management of strategic resources in order to recognise and manage the interrelated nature of different resources so that the status alteration of a specific resource does not adversely affect the status of another resource. This trend is clearly reflected in South African environmental legislation. The protection of strategic resources is interlinked with all the other development strategies and is affected by them and it also affects them on various levels. Merafong lacks proper policy guidelines regarding its strategic resources which need to be addressed. A state of the environment report will be compiled, which will address environmental issues. One aspect of environmental management that has of yet not received enough attention is the encroachment of alien vegetation in Merafong. If this problem is not addressed soon it will become a very costly issue and will have the ability to cause irreparable damage to the environment.
Draft IDP Document 2015/2016 Page 253
Water There are several forms of pollution present in the rivers and streams of Merafong such as Nitrites, Nitrates, Ammonium, Phosphates, heavy metals and sulphates. Nitrogen based pollution is clearly evident in the Loopspruit by the green colour of water down stream of Klipdrift dam. Most pollutants are invisible to the eye, however their effects can be seen downstream. In addition to sometimes careless mining practices of the past, urban areas and bad farming practices contribute significantly to pollution. The Mooirivier system is already under a lot of strain and reducing pollution from urban areas will relieve pressure on the Mooirivier. Although National Government is working on solutions for acid mine drainage problems, there are measures that can be implemented to reduce nitrogen based pollution and turbidity as well as mine tailings material in rivers and streams: 1. The creation of storm water retention ponds at stretegic localities will cause suspended particals from
tailings storage facilities to subside and can then be cleaned out at certain intervals.
2. Urban and even agricultural runoff can be treated effectively with bio swales. A bio swale is basically a
vegetated storm water canal. The bio swale is a low-gradient, open channel possessing a dense cover of
vegetation through which all surface runoff is directed. The bio swale decreases the speed of flows, acts
as a stormwater retention facility, and allows suspended solids to settle out. Aboveground plant parts
filter particulates and their associated pollutants as runoff passes slowly and evenly through the channel.
The pollutants are then incorporated into the soil where they may be immobilized and/or decomposed by
plants and microbes. The bio swale is considered a creative means of controlling runoff, and has the
potential to improve water quality, mitigate wetland loss, provide flood containment, and improve the
aesthetics of an area. As such, the bio swale has hydrological, chemical, biological, aesthetic and
economic functions. Storm water runoff contributes pollutants to streams and rivers. Studies have shown
that as much as 70% of the pollution in streams, rivers and lakes has been carried there by storm water.
Pesticides, herbicides, and fertilizers come from residential lawns, commercial landscaping, and
recreational facilities like golf courses. There can be residuals that leach from land that was once
farmland. Heavy metals come from vehicles, buildings, roofs, and industrial sites. Oil and grease drip
regularly from cars onto streets, parking lots, and are occasionally dumped into storm drains by residents
performing maintenance on vehicles and equipment as well as industrial dumping. Pathogens and
bacteria in runoff can come from pet waste, broken or leaking sewers, rats, birds, or sewer overflows as
well as industrial effluent from food processing. Bio swales can remove and immobilize or break down a
large portion of pollutants found in storm water runoff. Bio swales have achieved high levels of removal
of suspended solids (TSS), turbidity, oil and grease. They can also remove large amounts of metals and
nutrients in runoff. Obtainable reductions of pollutants in bio swales are:
Total Suspended Solids – 83 to 92% Turbidity– ±7% reduction per 1 minute contact (residence) Lead – 67% Copper – 46% Total Phosphorus – 29 to 80% Aluminium – 63% Total Zinc - 63% Dissolved Zinc – 30% Oil/Grease – 75% Nitrate-N – 39 to 89% Solid waste, e.g. litter- up to 100%
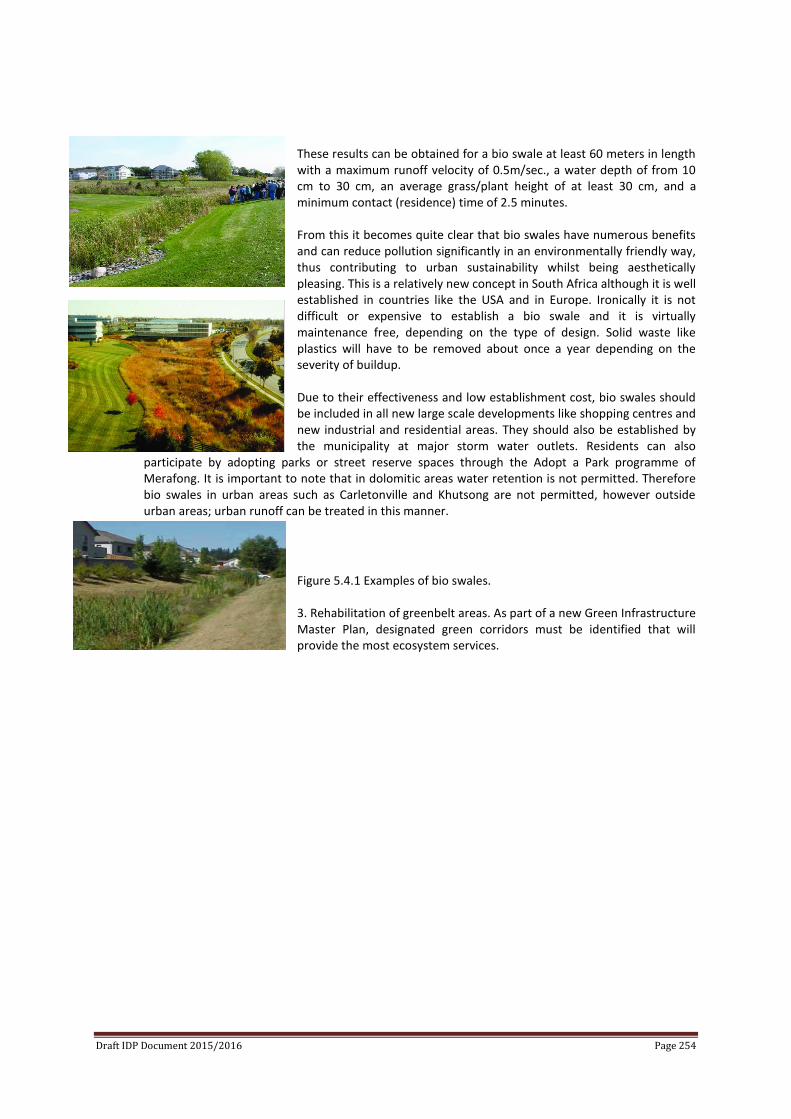
Draft IDP Document 2015/2016 Page 254
These results can be obtained for a bio swale at least 60 meters in length with a maximum runoff velocity of 0.5m/sec., a water depth of from 10 cm to 30 cm, an average grass/plant height of at least 30 cm, and a minimum contact (residence) time of 2.5 minutes. From this it becomes quite clear that bio swales have numerous benefits and can reduce pollution significantly in an environmentally friendly way, thus contributing to urban sustainability whilst being aesthetically pleasing. This is a relatively new concept in South Africa although it is well established in countries like the USA and in Europe. Ironically it is not difficult or expensive to establish a bio swale and it is virtually maintenance free, depending on the type of design. Solid waste like plastics will have to be removed about once a year depending on the severity of buildup. Due to their effectiveness and low establishment cost, bio swales should be included in all new large scale developments like shopping centres and new industrial and residential areas. They should also be established by the municipality at major storm water outlets. Residents can also
participate by adopting parks or street reserve spaces through the Adopt a Park programme of Merafong. It is important to note that in dolomitic areas water retention is not permitted. Therefore bio swales in urban areas such as Carletonville and Khutsong are not permitted, however outside urban areas; urban runoff can be treated in this manner.
Figure 5.4.1 Examples of bio swales. 3. Rehabilitation of greenbelt areas. As part of a new Green Infrastructure Master Plan, designated green corridors must be identified that will provide the most ecosystem services.
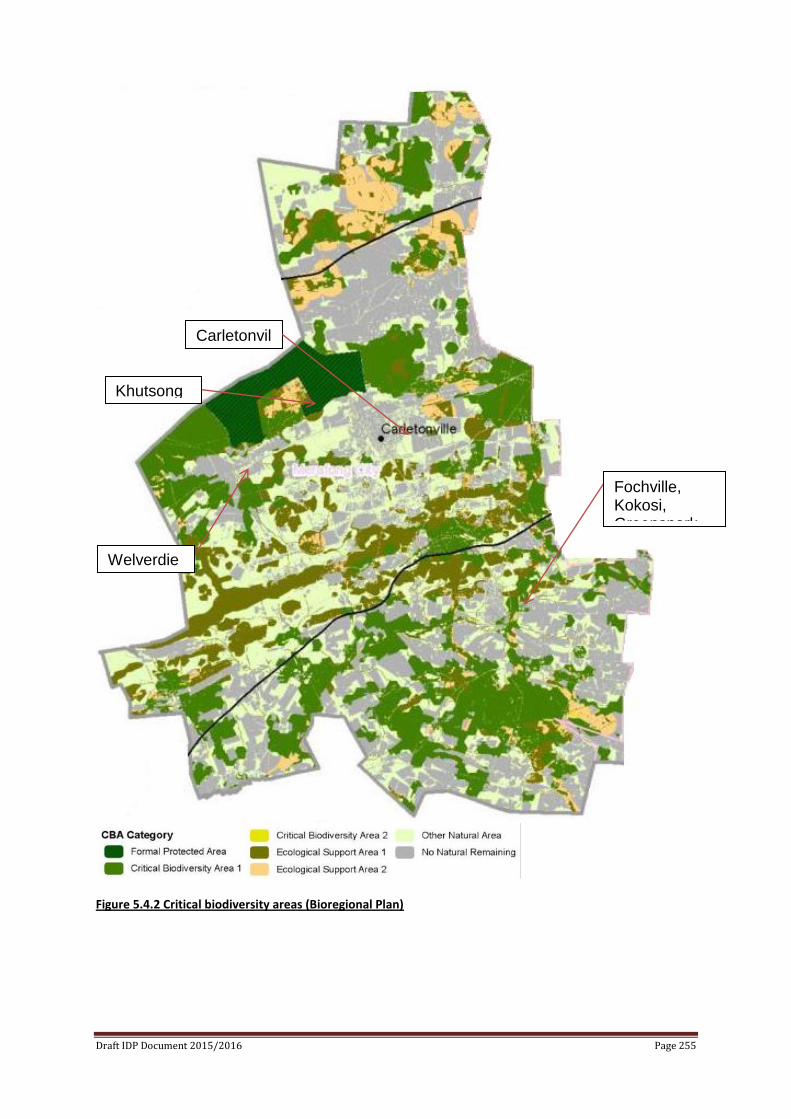
Draft IDP Document 2015/2016 Page 255
Figure 5.4.2 Critical biodiversity areas (Bioregional Plan)
Carletonville
Fochville, Kokosi, Greenspark
Khutsong
Welverdiend
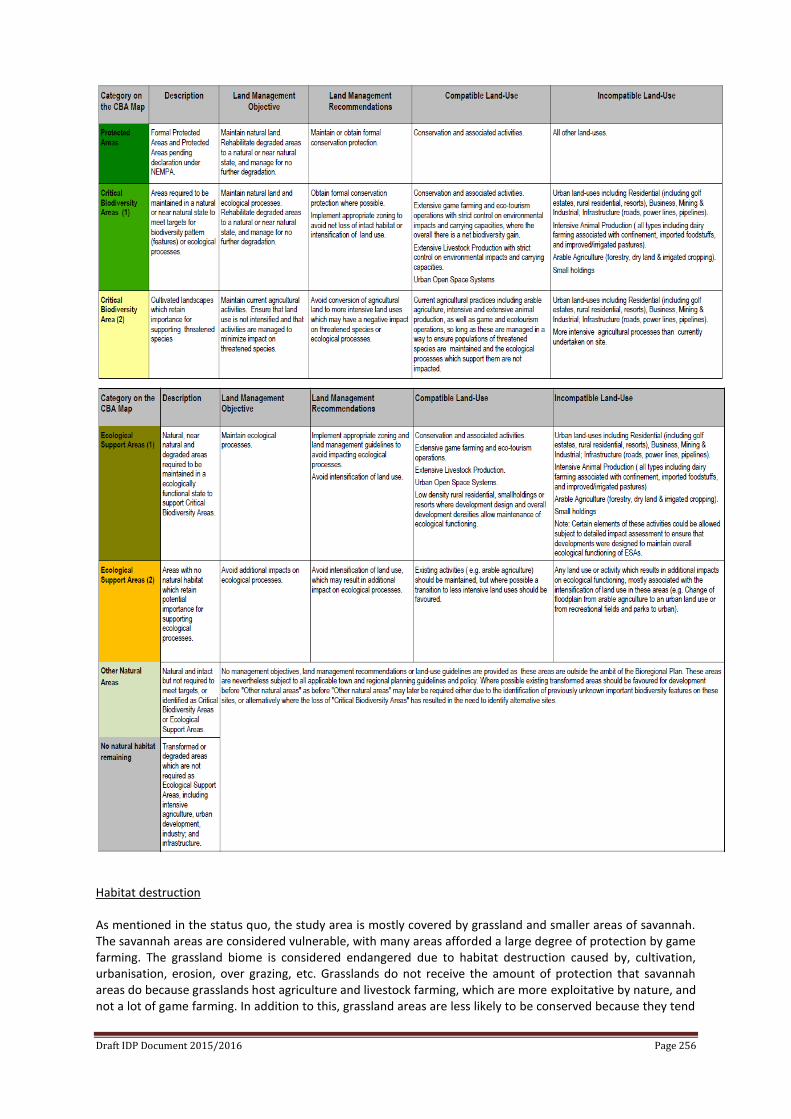
Draft IDP Document 2015/2016 Page 256
Habitat destruction As mentioned in the status quo, the study area is mostly covered by grassland and smaller areas of savannah. The savannah areas are considered vulnerable, with many areas afforded a large degree of protection by game farming. The grassland biome is considered endangered due to habitat destruction caused by, cultivation, urbanisation, erosion, over grazing, etc. Grasslands do not receive the amount of protection that savannah areas do because grasslands host agriculture and livestock farming, which are more exploitative by nature, and not a lot of game farming. In addition to this, grassland areas are less likely to be conserved because they tend
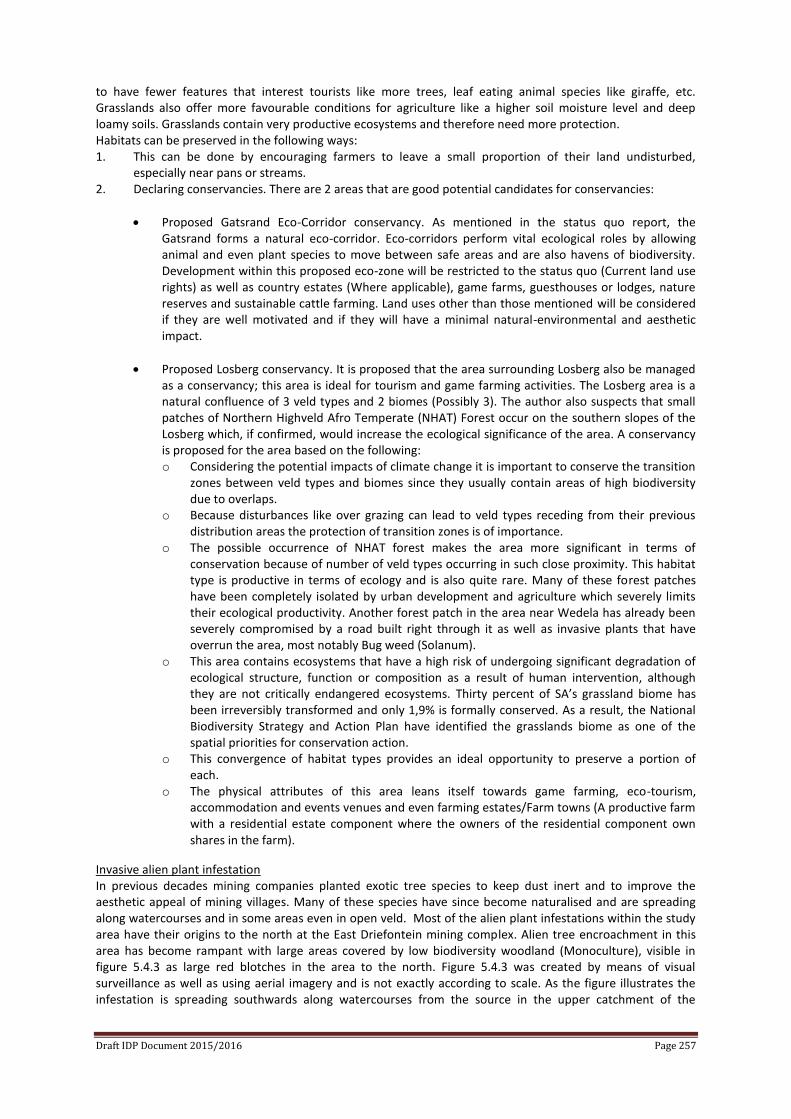
Draft IDP Document 2015/2016 Page 257
to have fewer features that interest tourists like more trees, leaf eating animal species like giraffe, etc. Grasslands also offer more favourable conditions for agriculture like a higher soil moisture level and deep loamy soils. Grasslands contain very productive ecosystems and therefore need more protection. Habitats can be preserved in the following ways: 1. This can be done by encouraging farmers to leave a small proportion of their land undisturbed,
especially near pans or streams. 2. Declaring conservancies. There are 2 areas that are good potential candidates for conservancies:
Proposed Gatsrand Eco-Corridor conservancy. As mentioned in the status quo report, the Gatsrand forms a natural eco-corridor. Eco-corridors perform vital ecological roles by allowing animal and even plant species to move between safe areas and are also havens of biodiversity. Development within this proposed eco-zone will be restricted to the status quo (Current land use rights) as well as country estates (Where applicable), game farms, guesthouses or lodges, nature reserves and sustainable cattle farming. Land uses other than those mentioned will be considered if they are well motivated and if they will have a minimal natural-environmental and aesthetic impact.
Proposed Losberg conservancy. It is proposed that the area surrounding Losberg also be managed as a conservancy; this area is ideal for tourism and game farming activities. The Losberg area is a natural confluence of 3 veld types and 2 biomes (Possibly 3). The author also suspects that small patches of Northern Highveld Afro Temperate (NHAT) Forest occur on the southern slopes of the Losberg which, if confirmed, would increase the ecological significance of the area. A conservancy is proposed for the area based on the following: o Considering the potential impacts of climate change it is important to conserve the transition
zones between veld types and biomes since they usually contain areas of high biodiversity due to overlaps.
o Because disturbances like over grazing can lead to veld types receding from their previous distribution areas the protection of transition zones is of importance.
o The possible occurrence of NHAT forest makes the area more significant in terms of conservation because of number of veld types occurring in such close proximity. This habitat type is productive in terms of ecology and is also quite rare. Many of these forest patches have been completely isolated by urban development and agriculture which severely limits their ecological productivity. Another forest patch in the area near Wedela has already been severely compromised by a road built right through it as well as invasive plants that have overrun the area, most notably Bug weed (Solanum).
o This area contains ecosystems that have a high risk of undergoing significant degradation of ecological structure, function or composition as a result of human intervention, although they are not critically endangered ecosystems. Thirty percent of SA’s grassland biome has been irreversibly transformed and only 1,9% is formally conserved. As a result, the National Biodiversity Strategy and Action Plan have identified the grasslands biome as one of the spatial priorities for conservation action.
o This convergence of habitat types provides an ideal opportunity to preserve a portion of each.
o The physical attributes of this area leans itself towards game farming, eco-tourism, accommodation and events venues and even farming estates/Farm towns (A productive farm with a residential estate component where the owners of the residential component own shares in the farm).
Invasive alien plant infestation In previous decades mining companies planted exotic tree species to keep dust inert and to improve the aesthetic appeal of mining villages. Many of these species have since become naturalised and are spreading along watercourses and in some areas even in open veld. Most of the alien plant infestations within the study area have their origins to the north at the East Driefontein mining complex. Alien tree encroachment in this area has become rampant with large areas covered by low biodiversity woodland (Monoculture), visible in figure 5.4.3 as large red blotches in the area to the north. Figure 5.4.3 was created by means of visual surveillance as well as using aerial imagery and is not exactly according to scale. As the figure illustrates the infestation is spreading southwards along watercourses from the source in the upper catchment of the
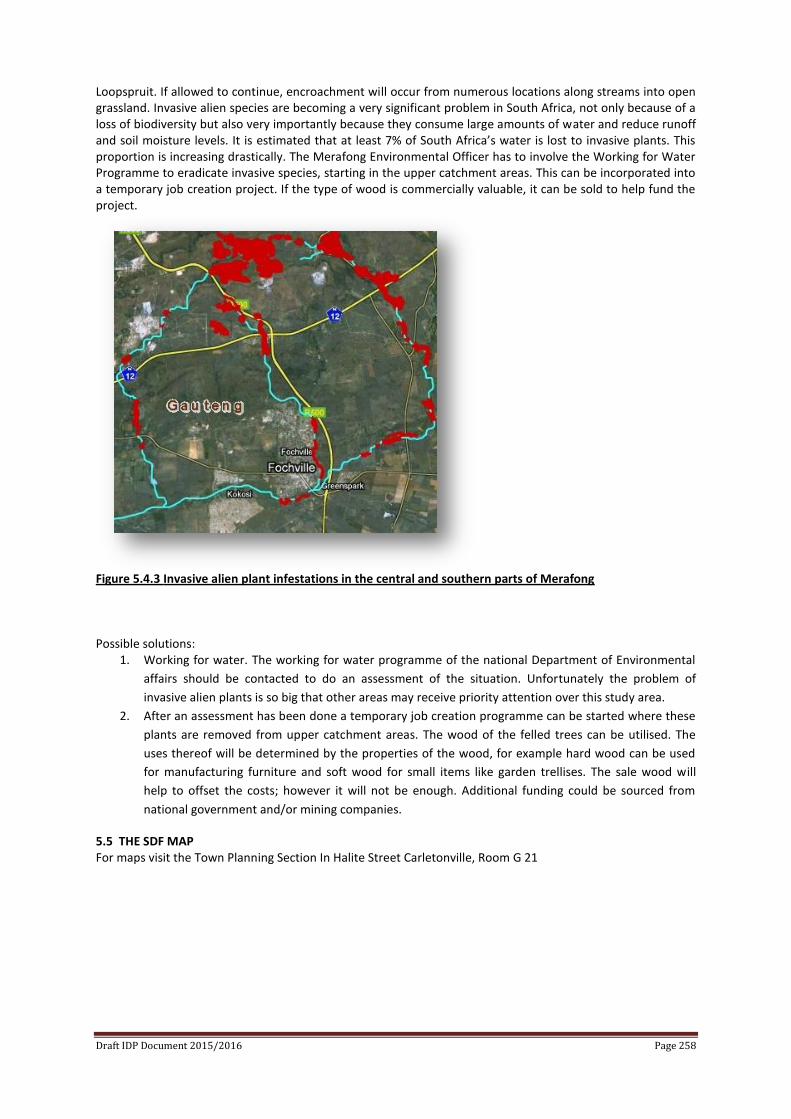
Draft IDP Document 2015/2016 Page 258
Loopspruit. If allowed to continue, encroachment will occur from numerous locations along streams into open grassland. Invasive alien species are becoming a very significant problem in South Africa, not only because of a loss of biodiversity but also very importantly because they consume large amounts of water and reduce runoff and soil moisture levels. It is estimated that at least 7% of South Africa’s water is lost to invasive plants. This proportion is increasing drastically. The Merafong Environmental Officer has to involve the Working for Water Programme to eradicate invasive species, starting in the upper catchment areas. This can be incorporated into a temporary job creation project. If the type of wood is commercially valuable, it can be sold to help fund the project.
Figure 5.4.3 Invasive alien plant infestations in the central and southern parts of Merafong Possible solutions:
1. Working for water. The working for water programme of the national Department of Environmental
affairs should be contacted to do an assessment of the situation. Unfortunately the problem of
invasive alien plants is so big that other areas may receive priority attention over this study area.
2. After an assessment has been done a temporary job creation programme can be started where these
plants are removed from upper catchment areas. The wood of the felled trees can be utilised. The
uses thereof will be determined by the properties of the wood, for example hard wood can be used
for manufacturing furniture and soft wood for small items like garden trellises. The sale wood will
help to offset the costs; however it will not be enough. Additional funding could be sourced from
national government and/or mining companies.
5.5 THE SDF MAP For maps visit the Town Planning Section In Halite Street Carletonville, Room G 21
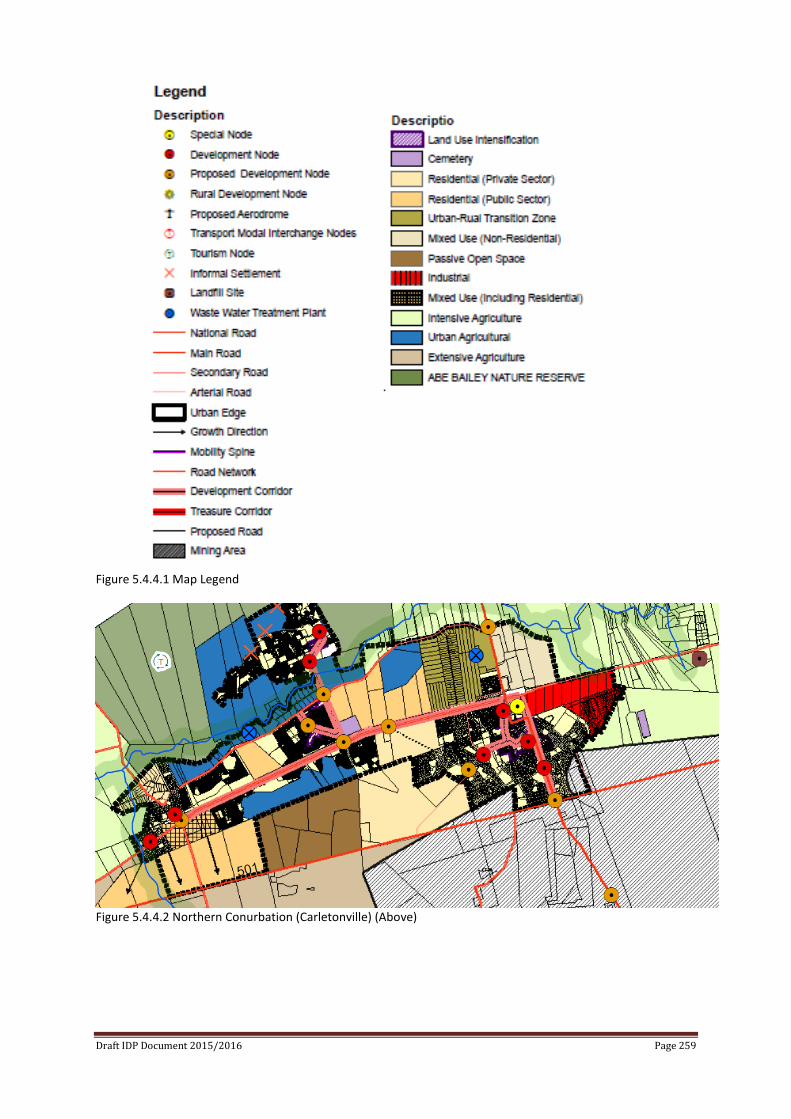
Draft IDP Document 2015/2016 Page 259
Figure 5.4.4.1 Map Legend
Figure 5.4.4.2 Northern Conurbation (Carletonville) (Above)
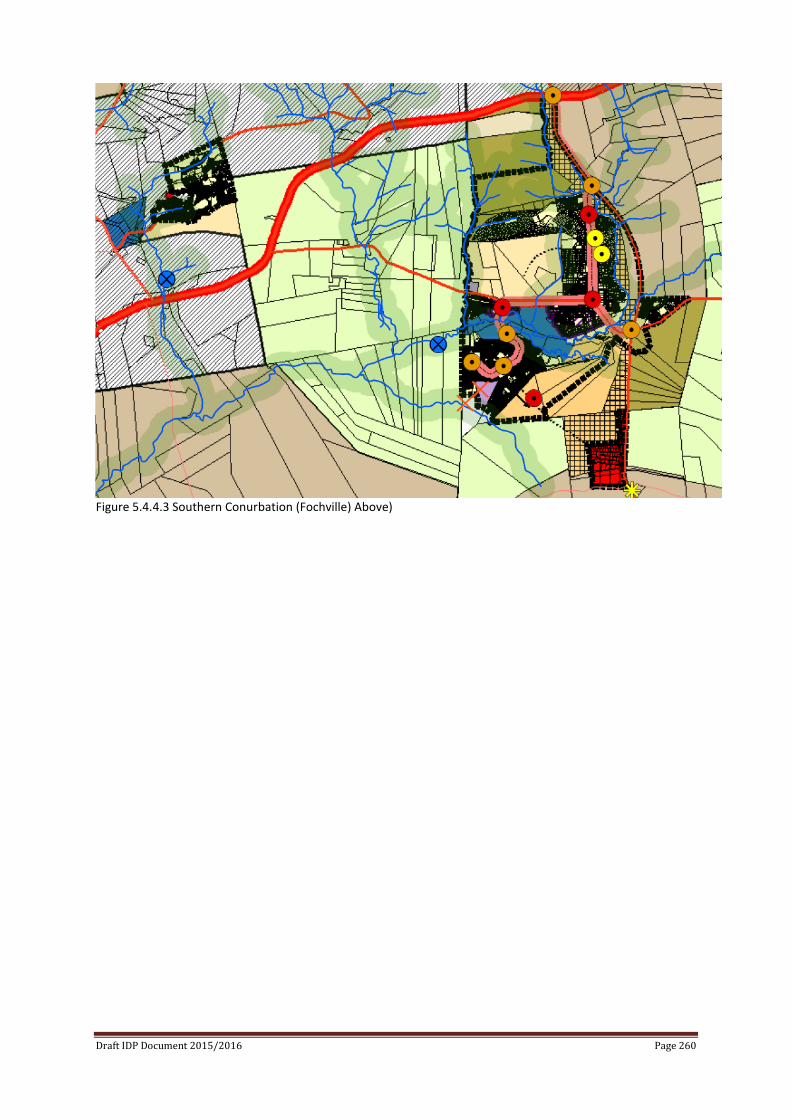
Draft IDP Document 2015/2016 Page 260
Figure 5.4.4.3 Southern Conurbation (Fochville) Above)
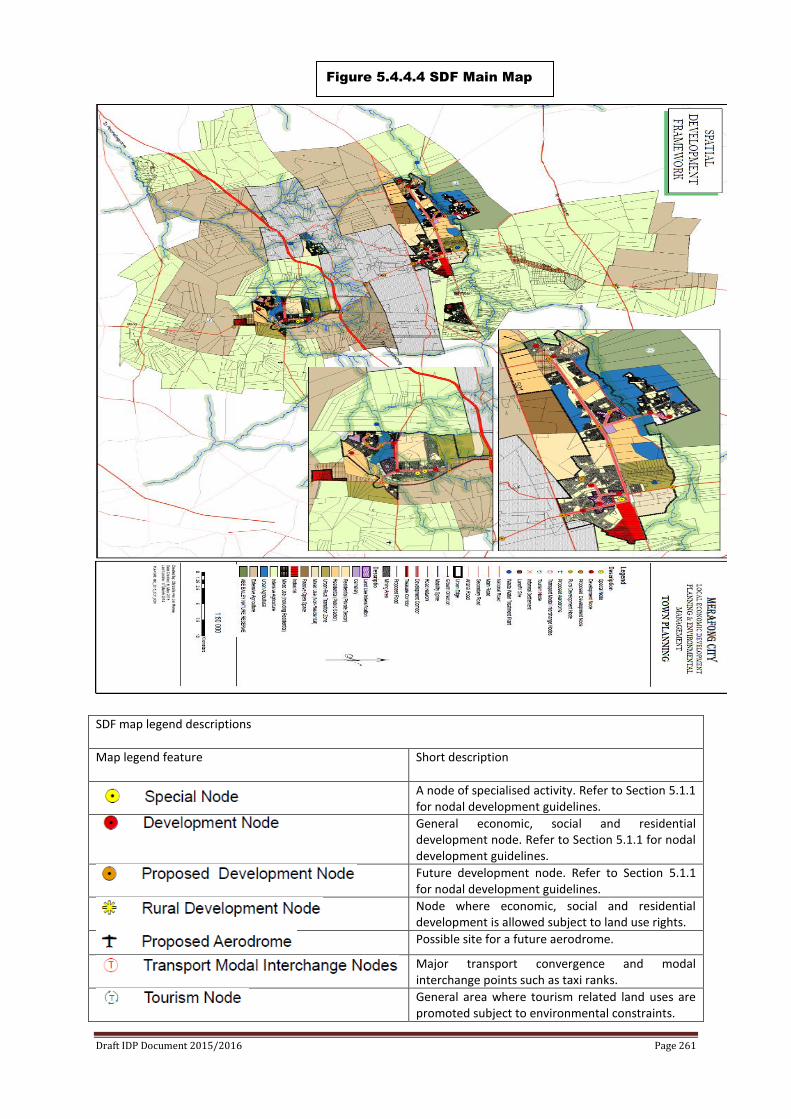
Draft IDP Document 2015/2016 Page 261
SDF map legend descriptions
Map legend feature
Short description
A node of specialised activity. Refer to Section 5.1.1 for nodal development guidelines.
General economic, social and residential development node. Refer to Section 5.1.1 for nodal development guidelines.
Future development node. Refer to Section 5.1.1 for nodal development guidelines.
Node where economic, social and residential development is allowed subject to land use rights.
Possible site for a future aerodrome.
Major transport convergence and modal interchange points such as taxi ranks.
General area where tourism related land uses are promoted subject to environmental constraints.
Figure 5.4.4.4 SDF Main Map
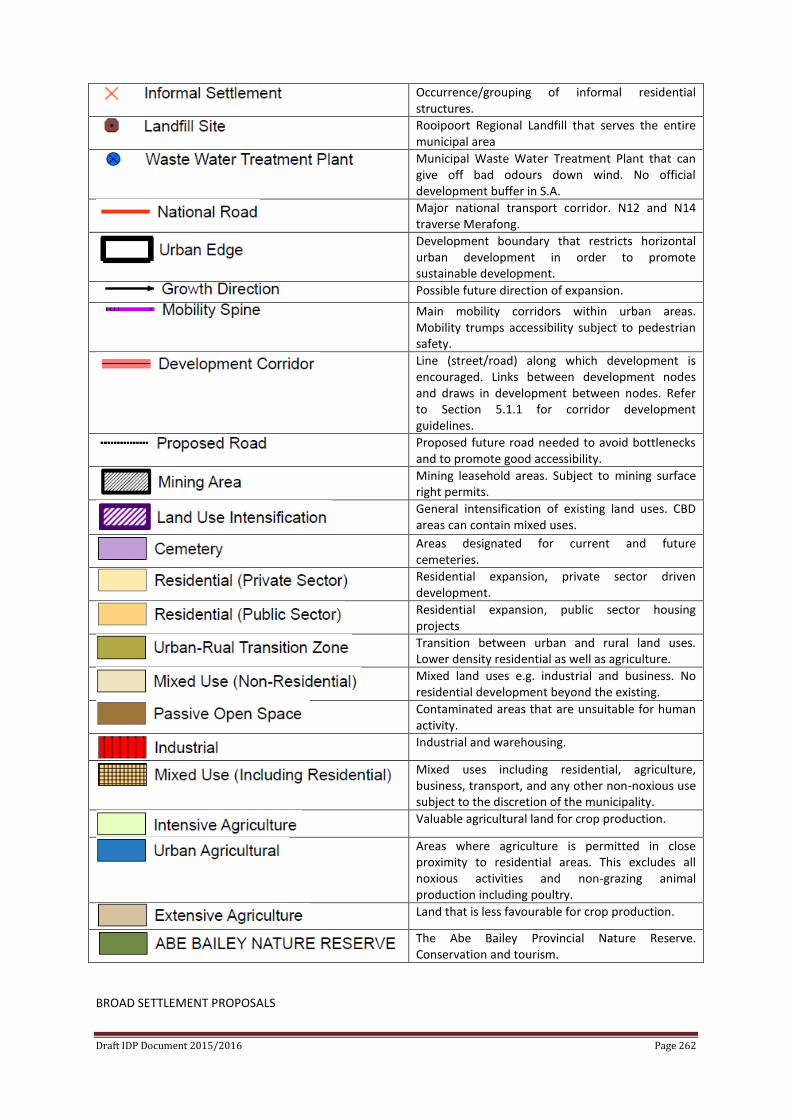
Draft IDP Document 2015/2016 Page 262
Occurrence/grouping of informal residential structures.
Rooipoort Regional Landfill that serves the entire municipal area
Municipal Waste Water Treatment Plant that can give off bad odours down wind. No official development buffer in S.A.
Major national transport corridor. N12 and N14 traverse Merafong.
Development boundary that restricts horizontal urban development in order to promote sustainable development.
Possible future direction of expansion.
Main mobility corridors within urban areas. Mobility trumps accessibility subject to pedestrian safety.
Line (street/road) along which development is encouraged. Links between development nodes and draws in development between nodes. Refer to Section 5.1.1 for corridor development guidelines.
Proposed future road needed to avoid bottlenecks and to promote good accessibility.
Mining leasehold areas. Subject to mining surface right permits.
General intensification of existing land uses. CBD areas can contain mixed uses.
Areas designated for current and future cemeteries.
Residential expansion, private sector driven development.
Residential expansion, public sector housing projects
Transition between urban and rural land uses. Lower density residential as well as agriculture.
Mixed land uses e.g. industrial and business. No residential development beyond the existing.
Contaminated areas that are unsuitable for human activity.
Industrial and warehousing.
Mixed uses including residential, agriculture, business, transport, and any other non-noxious use subject to the discretion of the municipality.
Valuable agricultural land for crop production.
Areas where agriculture is permitted in close proximity to residential areas. This excludes all noxious activities and non-grazing animal production including poultry.
Land that is less favourable for crop production.
The Abe Bailey Provincial Nature Reserve. Conservation and tourism.
BROAD SETTLEMENT PROPOSALS
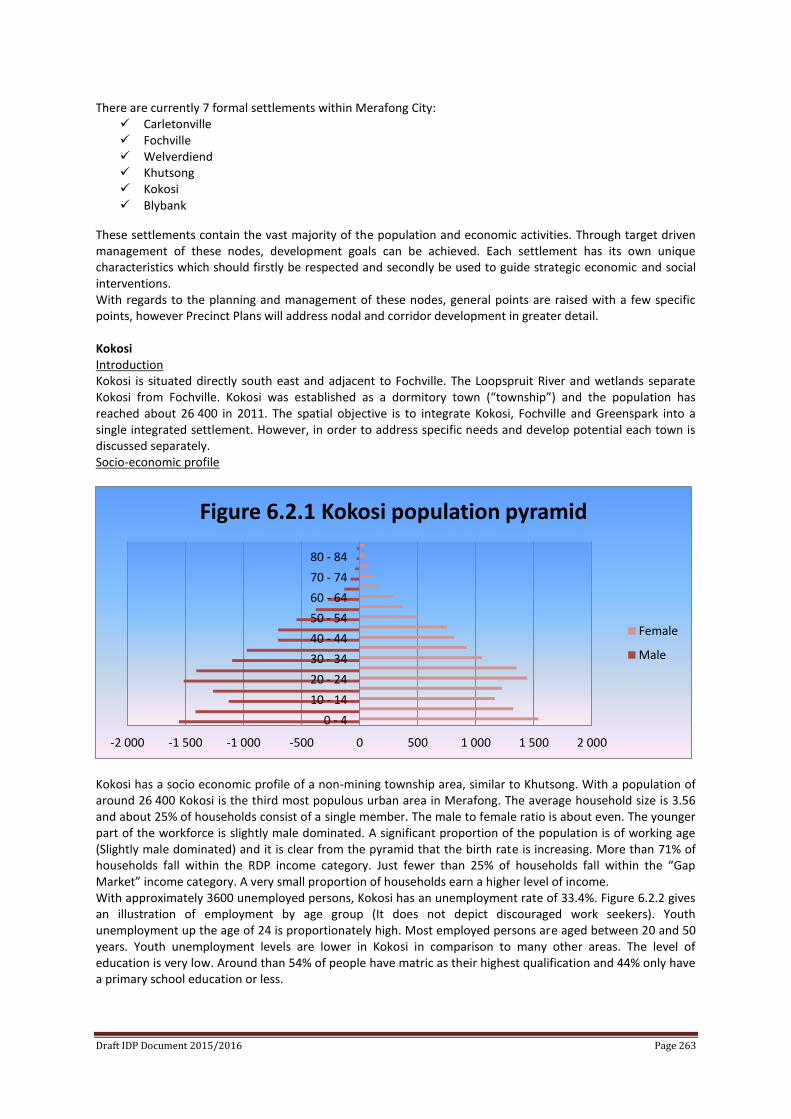
Draft IDP Document 2015/2016 Page 263
There are currently 7 formal settlements within Merafong City:
Carletonville Fochville Welverdiend Khutsong Kokosi Blybank
These settlements contain the vast majority of the population and economic activities. Through target driven management of these nodes, development goals can be achieved. Each settlement has its own unique characteristics which should firstly be respected and secondly be used to guide strategic economic and social interventions. With regards to the planning and management of these nodes, general points are raised with a few specific points, however Precinct Plans will address nodal and corridor development in greater detail. Kokosi Introduction Kokosi is situated directly south east and adjacent to Fochville. The Loopspruit River and wetlands separate Kokosi from Fochville. Kokosi was established as a dormitory town (“township”) and the population has reached about 26 400 in 2011. The spatial objective is to integrate Kokosi, Fochville and Greenspark into a single integrated settlement. However, in order to address specific needs and develop potential each town is discussed separately. Socio-economic profile
Kokosi has a socio economic profile of a non-mining township area, similar to Khutsong. With a population of around 26 400 Kokosi is the third most populous urban area in Merafong. The average household size is 3.56 and about 25% of households consist of a single member. The male to female ratio is about even. The younger part of the workforce is slightly male dominated. A significant proportion of the population is of working age (Slightly male dominated) and it is clear from the pyramid that the birth rate is increasing. More than 71% of households fall within the RDP income category. Just fewer than 25% of households fall within the “Gap Market” income category. A very small proportion of households earn a higher level of income. With approximately 3600 unemployed persons, Kokosi has an unemployment rate of 33.4%. Figure 6.2.2 gives an illustration of employment by age group (It does not depict discouraged work seekers). Youth unemployment up the age of 24 is proportionately high. Most employed persons are aged between 20 and 50
years. Youth unemployment levels are lower in Kokosi in comparison to many other areas. The level of education is very low. Around than 54% of people have matric as their highest qualification and 44% only have a primary school education or less.
-2 000 -1 500 -1 000 -500 0 500 1 000 1 500 2 000
0 - 4
10 - 14
20 - 24
30 - 34
40 - 44
50 - 54
60 - 64
70 - 74
80 - 84
Figure 6.2.1 Kokosi population pyramid
Female
Male
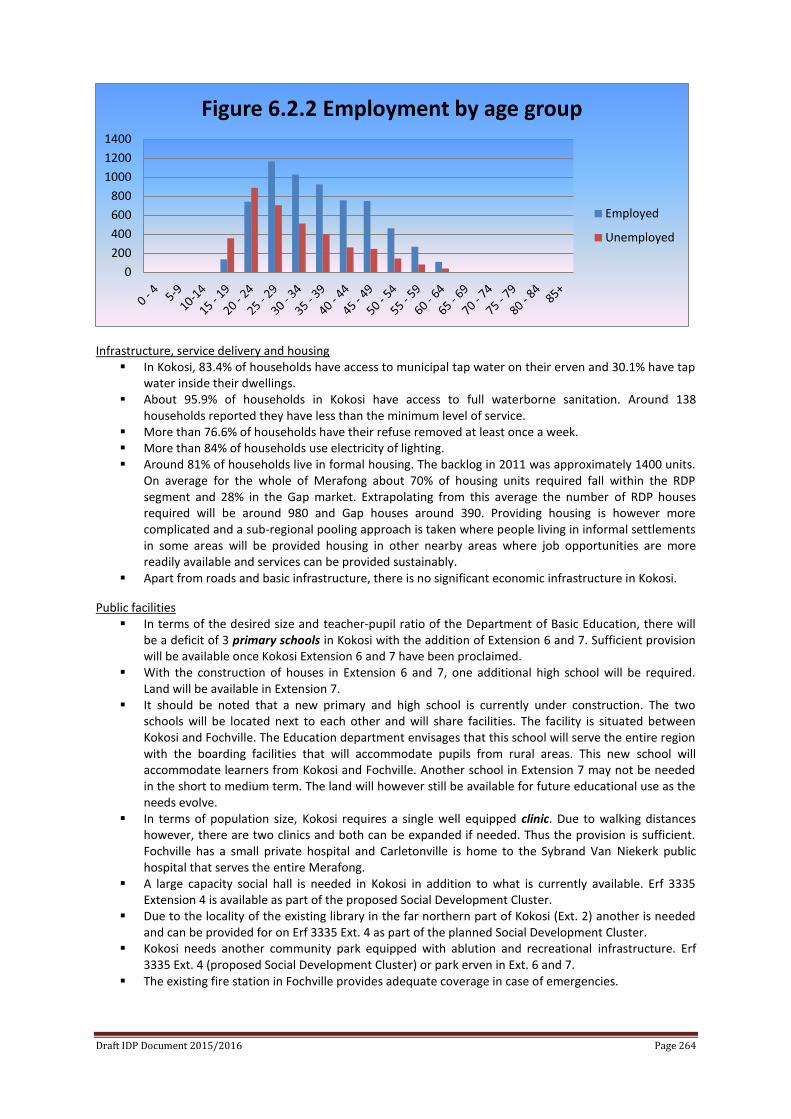
Draft IDP Document 2015/2016 Page 264
Infrastructure, service delivery and housing In Kokosi, 83.4% of households have access to municipal tap water on their erven and 30.1% have tap
water inside their dwellings. About 95.9% of households in Kokosi have access to full waterborne sanitation. Around 138
households reported they have less than the minimum level of service. More than 76.6% of households have their refuse removed at least once a week. More than 84% of households use electricity of lighting. Around 81% of households live in formal housing. The backlog in 2011 was approximately 1400 units.
On average for the whole of Merafong about 70% of housing units required fall within the RDP segment and 28% in the Gap market. Extrapolating from this average the number of RDP houses required will be around 980 and Gap houses around 390. Providing housing is however more complicated and a sub-regional pooling approach is taken where people living in informal settlements in some areas will be provided housing in other nearby areas where job opportunities are more readily available and services can be provided sustainably.
Apart from roads and basic infrastructure, there is no significant economic infrastructure in Kokosi.
Public facilities In terms of the desired size and teacher-pupil ratio of the Department of Basic Education, there will
be a deficit of 3 primary schools in Kokosi with the addition of Extension 6 and 7. Sufficient provision will be available once Kokosi Extension 6 and 7 have been proclaimed.
With the construction of houses in Extension 6 and 7, one additional high school will be required. Land will be available in Extension 7.
It should be noted that a new primary and high school is currently under construction. The two schools will be located next to each other and will share facilities. The facility is situated between Kokosi and Fochville. The Education department envisages that this school will serve the entire region with the boarding facilities that will accommodate pupils from rural areas. This new school will accommodate learners from Kokosi and Fochville. Another school in Extension 7 may not be needed in the short to medium term. The land will however still be available for future educational use as the needs evolve.
In terms of population size, Kokosi requires a single well equipped clinic. Due to walking distances however, there are two clinics and both can be expanded if needed. Thus the provision is sufficient. Fochville has a small private hospital and Carletonville is home to the Sybrand Van Niekerk public hospital that serves the entire Merafong.
A large capacity social hall is needed in Kokosi in addition to what is currently available. Erf 3335 Extension 4 is available as part of the proposed Social Development Cluster.
Due to the locality of the existing library in the far northern part of Kokosi (Ext. 2) another is needed and can be provided for on Erf 3335 Ext. 4 as part of the planned Social Development Cluster.
Kokosi needs another community park equipped with ablution and recreational infrastructure. Erf 3335 Ext. 4 (proposed Social Development Cluster) or park erven in Ext. 6 and 7.
The existing fire station in Fochville provides adequate coverage in case of emergencies.
0
200
400
600
800
1000
1200
1400
Figure 6.2.2 Employment by age group
Employed
Unemployed
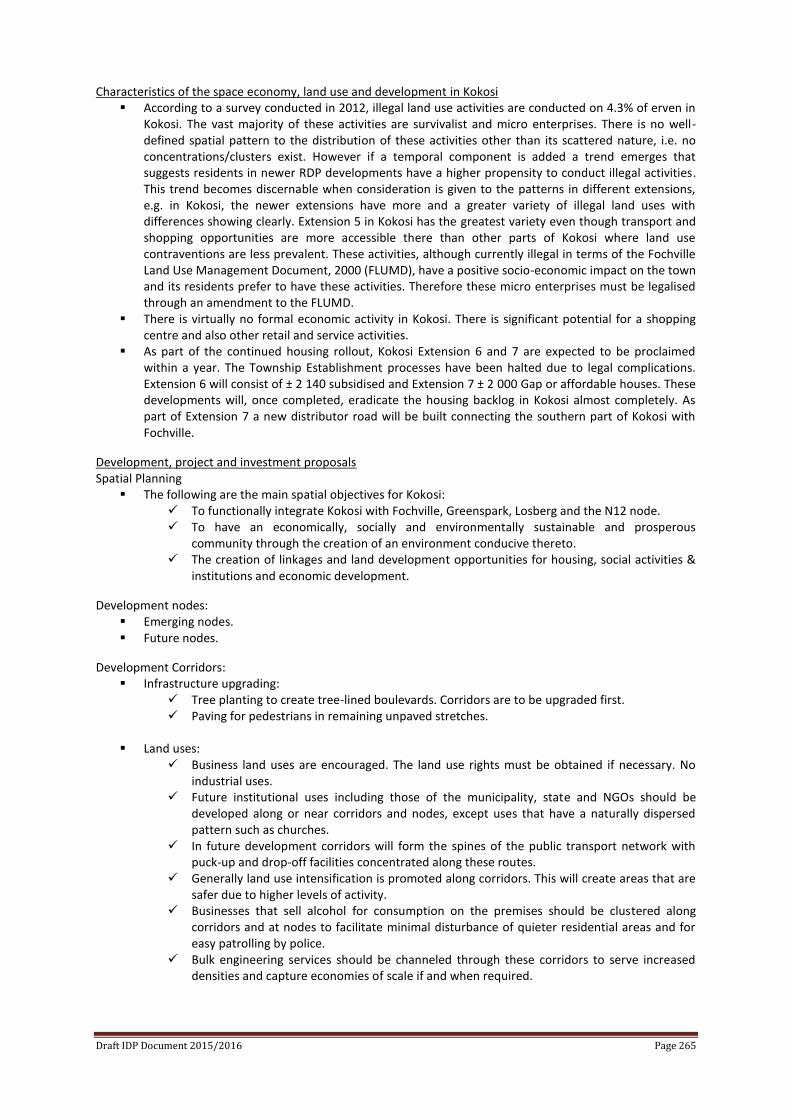
Draft IDP Document 2015/2016 Page 265
Characteristics of the space economy, land use and development in Kokosi According to a survey conducted in 2012, illegal land use activities are conducted on 4.3% of erven in
Kokosi. The vast majority of these activities are survivalist and micro enterprises. There is no well-defined spatial pattern to the distribution of these activities other than its scattered nature, i.e. no concentrations/clusters exist. However if a temporal component is added a trend emerges that suggests residents in newer RDP developments have a higher propensity to conduct illegal activities. This trend becomes discernable when consideration is given to the patterns in different extensions, e.g. in Kokosi, the newer extensions have more and a greater variety of illegal land uses with differences showing clearly. Extension 5 in Kokosi has the greatest variety even though transport and shopping opportunities are more accessible there than other parts of Kokosi where land use contraventions are less prevalent. These activities, although currently illegal in terms of the Fochville Land Use Management Document, 2000 (FLUMD), have a positive socio-economic impact on the town and its residents prefer to have these activities. Therefore these micro enterprises must be legalised through an amendment to the FLUMD.
There is virtually no formal economic activity in Kokosi. There is significant potential for a shopping centre and also other retail and service activities.
As part of the continued housing rollout, Kokosi Extension 6 and 7 are expected to be proclaimed within a year. The Township Establishment processes have been halted due to legal complications. Extension 6 will consist of ± 2 140 subsidised and Extension 7 ± 2 000 Gap or affordable houses. These developments will, once completed, eradicate the housing backlog in Kokosi almost completely. As part of Extension 7 a new distributor road will be built connecting the southern part of Kokosi with Fochville.
Development, project and investment proposals Spatial Planning
The following are the main spatial objectives for Kokosi: To functionally integrate Kokosi with Fochville, Greenspark, Losberg and the N12 node. To have an economically, socially and environmentally sustainable and prosperous
community through the creation of an environment conducive thereto. The creation of linkages and land development opportunities for housing, social activities &
institutions and economic development.
Development nodes: Emerging nodes. Future nodes.
Development Corridors: Infrastructure upgrading:
Tree planting to create tree-lined boulevards. Corridors are to be upgraded first. Paving for pedestrians in remaining unpaved stretches.
Land uses:
Business land uses are encouraged. The land use rights must be obtained if necessary. No industrial uses.
Future institutional uses including those of the municipality, state and NGOs should be developed along or near corridors and nodes, except uses that have a naturally dispersed pattern such as churches.
In future development corridors will form the spines of the public transport network with puck-up and drop-off facilities concentrated along these routes.
Generally land use intensification is promoted along corridors. This will create areas that are safer due to higher levels of activity.
Businesses that sell alcohol for consumption on the premises should be clustered along corridors and at nodes to facilitate minimal disturbance of quieter residential areas and for easy patrolling by police.
Bulk engineering services should be channeled through these corridors to serve increased densities and capture economies of scale if and when required.
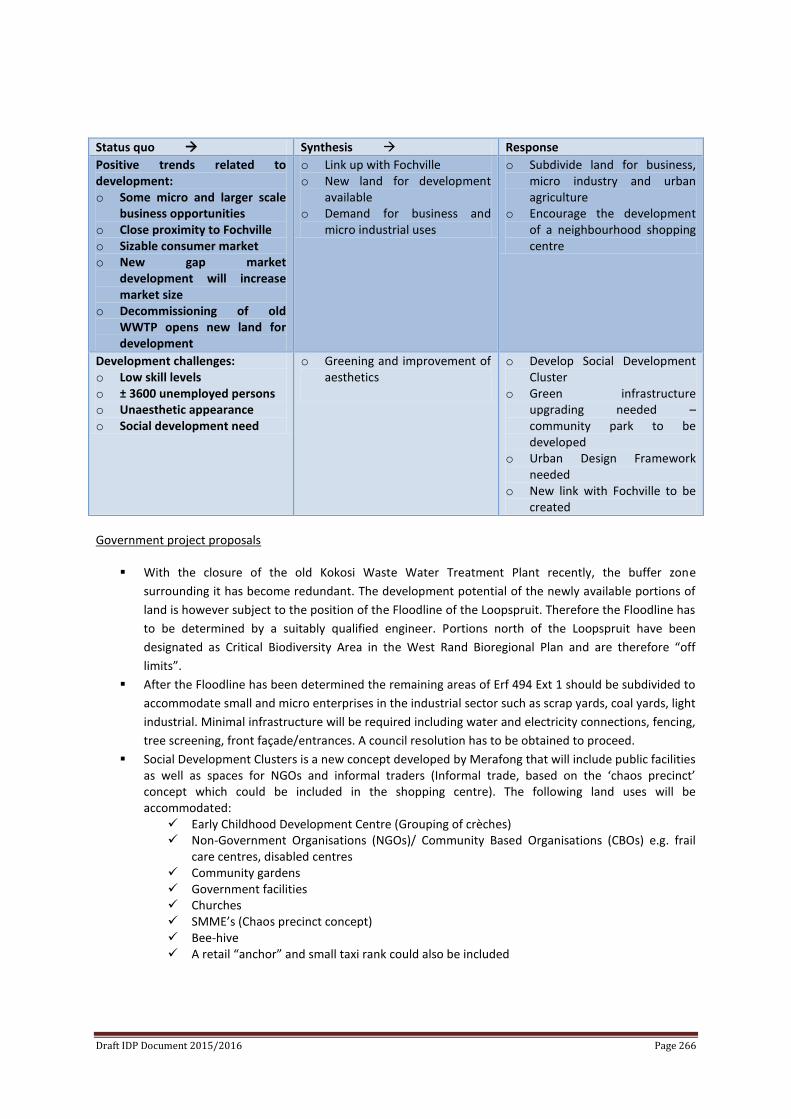
Draft IDP Document 2015/2016 Page 266
Government project proposals
With the closure of the old Kokosi Waste Water Treatment Plant recently, the buffer zone
surrounding it has become redundant. The development potential of the newly available portions of
land is however subject to the position of the Floodline of the Loopspruit. Therefore the Floodline has
to be determined by a suitably qualified engineer. Portions north of the Loopspruit have been
designated as Critical Biodiversity Area in the West Rand Bioregional Plan and are therefore “off
limits”.
After the Floodline has been determined the remaining areas of Erf 494 Ext 1 should be subdivided to
accommodate small and micro enterprises in the industrial sector such as scrap yards, coal yards, light
industrial. Minimal infrastructure will be required including water and electricity connections, fencing,
tree screening, front façade/entrances. A council resolution has to be obtained to proceed.
Social Development Clusters is a new concept developed by Merafong that will include public facilities as well as spaces for NGOs and informal traders (Informal trade, based on the ‘chaos precinct’ concept which could be included in the shopping centre). The following land uses will be accommodated:
Early Childhood Development Centre (Grouping of crèches) Non-Government Organisations (NGOs)/ Community Based Organisations (CBOs) e.g. frail
care centres, disabled centres Community gardens Government facilities Churches SMME’s (Chaos precinct concept) Bee-hive A retail “anchor” and small taxi rank could also be included
Status quo Synthesis Response
Positive trends related to development: o Some micro and larger scale
business opportunities o Close proximity to Fochville o Sizable consumer market o New gap market
development will increase market size
o Decommissioning of old WWTP opens new land for development
o Link up with Fochville o New land for development
available o Demand for business and
micro industrial uses
o Subdivide land for business, micro industry and urban agriculture
o Encourage the development of a neighbourhood shopping centre
Development challenges: o Low skill levels o ± 3600 unemployed persons o Unaesthetic appearance o Social development need
o Greening and improvement of aesthetics
o Develop Social Development Cluster
o Green infrastructure upgrading needed – community park to be developed
o Urban Design Framework needed
o New link with Fochville to be created
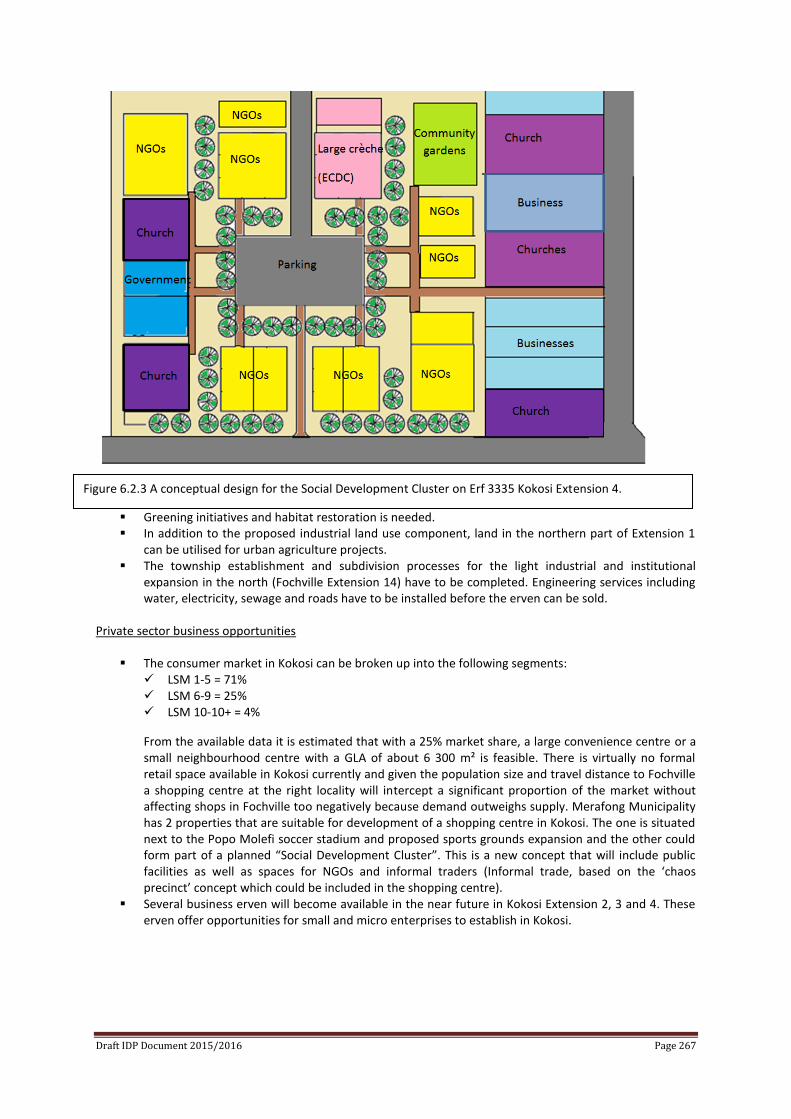
Draft IDP Document 2015/2016 Page 267
Greening initiatives and habitat restoration is needed. In addition to the proposed industrial land use component, land in the northern part of Extension 1
can be utilised for urban agriculture projects. The township establishment and subdivision processes for the light industrial and institutional
expansion in the north (Fochville Extension 14) have to be completed. Engineering services including water, electricity, sewage and roads have to be installed before the erven can be sold.
Private sector business opportunities
The consumer market in Kokosi can be broken up into the following segments: LSM 1-5 = 71% LSM 6-9 = 25% LSM 10-10+ = 4%
From the available data it is estimated that with a 25% market share, a large convenience centre or a small neighbourhood centre with a GLA of about 6 300 m² is feasible. There is virtually no formal retail space available in Kokosi currently and given the population size and travel distance to Fochville a shopping centre at the right locality will intercept a significant proportion of the market without affecting shops in Fochville too negatively because demand outweighs supply. Merafong Municipality has 2 properties that are suitable for development of a shopping centre in Kokosi. The one is situated next to the Popo Molefi soccer stadium and proposed sports grounds expansion and the other could form part of a planned “Social Development Cluster”. This is a new concept that will include public facilities as well as spaces for NGOs and informal traders (Informal trade, based on the ‘chaos precinct’ concept which could be included in the shopping centre).
Several business erven will become available in the near future in Kokosi Extension 2, 3 and 4. These erven offer opportunities for small and micro enterprises to establish in Kokosi.
Figure 6.2.3 A conceptual design for the Social Development Cluster on Erf 3335 Kokosi Extension 4.
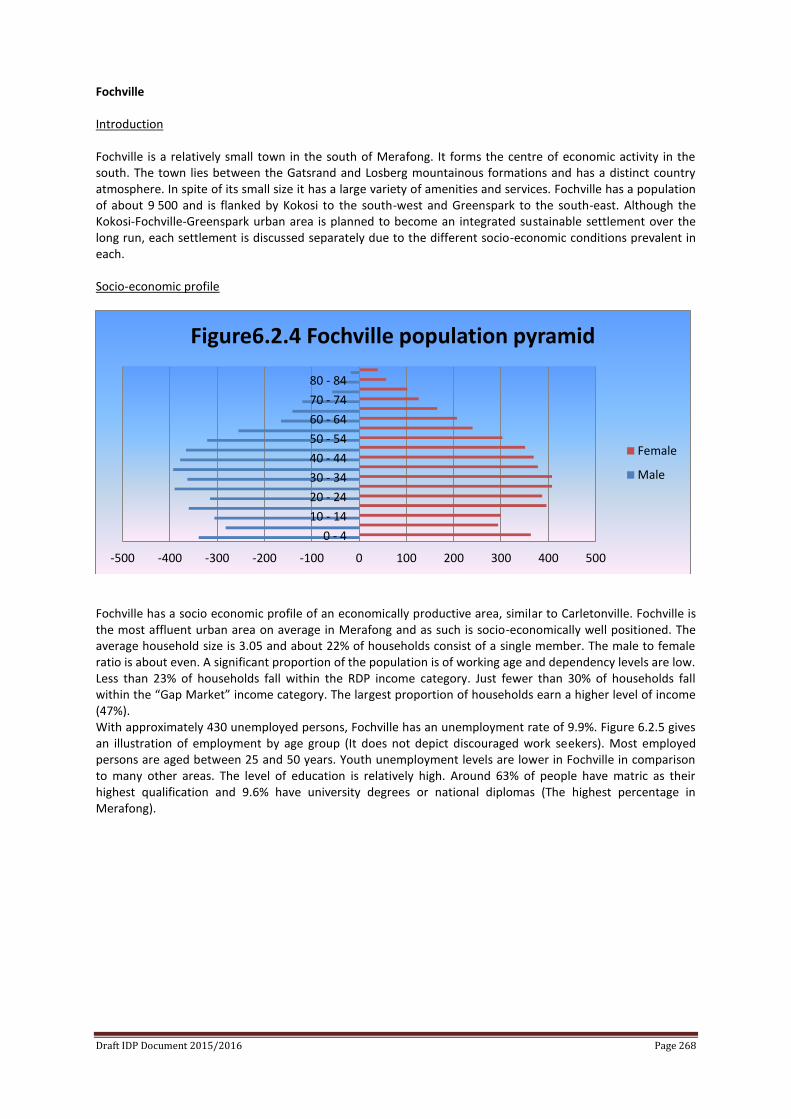
Draft IDP Document 2015/2016 Page 268
Fochville Introduction Fochville is a relatively small town in the south of Merafong. It forms the centre of economic activity in the south. The town lies between the Gatsrand and Losberg mountainous formations and has a distinct country atmosphere. In spite of its small size it has a large variety of amenities and services. Fochville has a population of about 9 500 and is flanked by Kokosi to the south-west and Greenspark to the south-east. Although the Kokosi-Fochville-Greenspark urban area is planned to become an integrated sustainable settlement over the long run, each settlement is discussed separately due to the different socio-economic conditions prevalent in each. Socio-economic profile
Fochville has a socio economic profile of an economically productive area, similar to Carletonville. Fochville is the most affluent urban area on average in Merafong and as such is socio-economically well positioned. The average household size is 3.05 and about 22% of households consist of a single member. The male to female ratio is about even. A significant proportion of the population is of working age and dependency levels are low. Less than 23% of households fall within the RDP income category. Just fewer than 30% of households fall within the “Gap Market” income category. The largest proportion of households earn a higher level of income (47%). With approximately 430 unemployed persons, Fochville has an unemployment rate of 9.9%. Figure 6.2.5 gives an illustration of employment by age group (It does not depict discouraged work seekers). Most employed persons are aged between 25 and 50 years. Youth unemployment levels are lower in Fochville in comparison to many other areas. The level of education is relatively high. Around 63% of people have matric as their highest qualification and 9.6% have university degrees or national diplomas (The highest percentage in Merafong).
-500 -400 -300 -200 -100 0 100 200 300 400 500
0 - 4
10 - 14
20 - 24
30 - 34
40 - 44
50 - 54
60 - 64
70 - 74
80 - 84
Figure6.2.4 Fochville population pyramid
Female
Male
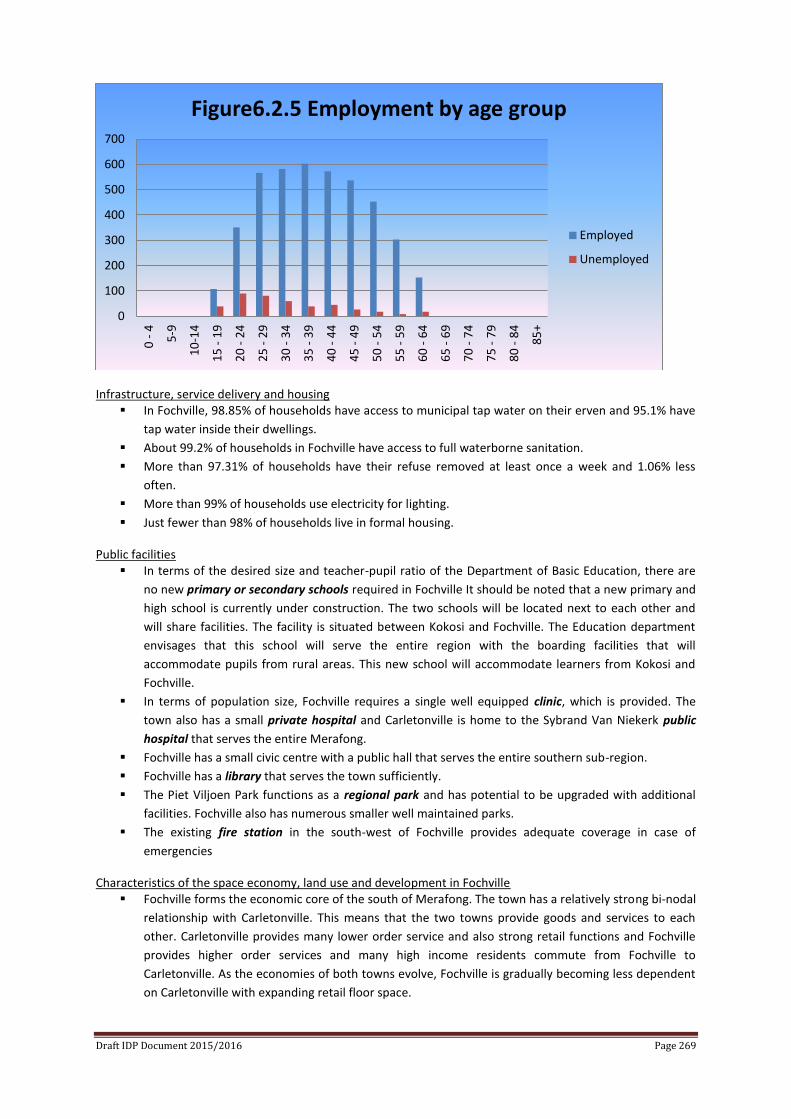
Draft IDP Document 2015/2016 Page 269
Infrastructure, service delivery and housing
In Fochville, 98.85% of households have access to municipal tap water on their erven and 95.1% have
tap water inside their dwellings.
About 99.2% of households in Fochville have access to full waterborne sanitation.
More than 97.31% of households have their refuse removed at least once a week and 1.06% less
often.
More than 99% of households use electricity for lighting.
Just fewer than 98% of households live in formal housing.
Public facilities In terms of the desired size and teacher-pupil ratio of the Department of Basic Education, there are
no new primary or secondary schools required in Fochville It should be noted that a new primary and
high school is currently under construction. The two schools will be located next to each other and
will share facilities. The facility is situated between Kokosi and Fochville. The Education department
envisages that this school will serve the entire region with the boarding facilities that will
accommodate pupils from rural areas. This new school will accommodate learners from Kokosi and
Fochville.
In terms of population size, Fochville requires a single well equipped clinic, which is provided. The
town also has a small private hospital and Carletonville is home to the Sybrand Van Niekerk public
hospital that serves the entire Merafong.
Fochville has a small civic centre with a public hall that serves the entire southern sub-region.
Fochville has a library that serves the town sufficiently.
The Piet Viljoen Park functions as a regional park and has potential to be upgraded with additional
facilities. Fochville also has numerous smaller well maintained parks.
The existing fire station in the south-west of Fochville provides adequate coverage in case of
emergencies
Characteristics of the space economy, land use and development in Fochville Fochville forms the economic core of the south of Merafong. The town has a relatively strong bi-nodal
relationship with Carletonville. This means that the two towns provide goods and services to each
other. Carletonville provides many lower order service and also strong retail functions and Fochville
provides higher order services and many high income residents commute from Fochville to
Carletonville. As the economies of both towns evolve, Fochville is gradually becoming less dependent
on Carletonville with expanding retail floor space.
0
100
200
300
400
500
600
7000
- 4
5-9
10
-14
15
- 1
9
20
- 2
4
25
- 2
9
30
- 3
4
35
- 3
9
40
- 4
4
45
- 4
9
50
- 5
4
55
- 5
9
60
- 6
4
65
- 6
9
70
- 7
4
75
- 7
9
80
- 8
4
85
+
Figure6.2.5 Employment by age group
Employed
Unemployed
Draft IDP Document 2015/2016 Page 270
Fochville is experiencing moderate economic growth (The highest growth rate in Merafong) with
expanding retail and office floor space. There is also healthy demand for new residential units. In
more recent years the construction of walk-up flats has increased significantly.
The area that experiences the highest demand for housing development is in the north of Fochville,
however from an urban sustainability perspective the most viable area for residential densification is
to the south where infrastructure costs to the municipality will be much less in the long run.
Therefore a balance needs to be struck.
Fochville has a strong ‘small town’ appeal. The town originated as a central place for farmers in the
area. Since the development of gold mines in the area the functions of Fochville have changed, with
more service and industrial activities linked to mining. The town has however retained its charm and
this offers many opportunities, especially considering the migration changes that are occurring
nationally within high income categories of households. The trend is referred to as Polarisation
Reversal. Polarisation Reversal is part of the natural evolution that a national space economy goes
through (Termed Differential Urbanisation) where firstly high income families start to move away
from core metropolitan areas due to the negative externalities associated with ‘big city living’.
Fochville is situated about 65km from the Johannesburg Central Business District which makes it
completely feasible to commute from Fochville to Johannesburg for work and have children attend
schools in the countryside which generally have fewer problems such as drug use, etc. There are also
a wide variety of amenities available that are usually not associated with a small town, such as a
private hospital.
Given the higher level of education and the good linkages with the rest of the Gauteng City Region,
Fochville seems to be a good location for high technology, high skills companies that are less spatially
bound to relocate to. Many of these types of companies are looking at alternatives due to negative
externalities such as traffic congestion, pollution, unaesthetical environments, and high crime levels.
Development in the Losberg industrial township has never taken off properly due to spatial factors at
the time of its establishment. There are however several factors that currently bode well for industrial
development in Losberg. The two most notable are the very low prices of land (± R10/m²) and the
willingness of many industries to relocate outside the core area of large cities.
Fochville is starting to experience bulk engineering service capacity problems. Upgrades are needed
to accommodate growth in the future. Upgrading has started with water reservoirs and is continuing.
Over the long term it is planned that Kokosi, Fochville and Greenspark develop into a single seamless
integrated and sustainable settlement. The following planned interventions are currently used as
tools to create the planned settlement:
Improved connectivity. A new access road is planned between Kokosi and Fochville in the
south which will drastically improve accessibility.
Urban infill and growth areas. Fochville Extension 8 and 14, and Kokosi Extension 6 and 7
will fill in gaps to reshape the settlements into a compact town.
Development nodes. These nodes guide development to desired localities with planned
infrastructure upgrades.
Development corridors. These corridors guide development in desired directions and in
future will become the main spines of development and routes for public transport. Nodes
and corridors will help to create a transit oriented settlement that will improve connectivity
and reduce the cost of living.
Containment. Undesirable development is curbed by containment boundaries. A good
example is the encroachment of industrial activities on residential areas in the south of
Fochville.
Public transport is provided by private taxi and bus operators. The West Rand district is looking into
the possibilities of establishing a Bus Rapid Transit system in the west rand. The municipality is
planning to reshape urban areas in Merafong into transit oriented settlements where public transport
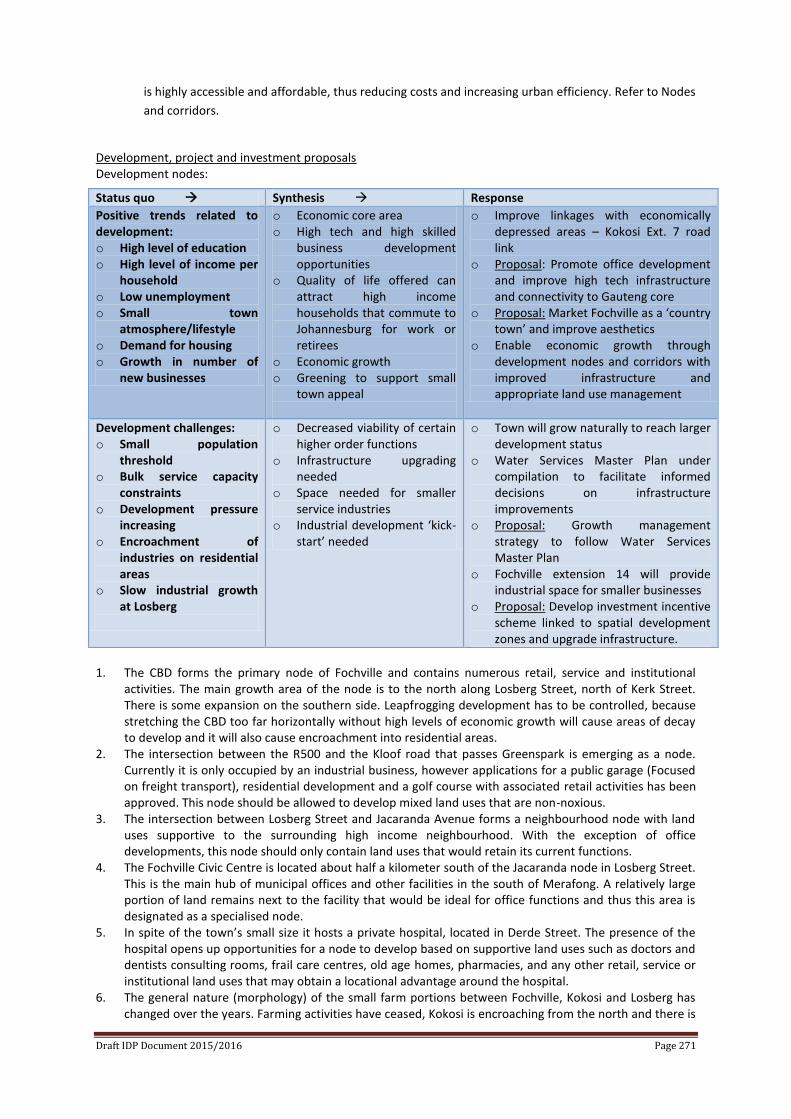
Draft IDP Document 2015/2016 Page 271
is highly accessible and affordable, thus reducing costs and increasing urban efficiency. Refer to Nodes
and corridors.
Development, project and investment proposals Development nodes:
1. The CBD forms the primary node of Fochville and contains numerous retail, service and institutional
activities. The main growth area of the node is to the north along Losberg Street, north of Kerk Street. There is some expansion on the southern side. Leapfrogging development has to be controlled, because stretching the CBD too far horizontally without high levels of economic growth will cause areas of decay to develop and it will also cause encroachment into residential areas.
2. The intersection between the R500 and the Kloof road that passes Greenspark is emerging as a node. Currently it is only occupied by an industrial business, however applications for a public garage (Focused on freight transport), residential development and a golf course with associated retail activities has been approved. This node should be allowed to develop mixed land uses that are non-noxious.
3. The intersection between Losberg Street and Jacaranda Avenue forms a neighbourhood node with land uses supportive to the surrounding high income neighbourhood. With the exception of office developments, this node should only contain land uses that would retain its current functions.
4. The Fochville Civic Centre is located about half a kilometer south of the Jacaranda node in Losberg Street. This is the main hub of municipal offices and other facilities in the south of Merafong. A relatively large portion of land remains next to the facility that would be ideal for office functions and thus this area is designated as a specialised node.
5. In spite of the town’s small size it hosts a private hospital, located in Derde Street. The presence of the hospital opens up opportunities for a node to develop based on supportive land uses such as doctors and dentists consulting rooms, frail care centres, old age homes, pharmacies, and any other retail, service or institutional land uses that may obtain a locational advantage around the hospital.
6. The general nature (morphology) of the small farm portions between Fochville, Kokosi and Losberg has changed over the years. Farming activities have ceased, Kokosi is encroaching from the north and there is
Status quo Synthesis Response
Positive trends related to development: o High level of education o High level of income per
household o Low unemployment o Small town
atmosphere/lifestyle o Demand for housing o Growth in number of
new businesses
o Economic core area o High tech and high skilled
business development opportunities
o Quality of life offered can attract high income households that commute to Johannesburg for work or retirees
o Economic growth o Greening to support small
town appeal
o Improve linkages with economically depressed areas – Kokosi Ext. 7 road link
o Proposal: Promote office development and improve high tech infrastructure and connectivity to Gauteng core
o Proposal: Market Fochville as a ‘country town’ and improve aesthetics
o Enable economic growth through development nodes and corridors with improved infrastructure and appropriate land use management
Development challenges: o Small population
threshold o Bulk service capacity
constraints o Development pressure
increasing o Encroachment of
industries on residential areas
o Slow industrial growth at Losberg
o Decreased viability of certain higher order functions
o Infrastructure upgrading needed
o Space needed for smaller service industries
o Industrial development ‘kick-start’ needed
o Town will grow naturally to reach larger development status
o Water Services Master Plan under compilation to facilitate informed decisions on infrastructure improvements
o Proposal: Growth management strategy to follow Water Services Master Plan
o Fochville extension 14 will provide industrial space for smaller businesses
o Proposal: Develop investment incentive scheme linked to spatial development zones and upgrade infrastructure.
Draft IDP Document 2015/2016 Page 272
significant pressure for business and light industrial development. Many land uses, specifically in the transport sub-sector require larger tracts of land and a lower level of services, and due to the nature of the activities need cheaper land than is generally available in fully serviced towns. Considering the changing character of the area and the demand for cheaper land this area is opened up for business development for small enterprises as long as activities are non-noxious.
7. The Losberg industrial node is located south of Fochville and has rail access to most erven as well as a freight and passenger station that is not currently in use. Noxious industrial activities are allowed at this node subject to compliance with all applicable legislation and regulations.
Development Corridors:
1. The main development corridor in Fochville follows Losberg Street. Between the Civic Centre and the CBD home office type developments are allowed, with business uses in the |CBD and mixed business and industrial uses further south outside the CBD in Loopspruit Avenue.
2. From the CBD up to Extension 14, business uses are encouraged along Kerk Street. Infrastructure upgrading:
Tree planting to create tree-lined boulevards. Corridors are to be upgraded first. Paving for pedestrians in remaining unpaved stretches. Bulk engineering services should be channeled through these corridors to serve increased
densities and capture economies of scale if and when required. Public transport pick-up points should be located along these routes at approximately 1 km
intervals. In areas of high pedestrian volumes, traffic calming measures should be put in place.
Especially in the CBD.
Land uses: Business land uses are encouraged. The land use rights must be obtained if necessary. No
industrial uses unless stated otherwise. It should be noted that not all areas along corridors are earmarked for development
simultaneously as this would create a situation where certain areas experience decay. As the economy grows more areas along corridors and nodes are ‘released’ for redevelopment. Therefore refer to the SDF main map for the distinction between current and proposed development areas and also refer to the guidelines for nodes and corridors.
Future institutional uses including those of the municipality, state and NGOs should be developed along or near corridors and nodes, except uses that have a naturally dispersed pattern such as churches.
In future development corridors will form the spines of the public transport network with pick-up and drop-off facilities concentrated along these routes.
Generally land use intensification is promoted along corridors. This will create areas that are safer due to higher levels of activity.
Businesses that sell alcohol for consumption on the premises should be clustered along corridors and at nodes to facilitate minimal disturbance of quieter residential areas and for easy patrolling by police.
Private sector business opportunities The consumer market in Fochville can be broken up into the following segments:
LSM 1-5 = 10% LSM 6-9 = 44% LSM 10-10+ = 36%
A survey of current retail space in Fochville is required to estimate expansion potential. Such a survey has not been done and therefore no opinion can be presented. The retail landscape in Fochville is dominated by the President Square shopping centre (Classified as a neighbourhood centre). The owners are planning an expansion that would ramp up the size to a community centre. Further shopping centre developments are welcomed as long as viability can be proven.
Several industrial erven will become available in the near future in Fochville Extension 14. These erven offer opportunities for small and micro enterprises to establish. The development is mainly focused on small industrial service businesses that are struggling to find space in Fochville and surrounds.
Draft IDP Document 2015/2016 Page 273
Some of the cheapest industrial land in the country is available in Losberg. Currently only Eskom electricity and water is available, however the municipality plans to upgrade the infrastructure of Losberg to attract more investment.
As mentioned in the previous section, there is potential for the development of office type businesses in the high tech and business services sub sectors. Land is available next to the Fochville civic centre.
The development node at the N12 is suited for transport and logistics activities. A small ‘Logistics Village’ that provides services to transport seems to be feasible. At a later stage industrial development will be considered.
The urban–rural transition area between Fochville and Losberg has been opened for non-noxious business and industrial development subject to obtaining the land use rights and comments from neighbours.
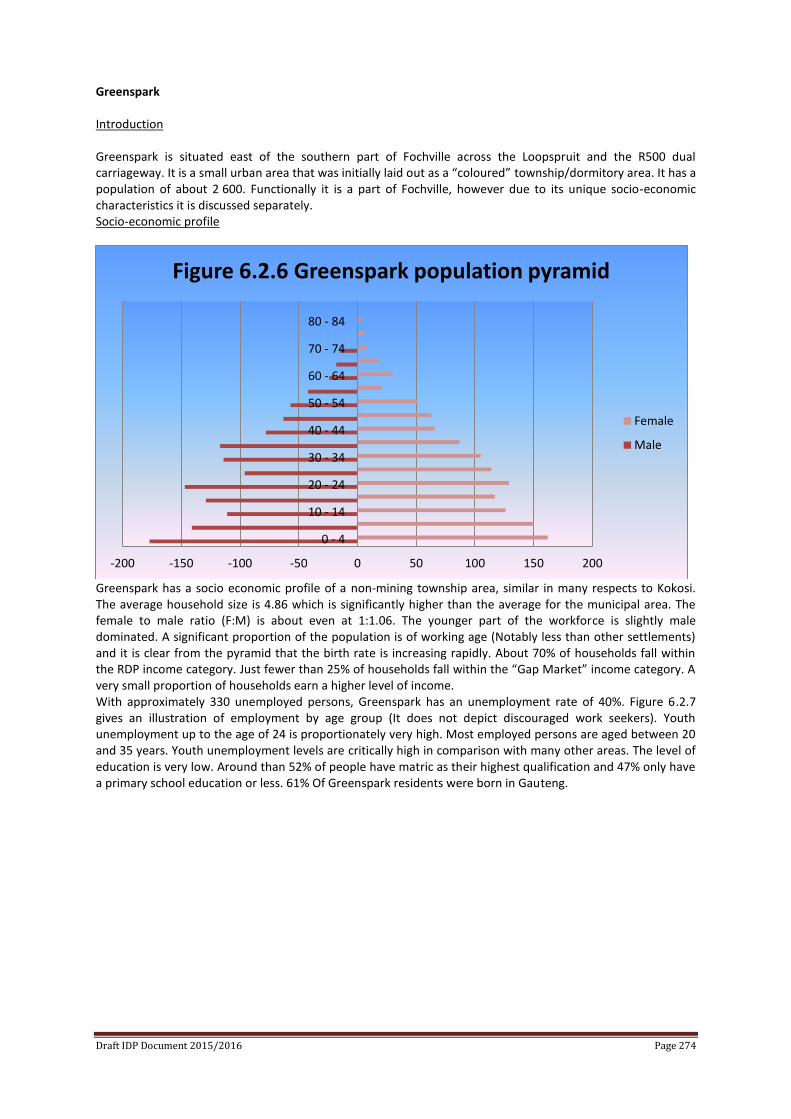
Draft IDP Document 2015/2016 Page 274
Greenspark Introduction Greenspark is situated east of the southern part of Fochville across the Loopspruit and the R500 dual carriageway. It is a small urban area that was initially laid out as a “coloured” township/dormitory area. It has a population of about 2 600. Functionally it is a part of Fochville, however due to its unique socio-economic characteristics it is discussed separately. Socio-economic profile
Greenspark has a socio economic profile of a non-mining township area, similar in many respects to Kokosi. The average household size is 4.86 which is significantly higher than the average for the municipal area. The female to male ratio (F:M) is about even at 1:1.06. The younger part of the workforce is slightly male dominated. A significant proportion of the population is of working age (Notably less than other settlements) and it is clear from the pyramid that the birth rate is increasing rapidly. About 70% of households fall within the RDP income category. Just fewer than 25% of households fall within the “Gap Market” income category. A very small proportion of households earn a higher level of income. With approximately 330 unemployed persons, Greenspark has an unemployment rate of 40%. Figure 6.2.7 gives an illustration of employment by age group (It does not depict discouraged work seekers). Youth unemployment up to the age of 24 is proportionately very high. Most employed persons are aged between 20 and 35 years. Youth unemployment levels are critically high in comparison with many other areas. The level of education is very low. Around than 52% of people have matric as their highest qualification and 47% only have a primary school education or less. 61% Of Greenspark residents were born in Gauteng.
-200 -150 -100 -50 0 50 100 150 200
0 - 4
10 - 14
20 - 24
30 - 34
40 - 44
50 - 54
60 - 64
70 - 74
80 - 84
Figure 6.2.6 Greenspark population pyramid
Female
Male
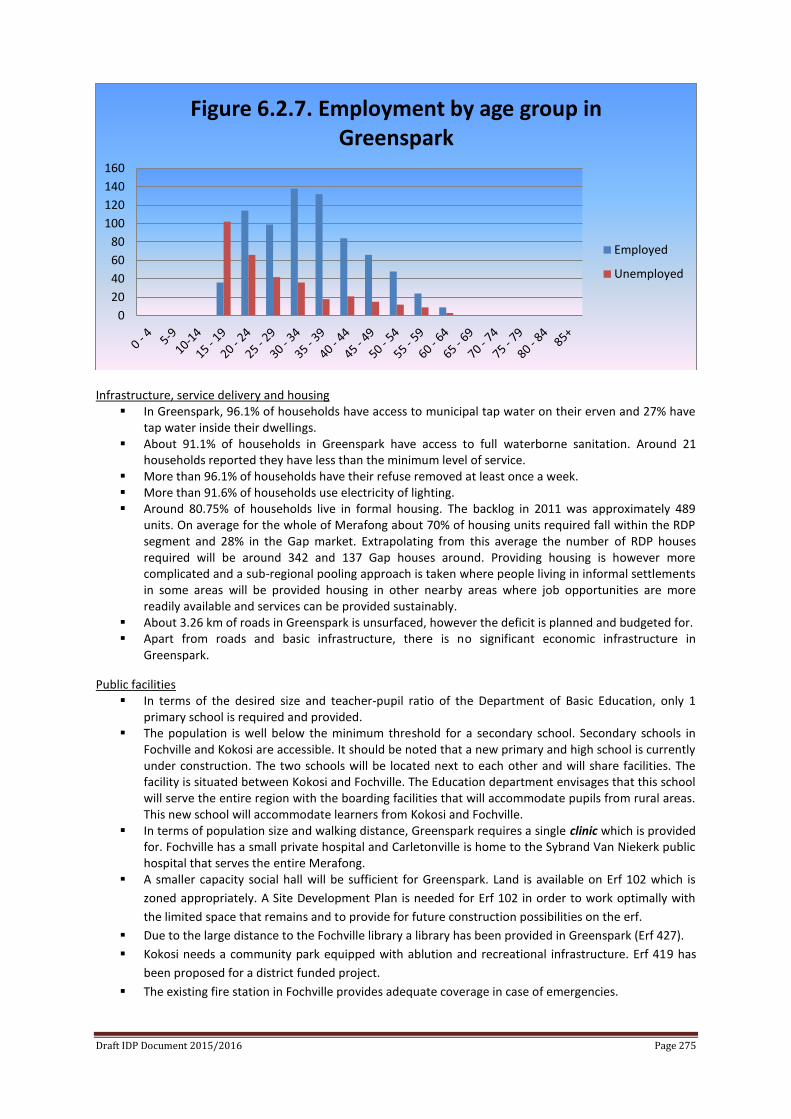
Draft IDP Document 2015/2016 Page 275
Infrastructure, service delivery and housing
In Greenspark, 96.1% of households have access to municipal tap water on their erven and 27% have tap water inside their dwellings.
About 91.1% of households in Greenspark have access to full waterborne sanitation. Around 21 households reported they have less than the minimum level of service.
More than 96.1% of households have their refuse removed at least once a week. More than 91.6% of households use electricity of lighting. Around 80.75% of households live in formal housing. The backlog in 2011 was approximately 489
units. On average for the whole of Merafong about 70% of housing units required fall within the RDP segment and 28% in the Gap market. Extrapolating from this average the number of RDP houses required will be around 342 and 137 Gap houses around. Providing housing is however more complicated and a sub-regional pooling approach is taken where people living in informal settlements in some areas will be provided housing in other nearby areas where job opportunities are more readily available and services can be provided sustainably.
About 3.26 km of roads in Greenspark is unsurfaced, however the deficit is planned and budgeted for. Apart from roads and basic infrastructure, there is no significant economic infrastructure in
Greenspark.
Public facilities In terms of the desired size and teacher-pupil ratio of the Department of Basic Education, only 1
primary school is required and provided. The population is well below the minimum threshold for a secondary school. Secondary schools in
Fochville and Kokosi are accessible. It should be noted that a new primary and high school is currently under construction. The two schools will be located next to each other and will share facilities. The facility is situated between Kokosi and Fochville. The Education department envisages that this school will serve the entire region with the boarding facilities that will accommodate pupils from rural areas. This new school will accommodate learners from Kokosi and Fochville.
In terms of population size and walking distance, Greenspark requires a single clinic which is provided for. Fochville has a small private hospital and Carletonville is home to the Sybrand Van Niekerk public hospital that serves the entire Merafong.
A smaller capacity social hall will be sufficient for Greenspark. Land is available on Erf 102 which is
zoned appropriately. A Site Development Plan is needed for Erf 102 in order to work optimally with
the limited space that remains and to provide for future construction possibilities on the erf.
Due to the large distance to the Fochville library a library has been provided in Greenspark (Erf 427).
Kokosi needs a community park equipped with ablution and recreational infrastructure. Erf 419 has
been proposed for a district funded project.
The existing fire station in Fochville provides adequate coverage in case of emergencies.
0
20
40
60
80
100
120
140
160
Figure 6.2.7. Employment by age group in Greenspark
Employed
Unemployed
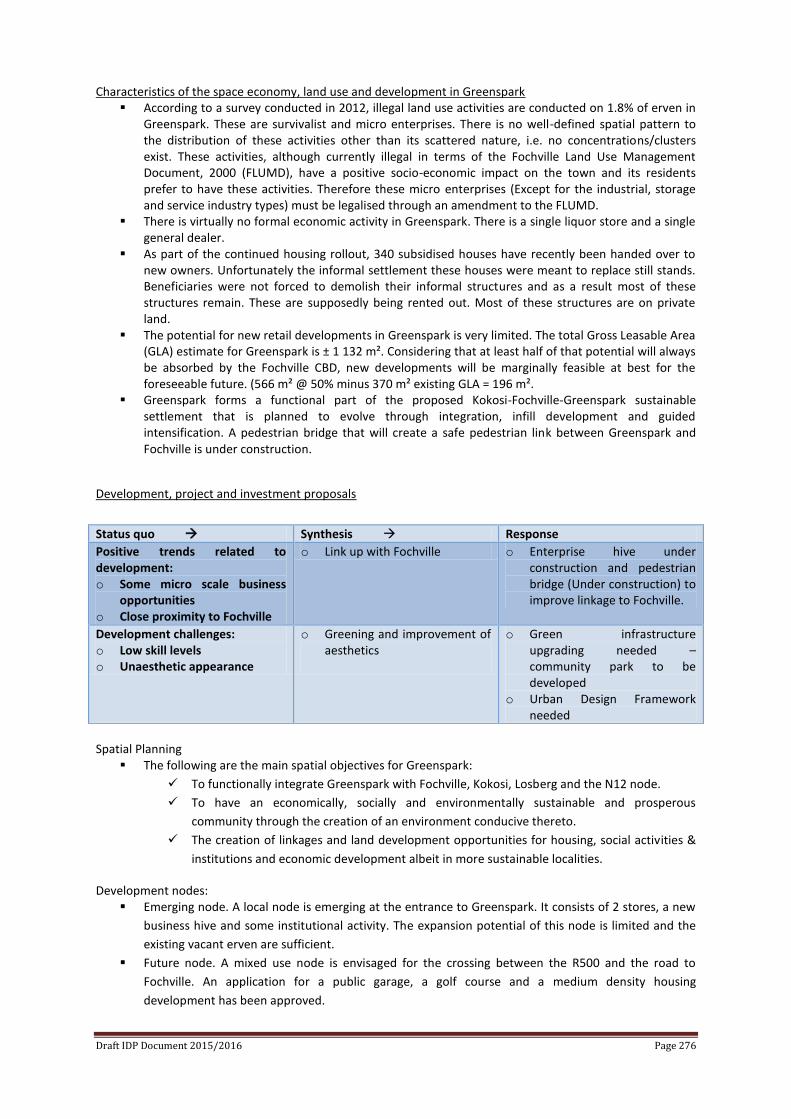
Draft IDP Document 2015/2016 Page 276
Characteristics of the space economy, land use and development in Greenspark According to a survey conducted in 2012, illegal land use activities are conducted on 1.8% of erven in
Greenspark. These are survivalist and micro enterprises. There is no well-defined spatial pattern to the distribution of these activities other than its scattered nature, i.e. no concentrations/clusters exist. These activities, although currently illegal in terms of the Fochville Land Use Management Document, 2000 (FLUMD), have a positive socio-economic impact on the town and its residents prefer to have these activities. Therefore these micro enterprises (Except for the industrial, storage and service industry types) must be legalised through an amendment to the FLUMD.
There is virtually no formal economic activity in Greenspark. There is a single liquor store and a single general dealer.
As part of the continued housing rollout, 340 subsidised houses have recently been handed over to new owners. Unfortunately the informal settlement these houses were meant to replace still stands. Beneficiaries were not forced to demolish their informal structures and as a result most of these structures remain. These are supposedly being rented out. Most of these structures are on private land.
The potential for new retail developments in Greenspark is very limited. The total Gross Leasable Area (GLA) estimate for Greenspark is ± 1 132 m². Considering that at least half of that potential will always be absorbed by the Fochville CBD, new developments will be marginally feasible at best for the foreseeable future. (566 m² @ 50% minus 370 m² existing GLA = 196 m².
Greenspark forms a functional part of the proposed Kokosi-Fochville-Greenspark sustainable settlement that is planned to evolve through integration, infill development and guided intensification. A pedestrian bridge that will create a safe pedestrian link between Greenspark and Fochville is under construction.
Development, project and investment proposals
Spatial Planning
The following are the main spatial objectives for Greenspark:
To functionally integrate Greenspark with Fochville, Kokosi, Losberg and the N12 node.
To have an economically, socially and environmentally sustainable and prosperous
community through the creation of an environment conducive thereto.
The creation of linkages and land development opportunities for housing, social activities &
institutions and economic development albeit in more sustainable localities.
Development nodes: Emerging node. A local node is emerging at the entrance to Greenspark. It consists of 2 stores, a new
business hive and some institutional activity. The expansion potential of this node is limited and the
existing vacant erven are sufficient.
Future node. A mixed use node is envisaged for the crossing between the R500 and the road to
Fochville. An application for a public garage, a golf course and a medium density housing
development has been approved.
Status quo Synthesis Response
Positive trends related to development: o Some micro scale business
opportunities o Close proximity to Fochville
o Link up with Fochville o Enterprise hive under construction and pedestrian bridge (Under construction) to improve linkage to Fochville.
Development challenges: o Low skill levels o Unaesthetic appearance
o Greening and improvement of aesthetics
o Green infrastructure upgrading needed – community park to be developed
o Urban Design Framework needed
Draft IDP Document 2015/2016 Page 277
Government project proposals Considering the limited availability of space for government and institutional uses, a Site
Development Plan (SDP) is required for Erf 102 Greenspark. This erf contains the only available land
that remains for these purposes. The SDP will include the current, planned and proposed uses for the
erf into consideration in order to avoid uncoordinated development.
Greening initiatives are needed to improve liveability.
Draft IDP Document 2015/2016 Page 278
Blybank Introduction Blybank is situated east of Carletonville, directly south of the R559. It is a small urban area that was laid out as a township/dormitory area for the nearby mine shafts. The municipality has no official statistics available on Blybank as a town, however from the available ward data a profile very similar to that of Wedela emerges. Using available data from the Merafong cadaster and illegal land use survey the population is estimated at ± 2900. Socio-economic profile The Stats SA sub-place data that was used to draw profiles for all other formal towns is unfortunately not available for Blybank as a town on its own. Blybank has a socio-economic profile that is very similar to that of Wedela as derived from ward based data. Therefore general assumptions can be made based on the Wedela data. The fact that Blybank is so similar in the functions that it performs to Wedela, backs the data assumptions up. Blybank is almost completely dependent on the nearby mine shafts for its employment. The settlement is male dominated and has a smaller than average family size. This is due to a high proportion of migrant labourers that reside in Blybank. Infrastructure, service delivery and housing Once again specific data is not available. From visual surveys and municipal data it is clear that there are almost no basic service backlogs in Blybank. There are also no informal settlements and very few backyard informal dwellers in Blybank. There is however a proliferation of illegally built “semi-formal” backyard structures. In most cases these structures are built using pre-fabricated concrete wall sections also known as “precon” walls or “stop nonsense”. At the last count these structures numbered 115 and contained on average 3 rooms. The existing infrastructure does not have the capacity to service this number of people. Intermittent power failures are common in Blybank and many illegal service connections exist. Public facilities
In terms of the desired size and teacher-pupil ratio of the Department of Basic Education, a small primary school can be considered due to the long distance to the nearest school in Carletonville.
The population is well below the minimum threshold for a secondary school. In terms of population size and walking distance, Greenspark requires a single clinic which is provided
for. Carletonville is home to the Sybrand Van Niekerk public hospital that serves the entire Merafong. A smaller capacity social hall will be sufficient for Blybank. Land is available on Erf 2510. Due to the large distance to the Carletonville library a library has been provided in Blybank on Erf
2510. The existing fire station in Carletonville does not provide adequate coverage in case of emergencies
due to the long distances. The fire services of the nearby mine shafts are closer.
Characteristics of the space economy, land use and development in Blybank
According to a survey conducted in 2012-2013, illegal land use activities are conducted on 5.3% of erven in Blybank. These are survivalist and micro enterprises. There is no well-defined spatial pattern to the distribution of these activities other than its scattered nature, i.e. no concentrations/clusters exist. These activities, although currently illegal in terms of the Carletonville Town Planning Scheme, 1993, have a positive socio-economic impact on the town and its residents prefer to have these activities. Therefore these micro enterprises (Except for industrial, storage and service industry, or any noxious types) must be legalised through an amendment to the scheme.
The proliferation of illegal housing structures can be attributed to the shortage of housing for employees of mining and affiliated companies. The other illegal uses can be attributed to the travel distance to Carletonville.
There is virtually no formal economic activity in Blybank. The potential for new formal retail developments in Blybank is very limited. The total Gross Leasable
Area (GLA) estimate for Blybank is ± 4864 m². Considering that at least half of that potential will always be absorbed by the Carletonville CBD and that at least a further quarter is taken up by spaza
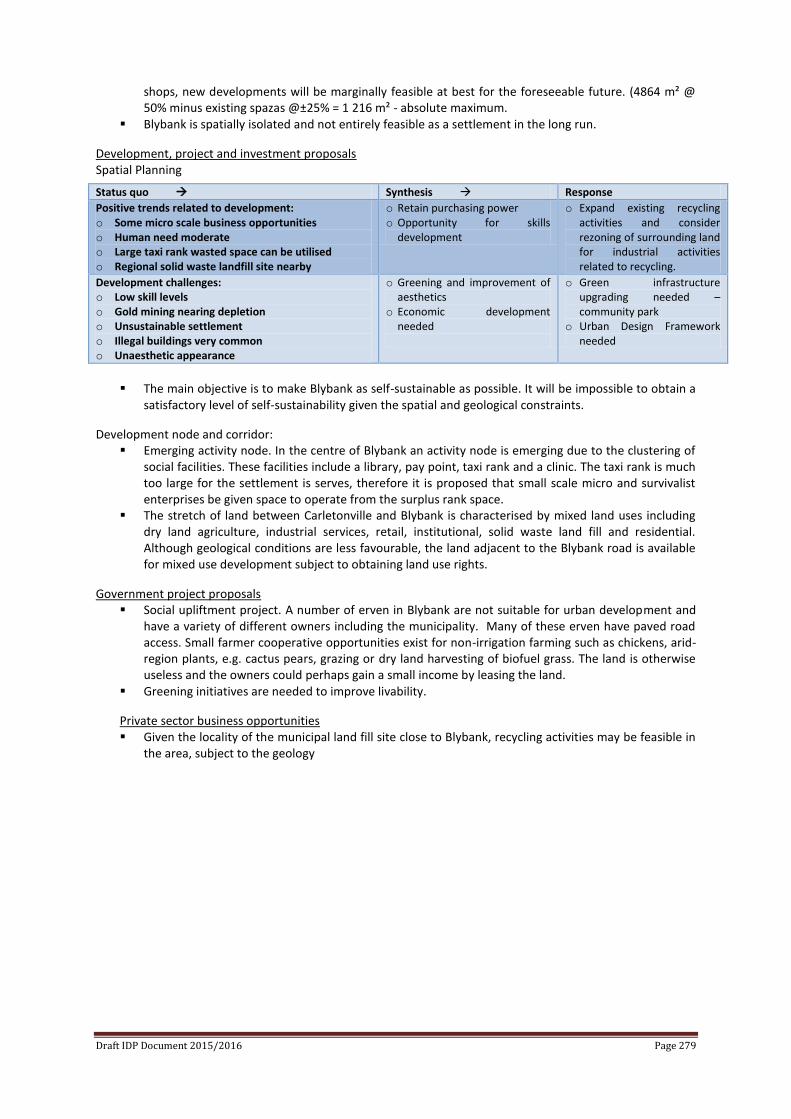
Draft IDP Document 2015/2016 Page 279
shops, new developments will be marginally feasible at best for the foreseeable future. (4864 m² @ 50% minus existing spazas @±25% = 1 216 m² - absolute maximum.
Blybank is spatially isolated and not entirely feasible as a settlement in the long run.
Development, project and investment proposals Spatial Planning
The main objective is to make Blybank as self-sustainable as possible. It will be impossible to obtain a
satisfactory level of self-sustainability given the spatial and geological constraints.
Development node and corridor: Emerging activity node. In the centre of Blybank an activity node is emerging due to the clustering of
social facilities. These facilities include a library, pay point, taxi rank and a clinic. The taxi rank is much too large for the settlement is serves, therefore it is proposed that small scale micro and survivalist enterprises be given space to operate from the surplus rank space.
The stretch of land between Carletonville and Blybank is characterised by mixed land uses including dry land agriculture, industrial services, retail, institutional, solid waste land fill and residential. Although geological conditions are less favourable, the land adjacent to the Blybank road is available for mixed use development subject to obtaining land use rights.
Government project proposals Social upliftment project. A number of erven in Blybank are not suitable for urban development and
have a variety of different owners including the municipality. Many of these erven have paved road access. Small farmer cooperative opportunities exist for non-irrigation farming such as chickens, arid-region plants, e.g. cactus pears, grazing or dry land harvesting of biofuel grass. The land is otherwise useless and the owners could perhaps gain a small income by leasing the land.
Greening initiatives are needed to improve livability.
Private sector business opportunities Given the locality of the municipal land fill site close to Blybank, recycling activities may be feasible in
the area, subject to the geology
Status quo Synthesis Response
Positive trends related to development: o Some micro scale business opportunities o Human need moderate o Large taxi rank wasted space can be utilised o Regional solid waste landfill site nearby
o Retain purchasing power o Opportunity for skills
development
o Expand existing recycling activities and consider rezoning of surrounding land for industrial activities related to recycling.
Development challenges: o Low skill levels o Gold mining nearing depletion o Unsustainable settlement o Illegal buildings very common o Unaesthetic appearance
o Greening and improvement of aesthetics
o Economic development needed
o Green infrastructure upgrading needed – community park
o Urban Design Framework needed
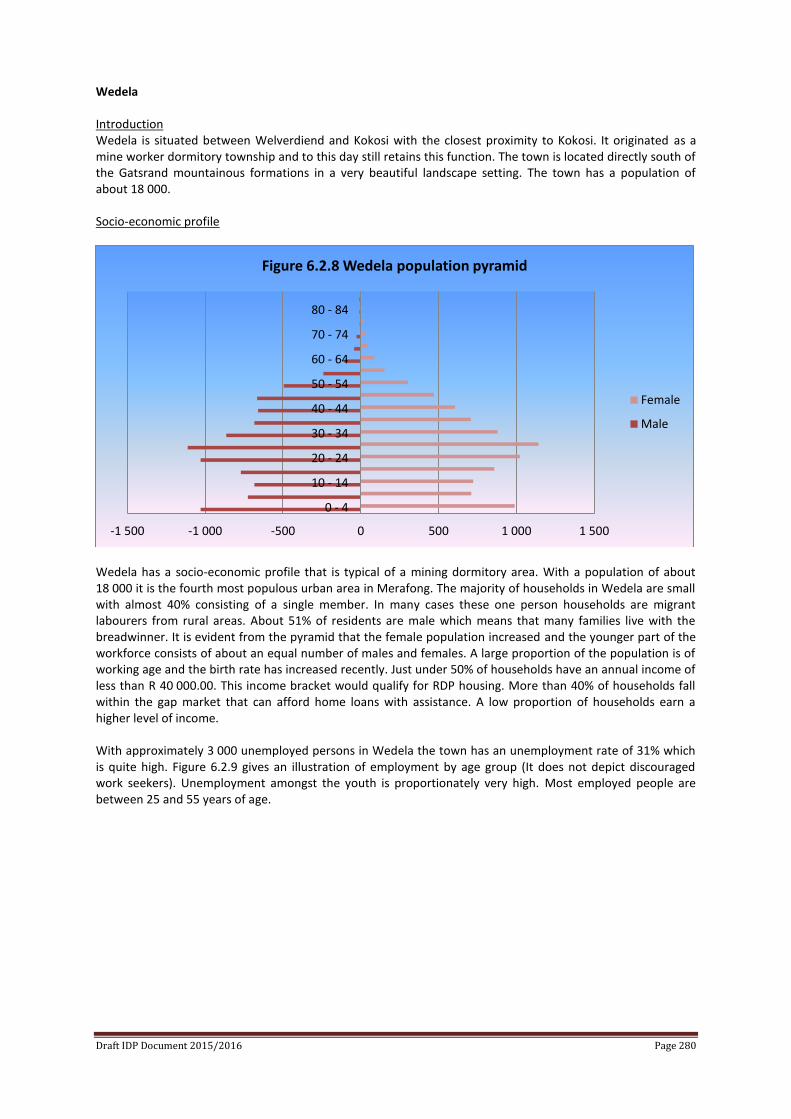
Draft IDP Document 2015/2016 Page 280
Wedela Introduction Wedela is situated between Welverdiend and Kokosi with the closest proximity to Kokosi. It originated as a mine worker dormitory township and to this day still retains this function. The town is located directly south of the Gatsrand mountainous formations in a very beautiful landscape setting. The town has a population of about 18 000. Socio-economic profile
Wedela has a socio-economic profile that is typical of a mining dormitory area. With a population of about 18 000 it is the fourth most populous urban area in Merafong. The majority of households in Wedela are small with almost 40% consisting of a single member. In many cases these one person households are migrant labourers from rural areas. About 51% of residents are male which means that many families live with the breadwinner. It is evident from the pyramid that the female population increased and the younger part of the workforce consists of about an equal number of males and females. A large proportion of the population is of working age and the birth rate has increased recently. Just under 50% of households have an annual income of less than R 40 000.00. This income bracket would qualify for RDP housing. More than 40% of households fall within the gap market that can afford home loans with assistance. A low proportion of households earn a higher level of income. With approximately 3 000 unemployed persons in Wedela the town has an unemployment rate of 31% which is quite high. Figure 6.2.9 gives an illustration of employment by age group (It does not depict discouraged work seekers). Unemployment amongst the youth is proportionately very high. Most employed people are between 25 and 55 years of age.
-1 500 -1 000 -500 0 500 1 000 1 500
0 - 4
10 - 14
20 - 24
30 - 34
40 - 44
50 - 54
60 - 64
70 - 74
80 - 84
Figure 6.2.8 Wedela population pyramid
Female
Male
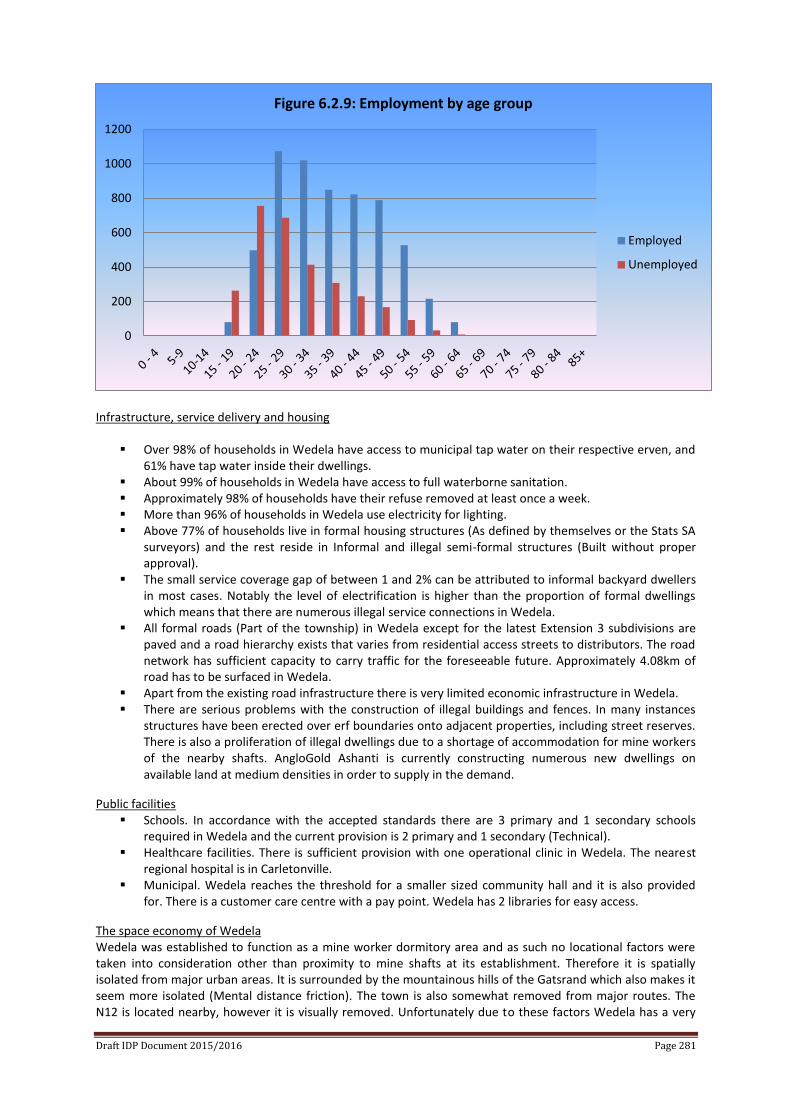
Draft IDP Document 2015/2016 Page 281
Infrastructure, service delivery and housing
Over 98% of households in Wedela have access to municipal tap water on their respective erven, and 61% have tap water inside their dwellings.
About 99% of households in Wedela have access to full waterborne sanitation. Approximately 98% of households have their refuse removed at least once a week. More than 96% of households in Wedela use electricity for lighting. Above 77% of households live in formal housing structures (As defined by themselves or the Stats SA
surveyors) and the rest reside in Informal and illegal semi-formal structures (Built without proper approval).
The small service coverage gap of between 1 and 2% can be attributed to informal backyard dwellers in most cases. Notably the level of electrification is higher than the proportion of formal dwellings which means that there are numerous illegal service connections in Wedela.
All formal roads (Part of the township) in Wedela except for the latest Extension 3 subdivisions are paved and a road hierarchy exists that varies from residential access streets to distributors. The road network has sufficient capacity to carry traffic for the foreseeable future. Approximately 4.08km of road has to be surfaced in Wedela.
Apart from the existing road infrastructure there is very limited economic infrastructure in Wedela. There are serious problems with the construction of illegal buildings and fences. In many instances
structures have been erected over erf boundaries onto adjacent properties, including street reserves. There is also a proliferation of illegal dwellings due to a shortage of accommodation for mine workers of the nearby shafts. AngloGold Ashanti is currently constructing numerous new dwellings on available land at medium densities in order to supply in the demand.
Public facilities Schools. In accordance with the accepted standards there are 3 primary and 1 secondary schools
required in Wedela and the current provision is 2 primary and 1 secondary (Technical). Healthcare facilities. There is sufficient provision with one operational clinic in Wedela. The nearest
regional hospital is in Carletonville. Municipal. Wedela reaches the threshold for a smaller sized community hall and it is also provided
for. There is a customer care centre with a pay point. Wedela has 2 libraries for easy access.
The space economy of Wedela Wedela was established to function as a mine worker dormitory area and as such no locational factors were taken into consideration other than proximity to mine shafts at its establishment. Therefore it is spatially isolated from major urban areas. It is surrounded by the mountainous hills of the Gatsrand which also makes it seem more isolated (Mental distance friction). The town is also somewhat removed from major routes. The N12 is located nearby, however it is visually removed. Unfortunately due to these factors Wedela has a very
0
200
400
600
800
1000
1200
Figure 6.2.9: Employment by age group
Employed
Unemployed
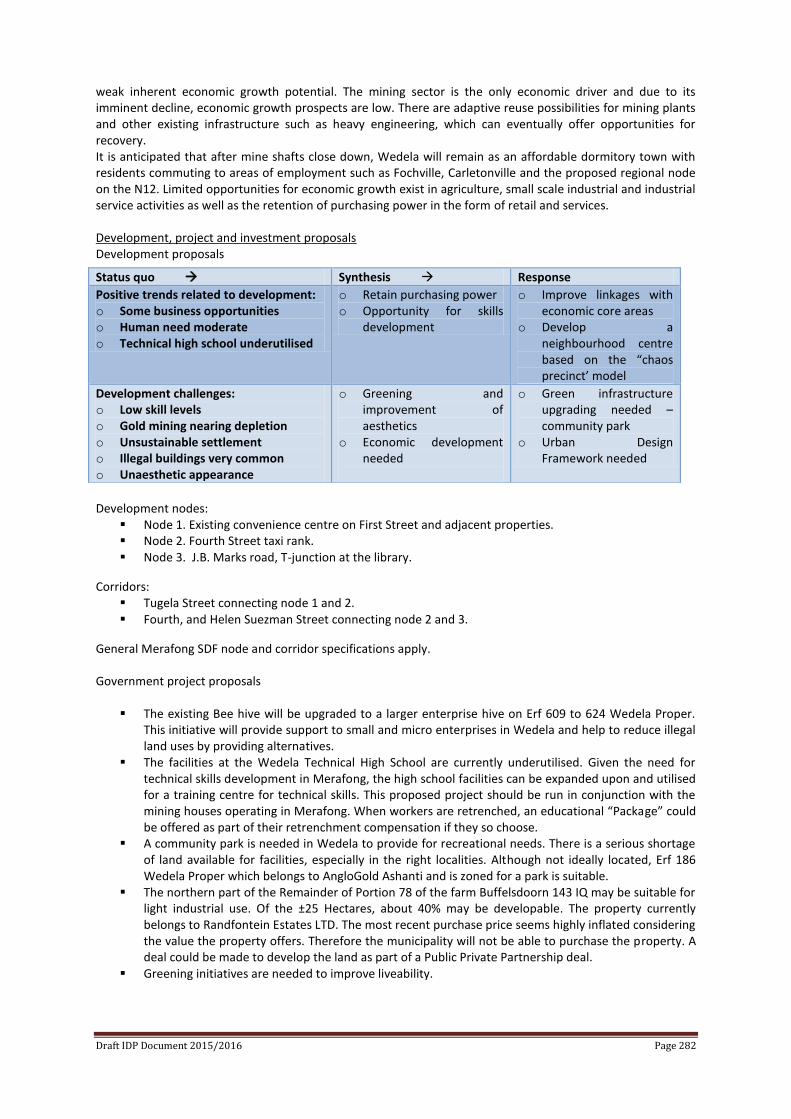
Draft IDP Document 2015/2016 Page 282
weak inherent economic growth potential. The mining sector is the only economic driver and due to its imminent decline, economic growth prospects are low. There are adaptive reuse possibilities for mining plants and other existing infrastructure such as heavy engineering, which can eventually offer opportunities for recovery. It is anticipated that after mine shafts close down, Wedela will remain as an affordable dormitory town with residents commuting to areas of employment such as Fochville, Carletonville and the proposed regional node on the N12. Limited opportunities for economic growth exist in agriculture, small scale industrial and industrial service activities as well as the retention of purchasing power in the form of retail and services. Development, project and investment proposals Development proposals
Development nodes:
Node 1. Existing convenience centre on First Street and adjacent properties. Node 2. Fourth Street taxi rank. Node 3. J.B. Marks road, T-junction at the library.
Corridors: Tugela Street connecting node 1 and 2. Fourth, and Helen Suezman Street connecting node 2 and 3.
General Merafong SDF node and corridor specifications apply. Government project proposals
The existing Bee hive will be upgraded to a larger enterprise hive on Erf 609 to 624 Wedela Proper. This initiative will provide support to small and micro enterprises in Wedela and help to reduce illegal land uses by providing alternatives.
The facilities at the Wedela Technical High School are currently underutilised. Given the need for technical skills development in Merafong, the high school facilities can be expanded upon and utilised for a training centre for technical skills. This proposed project should be run in conjunction with the mining houses operating in Merafong. When workers are retrenched, an educational “Package” could be offered as part of their retrenchment compensation if they so choose.
A community park is needed in Wedela to provide for recreational needs. There is a serious shortage of land available for facilities, especially in the right localities. Although not ideally located, Erf 186 Wedela Proper which belongs to AngloGold Ashanti and is zoned for a park is suitable.
The northern part of the Remainder of Portion 78 of the farm Buffelsdoorn 143 IQ may be suitable for light industrial use. Of the ±25 Hectares, about 40% may be developable. The property currently belongs to Randfontein Estates LTD. The most recent purchase price seems highly inflated considering the value the property offers. Therefore the municipality will not be able to purchase the property. A deal could be made to develop the land as part of a Public Private Partnership deal.
Greening initiatives are needed to improve liveability.
Status quo Synthesis Response
Positive trends related to development: o Some business opportunities o Human need moderate o Technical high school underutilised
o Retain purchasing power o Opportunity for skills
development
o Improve linkages with economic core areas
o Develop a neighbourhood centre based on the “chaos precinct’ model
Development challenges: o Low skill levels o Gold mining nearing depletion o Unsustainable settlement o Illegal buildings very common o Unaesthetic appearance
o Greening and improvement of aesthetics
o Economic development needed
o Green infrastructure upgrading needed – community park
o Urban Design Framework needed
Draft IDP Document 2015/2016 Page 283
Private sector project possibilities The consumer market of Wedela can be broken up into the following segments:
LSM 1-5 = 22.1%
LSM 6-9 = 78.3%
LSM 10-10+ = 0,45%
From the available data it is estimated that with a 25% market share, a large convenience centre or a small neighbourhood centre with a GLA of about 5 500 m² is feasible. There is virtually no formal retail space currently available in Wedela and given the large proportion of the market taken up by the LSM 6-9 segment, a new retail offering seems highly feasible. At a coverage rate of 40% a property size of about 14 000 m² will be required. The coverage and parking requirements can be altered with application for the land use rights. Currently Merafong Municipality does not own any suitable properties in Wedela; however private land may be available.
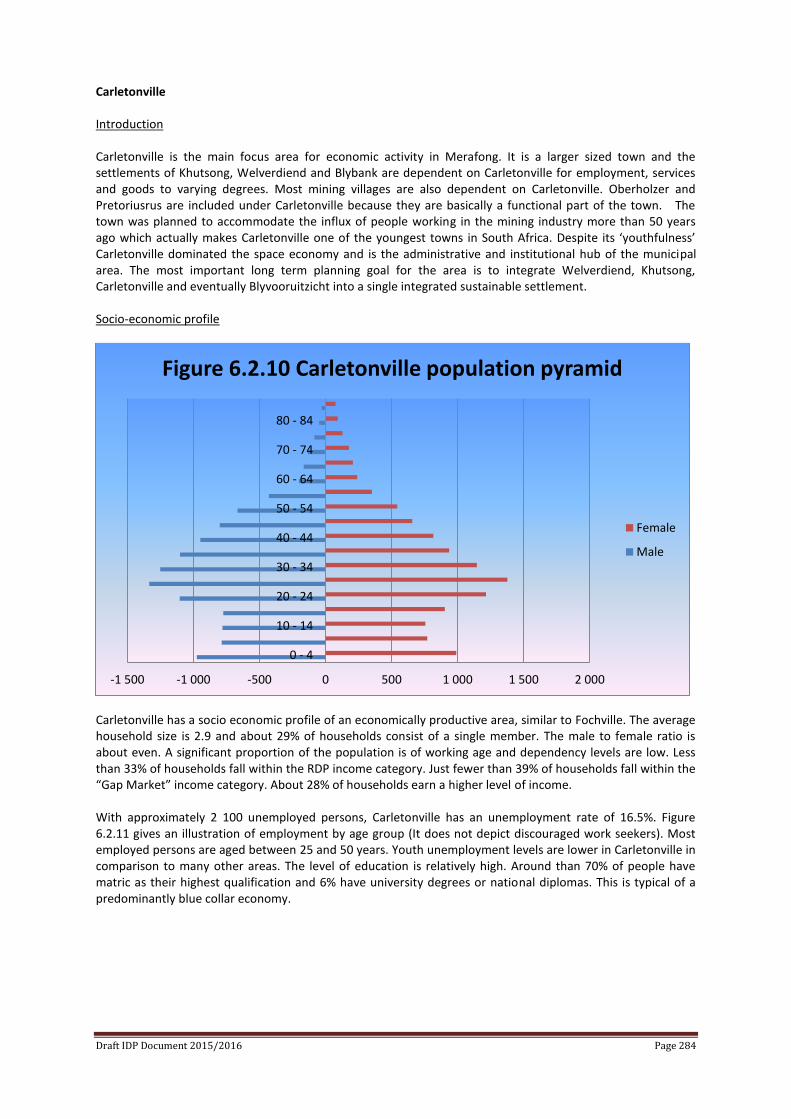
Draft IDP Document 2015/2016 Page 284
Carletonville Introduction Carletonville is the main focus area for economic activity in Merafong. It is a larger sized town and the settlements of Khutsong, Welverdiend and Blybank are dependent on Carletonville for employment, services and goods to varying degrees. Most mining villages are also dependent on Carletonville. Oberholzer and Pretoriusrus are included under Carletonville because they are basically a functional part of the town. The town was planned to accommodate the influx of people working in the mining industry more than 50 years ago which actually makes Carletonville one of the youngest towns in South Africa. Despite its ‘youthfulness’ Carletonville dominated the space economy and is the administrative and institutional hub of the municipal area. The most important long term planning goal for the area is to integrate Welverdiend, Khutsong, Carletonville and eventually Blyvooruitzicht into a single integrated sustainable settlement. Socio-economic profile
Carletonville has a socio economic profile of an economically productive area, similar to Fochville. The average household size is 2.9 and about 29% of households consist of a single member. The male to female ratio is about even. A significant proportion of the population is of working age and dependency levels are low. Less than 33% of households fall within the RDP income category. Just fewer than 39% of households fall within the “Gap Market” income category. About 28% of households earn a higher level of income. With approximately 2 100 unemployed persons, Carletonville has an unemployment rate of 16.5%. Figure 6.2.11 gives an illustration of employment by age group (It does not depict discouraged work seekers). Most employed persons are aged between 25 and 50 years. Youth unemployment levels are lower in Carletonville in comparison to many other areas. The level of education is relatively high. Around than 70% of people have matric as their highest qualification and 6% have university degrees or national diplomas. This is typical of a predominantly blue collar economy.
-1 500 -1 000 -500 0 500 1 000 1 500 2 000
0 - 4
10 - 14
20 - 24
30 - 34
40 - 44
50 - 54
60 - 64
70 - 74
80 - 84
Figure 6.2.10 Carletonville population pyramid
Female
Male
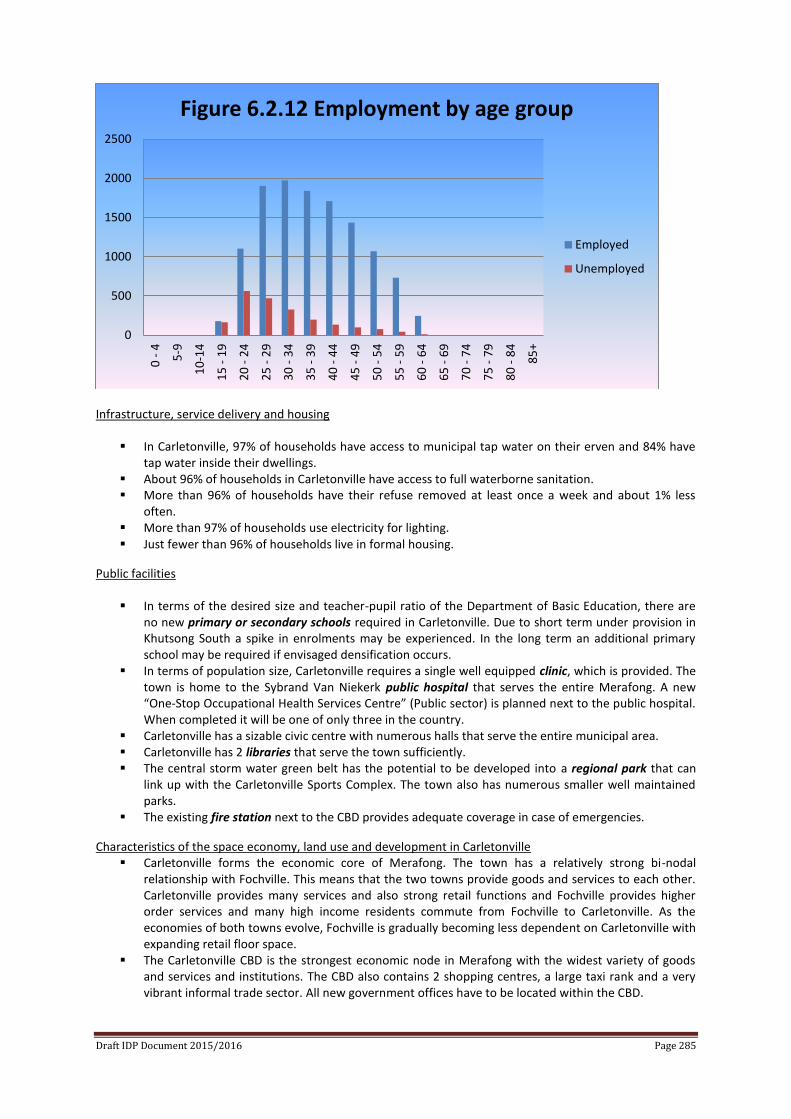
Draft IDP Document 2015/2016 Page 285
Infrastructure, service delivery and housing
In Carletonville, 97% of households have access to municipal tap water on their erven and 84% have tap water inside their dwellings.
About 96% of households in Carletonville have access to full waterborne sanitation. More than 96% of households have their refuse removed at least once a week and about 1% less
often. More than 97% of households use electricity for lighting. Just fewer than 96% of households live in formal housing.
Public facilities
In terms of the desired size and teacher-pupil ratio of the Department of Basic Education, there are no new primary or secondary schools required in Carletonville. Due to short term under provision in Khutsong South a spike in enrolments may be experienced. In the long term an additional primary school may be required if envisaged densification occurs.
In terms of population size, Carletonville requires a single well equipped clinic, which is provided. The town is home to the Sybrand Van Niekerk public hospital that serves the entire Merafong. A new “One-Stop Occupational Health Services Centre” (Public sector) is planned next to the public hospital. When completed it will be one of only three in the country.
Carletonville has a sizable civic centre with numerous halls that serve the entire municipal area. Carletonville has 2 libraries that serve the town sufficiently. The central storm water green belt has the potential to be developed into a regional park that can
link up with the Carletonville Sports Complex. The town also has numerous smaller well maintained parks.
The existing fire station next to the CBD provides adequate coverage in case of emergencies.
Characteristics of the space economy, land use and development in Carletonville Carletonville forms the economic core of Merafong. The town has a relatively strong bi-nodal
relationship with Fochville. This means that the two towns provide goods and services to each other. Carletonville provides many services and also strong retail functions and Fochville provides higher order services and many high income residents commute from Fochville to Carletonville. As the economies of both towns evolve, Fochville is gradually becoming less dependent on Carletonville with expanding retail floor space.
The Carletonville CBD is the strongest economic node in Merafong with the widest variety of goods and services and institutions. The CBD also contains 2 shopping centres, a large taxi rank and a very vibrant informal trade sector. All new government offices have to be located within the CBD.
0
500
1000
1500
2000
25000
- 4
5-9
10
-14
15
- 1
9
20
- 2
4
25
- 2
9
30
- 3
4
35
- 3
9
40
- 4
4
45
- 4
9
50
- 5
4
55
- 5
9
60
- 6
4
65
- 6
9
70
- 7
4
75
- 7
9
80
- 8
4
85
+
Figure 6.2.12 Employment by age group
Employed
Unemployed
Draft IDP Document 2015/2016 Page 286
A process of informal trade infiltration and succession is taking place from the taxi rank spreading southwards. This is a process where informal traders infiltrate an area and cause formal businesses to move out and be replaced by formal businesses trading in lower end products and services, directly in competition with the informal traders. If this happens on a large enough scale severe decay may start to set in because the healthy mix of retail and service gets disturbed. Such morphological disturbances leave gaps for further infiltration and can lead to increased levels of crime and physical decay, causing a reinforcing feedback loop of decay. This process could be sped up by the development of new suburban shopping centres. A new informal trader plan is under compilation which will greatly improve conditions within the CBD and revitalisation initiatives are being considered.
Carletonville is experiencing slow growth in residential development due to geological conditions that add to development costs.
Another constraining factor is that a significant proportion of potential development land belongs to mining companies in the form of single residential houses. Because mining companies are not interested in selling, that land will be ‘frozen’ in the current state.
The area that experiences the highest demand for housing development is Extension 16 because it has been found to be geologically less risky.
There are 2 industrial nodes in the greater Carletonville. The Oberholzer node along Station Street is mostly focused on industrial service activities and Carletonville Extension 6 more on actual fabrication. An expansion is already planned (Extension 14). A need for warehousing and mixed business and industrial space has arisen. Developable land has been identified between Extension 6 and the railway station and a geotechnical investigation has been completed.
A new emerging illegal trend is the construction of backyard rooms without building plans or land use rights. This is a symptom of a shortage of Gap income housing options.
Over the long term it is planned that Carletonville, Khutsong and Welverdiend develop into a single seamless integrated and sustainable settlement. The following planned interventions are currently used as tools to create the planned settlement:
Improved connectivity. A new access road is planned between Kokosi and Fochville in the south which will drastically improve accessibility.
Urban infill and growth areas. Fochville Extension 8 and 14, and Kokosi Extension 6 and 7 will fill in gaps to reshape the settlements into a compact town.
Development nodes. These nodes guide development to desired localities with planned infrastructure upgrades.
Development corridors. These corridors guide development in desired directions and in future will become the main spines of development and routs for public transport. Nodes and corridors will help to create a transit oriented settlement that will improve connectivity and reduce the cost of living.
Containment. Undesirable development is curbed by containment boundaries. A good example is the encroachment of industrial activities on residential areas in the south of Fochville.
Public transport is provided by private taxi and bus operators. The West Rand district is looking into the possibilities of establishing a Bus Rapid Transit system in the west rand. The municipality is planning to reshape urban areas in Merafong into transit oriented settlements where public transport is highly accessible and affordable, thus reducing costs and increasing urban efficiency. Refer to Nodes and corridors.
Greening initiatives are needed to improve liveability.
Draft IDP Document 2015/2016 Page 287
Development, project and investment proposals Development nodes:
The CBD is the largest economic node in Merafong. In the near future revitalisation initiatives will
target this node in order to create a more business friendly environment and stimulate growth. New government offices have to locate in the CBD and residential development is encouraged.
The Oberholzer node started out as a retail strip and evolved into more complicated district node. The node should be allowed to grow along Van Zyl Smit Street and Ada Street.
The node at the intersection of Onyx Drive and Paul Kruger Street consists of a hyper market centre, a car dealership, a public garage, a few shops and the Carletonville Sports Complex. This node has expansion potential, subject to geological suitability.
Two smaller emerging nodes are located along Annan Road. Mixed land uses are encouraged at these nodes.
Development Corridors: The entire Annan Road and Station Street form the structural spine of Carletonville and also extends
through Khutsong South to Welverdiend. From the Southern tip of Annan to the CBD dwelling house offices are encouraged. From the CBD northwards turning west on Station Street Industrial activities dominate. Along Station Street industrial and business land uses are encouraged and directly south of Station Street business uses are encouraged.
The Onyx Drive corridor extends from the CBD to the Shoprite node with dwelling house offices encouraged.
Along Ada Street business uses are encouraged that will link up with the Oberholzer node. Infrastructure upgrading:
Tree planting to create tree-lined boulevards. Corridors are to be upgraded first.
Status quo Synthesis Response
Positive trends related to development: o Largest economic nodes o Demand for warehousing o Large pool of technical skills o Best linkages to other regions o High level of income per
household o Low unemployment o Demand for housing
o Economic core area o Opportunity to expand
industrial base o Opportunity to expand
residential areas and supportive land uses.
o Improve linkages with economically depressed areas
o Enable economic growth through development nodes and corridors with improved infrastructure and appropriate land use management
Development challenges: o Geological constraints o Land belongs to mining
companies o Illegal buildings o Deteriorating appearance of
CBD o Stagnating business growth o Congestion at taxi rank o Industrial development
opportunities in Carletonville unknown
o Lack of green infrastructure and general appearance of the town is lacking
o Cost of development o Infrastructure upgrading
needed o Industrial development ‘kick-
start’, incentives and marketing needed
o CBD revitalisation needed o New taxi rank required o Support for residential
densification needed o Mine owned land frozen o Greening and improvement
of aesthetics
o Water Services Master Plan under compilation to facilitate informed decisions on infrastructure improvements
o Proposal: Growth management strategy to follow Water Services Master Plan
o Blanket geotechnical investigation to be done for CBD and densification areas.
o Negotiation with mines needed to release critical land parcels.
o Proposal: Develop investment incentive scheme linked to spatial development zones and upgrade infrastructure.
o Green infrastructure upgrading needed
o Urban Design Framework needed
Draft IDP Document 2015/2016 Page 288
Paving for pedestrians in remaining unpaved stretches. Bulk engineering services should be channeled through these corridors to serve increased
densities and capture economies of scale if and when required. Public transport pick-up points should be located along these routes at approximately 1 km
intervals. In areas of high pedestrian volumes, traffic calming measures should be put in place.
Especially in the CBD.
Land uses:
Business land uses are encouraged. The land use rights must be obtained if necessary. No industrial uses unless stated otherwise.
It should be noted that not all areas along corridors are earmarked for development simultaneously as this would create a situation where certain areas experience decay. As the economy grows more areas along corridors and nodes are ‘released’ for redevelopment. Therefore refer to the SDF main map for the distinction between current and proposed development areas and also refer to the guidelines for nodes and corridors.
Future institutional uses including those of the municipality, state and NGOs should be developed along or near corridors and nodes, except uses that have a naturally dispersed pattern such as churches.
In future development corridors will form the spines of the public transport network with pick-up and drop-off facilities concentrated along these routes.
Generally land use intensification is promoted along corridors. This will create areas that are safer due to higher levels of activity.
Businesses that sell alcohol for consumption on the premises should be clustered along corridors and at nodes to facilitate minimal disturbance of quieter residential areas and for easy patrolling by police.
Government project proposals The proposed mixed industrial and business node on Portion 53 of Wonderfontein 103 I.Q. should be
developed to supply the demand for land. A geotechnical investigation has been completed. This node could fulfill an important logistical function and open up more opportunities and reduce bottlenecks.
The proposal to build a new taxi rank for regional passenger arrivals and busses could be located on Portion 53 as well.
With the development of the Gold reef mall the revitalisation of the Carletonville CBD will become more important. This is a major priority for Carletonville.
Carletonville requires its green infrastructure to be upgraded, especially the open space system. Ways to capture mine tailings sediment such as retention ponds have to be investigated.
Greening initiatives are needed to improve liveability.
Private sector business opportunities The consumer market in Carletonville can be broken up into the following segments:
LSM 1-5 = 14.1% LSM 6-9 = 54.8% LSM 10-10+ = 21.8%
A survey of current retail space in Carletonville is required to estimate expansion potential. Such a survey has not been done and therefore no opinion can be presented.
Several industrial erven will become available in the near future in Carletonville Extension 14. These erven offer opportunities for small to large enterprises to establish.
Supportive land uses are required at the proposed new taxi rank, most notably some retail activities and a public garage.
The proposed new mixed business and industrial development next to the taxi rank will fulfill the need for commercial space and will have the opportunity to develop into a logistics node for the sub-region. The existing railway should be branched to provide better access, or a loading facility must be constructed with access to all businesses in the development.
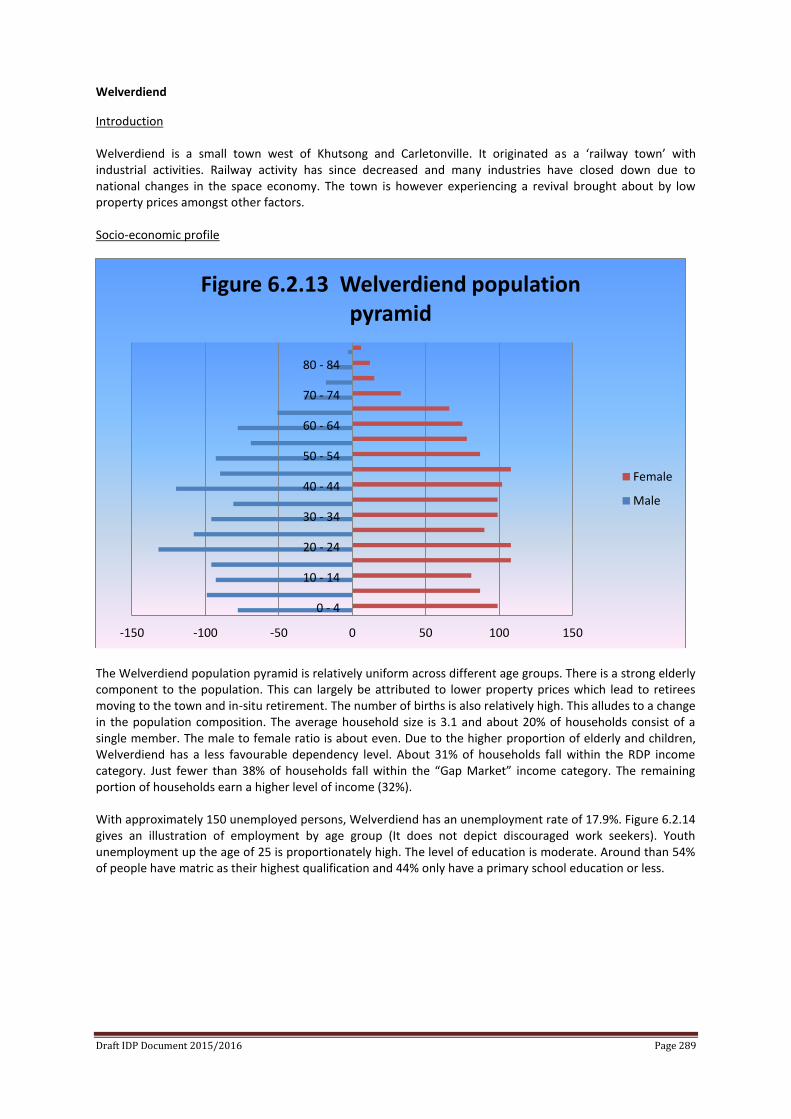
Draft IDP Document 2015/2016 Page 289
Welverdiend
Introduction Welverdiend is a small town west of Khutsong and Carletonville. It originated as a ‘railway town’ with industrial activities. Railway activity has since decreased and many industries have closed down due to national changes in the space economy. The town is however experiencing a revival brought about by low property prices amongst other factors. Socio-economic profile
The Welverdiend population pyramid is relatively uniform across different age groups. There is a strong elderly component to the population. This can largely be attributed to lower property prices which lead to retirees moving to the town and in-situ retirement. The number of births is also relatively high. This alludes to a change in the population composition. The average household size is 3.1 and about 20% of households consist of a single member. The male to female ratio is about even. Due to the higher proportion of elderly and children, Welverdiend has a less favourable dependency level. About 31% of households fall within the RDP income category. Just fewer than 38% of households fall within the “Gap Market” income category. The remaining portion of households earn a higher level of income (32%). With approximately 150 unemployed persons, Welverdiend has an unemployment rate of 17.9%. Figure 6.2.14 gives an illustration of employment by age group (It does not depict discouraged work seekers). Youth unemployment up the age of 25 is proportionately high. The level of education is moderate. Around than 54% of people have matric as their highest qualification and 44% only have a primary school education or less.
-150 -100 -50 0 50 100 150
0 - 4
10 - 14
20 - 24
30 - 34
40 - 44
50 - 54
60 - 64
70 - 74
80 - 84
Figure 6.2.13 Welverdiend population pyramid
Female
Male
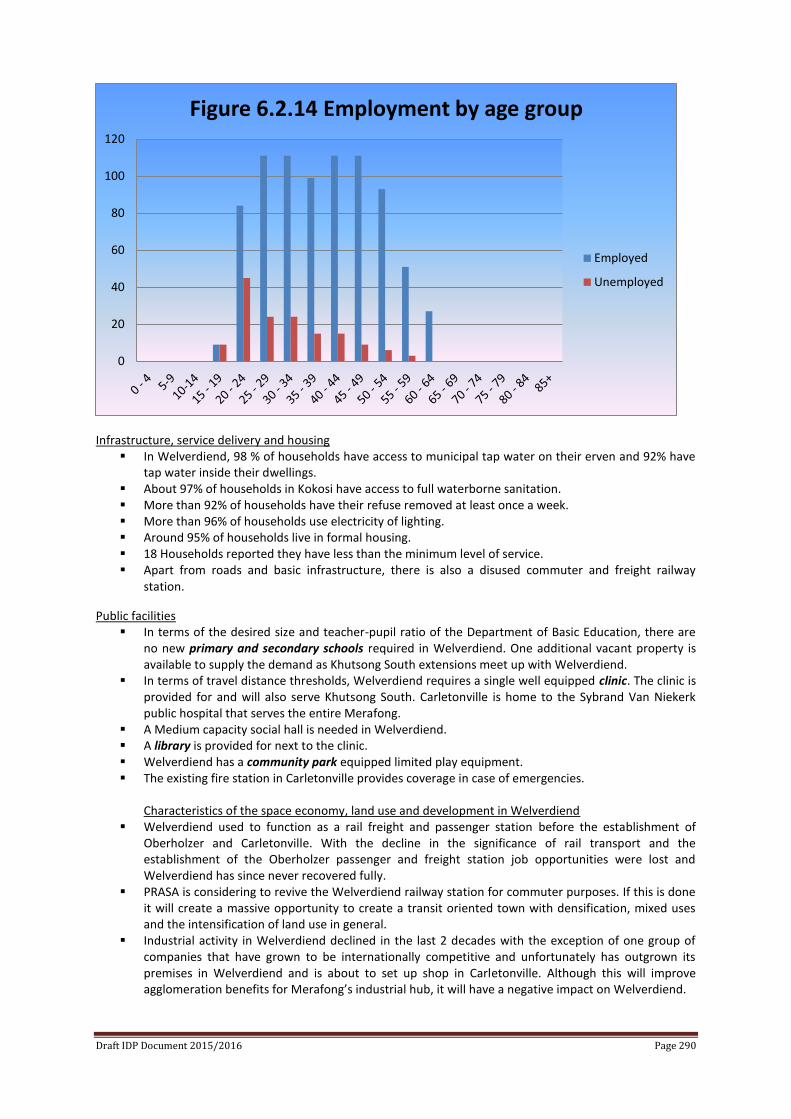
Draft IDP Document 2015/2016 Page 290
Infrastructure, service delivery and housing In Welverdiend, 98 % of households have access to municipal tap water on their erven and 92% have
tap water inside their dwellings. About 97% of households in Kokosi have access to full waterborne sanitation. More than 92% of households have their refuse removed at least once a week. More than 96% of households use electricity of lighting. Around 95% of households live in formal housing. 18 Households reported they have less than the minimum level of service. Apart from roads and basic infrastructure, there is also a disused commuter and freight railway
station.
Public facilities In terms of the desired size and teacher-pupil ratio of the Department of Basic Education, there are
no new primary and secondary schools required in Welverdiend. One additional vacant property is available to supply the demand as Khutsong South extensions meet up with Welverdiend.
In terms of travel distance thresholds, Welverdiend requires a single well equipped clinic. The clinic is provided for and will also serve Khutsong South. Carletonville is home to the Sybrand Van Niekerk public hospital that serves the entire Merafong.
A Medium capacity social hall is needed in Welverdiend. A library is provided for next to the clinic. Welverdiend has a community park equipped limited play equipment. The existing fire station in Carletonville provides coverage in case of emergencies.
Characteristics of the space economy, land use and development in Welverdiend
Welverdiend used to function as a rail freight and passenger station before the establishment of Oberholzer and Carletonville. With the decline in the significance of rail transport and the establishment of the Oberholzer passenger and freight station job opportunities were lost and Welverdiend has since never recovered fully.
PRASA is considering to revive the Welverdiend railway station for commuter purposes. If this is done it will create a massive opportunity to create a transit oriented town with densification, mixed uses and the intensification of land use in general.
Industrial activity in Welverdiend declined in the last 2 decades with the exception of one group of companies that have grown to be internationally competitive and unfortunately has outgrown its premises in Welverdiend and is about to set up shop in Carletonville. Although this will improve agglomeration benefits for Merafong’s industrial hub, it will have a negative impact on Welverdiend.
0
20
40
60
80
100
120
Figure 6.2.14 Employment by age group
Employed
Unemployed
Draft IDP Document 2015/2016 Page 291
The existing taxi stop is dilapidated and should be upgraded with ablution facilities and a small number of informal trade stalls.
There is however a massive economic development opportunity just west of Welverdiend. Merafong Municipality is currently working on a potential project that could harvest methane gas from waste water (Sewage) from Carletonville, Khutsong and Welverdiend to use as fuel for a power station. In addition to the generation of electricity, by-products will be produced that have industrial, packaging & processing and agricultural applications. The opportunity exists to include a large cattle feedlot into the development that would supply its waste to the energy plant. With this addition the opportunity for a complete beef value chain is created that would include a feedlot, abattoir, packaging and processing plant and refrigeration and logistics.
The Khutsong South Resettlement Program is changing the space economy of the area linking Welverdiend with Carletonville to form a continuous settlement. Welverdiend has a small established business node that will undoubtedly expand with the additional purchasing power of the Khutsong South extensions.
The northern part of Welverdiend should as far as the infrastructure and geology permits be developed into a medium density residential area through subdivisions, consolidations, second dwellings and boarding houses.
Development, project and investment proposals Development nodes:
The existing retail and service street in 10th
ave Welverdiend has a significant proportion of vacancies. However the Khutsong South extensions will soon change the fortunes of this node. This avenue also leads to Welverdiend’ s industrial area which has rental space available. PRASA is considering to revive the Welverdiend railway station for commuter purposes. If this is done it will create a massive opportunity to create a transit oriented town with densification, mixed uses and the intensification of land use in general.
The conditions required to form a new node are improving along Main ave (R559) in the south western part of Welverdiend. Three businesses exist and the municipal library and clinic will soon be complimented by a municipal pay point and will eventually be utilized as a Social Development Cluster.
If development in Welverdiend takes off sufficiently in future, a new mixed use node will be feasible along the R 559 and the D92. This proposed node would actually be a functional extension of the previously mentioned business street.
Development Corridors: The main urban spine that integrates the northern settlements of Welverdiend, Khutsong and
Carletonville starts at the Main ave node and stretches to the proposed Warehousing node in Carletonville.
Infrastructure upgrading along corridors:
Tree planting to create tree-lined boulevards. Corridors are to be upgraded first. Paving for pedestrians and cyclists in remaining unpaved stretches to improve safety,
convenience and aesthetics.
Land uses: Business land uses are encouraged where possible, viable and desirable. The land use rights
must be obtained if necessary. No industrial uses. Future institutional uses including those of the municipality, state and NGOs should be
developed along or near corridors and nodes, except uses that have a naturally dispersed pattern such as churches.
In future development corridors will form the spines of the public transport network with puck-up and drop-off facilities concentrated along these routes.
Generally land use intensification is promoted along corridors. This will create areas that are safer due to higher levels of activity.
Businesses that sell alcohol for consumption on the premises should be clustered along corridors and at nodes to facilitate minimal disturbance of quieter residential areas and for easy patrolling by police.
Draft IDP Document 2015/2016 Page 292
Bulk engineering services should be channeled through these corridors to serve increased densities and capture economies of scale if and when required.
Government project proposals
The proposed waste-to-energy project will create the opportunity for an Eco-Business Park development with industrial and agricultural businesses. It is currently in the pre-feasibility phase.
Social Development Clusters is a new concept developed by Merafong that will include public facilities as well as spaces for NGOs and informal traders (Informal trade, based on the ‘chaos precinct’ concept which could be included in the shopping centre). The following land uses will be accommodated:
Early Childhood Development Centre (Grouping of crèches) Non-Government Organisations (NGOs)/ Community Based Organisations (CBOs) e.g. frail
care centres, disabled centres Community gardens Government facilities Churches SMME’s (Chaos precinct concept) Bee-hive A retail “anchor” and small taxi rank could also be included
Greening initiatives are needed to improve liveability.
Private sector business opportunities
There are a number of industrial buildings available for rent in Welverdiend. The proposed Eco-business Park will offer new opportunities as well.
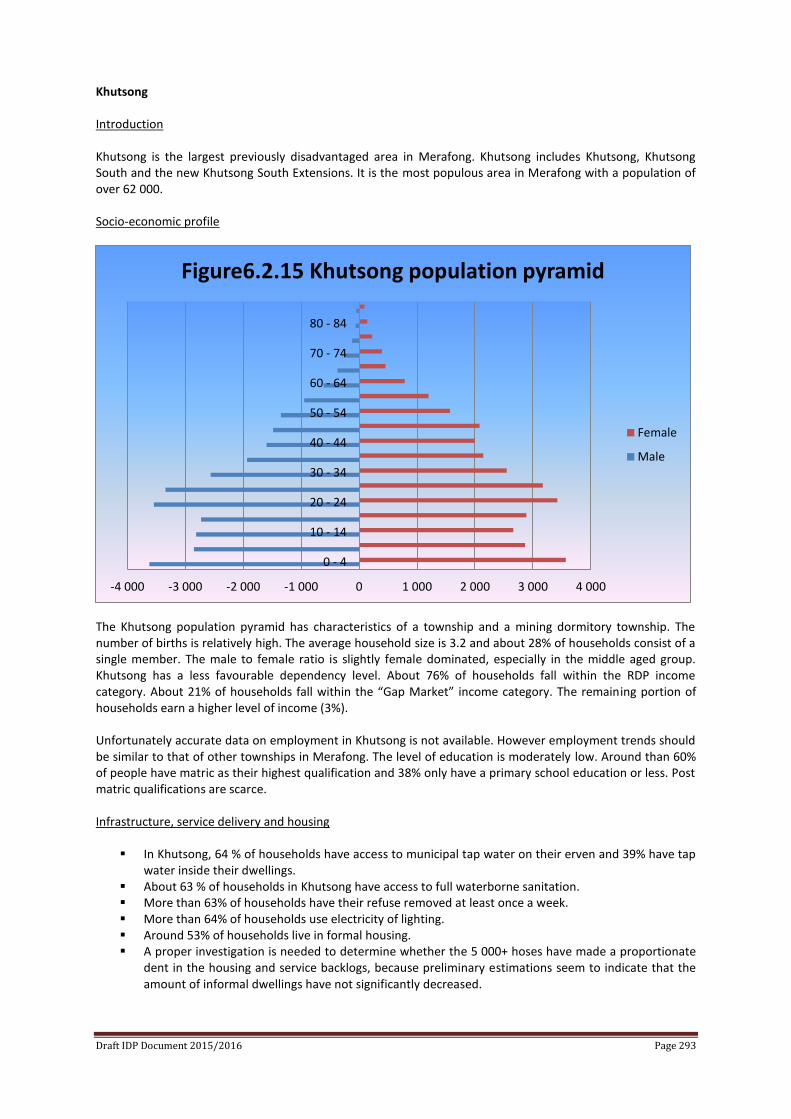
Draft IDP Document 2015/2016 Page 293
Khutsong Introduction Khutsong is the largest previously disadvantaged area in Merafong. Khutsong includes Khutsong, Khutsong South and the new Khutsong South Extensions. It is the most populous area in Merafong with a population of over 62 000. Socio-economic profile
The Khutsong population pyramid has characteristics of a township and a mining dormitory township. The number of births is relatively high. The average household size is 3.2 and about 28% of households consist of a single member. The male to female ratio is slightly female dominated, especially in the middle aged group. Khutsong has a less favourable dependency level. About 76% of households fall within the RDP income category. About 21% of households fall within the “Gap Market” income category. The remaining portion of households earn a higher level of income (3%). Unfortunately accurate data on employment in Khutsong is not available. However employment trends should be similar to that of other townships in Merafong. The level of education is moderately low. Around than 60% of people have matric as their highest qualification and 38% only have a primary school education or less. Post matric qualifications are scarce. Infrastructure, service delivery and housing
In Khutsong, 64 % of households have access to municipal tap water on their erven and 39% have tap water inside their dwellings.
About 63 % of households in Khutsong have access to full waterborne sanitation. More than 63% of households have their refuse removed at least once a week. More than 64% of households use electricity of lighting. Around 53% of households live in formal housing. A proper investigation is needed to determine whether the 5 000+ hoses have made a proportionate
dent in the housing and service backlogs, because preliminary estimations seem to indicate that the amount of informal dwellings have not significantly decreased.
-4 000 -3 000 -2 000 -1 000 0 1 000 2 000 3 000 4 000
0 - 4
10 - 14
20 - 24
30 - 34
40 - 44
50 - 54
60 - 64
70 - 74
80 - 84
Figure6.2.15 Khutsong population pyramid
Female
Male
Draft IDP Document 2015/2016 Page 294
Public facilities In terms of the desired size and teacher-pupil ratio of the Department of Basic Education, Khutsong
requires at least 2 more primary and 2 more secondary schools in the short to medium term. Properties are available.
In terms of travel distance thresholds, Welverdiend requires another single well equipped clinic. The required land is available. Carletonville is home to the Sybrand Van Niekerk public hospital that serves the entire Merafong.
Khutsong requires at least 1 large community hall and at least 2 smaller capacity halls. Land is available and these should be positioned to reduce traveling times.
A library is provided for in Khutsong South Extension 2, which brings the total amount of libraries to a satisfactory level.
A community park is planned in Khutsong South and a regional park next to the river. Another community park is planned for the new extensions.
The existing fire station in Carletonville provides coverage in case of emergencies.
Characteristics of the space economy, land use and development in Kokosi Khutsong has some of the worst affected areas in terms of dolomite and a building moratorium still
exists on new construction. A new blanket geotechnical investigation will soon shed light on the situation.
There is very little formal economic activity in Khutsong. The potential exists to increase the amount of formal businesses, especially once geotechnical problems have been reduced.
Currently Khutsong and Khutsong South Proper has weak access to the rest of Merafong, however a new bridge is proposed that would improve the linkage with Carletonville and create new economic opportunities as well. Given the fact that the high number of unemployed people in Khutsong will have to find employment at more economically viable localities makes this link very important.
The Khutsong South Resettlement Program is changing the space economy of the area linking Welverdiend with Carletonville to form a continuous integrated settlement. This process will vastly improve urban efficiency in the area and help to reduce the cost of living, the cost of doing business and also reduce maintenance costs for the municipality.
Once more knowledge is gained about the geotechnical conditions in Khutsong, new areas will probably open up for development.
Development, project and investment proposals Spatial Planning
The following are the main spatial objectives for Kokosi: To functionally integrate Welverdiend, Khutsong, Khutsong South and Carletonville. To have an economically, socially and environmentally sustainable and prosperous
community through the creation of an environment conducive thereto. The creation of linkages and land development opportunities for housing, social activities &
institutions and economic development.
Development nodes: Development nodes will be feasible at the following localities and should be developed as such:
The Carletonville mall The new link between Khutsong South and the Khutsong South extensions. The intersection at the entrance of old Khutsong The existing node in Sompane drive.
Development Corridors: There are 2 development corridors in Khutsong. Firstly the central development spine that links up
with Carletonville and Welverdiend. Not all localities along the route are developable. Opportunities exist at nodes along the route. Secondly the new link will create a corridor running from the primary spine to the node in Sompane drive.
Infrastructure upgrading: Tree planting to create tree-lined boulevards. Corridors are to be upgraded first. Paving for pedestrians in remaining unpaved stretches.
Land uses:
Draft IDP Document 2015/2016 Page 295
Business land uses are encouraged. The land use rights must be obtained if necessary. No industrial uses.
Future institutional uses including those of the municipality, state and NGOs should be developed along or near corridors and nodes, except uses that have a naturally dispersed pattern such as churches.
In future development corridors will form the spines of the public transport network with pick-up and drop-off facilities concentrated along these routes.
Generally land use intensification is promoted along corridors. This will create areas that are safer due to higher levels of activity.
Businesses that sell alcohol for consumption on the premises should be clustered along corridors and at nodes to facilitate minimal disturbance of quieter residential areas and for easy patrolling by police.
Bulk engineering services should be channeled through these corridors to serve increased densities and capture economies of scale if and when required.
Government project proposals Numerous proposals are made in the Khutsong precinct plan as part of the 26 priority townships
program. Social Development Clusters is a new concept developed by Merafong that will include public facilities
as well as spaces for NGOs and informal traders (Informal trade, based on the ‘chaos precinct’ concept which could be included in the shopping centre). The following land uses will be accommodated:
Early Childhood Development Centre (Grouping of crèches) Non-Government Organisations (NGOs)/ Community Based Organisations (CBOs) e.g. frail
care centres, disabled centres Community gardens Government facilities Churches SMME’s (Chaos precinct concept) Bee-hive A retail “anchor” and small taxi rank could also be included
With the completion of the blanket geotechnical investigation new development areas should be
designated where possible. IMPLEMENTATION PLANS Taking the above development vision into account, together with the analysis of development opportunities within the local economy, a strategic framework with specific development projects per sector can be compiled. The identification of programmes and projects are therefore based on the development opportunities identified in the Opportunity Analysis phase of the Growth and Development Strategy. These projects should not only reflect the development opportunities within each sector, but also tie in with the proposed development vision of a manufacturing hub within Merafong City. The identified potential projects can be grouped into different development thrusts, namely: 1. Agricultural Development
2. Industrial Development
3. Infrastructure Development
4. Business and Services Development
5. Human Resource Development and Empowerment
The thrusts aim at utilizing existing economic strengths and opportunities by transferring these into workable programmes and projects. Under each of the five thrusts, several programmes and projects have been identified.
GAUTENG
MERAFONG
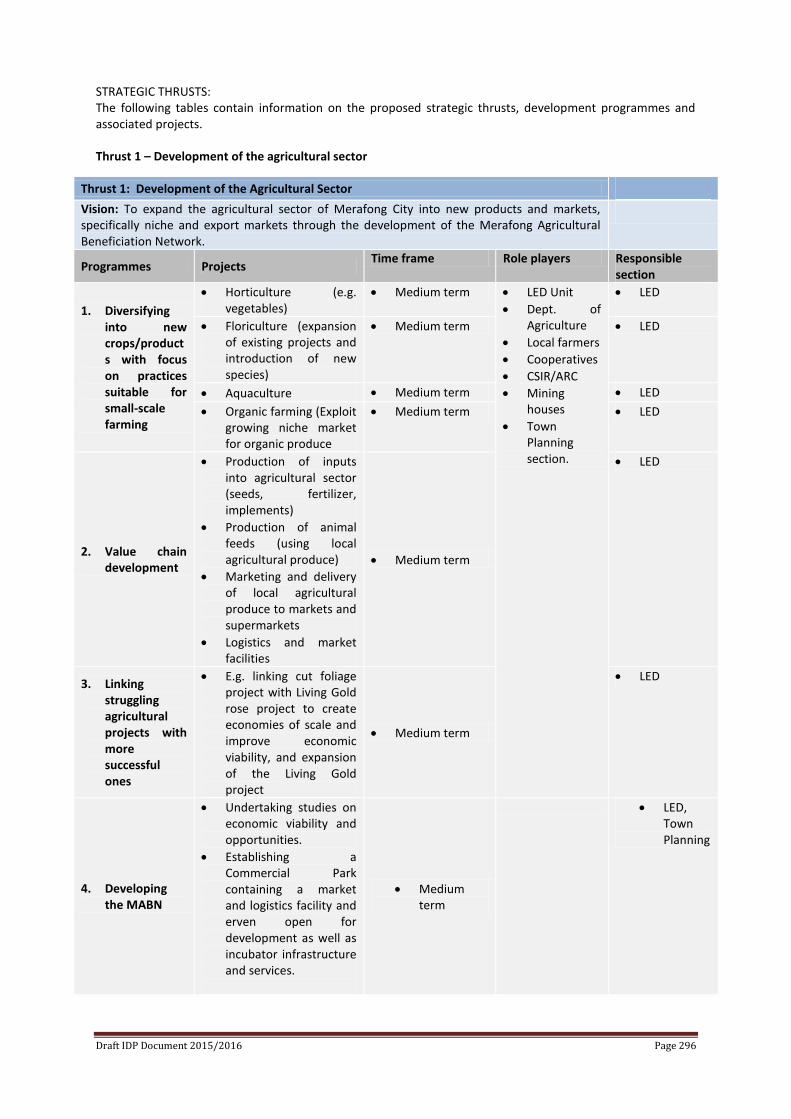
Draft IDP Document 2015/2016 Page 296
STRATEGIC THRUSTS: The following tables contain information on the proposed strategic thrusts, development programmes and associated projects.
Thrust 1 – Development of the agricultural sector
Thrust 1: Development of the Agricultural Sector
Vision: To expand the agricultural sector of Merafong City into new products and markets, specifically niche and export markets through the development of the Merafong Agricultural Beneficiation Network.
Programmes Projects Time frame Role players Responsible
section
1. Diversifying into new crops/products with focus on practices suitable for small-scale farming
Horticulture (e.g. vegetables)
Medium term LED Unit
Dept. of Agriculture
Local farmers
Cooperatives
CSIR/ARC
Mining houses
Town Planning section.
LED
Floriculture (expansion of existing projects and introduction of new species)
Medium term LED
Aquaculture Medium term LED
Organic farming (Exploit growing niche market for organic produce
Medium term LED
2. Value chain development
Production of inputs into agricultural sector (seeds, fertilizer, implements)
Production of animal feeds (using local agricultural produce)
Marketing and delivery of local agricultural produce to markets and supermarkets
Logistics and market facilities
Medium term
LED
3. Linking struggling agricultural projects with more successful ones
E.g. linking cut foliage project with Living Gold rose project to create economies of scale and improve economic viability, and expansion of the Living Gold project
Medium term
LED
4. Developing the MABN
Undertaking studies on economic viability and opportunities.
Establishing a Commercial Park containing a market and logistics facility and erven open for development as well as incubator infrastructure and services.
Medium term
LED, Town Planning
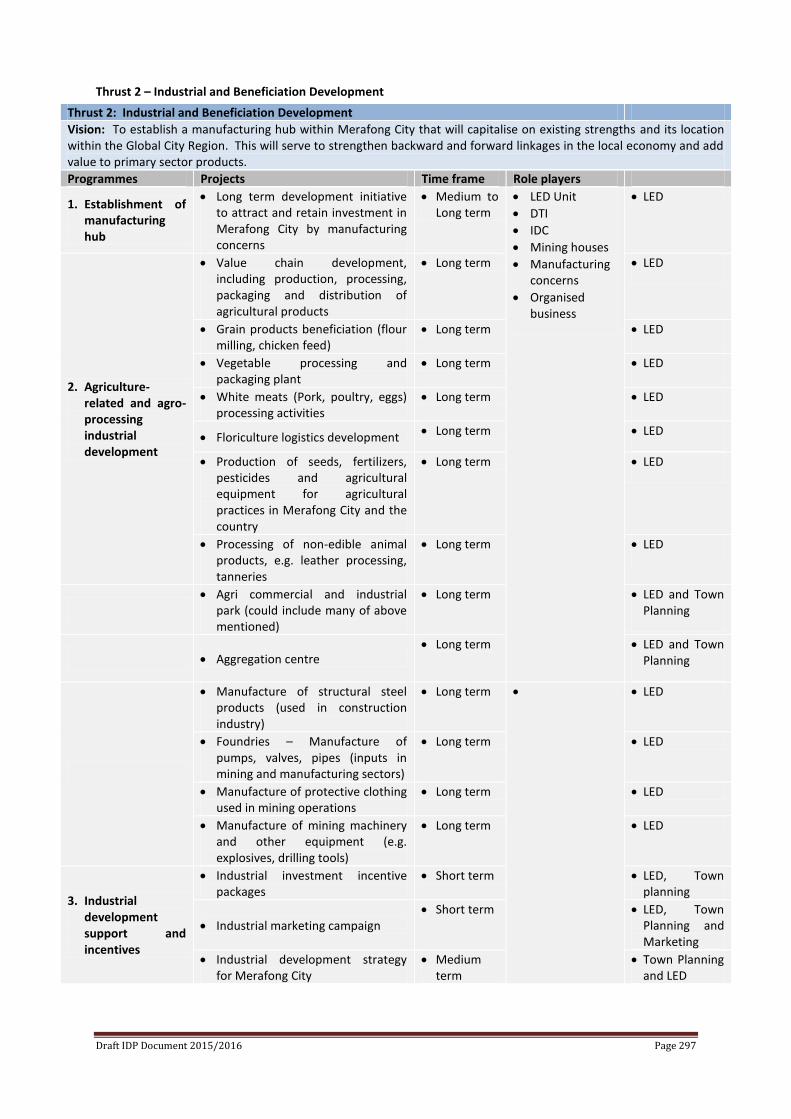
Draft IDP Document 2015/2016 Page 297
Thrust 2 – Industrial and Beneficiation Development
Thrust 2: Industrial and Beneficiation Development
Vision: To establish a manufacturing hub within Merafong City that will capitalise on existing strengths and its location within the Global City Region. This will serve to strengthen backward and forward linkages in the local economy and add value to primary sector products.
Programmes Projects Time frame Role players
1. Establishment of manufacturing hub
Long term development initiative to attract and retain investment in Merafong City by manufacturing concerns
Medium to Long term
LED Unit
DTI
IDC
Mining houses
Manufacturing concerns
Organised business
LED
2. Agriculture-related and agro-processing industrial development
Value chain development, including production, processing, packaging and distribution of agricultural products
Long term LED
Grain products beneficiation (flour milling, chicken feed)
Long term LED
Vegetable processing and packaging plant
Long term LED
White meats (Pork, poultry, eggs) processing activities
Long term LED
Floriculture logistics development Long term LED
Production of seeds, fertilizers, pesticides and agricultural equipment for agricultural practices in Merafong City and the country
Long term LED
Processing of non-edible animal products, e.g. leather processing, tanneries
Long term LED
Agri commercial and industrial
park (could include many of above mentioned)
Long term LED and Town Planning
Aggregation centre Long term LED and Town
Planning
Manufacture of structural steel products (used in construction industry)
Long term LED
Foundries – Manufacture of pumps, valves, pipes (inputs in mining and manufacturing sectors)
Long term LED
Manufacture of protective clothing used in mining operations
Long term LED
Manufacture of mining machinery and other equipment (e.g. explosives, drilling tools)
Long term LED
3. Industrial development support and incentives
Industrial investment incentive packages
Short term LED, Town planning
Industrial marketing campaign Short term LED, Town
Planning and Marketing
Industrial development strategy for Merafong City
Medium term
Town Planning and LED
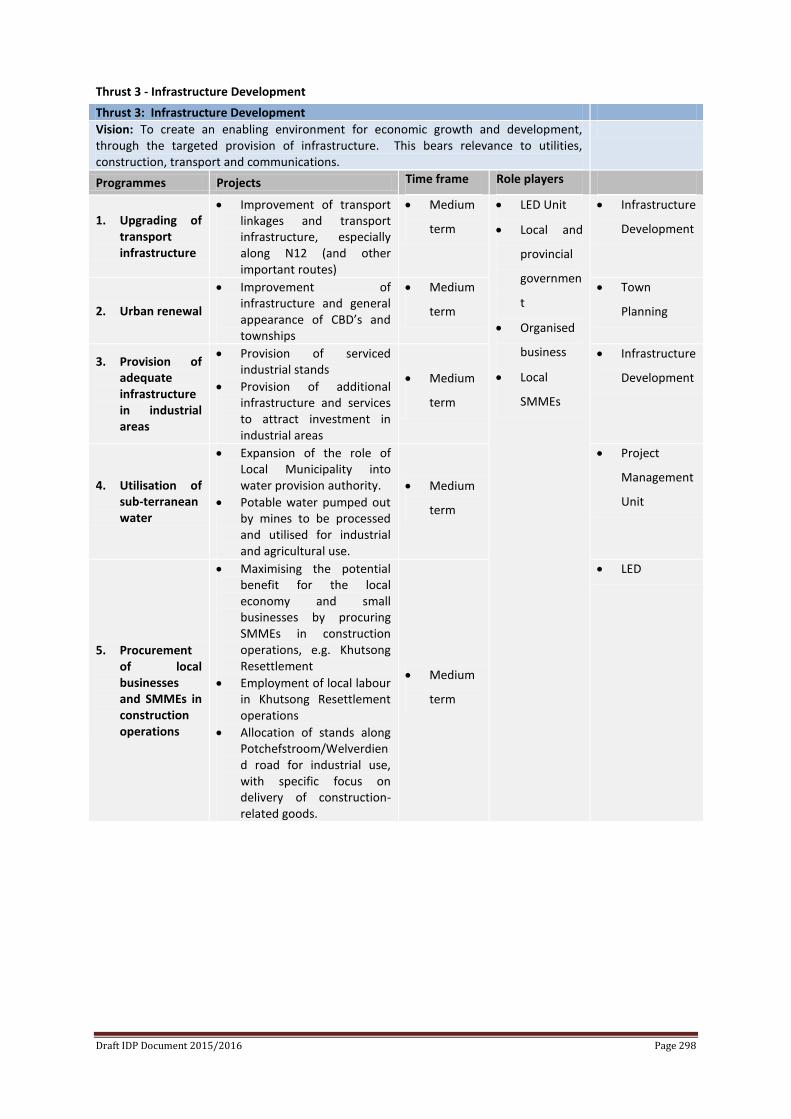
Draft IDP Document 2015/2016 Page 298
Thrust 3 - Infrastructure Development
Thrust 3: Infrastructure Development
Vision: To create an enabling environment for economic growth and development, through the targeted provision of infrastructure. This bears relevance to utilities, construction, transport and communications.
Programmes Projects Time frame Role players
1. Upgrading of transport infrastructure
Improvement of transport linkages and transport infrastructure, especially along N12 (and other important routes)
Medium
term
LED Unit
Local and
provincial
governmen
t
Organised
business
Local
SMMEs
Infrastructure
Development
2. Urban renewal
Improvement of infrastructure and general appearance of CBD’s and townships
Medium
term
Town
Planning
3. Provision of adequate infrastructure in industrial areas
Provision of serviced industrial stands
Provision of additional infrastructure and services to attract investment in industrial areas
Medium
term
Infrastructure
Development
4. Utilisation of sub-terranean water
Expansion of the role of Local Municipality into water provision authority.
Potable water pumped out by mines to be processed and utilised for industrial and agricultural use.
Medium
term
Project
Management
Unit
5. Procurement of local businesses and SMMEs in construction operations
Maximising the potential benefit for the local economy and small businesses by procuring SMMEs in construction operations, e.g. Khutsong Resettlement
Employment of local labour in Khutsong Resettlement operations
Allocation of stands along Potchefstroom/Welverdiend road for industrial use, with specific focus on delivery of construction-related goods.
Medium
term
LED
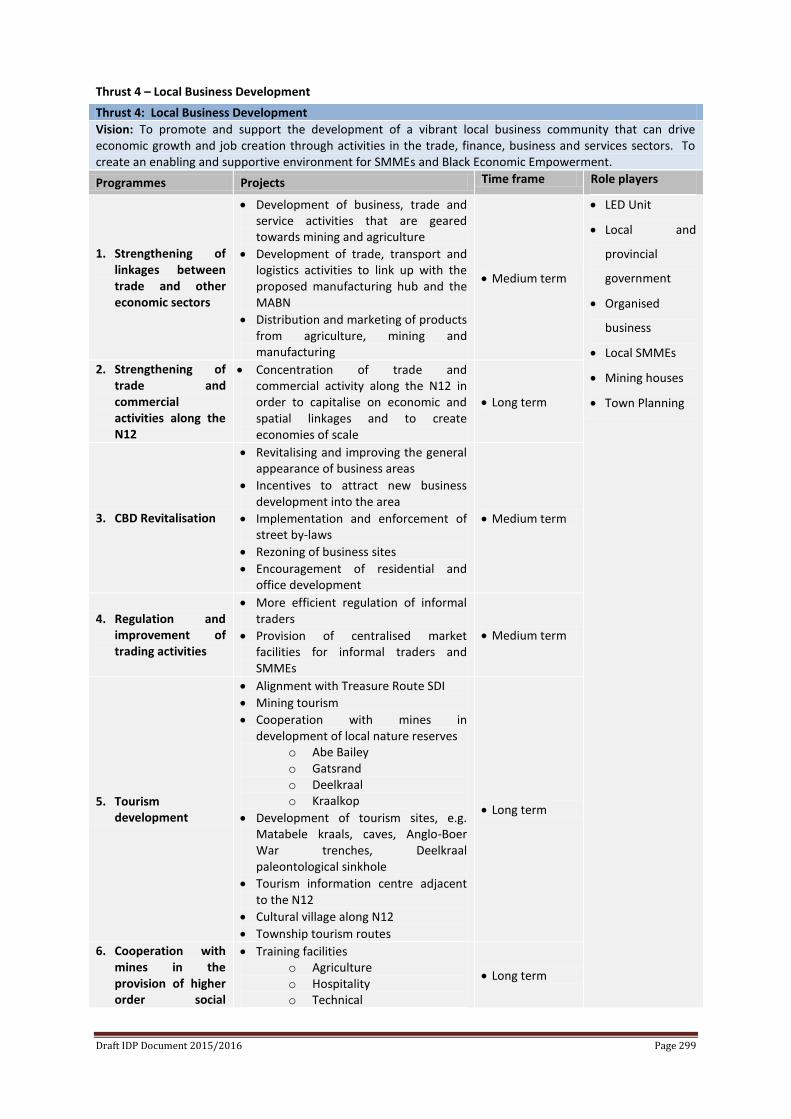
Draft IDP Document 2015/2016 Page 299
Thrust 4 – Local Business Development
Thrust 4: Local Business Development
Vision: To promote and support the development of a vibrant local business community that can drive economic growth and job creation through activities in the trade, finance, business and services sectors. To create an enabling and supportive environment for SMMEs and Black Economic Empowerment.
Programmes Projects Time frame Role players
1. Strengthening of linkages between trade and other economic sectors
Development of business, trade and service activities that are geared towards mining and agriculture
Development of trade, transport and logistics activities to link up with the proposed manufacturing hub and the MABN
Distribution and marketing of products from agriculture, mining and manufacturing
Medium term
LED Unit
Local and
provincial
government
Organised
business
Local SMMEs
Mining houses
Town Planning
2. Strengthening of trade and commercial activities along the N12
Concentration of trade and commercial activity along the N12 in order to capitalise on economic and spatial linkages and to create economies of scale
Long term
3. CBD Revitalisation
Revitalising and improving the general appearance of business areas
Incentives to attract new business development into the area
Implementation and enforcement of street by-laws
Rezoning of business sites
Encouragement of residential and office development
Medium term
4. Regulation and improvement of trading activities
More efficient regulation of informal traders
Provision of centralised market facilities for informal traders and SMMEs
Medium term
5. Tourism development
Alignment with Treasure Route SDI
Mining tourism
Cooperation with mines in development of local nature reserves
o Abe Bailey o Gatsrand o Deelkraal o Kraalkop
Development of tourism sites, e.g. Matabele kraals, caves, Anglo-Boer War trenches, Deelkraal paleontological sinkhole
Tourism information centre adjacent to the N12
Cultural village along N12
Township tourism routes
Long term
6. Cooperation with mines in the provision of higher order social
Training facilities o Agriculture o Hospitality o Technical
Long term
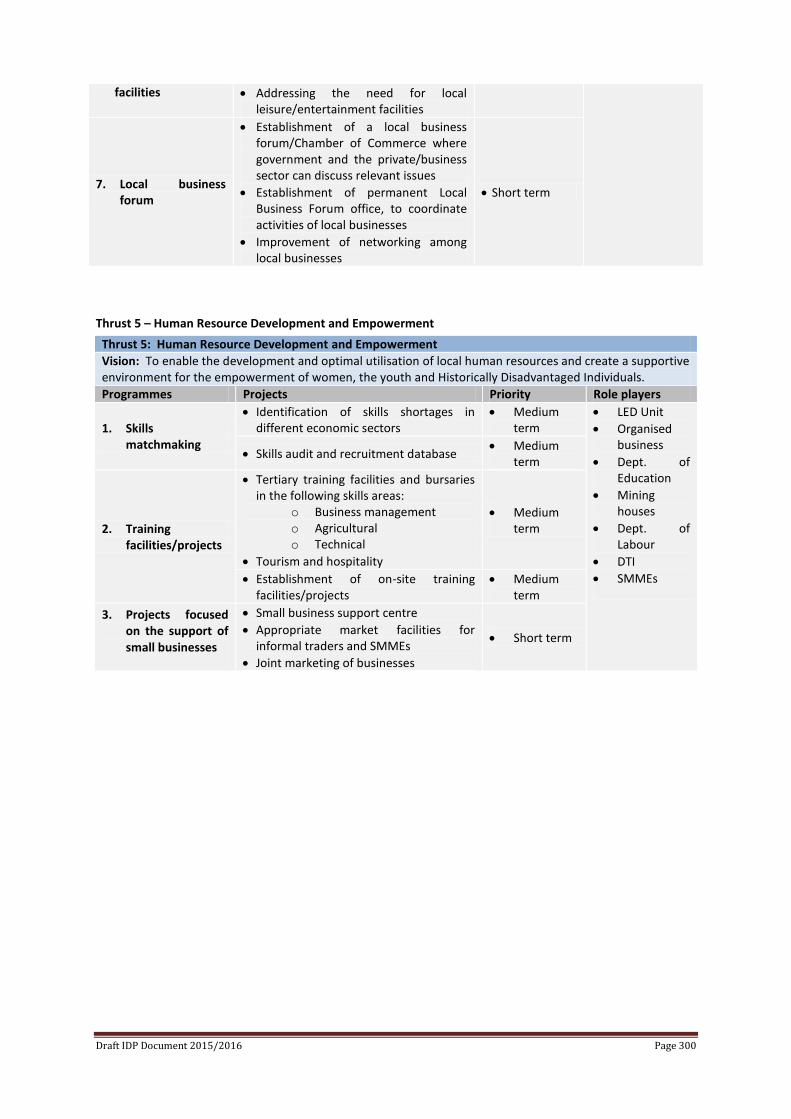
Draft IDP Document 2015/2016 Page 300
facilities Addressing the need for local leisure/entertainment facilities
7. Local business forum
Establishment of a local business forum/Chamber of Commerce where government and the private/business sector can discuss relevant issues
Establishment of permanent Local Business Forum office, to coordinate activities of local businesses
Improvement of networking among local businesses
Short term
Thrust 5 – Human Resource Development and Empowerment
Thrust 5: Human Resource Development and Empowerment
Vision: To enable the development and optimal utilisation of local human resources and create a supportive environment for the empowerment of women, the youth and Historically Disadvantaged Individuals.
Programmes Projects Priority Role players
1. Skills matchmaking
Identification of skills shortages in different economic sectors
Medium term
LED Unit
Organised business
Dept. of Education
Mining houses
Dept. of Labour
DTI
SMMEs
Skills audit and recruitment database Medium
term
2. Training facilities/projects
Tertiary training facilities and bursaries in the following skills areas:
o Business management o Agricultural o Technical
Tourism and hospitality
Medium term
Establishment of on-site training facilities/projects
Medium term
3. Projects focused on the support of small businesses
Small business support centre
Appropriate market facilities for informal traders and SMMEs
Joint marketing of businesses
Short term
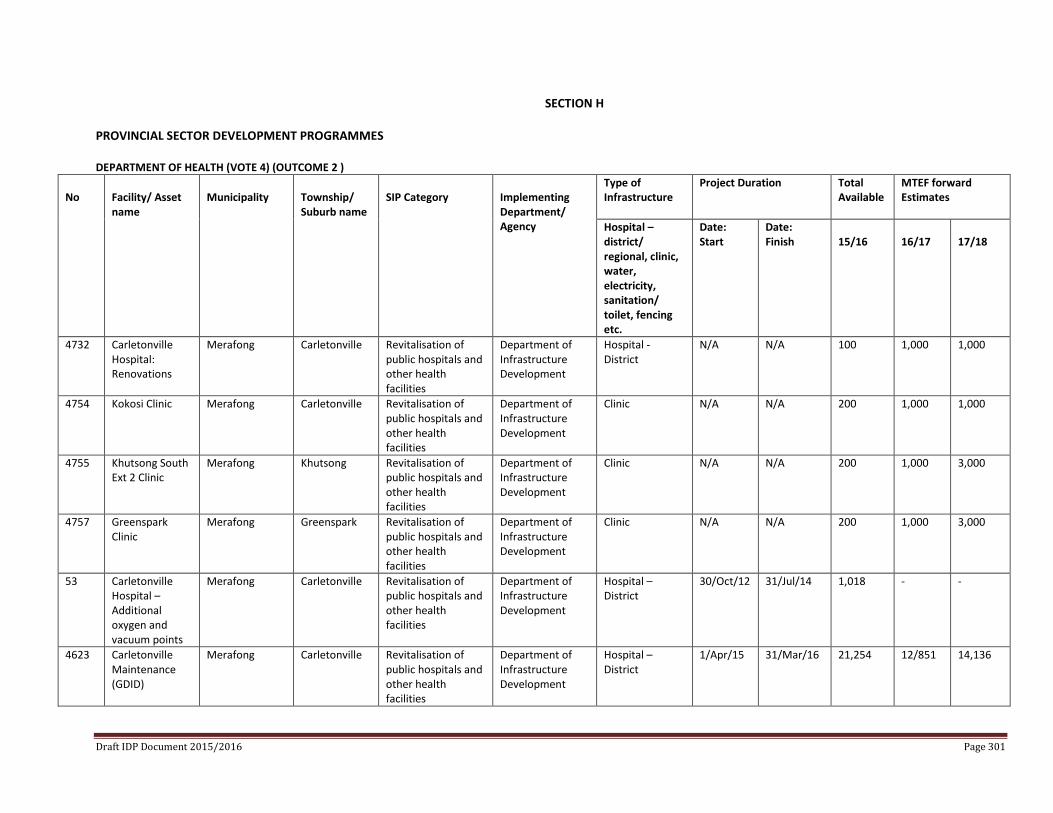
SECTION H PROVINCIAL SECTOR DEVELOPMENT PROGRAMMES DEPARTMENT OF HEALTH (VOTE 4) (OUTCOME 2 )
No
Facility/ Asset name
Municipality
Township/ Suburb name
SIP Category
Implementing Department/ Agency
Type of Infrastructure
Project Duration Total Available
MTEF forward Estimates
Hospital – district/ regional, clinic, water, electricity, sanitation/ toilet, fencing etc.
Date: Start
Date: Finish
15/16
16/17
17/18
4732 Carletonville Hospital: Renovations
Merafong Carletonville Revitalisation of public hospitals and other health facilities
Department of Infrastructure Development
Hospital - District
N/A N/A 100 1,000 1,000
4754 Kokosi Clinic Merafong Carletonville Revitalisation of public hospitals and other health facilities
Department of Infrastructure Development
Clinic N/A N/A 200 1,000 1,000
4755 Khutsong South Ext 2 Clinic
Merafong Khutsong Revitalisation of public hospitals and other health facilities
Department of Infrastructure Development
Clinic N/A N/A 200 1,000 3,000
4757 Greenspark Clinic
Merafong Greenspark Revitalisation of public hospitals and other health facilities
Department of Infrastructure Development
Clinic N/A N/A 200 1,000 3,000
53 Carletonville Hospital – Additional oxygen and vacuum points
Merafong Carletonville Revitalisation of public hospitals and other health facilities
Department of Infrastructure Development
Hospital – District
30/Oct/12 31/Jul/14 1,018 - -
4623 Carletonville Maintenance (GDID)
Merafong Carletonville Revitalisation of public hospitals and other health facilities
Department of Infrastructure Development
Hospital – District
1/Apr/15 31/Mar/16
21,254 12/851 14,136
Draft IDP Document 2015/2016 Page 301
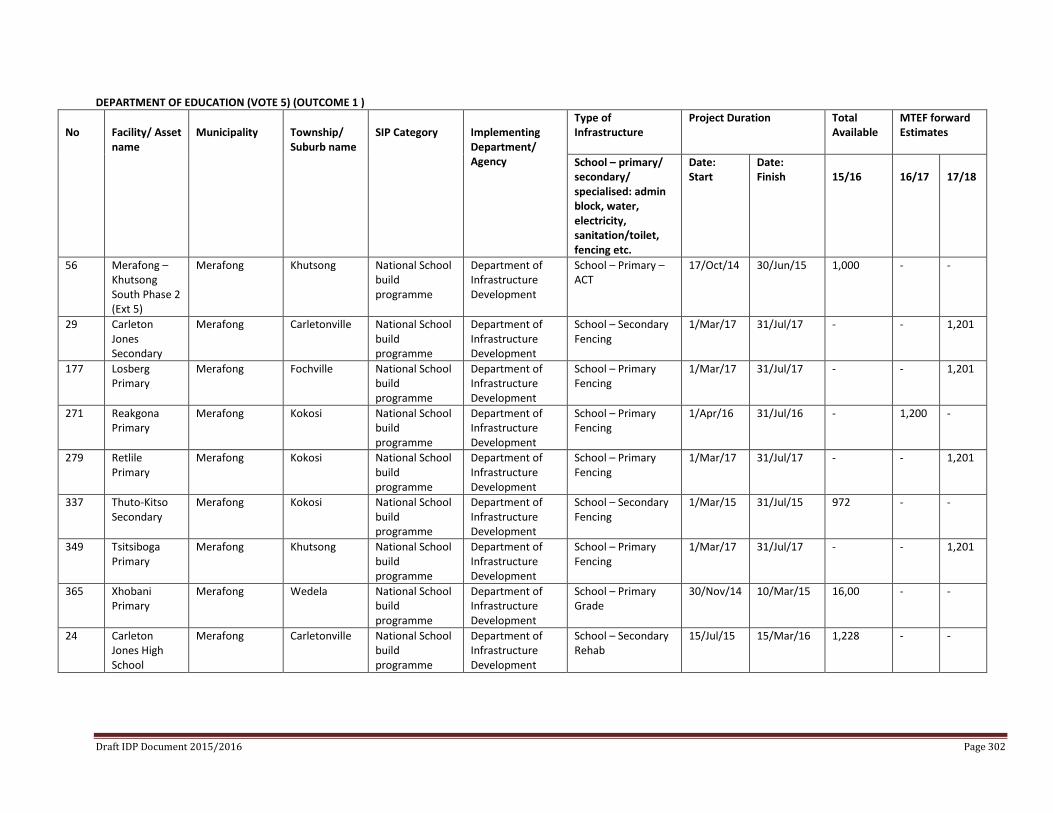
DEPARTMENT OF EDUCATION (VOTE 5) (OUTCOME 1 ) No
Facility/ Asset name
Municipality
Township/ Suburb name
SIP Category
Implementing Department/ Agency
Type of Infrastructure
Project Duration Total Available
MTEF forward Estimates
School – primary/ secondary/ specialised: admin block, water, electricity, sanitation/toilet, fencing etc.
Date: Start
Date: Finish
15/16
16/17
17/18
56 Merafong – Khutsong South Phase 2 (Ext 5)
Merafong Khutsong National School build programme
Department of Infrastructure Development
School – Primary – ACT
17/Oct/14 30/Jun/15 1,000 - -
29 Carleton Jones Secondary
Merafong Carletonville National School build programme
Department of Infrastructure Development
School – Secondary Fencing
1/Mar/17 31/Jul/17 - - 1,201
177 Losberg Primary
Merafong Fochville National School build programme
Department of Infrastructure Development
School – Primary Fencing
1/Mar/17 31/Jul/17 - - 1,201
271 Reakgona Primary
Merafong Kokosi National School build programme
Department of Infrastructure Development
School – Primary Fencing
1/Apr/16 31/Jul/16 - 1,200 -
279 Retlile Primary
Merafong Kokosi National School build programme
Department of Infrastructure Development
School – Primary Fencing
1/Mar/17 31/Jul/17 - - 1,201
337 Thuto-Kitso Secondary
Merafong Kokosi National School build programme
Department of Infrastructure Development
School – Secondary Fencing
1/Mar/15 31/Jul/15 972 - -
349 Tsitsiboga Primary
Merafong Khutsong National School build programme
Department of Infrastructure Development
School – Primary Fencing
1/Mar/17 31/Jul/17 - - 1,201
365 Xhobani Primary
Merafong Wedela National School build programme
Department of Infrastructure Development
School – Primary Grade
30/Nov/14
10/Mar/15 16,00 - -
24 Carleton Jones High School
Merafong Carletonville National School build programme
Department of Infrastructure Development
School – Secondary Rehab
15/Jul/15 15/Mar/16 1,228 - -
Draft IDP Document 2015/2016 Page 302
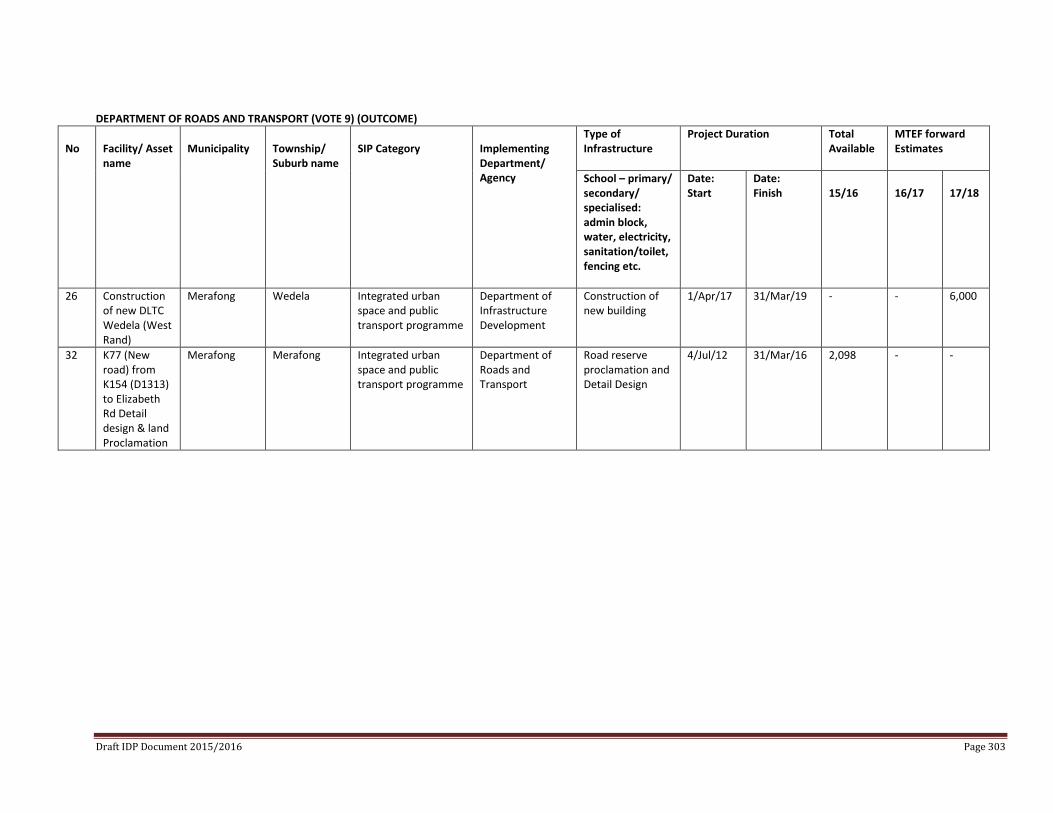
DEPARTMENT OF ROADS AND TRANSPORT (VOTE 9) (OUTCOME)
No
Facility/ Asset name
Municipality
Township/ Suburb name
SIP Category
Implementing Department/ Agency
Type of Infrastructure
Project Duration Total Available
MTEF forward Estimates
School – primary/ secondary/ specialised: admin block, water, electricity, sanitation/toilet, fencing etc.
Date: Start
Date: Finish
15/16
16/17
17/18
26 Construction of new DLTC Wedela (West Rand)
Merafong Wedela Integrated urban space and public transport programme
Department of Infrastructure Development
Construction of new building
1/Apr/17 31/Mar/19 - - 6,000
32 K77 (New road) from K154 (D1313) to Elizabeth Rd Detail design & land Proclamation
Merafong Merafong Integrated urban space and public transport programme
Department of Roads and Transport
Road reserve proclamation and Detail Design
4/Jul/12 31/Mar/16 2,098 - -
Draft IDP Document 2015/2016 Page 303
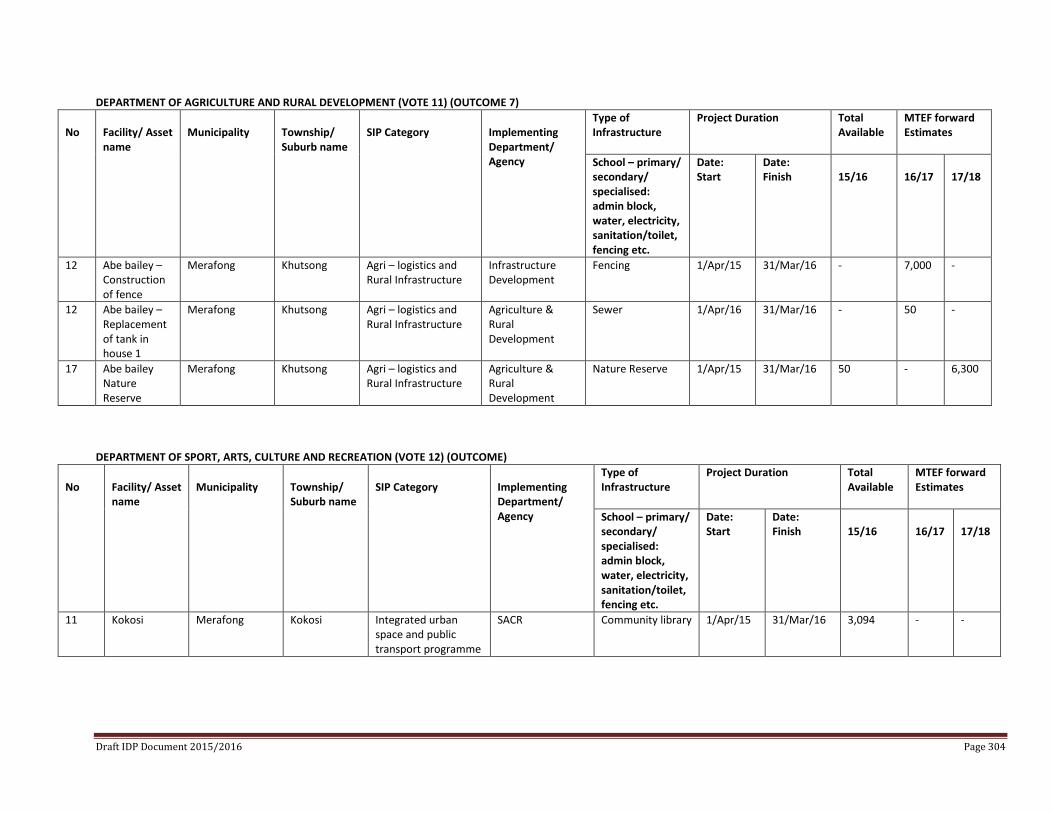
DEPARTMENT OF AGRICULTURE AND RURAL DEVELOPMENT (VOTE 11) (OUTCOME 7) No
Facility/ Asset name
Municipality
Township/ Suburb name
SIP Category
Implementing Department/ Agency
Type of Infrastructure
Project Duration Total Available
MTEF forward Estimates
School – primary/ secondary/ specialised: admin block, water, electricity, sanitation/toilet, fencing etc.
Date: Start
Date: Finish
15/16
16/17
17/18
12 Abe bailey – Construction of fence
Merafong Khutsong Agri – logistics and Rural Infrastructure
Infrastructure Development
Fencing 1/Apr/15 31/Mar/16 - 7,000 -
12 Abe bailey – Replacement of tank in house 1
Merafong Khutsong Agri – logistics and Rural Infrastructure
Agriculture & Rural Development
Sewer 1/Apr/16 31/Mar/16 - 50 -
17 Abe bailey Nature Reserve
Merafong Khutsong Agri – logistics and Rural Infrastructure
Agriculture & Rural Development
Nature Reserve 1/Apr/15 31/Mar/16 50 - 6,300
DEPARTMENT OF SPORT, ARTS, CULTURE AND RECREATION (VOTE 12) (OUTCOME)
No
Facility/ Asset name
Municipality
Township/ Suburb name
SIP Category
Implementing Department/ Agency
Type of Infrastructure
Project Duration Total Available
MTEF forward Estimates
School – primary/ secondary/ specialised: admin block, water, electricity, sanitation/toilet, fencing etc.
Date: Start
Date: Finish
15/16
16/17
17/18
11 Kokosi Merafong Kokosi Integrated urban space and public transport programme
SACR Community library 1/Apr/15 31/Mar/16 3,094 - -
Draft IDP Document 2015/2016 Page 304
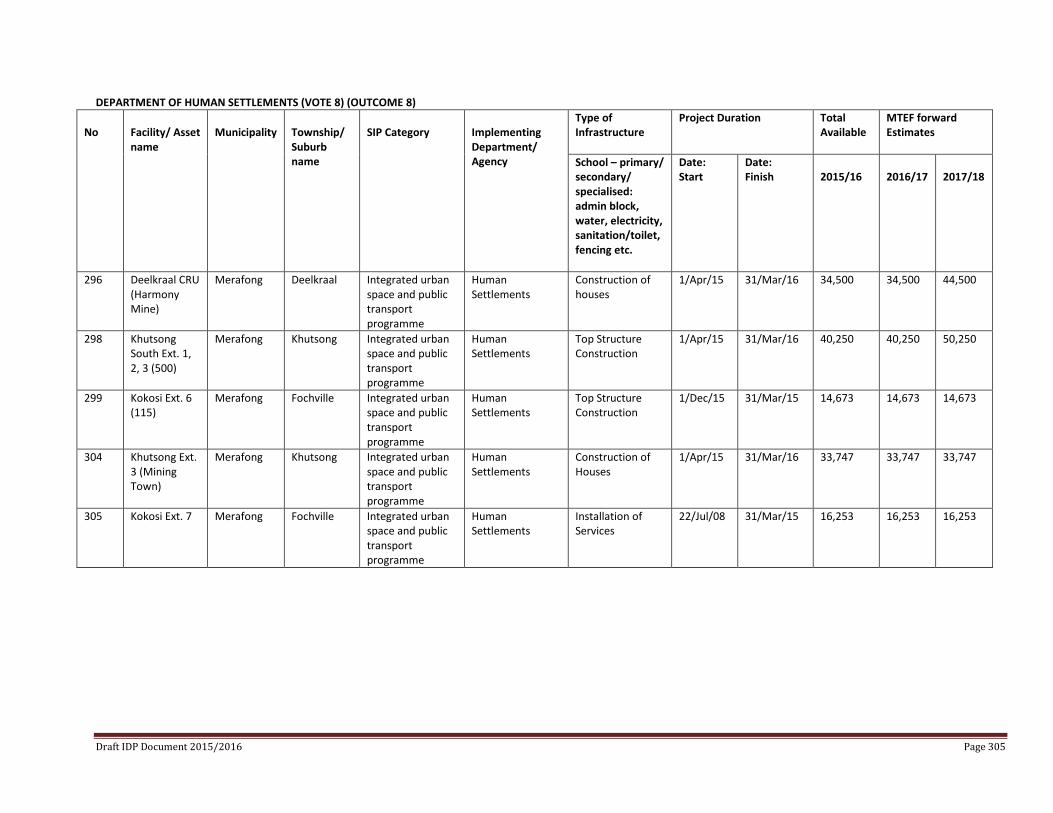
DEPARTMENT OF HUMAN SETTLEMENTS (VOTE 8) (OUTCOME 8) No
Facility/ Asset name
Municipality
Township/ Suburb name
SIP Category
Implementing Department/ Agency
Type of Infrastructure
Project Duration Total Available
MTEF forward Estimates
School – primary/ secondary/ specialised: admin block, water, electricity, sanitation/toilet, fencing etc.
Date: Start
Date: Finish
2015/16
2016/17
2017/18
296 Deelkraal CRU (Harmony Mine)
Merafong Deelkraal Integrated urban space and public transport programme
Human Settlements
Construction of houses
1/Apr/15 31/Mar/16 34,500 34,500 44,500
298 Khutsong South Ext. 1, 2, 3 (500)
Merafong Khutsong Integrated urban space and public transport programme
Human Settlements
Top Structure Construction
1/Apr/15 31/Mar/16 40,250 40,250 50,250
299 Kokosi Ext. 6 (115)
Merafong Fochville Integrated urban space and public transport programme
Human Settlements
Top Structure Construction
1/Dec/15 31/Mar/15 14,673 14,673 14,673
304 Khutsong Ext. 3 (Mining Town)
Merafong Khutsong Integrated urban space and public transport programme
Human Settlements
Construction of Houses
1/Apr/15 31/Mar/16 33,747 33,747 33,747
305 Kokosi Ext. 7 Merafong Fochville Integrated urban space and public transport programme
Human Settlements
Installation of Services
22/Jul/08 31/Mar/15 16,253 16,253 16,253
Draft IDP Document 2015/2016 Page 305
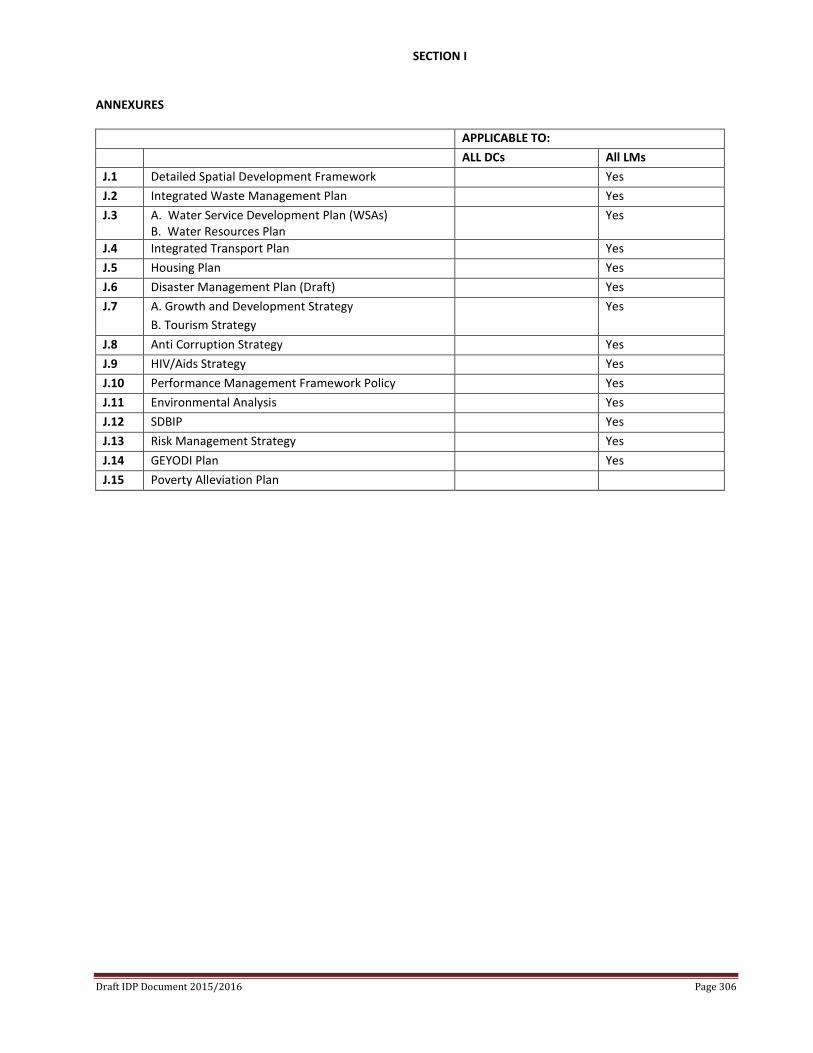
SECTION I ANNEXURES
APPLICABLE TO: ALL DCs All LMs J.1 Detailed Spatial Development Framework Yes J.2 Integrated Waste Management Plan Yes J.3 A. Water Service Development Plan (WSAs)
B. Water Resources Plan Yes
J.4 Integrated Transport Plan Yes J.5 Housing Plan Yes J.6 Disaster Management Plan (Draft) Yes J.7 A. Growth and Development Strategy
B. Tourism Strategy Yes
J.8 Anti Corruption Strategy Yes J.9 HIV/Aids Strategy Yes J.10 Performance Management Framework Policy Yes J.11 Environmental Analysis Yes J.12 SDBIP Yes J.13 Risk Management Strategy Yes J.14 GEYODI Plan Yes J.15 Poverty Alleviation Plan
Draft IDP Document 2015/2016 Page 306


