Embed Size (px)
Citation preview
Dragon: A Static and Dynamic Tool for OpenMP
Oscar Hernandez, Chunhua Liao, and Barbara Chapman
Computer Science Department, University of Houston {oscar, liaoch, chapman}@cs.uh.edu
Abstract. A program analysis tool can play an important role in helping users understand and improve OpenMP codes. Dragon is a robust interactive program analysis tool based on the Open64 compiler, an open source OpenMP, C/C++/Fortran77/90 compiler for Intel Itanium systems. We developed the Dragon tool on top of Open64 to exploit its powerful analyses in order to pro-vide static as well as dynamic (feedback-based) information which can be used to develop or optimize OpenMP codes. Dragon enables users to visualize and print essential program structures and obtain runtime information on their ap-plications. Current features include static/dynamic call graphs and control flow graphs, data dependence analysis and interprocedural array region summaries, that help understand procedure side effects within parallel loops. On-going work extends Dragon to display data access patterns at runtime, and provide support for runtime instrumentation and optimizations.
1 Introduction
Scientific and industrial OpenMP applications are becoming increasingly large and complex. They are generally difficult to understand, parallelize, and optimize. A lot of programmer effort is thus expended in the task of investigating complex code structures. Extensive information on often low-level details of data structures and control flow is necessary for any kind of code reengineering, as well as for creating parallel applications under OpenMP or an alternative paradigm. The optimization of parallel programs is particularly challenging as it requires information pertaining to multiple processes or threads. For shared memory parallel codes, optimization strate-gies may include the privatization of scalar and array variables to improve data local-ity, and code modifications that reduce synchronizations, all of which require consid-erable insight into a given code. The automated provision of structural information (call graphs, procedure control flow graphs), interprocedural information (procedure side effects), information on variable usage (data dependences, use-def chains, aliases) and runtime profile information, can speed up the development process and reduce the likelihood that errors are introduced in the process. Dynamic compiler feedback has proved to be useful for optimization as it can help programmers discover how an
This work was partially supported by the DOE under contract DE-FC03-01ER25502 and by
the Los Alamos National Laboratory Computer Science Institute (LACSI) through LANL contract number 03891-99-23.
application is behaving, including detecting program hotspots, runtime anomalies, and other behavior which is unknown statically.
Dragon is a tool that gathers information on the structure and variable usage of a potentially multi-language program, saves this data and displays the results to a user via a graphical menu-driven interface. If dynamic information is desired, it automati-cally instruments the code to gather additional data during one or more runs and stores these results also. It includes features that are commonly needed to study and change both sequential and parallel codes, with specific support for OpenMP code. Current features include static and dynamic call graphs and control flow graphs, data dependence graphs to help the user find parallel loops and detect race conditions, and summaries of array accesses across procedure boundaries, to support the paralleliza-tion of loops with procedure calls and enable an understanding of procedure side effects within parallel loops. We decided to use the publicly available Open64 compiler infrastructure to create this tool, since Open64 is robust, has powerful analyses, supports the programming languages that are of interest to us and is open source. However, Open64 is undergoing further development by a number of different researchers and so this also constrains us to perform our work in such a way that we can easily adapt to newer versions of the compiler infrastructure. Dragon is a robust tool that can analyze large real-world applications and visualize large graphs, and is freely available (http://www.cs.uh.edu/~dragon).
This paper presents the design and implementation of Dragon, and its organization is as follows. Section 2 describes the Open64 compiler [9] and its support for OpenMP. The following section introduces Dragon, its structure, functionalities and interfaces to Open64. We next show how Dragon supports OpenMP and gives dy-namic feedback. Finally, we reach conclusions and discuss future work.
2 An Overview of the Open64 Compiler
The Open64 compiler infrastructure was originally developed and put into the public domain by Silicon Graphics Inc.; it is currently maintained by Intel. Written in C++, Open64 accepts Fortran 77/90 and C/C++, as well as the shared memory API OpenMP. The system targets Intel’s IA-64 processors. Open64 is a well-written com-piler performing state-of-the-art analyses that can be exploited by tools such as Dragon. They include interprocedural analysis, data flow analysis, data dependence analysis and array region analysis. A number of different research groups already base their compiler research on this open source system.
2.1 IR and Optimizations
The intermediate representation (IR) for the Open64 compiler, called WHIRL, has five different levels, starting with Very High Level (VHL) WHIRL, and serves as the common interface among all the front end and back end components. Each optimiza-tion phase is designed to work at a specific level of WHIRL. Our tool gathers infor-mation primarily from the VHL and High Level (HL) WHIRL phases, which preserve
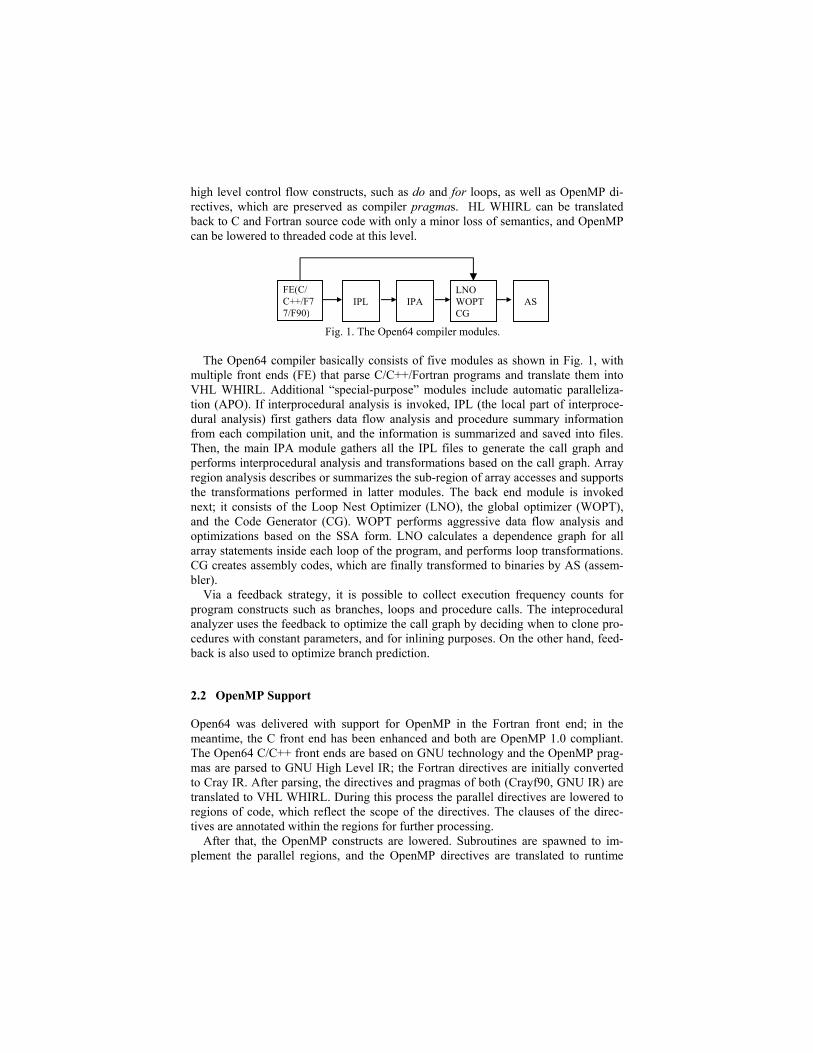
high level control flow constructs, such as do and for loops, as well as OpenMP di-rectives, which are preserved as compiler pragmas. HL WHIRL can be translated back to C and Fortran source code with only a minor loss of semantics, and OpenMP can be lowered to threaded code at this level.
Fig. 1. The Open64 compiler modules.
The Open64 compiler basically consists of five modules as shown in Fig. 1, with
multiple front ends (FE) that parse C/C++/Fortran programs and translate them into VHL WHIRL. Additional “special-purpose” modules include automatic paralleliza-tion (APO). If interprocedural analysis is invoked, IPL (the local part of interproce-dural analysis) first gathers data flow analysis and procedure summary information from each compilation unit, and the information is summarized and saved into files. Then, the main IPA module gathers all the IPL files to generate the call graph and performs interprocedural analysis and transformations based on the call graph. Array region analysis describes or summarizes the sub-region of array accesses and supports the transformations performed in latter modules. The back end module is invoked next; it consists of the Loop Nest Optimizer (LNO), the global optimizer (WOPT), and the Code Generator (CG). WOPT performs aggressive data flow analysis and optimizations based on the SSA form. LNO calculates a dependence graph for all array statements inside each loop of the program, and performs loop transformations. CG creates assembly codes, which are finally transformed to binaries by AS (assem-bler).
Via a feedback strategy, it is possible to collect execution frequency counts for program constructs such as branches, loops and procedure calls. The inteprocedural analyzer uses the feedback to optimize the call graph by deciding when to clone pro-cedures with constant parameters, and for inlining purposes. On the other hand, feed-back is also used to optimize branch prediction.
2.2 OpenMP Support
Open64 was delivered with support for OpenMP in the Fortran front end; in the meantime, the C front end has been enhanced and both are OpenMP 1.0 compliant. The Open64 C/C++ front ends are based on GNU technology and the OpenMP prag-mas are parsed to GNU High Level IR; the Fortran directives are initially converted to Cray IR. After parsing, the directives and pragmas of both (Crayf90, GNU IR) are translated to VHL WHIRL. During this process the parallel directives are lowered to regions of code, which reflect the scope of the directives. The clauses of the direc-tives are annotated within the regions for further processing.
After that, the OpenMP constructs are lowered. Subroutines are spawned to im-plement the parallel regions, and the OpenMP directives are translated to runtime
FE(C/ C++/F77/F90)
IPL
IPA
AS
LNO WOPT CG
calls to a threading library implemented via Pthreads. For example, loops are broken down into chunks, based on the specified schedule, and assigned to individual threads and the respective runtime system calls are inserted. The compiler handles the mem-ory for SHARED, PRIVATE, FIRSTPRIVATE and LASTPRIVATE variables but currently lacks support for THREADPRIVATE variables and directives such as COPYIN, that copies data from sequential regions to the parallel region.
3 The Dragon Tool
In order to implement Dragon, we directly modified the Open64 compiler to extract the relevant information on an input program, and created a separate menu-driven graphical interface with which the user may retrieve a variety of facts about their code.
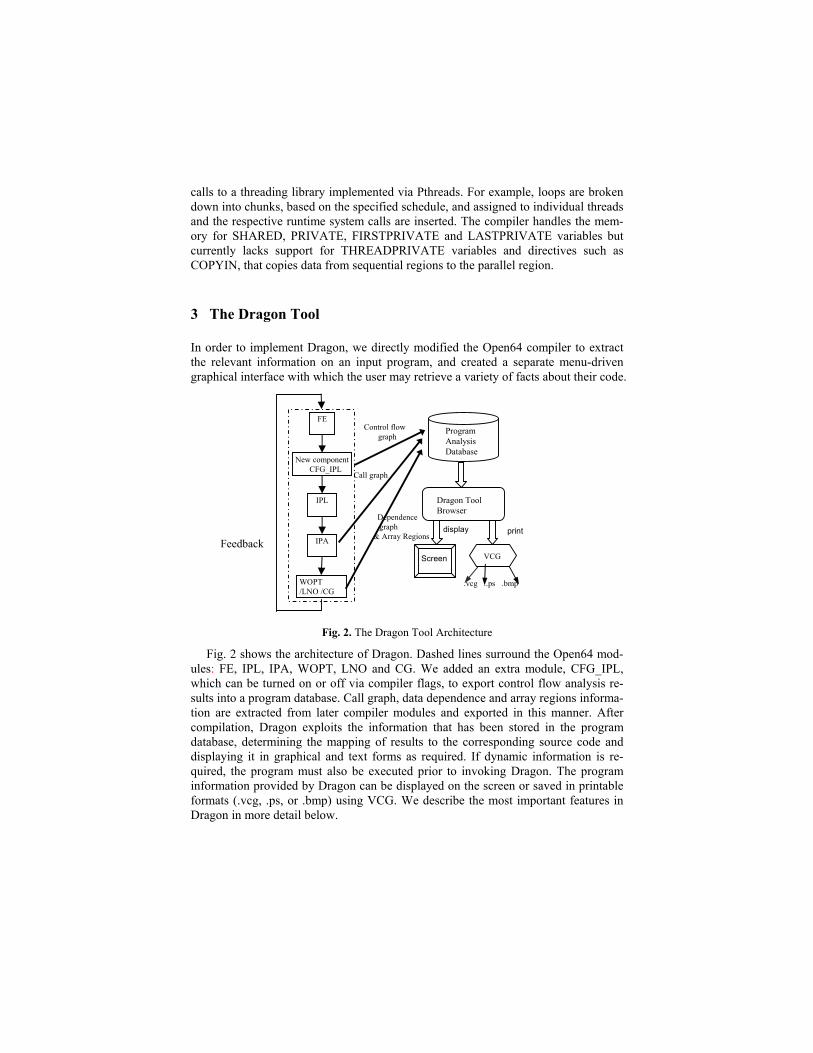
Fig. 2. The Dragon Tool Architecture
Fig. 2 shows the architecture of Dragon. Dashed lines surround the Open64 mod-ules: FE, IPL, IPA, WOPT, LNO and CG. We added an extra module, CFG_IPL, which can be turned on or off via compiler flags, to export control flow analysis re-sults into a program database. Call graph, data dependence and array regions informa-tion are extracted from later compiler modules and exported in this manner. After compilation, Dragon exploits the information that has been stored in the program database, determining the mapping of results to the corresponding source code and displaying it in graphical and text forms as required. If dynamic information is re-quired, the program must also be executed prior to invoking Dragon. The program information provided by Dragon can be displayed on the screen or saved in printable formats (.vcg, .ps, or .bmp) using VCG. We describe the most important features in Dragon in more detail below.
FE
New componentCFG_IPL
IPL
IPA
Program Analysis Database
WOPT /LNO /CG
Control flow
graph
Call graph
Dragon Tool Browser
VCG
.vcg ..ps .bmp
print display
Screen
Dependence graph
& Array Regions
Feedback
3.1 The Static and Dynamic Call Graph
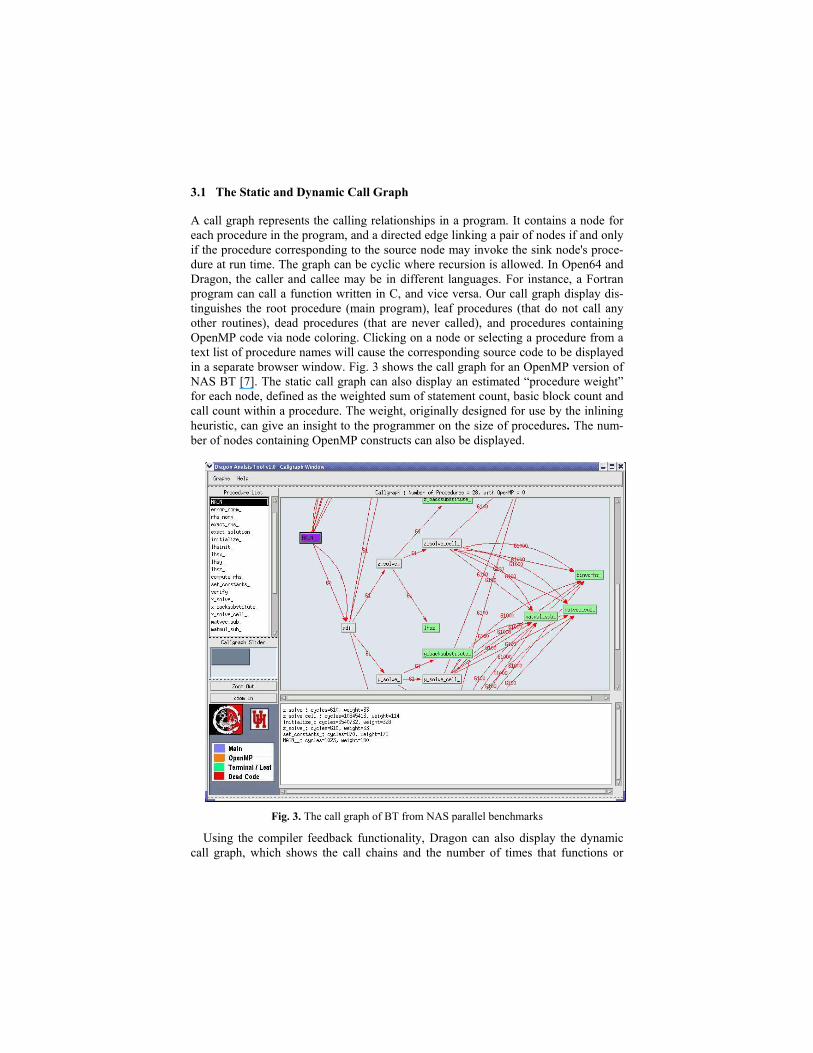
A call graph represents the calling relationships in a program. It contains a node for each procedure in the program, and a directed edge linking a pair of nodes if and only if the procedure corresponding to the source node may invoke the sink node's proce-dure at run time. The graph can be cyclic where recursion is allowed. In Open64 and Dragon, the caller and callee may be in different languages. For instance, a Fortran program can call a function written in C, and vice versa. Our call graph display dis-tinguishes the root procedure (main program), leaf procedures (that do not call any other routines), dead procedures (that are never called), and procedures containing OpenMP code via node coloring. Clicking on a node or selecting a procedure from a text list of procedure names will cause the corresponding source code to be displayed in a separate browser window. Fig. 3 shows the call graph for an OpenMP version of NAS BT [7]. The static call graph can also display an estimated “procedure weight” for each node, defined as the weighted sum of statement count, basic block count and call count within a procedure. The weight, originally designed for use by the inlining heuristic, can give an insight to the programmer on the size of procedures. The num-ber of nodes containing OpenMP constructs can also be displayed.
Fig. 3. The call graph of BT from NAS parallel benchmarks
Using the compiler feedback functionality, Dragon can also display the dynamic call graph, which shows the call chains and the number of times that functions or
procedures were invoked at runtime. If the application was run several times, feed-back from the different runs are collected and merged into the call graph, to show the frequencies with which procedures were invoked in different runs. This information, plus the cycle count for each procedure, can help to detect hot spots in the application, especially when there are procedures containing OpenMP. This may help the pro-grammer decide when to inline a procedure, or where to focus manual optimization efforts on.
3.2 The Static and Dynamic Control Flow Graph
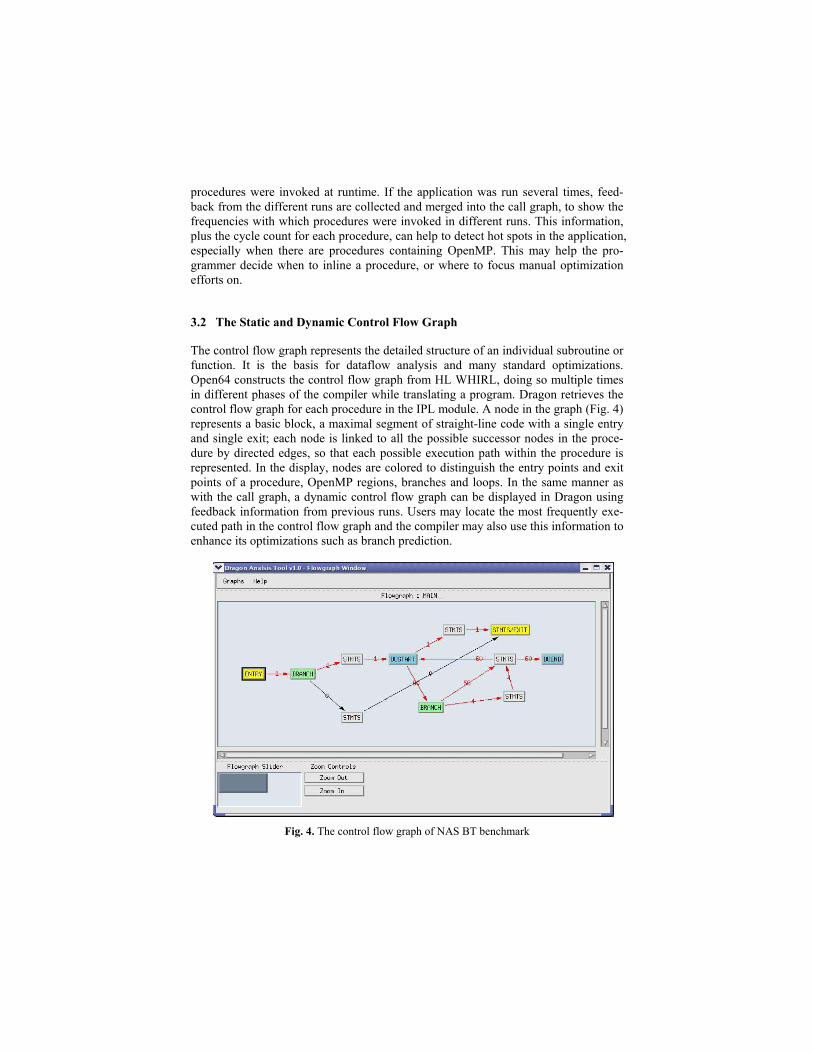
The control flow graph represents the detailed structure of an individual subroutine or function. It is the basis for dataflow analysis and many standard optimizations. Open64 constructs the control flow graph from HL WHIRL, doing so multiple times in different phases of the compiler while translating a program. Dragon retrieves the control flow graph for each procedure in the IPL module. A node in the graph (Fig. 4) represents a basic block, a maximal segment of straight-line code with a single entry and single exit; each node is linked to all the possible successor nodes in the proce-dure by directed edges, so that each possible execution path within the procedure is represented. In the display, nodes are colored to distinguish the entry points and exit points of a procedure, OpenMP regions, branches and loops. In the same manner as with the call graph, a dynamic control flow graph can be displayed in Dragon using feedback information from previous runs. Users may locate the most frequently exe-cuted path in the control flow graph and the compiler may also use this information to enhance its optimizations such as branch prediction.
Fig. 4. The control flow graph of NAS BT benchmark
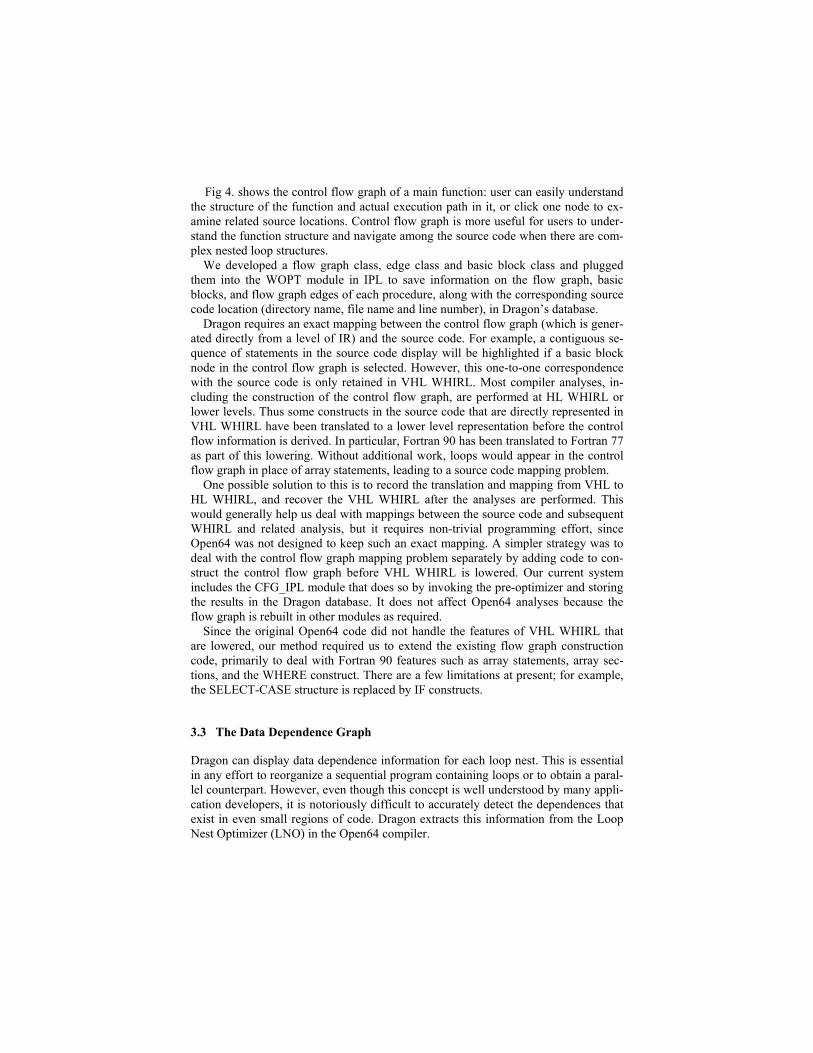
Fig 4. shows the control flow graph of a main function: user can easily understand the structure of the function and actual execution path in it, or click one node to ex-amine related source locations. Control flow graph is more useful for users to under-stand the function structure and navigate among the source code when there are com-plex nested loop structures.
We developed a flow graph class, edge class and basic block class and plugged them into the WOPT module in IPL to save information on the flow graph, basic blocks, and flow graph edges of each procedure, along with the corresponding source code location (directory name, file name and line number), in Dragon’s database.
Dragon requires an exact mapping between the control flow graph (which is gener-ated directly from a level of IR) and the source code. For example, a contiguous se-quence of statements in the source code display will be highlighted if a basic block node in the control flow graph is selected. However, this one-to-one correspondence with the source code is only retained in VHL WHIRL. Most compiler analyses, in-cluding the construction of the control flow graph, are performed at HL WHIRL or lower levels. Thus some constructs in the source code that are directly represented in VHL WHIRL have been translated to a lower level representation before the control flow information is derived. In particular, Fortran 90 has been translated to Fortran 77 as part of this lowering. Without additional work, loops would appear in the control flow graph in place of array statements, leading to a source code mapping problem.
One possible solution to this is to record the translation and mapping from VHL to HL WHIRL, and recover the VHL WHIRL after the analyses are performed. This would generally help us deal with mappings between the source code and subsequent WHIRL and related analysis, but it requires non-trivial programming effort, since Open64 was not designed to keep such an exact mapping. A simpler strategy was to deal with the control flow graph mapping problem separately by adding code to con-struct the control flow graph before VHL WHIRL is lowered. Our current system includes the CFG_IPL module that does so by invoking the pre-optimizer and storing the results in the Dragon database. It does not affect Open64 analyses because the flow graph is rebuilt in other modules as required.
Since the original Open64 code did not handle the features of VHL WHIRL that are lowered, our method required us to extend the existing flow graph construction code, primarily to deal with Fortran 90 features such as array statements, array sec-tions, and the WHERE construct. There are a few limitations at present; for example, the SELECT-CASE structure is replaced by IF constructs.
3.3 The Data Dependence Graph
Dragon can display data dependence information for each loop nest. This is essential in any effort to reorganize a sequential program containing loops or to obtain a paral-lel counterpart. However, even though this concept is well understood by many appli-cation developers, it is notoriously difficult to accurately detect the dependences that exist in even small regions of code. Dragon extracts this information from the Loop Nest Optimizer (LNO) in the Open64 compiler.
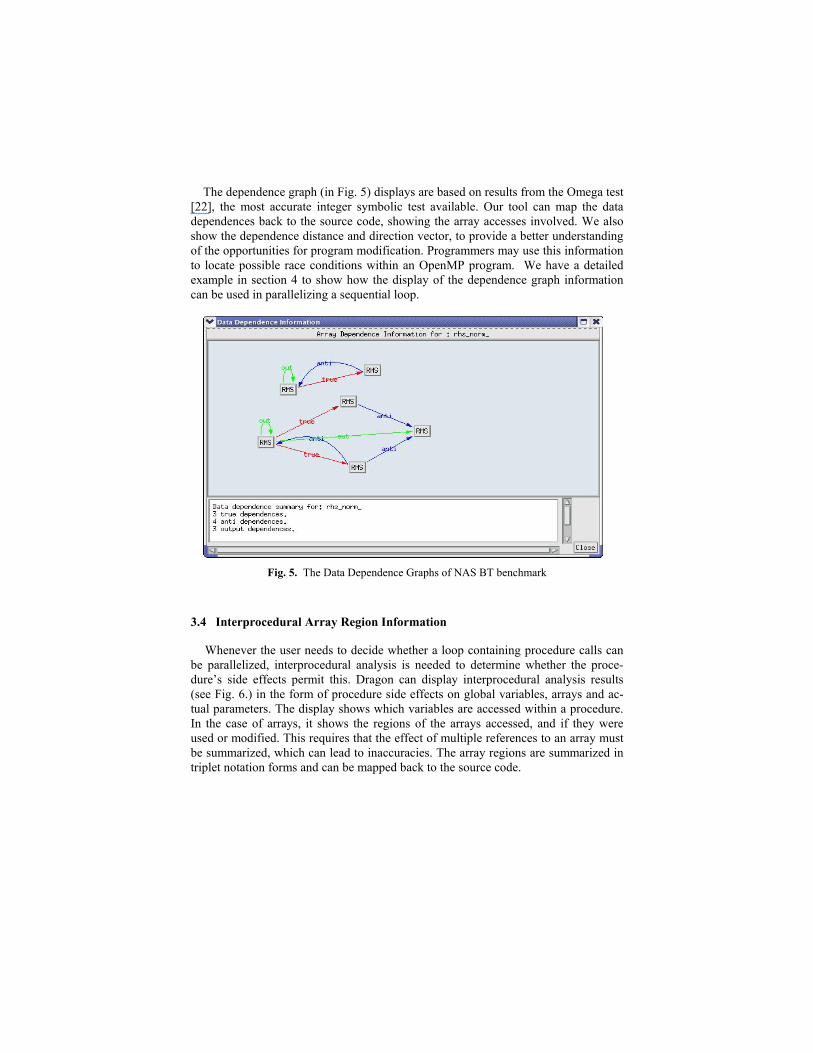
The dependence graph (in Fig. 5) displays are based on results from the Omega test [22], the most accurate integer symbolic test available. Our tool can map the data dependences back to the source code, showing the array accesses involved. We also show the dependence distance and direction vector, to provide a better understanding of the opportunities for program modification. Programmers may use this information to locate possible race conditions within an OpenMP program. We have a detailed example in section 4 to show how the display of the dependence graph information can be used in parallelizing a sequential loop.
Fig. 5. The Data Dependence Graphs of NAS BT benchmark
3.4 Interprocedural Array Region Information
Whenever the user needs to decide whether a loop containing procedure calls can be parallelized, interprocedural analysis is needed to determine whether the proce-dure’s side effects permit this. Dragon can display interprocedural analysis results (see Fig. 6.) in the form of procedure side effects on global variables, arrays and ac-tual parameters. The display shows which variables are accessed within a procedure. In the case of arrays, it shows the regions of the arrays accessed, and if they were used or modified. This requires that the effect of multiple references to an array must be summarized, which can lead to inaccuracies. The array regions are summarized in triplet notation forms and can be mapped back to the source code.
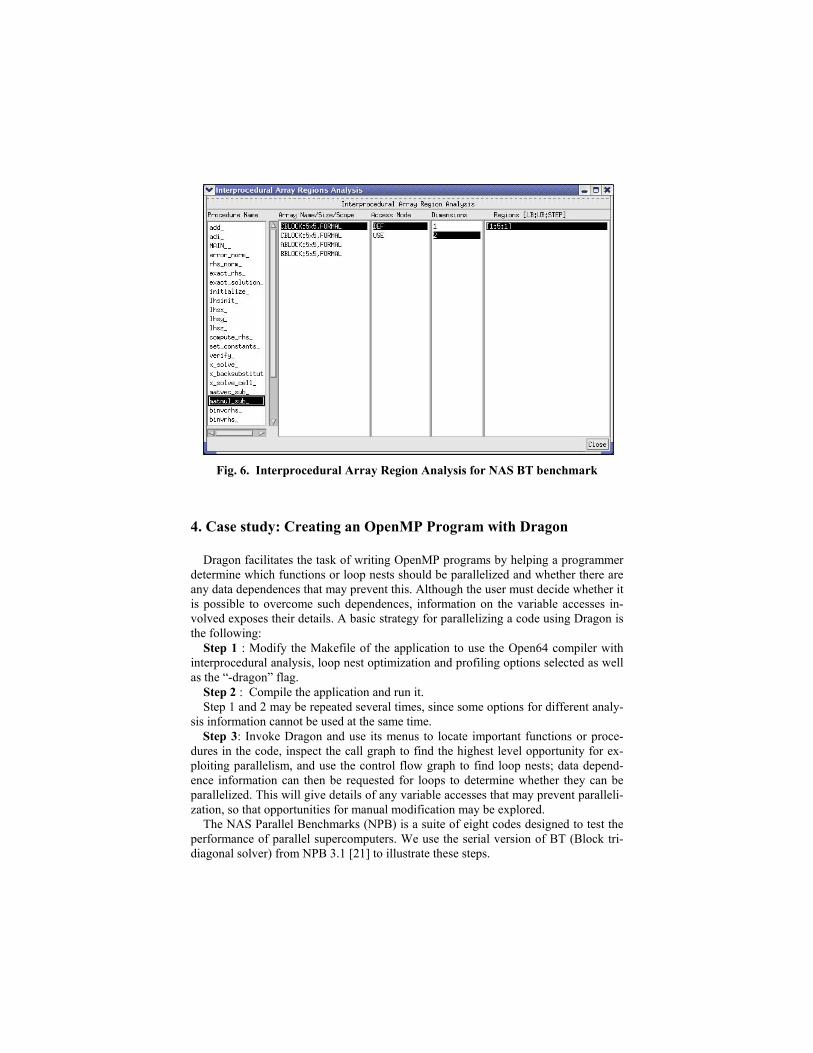
Fig. 6. Interprocedural Array Region Analysis for NAS BT benchmark
4. Case study: Creating an OpenMP Program with Dragon
Dragon facilitates the task of writing OpenMP programs by helping a programmer determine which functions or loop nests should be parallelized and whether there are any data dependences that may prevent this. Although the user must decide whether it is possible to overcome such dependences, information on the variable accesses in-volved exposes their details. A basic strategy for parallelizing a code using Dragon is the following:
Step 1 : Modify the Makefile of the application to use the Open64 compiler with interprocedural analysis, loop nest optimization and profiling options selected as well as the “-dragon” flag.
Step 2 : Compile the application and run it. Step 1 and 2 may be repeated several times, since some options for different analy-
sis information cannot be used at the same time. Step 3: Invoke Dragon and use its menus to locate important functions or proce-
dures in the code, inspect the call graph to find the highest level opportunity for ex-ploiting parallelism, and use the control flow graph to find loop nests; data depend-ence information can then be requested for loops to determine whether they can be parallelized. This will give details of any variable accesses that may prevent paralleli-zation, so that opportunities for manual modification may be explored.
The NAS Parallel Benchmarks (NPB) is a suite of eight codes designed to test the performance of parallel supercomputers. We use the serial version of BT (Block tri-diagonal solver) from NPB 3.1 [21] to illustrate these steps.
In the first step, we modify BT’s make.def file to use the Open64 Fortran compiler with the following options:
F77= openf90 FFLAGS = -fb_create myfeedback -fb_type=1 -fb_phase=0 FLINKFLAGS = -fb_opt myfeedback -dragon -ipa -O2 After compilation and execution of BT with test data, a new set of options are used
in both FFLAGS and FLINKFLAGS to recompile the application and dump the feed-back information:
-fb_opt myfeedback -dragon -ipa -O2. As a result, the call graph, control flow graph and feedback information will be
stored in Dragon’s database for subsequent querying. It is also easy to obtain data dependence information. We use another compiler option “–dragon –O3” in the Makefile to recompile the application, ensuring that the loop nest optimization proce-dures in the compiler are carried out and the data dependence information generated there is exported to the dragon database.
CPU Cycles(in Million)
for Top 10 Functions in BT
0
5000
10000
15000
20000
25000
30000
35000
binvc
rhs
matmul_
sub
x_so
lve
z_so
lve
y_so
lve
compu
te_rhs
matvec
_sub
lhsini
tad
d
binvrh
s
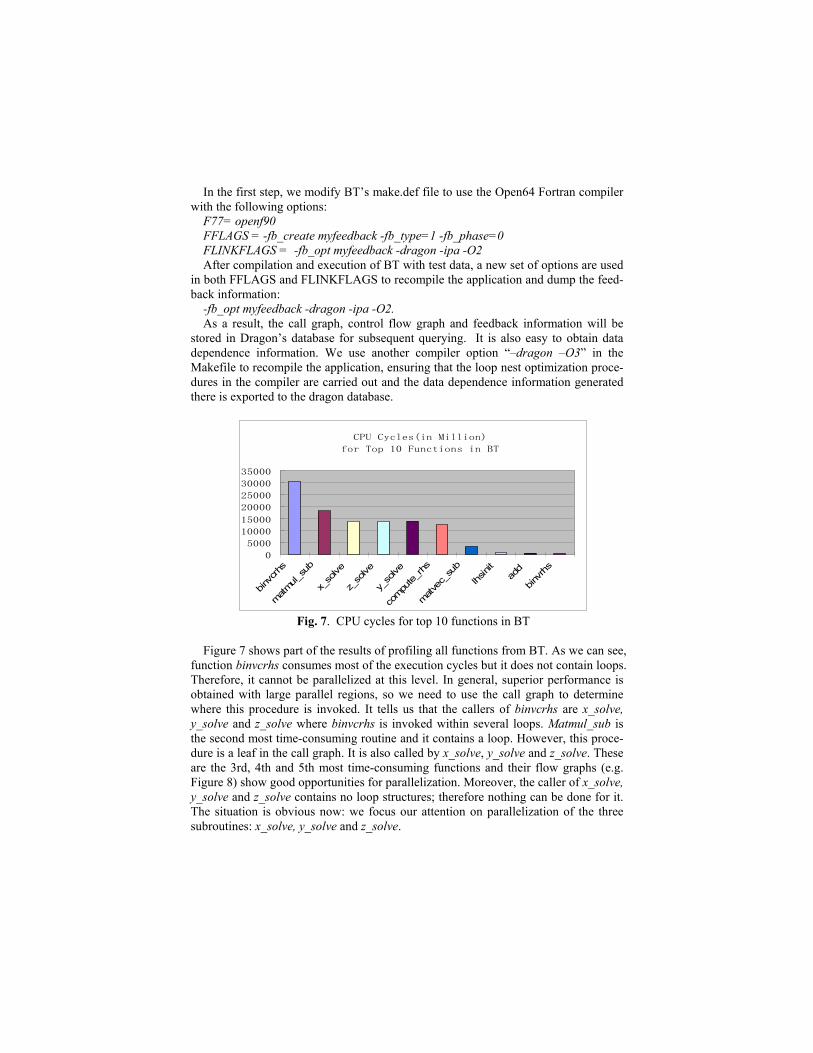
Fig. 7. CPU cycles for top 10 functions in BT
Figure 7 shows part of the results of profiling all functions from BT. As we can see,
function binvcrhs consumes most of the execution cycles but it does not contain loops. Therefore, it cannot be parallelized at this level. In general, superior performance is obtained with large parallel regions, so we need to use the call graph to determine where this procedure is invoked. It tells us that the callers of binvcrhs are x_solve, y_solve and z_solve where binvcrhs is invoked within several loops. Matmul_sub is the second most time-consuming routine and it contains a loop. However, this proce-dure is a leaf in the call graph. It is also called by x_solve, y_solve and z_solve. These are the 3rd, 4th and 5th most time-consuming functions and their flow graphs (e.g. Figure 8) show good opportunities for parallelization. Moreover, the caller of x_solve, y_solve and z_solve contains no loop structures; therefore nothing can be done for it. The situation is obvious now: we focus our attention on parallelization of the three subroutines: x_solve, y_solve and z_solve.
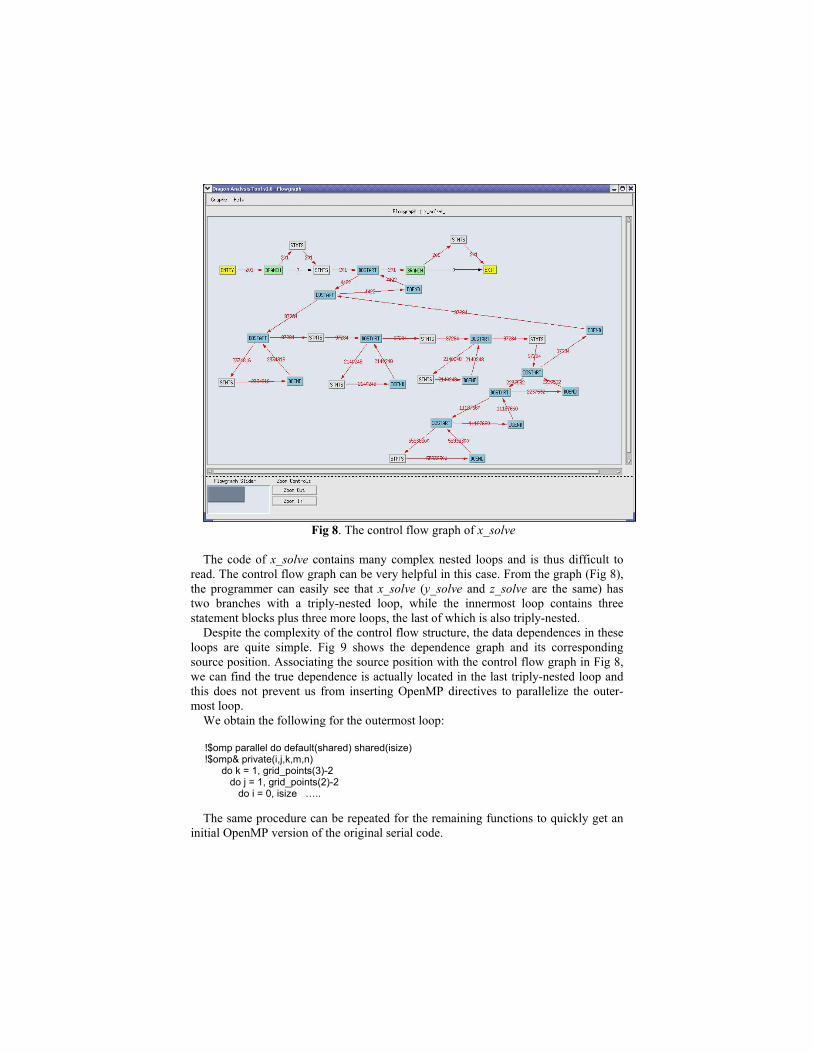
Fig 8. The control flow graph of x_solve
The code of x_solve contains many complex nested loops and is thus difficult to
read. The control flow graph can be very helpful in this case. From the graph (Fig 8), the programmer can easily see that x_solve (y_solve and z_solve are the same) has two branches with a triply-nested loop, while the innermost loop contains three statement blocks plus three more loops, the last of which is also triply-nested.
Despite the complexity of the control flow structure, the data dependences in these loops are quite simple. Fig 9 shows the dependence graph and its corresponding source position. Associating the source position with the control flow graph in Fig 8, we can find the true dependence is actually located in the last triply-nested loop and this does not prevent us from inserting OpenMP directives to parallelize the outer-most loop.
We obtain the following for the outermost loop: !$omp parallel do default(shared) shared(isize) !$omp& private(i,j,k,m,n) do k = 1, grid_points(3)-2 do j = 1, grid_points(2)-2 do i = 0, isize ….. The same procedure can be repeated for the remaining functions to quickly get an
initial OpenMP version of the original serial code.
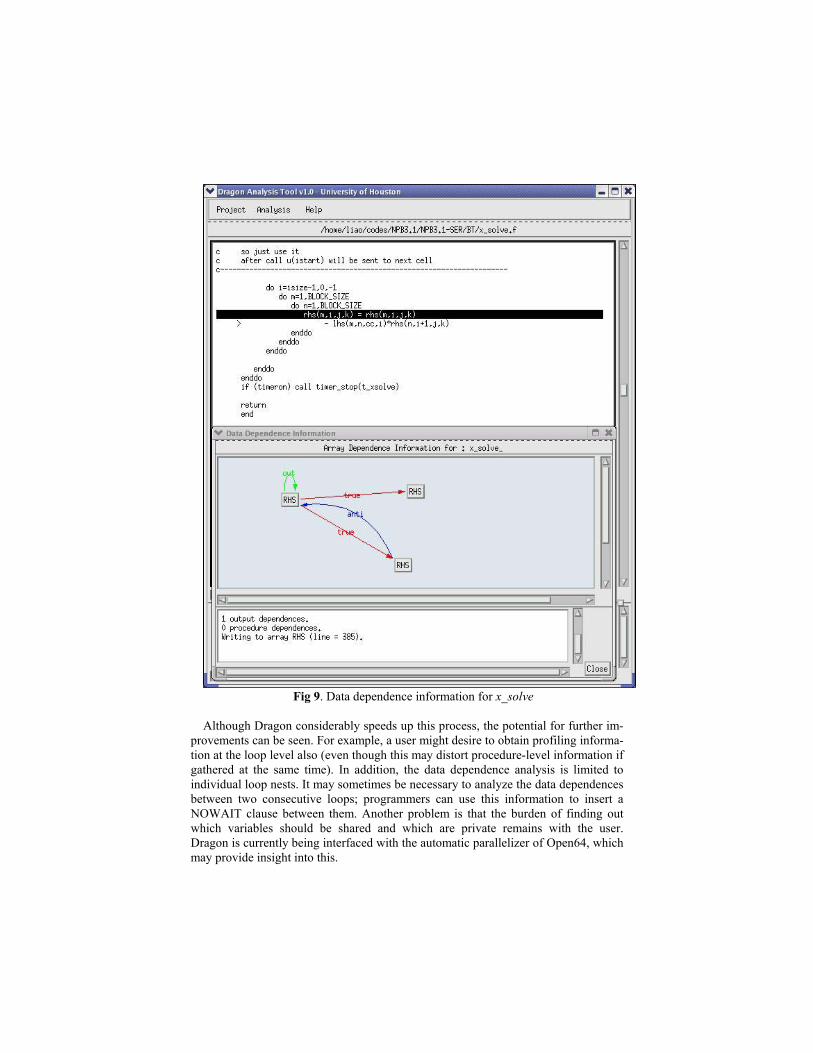
Fig 9. Data dependence information for x_solve
Although Dragon considerably speeds up this process, the potential for further im-
provements can be seen. For example, a user might desire to obtain profiling informa-tion at the loop level also (even though this may distort procedure-level information if gathered at the same time). In addition, the data dependence analysis is limited to individual loop nests. It may sometimes be necessary to analyze the data dependences between two consecutive loops; programmers can use this information to insert a NOWAIT clause between them. Another problem is that the burden of finding out which variables should be shared and which are private remains with the user. Dragon is currently being interfaced with the automatic parallelizer of Open64, which may provide insight into this.
5 Related Work
There are a number of other tools that analyze source code, or provide support for parallelization. They include CAPO [6] for automatic OpenMP generation which supports Fortran 77 and some F90 extensions, Intel Thread Checker [17] which fo-cuses on OpenMP semantic checking, GPE [16] which uses a static hierarchical task graph to help users create OpenMP. Foresys [4] is an early product that supports the maintenance of Fortran code and helps with parallelization. Profile tools such as TAU [18], Expert [19], and Guide [20] focus on performance issues, and do not perform program analysis. None of these program analysis tools integrate both dynamic and static analysis information for OpenMP or provide similar features for multilanguage codes. Our tool also differs from SUIF Explorer [23] because there is no OpenMP support from SUIF explorer.
6 Conclusions and Future Work
Dragon is an interactive tool that provides detailed information about a C/Fortran77/Fortran90 program that may contain OpenMP/MPI constructs. It takes advantage of Open64’s analysis capabilities. Much of the information displayed in this graphical tool is general-purpose and could be employed in many situations, from analyzing legacy sequential code to helping users reconstruct parallel code.
Dragon has been tested on many large applications including the POP code [11], ASCI Sweep3d and UMT98 [1]. GenIDLEST [14] and the NAS OpenMP parallel benchmarks [7] have also been analyzed successfully by the Dragon tool. Both POP beta 2.0 and GenIDLEST are large, real-world applications containing MPI and OpenMP. We are currently enhancing Dragon and Open64 to provide dynamic (runtime) array region information, in order to better understand the actual array access patterns for different OpenMP threads. This functionality may help privatize data in an OpenMP code, or restructure code to achieve SPMD style OpenMP. Each time an array region is accessed dynamically, we will record the information necessary to instantiate that region (which may have been described in symbolic terms), and de-termine which thread has accessed it. We will combine this information with the dynamic call graph and control flow graph of the application to provide different views of array region summaries at the procedure, basic block, statement and thread level. One of our research goals is to provide further support for developing SPMD style OpenMP, which promises to provide good performance on shared and distributed shared memory systems. To do this we need to develop additional functionality, in-cluding the ability to analyze and present information on explicitly parallel OpenMP programs, such as the parallel data flow graph and parallel task graph.
References
1. The ASCI Blue Benchmark Codes, http://www.llnl.gov/asci_benchmarks/ 2. B. M. Chapman, T. H. Weng, O. Hernandez, Z. Liu, L. Huang, Y. Wen, L.
Adhianto. “Cougar: Interactive Tool for Cluster Computing,” Proceedings of the 6th World MultiConference on Systemics, Cybernetics and Informatics, Or-lando, Florida. July 14-18, 2002.
3. Dragon tool, http://www.cs.uh.edu/~dragon 4. Foresys, http://www.simulog.fr/is/2fore1.htm 5. O. Hernandez, “Dragon Analysis Tool”, Master Thesis. Department of Com-
puter Science, University of Houston. December 2002. 6. C. S. Ierotheou, S. P. Johnson, M. Cross, and P. Legget, “Computer Aided Par-
allelisation Tools (CAPTools) – Conceptual Overview and Performance on the Parallelisation of Structured Mesh Codes,” Parallel Computing, 22 (1996) 163-195.
7. H. Jin, M. Frumkin, J. Yan, “The OpenMP Implementation of NAS Parallel Benchmarks and its Performance,” NASA Technical Report, NAS-99-011, 1999.
8. Z. Liu, B. Chapman, T.-H. Weng, O. Hernandez, “Improving the Performance of OpenMP by Array Privatization,” WOMPAT’2002, Workshop on OpenMP Ap-plications and Tools. The University of Alaska Fairbanks. Fairbanks, Alaska. August 5-7, 2002.
9. The Open64 compiler, http://open64.sourceforge.net/ 10. The OpenMP Application Program Interface, http://www.openmp.org 11. Parallel Ocean Program(POP), http://www.acl.lanl.gov/climate/models/pop/ 12. Source Navigator, http://sourcenav.sourceforge.net/ 13. M. Satoh, Y. Aoki, K. Wada, T. Iitsuka, and S. Kikuchi, “Interprocedural Paral-
lelizing Compiler WPP and Analysis Information Visualization too Aivi,” Sec-ond European Workshop on OpenMP ( EWOMP 2000 ), 2000
14. D. K. Tafti. “GenIDLEST - A Scalable Parallel Computational Tool for Simulat-ing Complex Turbulent Flows,” Proceedings of the ASME Fluids Engineering Division, FED 256, ASME-IMECE, Nov. 2001, New York.
15. T.-H. Weng, B. M. Chapman. “Implementing OpenMP Using Dataflow Execu-tion Model for Data Locality and Efficient Parallel Execution,” Proceedings of the 7th workshop on High-Level Parallel Programming Models and Supportive Environments (HIPS-7), IEEE, Ft. Lauderdale, April 2002.
16. M. Giordano and M. Mango Furnari. GPE: an OpenMP Program Development Environment. 2004 To appear.
17. Intel Thread Checker, http://www.intel.com/software/products/threading/tcwn/ 18. Tuning and Analysis Utilities (TAU),
http://www.cs.uoregon.edu/research/paracomp/tau 19. Felix Wolf, Bernd Mohr: Automatic Performance Analysis of Hybrid
MPI/OpenMP Applications. Euro PDP 2003: 13-22 20. Guide Reference Manual, http://www.intel.com 21. The NAS Parallel Benchmarks, http://www.nas.nasa.gov/Software/NPB/
22. William Pugh, “The Omega test: a fast and practical integer programming algo-rithm for dependence analysis, ” Proceedings of the 1991 ACM/IEEE confer-ence on Supercomputing, p.4-13, November 18-22, 1991, Albuquerque, New Mexico, United States
23. S.-W Liao, A. Diwan, R. P. Bosch, Jr. and A. Ghuloum, M. S. Lam, "SUIF Ex-plorer: An Interactive and Interprocedural Parallelizer," Proceedings of the 7th ACM SIGPLAN Symposium on Principles and Practice of Parallel Program-ming (PPOPP'99), May, 1999.