Embed Size (px)
Citation preview
Delft University of Technology
Droplet microfluidics for bioprocess engineering
Totlani, K.
DOI10.4233/uuid:002fd175-87bf-4f59-9428-96c0a3d3f6f8Publication date2021Document VersionFinal published versionCitation (APA)Totlani, K. (2021). Droplet microfluidics for bioprocess engineering. https://doi.org/10.4233/uuid:002fd175-87bf-4f59-9428-96c0a3d3f6f8
Important noteTo cite this publication, please use the final published version (if applicable).Please check the document version above.
CopyrightOther than for strictly personal use, it is not permitted to download, forward or distribute the text or part of it, without the consentof the author(s) and/or copyright holder(s), unless the work is under an open content license such as Creative Commons.
Takedown policyPlease contact us and provide details if you believe this document breaches copyrights.We will remove access to the work immediately and investigate your claim.
This work is downloaded from Delft University of Technology.For technical reasons the number of authors shown on this cover page is limited to a maximum of 10.
Propositions
accompanying the dissertation
DROPLET MICROFLUIDICS FOR BIOPROCESS ENGINEERING
by
Kartik Arun TOTLANI
1. Microfluidics promises Lab-on-a-Chip yet delivers Chip-in-a-Lab.
2. Validation through organs-on-chips should be commonplace in pre-clinical stud-ies.
3. Geometry-mediated strategies make droplet-based microfluidics for semi-continuouscell-cultures accessible to non-experts. (Chapter-3, this thesis).
4. Simplicity and brevity in scientific writing has been sold out to pre-empting criti-cism during peer review.
5. TU Delft’s applied sciences’ grading scheme is biased in favour of theoretical projects.
6. Instant gratification in the world of social media leads to a generation lacking sci-entific rigour.
7. Development of technology for rapid diagnosis of diseases deserves more mediaattention than self-driven cars.
8. Importance of lazy geniuses is underrated.
9. Principal Investigators should spend more of their time in the lab.
10. Owing to the funding inequity, global university rankings can’t be taken seriously.
These propositions are regarded as opposable and defendable, and have been approvedas such by the promotor prof. dr. ir. M. T. Kreutzer and co-promoters dr. W. M. van Gulik
and dr. V. van Steijn

DROPLET MICROFLUIDICS FOR BIOPROCESSENGINEERING

DROPLET MICROFLUIDICS FOR BIOPROCESSENGINEERING
Dissertation
for the purpose of obtaining the degree of doctorat Delft University of Technology,
by the authority of the Rector Magnificus prof. dr. ir. T. H. J. J. van der Hagen,chair of the board of Doctorates,
to be defended publicly on Thursday 21 October 2021 at 12.30 hours
by
Kartik Arun TOTLANI
Master of Science in Chemical Engineering,Delft University of Technology, Delft, the Netherlands,
Born in Nagpur, India.
This dissertation has been approved by the
promotor: Prof. dr. ir. M. T. Kreutzercopromotor: Dr. W. M. van Gulikcopromotor: Dr. V. van Steijn
Composition of the doctoral committee:
Rector Magnificus, chairpersonProf. dr. ir. M. T. Kreutzer, Delft University of TechnologyDr. W. M. van Gulik, Delft University of TechnologyDr. V. van Steijn, Delft University of Technology
Independent members:Prof. dr. P. Garstecki, Polish Academy of SciencesProf. dr. F. G. Mugele, University of TwenteProf. dr. ir. C. Poelma, Delft University of TechnologyProf. dr. P. A. S. Daran-Lapujade, Delft University of Technology
Reserve Member:Prof. dr. ir. C. R. Kleijn, Delft University of Technology
Keywords: Bioprocess engineering, droplet microfluidics, droplet on-demand,fed-batch, nutrient-controlled growth, yeast, dissolved oxygen,droplet-based assays, lab-on-a-chip
Printed by: Ipskamp Printing
Front & Back: Beautiful cover art by Khushal Kapoor and Gaurav Dhanda that cap-tures the coalescence of nutrient droplet and cell containing droplet toestablish fed-batch process on a chip.
Copyright © 2021 by K. Totlani
ISBN 978-94-6421-522-9
An electronic version of this dissertation is available athttp://repository.tudelft.nl/.

for my family

SUMMARY
A crucial challenge during the initial stages of bioprocess development is that tools usedto screen microorganisms and optimize cultivation conditions do not represent the en-vironment imposed at industrial scale. Inside an industrial-scale bioreactor, microor-ganisms are often cultivated under fed-batch conditions, where nutrients are suppliedduring the culture. Additionally, microorganisms continuously keep crossing zones withlow and high concentrations of substrate and dissolved oxygen. However, during ini-tial bioprocess development, growth and productivity of microorganisms are evaluatedunder batch conditions due to the difficulty of dynamically controlling nutrient and dis-solved oxygen concentrations in screening equipment such as micotiter plates. This in-consistency in cultivation conditions often leads to selection of strains that fail to per-form at industrial scale. The difficulty in continuously supplying minute amounts ofnutrients to microorganisms in microtiter plates and imposing dynamic dissolved oxy-gen levels throughout the cultivation experiment necessitates an alternative approach.Microfluidic technology holds the potential to address this inconsistency with fidelityby offering high-throughput experimentation and excellent control over the culture mi-croenvironment. The central theme of this Ph.D. project is the design and develop-ment of droplet-based microfluidic technology, that enable studying microorganismsunder such dynamically controlled cultivation conditions. As such, the outcomes fromthis Ph.D. project form a foundation step towards narrowing the gap between screeningand industrial-scale use, with an eye to keeping the technology sufficiently simple to beadopted by the biotechnology and bioengineering community.
We start by reviewing different types of scalable micro-bioreactor platforms that couldbe utilized for carrying out dynamic fed-batch and continuous cultures (chapter 2). Wecategorize the platforms into three types: (i) microtiter plate-based, (ii) microfluidicchamber-based, and (iii) microfluidic droplet-based. This review highlights the poten-tial of droplet-based micro-bioreactors and motivates the development of the droplet-based systems presented in this thesis.
The first type of tool we developed is a droplet-based nanobioreactor that facilitatesnutrient-controlled cultivation in fed-batch mode. Since the operation of such a de-vice needs a reliable method for supplying nutrient droplets to cell-containing droplets,we first designed a strategy for feeding nutrient droplets. As a first goal, we developeda scalable microfluidic droplet on-demand (DoD) generator for producing monodis-perse droplets, where the droplet volume is primarily dictated by the generator geom-etry and is independent of operating conditions (chapter 3). The DoD generator wasthoroughly characterized for a range of operating conditions and flow parameters whilegenerating droplets with a high monodispersity. By decoupling droplet formation fromits transport, a reliable scale-out was achieved for the sequential generation of dropletson-demand at multiple DoD junctions in the chip. This DoD technology was used todesign and develop a microfluidic tool that enables studying microorganisms under
vii
viii SUMMARY
nutrient-controlled fed-batch conditions (chapter 4). We hereby use the yeast Cyberlind-nera (Pichia) jadinii as a model organism. The droplet-based fed-batch nanobioreactorcomprises two separate DoD generators, where the first one is used for creating dropletsencapsulated with microorganisms and the second one for making nutrient droplets atthe desired frequency throughout the cultivation. The nutrient droplets were chemi-cally coalesced to the cell-containing droplet, immobilized inside a trap, by temporarilyde-stabilizing the droplet-droplet interface through the flow of a poor solvent around it,thereby establishing a fed-batch process. We performed nutrient-controlled cell growthexperiments by varying the glucose concentration inside the nutrient droplets and byvarying the frequency of droplet generation. Nutrient controlled growth inside the dropletswas established by demonstrating different cell growth rates with different glucose con-centrations inside nutrient droplets. The growth behaviour of the microorganisms for adifferent set of glucose concentrations agreed well with a simple kinetic growth model.Diverting away from continuous droplet microfluidic platforms which require sophisti-cated workflows and integration of multiple devices, we developed a strategy that facili-tates simple operation and fabrication of devices from standard procedures. The resultsfrom this work form a proof-of-concept of long-term and nutrient-controlled growth ofmicroorganisms inside microdroplets through a controlled supply of nutrient droplets.
The second type of microfluidic tool that we developed enables the cultivation ofyeast inside microdroplets with the main supply of oxygen to the cells coming fromthe oil flowing around the droplets (chapter 5). We used fluorinated oil as it has a highoxygen solubility. Batch growth of Cyberlindnera (Pichia) jadinii was performed insidedroplets under two limiting cases. For the first case, oil saturated with oxygen was flownaround the droplets containing microorganisms, which showed exponential cell growth.In contrast, negligible growth was observed in the second case where the oil was satu-rated with nitrogen and flown around the droplets. Even though we present preliminaryresults on the cultivation of microorganisms under two static oxygen levels, this method-ology could be further developed to impose dynamic changes in dissolved oxygen con-centration as experienced by microorganisms inside an industrial-scale reactor in orderto take along the sensitivity of microorganisms towards such changes during the initialstages of bioprocess development.
SAMENVATTING
Een belangrijke uitdaging tijdens de eerste fasen van de ontwikkeling van bioproces-sen is dat de methoden die worden gebruikt voor het selecteren van micro-organismenen het optimaliseren van de kweekomstandigheden niet representatief zijn voor de om-geving van microorganismen op industriële schaal. Enerzijds worden in een reactorop industriële schaal micro-organismen in veel gevallen gekweekt volgens de fed-batchmethode, waarbij nutriënten worden toegevoegd tijdens de kweek. Bovendien door-kruisen de micro-organismen voortdurend zones met lage en hoge substraat concen-traties en opgeloste zuurstofconcentraties. Anderzijds worden tijdens screening en ini-tiële bioprocesontwikkeling de groei en productiviteit van micro-organismen geëvalu-eerd in batchcultuur in microtiterplaten, zonder toevoeging van nutriënten of dyna-misch wisselende niveaus van substraat en opgeloste zuurstof. Deze inconsistentie inkweekomstandigheden leidt vaak tot de selectie van stammen die niet goed presteren opindustriële schaal. De moeilijkheid om voortdurend minuscule hoeveelheden voedings-stoffen toe te dienen aan micro-organismen in microtiterplaten en dynamische opge-loste zuurstofniveaus op te leggen gedurende het kweekexperiment maakt een alterna-tief noodzakelijk. Microfluïdische technologie biedt deze mogelijkheden en is tevens ge-schikt voor high-throughput experimentatie met behoud van uitstekende controle overde kweekomgeving op microschaal. Het centrale thema van dit promotieproject is hetontwerp en de ontwikkeling van druppel gebaseerde microfluïdische technologie, diehet mogelijk maakt om micro-organismen te bestuderen onder dergelijke dynamischgecontroleerde kweekomstandigheden. Daarmee zijn de resultaten van dit project eeneerste stap in de richting van het verkleinen van de kloof tussen de screeningfase en hetgebruik van micro-organismen op industriële schaal, terwijl er bij de ontwikkeling aan-dacht is geschonken aan het voldoende eenvoudig maken van de technieken om zo tekunnen worden toegepast door de biotechnologische en bio-engineeringgemeenschap.
We beginnen met een overzicht van de verschillende types schaalbare microbiore-actorplatformen die kunnen worden gebruikt voor het uitvoeren van dynamische fed-batch en continue culturen (hoofdstuk 2). We delen deze platforms in drie types in:(i) microtiterplaat-gebaseerd, (ii) microfluïdisch vat gebaseerd, en (iii) microfluïdischedruppel gebaseerd. Dit review illustreert de potentie van microfluïdische druppel geba-seerd systemen en motiveert de ontwikkeling ervan zoals gepresenteerd in deze thesis.
Het eerste type microfluïdisch systeem dat we ontwikkeld hebben is een nanobio-reactor op basis van druppels die nutriënt gecontroleerde kweek in fed-batch modusmogelijk maakt. Aangezien de werking van een dergelijk druppel gebaseerde reactoreen betrouwbare methode vereist voor de toevoer van nutriëntdruppels naar de cel-bevattende druppel, ontwierpen we eerst een strategie voor het genereren van dergelijkenutriëntdruppels. Hiertoe werd een schaalbare microfluïdische druppel op aanvraag(Droplet-on-demand, DoD) generator voor het produceren van monodisperse druppelsgeconstrueerd, waar het druppelvolume voornamelijk wordt bepaald door de geometrie
ix
x SAMENVATTING
van de generator en onafhankelijk is van de condities (hoofdstuk 3). De DoD generatorwerd grondig gekarakteriseerd voor een reeks van procescondities, terwijl druppels meteen hoge monodispersiteit werden gegenereerd. Door druppelvorming los te koppelenvan transport werd een betrouwbare schaalbare methode bereikt voor het herhaaldelijkgenereren van druppels op aanvraag op meerdere DoD generatoren op de microfluïdi-sche chip. De DoD technologie is vervolgend gebruikt om een chip te ontwerpen enontwikkelen die het mogelijk maakt om micro-organismen te bestuderen onder nutri-ënt gecontroleerde kweek in fed-batch modus (hoofdstuk 4). We hebben hierbij Cyber-lindnera (Pichia) jadinii gebruikt als model micro-organisme. De druppel gebaseerdefed-batch nanobioreactor bestond uit twee afzonderlijke DoD generatoren waarbij deeerste werd gebruikt voor het maken van druppels met daarin de micro-organismen ende tweede voor het genereren van de voedingsdruppels met de gewenste frequentie ge-durende de cultivatie. Coalescentie van de voedingsdruppels met de geïmmobiliseerdedruppel met cellen werd bereikt door tijdelijk destabiliseren van het druppel-druppelinterface met behulp van een oplosmiddel. Op deze manier kon een fed-batch cultivatieuitgevoerd worden. We hebben gecontroleerde celgroei experimenten uitgevoerd doorde glucoseconcentratie binnen de voedingsdruppels te variëren en door de frequentievan de druppelgeneratie te wijzigen. Nutriënt gecontroleerde groei binnenin de drup-pels werd bereikt door aan te tonen dat de cellen verschillende groeisnelheden bij ge-bruik van verschillende glucoseconcentraties in de voedingsdruppels. Het groeigedragvan de micro-organismen voor verschillende glucoseconcentraties kwam goed overeenmet berekeningen aan de hand een eenvoudig kinetisch groeimodel. Wij zijn er hierbijin geslaagd om een strategie voor fed-batch kweek op chip te ontwikkelen met behulpvan een relatief eenvoudige opstelling bestaande uit een in de handel verkrijgbare druk-pomp en microfluïdische chips die volgens standaardprocedures worden vervaardigd.De resultaten van dit werk vormen een proof-of-concept van substraat gelimiteerde cul-tivatie van micro-organismen binnen microdruppels door een gecontroleerde toevoervan voedingsdruppels.
Het tweede type microfluïdisch systeem dat wij ontwikkelden maakt het mogelijk gistte kweken in microdruppels terwijl de belangrijkste toevoer van zuurstof naar de cellenafkomstig is van de olie die rond de druppels stroomt (hoofdstuk 5). We gebruiken ge-fluoreerde olie, omdat deze een hoge oplosbaarheid van zuurstof heeft. Batchgroei vanCyberlindnera (Pichia) jadinii werd uitgevoerd onder twee limietgevallen. In het eerstegeval werd met zuurstof verzadigde olie rond de druppels met micro-organismen ge-leid, met exponentiële celgroei als gevolg. de cel gedurende een langere periode in alledruppels een aanzienlijke groei vertoonden. Daarentegen werd verwaarloosbare groeiwaargenomen in het geval waarin olie verzadigd met stikstof rond de druppels werd ge-leid. Hoewel we voorlopige resultaten presenteren over de kweek van micro-organismenonder verschillende statische zuurstofniveaus, voorzien we dat deze methodologie ver-der kan worden ontwikkeld om fluctuaties in de opgeloste zuurstofconcentratie op teleggen zoals die worden ervaren door micro-organismen in een reactor op industriëleschaal. Op deze manier kan de gevoeligheid van micro-organismen voor fluctuaties inopgelost zuurstof worden meegenomen tijdens de eerste fasen van de ontwikkeling vanbioprocessen.
CONTENTS
Summary vii
Samenvatting ix
1 Introduction 11.1 Challenges in bioprocess development . . . . . . . . . . . . . . . . . . . 21.2 Droplet microreactors for bioprocess engineering . . . . . . . . . . . . . 41.3 Research goals . . . . . . . . . . . . . . . . . . . . . . . . . . . . . . . 61.4 Dissertation outline . . . . . . . . . . . . . . . . . . . . . . . . . . . . . 7References . . . . . . . . . . . . . . . . . . . . . . . . . . . . . . . . . . . . 8
2 Microbioreactors for nutrient-controlled cultures 112.1 Introduction . . . . . . . . . . . . . . . . . . . . . . . . . . . . . . . . 122.2 Microbioreactors for nutrient-controlled cultivation of microorganisms . . 12
2.2.1 Microtiter plate-based platforms. . . . . . . . . . . . . . . . . . . 122.2.2 Microfluidic chamber-based platforms . . . . . . . . . . . . . . . 142.2.3 Microfluidic droplet-based platforms . . . . . . . . . . . . . . . . 17
References . . . . . . . . . . . . . . . . . . . . . . . . . . . . . . . . . . . . 21
3 Droplet on demand generator 253.1 Introduction . . . . . . . . . . . . . . . . . . . . . . . . . . . . . . . . 263.2 Materials and Methods . . . . . . . . . . . . . . . . . . . . . . . . . . . 28
3.2.1 Device design . . . . . . . . . . . . . . . . . . . . . . . . . . . . 283.2.2 Device operation. . . . . . . . . . . . . . . . . . . . . . . . . . . 293.2.3 Device fabrication . . . . . . . . . . . . . . . . . . . . . . . . . . 303.2.4 Working fluids . . . . . . . . . . . . . . . . . . . . . . . . . . . . 313.2.5 Image acquisition and analysis. . . . . . . . . . . . . . . . . . . . 31
3.3 Results and discussion . . . . . . . . . . . . . . . . . . . . . . . . . . . 313.3.1 Single droplet on-demand: Robustness in operation. . . . . . . . . 313.3.2 Single droplet on-demand: Robustness in used fluids . . . . . . . . 353.3.3 Scaling out droplet on-demand: Importance of decoupling forma-
tion and release . . . . . . . . . . . . . . . . . . . . . . . . . . . 363.3.4 Application of droplet on-demand: Reagent supply in a droplet-
based assay . . . . . . . . . . . . . . . . . . . . . . . . . . . . . 403.4 Conclusions. . . . . . . . . . . . . . . . . . . . . . . . . . . . . . . . . 41
Appendices 433.A Drawing of microfluidic devices. . . . . . . . . . . . . . . . . . . . . . . 433.B MATLAB script for running a DoD experiment . . . . . . . . . . . . . . . 473.C Pressure profiles for Figure.3.3.3(a) . . . . . . . . . . . . . . . . . . . . . 50
xi
xii CONTENTS
3.D Droplet on demand movies . . . . . . . . . . . . . . . . . . . . . . . . . 51References . . . . . . . . . . . . . . . . . . . . . . . . . . . . . . . . . . . . 53
4 Fed-batch droplet nanobioreactor 594.1 Introduction . . . . . . . . . . . . . . . . . . . . . . . . . . . . . . . . 604.2 Results and Discussion . . . . . . . . . . . . . . . . . . . . . . . . . . . 61
4.2.1 Fed-batch droplet nanobioreactor : Concept. . . . . . . . . . . . . 614.2.2 Fed-batch droplet nanobioreactor: Device architecture and opera-
tion . . . . . . . . . . . . . . . . . . . . . . . . . . . . . . . . . 624.2.3 Nutrient feeding profiles . . . . . . . . . . . . . . . . . . . . . . . 644.2.4 Controlled growth of Cyberlindnera (Pichia) jadinii in fed-batch droplet
nanobioreactor . . . . . . . . . . . . . . . . . . . . . . . . . . . 664.3 Conclusions & Outlook . . . . . . . . . . . . . . . . . . . . . . . . . . . 704.4 Materials and Methods . . . . . . . . . . . . . . . . . . . . . . . . . . . 71
4.4.1 Device design and dimensions . . . . . . . . . . . . . . . . . . . . 714.4.2 Device fabrication . . . . . . . . . . . . . . . . . . . . . . . . . . 724.4.3 Experimental setup . . . . . . . . . . . . . . . . . . . . . . . . . 734.4.4 Image acquisition and analysis. . . . . . . . . . . . . . . . . . . . 734.4.5 Working fluids . . . . . . . . . . . . . . . . . . . . . . . . . . . . 744.4.6 Microbial growth model . . . . . . . . . . . . . . . . . . . . . . . 75
Appendices 774.A MATLAB script for running fed-batch experiment . . . . . . . . . . . . . 774.B Fed-batch droplet nanobioreactor movies . . . . . . . . . . . . . . . . . 844.C Drawing of fed-batch microfluidic chip . . . . . . . . . . . . . . . . . . . 854.D Growth curves for the nutrient-controlled growth experiments . . . . . . . 864.E Mixing inside fed-batch droplet nanobioreactor . . . . . . . . . . . . . . 864.F Close-up of cells inside microdroplet . . . . . . . . . . . . . . . . . . . . 874.G Preparation of vitamins and trace elements . . . . . . . . . . . . . . . . . 884.H Toxicity of coalescence agent . . . . . . . . . . . . . . . . . . . . . . . . 904.I Kinetic cell growth model . . . . . . . . . . . . . . . . . . . . . . . . . . 91References . . . . . . . . . . . . . . . . . . . . . . . . . . . . . . . . . . . . 93
5 Microfluidic tool for dissolved oxygen 995.1 Introduction . . . . . . . . . . . . . . . . . . . . . . . . . . . . . . . . 1005.2 Results and Discussion . . . . . . . . . . . . . . . . . . . . . . . . . . . 101
5.2.1 Quantification of growth of C. Jadinii inside microdroplets . . . . . 1015.2.2 Growth under Oxygen rich conditions . . . . . . . . . . . . . . . . 1035.2.3 Growth under oxygen deprived conditions. . . . . . . . . . . . . . 104
5.3 Conclusions. . . . . . . . . . . . . . . . . . . . . . . . . . . . . . . . . 1045.4 Materials and Methods . . . . . . . . . . . . . . . . . . . . . . . . . . . 106
5.4.1 Device fabrication . . . . . . . . . . . . . . . . . . . . . . . . . . 1065.4.2 Experimental setup . . . . . . . . . . . . . . . . . . . . . . . . . 1065.4.3 Image acquisition and analysis. . . . . . . . . . . . . . . . . . . . 1075.4.4 Working fluids . . . . . . . . . . . . . . . . . . . . . . . . . . . . 108
CONTENTS xiii
Appendices 1115.A Growth of C. Jadinii inside microdroplet . . . . . . . . . . . . . . . . . . 1115.B Drawing of microfluidic devices. . . . . . . . . . . . . . . . . . . . . . . 111References . . . . . . . . . . . . . . . . . . . . . . . . . . . . . . . . . . . . 112
6 Conclusion and Outlook 1156.1 Conclusions. . . . . . . . . . . . . . . . . . . . . . . . . . . . . . . . . 116
6.1.1 Droplet on-demand generator . . . . . . . . . . . . . . . . . . . . 1166.1.2 Fed-batch droplet nanobioreactor . . . . . . . . . . . . . . . . . . 1166.1.3 Microfluidic tool for dissolved oxygen . . . . . . . . . . . . . . . . 117
6.2 Opportunities for future research . . . . . . . . . . . . . . . . . . . . . . 1186.2.1 Droplet formation on-demand in long term culturing . . . . . . . . 1186.2.2 Scaling out: Towards screening under fed-batch conditions . . . . . 1186.2.3 Incorporation of analytics: Towards screening under fed-batch con-
ditions . . . . . . . . . . . . . . . . . . . . . . . . . . . . . . . . 1206.2.4 Imposing fluctuations in dissolved oxygen concentrations. . . . . . 121
References . . . . . . . . . . . . . . . . . . . . . . . . . . . . . . . . . . . . 122
Outreach 125
Propositions 127
Acknowledgements 129
Curriculum Vitæ 139

1INTRODUCTION
This doctoral dissertation is on the development of a microfluidic platform for the growthand study of microorganisms such as yeast inside microdroplets under dynamically con-trolled cultivation conditions. This chapter starts with a brief motivation of this devel-opment in the broader context of bioprocess development. After briefly introducing thedroplet-based approach taken in this work (a detailed review is provided in Chapter 2),we introduce the research goals. We conclude by describing the outline of the dissertation.
Part of this chapter would be submitted as K. Totlani, R. J. van Tatenhoeven-Pel, M. T. Kreutzer, W. M. vanGulik, V. van Steijn. Microbioreactors for nutrient-controlled microbial cultures: Bridging the gap betweenearly bioprocess development and industrial scale use.
1
1
2 1. INTRODUCTION
1.1. CHALLENGES IN BIOPROCESS DEVELOPMENT
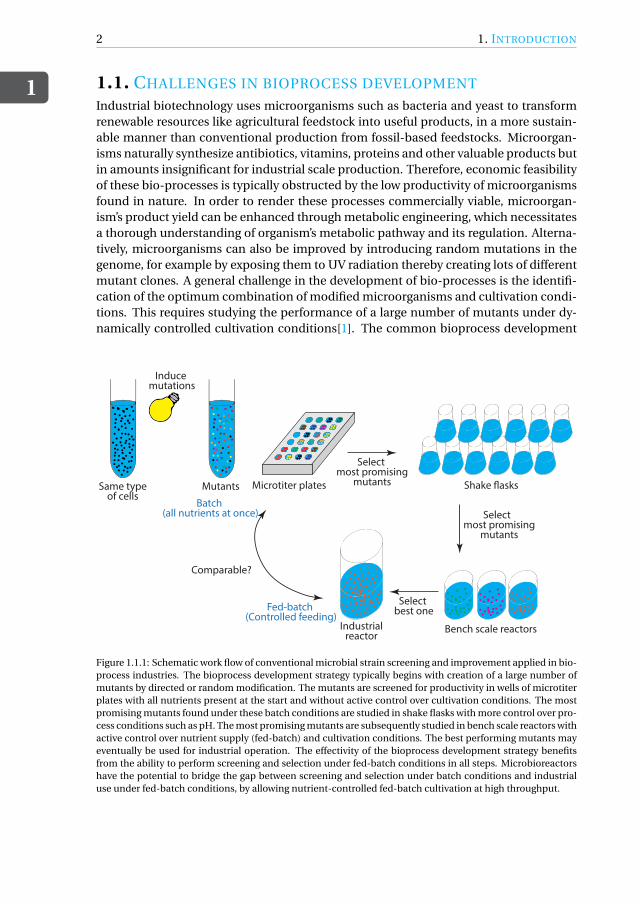
Industrial biotechnology uses microorganisms such as bacteria and yeast to transformrenewable resources like agricultural feedstock into useful products, in a more sustain-able manner than conventional production from fossil-based feedstocks. Microorgan-isms naturally synthesize antibiotics, vitamins, proteins and other valuable products butin amounts insignificant for industrial scale production. Therefore, economic feasibilityof these bio-processes is typically obstructed by the low productivity of microorganismsfound in nature. In order to render these processes commercially viable, microorgan-ism’s product yield can be enhanced through metabolic engineering, which necessitatesa thorough understanding of organism’s metabolic pathway and its regulation. Alterna-tively, microorganisms can also be improved by introducing random mutations in thegenome, for example by exposing them to UV radiation thereby creating lots of differentmutant clones. A general challenge in the development of bio-processes is the identifi-cation of the optimum combination of modified microorganisms and cultivation condi-tions. This requires studying the performance of a large number of mutants under dy-namically controlled cultivation conditions[1]. The common bioprocess development
Same type of cells
Induce mutations
Mutants Microtiter plates
Bench scale reactorsIndustrialreactor
Select most promising
mutants
Select most promising
mutants
Shake �asks
Select best one
Comparable?
Batch (all nutrients at once)
Fed-batch (Controlled feeding)
Figure 1.1.1: Schematic work flow of conventional microbial strain screening and improvement applied in bio-process industries. The bioprocess development strategy typically begins with creation of a large number ofmutants by directed or random modification. The mutants are screened for productivity in wells of microtiterplates with all nutrients present at the start and without active control over cultivation conditions. The mostpromising mutants found under these batch conditions are studied in shake flasks with more control over pro-cess conditions such as pH. The most promising mutants are subsequently studied in bench scale reactors withactive control over nutrient supply (fed-batch) and cultivation conditions. The best performing mutants mayeventually be used for industrial operation. The effectivity of the bioprocess development strategy benefitsfrom the ability to perform screening and selection under fed-batch conditions in all steps. Microbioreactorshave the potential to bridge the gap between screening and selection under batch conditions and industrialuse under fed-batch conditions, by allowing nutrient-controlled fed-batch cultivation at high throughput.
1.1. CHALLENGES IN BIOPROCESS DEVELOPMENT
1
3
strategy starts with studying a large number of modified microorganisms in the wells ofmicrotiter plates, with a small fraction of best performers progressing to the next phase.Further selection is sequentially performed with tools that afford more control over cul-tivation conditions, but have a lower throughput, first with shake flasks and eventuallywith fully-equipped lab scale reactors, as illustrated in Figure.1.1.1. The best performeris then selected for industrial scale operation[2, 3]. Even though microtiter plates andshake flasks facilitate high throughput experimentation, they do not afford dynamic con-trol over the cultivation conditions. Initial screening and selection is hence typically per-formed in batch mode where all the nutrients are present from the start of cultivation,and parameters like pH and dissolved oxygen are not actively controlled[4].
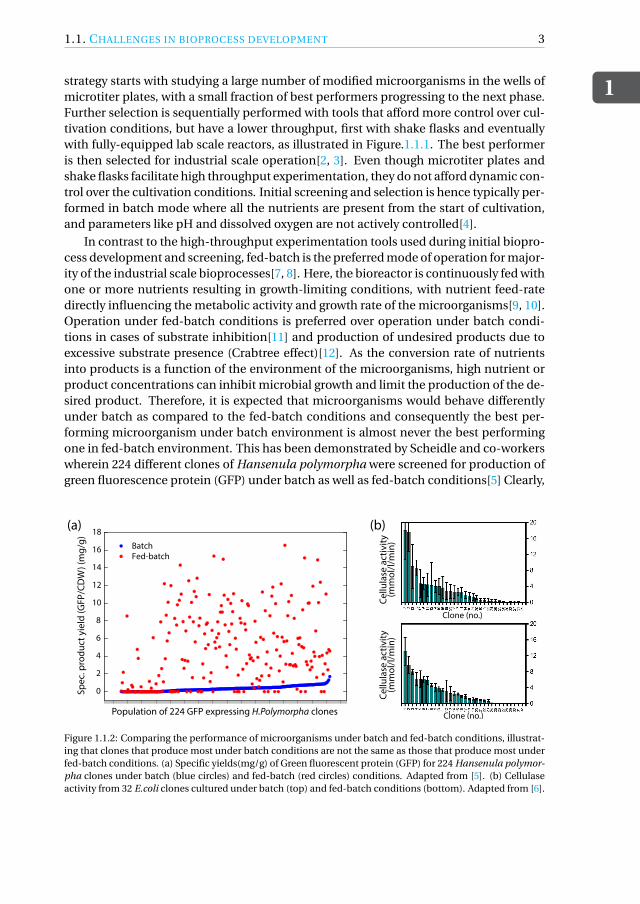
In contrast to the high-throughput experimentation tools used during initial biopro-cess development and screening, fed-batch is the preferred mode of operation for major-ity of the industrial scale bioprocesses[7, 8]. Here, the bioreactor is continuously fed withone or more nutrients resulting in growth-limiting conditions, with nutrient feed-ratedirectly influencing the metabolic activity and growth rate of the microorganisms[9, 10].Operation under fed-batch conditions is preferred over operation under batch condi-tions in cases of substrate inhibition[11] and production of undesired products due toexcessive substrate presence (Crabtree effect)[12]. As the conversion rate of nutrientsinto products is a function of the environment of the microorganisms, high nutrient orproduct concentrations can inhibit microbial growth and limit the production of the de-sired product. Therefore, it is expected that microorganisms would behave differentlyunder batch as compared to the fed-batch conditions and consequently the best per-forming microorganism under batch environment is almost never the best performingone in fed-batch environment. This has been demonstrated by Scheidle and co-workerswherein 224 different clones of Hansenula polymorpha were screened for production ofgreen fluorescence protein (GFP) under batch as well as fed-batch conditions[5] Clearly,
(a) (b)
Clone (no.)
Cellu
lase
act
ivity
(mm
ol/l/
min
)Ce
llula
se a
ctiv
ity(m
mol
/l/m
in)
Clone (no.)Population of 224 GFP expressing H.Polymorpha clones
Spec
. pro
duct
yie
ld (G
FP/C
DW
) (m
g/g)
0
2
4
6
8
10
12
14
16
18
Batch Fed-batch
Figure 1.1.2: Comparing the performance of microorganisms under batch and fed-batch conditions, illustrat-ing that clones that produce most under batch conditions are not the same as those that produce most underfed-batch conditions. (a) Specific yields(mg/g) of Green fluorescent protein (GFP) for 224 Hansenula polymor-pha clones under batch (blue circles) and fed-batch (red circles) conditions. Adapted from [5]. (b) Cellulaseactivity from 32 E.coli clones cultured under batch (top) and fed-batch conditions (bottom). Adapted from [6].
1
4 1. INTRODUCTION
there is no correlation between best-producing clones under batch and fed-batch con-ditions, see Figure.1.1.2(a)). Additionally, the average yield achieved under fed-batchconditions is about 14-fold higher than that achieved under batch conditions. Similarobservations, although less strikingly, were recently reported by Keil and co-workers[6],who compared the performance of 32 clones of cellulase producing E.coli under batchand fed-batch conditions, see Figure.1.1.2(b). Both these studies clearly illustrate thatidentifying best performers under batch conditions with the purpose to use them underfed-batch conditions at industrial scale leads to ineffectiveness in bio-process develop-ment.
Besides nutrient levels, oxygen levels present a second inconsistency in conditionsduring screening and industrial scale operation. In industrial scale bioreactors, oxy-gen levels vary from bottom to top, since oxygen is fed from the bottom[13, 14]. Dur-ing cultivation, microorganisms experience dynamically changing oxygen levels whentraveling through regions of high and low concentrations of dissolved oxygen. It wouldtherefore be beneficial to perform screening under dynamically varying oxygen levelsin order to evaluate the sensitivity of different mutants towards dissolved oxygen levels.However, mimicking such a dynamic environment of dissolved oxygen is not yet pos-sible with state-of-the-art screening tools. Microreactors, known for their unsurpassedcontrol over fluids on the one hand and their the scalability on the other hand, offer thepotential to address the inconsistency between screening and industrial use of microor-ganisms.
1.2. DROPLET MICROREACTORS FOR BIOPROCESS ENGINEER-ING
Droplet-based microfluidics is an emerging technology for numerous applications inmicrobiology and biotechnology[15–18] where microorganisms are encapsulated insidediscrete aqueous phase microdroplets, that are formed and transported within an im-miscible organic phase. Microdroplets offer compartmentalization, single-cell resolu-tion and the possibility to add reagents for bio-chemical assays. The possibility to per-form (1) a large number of experiments in parallel, (2) complex multistep and multi-plexed operations on miniscule droplet microreactors, and (3) manipulation of smallvolumes with extensive spatio-temporal control makes droplet-based microfluidics asuitable platform for non-steady assays. Microdroplets have been used for carrying outhigh throughput chemical and biological experimentation where droplet operations likeformation, reagent addition, on/off-chip incubation, splitting and sorting are imple-mented based on the requirements of the process workflow. For high throughput screen-ing applications, millions of microdroplets encapsulated with microorganisms are typi-cally generated, incubated, and based on the product of interest secreted in each droplet,sorting is performed for selecting best performing microbes[19]. A plethora of studieshave been performed for screening of microorganism using droplet-based microfluidics.A recent review by Payne and co-workers[20] highlights the key challenges associatedwith the development of such droplet-based screening routines and offers perspectivetowards addressing them.
While most of droplet screening platforms involve addition of nutrients only in the be-
1.2. DROPLET MICROREACTORS FOR BIOPROCESS ENGINEERING
1
5
ginning of the routine (batch format), a more industrially-relevant method of screeningwould be to feed nutrients during the incubation in order to mimic a fed-batch process.Development of a droplet-based microfluidic platform capable of cultivating and pos-sibly screening microorganisms in nutrient controlled fed-batch mode would requireimplementation of following set of operations:
1. Generation of cell-containing droplets on-demand.
2. Generation of nutrient-containing droplets on-demand.
3. Coalescence of nutrient-containing droplets with cell-containing droplets to es-tablish nutrient feeding.
4. Long term growth(and real time monitoring) of microorganism inside droplets in-cubating on a microfluidic device.
5. Retrieval of the best performing microorganisms.
Studying microorganisms under dynamically controlled dissolved oxygen levels addi-tionally requires dynamically controlling those levels throughout the incubation period.Based on the aforementioned set of conditions, research goals have been formulated inthe next section.
1
6 1. INTRODUCTION
1.3. RESEARCH GOALSThe main goal of this Ph.D. thesis is development of droplet-based microfluidic toolsthat enable studying cells under dynamically controlled cultivation conditions. The firsttype of tool we engineered is a fed-batch droplet microreactor that enables nutrient-controlled fed-batch cultivation. Its development critically hinges on the developmentof a method that enables a robust on-demand supply of nutrient droplets to the cell-containing droplet. Once the nutrient feeding strategy was developed in the first re-search goal, the next step was the application of the designed droplet on-demand gen-erator for carrying out nutrient limited fed-batch cultivation of microorganisms such asyeast. The second type of tool we engineered enables studying cells under different oxy-gen tensions. Taken together, the three goals addressed in this thesis are:
• Droplet on-demand generator
Generating multiple monodisperse droplets on-demand at different locations on amicrofluidic chip at the same instance for non-steady droplet based assays.
This research goal has been addressed in Chapter 3 of this dissertation.
• Fed-batch droplet nanobioreactor
Development of a droplet-based microfluidic platform for cultivation of microor-ganisms where their growth rate can be controlled by nutrient feeding.
This research goal has been addressed in Chapter 4 of this dissertation.
• Microfluidic tool for dissolved oxygen
Design and development of a microfluidic static droplet array where growth of mi-croorganisms can be studied under different concentrations of dissolved oxygen.
This research goal has been addressed in Chapter 5 of this dissertation.
1.4. DISSERTATION OUTLINE
1
7
1.4. DISSERTATION OUTLINEThis doctoral dissertation comprises of 6 chapters including this introduction chapter.The outline of the dissertation is as follows:
• Chapter 2 describes an overview of different types of microbioreactor technologiesthat can be used for more dynamic continuous and fed-batch cultivation experi-ments. Three different types of microbioreactor platforms have been reviewed inthis chapter: (i) microtiter plate-based platforms, (ii) microfluidic chamber-basedplatforms, and (iii) microfluidic droplet-based platforms. The chapter concludeswith limitations for each of these types.
• Chapter 3 presents the design and development of a robust and scalable microflu-idic droplet on-demand (DoD) generator for the production of monodisperse water-in-oil droplets. The core idea is that volume of generated droplets is primarily gov-erned by the geometry of the DoD generator and independent of flow conditions.By decoupling the formation and the transport of the droplets, efficient scale-outis possible for producing multiple droplets on-demand that could be further usedas reagent droplets for non-steady droplet-based bio-chemical assays on a chip.
• Chapter 4 is on the development of a droplet-based fed-batch nanobioreactor thatenabled studying and growth of Cyberlindnera jadinii under nutrient-limited fed-batch conditions. Microorganisms are encapsulated inside the droplets and re-peatedly fed with nutrient-containing droplets to establish a fed-batch process.An innovative aspect of this platform is the integration of droplet on-demand gen-erators described in Chapter 3 with on-demand coalescence achieved by tempo-rary injection of a poor solvent.
• Chapter 5 is a short chapter on the development of a microfluidic platform whereyeast cells are cultivated inside microdroplets while, the continuously flowing oilphase is used as a source and sink for dissolved oxygen (DO). The goal was to per-form batch growth of Cyberlindnera jadinii under two different concentrations ofdissolved oxygen by leveraging the high oxygen-carrying capacity of fluorinatedoil. This chapter presents preliminary results on the development of a microflu-idic chip that could be used to impose dynamic dissolved oxygen levels such asthose experienced by microorganisms inside an industrial-scale reactor.
• Chapter 6 summarizes the main findings and conclusions of the work carried outin this doctoral dissertation as well as provides outlook and recommendations forfuture research that could be carried out.
1
8 REFERENCES
REFERENCES[1] P. Neubauer, N. Cruz, F. Glauche, S. Junne, A. Knepper, and M. Raven, “Consistent
development of bioprocesses from microliter cultures to the industrial scale,” En-gineering in Life Sciences, vol. 13, no. 3, pp. 224–238, 2013.
[2] S. Parekh, V. Vinci, and R. Strobel, “Improvement of microbial strains and fermenta-tion processes,” Applied microbiology and biotechnology, vol. 54, no. 3, pp. 287–301,2000.
[3] W. Zeng, L. Guo, S. Xu, J. Chen, and J. Zhou, “High-throughput screening technologyin industrial biotechnology,” Trends in biotechnology, 2020.
[4] Q. Long, X. Liu, Y. Yang, L. Li, L. Harvey, B. McNeil, and Z. Bai, “The developmentand application of high throughput cultivation technology in bioprocess develop-ment,” Journal of biotechnology, vol. 192, pp. 323–338, 2014.
[5] M. Scheidle, M. Jeude, B. Dittrich, S. Denter, F. Kensy, M. Suckow, D. Klee, andJ. Büchs, “High-throughput screening of hansenula polymorpha clones in the batchcompared with the controlled-release fed-batch mode on a small scale,” FEMS YeastResearch, vol. 10, no. 1, pp. 83–92, 2009.
[6] T. Keil, M. Landenberger, B. Dittrich, S. Selzer, and J. Büchs, “Precultures grownunder fed-batch conditions increase the reliability and reproducibility of high-throughput screening results,” Biotechnology journal, vol. 14, no. 11, p. 1800727,2019.
[7] C. Wittmann, A.-P. Zeng, and W.-D. Deckwer, “Growth inhibition by ammonia anduse of a ph-controlled feeding strategy for the effective cultivation of mycobac-terium chlorophenolicum,” Applied microbiology and biotechnology, vol. 44, no. 3,pp. 519–525, 1995.
[8] B. S. Kim, S. C. Lee, S. Y. Lee, Y. K. Chang, and H. N. Chang, “High cell density fed-batch cultivation of escherichia coli using exponential feeding combined with ph-stat,” Bioprocess and Biosystems Engineering, vol. 26, no. 3, pp. 147–150, 2004.
[9] T. Yamanè and S. Shimizu, “Fed-batch techniques in microbial processes,” pp. 147–194, 1984.
[10] H. C. Lim and H. S. Shin, Fed-batch cultures: principles and applications of semi-batch bioreactors. Cambridge University Press, 2013.
[11] M. Papagianni, Y. Boonpooh, M. Mattey, and B. Kristiansen, “Substrate inhibitionkinetics of saccharomyces cerevisiae in fed-batch cultures operated at constantglucose and maltose concentration levels,” Journal of Industrial Microbiology andBiotechnology, vol. 34, no. 4, pp. 301–309, 2007.
[12] E. Postma, C. Verduyn, W. A. Scheffers, and J. P. Van Dijken, “Enzymic analysis of thecrabtree effect in glucose-limited chemostat cultures of saccharomyces cerevisiae.,”Applied and environmental microbiology, vol. 55, no. 2, pp. 468–477, 1989.
REFERENCES
1
9
[13] A. R. Lara, E. Galindo, O. T. Ramírez, and L. A. Palomares, “Living with hetero-geneities in bioreactors,” Molecular biotechnology, vol. 34, no. 3, pp. 355–381, 2006.
[14] H. F. Zimmermann, T. Anderlei, J. Büchs, and M. Binder, “Oxygen limitation is apitfall during screening for industrial strains,” Applied microbiology and biotech-nology, vol. 72, no. 6, pp. 1157–1160, 2006.
[15] A. B. Theberge, F. Courtois, Y. Schaerli, M. Fischlechner, C. Abell, F. Hollfelder, andW. T. Huck, “Microdroplets in microfluidics: an evolving platform for discoveries inchemistry and biology,” Angewandte Chemie International Edition, vol. 49, no. 34,pp. 5846–5868, 2010.
[16] M. T. Guo, A. Rotem, J. A. Heyman, and D. A. Weitz, “Droplet microfluidics for high-throughput biological assays,” Lab on a Chip, vol. 12, no. 12, pp. 2146–2155, 2012.
[17] T. S. Kaminski, O. Scheler, and P. Garstecki, “Droplet microfluidics for microbiology:techniques, applications and challenges,” Lab on a Chip, vol. 16, no. 12, pp. 2168–2187, 2016.
[18] A. K. Price and B. M. Paegel, “Discovery in droplets,” Analytical chemistry, vol. 88,no. 1, pp. 339–353, 2016.
[19] M. Sesen, T. Alan, and A. Neild, “Droplet control technologies for microfluidic highthroughput screening (µhts),” Lab on a Chip, vol. 17, no. 14, pp. 2372–2394, 2017.
[20] E. M. Payne, D. A. Holland-Moritz, S. Sun, and R. T. Kennedy, “High-throughputscreening by droplet microfluidics: Perspective into key challenges and futureprospects,” Lab on a Chip, vol. 20, no. 13, pp. 2247–2262, 2020.

2MICROBIOREACTORS FOR
NUTRIENT-CONTROLLED CULTURES
Microbioreactors for nutrient-controlled microbial cultures: Bridgingthe gap between early bioprocess development and industrial scale use
In industrial strain improvement programs large numbers of mutants are generated throughrandom mutagenesis or automated strain construction, followed by high-throughput screen-ing to select the ones that perform best for use at industrial scale. At industrial scale, strictnutrient-controlled fed-batch conditions are imposed as a means to control the metabolicactivity and growth rate of the microorganism, thereby enhancing the expression of theproduct of interest. Although, it is known that microorganisms that perform best underthese strictly controlled fed-batch conditions are not the same as the ones that perform bestunder uncontrolled batch conditions, screening and selection is predominantly performedunder batch conditions. Tools that afford high-throughput on the one hand and dynamiccontrol over cultivation conditions on the other hand are not yet available. Microbioreac-tors offer the potential to address this problem, resolving the gap between the bioprocessdevelopment and industrial application. In this chapter, we highlight the current state-of-the-art of microbioreactors that offer the potential for high-throughput screening ofmicroorganisms under controlled conditions. We classify them into: (i) microtiter platesbased platforms, (ii) microfluidic chamber based platforms, and (iii) microfluidic dropletbased platforms. We also highlight some challenges that each of these platforms face.
Part of this chapter would be submitted as K. Totlani, R. J. van Tatenhoeven-Pel, M. T. Kreutzer, W. M. vanGulik, V. van Steijn. Microbioreactors for nutrient-controlled microbial cultures: Bridging the gap betweenearly bioprocess development and industrial scale use.
11
2
12 2. MICROBIOREACTORS FOR NUTRIENT-CONTROLLED CULTURES
2.1. INTRODUCTIONIn the experiments performed with state-of-the-art tools in early stage bioprocess devel-opment and mutant screening routines, the process control over the experiment is in-versely proportional to the achieved throughput[1]. Over the years, several technologieshave been developed to address this shortcoming and transform the conventional bio-process development strategy. The control over fluids in microfluidic channels offersthe potential to overcome the trade-off between throughput and level of control throughthe development of microbioreactors that enable studying a large number of modifiedmicroorganisms in parallel under dynamically controlled fed-batch conditions. An idealmicrobioreactor should: (1) enable dynamic supply of nutrients and control over pH anddissolved oxygen, (2) enable integration with analytics to quantify biomass and productsof interest and allow for selection and retrieval of best performers (3) be scalable therebyenabling high throughput experimentation, and (4) be robust and simple for easy adop-tion by the industry.
In this chapter, we present an overview of the emerging microbioreactor technolo-gies, with the focus on nutrient feeding strategies. For more general reviews on micro-bioreactors or larger miniaturized bioreactors, we refer to Hemmerich et. al.[1], Hegabet. al.[2] and Schäpper et.al.[3]. We start by presenting different types of modified mi-crotiter plate based platforms, which are commonly used for mutant screening in indus-trial biotechnology. Next, we review microfluidic chamber based platforms where mi-croorganisms are immobilized in geometrical constrictions and grown in a dynamic andnutrient-controlled manner. Finally, droplet-based microfluidics has been discussed asa potential technology for performing (semi) continuous cultivation of microorganisms.We believe that these miniaturized fermentation platforms can play a drastic role in ac-celerating the bioprocess development by reducing gap between conditions imposedduring screening phase and that inside the industrial scale bioreactor.
2.2. MICROBIOREACTORS FOR NUTRIENT-CONTROLLED CUL-TIVATION OF MICROORGANISMS
2.2.1. MICROTITER PLATE-BASED PLATFORMSIn the recent years, significant effort has been made to modify microtiter plates to enablecultivation of microorganisms in fed-batch mode with passive and active control overnutrients. One strategy to continuously supply glucose to cells in the wells is by produc-ing glucose inside the wells through enzymatic conversion of starch by glucoamylase,both added to the culture medium at the start of cultivation[4, 5]. Different supply ratesof glucose can be achieved by using different concentrations of the enzyme. A differentstrategy is to connect pairs of wells by a microchannel, with one well acting as a reser-voir for nutrients, and the other as a cultivation chamber, see Figure.2.2.1(a). The use ofa polyacrylamide gel inside the connecting microchannel enables the slow and steadysupply of nutrients to the culture well, with the feed rate depending on the diffusionalproperties of the gel [6]. Another strategy for nutrient release into the culture chamberis by loading wells with a silicon elastomer that contains crystals of glucose, see Fig-ure.2.2.1(b). In these fed-batch microtiter plates (FeedPlate), release of glucose from theelastomer into the culture well is driven by a difference in osmotic pressure (steps 1, 2,
2.2. MICROBIOREACTORS FOR NUTRIENT-CONTROLLED CULTIVATION OF
MICROORGANISMS
2
13
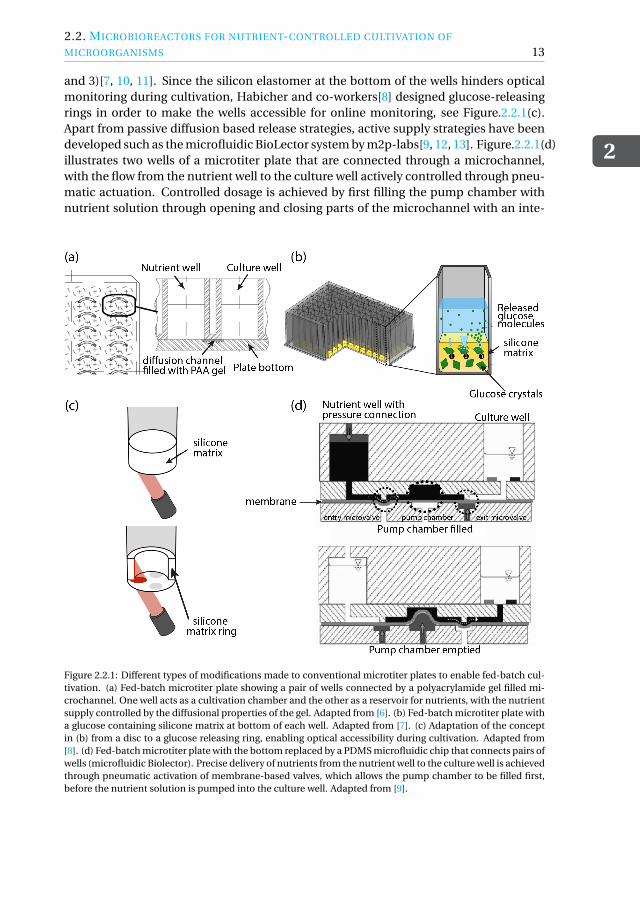
and 3)[7, 10, 11]. Since the silicon elastomer at the bottom of the wells hinders opticalmonitoring during cultivation, Habicher and co-workers[8] designed glucose-releasingrings in order to make the wells accessible for online monitoring, see Figure.2.2.1(c).Apart from passive diffusion based release strategies, active supply strategies have beendeveloped such as the microfluidic BioLector system by m2p-labs[9, 12, 13]. Figure.2.2.1(d)illustrates two wells of a microtiter plate that are connected through a microchannel,with the flow from the nutrient well to the culture well actively controlled through pneu-matic actuation. Controlled dosage is achieved by first filling the pump chamber withnutrient solution through opening and closing parts of the microchannel with an inte-
Figure 2.2.1: Different types of modifications made to conventional microtiter plates to enable fed-batch cul-tivation. (a) Fed-batch microtiter plate showing a pair of wells connected by a polyacrylamide gel filled mi-crochannel. One well acts as a cultivation chamber and the other as a reservoir for nutrients, with the nutrientsupply controlled by the diffusional properties of the gel. Adapted from [6]. (b) Fed-batch microtiter plate witha glucose containing silicone matrix at bottom of each well. Adapted from [7]. (c) Adaptation of the conceptin (b) from a disc to a glucose releasing ring, enabling optical accessibility during cultivation. Adapted from[8]. (d) Fed-batch microtiter plate with the bottom replaced by a PDMS microfluidic chip that connects pairs ofwells (microfluidic Biolector). Precise delivery of nutrients from the nutrient well to the culture well is achievedthrough pneumatic activation of membrane-based valves, which allows the pump chamber to be filled first,before the nutrient solution is pumped into the culture well. Adapted from [9].
2
14 2. MICROBIOREACTORS FOR NUTRIENT-CONTROLLED CULTURES
grated micropump that inflates/deflates an elastic membrane, and subsequently empty-ing the pump chamber into the culture well. This technology allows fed-batch fermenta-tions with a predetermined feeding profile[9]. Besides, it enables actively pH-controlledcultivations. A commercially available modified microtiter plate system (Micro-matrix)developed by Applikon Biotechnology (http://www.applikon-bio.com, Delft, the Nether-lands) offers 24 parallel fed-batch fermentations with the possibility to feed nutrientswhilst controlling parameters such pH, temperature and dissolved oxygen.
While different modifications to existing microtiter plate-based platforms have en-abled potential options to carry out nutrient-controlled fed-batch cultivation experi-ments at microscale, there are several challenges that each of these platforms face be-fore they are ready for adoption in biotechnological screening routines. Firstly, enzy-matic glucose release based systems are strongly influenced by the operation parame-ters such as pH and temperature as the activity of the enzyme depends on them. Ad-ditionally, enzymatic release feeding can only be used for glucose controlled fed-batchcultivations. Diffusion based feeding mechanisms also depend on environmental fac-tors such as media, pH, temperature and geometrical factors as in the case of PAA filledmicrochannel[6]. Establishing nutrient feeding profiles could be difficult to implementin diffusion-based release strategies as little control can be achieved in the release rateof glucose through the silicone matrices on the bottom of the plate or through the disksfloating inside the microwells. Additionally, multiple glucose crystals can be released atonce due to the osmotic pressure difference, leading to random dynamics of the glu-cose concentration. Finally, embedding microfluidic channels at the bottom of the stan-dard microtiter plate as in the case of Microfluidic BioLector[9], could pose difficul-ties in fabrication. The combination of Microtiter plates and microfluidic channels,thereby replacing the base of the plate with embedded micro-pumps and valves, in-creases the complexity of the system. Additionally, systems like the Microfluidic Biolec-tor offer a maximum of 44 to 48 fed-batch experiments per plate, which could be treatedas relatively low-throughput in screening routines.While some of the modified microtiterplates discussed above integrate microfluidic channels, microbioreactors constructed ascomplete microfluidic devices present an interesting alternative and are discussed next.
2.2.2. MICROFLUIDIC CHAMBER-BASED PLATFORMS
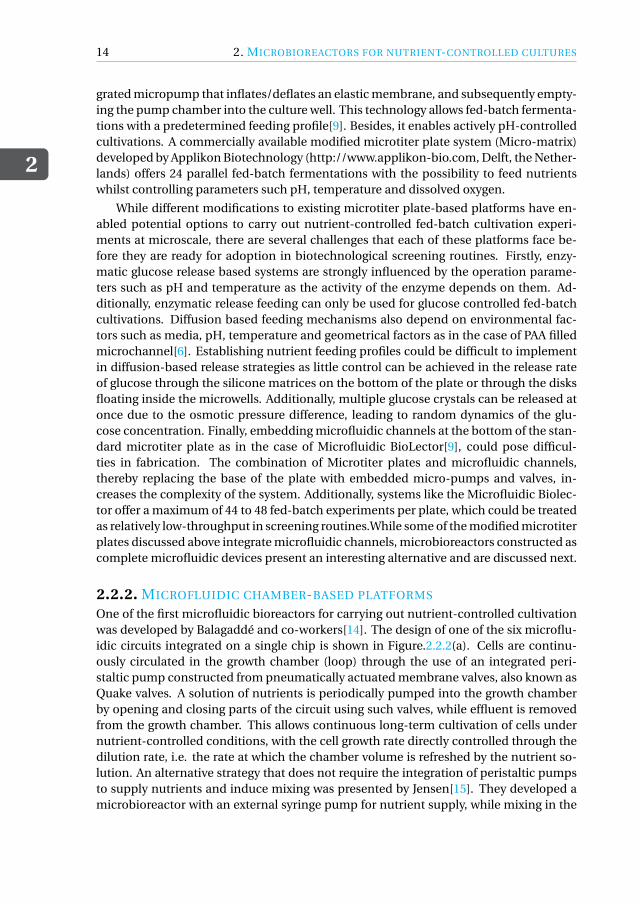
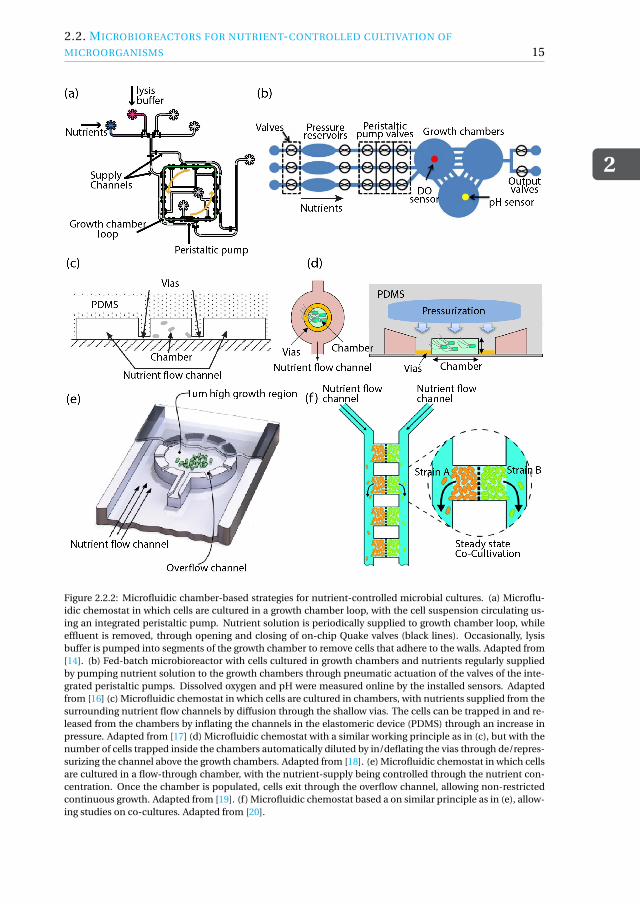
One of the first microfluidic bioreactors for carrying out nutrient-controlled cultivationwas developed by Balagaddé and co-workers[14]. The design of one of the six microflu-idic circuits integrated on a single chip is shown in Figure.2.2.2(a). Cells are continu-ously circulated in the growth chamber (loop) through the use of an integrated peri-staltic pump constructed from pneumatically actuated membrane valves, also known asQuake valves. A solution of nutrients is periodically pumped into the growth chamberby opening and closing parts of the circuit using such valves, while effluent is removedfrom the growth chamber. This allows continuous long-term cultivation of cells undernutrient-controlled conditions, with the cell growth rate directly controlled through thedilution rate, i.e. the rate at which the chamber volume is refreshed by the nutrient so-lution. An alternative strategy that does not require the integration of peristaltic pumpsto supply nutrients and induce mixing was presented by Jensen[15]. They developed amicrobioreactor with an external syringe pump for nutrient supply, while mixing in the
2.2. MICROBIOREACTORS FOR NUTRIENT-CONTROLLED CULTIVATION OF
MICROORGANISMS
2
15
Figure 2.2.2: Microfluidic chamber-based strategies for nutrient-controlled microbial cultures. (a) Microflu-idic chemostat in which cells are cultured in a growth chamber loop, with the cell suspension circulating us-ing an integrated peristaltic pump. Nutrient solution is periodically supplied to growth chamber loop, whileeffluent is removed, through opening and closing of on-chip Quake valves (black lines). Occasionally, lysisbuffer is pumped into segments of the growth chamber to remove cells that adhere to the walls. Adapted from[14]. (b) Fed-batch microbioreactor with cells cultured in growth chambers and nutrients regularly suppliedby pumping nutrient solution to the growth chambers through pneumatic actuation of the valves of the inte-grated peristaltic pumps. Dissolved oxygen and pH were measured online by the installed sensors. Adaptedfrom [16] (c) Microfluidic chemostat in which cells are cultured in chambers, with nutrients supplied from thesurrounding nutrient flow channels by diffusion through the shallow vias. The cells can be trapped in and re-leased from the chambers by inflating the channels in the elastomeric device (PDMS) through an increase inpressure. Adapted from [17] (d) Microfluidic chemostat with a similar working principle as in (c), but with thenumber of cells trapped inside the chambers automatically diluted by in/deflating the vias through de/repres-surizing the channel above the growth chambers. Adapted from [18]. (e) Microfluidic chemostat in which cellsare cultured in a flow-through chamber, with the nutrient-supply being controlled through the nutrient con-centration. Once the chamber is populated, cells exit through the overflow channel, allowing non-restrictedcontinuous growth. Adapted from [19]. (f) Microfluidic chemostat based a on similar principle as in (e), allow-ing studies on co-cultures. Adapted from [20].
2
16 2. MICROBIOREACTORS FOR NUTRIENT-CONTROLLED CULTURES
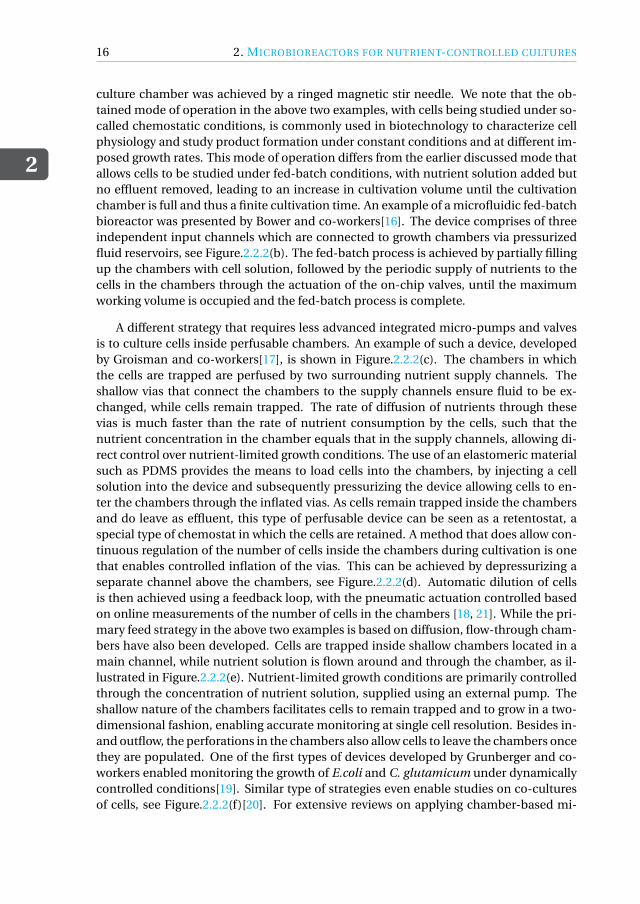
culture chamber was achieved by a ringed magnetic stir needle. We note that the ob-tained mode of operation in the above two examples, with cells being studied under so-called chemostatic conditions, is commonly used in biotechnology to characterize cellphysiology and study product formation under constant conditions and at different im-posed growth rates. This mode of operation differs from the earlier discussed mode thatallows cells to be studied under fed-batch conditions, with nutrient solution added butno effluent removed, leading to an increase in cultivation volume until the cultivationchamber is full and thus a finite cultivation time. An example of a microfluidic fed-batchbioreactor was presented by Bower and co-workers[16]. The device comprises of threeindependent input channels which are connected to growth chambers via pressurizedfluid reservoirs, see Figure.2.2.2(b). The fed-batch process is achieved by partially fillingup the chambers with cell solution, followed by the periodic supply of nutrients to thecells in the chambers through the actuation of the on-chip valves, until the maximumworking volume is occupied and the fed-batch process is complete.
A different strategy that requires less advanced integrated micro-pumps and valvesis to culture cells inside perfusable chambers. An example of such a device, developedby Groisman and co-workers[17], is shown in Figure.2.2.2(c). The chambers in whichthe cells are trapped are perfused by two surrounding nutrient supply channels. Theshallow vias that connect the chambers to the supply channels ensure fluid to be ex-changed, while cells remain trapped. The rate of diffusion of nutrients through thesevias is much faster than the rate of nutrient consumption by the cells, such that thenutrient concentration in the chamber equals that in the supply channels, allowing di-rect control over nutrient-limited growth conditions. The use of an elastomeric materialsuch as PDMS provides the means to load cells into the chambers, by injecting a cellsolution into the device and subsequently pressurizing the device allowing cells to en-ter the chambers through the inflated vias. As cells remain trapped inside the chambersand do leave as effluent, this type of perfusable device can be seen as a retentostat, aspecial type of chemostat in which the cells are retained. A method that does allow con-tinuous regulation of the number of cells inside the chambers during cultivation is onethat enables controlled inflation of the vias. This can be achieved by depressurizing aseparate channel above the chambers, see Figure.2.2.2(d). Automatic dilution of cellsis then achieved using a feedback loop, with the pneumatic actuation controlled basedon online measurements of the number of cells in the chambers [18, 21]. While the pri-mary feed strategy in the above two examples is based on diffusion, flow-through cham-bers have also been developed. Cells are trapped inside shallow chambers located in amain channel, while nutrient solution is flown around and through the chamber, as il-lustrated in Figure.2.2.2(e). Nutrient-limited growth conditions are primarily controlledthrough the concentration of nutrient solution, supplied using an external pump. Theshallow nature of the chambers facilitates cells to remain trapped and to grow in a two-dimensional fashion, enabling accurate monitoring at single cell resolution. Besides in-and outflow, the perforations in the chambers also allow cells to leave the chambers oncethey are populated. One of the first types of devices developed by Grunberger and co-workers enabled monitoring the growth of E.coli and C. glutamicum under dynamicallycontrolled conditions[19]. Similar type of strategies even enable studies on co-culturesof cells, see Figure.2.2.2(f)[20]. For extensive reviews on applying chamber-based mi-
2.2. MICROBIOREACTORS FOR NUTRIENT-CONTROLLED CULTIVATION OF
MICROORGANISMS
2
17
crofluidic devices for studying morphology, heterogeneity, growth and communicationof microorganisms in a high-throughput manner and at single-cell resolution, we referto [22–24].
Microfluidic chamber based devices offer a great platform for performing nutrient-controlled cultivation of microorganisms. However, there are number of limitationsthese systems face. Due to the presence of a solid wall, the chambers are susceptibleto formation of biofilm. Secondly, since the chamber based micro-bioreactors operatein single phase and every chamber is not isolated from each other, cross-contaminationof nutrients and microorganisms could occur across different chambers which couldhamper the experiment. Due to lack of complete compartmentalization and cross-talkbetween cultivation chambers, quantification of secreted product during screening rou-tines also becomes difficult. A challenge while operating the microfluidic device is that,large number of inlet ports are typically required as compared to number of experimentsthat could be performed on that device. This could lead to increased complexity of thedevice on increasing the number of experiments per chip. Since, microfluidic cham-ber based platforms contain solid walls to separate every cultivation experiment, it isdifficult to accomodate increasing reactor volumes as in the case of semi-continuouscultivations. Increasing the microreactor volume becomes much easier with dropletsas compared to solid chambers. Droplet based microfluidics can facilitate nutrient-controlled growth of microorganisms where the nutrient feeding strategy could be coa-lescing smaller nutrient droplets to the cell-containing droplets during cultivation. Thisplatform is discussed in the next section.
2.2.3. MICROFLUIDIC DROPLET-BASED PLATFORMS
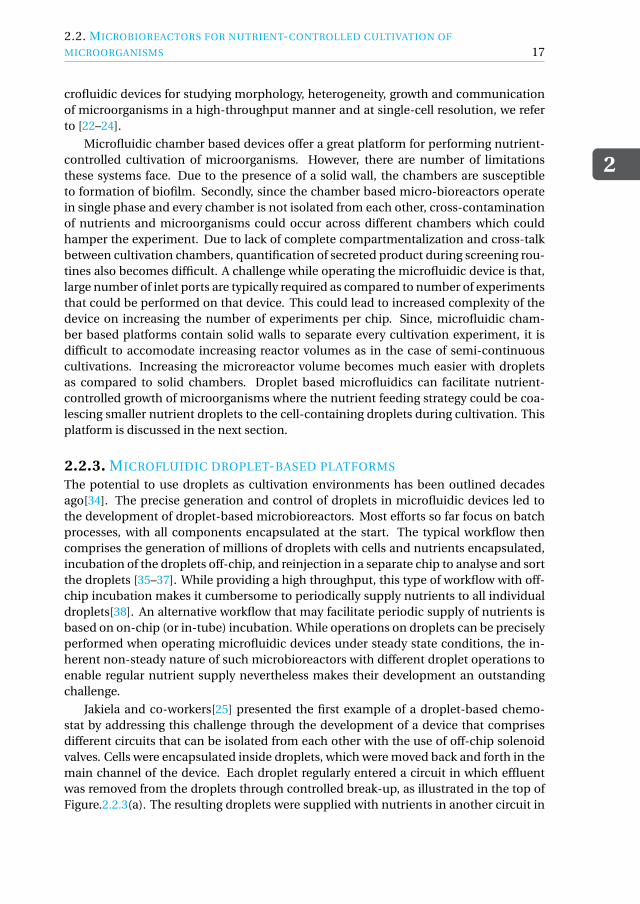
The potential to use droplets as cultivation environments has been outlined decadesago[34]. The precise generation and control of droplets in microfluidic devices led tothe development of droplet-based microbioreactors. Most efforts so far focus on batchprocesses, with all components encapsulated at the start. The typical workflow thencomprises the generation of millions of droplets with cells and nutrients encapsulated,incubation of the droplets off-chip, and reinjection in a separate chip to analyse and sortthe droplets [35–37]. While providing a high throughput, this type of workflow with off-chip incubation makes it cumbersome to periodically supply nutrients to all individualdroplets[38]. An alternative workflow that may facilitate periodic supply of nutrients isbased on on-chip (or in-tube) incubation. While operations on droplets can be preciselyperformed when operating microfluidic devices under steady state conditions, the in-herent non-steady nature of such microbioreactors with different droplet operations toenable regular nutrient supply nevertheless makes their development an outstandingchallenge.
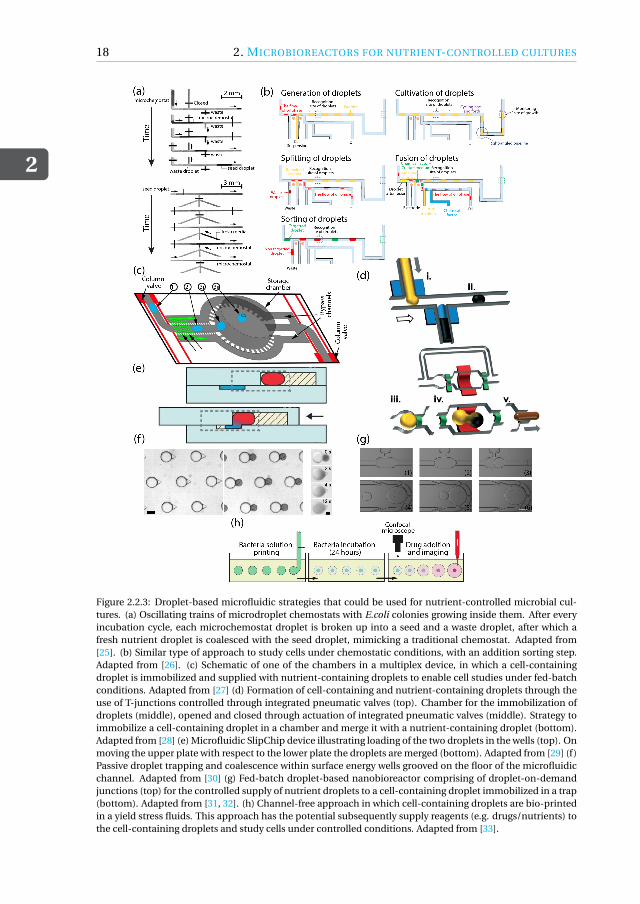
Jakiela and co-workers[25] presented the first example of a droplet-based chemo-stat by addressing this challenge through the development of a device that comprisesdifferent circuits that can be isolated from each other with the use of off-chip solenoidvalves. Cells were encapsulated inside droplets, which were moved back and forth in themain channel of the device. Each droplet regularly entered a circuit in which effluentwas removed from the droplets through controlled break-up, as illustrated in the top ofFigure.2.2.3(a). The resulting droplets were supplied with nutrients in another circuit in
2
18 2. MICROBIOREACTORS FOR NUTRIENT-CONTROLLED CULTURES
Figure 2.2.3: Droplet-based microfluidic strategies that could be used for nutrient-controlled microbial cul-tures. (a) Oscillating trains of microdroplet chemostats with E.coli colonies growing inside them. After everyincubation cycle, each microchemostat droplet is broken up into a seed and a waste droplet, after which afresh nutrient droplet is coalesced with the seed droplet, mimicking a traditional chemostat. Adapted from[25]. (b) Similar type of approach to study cells under chemostatic conditions, with an addition sorting step.Adapted from [26]. (c) Schematic of one of the chambers in a multiplex device, in which a cell-containingdroplet is immobilized and supplied with nutrient-containing droplets to enable cell studies under fed-batchconditions. Adapted from [27] (d) Formation of cell-containing and nutrient-containing droplets through theuse of T-junctions controlled through integrated pneumatic valves (top). Chamber for the immobilization ofdroplets (middle), opened and closed through actuation of integrated pneumatic valves (middle). Strategy toimmobilize a cell-containing droplet in a chamber and merge it with a nutrient-containing droplet (bottom).Adapted from [28] (e) Microfluidic SlipChip device illustrating loading of the two droplets in the wells (top). Onmoving the upper plate with respect to the lower plate the droplets are merged (bottom). Adapted from [29] (f)Passive droplet trapping and coalescence within surface energy wells grooved on the floor of the microfluidicchannel. Adapted from [30] (g) Fed-batch droplet-based nanobioreactor comprising of droplet-on-demandjunctions (top) for the controlled supply of nutrient droplets to a cell-containing droplet immobilized in a trap(bottom). Adapted from [31, 32]. (h) Channel-free approach in which cell-containing droplets are bio-printedin a yield stress fluids. This approach has the potential subsequently supply reagents (e.g. drugs/nutrients) tothe cell-containing droplets and study cells under controlled conditions. Adapted from [33].
2.2. MICROBIOREACTORS FOR NUTRIENT-CONTROLLED CULTIVATION OF
MICROORGANISMS
2
19
which they were coalesced with nutrient droplets that were generated on demand, asillustrated in the bottom of Figure.2.2.3(a). More recently, Jian and co-workers[26] de-veloped a similar automated droplet-based chemostat, including a sorting step basedon monitoring biomass growth via OD measurements (see Figure.2.2.3(b)). An alter-native to guiding cell-containing droplets to a nutrient-delivery location is to spatiallyimmobilize the cell-containing droplets and supply them with nutrients. One of the firstexamples of such a strategy was by presented by Leung and co-workers[27]. The devicecomprises 95 chambers, which can all be individually addressed through the pneumaticactuation of integrated Quake valves. After loading a cell-containing droplet inside eachchamber of this multiplex device, nutrient droplets can be generated on demand andguided to the chambers as illustrated in Figure.2.2.3(c), enabling studies under fed-batchconditions. A similar strategy based on immobilization of droplets in chambers and con-trolled supply of reagents through pneumatic actuation of integrated valves has used bythe group of Chang-Soo Lee[28, 39, 40] for the cultivation of cells and the developmentof bio-chemical assays, see Figure.2.2.3(d)).
The above examples show a trend towards enhanced control over cultivation envi-ronment by developing sophisticated devices with integrated/external values, operatedthrough multi-step actuation schemes. There is also another, almost opposite, trendvisible in literature, in which control is achieved through the use (passive) geometricalfeatures in order to keep device architecture and operation as simple as possible. Anelegant example was demonstrated by Ismagilov and co-workers[29, 41], who compart-mentalized droplets inside chambers, which can be joined by manually sliding the topand bottom half of these so-called SlipChips towards each other, as illustrated in Fig-ure.2.2.3(e). Baroud and co-workers[30] explored the use of cavities in the floor/ceil-ing of a microchannel in which droplets squeezed between the floor and ceiling canrelax their shape, and thereby remain trapped. These cavities can be designed suchthat each allows immobilization of a cell-containing droplet, while leaving room for an-other droplet to be loaded for controlled supply, as illustrated in the left panel of Fig-ure.2.2.3(f). After loading those droplets (middle panel), supply is achieved by impos-ing coalescence (right panel). This is done by flowing a solvent through the channel inwhich the surfactant used for stabilization of the interfaces is less soluble. This strategyso far has been used for drug toxicity studies of cells with a single delivery (of drugs)[30].Whether it can be used for repeated supply of nutrients to enable nutrient-controlledgrowth experiments under fed-batch conditions is yet to be explored. A recent exam-ple of a droplet-based microbioreactor does allow the repeated and controlled supplyof nutrients to a cell-containing droplet immobilized in a chamber was demonstratedin the lab of the authors[31]. The design of the geometry in which the nutrient dropletsare produced allows a robust periodic on-demand supply of droplets in a device freeof valves, just through the use of a commercially available pressure pump[32], see Fig-ure.2.2.3(g). The authors demonstrated the cultivation of cells under fed-batch condi-tions, with the growth rate of the cells inside the immobilized cell-containing dropletcontrolled by the concentration of the nutrient-containing droplets. Besides the droplet-based approaches in microfluidic channels, we conclude by highlighting a channel-freeapproach in which cell-containing droplets are bio-printed in a yield-stress fluid. Nel-son and co-workers[33] developed a bioprinting method to study the response to drugs
2
20 2. MICROBIOREACTORS FOR NUTRIENT-CONTROLLED CULTURES
injected into the droplets after 24h of incubation, see Figure.2.2.3(h). Since the print-head enables injection of nutrients or extraction of effluent, this relative unexploredstrategy is also potentially interesting for high-throughput studies of microorganismsunder nutrient-controlled growth conditions.
Even though droplet microfluidics offer an interesting platform for carrying out nutrient-controlled cultivation with feeding of nutrients, there are certain open challenges beforewhich this can be readily adopted. One of the first challenges with the analytics and pro-cess control in microdroplet format. On-line monitoring and control of process param-eters such as pH, dissolved oxygen and nutrient concentration can be difficult duringthe cultivation inside droplets. Quantifying concentrations of secreted metabolites ofinterest, which forms the heart of any screening routine, can be difficult to achieve in anon-invasive way. One way to achieve this is by using a fluorescent-based readout at theend of fed-batch cultivation. Further on, implementing control over dissolved oxygenand assuring that the cultivation does not run under oxygen limitations can be challeng-ing in droplet based cultivation experiments. Fluorinated oils which often serve as thecontinuous phase can be used as oxygen source during the fed-batch cultivation[42].A second challenge is to establish a simple and robust feeding strategy such that thetechnology can be easily adapted by non-experts[43]. As aforementioned, microfluidicdroplet arrays are useful in carrying out non-steady state assays, in which nutrients canbe added semi-continuously. However, these droplet arrays use multiple membranebased pneumatic valves which make the devices less robust, difficult to fabricate andpossibly inhibit its easy adaptation by the biotechnology and bioprocess engineeringcommunity. The barrier of adoption of droplet microfluidic methods by non-expertscan be reduced by embedding the complicated chip operation workflow and associatedexperimental paraphernalia in “chip-in a box” type of systems[44]. A third challengein implementation of droplet-based microfluidic formats for long-term nutrient-limitedfermentation is the possible leakage of molecules through the oil-water interface of thedroplet[45, 46]. Leakage of nutrients or secreted metabolites could not just lead to un-even growth rates but also selection of false positives during fed-batch strain selection. Anumber of studies have been performed in order to investigate mass transport throughthe oil-water interphase where droplets are incubated inside PDMS devices. The natureof the molecules inside the droplets and the surfactants at the oil-water interphase arehypothesized as the most important parameters in understanding and controlling theleakage of molecules through microdroplets.
REFERENCES
2
21
REFERENCES[1] J. Hemmerich, S. Noack, W. Wiechert, and M. Oldiges, “Microbioreactor systems
for accelerated bioprocess development,” Biotechnology journal, vol. 13, no. 4,p. 1700141, 2018.
[2] H. M. Hegab, A. ElMekawy, and T. Stakenborg, “Review of microfluidic micro-bioreactor technology for high-throughput submerged microbiological cultiva-tion,” Biomicrofluidics, vol. 7, no. 2, p. 021502, 2013.
[3] D. Schäpper, M. N. H. Z. Alam, N. Szita, A. E. Lantz, and K. V. Gernaey, “Applica-tion of microbioreactors in fermentation process development: a review,” Analyti-cal and bioanalytical chemistry, vol. 395, no. 3, pp. 679–695, 2009.
[4] J. Panula-Perälä, J. Šiurkus, A. Vasala, R. Wilmanowski, M. G. Casteleijn, andP. Neubauer, “Enzyme controlled glucose auto-delivery for high cell density cultiva-tions in microplates and shake flasks,” Microbial Cell Factories, vol. 7, no. 1, pp. 1–12, 2008.
[5] C. Toeroek, M. Cserjan-Puschmann, K. Bayer, and G. Striedner, “Fed-batch like cul-tivation in a micro-bioreactor: screening conditions relevant for escherichia colibased production processes,” SpringerPlus, vol. 4, no. 1, pp. 1–10, 2015.
[6] A. Wilming, C. Bähr, C. Kamerke, and J. Büchs, “Fed-batch operation in special mi-crotiter plates: a new method for screening under production conditions,” Journalof Industrial Microbiology and Biotechnology, vol. 41, no. 3, pp. 513–525, 2014.
[7] T. Keil, B. Dittrich, C. Lattermann, T. Habicher, and J. Büchs, “Polymer-basedcontrolled-release fed-batch microtiter plate–diminishing the gap between earlyprocess development and production conditions,” Journal of biological engineer-ing, vol. 13, no. 1, pp. 1–15, 2019.
[8] T. Habicher, V. Czotscher, T. Klein, A. Daub, T. Keil, and J. Büchs, “Glucose-containing polymer rings enable fed-batch operation in microtiter plates with par-allel online measurement of scattered light, fluorescence, dissolved oxygen tension,and ph,” Biotechnology and bioengineering, vol. 116, no. 9, pp. 2250–2262, 2019.
[9] M. Funke, A. Buchenauer, U. Schnakenberg, W. Mokwa, S. Diederichs, A. Mertens,C. Müller, F. Kensy, and J. Büchs, “Microfluidic biolector—microfluidic bioprocesscontrol in microtiter plates,” Biotechnology and bioengineering, vol. 107, no. 3,pp. 497–505, 2010.
[10] T. Keil, B. Dittrich, C. Lattermann, and J. Büchs, “Optimized polymer-based glucoserelease in microtiter plates for small-scale e. coli fed-batch cultivations,” Journal ofbiological engineering, vol. 14, no. 1, pp. 1–12, 2020.
[11] T. Habicher, E. K. Rauls, F. Egidi, T. Keil, T. Klein, A. Daub, and J. Büchs, “Establishinga fed-batch process for protease expression with bacillus licheniformis in polymer-based controlled-release microtiter plates,” Biotechnology journal, vol. 15, no. 2,p. 1900088, 2020.
2
22 REFERENCES
[12] A. Buchenauer, M. Hofmann, M. Funke, J. Büchs, W. Mokwa, and U. Schnakenberg,“Micro-bioreactors for fed-batch fermentations with integrated online monitoringand microfluidic devices,” Biosensors and Bioelectronics, vol. 24, no. 5, pp. 1411–1416, 2009.
[13] M. Funke, A. Buchenauer, W. Mokwa, S. Kluge, L. Hein, C. Müller, F. Kensy, andJ. Büchs, “Bioprocess control in microscale: scalable fermentations in disposableand user-friendly microfluidic systems,” Microbial cell factories, vol. 9, no. 1, pp. 1–13, 2010.
[14] F. K. Balagaddé, L. You, C. L. Hansen, F. H. Arnold, and S. R. Quake, “Long-term monitoring of bacteria undergoing programmed population control in a mi-crochemostat,” Science, vol. 309, no. 5731, pp. 137–140, 2005.
[15] Z. Zhang, P. Boccazzi, H.-G. Choi, G. Perozziello, A. J. Sinskey, and K. F. Jensen, “Mi-crochemostat—microbial continuous culture in a polymer-based, instrumentedmicrobioreactor,” Lab on a Chip, vol. 6, no. 7, pp. 906–913, 2006.
[16] D. M. Bower, K. S. Lee, R. J. Ram, and K. L. Prather, “Fed-batch microbioreactor plat-form for scale down and analysis of a plasmid dna production process,” Biotechnol-ogy and bioengineering, vol. 109, no. 8, pp. 1976–1986, 2012.
[17] A. Groisman, C. Lobo, H. Cho, J. K. Campbell, Y. S. Dufour, A. M. Stevens, andA. Levchenko, “A microfluidic chemostat for experiments with bacterial and yeastcells,” Nature methods, vol. 2, no. 9, pp. 685–689, 2005.
[18] M. Kim, J. W. Lim, S. K. Lee, and T. Kim, “Nanoscale hydrodynamic film for diffusivemass transport control in compartmentalized microfluidic chambers,” Analyticalchemistry, vol. 89, no. 19, pp. 10286–10295, 2017.
[19] A. Grünberger, N. Paczia, C. Probst, G. Schendzielorz, L. Eggeling, S. Noack,W. Wiechert, and D. Kohlheyer, “A disposable picolitre bioreactor for cultivation andinvestigation of industrially relevant bacteria on the single cell level,” Lab on a chip,vol. 12, no. 11, pp. 2060–2068, 2012.
[20] A. Burmeister, F. Hilgers, A. Langner, C. Westerwalbesloh, Y. Kerkhoff, N. Ten-haef, T. Drepper, D. Kohlheyer, E. von Lieres, S. Noack, et al., “A microfluidic co-cultivation platform to investigate microbial interactions at defined microenviron-ments,” Lab on a Chip, vol. 19, no. 1, pp. 98–110, 2019.
[21] M. Kim, J. Bae, and T. Kim, “Long-term and programmable bacterial subculturein completely automated microchemostats,” Analytical chemistry, vol. 89, no. 18,pp. 9676–9684, 2017.
[22] A. Grünberger, W. Wiechert, and D. Kohlheyer, “Single-cell microfluidics: opportu-nity for bioprocess development,” Current opinion in biotechnology, vol. 29, pp. 15–23, 2014.
REFERENCES
2
23
[23] A. Burmeister and A. Grünberger, “Microfluidic cultivation and analysis tools forinteraction studies of microbial co-cultures,” Current opinion in biotechnology,vol. 62, pp. 106–115, 2020.
[24] N. R. Wright, N. P. Rønnest, and N. Sonnenschein, “Single-cell technologies to un-derstand the mechanisms of cellular adaptation in chemostats,” Frontiers in Bio-engineering and Biotechnology, vol. 8, p. 1460, 2020.
[25] S. Jakiela, T. S. Kaminski, O. Cybulski, D. B. Weibel, and P. Garstecki, “Bacterialgrowth and adaptation in microdroplet chemostats,” Angewandte Chemie, vol. 125,no. 34, pp. 9076–9079, 2013.
[26] X. Jian, X. Guo, J. Wang, Z. L. Tan, X.-h. Xing, L. Wang, and C. Zhang, “Microbialmicrodroplet culture system (mmc): An integrated platform for automated, high-throughput microbial cultivation and adaptive evolution,” Biotechnology and bio-engineering, vol. 117, no. 6, pp. 1724–1737, 2020.
[27] K. Leung, H. Zahn, T. Leaver, K. M. Konwar, N. W. Hanson, A. P. Pagé, C.-C. Lo, P. S.Chain, S. J. Hallam, and C. L. Hansen, “A programmable droplet-based microflu-idic device applied to multiparameter analysis of single microbes and microbialcommunities,” Proceedings of the National Academy of Sciences, vol. 109, no. 20,pp. 7665–7670, 2012.
[28] S. H. Jin, H.-H. Jeong, B. Lee, S. S. Lee, and C.-S. Lee, “A programmable microflu-idic static droplet array for droplet generation, transportation, fusion, storage, andretrieval,” Lab on a Chip, vol. 15, no. 18, pp. 3677–3686, 2015.
[29] D. V. Zhukov, E. M. Khorosheva, T. Khazaei, W. Du, D. A. Selck, A. A. Shishkin, andR. F. Ismagilov, “Microfluidic slipchip device for multistep multiplexed biochem-istry on a nanoliter scale,” Lab on a Chip, vol. 19, no. 19, pp. 3200–3211, 2019.
[30] R. F.-X. Tomasi, S. Sart, T. Champetier, and C. N. Baroud, “Individual control andquantification of 3d spheroids in a high-density microfluidic droplet array,” Cellreports, vol. 31, no. 8, p. 107670, 2020.
[31] K. Totlani, Y.-C. Wang, M. Bisschops, T. de Riese, M. T. Kreutzer, W. M. van Gulik,and V. van Steijn, “Fed-batch droplet nanobioreactor for controlled growth of cy-berlindnera (pichia) jadinii: A proof-of-concept demonstration,” Advanced Materi-als Technologies, p. 2100083, 2021.
[32] K. Totlani, J.-W. Hurkmans, W. M. Van Gulik, M. T. Kreutzer, and V. Van Steijn,“Scalable microfluidic droplet on-demand generator for non-steady operation ofdroplet-based assays,” Lab on a Chip, vol. 20, no. 8, pp. 1398–1409, 2020.
[33] A. Z. Nelson, B. Kundukad, W. K. Wong, S. A. Khan, and P. S. Doyle, “Embeddeddroplet printing in yield-stress fluids,” Proceedings of the National Academy of Sci-ences, vol. 117, no. 11, pp. 5671–5679, 2020.
[34] J. Lederberg, “A simple method for isolating individual microbes,” Journal of bacte-riology, vol. 68, no. 2, p. 258, 1954.
2
24 REFERENCES
[35] L. Mazutis, J. Gilbert, W. L. Ung, D. A. Weitz, A. D. Griffiths, and J. A. Heyman,“Single-cell analysis and sorting using droplet-based microfluidics,” Nature proto-cols, vol. 8, no. 5, pp. 870–891, 2013.
[36] M. Huang, Y. Bai, S. L. Sjostrom, B. M. Hallström, Z. Liu, D. Petranovic, M. Uhlén,H. N. Joensson, H. Andersson-Svahn, and J. Nielsen, “Microfluidic screening andwhole-genome sequencing identifies mutations associated with improved proteinsecretion by yeast,” Proceedings of the National Academy of Sciences, vol. 112, no. 34,pp. E4689–E4696, 2015.
[37] H. S. Kim, A. R. Guzman, H. R. Thapa, T. P. Devarenne, and A. Han, “A dropletmicrofluidics platform for rapid microalgal growth and oil production analysis,”Biotechnology and bioengineering, vol. 113, no. 8, pp. 1691–1701, 2016.
[38] B. L. Wang, A. Ghaderi, H. Zhou, J. Agresti, D. A. Weitz, G. R. Fink, andG. Stephanopoulos, “Microfluidic high-throughput culturing of single cells for se-lection based on extracellular metabolite production or consumption,” Naturebiotechnology, vol. 32, no. 5, p. 473, 2014.
[39] B. Lee, S. H. Jin, Y.-M. Noh, S.-G. Jeong, H.-H. Jeong, and C.-S. Lee, “Scalable staticdroplet array for biochemical assays based on concentration gradients,” Sensorsand Actuators B: Chemical, vol. 273, pp. 1572–1578, 2018.
[40] H.-H. Jeong, B. Lee, S. H. Jin, and C.-S. Lee, “Hydrodynamic control of dropletbreakup, immobilization, and coalescence for a multiplex microfluidic staticdroplet array,” Chemical Engineering Journal, vol. 360, pp. 562–568, 2019.
[41] W. Du, L. Li, K. P. Nichols, and R. F. Ismagilov, “Slipchip,” Lab on a Chip, vol. 9, no. 16,pp. 2286–2292, 2009.
[42] L. Mahler, M. Tovar, T. Weber, S. Brandes, M. M. Rudolph, J. Ehgartner, T. Mayr, M. T.Figge, M. Roth, and E. Zang, “Enhanced and homogeneous oxygen availability dur-ing incubation of microfluidic droplets,” RSC advances, vol. 5, no. 123, pp. 101871–101878, 2015.
[43] T. S. Kaminski, O. Scheler, and P. Garstecki, “Droplet microfluidics for microbiology:techniques, applications and challenges,” Lab on a Chip, vol. 16, no. 12, pp. 2168–2187, 2016.
[44] V. Ortseifen, M. Viefhues, L. Wobbe, and A. Grünberger, “Microfluidics for biotech-nology: Bridging gaps to foster microfluidic applications,” Frontiers in Bioengineer-ing and Biotechnology, vol. 8, p. 1324, 2020.
[45] G. Etienne, A. Vian, M. Biocanin, B. Deplancke, and E. Amstad, “Cross-talk betweenemulsion drops: how are hydrophilic reagents transported across oil phases?,” Labon a Chip, vol. 18, no. 24, pp. 3903–3912, 2018.
[46] P. Gruner, B. Riechers, B. Semin, J. Lim, A. Johnston, K. Short, and J.-C. Baret, “Con-trolling molecular transport in minimal emulsions,” Nature communications, vol. 7,no. 1, pp. 1–9, 2016.
3DROPLET ON DEMAND GENERATOR
Scalable microfluidic droplet on-demand generator for non-steadyoperation of droplet-based assays
We developed a microfluidic droplet on-demand (DoD) generator that enables the pro-duction of droplets with a volume solely governed by the geometry of the generator for arange of operating conditions. The prime reason to develop this novel type of DoD gener-ator is that its robustness in operation enables scale out and operation under non-steadyconditions, which are both essential features for the further advancement of droplet-basedassays. We first detail the working principle of the DoD generator and study the sensitivityof the volume of the generated droplets with respect to used fluids and control parame-ters. We next compare the performance of our DoD generator when scaled out to 8 parallelgenerators to the performance of a conventional DoD generator in which droplet volumeis not geometry-controlled, showing its superior performance. Further scale out to 64 par-allel DoD generator shows that all generators produce droplets with a volume between91% and 105% of the predesigned volume. We conclude the chapter by presenting a sim-ple droplet-based assay in which the DoD generator enables sequential supply of reagentdroplets to a droplet stored in the device, illustrating its potential to be used in droplet-based assays for biochemical studies under non-steady operation.
This chapter is published as: K. Totlani, J. Hurkmans, W. M. van Gulik, M. T. Kreutzer and V. van Steijn. Scal-able microfluidic droplet on-demand generator for non-steady operation of droplet based assays, Lab Chip,2020,20, 1398-1409.
25
3
26 3. DROPLET ON DEMAND GENERATOR
3.1. INTRODUCTION
Microscale droplets are being used as miniaturized reaction vessels for a variety of ap-plications in the fields of biotechnology, chemical engineering, and material science.Some of these applications include high throughput screening of microorganisms[1–5],drugs[6], antibiotic toxicity[7] and combinatorial bio-chemical spaces[8, 9], while otherapplications use microdroplets to construct artificial cells[10, 11] or other advanced materials[12–15]. The development of microdroplet-based assays as an alternative to traditional as-says is driven by the ongoing desire for massively parallel experimentation[16, 17], withan unprecedented throughput and a small sample volume as key enablers[2]. Over thepast two decades, methods have been developed to produce[18–20], navigate[21], infuse[22],dilute[23], combine[24], split[25], store[26, 27], incubate[28] and sort[2] microdroplets.Notably, these operations have almost exclusively been developed for steady flow con-ditions. However, assays are inherently non-steady, as they typically require sequentialexecution of multiple of these operations. A common strategy to utilize these steadyoperations in a non-steady assay is to decouple them and execute them separately in asequence, typically in separate dedicated devices, each one operated under steady flowconditions[29]. Although this decoupling strategy has proven to be powerful for largescreens[3, 30], the number of operations possible during the screen is limited, often re-sorting to studying systems under batch conditions with all reagents present from thebeginning, with end point measurements only. The application window of such droplet-based assays would hence significantly widen when developing an alternative strategyin which different operations can be integrated in the same device, operated in a non-continuous fashion. For example, a microdroplet-based assay that would be very pow-erful is one that enables sequential addition of reagents to droplets containing cells andstudying their behaviour over time under (semi) continuous conditions. However, therequired intermittent addition of reagents to droplets stored in the device presents animportant hurdle. In fact, integrating long-term culturing in a controlled environmentwith technology accessible to non-experts is seen as one of the great outstanding chal-lenges in the field[31]. While a few successful examples have been demonstrated thatovercome the integration challenge using sophisticated devices with valves (integratedin the device or in the external connections to it)[8, 9, 32–35], the complexity of thesedevices and their use prevents their widespread adoption. In this paper, we address thishurdle by presenting a scalable droplet on-demand approach that enables the sequen-tial delivery of reagent droplets of predefined volume to many locations in the assayingdevice at the same time using commercially available equipment.
Droplet on-demand (DoD) techniques in unbounded systems are well-establishedand find their widespread use, for example in the printing industry. One of the first DoDimplementations in a microfluidic chip was provided by Attinger and co-workers[36].While most developments so far focused on single on-demand generators[37–40], sev-eral scaled-out DoD approaches have been proposed[41, 42]. Guzowski and co-workers[41],for example, developed a scaled-out device, generating droplets on demand in 16 paral-lel channels, using just one continuous and one dispersed phase inlet, controlled by twoexternal valves, with the volume of the droplets controlled by the duration the valveswere opened. A foreseen challenge in adopting this approach in a more complicated de-vice is that small difference in the hydrodynamic resistance across the device may lead
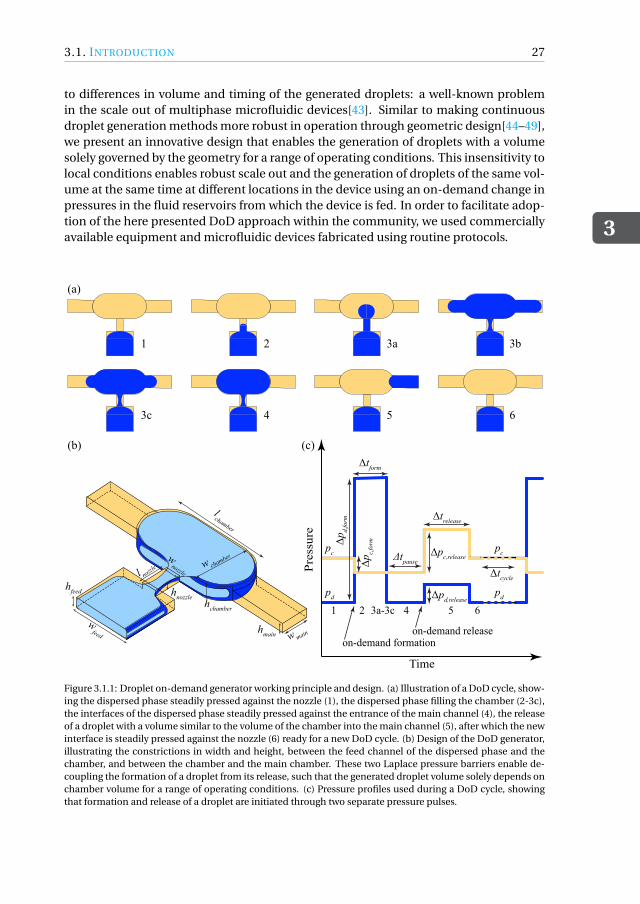
3.1. INTRODUCTION
3
27
to differences in volume and timing of the generated droplets: a well-known problemin the scale out of multiphase microfluidic devices[43]. Similar to making continuousdroplet generation methods more robust in operation through geometric design[44–49],we present an innovative design that enables the generation of droplets with a volumesolely governed by the geometry for a range of operating conditions. This insensitivity tolocal conditions enables robust scale out and the generation of droplets of the same vol-ume at the same time at different locations in the device using an on-demand change inpressures in the fluid reservoirs from which the device is fed. In order to facilitate adop-tion of the here presented DoD approach within the community, we used commerciallyavailable equipment and microfluidic devices fabricated using routine protocols.
1 3a2 3b
3c 4 5 6
(a)
(c)
Time
Pres
sure
on-demand formationon-demand release
2 3a-3c 4
Δtpause
Δpd,
form
Δtform
pc
pd
651
Δtrelease
Δpc,release
Δpc,
form pc
pdΔpd,release
Δtcycle
(b)
hnozzle
hmainw
feed w main
hfeed
lchamber
hchamber
w chamber
l nozzlew
nozzle
Figure 3.1.1: Droplet on-demand generator working principle and design. (a) Illustration of a DoD cycle, show-ing the dispersed phase steadily pressed against the nozzle (1), the dispersed phase filling the chamber (2-3c),the interfaces of the dispersed phase steadily pressed against the entrance of the main channel (4), the releaseof a droplet with a volume similar to the volume of the chamber into the main channel (5), after which the newinterface is steadily pressed against the nozzle (6) ready for a new DoD cycle. (b) Design of the DoD generator,illustrating the constrictions in width and height, between the feed channel of the dispersed phase and thechamber, and between the chamber and the main chamber. These two Laplace pressure barriers enable de-coupling the formation of a droplet from its release, such that the generated droplet volume solely depends onchamber volume for a range of operating conditions. (c) Pressure profiles used during a DoD cycle, showingthat formation and release of a droplet are initiated through two separate pressure pulses.
3
28 3. DROPLET ON DEMAND GENERATOR
The working principle of our droplet on-demand generator is illustrated in Figure.3.1.1(a),showing that the interface is steadily pressed against a nozzle (1) until, at will, the pres-sure in the fluid reservoir of the dispersed phase is temporarily elevated. This on-demandformation pulse pushes the interface through the nozzle (2) such that the dispersed phasestarts filling the chamber (3a). From here two modes of operation are possible, depend-ing on the used control parameters: either the dispersed phase steadily fills the chamberuntil full or it initially spills into the main channel (3b) and subsequently retracts backinto the chamber (3c). Importantly, both these modes result in a filled chamber, with theinterfaces steadily pressed against the entrance of the main channel (4). By elevating thepressure in the fluid reservoir of the continuous phase, the dispersed phase is pushedfrom the chamber into the main channel. This on-demand release pulse leads to pinch-off and the release of a droplet (5) with a volume similar to the volume of the chamber.After release, the pressures are adjusted to their initial values, the new interface beingsteadily pressed against the nozzle (6), ready for the next DoD cycle. Two innovative as-pects of the here introduced two-step formation and release DoD approach are (1) theconstrained growth of the droplet to a geometry-controlled (chamber) volume and (2)the decoupling between formation and release. While the use of chambers[46, 50] andthe decoupling of formation and release based on flow modulation[41, 51–53] have beendemonstrated before, it is the here introduced combination that makes the on-demandgeneration insensitive to the pressure up and downstream of the generator, enabling therobust scale out.
We start this chapter by presenting a proof-of-principle for single droplet on-demandgeneration, showing the robustness of the approach, with regard to operating conditionsand used fluids. We next demonstrate the scalability of this approach by implement-ing the DoD design in 8 parallel channels, illustrating the importance of the chamberby comparing parallel DoD devices with and without chambers. Next, we demonstratefurther scale out to 64 parallel channels, fed from just two fluid reservoirs, one for thecontinuous and one for the dispersed phase, through the use of a single (commerciallyavailable) pressure pump. We conclude this chapter with an outlook on the use of theDoD generator in droplet-based assays, by demonstrating sequential feeding of reagentdroplets to a droplet stored on a chip.
3.2. MATERIALS AND METHODS
3.2.1. DEVICE DESIGN
The three-dimensional design of the microfluidic DoD generator is shown in Figure.3.1.1(b),with two key features being the nozzle and the chamber. Firstly, the constriction be-tween the feed and the chamber (i.e. nozzle) enables one to (1) steadily press the in-terface against the nozzle and initiate formation when raising the pressure above theLaplace pressure associated with the difference in height and width between feed andnozzle. Secondly, the constriction between chamber and main channel (2) facilitatesconfinement of the growth of the dispersed phase to the chamber and its subsequentrelease from the chamber into the main channel, again by changing the pressure in ac-cordance with the Laplace pressure. Since these two Laplace pressure barriers act asvalves[54], allowing the interface to only pass when the driving pressure (temporarily)
3.2. MATERIALS AND METHODS
3
29
exceeds the (static) Laplace pressure associated to the barriers, we hypothesize that thevolume of the dispersed phase in the chamber after the formation pulse does not dependon the actual values of the strength and duration of the pulse. Even when the dispersedphase initially spills into the main channel and halts within a few channel widths fromthe chamber, it is expected to retract back into the chamber. This is again understood byconsidering the static Laplace pressure: the curvature of the interface in the main chan-nel is higher than that in the chamber, such that the disperse phase flows back. Similarly,we do not expect the volume of the droplet after the release pulse to depend on the exactsettings of the pulse. In order to prevent unwanted formation or release of droplets dueto pressure fluctuations present in the system, we constricted the channels not just inwidth, but also in height. The chamber, nozzle and main channel therefore have differ-ent heights, as shown in Figure.3.1.1(b).
All DoD junctions presented in this paper have the same dimensions. The mainchannel is 50µm wide (wmai n) and 35µm high (hmai n), the nozzle is 25µm wide (wnozzle ),25 µm high (hnozzle ) and 50 µm long (lnozzle ), and the feed of the dispersed phase is100 µm wide (w f eed ) and 35 µm high (h f eed ). Of key importance are the dimensions ofthe chamber, because they impose the volume of the generated droplets. The chamberis 100 µm wide (wchamber ), 40 µm high (hchamber ), and 200 µm long (lchamber ) such thatits volume is about Vch = 0.71 nL. The chosen dimensions were based on initial testsperformed in devices with different nozzle and chamber dimensions, with the ones withhighly constricted nozzles and large chambers leading to premature droplet pinch-off,i.e. before the chamber was completely filled. The full design of the here used DoD gen-erator is made available as an AutoCAD file in Section.3.A.
3.2.2. DEVICE OPERATION
A pressure flow controller (MFCS-4C 1000 mbar, Fluigent) was used to control the injec-tion of the working fluids into the chips. The ports on this controller were connected toreservoirs containing the fluids using silicone tubing. PTFE tubing (0.5 mm ID, 1/16 inchOD, 60 cm in length, Kinesis) was used to connect the reservoirs to the tubing glued tothe inlets of the chips with the use of PEEK connectors. Care was taken to use the sameheight difference between the outlet of the chips and the liquid levels in the reservoirsin order to have comparable contributions of the hydrostatic pressure between differ-ent sets of experiments. Relatively large reservoirs (15 ml Eppendorf tubes) were used toensure a negligible change in liquid level over the course of an experiment.
The pressure pump was controlled using a custom made MATLAB script, which isprovided in Section.3.B. In each set of experiments, we ran the script to carry out 50DoD cycles with predefined pressure profile in an automated fashion. This profile ischaracterised by pd , pc , ∆pd , f or m , ∆pc, f or m , ∆t f or m , ∆tpause , ∆pd ,r elease , ∆pc,r elease ,∆tr elease , and ∆tc ycle , as defined in Figure.3.1.1(c). While the main working principlehas been explained before, with an increase in the dispersed phase pressure (∆pd , f or m)initiating formation and an increase in continuous phase pressure (∆pc,r elease ) initiatingrelease, we did not yet explain the rationale behind the base line pressures pd and pc andthe jumps ∆pc, f or m and ∆pd ,r elease . The base line pressure pc is chosen in order to ob-tain a desired (background) flow rate of the continuous phase through the main channelwhen the device is running steadily between droplet generation events. As the chosen
3
30 3. DROPLET ON DEMAND GENERATOR
value of pc determines the local pressure in the chamber, the baseline pressure pd isadjusted in accordance. In experiments, pd was tuned manually in such a way that itresulted in the interface being steadily pressed against the nozzle. While the choice of pc
is not stringent, pd should be chosen such that the interface neither gets pushed back into the feed channel nor through the nozzle. In the experiments performed, this was rela-tively straightforward. To ensure that the continuous phase does not prematurely breakthe neck of the dispersed phase by pushing it forward into the chamber after the for-mation pulse, we reduced the background flow of the continuous phase using ∆pc, f or m
when initiating formation. When initiating release, an extra pressure of ∆pd ,r elease isadded to the dispersed phase in order to avoid the dispersed phase being pushed backinto the feed channel. With this in mind, we noticed in initial experiments that the win-dow of operation is relatively large for the release stage. In the experiments, we hencefocus on the sensitivity of the droplet volume with respect to the operating parametersassociated with the formation stage.
3.2.3. DEVICE FABRICATION
The microfluidic devices were fabricated using standard soft lithographic methods[55].To obtain channels with three different heights in the same device, we spun three layersof the negative photoresist SU-8 (micro resist technology GmbH) on top of each other ona 4 inch silicon wafer and exposed each layer to near UV (EVG 620, EV Group) through aseparate mask. These masks were designed using AutoCAD 2015 (Autodesk) and printedon transparencies using a high resolution printer (CAD/Art (Oregon, USA)). The firstmask featured all channels of the microfluidic device, while the channel connecting thefeed of the dispersed phase to the chamber (i.e. the nozzle) was not included on the sec-ond mask in order to make a nozzle with a constriction in height. The third mask onlycontained the chamber in order to make it higher than all other channels. The designsof the three masks are made available in Section.3.A. Unless stated otherwise, microflu-idic devices were constructed from a 25 µm thick first layer (SU-8 3025), a 10 µm thicksecond layer (SU-8 3005), and a 5 µm thick third layer (SU-8 3005). After spin-coating alayer, it was soft baked, exposed, and post baked, following the guidelines provided bythe manufacturer. The resulting wafer was then developed with mr-Dev 600 (micro re-sist technology GmbH), washed with isopropyl alcohol, spin dried, hard baked at 150◦Cfor 30 minutes, and slowly cooled down on a hot plate to avoid cracks in the SU-8 struc-tures. Before using the wafer as a master for replica moulding in PDMS, its surface wassilanized by exposing it to vapours of 1H,1H,2H,2H-perfluorooctyl- trichlorosilane in adepressurized desiccator.
PDMS devices were made by mixing 80 g of PDMS elastomer and 8 g of curing agent(Dow corning, Slygard 184 elastomer kit), degassing the mixture and pouring it over themaster placed in a 5 inch petridish. The PDMS mixture was cured at 70◦C for 3 hoursin an oven, gently removed from the wafer, and cut to size. The inlets and outlets werepunched with a 1.5 mm biopsy punch and the resulting PDMS moulds were washedwith ethanol to remove dust and debris. PDMS moulds and PDMS spin coated glassslides (25 mm × 75 mm) were exposed to an oxygen plasma (Harrick, PDC-002) for 140s at a pressure of 0.2-0.4 mbar and subsequently pressed together to bond them. Theobtained microfluidic devices were then baked at 140◦C for at least 4 hours to regain the
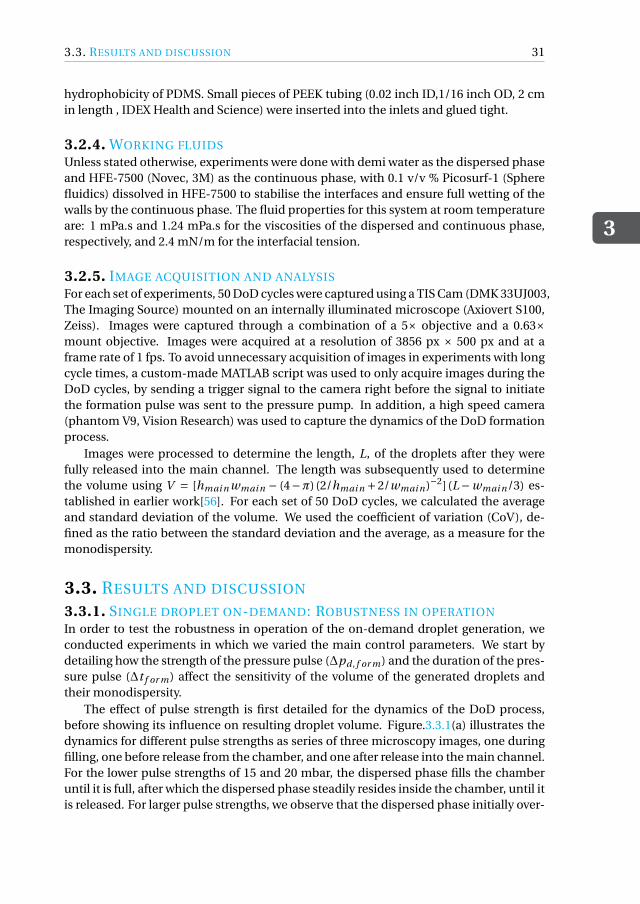
3.3. RESULTS AND DISCUSSION
3
31
hydrophobicity of PDMS. Small pieces of PEEK tubing (0.02 inch ID,1/16 inch OD, 2 cmin length , IDEX Health and Science) were inserted into the inlets and glued tight.
3.2.4. WORKING FLUIDS
Unless stated otherwise, experiments were done with demi water as the dispersed phaseand HFE-7500 (Novec, 3M) as the continuous phase, with 0.1 v/v % Picosurf-1 (Spherefluidics) dissolved in HFE-7500 to stabilise the interfaces and ensure full wetting of thewalls by the continuous phase. The fluid properties for this system at room temperatureare: 1 mPa.s and 1.24 mPa.s for the viscosities of the dispersed and continuous phase,respectively, and 2.4 mN/m for the interfacial tension.
3.2.5. IMAGE ACQUISITION AND ANALYSIS
For each set of experiments, 50 DoD cycles were captured using a TIS Cam (DMK 33UJ003,The Imaging Source) mounted on an internally illuminated microscope (Axiovert S100,Zeiss). Images were captured through a combination of a 5× objective and a 0.63×mount objective. Images were acquired at a resolution of 3856 px × 500 px and at aframe rate of 1 fps. To avoid unnecessary acquisition of images in experiments with longcycle times, a custom-made MATLAB script was used to only acquire images during theDoD cycles, by sending a trigger signal to the camera right before the signal to initiatethe formation pulse was sent to the pressure pump. In addition, a high speed camera(phantom V9, Vision Research) was used to capture the dynamics of the DoD formationprocess.
Images were processed to determine the length, L, of the droplets after they werefully released into the main channel. The length was subsequently used to determinethe volume using V = [hmai n wmai n − (4−π) (2/hmai n +2/wmai n)−2] (L−wmai n/3) es-tablished in earlier work[56]. For each set of 50 DoD cycles, we calculated the averageand standard deviation of the volume. We used the coefficient of variation (CoV), de-fined as the ratio between the standard deviation and the average, as a measure for themonodispersity.
3.3. RESULTS AND DISCUSSION
3.3.1. SINGLE DROPLET ON-DEMAND: ROBUSTNESS IN OPERATION
In order to test the robustness in operation of the on-demand droplet generation, weconducted experiments in which we varied the main control parameters. We start bydetailing how the strength of the pressure pulse (∆pd , f or m) and the duration of the pres-sure pulse (∆t f or m) affect the sensitivity of the volume of the generated droplets andtheir monodispersity.
The effect of pulse strength is first detailed for the dynamics of the DoD process,before showing its influence on resulting droplet volume. Figure.3.3.1(a) illustrates thedynamics for different pulse strengths as series of three microscopy images, one duringfilling, one before release from the chamber, and one after release into the main channel.For the lower pulse strengths of 15 and 20 mbar, the dispersed phase fills the chamberuntil it is full, after which the dispersed phase steadily resides inside the chamber, until itis released. For larger pulse strengths, we observe that the dispersed phase initially over-
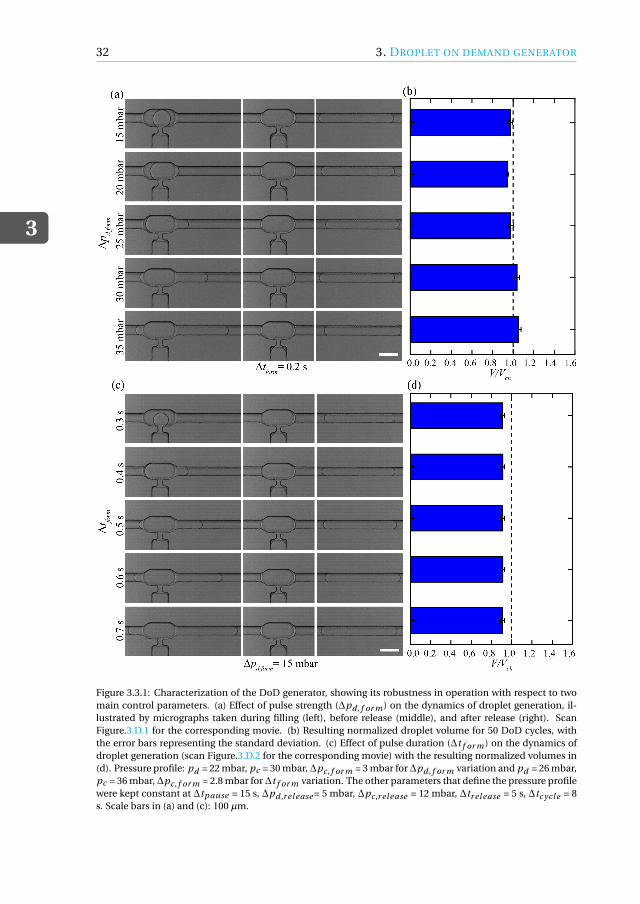
3
32 3. DROPLET ON DEMAND GENERATOR
Figure 3.3.1: Characterization of the DoD generator, showing its robustness in operation with respect to twomain control parameters. (a) Effect of pulse strength (∆pd , f or m ) on the dynamics of droplet generation, il-lustrated by micrographs taken during filling (left), before release (middle), and after release (right). ScanFigure.3.D.1 for the corresponding movie. (b) Resulting normalized droplet volume for 50 DoD cycles, withthe error bars representing the standard deviation. (c) Effect of pulse duration (∆t f or m ) on the dynamics ofdroplet generation (scan Figure.3.D.2 for the corresponding movie) with the resulting normalized volumes in(d). Pressure profile: pd = 22 mbar, pc = 30 mbar,∆pc, f or m = 3 mbar for∆pd , f or m variation and pd = 26 mbar,pc = 36 mbar,∆pc, f or m = 2.8 mbar for∆t f or m variation. The other parameters that define the pressure profilewere kept constant at ∆tpause = 15 s, ∆pd ,r elease = 5 mbar, ∆pc,r elease = 12 mbar, ∆tr elease = 5 s, ∆tc ycle = 8s. Scale bars in (a) and (c): 100 µm.
3.3. RESULTS AND DISCUSSION
3
33
flows the chamber, spilling into the main channel, with larger pulse strengths leadingto larger overshoots as evident from the left column in Figure.3.3.1(a). After this over-shoot, the interfaces halt within a few channel widths from the chamber. At that instant,the dispersed phase pressure in the main channel is higher than in the chamber due tothe curvature of the interfaces imposed by the main channel. As a result, the dispersedphase flows back into the chamber. Despite the overshoot for larger pulse strengths andthe difference in dynamics for low and high pulse strengths, the formation pulse resultsin the same steady outcome: a chamber filled with the dispersed phase, from which adroplet can be released upon a second pulse.
For pulse strengths between 15 to 35 mbar, we find that the generated droplets have avolume (V ) similar to the volume of the chamber (Vch), as shown in Figure.3.3.1(b), withall corresponding CoVs below 0.03. Pulse strengths below 15 mbar were not sufficientlypowerful to push the dispersed phase through the nozzle. This is in line with the order ofmagnitude of the (over) pressure required to push the interface quasi-statically throughthe nozzle, which is about 4 mbar as estimated from the Laplace law, γ (2/wnozzle +2/hnozzle ).Although not shown, the droplet formation process works in a similar fashion for pulsestrengths of 40 and 45 mbar and device operation was insensitive to pulse strengths upto 45 mbar. For larger pulse strengths (at ∆t f or m= 0.2 s), we observed that the interfacepenetrated all the way to the exit of the downstream channel such that retraction backinto the chamber did not occur.
The effect of the duration of the pulse (∆t f or m) on the dynamics of DoD generationis illustrated in Figure.3.3.1(c). The behaviour is very similar to that observed for differ-ent pulse strengths; the chamber is gradually filled with the dispersed phase for shortpulses, while an initial overshoot and subsequent retraction occurs for longer pulses.The resulting droplet volume is insensitive to the applied pulse duration for the herereported range of durations, see Figure.3.3.1(d), with corresponding CoVs below 0.03.Outside the reported range, the interface was not pushed through the nozzle for shorterpulses, while it overshot to the exit for longer pulses. We note that the droplet volumes inFigure.3.3.1(d) are systematically lower than the chamber volume. With the pre-formeddroplets in the chamber similar in volume in Figure.3.3.1(a) and Figure.3.3.1(c), we ex-pect that the lower value is caused by partial backflow of dispersed phase into the nozzlebefore complete pinch-off during release.
We conclude the experiments on pulse strength and pulse duration by returning toour original hypothesis that the volume of the dispersed phase in the chamber after theformation pulse, and the volume of the generated droplet after the release pulse, have alow sensitivity with respect to the actual values of the pressure pulses used, as long as thedriving pressure is raised above the static Laplace pressure associated to the barriers fora sufficient amount of time. The data presented in Figure.3.3.1 confirms that (i) dropletsare not generated for driving pressure below the static Laplace pressure, (ii) droplets aregenerated for higher pressures, with the performance of the generator, characterized interms of droplet volume and variations therein, having a low sensitivity to the actualsettings of the pressure pulse, for pulse strengths and pulse durations in the range be-tween 15-45 mbar and 0.3-0.7 seconds. This low sensitivity enables different DoDs in ascaled-out device to produce similar sized droplets, even when the local pressures nearthe different DoDs are different.
3
34 3. DROPLET ON DEMAND GENERATOR
To further substantiate the robustness in operation of the DoD generator, we studiedthe sensitivity of the volume of the generated droplets with respect to the time betweentwo droplet formation cycles (∆tc ycle ). The volume of the generated droplets is insensi-tive for the here studied range as shown in Figure.3.3.2. The CoV for∆tc ycle = 10 s and 60s is 0.02, while it is 0.06 for∆tc ycle = 300 s. In this set, we observed slight differences in thelocation of the interfaces when pressed against the entrance of main channel in differentDoD cycles, which may be caused by (long term) variations in the base line pressures.
Δtcycle (s)
V/V ch
0.00.20.40.60.81.01.21.41.6
10 60 300
Figure 3.3.2: Effect of cycle time (∆tc ycle ) on generated droplet volume and monodispersity. Pressure pro-file: pd = 26 mbar, pc = 52 mbar, ∆pd , f or m = 20 mbar, ∆pc, f or m = 3 mbar, ∆t f or m = 0.2 s, ∆tpause = 30 s,∆pd ,r elease = 5 mbar, ∆pc,r elease = 12 mbar, ∆tr elease = 5 s.
Before further characterizing the performance of the DoD generator, we commenton the feeding frequencies (or throughput) that can be achieved in the context of itsintended use. One of the foreseen areas of its application is in bioprocess engineer-ing, where it can be used for long term cultivation of cells under sequential-batch/fed-batch/semi-continuous conditions, with control over the produced metabolites throughthe controlled supply of nutrients. The required feeding frequency then depends on thedesired growth rate of the cells. The simplest estimate of the order of magnitude of therequired feeding frequency is obtained by considering a chemostat, for which the re-quired volumetric flow rate of nutrients (F ) solely depends on the volume in which thecells are cultured (Vr ) and the desired cell growth rate (µcel l ) as F = Vr µcel l . Feeding nu-trient droplets of volume V at a frequency f , the required frequency simply equals f =(Vr /V )µcel l . For typical nutrient-controlled growth rates of the order of 0.1 h−1 and nu-trient volumes of the order of 10 - 100 times the cell culture volume, the expected feedingfrequency is of the order of 1 - 10 droplets per hour. This is well in the range of feedingfrequencies possible with the DoD generator, with its maximum generation frequencyprimarily depending on the time it takes for the interface to retract back from the mainchannel into the chamber after the formation pulse. This typically occurs within 5 - 10
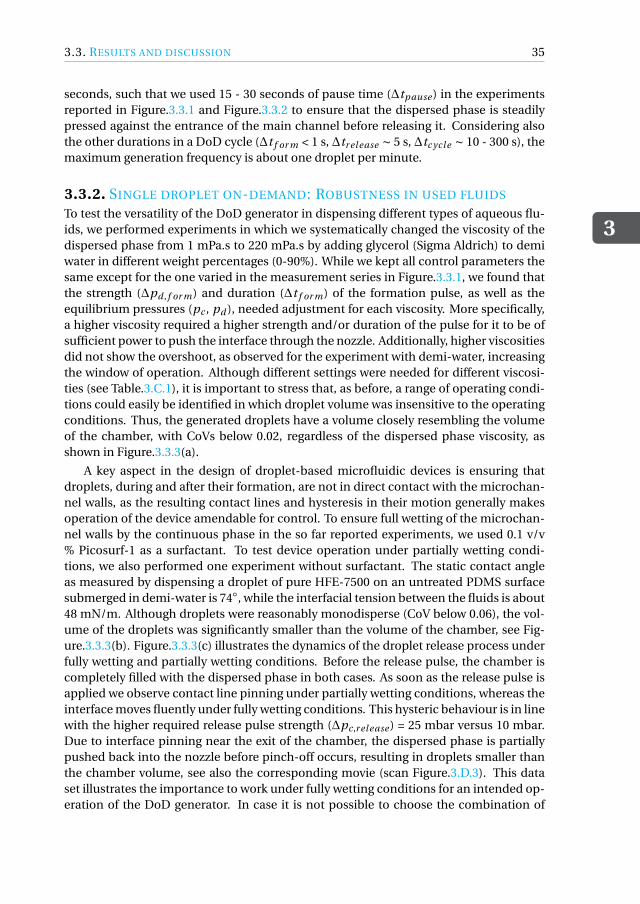
3.3. RESULTS AND DISCUSSION
3
35
seconds, such that we used 15 - 30 seconds of pause time (∆tpause ) in the experimentsreported in Figure.3.3.1 and Figure.3.3.2 to ensure that the dispersed phase is steadilypressed against the entrance of the main channel before releasing it. Considering alsothe other durations in a DoD cycle (∆t f or m < 1 s, ∆tr elease ∼ 5 s, ∆tc ycle ∼ 10 - 300 s), themaximum generation frequency is about one droplet per minute.
3.3.2. SINGLE DROPLET ON-DEMAND: ROBUSTNESS IN USED FLUIDS
To test the versatility of the DoD generator in dispensing different types of aqueous flu-ids, we performed experiments in which we systematically changed the viscosity of thedispersed phase from 1 mPa.s to 220 mPa.s by adding glycerol (Sigma Aldrich) to demiwater in different weight percentages (0-90%). While we kept all control parameters thesame except for the one varied in the measurement series in Figure.3.3.1, we found thatthe strength (∆pd , f or m) and duration (∆t f or m) of the formation pulse, as well as theequilibrium pressures (pc , pd ), needed adjustment for each viscosity. More specifically,a higher viscosity required a higher strength and/or duration of the pulse for it to be ofsufficient power to push the interface through the nozzle. Additionally, higher viscositiesdid not show the overshoot, as observed for the experiment with demi-water, increasingthe window of operation. Although different settings were needed for different viscosi-ties (see Table.3.C.1), it is important to stress that, as before, a range of operating condi-tions could easily be identified in which droplet volume was insensitive to the operatingconditions. Thus, the generated droplets have a volume closely resembling the volumeof the chamber, with CoVs below 0.02, regardless of the dispersed phase viscosity, asshown in Figure.3.3.3(a).
A key aspect in the design of droplet-based microfluidic devices is ensuring thatdroplets, during and after their formation, are not in direct contact with the microchan-nel walls, as the resulting contact lines and hysteresis in their motion generally makesoperation of the device amendable for control. To ensure full wetting of the microchan-nel walls by the continuous phase in the so far reported experiments, we used 0.1 v/v% Picosurf-1 as a surfactant. To test device operation under partially wetting condi-tions, we also performed one experiment without surfactant. The static contact angleas measured by dispensing a droplet of pure HFE-7500 on an untreated PDMS surfacesubmerged in demi-water is 74◦, while the interfacial tension between the fluids is about48 mN/m. Although droplets were reasonably monodisperse (CoV below 0.06), the vol-ume of the droplets was significantly smaller than the volume of the chamber, see Fig-ure.3.3.3(b). Figure.3.3.3(c) illustrates the dynamics of the droplet release process underfully wetting and partially wetting conditions. Before the release pulse, the chamber iscompletely filled with the dispersed phase in both cases. As soon as the release pulse isapplied we observe contact line pinning under partially wetting conditions, whereas theinterface moves fluently under fully wetting conditions. This hysteric behaviour is in linewith the higher required release pulse strength (∆pc,r elease ) = 25 mbar versus 10 mbar.Due to interface pinning near the exit of the chamber, the dispersed phase is partiallypushed back into the nozzle before pinch-off occurs, resulting in droplets smaller thanthe chamber volume, see also the corresponding movie (scan Figure.3.D.3). This dataset illustrates the importance to work under fully wetting conditions for an intended op-eration of the DoD generator. In case it is not possible to choose the combination of
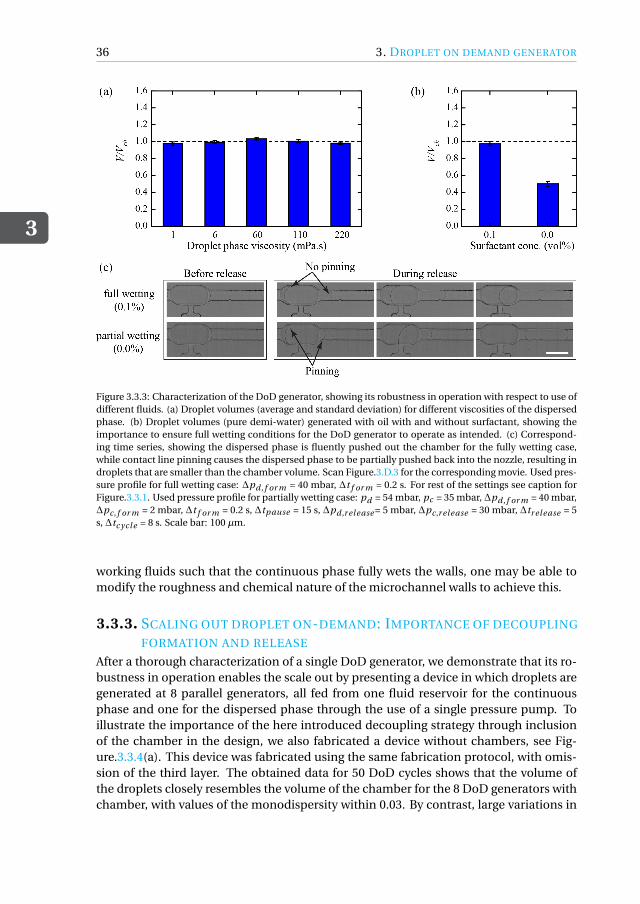
3
36 3. DROPLET ON DEMAND GENERATOR
Figure 3.3.3: Characterization of the DoD generator, showing its robustness in operation with respect to use ofdifferent fluids. (a) Droplet volumes (average and standard deviation) for different viscosities of the dispersedphase. (b) Droplet volumes (pure demi-water) generated with oil with and without surfactant, showing theimportance to ensure full wetting conditions for the DoD generator to operate as intended. (c) Correspond-ing time series, showing the dispersed phase is fluently pushed out the chamber for the fully wetting case,while contact line pinning causes the dispersed phase to be partially pushed back into the nozzle, resulting indroplets that are smaller than the chamber volume. Scan Figure.3.D.3 for the corresponding movie. Used pres-sure profile for full wetting case: ∆pd , f or m = 40 mbar, ∆t f or m = 0.2 s. For rest of the settings see caption forFigure.3.3.1. Used pressure profile for partially wetting case: pd = 54 mbar, pc = 35 mbar,∆pd , f or m = 40 mbar,∆pc, f or m = 2 mbar, ∆t f or m = 0.2 s, ∆tpause = 15 s, ∆pd ,r elease = 5 mbar, ∆pc,r elease = 30 mbar, ∆tr elease = 5s, ∆tc ycle = 8 s. Scale bar: 100 µm.
working fluids such that the continuous phase fully wets the walls, one may be able tomodify the roughness and chemical nature of the microchannel walls to achieve this.
3.3.3. SCALING OUT DROPLET ON-DEMAND: IMPORTANCE OF DECOUPLING
FORMATION AND RELEASE
After a thorough characterization of a single DoD generator, we demonstrate that its ro-bustness in operation enables the scale out by presenting a device in which droplets aregenerated at 8 parallel generators, all fed from one fluid reservoir for the continuousphase and one for the dispersed phase through the use of a single pressure pump. Toillustrate the importance of the here introduced decoupling strategy through inclusionof the chamber in the design, we also fabricated a device without chambers, see Fig-ure.3.3.4(a). This device was fabricated using the same fabrication protocol, with omis-sion of the third layer. The obtained data for 50 DoD cycles shows that the volume ofthe droplets closely resembles the volume of the chamber for the 8 DoD generators withchamber, with values of the monodispersity within 0.03. By contrast, large variations in
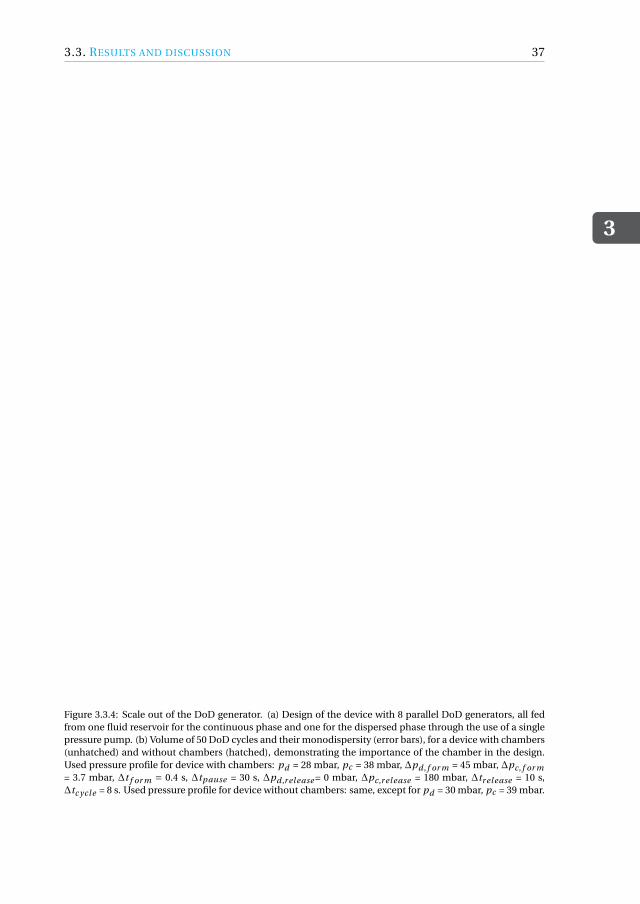
3.3. RESULTS AND DISCUSSION
3
37
with chamber
withoutchamber
inlet CP
inlet DPexit exit exit exit
8 D
oD
gene
rato
rs(a)
(b)
1 2 3 4 5 6 7 80.0
0.2
0.4
0.6
0.8
1.0
1.2
1.4
1.6
Droplet generator ID
V/V ch
Figure 3.3.4: Scale out of the DoD generator. (a) Design of the device with 8 parallel DoD generators, all fedfrom one fluid reservoir for the continuous phase and one for the dispersed phase through the use of a singlepressure pump. (b) Volume of 50 DoD cycles and their monodispersity (error bars), for a device with chambers(unhatched) and without chambers (hatched), demonstrating the importance of the chamber in the design.Used pressure profile for device with chambers: pd = 28 mbar, pc = 38 mbar, ∆pd , f or m = 45 mbar, ∆pc, f or m= 3.7 mbar, ∆t f or m = 0.4 s, ∆tpause = 30 s, ∆pd ,r elease = 0 mbar, ∆pc,r elease = 180 mbar, ∆tr elease = 10 s,∆tc ycle = 8 s. Used pressure profile for device without chambers: same, except for pd = 30 mbar, pc = 39 mbar.
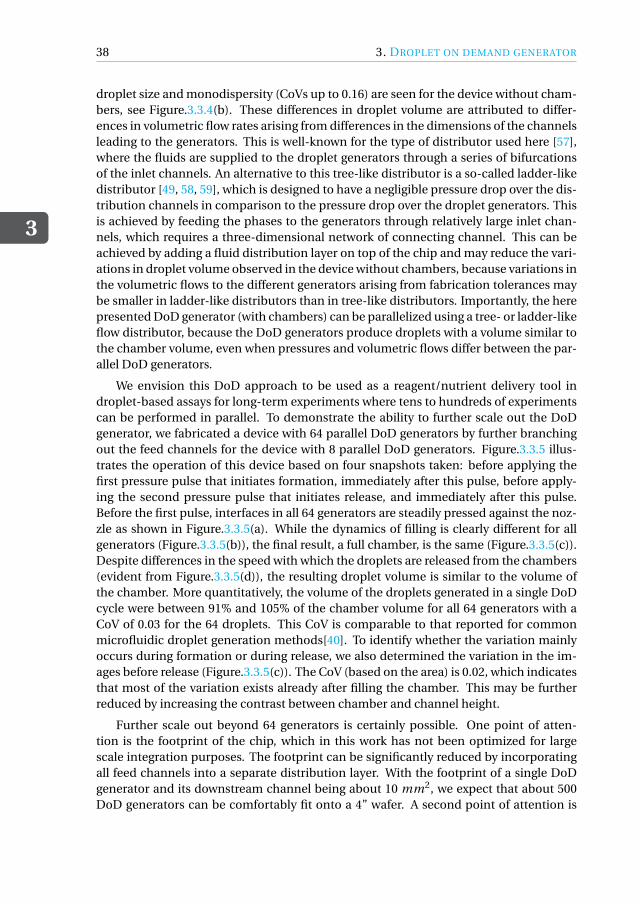
3
38 3. DROPLET ON DEMAND GENERATOR
droplet size and monodispersity (CoVs up to 0.16) are seen for the device without cham-bers, see Figure.3.3.4(b). These differences in droplet volume are attributed to differ-ences in volumetric flow rates arising from differences in the dimensions of the channelsleading to the generators. This is well-known for the type of distributor used here [57],where the fluids are supplied to the droplet generators through a series of bifurcationsof the inlet channels. An alternative to this tree-like distributor is a so-called ladder-likedistributor [49, 58, 59], which is designed to have a negligible pressure drop over the dis-tribution channels in comparison to the pressure drop over the droplet generators. Thisis achieved by feeding the phases to the generators through relatively large inlet chan-nels, which requires a three-dimensional network of connecting channel. This can beachieved by adding a fluid distribution layer on top of the chip and may reduce the vari-ations in droplet volume observed in the device without chambers, because variations inthe volumetric flows to the different generators arising from fabrication tolerances maybe smaller in ladder-like distributors than in tree-like distributors. Importantly, the herepresented DoD generator (with chambers) can be parallelized using a tree- or ladder-likeflow distributor, because the DoD generators produce droplets with a volume similar tothe chamber volume, even when pressures and volumetric flows differ between the par-allel DoD generators.
We envision this DoD approach to be used as a reagent/nutrient delivery tool indroplet-based assays for long-term experiments where tens to hundreds of experimentscan be performed in parallel. To demonstrate the ability to further scale out the DoDgenerator, we fabricated a device with 64 parallel DoD generators by further branchingout the feed channels for the device with 8 parallel DoD generators. Figure.3.3.5 illus-trates the operation of this device based on four snapshots taken: before applying thefirst pressure pulse that initiates formation, immediately after this pulse, before apply-ing the second pressure pulse that initiates release, and immediately after this pulse.Before the first pulse, interfaces in all 64 generators are steadily pressed against the noz-zle as shown in Figure.3.3.5(a). While the dynamics of filling is clearly different for allgenerators (Figure.3.3.5(b)), the final result, a full chamber, is the same (Figure.3.3.5(c)).Despite differences in the speed with which the droplets are released from the chambers(evident from Figure.3.3.5(d)), the resulting droplet volume is similar to the volume ofthe chamber. More quantitatively, the volume of the droplets generated in a single DoDcycle were between 91% and 105% of the chamber volume for all 64 generators with aCoV of 0.03 for the 64 droplets. This CoV is comparable to that reported for commonmicrofluidic droplet generation methods[40]. To identify whether the variation mainlyoccurs during formation or during release, we also determined the variation in the im-ages before release (Figure.3.3.5(c)). The CoV (based on the area) is 0.02, which indicatesthat most of the variation exists already after filling the chamber. This may be furtherreduced by increasing the contrast between chamber and channel height.
Further scale out beyond 64 generators is certainly possible. One point of atten-tion is the footprint of the chip, which in this work has not been optimized for largescale integration purposes. The footprint can be significantly reduced by incorporatingall feed channels into a separate distribution layer. With the footprint of a single DoDgenerator and its downstream channel being about 10 mm2, we expect that about 500DoD generators can be comfortably fit onto a 4” wafer. A second point of attention is
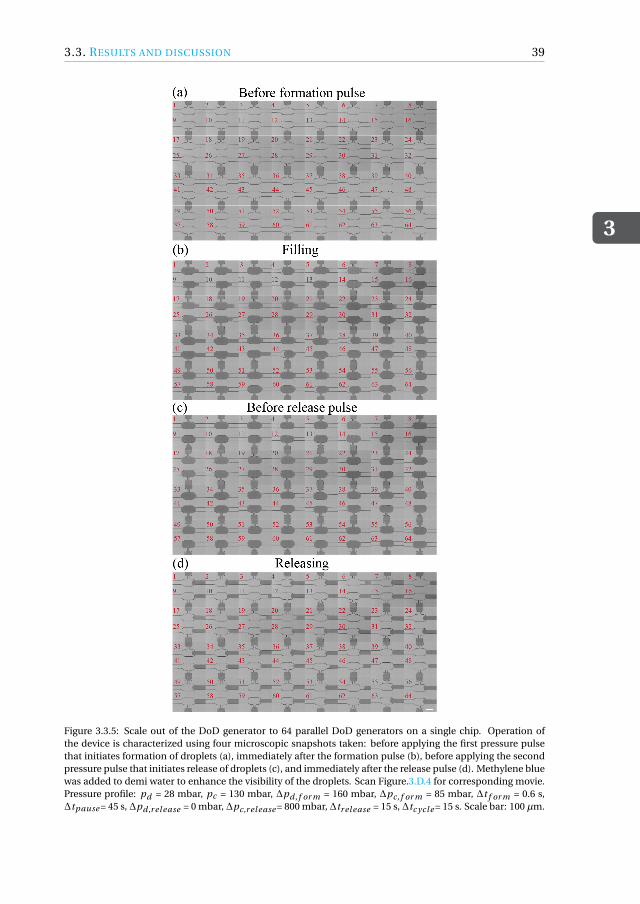
3.3. RESULTS AND DISCUSSION
3
39
Figure 3.3.5: Scale out of the DoD generator to 64 parallel DoD generators on a single chip. Operation ofthe device is characterized using four microscopic snapshots taken: before applying the first pressure pulsethat initiates formation of droplets (a), immediately after the formation pulse (b), before applying the secondpressure pulse that initiates release of droplets (c), and immediately after the release pulse (d). Methylene bluewas added to demi water to enhance the visibility of the droplets. Scan Figure.3.D.4 for corresponding movie.Pressure profile: pd = 28 mbar, pc = 130 mbar, ∆pd , f or m = 160 mbar, ∆pc, f or m = 85 mbar, ∆t f or m = 0.6 s,∆tpause = 45 s,∆pd ,r elease = 0 mbar,∆pc,r elease = 800 mbar,∆tr elease = 15 s,∆tc ycle = 15 s. Scale bar: 100 µm.
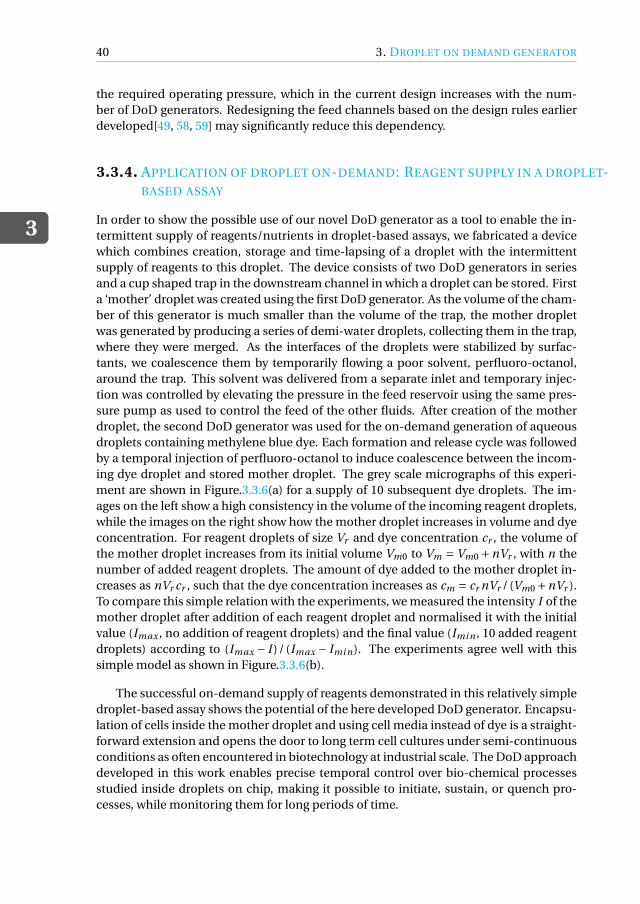
3
40 3. DROPLET ON DEMAND GENERATOR
the required operating pressure, which in the current design increases with the num-ber of DoD generators. Redesigning the feed channels based on the design rules earlierdeveloped[49, 58, 59] may significantly reduce this dependency.
3.3.4. APPLICATION OF DROPLET ON-DEMAND: REAGENT SUPPLY IN A DROPLET-BASED ASSAY
In order to show the possible use of our novel DoD generator as a tool to enable the in-termittent supply of reagents/nutrients in droplet-based assays, we fabricated a devicewhich combines creation, storage and time-lapsing of a droplet with the intermittentsupply of reagents to this droplet. The device consists of two DoD generators in seriesand a cup shaped trap in the downstream channel in which a droplet can be stored. Firsta ‘mother’ droplet was created using the first DoD generator. As the volume of the cham-ber of this generator is much smaller than the volume of the trap, the mother dropletwas generated by producing a series of demi-water droplets, collecting them in the trap,where they were merged. As the interfaces of the droplets were stabilized by surfac-tants, we coalescence them by temporarily flowing a poor solvent, perfluoro-octanol,around the trap. This solvent was delivered from a separate inlet and temporary injec-tion was controlled by elevating the pressure in the feed reservoir using the same pres-sure pump as used to control the feed of the other fluids. After creation of the motherdroplet, the second DoD generator was used for the on-demand generation of aqueousdroplets containing methylene blue dye. Each formation and release cycle was followedby a temporal injection of perfluoro-octanol to induce coalescence between the incom-ing dye droplet and stored mother droplet. The grey scale micrographs of this experi-ment are shown in Figure.3.3.6(a) for a supply of 10 subsequent dye droplets. The im-ages on the left show a high consistency in the volume of the incoming reagent droplets,while the images on the right show how the mother droplet increases in volume and dyeconcentration. For reagent droplets of size Vr and dye concentration cr , the volume ofthe mother droplet increases from its initial volume Vm0 to Vm = Vm0 +nVr , with n thenumber of added reagent droplets. The amount of dye added to the mother droplet in-creases as nVr cr , such that the dye concentration increases as cm = cr nVr /(Vm0 +nVr ).To compare this simple relation with the experiments, we measured the intensity I of themother droplet after addition of each reagent droplet and normalised it with the initialvalue (Imax , no addition of reagent droplets) and the final value (Imi n , 10 added reagentdroplets) according to (Imax − I )/(Imax − Imi n). The experiments agree well with thissimple model as shown in Figure.3.3.6(b).
The successful on-demand supply of reagents demonstrated in this relatively simpledroplet-based assay shows the potential of the here developed DoD generator. Encapsu-lation of cells inside the mother droplet and using cell media instead of dye is a straight-forward extension and opens the door to long term cell cultures under semi-continuousconditions as often encountered in biotechnology at industrial scale. The DoD approachdeveloped in this work enables precise temporal control over bio-chemical processesstudied inside droplets on chip, making it possible to initiate, sustain, or quench pro-cesses, while monitoring them for long periods of time.
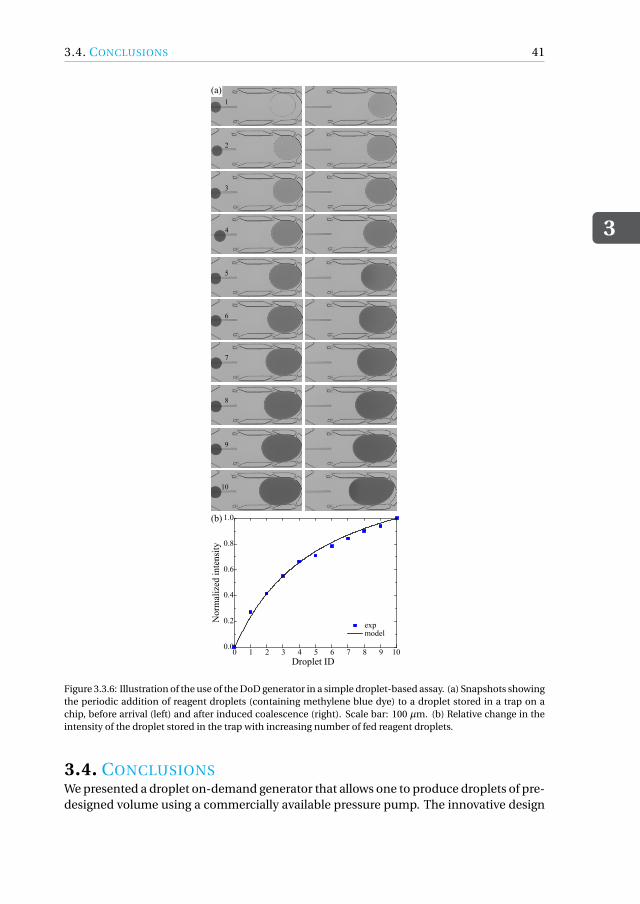
3.4. CONCLUSIONS
3
41
1
2
3
4
5
6
7
8
9
10
(b)
0 1 2 3 4 5 6 7 8 9 100.0
0.2
0.4
0.6
0.8
1.0
exp model
Nor
mal
ized
inte
nsity
Droplet ID
(a)
Figure 3.3.6: Illustration of the use of the DoD generator in a simple droplet-based assay. (a) Snapshots showingthe periodic addition of reagent droplets (containing methylene blue dye) to a droplet stored in a trap on achip, before arrival (left) and after induced coalescence (right). Scale bar: 100 µm. (b) Relative change in theintensity of the droplet stored in the trap with increasing number of fed reagent droplets.
3.4. CONCLUSIONSWe presented a droplet on-demand generator that allows one to produce droplets of pre-designed volume using a commercially available pressure pump. The innovative design
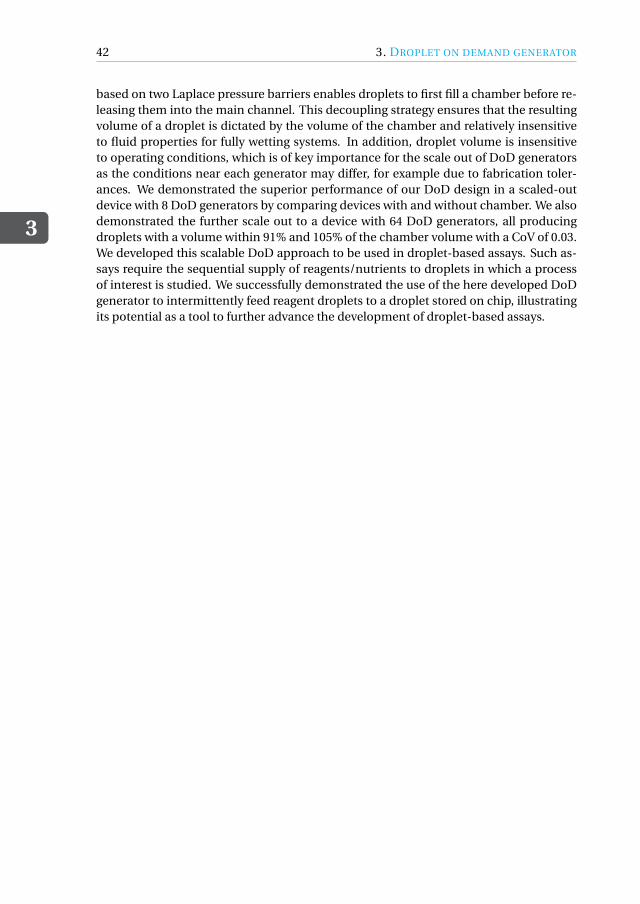
3
42 3. DROPLET ON DEMAND GENERATOR
based on two Laplace pressure barriers enables droplets to first fill a chamber before re-leasing them into the main channel. This decoupling strategy ensures that the resultingvolume of a droplet is dictated by the volume of the chamber and relatively insensitiveto fluid properties for fully wetting systems. In addition, droplet volume is insensitiveto operating conditions, which is of key importance for the scale out of DoD generatorsas the conditions near each generator may differ, for example due to fabrication toler-ances. We demonstrated the superior performance of our DoD design in a scaled-outdevice with 8 DoD generators by comparing devices with and without chamber. We alsodemonstrated the further scale out to a device with 64 DoD generators, all producingdroplets with a volume within 91% and 105% of the chamber volume with a CoV of 0.03.We developed this scalable DoD approach to be used in droplet-based assays. Such as-says require the sequential supply of reagents/nutrients to droplets in which a processof interest is studied. We successfully demonstrated the use of the here developed DoDgenerator to intermittently feed reagent droplets to a droplet stored on chip, illustratingits potential as a tool to further advance the development of droplet-based assays.
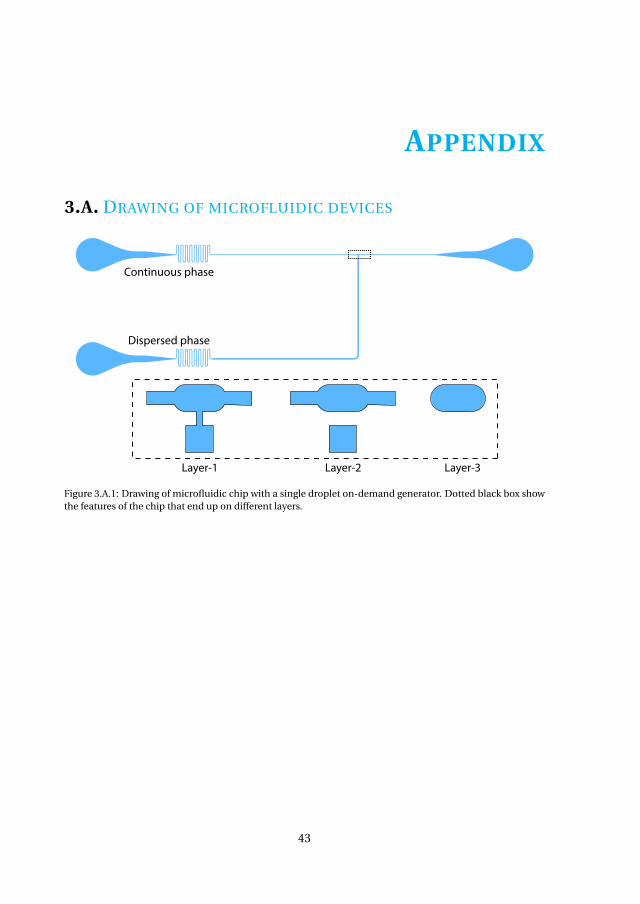
APPENDIX
3.A. DRAWING OF MICROFLUIDIC DEVICES
Continuous phase
Dispersed phase
Layer-1 Layer-2 Layer-3
Figure 3.A.1: Drawing of microfluidic chip with a single droplet on-demand generator. Dotted black box showthe features of the chip that end up on different layers.
43
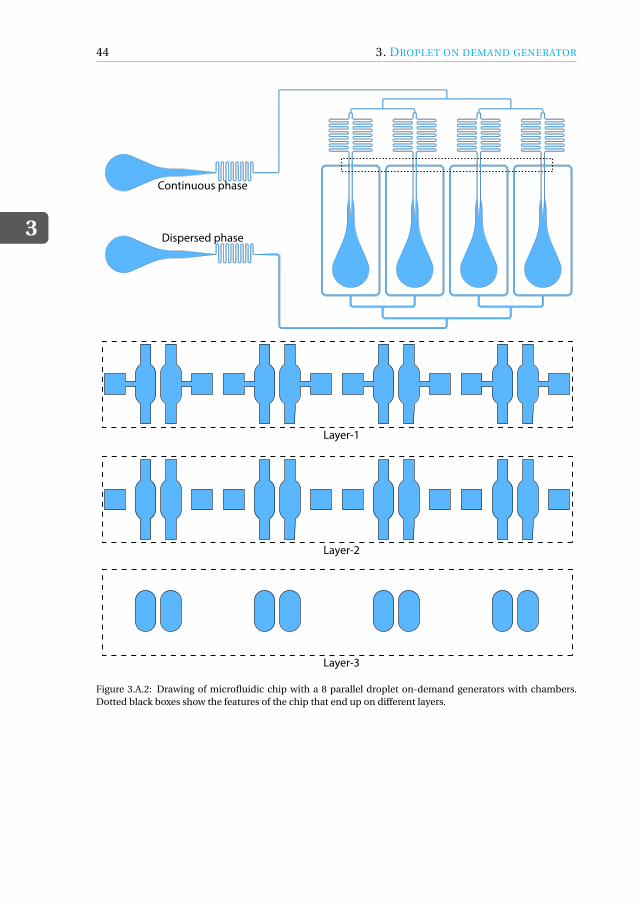
3
44 3. DROPLET ON DEMAND GENERATOR
Continuous phase
Dispersed phase
Layer-1
Layer-2
Layer-3
Figure 3.A.2: Drawing of microfluidic chip with a 8 parallel droplet on-demand generators with chambers.Dotted black boxes show the features of the chip that end up on different layers.
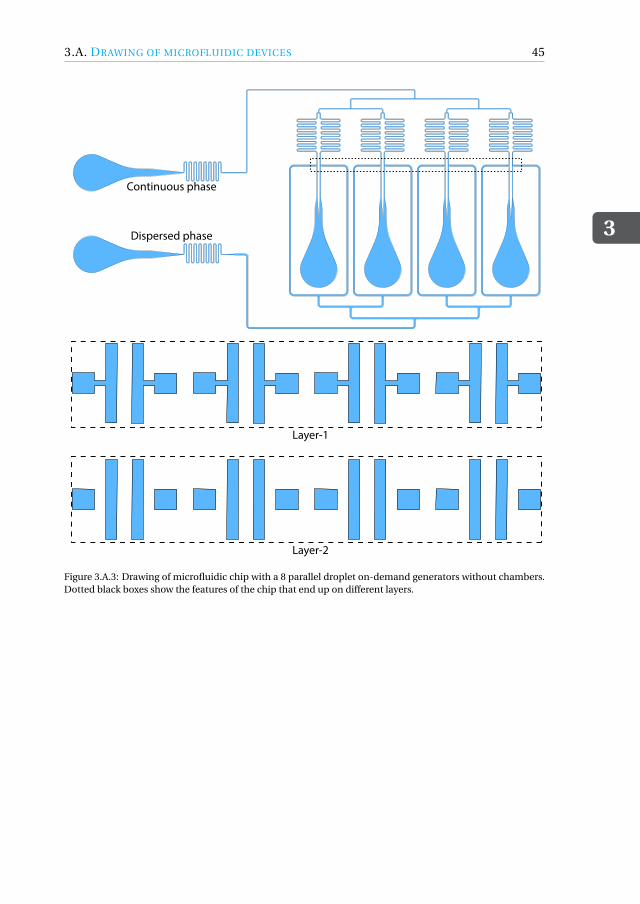
3.A. DRAWING OF MICROFLUIDIC DEVICES
3
45
Continuous phase
Dispersed phase
Layer-1
Layer-2
Figure 3.A.3: Drawing of microfluidic chip with a 8 parallel droplet on-demand generators without chambers.Dotted black boxes show the features of the chip that end up on different layers.
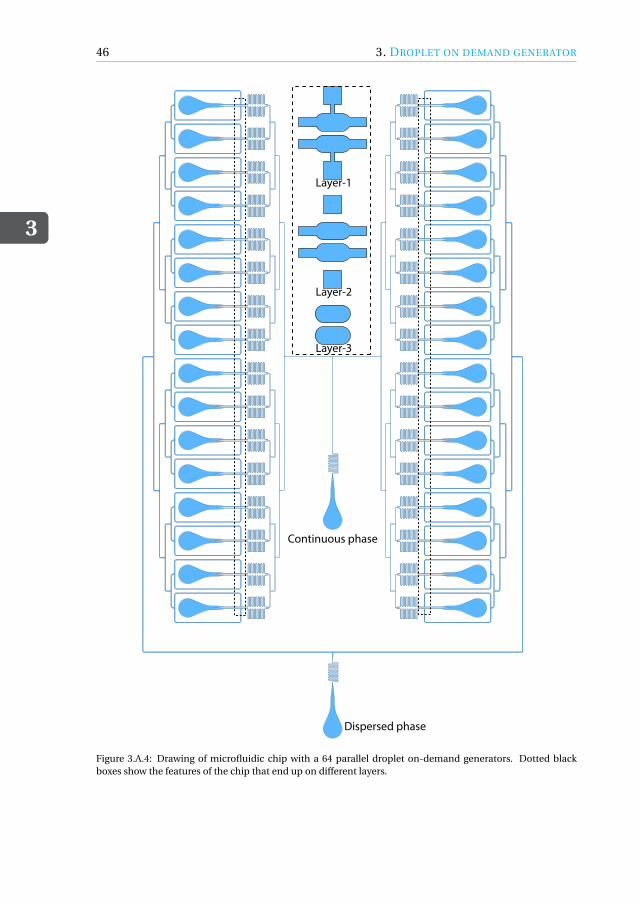
3
46 3. DROPLET ON DEMAND GENERATOR
Layer-1
Layer-2
Layer-3
Continuous phase
Dispersed phase
Figure 3.A.4: Drawing of microfluidic chip with a 64 parallel droplet on-demand generators. Dotted blackboxes show the features of the chip that end up on different layers.
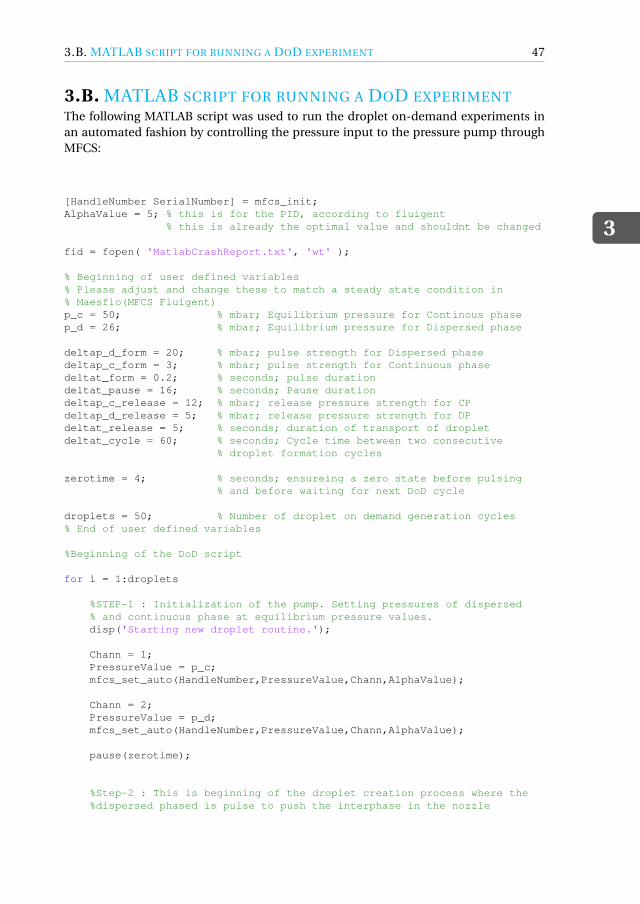
3.B. MATLAB SCRIPT FOR RUNNING A DOD EXPERIMENT
3
47
3.B. MATLAB SCRIPT FOR RUNNING A DOD EXPERIMENTThe following MATLAB script was used to run the droplet on-demand experiments inan automated fashion by controlling the pressure input to the pressure pump throughMFCS:
[HandleNumber SerialNumber] = mfcs_init;AlphaValue = 5; % this is for the PID, according to fluigent
% this is already the optimal value and shouldnt be changed
fid = fopen( 'MatlabCrashReport.txt', 'wt' );
% Beginning of user defined variables% Please adjust and change these to match a steady state condition in% Maesflo(MFCS Fluigent)p_c = 50; % mbar; Equilibrium pressure for Continous phasep_d = 26; % mbar; Equilibrium pressure for Dispersed phase
deltap_d_form = 20; % mbar; pulse strength for Dispersed phasedeltap_c_form = 3; % mbar; pulse strength for Continuous phasedeltat_form = 0.2; % seconds; pulse durationdeltat_pause = 16; % seconds; Pause durationdeltap_c_release = 12; % mbar; release pressure strength for CPdeltap_d_release = 5; % mbar; release pressure strength for DPdeltat_release = 5; % seconds; duration of transport of dropletdeltat_cycle = 60; % seconds; Cycle time between two consecutive
% droplet formation cycles
zerotime = 4; % seconds; ensureing a zero state before pulsing% and before waiting for next DoD cycle
droplets = 50; % Number of droplet on demand generation cycles% End of user defined variables
%Beginning of the DoD script
for i = 1:droplets
%STEP-1 : Initialization of the pump. Setting pressures of dispersed% and continuous phase at equilibrium pressure values.disp('Starting new droplet routine.');
Chann = 1;PressureValue = p_c;mfcs_set_auto(HandleNumber,PressureValue,Chann,AlphaValue);
Chann = 2;PressureValue = p_d;mfcs_set_auto(HandleNumber,PressureValue,Chann,AlphaValue);
pause(zerotime);
%Step-2 : This is beginning of the droplet creation process where the%dispersed phased is pulse to push the interphase in the nozzle
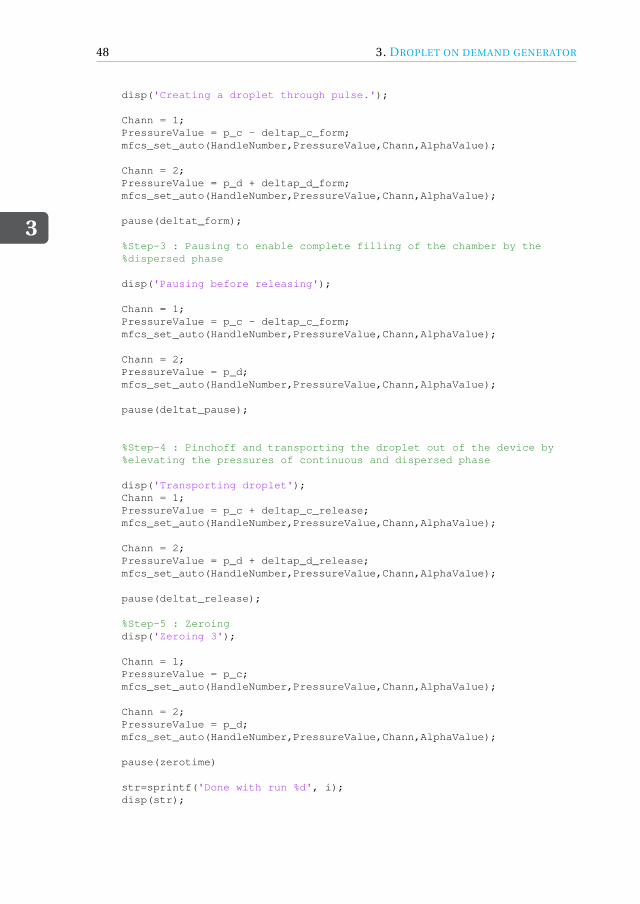
3
48 3. DROPLET ON DEMAND GENERATOR
disp('Creating a droplet through pulse.');
Chann = 1;PressureValue = p_c - deltap_c_form;mfcs_set_auto(HandleNumber,PressureValue,Chann,AlphaValue);
Chann = 2;PressureValue = p_d + deltap_d_form;mfcs_set_auto(HandleNumber,PressureValue,Chann,AlphaValue);
pause(deltat_form);
%Step-3 : Pausing to enable complete filling of the chamber by the%dispersed phase
disp('Pausing before releasing');
Chann = 1;PressureValue = p_c - deltap_c_form;mfcs_set_auto(HandleNumber,PressureValue,Chann,AlphaValue);
Chann = 2;PressureValue = p_d;mfcs_set_auto(HandleNumber,PressureValue,Chann,AlphaValue);
pause(deltat_pause);
%Step-4 : Pinchoff and transporting the droplet out of the device by%elevating the pressures of continuous and dispersed phase
disp('Transporting droplet');Chann = 1;PressureValue = p_c + deltap_c_release;mfcs_set_auto(HandleNumber,PressureValue,Chann,AlphaValue);
Chann = 2;PressureValue = p_d + deltap_d_release;mfcs_set_auto(HandleNumber,PressureValue,Chann,AlphaValue);
pause(deltat_release);
%Step-5 : Zeroingdisp('Zeroing 3');
Chann = 1;PressureValue = p_c;mfcs_set_auto(HandleNumber,PressureValue,Chann,AlphaValue);
Chann = 2;PressureValue = p_d;mfcs_set_auto(HandleNumber,PressureValue,Chann,AlphaValue);
pause(zerotime)
str=sprintf('Done with run %d', i);disp(str);
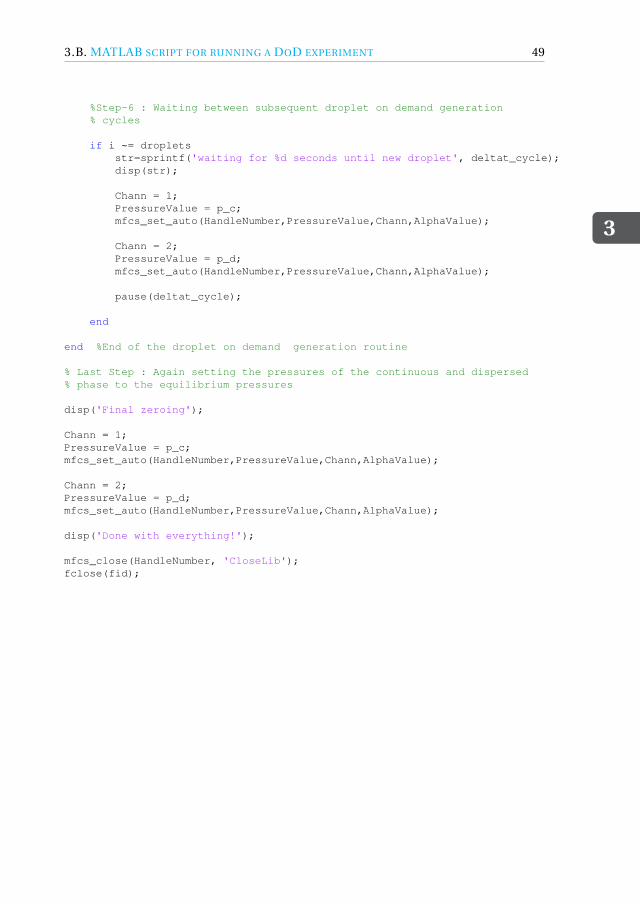
3.B. MATLAB SCRIPT FOR RUNNING A DOD EXPERIMENT
3
49
%Step-6 : Waiting between subsequent droplet on demand generation% cycles
if i ~= dropletsstr=sprintf('waiting for %d seconds until new droplet', deltat_cycle);disp(str);
Chann = 1;PressureValue = p_c;mfcs_set_auto(HandleNumber,PressureValue,Chann,AlphaValue);
Chann = 2;PressureValue = p_d;mfcs_set_auto(HandleNumber,PressureValue,Chann,AlphaValue);
pause(deltat_cycle);
end
end %End of the droplet on demand generation routine
% Last Step : Again setting the pressures of the continuous and dispersed% phase to the equilibrium pressures
disp('Final zeroing');
Chann = 1;PressureValue = p_c;mfcs_set_auto(HandleNumber,PressureValue,Chann,AlphaValue);
Chann = 2;PressureValue = p_d;mfcs_set_auto(HandleNumber,PressureValue,Chann,AlphaValue);
disp('Done with everything!');
mfcs_close(HandleNumber, 'CloseLib');fclose(fid);
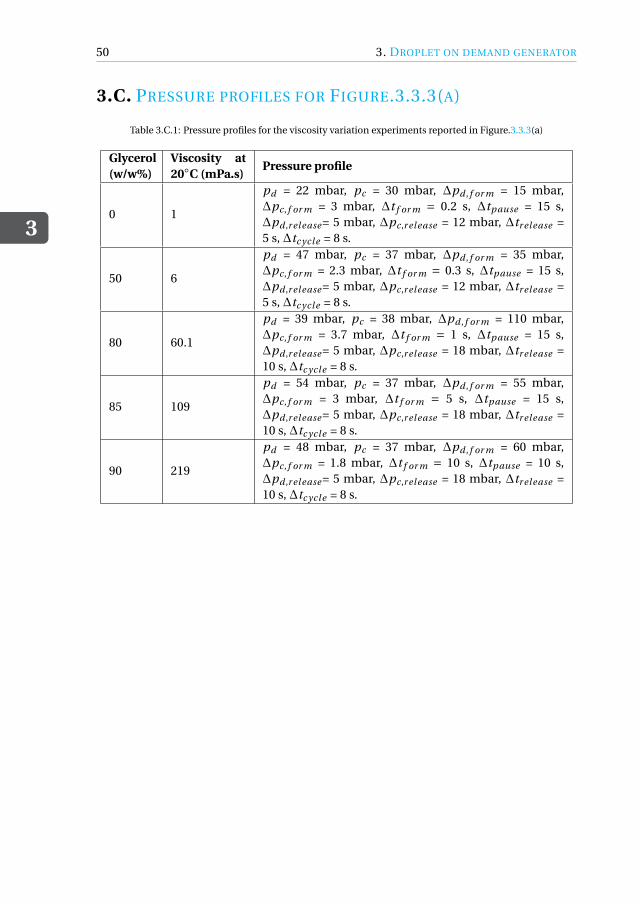
3
50 3. DROPLET ON DEMAND GENERATOR
3.C. PRESSURE PROFILES FOR FIGURE.3.3.3(A)
Table 3.C.1: Pressure profiles for the viscosity variation experiments reported in Figure.3.3.3(a)
Glycerol(w/w%)
Viscosity at20◦C (mPa.s)
Pressure profile
0 1
pd = 22 mbar, pc = 30 mbar, ∆pd , f or m = 15 mbar,∆pc, f or m = 3 mbar, ∆t f or m = 0.2 s, ∆tpause = 15 s,∆pd ,r elease = 5 mbar, ∆pc,r elease = 12 mbar, ∆tr elease =5 s, ∆tc ycle = 8 s.
50 6
pd = 47 mbar, pc = 37 mbar, ∆pd , f or m = 35 mbar,∆pc, f or m = 2.3 mbar, ∆t f or m = 0.3 s, ∆tpause = 15 s,∆pd ,r elease = 5 mbar, ∆pc,r elease = 12 mbar, ∆tr elease =5 s, ∆tc ycle = 8 s.
80 60.1
pd = 39 mbar, pc = 38 mbar, ∆pd , f or m = 110 mbar,∆pc, f or m = 3.7 mbar, ∆t f or m = 1 s, ∆tpause = 15 s,∆pd ,r elease = 5 mbar, ∆pc,r elease = 18 mbar, ∆tr elease =10 s, ∆tc ycle = 8 s.
85 109
pd = 54 mbar, pc = 37 mbar, ∆pd , f or m = 55 mbar,∆pc, f or m = 3 mbar, ∆t f or m = 5 s, ∆tpause = 15 s,∆pd ,r elease = 5 mbar, ∆pc,r elease = 18 mbar, ∆tr elease =10 s, ∆tc ycle = 8 s.
90 219
pd = 48 mbar, pc = 37 mbar, ∆pd , f or m = 60 mbar,∆pc, f or m = 1.8 mbar, ∆t f or m = 10 s, ∆tpause = 10 s,∆pd ,r elease = 5 mbar, ∆pc,r elease = 18 mbar, ∆tr elease =10 s, ∆tc ycle = 8 s.
3.D. DROPLET ON DEMAND MOVIES
3
51
3.D. DROPLET ON DEMAND MOVIES
Figure 3.D.1: Movie illustrating droplet on demand generation for variation of pulse strength reported in Fig-ure.3.3.1(a). To see the movie scan the QR code or click here.
Figure 3.D.2: Movie illustrating droplet on demand generation for variation of pulse duration reported in Fig-ure.3.3.1(c). To see the movie scan the QR code or click here.
3
52 3. DROPLET ON DEMAND GENERATOR
Figure 3.D.3: Movie illustrating droplet on demand generation for partial wetting system reported in Fig-ure.3.3.3(c). To see the movie scan the QR code or click here.
Figure 3.D.4: Movie illustrating scale out to 64 parallel droplet on-demand generators reported in Figure.3.3.5.To see the movie scan the QR code or click here.
REFERENCES
3
53
REFERENCES[1] E. Brouzes, M. Medkova, N. Savenelli, D. Marran, M. Twardowski, J. B. Hutchison,
J. M. Rothberg, D. R. Link, N. Perrimon, and M. L. Samuels, “Droplet microfluidictechnology for single-cell high-throughput screening,” Proceedings of the NationalAcademy of Sciences, vol. 106, no. 34, pp. 14195–14200, 2009.
[2] J. J. Agresti, E. Antipov, A. R. Abate, K. Ahn, A. C. Rowat, J.-C. Baret, M. Marquez,A. M. Klibanov, A. D. Griffiths, and D. A. Weitz, “Ultrahigh-throughput screeningin drop-based microfluidics for directed evolution,” Proceedings of the NationalAcademy of Sciences, vol. 107, no. 9, pp. 4004–4009, 2010.
[3] B. L. Wang, A. Ghaderi, H. Zhou, J. Agresti, D. A. Weitz, G. R. Fink, andG. Stephanopoulos, “Microfluidic high-throughput culturing of single cells for se-lection based on extracellular metabolite production or consumption,” NatureBiotechnology, vol. 32, no. 5, p. 473, 2014.
[4] T. Beneyton, I. P. M. Wijaya, P. Postros, M. Najah, P. Leblond, A. Couvent, E. Mayot,A. D. Griffiths, and A. Drevelle, “High-throughput screening of filamentous fungi us-ing nanoliter-range droplet-based microfluidics,” Scientific reports, vol. 6, p. 27223,2016.
[5] M. Huang, Y. Bai, S. L. Sjostrom, B. M. Hallström, Z. Liu, D. Petranovic, M. Uhlén,H. N. Joensson, H. Andersson-Svahn, and J. Nielsen, “Microfluidic screening andwhole-genome sequencing identifies mutations associated with improved proteinsecretion by yeast,” Proceedings of the National Academy of Sciences, vol. 112, no. 34,pp. E4689–E4696, 2015.
[6] M. Courtney, X. Chen, S. Chan, T. Mohamed, P. P. Rao, and C. L. Ren, “Dropletmicrofluidic system with on-demand trapping and releasing of droplet for drugscreening applications,” Analytical chemistry, vol. 89, no. 1, pp. 910–915, 2016.
[7] K. Churski, T. S. Kaminski, S. Jakiela, W. Kamysz, W. Baranska-Rybak, D. B. Weibel,and P. Garstecki, “Rapid screening of antibiotic toxicity in an automated micro-droplet system,” Lab on a Chip, vol. 12, no. 9, pp. 1629–1637, 2012.
[8] K. Leung, H. Zahn, T. Leaver, K. M. Konwar, N. W. Hanson, A. P. Pagé, C.-C. Lo, P. S.Chain, S. J. Hallam, and C. L. Hansen, “A programmable droplet-based microflu-idic device applied to multiparameter analysis of single microbes and microbialcommunities,” Proceedings of the National Academy of Sciences, vol. 109, no. 20,pp. 7665–7670, 2012.
[9] S. H. Jin, H.-H. Jeong, B. Lee, S. S. Lee, and C.-S. Lee, “A programmable microflu-idic static droplet array for droplet generation, transportation, fusion, storage, andretrieval,” Lab on a Chip, vol. 15, no. 18, pp. 3677–3686, 2015.
[10] M. M. Hansen, L. H. Meijer, E. Spruijt, R. J. Maas, M. V. Rosquelles, J. Groen, H. A.Heus, and W. T. Huck, “Macromolecular crowding creates heterogeneous environ-ments of gene expression in picolitre droplets,” Nature nanotechnology, vol. 11,no. 2, pp. 191–197, 2016.
3
54 REFERENCES
[11] F. Fanalista, A. Birnie, R. Maan, F. Burla, K. Charles, G. Pawlik, S. Deshpande, G. H.Koenderink, M. Dogterom, and C. Dekker, “Shape and size control of artificial cellsfor bottom-up biology,” ACS nano, vol. 13, no. 5, pp. 5439–5450, 2019.
[12] L.-Y. Chu, A. S. Utada, R. K. Shah, J.-W. Kim, and D. A. Weitz, “Controllable monodis-perse multiple emulsions,” Angewandte Chemie International Edition, vol. 46,no. 47, pp. 8970–8974, 2007.
[13] L. Adams, T. E. Kodger, S.-H. Kim, H. C. Shum, T. Franke, and D. A. Weitz, “Singlestep emulsification for the generation of multi-component double emulsions,” SoftMatter, vol. 8, no. 41, pp. 10719–10724, 2012.
[14] S. Mytnyk, I. Ziemecka, A. G. Olive, J. W. M. van der Meer, K. A. Totlani, S. Oldenhof,M. T. Kreutzer, V. van Steijn, and J. H. van Esch, “Microcapsules with a permeablehydrogel shell and an aqueous core continuously produced in a 3d microdevice byall-aqueous microfluidics,” RSC Advances, vol. 7, no. 19, pp. 11331–11337, 2017.
[15] F. He, M.-J. Zhang, W. Wang, Q.-W. Cai, Y.-Y. Su, Z. Liu, Y. Faraj, X.-J. Ju, R. Xie, and L.-Y. Chu, “Designable polymeric microparticles from droplet microfluidics for con-trolled drug release,” Advanced Materials Technologies, p. 1800687, 2019.
[16] A. D. Griffiths and D. S. Tawfik, “Miniaturising the laboratory in emulsion droplets,”Trends in biotechnology, vol. 24, no. 9, pp. 395–402, 2006.
[17] B. Kintses, L. D. van Vliet, S. R. Devenish, and F. Hollfelder, “Microfluidic droplets:new integrated workflows for biological experiments,” Current opinion in chemicalbiology, vol. 14, no. 5, pp. 548–555, 2010.
[18] S. L. Anna and H. C. Mayer, “Microscale tipstreaming in a microfluidic flow focusingdevice,” Physics of Fluids, vol. 18, no. 12, p. 121512, 2006.
[19] P. Garstecki, M. J. Fuerstman, H. A. Stone, and G. M. Whitesides, “Formationof droplets and bubbles in a microfluidic t-junction—scaling and mechanism ofbreak-up,” Lab on a Chip, vol. 6, no. 3, pp. 437–446, 2006.
[20] P. M. Korczyk, V. van Steijn, S. Blonski, D. Zaremba, D. A. Beattie, and P. Garstecki,“Accounting for corner flow unifies the understanding of droplet formation in mi-crofluidic channels,” Nature Communications, vol. 10, no. 1, p. 2528, 2019.
[21] P. Abbyad, R. Dangla, A. Alexandrou, and C. N. Baroud, “Rails and anchors: guid-ing and trapping droplet microreactors in two dimensions,” Lab on a Chip, vol. 11,no. 5, pp. 813–821, 2011.
[22] A. R. Abate, T. Hung, P. Mary, J. J. Agresti, and D. A. Weitz, “High-throughput injec-tion with microfluidics using picoinjectors,” Proceedings of the National Academyof Sciences, vol. 107, no. 45, pp. 19163–19166, 2010.
[23] X. Niu, F. Gielen, J. B. Edel, and A. J. Demello, “A microdroplet dilutor for high-throughput screening,” Nature Chemistry, vol. 3, no. 6, p. 437, 2011.
REFERENCES
3
55
[24] I. Akartuna, D. M. Aubrecht, T. E. Kodger, and D. A. Weitz, “Chemically inducedcoalescence in droplet-based microfluidics,” Lab on a Chip, vol. 15, no. 4, pp. 1140–1144, 2015.
[25] D. Link, S. L. Anna, D. Weitz, and H. A. Stone, “Geometrically mediated breakup ofdrops in microfluidic devices,” Physical review letters, vol. 92, no. 5, p. 054503, 2004.
[26] J. Pan, A. L. Stephenson, E. Kazamia, W. T. Huck, J. S. Dennis, A. G. Smith, andC. Abell, “Quantitative tracking of the growth of individual algal cells in micro-droplet compartments,” Integrative Biology, vol. 3, no. 10, pp. 1043–1051, 2011.
[27] C. H. Schmitz, A. C. Rowat, S. Köster, and D. A. Weitz, “Dropspots: a picoliter arrayin a microfluidic device,” Lab on a Chip, vol. 9, no. 1, pp. 44–49, 2009.
[28] A. Dewan, J. Kim, R. H. McLean, S. A. Vanapalli, and M. N. Karim, “Growth kineticsof microalgae in microfluidic static droplet arrays,” Biotechnology and Bioengineer-ing, vol. 109, no. 12, pp. 2987–2996, 2012.
[29] N. Shembekar, C. Chaipan, R. Utharala, and C. A. Merten, “Droplet-based microflu-idics in drug discovery, transcriptomics and high-throughput molecular genetics,”Lab on a Chip, vol. 16, no. 8, pp. 1314–1331, 2016.
[30] L. Mazutis, J. Gilbert, W. L. Ung, D. A. Weitz, A. D. Griffiths, and J. A. Heyman,“Single-cell analysis and sorting using droplet-based microfluidics,” Nature Proto-cols, vol. 8, no. 5, p. 870, 2013.
[31] T. S. Kaminski, O. Scheler, and P. Garstecki, “Droplet microfluidics for microbiology:techniques, applications and challenges,” Lab on a Chip, vol. 16, no. 12, pp. 2168–2187, 2016.
[32] S. Jakiela, T. S. Kaminski, O. Cybulski, D. B. Weibel, and P. Garstecki, “Bacterialgrowth and adaptation in microdroplet chemostats,” Angewandte Chemie Interna-tional Edition, vol. 52, no. 34, pp. 8908–8911, 2013.
[33] H.-H. Jeong, S. H. Jin, B. J. Lee, T. Kim, and C.-S. Lee, “Microfluidic static dropletarray for analyzing microbial communication on a population gradient,” Lab on aChip, vol. 15, no. 3, pp. 889–899, 2015.
[34] H.-H. Jeong, B. Lee, S. H. Jin, S.-G. Jeong, and C.-S. Lee, “A highly addressable staticdroplet array enabling digital control of a single droplet at pico-volume resolution,”Lab on a Chip, vol. 16, no. 9, pp. 1698–1707, 2016.
[35] M. Sesen, T. Alan, and A. Neild, “Droplet control technologies for microfluidic highthroughput screening (µhts),” Lab on a Chip, vol. 17, no. 14, pp. 2372–2394, 2017.
[36] J. Xu and D. Attinger, “Drop on demand in a microfluidic chip,” Journal of Microme-chanics and Microengineering, vol. 18, no. 6, p. 065020, 2008.
[37] K. Churski, P. Korczyk, and P. Garstecki, “High-throughput automated droplet mi-crofluidic system for screening of reaction conditions,” Lab on a Chip, vol. 10, no. 7,pp. 816–818, 2010.
3
56 REFERENCES
[38] H. Zhou and S. Yao, “A facile on-demand droplet microfluidic system for lab-on-a-chip applications,” microfluidics and nanofluidics, vol. 16, no. 4, pp. 667–675, 2014.
[39] Z. Z. Chong, S. H. Tan, A. M. Gañán-Calvo, S. B. Tor, N. H. Loh, and N.-T. Nguyen,“Active droplet generation in microfluidics,” Lab on a Chip, vol. 16, no. 1, pp. 35–58,2016.
[40] P. Zhu and L. Wang, “Passive and active droplet generation with microfluidics: areview,” Lab on a Chip, vol. 17, no. 1, pp. 34–75, 2017.
[41] J. Guzowski, P. M. Korczyk, S. Jakiela, and P. Garstecki, “Automated high-throughputgeneration of droplets,” Lab on a Chip, vol. 11, no. 21, pp. 3593–3595, 2011.
[42] U. Tangen, A. Sharma, P. Wagler, and J. S. McCaskill, “On demand nanoliter-scalemicrofluidic droplet generation, injection, and mixing using a passive microfluidicdevice,” Biomicrofluidics, vol. 9, no. 1, p. 014119, 2015.
[43] G. T. Vladisavljevic, N. Khalid, M. A. Neves, T. Kuroiwa, M. Nakajima, K. Uemura,S. Ichikawa, and I. Kobayashi, “Industrial lab-on-a-chip: Design, applications andscale-up for drug discovery and delivery,” Advanced drug delivery reviews, vol. 65,no. 11-12, pp. 1626–1663, 2013.
[44] T. Kawakatsu, Y. Kikuchi, and M. Nakajima, “Regular-sized cell creation in mi-crochannel emulsification by visual microprocessing method,” Journal of the Amer-ican Oil Chemists’ Society, vol. 74, no. 3, pp. 317–321, 1997.
[45] M. Sun, S. S. Bithi, and S. A. Vanapalli, “Microfluidic static droplet arrays with tune-able gradients in material composition,” Lab on a Chip, vol. 11, no. 23, pp. 3949–3952, 2011.
[46] P. M. Korczyk, L. Derzsi, S. Jakieła, and P. Garstecki, “Microfluidic traps for hard-wired operations on droplets,” Lab on a Chip, vol. 13, no. 20, pp. 4096–4102, 2013.
[47] V. Van Steijn, P. M. Korczyk, L. Derzsi, A. R. Abate, D. A. Weitz, and P. Garstecki,“Block-and-break generation of microdroplets with fixed volume,” Biomicroflu-idics, vol. 7, no. 2, p. 024108, 2013.
[48] R. Dangla, S. C. Kayi, and C. N. Baroud, “Droplet microfluidics driven by gradientsof confinement,” Proceedings of the National Academy of Sciences, vol. 110, no. 3,pp. 853–858, 2013.
[49] E. Amstad, M. Chemama, M. Eggersdorfer, L. R. Arriaga, M. P. Brenner, and D. A.Weitz, “Robust scalable high throughput production of monodisperse drops,” Labon a Chip, vol. 16, no. 21, pp. 4163–4172, 2016.
[50] W. Postek, T. Kaminski, and P. Garstecki, “A precise and accurate microfluidicdroplet dilutor,” Analyst, vol. 142, no. 16, pp. 2901–2911, 2017.
[51] A. M. Nightingale, G. W. Evans, P. Xu, B. J. Kim, S.-u. Hassan, and X. Niu, “Phasedperistaltic micropumping for continuous sampling and hardcoded droplet genera-tion,” Lab on a Chip, vol. 17, no. 6, pp. 1149–1157, 2017.
REFERENCES
3
57
[52] W. Du, L. Li, K. P. Nichols, and R. F. Ismagilov, “Slipchip,” Lab on a Chip, vol. 9, no. 16,pp. 2286–2292, 2009.
[53] F. Gielen, L. van Vliet, B. T. Koprowski, S. R. Devenish, M. Fischlechner, J. B. Edel,X. Niu, A. J. deMello, and F. Hollfelder, “A fully unsupervised compartment-on-demand platform for precise nanoliter assays of time-dependent steady-state en-zyme kinetics and inhibition,” Analytical chemistry, vol. 85, no. 9, pp. 4761–4769,2013.
[54] M. Yamada and M. Seki, “Nanoliter-sized liquid dispenser array for multiple bio-chemical analysis in microfluidic devices,” Analytical chemistry, vol. 76, no. 4,pp. 895–899, 2004.
[55] D. C. Duffy, J. C. McDonald, O. J. Schueller, and G. M. Whitesides, “Rapid proto-typing of microfluidic systems in poly (dimethylsiloxane),” Analytical chemistry,vol. 70, no. 23, pp. 4974–4984, 1998.
[56] M. Musterd, V. van Steijn, C. R. Kleijn, and M. T. Kreutzer, “Calculating the volumeof elongated bubbles and droplets in microchannels from a top view image,” RSCadvances, vol. 5, no. 21, pp. 16042–16049, 2015.
[57] G. Tetradis-Meris, D. Rossetti, C. Pulido de Torres, R. Cao, G. Lian, and R. Janes,“Novel parallel integration of microfluidic device network for emulsion formation,”Industrial & engineering chemistry research, vol. 48, no. 19, pp. 8881–8889, 2009.
[58] M. B. Romanowsky, A. R. Abate, A. Rotem, C. Holtze, and D. A. Weitz, “High through-put production of single core double emulsions in a parallelized microfluidic de-vice,” Lab on a Chip, vol. 12, no. 4, pp. 802–807, 2012.
[59] S. Yadavali, H.-H. Jeong, D. Lee, and D. Issadore, “Silicon and glass very large scalemicrofluidic droplet integration for terascale generation of polymer microparti-cles,” Nature communications, vol. 9, no. 1, p. 1222, 2018.

4FED-BATCH DROPLET
NANOBIOREACTOR
Fed-batch droplet nanobioreactor for controlled growth ofCyberlindnera (Pichia) jadinii: A proof-of-concept demonstration
We present a droplet-based nanobioreactor that enables studying microorganisms undernutrient-limited growth conditions through controlled supply of fresh nutrients over thecourse of a cultivation experiment. A key challenge addressed in this work is the im-plementation of the required non-steady droplet operations on chip to establish a semi-continuous nutrient supply, while keeping the chip and its operation as simple as possible.We start by detailing the working principle and demonstrating the ability to feed nutri-ents to a droplet immobilised on the chip at rates required for unconstrained exponentialgrowth as well as constrained linear growth. We then demonstrate the ability to study mi-croorganisms under nutrient-controlled growth conditions using the yeast Cyberlindnera(Pichia) jadinii as the model microorganism, with the cell growth rate controlled throughthe glucose concentration in the nutrient droplets. The obtained growth curves agree wellwith a simple kinetic cell growth model, which highlights its relevance in the design andinterpretation of nutrient-controlled cell studies. Given the relative ease of operation andthe large demand for controlled growth experiments, we expect that the presented droplet-based nanobioreactor provides a solid platform technology for further development anduse in the field of bioprocess development and beyond.
This chapter is published as: K. Totlani, Y. Wang, M. M. Bisschops, T. de Riese, M. T. Kreutzer, W. M. van Gulik,and V. van Steijn. Fed-batch droplet nanobioreactor for controlled growth of Cyberlindnera (Pichia) jadinii: Aproof-of-concept demonstration, Adv. Mater. Technol., 7, 2100083
59
4
60 4. FED-BATCH DROPLET NANOBIOREACTOR
4.1. INTRODUCTION
Microorganisms such as yeast and bacteria have the ability to naturally convert raw feed-stock into useful products but often in amounts insufficient for industrial scale pro-duction. Improvement of the microorganism’s product yield on feedstock is possibleby targeted genetic modification, which requires a solid understanding of the speciesmetabolism and genetics. Alternatively, genetic modifications can be introduced ran-domly such that the chance that a resulting mutant performs better than the original oneis small. Consequently, many mutants need to be created and subsequently screened inorder to identify the best performing ones[1]. Given the large number of experiments, itis common practice to grow and study all the different mutants in individual microliter-sized wells on microtiter plates. While this allows for parallel screening in an automatedfashion using pipetting robots and plate readers, conventional microtiter plates lack theability to feed nutrients and control pH by base or acid addition. It is indeed challeng-ing to feed liquids at flow rates in the nanoliter per hour range to all the individual wellsof a microtiter plate and to do so accurately. Therefore, screening of mutants is com-monly performed under batch conditions with all feedstock present from the start andno further control over feedstock concentration and pH. In contrast, more than 80 % ofthe processes in industrial biotechnology are operated under so called fed-batch condi-tions with control over feedstock concentration and pH[2, 3]. This incompatibility be-tween the physiological conditions during screening and industrial operation not onlyleads to selection of false positives which fail to generate competitive yields at industrialscale, but also fails to identify the best mutants for fed-batch conditions[4–6]. The ef-fectiveness of screening hence greatly benefits from a technology that enables growingand studying a large number of microorganisms under precisely controlled conditionsrepresentative of industrial bioreactors. Besides screening of mutants, optimization ofprocess conditions, a second important aspect in bioprocess development, also bene-fits from such a technology[7]. Although there has been progress in recent years, thereremains both need and opportunity to cost-effectively and with fidelity miniaturise fer-mentation to screen under fed-batch conditions.
Several strategies have been developed to study microorganisms under controlledgrowth conditions. One strategy is to improve existing platforms such as microtiter platesand shake flasks. Jeude and co-workers[8], for example, implemented a continuous sup-ply of glucose by adding glucose-containing silicon discs to the shake flasks. A simi-lar slow diffusive release strategy has been demonstrated in microtiter plates[5, 9, 10].Scheidle and co-workers[5] used this strategy to compare the performance of 220 differ-ent mutants grown under batch conditions to that grown under fed-batch conditions,showing that best performers are not the same. Apart from slow release approaches, mi-crochannels controlled through pneumatic valves have been added to or incorporatedin microtiter plates for nutrient supply and pH regulation[11–13]. A second strategy is tointegrate the wells and fluidic supply lines all in a single microfluidic device[14–19], seethe comprehensive reviews by Grunberger’ s group[20–22]. A third strategy is to growand study cells by compartmentalising them inside aqueous microdroplets instead ofinside solid wells[23, 24]. This strategy may prevent issues arising in single phase mi-crofluidic devices such as cross-contamination between the different wells due to lackof complete isolation and biofilm formation at the solid walls, but comes with its own
4.2. RESULTS AND DISCUSSION
4
61
challenges[25–27]. Microdroplets have been successfully used for screening of mutantswhere millions of droplets were encapsulated with cells and growth media at once, incu-bated off chip under batch conditions and reinjected in a separate chip to analyse andsort the best performing ones[28–30]. An outstanding challenge is to semi-continuouslyadd nutrients to cell-containing droplets to perform screening under continuous or fed-batch conditions[27, 29].
Droplet-based assays that enable studies under controlled cell growth through con-trolled nutrient supply are scarce. Programmable devices have been developed[31–33]that could facilitate controlled microbial growth inside droplets that are spatially fixedon a chip, allowing sequential addition of nutrients by on-demand formation of nutrient-containing droplets, transport to the cell-containing droplets and induction of coales-cence. Jakiela and co-workers[34] as well as Jian and co-workers[35] in separate studieshave used an alternative approach in which cell-containing droplets were circulated onchip and periodically flown through part of the circuit designed to split off part of thedroplet and merge it with a nutrient droplet. While these studies successfully demon-strated cell growth studies under (semi) continuous conditions, the complexity of thedevices and their use may prevent widespread adoption of this technology by the mi-crofluidics community. Integrating long-term culturing in a controlled environmentwith technology accessible to non-experts is therefore identified as one of the great out-standing challenges in the field[27]. In this work, we address this challenge by simplify-ing the nutrient supply strategy as also very recently demonstrated by Baroud’s lab in thecontext of 3D spheroid formation[36], eliminating the need for (on/off-chip) valves andoptical feedback loops and allowing operation based on a single commercially availablepressure pump.
We start this chapter by first describing the working principle of our fed-batch dropletnanobioreactor, illustrating the various fluidic operations involved, including the capa-bility to supply nutrients at controlled rates. After a verification experiment in which wedemonstrate that cell growth itself is not influenced by the fluidic operations, we demon-strate the growth of cells under nutrient-controlled fed-batch conditions. The experi-mentally obtained cell growth curves are subsequently compared with a simple kineticcell growth model. Good agreement shows that the model is not only valuable in theinterpretation of the results, but also in the experimental design of nutrient-controlledgrowth experiments (e.g. selection of feeding frequencies and nutrient concentrations).
4.2. RESULTS AND DISCUSSION
4.2.1. FED-BATCH DROPLET NANOBIOREACTOR : CONCEPT
The working principle of our fed-batch droplet nanobioreactor is illustrated in Figure.4.2.1.First, a cell-containing droplet is generated and trapped inside a cup-shaped trap (1).Being spatially fixed on the chip allows for easy monitoring of the growth of microorgan-isms. At will, a nutrient droplet is generated and flown into the trap (2). The challengeto coalesce the surfactant-stabilised interfaces is resolved by temporarily de-stabilizingthe interfaces by flowing a solvent around the droplets in which the surfactant is lesssoluble (3). After supplying fresh nutrients, cells are incubated and monitored until thenext nutrient supply (4). This mode of operation, in which the cells are cultured under
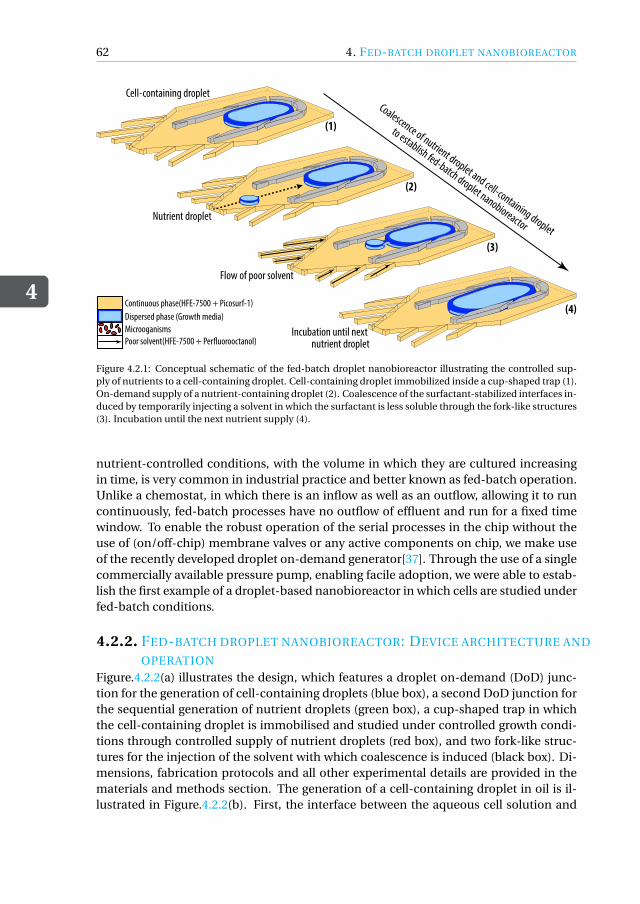
4
62 4. FED-BATCH DROPLET NANOBIOREACTOR
(1)
(3)
(2)
(4)Continuous phase(HFE-7500 + Picosurf-1)Dispersed phase (Growth media)MicrooganismsPoor solvent(HFE-7500 + Per�uorooctanol)
Cell-containing droplet
Nutrient droplet
Flow of poor solvent
Incubation until next nutrient droplet
Coalescence of nutrient droplet and cell-containing droplet
to establish fed-batch droplet nanobioreactor
Figure 4.2.1: Conceptual schematic of the fed-batch droplet nanobioreactor illustrating the controlled sup-ply of nutrients to a cell-containing droplet. Cell-containing droplet immobilized inside a cup-shaped trap (1).On-demand supply of a nutrient-containing droplet (2). Coalescence of the surfactant-stabilized interfaces in-duced by temporarily injecting a solvent in which the surfactant is less soluble through the fork-like structures(3). Incubation until the next nutrient supply (4).
nutrient-controlled conditions, with the volume in which they are cultured increasingin time, is very common in industrial practice and better known as fed-batch operation.Unlike a chemostat, in which there is an inflow as well as an outflow, allowing it to runcontinuously, fed-batch processes have no outflow of effluent and run for a fixed timewindow. To enable the robust operation of the serial processes in the chip without theuse of (on/off-chip) membrane valves or any active components on chip, we make useof the recently developed droplet on-demand generator[37]. Through the use of a singlecommercially available pressure pump, enabling facile adoption, we were able to estab-lish the first example of a droplet-based nanobioreactor in which cells are studied underfed-batch conditions.
4.2.2. FED-BATCH DROPLET NANOBIOREACTOR: DEVICE ARCHITECTURE AND
OPERATION
Figure.4.2.2(a) illustrates the design, which features a droplet on-demand (DoD) junc-tion for the generation of cell-containing droplets (blue box), a second DoD junction forthe sequential generation of nutrient droplets (green box), a cup-shaped trap in whichthe cell-containing droplet is immobilised and studied under controlled growth condi-tions through controlled supply of nutrient droplets (red box), and two fork-like struc-tures for the injection of the solvent with which coalescence is induced (black box). Di-mensions, fabrication protocols and all other experimental details are provided in thematerials and methods section. The generation of a cell-containing droplet in oil is il-lustrated in Figure.4.2.2(b). First, the interface between the aqueous cell solution and
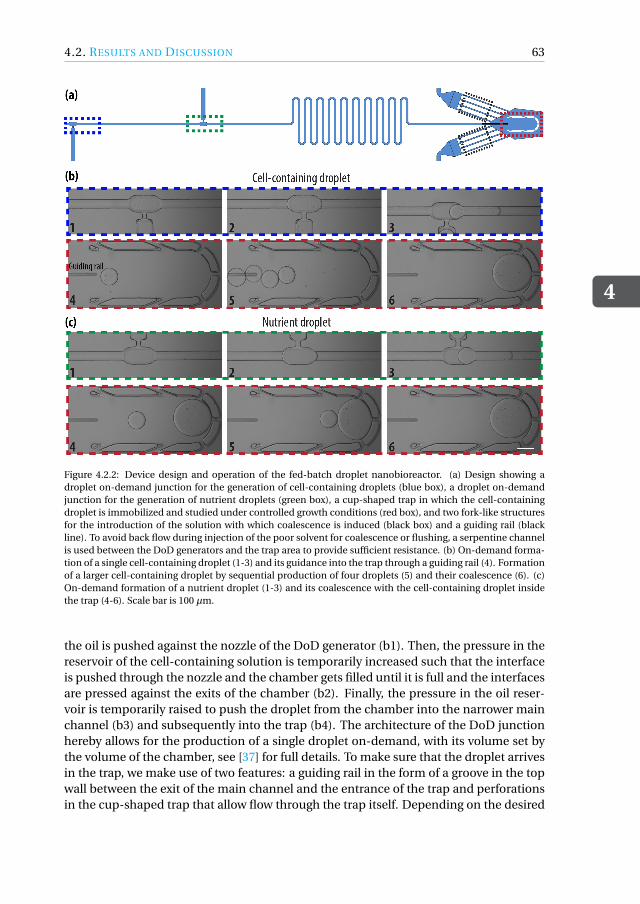
4.2. RESULTS AND DISCUSSION
4
63
Figure 4.2.2: Device design and operation of the fed-batch droplet nanobioreactor. (a) Design showing adroplet on-demand junction for the generation of cell-containing droplets (blue box), a droplet on-demandjunction for the generation of nutrient droplets (green box), a cup-shaped trap in which the cell-containingdroplet is immobilized and studied under controlled growth conditions (red box), and two fork-like structuresfor the introduction of the solution with which coalescence is induced (black box) and a guiding rail (blackline). To avoid back flow during injection of the poor solvent for coalescence or flushing, a serpentine channelis used between the DoD generators and the trap area to provide sufficient resistance. (b) On-demand forma-tion of a single cell-containing droplet (1-3) and its guidance into the trap through a guiding rail (4). Formationof a larger cell-containing droplet by sequential production of four droplets (5) and their coalescence (6). (c)On-demand formation of a nutrient droplet (1-3) and its coalescence with the cell-containing droplet insidethe trap (4-6). Scale bar is 100 µm.
the oil is pushed against the nozzle of the DoD generator (b1). Then, the pressure in thereservoir of the cell-containing solution is temporarily increased such that the interfaceis pushed through the nozzle and the chamber gets filled until it is full and the interfacesare pressed against the exits of the chamber (b2). Finally, the pressure in the oil reser-voir is temporarily raised to push the droplet from the chamber into the narrower mainchannel (b3) and subsequently into the trap (b4). The architecture of the DoD junctionhereby allows for the production of a single droplet on-demand, with its volume set bythe volume of the chamber, see [37] for full details. To make sure that the droplet arrivesin the trap, we make use of two features: a guiding rail in the form of a groove in the topwall between the exit of the main channel and the entrance of the trap and perforationsin the cup-shaped trap that allow flow through the trap itself. Depending on the desired
4
64 4. FED-BATCH DROPLET NANOBIOREACTOR
volume at the start of cultivation, multiple cell-containing droplets can be sequentiallygenerated and pushed into the trap (b5). Coalescence of these droplets is achieved bytemporarily raising the pressure in the fluid reservoir that contains a solution in whichthe surfactant is less soluble, which is introduced in the area of the trap through the fork-like structures (b6). Supply of nutrient droplets to the obtained cell-containing dropletfollows a similar protocol, with the nutrients supplied from a separate reservoir and asecond DoD junction as illustrated in Figure.4.2.2(c1-6). For a given DoD geometry and agiven nutrient concentration in the fluid reservoir, controlling the time interval betweensubsequent droplets (denoted as the waiting time (tw )) is the most straightforward con-trol over the nutrient supply rate. After each coalescence event, a residual flow of oil withsurfactant is maintained via the main channel to ensure full wetting of the PDMS wallsby the oil and stability of the cell-containing droplet during its incubation. After incu-bation, the cell-containing droplet can be extracted out of the chip for further analysisby reversing the oil flow which is possible by exchanging the outlet port with the inletport for continuous phase. All operations are performed in an automated fashion usinga MATLAB script that instructs a commercially available pressure pump with predefinedpressure settings, see Section.4.A for script and settings. Using the here introduced ap-proach, microorganisms can be studied under fed-batch conditions with their growthcontrolled through the controlled supply of nutrients.
4.2.3. NUTRIENT FEEDING PROFILES
The most straightforward cultivation method is the batch culture, wherein all nutrientsare supplied at the start of the cultivation and the cells grow exponentially at their max-imum rate until one of the medium components gets depleted. Controlling the supplyof nutrients over the course of a cultivation experiment is important in biotechnologi-cal applications, because in this way the growth rate of the cells can be controlled andthereby also the rate of product formation. Because the relation between the rate ofproduct formation and the growth rate can be different for each microorganism/prod-uct combination, a dedicated feed profile has to be designed to maximise the productformation rate and yield of a fed-batch process. Examples of basic feeding strategies areconstant, linearly increasing and exponentially increasing feed rates, whereby the num-ber of microorganisms increases respectively linearly, quadratically and exponentially.Different feeding strategies can be established in the droplet fed-batch reactor by con-trolling the interval between subsequent nutrient supplies and the amount of nutrientsfed per supply. Here we demonstrate constant and linearly increasing feed profiles. Incase one nutrient-containing reservoir is used in combination with one DoD generatorfor the supply of nutrients, the nutrient concentration and the volume of a single nutri-ent droplet are fixed. Supply at a constant rate is then achieved by adding one nutrientdroplet at a time at a constant time interval. An example of such a constant feed rateexperiment is illustrated in Figure.4.2.3(a), with the time interval equal to 10 mins. Oneway to obtain a linearly increasing feed rate is to linearly decrease the time interval. Al-ternatively, the number of nutrient droplets per supply can be linearly increased, whilekeeping the time interval between the supplies the same. An example of this mode ofoperation is illustrated in Figure.4.2.3(b), with one droplet supplied after 10 mins, twodroplets shortly generated after each other (within 20 s) supplied after 20 mins and so
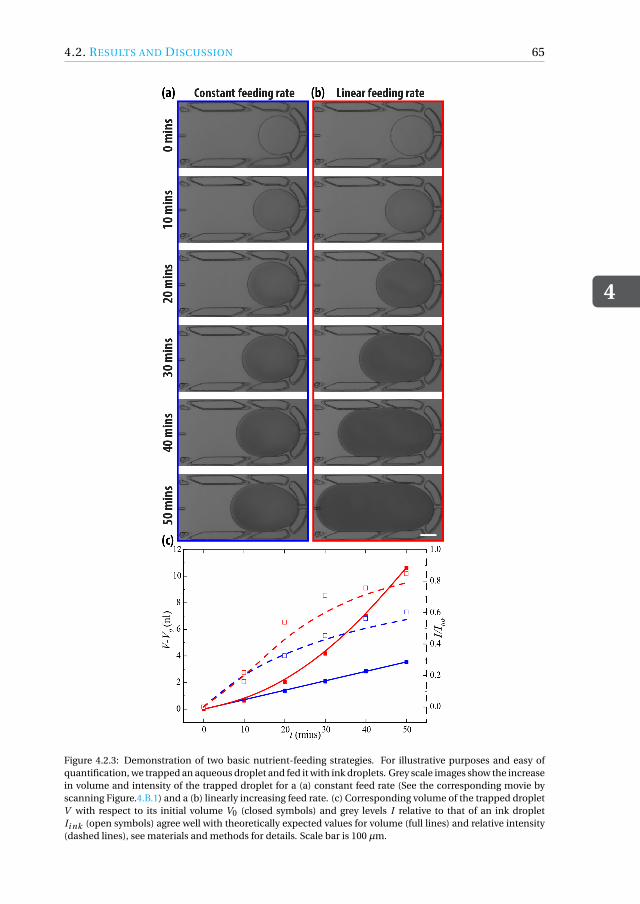
4.2. RESULTS AND DISCUSSION
4
65
Figure 4.2.3: Demonstration of two basic nutrient-feeding strategies. For illustrative purposes and easy ofquantification, we trapped an aqueous droplet and fed it with ink droplets. Grey scale images show the increasein volume and intensity of the trapped droplet for a (a) constant feed rate (See the corresponding movie byscanning Figure.4.B.1) and a (b) linearly increasing feed rate. (c) Corresponding volume of the trapped dropletV with respect to its initial volume V0 (closed symbols) and grey levels I relative to that of an ink dropletIi nk (open symbols) agree well with theoretically expected values for volume (full lines) and relative intensity(dashed lines), see materials and methods for details. Scale bar is 100 µm.
4
66 4. FED-BATCH DROPLET NANOBIOREACTOR
on. The volume of the trapped droplet increases linearly and quadratically for a con-stant and linearly increasing feed rate respectively, as illustrated in Figure.4.2.3(c). Thisincrease agrees well with the expected increase based on the volume of the DoD cham-ber used to produce the droplets (0.71 nl). For illustrative purposes and ease of quantifi-cation, we performed these experiments by trapping an aqueous droplet and feeding itwith ink droplets. This allowed us to straightforwardly verify that the concentration inthe trapped droplet increases as expected through the measurement of the intensity, seeFigure.4.2.3(c). While the experiments presented here illustrate the working principle ofthe droplet nanobioreactor for two basic feeding strategies, we foresee that other, morecomplex, feed profiles are also possible. One limitation in establishing more complexfeeding profiles arises from the frequency with which nutrient droplets can be gener-ated. Two subsequent droplets can be generated within 20 s. In an exponential scheme,in which we with the current setup need to subsequently generate 1, 2, 4, 8, 16, 32, . . .nutrient droplets in each supply cycle, the time it takes for the supply soon becomescomparable to the waiting time between the cycles. Another limitation arises from thevolume of the trap relative to the volume of the chamber of the DoD generator, whichcurrently dictates that 20 nutrient droplets can be fed until the trap is full. Potential im-provements to overcome these two limitations are to incorporate multiple DoD genera-tors connected to reservoirs with different nutrient concentrations, limiting the numberof droplets that need to be generated per supply cycle. Using multiple reservoirs alsoopens up the possibility to supply basic/acidic solutions to control pH or other types ofreagents, for example inhibitors, antibiotics, or even competitive microbial communi-ties.
4.2.4. CONTROLLED GROWTH OF Cyberlindnera (Pichia) jadinii IN FED-BATCH DROPLET NANOBIOREACTOR
After a successful demonstration of the ability to controllably produce and trap a cell-containing droplet and repeatedly supply it with fresh nutrients, we now show that wecan utilise the developed approach to study cells under nutrient-controlled growth con-ditions. The model microorganism we used in this work is the Crabtree negative yeastCyberlindnera (Pichia) jadinii, which was chosen for its relatively simple growth char-acteristics as it does not convert glucose to ethanol under aerobic conditions. Further-more, its growth is severely limited under oxygen limited conditions[38] which allowedus to verify from the growth behaviour whether oxygen limitation would occur. Theexperiments were designed such that glucose is the limiting nutrient with which cellgrowth can be controlled. To eliminate the need for active pH control over the courseof the experiments, urea was used as the nitrogen source in the media. Based on thesechoices, cell growth is primarily controlled through the controlled supply of nutrients.
A typical cell growth experiment starts with overnight precultivation in a shake flaskand harvesting the cells in the exponential growth phase. Cells were washed with freshdefined medium to obtain a cell solution with a given initial glucose concentration CS0.This solution was used to produce a cell-containing droplet, with the initial number ofencapsulated cells (N0) controlled through the washing step and the number of dropletsused to form the cell-containing droplet. In our experiments, we used the protocol il-lustrated in Figure.4.2.2(b) and coalesced four cell-containing droplets of volume Vd
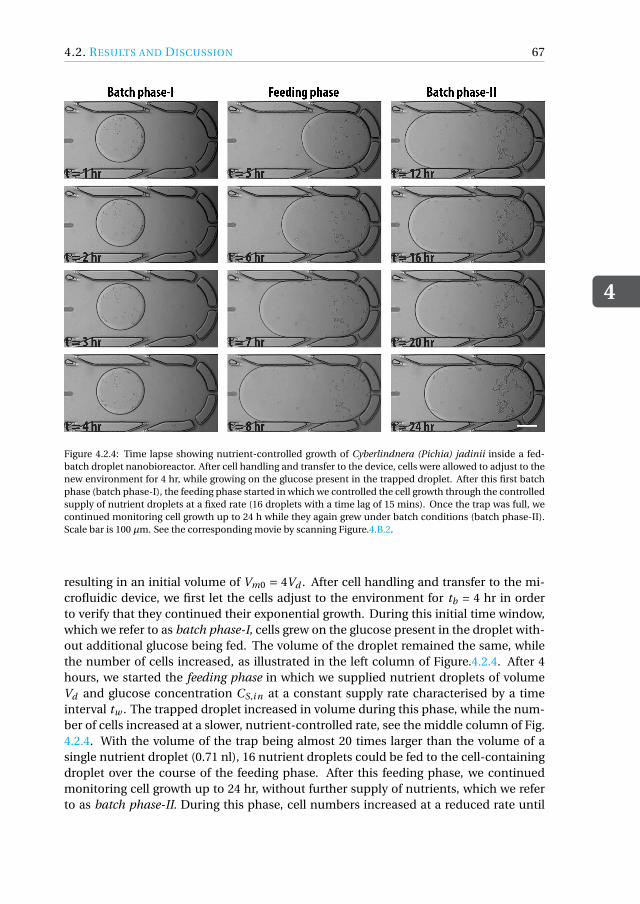
4.2. RESULTS AND DISCUSSION
4
67
Figure 4.2.4: Time lapse showing nutrient-controlled growth of Cyberlindnera (Pichia) jadinii inside a fed-batch droplet nanobioreactor. After cell handling and transfer to the device, cells were allowed to adjust to thenew environment for 4 hr, while growing on the glucose present in the trapped droplet. After this first batchphase (batch phase-I), the feeding phase started in which we controlled the cell growth through the controlledsupply of nutrient droplets at a fixed rate (16 droplets with a time lag of 15 mins). Once the trap was full, wecontinued monitoring cell growth up to 24 h while they again grew under batch conditions (batch phase-II).Scale bar is 100 µm. See the corresponding movie by scanning Figure.4.B.2.
resulting in an initial volume of Vm0 = 4Vd . After cell handling and transfer to the mi-crofluidic device, we first let the cells adjust to the environment for tb = 4 hr in orderto verify that they continued their exponential growth. During this initial time window,which we refer to as batch phase-I, cells grew on the glucose present in the droplet with-out additional glucose being fed. The volume of the droplet remained the same, whilethe number of cells increased, as illustrated in the left column of Figure.4.2.4. After 4hours, we started the feeding phase in which we supplied nutrient droplets of volumeVd and glucose concentration CS,i n at a constant supply rate characterised by a timeinterval tw . The trapped droplet increased in volume during this phase, while the num-ber of cells increased at a slower, nutrient-controlled rate, see the middle column of Fig.4.2.4. With the volume of the trap being almost 20 times larger than the volume of asingle nutrient droplet (0.71 nl), 16 nutrient droplets could be fed to the cell-containingdroplet over the course of the feeding phase. After this feeding phase, we continuedmonitoring cell growth up to 24 hr, without further supply of nutrients, which we referto as batch phase-II. During this phase, cell numbers increased at a reduced rate until
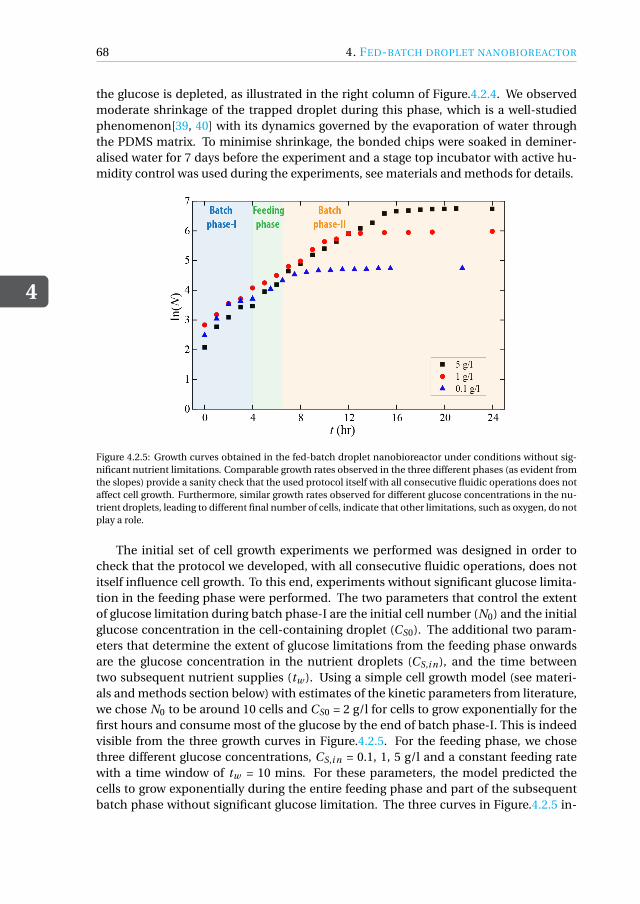
4
68 4. FED-BATCH DROPLET NANOBIOREACTOR
the glucose is depleted, as illustrated in the right column of Figure.4.2.4. We observedmoderate shrinkage of the trapped droplet during this phase, which is a well-studiedphenomenon[39, 40] with its dynamics governed by the evaporation of water throughthe PDMS matrix. To minimise shrinkage, the bonded chips were soaked in deminer-alised water for 7 days before the experiment and a stage top incubator with active hu-midity control was used during the experiments, see materials and methods for details.
Figure 4.2.5: Growth curves obtained in the fed-batch droplet nanobioreactor under conditions without sig-nificant nutrient limitations. Comparable growth rates observed in the three different phases (as evident fromthe slopes) provide a sanity check that the used protocol itself with all consecutive fluidic operations does notaffect cell growth. Furthermore, similar growth rates observed for different glucose concentrations in the nu-trient droplets, leading to different final number of cells, indicate that other limitations, such as oxygen, do notplay a role.
The initial set of cell growth experiments we performed was designed in order tocheck that the protocol we developed, with all consecutive fluidic operations, does notitself influence cell growth. To this end, experiments without significant glucose limita-tion in the feeding phase were performed. The two parameters that control the extentof glucose limitation during batch phase-I are the initial cell number (N0) and the initialglucose concentration in the cell-containing droplet (CS0). The additional two param-eters that determine the extent of glucose limitations from the feeding phase onwardsare the glucose concentration in the nutrient droplets (CS,i n), and the time betweentwo subsequent nutrient supplies (tw ). Using a simple cell growth model (see materi-als and methods section below) with estimates of the kinetic parameters from literature,we chose N0 to be around 10 cells and CS0 = 2 g/l for cells to grow exponentially for thefirst hours and consume most of the glucose by the end of batch phase-I. This is indeedvisible from the three growth curves in Figure.4.2.5. For the feeding phase, we chosethree different glucose concentrations, CS,i n = 0.1, 1, 5 g/l and a constant feeding ratewith a time window of tw = 10 mins. For these parameters, the model predicted thecells to grow exponentially during the entire feeding phase and part of the subsequentbatch phase without significant glucose limitation. The three curves in Figure.4.2.5 in-
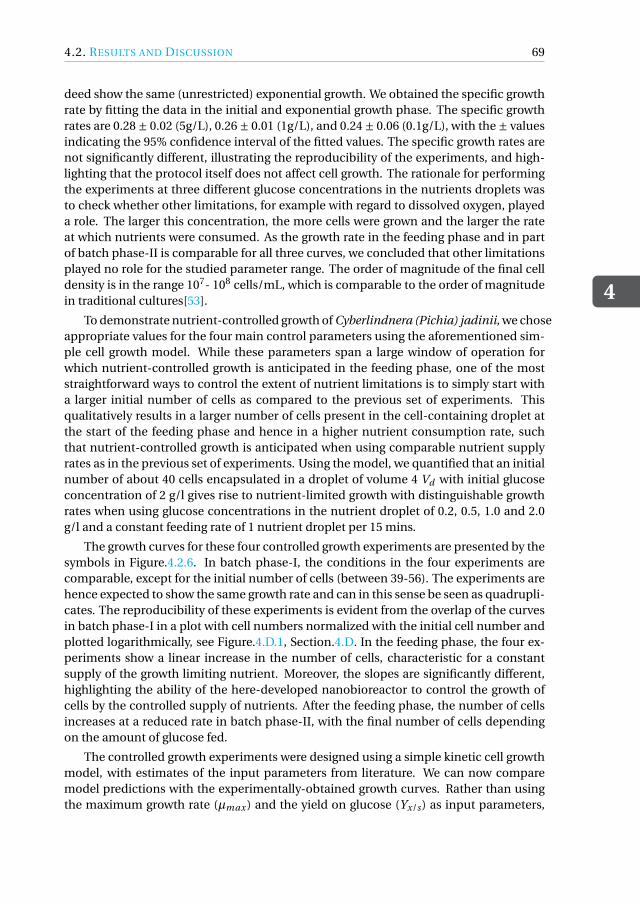
4.2. RESULTS AND DISCUSSION
4
69
deed show the same (unrestricted) exponential growth. We obtained the specific growthrate by fitting the data in the initial and exponential growth phase. The specific growthrates are 0.28 ± 0.02 (5g/L), 0.26 ± 0.01 (1g/L), and 0.24 ± 0.06 (0.1g/L), with the ± valuesindicating the 95% confidence interval of the fitted values. The specific growth rates arenot significantly different, illustrating the reproducibility of the experiments, and high-lighting that the protocol itself does not affect cell growth. The rationale for performingthe experiments at three different glucose concentrations in the nutrients droplets wasto check whether other limitations, for example with regard to dissolved oxygen, playeda role. The larger this concentration, the more cells were grown and the larger the rateat which nutrients were consumed. As the growth rate in the feeding phase and in partof batch phase-II is comparable for all three curves, we concluded that other limitationsplayed no role for the studied parameter range. The order of magnitude of the final celldensity is in the range 107- 108 cells/mL, which is comparable to the order of magnitudein traditional cultures[53].
To demonstrate nutrient-controlled growth of Cyberlindnera (Pichia) jadinii, we choseappropriate values for the four main control parameters using the aforementioned sim-ple cell growth model. While these parameters span a large window of operation forwhich nutrient-controlled growth is anticipated in the feeding phase, one of the moststraightforward ways to control the extent of nutrient limitations is to simply start witha larger initial number of cells as compared to the previous set of experiments. Thisqualitatively results in a larger number of cells present in the cell-containing droplet atthe start of the feeding phase and hence in a higher nutrient consumption rate, suchthat nutrient-controlled growth is anticipated when using comparable nutrient supplyrates as in the previous set of experiments. Using the model, we quantified that an initialnumber of about 40 cells encapsulated in a droplet of volume 4 Vd with initial glucoseconcentration of 2 g/l gives rise to nutrient-limited growth with distinguishable growthrates when using glucose concentrations in the nutrient droplet of 0.2, 0.5, 1.0 and 2.0g/l and a constant feeding rate of 1 nutrient droplet per 15 mins.
The growth curves for these four controlled growth experiments are presented by thesymbols in Figure.4.2.6. In batch phase-I, the conditions in the four experiments arecomparable, except for the initial number of cells (between 39-56). The experiments arehence expected to show the same growth rate and can in this sense be seen as quadrupli-cates. The reproducibility of these experiments is evident from the overlap of the curvesin batch phase-I in a plot with cell numbers normalized with the initial cell number andplotted logarithmically, see Figure.4.D.1, Section.4.D. In the feeding phase, the four ex-periments show a linear increase in the number of cells, characteristic for a constantsupply of the growth limiting nutrient. Moreover, the slopes are significantly different,highlighting the ability of the here-developed nanobioreactor to control the growth ofcells by the controlled supply of nutrients. After the feeding phase, the number of cellsincreases at a reduced rate in batch phase-II, with the final number of cells dependingon the amount of glucose fed.
The controlled growth experiments were designed using a simple kinetic cell growthmodel, with estimates of the input parameters from literature. We can now comparemodel predictions with the experimentally-obtained growth curves. Rather than usingthe maximum growth rate (µmax ) and the yield on glucose (Yx/s ) as input parameters,
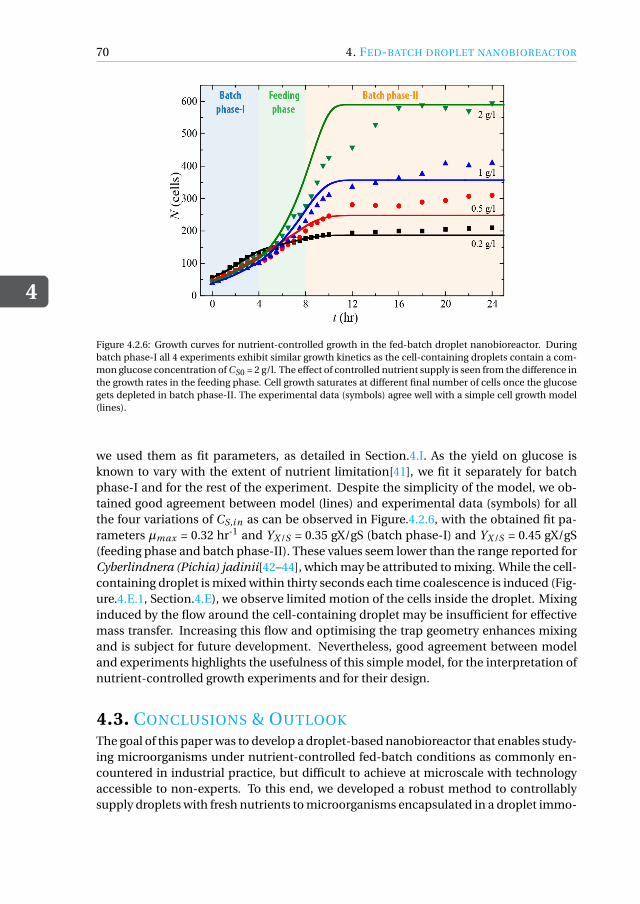
4
70 4. FED-BATCH DROPLET NANOBIOREACTOR
Figure 4.2.6: Growth curves for nutrient-controlled growth in the fed-batch droplet nanobioreactor. Duringbatch phase-I all 4 experiments exhibit similar growth kinetics as the cell-containing droplets contain a com-mon glucose concentration of CS0 = 2 g/l. The effect of controlled nutrient supply is seen from the difference inthe growth rates in the feeding phase. Cell growth saturates at different final number of cells once the glucosegets depleted in batch phase-II. The experimental data (symbols) agree well with a simple cell growth model(lines).
we used them as fit parameters, as detailed in Section.4.I. As the yield on glucose isknown to vary with the extent of nutrient limitation[41], we fit it separately for batchphase-I and for the rest of the experiment. Despite the simplicity of the model, we ob-tained good agreement between model (lines) and experimental data (symbols) for allthe four variations of CS,i n as can be observed in Figure.4.2.6, with the obtained fit pa-rameters µmax = 0.32 hr-1 and YX /S = 0.35 gX/gS (batch phase-I) and YX /S = 0.45 gX/gS(feeding phase and batch phase-II). These values seem lower than the range reported forCyberlindnera (Pichia) jadinii[42–44], which may be attributed to mixing. While the cell-containing droplet is mixed within thirty seconds each time coalescence is induced (Fig-ure.4.E.1, Section.4.E), we observe limited motion of the cells inside the droplet. Mixinginduced by the flow around the cell-containing droplet may be insufficient for effectivemass transfer. Increasing this flow and optimising the trap geometry enhances mixingand is subject for future development. Nevertheless, good agreement between modeland experiments highlights the usefulness of this simple model, for the interpretation ofnutrient-controlled growth experiments and for their design.
4.3. CONCLUSIONS & OUTLOOK
The goal of this paper was to develop a droplet-based nanobioreactor that enables study-ing microorganisms under nutrient-controlled fed-batch conditions as commonly en-countered in industrial practice, but difficult to achieve at microscale with technologyaccessible to non-experts. To this end, we developed a robust method to controllablysupply droplets with fresh nutrients to microorganisms encapsulated in a droplet immo-
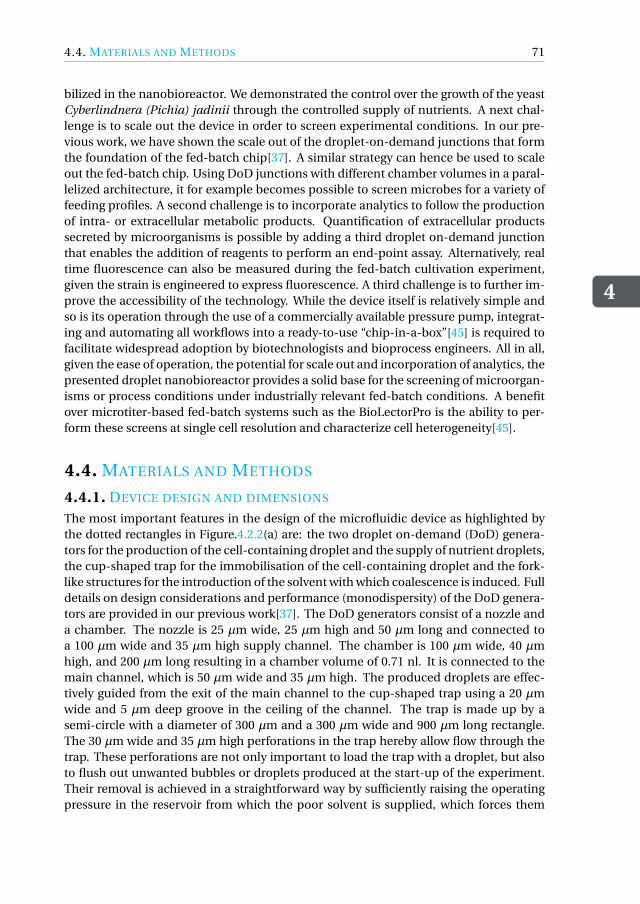
4.4. MATERIALS AND METHODS
4
71
bilized in the nanobioreactor. We demonstrated the control over the growth of the yeastCyberlindnera (Pichia) jadinii through the controlled supply of nutrients. A next chal-lenge is to scale out the device in order to screen experimental conditions. In our pre-vious work, we have shown the scale out of the droplet-on-demand junctions that formthe foundation of the fed-batch chip[37]. A similar strategy can hence be used to scaleout the fed-batch chip. Using DoD junctions with different chamber volumes in a paral-lelized architecture, it for example becomes possible to screen microbes for a variety offeeding profiles. A second challenge is to incorporate analytics to follow the productionof intra- or extracellular metabolic products. Quantification of extracellular productssecreted by microorganisms is possible by adding a third droplet on-demand junctionthat enables the addition of reagents to perform an end-point assay. Alternatively, realtime fluorescence can also be measured during the fed-batch cultivation experiment,given the strain is engineered to express fluorescence. A third challenge is to further im-prove the accessibility of the technology. While the device itself is relatively simple andso is its operation through the use of a commercially available pressure pump, integrat-ing and automating all workflows into a ready-to-use “chip-in-a-box”[45] is required tofacilitate widespread adoption by biotechnologists and bioprocess engineers. All in all,given the ease of operation, the potential for scale out and incorporation of analytics, thepresented droplet nanobioreactor provides a solid base for the screening of microorgan-isms or process conditions under industrially relevant fed-batch conditions. A benefitover microtiter-based fed-batch systems such as the BioLectorPro is the ability to per-form these screens at single cell resolution and characterize cell heterogeneity[45].
4.4. MATERIALS AND METHODS
4.4.1. DEVICE DESIGN AND DIMENSIONS
The most important features in the design of the microfluidic device as highlighted bythe dotted rectangles in Figure.4.2.2(a) are: the two droplet on-demand (DoD) genera-tors for the production of the cell-containing droplet and the supply of nutrient droplets,the cup-shaped trap for the immobilisation of the cell-containing droplet and the fork-like structures for the introduction of the solvent with which coalescence is induced. Fulldetails on design considerations and performance (monodispersity) of the DoD genera-tors are provided in our previous work[37]. The DoD generators consist of a nozzle anda chamber. The nozzle is 25 µm wide, 25 µm high and 50 µm long and connected toa 100 µm wide and 35 µm high supply channel. The chamber is 100 µm wide, 40 µmhigh, and 200 µm long resulting in a chamber volume of 0.71 nl. It is connected to themain channel, which is 50 µm wide and 35 µm high. The produced droplets are effec-tively guided from the exit of the main channel to the cup-shaped trap using a 20 µmwide and 5 µm deep groove in the ceiling of the channel. The trap is made up by asemi-circle with a diameter of 300 µm and a 300 µm wide and 900 µm long rectangle.The 30 µm wide and 35 µm high perforations in the trap hereby allow flow through thetrap. These perforations are not only important to load the trap with a droplet, but alsoto flush out unwanted bubbles or droplets produced at the start-up of the experiment.Their removal is achieved in a straightforward way by sufficiently raising the operatingpressure in the reservoir from which the poor solvent is supplied, which forces them
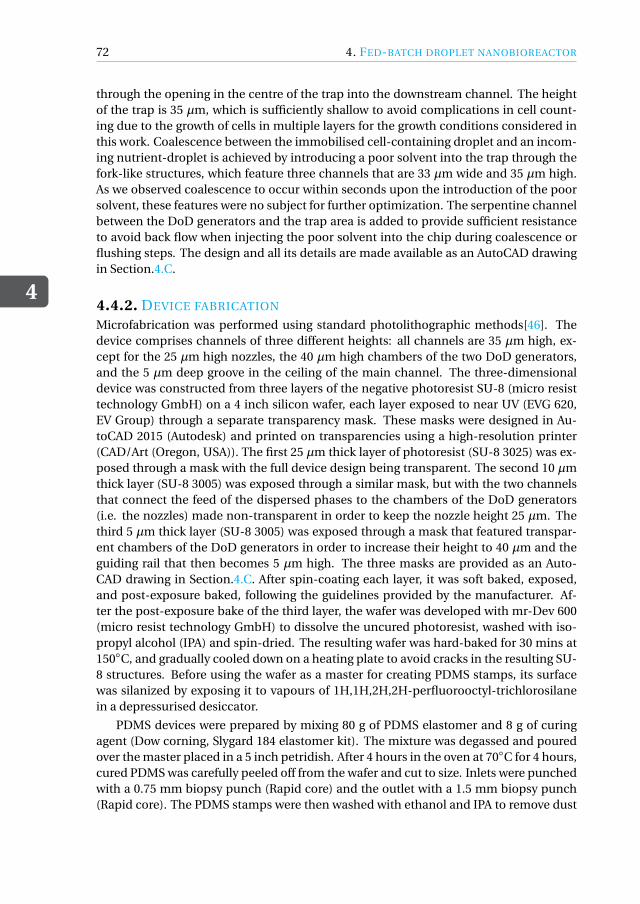
4
72 4. FED-BATCH DROPLET NANOBIOREACTOR
through the opening in the centre of the trap into the downstream channel. The heightof the trap is 35 µm, which is sufficiently shallow to avoid complications in cell count-ing due to the growth of cells in multiple layers for the growth conditions considered inthis work. Coalescence between the immobilised cell-containing droplet and an incom-ing nutrient-droplet is achieved by introducing a poor solvent into the trap through thefork-like structures, which feature three channels that are 33 µm wide and 35 µm high.As we observed coalescence to occur within seconds upon the introduction of the poorsolvent, these features were no subject for further optimization. The serpentine channelbetween the DoD generators and the trap area is added to provide sufficient resistanceto avoid back flow when injecting the poor solvent into the chip during coalescence orflushing steps. The design and all its details are made available as an AutoCAD drawingin Section.4.C.
4.4.2. DEVICE FABRICATION
Microfabrication was performed using standard photolithographic methods[46]. Thedevice comprises channels of three different heights: all channels are 35 µm high, ex-cept for the 25 µm high nozzles, the 40 µm high chambers of the two DoD generators,and the 5 µm deep groove in the ceiling of the main channel. The three-dimensionaldevice was constructed from three layers of the negative photoresist SU-8 (micro resisttechnology GmbH) on a 4 inch silicon wafer, each layer exposed to near UV (EVG 620,EV Group) through a separate transparency mask. These masks were designed in Au-toCAD 2015 (Autodesk) and printed on transparencies using a high-resolution printer(CAD/Art (Oregon, USA)). The first 25 µm thick layer of photoresist (SU-8 3025) was ex-posed through a mask with the full device design being transparent. The second 10 µmthick layer (SU-8 3005) was exposed through a similar mask, but with the two channelsthat connect the feed of the dispersed phases to the chambers of the DoD generators(i.e. the nozzles) made non-transparent in order to keep the nozzle height 25 µm. Thethird 5 µm thick layer (SU-8 3005) was exposed through a mask that featured transpar-ent chambers of the DoD generators in order to increase their height to 40 µm and theguiding rail that then becomes 5 µm high. The three masks are provided as an Auto-CAD drawing in Section.4.C. After spin-coating each layer, it was soft baked, exposed,and post-exposure baked, following the guidelines provided by the manufacturer. Af-ter the post-exposure bake of the third layer, the wafer was developed with mr-Dev 600(micro resist technology GmbH) to dissolve the uncured photoresist, washed with iso-propyl alcohol (IPA) and spin-dried. The resulting wafer was hard-baked for 30 mins at150◦C, and gradually cooled down on a heating plate to avoid cracks in the resulting SU-8 structures. Before using the wafer as a master for creating PDMS stamps, its surfacewas silanized by exposing it to vapours of 1H,1H,2H,2H-perfluorooctyl-trichlorosilanein a depressurised desiccator.
PDMS devices were prepared by mixing 80 g of PDMS elastomer and 8 g of curingagent (Dow corning, Slygard 184 elastomer kit). The mixture was degassed and pouredover the master placed in a 5 inch petridish. After 4 hours in the oven at 70◦C for 4 hours,cured PDMS was carefully peeled off from the wafer and cut to size. Inlets were punchedwith a 0.75 mm biopsy punch (Rapid core) and the outlet with a 1.5 mm biopsy punch(Rapid core). The PDMS stamps were then washed with ethanol and IPA to remove dust
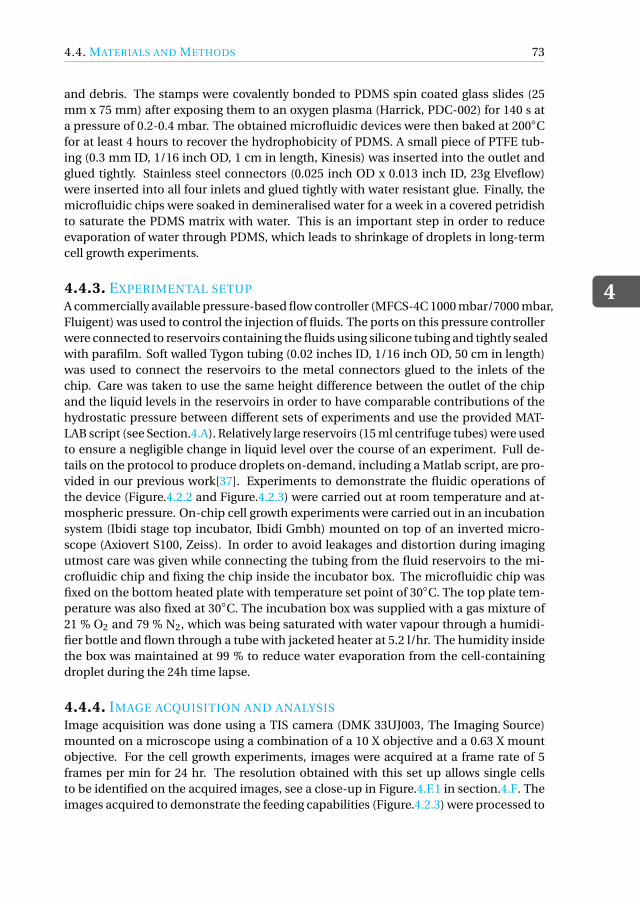
4.4. MATERIALS AND METHODS
4
73
and debris. The stamps were covalently bonded to PDMS spin coated glass slides (25mm x 75 mm) after exposing them to an oxygen plasma (Harrick, PDC-002) for 140 s ata pressure of 0.2-0.4 mbar. The obtained microfluidic devices were then baked at 200◦Cfor at least 4 hours to recover the hydrophobicity of PDMS. A small piece of PTFE tub-ing (0.3 mm ID, 1/16 inch OD, 1 cm in length, Kinesis) was inserted into the outlet andglued tightly. Stainless steel connectors (0.025 inch OD x 0.013 inch ID, 23g Elveflow)were inserted into all four inlets and glued tightly with water resistant glue. Finally, themicrofluidic chips were soaked in demineralised water for a week in a covered petridishto saturate the PDMS matrix with water. This is an important step in order to reduceevaporation of water through PDMS, which leads to shrinkage of droplets in long-termcell growth experiments.
4.4.3. EXPERIMENTAL SETUP
A commercially available pressure-based flow controller (MFCS-4C 1000 mbar/7000 mbar,Fluigent) was used to control the injection of fluids. The ports on this pressure controllerwere connected to reservoirs containing the fluids using silicone tubing and tightly sealedwith parafilm. Soft walled Tygon tubing (0.02 inches ID, 1/16 inch OD, 50 cm in length)was used to connect the reservoirs to the metal connectors glued to the inlets of thechip. Care was taken to use the same height difference between the outlet of the chipand the liquid levels in the reservoirs in order to have comparable contributions of thehydrostatic pressure between different sets of experiments and use the provided MAT-LAB script (see Section.4.A). Relatively large reservoirs (15 ml centrifuge tubes) were usedto ensure a negligible change in liquid level over the course of an experiment. Full de-tails on the protocol to produce droplets on-demand, including a Matlab script, are pro-vided in our previous work[37]. Experiments to demonstrate the fluidic operations ofthe device (Figure.4.2.2 and Figure.4.2.3) were carried out at room temperature and at-mospheric pressure. On-chip cell growth experiments were carried out in an incubationsystem (Ibidi stage top incubator, Ibidi Gmbh) mounted on top of an inverted micro-scope (Axiovert S100, Zeiss). In order to avoid leakages and distortion during imagingutmost care was given while connecting the tubing from the fluid reservoirs to the mi-crofluidic chip and fixing the chip inside the incubator box. The microfluidic chip wasfixed on the bottom heated plate with temperature set point of 30◦C. The top plate tem-perature was also fixed at 30◦C. The incubation box was supplied with a gas mixture of21 % O2 and 79 % N2, which was being saturated with water vapour through a humidi-fier bottle and flown through a tube with jacketed heater at 5.2 l/hr. The humidity insidethe box was maintained at 99 % to reduce water evaporation from the cell-containingdroplet during the 24h time lapse.
4.4.4. IMAGE ACQUISITION AND ANALYSIS
Image acquisition was done using a TIS camera (DMK 33UJ003, The Imaging Source)mounted on a microscope using a combination of a 10 X objective and a 0.63 X mountobjective. For the cell growth experiments, images were acquired at a frame rate of 5frames per min for 24 hr. The resolution obtained with this set up allows single cellsto be identified on the acquired images, see a close-up in Figure.4.F.1 in section.4.F. Theimages acquired to demonstrate the feeding capabilities (Figure.4.2.3) were processed to
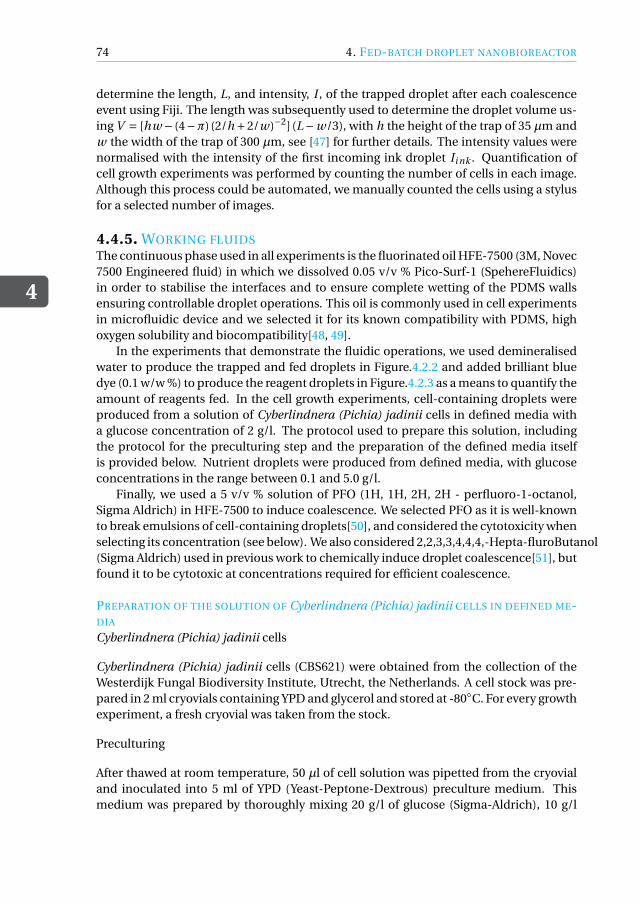
4
74 4. FED-BATCH DROPLET NANOBIOREACTOR
determine the length, L, and intensity, I , of the trapped droplet after each coalescenceevent using Fiji. The length was subsequently used to determine the droplet volume us-ing V = [hw − (4−π) (2/h +2/w)−2] (L−w/3), with h the height of the trap of 35 µm andw the width of the trap of 300 µm, see [47] for further details. The intensity values werenormalised with the intensity of the first incoming ink droplet Ii nk . Quantification ofcell growth experiments was performed by counting the number of cells in each image.Although this process could be automated, we manually counted the cells using a stylusfor a selected number of images.
4.4.5. WORKING FLUIDSThe continuous phase used in all experiments is the fluorinated oil HFE-7500 (3M, Novec7500 Engineered fluid) in which we dissolved 0.05 v/v % Pico-Surf-1 (SpehereFluidics)in order to stabilise the interfaces and to ensure complete wetting of the PDMS wallsensuring controllable droplet operations. This oil is commonly used in cell experimentsin microfluidic device and we selected it for its known compatibility with PDMS, highoxygen solubility and biocompatibility[48, 49].
In the experiments that demonstrate the fluidic operations, we used demineralisedwater to produce the trapped and fed droplets in Figure.4.2.2 and added brilliant bluedye (0.1 w/w %) to produce the reagent droplets in Figure.4.2.3 as a means to quantify theamount of reagents fed. In the cell growth experiments, cell-containing droplets wereproduced from a solution of Cyberlindnera (Pichia) jadinii cells in defined media witha glucose concentration of 2 g/l. The protocol used to prepare this solution, includingthe protocol for the preculturing step and the preparation of the defined media itselfis provided below. Nutrient droplets were produced from defined media, with glucoseconcentrations in the range between 0.1 and 5.0 g/l.
Finally, we used a 5 v/v % solution of PFO (1H, 1H, 2H, 2H - perfluoro-1-octanol,Sigma Aldrich) in HFE-7500 to induce coalescence. We selected PFO as it is well-knownto break emulsions of cell-containing droplets[50], and considered the cytotoxicity whenselecting its concentration (see below). We also considered 2,2,3,3,4,4,4,-Hepta-fluroButanol(Sigma Aldrich) used in previous work to chemically induce droplet coalescence[51], butfound it to be cytotoxic at concentrations required for efficient coalescence.
PREPARATION OF THE SOLUTION OF Cyberlindnera (Pichia) jadinii CELLS IN DEFINED ME-DIA
Cyberlindnera (Pichia) jadinii cells
Cyberlindnera (Pichia) jadinii cells (CBS621) were obtained from the collection of theWesterdijk Fungal Biodiversity Institute, Utrecht, the Netherlands. A cell stock was pre-pared in 2 ml cryovials containing YPD and glycerol and stored at -80◦C. For every growthexperiment, a fresh cryovial was taken from the stock.
Preculturing
After thawed at room temperature, 50 µl of cell solution was pipetted from the cryovialand inoculated into 5 ml of YPD (Yeast-Peptone-Dextrous) preculture medium. Thismedium was prepared by thoroughly mixing 20 g/l of glucose (Sigma-Aldrich), 10 g/l
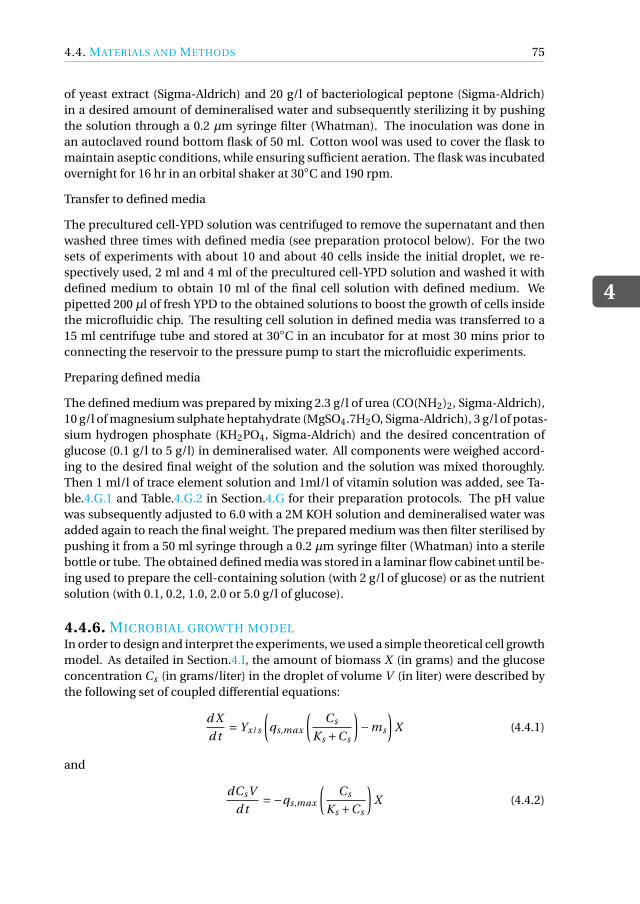
4.4. MATERIALS AND METHODS
4
75
of yeast extract (Sigma-Aldrich) and 20 g/l of bacteriological peptone (Sigma-Aldrich)in a desired amount of demineralised water and subsequently sterilizing it by pushingthe solution through a 0.2 µm syringe filter (Whatman). The inoculation was done inan autoclaved round bottom flask of 50 ml. Cotton wool was used to cover the flask tomaintain aseptic conditions, while ensuring sufficient aeration. The flask was incubatedovernight for 16 hr in an orbital shaker at 30◦C and 190 rpm.
Transfer to defined media
The precultured cell-YPD solution was centrifuged to remove the supernatant and thenwashed three times with defined media (see preparation protocol below). For the twosets of experiments with about 10 and about 40 cells inside the initial droplet, we re-spectively used, 2 ml and 4 ml of the precultured cell-YPD solution and washed it withdefined medium to obtain 10 ml of the final cell solution with defined medium. Wepipetted 200 µl of fresh YPD to the obtained solutions to boost the growth of cells insidethe microfluidic chip. The resulting cell solution in defined media was transferred to a15 ml centrifuge tube and stored at 30◦C in an incubator for at most 30 mins prior toconnecting the reservoir to the pressure pump to start the microfluidic experiments.
Preparing defined media
The defined medium was prepared by mixing 2.3 g/l of urea (CO(NH2)2, Sigma-Aldrich),10 g/l of magnesium sulphate heptahydrate (MgSO4.7H2O, Sigma-Aldrich), 3 g/l of potas-sium hydrogen phosphate (KH2PO4, Sigma-Aldrich) and the desired concentration ofglucose (0.1 g/l to 5 g/l) in demineralised water. All components were weighed accord-ing to the desired final weight of the solution and the solution was mixed thoroughly.Then 1 ml/l of trace element solution and 1ml/l of vitamin solution was added, see Ta-ble.4.G.1 and Table.4.G.2 in Section.4.G for their preparation protocols. The pH valuewas subsequently adjusted to 6.0 with a 2M KOH solution and demineralised water wasadded again to reach the final weight. The prepared medium was then filter sterilised bypushing it from a 50 ml syringe through a 0.2 µm syringe filter (Whatman) into a sterilebottle or tube. The obtained defined media was stored in a laminar flow cabinet until be-ing used to prepare the cell-containing solution (with 2 g/l of glucose) or as the nutrientsolution (with 0.1, 0.2, 1.0, 2.0 or 5.0 g/l of glucose).
4.4.6. MICROBIAL GROWTH MODELIn order to design and interpret the experiments, we used a simple theoretical cell growthmodel. As detailed in Section.4.I, the amount of biomass X (in grams) and the glucoseconcentration Cs (in grams/liter) in the droplet of volume V (in liter) were described bythe following set of coupled differential equations:
d X
d t= Yx/s
(qs,max
(Cs
Ks +Cs
)−ms
)X (4.4.1)
and
dCsV
d t=−qs,max
(Cs
Ks +Cs
)X (4.4.2)
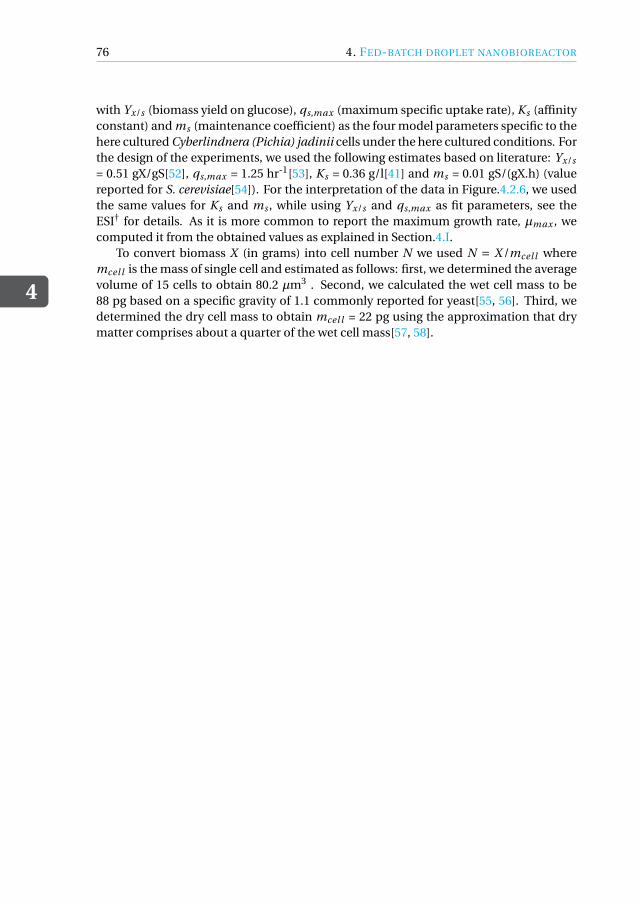
4
76 4. FED-BATCH DROPLET NANOBIOREACTOR
with Yx/s (biomass yield on glucose), qs,max (maximum specific uptake rate), Ks (affinityconstant) and ms (maintenance coefficient) as the four model parameters specific to thehere cultured Cyberlindnera (Pichia) jadinii cells under the here cultured conditions. Forthe design of the experiments, we used the following estimates based on literature: Yx/s
= 0.51 gX/gS[52], qs,max = 1.25 hr-1[53], Ks = 0.36 g/l[41] and ms = 0.01 gS/(gX.h) (valuereported for S. cerevisiae[54]). For the interpretation of the data in Figure.4.2.6, we usedthe same values for Ks and ms , while using Yx/s and qs,max as fit parameters, see theESI† for details. As it is more common to report the maximum growth rate, µmax , wecomputed it from the obtained values as explained in Section.4.I.
To convert biomass X (in grams) into cell number N we used N = X /mcel l wheremcel l is the mass of single cell and estimated as follows: first, we determined the averagevolume of 15 cells to obtain 80.2 µm3 . Second, we calculated the wet cell mass to be88 pg based on a specific gravity of 1.1 commonly reported for yeast[55, 56]. Third, wedetermined the dry cell mass to obtain mcel l = 22 pg using the approximation that drymatter comprises about a quarter of the wet cell mass[57, 58].
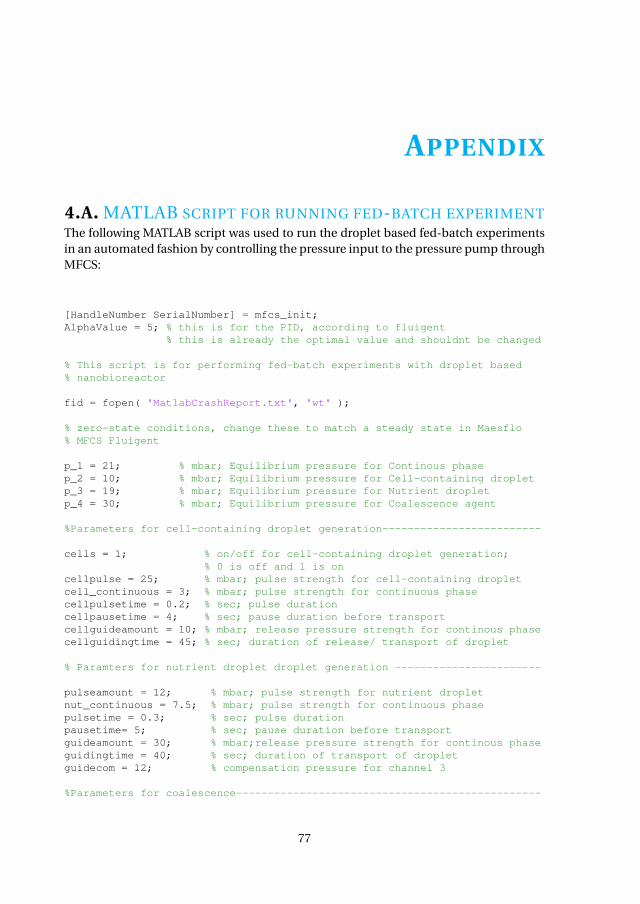
APPENDIX
4.A. MATLAB SCRIPT FOR RUNNING FED-BATCH EXPERIMENTThe following MATLAB script was used to run the droplet based fed-batch experimentsin an automated fashion by controlling the pressure input to the pressure pump throughMFCS:
[HandleNumber SerialNumber] = mfcs_init;AlphaValue = 5; % this is for the PID, according to fluigent
% this is already the optimal value and shouldnt be changed
% This script is for performing fed-batch experiments with droplet based% nanobioreactor
fid = fopen( 'MatlabCrashReport.txt', 'wt' );
% zero-state conditions, change these to match a steady state in Maesflo% MFCS Fluigent
p_1 = 21; % mbar; Equilibrium pressure for Continous phasep_2 = 10; % mbar; Equilibrium pressure for Cell-containing dropletp_3 = 19; % mbar; Equilibrium pressure for Nutrient dropletp_4 = 30; % mbar; Equilibrium pressure for Coalescence agent
%Parameters for cell-containing droplet generation-------------------------
cells = 1; % on/off for cell-containing droplet generation;% 0 is off and 1 is on
cellpulse = 25; % mbar; pulse strength for cell-containing dropletcell_continuous = 3; % mbar; pulse strength for continuous phasecellpulsetime = 0.2; % sec; pulse durationcellpausetime = 4; % sec; pause duration before transportcellguideamount = 10; % mbar; release pressure strength for continous phasecellguidingtime = 45; % sec; duration of release/ transport of droplet
% Paramters for nutrient droplet droplet generation -----------------------
pulseamount = 12; % mbar; pulse strength for nutrient dropletnut_continuous = 7.5; % mbar; pulse strength for continuous phasepulsetime = 0.3; % sec; pulse durationpausetime= 5; % sec; pause duration before transportguideamount = 30; % mbar;release pressure strength for continous phaseguidingtime = 40; % sec; duration of transport of dropletguidecom = 12; % compensation pressure for channel 3
%Parameters for coalescence------------------------------------------------
77
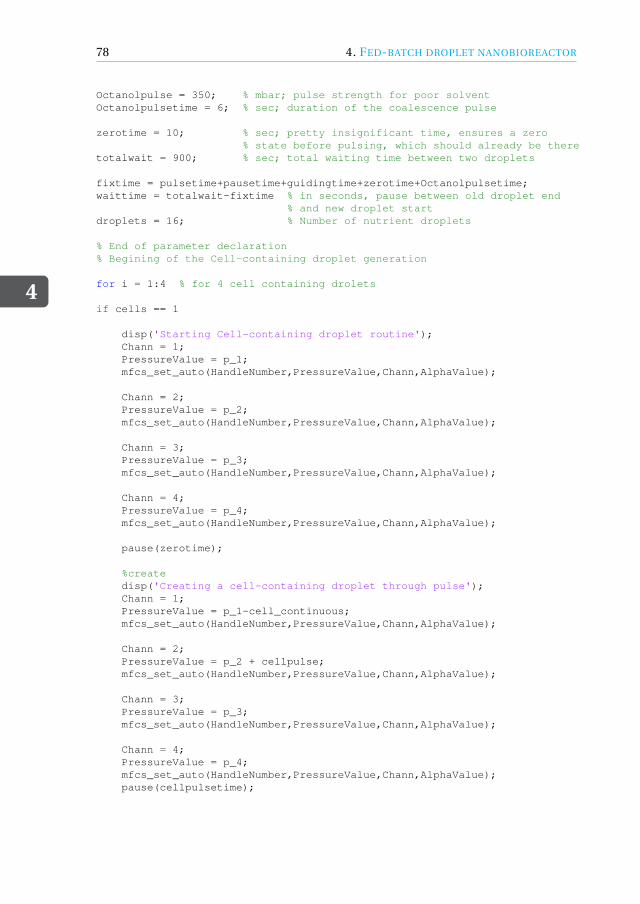
4
78 4. FED-BATCH DROPLET NANOBIOREACTOR
Octanolpulse = 350; % mbar; pulse strength for poor solventOctanolpulsetime = 6; % sec; duration of the coalescence pulse
zerotime = 10; % sec; pretty insignificant time, ensures a zero% state before pulsing, which should already be there
totalwait = 900; % sec; total waiting time between two droplets
fixtime = pulsetime+pausetime+guidingtime+zerotime+Octanolpulsetime;waittime = totalwait-fixtime % in seconds, pause between old droplet end
% and new droplet startdroplets = 16; % Number of nutrient droplets
% End of parameter declaration% Begining of the Cell-containing droplet generation
for i = 1:4 % for 4 cell containing drolets
if cells == 1
disp('Starting Cell-containing droplet routine');Chann = 1;PressureValue = p_1;mfcs_set_auto(HandleNumber,PressureValue,Chann,AlphaValue);
Chann = 2;PressureValue = p_2;mfcs_set_auto(HandleNumber,PressureValue,Chann,AlphaValue);
Chann = 3;PressureValue = p_3;mfcs_set_auto(HandleNumber,PressureValue,Chann,AlphaValue);
Chann = 4;PressureValue = p_4;mfcs_set_auto(HandleNumber,PressureValue,Chann,AlphaValue);
pause(zerotime);
%createdisp('Creating a cell-containing droplet through pulse');Chann = 1;PressureValue = p_1-cell_continuous;mfcs_set_auto(HandleNumber,PressureValue,Chann,AlphaValue);
Chann = 2;PressureValue = p_2 + cellpulse;mfcs_set_auto(HandleNumber,PressureValue,Chann,AlphaValue);
Chann = 3;PressureValue = p_3;mfcs_set_auto(HandleNumber,PressureValue,Chann,AlphaValue);
Chann = 4;PressureValue = p_4;mfcs_set_auto(HandleNumber,PressureValue,Chann,AlphaValue);pause(cellpulsetime);
4.A. MATLAB SCRIPT FOR RUNNING FED-BATCH EXPERIMENT
4
79
%pausedisp('Pause before transporting the cell-containing droplet to trap');Chann = 1;PressureValue = p_1-cell_continuous;mfcs_set_auto(HandleNumber,PressureValue,Chann,AlphaValue);
Chann = 2;PressureValue = p_2;mfcs_set_auto(HandleNumber,PressureValue,Chann,AlphaValue);
Chann = 3;PressureValue = p_3;mfcs_set_auto(HandleNumber,PressureValue,Chann,AlphaValue);
Chann = 4;PressureValue = p_4;mfcs_set_auto(HandleNumber,PressureValue,Chann,AlphaValue);
pause(cellpausetime);
%transportdisp('Transporting cell-containing droplet to the trap');Chann = 1;PressureValue = p_1 + cellguideamount;mfcs_set_auto(HandleNumber,PressureValue,Chann,AlphaValue);
Chann = 2;PressureValue = p_2;mfcs_set_auto(HandleNumber,PressureValue,Chann,AlphaValue);
Chann = 3;PressureValue = p_3;mfcs_set_auto(HandleNumber,PressureValue,Chann,AlphaValue);
Chann = 4;PressureValue = p_4;mfcs_set_auto(HandleNumber,PressureValue,Chann,AlphaValue);
pause(cellguidingtime);
%zerodisp('Zeroing 3');
Chann = 1;PressureValue = p_1;mfcs_set_auto(HandleNumber,PressureValue,Chann,AlphaValue);
Chann = 2;PressureValue = p_2;mfcs_set_auto(HandleNumber,PressureValue,Chann,AlphaValue);
Chann = 3;PressureValue = p_3;mfcs_set_auto(HandleNumber,PressureValue,Chann,AlphaValue);
Chann = 4;PressureValue = p_4;
4
80 4. FED-BATCH DROPLET NANOBIOREACTOR
mfcs_set_auto(HandleNumber,PressureValue,Chann,AlphaValue);
pause(zerotime)
disp('Cell-containing droplet generated!');
disp('Starting nutrient droplet generation');endend %End of cell-containing droplet generation routine
for i = 1:droplets
%zerodisp('Starting new nutrient droplet generation routine.');Chann = 1;PressureValue = p_1;mfcs_set_auto(HandleNumber,PressureValue,Chann,AlphaValue);
Chann = 2;PressureValue = p_2;mfcs_set_auto(HandleNumber,PressureValue,Chann,AlphaValue);
Chann = 3;PressureValue = p_3;mfcs_set_auto(HandleNumber,PressureValue,Chann,AlphaValue);
Chann = 4;PressureValue = p_4;mfcs_set_auto(HandleNumber,PressureValue,Chann,AlphaValue);
pause(zerotime);waittime = waittime - zerotime;
%createstr=sprintf('Creating No.%d nutrient droplet.',j);disp(str);
Chann = 1;PressureValue = p_1-nut_continuous;mfcs_set_auto(HandleNumber,PressureValue,Chann,AlphaValue);
Chann = 2;PressureValue = p_2;mfcs_set_auto(HandleNumber,PressureValue,Chann,AlphaValue);
Chann = 3;PressureValue = p_3 + pulseamount;mfcs_set_auto(HandleNumber,PressureValue,Chann,AlphaValue);
Chann = 4;PressureValue = p_4;mfcs_set_auto(HandleNumber,PressureValue,Chann,AlphaValue);
pause(pulsetime);
4.A. MATLAB SCRIPT FOR RUNNING FED-BATCH EXPERIMENT
4
81
% pausedisp('Pause before guiding');
Chann = 1;PressureValue = p_1-nut_continuous;mfcs_set_auto(HandleNumber,PressureValue,Chann,AlphaValue);
Chann = 2;PressureValue = p_2;mfcs_set_auto(HandleNumber,PressureValue,Chann,AlphaValue);
Chann = 3;PressureValue = p_3 - 1.5;mfcs_set_auto(HandleNumber,PressureValue,Chann,AlphaValue);
Chann = 4;PressureValue = p_4;mfcs_set_auto(HandleNumber,PressureValue,Chann,AlphaValue);
pause(pausetime);
%transportdisp('Guiding nutrient droplet to the trap');Chann = 1;PressureValue = p_1+ guideamount;mfcs_set_auto(HandleNumber,PressureValue,Chann,AlphaValue);
Chann = 2;PressureValue = p_2;mfcs_set_auto(HandleNumber,PressureValue,Chann,AlphaValue);
Chann = 3;PressureValue = p_3 + guidecom;mfcs_set_auto(HandleNumber,PressureValue,Chann,AlphaValue);
Chann = 4;PressureValue = p_4;mfcs_set_auto(HandleNumber,PressureValue,Chann,AlphaValue);
pause(guidingtime);
%coalescence
disp('Coalescing');
Chann = 1;PressureValue = p_1;mfcs_set_auto(HandleNumber,PressureValue,Chann,AlphaValue);
Chann = 2;PressureValue = p_2;mfcs_set_auto(HandleNumber,PressureValue,Chann,AlphaValue);
Chann = 3;PressureValue = p_3;mfcs_set_auto(HandleNumber,PressureValue,Chann,AlphaValue);
4
82 4. FED-BATCH DROPLET NANOBIOREACTOR
Chann = 4;PressureValue = p_4 + Octanolpulse;mfcs_set_auto(HandleNumber,PressureValue,Chann,AlphaValue);
pause(Octanolpulsetime);
creepnumber = fix(waittime/25) %integersubwaittime = waittime/creepnumber;
%zerodisp('Zeroing 3');
Chann = 1;PressureValue = p_1;mfcs_set_auto(HandleNumber,PressureValue,Chann,AlphaValue);
Chann = 2;PressureValue = p_2;mfcs_set_auto(HandleNumber,PressureValue,Chann,AlphaValue);
Chann = 3;PressureValue = p_3;mfcs_set_auto(HandleNumber,PressureValue,Chann,AlphaValue);
Chann = 4;PressureValue = p_4;mfcs_set_auto(HandleNumber,PressureValue,Chann,AlphaValue);
str=sprintf('Done with run %d', i);disp(str);fprintf( fid, '%s\nDone with run %d without crashing. Time passed:d minutes. \n\n', datestr(now), i, round((i*(zerotime+Octanolpulsetime+guidingtime)+(i-1)*waittime)/60));
%waitingif i ~= droplets
str=sprintf('waiting for %d seconds until new droplet', waittime);disp(str);for i=1:creepnumber
str=sprintf('Subwaittime is %d', subwaittime);disp(str);a = subwaittime/2-creeptime/2;pause(a);
str=sprintf('Half the subwaittime is over, %d creep starts,pushing the interface a ford seconds to avoid sticking', i ,creeptime);disp(str);Chann = 1;PressureValue = p_1;mfcs_set_auto(HandleNumber,PressureValue,Chann,AlphaValue);
Chann = 2;PressureValue = p_2;mfcs_set_auto(HandleNumber,PressureValue,Chann,AlphaValue);
4.A. MATLAB SCRIPT FOR RUNNING FED-BATCH EXPERIMENT
4
83
Chann = 3;PressureValue = p_3+creepamount;mfcs_set_auto(HandleNumber,PressureValue,Chann,AlphaValue);
Chann = 4;PressureValue = p_4;mfcs_set_auto(HandleNumber,PressureValue,Chann,AlphaValue);
pause(creeptime);str=sprintf('Done! Waiting for the rest...');disp(str);
Chann = 1;PressureValue = p_1;mfcs_set_auto(HandleNumber,PressureValue,Chann,AlphaValue);
Chann = 2;PressureValue = p_2;mfcs_set_auto(HandleNumber,PressureValue,Chann,AlphaValue);
Chann = 3;PressureValue = p_3;mfcs_set_auto(HandleNumber,PressureValue,Chann,AlphaValue);
Chann = 4;PressureValue = p_4;mfcs_set_auto(HandleNumber,PressureValue,Chann,AlphaValue);
pause(a); % finishing the waitingend
endend % Nutrient droplet generation routine
% End of feeding phasedisp('Completion of the Experiment!');mfcs_close(HandleNumber, 'CloseLib');fclose(fid);% End of my code
4
84 4. FED-BATCH DROPLET NANOBIOREACTOR
4.B. FED-BATCH DROPLET NANOBIOREACTOR MOVIES
Figure 4.B.1: Illustration of feeding of reagent droplets to a water droplet showing a constant feeding profile asreported in Figure.4.2.3(a). To see the movie scan the QR code or click here.
Figure 4.B.2: Controlled microbial fed-batch growth of textitCyberlindnera (Pichia) jadinii with a feeding con-centration of 0.5 g/L glucose and feeding frequency of 1 droplet/15 mins as reported in Figure.4.2.4.To see themovie scan the QR code or click here.
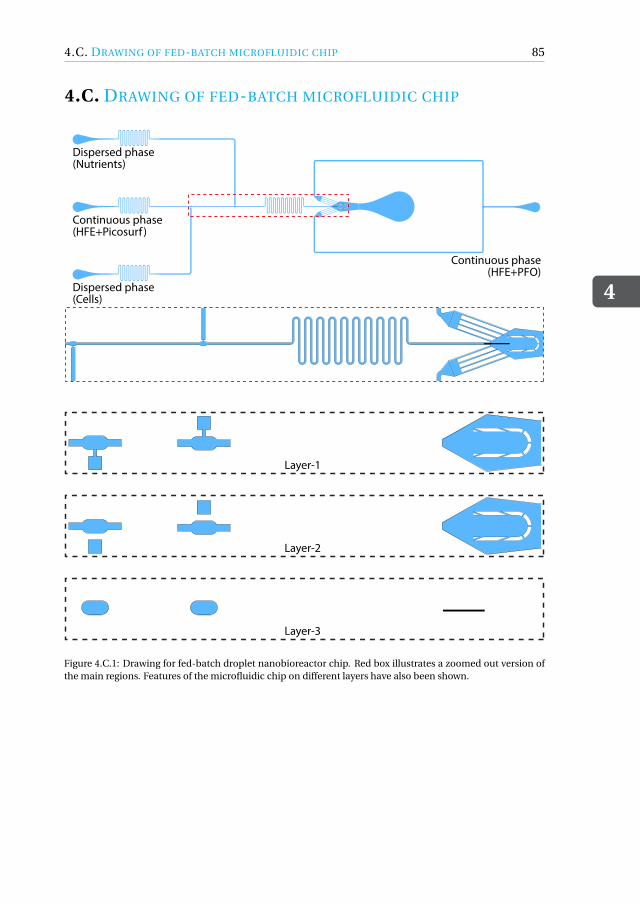
4.C. DRAWING OF FED-BATCH MICROFLUIDIC CHIP
4
85
4.C. DRAWING OF FED-BATCH MICROFLUIDIC CHIP
Layer-1
Layer-2
Layer-3
Continuous phase(HFE+Picosurf )
Dispersed phase(Nutrients)
Dispersed phase(Cells)
Continuous phase(HFE+PFO)
Figure 4.C.1: Drawing for fed-batch droplet nanobioreactor chip. Red box illustrates a zoomed out version ofthe main regions. Features of the microfluidic chip on different layers have also been shown.
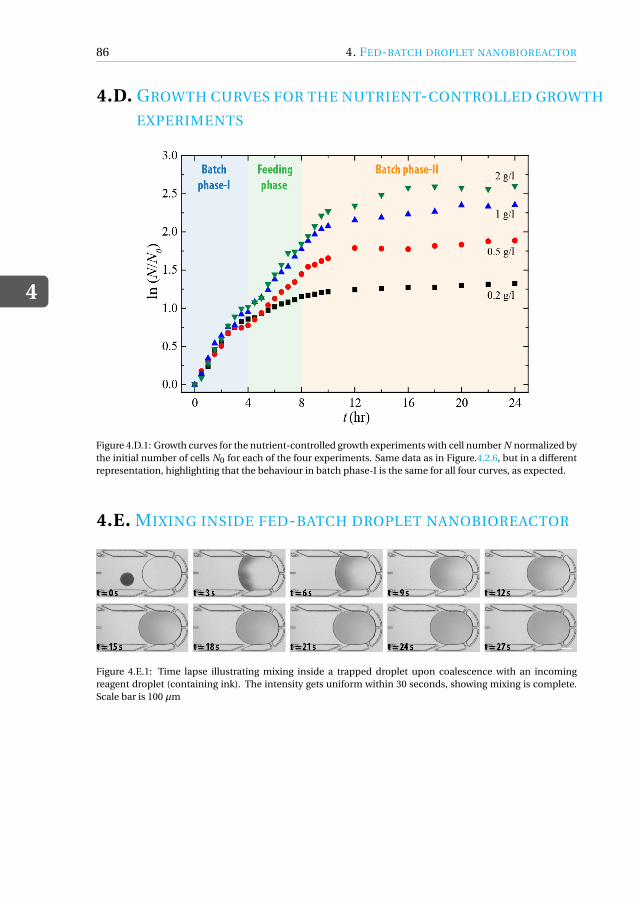
4
86 4. FED-BATCH DROPLET NANOBIOREACTOR
4.D. GROWTH CURVES FOR THE NUTRIENT-CONTROLLED GROWTH
EXPERIMENTS
Figure 4.D.1: Growth curves for the nutrient-controlled growth experiments with cell number N normalized bythe initial number of cells N0 for each of the four experiments. Same data as in Figure.4.2.6, but in a differentrepresentation, highlighting that the behaviour in batch phase-I is the same for all four curves, as expected.
4.E. MIXING INSIDE FED-BATCH DROPLET NANOBIOREACTOR
Figure 4.E.1: Time lapse illustrating mixing inside a trapped droplet upon coalescence with an incomingreagent droplet (containing ink). The intensity gets uniform within 30 seconds, showing mixing is complete.Scale bar is 100 µm
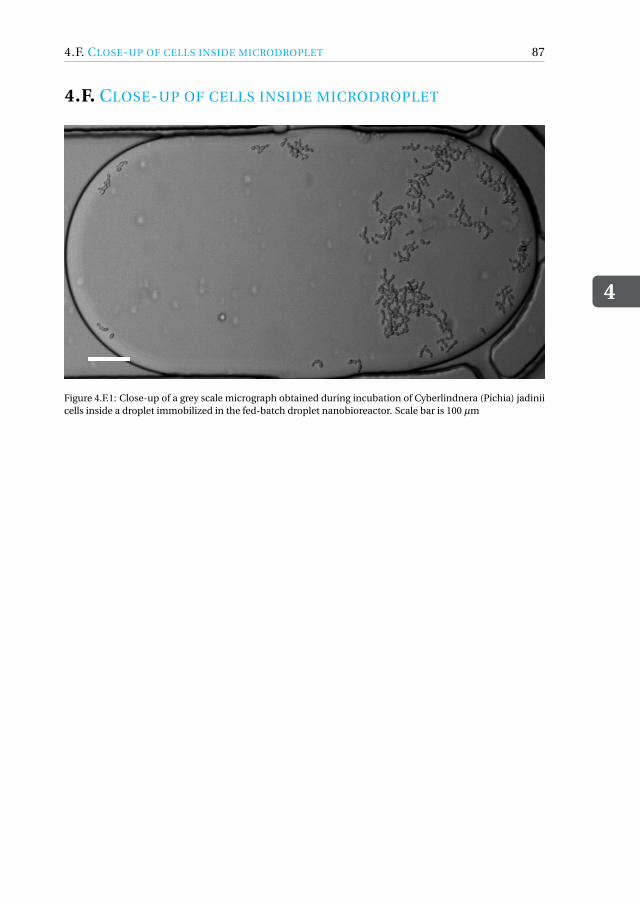
4.F. CLOSE-UP OF CELLS INSIDE MICRODROPLET
4
87
4.F. CLOSE-UP OF CELLS INSIDE MICRODROPLET
Figure 4.F.1: Close-up of a grey scale micrograph obtained during incubation of Cyberlindnera (Pichia) jadiniicells inside a droplet immobilized in the fed-batch droplet nanobioreactor. Scale bar is 100 µm
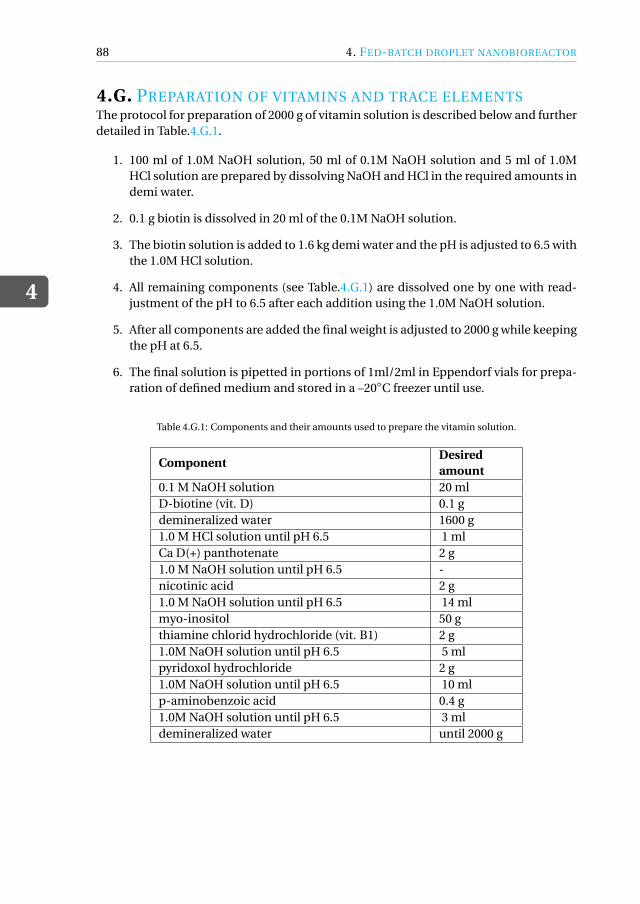
4
88 4. FED-BATCH DROPLET NANOBIOREACTOR
4.G. PREPARATION OF VITAMINS AND TRACE ELEMENTSThe protocol for preparation of 2000 g of vitamin solution is described below and furtherdetailed in Table.4.G.1.
1. 100 ml of 1.0M NaOH solution, 50 ml of 0.1M NaOH solution and 5 ml of 1.0MHCl solution are prepared by dissolving NaOH and HCl in the required amounts indemi water.
2. 0.1 g biotin is dissolved in 20 ml of the 0.1M NaOH solution.
3. The biotin solution is added to 1.6 kg demi water and the pH is adjusted to 6.5 withthe 1.0M HCl solution.
4. All remaining components (see Table.4.G.1) are dissolved one by one with read-justment of the pH to 6.5 after each addition using the 1.0M NaOH solution.
5. After all components are added the final weight is adjusted to 2000 g while keepingthe pH at 6.5.
6. The final solution is pipetted in portions of 1ml/2ml in Eppendorf vials for prepa-ration of defined medium and stored in a –20◦C freezer until use.
Table 4.G.1: Components and their amounts used to prepare the vitamin solution.
ComponentDesiredamount
0.1 M NaOH solution 20 mlD-biotine (vit. D) 0.1 gdemineralized water 1600 g1.0 M HCl solution until pH 6.5 1 mlCa D(+) panthotenate 2 g1.0 M NaOH solution until pH 6.5 -nicotinic acid 2 g1.0 M NaOH solution until pH 6.5 14 mlmyo-inositol 50 gthiamine chlorid hydrochloride (vit. B1) 2 g1.0M NaOH solution until pH 6.5 5 mlpyridoxol hydrochloride 2 g1.0M NaOH solution until pH 6.5 10 mlp-aminobenzoic acid 0.4 g1.0M NaOH solution until pH 6.5 3 mldemineralized water until 2000 g
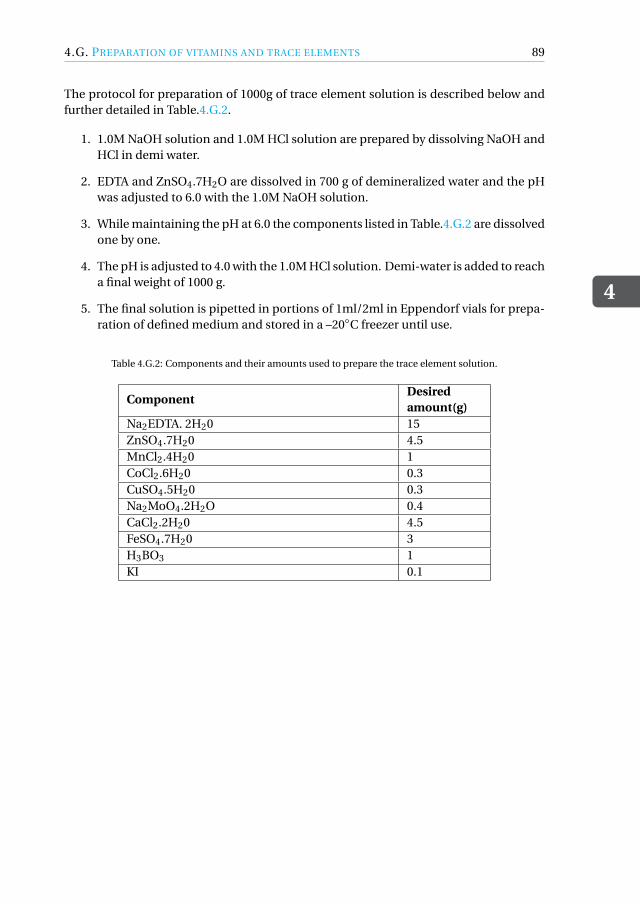
4.G. PREPARATION OF VITAMINS AND TRACE ELEMENTS
4
89
The protocol for preparation of 1000g of trace element solution is described below andfurther detailed in Table.4.G.2.
1. 1.0M NaOH solution and 1.0M HCl solution are prepared by dissolving NaOH andHCl in demi water.
2. EDTA and ZnSO4.7H2O are dissolved in 700 g of demineralized water and the pHwas adjusted to 6.0 with the 1.0M NaOH solution.
3. While maintaining the pH at 6.0 the components listed in Table.4.G.2 are dissolvedone by one.
4. The pH is adjusted to 4.0 with the 1.0M HCl solution. Demi-water is added to reacha final weight of 1000 g.
5. The final solution is pipetted in portions of 1ml/2ml in Eppendorf vials for prepa-ration of defined medium and stored in a –20◦C freezer until use.
Table 4.G.2: Components and their amounts used to prepare the trace element solution.
ComponentDesiredamount(g)
Na2EDTA. 2H20 15ZnSO4.7H20 4.5MnCl2.4H20 1CoCl2.6H20 0.3CuSO4.5H20 0.3Na2MoO4.2H2O 0.4CaCl2.2H20 4.5FeSO4.7H20 3H3BO3 1KI 0.1
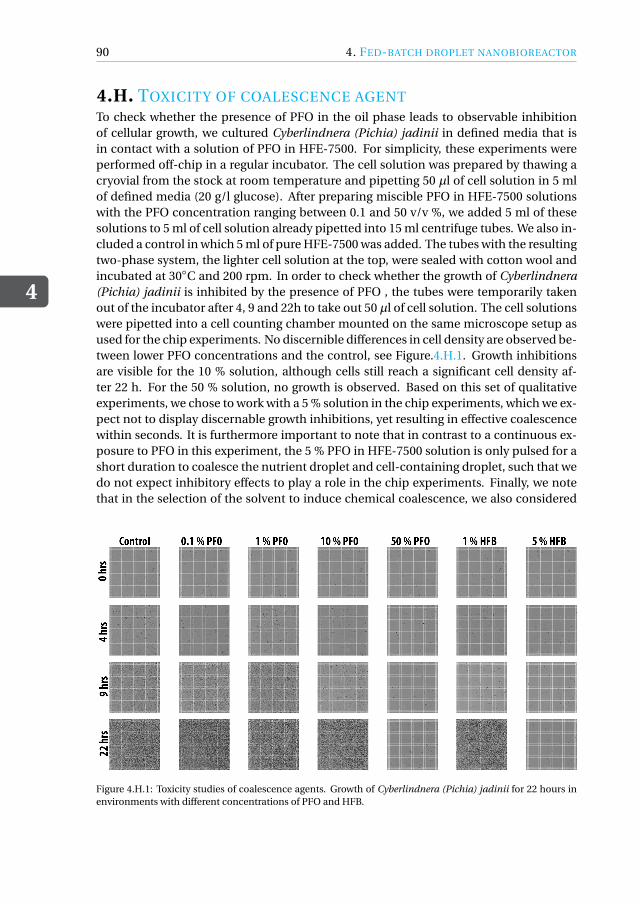
4
90 4. FED-BATCH DROPLET NANOBIOREACTOR
4.H. TOXICITY OF COALESCENCE AGENTTo check whether the presence of PFO in the oil phase leads to observable inhibitionof cellular growth, we cultured Cyberlindnera (Pichia) jadinii in defined media that isin contact with a solution of PFO in HFE-7500. For simplicity, these experiments wereperformed off-chip in a regular incubator. The cell solution was prepared by thawing acryovial from the stock at room temperature and pipetting 50 µl of cell solution in 5 mlof defined media (20 g/l glucose). After preparing miscible PFO in HFE-7500 solutionswith the PFO concentration ranging between 0.1 and 50 v/v %, we added 5 ml of thesesolutions to 5 ml of cell solution already pipetted into 15 ml centrifuge tubes. We also in-cluded a control in which 5 ml of pure HFE-7500 was added. The tubes with the resultingtwo-phase system, the lighter cell solution at the top, were sealed with cotton wool andincubated at 30◦C and 200 rpm. In order to check whether the growth of Cyberlindnera(Pichia) jadinii is inhibited by the presence of PFO , the tubes were temporarily takenout of the incubator after 4, 9 and 22h to take out 50 µl of cell solution. The cell solutionswere pipetted into a cell counting chamber mounted on the same microscope setup asused for the chip experiments. No discernible differences in cell density are observed be-tween lower PFO concentrations and the control, see Figure.4.H.1. Growth inhibitionsare visible for the 10 % solution, although cells still reach a significant cell density af-ter 22 h. For the 50 % solution, no growth is observed. Based on this set of qualitativeexperiments, we chose to work with a 5 % solution in the chip experiments, which we ex-pect not to display discernable growth inhibitions, yet resulting in effective coalescencewithin seconds. It is furthermore important to note that in contrast to a continuous ex-posure to PFO in this experiment, the 5 % PFO in HFE-7500 solution is only pulsed for ashort duration to coalesce the nutrient droplet and cell-containing droplet, such that wedo not expect inhibitory effects to play a role in the chip experiments. Finally, we notethat in the selection of the solvent to induce chemical coalescence, we also considered
Figure 4.H.1: Toxicity studies of coalescence agents. Growth of Cyberlindnera (Pichia) jadinii for 22 hours inenvironments with different concentrations of PFO and HFB.
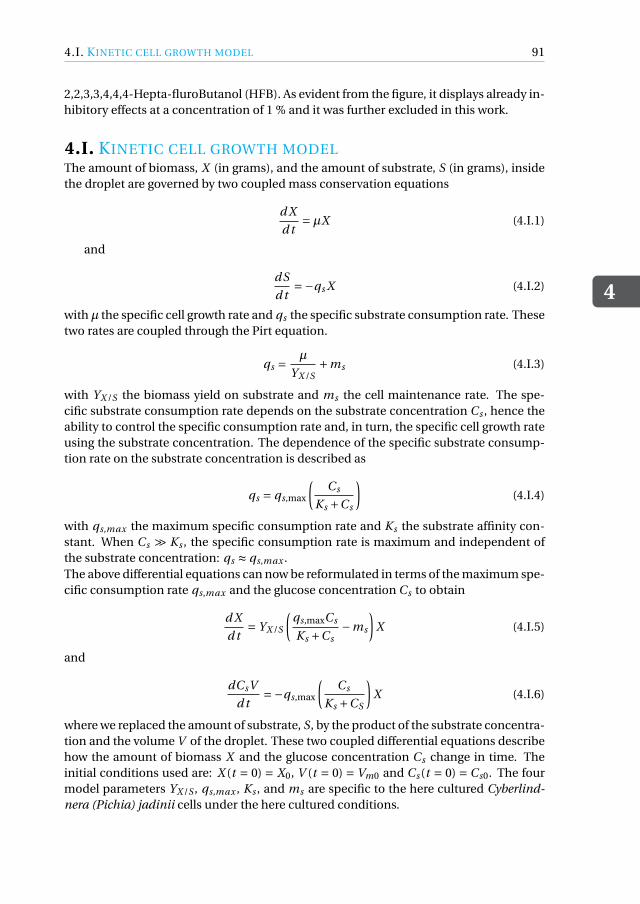
4.I. KINETIC CELL GROWTH MODEL
4
91
2,2,3,3,4,4,4-Hepta-fluroButanol (HFB). As evident from the figure, it displays already in-hibitory effects at a concentration of 1 % and it was further excluded in this work.
4.I. KINETIC CELL GROWTH MODELThe amount of biomass, X (in grams), and the amount of substrate, S (in grams), insidethe droplet are governed by two coupled mass conservation equations
d X
d t=µX (4.I.1)
and
dS
d t=−qs X (4.I.2)
withµ the specific cell growth rate and qs the specific substrate consumption rate. Thesetwo rates are coupled through the Pirt equation.
qs = µ
YX /S+ms (4.I.3)
with YX /S the biomass yield on substrate and ms the cell maintenance rate. The spe-cific substrate consumption rate depends on the substrate concentration Cs , hence theability to control the specific consumption rate and, in turn, the specific cell growth rateusing the substrate concentration. The dependence of the specific substrate consump-tion rate on the substrate concentration is described as
qs = qs,max
(Cs
Ks +Cs
)(4.I.4)
with qs,max the maximum specific consumption rate and Ks the substrate affinity con-stant. When Cs À Ks , the specific consumption rate is maximum and independent ofthe substrate concentration: qs ≈ qs,max .The above differential equations can now be reformulated in terms of the maximum spe-cific consumption rate qs,max and the glucose concentration Cs to obtain
d X
d t= YX /S
(qs,maxCs
Ks +Cs−ms
)X (4.I.5)
and
dCsV
d t=−qs,max
(Cs
Ks +CS
)X (4.I.6)
where we replaced the amount of substrate, S, by the product of the substrate concentra-tion and the volume V of the droplet. These two coupled differential equations describehow the amount of biomass X and the glucose concentration Cs change in time. Theinitial conditions used are: X (t = 0) = X0, V (t = 0) = Vm0 and Cs (t = 0) = Cs0. The fourmodel parameters YX /S , qs,max , Ks , and ms are specific to the here cultured Cyberlind-nera (Pichia) jadinii cells under the here cultured conditions.
4
92 4. FED-BATCH DROPLET NANOBIOREACTOR
We solved equation.4.I.5 and 4.I.6 in MATLAB using ODE45. We hereby described eachtime window between nutrient additions as a batch phase. After a batch phase, we deter-mined the volume of the droplet, the amount of biomass, and the substrate concentra-tion. We then adjusted these numbers to those obtained after the addition of a nutrientdroplet with a given volume and substrate concentration. These obtained values werethen used as initial conditions for the subsequent batch phase. In this way, we computedgrowth curves for the 24 hour time lapses.We firstly used the model to estimate the operating window for nutrient-controlled growth,with estimates of the parameters for YX /S , qs,max , Ks , and ms from literature. Secondly,we used the model to fit values of these parameters based on the experimental data inFigure.4.2.6. Rather than fitting four parameters, we used estimates of ms and Ks fromliterature, leaving qs,max and YX /S as the remaining unknowns. We determined qs,max
as follows: First, we considered batch phase-I in the set of experiments with uncon-strained growth and determined the specific growth rates µ for the three curves in Fig-ure.4.2.5 by fitting the data for which exponential growth was observed. Second, we usedthe obtained values for µ to determine the maximum specific growth rate µmax using
the relations µ = YX /S
(qs,max
CsKs+Cs
−ms
)and µmax = YX /S
(qs,max −ms
)to give µmax =
µKs+CsCs
−ms
(YX /S
CsKs+Cs
−1)
Ks+CsCs
. Given the last term is expected to be negligible, we
estimated the maximum growth rates for the three curves using µmax = µKs+CsCs
with Cs
taken as Cs0. An average of the three values was taken to find µmax = 0.32hr−1. Third,we used the aforementioned relation to obtain the following expression for the maxi-mum specific consumption rate: qs,max = µmax
YX /S+ms . This expression was put into equa-
tion.4.I.5 and 4.I.6, leaving the yield YX /S as the last remaining unknown. We determinedits value based on the data sets for controlled growth in Figure.4.2.6. Given that theyield is known to depend on the extent of nutrient limitation, we determined two val-ues, one for batch phase-I, another one for the combination of the feeding phase andbatch phase-II. This was done by computing growth curves for a large number of differ-ent values of YX /S and determining the value for which the mean square error betweenmodel and experimental data was smallest.
REFERENCES
4
93
REFERENCES[1] S. Parekh, V. Vinci, and R. Strobel, “Improvement of microbial strains and fermenta-
tion processes,” Applied Microbiology and Biotechnology, vol. 54, no. 3, pp. 287–301,2000.
[2] B. S. Kim, S. C. Lee, S. Y. Lee, Y. K. Chang, and H. N. Chang, “High cell density fed-batch cultivation of escherichia coli using exponential feeding combined with ph-stat,” Bioprocess and Biosystems Engineering, vol. 26, no. 3, pp. 147–150, 2004.
[3] G. Larsson, S. Jørgensen, M. Pons, B. Sonnleitner, and A. Tijsterman, “Biochemicalengineering science,” Journal of Biotechnology, vol. 59, no. 1-2, pp. 3–9, 1997.
[4] G. W. Luli and W. R. Strohl, “Comparison of growth, acetate production, and ac-etate inhibition of escherichia coli strains in batch and fed-batch fermentations.,”Applied and Environmental Microbiology, vol. 56, no. 4, pp. 1004–1011, 1990.
[5] M. Scheidle, M. Jeude, B. Dittrich, S. Denter, F. Kensy, M. Suckow, D. Klee, andJ. Büchs, “High-throughput screening of hansenula polymorpha clones in the batchcompared with the controlled-release fed-batch mode on a small scale,” FEMS YeastResearch, vol. 10, no. 1, pp. 83–92, 2009.
[6] C. Stöckmann, M. Scheidle, B. Dittrich, A. Merckelbach, G. Hehmann, G. Melmer,D. Klee, J. Büchs, H. A. Kang, and G. Gellissen, “Process development in hansenulapolymorpha and arxula adeninivorans, a re-assessment,” Microbial Cell Factories,vol. 8, no. 1, p. 22, 2009.
[7] P. Neubauer, N. Cruz, F. Glauche, S. Junne, A. Knepper, and M. Raven, “Consistentdevelopment of bioprocesses from microliter cultures to the industrial scale,” En-gineering in Life Sciences, vol. 13, no. 3, pp. 224–238, 2013.
[8] M. Jeude, B. Dittrich, H. Niederschulte, T. Anderlei, C. Knocke, D. Klee, and J. Büchs,“Fed-batch mode in shake flasks by slow-release technique,” Biotechnology andBioengineering, vol. 95, no. 3, pp. 433–445, 2006.
[9] T. Keil, B. Dittrich, C. Lattermann, T. Habicher, and J. Büchs, “Polymer-basedcontrolled-release fed-batch microtiter plate–diminishing the gap between earlyprocess development and production conditions,” Journal of Biological Engineer-ing, vol. 13, no. 1, p. 18, 2019.
[10] T. Habicher, V. Czotscher, T. Klein, A. Daub, T. Keil, and J. Büchs, “Glucose-containing polymer rings enable fed-batch operation in microtiter plates with par-allel online measurement of scattered light, fluorescence, dissolved oxygen tension,and ph,” Biotechnology and Bioengineering, vol. 116, no. 9, pp. 2250–2262, 2019.
[11] A. Buchenauer, M. Hofmann, M. Funke, J. Büchs, W. Mokwa, and U. Schnakenberg,“Micro-bioreactors for fed-batch fermentations with integrated online monitoringand microfluidic devices,” Biosensors and Bioelectronics, vol. 24, no. 5, pp. 1411–1416, 2009.
4
94 REFERENCES
[12] M. Funke, A. Buchenauer, W. Mokwa, S. Kluge, L. Hein, C. Müller, F. Kensy, andJ. Büchs, “Bioprocess control in microscale: scalable fermentations in disposableand user-friendly microfluidic systems,” Microbial Cell Factories, vol. 9, no. 1, p. 86,2010.
[13] M. Funke, A. Buchenauer, U. Schnakenberg, W. Mokwa, S. Diederichs, A. Mertens,C. Müller, F. Kensy, and J. Büchs, “Microfluidic biolector—microfluidic bioprocesscontrol in microtiter plates,” Biotechnology and Bioengineering, vol. 107, no. 3,pp. 497–505, 2010.
[14] A. Groisman, C. Lobo, H. Cho, J. K. Campbell, Y. S. Dufour, A. M. Stevens, andA. Levchenko, “A microfluidic chemostat for experiments with bacterial and yeastcells,” Nature Methods, vol. 2, no. 9, pp. 685–689, 2005.
[15] F. K. Balagaddé, L. You, C. L. Hansen, F. H. Arnold, and S. R. Quake, “Long-term monitoring of bacteria undergoing programmed population control in a mi-crochemostat,” Science, vol. 309, no. 5731, pp. 137–140, 2005.
[16] Z. Zhang, P. Boccazzi, H.-G. Choi, G. Perozziello, A. J. Sinskey, and K. F. Jensen, “Mi-crochemostat—microbial continuous culture in a polymer-based, instrumentedmicrobioreactor,” Lab on a Chip, vol. 6, no. 7, pp. 906–913, 2006.
[17] S. H. Au, S. C. Shih, and A. R. Wheeler, “Integrated microbioreactor for culture andanalysis of bacteria, algae and yeast,” Biomedical Microdevices, vol. 13, no. 1, pp. 41–50, 2011.
[18] W. Du, L. Li, K. P. Nichols, and R. F. Ismagilov, “Slipchip,” Lab on a Chip, vol. 9, no. 16,pp. 2286–2292, 2009.
[19] D. V. Zhukov, E. M. Khorosheva, T. Khazaei, W. Du, D. A. Selck, A. A. Shishkin, andR. F. Ismagilov, “Microfluidic slipchip device for multistep multiplexed biochem-istry on a nanoliter scale,” Lab on a Chip, vol. 19, no. 19, pp. 3200–3211, 2019.
[20] A. Grünberger, W. Wiechert, and D. Kohlheyer, “Single-cell microfluidics: oppor-tunity for bioprocess development,” Current Opinion in Biotechnology, vol. 29,pp. 15–23, 2014.
[21] S. Täuber, E. von Lieres, and A. Grünberger, “Dynamic environmental control inmicrofluidic single-cell cultivations: From concepts to applications,” Small, vol. 16,no. 16, p. 1906670, 2020.
[22] A. Burmeister and A. Grünberger, “Microfluidic cultivation and analysis tools forinteraction studies of microbial co-cultures,” Current Opinion in Biotechnology,vol. 62, pp. 106–115, 2020.
[23] G. J. Nossal and J. Lederberg, “Antibody production by single cells,” Nature, vol. 181,no. 4620, pp. 1419–1420, 1958.
[24] B. Rotman, “Measurement of activity of single molecules ofβ-d-galactosidase,” Pro-ceedings of the National Academy of Sciences, vol. 47, no. 12, p. 1981, 1961.
REFERENCES
4
95
[25] E. M. Payne, D. A. Holland-Moritz, S. Sun, and R. T. Kennedy, “High-throughputscreening by droplet microfluidics: Perspective into key challenges and futureprospects,” Lab on a Chip, 2020.
[26] T. Kaminski and P. Garstecki, “Controlled droplet microfluidic systems for multistepchemical and biological assays,” Chemical Society Reviews, vol. 46, no. 20, pp. 6210–6226, 2017.
[27] T. S. Kaminski, O. Scheler, and P. Garstecki, “Droplet microfluidics for microbiology:techniques, applications and challenges,” Lab on a Chip, vol. 16, no. 12, pp. 2168–2187, 2016.
[28] J. J. Agresti, E. Antipov, A. R. Abate, K. Ahn, A. C. Rowat, J.-C. Baret, M. Marquez,A. M. Klibanov, A. D. Griffiths, and D. A. Weitz, “Ultrahigh-throughput screeningin drop-based microfluidics for directed evolution,” Proceedings of the NationalAcademy of Sciences, vol. 107, no. 9, pp. 4004–4009, 2010.
[29] B. L. Wang, A. Ghaderi, H. Zhou, J. Agresti, D. A. Weitz, G. R. Fink, andG. Stephanopoulos, “Microfluidic high-throughput culturing of single cells for se-lection based on extracellular metabolite production or consumption,” NatureBiotechnology, vol. 32, no. 5, p. 473, 2014.
[30] T. Beneyton, I. P. M. Wijaya, P. Postros, M. Najah, P. Leblond, A. Couvent, E. Mayot,A. D. Griffiths, and A. Drevelle, “High-throughput screening of filamentous fungi us-ing nanoliter-range droplet-based microfluidics,” Scientific Reports, vol. 6, p. 27223,2016.
[31] K. Leung, H. Zahn, T. Leaver, K. M. Konwar, N. W. Hanson, A. P. Pagé, C.-C. Lo, P. S.Chain, S. J. Hallam, and C. L. Hansen, “A programmable droplet-based microflu-idic device applied to multiparameter analysis of single microbes and microbialcommunities,” Proceedings of the National Academy of Sciences, vol. 109, no. 20,pp. 7665–7670, 2012.
[32] H. Babahosseini, S. Padmanabhan, T. Misteli, and D. L. DeVoe, “A programmablemicrofluidic platform for multisample injection, discretization, and droplet manip-ulation,” Biomicrofluidics, vol. 14, no. 1, p. 014112, 2020.
[33] S. H. Jin, H.-H. Jeong, B. Lee, S. S. Lee, and C.-S. Lee, “A programmable microflu-idic static droplet array for droplet generation, transportation, fusion, storage, andretrieval,” Lab on a Chip, vol. 15, no. 18, pp. 3677–3686, 2015.
[34] S. Jakiela, T. S. Kaminski, O. Cybulski, D. B. Weibel, and P. Garstecki, “Bacterialgrowth and adaptation in microdroplet chemostats,” Angewandte Chemie Interna-tional Edition, vol. 52, no. 34, pp. 8908–8911, 2013.
[35] X. Jian, X. Guo, J. Wang, Z. L. Tan, X.-h. Xing, L. Wang, and C. Zhang, “Microbialmicrodroplet culture system (mmc): An integrated platform for automated, high-throughput microbial cultivation and adaptive evolution,” Biotechnology and Bio-engineering, vol. 117, no. 6, pp. 1724–1737, 2020.
4
96 REFERENCES
[36] R. F.-X. Tomasi, S. Sart, T. Champetier, and C. N. Baroud, “Individual control andquantification of 3d spheroids in a high-density microfluidic droplet array,” Cellreports, vol. 31, no. 8, p. 107670, 2020.
[37] K. Totlani, J.-W. Hurkmans, W. M. van Gulik, M. T. Kreutzer, and V. van Steijn,“Scalable microfluidic droplet on-demand generator for non-steady operation ofdroplet-based assays,” Lab on a Chip, vol. 20, no. 8, pp. 1398–1409, 2020.
[38] W. Visser, W. A. Scheffers, W. H. Batenburg-van der Vegte, and J. P. van Dijken,“Oxygen requirements of yeasts.,” Applied and Environmental Microbiology, vol. 56,no. 12, pp. 3785–3792, 1990.
[39] J.-u. Shim, G. Cristobal, D. R. Link, T. Thorsen, Y. Jia, K. Piattelli, and S. Fraden,“Control and measurement of the phase behavior of aqueous solutions using mi-crofluidics,” Journal of the American Chemical Society, vol. 129, no. 28, pp. 8825–8835, 2007.
[40] A. Dewan, J. Kim, R. H. McLean, S. A. Vanapalli, and M. N. Karim, “Growth kineticsof microalgae in microfluidic static droplet arrays,” Biotechnology and Bioengineer-ing, vol. 109, no. 12, pp. 2987–2996, 2012.
[41] E. Postma, W. A. Scheffers, and J. P. Van Dijken, “Adaptation of the kinetics of glu-cose transport to environmental conditions in the yeast candida utilis cbs 621: acontinuous-culture study,” Microbiology, vol. 134, no. 5, pp. 1109–1116, 1988.
[42] C. Verduyn, A. H. Stouthamer, W. A. Scheffers, and J. P. van Dijken, “A theoreticalevaluation of growth yields of yeasts,” Antonie Van Leeuwenhoek, vol. 59, no. 1,pp. 49–63, 1991.
[43] M. Tobajas and E. Garcia-Calvo, “Determination of biomass yield for growth of can-dida utilis on glucose: black box and metabolic descriptions,” World Journal of Mi-crobiology and Biotechnology, vol. 15, no. 4, pp. 431–438, 1999.
[44] M. Imura, K. Nitta, R. Iwakiri, F. Matsuda, H. Shimizu, and E. Fukusaki, “Compari-son of metabolic profiles of yeasts based on the difference of the crabtree positiveand negative,” Journal of Bioscience and Bioengineering, vol. 129, no. 1, pp. 52–58,2020.
[45] V. Ortseifen, M. Viefhues, L. Wobbe, and A. Grünberger, “Microfluidics for biotech-nology: Bridging gaps to foster microfluidic applications,” Frontiers in Bioengineer-ing and Biotechnology, vol. 8, p. 1324, 2020.
[46] Y. Xia and G. M. Whitesides, “Soft lithography,” Annual Review of Materials Science,vol. 28, no. 1, pp. 153–184, 1998.
[47] M. Musterd, V. van Steijn, C. R. Kleijn, and M. T. Kreutzer, “Calculating the volumeof elongated bubbles and droplets in microchannels from a top view image,” RSCAdvances, vol. 5, no. 21, pp. 16042–16049, 2015.
REFERENCES
4
97
[48] P. Gruner, B. Riechers, L. A. C. Orellana, Q. Brosseau, F. Maes, T. Beneyton, D. Pekin,and J.-C. Baret, “Stabilisers for water-in-fluorinated-oil dispersions: Key proper-ties for microfluidic applications,” Current Opinion in Colloid & Interface Science,vol. 20, no. 3, pp. 183–191, 2015.
[49] J.-C. Baret, “Surfactants in droplet-based microfluidics,” Lab on a Chip, vol. 12,no. 3, pp. 422–433, 2012.
[50] L. Mazutis, J. Gilbert, W. L. Ung, D. A. Weitz, A. D. Griffiths, and J. A. Heyman,“Single-cell analysis and sorting using droplet-based microfluidics,” Nature Proto-cols, vol. 8, no. 5, pp. 870–891, 2013.
[51] I. Akartuna, D. M. Aubrecht, T. E. Kodger, and D. A. Weitz, “Chemically inducedcoalescence in droplet-based microfluidics,” Lab on a Chip, vol. 15, no. 4, pp. 1140–1144, 2015.
[52] E. Hernandez and M. J. Johnson, “Energy supply and cell yield in aerobically grownmicroorganisms,” Journal of Bacteriology, vol. 94, no. 4, pp. 996–1001, 1967.
[53] E. Postma, A. Kuiper, W. Tomasouw, W. Scheffers, and J. Van Dijken, “Competitionfor glucose between the yeasts saccharomyces cerevisiae and candida utilis.,” Ap-plied and Environmental Microbiology, vol. 55, no. 12, pp. 3214–3220, 1989.
[54] T. Vos, X. D. Hakkaart, E. A. de Hulster, A. J. van Maris, J. T. Pronk, and P. Daran-Lapujade, “Maintenance-energy requirements and robustness of saccharomycescerevisiae at aerobic near-zero specific growth rates,” Microbial Cell Factories,vol. 15, no. 1, p. 111, 2016.
[55] A. K. Bryan, A. Goranov, A. Amon, and S. R. Manalis, “Measurement of mass, density,and volume during the cell cycle of yeast,” Proceedings of the National Academy ofSciences, vol. 107, no. 3, pp. 999–1004, 2010.
[56] S. A. Haddad and C. C. Lindegren, “A method for determining the weight of an indi-vidual yeast cell,” Applied Microbiology, vol. 1, no. 3, p. 153, 1953.
[57] A. Schmid, H. Kortmann, P. S. Dittrich, and L. M. Blank, “Chemical and biologi-cal single cell analysis,” Current Opinion in Biotechnology, vol. 21, no. 1, pp. 12–20,2010.
[58] F. Sherman, “Getting started with yeast,” in Methods in Enzymology, vol. 350, pp. 3–41, Elsevier, 2002.

5MICROFLUIDIC TOOL FOR
DISSOLVED OXYGEN
Microfluidic static droplet array for studying microbial growth underdifferent levels of dissolved oxygen
We develop a scalable microfluidic platform that enables studying the growth of microor-ganisms under controlled oxygen levels. The microorganisms are cultured inside dropletsstored in chambers on a microfluidic device, while the level of oxygen is controlled throughthe amount of oxygen dissolved in the fluorinated oil that flows around the droplets. Ourstudy is motivated by the need for lab-scale experimental analysis of industrial growthconditions in bioprocess development. We present a proof-of-concept study in which westudied two limiting cases, using the yeast Cyberlindnera Jadinii as the model microorgan-ism. The first case is with oxygen-saturated fluorinated oil, where significant growth for aprolonged duration is seen. The second case is with oil deprived of oxygen where negligi-ble growth is observed. While we impose static conditions for these two limiting cases, theplatform can be further extended to study microorganisms under dynamically controlledoxygen levels.
This chapter would be submitted as K. Totlani, P. Katakwar, N. du Pree, M. T. Kreutzer, W. M. van Gulik, V.van Steijn. Microfluidic static droplet array for studying microbial growth under different levels of dissolvedoxygen.
99
5
100 5. MICROFLUIDIC TOOL FOR DISSOLVED OXYGEN
5.1. INTRODUCTION
Dissolved oxygen is an important nutrient that is consumed by microorganisms for growth,maintenance and production of metabolites[1]. Owing to its poor solubility in aque-ous solutions[2], oxygen (air) is supplied continuously to industrial-scale bioreactorsvia a sparger below the impeller. Since the solubility depends on pressure, a gradientin hydrostatic pressure results in a gradient in oxygen levels[3]. Additionally, in indus-trial scale fed-batch reactors, in which concentrated nutrients are supplied continuouslyfrom the top, cell densities and oxygen consumption rates are largest near the feedingzone. This leads to oxygen limitations near the top, giving rise to gradients in dissolvedoxygen levels across the reactors[4]. Therefore, microorganisms traveling through thereactors constantly experience different levels of dissolved oxygen[5]. These variationsexperienced by the microorganisms not only affect the cellular physiology and produc-tivity but also lead to production of undesired side products. It is therefore importantto be able to study the sensitivity of microorganisms towards differences in dissolvedoxygen levels when developing bioprocesses[6].
Microtiter plates and shake flasks comprise state-of-the-art tools for initial biopro-cess development as they allow studying a large number of mutant strains and processconditions in order to select the optimum combination. However, these tools lack theability to impose dynamically changing environments due to the lack of precise andrapid control of the supply of nutrients or dissolved oxygen[7, 8]. Microfluidic tools areknown for their regulation of minute amounts of fluid, enabling precise and rapid con-trol of biological micro-environments[9, 10]. For gases like oxygen, permeable mem-branes are typically used to facilitate the exchange with the surrounding environment,with the supply rates controlled by the concentration in the environment and the per-meability of the membrane[11]. Alternatively, supply can be achieved through dedicatedsupply channels incorporated into the microfluidic devices and separated from the loca-tion of interest by a thin permeable wall. Apart from diffusion of oxygen through perme-able membranes or walls, liquids pre-equilibrated with oxygen are also used as a sourceof oxygen. Fluorinated oils such as HFE-7500 and FC-40 are known for their high oxy-gen solubility[12–14]. Such oxygen-rich oils have also been supplied to shake flasks andlarge-scale bioreactors in order to increase the oxygen supply[15]. In microchannels, flu-orinated oils can be flown around aqueous cell-containing droplets as a means to supplyor remove dissolved oxygen. Mahler and co-workers[16] generated droplets on-chip andfed these into an incubator vessel containing a fluorinated oil, with marked effect onculture growth inside the droplets during 1-25 hours by slowly feeding oxygen-saturatedoils into the vessel, in comparison with control experiments with the same oil stagnantin the vessel without refreshing it. Essentially, the incubator eliminated oxygen-supplylimitations, while the gentle flow of oil caused less droplet coalescence and droplet evap-oration than cultivation in microtiter-plates and shake flasks, two benchmark systemsthat the incubator was compared with. In contrast to the slower dynamics of cultiva-tion, Abbyad and co-workers created a flow focussing droplet generator with oxygen-saturated fluorinated oil that suddenly changed the dissolved oxygen concentration in-side droplets containing haemoglobin, in order to study its polymerisation in the contextof sickling of red blood cells[17]. These works highlight the capabilities of droplet-basedmicrofluidic systems to study a large number of microorganisms and process conditions
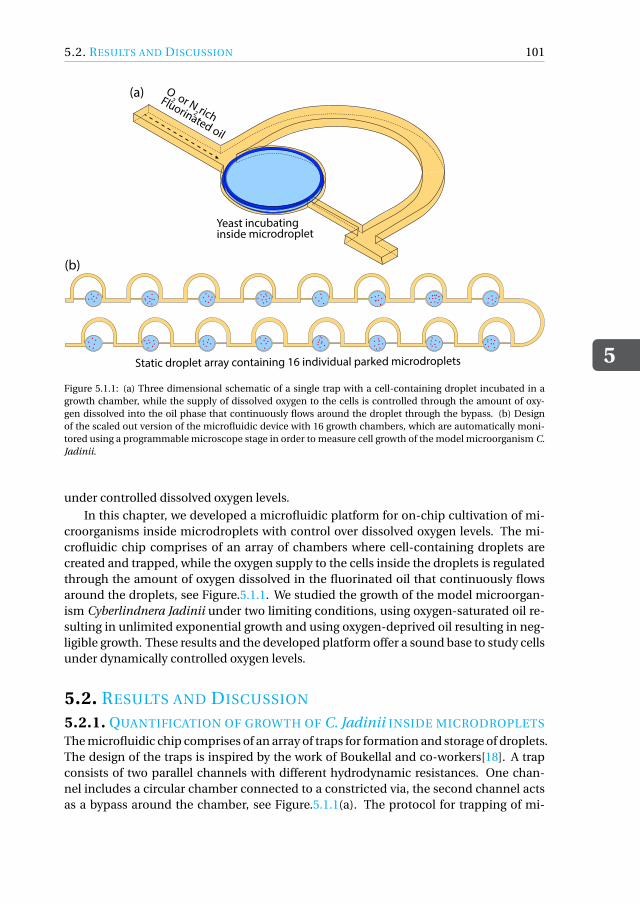
5.2. RESULTS AND DISCUSSION
5
101
(b)
(a) O2 or N
2 richFluorinated oil
Yeast incubating inside microdroplet
Static droplet array containing 16 individual parked microdroplets
Figure 5.1.1: (a) Three dimensional schematic of a single trap with a cell-containing droplet incubated in agrowth chamber, while the supply of dissolved oxygen to the cells is controlled through the amount of oxy-gen dissolved into the oil phase that continuously flows around the droplet through the bypass. (b) Designof the scaled out version of the microfluidic device with 16 growth chambers, which are automatically moni-tored using a programmable microscope stage in order to measure cell growth of the model microorganism C.Jadinii.
under controlled dissolved oxygen levels.
In this chapter, we developed a microfluidic platform for on-chip cultivation of mi-croorganisms inside microdroplets with control over dissolved oxygen levels. The mi-crofluidic chip comprises of an array of chambers where cell-containing droplets arecreated and trapped, while the oxygen supply to the cells inside the droplets is regulatedthrough the amount of oxygen dissolved in the fluorinated oil that continuously flowsaround the droplets, see Figure.5.1.1. We studied the growth of the model microorgan-ism Cyberlindnera Jadinii under two limiting conditions, using oxygen-saturated oil re-sulting in unlimited exponential growth and using oxygen-deprived oil resulting in neg-ligible growth. These results and the developed platform offer a sound base to study cellsunder dynamically controlled oxygen levels.
5.2. RESULTS AND DISCUSSION
5.2.1. QUANTIFICATION OF GROWTH OF C. Jadinii INSIDE MICRODROPLETS
The microfluidic chip comprises of an array of traps for formation and storage of droplets.The design of the traps is inspired by the work of Boukellal and co-workers[18]. A trapconsists of two parallel channels with different hydrodynamic resistances. One chan-nel includes a circular chamber connected to a constricted via, the second channel actsas a bypass around the chamber, see Figure.5.1.1(a). The protocol for trapping of mi-
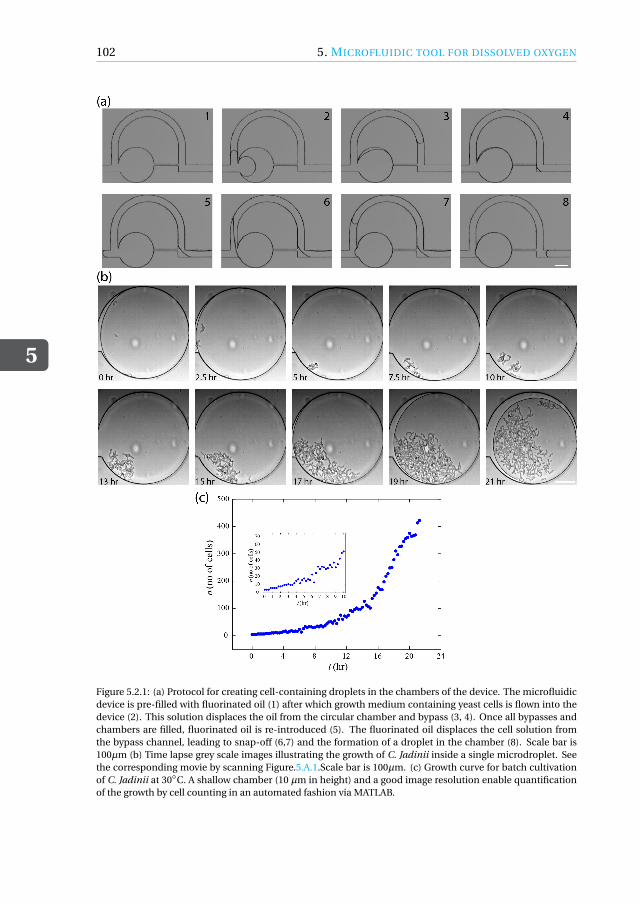
5
102 5. MICROFLUIDIC TOOL FOR DISSOLVED OXYGEN
Figure 5.2.1: (a) Protocol for creating cell-containing droplets in the chambers of the device. The microfluidicdevice is pre-filled with fluorinated oil (1) after which growth medium containing yeast cells is flown into thedevice (2). This solution displaces the oil from the circular chamber and bypass (3, 4). Once all bypasses andchambers are filled, fluorinated oil is re-introduced (5). The fluorinated oil displaces the cell solution fromthe bypass channel, leading to snap-off (6,7) and the formation of a droplet in the chamber (8). Scale bar is100µm (b) Time lapse grey scale images illustrating the growth of C. Jadinii inside a single microdroplet. Seethe corresponding movie by scanning Figure.5.A.1.Scale bar is 100µm. (c) Growth curve for batch cultivationof C. Jadinii at 30◦C. A shallow chamber (10 µm in height) and a good image resolution enable quantificationof the growth by cell counting in an automated fashion via MATLAB.
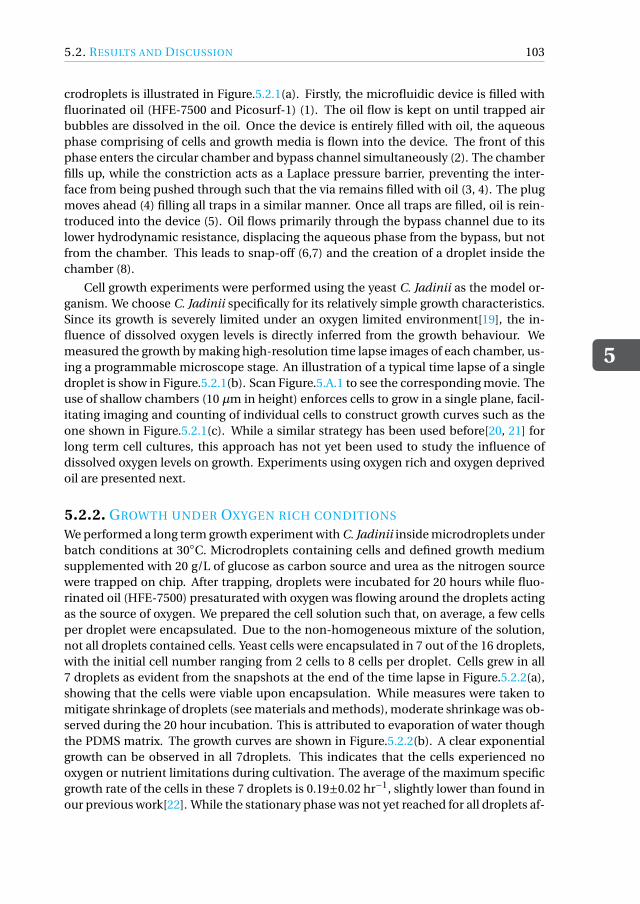
5.2. RESULTS AND DISCUSSION
5
103
crodroplets is illustrated in Figure.5.2.1(a). Firstly, the microfluidic device is filled withfluorinated oil (HFE-7500 and Picosurf-1) (1). The oil flow is kept on until trapped airbubbles are dissolved in the oil. Once the device is entirely filled with oil, the aqueousphase comprising of cells and growth media is flown into the device. The front of thisphase enters the circular chamber and bypass channel simultaneously (2). The chamberfills up, while the constriction acts as a Laplace pressure barrier, preventing the inter-face from being pushed through such that the via remains filled with oil (3, 4). The plugmoves ahead (4) filling all traps in a similar manner. Once all traps are filled, oil is rein-troduced into the device (5). Oil flows primarily through the bypass channel due to itslower hydrodynamic resistance, displacing the aqueous phase from the bypass, but notfrom the chamber. This leads to snap-off (6,7) and the creation of a droplet inside thechamber (8).
Cell growth experiments were performed using the yeast C. Jadinii as the model or-ganism. We choose C. Jadinii specifically for its relatively simple growth characteristics.Since its growth is severely limited under an oxygen limited environment[19], the in-fluence of dissolved oxygen levels is directly inferred from the growth behaviour. Wemeasured the growth by making high-resolution time lapse images of each chamber, us-ing a programmable microscope stage. An illustration of a typical time lapse of a singledroplet is show in Figure.5.2.1(b). Scan Figure.5.A.1 to see the corresponding movie. Theuse of shallow chambers (10 µm in height) enforces cells to grow in a single plane, facil-itating imaging and counting of individual cells to construct growth curves such as theone shown in Figure.5.2.1(c). While a similar strategy has been used before[20, 21] forlong term cell cultures, this approach has not yet been used to study the influence ofdissolved oxygen levels on growth. Experiments using oxygen rich and oxygen deprivedoil are presented next.
5.2.2. GROWTH UNDER OXYGEN RICH CONDITIONS
We performed a long term growth experiment with C. Jadinii inside microdroplets underbatch conditions at 30◦C. Microdroplets containing cells and defined growth mediumsupplemented with 20 g/L of glucose as carbon source and urea as the nitrogen sourcewere trapped on chip. After trapping, droplets were incubated for 20 hours while fluo-rinated oil (HFE-7500) presaturated with oxygen was flowing around the droplets actingas the source of oxygen. We prepared the cell solution such that, on average, a few cellsper droplet were encapsulated. Due to the non-homogeneous mixture of the solution,not all droplets contained cells. Yeast cells were encapsulated in 7 out of the 16 droplets,with the initial cell number ranging from 2 cells to 8 cells per droplet. Cells grew in all7 droplets as evident from the snapshots at the end of the time lapse in Figure.5.2.2(a),showing that the cells were viable upon encapsulation. While measures were taken tomitigate shrinkage of droplets (see materials and methods), moderate shrinkage was ob-served during the 20 hour incubation. This is attributed to evaporation of water thoughthe PDMS matrix. The growth curves are shown in Figure.5.2.2(b). A clear exponentialgrowth can be observed in all 7droplets. This indicates that the cells experienced nooxygen or nutrient limitations during cultivation. The average of the maximum specificgrowth rate of the cells in these 7 droplets is 0.19±0.02 hr−1, slightly lower than found inour previous work[22]. While the stationary phase was not yet reached for all droplets af-
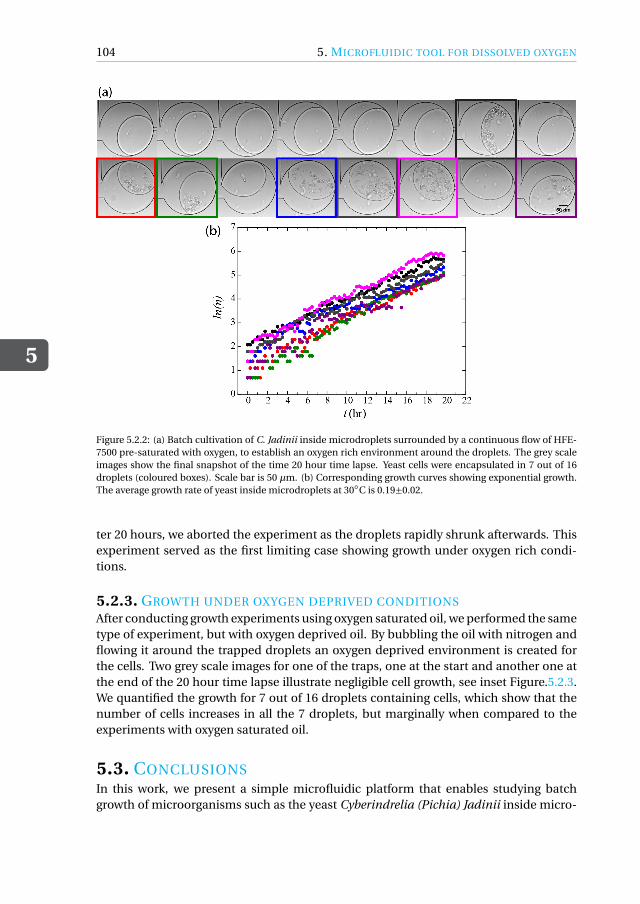
5
104 5. MICROFLUIDIC TOOL FOR DISSOLVED OXYGEN
Figure 5.2.2: (a) Batch cultivation of C. Jadinii inside microdroplets surrounded by a continuous flow of HFE-7500 pre-saturated with oxygen, to establish an oxygen rich environment around the droplets. The grey scaleimages show the final snapshot of the time 20 hour time lapse. Yeast cells were encapsulated in 7 out of 16droplets (coloured boxes). Scale bar is 50 µm. (b) Corresponding growth curves showing exponential growth.The average growth rate of yeast inside microdroplets at 30◦C is 0.19±0.02.
ter 20 hours, we aborted the experiment as the droplets rapidly shrunk afterwards. Thisexperiment served as the first limiting case showing growth under oxygen rich condi-tions.
5.2.3. GROWTH UNDER OXYGEN DEPRIVED CONDITIONS
After conducting growth experiments using oxygen saturated oil, we performed the sametype of experiment, but with oxygen deprived oil. By bubbling the oil with nitrogen andflowing it around the trapped droplets an oxygen deprived environment is created forthe cells. Two grey scale images for one of the traps, one at the start and another one atthe end of the 20 hour time lapse illustrate negligible cell growth, see inset Figure.5.2.3.We quantified the growth for 7 out of 16 droplets containing cells, which show that thenumber of cells increases in all the 7 droplets, but marginally when compared to theexperiments with oxygen saturated oil.
5.3. CONCLUSIONSIn this work, we present a simple microfluidic platform that enables studying batchgrowth of microorganisms such as the yeast Cyberindrelia (Pichia) Jadinii inside micro-
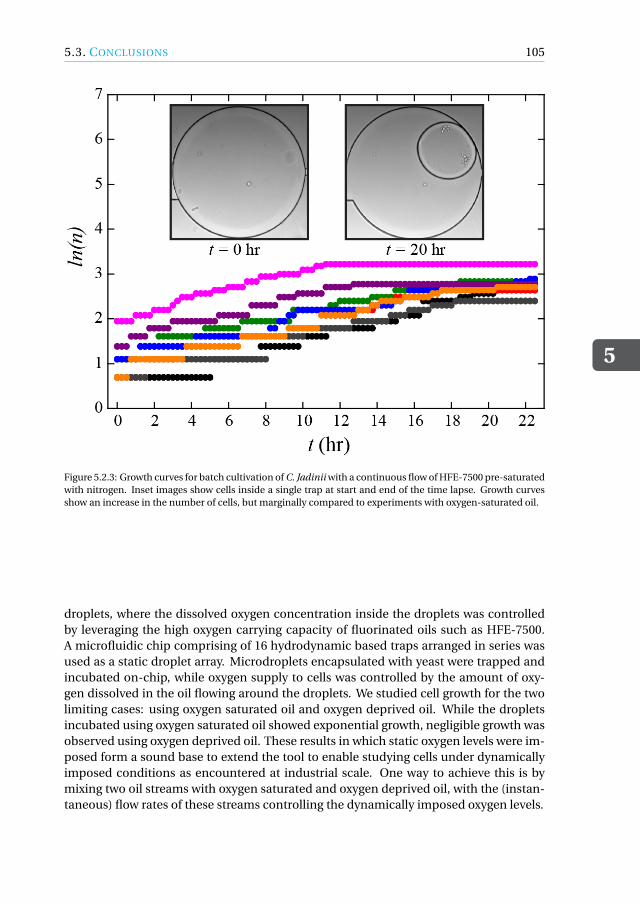
5.3. CONCLUSIONS
5
105
Figure 5.2.3: Growth curves for batch cultivation of C. Jadinii with a continuous flow of HFE-7500 pre-saturatedwith nitrogen. Inset images show cells inside a single trap at start and end of the time lapse. Growth curvesshow an increase in the number of cells, but marginally compared to experiments with oxygen-saturated oil.
droplets, where the dissolved oxygen concentration inside the droplets was controlledby leveraging the high oxygen carrying capacity of fluorinated oils such as HFE-7500.A microfluidic chip comprising of 16 hydrodynamic based traps arranged in series wasused as a static droplet array. Microdroplets encapsulated with yeast were trapped andincubated on-chip, while oxygen supply to cells was controlled by the amount of oxy-gen dissolved in the oil flowing around the droplets. We studied cell growth for the twolimiting cases: using oxygen saturated oil and oxygen deprived oil. While the dropletsincubated using oxygen saturated oil showed exponential growth, negligible growth wasobserved using oxygen deprived oil. These results in which static oxygen levels were im-posed form a sound base to extend the tool to enable studying cells under dynamicallyimposed conditions as encountered at industrial scale. One way to achieve this is bymixing two oil streams with oxygen saturated and oxygen deprived oil, with the (instan-taneous) flow rates of these streams controlling the dynamically imposed oxygen levels.
5
106 5. MICROFLUIDIC TOOL FOR DISSOLVED OXYGEN
5.4. MATERIALS AND METHODS
5.4.1. DEVICE FABRICATION
Microfluidic masters were fabricated from silicon wafers using E-beam lithography anddry etching. Firstly, a 4” silicon wafer was primed with AR 300-80 (Allresist GmbH Ger-many) by spin-coating at 4000 rpm for 1 min. The wafer was baked at 180◦C for 2 mins.Next, the wafer was spin-coated with negative tone resist ARN7700.18 (Allresist GmbHGermany) at 4000 rpm for 1 min and was soft baked at 85◦C for 60 s. A Lecia EBPG5000+ was used for writing the desired pattern on the spin-coated wafer with a dosageof 117µCcm−2 (See Figure.5.B.1 for the complete drawing of microfluidic device). Afterexposure, the wafer was post-baked at 105◦C for 2 mins. The patterns were developedin MF321 (Dow chemical) for 2 mins, followed by rinsing the wafer in diluted MF321solution in water (10% v/v) for 30 s and finally in fresh de-ionised water for 60 s. 10µm of deep reactive-ion etching was achieved using the Bosch process in a Plasma Pro100 Estrelas (Oxford Instruments). The procedure comprised alternate steps of etch-ing (with Sulphur hexafluoride, SF6) and passivation (with Octafluorocylobutane, C4F8).The pressure was maintained at 0.05 mbar. The flow rate in etching step was 225 s.c.c.mSF6 for 8 s with ICP power at 2000 W, while the capacitive coupled plasma(CCP) was off.The passivation step was at flowrate of 80 s.c.c.m with C4F8 for 5 s with the ICP power at2000 W. A constant temperature of 10◦C was maintained during the complete procedure.Temperature of the chamber was maintained around 200◦C. The rate of etching was keptaround 3 µm/min. Resist was then removed using oxygen plasma in the same machine.After plasma surface treatment (40 mbar, 100 W, 3 min), the wafer is passivated againstPDMS by exposing it to fumes of 200 µl 1H, 1H, 2H, 2H- perfluorooctyltrichlorosilane(Sigma Aldrich) in a desiccator under vacuum for 4 hours.
Microfluidic chips were casted out of PDMS (Slygard 184 elastomer kit, Dow corn-ing). The elastomer and curing agent were mixed in 10:1 ratio by weight. The mixturewas degassed and poured on the master wafer in a petridish. PDMS was cured for 3 hrin a convection oven at 70◦C. After curing, PDMS was peeled off carefully from the waferand diced to the desired sizes. The two inlets were punched with a 0.75 mm biopsypunch and the outlet was punched with a 1.5 mm biopsy punch. PDMS chips werecleaned with iso-propyl alcohol to get rid of any dust or debris. The devices were thenbonded to microscopy glass slides that were spin coated with PDMS by exposing themto an oxygen plasma (Harrick, PDC-002) for 160 s at a pressure of 0.2-0.4 mbar. Themicrofluidic chips were then baked at 200◦C for 2 hr for recovery of PDMS’s hydropho-bicity. Small PTFE tubing pieces (0.5 mm ID, 1/16 inch OD, 1.5 cm in length, Kinesis)were glued to the outlet. Stainless steel tubing (0.025 inch OD x 0.013 inch ID, 23g Elve-flow) were glued to the inlets. In order to minimize water evaporation and subsequentdroplet shrinkage during long term growth experiments, the prepared PDMS chips weresoaked in de-mineralised water for 7 days.
5.4.2. EXPERIMENTAL SETUP
A schematic of the entire experimental setup is shown in Figure.5.4.1. As all the microflu-idic experiments included long term cultivation of C. Jadinii inside the chip, it was im-portant to control the temperature, humidity and gas environment around the microflu-
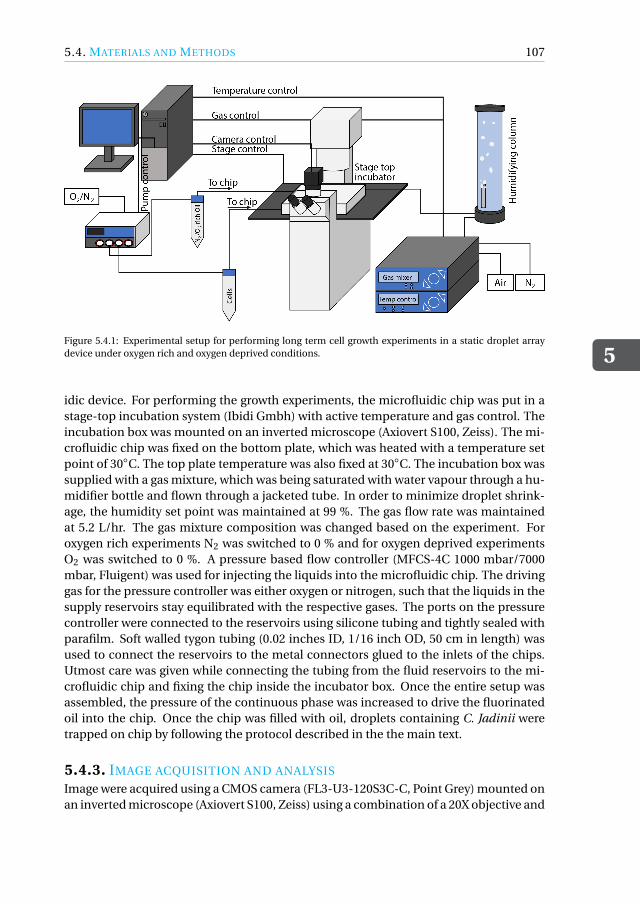
5.4. MATERIALS AND METHODS
5
107
Figure 5.4.1: Experimental setup for performing long term cell growth experiments in a static droplet arraydevice under oxygen rich and oxygen deprived conditions.
idic device. For performing the growth experiments, the microfluidic chip was put in astage-top incubation system (Ibidi Gmbh) with active temperature and gas control. Theincubation box was mounted on an inverted microscope (Axiovert S100, Zeiss). The mi-crofluidic chip was fixed on the bottom plate, which was heated with a temperature setpoint of 30◦C. The top plate temperature was also fixed at 30◦C. The incubation box wassupplied with a gas mixture, which was being saturated with water vapour through a hu-midifier bottle and flown through a jacketed tube. In order to minimize droplet shrink-age, the humidity set point was maintained at 99 %. The gas flow rate was maintainedat 5.2 L/hr. The gas mixture composition was changed based on the experiment. Foroxygen rich experiments N2 was switched to 0 % and for oxygen deprived experimentsO2 was switched to 0 %. A pressure based flow controller (MFCS-4C 1000 mbar/7000mbar, Fluigent) was used for injecting the liquids into the microfluidic chip. The drivinggas for the pressure controller was either oxygen or nitrogen, such that the liquids in thesupply reservoirs stay equilibrated with the respective gases. The ports on the pressurecontroller were connected to the reservoirs using silicone tubing and tightly sealed withparafilm. Soft walled tygon tubing (0.02 inches ID, 1/16 inch OD, 50 cm in length) wasused to connect the reservoirs to the metal connectors glued to the inlets of the chips.Utmost care was given while connecting the tubing from the fluid reservoirs to the mi-crofluidic chip and fixing the chip inside the incubator box. Once the entire setup wasassembled, the pressure of the continuous phase was increased to drive the fluorinatedoil into the chip. Once the chip was filled with oil, droplets containing C. Jadinii weretrapped on chip by following the protocol described in the the main text.
5.4.3. IMAGE ACQUISITION AND ANALYSIS
Image were acquired using a CMOS camera (FL3-U3-120S3C-C, Point Grey) mounted onan inverted microscope (Axiovert S100, Zeiss) using a combination of a 20X objective and
5
108 5. MICROFLUIDIC TOOL FOR DISSOLVED OXYGEN
a 0.63X mount objective. The open source program Micromanager was used for multi-dimensional image acquisition. The stage, microscope and camera were first connectedto a computer and accessed via micromanager. The program uses ImageJ to control theimage acquisition while synchronizing microscope control, stage motion and image ac-quisition through the camera. Once all the droplets were trapped with microorganisms,the location of each droplet was saved. Images were acquired for all the 16 locationsduring the course of entire experiment with a resolution of 4000px by 3000px and at aframe rate of 1 image every 15 mins. In order to maintain the stability of the setup dur-ing the experiments, stage drift speed was set as 5 mm/s. The images were acquired at8-bit instead of the standard 16-bit to make sure that they were of a manageable size.Cell counting and quantification was performed by processing all the time lapse imagesusing a self-written MATLAB script.
5.4.4. WORKING FLUIDS
Continuous phase
Fluorinated oil HFE-7500 (3M, Novec-7500 Engineered fluid) was used as the continuousphase for the microfluidic experiments. In order to ensure droplet stability and completewetting of the PDMS walls by HFE-7500, 0.1% v/v Pico-Surf-1 (SpehereFluidics) was dis-solved in HFE-7500. The oil was bubbled with oxygen or nitrogen for 6 hours before use.
Dispersed phase
Cell solution
Cyberindrelia (Pichia) Jadinii (CBS621) was acquired from the Westerdijk Fungal Bio-diversity Institute, Utrecht, the Netherlands. Cell stocks were stored in 2 ml cryovialscontaining YPD and glycerol (1:10 by volume) inside a freezer at -80◦C.
Preculture media
Before transferring the microorganisms to the defined medium used for on-chip exper-iments, the C. Jadinii cells were pre-cultured in YPD (Yeast-Peptone-Dextrous) media.The YPD medium was prepared by mixing 20 g/L of glucose (Sigma-Aldrich), 10 g/Lof Yeast extract (Sigma-Aldrich) and 20 g/L of Bacteriological peptone (Sigma-Aldrich)in demineralised water. The components were weighed according to the desired finalweight of the media and were thoroughly mixed until everything was dissolved. The so-lution was then filtered through a 0.2 µm syringe filter (Whatman) to filter-sterilize themedium.
Defined media
A defined medium was used for cultivation of Cyberindrelia (Pichia) Jadinii inside themicrodroplets. The defined media was prepared by adding 2.3 g/L of urea (CO(NH2)2,Sigma-Aldrich), 10 g/L of magnesium sulphate heptahydrate (MgSO4.7H2O, Sigma-Aldrich),
5.4. MATERIALS AND METHODS
5
109
3 g/L of potassium hydrogen phosphate (KH2PO4, Sigma-Aldrich) and 20 g/L of glucoseto demineralised water. All components were weighed according to the final weight ofthe medium and dissolved in demineralized water. 1 ml/L of trace element solution and1ml/L of vitamin solution was added to the mixture. The pH value was subsequently ad-justed to 6.0 with a 2M KOH solution and demineralized water was added again to reachthe final weight. The prepared medium was then filter sterilized with a 0.2 µm syringefilter (Whatman) and a 50 ml syringe into a sterile bottle and stored inside a laminar flowcabinet. Detailed protocols for the preparation of the trace elements and the vitamin so-lution can be found in the supporting information of our previous work[22].
Preparation of solutions
All the steps for cell solution preparation were carried out in a laminar flow cabinet. Forevery experiment, a fresh cryovial was obtained from the stock and thawed at room tem-perature. After thawing, 500 µL of cell solution was pipetted into 5 mL of sterilized YPDin an autoclaved round bottom flask of 50 ml. Cotton wool was used to cover the flaskto make sure aeration is sufficient. The shake flask was then incubated for 6 hours in anincubator at 30◦C and 190 rpm. After preculturing, the resulting 5 ml of cell-YPD solu-tion was centrifuged to separate the supernatant YPD and washed with defined media3 times and diluted upto 10 ml of the final cell solution with defined media. 200 µL offresh 20 g/L YPD is pipetted to this mixture to boost the growth of microorganisms insidethe microfluidic chip. The solution of Cyberindrelia (Pichia) Jadinii in defined media istransferred to a 15 ml centrifuge tube and stored at 30◦C in a mini-incubator before star-ing the microfluidic experiments.

APPENDIX
5.A. GROWTH OF C. Jadinii INSIDE MICRODROPLET
Figure 5.A.1: Movie depicting batch growth of Cyberindrelia Jadinii inside microdroplet at 30◦C as shown intime lapse of Figure.5.2.1(b). To see the movie scan the QR code or click here.
5.B. DRAWING OF MICROFLUIDIC DEVICES
Continuous phase(HFE+Picosurf )
Dispersed phase(Cells)
Figure 5.B.1: Drawing of the microfluidic static droplet array device for batch cultivation of Cyberindrelia Ja-dinii
111
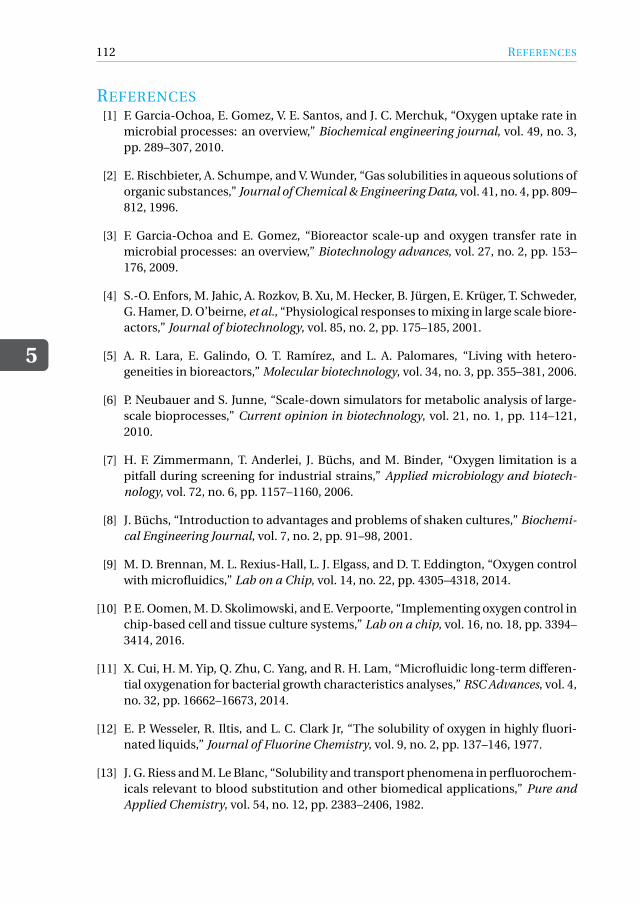
5
112 REFERENCES
REFERENCES[1] F. Garcia-Ochoa, E. Gomez, V. E. Santos, and J. C. Merchuk, “Oxygen uptake rate in
microbial processes: an overview,” Biochemical engineering journal, vol. 49, no. 3,pp. 289–307, 2010.
[2] E. Rischbieter, A. Schumpe, and V. Wunder, “Gas solubilities in aqueous solutions oforganic substances,” Journal of Chemical & Engineering Data, vol. 41, no. 4, pp. 809–812, 1996.
[3] F. Garcia-Ochoa and E. Gomez, “Bioreactor scale-up and oxygen transfer rate inmicrobial processes: an overview,” Biotechnology advances, vol. 27, no. 2, pp. 153–176, 2009.
[4] S.-O. Enfors, M. Jahic, A. Rozkov, B. Xu, M. Hecker, B. Jürgen, E. Krüger, T. Schweder,G. Hamer, D. O’beirne, et al., “Physiological responses to mixing in large scale biore-actors,” Journal of biotechnology, vol. 85, no. 2, pp. 175–185, 2001.
[5] A. R. Lara, E. Galindo, O. T. Ramírez, and L. A. Palomares, “Living with hetero-geneities in bioreactors,” Molecular biotechnology, vol. 34, no. 3, pp. 355–381, 2006.
[6] P. Neubauer and S. Junne, “Scale-down simulators for metabolic analysis of large-scale bioprocesses,” Current opinion in biotechnology, vol. 21, no. 1, pp. 114–121,2010.
[7] H. F. Zimmermann, T. Anderlei, J. Büchs, and M. Binder, “Oxygen limitation is apitfall during screening for industrial strains,” Applied microbiology and biotech-nology, vol. 72, no. 6, pp. 1157–1160, 2006.
[8] J. Büchs, “Introduction to advantages and problems of shaken cultures,” Biochemi-cal Engineering Journal, vol. 7, no. 2, pp. 91–98, 2001.
[9] M. D. Brennan, M. L. Rexius-Hall, L. J. Elgass, and D. T. Eddington, “Oxygen controlwith microfluidics,” Lab on a Chip, vol. 14, no. 22, pp. 4305–4318, 2014.
[10] P. E. Oomen, M. D. Skolimowski, and E. Verpoorte, “Implementing oxygen control inchip-based cell and tissue culture systems,” Lab on a chip, vol. 16, no. 18, pp. 3394–3414, 2016.
[11] X. Cui, H. M. Yip, Q. Zhu, C. Yang, and R. H. Lam, “Microfluidic long-term differen-tial oxygenation for bacterial growth characteristics analyses,” RSC Advances, vol. 4,no. 32, pp. 16662–16673, 2014.
[12] E. P. Wesseler, R. Iltis, and L. C. Clark Jr, “The solubility of oxygen in highly fluori-nated liquids,” Journal of Fluorine Chemistry, vol. 9, no. 2, pp. 137–146, 1977.
[13] J. G. Riess and M. Le Blanc, “Solubility and transport phenomena in perfluorochem-icals relevant to blood substitution and other biomedical applications,” Pure andApplied Chemistry, vol. 54, no. 12, pp. 2383–2406, 1982.
REFERENCES
5
113
[14] J. G. Riess, “Understanding the fundamentals of perfluorocarbons and perfluoro-carbon emulsions relevant to in vivo oxygen delivery,” Artificial cells, blood substi-tutes, and biotechnology, vol. 33, no. 1, pp. 47–63, 2005.
[15] K. Sklodowska and S. Jakiela, “Enhancement of bacterial growth with the help ofimmiscible oxygenated oils,” RSC advances, vol. 7, no. 65, pp. 40990–40995, 2017.
[16] L. Mahler, M. Tovar, T. Weber, S. Brandes, M. M. Rudolph, J. Ehgartner, T. Mayr, M. T.Figge, M. Roth, and E. Zang, “Enhanced and homogeneous oxygen availability dur-ing incubation of microfluidic droplets,” RSC advances, vol. 5, no. 123, pp. 101871–101878, 2015.
[17] P. Abbyad, P.-L. Tharaux, J.-L. Martin, C. N. Baroud, and A. Alexandrou, “Sicklingof red blood cells through rapid oxygen exchange in microfluidic drops,” Lab on aChip, vol. 10, no. 19, pp. 2505–2512, 2010.
[18] H. Boukellal, Š. Selimovic, Y. Jia, G. Cristobal, and S. Fraden, “Simple, robust storageof drops and fluids in a microfluidic device,” Lab on a Chip, vol. 9, no. 2, pp. 331–338, 2009.
[19] W. Visser, W. A. Scheffers, W. H. Batenburg-van der Vegte, and J. P. van Dijken,“Oxygen requirements of yeasts.,” Applied and environmental microbiology, vol. 56,no. 12, pp. 3785–3792, 1990.
[20] A. Dewan, J. Kim, R. H. McLean, S. A. Vanapalli, and M. N. Karim, “Growth kineticsof microalgae in microfluidic static droplet arrays,” Biotechnology and bioengineer-ing, vol. 109, no. 12, pp. 2987–2996, 2012.
[21] M. Sun, S. S. Bithi, and S. A. Vanapalli, “Microfluidic static droplet arrays with tune-able gradients in material composition,” Lab on a Chip, vol. 11, no. 23, pp. 3949–3952, 2011.
[22] K. Totlani, Y.-C. Wang, M. Bisschops, T. de Riese, M. T. Kreutzer, W. M. van Gulik,and V. van Steijn, “Fed-batch droplet nanobioreactor for controlled growth of cy-berlindnera (pichia) jadinii: A proof-of-concept demonstration,” Advanced Materi-als Technologies, p. 2100083, 2021.

6CONCLUSION AND OUTLOOK
The purpose of this chapter is to provide an overview of the work discussed in this disser-tation and to highlight interesting research opportunities. The first part of this chaptersummarizes the major findings with regards to the research goals formulated in Chap-ter 1. The second part of this chapter lists down recommendations and perspectives thatcan be followed for carrying out further research in the future.
115
6
116 6. CONCLUSION AND OUTLOOK
6.1. CONCLUSIONSIn the following three subsections, conclusions of the research goals formulated in theChapter 1 have been briefly discussed.
6.1.1. DROPLET ON-DEMAND GENERATORThe first research goal was on establishment of a robust and scalable nutrient feedingstrategy which could be utilized for culturing microorganisms inside microdroplets infed-batch mode. In order to achieve this, a droplet on-demand (DoD) generator wasdesigned where droplet volume was governed by its geometry. The DoD generator com-prised of two key features: a nozzle (constriction between main and feed channel) anda chamber. The restrictions in height and width of the nozzle and the chamber actedas Laplace pressure barriers. While the nozzle acts as a pressure barrier to hold the in-terface at equilibrium position before droplet formation, the chamber allows for a re-stricted filling of the oil-water interface, thereby decoupling the droplet formation fromits release. A high monodispersity (≤ 5 %) was achieved with droplet volumes beingindependent of operating conditions such as pulse duration and strength, waiting timebetween DoD cycles and interfacial tension between fluids. The scalability of the dropleton-demand generation process was a result of decoupling of droplet formation from itsrelease and transport. The importance of chamber’s presence was illustrated by compar-ing the monodispersity of droplets that were formed using scaled out versions of DoDchips, with and without chamber. The DoD generator was applied for a simple droplet-based assay where multiple dye droplets were sequentially coalesced to a water dropletillustrating its potential for nutrient or reagent addition in non-steady operations suchas nutrient-limited fed-batch cultures.
6.1.2. FED-BATCH DROPLET NANOBIOREACTORThe second research goal as formulated in Chapter 1 was based on the implementationof a droplet-based fed-batch process for nutrient-controlled growth of microorganismssuch as Cyberlindnera jadinii. Breaking away from all the continuous flow devices, whichrequire sophisticated work flows and/or devices, we developed a strategy that allowseasy operation (through a commercially available pressure pump) and relatively easy de-vices. The general strategy we developed is one in which nutrient droplets are generatedon demand throughout the cultivation and chemically coalesced to the cell-containingdroplet immobilized in a trap by temporarily flowing a poor solvent around the droplet-droplet interface. The droplet on-demand generator that was designed and character-ized previously was used for the formation of cell-containing and nutrient-containingdroplets. We illustrated that the droplet on-demand generators can be used to generatebiotechnologically relevant feeding profiles. Controlled microbial growth experimentswere performed by tuning the concentration of the glucose inside the nutrient dropletsand by changing the droplet generation frequency. By changing the glucose concen-tration in nutrient droplets, different growth rates were observed, establishing nutrient-controlled growth. The growth behaviour of the microorganisms for different set of glu-cose concentrations agreed well with a simple growth model and is captured by a singleset of model parameters. This work forms a proof-of-concept of carrying out long termand nutrient controlled growth of microorganism through controlled nutrient supply.
6.1. CONCLUSIONS
6
117
6.1.3. MICROFLUIDIC TOOL FOR DISSOLVED OXYGENThe third research goal as formulated in Chapter 1 was to develop a microfluidic toolthat allows studying microorganisms under dynamically controlled levels of dissolvedoxygen, in order to test the sensitivity of microorganisms for the varying oxygen levelsin industrial scale reactors. The strategy we adopted is to culture cells inside dropletstrapped on a chip, with the main supply of oxygen to the cells coming from the oil flow-ing around the droplets. Fluorinated oil was used, which is known for its high solubilityof oxygen. We performed batch growth experiments under two limiting cases using Cy-berlindnera jadinii as the model microorganism. The first one was with oil saturated byoxygen, the second one with oil deprived from oxygen. Experiments with oxygen satu-rated oil showed much more significant growth for a prolonged period of 20 hours insideall droplets. In contrast, negligible growth was observed in case where the oil was satu-rated nitrogen. Although imposing dynamically controlled variations in the concentra-tion dissolved oxygen was out of scope, these experiments form a solid basis of such astudy. The proposed methodology can be further developed into a robust droplet-basedmethod where microorganisms can be cultured and screened under changing levels ofdissolved oxygen.
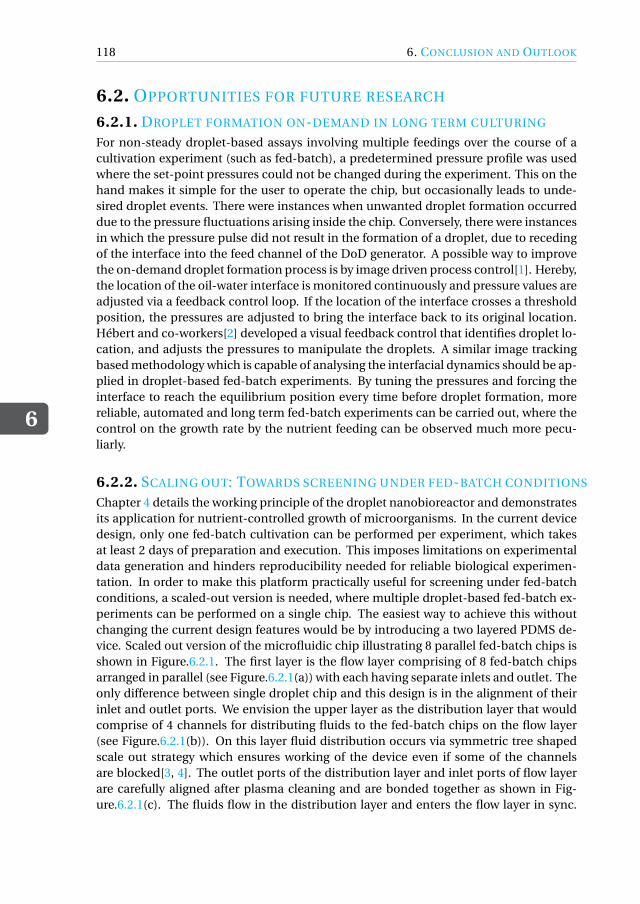
6
118 6. CONCLUSION AND OUTLOOK
6.2. OPPORTUNITIES FOR FUTURE RESEARCH
6.2.1. DROPLET FORMATION ON-DEMAND IN LONG TERM CULTURING
For non-steady droplet-based assays involving multiple feedings over the course of acultivation experiment (such as fed-batch), a predetermined pressure profile was usedwhere the set-point pressures could not be changed during the experiment. This on thehand makes it simple for the user to operate the chip, but occasionally leads to unde-sired droplet events. There were instances when unwanted droplet formation occurreddue to the pressure fluctuations arising inside the chip. Conversely, there were instancesin which the pressure pulse did not result in the formation of a droplet, due to recedingof the interface into the feed channel of the DoD generator. A possible way to improvethe on-demand droplet formation process is by image driven process control[1]. Hereby,the location of the oil-water interface is monitored continuously and pressure values areadjusted via a feedback control loop. If the location of the interface crosses a thresholdposition, the pressures are adjusted to bring the interface back to its original location.Hébert and co-workers[2] developed a visual feedback control that identifies droplet lo-cation, and adjusts the pressures to manipulate the droplets. A similar image trackingbased methodology which is capable of analysing the interfacial dynamics should be ap-plied in droplet-based fed-batch experiments. By tuning the pressures and forcing theinterface to reach the equilibrium position every time before droplet formation, morereliable, automated and long term fed-batch experiments can be carried out, where thecontrol on the growth rate by the nutrient feeding can be observed much more pecu-liarly.
6.2.2. SCALING OUT: TOWARDS SCREENING UNDER FED-BATCH CONDITIONS
Chapter 4 details the working principle of the droplet nanobioreactor and demonstratesits application for nutrient-controlled growth of microorganisms. In the current devicedesign, only one fed-batch cultivation can be performed per experiment, which takesat least 2 days of preparation and execution. This imposes limitations on experimentaldata generation and hinders reproducibility needed for reliable biological experimen-tation. In order to make this platform practically useful for screening under fed-batchconditions, a scaled-out version is needed, where multiple droplet-based fed-batch ex-periments can be performed on a single chip. The easiest way to achieve this withoutchanging the current design features would be by introducing a two layered PDMS de-vice. Scaled out version of the microfluidic chip illustrating 8 parallel fed-batch chips isshown in Figure.6.2.1. The first layer is the flow layer comprising of 8 fed-batch chipsarranged in parallel (see Figure.6.2.1(a)) with each having separate inlets and outlet. Theonly difference between single droplet chip and this design is in the alignment of theirinlet and outlet ports. We envision the upper layer as the distribution layer that wouldcomprise of 4 channels for distributing fluids to the fed-batch chips on the flow layer(see Figure.6.2.1(b)). On this layer fluid distribution occurs via symmetric tree shapedscale out strategy which ensures working of the device even if some of the channelsare blocked[3, 4]. The outlet ports of the distribution layer and inlet ports of flow layerare carefully aligned after plasma cleaning and are bonded together as shown in Fig-ure.6.2.1(c). The fluids flow in the distribution layer and enters the flow layer in sync.
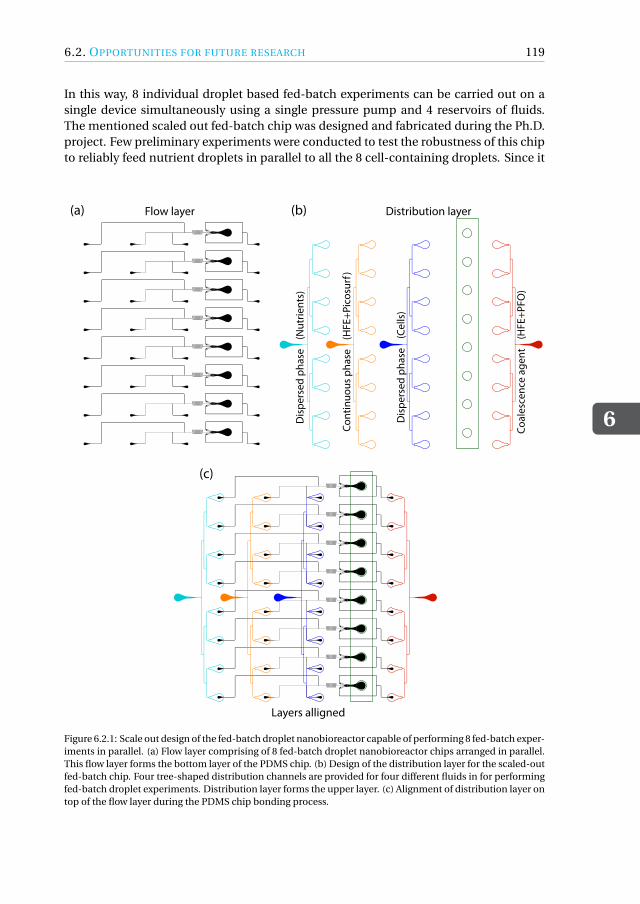
6.2. OPPORTUNITIES FOR FUTURE RESEARCH
6
119
In this way, 8 individual droplet based fed-batch experiments can be carried out on asingle device simultaneously using a single pressure pump and 4 reservoirs of fluids.The mentioned scaled out fed-batch chip was designed and fabricated during the Ph.D.project. Few preliminary experiments were conducted to test the robustness of this chipto reliably feed nutrient droplets in parallel to all the 8 cell-containing droplets. Since it
(a) (b)
(c)
Flow layer Distribution layer
Layers alligned
Cont
inuo
us p
hase
(H
FE+P
icos
urf)
Dis
pers
ed p
hase
(C
ells
)
Dis
pers
ed p
hase
(N
utrie
nts)
Coal
esce
nce
agen
t (
HFE
+PFO
)
Figure 6.2.1: Scale out design of the fed-batch droplet nanobioreactor capable of performing 8 fed-batch exper-iments in parallel. (a) Flow layer comprising of 8 fed-batch droplet nanobioreactor chips arranged in parallel.This flow layer forms the bottom layer of the PDMS chip. (b) Design of the distribution layer for the scaled-outfed-batch chip. Four tree-shaped distribution channels are provided for four different fluids in for performingfed-batch droplet experiments. Distribution layer forms the upper layer. (c) Alignment of distribution layer ontop of the flow layer during the PDMS chip bonding process.
6
120 6. CONCLUSION AND OUTLOOK
was challenging to synchronize the on-demand formation and coalescence of nutrientdroplets, the robustness and feasibility of the scaled-out chip still needs further experi-mentation.
6.2.3. INCORPORATION OF ANALYTICS: TOWARDS SCREENING UNDER FED-BATCH CONDITIONS
After a successful implementation of droplet-based fed-batch nanobioreactor for cul-tivation of microorganisms in Chapter 4, the next challenge would be measurementand quantification of secreted products of interest. A common methodology to quantifythe secreted metabolites in droplet-based microfluidic systems is by using fluorescence-based assays[5]. For example, fermentation of Saccharomyces cerevisiae on high glucoseconcentration yields ethanol while a metabolically engineered strain of Saccharomycescerevisiae yields succinic acid under nitrogen starved conditions. Both of these productscan be quantified using fluorescent assays. Cela and co-workers[6] developed a methodfor measuring concentration of ethanol inside microdroplets. Cyanobacteria was en-capsulated in aqueous droplets with media and incubated for 48 hours. To determinethe ethanol concentration inside the droplets, assay reagent droplets (consisting of alco-hol oxidase, horseradish peroxidase and amplex red) were coalesced with the incubateddroplets and again incubated for the assay reaction to proceed. The amount of ethanolwas quantified based on the fluorescence intensity emitted by resorufin which was re-leased upon the assay reaction. In another study, Sun and co-workers[7] reported using adouble enzyme assay for quick measurement of succinic acid produced by E. coli strains.A simple extension of the current fed-batch droplet nanobioreactor would be introduc-tion of a third DoD junction that can be used for generating assay reagent droplets. Af-ter the fed-batch cultivation ends, assay droplets could be generated on-demand andcoalesced to the droplet containing the microorganisms and secreted product of inter-est to initiate the assaying reaction. A fluorescence-based assay reporter would give anend point measurement of the product after the cultivation is complete. Care should betaken to design the experiments in such a way that the product of interest remains in-side the droplets and does not leak into the surrounding oil[8, 9]. Readers are referred toa recent review by van Tatenhove-Pel and co-workers which is on screening of microor-ganisms based on extracellular product measurement in droplet microfluidics[10].
Monitoring and controlling pH within the droplets also remains a technical chal-lenge towards developing a droplet based screening platform. Tovar and co-workersused a fluorescent reporter dye 6-carboxyfluorescein in aqueous phase and correlate thepH to its fluorescent intensities[11]. In one of the studies for controlling the pH insidemicrodroplets, Mashaghi and co-workers demonstrated increase and decrease of pH byadding reagents such as acetic acid and propyl amine to the continuous oil phase[12].The transport of the reagents that were soluble in both the aqueous and oil phase wasmediated by diffusive mechanism from the oil phase. Similar pH control strategies canbe applied to the proposed fed-batch droplet microreactor such that the microorgan-isms can have a similar well-controlled environment as they face in an industrial scalereactor.
6.2. OPPORTUNITIES FOR FUTURE RESEARCH
6
121
6.2.4. IMPOSING FLUCTUATIONS IN DISSOLVED OXYGEN CONCENTRATIONSOne of the outstanding challenges in using droplet bioreactors to carry out microbiologi-cal studies is controlling concentration of gases such as oxygen during the incubation[13].While chapter 5 described preliminary results on cultivation of microorganisms undertwo different concentrations of dissolved oxygen, imposing fluctuations of dissolvedoxygen concentrations during microbial growth inside the droplets remained out of scope.A possible way to extend the current microfluidic device for achieving this is by connect-ing two independent fluorinated oil sources to the continuous phase inlet. One of theoil lines should be enriched in pure oxygen while the other fluorinated oil should becompletely drained of oxygen by enriching it with pure nitrogen. These two fluorinatedoil tubing can be joined by a flow control valve before entering the microfluidic chip.Depending on the relative flowrates of the two oil channels, concentration of dissolvedoxygen in the microfluidic chip can be changed during the droplet incubation exper-iments. A similar approach was used in experiments by Abbyad and co-workers[14],where sickling of red blood cells was studied due to unavailability of dissolved oxygeninside microdroplets.
Real time measurement of dissolved oxygen concentration in each microdroplet isalso of key importance while imposing DO concentration fluctuations during the incu-bation of microorganisms. Oxygen-sensitive fluorescent ruthenium compounds suchas ruthenium tris(2,2’-dipyridyl) dichloride hexahydrate (RTDP) have been extensivelyused for sensing of oxygen by Fluorescence lifetime imaging microscopy (FLIM)[14–16]. Alternatively, oxygen sensor nanoparticles with phosphorescent indicator dye couldbe co- encapsulated with microorganisms and media for real time read-out of oxygenconcentration inside the microdroplets by combining it with phosphorescence lifetime-based measurement[17].
6
122 REFERENCES
REFERENCES[1] C. Girabawe and S. Fraden, “An image-driven drop-on-demand system,” Sensors
and Actuators B: Chemical, vol. 238, pp. 532–539, 2017.
[2] M. Hébert, M. Courtney, and C. L. Ren, “Semi-automated on-demand control ofindividual droplets with a sample application to a drug screening assay,” Lab on aChip, vol. 19, no. 8, pp. 1490–1501, 2019.
[3] G. Tetradis-Meris, D. Rossetti, C. Pulido de Torres, R. Cao, G. Lian, and R. Janes,“Novel parallel integration of microfluidic device network for emulsion formation,”Industrial & engineering chemistry research, vol. 48, no. 19, pp. 8881–8889, 2009.
[4] H.-H. Jeong, D. Issadore, and D. Lee, “Recent developments in scale-up of microflu-idic emulsion generation via parallelization,” Korean journal of chemical engineer-ing, vol. 33, no. 6, pp. 1757–1766, 2016.
[5] B. L. Wang, A. Ghaderi, H. Zhou, J. Agresti, D. A. Weitz, G. R. Fink, andG. Stephanopoulos, “Microfluidic high-throughput culturing of single cells for se-lection based on extracellular metabolite production or consumption,” Naturebiotechnology, vol. 32, no. 5, p. 473, 2014.
[6] S. Abalde-Cela, A. Gould, X. Liu, E. Kazamia, A. G. Smith, and C. Abell, “High-throughput detection of ethanol-producing cyanobacteria in a microdroplet plat-form,” Journal of The Royal Society Interface, vol. 12, no. 106, p. 20150216, 2015.
[7] L. Sun, H. Zhang, H. Yuan, R. Tu, Q. Wang, and Y. Ma, “A double-enzyme-coupledassay for high-throughput screening of succinic acid-producing strains,” Journal ofapplied microbiology, vol. 114, no. 6, pp. 1696–1701, 2013.
[8] G. Etienne, A. Vian, M. Biocanin, B. Deplancke, and E. Amstad, “Cross-talk betweenemulsion drops: how are hydrophilic reagents transported across oil phases?,” Labon a Chip, vol. 18, no. 24, pp. 3903–3912, 2018.
[9] P. Gruner, B. Riechers, B. Semin, J. Lim, A. Johnston, K. Short, and J.-C. Baret, “Con-trolling molecular transport in minimal emulsions,” Nature communications, vol. 7,no. 1, pp. 1–9, 2016.
[10] R. J. van Tatenhove-Pel, J. A. Hernandez-Valdes, B. Teusink, O. P. Kuipers, M. Fis-chlechner, and H. Bachmann, “Microdroplet screening and selection for improvedmicrobial production of extracellular compounds,” Current opinion in biotechnol-ogy, vol. 61, pp. 72–81, 2020.
[11] M. Tovar, L. Mahler, S. Buchheim, M. Roth, and M. A. Rosenbaum, “Monitoring andexternal control of ph in microfluidic droplets during microbial culturing,” Micro-bial cell factories, vol. 19, no. 1, pp. 1–9, 2020.
[12] S. Mashaghi and A. M. Van Oijen, “External control of reactions in microdroplets,”Scientific reports, vol. 5, no. 1, pp. 1–8, 2015.
REFERENCES
6
123
[13] T. S. Kaminski, O. Scheler, and P. Garstecki, “Droplet microfluidics for microbiology:techniques, applications and challenges,” Lab on a Chip, vol. 16, no. 12, pp. 2168–2187, 2016.
[14] P. Abbyad, P.-L. Tharaux, J.-L. Martin, C. N. Baroud, and A. Alexandrou, “Sicklingof red blood cells through rapid oxygen exchange in microfluidic drops,” Lab on aChip, vol. 10, no. 19, pp. 2505–2512, 2010.
[15] G. Mehta, K. Mehta, D. Sud, J. W. Song, T. Bersano-Begey, N. Futai, Y. S. Heo, M.-A.Mycek, J. J. Linderman, and S. Takayama, “Quantitative measurement and controlof oxygen levels in microfluidic poly (dimethylsiloxane) bioreactors during cell cul-ture,” Biomedical microdevices, vol. 9, no. 2, pp. 123–134, 2007.
[16] M. D. Brennan, M. L. Rexius-Hall, L. J. Elgass, and D. T. Eddington, “Oxygen controlwith microfluidics,” Lab on a Chip, vol. 14, no. 22, pp. 4305–4318, 2014.
[17] M. Horka, S. Sun, A. Ruszczak, P. Garstecki, and T. Mayr, “Lifetime of phosphores-cence from nanoparticles yields accurate measurement of concentration of oxygenin microdroplets, allowing one to monitor the metabolism of bacteria,” Analyticalchemistry, vol. 88, no. 24, pp. 12006–12012, 2016.

OUTREACH
JOURNAL PAPERS
7. Totlani, K., van Tatenhoeven-Pel, R. J., Kreutzer, M. T., van Gulik, W. M., and vanSteijn, V., Microbioreactors for nutrient-controlled microbial cultures: Bridging thegap between early bioprocess development and industrial scale use, To be submittedto Biotechnology Journal (2021).
6. Totlani, K., Katakwar, P., du Pree, N., Kreutzer, M. T., van Gulik, W. M., and vanSteijn, V., Microfluidic static droplet array to study microbial growth under differentlevels of dissolved oxygen, To be submitted to Micromachines (2021).
5. Totlani, K., Wang, Y., Bisschops, M. M., de Riese, T., Kreutzer, M. T., van Gulik,W. M., and van Steijn, V., Fed-Batch Droplet Nanobioreactor for Controlled Growthof Cyberlindnera (Pichia) jadinii: A Proof-Of-Concept Demonstration, AdvancedMaterials Technologies, 6, 2100083, (2021).
4. Totlani, K., Hurkmans, J., van Gulik, W. M., Kreutzer, M. T., and van Steijn, V., Scal-able microfluidic droplet on-demand generator for non-steady operation of droplet-based assays, Lab on a Chip, 20(8), 1398-1409, (2020).
3. Mytnyk, S., Ziemecka, I., Olive, A. G., van der Meer, J. W. M., Totlani, K., Oldenhof,S., Kreutzer, M. T., van Steijn, V., and van Esch, J., Microcapsules with a permeablehydrogel shell and an aqueous core continuously produced in a 3D microdevice byall-aqueous microfluidics, RSC Advances, 7(19), 11331-11337, (2017).
2. Hasabnis, N. S., Totlani, K., and Ranade, V. V., Heat transfer and mixing in flowthrough pinched pipe, The Canadian Journal of Chemical Engineering, 93(10), 1860-1868, (2015).
1. Totlani, K., Mehta, R., and Mandavgane, S. A.,Comparative study of adsorption ofNi (II) on RHA and carbon embedded silica obtained from RHA, Chemical Engi-neering Journal, 181, 376-386, (2012).
CONFERENCE PRESENTATIONS
6. Miniaturized Systems for Chemistry and Life Sciences (µTAS), Switzerland, 2019.
5. Implementation of Microreactor Technology in Biotechnology (IMTB), Croatia,2019.
4. Physics at Veldhoven, Netherlands, 2019.
125

126 OUTREACH
3. Netherlands Process Technology Symposium (NPS), Netherlands, 2018.
2. Physics at Veldhoven, Netherlands, 2017.
1. Internation Conference on Bioencapsulation, Netherlands, 2015.
PROPOSITIONS
1. Microfluidics promises Lab-on-a-Chip yet delivers Chip-in-a-Lab.
2. Validation through organs-on-chips should be commonplace in pre-clinical stud-ies.
3. Geometry-mediated strategies make droplet-based microfluidics for semi-continuouscell-cultures accessible to non-experts. (Chapter-3, this thesis).
4. Simplicity and brevity in scientific writing has been sold out to pre-empting criti-cism during peer review.
5. TU Delft’s applied sciences’ grading scheme is biased in favour of theoretical projects.
6. Instant gratification in the world of social media leads to a generation lacking sci-entific rigour.
7. Development of technology for rapid diagnosis of diseases deserves more mediaattention than self-driven cars.
8. Importance of lazy geniuses is underrated.
9. Principal Investigators should spend more of their time in the lab.
10. Owing to the funding inequity, global university rankings can’t be taken seriously.
These propositions are regarded as opposable and defendable, and have been approvedas such by the promotor prof. dr. ir. M. T. Kreutzer and co-promoters dr. W. M. van Gulik
and dr. V. van Steijn
127

ACKNOWLEDGEMENTS
Welcome to the most read section of a Ph.D. thesis! After going through the colourfulimages in this book, most of you have skipped the main part of the text to read this sec-tion ;-). This Ph.D. has been quite a journey. Right from experimenting with microscopicobjects in the lab to writing huge pieces of text; bits of anxiety, self-doubt, burnout, andvery recently, a pandemic have also been parts of this incredible journey. Several peoplehave helped me navigate through this, be it during the turbulent times or when the sail-ing was smooth. Therefore, I would like to take this opportunity to express my heartfeltgratitude to those who have supported me throughout this journey.
First and foremost Volkert, thank you for providing me with the opportunity to beassociated with you as a researcher for both M.Sc. and Ph.D. projects. I vividly remem-ber you mentioned about this Ph.D project to me during lunch after my M.Sc. halfwaypresentation. Honestly, you being a supervisor was a key element for my decision intaking up this Ph.D. project. Your role has been pivotal in shaping me as a researcher. Ireally enjoyed the brainstorming sessions during our science-only meetings, especiallythe open-ended ones at the end of the day. I would definitely miss our interactions ondesigning simple yet novel microfluidic architectures. You are one of those rare princi-pal investigators who believe in stepping inside the lab when needed. I still rememberthe initial days of my Ph.D. when you taught me photolithography in the cleanroom. Myskill in making multi-layered wafers with ease is a result of your mentorship. There weremany instances when you dropped by the lab to check on the experiments and providedfeedback for improvement. I learned a lot from you on writing crisp papers and mak-ing elegant presentations. You had the eye for detail and quest for perfection which wasalways reflected in the edits. You have inspired me as a teacher since the first day ofMTP in 2013. I really enjoyed being a TA for MTP and cherish our discussions during theexam correction sessions. Only after watching you teach and prepare for courses withso much enthusiasm, I realized that teaching can also be a satisfying element of an aca-demic career. Apart from being an excellent researcher and a coach, you have been avery kind human being. Your work-life balance is something I aspire to emulate in mycareer. Despite being packed with education duties during different times of the year,you managed to find time for research and ensured things kept pace. You understoodthe experimental complexity of this project and supported me with whatever you could.I am really proud of our LOC & AMT paper and look forward to collaborating with youeven after the Ph.D.
Walter, you were a key supervisory team member in this interdisciplinary project. Icame running to you when the biotechnological challenges of the project popped up.You were always accessible and willing to help with experimental issues. Your sugges-tions during our progress meetings were extremely valuable and you always encouragedme to design the droplet-based fed-batch experiments to check its feasibility. I was verycertain that I was in safe hands as your knowledge in your field is incredible. I am thank-
129
130 ACKNOWLEDGEMENTS
ful that I got the opportunity to attend your lectures during the FTEB advanced course.Thank you for all the critical feedback you provided during the manuscript preparationwhich was also valuable in shaping up this thesis.
Michiel, your critical reasoning and the ability to formulate crisp research questionsis outstanding. Although our interaction was limited to only the progress meetings, yourknowledge and experience made sure I gained remarkable help and learnt significantlyduring these meetings. You always challenged the experimentalist inside me to thinkcritically about the worth of doing an experiment before stepping in the lab. Your styleof writing is something I would really like to follow for the papers I write in the future.Your sharp and on-point feedback on the manuscripts helped me improve them signif-icantly. Thank you for providing a stimulating research environment in the departmentof Chemical Engineering in these years.
I wish to thank Prof. Piotr Garstecki, Prof. Fridrer Mugele, Prof. Pascale Daran-Lapujade, Prof. Christian Poelma and Prof. Chris Kleijn for taking out time to evaluatemy doctoral dissertation and also for agreeing to be part of my doctoral defense com-mittee.
I would also like to thank Prof. Sef Heijnen for fruitful discussions during the FTEBcourse about various aspects of the droplet nanobioreactor. Thank you Dr. Marco vanden Berg and Dr. Jeff Lievense for reviewing and providing your critical insights on thefed-batch paper. Your feedback really improved the paper. I would also like to thank Dr.Marco for the discussions during the initial days for shaping up the research goals of thisproject.
During my entire Ph.D. tenure, several experimental challenges came in the way.I was fortunate to be surrounded by skillful technicians and research engineers bothwithin the ChemE and Biotechnology departments. I would like to thank each one ofthem for their help, valuable input, and suggestions.
First of all, Wim, thank you for the smooth initiation of the work with yeast. Youguided me with the lab work involving microorganisms and helped me kick start theproject. You were also responsible for mentoring me in the cleanroom. Thank you formaking wafers on short notice during my M.Sc. project. I really appreciate your help inordering chemicals and related material to ensure a smoothly running laboratory. Mo-jgan, you helped us a lot when the group didn’t have a technician. Thank you for effi-ciently managing the ALD lab as well. Your pleasant personality is infectious. Stefan,you were an extremely helpful technician and rarely said no to our fabrication requests.You fabricated a simple yet elegant stage top cultivation chamber which was very use-ful for performing long-term growth experiments. I really regret not making that boxduring the first year. Bas, even though we interacted briefly during your tenure as a labtechnician and also during your weekly visits, it was my pleasure to interact with you.Discussions with you on subtleties in microfluidic chip fabrication and the challengeswith long term cell culturing experiments inside microfluidic chips were very insightful.You taught me small improvements in chip preparation can lead to big differences dur-ing imaging. Kristen, even though we didn’t have significant overlap, having you aroundin the lab with your amazing organizational skills was really nice. Evert, Christian, andDuco, a lot of times I came running to your offices seeking help with different problems.All three of you were very kind to help me out to the best of your abilities. Evert, thank
ACKNOWLEDGEMENTS 131
you for your support with setting up the camera for long-term DOD experiments. Youmade the stuff look really simple. Christian, you were our go-to person for items relatedto electronic support. Duco, as a group we got your help with the vacuum pumps for thePDMS station which was really critical for everyone working on microfluidics.
Apart from ChemE, I got a lot of help from technicians of the Biotechnology depart-ment. There were a lot of instances where we performed bench scale/ microtiter plateexperiments in various labs at Biotechnology. Max, Stef, and Song , all three of you areheroes. Please accept my heartfelt gratitude. I still remember the first year of my Ph.D.when Max, you arranged my admission to the lab course and ensured things were goingfine. Stef, you helped a lot during the Maxime’s M.Sc project to set up automated imageanalysis. Often, we took the droplet containing chips from PPE to your lab for performingcell counting analysis and you were so enthusiastic to help us by setting up the micro-scope yourself. Song, I really appreciate your kindness and helping nature. You alongwith Max provided to us a lot of support for carrying our bench-scale experiments at BTlabs on multiple occasions and also answered our doubts on batch/fed-batch processes.Astrid, Apilena and Jannie, I really appreciate your jolly and helpful nature. Thank youfor your help and support with making and providing cell growth media on short notices.You responded rapidly to my email requests for culturing protocols and other solutionrequests from the Biotech kitchen.
Along with the technical work, there were a bunch of people who helped me withthe administrative part of the project. I would like to extend my gratitude to Astrid, Elly,and Leslie. Thank you all three of you for arranging the meetings with supervisors andpaperwork during my stay at TU Delft. I have bothered you a lot during the hospitalityextensions and reimbursement procedures. Thanks a lot for keeping so much patience.
Next, the faculty members of the PPE group. Thank you Pouyan, Ruud, Gabrie,Henk, and Peter for the scientific interactions during our journal clubs/group meet-ings and for the fun times during our group outings, barbeques and Christmas dinners.Pouyan, your feedback on comparing parallel DoD generators during one of the groupmeetings was extremely useful for the paper. It was fun having discussions with youduring shifting of our department to the new building and setting up the new bio & mi-croscopy labs. Ruud, Thank you for keeping the group cohesive and providing an amaz-ing research environment at PPE. I would also like to thank you for arranging my M.Sc.research internship at Merck Sharp & Dohme. Watching you and Pouyan get competi-tive during the paintball match was fun. Gabrie, your guidance on translating to indus-try from research was very nice and I really wished I could have written a valorizationchapter for my thesis. Henk your enthusiasm for cycling and fitness was really inspiring.Peter, you were the education director of our M.Sc. program and also the first profes-sor with whom I interacted after joining TU Delft. Thank you for being considerate tostudents every time and managing our education smoothly. Thank you all of you for avibrant research environment in the group and also for conversations at the coffee cor-ner.
Serhii, you were my supervisor during my M.Sc. thesis and later became my col-league at PPE. Thank you so much for taking out time for numerous discussions andhelping me with different experiments throughout. Thanks a lot for solving problemsrelated to micromanager and image capturing. I really enjoyed our cleanroom sessions
132 ACKNOWLEDGEMENTS
as well.
I am thankful to the Ph.D.s and postodcs of the PPE group. Durgesh, thank you forthe discussions and support during my M.Sc. project. There were a number of times Icame to you with doubts on microfluidic instrumentation. You answered them with alot of patience. Dayinta, I really appreciate your jolly nature. Thank you for the amazingtimes during lunch and coffee sessions at PPE. Shifting the department with you in theteam was very nice. Fabio, your academic brilliance amazed me a lot. Thank you forthe lively debates during journal clubs and group meetings. Dominik, your positivityand enthusiasm in binding the group together was infectious. I just loved how you man-aged your work-life balance. While being busy with experiments during major part ofyour Ph.D. you made sure to give time to sports activities such as Frisbee. I would reallylike to take that with me. We had numerous discussion where we shared our frustrationon experimental challenges. I loved your and Shaurya’s question answer round duringour lunch. Thank you for being an amazing colleague. Damiano, your presence in thegroup was extremely soothing. I remember a lot of times both of us laughing loudly onsecret jokes(sshhh!). Your take on issues with the current academic system was thoughtprovoking for me. I would never forget your reaction on the Indianised version of pastaI made(there was corn in the pasta!). Lea, your dedication towards research was mindblowing. Erik, you were the new addition to the microfluidics group. It was comfortingto see yet another group member become a part of this field. I really enjoyed our dis-cussions on microfluidics in the Biolab and microfabrication in the cleanroom. Aswin, Ispent a lot of time in the lab with you being around. I remember you used to come to-wards my setup and always appreciated the droplet on-demand formation process witha smile on your face. While being in the lab we discussed the issues with our respectiveexperiments and went back again continuing the same experiments. These are the mem-ories I would always cherish. I wished we had a bigger overlap during our Ph.D. I wouldlove to see you soon in Indian academia someday and perhaps collaborate on a projecttoo. Albert, I appreciate your hard work and dedication towards your Ph.D. project. Iwished we could have worked together on the microfluidics project for a longer dura-tion. Best of luck for your Ph.D. Georg, Hamid, Afshin, Fuweng, Feilong, Isabell, Zaidand Ruben. Thank you so much for keeping the group so vibrant and lively. The lunchhours during the end of my Ph.D. became more engaging due your presence.
I am also thankful to the colleagues from the TP group. Sid, I am really sad that wedid not interact during the initial years of my Ph.D. Nevertheless, I am now happy thatI got to know you eventually. The amount of knowledge you have feels like you knowmostly about everything in this world ;-) Honestly, I haven’t seen a creative and intelli-gent person like you being so humble and modest. I deeply enjoyed our discussions onpolitics, comedy and the state of journalism in India. I wished we could have met onelast time before leaving Netherlands. I am super confident that, soon you would bag apermanent academic position at a reputed university and as I always say if you won’t getit, then who else would! Manas you have a very pleasant and jolly personality. We hadloads of discussion about life as an experimentalist and times that each one of us spent atNCL. Thank you for helping me out with surface tension measurements and for alwaysbeing so accessible. Also, thank you for inviting me to the amazing dinners at variousoccasions. Manu it was fun having conversations and sharing the Ph.D. frustration with
ACKNOWLEDGEMENTS 133
you during our unplanned coffee breaks. I really appreciated your sincerity and dedica-tion towards your Ph.D. work. Chirag, thank you for letting me stay at your house duringthe initial weeks of my Ph.D. Your take on life and science was really refreshing. Yourguidance on pursuing acads in India was useful. Hrushikesh, I really enjoyed discussingtransport phenomena with you during the ATP sessions and even after starting the Ph.D.You always challenged me to think on the physics of the process rather than just lookingat the bigger picture.
Throughout this Ph.D. project, I have had the opportunity and privilege to supervisemany M.Sc./ B.Sc. students. Piyush, you were my first student and it was a bit nostalgicfor me to have a student who was also an alumnus of Chemical Engineering, VNIT. Youstarted your M.Sc. thesis within the first six months of me starting this project. I have toadmit that I was slightly lost during the initial phase. You worked independently througha major chunk of your project and delivered what you promised. I hope we can submitour paper on your and Naomi’s work soon. Next, Thorben, you joined as a short-termexchange student from Hamburg and started experiments on day one. Within just twomonths, you managed to run the first automated fed-batch experiment. Your insightson the toxicity of coalescence agent were extremely useful in deciding the course of theexperiments. I must say, I could foresee a robust and working fed-batch chip after yourshort stint. I wished you could have done your M.Sc. thesis here in Delft as well. Maxime,you joined in next and continued working on the setup that Thorben and I had built. Be-ing from Biotechnology, you offered a very fresh perspective to the project with regardsto the fed-batch experiments and modeling. Even though you faced a lot of experimentalchallenges during your project, your thesis was solid and your conclusions provided use-ful insights. A lot of times you went out of your way to collaborate with technicians fromBT for sake of this project. Alex and Jan-Willem, thank you both for your contributionsto the Droplet on Demand project. Alex you performed the preliminary experiments forDoD generation and provided a nice start. Jan-Willem you came in next and acceleratedthe project during your four month tenure. I am really happy that this work was eventu-ally published in Lab on a Chip and ended up on the front cover. Naomi, you continuedon Piyush’s work and took the project to the next level. Your hard work and dedication tothe project were really inspiring to me. It amazed me, that even after several failed exper-iments in a row, you had the patience to go into the lab and run the experiment one moretime. Thank you so much for editing the Dutch version of the summary for this thesis.Yen, you built on Thorben’s and Maxime’s work. Your contribution was very significantfor the completion of the fed-batch project. You were extremely efficient and productivewith your work. You designed the fed-batch experiments using the first principles andthen systematically performed them. Not only that, images from your thesis ended upin our Advanced Materials Technologies paper which I am really proud of. I wished wecould have met one last time before you departed from Delft. Joppe, you started withthe collaborative project on liquid-liquid extraction in microdroplets with me and Ru-pali as your supervisors. Even though the nature of the project was super exploratory,you showed perseverance and made sure there was a closure to this work. I wish all ofyou success in your future endeavors.
I would also like to thank the people with whom I have shared the apartment(s) andamazing times during my stay in Delft. Gabriele and Lorenzo, even though we didn’t stay
134 ACKNOWLEDGEMENTS
together for long time it was always fun living with you and cooking Indian/Italian foodtogether. Sven, I think you have been my flatmate for the longest time. I still rememberyou shouting across the room whenever you scored a point while gaming. We used tohave long discussions on a range of topics just standing outside the house. Rolf, thankyou for being an amazing flatmate. I enjoyed numerous discussions on from Dutch vsindian food, eco-friendly travelling and sustainability. Thank you so much for editingthe Dutch translation of the summary. Pratap, we had limited interaction during yourstay in Delft. I wished we could have met before you left. I wish you best of luck for yourfuture endeavours. Vishwa and Aravind, you both are very kind and generous individu-als. Your presence in the house was comforting. I couldn’t believe I was already havingIdli Sambhar on the first day of my return from India after almost a year of staying back.I would always remember the south indian meals you cooked for me during the initialquarantine period. I wish you both best of luck for completion of your M.Sc.
Pieter, you would always have a special place in my Ph.D. journey. I met you throughblablacar and very soon developed a nice bonding with you. I enjoyed our long conver-sations over a wide range of topics during our road trips. I wish, we could have done atrip one last time before leaving Netherlands. Even though, my driving skills are not even10% of yours, I wish one day, I can take you in my car when you visit India.
Next, I wish to thank the folks who made my life easy and helped me get adjustedin the Netherlands. Sumit sirjee, you were one of the first persons I met after comingto Delft. Thank you for your guidance on the research environment at ChemE. I knewyou were very interested in being a part of this project but somehow it didn’t work out.I wish someday we both can work together on a technology development project andend up with a spin-off company. Rajat, I remember bothering you a lot before my arrivalto Delft. You patiently answered all my queries and always kept in touch. Thank youSumit and Rajat for inviting me to Indian festivities. Rupali, thank you for initiatingthe collaboration between RID and PPE through the science date. I am happy that wewon that the science DATE grant for our idea and wish someday we could publish thatpaper together. Rotya (Rohit), firstly, thank you for letting me stay at your place duringmy M.Sc. internship. The time you, me and Raj spent together in Eindhoven was reallyawesome. I would never forget those three months. I apologise for not keeping in touchwith you recently.
Prachi, thank you for being one of my paranymphs. Your chill punjabi vibe is reallyrefreshing. During our times in Delft you really took effort to keep in touch. Your senseof humour really cracks me up. I would never forget the way in which you said “. . . Jyadajazbati mat bano.. and ..tere dimag me hi tatti bhari hai..” and other swear words that Ican’t mention here. There is never a dull moment around you. Samiya, you are a properenthu cutlet. Your enthusiasm and excitement over little yet important things in life isreally contagious. Thank you for the amazing two years during masters and also forkeeping in touch afterwards. Daware, thank you for the fun times at TU Delft as wellas VNIT. I wished we could have spent more time in Netherlands. Sneha, Aparna andAruna, thank you for good times during our M.Sc.
Shaurya, our association started from being classmates/labmates during M.Sc., de-veloped as colleagues during Ph.D., and by the end, it culminated into a beautiful friend-ship. There are several things I have learned from you over the past few years. Your ef-
ACKNOWLEDGEMENTS 135
fortless articulation of thoughts is something I cannot really fathom. Our discussionson science, life, and philosophy were extremely engaging because you had an abnormalclarity in conveying your thoughts. The critical attitude with which you spoke about sci-ence has transformed me into a more critical researcher and an individual. I would neverforget your “Mai yaha sirf do cheeze karne aaya hun: Science aur Nasha”. Your innocence,when you asked (not so difficult) Bollywood questions and bragged about your cookingskills, always brought a smile to my face. Thank you so much for being a significant partof my Ph.D. journey.
Maulik, I don’t know where to start and end this. I was in NCL when Yogesh firstmentioned to me that you were also applying to Delft. Little did I know that the compan-ionship during the initial phase of the application would transform into such a strongfriendship. Your presence was immensely comforting during the difficult times. Therewere many instances where I was frustrated after failed experiments or bad meetings.You were extremely patient and calm to hear all of it out. Not only that, your eternaloptimism and faith gave me a lot of courage to go to the lab once again. I would alwaysmiss and cherish our conversations in the office after 7 pm, where one of us was readyto leave but still stayed and talked to the other person. Thank you for giving me strengthand courage by your positive words throughout my Ph.D. You are like an elder brother tome. Thank you for being there.
Next, I would like to thank the people who have stood strong behind me during dif-ficult times, my friends and family from India.
Aditya, I apologize for not keeping in touch with you for a very long time. Eventhough we didn’t speak for long, I never felt any gap in our equation. I am really happythat you are planning to shift to Nagpur such that I would be able to see you often.Aditya, I really appreciate your passionate nature and I genuinely believe that you area person who can take a bullet for a friend.
Attending weddings in India and roaming around in Europe have been significant el-ements of this journey. These were the most needed & deserved brakes that rejuvenatedmy energy after stressful and frustrating patches during the Ph.D. These happened themost with the members of the amazing potshots gang. Thank you Prateek, KD, Parag,Shreyas, Sam, Mayur, Sonal, and Jajoo for the countless memories during these years.The discussions we had during our night outs (or sometimes the heavy ones on the group;-) ) are the best part of our friendship. I would give the credits for my debating skills to allof you folks ;-). Prateek, KD, Parag and Shreyas, the euro trip we had is one of the mostmemorable trips for me (of course after the historic goa trip). It was filled with momentsthat I would cherish for a lifetime.
Bhoomi, Piyush, Raj and Disha. Thank you for being the family away from home.
Bhoomi and Piyush, happiness is the first word that comes to my mind when I thinkof you both. Thank you for the infinite moments of laughter you both have given us. Idon’t know if there is any connect but spending time with you both feels so natural. Thereare very few people in this world with whom Sparsha and I can talk the way we talk toyou. This very fact describes the comfort that we share with each other. I think that isbecause our struggles are relatable af and we have a mutual appreciation for them. Frombinge watching and binge eating to our bitching sessions, I loved our get-togethers a lot.Thank you for hosting us on numerous occasions. I am confident that both you would
136 ACKNOWLEDGEMENTS
soon find amazing jobs after which we can come and stay with you again. I am lookingforward to the eurotrip which are planning since an eternity.
Raj and Disha, life has come a full circle. It all started in VNIT. I still remember thetrinity team which was enthusiastic for the design competition at IIT-Bombay. And nowyou are here in the Netherlands. Raj, everything started with the research project we didat the chemistry department and since then we have never looked back. I wrote my firstpaper with you and I think your dedication and hard work were something that I alwaystried to match with. That period was the foundation stone of my research career. Thankyou for being a huge part of it. Disha, we both became friends a bit later during B.Tech.and now you are a colleague here at TU Delft. I really enjoy our conversations on scienceand academia and wished our overlap at TU Delft was much bigger. You are one of thoserare people who not only laughs but really enjoys my sense of humour. For me, that feelslike a bigger achievement than earning a Ph.D. Thank you for the good times in VNITand in Netherlands.
Divya, lately we haven’t been in touch. However, there was an instant comfort whenwe spoke last time because both of us shared the same struggles. I apologize for notkeeping in touch and also for not being able to attend your wedding. I wish to see youand Yash killing in the Indian academic scene very soon. I wish you all the best for yourPh.D. defense as well. Parag, you have always taken effort to keep in touch and haveshown concern about my Ph.D. The way you articulate your thoughts is something I amreally fond of. You kept reassuring that no matter what this Ph.D. would end on a nicenote. Praveen, apart from giving health goals, you also give me humour goals. Thereis never ever a dull moment around you. Whenever I hang up the call after talking toyou, there is a smile on my face. Your hard work and resilience towards building yourcompany from scratch is outstanding. I still cherish the times we spent together here inEurope and I wish there were many more road trips like the one in Norway.
Ankit, since the VNIT and Pune days, our friendship has grown into a beautiful re-lationship. There are so many life lessons I have learned from you. It’s beautiful to seethe innocence and simplicity with which you carry yourself even after being an achiever.Your constant effort for learning something new every day is very inspiring to me. Youhave been a patient listener to my rants on the academic culture around the world. I loveour (sometimes heated) debates on Indian politics. Your take on mediocrity in life wassomething that amazed me a lot. I realize these words cannot do justice to the bond weshare but I just want you to know that I am really lucky to have a friend like you.
Prem, knowingly or unknowingly, you were the one who has instilled the Ph.D. kakeeda inside me. I remember our discussions during the NCL internship, where you saidthat if you want to pursue a career in research, then you should go for a Ph.D. (preferablydirectly after B.Tech.). Very rarely, I take an advice so seriously, but that also I took itpartly ;-). You constantly supported me throughout the M.Sc. & Ph.D. journey and werealways concerned about the status of my work/papers. Being from the same backgroundyou understood delays due to peer review and experimental failure in research. I wouldlike to go on many more trips with you, Richa and Sparsha. You are a kickass friend anda brother.
Nupoor, Ruchi, and Nilesh, what can I say to you three! All of you have supportedme unconditionally in this journey. This support and belief was not just limited to the
ACKNOWLEDGEMENTS 137
Ph.D. but was since the beginning of our association. Thank you for patiently handlingmy abrupt emotional bursts and frustrations that popped up during our discussions.Even though our lives and careers took different paths, you all made sure to listen to myproblems. Thank you for your care, concern, and affection. I know all of you are veryproud to see me complete this journey. I promise to spend more time with all three ofyou once I am back. Thanks for being there always!
Sasikala and Satya uncle, I have known you both for as long as I have known Spar-sha. Since then, I have enjoyed your company and our multiple interactions. Eventhough we were in the middle of the pandemic, I felt fortunate that I was in India andgot a lot of time to spend with you both. Sasikala, I always look forward to our longbitching sessions about anyone and everyone. Your sarcastic wit always brings a smirkto my face. Your passion for interior design is inspiring. I am really happy that both ofyou are also here to witness this day.
I am out of words here to describe my feelings for my family in India. Lockdownsand flight bans were a blessing in disguise for me. Even though I was unhappy aboutthe delay in the Ph.D., seeing all of you safe and healthy really uplifted my spirits. Latabua and Jagdish jijaji, I feel immensely fortunate that I was in India when the pandemicwas at its peak and I could help you both navigate through the difficult period. Lata buayour willpower and courage are phenomenal. Thank you for all your love and support.Sheena and Vinisha, you have always believed in me and supported me no matter what.Lately, we haven’t been in touch and I feel it’s high time we all should have a meet-up.Sheru mama, Manju mami, Pappu mama, Bharti mami, Abban, Nana, and Geeta masi.All of you have loved and supported me unconditionally. I would be indebted to you for-ever and couldn’t have asked for more. Thank you for constantly checking up on me andreassuring that all of you were there in Nagpur to take care of everyone in my absence.Pappu Mama, you were the one who encouraged me to take up Chemical Engineeringin VNIT and I know that you would have been really proud today to see me completemy Ph.D. in Chemical Engineering. Sheru mama, your contribution to my life has beenimmensely significant, not just work-wise but also in my personality development. I re-member your coaching during 10th std board preparations. I think that struggle andhustle have instilled belief in me that I can achieve goals even where I need to punchway above my weight. Thank you for that. It really means a lot. Abban, our discus-sion on bollywood movies and how history should have been taught are very interesting.Your jokes, movies and series references really cheers me up. I am happy that you hadguts and willpower to follow your interest and passion. I am confident you would kill inwhatever you pursue. Let’s make sure to keep in touch.
Amma, the sheer confidence and willpower you hold is inspiring. I haven’t seenmany 80-year-olds who would want to learn technology and try hard to get used to it.Thank you for being so caring, accommodating, and believing in me. After listening toyour stories on the partition of INDIA, my struggles look very small and shallow.
Bharat, our equation has evolved slowly over time. I must admit that my unavail-ability during your formative years is probably responsible for this slow evolution. But Ithink all good things take time. Very few people have realized and witnessed that behinda seemingly headstrong person like you, there is a deeply emotional side too. You werealways concerned about my progress during the Ph.D. and had immense faith in me.
138 ACKNOWLEDGEMENTS
We have had countless discussions and sometimes arguments on a wide range of top-ics. These discussions have made me think about things more critically and as a Ph.D., Ithink this is one of the most important skills to hone. One of the things that I have learntduring these discussions is that you like to address the central point directly rather thanbeating around the bush. I do understand and appreciate your concern about havingmore real discussions than having meaningless sessions of talking about others. I reallylook up to your hard work and dedication to achieving your life goals. Thank you for yoursupport and for consistently reiterating that the bigger picture matters.
Sparsha, I really don’t have words for describing the positive impact you have createdon my life; not only on the personal front but also on my professional life. Summariz-ing our decade long equation in this paragraph seems more difficult than defending fiveyears of work in an hour. You are hands down the most selfless and unconditional in-dividual I have ever met. You really are like your idol who would walk on broken glassif your loved ones would ask you to. Your patience and tolerance are so high that youlistened to my whining even when you were facing similar challenges during your Ph.D.tenure. I really respect your values in terms of work and personal relationships and oc-casionally even get envious of those. I do not want to talk about how your academicand research brilliance motivates me to constantly improve myself because you neverbelieve that!! The balance you have in life is something I would aspire to have. You havemade me realize that I can’t live my life in series; but would have to find time for our-selves and grow professionally in parallel. I would never forget our trips, some of whichwere to the remotest possible locations. There were so many instances when I thoughtof giving up and quitting. You have shown immense faith and believe in me and madesure I was back on track every damn time. I really respect your thoughts on equality andfreedom and I believe discussions with you have made me a more open minded individ-ual. Thank you for all your love, care and unconditional support throughout these years.I couldn’t have imagined doing all this without you. You are the yin to my yang, the calmto my storm, naina to my bunny and would be the best collaborator I could ever have inevery sense. I am really looking forward to the brilliant times ahead.
Mummy and Papa, thanking you in mere words is an injustice to your contributionin making me who I am, and it seems like a pointless activity. You both are the epitomeof hard work, honesty, and integrity for me in every sense. You have given me all the free-dom to pursue my passion and made sure there was nothing I had to worry about. Therewere times, I was impatient and impulsive during this journey but you stood behind merock solid. Thank you for being extremely patient during this roller coaster ride. I knowboth of you are the proudest to hold this book in your hands and also to witness the dayI would be defending my work. It’s your prayers and countless sacrifices that have madeall of this possible. So this one is for you.
My furry friends Bourbon, Kaju, Kulfi, and now KK, I know you don’t give a damnabout me getting a Ph.D. or where I published my papers; but still are super excited ev-ery time you see me. That is why I feel we don’t deserve your goodness.
Gentle reminder to self: During the rare occasions when you feel that research is pointlessand academia is a sham, this work (and the book) will remind you of the Ph.D. journeyand the reasons you chose this career in the first place.
CURRICULUM VITÆ
Kartik Totlani was born on 24th of June 1990, in Nagpur, India. He finished his primaryand secondary education from Modern School in 2006, and higher secondary educationfrom Bhavan’s Bhagwandas Purohit Vidya Mandir in 2008, both in Nagpur. He went on todo a Bachelors (B.Tech.) in Chemical Engineering from Visvesvaraya National Instituteof Technology (VNIT), Nagpur, India, graduating in 2012. He then worked as a Projectfellow with the Industrial Flow Modelling Group (iFMG) in the Chemical Engineeringand Process Development division at National Chemical Laboratory (NCL) in Pune, In-dia.
Kartik then joined TU Delft in 2013, for a Masters (M.Sc.) in Chemical Engineering withspecialization in Process Engineering. During his masters, he worked in Product & Pro-cess Engineering and Advanced Soft Matter research groups for his thesis on microfluidicsynthesis of all aqueous core shell particles for drug delivery applications. After his M.Sc.thesis, Kartik did a brief research internship at Merck Sharp and Dohme, Oss and grad-uated in August 2015. In 2016, Kartik started his Ph.D. on an interdisciplinary projectin the group of Product & Process Engineering. During his Ph.D. he worked on develop-ment of droplet microfluidic tools for bioprocess engineering with Dr. Volkert van Steijn,Dr. Walter van Gulik as co-promotors and Prof. Michiel Kreutzer as his promotor.
139


