Embed Size (px)
Citation preview

ARTICLE
Received 4 Jun 2013 | Accepted 15 Nov 2013 | Published 12 Dec 2013
Dual-channel spontaneous emission of quantumdots in magnetic metamaterialsManuel Decker1, Isabelle Staude1, Ivan I. Shishkin2,3, Kirill B. Samusev2,3, Patrick Parkinson4,
Varun K.A. Sreenivasan5, Alexander Minovich1, Andrey E. Miroshnichenko1, Andrei Zvyagin5,
Chennupati Jagadish4, Dragomir N. Neshev1 & Yuri S. Kivshar1,2
Metamaterials, artificial electromagnetic media realized by subwavelength nano-structuring,
have become a paradigm for engineering electromagnetic space, allowing for independent
control of both electric and magnetic responses of the material. Whereas most metamaterials
studied so far are limited to passive structures, the need for active metamaterials is rapidly
growing. However, the fundamental question on how the energy of emitters is distributed
between both (electric and magnetic) interaction channels of the metamaterial still remains
open. Here we study simultaneous spontaneous emission of quantum dots into both of these
channels and define the control parameters for tailoring the quantum-dot coupling to
metamaterials. By superimposing two orthogonal modes of equal strength at the wavelength
of quantum-dot photoluminescence, we demonstrate a sharp difference in their interaction
with the magnetic and electric metamaterial modes. Our observations reveal the importance
of mode engineering for spontaneous emission control in metamaterials, paving a way
towards loss-compensated metamaterials and metamaterial nanolasers.
DOI: 10.1038/ncomms3949
1 Nonlinear Physics Centre, Research School of Physics and Engineering, The Australian National University, Canberra, Australian Capital Territory 0200,Australia. 2 National Research University for Information Technology, Mechanics and Optics (ITMO), St Petersburg 197101, Russia. 3 Ioffe Physical TechnicalInstitute of the Russian Academy of Sciences, St Petersburg 194021, Russia. 4 Department of Electronic Materials Engineering, Research School of Physics andEngineering, The Australian National University, Canberra, Australian Capital Territory 0200, Australia. 5 MQ Photonics & MQ Biophotonics ResearchCenters, Macquarie University, Sydney, New South Wales 2109, Australia. Correspondence and requests for materials should be addressed to M.D.(email: [email protected]).
NATURE COMMUNICATIONS | 4:2949 | DOI: 10.1038/ncomms3949 | www.nature.com/naturecommunications 1
& 2013 Macmillan Publishers Limited. All rights reserved.

The control of spontaneous emission in photonic structuresrelies on enhanced light–matter interactions because offield localization and large interaction times1–3. As such,
nanostructured plasmonic materials are well suited for thispurpose because they offer strong field confinement and can beengineered to support good coupling to free space,thereby opening up a way towards applications such asquantum information devices4,5, solar-energy harvesting6,efficient photodetection7,8 and biological markers9.
At the same time, the opportunity of reducing losses andachieving gain in plasmonic structures using quantum emitters isparticularly promising for optical metamaterials, in which the stepto practical applications is significantly hindered by energydissipation in metals. Overcoming this major obstacle would leadto novel functional materials based on the control of both electricand magnetic material responses at optical frequencies, namely, tonegative refractive index10–12, chirality13–18 and subwavelengthimaging19 as well as to compact nanolasers and spasers20,21.Finally, active metamaterials might also enter new, unexploredareas such as quantum metamaterials22–24. In recent years, strongefforts have been made to find practical ways of reducing losses inoptical metamaterials21,25–29, leading to the first demonstration ofa loss-compensated negative-index metamaterial26. An importantstep in controlling the process of loss compensation is the study ofcoupling of quantum emitters such as quantum dots (QDs) withmetamaterials. In such structures, the hybridization of QDswith electric resonances of a metamaterial can lead tophotoluminescence (PL) enhancement and modification of thePL properties that can be controlled by the metamaterialdesign30,31. Topological transitions in hyperbolic metamaterials32
have also shown an important avenue to alter the photonic densityof states by changing the isofrequency surfaces via plasmonicresonances.
However, when there are two modes involved, such as electricand magnetic modes in negative-index metamaterials, thesemodes provide different routes for the extraction of energy fromthe emitters. As such, an important question is how the energy ofthe emitter is distributed between these two modes and whetherany of these modes dominates the emission dynamics. To date, ananalysis of the PL emission properties for different metamaterialmodes and specifically the control of emission via electric andmagnetic modes have not been reported.
Here we study experimentally the emission enhancement ina system of QDs coupled to a magnetic metamaterial consisting
of split-ring resonators (SRRs), the prototype magnetic metama-terial33–36 characterized by several well-known plasmonicresonances37–39. In contrast to previous work investigating PLenhancement in single nanoparticles and nanoantennas3,40,41 orin Fano-type30,42,43 and hyperbolic metamaterials31,32, our SRRmetamaterial supports both electric and magnetic modes that arespectrally matched to the emission of semiconductor QDs ataround lQD¼ 800 nm wavelength. Since both modes in ourmetamaterial can be engineered independently from each other,our QD metamaterial offers new opportunities to tailor thespontaneous emission of quantum emitters into two independentradiative decay channels. We demonstrate that the emission ofQD metamaterials is fundamentally different for the magneticand electric modes of the SRR metamaterial, revealing theinterplay between the Purcell enhancement and energy couplingto free space. Remarkably, we observe that the magnetic mode,characterized by strong contributions of non-radiating highermultipole moments, exhibits stronger PL enhancement than thedipole-like electric mode. This is unlike the case of small, highlysymmetric metal particles in which PL enhancement is governedby the dipole moment of the nanoparticle40,44 while higher-orderexcitations cannot couple to the far field and lead to
PL-quenching. Furthermore, in sharp contrast to the previouswork on coupling of metamaterials to semiconductor quantumwells27, coupling of QDs to different plasmonic modes is notrestricted by selection rules imposed by the quantum-wellstructure. Hence, core-shell QDs are a highly flexible androbust material system that allow for investigating modecompetition in QD-metamaterial systems.
ResultsMetamaterial mode analysis. The system investigated hereconsists of a SRR metamaterial covered by a 200-nm-thick layerof polyvinyl alcohol (PVA) containing a low concentration ofcore-shell colloidal QDs emitting around lQD¼ 800 nm wave-length (for details see Methods). The sample geometry is depictedin Fig. 1. The SRR metamaterial is designed in such a way thatboth its magnetic and electric modes are superimposed with theemission of semiconductor QDs.
Linear-optical transmittance spectra of the metamaterialsamples after spin-coating of the QD layer have been collectedusing a white-light spectroscopy setup and an optical spectrumanalyser. Three different sets of split-ring-resonator metamater-ials, marked as samples A, B and C, have been characterized forx- and y polarization of the incident light. These results aredepicted in Fig. 2a,b also including a typical measured QD-PLspectrum of uncoupled QDs (PL0) visualizing the sample- and themode-dependent spectral overlap of the QD-PL spectrum withthe plasmonic modes of the split-ring-resonator metamaterial. Inboth polarizations, the characteristic (higher-order) plasmonicresonances37–39 are clearly visible in the spectral region of interestbetween 700 and 1,000 nm wavelength.
In accordance with previous work39,45,46, the resonance excitedin x polarization is characterized by a strong electric dipolemoment39, which is naturally accompanied by strong radiativelosses and, hence, a broad spectral line width; we therefore referto this mode as the electric mode. In contrast, the resonance thatis excited in y polarization is characterized by a superposition ofan electric dipole, an electric quadrupole and a weaker magneticdipole moment39 and results in a narrower spectral linewidth ofthe resonance as compared with the electric mode. Owing to the
532 nmexcitation
Photo-luminescence
z
y
y
x
Substrate
PVA + QDs
x
Figure 1 | Sample geometry. Artist’s impression of the sample geometry
(not to scale): A magnetic SRR metamaterial processed on a glass substrate
is covered by a 200-nm-thin PVA layer containing QDs. The sample is
excited by 532-nm cw laser from the top with a � 100 objective
(NA¼0.9). The measured spot size was B800 nm. The QD PL is then
collected from the bottom. The inset shows a scanning electron micrograph
of a sample without the QD-containing PVA layer. The scale bar is 500 nm.
ARTICLE NATURE COMMUNICATIONS | DOI: 10.1038/ncomms3949
2 NATURE COMMUNICATIONS | 4:2949 | DOI: 10.1038/ncomms3949 | www.nature.com/naturecommunications
& 2013 Macmillan Publishers Limited. All rights reserved.

presence of magnetic (multipole) moments, we refer to this modeas the magnetic mode (the fundamental magnetic mode of theSRR metamaterial is at 1.5mm wavelength). From thetransmittance spectra in Fig. 2a,b, we can extract the linewidthsDfi for the two modes at the resonance frequency fi. Owing to thedifferent radiative properties of the electric and magnetic modes,this results in different linewidths, namely Dfel ffi 99 THz Að Þ,76 THz (B) and 65 THz (C) for the electric mode, as comparedwith Dfmag ffi 41 THz Að Þ, 39 THz (B) and 38 THz (C) for themagnetic mode. This is reflected in different quality factors forthe two modes and allows us to identify the strongly radiatingelectric mode as the brighter mode and the magnetic mode, withits non-radiating quadrupole moment as the darker mode of theSRR metamaterial.
In order to map our measurements to a simple model, wenumerically calculate the transmittance spectra for the threesamples (see Methods). These results are shown in Fig. 2c,d. Ourcalculations furthermore give us additional information about theoptical near-fields and the electric moments of the two plasmonicmodes. Normalized electric and magnetic field-intensity cross-sections calculated for the experimental parameters of sample Ain the x–y plane cutting through the SRR are shown in the insets.The dipole moments in each individual arm of the SRR depictedin Fig. 2c,d also clearly visualize the quadrupole contributions tothe magnetic resonance (Fig. 2d), while the electric resonance(Fig. 2c) is dominated by a strong electric dipole contribution.
Furthermore, we calculate the effective mode volume Vm of thetwo SRR modes and the fraction Z of QDs located in the modevolume, hence, coupled to the metamaterial by evaluating the
mode-volume integral47,48 Vm ¼R
Wd3r
avðWÞ of a single SRR (seeMethods). Since the mode volume is symmetric around the SRRat z¼ 0 and extends approximately halfway into the PVA layer
(with QDs), this gives us a fraction Z � 0:5 of QDs inside themode volume.
PL properties. Next, the coupled QD-metamaterial system isinvestigated with respect to the luminescence properties for theelectric and magnetic SRR modes. The QDs are excited off-resonantly at l¼ 532 nm to investigate the emission processes inthe coupled QD metamaterial at around l¼ 790 nm. Note thatthe excitation wavelength is well below the SRR resonances (seeFig. 2a,b), where the transmittance of the metamaterial is close tounity. Hence, we can assume that the presence of the metama-terial is not significantly affecting the excitation rate of the QDs.Using an analyser in the detection path allows us to indepen-dently select the x- and y-polarized QD-PL components of therandomly positioned and oriented QDs. In the following, wediscuss the experimental results of spatial QD-PL mapping(Fig. 3a,b) and spectrally resolved QD-PL measurements(Fig. 3c,d) for sample A. This sample has the strongest spectraloverlap of the QD luminescence with both metamaterial modesand, therefore, the strongest coupling efficiency. Additionally, thetransmittance for the two different linear polarizations, corre-sponding to the two plasmonic modes, takes on approximatelythe same value of about 28% at l¼ 790 nm close to the centralwavelength lQD of the QD-PL emission.
Figure 3a,b shows the spatially mapped QD PL both on themetamaterial sample (lower right corner of each image) andnext to the metamaterial for x and y orientations of the polarizerin the detection path, respectively. The QD-PL maps in Fig. 3a,bshow that for y-polarized detection (magnetic mode) thePL-enhancement factors are on average B1.5; however, thereare spatial positions where enhancement of up to approximatelythree can be observed. This is a notable enhancement given
1
0.8
0.6
Sample A
E
E
E
E
|E0|2|E0|2
0
0
|E|2
|H|2
|E|2
|H|2
|H0|2|H0|20
0
Sample BSample CPL0
Sample ASample BSample CPL0
Sample ASample BSample CPL0 Sample A
Sample BSample CPL0
0.4
0.2
0500 600 700 800
Wavelength (nm)
Tran
smitt
ance
Tran
smitt
ance
, abs
orba
nce
900 1,000 500 600 700 800Wavelength (nm)
900 1,000
500 600 700 800Wavelength (nm)
900 1,000500 600 700 800Wavelength (nm)
900 1,000
1
0.8
0.6
0.4
0.2
0
1
0.8
0.6
0.4
0.2
0
1
0.8
0.6
0.4
0.2
0
Figure 2 | Linear-optical properties of the quantum-dot metamaterial. (a,b) Measured transmittance spectra for the SRR metamaterial covered by the
QD-PVA layer for the incident electric-field polarized in x- and y directions, respectively. Different curves correspond to samples with slightly different
parameters. The grey-shaded region shows a typical measured free-space QD-PL spectrum PL0; the vertical green line indicates the excitation wavelength
for PL measurements. (c,d) Calculated transmittance (solid lines) and absorbance (dashed lines) spectra (without QDs). The insets show calculated
electric and magnetic field intensities of the corresponding modes for sample A, both normalized to the same maximum intensity ( E0j j2 and H0j j2,
respectively). The electric dipole moments in each individual arm of the SRR are schematically indicated as grey arrows.
NATURE COMMUNICATIONS | DOI: 10.1038/ncomms3949 ARTICLE
NATURE COMMUNICATIONS | 4:2949 | DOI: 10.1038/ncomms3949 | www.nature.com/naturecommunications 3
& 2013 Macmillan Publishers Limited. All rights reserved.
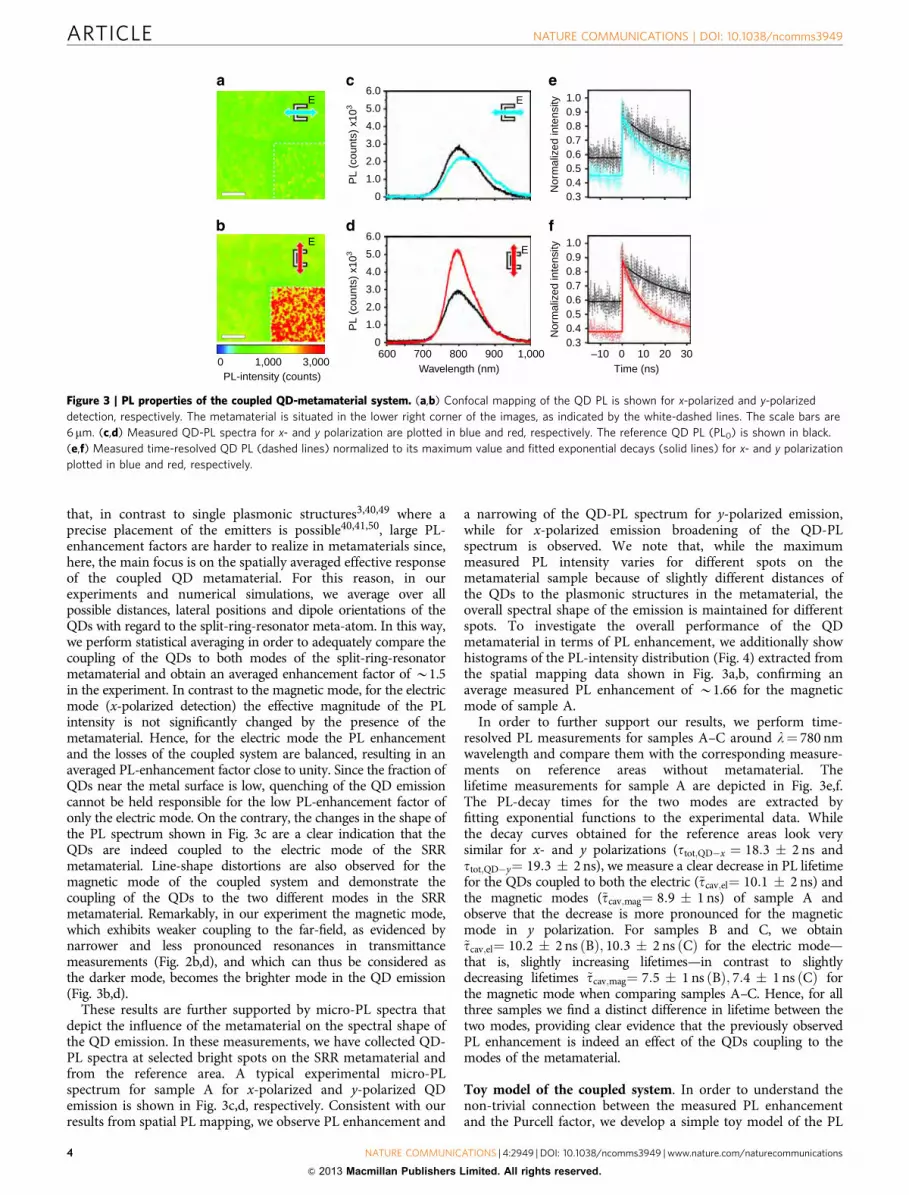
that, in contrast to single plasmonic structures3,40,49 where aprecise placement of the emitters is possible40,41,50, large PL-enhancement factors are harder to realize in metamaterials since,here, the main focus is on the spatially averaged effective responseof the coupled QD metamaterial. For this reason, in ourexperiments and numerical simulations, we average over allpossible distances, lateral positions and dipole orientations of theQDs with regard to the split-ring-resonator meta-atom. In this way,we perform statistical averaging in order to adequately compare thecoupling of the QDs to both modes of the split-ring-resonatormetamaterial and obtain an averaged enhancement factor of B1.5in the experiment. In contrast to the magnetic mode, for the electricmode (x-polarized detection) the effective magnitude of the PLintensity is not significantly changed by the presence of themetamaterial. Hence, for the electric mode the PL enhancementand the losses of the coupled system are balanced, resulting in anaveraged PL-enhancement factor close to unity. Since the fraction ofQDs near the metal surface is low, quenching of the QD emissioncannot be held responsible for the low PL-enhancement factor ofonly the electric mode. On the contrary, the changes in the shape ofthe PL spectrum shown in Fig. 3c are a clear indication that theQDs are indeed coupled to the electric mode of the SRRmetamaterial. Line-shape distortions are also observed for themagnetic mode of the coupled system and demonstrate thecoupling of the QDs to the two different modes in the SRRmetamaterial. Remarkably, in our experiment the magnetic mode,which exhibits weaker coupling to the far-field, as evidenced bynarrower and less pronounced resonances in transmittancemeasurements (Fig. 2b,d), and which can thus be considered asthe darker mode, becomes the brighter mode in the QD emission(Fig. 3b,d).
These results are further supported by micro-PL spectra thatdepict the influence of the metamaterial on the spectral shape ofthe QD emission. In these measurements, we have collected QD-PL spectra at selected bright spots on the SRR metamaterial andfrom the reference area. A typical experimental micro-PLspectrum for sample A for x-polarized and y-polarized QDemission is shown in Fig. 3c,d, respectively. Consistent with ourresults from spatial PL mapping, we observe PL enhancement and
a narrowing of the QD-PL spectrum for y-polarized emission,while for x-polarized emission broadening of the QD-PLspectrum is observed. We note that, while the maximummeasured PL intensity varies for different spots on themetamaterial sample because of slightly different distances ofthe QDs to the plasmonic structures in the metamaterial, theoverall spectral shape of the emission is maintained for differentspots. To investigate the overall performance of the QDmetamaterial in terms of PL enhancement, we additionally showhistograms of the PL-intensity distribution (Fig. 4) extracted fromthe spatial mapping data shown in Fig. 3a,b, confirming anaverage measured PL enhancement of B1.66 for the magneticmode of sample A.
In order to further support our results, we perform time-resolved PL measurements for samples A–C around l¼ 780 nmwavelength and compare them with the corresponding measure-ments on reference areas without metamaterial. Thelifetime measurements for sample A are depicted in Fig. 3e,f.The PL-decay times for the two modes are extracted byfitting exponential functions to the experimental data. Whilethe decay curves obtained for the reference areas look verysimilar for x- and y polarizations (ttot;QD�x ¼ 18:3 � 2 ns andttot;QD�y¼ 19:3 � 2 ns), we measure a clear decrease in PL lifetimefor the QDs coupled to both the electric (~tcav;el¼ 10:1 � 2 ns) andthe magnetic modes (~tcav;mag¼ 8:9 � 1 ns) of sample A andobserve that the decrease is more pronounced for the magneticmode in y polarization. For samples B and C, we obtain~tcav;el¼ 10:2 � 2 ns Bð Þ; 10:3 � 2 ns ðCÞ for the electric mode—that is, slightly increasing lifetimes—in contrast to slightlydecreasing lifetimes ~tcav;mag¼ 7:5 � 1 ns Bð Þ; 7:4 � 1 ns ðCÞ forthe magnetic mode when comparing samples A–C. Hence, for allthree samples we find a distinct difference in lifetime between thetwo modes, providing clear evidence that the previously observedPL enhancement is indeed an effect of the QDs coupling to themodes of the metamaterial.
Toy model of the coupled system. In order to understand thenon-trivial connection between the measured PL enhancementand the Purcell factor, we develop a simple toy model of the PL
6.0
5.0
4.0
E
E
E
E
Nor
mal
ized
inte
nsity
Nor
mal
ized
inte
nsity
PL
(cou
nts)
x10
3P
L (c
ount
s) x
103
3.0
2.0
1.0
0 0.30.40.50.60.70.80.91.0
0.30.40.50.60.70.80.91.0
6.0
5.0
4.0
3.0
2.0
1.0
0
0PL-intensity (counts)
600 700 800Wavelength (nm) Time (ns)
900 –10 10 20 3001,0001,000 3,000
Figure 3 | PL properties of the coupled QD-metamaterial system. (a,b) Confocal mapping of the QD PL is shown for x-polarized and y-polarized
detection, respectively. The metamaterial is situated in the lower right corner of the images, as indicated by the white-dashed lines. The scale bars are
6mm. (c,d) Measured QD-PL spectra for x- and y polarization are plotted in blue and red, respectively. The reference QD PL (PL0) is shown in black.
(e,f) Measured time-resolved QD PL (dashed lines) normalized to its maximum value and fitted exponential decays (solid lines) for x- and y polarization
plotted in blue and red, respectively.
ARTICLE NATURE COMMUNICATIONS | DOI: 10.1038/ncomms3949
4 NATURE COMMUNICATIONS | 4:2949 | DOI: 10.1038/ncomms3949 | www.nature.com/naturecommunications
& 2013 Macmillan Publishers Limited. All rights reserved.

enhancement and decay times and compare these estimates withour experimental findings. In our toy model, we account forplasmonic field confinement, off-resonant coupling and scatteringproperties of the different metamaterial resonances. While thismodel does not fully describe the complex QD–plasmon inter-action and neglects the influence of uncontrolled parametersbecause of sample imperfections, variations in gold quality (sur-face roughness), and shape variations of the QDs, it can never-theless be used to understand the mechanisms that govern theQD-PL modification in presence of the metamaterial. In ourapproach (see also Methods), assuming saturation of QD exci-tation, we can estimate the measured PL-enhancement factor Y
Y ¼ Fp;mod � Zþ 1� Zð Þ � T; ð1Þwhere Z is the fraction of QDs that is actually contained inside themode volume Vm and is coupled to the near-field of the SRRs. T isthe experimental transmittance value for the corresponding modeof the metamaterial sample at the emission wavelength of theQDs, and Fp,mod is the Purcell factor of our combined system:
Fp;mod ¼3
8plQD
n
� �3 oVm
ZL oð Þrcav oð Þdo: ð2Þ
The total density of states of the plasmonic cavity modercav oð Þ and the spectral distribution of optical transitions in the(homogeneously broadened) emitter L oð Þ are both described bynormalized Lorentzian functions with resonance frequencies oi
and linewidths Doi. The plasmonic resonances coupled to theQDs are described by the parameters oj and Doj extracted fromthe experimental transmittance spectra of the SRR modes. Wealso note that in contrast to the uncoupled fraction of QDs, thecoupled system of QDs and metamaterial is characterized by themodified radiative and non-radiative losses, hence a (modified)quantum yield. Using the central QD-emission wavelengthlQD¼ 800 nm, the effective refractive index of the SRR environ-ment n¼ 1.45, and the transmittance/linewidth for the x- and y-polarized modes from the transmittance spectra (Fig. 2a,b), wecalculate the enhancement factors Yel¼ 1:03 Að Þ; 1:1 Bð Þ; 1:0 ðCÞ,for the electric mode, and Ymag¼ 1:65 Að Þ; 1:77 Bð Þ; 1:89 ðCÞ, forthe magnetic mode, respectively. These results are in goodagreement with the experimental values and they correspond tothe calculated Purcell factors Fp;modðelÞ¼ 1:8 Að Þ, 1.66 (B), 1.34 (C)and Fp;modðmagÞ¼ 2:98 Að Þ, 3.06 (B), 3.23 (C) of the QDs which arecoupled to the metamaterial modes only. For better quantitativecomparison with the experimental PL-mapping data, Fig. 4a,bshows histograms of the intensity distribution of the QD emissionobtained from the spatial PL data shown in Fig. 3a,b. Thecorresponding experimental data for samples B and C are shownin Fig. 4c–f, respectively. Extracting the median values for the PLintensity of the QD reference and the PL of the QD metamaterial,we can calculate the median experimental PL enhancement ~Y forsamples A–C. For the electric mode, we obtain enhancementfactors ~Yel¼ 0:93 Að Þ; 0:88 Bð Þ; 0:85 ðCÞ, while for the magnetic
1,200 Sample APL0
Sample APL0
Sample BPL0
Sample BPL0
Sample CPL0
Sample C
EE
E E
EE
PL0
Num
ber
of p
ixel
s
Num
ber
of p
ixel
sN
umbe
r of
pix
els
Num
ber
of p
ixel
sN
umbe
r of
pix
els
Num
ber
of p
ixel
s
800
400
0.5 1.0 1.5 2.0 2.5 3.0 3.5 4.0 4.5APD signal (counts) x 103
0.5 1.0 1.5 2.0 2.5 3.0 3.5 4.0 4.5
0.5 1.0 1.5 2.0 2.5 3.0 3.5 4.0 4.5 0.5 1.0 1.5 2.0 2.5 3.0 3.5 4.0 4.5
0.5 1.0 1.5 2.0 2.5 3.0 3.5 4.0 4.5 0.5 1.0 1.5 2.0 2.5 3.0 3.5 4.0 4.5
APD signal (counts) x 103
APD signal (counts) x 103APD signal (counts) x 103
APD signal (counts) x 103 APD signal (counts) x 103
0
1,200
800
400
0
1,200
800
400
0
1,200
800
400
0
1,200
800
400
0
1,200
800
400
0
Figure 4 | PL-intensity statistics. (a,b) PL histograms for sample A showing the spatial PL-intensity distribution of the QD emission on the metamaterial
and on the reference area (PL0) extracted from Fig. 3a,b for (a) x polarization and (b) y polarization. (c–f) show the corresponding data for samples
B and C, respectively.
NATURE COMMUNICATIONS | DOI: 10.1038/ncomms3949 ARTICLE
NATURE COMMUNICATIONS | 4:2949 | DOI: 10.1038/ncomms3949 | www.nature.com/naturecommunications 5
& 2013 Macmillan Publishers Limited. All rights reserved.

mode significantly higher values ~Ymag¼ 1:66 Að Þ; 1:47 Bð Þ; 1:43 ðCÞare measured. The PL enhancement of the two modes is also in goodagreement with numerical PL-enhancement calculations using CSTMicrowave Studio (see Methods).
As a next step, we estimate the upper limit for the lifetimes ofthe coupled QD metamaterials using (see Methods):
tcav � ttot;QD Fp;mod� 1� �
qþ 1� �� 1 ð3Þ
(q being the quantum yield of the QDs) and compare themwith the experimental data. We obtain values oftcav;elr13:1 ns Að Þ; 13:9 ns Bð Þ; 15:9 ns ðCÞ for the electric modeand tcav;magr9:0 ns Að Þ; 8:8 ns Bð Þ; 8:4 ns ðCÞ for the magneticmode. Being upper-limit estimates for the lifetimes, they agreewell with the experimentally measured values. In particular, themain experimental observation that the decay into the magneticmode happens faster than into the electric mode is very wellreproduced by our simple model. Furthermore, the predictedtrends that the lifetimes are getting shorter/longer from sample Ato sample C for the magnetic/electric mode can also be found inthe experiment.
However, because of the occurrence of additional non-radiativedecay channels in the experiment, there are deviations of the toy-model prediction from the experimental values for the PLlifetimes and for the PL-enhancement factors. These additionalnon-radiative losses can mainly be attributed to fabricationimperfections (gold quality, gold-surface roughness) of thedifferent SRR-metamaterial samples, which cannot be fullycaptured by the ideal parameter set used to describe the QD-PLproperties and the plasmonic cavity. Hence, when comparing thePL measurements of samples A–C we observe that the PLenhancement for the magnetic mode is gradually reduced, while aslight increase is predicted by our simple model. Furthermore,while the qualitative trends of the PL lifetimes are reproduced bythe toy model, there are small deviations in the absolute numbersin experiment and in the toy model. Both effects can be linked toan increase in non-radiative losses in the experiment that may bevery different for the different samples.
As the third observation, we can compare the spectral lineshape of QD PL for coupling to the two different modes and for avarying spectral overlap of the QD PL and the metamaterials’resonances (samples A–C). Figure 5 shows spectrally resolved PLfor (Fig. 5a,b) magnetic and (Fig. 5c,d) electric modes onnormalized scale to allow for easy comparison of the line shapeswith the reference QD-PL also shown in Fig. 5. In contrast to thecase of a single emitter at low temperatures, where the spectralwidth is determined by the total decay rate, in our experiment thespectral overlap of the (broadened) QD PL with the electric andmagnetic modes of the SRRs results in a distortion of the PLspectra. In the experiment (Fig. 5b,d), we observe a broadeningfor x-polarized detection (electric mode) in (Fig. 5d) and anarrowing for y-polarized detection (magnetic mode) in (Fig. 5b)for all samples. Moreover, shape variations can clearly beidentified among the three different samples, particularly forthe electric mode, where the spectral mode position for sample Ato sample C gradually shifts out of resonance with the QD PL. Inorder to compare these experimental findings with predictionsfrom our simple model, we calculate the PL line shape wcalcðlÞalong the lines of Tanaka et al.30 Generally, the PL line shapeconsists of an enhanced and spectrally modified contributionfrom the coupled QDs, and an undisturbed contribution from theuncoupled QDs, yielding
wcalcðlÞ / Z � Fp;mod½L lð Þrcav lð Þ þ 1� Zð Þ � L lð Þ � T: ð4Þ
These results are given in Fig. 5a,c, and they reproduce well theexperimental trends. In particular, the broadening for the electric
and narrowing for the magnetic modes and the change of lineshape for the electric mode are nicely reproduced.
DiscussionSummarizing our experimental findings, we have demonstrated,for the first time to our knowledge, the coupling of QDs to amagnetic split-ring-resonator metamaterial at near-infraredfrequencies. Via polarization-dependent spatially-, spectrally-,and time-resolved QD-PL measurements, we have demonstratedthat the PL enhancement, spectral shape and lifetime of the QD-metamaterial emission are strongly dependent on the SRR-modeproperties involved in the process. By deliberately designing theSRR metamaterial to support electric and magnetic modesoverlapping with the QD emission, we are able to investigatecoupling of QDs to two different radiative channels at the sametime. We observe PL enhancement of the QD emission of up to afactor of 3 with respect to the QD emission without metamaterialfor emission into the magnetic mode, which is characterized byadditional electric quadrupole and magnetic dipole moments. PLenhancement into the electric channel, on the other hand, is closeto unity. At the same time, the QD lifetime in the coupled QDmetamaterial is shortened by a factor of B2. We also find that incontrast to small spherical metal particles, the contribution ofhigher-order electric moments to the radiative emission proper-ties is substantially increased and even leads to greater PLenhancement factors for the magnetic mode than for the electricdipole mode. This finding also has important implications for thedesign of plasmonic nanostructures for emission enhancement—for example, in single-molecule and fluorescence-sensing applica-tions50. As opposed to small spherical nanoparticles in whichhigher-order modes are completely dark and can even cause PL-quenching, more complex structure designs make higher-orderplasmonic modes accessible for PL enhancement, resulting in amore efficient detection of quantum emitters or molecules.
In our experiment, we have collected data for three differentmetamaterial samples (see Supplementary Table S1) to investigatethe influence of spectral overlap and resonance strength on the PLspectra of the QD metamaterial. Figure 5 demonstrates that theemission properties are also dependent on the spectral overlap ofthe QD PL and resonance position of the metamaterial mode.Our experiments are supported by calculations from our simpletoy model in which the metamaterial modes are treated as opticalmicrocavities coupled to a dipole emitter. The expected valuesfor PL enhancement, PL lifetimes and PL line shape of theQD-metamaterial emission are in good agreement with theexperimental values for the two SRR-metamaterial modes.
Our novel approach of using plasmonic mode engineering totailor spontaneous emission of QD metamaterial systemsprovides an important insight to the enduring problem of losscompensation in metamaterials by gain media. In particular,when the electric and magnetic modes of a metamaterial areoverlapping (such as in negative-index metamaterials), there willbe competition for the extraction of the accumulated energy inthe emitter. This affects the effective permittivity and perme-ability and, hence, the effective impedance of the metamaterial.This change of the impedance under the presence of gain isknown as gain-induced impedance mismatch in the metamater-ial, as recently predicted theoretically51. The gain-compensationefficiency can then be controlled by engineering of theoverlapping modes and, hence, by precise adjustment of themetamaterial parameters.
Furthermore, we believe that our findings show a significantimpact on new concepts of metamaterials, such as the control ofemission of quantum light from quantum emitters coupled to themetamaterial. An interesting example could be engineering the
ARTICLE NATURE COMMUNICATIONS | DOI: 10.1038/ncomms3949
6 NATURE COMMUNICATIONS | 4:2949 | DOI: 10.1038/ncomms3949 | www.nature.com/naturecommunications
& 2013 Macmillan Publishers Limited. All rights reserved.

emission of entangled photon pairs from bi-excitonic excitationsin QDs, which are emitted in two orthogonal polarizations52,53.According to our findings, one of the possible two-photon decaychannels would be favoured by the presence of the SRRmetamaterial, allowing for tailoring the probabilities of the twoorthogonal states to occur.
MethodsSample preparation. The split-ring-resonator metamaterials (design parameters:lattice constant a¼ 300 nm, x-width lx¼ 131 nm, y-width ly¼ 148 nm, widths ofthe two arms wx¼ 48 nm, width of the central arm wy¼ 69 nm) have been fabri-cated via standard electron-beam lithography on a glass substrate covered by a5-nm indium-tin-oxide layer, subsequent evaporation of 20±2 nm of gold and alift-off procedure. A scanning electron microscopy image of a typical sample isdepicted in the inset of Fig. 1. The dimensions for the SRRs are extracted from thescanning electron microscopy images and varied within the tolerances of extractionso that the numerical spectra match the experimental ones. The lateral SRRdimensions of samples B/C are taken as ly ¼ 145 nm=145 nm, lx ¼ 130 nm=130 nm,the widths of the two arms are wx ¼ 40 nm=35 nm and the width of the central armsare wy ¼ 54 nm=50 nm. After fabrication of the metamaterial samples, a 50:50mixture of PVA solution (60 gl� 1 PVA 98–99% hydrolysed, Sigma Aldrich, in H2O)and a core-shell QD solution (CdSeTe core with a shell of ZnS and polymer coatingin 10ml, 2.2mM Invitrogen Qdot800 ITK streptavidin conjugate, quantum yieldq¼ 56% (lot data), diluted in 500ml Invitrogen Qdot800 incubation buffer) havebeen processed on top of the metamaterial sample by spin-coating (3,000 r.p.m.,90 s). PVA has previously been shown to form a viable transparent matrix forCdSe–ZnS QDs, leading to stable QD luminescence and no quenching effects beingobserved54. The resulting PVA–QD layer thickness has been measured to be 200 �10 nm using a Tencor alpha-step 200. The calculated density of the QDs in the PVAis B0.2 QDs per metamaterial unit cell, which has to be considered as a lower boundtaking into account the shrinkage of the PVA layer upon drying. This lowconcentration of QDs was chosen to provide a homogeneous distribution of QDs inthe PVA and prevent clustering. The system of CdSeTe/ZnS/polymer QDs in PVA ischosen because of its high photobleaching threshold, good thermostability, chemicalresistance, easy processability and transparency in the relevant spectral region.
Numerical calculations. For calculating the transmittance spectra and fielddistributions of the SRR-metamaterial samples, we use the finite-elementfrequency-domain solver of the software package CST Microwave Studio with
adaptive mesh size. The lateral dimensions of the SRRs (sample A) are taken asly ¼ 148 nm, lx ¼ 131 nm, the widths of the two arms is wx ¼ 48 nm and the widthof the central arm is wy ¼ 69 nm. To avoid sharp edges that could give rise tonumerical artefacts, we introduce round edges with a curve radius of 2 nm. TheSRRs are arranged in a periodic lattice with the lattice constant a¼ 300 nm. Thegold thickness is 20 nm. For modelling the gold, we use a Drude model with aplasma frequency of opl ¼ 2p � 2155 THz and a damping of g ¼ 2p � 26 THz.These values were obtained by fitting the Drude formula to the experimental valuesfor the permittivity of gold in the visible/near-infrared spectral region55 with aslightly increased damping to match the experimental depth and width of the SRRresonances. The refractive indices of the glass substrate is taken as nglass ¼ 1:5, ofthe 5-nm-thin indium-tin oxide layer as nITO ¼ 1:9, and for the PVA layer we takenPVA ¼ 1:345.
Numerical calculation of the mode volume. In order to calculate the effectivemode volume for the magnetic and electric modes at the centre wavelength of theQD emission, we numerically calculate the electric fields of a single SRR with thedimensions of sample A. The SRR is embedded in a homogeneous medium(neff ¼ 1:45) so that the resonance positions of the SRR are located at the samespectral position as for the periodic case (see Fig. 2). Since the height of the (planar)SRR is only 20 nm, the incident field for the calculation of the mode volume isstrictly identical along the extent of the SRRs (for normal incidence) and we canapply the quasi-static approximation56 to calculate the mode-volume integral for aleaky plasmonic cavity47,48
V ¼R
Wd3ravðWÞ : ð5Þ
This equation is a widely used measure for the mode volume of plasmoniccavities in the literature57–59. Here avðWÞ is the average energy density experiencedby a randomly positioned emitter in the simulation volume (which is, truncated atthe boundaries of the metamaterial unit cell and the height of the QD-containingPVA layer (see inset in Fig. 6). For the calculation of the energy density in thehomogeneous medium, we use Wn ¼ en Ej j2 and for the metal we use47
WAu ¼ Re eAuð Þþ 2oIm eAuð Þ=g½ Ej j2, where g is the Drude damping of gold. Thepermittivity of gold eAu is taken from our simulations. Finally, we calculate theextent of the mode volume in the z direction (light-shaded area in the inset inFig. 6) by dividing Equation 5 by the unit-cell area and obtain the total z height ofthe mode volume (indicated in Fig. 6) after subtraction of the linear divergence(dashed lines in Fig. 6). Since the mode volume extends symmetricallyfrom � zheight=2 to þ zheight=2, we conclude that the mode volume extendsapproximately halfway into the QD-containing PVA layer. This also gives us
600 700 800Wavelength (nm)
900 1,000 600 700 800Wavelength (nm)
900 1,000
1
0.8Sample ASample BSample C
EE
E E
PLref
Sample ASample BSample CPL0
Sample ASample BSample CPL0
Sample ASample BSample CPLref
Nor
mal
ized
PL-
sign
al
Nor
mal
ized
PL-
sign
al
0.6
0.4
0.2
0
1
0.8
Nor
mal
ized
PL-
sign
al
0.6
0.4
0.2
0
1
0.8
Nor
mal
ized
PL-
sign
al
0.6
0.4
0.2
0
1
0.8
0.6
0.4
0.2
0
Model Experiment
Figure 5 | Line-shape distortion. Predicted and measured normalized micro-PL spectra for the magnetic (a,b) and electric (c,d) modes for samples
A, B and C plotted in blue, red and black, respectively. The measured PL of the uncoupled QD emission (PL0) and the modelled reference QD-PL
shape (PLref) are indicated as grey-shaded area. While for coupling to the electric mode (c,d) broadening and distortion of the PL emission are predicted
and observed, the PL for coupling to the magnetic mode (a,b) shows a narrowing with regard to the reference QD PL.
NATURE COMMUNICATIONS | DOI: 10.1038/ncomms3949 ARTICLE
NATURE COMMUNICATIONS | 4:2949 | DOI: 10.1038/ncomms3949 | www.nature.com/naturecommunications 7
& 2013 Macmillan Publishers Limited. All rights reserved.
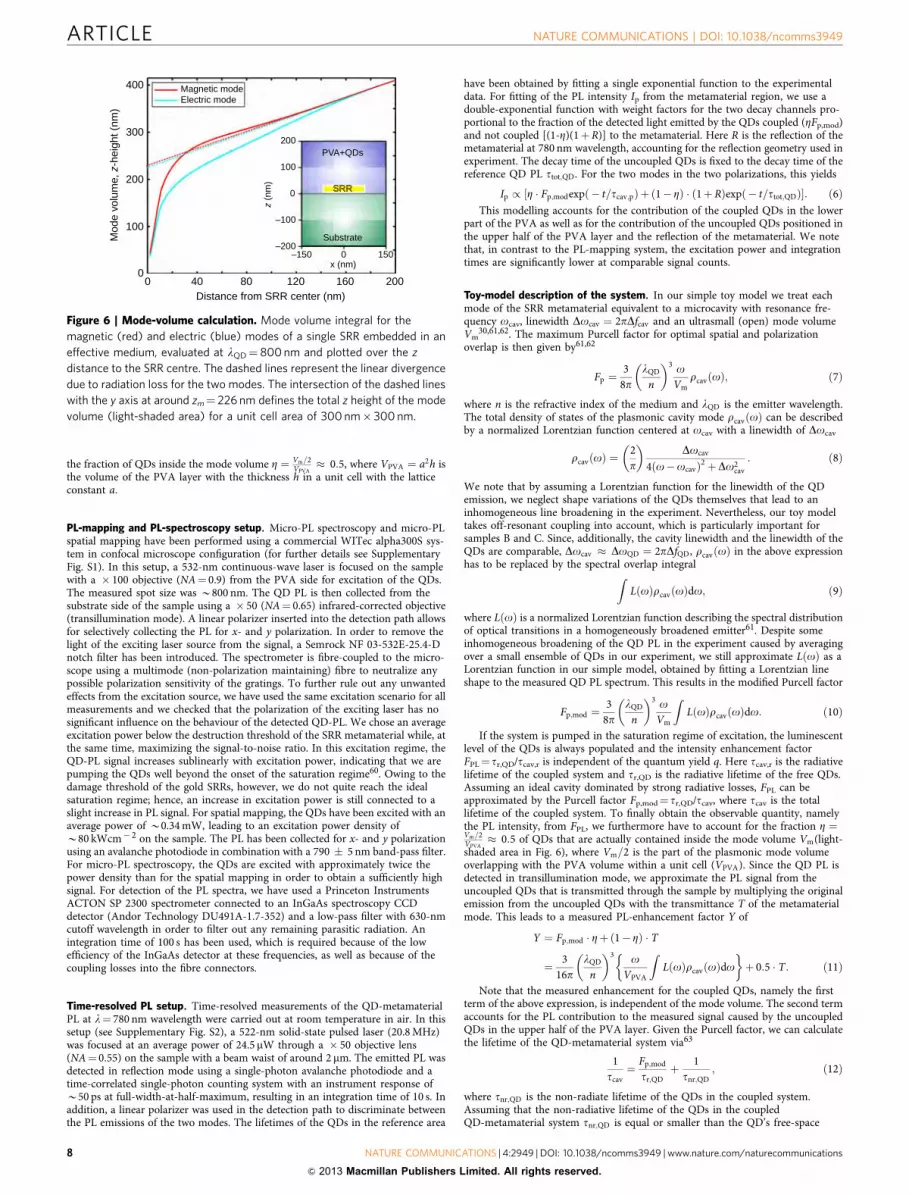
the fraction of QDs inside the mode volume Z ¼ Vm=2VPVA
� 0:5, where VPVA ¼ a2h isthe volume of the PVA layer with the thickness h in a unit cell with the latticeconstant a.
PL-mapping and PL-spectroscopy setup. Micro-PL spectroscopy and micro-PLspatial mapping have been performed using a commercial WITec alpha300S sys-tem in confocal microscope configuration (for further details see SupplementaryFig. S1). In this setup, a 532-nm continuous-wave laser is focused on the samplewith a � 100 objective (NA¼ 0.9) from the PVA side for excitation of the QDs.The measured spot size was B800 nm. The QD PL is then collected from thesubstrate side of the sample using a � 50 (NA¼ 0.65) infrared-corrected objective(transillumination mode). A linear polarizer inserted into the detection path allowsfor selectively collecting the PL for x- and y polarization. In order to remove thelight of the exciting laser source from the signal, a Semrock NF 03-532E-25.4-Dnotch filter has been introduced. The spectrometer is fibre-coupled to the micro-scope using a multimode (non-polarization maintaining) fibre to neutralize anypossible polarization sensitivity of the gratings. To further rule out any unwantedeffects from the excitation source, we have used the same excitation scenario for allmeasurements and we checked that the polarization of the exciting laser has nosignificant influence on the behaviour of the detected QD-PL. We chose an averageexcitation power below the destruction threshold of the SRR metamaterial while, atthe same time, maximizing the signal-to-noise ratio. In this excitation regime, theQD-PL signal increases sublinearly with excitation power, indicating that we arepumping the QDs well beyond the onset of the saturation regime60. Owing to thedamage threshold of the gold SRRs, however, we do not quite reach the idealsaturation regime; hence, an increase in excitation power is still connected to aslight increase in PL signal. For spatial mapping, the QDs have been excited with anaverage power of B0.34 mW, leading to an excitation power density ofB80 kWcm� 2 on the sample. The PL has been collected for x- and y polarizationusing an avalanche photodiode in combination with a 790 � 5 nm band-pass filter.For micro-PL spectroscopy, the QDs are excited with approximately twice thepower density than for the spatial mapping in order to obtain a sufficiently highsignal. For detection of the PL spectra, we have used a Princeton InstrumentsACTON SP 2300 spectrometer connected to an InGaAs spectroscopy CCDdetector (Andor Technology DU491A-1.7-352) and a low-pass filter with 630-nmcutoff wavelength in order to filter out any remaining parasitic radiation. Anintegration time of 100 s has been used, which is required because of the lowefficiency of the InGaAs detector at these frequencies, as well as because of thecoupling losses into the fibre connectors.
Time-resolved PL setup. Time-resolved measurements of the QD-metamaterialPL at l¼ 780 nm wavelength were carried out at room temperature in air. In thissetup (see Supplementary Fig. S2), a 522-nm solid-state pulsed laser (20.8 MHz)was focused at an average power of 24.5 mW through a � 50 objective lens(NA¼ 0.55) on the sample with a beam waist of around 2 mm. The emitted PL wasdetected in reflection mode using a single-photon avalanche photodiode and atime-correlated single-photon counting system with an instrument response ofB50 ps at full-width-at-half-maximum, resulting in an integration time of 10 s. Inaddition, a linear polarizer was used in the detection path to discriminate betweenthe PL emissions of the two modes. The lifetimes of the QDs in the reference area
have been obtained by fitting a single exponential function to the experimentaldata. For fitting of the PL intensity Ip from the metamaterial region, we use adouble-exponential function with weight factors for the two decay channels pro-portional to the fraction of the detected light emitted by the QDs coupled (ZFp,mod)and not coupled [(1-Z)(1þR)] to the metamaterial. Here R is the reflection of themetamaterial at 780 nm wavelength, accounting for the reflection geometry used inexperiment. The decay time of the uncoupled QDs is fixed to the decay time of thereference QD PL ttot;QD. For the two modes in the two polarizations, this yields
Ip / ½Z � Fp;modexpð� t=tcav;pÞþ ð1� ZÞ � ð1þRÞexpð� t=ttot;QDÞ: ð6ÞThis modelling accounts for the contribution of the coupled QDs in the lower
part of the PVA as well as for the contribution of the uncoupled QDs positioned inthe upper half of the PVA layer and the reflection of the metamaterial. We notethat, in contrast to the PL-mapping system, the excitation power and integrationtimes are significantly lower at comparable signal counts.
Toy-model description of the system. In our simple toy model we treat eachmode of the SRR metamaterial equivalent to a microcavity with resonance fre-quency ocav, linewidth Docav ¼ 2pDfcav and an ultrasmall (open) mode volumeVm
30,61,62. The maximum Purcell factor for optimal spatial and polarizationoverlap is then given by61,62
Fp ¼3
8plQD
n
� �3 oVm
rcavðoÞ; ð7Þ
where n is the refractive index of the medium and lQD is the emitter wavelength.The total density of states of the plasmonic cavity mode rcavðoÞ can be describedby a normalized Lorentzian function centered at ocav with a linewidth of Docav
rcav oð Þ ¼ 2p
� �Docav
4ðo�ocavÞ2 þDo2cav
: ð8Þ
We note that by assuming a Lorentzian function for the linewidth of the QDemission, we neglect shape variations of the QDs themselves that lead to aninhomogeneous line broadening in the experiment. Nevertheless, our toy modeltakes off-resonant coupling into account, which is particularly important forsamples B and C. Since, additionally, the cavity linewidth and the linewidth of theQDs are comparable, Docav � DoQD ¼ 2pDfQD, rcav oð Þ in the above expressionhas to be replaced by the spectral overlap integralZ
L oð Þrcav oð Þdo; ð9Þ
where L oð Þ is a normalized Lorentzian function describing the spectral distributionof optical transitions in a homogeneously broadened emitter61. Despite someinhomogeneous broadening of the QD PL in the experiment caused by averagingover a small ensemble of QDs in our experiment, we still approximate L oð Þ as aLorentzian function in our simple model, obtained by fitting a Lorentzian lineshape to the measured QD PL spectrum. This results in the modified Purcell factor
Fp;mod ¼3
8plQD
n
� �3 oVm
ZL oð Þrcav oð Þdo: ð10Þ
If the system is pumped in the saturation regime of excitation, the luminescentlevel of the QDs is always populated and the intensity enhancement factorFPL¼ tr,QD/tcav,r is independent of the quantum yield q. Here tcav,r is the radiativelifetime of the coupled system and tr,QD is the radiative lifetime of the free QDs.Assuming an ideal cavity dominated by strong radiative losses, FPL can beapproximated by the Purcell factor Fp,mod¼ tr,QD/tcav, where tcav is the totallifetime of the coupled system. To finally obtain the observable quantity, namelythe PL intensity, from FPL, we furthermore have to account for the fraction Z ¼Vm=2VPVA
� 0:5 of QDs that are actually contained inside the mode volume Vm(light-shaded area in Fig. 6), where Vm=2 is the part of the plasmonic mode volumeoverlapping with the PVA volume within a unit cell (VPVA). Since the QD PL isdetected in transillumination mode, we approximate the PL signal from theuncoupled QDs that is transmitted through the sample by multiplying the originalemission from the uncoupled QDs with the transmittance T of the metamaterialmode. This leads to a measured PL-enhancement factor Y of
Y ¼ Fp;mod � Zþ 1� Zð Þ � T
¼ 316p
lQD
n
� �3 oVPVA
ZL oð Þrcav oð Þdo
� þ 0:5 � T: ð11Þ
Note that the measured enhancement for the coupled QDs, namely the firstterm of the above expression, is independent of the mode volume. The second termaccounts for the PL contribution to the measured signal caused by the uncoupledQDs in the upper half of the PVA layer. Given the Purcell factor, we can calculatethe lifetime of the QD-metamaterial system via63
1tcav¼ Fp;mod
tr;QDþ 1
tnr;QD; ð12Þ
where tnr;QD is the non-radiate lifetime of the QDs in the coupled system.Assuming that the non-radiative lifetime of the QDs in the coupledQD-metamaterial system tnr;QD is equal or smaller than the QD’s free-space
400
300
Magnetic modeElectric mode
PVA+QDs
SRRSRR
Substrate
z (n
m)200
100
00 40 80 120 160
Distance from SRR center (nm)
Mod
e vo
lum
e, z
-hei
ght (
nm)
200
x (nm)
–100
–150 150
100
200
–200
0
0
Figure 6 | Mode-volume calculation. Mode volume integral for the
magnetic (red) and electric (blue) modes of a single SRR embedded in an
effective medium, evaluated at lQD¼ 800 nm and plotted over the z
distance to the SRR centre. The dashed lines represent the linear divergence
due to radiation loss for the two modes. The intersection of the dashed lines
with the y axis at around zm¼ 226 nm defines the total z height of the mode
volume (light-shaded area) for a unit cell area of 300 nm� 300 nm.
ARTICLE NATURE COMMUNICATIONS | DOI: 10.1038/ncomms3949
8 NATURE COMMUNICATIONS | 4:2949 | DOI: 10.1038/ncomms3949 | www.nature.com/naturecommunications
& 2013 Macmillan Publishers Limited. All rights reserved.

non-radiative lifetime t0;nr, we can use the QD’s measured free-space total radiativelifetime ttot;QD ¼ 1=gtot;QD and their quantum efficiency q ¼ gr;QD=gtot;QD. We canthen determine the lifetime tcav of the coupled QD metamaterials viatr;QD ¼ ttot;QD=q, t0;nr ¼ ttot;QD=ð1� qÞ and 1=ttot;QD ¼ 1=tr;QD þ 1=t0;nr; whichfinally results in
tcav � ttot;QD= Fp;mod � 1� �
qþ 1� �
: ð13ÞFollowing Tanaka et al.30, we can also estimate the line shape of the measured
PL by
wcalcðlÞ / FP;mod � Z � ½L oð Þrcav oð Þ þ 1� Zð Þ � L oð Þ � T ð14Þ
taking both the PL contribution of the QDs coupled to the metamaterial (firstterm) and the transmitted PL contribution of the uncoupled QDs (second term)into account.
The results of the toy-model calculations are summarized in SupplementaryTable S1. Naturally, deviations arise from the fact that the toy model does not takeall experimental details into account.
For instance, the toy model cannot fully map the variations with regard tolosses/non-radiative decay within the SRRs arising from variations of gold qualitybecause of different degrees of surface roughness for the samples A–C. Particularly,when approaching the fabrication limit by reducing the linewidth of the gold SRRs,the losses between the different samples may change significantly. However, adetailed analysis of this aspect is far from trivial and beyond the scope of our work.Additionally, the orientation of the QDs with respect to the electric-fieldcomponents is important when calculating the PL-enhancement factor. Since thisaspect is not accounted for in our toy model, this results in an overestimation of thePL enhancement. Another factor contributing to overestimation of the PLenhancement by our toy model, which, however, does not affect the lifetimeestimates, is the assumption of an ideal cavity dominated by strong radiative losses.Finally, we neglect deviations originating from directional emission of QDs incombination with the limited collection angle in detection in the experiment.Although this effect might play a role, our tests using a dedicated back-focal planesetup indicate that deviations originating from directional emission are small.
Generally, despite the limitations of our simple model, the quantitative valuesobtained from the toy model fit the experimental values well, hence, allowing us tomake qualitative predictions about the effect of different mode overlaps and modecharacteristics on the measured PL enhancement in our system.
Numerical simulations of PL enhancement. To further test the prediction of ourtoy model, we performed direct numerical simulations using CST MicrowaveStudio and the sample parameters for sample A. We simulate the emission of apoint-dipole oriented in x-, y- and z directions, respectively, and subsequentlydetect the QD emission in x- and y direction of polarization. We performed cal-culations of PL spectra for a quantum emitter situated in a plane at distances ofd¼ 5, 25, 45, 65 and 85 nm above the split-ring-resonator metamaterial and forseveral (30) positions of the dipole within each plane (see inset in Fig. 7). We thenaverage over the PL-enhancement values at each position and each distance d for x-polarized and y-polarized emissions. The PL-enhancement spectra for x- and y-polarized emissions of the dipoles are normalized to the emission of the referencepoint-dipole source. In doing so, we map the exponentially decaying electric fieldsof the SRR modes with a step width of 20 nm, keeping the simulation time atreasonable time scales. Furthermore, we avoid numerical artefacts because of thestep-like change in permittivity from gold to the surrounding medium by starting
the simulation at d¼ 5 nm above the gold surface. The resulting numerical PL-enhancement spectra are depicted in Fig. 7 for the magnetic and electric modes (y-and x-polarized emissions), respectively. For the spectral region around 790 nm(grey-shaded area), the numerical results confirm an average PL enhancement of2.02 for the magnetic mode as compared with 1.67 for the electric mode. Thesevalues are larger than those in the experiment, since the resonance linewidths of theelectric and magnetic resonances in the simulation are narrower than those in theexperiment (see Fig. 2c,d). As a result, the losses are smaller in the simulations andlarger PL-enhancement factors are expected. Despite the larger losses in theexperiment, we still observe a qualitatively good agreement between our numericalcalculations and our experimental results. Particularly, since the PL enhancementfor the magnetic mode is a factor of 1.21 larger than for the electric mode and thespectral distortion of the QD-PL is very well reproduced, our numerical calcula-tions are consistent with the experiment and the results from the toy model.
References1. Lodahl, P. et al. Controlling the dynamics of spontaneous emission from
quantum dots by photonic crystals. Nature 430, 654–657 (2004).2. Englund, D. et al. Controlling the spontaneous emission rate of single quantum
dots in a two-dimensional photonic crystal. Phys. Rev. Lett. 95, 013904 (2005).3. Russell, K. J., Liu, T.-L., Cui, S. & Hu, E. L. Large spontaneous emission
enhancement in plasmonic nanocavities. Nat. Photon. 6, 459–462 (2012).4. Toropov, A. A. et al. Optically enhanced emission of localized excitons in
InxGa1-xN films by coupling to plasmons in a gold nanoparticle. Phys. Rev. Lett.103, 037403 (2009).
5. Choy, J. T. et al. Enhanced single-photon emission from a diamond-silveraperture. Nat. Photon. 5, 738–743 (2011).
6. Atwater, H. & Polman, A. Plasmonics for improved photovoltaic devices. Nat.Mater. 9, 205–213 (2010).
7. Knight, M., Sobhani, H., Nordlander, P. & Halas, N. Photodetection with activeoptical antennas. Science 332, 702–704 (2011).
8. Jun, Y., Huang, K. & Brongersma, M. Plasmonic beaming and active controlover fluorescent emission. Nat. Commun. 2, 283 (2011).
9. Aouani, H. et al. Bright unidirectional fluorescence emission of molecules in ananoaperture with plasmonic corrugations. Nano Lett. 11, 637–644 (2011).
10. Smith, D. R., Padilla, W. J., Vier, D. C., Nemat-Nasser, S. C. & Schultz, S.Composite medium with simultaneously negative permeability andpermittivity. Phys. Rev. Lett. 84, 4184–4187 (2000).
11. Dolling, G., Enkrich, C., Wegener, M., Soukoulis, C. M. & Linden, S.Simultaneous negative phase and group velocity of light in a metamaterial.Science 312, 892–894 (2006).
12. Soukoulis, C. M., Linden, S. & Wegener, M. Negative refractive index at opticalwavelengths. Science 315, 47–49 (2007).
13. Rogacheva, A., Fedotov, V., Schwanecke, A. & Zheludev, N. I. Giant gyrotropydue to electromagnetic-field coupling in a bilayered chiral structure. Phys. Rev.Lett. 97, 177401 (2006).
14. Gansel, J. et al. Gold helix photonic metamaterial as broadband circularpolarizer. Science 325, 1513–1515 (2009).
15. Liu, N., Liu, H., Zhu, S. & Giessen, H. Stereometamaterials. Nat. Photon. 3,157–162 (2009).
16. Zhang, S. et al. Negative refractive index in chiral metamaterials. Phys. Rev.Lett. 102, 023901 (2009).
17. Decker, M., Zhao, R., Soukoulis, C. M., Linden, S. & Wegener, M. Twisted split-ring-resonator photonic metamaterial with huge optical activity. Opt. Lett. 35,1593–1595 (2010).
18. Huttunen, M. J. et al. Nonlinear chiral imaging of subwavelength-sized twisted-cross gold nanodimers [Invited]. Opt. Mater. Express 1, 46–56 (2011).
19. Zhang, X. & Liu, Z. Superlenses to overcome the diffraction limit. Nat. Mater.7, 435–441 (2008).
20. Bergman, D. & Stockman, M. Surface plasmon amplification by stimulatedemission of radiation: quantum generation of coherent surface plasmons innanosystems. Phys. Rev. Lett. 90, 027402 (2003).
21. Plum, E., Fedotov, V., Kuo, P., Tsai, D. & Zheludev, N. I. Towards the lasingspaser: controlling metamaterial optical response with semiconductor quantumdots. Opt. Express 17, 8548–8551 (2009).
22. Rakhmanov, A., Zagoskin, A., Savel’ev, S. & Nori, F. Quantum metamaterials:electromagnetic waves in a Josephson qubit line. Phys. Rev. B 77, 144507(2008).
23. Astafiev, O. et al. Resonance fluorescence of a single artificial atom. Science 327,840–843 (2010).
24. Zheludev, N. I. The road ahead for metamaterials. Science 328, 582–583 (2010).25. Dong, Z. G. et al. Optical loss compensation in a bulk left-handed metamaterial
by the gain in quantum dots. Appl. Phys. Lett. 96, 044104 (2010).26. Xiao, S. et al. Loss-free and active optical negative-index metamaterials. Nature
466, 735–738 (2010).27. Meinzer, N. et al. Arrays of Ag split-ring resonators coupled to InGaAs single-
quantum-well gain. Opt. Express 18, 24140–24151 (2010).
600500 700 800
Wavelength (nm)
PL-
enha
ncem
ent
900 1,000
1.5
2.5
2.0
1.0
0.5
0
Magnetic mode
Electric mode
Figure 7 | Numerical PL enhancement spectra. PL-enhancement
spectra for the magnetic (red) and electric (blue) modes of the SRR
averaged over all spatial positions indicated by the red dots in the inset. The
raw data are normalized to the emission of an undisturbed point dipole
and multiplied with the normalized experimental PL spectrum of
the QDs.
NATURE COMMUNICATIONS | DOI: 10.1038/ncomms3949 ARTICLE
NATURE COMMUNICATIONS | 4:2949 | DOI: 10.1038/ncomms3949 | www.nature.com/naturecommunications 9
& 2013 Macmillan Publishers Limited. All rights reserved.

28. Gabbay, A. et al. Interaction between metamaterial resonators andintersubband transitions in semiconductor quantum wells. Appl. Phys. Lett. 98,203103 (2011).
29. Hess, O. et al. Active nanoplasmonic metamaterials. Nat. Mater. 11, 573–584(2012).
30. Tanaka, K., Plum, E., Ou, J. Y., Uchino, T. & Zheludev, N. I. Multifoldenhancement of quantum dot luminescence in plasmonic metamaterials. Phys.Rev. Lett. 105, 227403 (2010).
31. Noginov, M. A. et al. Controlling spontaneous emission with metamaterials.Opt. Lett. 35, 1863–1865 (2010).
32. Krishnamoorthy, H., Jacob, Z., Narimanov, E., Kretzschmar, I. & Menon, V.Topological transitions in metamaterials. Science 336, 205–209 (2012).
33. Pendry, J. B., Holden, A., Robbins, D. & Stewart, W. Magnetism fromconductors and enhanced nonlinear phenomena. IEEE Trans MicrowaveTheory Tech. 47, 2075–2084 (1999).
34. Linden, S. et al. Magnetic response of metamaterials at 100 Terahertz. Science306, 1351–1353 (2004).
35. Decker, M., Burger, S., Linden, S. & Wegener, M. Magnetization waves in split-ring-resonator arrays: evidence for retardation effects. Phys. Rev. B 80, 193102(2009).
36. Decker, M., Feth, N., Soukoulis, C. M., Linden, S. & Wegener, M. Retardedlong-range interaction in split-ring-resonator square arrays. Phys. Rev. B 84,085416 (2011).
37. Rockstuhl, C. et al. On the reinterpretation of resonances in split-ring-resonators at normal incidence. Opt. Express 14, 8827–8836 (2006).
38. von Cube, F. et al. Spatio-spectral characterization of photonic meta-atomswith electron energy-loss spectroscopy [Invited]. Opt. Mater. Express 1,1009–1018 (2011).
39. Muhlig, S., Menzel, C., Rockstuhl, C. & Lederer, F. Multipole analysis of meta-atoms. Metamaterials 5, 64–73 (2011).
40. Anger, P., Bharadwaj, P. & Novotny, L. Enhancement and quenching of single-molecule fluorescence. Phys. Rev. Lett. 96, 113002 (2006).
41. Curto, A. G. et al. Unidirectional emission of a quantum dot coupled to ananoantenna. Science 329, 930–933 (2010).
42. Luk’yanchuk, B. et al. The Fano resonance in plasmonic nanostructures andmetamaterials. Nat. Mater. 9, 707–715 (2010).
43. Miroshnichenko, A. E., Flach, S. & Kivshar, Y. S. Fano resonances in nanoscalestructures. Rev. Mod. Phys. 82, 2257–2298 (2010).
44. Mertens, H., Koenderink, A. & Polman, A. Plasmon-enhanced luminescencenear noble-metal nanospheres: Comparison of exact theory and an improvedGersten and Nitzan model. Phys. Rev. B 76, 115123 (2007).
45. Enkrich, C. et al. Magnetic metamaterials at telecommunication and visiblefrequencies. Phys. Rev. Lett. 95, 203901 (2005).
46. Rockstuhl, C. et al. The origin of magnetic polarizability in metamaterials atoptical frequencies – an electrodynamic approach. Opt. Express 15, 8871–8883(2007).
47. Maier, S. A. Plasmonic field enhancement and SERS in the effective modevolume picture. Opt. Express 14, 1957–1964 (2006).
48. Koenderink, A. F. On the use of Purcell factors for plasmon antennas. Opt. Lett.35, 4208–4210 (2010).
49. Kinkhabwala, A. et al. Large single-molecule fluorescence enhancementsproduced by a bowtie nanoantenna. Nat. Photon. 3, 654–657 (2009).
50. Lee, K.-G. et al. Spontaneous emission enhancement of a single molecule by adouble-sphere nanoantenna across an interface. Opt. Express 20, 23331–23338(2012).
51. Huang, Z., Koschny, T. & Soukoulis, C. M. Theory of Pump-probe experimentsof metallic metamaterials coupled to a gain medium. Phys. Rev. Lett. 108,187402 (2012).
52. Shields, A. J. Semiconductor quantum light sources. Nat. Photon. 1, 215–223(2007).
53. Maksymov, I. S., Miroshnichenko, A. E. & Kivshar, Y. S. Plasmonicnanoantennas for efficient control of polarization-entangled photon pairs. Phys.Rev. A 86, 011801 (2012).
54. Suo, B. et al. Poly (vinyl alcohol) thin film filled with CdSe–ZnS quantum dots:fabrication, characterization and optical properties. Mater. Chem. Phys. 119,237–242 (2010).
55. Johnson, P. B. & Christy, R. W. Optical constants of the noble metals. Phys.Rev. B 6, 4370–4379 (1972).
56. Derom, S., Vincent, R., Bouhelier, A. & Colas des Francs, G. Resonance quality,radiative/ohmic losses and modal volume of Mie plasmons. Europhys. Lett. 98,47008 (2012).
57. Sun, G., Kurghin, J. B. & Soref, R. A. Practical enhancement ofphotoluminescence by metal nanoparticles. Appl. Phys. Lett. 94, 101103 (2009).
58. Hill, M. T. et al. Lasing in metallic-coated nanocavities. Nat. Photon. 1,589–594 (2007).
59. Oulton, R. F., Sorger, V. J., Genov, D. A., Pile, D. F. P. & Zhang, X. A hybridplasmonic waveguide for subwavelength confinement and long-rangepropagation. Nat. Photon. 2, 496–500 (2008).
60. Gerard, J.-M. & Gayral, B. Strong Purcell effect for InAs quantum boxes inthree-dimensional solid-state microcavities. J. Lightw. Technol. 17, 2089–2095(1999).
61. Gerard, J.-M. in Topics in Applied Physics Vol. 90 Ch. 7, 269–314 (Springer,2003).
62. Giannini, V., Fernandez-Domınguez, A., Heck, S. & Maier, S. A. Plasmonicnanoantennas: fundamentals and their use in controlling the radiativeproperties of nanoemitters. Chem. Rev. 111, 3888–3912 (2011).
63. Gong, Y. et al. Linewidth narrowing and Purcell enhancement in photoniccrystal cavities on an Er-doped silicon nitride platform. Opt. Express 18,2601–2612 (2010).
AcknowledgementsWe acknowledge the financial support by the Australian Research Council. The fabri-cation facilities used in this work are supported by the Australian National FabricationFacility (ANFF). This work was also supported by the Ministry of Education and Scienceof the Russian Federation, project 11.G34.31.0020, the Russian Foundation for BasicResearch, projects 11-02-00865 and 13-02-00186, and the Russian Academy of Sciences,program No. 24. We acknowledge useful discussions with P. Belov, S. Fan andM. Limonov.
Author contributionsM.D. fabricated the metamaterial samples and performed CST simulations. I.S. preparedthe QD samples with experimental support by V.K.A.S. and A.Z. QD-PL spatial map-ping, confocal spectroscopy and transmittance measurements have been performed byI.I.S. and K.B.S. with experimental support by I.S., M.D. and A.M. Time-resolved PLmeasurements have been carried out by I.S. and M.D. with the support of I.I.S., K.B.S.,P.P. and C.J. The toy model was developed by M.D., I.S. and A.E.M. The manuscript waswritten by M.D., I.S., D.N.N. and Y.S.K. D.N.N. and Y.S.K. guided the research. M.D.,I.S., I.I.S. and K.B.S. contributed equally to this work. All authors contributed todiscussions.
Additional informationSupplementary Information accompanies this paper at http://www.nature.com/naturecommunications
Competing financial interests: The authors declare no competing financial interests.
Reprints and permission information is available online at http://npg.nature.com/reprintsandpermissions/
How to cite this article: Decker, M. et al. Dual-channel spontaneous emission ofquantum dots in magnetic metamaterials. Nat. Commun. 4:2949 doi: 10.1038/ncomms3949 (2013).
ARTICLE NATURE COMMUNICATIONS | DOI: 10.1038/ncomms3949
10 NATURE COMMUNICATIONS | 4:2949 | DOI: 10.1038/ncomms3949 | www.nature.com/naturecommunications
& 2013 Macmillan Publishers Limited. All rights reserved.


