Embed Size (px)
Citation preview

Subscriber access provided by MPI FUR BIOPHYS CHEM
Nano Letters is published by the American Chemical Society. 1155 Sixteenth StreetN.W., Washington, DC 20036Published by American Chemical Society. Copyright © American Chemical Society.However, no copyright claim is made to original U.S. Government works, or worksproduced by employees of any Commonwealth realm Crown government in the courseof their duties.
Communication
Dual-label STED nanoscopy of living cells using photochromismKatrin I Willig, Andre C. Stiel, Tanja Brakemann, Stefan Jakobs, and Stefan W. Hell
Nano Lett., Just Accepted Manuscript • Publication Date (Web): 26 July 2011
Downloaded from http://pubs.acs.org on July 26, 2011
Just Accepted
“Just Accepted” manuscripts have been peer-reviewed and accepted for publication. They are postedonline prior to technical editing, formatting for publication and author proofing. The American ChemicalSociety provides “Just Accepted” as a free service to the research community to expedite thedissemination of scientific material as soon as possible after acceptance. “Just Accepted” manuscriptsappear in full in PDF format accompanied by an HTML abstract. “Just Accepted” manuscripts have beenfully peer reviewed, but should not be considered the official version of record. They are accessible to allreaders and citable by the Digital Object Identifier (DOI®). “Just Accepted” is an optional service offeredto authors. Therefore, the “Just Accepted” Web site may not include all articles that will be publishedin the journal. After a manuscript is technically edited and formatted, it will be removed from the “JustAccepted” Web site and published as an ASAP article. Note that technical editing may introduce minorchanges to the manuscript text and/or graphics which could affect content, and all legal disclaimersand ethical guidelines that apply to the journal pertain. ACS cannot be held responsible for errorsor consequences arising from the use of information contained in these “Just Accepted” manuscripts.
1
Dual-label STED nanoscopy of living cells using
photochromism
Katrin I. Willig*, Andre C. Stiel, Tanja Brakemann, Stefan Jakobs & Stefan W. Hell*
Max-Planck-Institute for Biophysical Chemistry, Am Fassberg 11, 37077 Göttingen Germany
RECEIVED DATE
* To whom correspondence should be addressed. E-mail: [email protected] (SWH); [email protected]
(KIW)
ABSTRACT We demonstrate live-cell STED microscopy of two protein species using photochromic
green fluorescent proteins as markers. The reversible photoswitching of two markers is implemented so
that they can be discerned with a single excitation and STED wavelength, and a single detection
channel. Dual-label STED microscopy is shown in living mammalian cells.
KEYWORDS microscopy, two-color, superresolution, photoswitching, green fluorescent protein
MANUSCRIPT TEXT Emergent superresolution fluorescence microscopy (nanoscopy) displaying
far-field optical resolution well beyond the diffraction limit has the potential to transform the life
sciences. Over the last years several concepts for overcoming the diffraction barrier have been
developed. While they all rely on modulating the fluorescence emission such that adjacent features
fluoresce sequentially in time, these methods also boast differences in operation and strengths1. Among
the reported methods, STED fluorescence nanoscopy stands out by its ease of operation, wide range of
applicability, recording speed, and ability to record 3D images from deep inside transparent specimens.
Page 1 of 12
ACS Paragon Plus Environment
Nano Letters
123456789101112131415161718192021222324252627282930313233343536373839404142434445464748495051525354555657585960

2
In a typical STED microscope2, 3
, the majority of the fluorophores covered by the diffracted focal spot
of excitation light are transiently rendered non-fluorescent, by preventing them from occupying the
fluorescent state. This is accomplished by superimposing the spot of excitation light with a doughnut
shaped light spot of a wavelength inducing stimulated emission from the excited state of the fluorophore
back down to its ground state. Only those fluorophores that happen to reside in subdiffraction proximity
to the doughnut center are allowed to fluoresce. Scanning the beams across or through the sample forces
adjacent features to fluoresce consecutively, so that they can be discerned by the detector.
Single-color live-cell STED-microscopy has been shown in a variety of applications including the
imaging of labeled vesicles at video-rate4, of cultured mammalians cells expressing various fusion
proteins labeled with organic dyes5, 6
, of YFP-labeled neurons in living organotypic brain slices7, and
others. Clearly, many applications require the imaging of two different fluorescent proteins in living
cells. However, while STED microscopy has been extended to multiple colors8, implementations of
two-color STED entailed (a combination of) additional pairs of laser lines8, 9
, or an additional detection
channel8, or the use of fluorophores with long Stokes shifts
10-12. The latter also requires an additional
excitation wavelength. While STED microscopy has recently been extended to three colors by
exploiting a multi-lifetime analysis13
, two-color measurements in living cells have still been hampered
by the complexity involved.
In this study we introduce a technically simple approach for STED microscopy of two fluorophores.
The method is demonstrated with photochromic fluorescent proteins, which are genetically encoded and
hence inherently compatible with living cells. Photochromic fluorescent proteins or reversible
switchable fluorescent proteins (RSFPs) are structurally similar to the green fluorescent protein (GFP),
but may be reversibly photoswitched from a non-fluorescent (off) to a fluorescent (on) state and back by
irradiation with light of different wavelengths, whereby the longer switching wavelength also leads to
fluorescence emission. RSFPs exhibit either a negative switching mode whereby the light eliciting
fluorescence induces the off-switching, or a positive switching mode in which the on-switching is
induced14
.
Page 2 of 12
ACS Paragon Plus Environment
Nano Letters
123456789101112131415161718192021222324252627282930313233343536373839404142434445464748495051525354555657585960

3
Here we use both the positive switching RSFP Padron14
and the negative switching Dronpa-M159T15
,
which is an improved and faster switching variant of Dronpa16
(Fig. 1A). The fluorescence of both
proteins is induced by optical irradiation at 488 nm. Moreover, Padron and Dronpa-M159T feature a
similar spectrum peaking at 515 nm and 511 nm, respectively (Fig. 1B). To optimize these RSFPs for
the expression in mammalian cells, we introduced the point mutation A218G and altered their N- and C-
termini. Hence, we refer to these RSFPs as Padronv2.0
and Dronpa-M159Tv2.0
, with v2.0 standing for
'improved version two'. Since the fluorescence excitation and emission spectra of both proteins are very
similar, one can expect the same excitation and STED wavelengths to work for both. Importantly,
because they exhibit antipodal switching characteristics, one should be able to switch these RSFPs
successively to the on-state so that they are sequentially recorded by STED nanoscopy. Since the two
RSFPs are separated by sequential switching rather than wavelength, the recording of Padronv2.0
and
Dronpa-M159Tv2.0
is inherently monochromatic. Chromatic distortions are excluded. Our approach
requires just a single additional wavelength for RSFP switching, which for the proteins in use was at
405 nm.
Page 3 of 12
ACS Paragon Plus Environment
Nano Letters
123456789101112131415161718192021222324252627282930313233343536373839404142434445464748495051525354555657585960
4
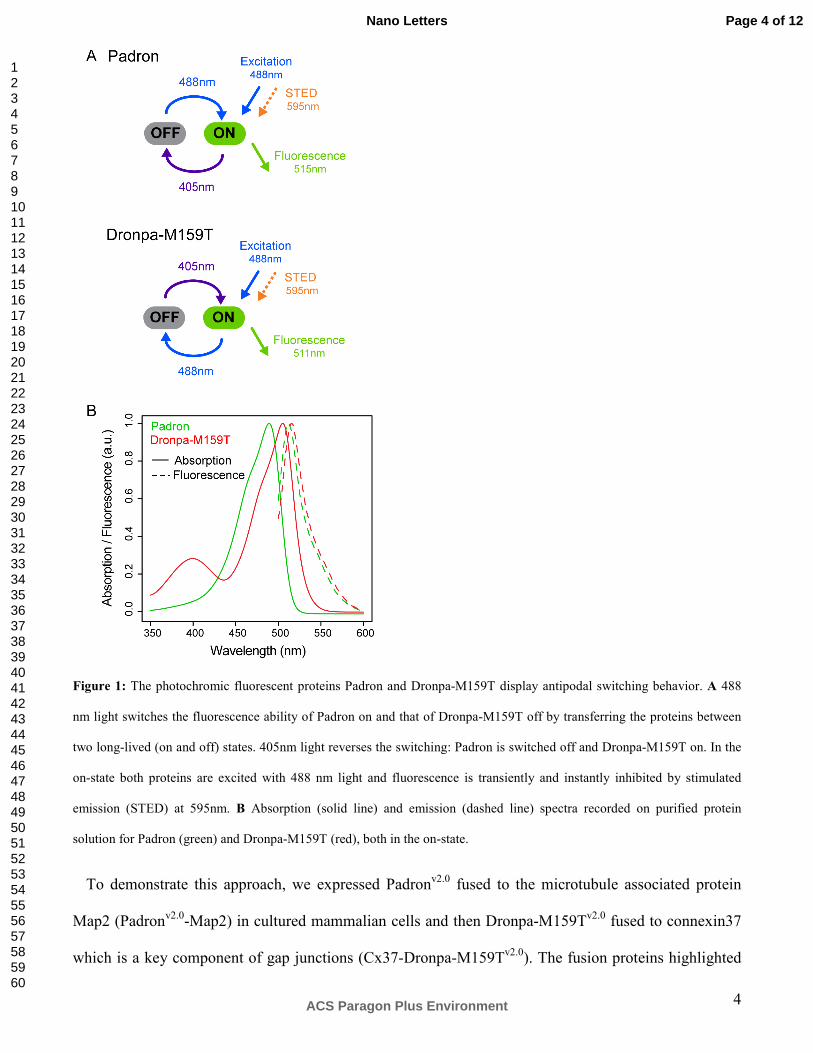
Figure 1: The photochromic fluorescent proteins Padron and Dronpa-M159T display antipodal switching behavior. A 488
nm light switches the fluorescence ability of Padron on and that of Dronpa-M159T off by transferring the proteins between
two long-lived (on and off) states. 405nm light reverses the switching: Padron is switched off and Dronpa-M159T on. In the
on-state both proteins are excited with 488 nm light and fluorescence is transiently and instantly inhibited by stimulated
emission (STED) at 595nm. B Absorption (solid line) and emission (dashed line) spectra recorded on purified protein
solution for Padron (green) and Dronpa-M159T (red), both in the on-state.
To demonstrate this approach, we expressed Padronv2.0
fused to the microtubule associated protein
Map2 (Padronv2.0
-Map2) in cultured mammalian cells and then Dronpa-M159Tv2.0
fused to connexin37
which is a key component of gap junctions (Cx37-Dronpa-M159Tv2.0
). The fusion proteins highlighted
Page 4 of 12
ACS Paragon Plus Environment
Nano Letters
123456789101112131415161718192021222324252627282930313233343536373839404142434445464748495051525354555657585960

5
the microtubule cytoskeleton and the gap junctions, respectively (Fig. 2). To image the distribution of
Padronv2.0
-Map2 in the diffraction-limited confocal mode, we irradiated just with 488 nm light, which
kept the proteins in the on-state and concomitantly induced fluorescence. In case of Cx37-Dronpa-
M159Tv2.0
, the cells were additionally irradiated with light of 405 nm to keep the proteins in the on-state
during imaging. Both Padronv2.0
and Dronpa-M159Tv2.0
could be imaged in the STED mode using light
of 595 nm for stimulated emission (Fig. 2).
The images demonstrate the resolution improvement gained by STED, as structures are clearly
discernible in the STED recordings which are blurred in their confocal counterparts. The residual
fluorescence of Dronpa-M159Tv2.0
residing in the off state was below 2 % of that of its on-state
fluorescence in the confocal mode and 9 % in the STED mode, demonstrating the good switching
contrast obtainable with this protein. Using the same light intensities, Padronv2.0
was switched to 30 %
of the maximal fluorescence both in the confocal and the STED mode (Fig. 2A). We note that in case of
Padronv2.0
, the switching contrast can be further improved by adjusting the light intensities, if required.
Together, these data demonstrate that Padronv2.0
and Dronpa-M159Tv2.0
can be expressed as functional
fusion proteins in living cells, that both proteins facilitate sub-diffraction imaging in the STED-mode,
and that they can be antagonistically photoswitched such that the two protein species can be
discriminated.
Page 5 of 12
ACS Paragon Plus Environment
Nano Letters
123456789101112131415161718192021222324252627282930313233343536373839404142434445464748495051525354555657585960

6
Figure 2: Crosstalk of the Padronv2.0
and Dronpa-M159Tv2.0
channel with and without STED. A Padronv2.0
-Map2 highlights
microtubules in PtK2 cell. It is switched on and read out with 488 nm light (green). Additional 595 nm STED light improves
the resolution significantly beyond the diffraction limit. Switching off with additional 405 nm light yields a small signal
which results in crosstalk into the Dronpa-M159Tv2.0
channel (red). B Cx37-Dronpa-M159Tv2.0
forming gap junctions in the
plasma membrane. No significant fluorescence is detected upon 488 nm illumination both with and without 595 nm STED
light. Additional 405 nm light switches Dronpa-M159Tv2.0
to the on state showing clusters in the confocal mode and with
sub-diffraction resolution just by turning on the STED beam as well. The color maps of the “ON” and corresponding “OFF”
images have the same range. Focal excitation power 1.4µW for all confocal and 4.2µW for all STED images; focal STED
power 22.6mW. Scale bars = 500nm.
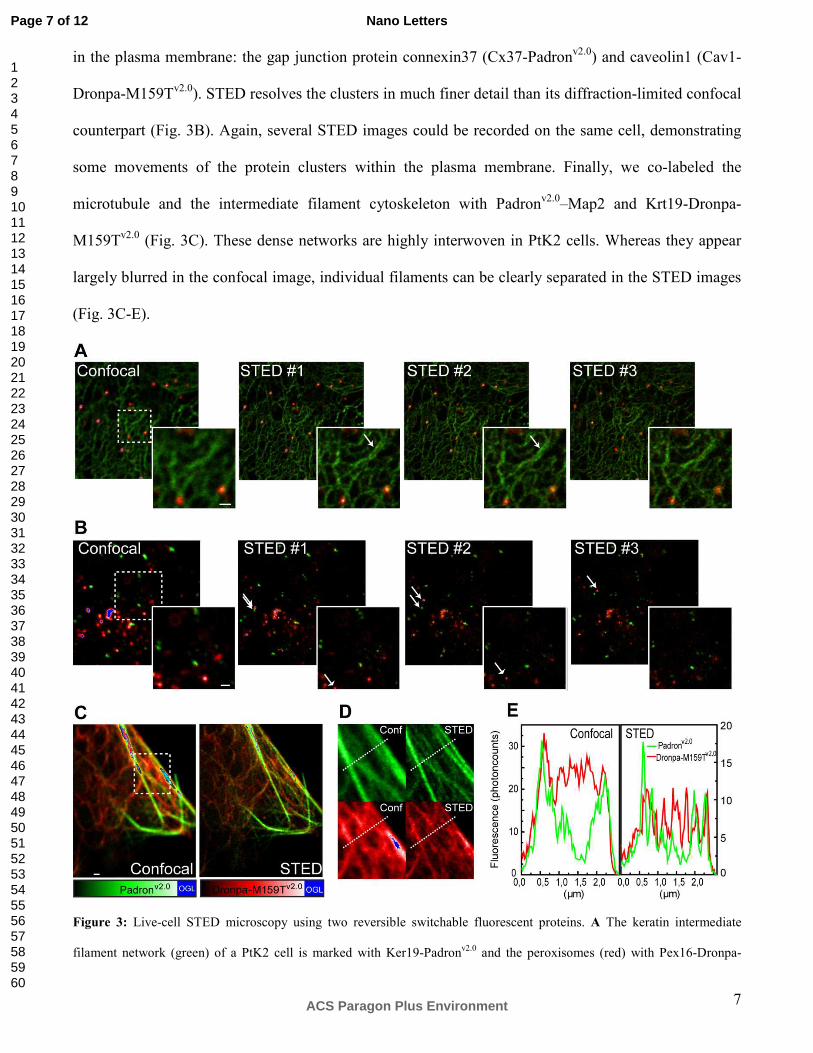
To demonstrate STED-imaging of living cells co-expressing Padronv2.0
and Dronpa-M159Tv2.0
, we
fused both RSFPs to different host proteins. Fig. 3A shows the intermediate filament network (Krt19-
Padronv2.0
, green) and the peroxisomes (Pex16-Dronpa-M159Tv2.0
, red) imaged in the confocal and
STED microscopy mode. STED microscopy resolves individual filaments within the network and the
peroxisomes as small spherical structures. Repetitive STED imaging reveals slight dynamical changes
in the structures (see arrows in Fig. 3A). Next, we tagged two proteins which are known to form clusters
Page 6 of 12
ACS Paragon Plus Environment
Nano Letters
123456789101112131415161718192021222324252627282930313233343536373839404142434445464748495051525354555657585960
7
in the plasma membrane: the gap junction protein connexin37 (Cx37-Padronv2.0
) and caveolin1 (Cav1-
Dronpa-M159Tv2.0
). STED resolves the clusters in much finer detail than its diffraction-limited confocal
counterpart (Fig. 3B). Again, several STED images could be recorded on the same cell, demonstrating
some movements of the protein clusters within the plasma membrane. Finally, we co-labeled the
microtubule and the intermediate filament cytoskeleton with Padronv2.0
–Map2 and Krt19-Dronpa-
M159Tv2.0
(Fig. 3C). These dense networks are highly interwoven in PtK2 cells. Whereas they appear
largely blurred in the confocal image, individual filaments can be clearly separated in the STED images
(Fig. 3C-E).
Figure 3: Live-cell STED microscopy using two reversible switchable fluorescent proteins. A The keratin intermediate
filament network (green) of a PtK2 cell is marked with Ker19-Padronv2.0
and the peroxisomes (red) with Pex16-Dronpa-
Page 7 of 12
ACS Paragon Plus Environment
Nano Letters
123456789101112131415161718192021222324252627282930313233343536373839404142434445464748495051525354555657585960
8
M159Tv2.0
. The STED image resolves the filaments of the keratin network which is blurred in the confocal image. Repeating
the STED images (#1, #2, #3) shows the dynamics of keratin network (highlighted by arrows) and peroxisomes in the living
cells with sub-diffraction resolution. B Gap junctions (Cx37-Padronv2.0
, green) and caveolin1 (Cav1-Dronpa-M159Tv2.0
, red)
form cluster in the plasma membrane of a Vero cell. STED microscopy distinguishes the clusters much better than the
standard confocal image and shows a small movement of the clusters between the STED images number #1, #2 and #3
(compare arrows). C Two cytoskeletal structures, Padronv2.0
-Map2 (green) attached to microtubule and keratin (Ker19-
Dronpa-M159Tv2.0
, red) form an intricate mesh. STED microscopy reveals the network much better than the confocal mode.
D Magnification of the boxed area in C; display of the separate channels. E Line profiles averaged over 3 pixels of the
dashed line in D shows separately resolved fibers only by using STED microscopy. All images were recorded within ~ 20s
per frame directly one after the other. The color maps of both channels of an image have the same range. Excitation and
STED power equivalent to Fig. 2, besides excitation #2 STED: 8.3µW, #3 STED: 11.4µW. Scale bars = 500nm.
In STED microscopy, the attainable resolution depends on the applied STED laser intensity and the
cross-section for stimulated emission. We adjusted the STED intensity so that several consecutive
images in both channels could be recorded. A higher STED power would have resulted in a higher
resolution at the expense of increased photobleaching. Under the chosen experimental conditions we
found that in the dual-label images, the full-width at half-maximum (FWHM) of small structures (which
is an estimate of the resolution) was ~70 nm or ~ 90 nm in case of Padronv2.0
or Dronpa-M159Tv2.0
-
labeled structures, respectively. Presumably, the slightly lower resolution in the Dronpa-M159Tv2.0
STED-images can be attributed to two properties of this fluorophore: i) its fluorescence emission is
blue-shifted by 4 nm as compared to Padronv2.0
, lowering the cross-section for stimulated emission, ii)
the fluorescence lifetime of Dronpa-M159Tv2.0
is only 0.8 ns which is much shorter than the 2.5 ns
fluorescence lifetime of EYFP which has previously been used in STED microscopy. Also, it is much
shorter than the 3.0 ns lifetime of Padron v2.0
. All these factors reduce the STED efficiency further,
making STED of Dronpa-M159Tv2.0
more sensitive to pulse timing jitter17
.
To minimize the spurious autofluorescence induced by the 405 nm line, we also implemented a
modality in which we alternated the irradiation with the 488 nm and 405 nm laser lines. Whereas in the
Page 8 of 12
ACS Paragon Plus Environment
Nano Letters
123456789101112131415161718192021222324252627282930313233343536373839404142434445464748495051525354555657585960

9
first half of the resonant scanner duty cycle one of the lines was on, in the second half the other line was
on, while the signal of both duty cycles was collected separately to form an image. However, this
measure is not strictly needed because the autofluorescence background can also be avoided by spatially
offsetting the beams. The 405 nm switching light spot can be slightly displaced in which case the
autofluorescence is not sensed by the confocal detection. Confocal detection was used because it
conveniently suppresses the background. Note that neither STED microscopy per se nor this dual-label
version strictly require the use of a confocal arrangement.
Importantly, this study has been performed with two photochromic proteins that were not specifically
optimized for STED microscopy. Hence future generations of RSFPs specifically tailored for this
approach or smart labels using photochomic synthetic fluorophores are likely to facilitate higher
imaging speeds as well as higher resolution values. In summary, the use of photochromic fluorescent
proteins enabled the first dual-label STED microscopy recording in living cells. Using a single
wavelength channel for excitation, STED, and detection, the concept is readily implemented and hence
should find wide use in superresolution imaging of living cells.
ACKNOWLEDGMENT We thank Tanja Gilat, Sylvia Löbermann and Ellen Rothermel for cell
culturing and plasmid generation, Birka Lalkens for creative and supportive help with the double
labeling, Volker Westphal and Andreas Schönle for help with the scanning hard- and software and
Jaydev Jethwa for critical reading of the manuscript. Parts of this work were supported by Deutsche
Forschungsgemeinschaft through the DFG-Research Center for Molecular Physiology of the Brain (to
S.J.) and the Leibniz prize of the Deutsche Forschungsgemeinschaft (to S.W.H.).
Supporting Information Available: A Material & Methods section describing the new termini, the
plasmid generation, cell preparation and STED setup. This material is available free of charge via the
Internet at http://pubs.acs.org.
REFERENCES
Page 9 of 12
ACS Paragon Plus Environment
Nano Letters
123456789101112131415161718192021222324252627282930313233343536373839404142434445464748495051525354555657585960

10
1. Hell, S. W., Microscopy and its focal switch. Nature Methods 2009, 6 (1), 24-32.
2. Hell, S. W.; Wichmann, J., Breaking the diffraction resolution limit by stimulated-emission -
stimulated-emission-depletion fluorescence microscopy. Optics Letters 1994, 19 (11), 780-782.
3. Klar, T. A.; Jakobs, S.; Dyba, M.; Egner, A.; Hell, S. W., Fluorescence microscopy with
diffraction resolution barrier broken by stimulated emission. Proceedings of the National Academy of
Sciences of the United States of America 2000, 97, 8206-8210.
4. Westphal, V.; Rizzoli, S. O.; Lauterbach, M. A.; Kamin, D.; Jahn, R.; Hell, S. W., Video-Rate
Far-Field Optical Nanoscopy Dissects Synaptic Vesicle Movement. Science 2008, 320 (5873), 246-249.
5. Hein, B.; Willig, K. I.; Wurm, C. A.; Westphal, V.; Jakobs, S.; Hell, S. W., Stimulated Emission
Depletion Nanoscopy of Living Cells Using SNAP-Tag Fusion Proteins. Biophysical Journal 2010, 98,
158 - 163.
6. Fitzpatrick, J. A. J.; Yan, Q.; Sieber, J. J.; Dyba, M.; Schwarz, U.; Szent-Gyorgyi, C.; Woolford,
C. A.; Berget, P. B.; Waggoner, A. S.; Bruchez, M. P., STED Nanoscopy in Living Cells Using
Fluorogen Activating Proteins. Bioconjugate Chemistry 2009, 20 (10), 1843-1847.
7. Nägerl, U. V., K. I. Willig, B. Hein, S. W. Hell, T. Bonhoeffer, Live-cell imaging of dendritic
spines by STED microscopy. Proceedings of the National Academy of Sciences of the United States of
America 2008, 105 (48), 18982-18987.
8. Donnert, G.; Keller, J.; Wurm, C. A.; Rizzoli, S. O.; Westphal, V.; Schoenle, A.; Jahn, R.;
Jakobs, S.; Eggeling, C.; Hell, S. W., Two-Color Far-Field Fluorescence Nanoscopy. Biophysical
Journal 2007, 92 (8), L67–L69.
9. Neumann, D.; Bückers, J.; Kastrup, L.; Hell, S.; Jakobs, S., Two-color STED microscopy
reveals different degrees of colocalization between hexokinase-I and the three human VDAC isoforms.
PMC Biophysics 2010, 5 (3), 1-4.
Page 10 of 12
ACS Paragon Plus Environment
Nano Letters
123456789101112131415161718192021222324252627282930313233343536373839404142434445464748495051525354555657585960

11
10. Schmidt, R.; Wurm, C. A.; Jakobs, S.; Engelhardt, J.; Egner, A.; Hell, S. W., Spherical
nanosized focal spot unravels the interior of cells. Nature Methods 2008, 5 (6), 539-544.
11. Gugel, H.; Giske, A.; Dyba, M.; Sieber, J., Confocal imaging at the nanoscale with two-color
STED microscopy. Proc. SPIE - Int. Soc. Opt. Eng. 2011, 7905, 79050X (7 pp.)-79050X (7 pp.)79050X
(7 pp.).
12. Friedemann, K.; Turshatov, A.; Landfester, K.; Crespy, D., Characterization via Two-Color
STED Microscopy of Nanostructured Materials Synthesized by Colloid Electrospinning. Langmuir
2011, 27 (11), 7132-7139.
13. Bückers, J.; Wildanger, D.; Vicidomini, G.; Kastrup, L.; Hell, S. W., Simultaneous multi-
lifetime multi-color STED imaging for colocalization analyses. Optics Express 2011, 19 (4), 3130 -
3143.
14. Andresen, M.; Stiel, A. C.; Folling, J.; Wenzel, D.; Schonle, A.; Egner, A.; Eggeling, C.; Hell, S.
W.; Jakobs, S., Photoswitchable fluorescent proteins enable monochromatic multilabel imaging and
dual color fluorescence nanoscopy. Nature Biotechnology 2008, 26 (9), 1035-1040.
15. Stiel, A. C.; Trowitzsch, S.; Weber, G.; Andresen, M.; Eggeling, C.; Hell, S. W.; Jakobs, S.;
Wahl, M. C., 1.8 angstrom bright-state structure of the reversibly switchable fluorescent protein dronpa
guides the generation of fast switching variants. Biochemical Journal 2007, 402 (1), 35-42.
16. Ando, R.; Mizuno, H.; Miyawaki, A., Regulated Fast Nucleocytoplasmic Shuttling Observed by
Reversible Protein Highlighting. Science 2004, 306 (5700), 1370-1373.
17. Leutenegger, M.; Eggeling, C.; Hell, S. W., Analytical description of STED microscopy
performance. Optics Express 2010, 18 (25), 26417-26429.
Page 11 of 12
ACS Paragon Plus Environment
Nano Letters
123456789101112131415161718192021222324252627282930313233343536373839404142434445464748495051525354555657585960

12
TABLE OF CONTENTS GRAPHICS
Page 12 of 12
ACS Paragon Plus Environment
Nano Letters
123456789101112131415161718192021222324252627282930313233343536373839404142434445464748495051525354555657585960


