Embed Size (px)
Citation preview

T h e o p e n – a c c e s s j o u r n a l f o r p h y s i c s
New Journal of Physics
Exploring single-molecule dynamics withfluorescence nanoscopy
Christian Ringemann1, Ben Harke1, Claas von Middendorff1,Rebecca Medda1, Alf Honigmann2, Richard Wagner2,Marcel Leutenegger1, Andreas Schönle1, Stefan W Hell1
and Christian Eggeling1
1 Department of Nanobiophotonics, Max Planck Institute for BiophysicalChemistry, Am Fassberg 11, 37077 Göttingen, Germany2 Biophysik, University Osnabrück, FB Biologie/Chemie, Osnabrück, GermanyE-mail: [email protected]
New Journal of Physics 11 (2009) 103054 (29pp)Received 30 April 2009Published 27 October 2009Online at http://www.njp.org/doi:10.1088/1367-2630/11/10/103054
Abstract. The study of molecular dynamics at the single-molecule level withfluorescence correlation spectroscopy (FCS) and far-field optics has contributedgreatly to the functional understanding of complex systems. Unfortunately,such studies are restricted to length scales of >200 nm because diffractiondoes not allow further reduction of the measurement volume. This sets anupper limit on the applicable concentration of fluorescently labeled moleculesand even more importantly, averages out details of nanoscale dynamics. Bycombining FCS and fluorescence intensity distribution analysis (FIDA) withsub-diffraction–resolution stimulated emission depletion (STED) nanoscopy, weremove this restriction and obtain open measurement volumes of nanoscaledimensions which are tunable in size. As a consequence, single-molecule studiescan now be extended to nanoscale dynamics and may be applied to much larger,often endogenous concentrations. In solution, low-brightness signal from axialout-of-focus volume shells was taken into account by using both FCS andFIDA in conjunction to analyze the data. In two-dimensional systems, such aslipid membranes, the background is greatly reduced and measurements featureexcellent signal-to-noise ratios. Measurement foci of down to 30 nm in diameterdirectly reveal anomalous diffusion of lipids in the plasma membrane of livingcells and allow for the determination of on/off rates of the binding of lipids
New Journal of Physics 11 (2009) 1030541367-2630/09/103054+29$30.00 © IOP Publishing Ltd and Deutsche Physikalische Gesellschaft

2
to other membrane constituents. Such important insight into the prominentbiological question of lipid membrane organization or ‘lipid rafts’ shows thatcombining fluctuation analysis with STED-engineered ultra-small measurementvolumes is a viable and powerful new approach to probing molecular dynamicson the nanoscale.
Contents
1. Introduction 22. Experimental 4
2.1. Dye solution . . . . . . . . . . . . . . . . . . . . . . . . . . . . . . . . . . . . 42.2. Multilamellar layer . . . . . . . . . . . . . . . . . . . . . . . . . . . . . . . . 42.3. Horizontal black lipid bilayer . . . . . . . . . . . . . . . . . . . . . . . . . . . 52.4. Cellular membrane . . . . . . . . . . . . . . . . . . . . . . . . . . . . . . . . 52.5. STED microscope . . . . . . . . . . . . . . . . . . . . . . . . . . . . . . . . . 52.6. FCS . . . . . . . . . . . . . . . . . . . . . . . . . . . . . . . . . . . . . . . . 72.7. FIDA . . . . . . . . . . . . . . . . . . . . . . . . . . . . . . . . . . . . . . . 82.8. Apparent particle number and brightness . . . . . . . . . . . . . . . . . . . . . 92.9. FIDA correction . . . . . . . . . . . . . . . . . . . . . . . . . . . . . . . . . . 102.10. FCS analysis of lipid membrane diffusion . . . . . . . . . . . . . . . . . . . . 112.11. Monte Carlo simulation of lipid membrane diffusion . . . . . . . . . . . . . . 12
3. Results and discussion 123.1. Principle of STED nanoscopy . . . . . . . . . . . . . . . . . . . . . . . . . . 123.2. Aqueous environment . . . . . . . . . . . . . . . . . . . . . . . . . . . . . . . 133.3. Dependence on experimental conditions . . . . . . . . . . . . . . . . . . . . . 173.4. Suppression of low-brightness signal contributions . . . . . . . . . . . . . . . 203.5. STED–FCS on lipid membranes . . . . . . . . . . . . . . . . . . . . . . . . . 213.6. Photobleaching . . . . . . . . . . . . . . . . . . . . . . . . . . . . . . . . . . 233.7. Live cell observations . . . . . . . . . . . . . . . . . . . . . . . . . . . . . . . 24
4. Conclusion 26Acknowledgments 27Appendix. Global FCS–FIDA analysis 27References 28
1. Introduction
The study of cellular processes requires sensitive and non-invasive observation techniques.Using visible light, fluorescence microscopy is largely benign to biological tissue and hasreached a sensitivity that allows for the detection of single molecules with high temporalresolution. It is thus ideally suited to study cellular dynamics on the molecular level andquantitative analysis of such single-molecule experiments is readily performed by studyingthe fluctuations of the fluorescence signal using well-established techniques like fluorescencecorrelation spectroscopy (FCS) [1]–[3] and photon-counting histogram (PCH) analysis [4] orfluorescence intensity distribution analysis (FIDA) [5]. However, due to the diffraction of light,far-field optics cannot separate the signal from features of the same kind that are less than
New Journal of Physics 11 (2009) 103054 (http://www.njp.org/)

3
approximately half the wavelength apart, i.e. 200–250 nm when using visible light [6]. Thislimited resolution blocks further insights into a lot of important biophysical processes because(i) it sets a lower limit on the achievable measurement volume and (ii) with sizes of <20 nmthe molecular building blocks of complex systems such as proteins are still out of reach. As aconsequence, the concentration of fluorescently marked molecules in single-molecule studieshas to be in the nanomolar range, which is sometimes below the natural and endogenousconcentration of the molecules under study, making it essential to lower the volume’s scalebelow diffraction [7, 8]. More importantly, the standard confocal microscopy spot usuallyaverages over details of nanoscale molecular dynamics. It has been demonstrated that someinformation about nanoscopic movement can be indirectly inferred when using model-basedapproaches [9], for example, by extrapolating measurement results to the nanoscopic case [10].However, due to the averaging, these approaches cannot deliver a clear signature of dynamicsbelow the length scale defined by the wavelength; instead they rely rather heavily on correctquantitative modeling of the system under study. Direct measurements at the length scale ofinterest, on the other hand, would deliver much more reliable and more model-independentresults about nanoscopic details and concomitantly allow indirect methods to access evensmaller length scales.
Therefore near-field optical techniques such as the probing on nanostructures ornanoholes [7, 11] have been used to downsize the measurement volume and to study processesat the nanoscale. However, these techniques are restricted to studies at or close to surfaces andtheir invasive nature may result in unwanted influence on the system under study. Therefore,these methods could not replace non-invasive far-field microscopy especially for dynamicstudies on living cells. In an attempt to access smaller length scales, far-field microscopy wasthus combined with single-particle tracking (SPT), using the much higher spatial localizationaccuracy of bright marker particles of down to below 10 nm [12, 13]. This however introducesother restrictions: to reach the desired spatial localization accuracy, SPT often applies bright butlarge and clumsy signal markers, which potentially influence the system under study. Further,the temporal resolution and statistical averaging of SPT still lacks far behind FCS and relatedtechniques.
In the 1990s, the strategy of exploiting the spectral properties of the fluorescentmarkers themselves for overcoming the diffraction barrier paved the way to far-fieldnanoscopy [14]–[16]. A whole range of ‘diffraction-unlimited’ microscopy approaches hasemerged since then [17], which despite their differences, are ultimately all based on switchingthe markers between a bright and a dark state to detect spatial features closer than thediffraction barrier sequentially in time. For example, sub-diffraction-resolution stimulatedemission depletion (STED) nanoscopy [14, 18] uses stimulated emission to switch offfluorescence everywhere outside small, confined regions. These regions are then scannedacross the diffraction limited volume to sequentially read out the spatial distribution ofmarker molecules within this volume. Far-field imaging with spatial resolutions down to thescale of ∼20 nm has become routinely possible using this approach [19]. Because it allowscontinuous downscaling of the detection volume, STED seems ideally suited to adjust themeasurement volume of fluctuation measurements to the length scale of interest and we havepreviously shown that it is indeed possible to observe single-molecule dynamics in nano-sizedvolumes in aqueous environment by combining STED with FCS [20]. However, this initialexperimental realization also showed drawbacks. While the predicted decrease in focal volumecould directly be measured from the dynamical single-molecule data, a concomitant relative
New Journal of Physics 11 (2009) 103054 (http://www.njp.org/)

4
increase in unspecific background signal precluded accurate single-molecule measurements.Here, we explore the reason for this additional background in detail, determine conditions for anoptimized nanoscopic single-molecule detection and extend our initial experiments accordingly.We show that the aforementioned unspecific background signal is caused by contributions oflow fluorescence signal from axial out-of-focus volume shells in which the fluorescence abilityof the dye was not entirely switched off by STED. In three-dimensional (3D) geometries, biasfrom these low-brightness contributions is minimized experimentally by decreasing the sizeof the confocal pinhole. Remaining contributions can be handled during analysis by a globalFCS–FIDA approach and we thus demonstrate the study of freely diffusing dye moleculesin an open measurement volume, confined more than 25-fold compared to the confocal case.Our approach is feasible for both 2D and 3D focal confinement, and with both pulsed andcontinuous-wave (CW) irradiation.
Importantly, unspecific out-of-focus background is absent when measuring on 2D samples.Consequently, STED nanoscopy studies of single-molecule dynamics on membranes featureexcellent signal-to-noise ratios, thereby allowing continuous down-scaling of the focal spot, inthe present experiments down to 30 nm in diameter. Here, we demonstrate nanoscale observationof the heterogeneous diffusion behavior of fluorescent phosphoglycero- and sphingolipids inthe plasma membrane of living cells and determine on/off rates of their nanoscale trappingto other membrane constituents. While phosphoglycerolipids almost diffuse freely, trappingis pronounced for the sphingolipids with on and off rates of ∼80 s−1. Consequently, thecombination of fluctuation analysis with STED-engineered ultra-small measurement volumessheds new light on prominent biological problems such as the putative formation of ‘lipid rafts’,which are assumed to play an important functional role in cells.
2. Experimental
2.1. Dye solution
The organic dye Atto647N (fluorescence excitation and emission maxima of 645 and 670 nm,respectively; Atto-Tec, Siegen, Germany) was dissolved either in PBS buffer (pH 7.5) or2,2′-thiodiethanol (TDE, Sigma-Aldrich; 96%, 4% water) to a final concentration of 1–10 nM.We performed measurements of the free diffusing dyes at 22 ◦C in 100 µl samples sealed onmicroscope cover glass.
2.2. Multilamellar layer
We put 100 µl of phospholipid blend (DOPE (1,2-dioleoyl-sn-glycero-3-phospho-ethanolamine), DOPS (1,2-dioleoyl-sn-glycero-3-phosphoserine), DOPC (1,2-dioleoyl-sn-glycero-3-phosphocholine) (Avanti polar lipids, Alabaster, AL) 5 : 3 : 2 in chloroform10 mg ml−1, stored at −20 ◦C under N2-atmosphere) on a cover slip and subsequently evapo-rated it under vacuum for roughly 1.30 h. Afterwards the dried lipids were swelled in distilledwater to a multilamellar layer for half an hour and rinsed two or three times. For fluorescencemeasurements, 1 µl of a 0.01 mg ml−1 solution of an Atto647N labeled phosphoglycerolipid(Atto647N-1,2-dipalmitoyl-sn-glycero-3-phosphoethanolamine, Atto-Tec, referred to asAtto647N-PE) was added to the phospholipid blend before evaporation to yield a dye/lipidmolar ratio of approximately 1 : 100 000.
New Journal of Physics 11 (2009) 103054 (http://www.njp.org/)

5
2.3. Horizontal black lipid bilayer
To perform measurements on a horizontal lipid bilayer (black lipid bilayer), L-α-phosphatidylcholine lipid (type S-IV, Sigma-Aldrich, Steinheim, Germany) was kept at −20 ◦Cin a chloroform/methanol (1 : 1) mixture at 50 mg ml−1. After vacuum evaporation of 100 µlof the stock solution we solved the lipid in 100 µl n-decane. Planar lipid bilayers were createdusing a modified painting technique in a setup depicted in figure 6(d) [21, 22]. Briefly, a dropof lipid was smeared over a small hole of ∼100 µm in diameter in a Teflon foil separating twowater-filled chambers. The lower chamber was bordered by a microscope cover glass, resultingin a cover glass-to-bilayer distance of approximately 100–150 µm. After the evaporation ofn-decan, a stable lipid bilayer forms spontaneously. To perform FCS measurements on thebilayer membranes, we added 10 µl of the 0.01 mg ml−1 solution of the Atto647N labeledphosphoglycerolipid Atto647N-PE (see above) to the S-IV-lipid before evaporation to yield adye/lipid molar ratio of ∼1 : 50 000.
2.4. Cellular membrane
We incorporated fluorescent lipid analogues into the plasma membrane of living PtK2 cells. Thecells were seeded on no.1 thickness standard glass coverslips (diameter 25 mm) to a confluenceof about 80%. The cells were grown at 37 ◦C in a water-saturated atmosphere of 5% CO2 in air.All media and supplements were purchased from Invitrogen. We used the following fluorescentlipids in our live-cell measurements: the phosphoglycerolipid Atto647N-PE (see above) andthe sphingolipid N-(Atto647N)-sphingosylphosphocholine (N-Atto647-sphingomyelin, Atto-Tec, referred to as Atto647N-SM). Complexes of the labeled lipids and bovine serum albumin(BSA) were prepared according to Martin and Pagano [23] and Schwarzmann et al [24] withslight modifications. Briefly, 100 nmol of the lipid stock solutions (CHCl3/MeOH, 3 : 1) weredried under a stream of nitrogen. The dried lipids were dissolved in 20 µl of absolute ethanoland vortexed vigorously after addition of 1 ml of defatted BSA solution (100 µM, i.e. 10−4 Mdefatted BSA in Dulbecco’s Modified Eagle Medium (DMEM) without phenol-red bufferedwith 10 mM HEPES). Addition of 9 ml HDMEM (HEPES + DMEM = HDMEM) resulted in afinal concentration of 10 µM BSA and 0.2% ethanol. In the case of PE, the BSA concentrationwas twice as large (2 × 10⁻⁴ M). Afterwards, cells were washed with HDMEM and incubatedwith BSA-lipid-complexes (5–50 nM in the case of Atto647N-SM and 10–300 nM in thecase of Atto647N-PE) on ice for 30 min, washed in cold HDMEM and incubated at 37 ◦Cfor 4 min in HDMEM. Measurements were performed at room temperature (22–24 ◦C).We excluded diffusion of non-integrated fluorescent lipids by control measurements inbetween the cells.
2.5. STED microscope
We incorporated a standard epi-illuminated confocal microscope for our fluorescenceexperiments. Fluorescence excitation was performed with a 633 nm pulsed laser diode (∼80 pspulse width, LDH-P-635, Picoquant, Berlin, Germany) or a CW laser diode (FiberTEC635;AMS Technologies, Munich, Germany). We supplied the STED light by a Titan:Sapphirelaser system (MaiTai, Spectra-Physics, Mountain View, CA; or Mira 900F, Coherent) runningat 750–780 nm and with a repetition rate of 76 and 80 MHz, respectively, or the Mira900F system operated in CW at 780 nm. In the case of pulsed irradiation, the repetition
New Journal of Physics 11 (2009) 103054 (http://www.njp.org/)

6
rate of the STED laser was taken as trigger for the excitation laser with timing adjustmentbetween the excitation and STED pulse performed by a home-build delay electronic. Atoptimum, the STED pulse immediately followed and partially overlapped with the excitationpulse. We controlled and stabilized the STED power by a laser power controller unit (LPC,Brockton Electronics, Brockton, MA) and coupled the linearly polarized STED beam througha 120 m long polarization-maintaining single-mode fiber (AMS Technologies) for stretchingthe pulses to about 250–300 ps. After spatial overlay of both laser beams with appropriatedichroic filters (AHF Analysentechnik, Tübingen, Germany) they were directed on a beam-scanning device (mirror tilting system PSH 10/2, Piezosystem Jena, Jena, Germany) and intothe microscope (DMIRBE, Leica Microsystems, Mannheim, Germany). We applied an oilimmersion objective (PLAPON 60 × NA = 1.42, Olympus, Japan, or HCXPLAPO NA = 1.4,Leica) to focus the laser light to a diffraction-limited spot on the sample and to collect thefluorescence emission. In the case of the horizontal lipid bilayers, we used a water immersionobjective (UPLSAPO 60 × NA = 1.2, Olympus). The axial position of the focal spots wasadjusted by an objective lens positioning system (MIPOS 250, Piezosystem Jena). We produceda doughnut-shaped focal spot with a central zero of the STED light by introducing a phase plateinto the beam path, imprinting a helical phase ramp exp(iϕ) with 06 ϕ 6 2π on the wave frontand introducing a λ/4 plate for circular polarization of the beam in front of the objective. Foraxial confinement, we introduced a phase plate into the linear polarized STED light beam thatπ -phase shifted the central half of the wave front incident on the objective (the beam was againcircularly polarized by a λ/4 plate in front of the objective). In the case of both lateral andaxial phase confinement, the linearly polarized STED beam was split up by a polarizing beamsplitter, each divided beam traversed one of the two different phase plates, and both beams wereagain re-combined by another polarizing beam splitter before being circularly polarized by aλ/4 plate in front of the objective. The respective powers of STED light for the lateral andaxial confinement were controlled by a λ/2 plate in front of the first polarizing beam splitter.In our 3D confinement experiments the power of the STED light was evenly split up onto bothbeam paths. The fluorescence was imaged back over the beam-scanning device and coupledinto a multi-mode 50 : 50 fiber splitter (Fiber Optic Network Technology, Surrey, Canada)with an aperture size corresponding to 1.4× the magnified confocal fluorescence spot (if nototherwise specified). The fluorescence signals were then detected by two single-photon countingunits (avalanche photo diode SPCM-AQR-13-FC, Perkin Elmer Optoelectronics, Fremont, CA).We blocked potential contributions from scattered laser light or unwanted autofluorescence byappropriate fluorescence filtering (AHF). The fluorescence counts were further processed bya hardware correlator (Flex02-01D, Correlator.com, NJ) for FCS and FIDA. We calculatedthe excitation intensity Iexc from the power Pexc incident on the sample and the focal areaAexc; Iexc = Pexc/Aexc. We determined Aexc ≈ π(FWHMexc/2)2 from the diameter FWHMexc
(full-width at half-maximum) of the conventional diffraction-limited focal spot. The values ofFWHMexc ≈ 240 nm for the oil immersion and ≈330 nm for the water immersion objectivewere measured by scanning over a scattering gold bead of sub-diffraction diameter (80 nmgold colloid, En.GC80, BBinternational, Cardiff, UK) and detecting the scattered signal ona non-confocal detector (MP 963 Photon Counting Module, Perkin Elmer). The intensityof the excitation light was usually 25 kW cm−2. For the STED light, we indicate the powerPSTED incident on the sample. The maximum pulse peak intensity of the focal spot of theSTED light can be estimated by ISTED,P(max) ≈ k PSTED/ASTED/(τP f ) with a scaling factork = 1 for the non-engineered spot and k = 0.3 and 0.5 for the spots engineered for lateral
New Journal of Physics 11 (2009) 103054 (http://www.njp.org/)

7
and axial confinement, respectively, the pulse duration τP, and the pulse repetition rate f .ASTED ≈ π(FWHMSTED/2)2 denotes the focal area of the non-engineered spot of the STEDlight and was determined by the experimentally measured focal diameter FWHMSTED ≈ 340 nm(oil immersion objective) or 400 nm (water immersion objective). For calibration of the STEDmicroscope with lateral confinement, we determined the diameters of the effective fluorescencefoci by scanning approximately 20 nm large fluorescent crimson beads (Molecular Probes,Eugene, OR) for the various STED powers and established the radii (at half-maximum of thedetected signal intensity) of the accordingly imaged beads.
2.6. FCS
FCS [1]–[3] analyses the temporal fluctuations δF(t) = F(t) − 〈F(t)〉 of the detectedfluorescence signal F(t) by calculating the normalized second-order auto-correlation functionGN(tc),
GN(tc) = 1 + 〈δF(t) δF(t + tc)〉/〈F(t)〉2, (1)
with correlation time tc and angular brackets indicating averaging over the measurement time t .Fluctuations δF(t) may stem from single dye molecules diffusing in and out of the detectionvolume or transiently turning dark due to, for example, transition into their metastable darktriplet state. We analyzed the correlation data according to common FCS theory [25].
GN(tc) = 1 + GN(0)[GD(tc)GT(tc)], (2a)
with
GD(tc) = (1 + tc/τxy)−1(1 + tc/τz)
−1/2, (2b)
GT(tc) = 1 + T/(1 − T ) exp (−tc/τT), (2c)
describing diffusion and triplet state dynamics. Here, a spatial 3D Gaussian profile of thedetected fluorescence was assumed. The lateral τ xy = rxy
2/(2D ln2) and axial transit timeτ z = rz
2/(2D ln2) through the 3D Gaussian profile are given by the diffusion constant D and thelateral and axial radii rxy and rz of the 3D Gaussian profile, respectively. The radii are definedat half the maximum of the Gaussian intensity distribution and rxy complies with the focalradius defined in equation (19). Further, on–off blinking of the molecular fluorescence from thetransition into the dye’s dark triplet state was regarded in the FCS analysis by the characteristicparameters of an average triplet population T and a triplet correlation time τT [25].
With the general 3D spatial coordinate r , the spatial profile of the detected fluorescenceQ(r) = Q0h(r) is expressed by the product of the maximum focal brightness Q0, i.e.maximum instantaneous count-rate per single fluorescing molecule, and the spatial fluorescencedetection profile h(r) with h(0) = 1. h(r) is defined through the focal intensity distributionof the excitation laser, the resulting spatial profile of fluorescence emission (including spatialdependent saturation of fluorescence excitation) and the spatial detection efficiency. The latterresults from the point-spread function of the imaging system and the diameter of the confocalpinhole. h(r) slightly deviates from a 3D Gaussian distribution. However, the inclusion of morecomplex spatial profiles would result in a drastic increase of complexity of FCS analysis withonly little effect on the resulting data. Because the Gaussian approximation fitted all of ourcorrelation data well, we used it throughout the manuscript; we can safely assume that the
New Journal of Physics 11 (2009) 103054 (http://www.njp.org/)

8
decay of the correlation curves, i.e. the values of τ xy and τ z give a good estimate of the relativeconfinement of the measurement volume by STED.
The amplitude GN(0) of the correlation curve is inversely proportional to the averagenumber of dye molecules in the detection volume. For negligible background signal, one usuallydefines a number of molecules Nfcs by
GN(0) = 1/Nfcs, (3)
where Nfcs = cV fcs with c being the physical concentration in molecules per unit volume. Thevolume Vfcs is defined by the size and form of the detection volume,
Vfcs = V 2
/∫h(r)2 dr 3
= V/γ, (4)
where the actual detection volume V is given by the volume integral
V =
∫h(r) dr 3 (5)
and the factor γ = V/Vfcs parameterizes the deviation of its shape from a box. The definition ofVfcs and consequently Nfcs results from the normalization of the correlation function by 〈F(t)〉2
(equation (1)). Vfcs and Nfcs are determined by all contributions of the detection volume, i.e. alsomolecules of low fluorescence brightness in the focal periphery contribute significantly to Nfcs.
2.7. FIDA
While FCS analyzes the temporal characteristics of the fluctuating fluorescence signal, FIDA(or PCH) [4, 5] extracts information from the amplitudes of the fluctuating fluorescence signalF(t). Specifically, a frequency histogram P(n) is formed from the number of counts n recordedin successive time intervals of fixed duration 1T . Fitting of a theoretical distribution to P(n)
provides a specific fluorescence brightness q, i.e. a detected count-rate per single molecule,a particle number N of the fluorescent molecule under study, and the amount of backgroundsignal Bb.
For a theoretical description of P(n), FIDA has to account for the inhomogeneous spatialfluorescence detection profile h(r). While the actual shape of h(r) is of no importance, anaccurate description of P(n) requires the knowledge of the relative volume size that a specificfluorescence brightness spans. In FIDA, the units of brightness are often chosen differentlythan in FCS and the apparent brightness profile B(r) = B0h(r) is introduced alongside a new,dimensionless variable w = ln(B0/B(r)) = −ln(h(r)). The volume element 1Vi defined by asmall brightness interval 1w around the brightness wi is described with sufficient accuracy bya function with three additional fitting parameters a0, a1 and a2 [26].
1Vi = V ′(w)1w = A0wa2i
⌊1 + a0wi + a1w
2i
⌋1w (6)
where the derivative V ′(w) = dV/dw describes the differential weight of regions withbrightness w and the choice of the parameter A0 defines the units of concentration. The systemparameters a0, a1 and a2 are empirical and can be determined by calibrating the optical systemwith a standard dye sample. The number of counts detected from the volume fraction 1Vi
is characterized by fluctuations in the average particle number and in the number of photoncounts n detected per time window 1T , both given by Poisson distributions. Thus, for a dye
New Journal of Physics 11 (2009) 103054 (http://www.njp.org/)
9
of concentration C and brightness q the probability Pi(n) to detect n photons from the section1Vi of the detection volume is given by
Pi(n) =
∞∑m=0
[(C1Vi)
m
m!exp(−C1Vi)
] [(mq B(wi)1T )n
n!exp(−mq B(wi)1T )
]. (7)
Here, q B(wi) = q B0exp(−wi) denotes the brightness (i.e. the expectation value of the detectionrate of fluorescence photons per molecule) of a dye located in 1Vi and m is the numberof fluorescing molecules present in the volume fraction. The overall theoretical photon countprobability function P(n) is then given by the convolution over all volume contributions Pi(n)
and the Poisson photon count distribution Pb(n) accounting for a possible background photonrate Bb
Pb(n) = (Bb1T )n/n! exp(−Bb1T ). (8)
In FIDA, convolution is performed efficiently through the principle of generating functionsreplacing the convolution of the Pi(n) by the multiplication of their generating functions [5, 26].For 1w → 0, the generating function of P(n) can eventually be written as a 1D integralover w which is then fitted to the experimental distributions to obtain estimates for C and q.As mentioned above, their units are determined by the choice of constants B0 and A0. It isconventional to fix them such that, in the units of volume defined by A0, the integrals
∫B dV =∫
B(w)V ′(w) dw and∫
B2 dV are normalized to unity [5]. In this case B0 = 1/γ = Vfcs/Vand the concentration and brightness fit parameters are scaled such that C = Nfcs = cV fcs andq = Q0/B0 = γ Q0 with the particle number Nfcs and the fluorescence detection volume Vfcs
defined in equations (3) and (4), the focal peak brightness Q0 and the factor γ given byequation (4). Again, the values Nfcs and q average over all detection volume contributions, evenover low-brightness contributions of, for example, the focal periphery. The historical reason forthis convention is that, if scaled in this way, C = N fcs and q can be calculated directly frommoment analysis [27] if the background contribution is negligible.
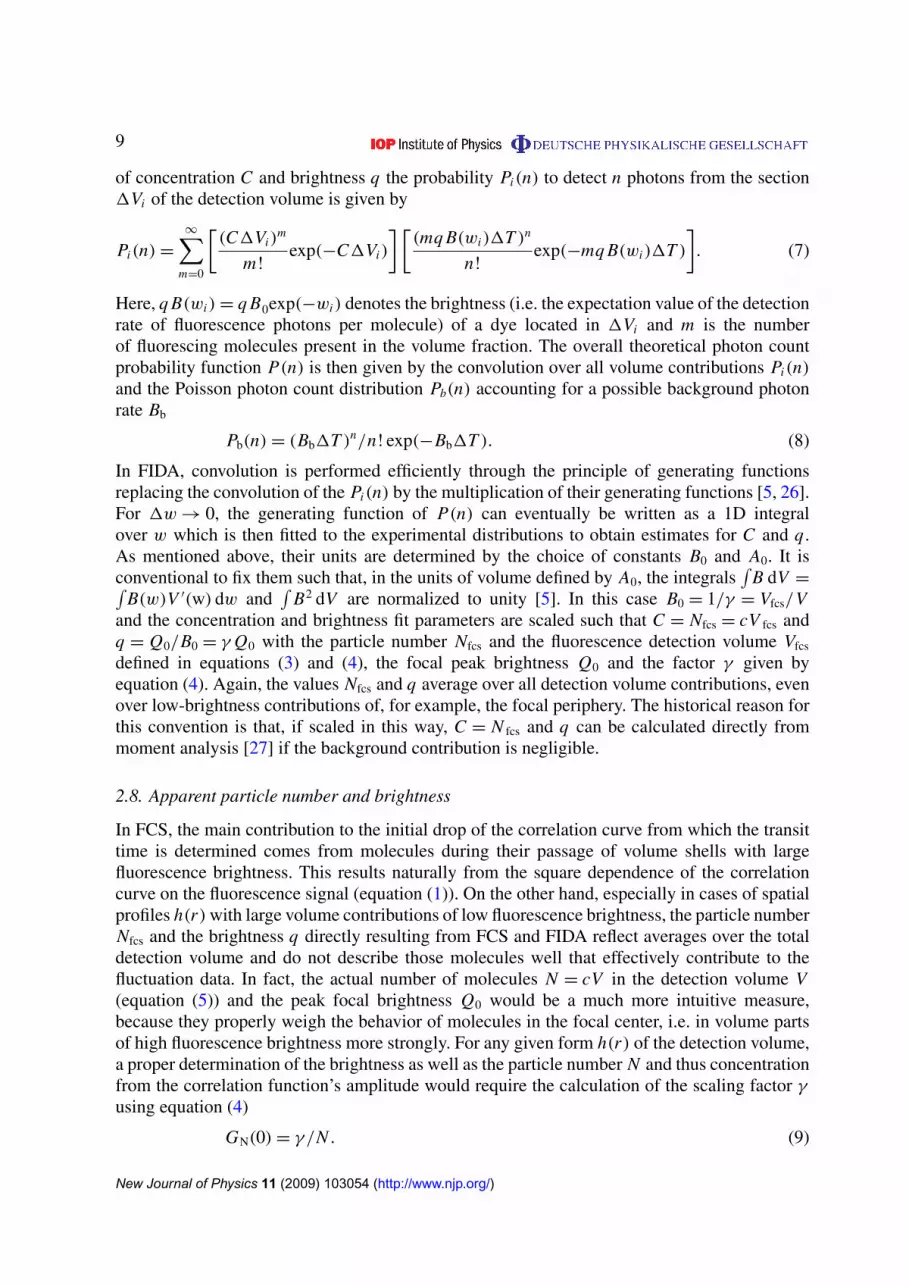
2.8. Apparent particle number and brightness
In FCS, the main contribution to the initial drop of the correlation curve from which the transittime is determined comes from molecules during their passage of volume shells with largefluorescence brightness. This results naturally from the square dependence of the correlationcurve on the fluorescence signal (equation (1)). On the other hand, especially in cases of spatialprofiles h(r) with large volume contributions of low fluorescence brightness, the particle numberNfcs and the brightness q directly resulting from FCS and FIDA reflect averages over the totaldetection volume and do not describe those molecules well that effectively contribute to thefluctuation data. In fact, the actual number of molecules N = cV in the detection volume V(equation (5)) and the peak focal brightness Q0 would be a much more intuitive measure,because they properly weigh the behavior of molecules in the focal center, i.e. in volume partsof high fluorescence brightness more strongly. For any given form h(r) of the detection volume,a proper determination of the brightness as well as the particle number N and thus concentrationfrom the correlation function’s amplitude would require the calculation of the scaling factor γ
using equation (4)
GN(0) = γ /N . (9)
New Journal of Physics 11 (2009) 103054 (http://www.njp.org/)

10
Again, this direct relation is valid only for negligible background. Calculation of γ requiresexact knowledge of the detection volume’s shape h(r). However, when reducing the detectionvolume by STED, exact determination of h(r) especially in the areas of low brightness isdifficult and calculating N using equation (9) is thus inaccurate. We therefore make a heuristicapproach to determine realistic values of the particle number N and the molecular brightnessQ0 without exact knowledge of h(r). We approximate the form of a fluorescence detectionprofile h(r) with large volume contributions of low brightness (and thus a low, unknown valueof γ ) by the form of a compact profile h∗(r) with a larger scaling factor γ ∗ > γ (which is,for example, described by the brightness–volume relation of a standard confocal microscope)and a pseudo background signal Bpseudo that takes into account contributions from the neglectedlow-brightness volume shells. In FIDA, this can be realized by fixing the system parametersa0, a1 and a2 to the values determined by confocal calibration measurements. One then obtainsan apparent particle number N ∗, an apparent brightness q∗ and an apparent background or low-brightness signal B∗
b when fitting the histogram data P(n). In this way, FIDA splits up the overallaverage signal count-rate 〈F(t)〉 into dedicated large and low brightness signal contributions
〈F(t)〉 = N ∗q∗ + B∗
b . (10)
Here, FIDA fits will estimate only the total (apparent) background signal B∗
b = Bb+Bpseudo,where Bb stands for possible ‘normal’ background signal such as scattered laser light.Importantly, since γ ∗ is now independent of the amount of volume reduction achieved by STED,both N ∗ and q∗ are not influenced by contributions of the resulting low-brightness signal fromouter shells which is now completely covered by Bpseudo. Thus, changes in N ∗(∼V ) now revealthe true confinement and q∗(∼Q0) reflects the true reduction of the focal peak brightness.
Once B∗
b is known, we can use the same approach in FCS. By relating the apparentbackground signal B∗
b as previously determined by FIDA to the total signal count-rate 〈F(t)〉,the apparent particle number N ∗ can be calculated from the amplitude GN(0) [28]:
GN(0) = (1 − B∗
b /〈F〉)2/N ∗. (11)
With this, the relative decrease of the factor γ with focal confinement by STED can well beestimated by the ratio N ∗/Nfcs.
2.9. FIDA correction
For very small sampling intervals and sufficient photon statistics, the values of particle numbersdetermined by FIDA are equal to those determined by FCS. For finite sampling intervals,1T > 0 (50 µs in our experiments), however, deviations may occur. For example, if 1T > τ xy
one would average over a whole molecular transit, effectively smearing out the volume shells.As a consequence, FIDA would obtain lowered brightness values q(1T ) and increased particlenumbers N (1T ) [29]. This bias can be corrected for. Because the following relations hold forboth the primary parameters Nfcs and q and the apparent values N ∗ and q∗, we will keep to ageneral notation N and q. To a good approximation, both the particle number and the brightnessscale with the same correction factor S < 1:
N = N (1T )S, (12a)
q = q(1T )/S, (12b)
New Journal of Physics 11 (2009) 103054 (http://www.njp.org/)

11
where S is a function of the ratio τ xy/1T :
S = [1 + 1T/(6a)(2/τxy + 1/τz)]−a
≈ [1 + (3a/(τxy/1T ))−1]−a. (12c)
The transit time τ xy can be determined, e.g. from complementing FCS analysis [29]. Neglectingthe axial transit time τ z is valid since τ z is usually much larger than the lateral transit timeτ xy . Common values of the empirical factor a are < 2/3 [29] and consequently, S significantlydeviates from 1 only if τ xy/1T < 1. Therefore, with 1T = 50 µs in our experiments, we expectsignificant corrections only in the case of aqueous environment (τ xy = 8–80 µs), while τ xy
exceeds 50 µs in the TDE or membrane measurements, even for strong focal confinement bySTED. The use of smaller time windows 1T < 50 µs is possible, but results in small numbersof photon counts n, reducing the number of data points of P(n) and making FIDA fittingimpractical. We corrected the FIDA parameters determined from the aqueous environmentmeasurements using a = 0.15, which has been estimated from the global FCS–FIDA analysisas outlined in the appendix. Remaining differences between the values of N and q determinedby FIDA and FCS may be explained by a slightly incorrect value of a as well as the fact that we(to make simultaneous recording of histogram and correlation data possible) have used a cross-correlation between the signal detected on our two detectors for FCS but gained the histogramdata for FIDA only from one single detector.
2.10. FCS analysis of lipid membrane diffusion
Diffusion along the axial z-direction is absent in 2D samples such as membranes, dropping theaxial diffusion term τ z in equation (2)
GD(tc) = (1 + (tc/τxy)α)−1. (13)
The anomaly (1/α) accounts for hindered diffusion, which is commonly encountered in live cellmeasurements [9]. While (1/α) = 1 corresponds to a free Brownian diffusion with a constantdiffusion coefficient D, (1/α) > 1 characterizes anomalous subdiffusion with an apparentlylower diffusion coefficient for large-scale motion. As before, the radial transit time is definedas τ xy = r 2
xy/(2D ln 2) with D and rxy being the (apparent or averaged) diffusion constant(including subdiffusion) and lateral radius, respectively. Subdiffusion may, for example, becaused by transient trapping due to binding of the diffusing molecule to a fixed or comparativelyslow moving particle. Such reactions are described by the on/off kinetic of the binding processto an immobile complex in the diffusion path of the molecule with an effective encounter rateconstant kon (denoted on-rate throughout) and off rate koff. If the trapping time 1/koff is muchlonger than the average time the freely diffusing molecule would spend in the observation focus,the diffusion is reaction dominated and we can describe the correlation function by
GD(tc) = (1 − B)(1 + (tc/τfree))−1 + B exp(−kofftc), (14)
where τfree = r 2xy/(2Dfreeln 2) is the average focal transit time for free diffusion (with free
diffusion constant Dfree not including subdiffusion) and the fraction B = 1/(1 + kon/koff)
quantifies the influence of trapping on diffusion [30]. In case, diffusion is not dominated bytrapping, we may follow the derivation laid out by Michelman-Ribeiro et al [30],
GD(tc) =r 2
xy
8π
∫ ∫0(q)�(q, tc) dEq, (15)
New Journal of Physics 11 (2009) 103054 (http://www.njp.org/)

12
where Eq = (qx , qy) is the Fourier transform variable, 0(q) = exp(−q2r 2xy/4) accounts for the
assumed Gaussian brightness profile and the term
�(q) = (1 + φ) exp[(α + β)tc] + (1 − φ) exp[(α − β)tc] (16)
comprises diffusion and chemical kinetics with
φ = [kon + koff + q2 Dfree(kon − koff)/(kon + koff)]/2β, (17)
where β =√
α2 − q2 Dfreekoff and α = −(q2 Dfree + kon + koff)/2 and Dfree is the diffusioncoefficient of free diffusion. In our fits we used kon and koff as free parameters and usuallyfixed Dfree = 5 × 10⁻⁹ cm2 s−1 to the value estimated from the confocal data and known fromprevious results [31]. As outlined in the text, fitting with values of Dfree = 4–6 × 10⁻⁹ cm2 s−1
yields similar results.
2.11. Monte Carlo simulation of lipid membrane diffusion
We used Monte Carlo simulations to check the validity of the trapping model for the observedcorrelation data. The simulations generated fluorescence time traces of the planar diffusionpathways of the fluorescent lipids through a Gaussian focal spot area of varying diameter (fullwidth at half maximum = 20–225 nm), undergoing transient binding to fixed particles with onand off rates kon and koff. The lipids were assumed to diffuse freely between binding with adiffusion coefficient of Dfree = 5 × 10⁻⁹ cm2 s−1 which agrees with that from our experimentalfindings. Initially, 100 lipid molecules were distributed randomly on a simulation support areaof 1 µm × 1 µm. The simulations featured stochastically stable results after 5 × 10⁶ time stepsof 1 µs length using a focal maximum brightness of 1000 MHz. The symmetrically normalizedauto-correlation curves of the fluorescence time traces were numerically calculated using themulti-tau correlation method [32]. Fitting equation (13) to the simulated correlation data revealsvalues of average transit time τ xy that are compared to the experimental values τ xy for thedifferent focal diameters.
3. Results and discussion
3.1. Principle of STED nanoscopy
The basic concept of STED nanoscopy is shown in figure 1. Excitation of a fluorescence markeris superimposed by red-shifted (STED) laser light. Inducing stimulated emission, an increasingpower PSTED of this STED light efficiently switches off the detected fluorescence, drivingthis excited state prohibition far into saturation (figure 1(a)). Combining the conventionaldiffraction-limited excitation spot with an engineered focus of the STED light featuring anirradiation spot with a sharp local intensity zero, large PSTED switch off fluorescence everywherebut at the local intensity zero. This arrangement leaves an effective fluorescence spot ofdimensions far below the diffraction limit (figure 1(b)). Importantly, varying the power ofthe light driving the switching process allows tuning of the lateral radius rxy of the effectivefluorescence spot, which can be estimated by a modification of Abbe’s equation [6, 33, 34],
rxy ≈ 0.6λ
2NA√
1 + PSTED/PSAT, (19)
with the wavelength λ of the fluorescence light, the numerical aperture (NA) of the microscopeobjective, the incident STED power PSTED and the saturation power PSAT being a characteristic
New Journal of Physics 11 (2009) 103054 (http://www.njp.org/)

13
PSTED (mW)0 100 200
0
1
Rel
. flu
ores
cenc
e
+Exc STEDSTED
Eff.
(a)
r xy (
nm)
0
100
50
(b)
=
on
0 100 200
off200 nm
x
y
Figure 1. Far-field optical STED nanoscopy. (a) STED nanoscopy is based onswitching off the fluorescence ability of a dye by a beam of light inducingstimulated emission. Increasing the power PSTED of the STED beam increases theprobability of fluorescence state inhibition. (b) The effective focal fluorescencespot is of sub-diffraction size (Eff. Inset), created by a focal intensity distributionof the STED light with a local zero (STED inset) that is overlaid with thediffraction-limited excitation spot (Exc inset). The lateral radius rxy of theeffective focal fluorescence spot decreases with the power PSTED of the STEDlight (experimental data (circles) and fit of equation (19) to the data withPSAT = 3 mW (line)). The data depicted were recorded on ∼20 nm sized crimsonfluorescent beads: relative (Rel.) fluorescence state inhibition when combiningthe excitation spot with a non-engineered, diffraction-limited focal STED spot(a), and average lateral radius rxy determined from the STED images withdoughnut-shaped focal STED spot (b). The lateral xy intensity distributions ofthe excitation and STED light (inset (b)) were both measured by scanning ascattering sub-diffraction-sized gold bead through the focal region. The effectivelateral fluorescence spot of the STED microscope (inset (b)) was measured on afluorescence crimson bead with PSTED = 150 mW.
of the fluorophore in use given a certain spatial distribution of the STED light [34].Consequently, by increasing PSTED the spatial resolution of a STED microscope can bedynamically optimized, potentially to a maximum possible, i.e. to molecular scales.
3.2. Aqueous environment
Figures 2(a) shows fluorescence correlation (FCS) data GN(tc) (equation (1)) recorded for theorganic dye Atto647N in aqueous PBS buffer with and without addition of focal-engineeredSTED light. In a first place, the correlation curve encodes the average molecular transit timethrough the focal detection volume, which follows from the decay of the correlation data, andthe average number Nfcs of fluorescing particles in the detection volume, which is inverselyproportional to the correlation function’s amplitude GN(0) = 1/Nfcs (equation (3)). A reductionof the detection volume by STED should result in a decrease of both the transit time and Nfcs,which in turn should allow revealing nanoscale details of molecular dynamics and performingFCS at larger concentration, respectively. According to the decrease of transit time and Nfcs, thedecay of GN(tc) should shift to shorter correlation times tc and GN(0) should increase. Whileour experimental FCS data outlines the expected shift of the correlation curve to lower tc, weobserved an unexpected decrease in amplitude GN(0) with PSTED.
New Journal of Physics 11 (2009) 103054 (http://www.njp.org/)

14
τ xy (
ms)
Particle num
ber N
fcs0.1
0
10.01tc (ms)
(a)
2
(b)
0 100 200
Rel
ativ
e de
crea
se
1
0
0.5
(c)
PSTED (mW)
1.5
1
GN(t
c)x
y
4
0 102
106
0.01 1 20 40n
P(n
)
tc (ms)
G(t
c) (
103
kHz2 ) 8
(d)
Globa l
Nfcs (FCS)
τxy
Nfcs (FIDA)
τxy
1
N* (FCS)
N* (FIDA)
Figure 2. STED–FCS/FIDA of the dye Atto647N in aqueous solution. (a)Correlation data GN(tc) at confocal (black circles) and STED recording (opencircles) with PSTED = 50 mW (780 nm) and the doughnut-shaped intensitydistribution of the STED light (inset) together with fits (grey lines) ofequation (2) to the data: normalization at tc = 0.001 ms (upper panel) andoriginal data (lower panel), showing a decrease of the decay time and amplitudeupon focal confinement (arrows). (b) Dependence of transit time τ xy (blackcircles) and particle numbers Nfcs determined by FCS (open circles) and FIDA(grey triangles) on the STED power PSTED. (c) Relative dependence of transittime τ xy (black circles) and apparent particle numbers N ∗ determined by FIDA(grey triangles) or FCS (open circles) on the STED power PSTED. (d) GlobalFCS–FIDA analysis. Un-normalized correlation G(tc) (left panel) and histogramdata P(n) (right panel) for confocal (open circles) and STED recording (closedcircles, PSTED = 160 mW) together with the global FCS–FIDA fit (grey lines) tothe experimental data.
To this end, we recorded FCS data with increasing power PSTED of STED light at a constantexcitation intensity of 25 kW cm−2, and fitted equation (2) to the data. The STED light featureda doughnut-like intensity distribution with a central zero along the lateral x/y-directions (insetfigure 2(a)). Increasing the power PSTED of the STED light consequently reduced the focalvolume along the lateral directions only, leaving the axial extension unchanged. As a result,the values of τ xy decreased and those of τ z remained unchanged. Apart from negligible light-induced triplet depopulation [35], the STED light does not alter the triplet population. Wedetermined τ z = 4 ms, T = 0.14 and τT = 3 µs from confocal FCS data and fixed these valuesthroughout further analysis. Figure 2(b) depicts the dependence of the resulting values of
New Journal of Physics 11 (2009) 103054 (http://www.njp.org/)

15
200
(a)
50
0
(b)
Vol
ume
V(h
)
Brightness h110–210–4
(c)
Rel
ativ
e γ
0
PSTED
1
0
PSTED (mW)100
Brig
htne
ss (
kHz)
2000PSTED (mW)
100R
elative Bb (%
)
100
0q
q*
Bb
*
*
Figure 3. STED–FIDA of the dye Atto647N in aqueous solution. (a) Relativevolume size V (h), a relative brightness h spans for PSTED = 0 mW (blackline), 64 mW (grey line) and 160 mW (light grey line), depicting a relativeincrease of volume fractions with low brightness (arrow). (b) Dependence of thefluorescence brightness q, of the apparent fluorescence brightness q∗ and of therelative fraction of apparent low-brightness background B∗
b of the total detectedsignal on the STED power PSTED. (c) Relative dependence of the scaling factorγ of FCS analysis on PSTED calculated using the ratio N ∗/Nfcs.
τ xy and Nfcs on PSTED. While τ xy decreases with PSTED from 80 µs at confocal recordings(PSTED = 0 mW) down to 8 µs at PSTED = 180 mW by a factor of ∼10, Nfcs increases from1.8 up to 3.3 by a factor of 1.3. The 10-fold decrease of τ xy outlines a congruent confinement ofthe focal area and a
√10 ≈ 3.3-fold reduction of the focal spot diameter. The particle number
Nfcs = cV fcs scales with the dye concentration c and the detection volume Vfcs defined in FCS(equation (4)). Since c stays constant, the observed increase of Nfcs depicts an enlargement ofVfcs, which is contrary to the volume decrease rendered by τ xy . While equation (2) fits our FCSdata well, Nfcs and Vfcs seem to be an inaccurate measure of our experimental conditions.
We used FIDA [4, 5] to complement our FCS data. We acquired the PCH data P(n) alongwith the FCS data and used FIDA to fit P(n) resulting in values of the particle number Nfcs,the fluorescence brightness q and the system parameters a0, a1 and a2. We fixed the backgroundcount-rate Bb to 1 kHz as measured for scattering signal on a pure PBS solution. Similarly to theFCS analysis, Nfcs as determined by FIDA increases with PSTED (figure 2(b)), which confirms itsinappropriate use. Slight deviations between Nfcs determined by FCS and FIDA may result fromexperimental differences between the two techniques as described in the discussion followingequation (12). The adapted system parameters a0, a1 and a2 varied with PSTED, indicatinga change of the fluorescence detection profile h(r). While this change is in principle to beexpected from the confinement of h(r) by STED, the values of a0, a1 and a2 reveal an increaseof volume fractions with low brightness. This is visualized by using the values of a0, a1 and a2 tocalculate (equation (6)) the relative volume size V (h) a relative brightness h spans (figure 3(a)).For comparison of V (h) at different PSTED, we applied an arbitrary normalization V = 1 ath = 5 × 10⁻⁵. The increasing low-brightness contributions result in an increase of the detectionvolume Vfcs as determined by equation (3), rendering the increase of Nfcs(∼Vfcs) and the vastdecrease of the fluorescence brightness q (∼1/Vfcs, section 2.7) from ≈70 kHz down to ≈7 kHz(figure 3(b)). Both Nfcs and q are determined by fluorescence signal emitted from all parts ofthe detection volume, i.e. also from low-brightness volume shells as depicted in the theoreticalsection 2.8.
New Journal of Physics 11 (2009) 103054 (http://www.njp.org/)

16
The actual detection volume V (equation (5)) and particle number N = cV may be a moreaccurate measure of our experimental conditions, since they do not overweigh low brightnesscontributions. However, experimental determination of N requires the calculation of the scalingfactor γ (equation (9)), whose exact determination is difficult when reducing the detectionvolume by STED. Therefore, we estimated values of N by applying a modified FIDA approach(section 2.8). Instead of varying the system parameters a0, a1 and a2, we determined values ofa0, a1 and a2 at diffraction-limited conditions, which feature the brightness–volume relationof a rather compact fluorescence detection profile h(r), and fixed these values throughoutfurther analysis resulting in values of an apparent particle number N ∗, an apparent fluorescencebrightness q∗ that is proportional to the focal peak brightness Q0, and an apparent low-brightness signal B∗
b (equation (10)). Figure 2(c) shows the dependence of N ∗ on PSTED. Forcomparison, we again plotted the dependence of τ xy of the FCS analysis and normalized alldata on the respective value at zero STED power, i.e. for the diffraction-limited confocal case.τ xy and N ∗ decrease equally confirming the confinement of the effective focal volume bySTED. Further, we observed a strong increase of apparent low-brightness contribution B∗
b upto values of ≈65–70% of the total signal for PSTED >100 mW (figure 3(b)). Besides scatteringbackground signal, B∗
b comprises all signal of low fluorescence brightness that is not coveredby the underlying brightness–volume relation. Since we kept the system parameters constant,i.e. we apparently regarded a wrong brightness–volume relation with increasing PSTED, theincreased portion of apparent low-brightness signal B∗
b confirms that the focal confinement bySTED introduces an increase of volume fractions of low brightness. The apparent backgroundsignal B∗
b further allows us to estimate an apparent particle number N ∗ from the FCS analysis.Using the values of B∗
b determined by FIDA, we can calculate N ∗ from the amplitude GN(0) ofthe correlation function (equation (11)). The, in this way, determined decrease of N ∗ coincideswith that observed of τ xy and of N ∗ from FIDA (figure 2(c)).
Increasing contributions of apparent low brightness signal are further confirmed by thedependence of the apparent fluorescence brightness q∗ (figure 3(b)) and scaling factor γ
(figure 3(c)) on PSTED. The decrease of q∗ follows that of the focal peak brightness Q0 (comparesection 2.8) and is much less pronounced than the decrease of q. (We will discuss reasonsof a general decrease of the fluorescence brightness further below). The scaling factor γ
quantifies the compactness of the fluorescence detection profile h(r) (equation (4)): compact(near rectangular) profiles give values of γ close to one, while values of γ � 1 characterizeprofiles with large volume contributions of low brightness. As outlined before, we lack exactknowledge of h(r) and thus cannot properly calculate γ . However, we can estimate relativechanges of γ with STED confinement by the proportionality to the ratio N ∗/Nfcs (equation (11)).As expected, γ declines with focal confinement by STED.
We have used information from FIDA to correct FCS analysis for a proper determinationof the particle number. An optimized analysis introduces global fitting of correlation and photonhistogram data, applying N ∗, the lateral diffusion time τ xy , the fluorescence brightness q∗
and the apparent background signal B∗
b as global parameters common to both correlation andhistogram evaluation. The global FCS–FIDA analysis fits the correlation and FIDA data well(figure 2(d)) and is outlined in the appendix in detail. The values of N ∗, τ xy , q∗ or B∗
b determinedby the global FCS–FIDA analysis coincide with those determined by single FCS and FIDAanalysis (figure 2(c)).
The increasing contributions of apparent low-brightness signal damp the signal-to-noiseratio and thus the general performance of our single-molecule studies. For example, FCS data
New Journal of Physics 11 (2009) 103054 (http://www.njp.org/)

17
recorded for PSTED = 50 mW are more noisy than those recorded without STED (comparefigure 2(a)). The lower signal-to-noise ratio is also due to a decrease of the focal peakfluorescence brightness as revealed by q∗ (figure 3(b)). The decrease of brightness mostprobably stemmed from residual intensity in the center of the doughnut-shaped STED focusmost properly due to imperfections of the optical imaging setup. Such imperfections may alsoresult in an anisotropic intensity distribution of the doughnut-like STED focus, deterioratingthe focal confinement by STED. From our calibration measurements (figure 1(b)), we wouldassume a reduction of the focal diameter by a factor of 5–6 for PSTED = 180 mW, whichis 1.5–1.8-fold larger than the factor of ∼3.3, which we determined for our measurementsin aqueous solution. Optical imperfections may result from distortions of the wavefront orpolarization at optical parts such as lenses or (dichroic) mirrors or from the refractive indexmismatch of the employed NA = 1.42 oil immersion objective and the aqueous sample. Suchoptical imperfections disclose no principle limits of nanoscale STED microscopy, since theycan be corrected for if necessary. In our experiments, we minimized the contributions from therefractive index mismatch by measuring less than 5 µm inside the aqueous solution [36]. Settingup a water immersion objective, which avoids such refractive index mismatch, is possible fornanoscale single-molecule spectroscopy (see figure 6), but due to its lower NA (usually 1.2)results in a larger focal volume from the very start (compare equation (19)).
3.3. Dependence on experimental conditions
3.3.1. Adaptation of the refractive index. To check for the influence of the refractive indexmismatch on the performance of our STED–FCS/FIDA measurements, we applied TDE asan environment for single-molecule dynamical studies at the nanoscale. The refractive indexof TDE of n ≈ 1.51–1.52 matches that of the immersion oil (n = 1.52) and should minimizeoptical imperfections. TDE has previously been successfully applied in microscopy applicationsrelying on proper phase adjustment [37]. Compared to water, TDE is characterized by anincreased viscosity and thus slower molecular diffusion. Further, the fluorescence brightnessof Atto647N is a factor of 3 worse in TDE than in water. The different polarity as well as thelower mobility of molecular oxygen leads to a reduced fluorescence quantum yield and a largertriplet population in TDE. Similar to the measurements in aqueous solution, we recorded FCSand FIDA data for increasing power PSTED of the STED light for Atto647N in TDE.
Figure 4(a) shows the dependence of the particle number as a measure of the focalconfinement by STED in TDE. Following the results of our experiments in water, we determinedvalues of two types of particle numbers: Nfcs determined by FCS (equation (3)) and the apparentparticle number N ∗ determined by FIDA (equation (10)). We applied different focal shapes ofthe STED light. For comparison, let us at first behold the values recovered for the same lateralxy-doughnut-shaped STED intensity distribution as we have used for the previous measurementsin water. Similar to the particle numbers determined in water, the values of Nfcs increasewith PSTED while those of N ∗ decrease. The decrease of N ∗ is again in accordance to thedecrease observed for the lateral diffusion time τ xy (which decreases from 1.2 ms down to55 µs at PSTED = 180 mW, data not shown). The adaptation of the refractive index brings alongone major advantage: at the same STED power PSTED = 180 mW, the ∼5-fold confinementin focal diameter is much better than the factor of ∼3.3 in water and almost matches the5–6-fold confinement expected from calibration (figure 1(b)). Some optical imperfectionsobviously remain, resulting in an insufficient intensity zero of the STED doughnut as witnessed
New Journal of Physics 11 (2009) 103054 (http://www.njp.org/)

18
(a) (b) (c)
x
y
0 100 200
1
10
0.1
Nfcs
N*
Rel
. par
ticle
num
ber
xy
z
PSTED (mW)
xy:x
y
z:
xyz :
Rel
. brig
htne
ss q
* 1
0.5
0 100 200
Relative B
(%)
100
0
q*
xy
z
+
Con
finem
ent 0.1
0
100
0
(d)
Iexc (kW cm–2)0 4020
Rel
ativ
e N
* 1
0
100
0
PSTED,pulsed (mW)1001
10 500PSTED,CW (mW)
(e)
750-CW
750-pulsed
780-pulsed
Bb*
Relative B
b (%)
*
Relative B
b (%)
*
Figure 4. STED–FCS/FIDA of the dye Atto647N in TDE with differentmodes of focal confinement by STED. (a) Relative dependence of theparticle numbers Nfcs (open symbols) and N ∗ (closed symbols) on theSTED power PSTED (780 nm) determined by FCS and FIDA, respectively,for different focal engineered spots of the STED light: lateral xy- (blackcircles), axial z- (grey triangles), and 3D xyz-confinement (light grey squares).(b) Relative dependence of the apparent fluorescence brightness q∗ (closedsymbols) and of the relative fraction of apparent low-brightness backgroundB∗
b (open symbols) on PSTED for the different modes of focal confinement.(c) Focal intensity distribution of the STED light for the lateral xy- and axialz-confinement. The 3D xyz-confinement is an addition of both. (d) Dependenceof the focal confinement by STED (Confinement = τ xy(STED)/τ xy(confocal),closed circles) and apparent background contribution B∗
b (open squares) atSTED recording (PSTED(780 nm) = 180 mW, xy-confinement) on the excitationintensity Iexc. (e) Dependence of the apparent particle number N ∗ (closedsymbols, normalized to PSTED = 0) and apparent background contribution B∗
b(open symbols) on the STED power PSTED for pulsed STED light at 780 nm(circles) and 750 nm (grey triangles) and for CW STED light at 750 nm (greysquares).
by a decrease of the fluorescence brightness q∗ down to ∼65% of its initial value (figure 4(b)),which is less compared to the 2-fold decrease in water but still notable. As before, the focalconfinement by STED gives rise to an increasing contribution of up to 65–70% of apparent low-brightness signal B∗
b (figure 4(b)), resulting in the characteristic increase of Nfcs and thus a bitmore noisy single-molecule data at large PSTED.
New Journal of Physics 11 (2009) 103054 (http://www.njp.org/)

19
3.3.2. Modus of confinement. Besides the xy-doughnut-shaped STED intensity distribution,figure 4(a) also shows the dependence of Nfcs and N ∗ on the focal confinement for other STEDfoci: z-confinement, i.e. intensity distribution of the STED light primarily confining the focalvolume along the axial z-direction, and xyz-confinement realized by overlaying the engineeredfoci for the xy- and the z-confinement (figure 4(c)). In all cases, we observed a similar behavior(figures 4(a) and (b)): a decrease of N ∗ due to the confinement in fluorescence detection volume,an increase of Nfcs due to an increased contribution of apparent low-brightness signal B∗
b ,and a decrease of the fluorescence brightness q∗, overall establishing somewhat more noisyfluctuation data. Yet, slight differences arise from the different modes of focal confinement:(i) quenching of the fluorescence brightness q∗ is weakest for the xy- (down to 65%), andstrongest for the z-confinement (down to 50%). Most probably the residual intensity in thecenter of the engineered STED foci is larger for the z-confinement. (ii) The reduction of thedetection volume by STED at PSTED = 180 mW is largest for the xyz-confinement (25-fold) andlowest for the sole z-confinement (15-fold). While we per se expect the strongest reduction forthe confinement along all spatial directions, the rather bad performance of the z-confinementhas several reasons. First, focal confinement is predominantly only 1D. Further, the intensitymaxima of the focal STED light distribution of the z-confinement are further apart than of thexy-doughnut (figure 4(c)), demanding for larger powers PSTED to realize the same focal volumereduction [34].
Further, we have performed STED–FCS and STED–FIDA at other experimentalconditions. We observed an increased apparent low-brightness contribution regardless of thechoice of excitation light intensity, STED wavelength, or modus of fluorescence state inhibitionby pulsed or CW STED light. Irrespective of increasing the excitation intensity Iexc from 5to 50 kW cm−2, xy-confinement with PSTED = 130 mW at 780 nm yielded similar reductions ofdetection volume and the same contributions of ∼65–70% of apparent low-brightness signal(figure 4(d)). Further, we did not observe a significant improvement in volume confinementor a reduction of apparent low-brightness contributions when changing the wavelength of theSTED light from 780 to 750 nm (figure 4(e)). Compared to 780 nm, the STED wavelengthof 750 nm is closer to the emission maximum of ∼670 nm of the Atto647N dye in aqueoussolution, resulting in an increased efficiency of stimulated emission [38] and thus providinga steeper decline of the focal confinement with PSTED. However, 750 nm is also closer tothe absorption maximum of ∼645 nm of the Atto647N dye in aqueous solution, yielding anincreased probability of anti-Stokes fluorescence excitation and thus a larger apparent low-brightness signal contribution B∗
b . Finally, it has been shown that nanoscale STED microscopyis not implicitly restricted to pulsed, but can also be realized with CW excitation and STEDlight, which simplifies laser sources needed [39]. The study of single-molecule dynamics inreduced focal volumes formed by the CW STED approach is possible (figure 4(e)). Comparedto pulsed STED we had to apply (ln2 f τF)
−1= 5-fold more average power PSTED of the
STED light where f = 76 MHz is the repetition rate of the pulsed mode and τF = 3.8 ns thefluorescence lifetime of Atto647N in TDE. Although resulting in a similar fraction B∗
b , theperformance of our ‘CW-mode’ measurements turned out to be slightly worse than the ‘pulsed-mode’ measurements because we obtained less confinement of the focal volume at comparablePSTED. A possible reason may be residual fluctuations of the power level of the CW STED lightsource.
New Journal of Physics 11 (2009) 103054 (http://www.njp.org/)
20
Rel
ativ
e q*
, ⟨F
⟩ 1
0
(a) (b)
PSTED (mW)0 20
⟨F ⟩ q*Pinhole 1:Pinhole 2:
Membrane:
Pinhole 1 Pinhole 2 Membrane
100
040
Rel
ativ
e B
b (
%)
*
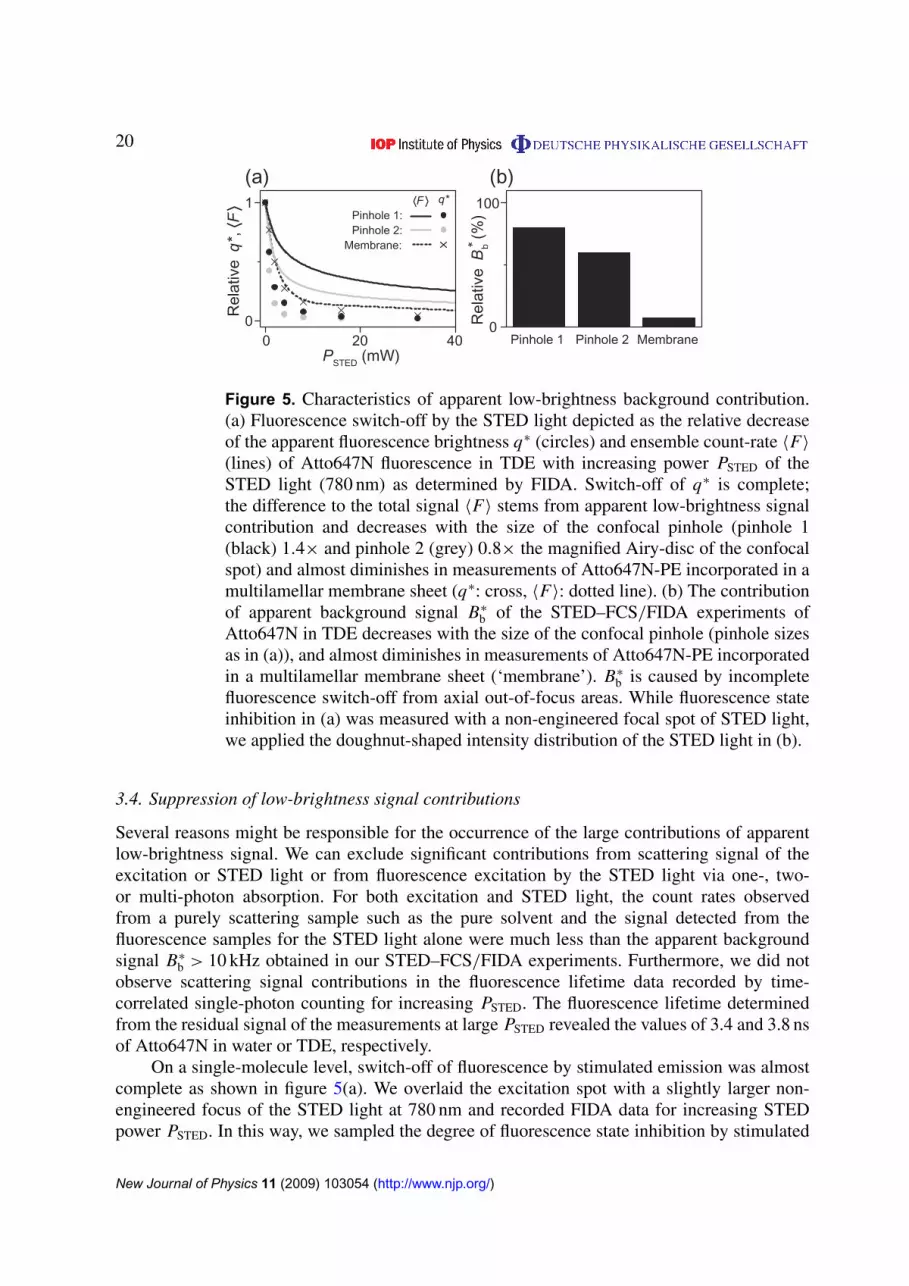
Figure 5. Characteristics of apparent low-brightness background contribution.(a) Fluorescence switch-off by the STED light depicted as the relative decreaseof the apparent fluorescence brightness q∗ (circles) and ensemble count-rate 〈F〉
(lines) of Atto647N fluorescence in TDE with increasing power PSTED of theSTED light (780 nm) as determined by FIDA. Switch-off of q∗ is complete;the difference to the total signal 〈F〉 stems from apparent low-brightness signalcontribution and decreases with the size of the confocal pinhole (pinhole 1(black) 1.4× and pinhole 2 (grey) 0.8× the magnified Airy-disc of the confocalspot) and almost diminishes in measurements of Atto647N-PE incorporated in amultilamellar membrane sheet (q∗: cross, 〈F〉: dotted line). (b) The contributionof apparent background signal B∗
b of the STED–FCS/FIDA experiments ofAtto647N in TDE decreases with the size of the confocal pinhole (pinhole sizesas in (a)), and almost diminishes in measurements of Atto647N-PE incorporatedin a multilamellar membrane sheet (‘membrane’). B∗
b is caused by incompletefluorescence switch-off from axial out-of-focus areas. While fluorescence stateinhibition in (a) was measured with a non-engineered focal spot of STED light,we applied the doughnut-shaped intensity distribution of the STED light in (b).
3.4. Suppression of low-brightness signal contributions
Several reasons might be responsible for the occurrence of the large contributions of apparentlow-brightness signal. We can exclude significant contributions from scattering signal of theexcitation or STED light or from fluorescence excitation by the STED light via one-, two-or multi-photon absorption. For both excitation and STED light, the count rates observedfrom a purely scattering sample such as the pure solvent and the signal detected from thefluorescence samples for the STED light alone were much less than the apparent backgroundsignal B∗
b > 10 kHz obtained in our STED–FCS/FIDA experiments. Furthermore, we did notobserve scattering signal contributions in the fluorescence lifetime data recorded by time-correlated single-photon counting for increasing PSTED. The fluorescence lifetime determinedfrom the residual signal of the measurements at large PSTED revealed the values of 3.4 and 3.8 nsof Atto647N in water or TDE, respectively.
On a single-molecule level, switch-off of fluorescence by stimulated emission was almostcomplete as shown in figure 5(a). We overlaid the excitation spot with a slightly larger non-engineered focus of the STED light at 780 nm and recorded FIDA data for increasing STEDpower PSTED. In this way, we sampled the degree of fluorescence state inhibition by stimulated
New Journal of Physics 11 (2009) 103054 (http://www.njp.org/)

21
emission by determining the (apparent) brightness q∗. While q∗ declined to almost zero kHz(<5% compared to its initial value) for PSTED >10 mW, the detected ensemble count-rate 〈F〉
showed residual levels of >15%. FIDA theory can explain this discrepancy between q∗ and〈F〉 only from apparent background signal B∗
b (equation (10)). Importantly, we could minimizethis discrepancy by applying smaller diameters of the confocal detection pinhole (figure 5(a)).We thus analyzed the correlation between pinhole diameter and contribution of apparentbackground signal also in our focal-confinement STED–FCS/FIDA experiments applying thedoughnut-like intensity distribution of STED light (figure 5(b)). Smaller pinholes resulted indecreasing apparent background signal, and because reducing the pinhole size reduces therelative contribution of out-of-focus planes we can conclude that the apparent low-brightnesscontributions originate from these areas where fluorescence state inhibition by STED is noteffective.
Unfortunately, smaller confocal detection pinholes also reduce the detection efficiencyof signal from the focal plane and consequently the sensitivity of our single-molecule basedmeasurements. With the corrections outlined above in place, there will therefore be an optimalpinhole size resulting in the best signal-to-noise ratio for every given degree of confinement.Nevertheless, unless otherwise addressed, the effect of axial out-of-focus contributions willultimately put a lower limit on the focal volumes achievable in 3D with STED.
This finding makes application of STED confinement to systems that inherently lack anyout-of-focus contributions all the more interesting. The 2D samples such as lipid membranesshould therefore feature excellent signal-to-noise ratios at very high levels of confinement,and indeed, single-molecule data recorded for an Atto647N-labeled phosphoglycerolipid(Atto647N-PE), which we introduced into a multilamellar (phosphoglycerolipid) membranelayer, revealed proper fluorescence switch-off by STED and hardly any low-brightnesscontributions (figure 5).
3.5. STED–FCS on lipid membranes
Figure 6 shows the results of the analysis of the FCS and FIDA data recorded for the fluorescentphosphoglycerolipid Atto647N-PE in a multilamellar lipid membrane layer. We employed thexy-doughnut-shaped engineered focus of the STED light and positioned the centers of theoverlaid excitation and STED spot on the membrane layer. With increasing power PSTED andthus increasing confinement of the focal area, the correlation data show both the expecteddecrease of the transit time τ xy and the increase of the amplitude GN(tc) (figure 6(a)). Thecorrelation data recorded on the membrane layer for PSTED = 50 mW was less noisy than thatrecorded in aqueous solution (compare figure 2(a)). The membrane layer precludes diffusionalong the axial direction. Therefore, we fitted the correlation data with the 2D diffusion model(equation (13), α = 1). The transit time τ xy and the particle numbers Nfcs and N ∗ as determinedby FCS and FIDA consistently evidence a >25-fold confinement of the focal spot at PSTED =
180 mW from a diffraction-limited diameter of ∼240 nm down to ∼40–50 nm (figure 6(b)).This 5–6-fold decrease in focal diameter is as expected from calibration (figure 1(b)). Ourmeasurements on 2D samples such as membranes thus showed hardly any influence by opticalimperfections and as expected from the previous results of figure 5 the influence of apparentlow-brightness noise from axial out-of focus regions was negligible: the fraction of apparentlow-brightness signal B∗
b determined by FIDA was <5%. Since Nfcs ∼ N ∗, we will further onjust denote a particle number N for the measurements on membranes. The single-moleculefluorescence traces observed in the nanoscale foci show signal-to-noise ratios larger than 100
New Journal of Physics 11 (2009) 103054 (http://www.njp.org/)

22
10.01t c (ms)
(a) (b)
(c)
GN(t
c)
x
y
3
1
5
Rel
ativ
e va
lues 1
0
0.5
N*τxy
Nfcs
Bila y.
PSTED (mW)0 100 200
0 1t (s)0
1
MH
z
F(t
) (k
Hz)
0
200
400
t (s)0 1 2
(d)BilayerTef.
Obj.
H2O
Gl.
Figure 6. STED–FCS/FIDA on lipid membranes. (a) Correlation data GN(tc)
of Atto647N-PE in a multilamellar lipid membrane layer at confocal (blackcircles) and STED recording (open circles) with PSTED = 50 mW (780 nm)and the doughnut-shaped intensity distribution together with fits (grey lines)of equation (2) to the data: normalization at tc = 0.001 ms (upper panel) andoriginal data (lower panel), showing a decrease of the decay time along with arise of the amplitude upon focal confinement (arrows). (b) Relative dependenceof the transit time τ xy (black circles), the particle numbers Nfcs (grey triangles)and N ∗ (open circles) on the STED power PSTED along with the relative decreaseof τ xy from the measurement on the horizontal membrane bilayers applying awater immersion objective (cross, ‘Bilay.’). (c) Fluorescence count-rate 〈F(t)〉 ofsingle Atto647N-PE lipids diffusing in a multilamellar membrane layer recordedin consecutive time windows of 1ms with PSTED = 170 mW, and concomitantconfocal (PSTED = 0 mW) recording (inset). (d) Scheme of the setup used forthe horizontal black lipid membrane bilayers with microscope objective (Obj.),microscope cover glass (Gl.), focal laser spot (red), lipid membrane bilayer,Teflon support (Tef.) and aqueous solution (H2O). The distance between coverglass and bilayer and thus focus was >100 µm.
(figure 6(c)) and outline the excellent ability of performing single-molecule based experimentsin STED microscopy. Further, these measurements depict how STED microscopy enlarges thepractical range of fluorophore concentration for single-molecule detection. While fluorescencebursts from single-molecule transits were clearly observable in the STED recording, theincreased number of particles in the larger detection volume of the confocal recording did notallow direct distinguishing of single-molecule events at the same concentration of fluorescentmolecules (inset figure 6(c)). In this way, single-molecule experiments can be performed atlarger, sometimes endogenous and inevitable concentrations.
New Journal of Physics 11 (2009) 103054 (http://www.njp.org/)

23
Our nanoscale observations on membranes not necessarily require the use of an oil-immersion objective with lipid membranes arranged close to the microscope cover glass. Wehave also succeeded to perform FCS and FIDA experiments in reduced focal areas formedby STED microscopy applying an NA = 1.2 water immersion objective lens (figure 6(b)). Inthese experiments, we measured the diffusion of the Atto647N-PE in horizontal membrane(black lipid) bilayers formed across microholes approximately 100–150 µm above the coverglass (figure 6(d)). Again, the apparent background contribution determined by FIDA wasnegligible and stayed constant with PSTED, optimizing signal-to-noise ratios and minimizingbias of the FCS analysis. Measuring on such horizontal lipid bilayers not only outlines thepossibility to monitor single-molecule dynamics at the nanoscale inside cells or tissues butalso to combine this technique with other readouts such as electrophysiological recordings[21, 22].
3.6. Photobleaching
The large intensities of STED light may lead to additional photobleaching [19]. However,photobleaching has minor influence on our dynamical measurements. As plotted in figure 7(a)for measurements on the multilamellar membranes, the decline of both τ xy and N scaledwith the dynamical reduction of the focal area A ∼ r 2
xy by STED. This linear dependence isexpected from theory, since N ∼ A and τ xy ∼ r 2
xy for the free diffusion of Atto647N-PE in themultilamellar membrane, and confirms that the reduction of τ xy and N stemmed from the STEDconfinement, and not from other light-induced characteristics such as photobleaching.
Further, photodestruction following the pure excitation process was hardly observedin the reduced focal areas compared to the confocal case, as depicted in figure 7(b) forour multilamellar measurements. Starting at ∼10 ms at low excitation intensity Iexc, τ xy
decreased with Iexc by a factor of two at Iexc = 480 kW cm−2 due to photobleaching forconfocal detection. In contrast, we hardly observed a decrease of τ xy with Iexc for STEDmicroscopy at PSTED = 160 mW. This low influence by photobleaching follows from importantgeometrical characteristics of the STED approach. The molecular transit times throughthe nanoscopic volumes are much shorter than for confocal recording, i.e. the time spanof probable photobleaching during non-switched-off fluorescence emission is pushed downsignificantly [40]. Photobleaching may however effect FCS measurements on moleculesfeaturing hindered diffusion due to, for example, trapping on the nanoscale. In this case, thefocal transit time does not scale with the focal diameter and molecules may also dwell longer inthe reduced focal spots [31]. Here, photobleaching may be minimized by scanning of the beam[41, 42].
Photodestruction may be enhanced during the passage through the ‘fluorescence switch-off’ area of STED light. In this case, the number of particles reaching the focal center might becut down. However, at our experimental conditions we have not observed a significant decreasein the particle number other than stemming from the focal confinement by STED (figure 7(a)).Most importantly, while ‘dilution’ of fluorescent particles by STED photobleaching may biasconcentration measurements it is of minor importance for the analysis of dynamics on thenanoscale: as long as some molecules reach the focal center undestroyed, their dynamics areunaltered and can be studied.
New Journal of Physics 11 (2009) 103054 (http://www.njp.org/)

24
1
0.5
IExc (kW cm–2)0 200 400
Rel
ativ
e τ xy
Confocal
STED
τxy
N
(b)(a)
Focal area A (103 nm 2)0 20 40
Rel
ativ
e N
, τxy
0
1
Figure 7. Influence of photobleaching on STED–FCS/FIDA. (a) Relativereduction of the particle number N (=N ∗) (open circles) and average transittime τ xy (closed circles) of Atto647N-PE in multilamellar membrane layers withfocal area A = πr 2
xy confined by STED. All values are normalized to the valuedetermined with the confocal spot. As expected from an ‘ideal’ reduction ofthe fluorescence spot by STED, N and τ xy decline in proportion to the focalarea, according to free diffusion of the lipids (straight line). This characteristicis a strong argument against STED light-induced effects other than the spotsize reduction. The values of the lateral radius rxy were determined from thecalibration measurements of figure 1(b). (b) Relative decrease of the averagetransit time τ xy of Atto647N-PE diffusion in multilamellar membrane layerswith excitation intensity Iexc for confocal (open circles) and STED recording(closed circles, PSTED = 160 mW). While τ xy is reduced down to ∼50% due tophotobleaching at confocal recording, photobleaching by the excitation light isnegligible for STED recording.
3.7. Live cell observations
Figure 8 shows results of our FCS experiments on Atto647N-labeled phospholipid PE(phosphoethanolamine) and Atto647N-labeled sphingolipid SM (sphingomyelin) inserted intothe plasma membrane of living PtK2 cells. The fluorescence fluctuations of the single lipidtransits exhibited diffusion times τ xy with continuously decreased area A ∼ r 2
xy of the focalspot (figure 8(a)). We dynamically reduced A approximately 70-fold from a diffraction-limiteddiameter of 250 nm down to 30 nm by gradually increasing PSTED (we estimated the values ofA from the radii determined in figure 1(b)). A linear dependence of τ xy on A indicates freediffusion (compare equation (13) τ xy ∼ r 2
xy/D) as exemplified in figure 8(a) for a diffusionconstant D = 5 × 10⁻⁹ cm2 s−1 (grey dotted line). Atto647N-labeled PE almost diffuses freelyand only shows slight deviation from the linear behavior for small focal spots. Deviation fromlinear behavior is much more pronounced for the Atto647N-labeled sphingolipid SM, a clearindication of anomalous diffusion [31]. Diffusion of the labeled lipids is slower and deviatesfrom free diffusion especially when measuring with small focal spots. This indicates that upontuning the observation area to small sizes we reach the scale of the heterogeneities causing theanomalous diffusion and resulting in the strong deviation of τ xy(A) from a linear dependenceon A. STED microscopy thus uniquely can distinguish anomalous from free diffusion on theselength scales.
New Journal of Physics 11 (2009) 103054 (http://www.njp.org/)

25
Focal area (2rxy)2 (103 nm 2)
Tran
sit
time
τxy
(ms)
1
10
100
PE
SM
(a)
1 10 1 2
kon
SM
PE
(b)
3
1
0.1
1
0.1
Rat
e k
(ms–1
)
koff
Figure 8. STED–FCS of lipid diffusion in the plasma membrane of living PtK2cells. (a) Transit time τ xy of Atto647N-labeled PE (grey circles) and SM (blacksquares) determined from fitting equation (13) to the experimental data recordedfor focal spots of radius rxy continuously downscaled by STED; error barsresult from averaging over more than 30 FCS measurements on different cells.A comparison to the linear decrease with the focal area A ∼ r 2
xy (grey dottedline) confirms nearly free diffusion for PE and pronounced hindered diffusionof SM, but not for the confocal recordings (grey shaded area). The experimentaldata of PE and SM can be described consistently by Monte Carlo simulateddata including transient binding with on and off rates kon = 190 s−1, koff =
800 s−1 (grey line) and kon = koff = 80 s−1 (black line), respectively. The valuesof the lateral radius rxy were determined from the calibration measurementsof figure 1(b). (b) On rate kon (upper panel) and offrate koff (lower panel) fortransient binding of PE (grey circles) and SM (black squares) determined fromfitting equation (14) (closed symbols) or equation (15) (open symbols) to theexperimental data. The black and grey lines approximate the resulting values ofkon and koff, which can only be reliably determined for the STED (rxy < 70 nm).
Our observation of heterogeneous lipid diffusion is consistent with previous FCSmeasurements, where similar characteristics have been observed for sphingolipids either byextrapolating the dependence of τ xy on A as measured for diffraction-limited and larger focito the nanoscale [10] or measuring τ xy(A) on the plasma membrane of cells grown over100–200 nm large nanoapertures, mechanically confining the focal area [11]. However, our far-field measurements at the length scales of interest deliver much more reliable and more model-independent results about the nanoscopic details of lipid dynamics, since they allow direct andleast invasive determination of the origin of the anomaly in diffusion. Our previous STED–FCSmeasurements of lipid diffusion have already revealed transient, cholesterol-assisted complexesof nanoscopic dimensions of the sphingolipids with other membrane components [31]. Here,we extend these studies and apply a more detailed analysis of the correlation data allowingfor the direct determination of the binding and release rates at these complexes. Figure 8(b)shows the results of fitting equation (14) or (15) to the correlation data, which considers thebinding with on- and off-rate constants kon and koff, respectively, to an immobile partner inthe diffusion path of the molecule. Reliable results of this fitting procedure have only beenobtained for the correlation data recorded for focal spots of diameter (2rxy) < 70 nm rendering
New Journal of Physics 11 (2009) 103054 (http://www.njp.org/)

26
kon ≈ koff ≈ 80 s−1, i.e. an equilibrium constant K = kon/koff ≈ 1 for SM. The off rate coincideswell with the trapping duration of ∼10 ms estimated in our previous analysis [31], and MonteCarlo simulations of lipid membrane diffusion (section 3.1) for kon ≈ koff ≈ 80 s−1 result in aconsistent description of the focal area dependence of τ xy(A) (figure 8(a)). The coincidingvalues of kon and koff determined from the reaction-dominated (equation (14)) and precise model(equation (15)) confirm that only by downscaling the focal radius rxy we ensure that a freelydiffusing molecule spends only little time τfree in the detection area reaching the experimentalcondition that diffusion is dominated by trapping: 1/koff � τfree ∼ r 2
xy .We can now even quantify the slight deviation from normal diffusion of PE. While the
reaction-dominated model (equation (14)) does not give congruent results even for rxy = 15 nm,the precise model (equation (15)) renders on and off rates kon ≈ 190 s−1 and koff ≈ 800 s−1
(figure 8(b)). Monte Carlo simulations with these rates give a consistent description ofthe experimentally observed dependence of τ xy(A) (figure 8(a)). With 1/koff = 1.25 ms andτfree ≈ 0.5–1.5 ms diffusion of PE is not reaction-dominated for rxy > 15 nm and the reaction-dominated model consequently fails. In comparison to SM, kon is 2-fold larger, but the 10-foldlarger off rate establishes a much less pronounced trapping and thus results in the almost normalfree diffusion of PE [31].
We have assumed a free diffusion coefficient Dfree = 5 × 10⁻⁹ cm2 s−1 of the lipids in ouranalysis as estimated from the confocal data and known from previous results [31]. The resultsdo not significantly change when assuming slightly different values of Dfree. For example,changing fixed values of Dfree from 4 to 6 × 10⁻⁹ cm2 s−1 results in kon ≈ koff ≈ 65–90 s−1.Fitting equation (15) to the data (for rxy < 20 nm) with Dfree as an additional free parameteryields Dfree ≈ 4 × 10⁻⁹ cm2 s−1 and kon ≈ koff ≈ 65 s−1, however, with a large variance ≈60%.
Most strikingly, only the <70 nm large spots of the STED microscope can reveal theobserved details of lipid membrane dynamics, simple confocal data render normal diffusionfor both SM and PE with a slightly lower diffusion coefficient in the case of SM [31]. Thedemonstrated hindered diffusion of the lipids in the plasma membrane of living cells highlightsthe great potential of STED microscopy to address prominent biological problems such asdetails on the formation of lipid membrane organization (lipid ‘rafts’).
4. Conclusion
Using STED microscopy we have shown the far-field fluorescence observation of single-molecule dynamics in focal volumes of down to 30 nm in diameter. Even smaller volumeswill be available with optimized instrumentations. The signal-to-noise ratio of the nanoscaleexperiments in 3D, open volumes was influenced by contributions of low-brightness signalfrom axial out-of-focus areas but can be corrected at the cost of lower signal-to-noise ratios. Incontrast, single-molecule data recorded on 2D samples such as membranes provided excellentsignal-to-noise ratios similar to those of confocal recordings. Being non-invasive, far-fieldstudies of single-molecule dynamics at the nanoscale open the way to a whole field of newexperiments. With observation volumes reaching the macromolecular scale, details of molecularmotion can now be revealed with higher sensitivity. This allows us to address importantquestions about the nano-organization of molecules, prominently the details of hindereddiffusion of molecules in the plasma membrane of living cells and their organization intonanodomains [31]. Specifically, we showed here that STED microscopy uniquely determinesbinding and release rates of nanoscale lipid interactions. Alternative far-field optical nanoscopy
New Journal of Physics 11 (2009) 103054 (http://www.njp.org/)

27
techniques based on stochastic switching and mathematical localization of single moleculesare equally powerful in resolution [43, 44], but by electing random molecular events within ad > 300 nm detection area, they lack the ability to probe within a specific subdiffraction site.A further advantage of the STED approach is that the focal spot can be dynamically tuned in acontrolled manner. Following the dependence of molecular transit times on the focal spot size orshape down to the nanoscale provides additional information on the characteristics of moleculardynamics such as local trapping or directional flow. Further on, with the smaller detection fociformed in STED microscopy the range of single-molecule based experiments can easily beexpanded to cases where larger, sometimes endogenous concentrations are inevitable.
Sufficient signal levels for single-molecule measurements in STED microscopy are alsorealizable with different modes of experimental design such as 2D or 3D focal confinement,continuous or pulsed laser light, and >100 µm away from the cover glass in solution, whichprovides nanoscale observations inside living cells or tissues. Compared to confocal recording,the diffusion time in the nanoscopic volumes formed by STED is strongly reduced and the effectof photobleaching on freely traversing molecules is thus reduced.
Combinations of STED–FCS with total-internal-reflection [45, 46], multi-photonexcitation [47] or with 4Pi microscopy [48] may further reduce the noise from axial out-of-focusareas, especially in cellular measurements with significant background due to autofluorescentor internalized molecules. Also, scanning of the beam may further increase the sensitivityof the STED–FCS measurements and allow for combining nanoscale spatial and temporalinformation [41, 42]. Nanoscopic focal spots may also be formed by fluorescence switchingprocesses other than STED, such as reversible photoswitchable fluorophores or dark statetransitions [17, 49]. In addition to the tuning of the detection volume as described above,photoswitching can also be used to tune the number of visible fluorophores and thus to optimizethe signal-to-noise ratio for varying given concentrations of markers [50]. Last but not least,one could combine different fluorescence and physical readouts on the nanoscale, such assimultaneous recording of fluorescence intensity, lifetime, anisotropy and color together withtemperature, force or electrical currents. Overall, we expect the ability to perform single-molecule studies at the nanoscale to be important for tackling many outstanding problems inall scientific areas where nano-organization is the key to the functionality.
Acknowledgments
We thank C v Middendorff, L Kastrup, V Belov (Göttingen), and G Schwarzmann (Bonn),P Kask (Tallinn) and H Rigneault (Marseille) for fruitful discussion and M Hilbert (Göttingen)for a critical reading of the manuscript.
Appendix. Global FCS–FIDA analysis
We performed a global FCS–FIDA analysis by fitting simultaneously recorded correlation andPCH data with the same set of parameters, respectively. For the global analysis, we found it moreconvenient to use the un-normalized correlation function G(tc), which is directly proportionalto the focal peak fluorescence brightness squared Q2
0 [1]. For FIDA, we applied our heuristicapproach resulting in values of N ∗, q∗(∼Q0), and B∗
b . The values of N ∗ and q∗ have to beinterconverted between correlation and histogram analysis by taking into account the samplingrate of FIDA, i.e. the ratio of sampling time window 1T and average transit time τ xy of a single
New Journal of Physics 11 (2009) 103054 (http://www.njp.org/)

28
molecule through the focal area 1T/τ xy , as outlined in equation (12). However, instead ofcalculating S applying equation (12), we found it more reliable to introduce S as an additionalfitting parameter [29]. We weighted the individual FCS and FIDA fits by the inverse of thefit function’s value [5], and applied an additional fitting parameter that adapts fit-weightingbetween both analysis methods.
Overall, both the correlation and histogram data were accurately reproduced by using thesame set of parameters, as exemplified in figure 2(d). The values of N ∗, q∗ and τ xy obtainedby the global FCS–FIDA analysis coincide with those determined from the individual FIDAand FCS analysis. Further, from the resulting values of the correction factor S we can estimatea = 0.15 ± 0.06 according to equation (12).
References
[1] Magde D, Elson E L and Webb W W 1972 Phys. Rev. Lett. 29 705–8[2] Ehrenberg M and Rigler R 1974 Chem. Phys. 4 390–401[3] Haustein E and Schwille P 2003 Methods 29 153–66[4] Chen Y, Müller J D, So P T C and Gratton E 1999 Biophys. J. 77 553–67[5] Kask P, Palo K, Ullmann D and Gall K 1999 Proc. Natl Acad. Sci. USA 96 13756–61[6] Abbe E 1873 Arch. Mikr. Anat. 9 413–68[7] Levene M J, Korlach J, Turner S W, Foquet M, Craighead H G and Webb W W 2003 Science 299 682–6[8] Laurence T A and Weiss S 2003 Science 299 667–8[9] Schwille P, Korlach J and Webb W W 1999 Cytometry 36 176–82
[10] Wawrezinieck L, Rigneault H, Marguet D and Lenne P-F 2005 Biophys. J. 89 4029–42[11] Wenger J, Conchonaud F, Dintinger J, Wawrezinieck L, Ebbesen T W, Rigneault H, Marguet D and Lenne
P-F 2007 Biophys. J. 92 913–9[12] Geerts H, De Brabander M, Nuydens R, Geuens S, Moeremans M, De Mey J R and Hollenbeck P 1987
Biophys. J. 52 775–82[13] Sheetz M P, Turney S, Qian H and Elson E L 1989 Nature 340 284–8[14] Hell S W and Wichmann J 1994 Opt. Lett. 19 780–2[15] Hell S W and Kroug M 1995 Appl. Phys. B 60 495–7[16] Dose V 2009 Europhys. Lett. 86 10000[17] Hell S W 2007 Science 316 1153–8[18] Klar T A, Jakobs S, Dyba M, Egner A and Hell S W 2000 Proc. Natl Acad. Sci. USA 97 8206–10[19] Donnert G, Keller J, Medda R, Andrei M A, Rizzoli S O, Lührmann R, Jahn R, Eggeling C and Hell S W
2006 Proc. Natl Acad. Sci. USA 103 11440–5[20] Kastrup L, Blom H, Eggeling C and Hell S W 2005 Phys. Rev. Lett. 94 178104[21] Mueller D, Rudin O, Tien H T and Wescott W C 1962 Nature 194 979–80[22] Hemmler R, Böse G, Wagner R and Peters R 2005 Biophys. J. 88 4000–7[23] Martin O C and Pagano R C 1994 J. Cell Biol. 125 769–81[24] Schwarzmann G, Hofmann P, Pütz U and Albrecht B 1995 J. Biol. Chem. 270 21271–6[25] Widengren J, Mets Ü and Rigler R 1995 J. Phys. Chem. 99 13368–79[26] Kask P, Eggeling C, Palo K, Mets Ü, Cole M and Gall K 2002 Fluorescence intensity distribution analysis
(FIDA) and related fluorescence fluctuation techniques: theory and practice Fluorescence Spectroscopy,Imaging and Probes—New Tools in Chemical, Physical and Life Sciences ed R Kraayenhof et al (Berlin:Springer) pp 153–81
[27] Qian H and Elson E L 1990 Proc. Natl Acad. Sci. USA 87 5479–83[28] Koppel D E 1974 Phys. Rev. A 10 1938–45[29] Palo K, Mets Ü, Jäger S, Kask P and Gall K 2000 Biophys. J. 79 2858–66
New Journal of Physics 11 (2009) 103054 (http://www.njp.org/)

29
[30] Michelman-Ribeiro A, Mazza D, Rosales T, Stasevich T J, Boukari H, Rishi V, Vinson C, Knutson J R andMcNally J G 2009 Biophys. J. 97 337–46
[31] Eggeling C et al 2009 Nature 457 1159–63[32] Schätzel K, Drewel M and Stimac S 1988 J. Mod. Opt. 35 711–8[33] Hell S W 2004 Phys. Lett. A 326 140–5[34] Harke B, Keller J, Ullal C K, Westphal V, Schoenle A and Hell S W 2008 Opt. Express 16 4154–62[35] Ringemann C, Schönle A, Giske A, von Middendorff C, Hell S W and Eggeling C 2008 ChemPhysChem.
9 612–24[36] Hell S, Reiner G, Cremer C and Stelzer E H K 1993 J. Microsc. 169 391–405[37] Staudt T, Lang M, Medda R, Engelhardt J and Hell S W 2007 Microsc. Res. Tech. 70 1–9[38] Rittweger E, Rankin B R, Westphal V and Hell S W 2007 Chem. Phys. Lett. 442 483–7[39] Willig K I, Harke B, Medda R and Hell S W 2007 Nat. Methods 4 915–8[40] Eggeling C, Widengren J, Rigler R and Seidel C A M 1998 Anal. Chem. 70 2651–9[41] Ruan Q, Cheng M A, Levi M, Gratton E and Mantulin W W 2004 Biophys. J. 87 1260–7[42] Ries J and Schwille P 2006 Biophys. J. 91 1915–24[43] Betzig E, Patterson G H, Sougrat R, Lindwasser O W, Olenych S, Bonifacino J S, Davidson M W, Lippincott-
Schwartz J and Hess H F 2006 Science 313 1642–5[44] Rust M J, Bates M and Zhuang X 2006 Nat. Methods 3 793–6[45] Thompson N L, Burghardt T P and Axelrod D 1981 Biophys. J. 33 435–54[46] Ries J, Ruckstuhl T, Verdes D and Schwille P 2008 Biophys. J. 94 221–9[47] Denk W, Strickler J H and Webb W W 1990 Science 248 73–6[48] Hell S and Stelzer E H K 1992 J. Opt. Soc. Am. A 9 2159–66[49] Hell S W 2003 Nat. Biotechnol. 21 1347–55[50] Eggeling C et al 2007 Microsc. Res. Tech. 70 1003–9
New Journal of Physics 11 (2009) 103054 (http://www.njp.org/)


