Embed Size (px)
Citation preview

Dutch Evaluation ofChauffeur Assistant(DECA)
Traffic flow effects of implementation in theHeavy Goods Vehicles sector
June 2004
G. Schermers (AVV)K. M. Malone (TNO-Inro)

Published byMinistry of Transport, Public Works and Water ManagementAVV Transport Research CenterBoompjes 200P.O. Box 10313000 BA RotterdamThe Netherlands
InformationAuthor G. Schermers (AVV), Dr. K.M. Malone (TNO-Inro)Contact Govert SchermersTelephone 0031 (0) 10 282 57 04E-mail [email protected]
In collaboration withTNO-Inro
June 2004
. . . . . . . . . . . . . . . . . . . . . . . . . . . . . . . . . . . . . . . . . . . . . . . . . . . . . . . . . . . . . . . . . . . . . . . . . . . . . . . . . . . . . . . . . . . . . . . . . . . .Colophon

Table of contents
. . . . . . . . . . . . . . . . . . . . . . . . . . . . . . . . . . . . . . . . . . . . . . . . . . . . . . . . . . . . . . . . . . . . . . . . . . . . . . . . . . . . . . . . . . . . .
1 Introduction..............................................................................................5 1.1 Background.......................................................................................5 1.2 Lateral support systems – Chauffeur Assistant ...................................6 1.3 Field Operational Test .......................................................................7 1.4 Outline of the report .........................................................................7
2 Lateral and longitudinal support systems ..................................................8 2.1 Lateral support systems.....................................................................8 2.2 Longitudinal control systems .............................................................9 2.3 Collision Avoidance Systems (CAS)....................................................9
3 Collision avoidance and other related Advanced Driver Assistance systems : Worldwide interest and testing ....................................................................10
3.1 United States...................................................................................10 3.1.1 Effects of CAS and ACC on traffic flow ....................................10 3.1.2 User acceptance.......................................................................17
3.2 Europe ............................................................................................19 3.2.1 Effects of CAS and ACC...........................................................19 3.2.2 Scenarios .................................................................................22
4 Modelling DECA Implementation ...........................................................24 4.1 Background.....................................................................................24
4.1.1 Selection of an appropriate model............................................25 4.1.2 Adapting MIXIC to accommodate Chauffeur Assistant ............25
4.2 The driving simulator study: The effects of CA on driving behaviour25 4.2.1 Data collection.........................................................................28 4.2.2 Data Analyses ..........................................................................28 4.2.3 Results .....................................................................................29 Use and choice of headway settings .......................................................29
4.3 Changes to the MIXIC model ..........................................................34 4.3.1 Driver model monitors car following characteristics..................35 4.3.2 System alerts the driver model .................................................35 4.3.3 Activating and deactivating CA................................................36 4.3.4 Lane change behaviour............................................................36
4.4 Traffic simulations with Chauffeur Assistant ....................................36 4.5 Simulation modelling framework .....................................................38 4.6 Simulation results ............................................................................40
4.6.1 Traffic safety indicators ............................................................40 4.6.2 Traffic flow and capacity..........................................................41 4.6.3 Results .....................................................................................41
5 Conclusions ............................................................................................49
Dutch evaluation of Chauffeur Assistant 3

Summary This report concludes the second phase of the Dutch FOT examining the effects of lateral support systems [AVV, 2001]. This second phase examined the traffic effects of the Chauffeur Assistant (CA) Driver Assistance System. The research carried out to evaluate the traffic effects included a world-wide literature study, the (changes to) driver behaviour with CA assessed in the TNO Human Factors’ driving simulator, and finally the incorporation of the literature review and the driver behaviour analysis in the TNO Inro MIXIC traffic simulation model which was subsequently used to assess the effects of CA. The CA control algorithms were developed by TNO Automotive and TNO Human Factors, based on information provided by Daimler-Chrysler in terms of the HMI and functionality of the CA. The scenarios analyzed in the traffic simulation model included trucks and passenger cars, but only the trucks had the CA equipment. Overall it is concluded that the introduction of Chauffeur Assistant in the HGV sector, assuming its use is limited to the primary road network of the Netherlands, will have no negative effects on traffic flow. The results of the MIXIC simulations do not suggest that significant changes will occur in any of the variables describing the quality of traffic flow (travel times, speeds, density etc.) and traffic safety (shockwaves, TTC, headways etc.) should CA be introduced in the HGV sector. The drivers participating in the driving simulator study did indicate, though, that their perceived workload decreased when CA was used. As mentioned, compensating behaviour in these cases is not yet known, but worth examining in the future. The effectiveness of CA system could significantly be enhanced if the system were applicable in other circumstances as well: wither by equipping other types of vehicles, such as passenger vehicles, with the system, or by extending the operational range to below the standard minimum speed by integrating a stop&go system in the CA.
Dutch evaluation of Chauffeur Assistant 4

1 Introduction
. . . . . . . . . . . . . . . . . . . . . . . . . . . . . . . . . . . . . . . . . . . . . . . . . . . . . . . . . . . . . . . . . . . . . . . . . . . . . . . . . . . . . . . . . . . . .
Being a geographically small and densely populated country with a highly developed road network, the Netherlands is continually being challenged to meet the growing demand for mobility whilst ensuring acceptable levels of congestion and sustainable levels of road safety. Until now the Netherlands has been able to maintain the delicate balance between the supply of road capacity and traffic demand. However, government has realised that infrastructure provision is in itself no permanent remedy to meet the growing demand. Given the limited availability and cost of valuable land, building new roads is become less and less viable. This presents an interesting challenge to policy makers in the country, either accept growing levels of congestion or develop alternatives to either manage the demand or to increase the capacity of existing infrastructure. The first has been rejected in government policy. The National Traffic and Transport Plan sets out objectives to reduce the number, duration and length of queues on the primary Dutch road network. This is to be achieved by providing a package of measures that manage the supply and demand chain. On the supply side ways need to be developed with which to optimally utilise existing road space. On the demand side ways are being investigated to discourage private automobile use, stimulate public transport and other means of non-motorised transport and using in-vehicle technology as an enabler to increase roadway capacity. Irrespective of these ambitions, government has committed itself to ensuring that road safety is at worst not comprised and at best improved to even higher levels. Within this context and as part of a larger research project (see section 1.3; AVV, LDWA FOT), this report explores opportunities relating to in-vehicle technologies and especially active lane keeping systems (lateral control), distance keeping systems (such as Automatic Cruise Control and enhancements thereof) and combinations of these two. 1.1 Background
In 2002 the Netherlands registered a total of 987 traffic fatalities, 11 018 serious injury victims (hospitalised) and 12 580 slight injury victims (requiring emergency room treatment). Taking into account the under registration by the police, the actual numbers were somewhat higher. In 2002 these were estimated at 1066 traffic deaths; 18 420 serious injury victims and 91 000 slight injury victims (AVV, 2003). Over the period 1997 to 2002 this constitutes reductions of approximately 14, 9 and 16 percent in traffic fatalities, serious injuries and slight injuries. Considering that the vehicle population and mobility have respectively increased by some 20 and 10 percent over the same period, this can be accepted a major achievement. However, indications are that unless new impetus is given to these efforts a chance exists that the momentum will be lost and even worse, the trend reversed. On the other side of the coin traffic congestion is a growing source for concern. Over the period 1998 to 2001 the total number of queues longer than 2 km on the primary Dutch road network grew by some 18% (from 29 226 to 34 785 queues) whereas the level of congestion (measured as the product of the length and the time spent in a queue) grew by over 4 percent. Apart from the high growth rate in passenger cars, the CPB Netherlands Bureau for Economic Policy Analysis (CPB) has predicted that heavy goods vehicles will increase by some 40% over the period 2000 to 2020 in the Netherlands. Heavy goods vehicles are involved in a relatively large proportion of accidents
Dutch evaluation of Chauffeur Assistant 5

(approximately 15% of all fatal accidents, whereas heavy goods vehicles constitute on average roughly 12% of the traffic volume and 2% of the vehicle population). In-vehicle driver support systems such as the Lane Departure Warning Assistant (LDWA) could play a significant role in mitigating the negative safety effects of a substantially increased heavy goods vehicle fleet. Since land is at a premium in the Netherlands and the fact that Government has realised that it cannot continually keep on providing new road infrastructure, alternatives have to be found to minimise the effects of road traffic on congestion and safety. To this end, the focus of future policy directs itself at technological solutions and maximum utilisation of existing infrastructure. One of these initiatives is aimed at investigating the possibilities that Automatic Vehicle Guidance (AVG) systems (Ministry of Transport, Public Works and Water Management, December 2000) offer for these problems. In 2001 the Ministry requested the Transport Research Centre (AVV) initiate a Field Operational Test (FOT) with passive derivatives of Lane Departure Warning Assistant systems (AVV, August 2001). A secondary focus within the FOT was to investigate developments with more active AVG systems, namely combinations of automatic lane and automatic distance keeping. This report concentrates on reporting international developments of these active systems and also presents a number of scenarios regarding the potential implementation and market penetration of such technology. The results of the first part of the Field Operational Test (FOT), namely the evaluation of LDWA, have been extensively reported elsewhere (Korse, et al., 2003; Hoedemaeker and de Ridder, 2003; Katteler, 2003; Rook and Hogema, 2002; Brouwer and de Ridder, 2003). The work described in this report differs from the LDWA evaluation in that the Chauffeur Assistant system is a combination of lane keeping and distance keeping and that the methodology is based on using a driving simulator and microscopic traffic simulation in preference to field tests. 1.2 Lateral support systems – Chauffeur Assistant
Lateral support systems are in-vehicle technologies aimed at helping a driver keep within the lane boundaries. These systems have particular potential for single-vehicle run-off the road incidents where driver fatigue, drowsiness or inattention play a role. Lateral support systems can be categorised into lane departure warning systems (passive systems such as LDWA) and lane keeping systems (active and semi-active systems such as LKS and Chauffeur Assistant). This, the second part of the FOT, is aimed at assessing active version of lateral support systems. Chauffeur Assistant (CA) is a development within the greater European Chauffeur-2 project (Brandenburg et al., 2002) and comprises a lane keeping system (LKS) and a Smart Distance Keeping (SDK) system. The lane keeping system keeps the vehicle in the desired lane by continually tracking the lane markings and sending data (status information) to the CA-computer for analysis and action (steering is not necessary). The SDK system is based on adaptive cruise control (ACC) technology that monitors relative speed and distance to leading vehicles or obstacles in the roadway. It takes into account the dynamic capabilities of other vehicles and: � Recognises the target object (car, obstacle truck etc.) � Keeps the shortest gap distance under the prevailing conditions � Warns the driver when a stationary object is detected � Continually monitors and sends data to the CA-computer The CA system is activated when a driver approaches a target vehicle and switches the system on. The system then keeps the vehicle in its lane whilst continually monitoring and maintaining a constant gap to the lead vehicle. The CA is a support system and does not totally take control of the vehicle. The
Dutch evaluation of Chauffeur Assistant 6

driver is responsible for operating the system and it is up to the driver when to activate or deactivate the system. As with LDWA it stands to reason that CA-systems will only function well where the provided road infrastructure (paved surface, road markings, alignment etc.) is of a high standard. 1.3 Field Operational Test
The research plan for the Field Operational Tests (FOT) aimed at addressing three systems that belong to a class of Advanced Driver Assistance (ADA) systems (AVV, August 2001). The three systems included in the FOT were LDWA, Lane Keeping (LKS) and Chauffeur Assistant systems. The first phase of the FOT focussed on evaluating the LDWA systems whereas the second aimed at evaluating the Chauffeur Assistant. The primary difference in approach is that the LDWA evaluation was based on field trails with LDWA systems and driving simulator studies whereas the evaluation of CA is based on evaluations using a driving simulator and microscopic simulation using a suitable dynamic traffic model. The primary objectives of the FOT were to: � Increase the knowledge of risk and success factors for the deployment of
lateral control support systems and for effective policy making by the transport authorities by gaining more insight into : � Effects on traffic safety and traffic flow � Acceptance and consensus � Infrastructure consequences � Relation of the systems with other developments (e.g. narrow lanes)
� Increase the awareness and acceptance of ADA systems in general and LDWA in particular.
1.4 Outline of the report
Chapter 2 provides a more detailed description of Chauffeur Assistant systems. Chapter 3 describes a number of modelling approaches that estimate the effects that CA-systems could have. Chapter 4 summarises these effects and describes a number of scenarios under which Chauffeur Assistant (or similar systems that combine lateral and longitudinal assistance) could be implemented in the Netherlands. In chapter 5 the primary conclusions of the report are presented.
Dutch evaluation of Chauffeur Assistant 7

2 Lateral and longitudinal support systems
……………………………………………………………………………………………………………………………………. In the context of Advanced Driver Assistance (ADA) Systems, a distinction can be made between lateral and longitudinal support systems, reversing and parking aids and vision enhancement systems. Lateral support systems primarily focus on systems that aim at maintaining the correct course along the roadway and within a lane. Longitudinal support systems primarily control vehicle speed in order to maintain a constant and safe speed or headway relative to leading (and sometimes even lagging) vehicles. Reversing and parking aids are devices for detecting obstacles at low speed. Vision enhancement systems are relatively new systems that are aimed at providing driver support in poor weather and low visibility conditions. This report concentrates on lateral and longitudinal support systems but also gives an overview with respect to initiatives aimed at developing an integrated solution by combining all the technologies into a so called collision avoidance system (CAS). Furthermore, ADA systems can be categorised into passive and active support systems. The passive systems are informative and support the driving task (for example LDWA), whereas active systems not only inform the driver but in certain instances partially take over certain driving tasks (e.g. LKS and ACC Stop and Go). 2.1 Lateral support systems
Lateral support systems aim to ensure that a vehicle remains within its lane and maintains a safe course. These systems are designed to prevent accidents resulting from lane changes or unintentional lane or roadway departures. These systems provide an audio or other signal to warn the driver that he/she is about to unintentionally leave the lane or to warn of the presence of other vehicles/objects in the adjacent lane(s). Lateral support systems include passive and active derivatives. Passive lane departure warning systems generally make use of video cameras linked to some form of image processing hardware and software. When the system detects that the lane boundary (as defined by the lane marking) is being approached or when the wheel of the vehicle physically touches it and the indicators have not been activated, a signal is given to the driver. The signal can be visual (via a display with a flashing LED or similar), audio (buzzer, bell) or tactile (e.g., the seat or the steering wheel vibrates). Apart from the relatively expensive camera-based systems, manufacturers are currently researching and developing alternative sensing devices (such as drowsy driver detection, infrared, radar, magnetic etc.). The more active lane keeping systems (LKS) also make use of similar technology to monitor the vehicle’s path. A fundamental difference is that the active systems have a form of heading control. When the vehicle threatens to unintentionally deviate from the lane or road the system physically corrects the steering angle and heading of the vehicle. Lane change and run-off the road accidents account for a significant proportion of the total number of accidents. Active steering and heading control systems are expected to decrease the number of injury accidents and will positively contribute to driver comfort more than passive LDWA systems.
Dutch evaluation of Chauffeur Assistant 8

2.2 Longitudinal control systems
These systems automatically monitor and maintain following distance and also can control vehicle speed. As with lane keeping systems there are active and passive derivatives of these systems available on the market. The passive versions of these include systems that advise the driver of appropriate speed (e.g. curve speed prediction, etc.) and inform the driver of the following distance. The active systems include Advanced Cruise Control (ACC), Stop and Go and Platooning (i.e. a train of vehicles following at fixed headways and equal speed). These systems have evolved from the standard cruise control and make use of sensor, warning systems and communication technology to control headways and speed. These systems can partially take over certain driving tasks such as acceleration, deceleration and moderate braking. The systems rely on sensors, hardware and software to measure the following distance and to compare the speeds of the leading and following vehicles. Based on a given headway setting the systems use algorithms to determine the course of action (accelerate, decelerate, maintain speed, brake etc.) and then carry out that action. 2.3 Collision Avoidance Systems (CAS)
The development of integrated collision avoidance systems is motivated by the potential effect that such systems could have on road traffic safety. At the present time virtually all the leading first world countries are researching and developing some form or other of collision warning system. Collision avoidance systems combine the longitudinal and lateral components of the driving task. CAS makes use of various technologies to monitor the road ahead, assess the speed of leading and following traffic, monitor traffic in adjacent lanes, detect objects in the roadway and measure the position in the lane and on the roadway. Using various control algorithms the data are continuously assessed and where necessary the speed and steering of the vehicle are automatically adjusted and/or the driver informed regarding conditions. These systems are able to react faster than the driver and help the driver by taking corrective actions in anticipation of certain events (e.g. lightly braking when the following distance becomes smaller than the preset minimum, course corrections etc.). CAS does not take over the driving task but merely supplements it. The driver remains in control of the vehicle and maintains overall responsibility. The Chauffeur Assistant concept as described by the Dutch Research Framework can for all practical purposes be defined as a CAS.
Dutch evaluation of Chauffeur Assistant 9

3 Collision avoidance and other related Advanced Driver Assistance systems : Worldwide interest and testing
…………………………………………………………………………………………………………………………………….
This section provides an overview of the latest developments with respect to approaches used to model and calculate the effects that collision avoidance systems and technologies can ultimately have on traffic flow and on roadway capacity. These developments provide an insight into road safety and traffic operational effects. They also indicate the probable trends that could affect the large-scale implementation of these products and systems in the future. These insights will help motivate the subsequent choice of modelling scenarios to be used in this study. 3.1 United States
3.1.1 Effects of CAS and ACC on traffic flow Advanced Collision Avoidance Systems The National Highway Traffic Safety Administration (NHTSA) of the US Department of Transport is currently conducting a large scale Field Operational Test with a collision avoidance system (NHTSA, 2002). The primary goal of the five-year trial is to demonstrate a state of the art CAS and to measure the effectiveness and performance of the system when used by typical American road users. The suitability of wide scale use of the CAS will be determined by:
• The perceived added value of such a system (marketability) • Safety and convenience benefits • Degree of added risk to users and other.
The intention is to develop an Advanced Collision Avoidance System (ACAS) based on a combination of Forward Collision Warning (FCW) and ACC and to equip a fleet of vehicles with the system. A number of drivers selected from the broader public will be given an ACAS-equipped car for use over a four-week period. Objective and subjective data will be collected before, during and after the candidates are supplied with the vehicles. Specific attention will be paid to system performance, usage patterns, changes in driving behaviour and user acceptance. Phase 1 of the trial started in June 1999 and was completed in December 2001. During this phase the system was developed, integrated and tested. During Phase II the system will be deployed in a fleet of ten vehicles and the actual field operational test will be conducted. No results of this phase were readily available at the time of drafting this report. The main conclusion from Phase 1 is that the FCW and ACC functions were successfully integrated into an ACAS and built into a vehicle. Extensive tests were carried out and the system passed all the agreed-upon verification tests. The major accomplishments out of Phase 1 and as reported by NHTSA were:
• A cost microwave monolithic integrated circuit (MMIC) was developed and tested. This is thought to have a positive effect on the cost of future automotive radars.
• Target detection, tracking and identification algorithms were developed and tested, including bridge identification and radar blockage detection algorithms.
• Three vision-based lane-sensing algorithms were developed of which one was integrated into the ACAS. This vision system detects lane
Dutch evaluation of Chauffeur Assistant 10

changes, estimates road geometry and lateral offset in the lane, and estimates the heading angle in the lane.
• A GPS-based road geometry estimation system and a map d-base were enhanced to increase the update rate, to improve dead reckoning when no GPS was available, to improve shape estimates at transitions into and out of corners, to add confidence levels and to add information about upcoming road features (e.g. intersections).
• A scene tracking function using radar data from leading vehicles was developed to estimate forward road geometry and the host vehicle with respect to the road.
• Two data fusion techniques (weighted combination and consensus) were developed to combine multiple sources of road geometry and estimates of host vehicle state.
• Target selection algorithms were improved to use the data fusion data outputs and to improve filtering to reduce errors in identifying in-path targets.
• Four threat assessment algorithms were developed and tested and ultimately one developed by General Motors was selected for the FOT.
• A driver-vehicle interface (DVI) was developed following extensive research and simulator, close course and on the road tests. The DVI included cruise control button on the steering wheel, a sensitivity button to control the ACC and FCW, a head up display (showing speed, ACC/FCW settings, visual alerts and status information) and an audio output to warn for FCW alerts
• A production brake system was modified to provide for automatic braking (ACC). The brake system included ABS, traction control and vehicle stability enhancement features.
• The ACAS was subjected to 30 verification system-level tests. These verified that FCW alerts occurred when intended and the ACC functioned correctly. A few nuisance alerts were reported.
• A detailed FOT plan for the execution of Phase II was developed and approved by the review panels (General Motors, University of Michigan and the US DOT).
In the context of this report, the NHTSA study is at present one of the most relevant developments coming from the USA. The progress of this study will be carefully monitored in order to incorporate relevant results into future trials in the Netherlands. Braking and steering support As early as 1996, research was carried out to estimate the potential benefits of collision avoidance systems (Gee, et al. 1996). The study was based on simulations of the braking and steering dynamics of heavy goods vehicles. A total of 5 truck configurations with two levels of braking and brake effectiveness were simulated at 2 speed regimes, three load conditions and two road surface conditions. Since automatic braking systems have the potential to significantly reduce driver reaction time, 5 different braking strategies (from gentle to emergency stop) using two driver responses (immediately react and react when the situation is recognised) were simulated to test the impact on the total stopping time/distance (sum of driver reaction time plus time for the vehicle to come to a stop). The initial results indicate that a system that warns a driver of a hazard helps reduce driver reaction time and thereby the severity of the braking strategy. Conversely, if the hazard is not detected early enough (slow reaction time) a more aggressive braking strategy has to be deployed. Also evidence was found that the difference in braking capability between the five vehicle types was marginal and therefore further simulations and safety estimates were calculated on the basis of only a tractor-trailer combination (6x4 tractor with a tandem axle semi-trailer) Based on this a sample size of 10 000 runs distributed over the four variables (different braking strategies and configurations, pre-collision speeds and
Dutch evaluation of Chauffeur Assistant 11

intervals and using different profiles for brake activation distances) were carried out. In the simulations:
- four random variables were considered to affect vehicle braking ability, namely; weight; road surface coefficient of friction; vehicle braking capability and driver reaction time to system override.
- Two types of braking systems were considered - Five braking strategies were modelled - A random sample size for modelling was selected - Pre-collision Lead Vehicle Stationary (LVS) speed distributions
were estimated and adjusted when real values were obtained - One HGV type was used; and - Two activation distance algorithms were examined to see how
they affect the number of rear-end collisions. The primary result of the simulations was that the accident reduction benefit is to a very large extent dependant on the activation scheme (i.e. the greater the distance at which a hazard is detected, in this case a stationary lead vehicle, the greater the % reduction). However, this also means that in order to preset the safest possible margin one would need to set the system at the maximum of the detection ability of the sensor. By so doing the chance of the systems issuing false warnings increases significantly. In addition this has a negative effect on traffic flow and capacity. Somewhere between this optimum activation and an actual accident occurring is a setting that will warn the driver in time and not force the system into emergency braking. An autonomous braking system should warn a driver at some distance before the hazard and only take action by applying brakes if the driver has not reacted when the critical activation distance is reached. Based on the simulation results the authors made an estimate of the potential road accidents that could be avoided by the introduction of these systems. The analysis concentrated on:
- Rear-end collisions involving two vehicles and where the striking vehicle is a truck-trailer combination;
- Both vehicles are travelling straight on (i.e. no lane changing, merging or swerving);
- The striking vehicles’ (truck) brakes did not fail; - The accident took place on a straight length of roadway; and - The accident did not occur under snowy/icy conditions.
The simulations showed that at the furthest possible activation distance between 78% (driver warning only) and 100% (driver warning plus active brake intervention) of rear-end accidents involving a tractor trailer combination as the following (striking) vehicle could be avoided if an active collision avoidance system were deployed. Applying this reduction to the population of accidents involving heavy goods vehicles implied an overall reduction of 6,9% of all collisions involving tractor-trailer combinations. This reduction is conservative since it only considers rear-end accidents involving two vehicles and where the following and striking vehicle is a tractor-trailer combination. The authors estimated that an autonomous braking system would cost approximately $5 700 per vehicle. Based on equipping 150 000 vehicles per year and using only accident costs, this would give a cost-benefit ratio of 0,88:1. This implies a pay back period of just 11 months. This is a very favourable rate of return considering the period of time that such vehicles remain in service. Braking algorithms in CAS Seiler et al. (Society of Automotive Engineers, 1998) developed algorithms incorporating a tyre-road friction estimator for application in a collision avoidance system. This system was designed to comply to the following criteria:
- System warnings have minimal influence on driver attention;
Dutch evaluation of Chauffeur Assistant 12
- Automatic brake control should not affect normal driving; and - The system should perform well under a number of driving
conditions. The authors recognise that collision avoidance systems need to find a balance between making the system useful to the driver whilst not interfering with the normal driving task. In other words the warnings must be perceived by the driver to be credible. On the one hand, if too many warnings are generated the driver will become irritated and deactivate the system or ignore the warnings. On the other hand, few warnings may startle the driver and could cause distraction during crucial situations. Since the method and frequency of warnings is quite critical to the eventual success of such systems, the authors of this paper propose a visual system which provides continual feedback on the basis of a colour coded status bar. The second issue they warn against is that automatic brake control in an active CA application must under no circumstances interfere with the regular driving task. If an active collision avoidance system automatically starts braking at a time that the driver decides to execute an evasive manoeuvre, the driver might get a fright and react incorrectly or worse, have an accident. At the other extreme, if an active system is programmed ultra defensively it may be able to prevent virtually all targeted accidents but will mean that the brakes will in many cases be applied inappropriately (i.e. the detection rage is great and the system brakes whenever an object is detected within this range. However the driver has anticipated the situation and does not judge it necessary to brake, for example and overtaking vehicle cutting in front). The solution proposed for this problem is to develop a system that does not aim to eliminate all targeted accidents but rather to significantly reduce these and to severely reduce the severity of those accidents that are not prevented by the system. Additionally the authors recognise the fact that individual driving styles and habits differ. These might imply that the specifications for CA systems may need to be different for passive as opposed to aggressive drivers. An average system will not meet the needs for the extremes so therefore the authors recommend a system that incorporates an algorithm that allows the driver to customise the frequency of warnings and brake interventions. Seiler et al. (1998) reviewed two algorithms developed by respectively the Mazda and Honda Motor Corporations. The former is of the type that was earlier labelled a conservative system (i.e. aimed at reducing all rear end accidents) whereas the latter is less conservative but will not prevent all targeted accidents from occurring. Seiler combines these two approaches with what he terms a non-dimensional warning value. In essence this comes down to a visual display that displays the distance spacing and in relation to a so-called critical distance. By using a graduated light display the driver is informed of his relative position. The instant the following distance starts approaching the brake critical distance the displayed bars light up in red and an audio alarm starts sounding. If the following distance equals or drops below the brake-critical distance, the system intervenes by applying brakes.
Dutch evaluation of Chauffeur Assistant 13

Seiler’s non-warning dimensional value is calculated from:
brw
br
ddddw
−−
=
where d is the actual vehicle spacing
brd is the braking critical distance which Seiler defines on the basis of a time to
collision criterion and is calculated as follows:
22 )(5.0)( humsyshumsysrelbr avd ττττ +•++•=
where
relv is the relative velocity between the vehicles
sysτ is the system response delay
humτ is the human response delay
2a is the deceleration (braking) rate of the leading vehicle
wd is the warning critical distance and calculated from
( )o
relw dvvvvd +•+⎟⎟
⎠
⎞⎜⎜⎝
⎛ −−= τ
αα
22
21
where v is the vehicle velocity
relv is the relative velocity between the vehicles α is the maximum deceleration of both vehicles τ is the driver and system delay
od is a headway offset. Using the above the system has a graduated light display which displays green lights when (i.e. safe driving conditions), an increasing number of yellow lights for a<w<1 (where a is the audio warning which increases as w decreases). In this condition the actual vehicle spacing (d) is higher than the
braking critical distance ( ). For the condition 0<w<a, red lights are
displayed and an audio warning sounded. If the driver has still not reacted and w<0 (i.e. the actual vehicle spacing and brake critical distance are equal) the system will begin applying brakes.
1>w
brd
In addition to the above parameters, Seiler introduces friction and driver scaling parameters to his proposed algorithm. The friction scaling factors are a function of estimated friction coefficients. The driver scaling is based on a personalised algorithm that uses driver settings of braking and warning distance as input via controls on the dashboard.
Dutch evaluation of Chauffeur Assistant 14

During testing Seiler used the following values for the various input parameters:
humτ = 1 s
sysτ = 0.2 s (assumed)
α =6 m/s2
do = 5 m The results of the computer simulations showed that the modified algorithm gave a more realistic result, especially compared to the Mazda algorithm which attempts to avoid all collisions. A more realistic approach is to use an algorithm that has both a conservative and a non-conservative brake warning distance incorporated into it. Based on the modifications Seiler conducted simulations of a single test case to compare the modified algorithm to the Honda algorithm. In the test case the lead vehicle and the following CA vehicle travel at 27,8 m/s with a gap of 50 metres. The lead car suddenly decelerates at 6 m/s2. Assuming a relatively inattentive driver, the CA vehicle maintains its speed (i.e. the driver is taken out of the loop). Using a specific tyre model two road surface conditions were assessed in the test. The results of the simulation revealed that the Honda algorithm begins applying brakes earlier than the modified algorithm. In this scenario this means that the impact velocity of the system using the modified algorithm is higher (11,5 m/s) than that of the Honda system (3,9 m/s). However, this scenario is unrealistic in that the driver takes no part in process whereas in reality the driver would react to the various warnings at some point in time. The question remains at which point in time. With the Honda model the following distance is allowed to close to about 30 m before the system actively begins decelerating (this is some 3,7 seconds after the lead vehicle begins braking). With the modified system the driver is continually receiving warning but the system only actively engages braking when the feedback allows the gap to shrink to some 20,8m (4,0s since start – 3,9s plus 0,1s system delay). In situations with high traffic volumes and relatively high speeds, small gaps such as these would most certainly be observed in the traffic stream. Under these circumstance drivers can generally react in time to avoid an incident From the tests of Seiler it is evident that careful consideration must be given to selecting parameters that give an optimal result in warning the driver before actively initiating braking. Systems such as that using the Mazda algorithm tend to initiate braking almost as soon as the lead vehicle begins decelerating. The Honda system allows a period of time to pass during which the driver can initiate certain actions. Failing this the system will initiate braking once the time period has expired. The modified Seiler algorithm refines the Honda method by introducing a graduated light warning system combined with an audio system to warn the driver as to the extent of the danger. Only when the driver fails to react after the vehicle spacing and the brake critical distance are equal does the system apply braking. Further research with respect to driver reaction and acceptance of this type of system is needed before definitive choices are made. Systems that are perceived by drivers to warn or brake too early will inevitably be deactivated whereas systems that are late in warning or braking may result in higher collision speeds (and therefore injury). Effect of ACC penetration rates on road capacity Van der Werf et. al. (2002) studied the effect of ACC market penetration on roadway capacity. Their study was based on simulations using Monte Carlo simulations and assuming market penetrations ranging from 0 to 100% for various mixes of vehicles with manual control, autonomous automatic cruise control (AACC) and co-operative automatic cruise control (CACC). Manual control vehicles were based on so called normal driver characteristics using state of the art models of car following behaviour.
Dutch evaluation of Chauffeur Assistant 15

AACC vehicles were controlled by simple although high performance AACC systems using a driver selected time gap of 1,4 seconds. This system was chosen to represent the first generation of such systems which typically allow gap settings of between 1 and 2 seconds. The systems could accelerate and decelerate (up to a maximum of 0,3g) but required the driver to intervene in emergency situations. Vehicles equipped with advanced CACC systems which used vehicle-to-vehicle communications to allow time gaps of 0,5 second between consecutive vehicles. In Van der Werfs’ study the CACC vehicles represented advanced systems which could monitor various aspects of the leading vehicle (eg. Speed, acceleration, state of the CACC system if present etc.). The shorter time gap was possible due to the fact that the CACC vehicles could react faster to prevailing conditions. Van der Werf opted to simulate a variety of penetration scenario’s beginning with 100% of vehicles being manually driven, then 100% being AACC-equipped and then 100% being CACC-equipped. Subsequently, scenarios were simulated where the degree of penetration was mixed among the three types, always in multiples of 20 and ranging from 0 to 100%. This study concluded that autonomous automatic cruise control systems would only have a marginal effect on highway capacity. Based on an average gap of 1,4 seconds and a market penetration of 20 to 60%, it was estimated that capacity would increase by no more than 7%. An interesting result is that the effect of the degree of penetration on capacity is the greatest with penetration between 0 to 20%. At penetration levels of 20 to 40% the effect on capacity diminishes and above 40% there was no effect on capacity found. Van der Werf found that at levels above 60% penetration, highway capacity may marginally decrease. This is not unexpected especially since the 1,4 second gap is quite large when compared to typical gap distributions of normal highway traffic. Due to the marginal effect on capacity the authors conclude that there is no justification for providing dedicated lanes for vehicles equipped with AACC. In fact, they recommend that these vehicles be distributed over all lanes, the reason being that AACC equipped vehicles appeared to reduce the negative effects of shock waves in the traffic stream. The more advanced CACC system was found to have a significant positive effect on highway capacity. They found that, when compared to the reference capacity, there was a quadratic increase in capacity with increased market penetration (largely due to the smaller time gaps between pairs of vehicles equipped with CACC). This study found that the effect on capacity was extremely sensitive to the degree of penetration and only at high levels of penetration can the full benefits be attained. Also at these high levels consideration of dedicated lanes was recommended. This study revealed that a dedicated CACC lane would have a capacity of around 4 200 vehicles per hour. In contrast, without CACC the capacity is typically around 2 200 pcu/h. Impacts of headway strategy on capacity Levinson and Zou (2002) conducted an evaluation of the impacts of two ACC strategies on roadway capacity and throughput. The ACC strategies evaluated were an ACC system based on a Constant Time Headway (CTH) algorithm and a system based on a Variable Time Headway (VTH) algorithm. The microscopic simulation model used in this study was consciously based a single lane highway section since the authors were of the opinion that lane changing behaviour was too complicated to describe in a model. They opted for simulating three scenarios, namely no ACC traffic (all vehicles on the road were controlled by the Gipps car following model); mixed traffic (certain mixes of ACC vehicle and normal vehicles); and finally all vehicles equipped with ACC. In all cases drivers preset the headway and desired speed (this is limited by the
Dutch evaluation of Chauffeur Assistant 16

maximum speed limit) and the automated system takes over the longitudinal control of the vehicle. The results of the simulation revealed that under the same traffic demand the variant with VTH traffic had higher space mean speed than did the variant with CTH traffic. Interestingly this was not the case where there was 100% penetration of either system. Speed variation of mixed traffic was higher than traffic with exclusively ACC or with no ACC. The variation is at its greatest at extremely high (95%) and extremely low (5%) levels of penetration. The authors furthermore examined the state of traffic flow if disturbances were introduced. By suddenly increasing traffic demand over a short period in the simulation an unstable situation could be created. From these simulations it became evident that the system stabilised faster with high proportions of VTH vehicles than was the case with the same proportion of CTH vehicles. Also the change in speed was less at high penetrations of VTH vehicles. The results of the simulations need to be interpreted with some caution since the authors indicate that this work is exploratory and based on many assumptions. Nevertheless it does provide insight into combinations of traffic mixes and the potential effects of different penetration levels. A paper by Darbha and Rajagopal (1998) describes the effects of a constant time headway ICC system on traffic flow. They found that traffic flow became unstable when all vehicles in the traffic stream were equipped with a CTH system. They conclude that the stability of the traffic flow is dependent on vehicle following control laws and the spacing policy employed by the control system. In a MIXIC simulation study of autonomous intelligent cruise control (AICC) by van Arem et. al (1996), the authors found that current AICC prototypes with headways of around 1,5 seconds could be introduced to the market provided penetration levels remained low (less than 20%). If these levels can be maintained the effect on traffic performance is minimal. However, at higher penetration levels the effect becomes negative and shorter target headways will be essential. 3.1.2 User acceptance A study conducted on behalf of the US Department of Transport by Charles River Associates examined user acceptance of in vehicle crash avoidance system (CRA, January 1998). The study was based on gathering opinions in a series of discussion groups that were generally stratified according to different types of user (older drivers, women only, etc.). The study was explorative and the results were indicative rather than representative of larger populations. Nevertheless the study revealed some interesting results, notably:
• The decision to purchase a vehicle is predominantly influenced by previous experience (own or family/friends) with the make or model of the vehicle; test-drives and visits to dealers; and finally consumer reports.
• Although respondents agreed that a number of factors such as bad weather and heavy traffic made driving stressful, these did not materially influence their choice of vehicle. Vehicle safety as a whole was important although this was not related to actual driving experiences.
• The majority of drivers were positive towards new safety concepts such as driver warning systems. Older drivers appeared to be more in favour of these concepts since these were perceived to aid their declining driving skills. Women on the whole were more safety conscious than men although they were more sceptical of new technology. The majority of respondents indicated that the wide scale implementation of these devices and concepts would have major
Dutch evaluation of Chauffeur Assistant 17

safety effects (airbags were used as a reference). The issue regarding compensating behaviour was also raised.
• A critical element of consumer acceptance was that integrated warning systems (comprising a number of different technologies and concepts) were combined in such a fashion that they present a clear and unambiguous message to drivers. If such systems are not effectively integrated could imply an array of light and audio warnings that would result in driver distraction.
• Collision avoidance systems were generally favourable accepted although respondents indicated that the type of warning signal was important, as was system reliability. The different type of warning systems constituting a CAS appeared to be easily understood by the respondents. The most popular CAS was a system that could detect objects to the rear (especially among older drivers who felt that this would assist in parking). Side object detection was next favourite followed by front collision warning and lane departure warning (run-off road).
• Drowsy-driver systems were well received by particularly people who had at some time or other experienced being drowsy while driving or who knew of someone that had had an accident as a result. Although positive, respondents were concerned about the reliability of such a system. Also the manner of detection (contact pad on the body, camera, eye movement etc.) was a point of concern.
• Adaptive Cruise Control (ACC) was not all that favourably received by respondents. This perception is closely linked to the experience of respondents with current, older versions of cruise control that are not often used by them. In addition there appears to be a degree of reluctance with respect to surrendering a degree of control over the vehicle. The effectiveness of the sensing and control functions of ACC was considered important. The smoothness and predictability of the vehicle’s response to lane changes and/or sudden stops was a further concern. Respondents indicated that such systems would be used primarily during long trips and at night (similar to how cruise control is currently used).
• The somewhat negative perception with respect to ACC was possibly affected by a lack of knowledge and understanding of such systems. Road users who have experience with such systems were reported to be favourable of the technology. The authors of this study suggest that marketing and public information campaigns will have to be developed and run to overcome this initial reluctance. Hands-on experience with such systems is also a powerful means to promote ACC type systems.
• Vision enhancement systems were presented and discussed among older road users only. Older respondents had indicated that their vision was declining, and thereby negatively affecting their driving skills. Consequently this group of respondents were positive toward systems that made improvements to windshields and that enhanced lighting.
Dutch evaluation of Chauffeur Assistant 18

3.2 Europe
3.2.1 Effects of CAS and ACC A study into the Deployment of Interurban ATT Test Scenarios (TRG – Univ. of Southampton, April 1999 and May 1999) aimed at:
- Identifying implementation alternatives for co-operative ATT systems
- Developing scenarios for potential impacts of these systems, and - Identifying key elements for the deployment of these measures.
Using various microscopic simulation models incorporating ACC algorithms and driver/vehicle models, the impact of ACC systems on roadway capacity was assessed. This study found that ACC would have a negligible impact in the short term (based on penetration rates of 10 to 20%). However, a stated-preference study revealed that there is a high level of consumer interest and should prices of the systems drastically be reduced, penetration levels of 50% could be possible. An interim study report (Deployment of Interurban ATT Test Scenarios, DIATS, Deliverable 10-12, 1998) found that ACC effects were dependent on the difference between target headways and the modal value of existing headway distributions. If the target headways were shorter than the modal then there was an increase in the proportion of short headways and shorter time to collision (TTC). If the target value was increased the proportion of small headways and TTC decreased. The introduction of ACC vehicles in the traffic stream had very little influence on average journey times but there was variation between the different simulation models. Those models that were based on the more conservative type system (which aim to prevent all accidents and therefore have severe braking and acceleration capabilities) have a higher proportion of small headway and TTC’s although they have less negative effect on traffic flow. ACC was found to positively support the longitudinal driving task with variations in acceleration being reduced by 46%. However studies in the UK and the US have revealed that drivers tend to switch the ACC off in situations with heavy traffic flows and many lane changes. It is in these situations that following headways are small and lane changes more difficult. Since the ACC minimum headway setting is (often) larger that these gaps, the occurrence of vehicles changing lanes into these larger gaps is high. Consequently when another vehicle accepts this gap, the ACC decelerates to increase the headway with the eventual result that the driver becomes irritated and switches the system off. As part of this study traffic flow was modelled under various conditions and with various proportions of ACC traffic. It was found that there is a relatively high chance that flow in the fast lane breaks down when there are ACC vehicles with time headways of more than 1,2 seconds. Capacity gains could be expected at smaller headways although this assumes that small gaps of around 1 second are unsuitable for lane changes. The simulation models used in these evaluations did not include algorithms for simulating lateral driver behaviour. The models used for lane changing are generally fixed rule-based models (i.e. the leading vehicle speed is lower/higher than the desired speed and there is a gap larger than the minimum gap in an adjacent stream). Consequently the incidence of shock waves appears to decrease as ACC headways decrease. The DIATS study questions the validity of these results and states that simulation has reached the extremes of what is realistic. It is recommended that lane change algorithms be introduced in these models and that these be validated with field data. Future generations of ACC will have to include some form lateral component to detect cut-in vehicles and to make these the new target vehicle (i.e. lead vehicle for headway setting and control).
Dutch evaluation of Chauffeur Assistant 19

At the time of publication of this work, the authors recommended that current minimum headway criteria on freeways be reviewed in the light of the potential that ACC systems offered. Microscopic Traffic simulation models The Dutch Ministry of Transport, Public Works and Water Management commissioned the development of microscopic simulation models to assess the effect of ITS applications on traffic safety, emission (noise and air) and traffic performance. This culminated in the development of the Microscopic model for Simulation of Intelligent Cruise control (MIXIC (van Arem, de Vos, and Vanderschuren, 1997)). MIXIC can be used to model traffic and vehicle performance on freeway links that forming scenarios in which the vehicles have some sort of intelligent cruise control. The model generates an extensive output that can then be further analysed using the various analysis modules. The MIXIC model makes use of driver and vehicle models with a number of algorithms to simulate driver and traffic behaviour. The driver model incorporates a lane change model (with provision for free and mandatory lane changes), a longitudinal driver model (incorporating a free driving model and a car following model) and finally a model to simulate driver interaction with the ACC. The vehicle model simulates the interaction between the driver and the road, taking into account ambient conditions. The traffic model feeds the vehicle model with data related to vehicle characteristics, road geometry and conditions and wind conditions. The vehicle model provides updates on vehicle accelerations to the microscopic traffic model that in turn calculates new vehicle speeds and position. Detailed descriptions of the MIXIC model can be found in the user manual (van Arem et. al. 1997). The MIXIC model has been validated in the Netherlands and has been used in a number of traffic flow studies including evaluations into the effects of ACC, the introduction of dynamic cross-sections with narrow lanes etc (van Arem et. al; Tampere, C.). Also these studies found that the capacity effects of ACC vehicles in the traffic stream would be marginally positive. Minderhoud and Bovy (1999) concluded that models such as MIXIC and FOSIM lacked certain properties needed for accurate capacity estimates. Based on this deduction they developed a model that included the following characteristics. It has the ability to:
- represent normal manually-controlled vehicles as well as vehicles with forms of intelligent longitudinal support
- model stochastic elements of driver behaviour - accommodate separate control of time delays; perception intervals
and vehicle following characteristics - model freeway sections; on and off ramps, weaving sections and
lane drops - model freeway congestion and queuing.
The model SIMONE was calibrated and validated on the basis of empirical data measured over a number of freeway sections in the Netherlands. The model was used to simulate a freeway section with an on-ramp and used reaction times of 0,3 seconds for AICC vehicles and 0,6 seconds for non-AICC vehicles. Four levels of AICC penetration, namely 10; 20; 50 and 100 percent were selected for 10 AICC design scenarios ranging from normal AICC design (a first generation “passive” driver support system) to a complete future AICC system (active with full braking capability). In all cases the authors considered that AICC systems would be installed in passenger cars.
Dutch evaluation of Chauffeur Assistant 20

The simulations revealed that headway settings had the largest effect on capacity and especially at penetration levels above 20%. Assuming a first generation AICC capacity gains of 4% are achievable with headway settings of 1 second (above 1.2 seconds there is no gain). At the other extreme (an active system with full braking capability) gains of 12% were estimated using headway settings of 0.8 seconds. Interestingly the simulations also revealed that first generation AICC systems will have a marginal effect on capacity at penetration levels of between 20 and 50%. Above or below these it was found that there was no significant effect. On the other hand, future active AICC systems show the most effect at penetration rates above 50% and using headway settings of 0,8 seconds. Algorithms for CAS Jansson et al. (2002) recognised two approaches in algorithms dealing with decision making in rear end collision avoidance systems, namely algorithms that attempt to avoid all collisions and algorithms that never make incorrect interventions (i.e. the CAS only intervenes when the theoretical probability of an accident is 1). Rather than basing their braking and warning algorithm on relative velocity and distance the authors use a probability function to calculate the risk of a collision. This method of computing collision risk using an algorithm has been proposed for use in military aircraft. Based on these algorithms a number of scenarios were simulated and eventually a prototype for field tests was developed. The prototype used laser radar sensing technology for object detection. The study concluded that further development work on sensor technology and sensor fusion was required to reduce the relatively high number of faulty interventions. Optimal performance could not be obtained due to :
- Measurement uncertainty (object recognition) - System response time (sensor measurement rate and
computational time) - Modelling errors.
Especially the sensor technologies (laser radar end millimetre radar) were unable to effectively recognise objects and especially so at lower speeds resulting in a relatively high number of incorrect interventions. Modelling and assessing perception with regards to AVG systems in Europe The COMUNICAR project is part of the larger Information Society Technology (IST) initiative funded by the European Union (Dibe, 2000). It has as its main goal the design, development and testing of in vehicle multimedia Human Machine Interfaces and more specifically those aimed at facilitating ADA deployment. The LACOS project that was funded within the 4th framework programme provided input to COMUNICAR with respect to lateral control systems. It aims at the development of microwave radar and CCD technology linked to an electronic control unit for processing the image data using specially developed algorithms. The HMI was based on an integrated audio visual and acoustic system. This system was further developed to include blind spot monitoring incorporating microwave radar detection. Within COMUNICAR extensive work was also done with respect to HMI’s for longitudinal support systems. As part of the state of the art review, the consortium (Dibe, 2000) indicated that independent evaluations of AICC rated the systems as “secure” although the systems evaluated had limitations with respect to detecting motorcyclists, cyclists and pedestrians. In addition the systems had problems following or detecting the lead vehicle (“target”) through tight curves. Also if objects/targets were outside the lane boundary the systems had problems detecting them. However, AICC led to more homogenous speeds, improved distance keeping and a large proportion (66%) of drivers would like such systems in their cars. On the downside, vehicles with AICC were observed to brake less in the vicinity of pedestrians, drivers were reliant on the system for warnings, many drivers perceived the reaction of the system as too slow, there
Dutch evaluation of Chauffeur Assistant 21

is a degree of information overload (the driver gets too many warnings/signals) and driving get more boring. 3.2.2 Scenarios Deliverable 7 of the EU Advisors programme examines a number of implementation scenarios for ADA systems (Bekiarie et al., Feb. 2003). It identifies three key actor groups, the users; the manufacturers and the authorities. Each of these groups is seen to have a major impact on the degree of implementation of ADA systems (depending on issues such as user willingness to pay through to issues such as regulating legislation). For each ADA system and sub-system the consortium developed a number of implementation scenarios. Each of the scenarios presents a functional and operational description; level of penetration and time frame; assumptions under which implementation occurs; an indication of the intended benefits and, in some cases potential hazards. On the basis of Multi-Criteria Analysis, 10 experts representing the Advisors consortium prioritised the various implementation scenarios. This process resulted in driver and third party safety receiving the highest criteria weighting. Other criteria such as traffic operations, network efficiency, environment, technical feasibility, costs etc. were also considered. The integrated ADA system (incorporating ACC, Stop and Go, extended navigation and ISA) scenario was awarded the highest overall score, followed by two driver monitoring system scenarios and then an ISA scenario. The lane keeping scenarios did not score highly. Consequently a number of implementation strategies were designed around ACC, ISA, Driver Monitoring (DM) and the Integrated ADA systems. Depending on the stage of product life cycle development, governments can take measures to facilitate, curtail or even prevent implementation. The Advisors project considers that this intervention is best during the invention or between the R&D and market introduction phases. The types of measures that Governments can take are:
• Structural changes to legislation, regulation (e.g. taxes) • Technology R&D, trials and experiments • Compatibility Standardisation to ensure compatibility between
systems or to prevent/complicate market introduction • Cultural Policy can have a role in influencing attitudes • Institutional These include issues that stimulate co-operation
between organisations (governmental, private etc.) in order to implement complex projects or concepts (I.e. multimodal transport, Travel demand management etc.).
The Advisors project makes various recommendations regarding type approvals and standardisation. The most significant of these is that some form of functional specification and standardisation for type approval should be introduced for ADA systems. To this end an expert panel or group should be established within the EU structures to develop what is termed a Statement of Principles. In addition recommendations regarding the development of process standards, basic and supporting research, definitions, standardisation activities, CEN standards and type approvals are made. The most likely scenario emerging from this evaluation is one where ADA systems will be implemented autonomously by industry. However, government has a role as watchdog and must ensure that vehicle type approvals include ADA systems. Also governments may help implementation by providing training to drivers and by stimulating development by participating in Research and Development through pilot projects. The time frame for integrated ADA systems to penetrate the market is long term and was not anticipated to occur
Dutch evaluation of Chauffeur Assistant 22

before 2021. However, components of an integrated system may well penetrate the market by 2009. According to the Stardust project (Deliverable 1, 5th FWP, 2000), ACC with Stop and Go functionality will be deployed between 2003 and 2015 in Europe, the USA and Japan. Lane departure warning systems are, according to this study, currently available for the truck market in the USA and for cars in Japan. Lane keeping systems were also deemed to market available for buses in Europe and for cars in Japan. Fully automated driving is not expected to be realised in the short term and will initially be deployed in niche markets.
Dutch evaluation of Chauffeur Assistant 23

Dutch evaluation of Chauffeur Assistant 24
4 Modelling DECA Implementation
………………………………………………………………………………………………………………………………… 4.1 Background
The research framework for the Dutch Field Operational Tests (AVV, 2001) outlines the proposed methodology to evaluate effects of implementing Chauffeur Assistant in the Netherlands. This evaluation is called “Dutch Evaluation of Chauffeur Assistant”, or “DECA”. Due to a number of constraining factors the proposed methodology was adapted to concentrate on potential effects on capacity and traffic flow. Consequently the main objective was: To assess the primary and secondary impacts of (DE)CA implementation on traffic flow and especially on throughput. The Research Framework anticipated that the effects on traffic flow would be estimated on the basis of primarily literature research followed by the development of implementation scenarios and finally on the outcomes of various microscopic traffic simulations. Since (DE)CA is a new concept, subsequent behavioural and vehicle models will need to be developed which describe the driving behaviour in traffic with CA, for example, lane changing behaviour and following behaviour may be different with and without the CA. These models need to be developed, calibrated and validated on the basis on experiments in a mock up truck simulator equipped with a state-of-the-art DECA system. These models would need to be incorporated into a traffic simulation model that would be used to model the various implementation scenarios under the chosen road and traffic conditions. Subsequently, the information gained from the truck simulations were incorporated into the traffic simulation model MIXIC. Figure 4.1: Relationship between driving simulator and traffic simulation
Detailed CA specs
DECWP1: Literature study, Scenario’s
WP4: Incorporate CA in MIXIC Acceptance test
WP6: Bulk runs + analyses
WP7: Final report
WP3: Behaviour with CA
D. simulator–MIXIC
WP5: Draft report
AVV Inr T DCLegend:
Vehicle model and Specify CA
WP2: Modify controllers, simulation models
WT

4.1.1 Selection of an appropriate model Currently there are only a few traffic flow models available for simulating individual vehicles behaviour in a traffic stream (the so-called sub-microscopic simulation models). Not all these models have the capability of simulating intelligent vehicle control (such as ACC or Stop and Go). For the purpose of this evaluation it was necessary to select a microscopic model incorporating both vehicle and driver models with the capability of modelling longitudinal and lateral driving behaviour in a traffic stream. Ideally the model should have been previously applied (validated and calibrated) in the Netherlands. In the Netherlands the models Simone (Minderhoud, 1999) and MIXIC (van Arem et al, 1997) have been the most extensively used for modelling the impacts of ADA systems and other ITS applications. Both models take account of the vehicle, the driver and the environment. The model Simone was developed as part of a post-graduate study at the University of Delft (Minderhoud, 1999) in which the impact of ADA type systems on motorway traffic operations were studied. MIXIC (Microscopic model for Simulation of Intelligent Cruise Control) was developed by TNO for the Dutch Ministry of Transport, Public Works and Water Management. The model simulates vehicle and traffic behaviour on motorways and in an environment where ITS Technologies such as ICC/ACC are deployed. Based on the broad objectives of the study it was decided to use the MIXIC model to simulate the various scenarios describing the implementation of Chauffeur Assistant in the Netherlands (Appendix A) . A prime consideration in the selection of the model was the ability to simulate lane changing behaviour in combination with ICC/ACC operation. Although MIXIC did not have this capability it was decided to further develop the model to incorporate this behaviour. To facilitate this, the TNO Human Factors was commissioned to use their driving simulator to research the various behavioural parameters required to adapt MIXIC. The results presented in the sections 4.1.2 to section 4.4, describing the modified driving behaviour and the subsequent driver model changes, are based on this work (Hogema, July 2003; Hogema, September 2003; van Katwijk, September 2003). 4.1.2 Adapting MIXIC to accommodate Chauffeur Assistant The Chauffeur Assistant system described by deliverable D1 of Promote Chauffeur 2 (Brandenburg et al., 2000) incorporates a combined ACC and LKS. Considering that development of the systems is barely at the prototype stage implies that the traffic flow effects can only be estimated on the basis of traffic flow simulation. However the MIXIC model had to be further developed to incorporate the LKS functionality into the normal lane change behaviour. To define the different values of the parameters used by the vehicle and driver modules incorporated in MIXIC required further behavioural research using a driving simulator equipped with a Chauffeur Assistant system. Once these parameters were defined and incorporated into the model, the model could be tested and validated against the results obtained from the simulator. Section 4.2 will present an overview of these changes. 4.2 The driving simulator study: The effects of CA on driving behaviour
TNO Human Factors developed a moving base truck simulator (Hogema, Hoekstra, Verschuren, 2003) that was used to determine the effects of CA on driving behaviour. The simulator uses a mock-up based on a DAF 95XF rigid truck cabin mounted on a moving base (Figure 4.1). The controls in the cabin are standard and incorporate a fully functional CA system. A computer model calculates the motion of the simulated truck through the world, based on the
Dutch evaluation of Chauffeur Assistant 25

input of the driver. The simulator incorporates image and sound projection coupled to various computers. A supervisor computer controls traffic and other functions.
Figure 4.2 : TNO Truck driving simulator (Picture courtesy of TNO Human Factors, Soesterberg, Netherlands) To enable ACC operation the simulator was fitted with an automatic transmission. The ACC controller was based on that implemented in the MIXIC model (van Arem et. al., 1995) and based on the following: Car following distance Dref = 6.0 +tk x V Where Dref = Intended ACC following distance (m) V = current speed (m/s) tk = following time (selectable at 1.0; 1.3 or 1.6 seconds) The maximum deceleration applied by the ACC was 3.0 m/s2. To demonstrate the validity of the simulator outputs, five scenarios were run and compared to the MIXIC reference model (Hogema, September 2003). The reference model of MIXIC refers to the model used in previous studies. The lateral and longitudinal control modules of this model were modified using the results obtained from the driving simulator. These scenarios comparing the simulator ACC outputs with the outputs of the original MIXIC reference model are shown in Table 4.1.
Dutch evaluation of Chauffeur Assistant 26

Table 4.1 : Model validation scenario’s Number Description Initial condition Event description 1 Approaching Vl0=50km/h
Vf0=80km/h Vref=80km/h D0=200m
2 Accelerating Vl0=50km/h Vf0=50km/h Vref=120km/h D0=Dref
At t=3s, leading vehicle accelerates at constant acceleration of 0.2m/s2 up to 75km/h
3 Cut in Vl0=80km/h Vf0=80km/h Vref=120km/h D0=Dref
The distance between following and lead vehicle halves at t=3s
4 Decelerating Vl0=80km/h Vf0=80km/h Vref=120km/h D0=Dref
At t=3s, lead vehicle decelerates with constant deceleration of 3 m/s2 till 50km/h is reached
5 Pulling away Vl0=50km/h Vf0=50km/h Vref=75km/h D0=Dref
At t=3s, leading vehicle accelerates at constant acceleration of 0.2m/s2 and continues doing so
Vl0 = speed of lead vehicle at t=0 Vf0 = speed of following vehicle (equipped with ACC) at t=0 D0 = following distance at t=0 Dref = desired ACC following distance Vref = Desired ACC speed The results obtained with ACC operating in the driving simulator under the above scenarios showed a high degree of similarity to those obtained from the reference model (Appendix B). The Lane Keeping System (LKS) in the driving simulator was based on information obtained from Daimler-Chrysler In terms of the functionality and performance of their CA. The LKS was based on a straight lane design (Hogema and Burry, 2002) and modified to incorporate lane keeping (without offsets) in corners. The vehicle model of the simulator receives steering wheel inputs from the LKS when the CA is active. Noise was introduced to ensure that lateral control performance was realistic. The noise level was adjusted to actual driving speed so that the standard deviation of the lateral position (SDLP) was at a user defined level. Off line tests with a reference SDLP value of 10cm showed that the realised SDLP was also 10cm and that the amplitudes were within the range specified by Daimler-Chrysler. In practice the use of the CA system is voluntary and can be activated via a switch on the steering column. The CA system tested in this study had the ACC and LKS operating together and the driver could not activate the one without the other. In addition to using the on/off switch for engaging/disengaging the system, the CA is also deactivated when applying the brakes or turn indicators. When activated the CA dashboard display shows the ACC set speed and an indication of the ACC state (speed or headway control). The CA emits an audio warning when the maximum acceleration of the ACC is reached.
Dutch evaluation of Chauffeur Assistant 27
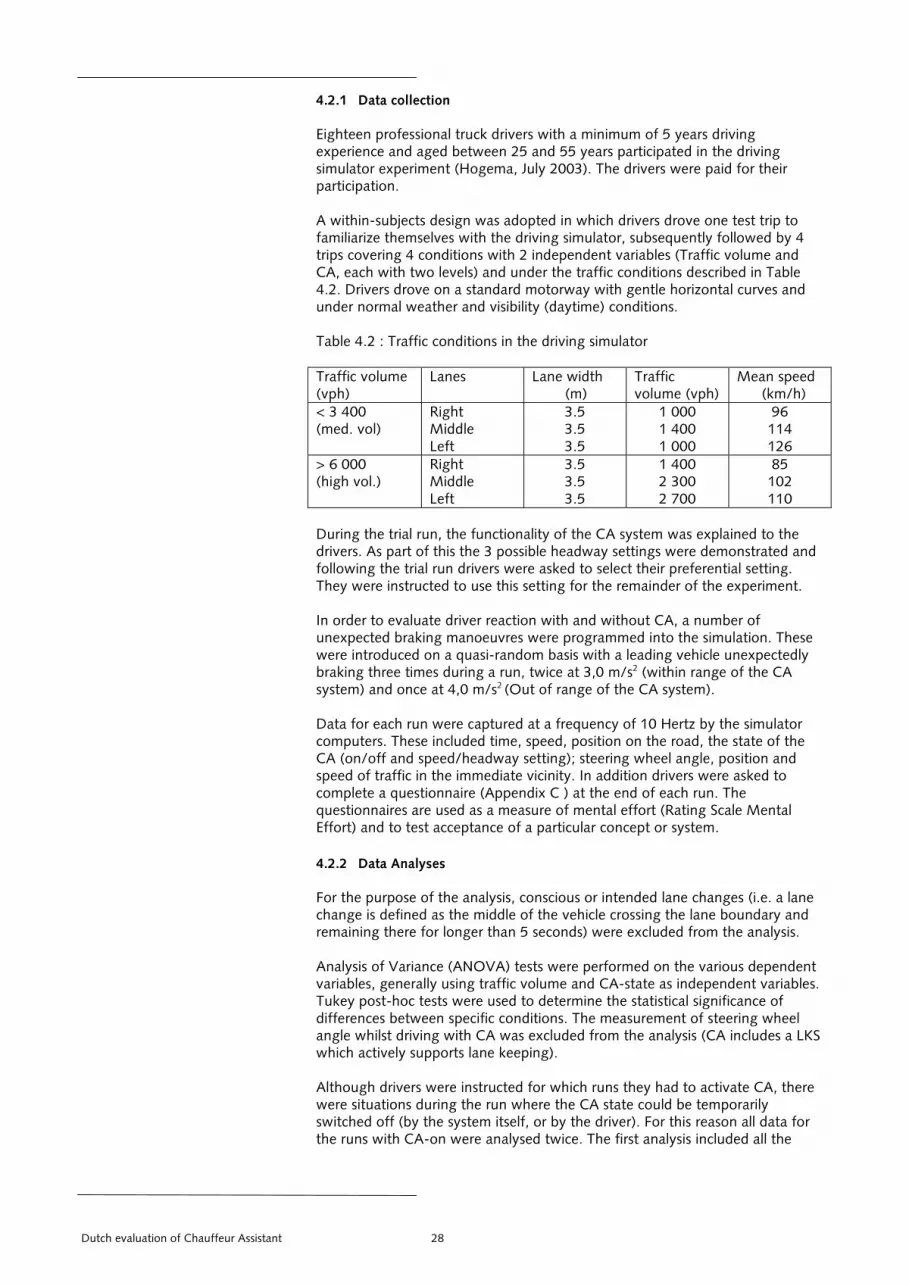
4.2.1 Data collection Eighteen professional truck drivers with a minimum of 5 years driving experience and aged between 25 and 55 years participated in the driving simulator experiment (Hogema, July 2003). The drivers were paid for their participation. A within-subjects design was adopted in which drivers drove one test trip to familiarize themselves with the driving simulator, subsequently followed by 4 trips covering 4 conditions with 2 independent variables (Traffic volume and CA, each with two levels) and under the traffic conditions described in Table 4.2. Drivers drove on a standard motorway with gentle horizontal curves and under normal weather and visibility (daytime) conditions. Table 4.2 : Traffic conditions in the driving simulator Traffic volume (vph)
Lanes Lane width (m)
Traffic volume (vph)
Mean speed (km/h)
< 3 400 (med. vol)
Right Middle Left
3.5 3.5 3.5
1 000 1 400 1 000
96 114 126
> 6 000(high vol.)
Right Middle Left
3.5 3.5 3.5
1 400 2 300 2 700
85 102 110
During the trial run, the functionality of the CA system was explained to the drivers. As part of this the 3 possible headway settings were demonstrated and following the trial run drivers were asked to select their preferential setting. They were instructed to use this setting for the remainder of the experiment. In order to evaluate driver reaction with and without CA, a number of unexpected braking manoeuvres were programmed into the simulation. These were introduced on a quasi-random basis with a leading vehicle unexpectedly braking three times during a run, twice at 3,0 m/s2 (within range of the CA system) and once at 4,0 m/s2 (Out of range of the CA system). Data for each run were captured at a frequency of 10 Hertz by the simulator computers. These included time, speed, position on the road, the state of the CA (on/off and speed/headway setting); steering wheel angle, position and speed of traffic in the immediate vicinity. In addition drivers were asked to complete a questionnaire (Appendix C ) at the end of each run. The questionnaires are used as a measure of mental effort (Rating Scale Mental Effort) and to test acceptance of a particular concept or system. 4.2.2 Data Analyses For the purpose of the analysis, conscious or intended lane changes (i.e. a lane change is defined as the middle of the vehicle crossing the lane boundary and remaining there for longer than 5 seconds) were excluded from the analysis. Analysis of Variance (ANOVA) tests were performed on the various dependent variables, generally using traffic volume and CA-state as independent variables. Tukey post-hoc tests were used to determine the statistical significance of differences between specific conditions. The measurement of steering wheel angle whilst driving with CA was excluded from the analysis (CA includes a LKS which actively supports lane keeping). Although drivers were instructed for which runs they had to activate CA, there were situations during the run where the CA state could be temporarily switched off (by the system itself, or by the driver). For this reason all data for the runs with CA-on were analysed twice. The first analysis included all the
Dutch evaluation of Chauffeur Assistant 28

data for these runs and the second analysis excluded those data where the CA had been de-activated. 4.2.3 Results Use and choice of headway settings For the condition where the CA was on during the run it was active for 84 percent of the time when traffic volumes were low (<3400vph) and 87 percent of the time when traffic volumes were high (>6000vph). During the times that CA was on the majority of drivers opted for time headway settings (controlling following distance) of 1,3 and 1,6 seconds (Table 4.3). Table 4.3 : Headway settings
Drivers ACC Headway setting (seconds) Number Percentage
1,0 1,3 1,6
1 8 9
5,6 44,4 50,0
Total 18 100 The average speeds recorded with vehicles where the CA was switched off, irrespective of volume were, around 81,3km/h. With the CA on the average speed ranged between 81,9 (low volume) and 80,5 km/h (high volume). The interaction between traffic volume and CA-state had no significant effect on average speeds. The standard deviations of speed (a measure of acceleration noise) at both low and high traffic volumes were slightly smaller with the CA-state on than with the CA-state off. However, these differences are not significant nor are they affected by the interaction between traffic volume and CA-state. The analysis revealed that the percentage of the trip time spent in the right lane was affected by the interaction between traffic volume and CA on (more time is spent in the right hand lane with the CA on than with the CA off). This effect is more pronounced at lower volumes. Traffic volume has a significant effect on this behaviour. However, the mean number of lane changes per trip was not materially affected by traffic volume. As expected (CA incorporates a LKS), the average number of lane changes with CA on was lower than with CA off at the same levels of traffic flow. There was no significant effect on the number of lane changes resulting from interactions between the independent variables. Mean lateral position One would expect vehicles with CA to drive more in the centre of a lane than vehicles without. In this analysis the lateral position was measured from the edge of the right lane to the right hand side of the vehicle. A value of 0,5m would constitute driving in the centre of the lane (0,5 clearance right + 2,5m vehicle width + 0,5 clearance left = 3,5m lane width). Although the differences are marginal (and not significant), the CA on state resulted in the vehicle travelling more to the centre of the lane and irrespective of the traffic volume (Table 4.4). At high volume and with the CA active, drivers drove more to the centre of the lane.
Dutch evaluation of Chauffeur Assistant 29

Table 4.4 Mean lateral position
Independent variable Traffic volume
(vph) CA state
Mean lateral Position (meas. from right edge)
(cm) 3400 3400 6000 6000
Off On Off On
23,4 24,5 22,8
30,98 F(1,17) = 0,62; p<0,385 Standard Deviation of the lateral position (SDLP) The standard deviation of the lateral position (SDLP) is an indication of the effort it takes a driver to maintain a straight line within a lane and over a distance travelled. In this evaluation SDLP was significantly reduced with CA on when compared to the situation with CA off and keeping traffic volumes constant (drivers swerve less with the CA on). There was also a noticeable effect between low and high traffic volumes (Table 4.5). Table 4.5 Standard deviation of lateral position
Independent variable Traffic volume
(vph) CA state
Standard deviation (cm)
3400 3400 6000 6000
Off On Off On
34,9 12,4 36,3 12,6
F(1,17) = 7,38; p<0,0146 The analysis of standard deviation revealed that the values of the standard deviation of lateral position, especially with the CA off, were higher than one would normally expect on relatively standard cross-sections. A number of possibilities may explain this behaviour:
1) The size of the mock-up cabin in the simulator environment could have played a role;
2) Driving in a simulator could require more effort than in a normal road situation resulting in a higher SDLP;
3) A number of parameters used in the lateral vehicle model (mass, moment of inertia, wheelbase etc etc.) collectively determine the relation between the driver input (steering wheel angle) and the vehicle response (yaw rate). The values of these parameters were provided by DAF. In retrospect, the dynamic behaviour of the model was somewhat too sluggish. This resulted in the vehicle reacting more slowly than normal on steering input and consequently the lateral movement was more pronounced.
Time to line crossing Time to line crossing (TLC) is used as an indicator of traffic risk (Brouwer and de Ridder, 2003). The TLC is an indication of the theoretical time it would take the vehicle (assuming no change in course or speed) to cross the line marking. Should a vehicle travel parallel to the line the value of TLC is infinite whereas it continually decreases the closer the vehicle gets without any corrective action. TLC’s below 1 second are considered a high risk. The time to line crossing was determined by: TLC = D/Vlat
Where D is the distance to the line (m) and Vlat is the lateral velocity (m/s) TLC’s (left edge marking) were analysed on the basis of the average of all TLC’s below 10 seconds (Table 4.6) and also on the proportion of these times
Dutch evaluation of Chauffeur Assistant 30

where the TLC’s were below 1 second (Table 4.7). The average value of minimum TLC was dependent on the state of the CA at both volume regimes. It is evident that the value of minimum TLC is significantly higher when the CA is active (See Appendix D for detailed analyses). Traffic volume has no significant effect on the value of minimum TLC. Table 4.6 Average value of TLC minima (left) below 10 seconds
Independent variable Traffic volume
(vph) CA state
Average minimum TLC (left) (s)
3400 3400 6000 6000
Off On Off On
2,47 3,51 2,32 3,36
F(1,17) = 0,00; p<0,9622 Traffic volume and CA state had no significant effect on the proportion of time where the TLC was below 1 second (Table 4.7). Typically one third of the minimum TLC’s (<10 seconds) were smaller than 1 second and there were marginal differences between conditions. Table 4.7 Proportion of TLC’s (left) less than 1 second
Independent variable Traffic volume
(vph) CA state
Time TLC(left) < 1 sec (%)
3400 3400 6000 6000
Off On Off On
34,4 33,9 34,9 29,6
F(1,17) = 0,38; p<0,5477 Mean headway An analysis of the amount of time spent travelling at headways of less than 5 seconds revealed no significant effects resulting from either traffic volume or CA-state (Table 4.8). An expected trend was evident at higher volumes with more time being spent driving at smaller headways. The effect of CA was marginal and not significant. Table 4.8: Proportion of trip time with headways less than 5 seconds
Independent variable Traffic volume
(vph) CA state
Prop. Time headway < 5 sec (%)
3400 3400 6000 6000
Off On Off On
58,9 60,0 65,8 69,0
F(1,17) = 0,08; p<0,7756 Seeing that CA uses fixed headway settings it would be reasonable to expect differences in the percentage of travel time spent at headways of equal to or less than 1 second (Table 4.9).
Dutch evaluation of Chauffeur Assistant 31

Table 4.9: Proportion of trip time with headways less than 1 second
Independent variable Traffic volume
(vph) CA state
Prop. Time headway ≤ 1 sec (%)
3400 3400 6000 6000
Off On Off On
2,49 0,50 4,50 0,68
F(1,17) = 1,47; p<0,2419 Considering that the headways of the CA in this experiment could not be set below 1 second it was expected that the proportion of time spent at headways smaller than this would be limited to occurrences where vehicles cut-in. The proportion of time spent at headways less than 1 second is significantly higher in conditions without CA. There also is a marked increase in this time at higher volumes and without CA. The mean headways calculated from the sample of conditions where vehicles were assumed to be following (i.e. headway < 5 seconds) revealed that there were no significant differences between the conditions. Neither traffic volume nor CA had a material effect on the average headways although there appeared to be a trend effect with higher volumes causing marginally lower average headways in cases in which CA was on (Table 4.10). Table 4.10: Average headway (all headways less than 5 sec.)
Independent variable Traffic volume
(vph) CA state
Avg. headway (s)
3400 3400 6000 6000
Off On Off On
2,91 2,86 2,75 2,59
F(1,17) = 0,47 ; p<0,5015 Braking Experiments During each run in the simulator, drivers were confronted with three separate and unexpected events in which the leading vehicle would brake. Two events with moderate braking (3,0m/s2 ) and one with extreme braking (4,0m/s2 ) were randomly introduced in each simulator run. The drivers had one of two options in these situations, either change lanes or brake. The above resulted in a total of 216 events where the lead vehicle unexpectedly braked. The events were evenly distributed over the two traffic volume regimes (see Appendix D for details). Six of these events were discarded because the scenarios were not correctly executed (Table 4.11). In 25% of these braking events (54 cases) drivers chose to change lanes. Of these 17 occurred while the CA was active. Of the cases where drivers decided not to change lanes, 58% were with the CA active. It would therefore appear that CA gives drivers more confidence in being able to avoid a situation without having to change lanes. Only 17% of the braking events with CA on result in a lane change whereas this proportion is double that for events with the CA off.
Dutch evaluation of Chauffeur Assistant 32

Table 4.11: Lanes changes resulting from lead vehicle braking
Braking resulting in (number of manoeuvres) Condition No lane change
Lane change Missed events
Total
Abs. % Abs. % Abs. % Abs. % CA Off 66 61% 37 34% 5 5% 108 100% CA On 90 83% 17 16% 1 1% 108 100% Total 156 72% 54 25% 6 3% 216 100% With respect to the degree of braking and disregarding CA state (on or off), a higher proportion of lane changes occurred when the lead vehicle braked hard (35% - Table 4.12). Some 20% of drivers following a vehicle that brakes moderately change lanes. Table 4.12: Lanes changes forced by moderate to violent braking
Braking resulting in (number of manoeuvres) Degree of braking No lane
change Lane change Missed
events Total
Moderate 101 26 0 127 Hard 43 24 0 67 Missed events 12 4 6 22 Total 156 54 6 216 The successfully conducted events in which no lane change took place (144 cases, the green-shaded cells in table 4.12) were further analysed to determine the potential safety risk in terms of the minimum time to collision and maximum deceleration criteria. Unfortunately a full factorial analysis of variance (ANOVA) was not possible due to the limited number of observations with complete sets of data. Consequently the following results are based on ANOVA’s of only the main effects: • The time to collision with the lead car braking moderately was significantly
larger than under hard braking conditions (5,3 vs. 4,3s - Table 4.13). • At the heavy traffic volume, a shorter TTC was evident. • The situation with the CA switched on had a longer time to collision than
when it was switched off (5,2 vs. 4,1s). Table 4.13: Minimum time to collision Condition Min. time to collision
(s) Significant effect * denotes yes
Moderate braking Hard braking
5,34 4,26
F (1,15) = 8,12* P<0,0122
Vol < 3400vph Vol < 6000vph
5,16 4,47
F(1,16) = 5,11* P<0,0381
CA off CA on
4,09 5,21
F(1,16) = 10,63* P<0,0049
With respect to maximum deceleration, there were no significant effects on deceleration rates resulting from high or low traffic volume or from CA use (Table 4.14). Interesting to note is that with the CA in the “On” state, the (average) maximum deceleration rate is lower than in the “Off” state. This could imply that drivers rely on the CA to initiate deceleration to the maximum CA level (3,0m/s2) before themselves braking and hence a less harsh braking action than with the CA off. This could have a positive effect on traffic flow.
Dutch evaluation of Chauffeur Assistant 33

Table 4.14: Effect on maximum deceleration Condition Max. deceleration
(m/s2) Significant effect * denotes yes
Moderate braking Hard braking
-3,47 -4,28
F (1,15) = 12,44* P<0,0031
Vol < 3400vph Vol < 6000vph
-3,73 -3,83
F(1,16) = 0.20 P<0,6587
CA off CA on
-4,30 -3,54
F(1,16) = 4,18 P<0,0578
Rating Scale Mental Effort Drivers participating in the experiment were asked to complete a rating form (Rating Scale Mental Effort – RSME) following each trip in the truck simulator. The form gives a subjective indication of the mental effort required to complete a task. The analysis shows that traffic volume does not affect the perceived mental effort whereas the state of the Chauffeur Assistant has an effect (Table 4.15). The subjective mental rating with the CA “On” is significantly less than with the CA “off”. This implies that the CA is perceived to make the driving task easier. Increased traffic volume marginally increased the perceived effort although by itself this is not significant. Table 4.15: Effect on maximum deceleration Condition Perceived mental effort
(0=no effort, 102 = extreme effort)
Significant effect * denotes yes
Low vol < 3400vph High vol < 6000vph
44,4 49,0
F (1,17) = 2,81 P<0,11
CA off CA on
58,1 35,2
F(1,17) = 14,6* P<0,001
Low volume CA Off Low volume CA On High volume CA Off High volume CA On
54,3 34,4 61,9 36,0
F (1,17) = 1,75; p < 0,20
The combination of traffic volume and CA-state has a marked effect on perceived effort (Table 4.15 and Appendix D). At both volume regimes, the perceived mental effort is significantly higher with the CA switched off and with drivers rating the task as fairly to reasonably strenuous. Drivers rated the degree of effort with the CA switched on as “slight” and that irrespective of traffic volume. This result is different to a recent simulator study with a Lane Departure Warning Assistant (LDWA) system (Brouwer and de Ridder, 2003). In this study respondents perceived the mental effort of driving with an LDWA system to be significantly higher than driving without an LDWA system. LDWA differs from CA in several ways: LDWA is simply a lane departure warning system, whereas CA has (1) ACC, (2) lane keeping and (3) integration of ACC and LK . This combination reduces the perceived effort. On the other hand one must be cautious in interpreting these results. Little is known of the behaviour that drivers may adopt to compensate for the reduced mental workload. These effects will need to be carefully assessed and understood before definitive conclusions can be drawn regarding positive or negative effects. 4.3 Changes to the MIXIC model
The driving simulator study formed the basis for the proposed changes that would need to be introduced in the MIXIC model. When reviewing the results of the driving simulator consideration had to be given to the functionality of both the CA and the original MIXIC model (Hogema, September 2003). Of importance was the interaction between the CA system and the driver model in MIXIC. In real life there is an interaction between the driver and the CA. The driver may choose to switch it off or to leave it on. However, when switched on the CA can be deactivated when the driver uses the turn indicator to change lanes or when he uses the brakes (voluntarily or as advised by the CA).
Dutch evaluation of Chauffeur Assistant 34

To be able to take account of these issues the driver model in MIXIC had to be adapted on the basis of a choice between essentially two options requiring the driver model to take over control when situations requiring hard braking occur. In the first case the driver model monitors the car following situation and when certain criteria regarding headway, speed etc. are met, the driver model takes over control from the CA. In the second the model takes over control after a certain reaction time and when the maximum CA deceleration is reached and the audio warning is sounded. The latter option is similar to the conservative control strategy discussed in chapter 2. 4.3.1 Driver model monitors car following characteristics With this option the driver model continuously monitors how the CA is controlling the car following situation. When a braking intervention takes place and the driver model detects that the braking action is inadequate it intervenes by taking over control. The current ACC model in MIXIC is based on the same principle. The ACC model in MIXIC combines two conditions that determine whether the driver model takes control, namely the ACC is braking at its maximum deceleration and the driver model would under the same conditions apply a higher rate of deceleration. In the model this is described by (van Arem et.al): If (a ≤ max dec. – C1) and (a – des. acc. > C2) then … Where a = actual deceleration (m/s2) max dec = ACC maximum deceleration (negative number in m/s2 ) des acc. = driver desired acceleration C1 and C2 = user specified thresholds (defaults are 0.1 and 0.5 m/s2 ) Where the ACC (following) vehicle approaches a much slower leading vehicle from a large distance, the above condition may not always result in the driver model disengaging the ACC control. As long as the leading vehicle remains out of the detection range of the ACC (with CA this is specified at 135m), the following vehicle will not decelerate. In real life however drivers noticing a much slower vehicle travelling ahead in their lane may (and in most cases will) slow down much sooner. In this situation the driver model in MIXIC was adapted to be able to emulate the condition where ACC control is disengaged based on the following equation:
).(max2
2
corrdecV
D diff
+−<
Where D = the current following distance (m) Vdiff = relative speed (m/s) Corr = correction factor (default is – 1,5 m/s2 ) 4.3.2 System alerts the driver model The MIXIC model was modified so that a warning (audible) is given the instant that the CA reached its maximum deceleration level. At this point the driver model deactivates the CA system and takes control of the vehicle (Hogema, September 2003). In an earlier version of MIXIC the warning was generated on the basis of a calculated braking distance (van Arem, et.al 1997). With this control scenario the driver model will always deactivate the CA when maximum deceleration is reached. In real life a driver will assess the situation and decide on whether intervention is necessary. Both the brake control scenarios rely heavily on the maximum deceleration rate of the CA system and
Dutch evaluation of Chauffeur Assistant 35

therefore it was decided to use the first strategy in preference to the strategy based on only warning. 4.3.3 Activating and deactivating CA For this study it was assumed that drivers would keep the system activated for almost all of the time (i.e. re-activate it after every lane change or hard braking action). In the MIXIC model a number of conditions had to be programmed to simulate this (van Katwijk, September 2003). The first is that a driver will not reactivate the system while rapidly accelerating or decelerating, a condition described in the model by: (-0,5<a<0,5 m/s2) where a is the current acceleration. A second situation where drivers are unlikely to reactivate the system is where the following vehicle despite having reached a stable (desired) speed, closes on the leading vehicle. In the model this condition for re-engaging the system is described by :
engagere
diff
aV
D−−
>2
2
where D = current following distance (m) Vdiff = relative speed (m/s) are-engage = constant (default of –1,0m/s2) Deactivating the CA system can occur by braking or by using the turn indicator to change lanes. In real life a driver requires a reaction time to activate the brake after having received some form of warning (from prevailing conditions or from a ADA system such as CA) that his intervention is required. In MIXIC control is handed over to the driver model once the car-following criteria for deactivating CA are met plus a reaction time. As far as lane changes are concerned, the driver model should take over control the instant that a turn signal is activated. In MIXIC the turn indicator signal is simulated by introducing a lane change delay. 4.3.4 Lane change behaviour The driver simulator study suggested that driving with CA reduced the number of lane changes although this effect was just below the level of statistical significance (Hogema, September 2003). The CA did not materially affect the amount of time driving in the right hand lane. This latter result is surprising in the light of previous research with ACC that indicated that the proportion of time in the left lane increases with ACC use (Saad and Villame, 1996; Törnros et. al 2002 – in Hogema, September 2003). The effect on lane changing frequency was not always reported but in one study these were reported to decrease with ACC use (Saad and Villame, 1996 – in Hogema, September 2003). These considerations need to be further examined in the future to determine the relevance for incorporating changes in lane change behaviour in the MIXIC model. These issues remain outside the scope of this study. 4.4 Traffic simulations with Chauffeur Assistant
As mentioned in chapter 3, the MIXIC traffic simulation model (Vanderschuren et. al) was selected to evaluate the traffic flow effects of implementing
Dutch evaluation of Chauffeur Assistant 36

Chauffeur Assistant in the Heavy Goods Vehicle (HGV) sector in the Netherlands. The HGV simulator study (Section 4.3) formed the basis for adapting certain parameters in the MIXIC model to better simulate lateral and longitudinal driving behaviour of HGV in a traffic stream. The ACC algorithm used in MIXIC was modified for CA. A more realistic lateral vehicle movement was incorporated, based on driving simulation test results described in section 4.3. This section will describe the parameters and values that were changed. For details on MIXIC the reader is referred to the literature and the user manuals (Van Arem et. al, 1997; Vanderschuren et. al. 1997; Tampére, 1999). Due to the relatively small differences between the ACC and CA algorithms , certain internal MIXIC parameters could be transferred to the input files, allowing the user to input user specific values. The vehicle dependent and independent parameters used by the simulation model are described in Table 4.16 and Table 4.17. For each parameter the ACC and CA algorithm input values are provided to highlight were changes were necessary. Table 4.16 : Changes to the ACC and CA input parameters in MIXIC : vehicle-Independent parameters (van Katwijk, September 2003) Vehicle Independent parameters
Value Input variable Description ACC CA
AICC_k Gain of P-type speed controller (m/s2) / (km/h)
0,1 0,3
AICC_kd Distance controller error factor (cm)
0,2 0,1
AICC_kv Distance controller speed error factor (m/s)
3,0 0,58
Inter_pl_hw Headway between platoons (s)
1,5
Intra_pl_hw Headway between vehicle in a platoon (s)
1,0
Platoon_size Maximum size of a platoon (veh.)
10
ICC_ref_lower Lower boundary of ICC reference speed (km/h)
50
ICC_ref_upper Upper boundary of ICC reference speed (km/h)
140
Curdec_thresh_diseng AICC disengage threshold 0,1 Desdec_thresh_diseng 0,5 Curaiccmaxdecalarmcorr (m/s2) -1,5 0,25 Min_acc_eng (m/s2) -0,5 Max_acc-eng (m/s2) 0,5 A_re_eng (m/s2) -1,0 The original MIXIC model did not contain a sub model for lateral behaviour. It was assumed that the lanes were dimensioned in a way that vehicles would not be influenced in their longitudinal control behaviour by vehicles in adjacent lanes. In a later study (Tampere, 1999) a rudimentary form of lateral behaviour was added to evaluate the impact of narrow lanes on traffic flow and capacity. The model could be parameterised so that the LKS of the CA is emulated in various degrees of effectiveness. The parameters for lateral behaviour can be set in such a manner that simulated vehicles do not deviate from the centre of the lane as would be expected with a perfect LKS. Table 4.17 lists the parameters used in modelling lateral behaviour.
Dutch evaluation of Chauffeur Assistant 37

Table 4.17: Changes to the ACC and CA input parameters in MIXIC: vehicle-dependent parameters (van Katwijk, September 2003) Vehicle dependant parameters Mean_position_lateral 0 Timestep_position_lateral 5 Margin_lateral_default 1,80 Prob_exceedance_lateral default 0,04 Factor_adjust_prob_exceedance_lateral 0,5 Stdev_position_lateral_default 0,036 0,012 Factor_adjust_stdev_position_lateral 0,026 0 Threshold_speed_intended_current_lane Vs_intended_lane
0,95
Threshold_speed_intended_effective_ Left_lane
1
Threshold_speed_intended_effective_ right_lane
1
Margin_lateral_min 0,28 Margin_lateral_max 1,78 Factor_adjusted_lane_width 0,89 Factor_adjusted_speed_limit 1,0 Factor_width_own 0,1 Factor_threat_other 0,2 Min_acceptable_lateral_separation 0,25 Acceptable_lateral_separation_switch 1 Threshold_proportion_adjacent 0,5 Influence_range_lateral_pred 40 Factor_sensibility_to_lateral_closeness 1 Factor_headway_deviation_passing 0 Factor_speed_deviation_passing -1,5 Factor_headway_deviation_locked 0,3 Factor_speed_deviation_locked -1,5 Lanechange_lanewidth_speedfactor 0,95 Lat_lock_hw 5 Sensitivity_lock_state 0,5 The outputs of the adapted MIXIC model were compared to the outputs generated by the MATLAB model used by the TNO Human Factors driving simulator. The same scenario’s describe in section 4.1 were modelled and the results, despite some small differences, were similar (Appendix B). These small differences in the modelled outputs were attributed (van Katwijk, September 2003) to differences in the time step intervals of the two models (0.1 second in MIXIC vs. 0.01 s in MATLAB). Furthermore the more complex nature of the MIXIC vehicle model requires a longer initialisation period resulting in some discrepancies between the two outputs at the beginning of the modelled period. Once the MIXIC model had stabilised the results were very similar to that produced by MATLAB. 4.5 Simulation modelling framework
To estimate the effects of CA implementation using a microscopic traffic simulation model requires a number of models that best represent the actual traffic situation, both currently and in the future. These models must reflect:
- Variations in traffic demand - Variations in traffic composition - Variations in the degree of CA implementation - Headway preferences
Dutch evaluation of Chauffeur Assistant 38

For the purpose of the simulations a number of parameters were kept constant for all modelling scenarios. These included roadway geometry, driver and vehicle performance criteria, and weather conditions (See Appendix E for an example data input file). In all cases a 3-lane highway section of 6 km length (made up of six 1 km links) and with 3,5m lanes was selected as being representative of a typical Dutch freeway. A choice was made not to include discontinuities such as a lane drop in the scenarios. Traffic in the MIXIC simulation model is input via so-called injection files. These data files contain individual vehicle data based on classified electronic traffic counts or can be artificially created by a Traffic Generation Model. An injection file contains data for each vehicle and these include time of registration, speed, vehicle length and lane. A number of these data files have been prepared by TNO-Inro and these cover a range of traffic volumes and compositions. For this study two injection files were selected, one with 10% HGV traffic and the other with 20% HGV traffic. Each file contains 4 ¼ hours of traffic data. A general description of traffic composition and distribution over the lanes is provided in Tables 4.18 and 4.19 (Bear in mind that this reflects traffic as it is inserted into the simulation). Table 4.18: Traffic volume and composition (10% HGV) Lane Traffic volume (veh per 4 ¼ hours) Cars Bus &MGV HGV Total Right Centre Left
3945 9774
12 420
1454 463 26
935 137
6334 10373 12446
Total 26 139 1943 1072 29153 The hourly traffic volumes in the above table range from 5700 vehicles in the lowest hour to 7700 in the highest hour. Table 4.19: Traffic volume and composition (20% HGV)
Traffic volume (veh per 4 ¼ hours) Lane
Cars Bus &MGV HGV Total Right Centre Left
1700 7739
10 514
2180 1011
50
1522 391
5402 9141
10564 Total 19 953 3241 1913 25107 Traffic volumes in the 20% HGV data file range from 5500 vehicles in the lowest hour to 6500 vehicles in the highest hour. MIXIC is a stochastic model that makes use of distributions and random numbers of driver and vehicle characteristics. To ensure that these characteristics are dissimilar the model makes use of a seed number in the random generator and that determines the outcome of the selected vehicle and driver characteristics. For the results of the simulations to differ from each other necessitates the selection of a unique seed number for each run. To ensure statistical validity it was therefore necessary to run a number of stochastically independent simulations for each selected scenario. In this study, each scenario was simulated 10 times. In total this implied 60 simulation runs (three penetration scenarios times two traffic volume types times 10 simulations) and yielding 255 hours of traffic data.
Dutch evaluation of Chauffeur Assistant 39

4.6 Simulation approach and analysis
As mentioned earlier, this study examined four primary scenarios, namely:
1. The current situation under moderate to high traffic demand and with 10 and 20% HGV.
2. As in 1 but with all HGV equipped with a CA system The MIXIC Traffic Simulation Model made use of a simple road network. It consisted of 6 links, end-to-end, each with 3 lanes of 3,5 m in width (standard Dutch lane width). There are no on- or off-ramps in the network. All vehicles follow the same route. For each scenario 10 simulations comprising 15300 seconds of real time data were run using a different seed, and the data analysed. To allow the simulation model time to stabilise the first 15 minutes of data in each simulation were discarded. The remaining data were analysed in 5 minute time intervals (48 per simulation) giving a total of 40 hours of traffic data per scenario. To simplify the comparison over the 10 simulations for each scenario, the key indicators for the 10 (5-minute) intervals with the highest (lowest) intensities per simulation were collected. The 10 highest traffic volumes represent a situation where the demand approaches or exceeds capacity and consequently traffic flow is relatively unstable. The analysis presented in this chapter are based on results achieved by calculating the weighted average for each scenario for the specific indicators. The weighting by intensity was used. The key indicators are: Safety • Number of shockwaves • Number of conflicts • Critical and average headways • Headway distribution • Critical TTC • Average TTC • Relative speed differences between lanes Traffic Flow and Capacity • Intensity • Average Speed Traffic data for the first and last links of the modelled road section were not analysed, the reason being that traffic inserted into the simulation at the beginning tends to behave erratically with the result that flow is highly unstable and therefore not representative. Similarly data from the last link can also be argued to be non-representative. The most stable traffic flow conditions are reached on links 3 and 4 and therefore the results of the modelled scenarios for link 4 will be discussed in detail in the following chapters (comparatively links 2, 3, 4 and 5 show similar traffic performance and the differences in various variables is too small to warrant a detailed analysis of each link). 4.6.1 Traffic safety indicators The MIXIC model generates a number of outputs that reflect on possible traffic safety impacts. These are: Shockwaves and conflicts Shockwaves occur when vehicles travelling at relatively short headways in a stream of traffic are suddenly forced to decelerate. This situation is potentially dangerous and can lead to accidents, especially where the headways are
Dutch evaluation of Chauffeur Assistant 40
marginal and the deceleration is severe. Furthermore, a shockwave affects a traffic stream and small disturbances upstream rapidly affect traffic flow downstream, often resulting in traffic coming to a standstill. The speed at which the shockwave travels downstream is a measure of the traffic safety hazard it poses. In MIXIC a shockwave is defined as an occurrence involving at least three vehicles at headways of less than 1 second and that decelerate at more than 5m/s2. Short headways and time to collision Headway and gap distributions are also indicators for potential road safety problems, especially where these are small and the speed of following vehicles is higher than that of leading vehicles. The time that the following vehicle takes to completely close the gap to the leading vehicle is also known as the Time to Collision (TTC). In the MIXIC simulations the critical headways can be set and all vehicles below this value are accumulated for each 5 minute time interval. In this study the critical headway was set at 0,5 seconds. In addition to headways distributions and average headways, the proportion of traffic with TTC smaller that the critical TTC (4s) and the average TTC were also calculated. Relative speed differences between lanes The more uniform vehicle speeds are across the lanes the less potential there is for conflicts when traffic changes lanes to overtake. In situations where the outermost (slow) lane has a high proportion of slow moving (heavy goods) traffic changing lanes to the middle or left (fast) lane to overtake can disrupt faster moving traffic in those lanes. 4.6.2 Traffic flow and capacity Traffic volumes, density and average speeds (travel times) are important indicators of the quality of traffic flow. In all situations a standard three-lane cross-section was applied and therefore the roadway capacity is theoretically equal for the different scenarios that were modelled. Throughput (V/C ratio) however could be affected by an increase in the proportion of larger headways that one expects if all HGV are equipped with CA and based on maximum headway settings of 1,3 and 1,6 seconds. Both the average travel time and the average (spot) speeds are calculated for each time interval by the model. The average travel time is a reflection of the quality of flow over the length of the link whereas the average speed is an indication of the average spot speeds measured by the traffic detectors in the middle of the link. 4.6.3 Results The initial runs with MIXIC reflected that the scenario with 50 percent HGV equipped with Chauffeur Assistant was not an immediate option, primarily due to limitations with regards to the number of vehicle types that could be specified in the input fields of the model. Consequently it was decided to first run the scenarios with no HGV equipped with CA and then the scenario with 100% HGV equipped with CA. These results would determine the necessity of conducting further simulations using other penetration rates. Due to the varying traffic volumes in the injection file, the 10 periods with the highest (lowest) intensities were chosen for comparison to other simulations with different seeds. The key indicators for the periods for the 10 highest (lowest) intensities from a single simulation were weighted-averaged for the
Dutch evaluation of Chauffeur Assistant 41

comparison. Thus, a single row of numbers is compared to other simulations. Per simulation there were approximately 48 periods available. The results are presented as follows. For the 10% HGV scenario, four sets of results are compared: the 10 lowest intensities with and without CA, and the 10 highest intensities with and without CA. Likewise for the 20% HGV scenario. 10% HGV scenario Tables 4.20 and 4.21 give a summary of the 10 time periods with the lowest traffic volumes recorded during the simulations with 10% HGV traffic. Comparing the situation with no HGV equipped with CA (Table 4.20) to that where all HGV have CA (Table 4.21) it is evident that traffic volumes traffic in all cases are similar. However, average traffic speeds are marginally lower in the situation where vehicles have CA. The differences in the values of the remaining parameters are marginal and therefore in this condition one can conclude that the introduction of CA has no material effect on either traffic performance (flow, capacity etc) or on factors affecting traffic safety (number and speed of shockwaves, TTC and critical headways). Table 4.20 : Summary of results for Link 4 : 10 time periods with the lowest traffic volumes per simulation (10%HGV, No vehicles with CA)
Simulation number
Avg. Vol.
(vph)
Avg. speed (km/h)
Std. Dev.
Speed (km/h)
Prop. of TTC
intervals < Crit.
Headway(%)
Weighted Avg. TTC
(s)
Weighted Avg.
headway(s)
Avg. density
(pcu/km)
Avg. no. of shock-waves
Avg. shock-wave speed (km/h)
1 6371 106,66 10,97 0,13 1,44 1,58 20,28 2,00 4,95 2 6330 106,47 10,95 0,14 1,38 1,59 20,32 2,00 9,93 3 6310 106,10 11,29 0,13 1,48 1,60 20,14 2,00 14,56 4 6304 106,95 10,71 0,11 1,50 1,60 20,04 3,00 17,70 5 6286 106,60 10,91 0,13 1,36 1,61 20,00 2,00 12,38 6 6318 106,65 11,33 0,14 1,37 1,60 20,15 2,00 13,67 7 6287 106,52 10,93 0,14 1,44 1,61 20,04 2,00 6,02 8 6311 106,20 10,81 0,14 1,36 1,60 20,15 2,00 13,89 9 6306 106,69 11,07 0,13 1,43 1,60 20,11 1,00 6,40 10 6301 106,15 11,11 0,13 1,41 1,60 20,23 4,00 10,70
Avg. 6312 106,50 11,01 0,13 1,42 1,60 20,15 2,20 11,02 Std. Dev. 261 1,76 0,77 0,03 0,14 0,07 1,06 2,33 15,25
N 100 100,00 100,00 100,00 100,00 100,00 100,00 100,00 100,00
Dutch evaluation of Chauffeur Assistant 42

Table 4.21: Summary of results for Link 4 : 10 time periods with the lowest traffic volumes per simulation (10%HGV, 100% HGV with CA)
Simulation number
Avg. Vol.
(vph)
Avg. speed (km/h)
Std. Dev.
Speed (km/h)
Prop. of TTC
intervals < Crit.
Headway(%)
Weighted Avg. TTC
(s)
Weighted Avg.
headway(s)
Avg. density
(pcu/km)
Avg. no. of shock-waves
Avg. shock-wave speed (km/h)
1 6206 106,94 11,46 0,13 1,43 1,63 19,83 3,00 10,51 2 6308 105,99 11,60 0,12 1,42 1,59 20,21 3,00 13,10 3 6330 105,59 11,34 0,11 1,55 1,59 20,31 1,00 12,46 4 6305 106,05 10,98 0,12 1,42 1,60 20,16 2,00 6,16 5 6288 105,87 11,21 0,12 1,51 1,60 20,22 3,00 10,32 6 6287 106,11 11,34 0,14 1,49 1,61 20,20 3,00 7,90 7 6350 106,00 11,18 0,11 1,50 1,58 20,32 3,00 11,09 8 6263 106,78 10,97 0,13 1,42 1,61 19,97 2,00 7,22 9 6323 106,42 11,69 0,13 1,49 1,59 20,18 2,00 10,00 10 6276 106,06 11,19 0,12 1,37 1,61 20,11 2,00 4,96
Avg. 6294 106,18 11,30 0,12 1,46 1,60 20,15 2,40 9,37 Std. Dev. 268 2,06 0,90 0,03 0,14 0,07 1,12 2,47 11,33
N 100 100,00 100,00 100,00 100,00 100,00 100,00 100,00 100,00 The analysis of the time periods with the highest traffic flows and with 10% HGV reflect that once again the application of CA in all HGV has virtually no effect on traffic performance (flow or safety- Tables 4.22 and 4.23). Average speeds are again marginally lower in the scenario where all HGV are equipped with CA. Interestingly, the average number of shockwaves in the situation where no HGV are equipped with CA is higher than in the situation where all HGV are equipped with CA. This could imply that HGV in the right hand (slow) lane tend to overtake less when equipped with a CA. Since their headways and speeds are to a large extent controlled they are able to drive in platoons without the need to overtake. Table 4.22 : Summary of results for Link 4 :10 time periods with the highest traffic volumes per simulation (10% HGV, No vehicles with CA)
Simulation number
Avg. Vol.
(vph)
Avg. speed (km/h)
Std. Dev.
Speed (km/h)
Prop. Of TTC
intervals < Crit.
Headway(%)
Weighted Avg. TTC
(s)
Weighted Avg.
headway (s)
Avg. density
(pcu/km)
Avg. no. of shock-waves
Avg. shock-wave speed (km/h)
1 7495 102,48 10,62 0,13 1,38 1,32 24,75 4,00 6,41 2 7528 101,40 10,49 0,11 1,49 1,31 25,08 3,00 7,86 3 7528 102,31 10,67 0,12 1,40 1,31 25,01 4,00 8,87 4 7564 102,44 10,36 0,11 1,41 1,30 24,99 2,00 6,41 5 7478 101,96 10,55 0,12 1,48 1,32 24,89 5,00 7,68 6 7518 102,00 10,59 0,12 1,46 1,31 25,03 4,00 1,99 7 7484 103,40 10,11 0,13 1,51 1,33 24,56 3,00 7,34 8 7585 101,29 10,91 0,12 1,48 1,30 25,34 4,00 4,82 9 7506 101,53 10,49 0,11 1,46 1,32 25,00 4,00 6,98
10 7654 101,87 10,21 0,12 1,40 1,29 25,39 4,00 10,83 Avg. 7534 102,07 10,50 0,12 1,45 1,31 25,00 3,70 6,92
Std. Dev. 173 1,40 0,73 0,03 0,15 0,03 0,67 2,47 10,77 n 100 100,00 100,00 100,00 100,00 100,00 100,00 100,00 100,00
Dutch evaluation of Chauffeur Assistant 43

Table 4.23 : Summary of results for Link 4 :10 time periods with the highest traffic volumes per simulation (10% HGV, 100% HGV with CA)
Simulation number
Avg. Vol.
(vph)
Avg. speed (km/h)
Std. Dev.
Speed(km/h)
Prop. Of TTC
intervals < Crit.
Headway(%)
Weighted Avg. TTC
(s)
Weighted Avg.
headway (s)
Avg. density
(pcu/km)
Avg. no. of shock-waves
Avg. shock-wave speed(km/h)
1 7613 101,77 10,58 0,11 1,46 1,29 25,36 3,00 10,602 7505 101,50 10,57 0,11 1,47 1,31 25,03 2,00 2,26 3 7418 102,04 11,03 0,13 1,45 1,33 24,65 3,00 4,16 4 7564 101,35 10,74 0,09 1,52 1,31 25,22 3,00 4,16 5 7530 101,66 10,35 0,10 1,44 1,31 25,16 3,00 4,83 6 7524 101,20 10,37 0,10 1,52 1,31 25,05 3,00 15,667 7480 100,90 10,94 0,12 1,44 1,32 25,18 4,00 9,70 8 7462 102,08 10,60 0,12 1,42 1,32 24,74 3,00 6,46 9 7519 101,39 10,83 0,12 1,45 1,31 25,14 4,00 2,02
10 7465 101,61 10,53 0,11 1,50 1,32 24,90 2,00 5,97 Avg. 7508 101,55 10,65 0,11 1,47 1,31 25,04 3,00 6,58
Std. Dev. 194 1,45 1,03 0,02 0,16 0,04 0,76 2,25 11,31n 100 100 100 100 100, 100 100 100 100
20% HGV scenario Comparing the situation with 20% HGV traffic under lighter traffic flows it is evident that the introduction of CA only has a marginal effect on average traffic speeds (Tables 4.24 and 4.25). Comparing the performance on a lane by lane basis, it was evident that there are at most three time intervals during which 0,5% of traffic in the centre and left lanes had critical headways smaller than the threshold value of 0,5 seconds. Traffic in the right (slow) lane was never observed to travel at headways below this value. This trend was evident irrespective of the traffic volume, percentage of HGV traffic or degree of CA implementation. Table 4.24: Summary of results for Link 4 : 10 time periods with the lowest traffic volumes per simulation (20%HGV, No vehicles with CA)
Simulation number
Avg. Vol.
(vph)
Avg. speed (km/h)
Std. Dev.
Speed (km/h)
Prop. Of TTC
intervals < Crit.
Headway(%)
Weighted Avg. TTC
(s)
Weighted Avg.
headway (s)
Avg. density
(pcu/km)
Avg. no. of shock-waves
Avg. shock-wave speed (km/h)
1 5570 105,58 11,66 0,12 1,48 1,89 18,06 2 9,44 2 5561 106,15 11,96 0,14 1,51 1,90 17,97 2 7,92 3 5561 105,85 11,85 0,14 1,47 1,90 18,04 2 14,18 4 5562 105,36 11,82 0,14 1,50 1,90 18,03 2 -1,26 5 5561 106,36 11,58 0,14 1,41 1,90 17,89 2 8,70 6 5562 105,80 12,01 0,15 1,44 1,90 18,01 2 8,05 7 5545 105,75 11,66 0,14 1,42 1,90 18,06 3 14,25 8 5569 105,62 11,60 0,13 1,47 1,90 18,14 3 9,84 9 5554 105,80 11,76 0,16 1,51 1,90 18,08 2 7,13 10 5570 106,31 12,39 0,16 1,39 1,90 17,94 3 6,53
Avg. 5562 105,86 11,83 0,14 1,46 1,90 18,02 2,3 8,48 Std. Dev. 148,3 1,39 0,700 0,03 0,13 0,07 0,51 1,68 16,47
n 100 100 100 100 100 100 100 100 100
Dutch evaluation of Chauffeur Assistant 44

Table 4.25: Summary of results for Link 4 : 10 time periods with the lowest traffic volumes (20%HGV, 100% HGV with CA)
Simulation number
Avg. Vol.
(vph)
Avg. speed (km/h)
Std. Dev.
Speed (km/h)
Prop. Of TTC
intervals < Crit.
Headway(%)
Weighted Avg. TTC
(s)
Weighted Avg.
headway (s)
Avg. density
(pcu/km)
Avg. no. of shock-waves
Avg. shock-wave speed (km/h)
1 5569 104,36 11,73 0,12 1,40 1,89 18,23 2,00 4,49 2 5557 104,27 11,75 0,14 1,42 1,90 18,20 2,00 5,67 3 5554 105,62 12,10 0,13 1,44 1,90 18,08 2,00 8,16 4 5580 105,43 12,29 0,15 1,45 1,89 18,15 3,00 10,61 5 5572 104,85 11,94 0,16 1,46 1,90 18,19 3,00 13,02 6 5558 104,78 11,52 0,13 1,44 1,89 18,20 2,00 8,55 7 5586 104,37 11,86 0,13 1,45 1,89 18,29 1,00 4,99 8 5554 104,21 11,89 0,15 1,41 1,89 18,43 3,00 13,58 9 5566 105,26 11,96 0,12 1,50 1,90 18,15 4,00 9,98 10 5561 104,97 12,05 0,14 1,53 1,90 18,16 2,00 12,74
Avg. 5566 104,81 11,91 0,14 1,45 1,90 18,21 2,40 9,18 Std. Dev. 146,1 1,52 0,66 0,03 0,13 0,07 0,56 1,64 13,63
n 100 100 100 100 100 100 100 100 100 As with all the previous results, a higher proportion of HGV, all equipped with CA, has virtually no effect on traffic performance (Tables 4.26 and 4.27). Average speeds are marginally lower in the situation where all HGV have CA whereas the majority of the other variables remain virtually equal in the higher traffic volume regime and for the scenario with and without CA. In this situation it is evident that the average number of shockwaves with all of the HGV equipped with CA is fractionally higher that in the situation where no HGV have CA. This is the opposite effect than was the situation with 10% HGV (fewer shockwaves in the situation where all HGV have CA). Table 4.26 : Summary of results for Link 4 :10 time periods with the highest traffic volumes per simulation (20% HGV, No vehicles with CA)
Simulation number
Avg. Vol.
(vph)
Avg. speed (km/h)
Std. Dev.
Speed (km/h)
Prop. Of TTC
intervals < Crit.
Headway(%)
Weighted Avg. TTC
(s)
Weighted Avg.
headway (s)
Avg. density
(pcu/km)
Avg. no. of shock-waves
Avg. shock-wave speed (km/h)
1 6702 102,63 11,27 0,13 1,53 1,55 22,31 2 0,44 2 6648 102,88 11,11 0,14 1,45 1,56 22,14 2 9,87 3 6700 102,49 11,99 0,14 1,46 1,55 22,21 4 11,41 4 6690 102,57 11,14 0,13 1,46 1,55 22,12 4 10,25 5 6677 102,97 11,25 0,13 1,41 1,55 22,01 3 16,24 6 6635 102,53 11,35 0,11 1,49 1,56 22,03 2 1,75 7 6706 102,52 11,16 0,14 1,43 1,55 22,26 2 7,03 8 6698 102,30 11,40 0,13 1,43 1,55 22,44 4 7,63 9 6719 102,40 10,97 0,13 1,42 1,54 22,40 2 7,85 10 6692 103,23 11,69 0,14 1,50 1,55 22,14 4 10,16
Avg. 6687 102,65 11,33 0,13 1,46 1,55 22,21 2,9 8,26 Std. Dev. 209,3 1,55 0,73 0,03 0,15 0,05 0,89 1,73 14,68
n 100 100 100 100 100 100 100 100 100
Dutch evaluation of Chauffeur Assistant 45

Table 4.27 : Summary of results for Link 4 :10 time periods with the highest traffic volumes (20% HGV, 100% HGV with CA)
Simulation number
Avg. Vol.
(vph)
Avg. speed (km/h)
Std. Dev.
Speed (km/h)
Prop. Of TTC < Crit.
Headway(%)
Weighted Avg. TTC
(s)
Weighted Avg.
headway (s)
Avg. density
(pcu/km)
Avg. no. of shock-waves
Avg. shock-wave speed (km/h)
1 6686 101,06 11,56 0,12 1,51 1,55 22,53 4,00 9,60 2 6695 100,79 11,74 0,12 1,49 1,54 22,64 3,00 10,78 3 6646 101,99 11,78 0,12 1,55 1,56 22,14 4,00 7,33 4 6701 101,19 11,64 0,10 1,53 1,54 22,60 3,00 6,09 5 6671 101,33 11,34 0,13 1,43 1,55 22,44 3,00 14,93 6 6658 101,02 11,25 0,13 1,45 1,55 22,33 3,00 5,65 7 6748 100,64 11,27 0,12 1,44 1,53 22,80 4,00 3,69 8 6709 102,27 11,69 0,13 1,55 1,54 22,45 4,00 7,18 9 6659 101,77 11,40 0,12 1,52 1,55 22,31 3,00 13,47 10 6720 101,44 11,35 0,13 1,43 1,54 22,46 3,00 9,66
Avg. 6689 101,35 11,50 0,12 1,49 1,54 22,47 3,40 8,84 Std. Dev. 216,2 1,76 0,79 0,03 0,13 0,05 0,93 2,08 10,17
N 100 100 100 100 100 100 100 100 100
Tables 4.28 and 4.29 provide an overall summary of the results. On average it is clear that the implementation of CA in the HGV sector will have limited to no effect on traffic flow or on indicators that may affect traffic safety. Although average speeds are marginally lower in the situation where HGV have CA, other variables remain relatively unchanged, irrespective of the percentage of HGV. Table 4.28 : Link 4 : Summary of results for 100 time intervals with the highest traffic volumes (All simulations)
Scenario Avg. Vol.
(vph)
Weighted avg. V (km/h)
Std. Dev V (km/h)
Prop. Of TTC
intervals < Crit.
Headway(%)
Weighted Avg. TTC
(s)
Weighted Avg.
headway (s)
Avg. density
(pcu/km)
Avg. no. of shock-waves
Avg. shocwave spee
(km/h)
10%HGV, No CA
7534 102,07 10,50 0,12 1,45 1,31 25,00 3,70 6,92
10%HGV,
All with CA
7508 101,55 10,65 0,11 1,47 1,31 25,04 3,00 6,58
20% HGV,
No CA 6687 102,65 11,33 0,13 1,46 1,55 22,21 2,90 8,26
20% HGV,
All with CA
6689 101,35 11,50 0,12 1,49 1,54 22,47 3,40 8,84
Dutch evaluation of Chauffeur Assistant 46

Table 4.29 : Link 4 : Summary of results for 100 time intervals with the lowest traffic volumes (All simulations)
Scenario Avg. Vol.
(vph)
Weighted avg. V (km/h)
Std. Dev V (km/h)
Prop. Of TTC
intervals < Crit.
Headway(%)
Weighted Avg. TTC
(s)
Weighted Avg.
headway (s)
Avg. density
(pcu/km)
Avg. no. of shock-waves
Avg. shocwave spe
(km/h)
10%HGV, No CA
6312 106,50 11,01 0,13 1,42 1,60 20,15 2,20 11,02
10%HGV,
All with CA
6294 106,18 11,30 0,12 1,46 1,60 20,15 2,40 9,37
20% HGV,
No CA 5562 105,86 11,83 0,14 1,46 1,90 18,02 2,30 8,48
20% HGV,
All with CA
5566 104,81 11,91 0,14 1,45 1,90 18,21 2,40 9,18
Although the effect of CA on speeds is not significant there are a number of interesting observations that can be made (Figure 4.3) such as the effect of a higher proportion of HGV on average speeds at lower traffic volumes. The difference in average speed (0 vs. 100% penetration) is greater at higher percentages of HGV although the average speed with 100% penetration is consistently lower. Figure 4.3: Effect of CA on speed
0% CA 100% CA
volume: L
10% HGV 20% HGV100
101
102
103
104
105
106
107
108
avg
spee
d (k
m/h
)
volume: H
10% HGV 20% HGV
To establish whether CA had any material effect on traffic flow in specific lanes, the detailed data for each of the selected time intervals were examined. Since HGV predominantly use the rightmost traffic lane, the headways for specifically this lane were examined for the low and high volume ranges and according to the proportion of HGV equipped with CA. It was evident that the average range in headways in the right hand lane was marginally higher in the scenarios with 100% CA implementation. In the cases with 20% HGV traffic the range lay between 2,0 and 2,7 seconds compared to 2,1 and 2,4 seconds in the
Dutch evaluation of Chauffeur Assistant 47
scenarios with no CA. The distribution of headways in the rightmost lane is more affected by the proportion of HGV than by the degree of CA implementation. The larger the proportion of HGV the broader the distribution, a result that is expected since the use of this lane by other traffic (cars) is dictated by the volume of HGV in this lane (The fewer trucks in the lane the more cars travelling at shorter headways).
Dutch evaluation of Chauffeur Assistant 48

5 Conclusions This report concludes the second phase of the Dutch FOT examining the effects of lateral support systems [AVV, 2001]. This second phase examined the traffic effects of the Chauffeur Assistant (CA) Driver Assistance System. The research carried out to evaluate the traffic effects included a literature study, changes to in driver behaviour with CA as assessed in the TNO Human Factors driving simulator, and finally the incorporation of the literature review and the driver behaviour analysis into the MIXIC traffic simulation model. The MIXIC model was subsequently used to assess the effects of CA. The CA control algorithms were developed by TNO Automotive and TNO Human Factors and were based on information provided by Daimler-Chrysler (HMI and functionality of the CA). The scenarios analysed in the traffic simulation model included trucks and passenger cars, but only the trucks had the CA equipment. Major conclusions from literature study The literature study revealed that the large-scale implementation of integrated ADA systems will not take place before 2020. It is likely that this process will take place autonomously with governments acting as watchdogs by ensuring that vehicle type approvals are in place. The majority of studies indicate that high levels of penetration of ACC systems evaluated to date will negatively impact on traffic flow and capacity. This is largely due to the fact that these systems are predominantly based on constant headways. However, the interaction between ACC equipped vehicles and remaining traffic remains a problem and this interaction negatively affects the ideal performance of these systems and also impacts on the stability of traffic flow. The acceptance of ACC systems is varied amongst respondents that were exposed to the technology. Certainly earlier studies with older prototypes indicate that road users are not entirely comfortable with the systems. This is to a large extent the cause of a general lack of understanding and knowledge of the systems and their capabilitites. Later studies with AICC reveal that the systems are becoming more sophisticated and reliable and hence more acceptable to users. However, the systems are still not perceived as ideal. Driving Simulator Results The driving simulation results did not lead to any major modifications of the driver model with CA. The driving simulator study found that CA state (on or off) had no significant effect on average speed whereas the standard deviation of the mean speeds was marginally lower with the CA activated. This result was also found during the MIXIC simulations where the average speed of all traffic was marginally lower with when all HGV were equipped with CA. Comparing speeds of HGV in the slow lane, average speeds remained similar irrespective of the CA state. The driving simulator study revealed that the average number of lane changes with the CA activated was lower that with the CA turned off. The results of the MIXIC simulations indicated that in certain instances the average number of shock waves was marginally lower when the CA was active. This could imply that fewer lane changes take place and hence traffic in the faster middle and left lanes are not disturbed by slow moving traffic changing lanes to overtake. Neither traffic volume nor CA-state had an effect of the average following headways of HGV drivers (typically between 2,6 and 2,9s).
Dutch evaluation of Chauffeur Assistant 49

The introduction of an unexpected event in the form of a leading vehicle suddenly braking revealed that a larger proportion of drivers driving with an activated CA remained in their original lane. In the situation where the CA was in the off state, drivers tended to take evasive action by changing lanes. The perceived mental effort of the driving tasks is significantly less whilst driving with the CA in the on state. Drivers rate the mental effort of driving with the CA in the off state as fairly to reasonable strenuous whereas it is rated as slightly strenuous whilst driving with the CA on. However, this result may appear positive but at this stage little is known regarding the possibility of drivers performing other non driving related tasks as a result of the reduced effort required for the driving task (compensating behaviour). MIXIC Traffic Simulation results Given the outcomes of the driving simulator study, it was not expected that a 100% CA penetration rate in the HGV sector, where HGV represent 10% or 20% of the vehicles in traffic, would have a significant effect on traffic flow. This is indeed the outcome of the MIXIC traffic simulation. The MIXIC micro-simulation model was used to generate some 160 hours of traffic data representing the current and future situations and each with two different traffic demand scenarios. Based on these inputs it was concluded that under these traffic conditions the introduction of Chauffeur Assistant would have no significant effect on traffic flow or, indirectly, on traffic safety. From the analysis of the MIXIC simulation data it appeared that in certain situations the average number of shockwaves in traffic with no CA equipped HGV were higher than in situations where all HGV were equipped with CA. This may imply that in situations where HGV are equipped with CA fewer overtaking manoeuvres (implying a lane change from the slow lane to the middle lane) occur and hence traffic in the middle and left lanes are less likely to be disrupted. This result seems to confirm the earlier finding of the driving simulator study where it was found that drivers with CA tend to change lanes less often, also in situations where leading vehicles suddenly brake. This could imply that under these conditions (high traffic volumes and 10% HGV) CA has a positive effect on traffic flow and safety. Implementing CA in the HGV sector results a larger spread in headways when comparing the headways in slow lane (the lane predominantly used by HGV) in the situation where all HGV have CA to the situation where no HGV have CA. This becomes more profound with if the proportion of HGV traffic is increased to the 20% level. This would suggest that passenger cars (used to travelling at shorter headways) are either less inclined to use the slow lane or if they do, they cause cut-ins whereby the following HGV has to re-adjust its following distance. Average headways and Time to Collision were significantly shorter in the MIXIC study than in the driving simulator study. The is attributed to the fact that the definitions of following headways and critical TTC were different in the two studies (smaller values were used in the MIXIC study). Furthermore, the driver model in MIXIC is also optimised, implying that it is very difficult to outperform it. Although both the driving simulator and MIXIC studies found that the average headways were essentially the same for scenarios with and without CA vehicles, the driving simulator study indicated that the TTC was significantly lower in the condition without CA control. This was not confirmed by the MIXIC study. Overall It is concluded that the introduction of Chauffeur Assistant in the HGV sector, assuming its use is limited to the primary road network of the Netherlands, will have no negative effects on traffic flow. The results of the MIXIC simulations do not suggest that significant changes will occur in any of the variables
Dutch evaluation of Chauffeur Assistant 50
describing the quality of traffic flow (travel times, speeds, density etc.) and traffic safety (shockwaves, TTC, headways etc.) should CA be introduced in the HGV sector. The drivers participating in the driving simulator study did indicate, though, that their perceived workload decreased when CA was used. As mentioned, compensating behaviour in these cases is not yet known, but worth examining in the future. The effectiveness of CA system could significantly be enhanced if the system were applicable in other circumstances as well: wither by equipping other types of vehicles, such as passenger vehicles, with the system, or by extending the operational range to below the standard minimum speed by integrating a stop&go system in the CA
Dutch evaluation of Chauffeur Assistant 51

List of References
Adviesdienst Verkeer en Vervoer (2003). Verkeersongevallen in Nederland, 2002). Transport Research Centre – AVV, Directorate-General Public Works and Water Management, Ministry of Transport, Public Works and Water Management, Rotterdam, Netherlands. Adviesdienst Verkeer en Vervoer (2000). Automatische voertuiggeleiding met ADA technologie – Perspectieven voor veiligheid en benutting. Transport Research Centre – AVV, Directorate-General Public Works and Water Management, Ministry of Transport, Public Works and Water Management, Rotterdam, Netherlands. AVV(2001). Research Framework for Dutch Field Operational Tests with lateral support systems. Transport Research Centre – AVV, Directorate-General Public Works and Water Management, Ministry of Transport, Public Works and Water Management, Rotterdam, Netherlands. Bekiaris, E; Bauer, A; Gelau, C; Stevens, A; Wiethoff, M; Oei, L; Schoon, C; Brookhuis, K; de Waard, D; Anttila, V; Mankinnen, E; Macharis, C and Verbeke, A (2003). Development of prioirty implementation scenarios for ADA systems. Deliverable D7.1v6 (Draft), Advisors, DG Tren, European Commission 5th Framework programme, European Commission, Brussels. Brandenburg, K; Braun, A; Benz, Th.; Diekmann, Th.; Fritz, H; Künzel, G; Irion, J; Lanfranco, C; Lorei, M; Martini, S; Schultze, M; Schwarzhaupt, A and Vollmer, D (2000). Chauffeur II System Requirement, system design and safety concept. Restricted Report Deliverable D1 Promote Chauffeur,Information Society Technologies, Stuttgart, Germany. Brouwer, R F T and de Ridder, S N (2003). Narrow lanes and distraction : Will LDWA come to the rescue?. TNO Report TM-03-C020, TNO Human Factors, Soesterberg, Netherlands. Charles River Associates (1998). Customer acceptance of automotive crash avoidance devices – a report of qualitative research. Charles River Associates project number 852-05, ITS Joint Program Office, National Highways Traffic Safety Administration (NHTSA), US Ministry of Transport, Washington DC. Darbha, S and Rajagopal, K R (1998). Intelligent Cruise Control Systems and traffic flow stability. California Path Research report UCB-ITS-PRR-98-36, Institute of Transportation Studies, University of California, Berkeley. Elios Group, DIBE (University of Genoa - 2003). Advanced Driver Assistance systems. Genoa, Italy (www.elios.dibe.unige.it/mito/adas.htm). Gee, T A; Smedley, D G and Sri, A (1996). Braking analysis for collision avoidance – autonomous braking system performance modelling and benefit analysis. Report No. 95-007, National Highways Traffic Safety Administration, US Department of Transport, Washington DC. Hoedemaeker, M and de Ridder, S N (2003). The Dutch experience with LDWA systems. TNO Report TM-03-C048, TNO-Human Factors, Soeterberg, Netherlands Hogema, J H; Hoekstra, W and Verschuren, R M A F (2003). A driving simulator vehicle model with an extended steering system sub-model. TNO Report TM-03-D004, TNO Human Factors, Soesterberg, Netherlands.
Dutch evaluation of Chauffeur Assistant 52

Hogema, J.H. (2003). Method and results DECA driving simulator experiment (Memo TNO-TM 2003-M020). Soesterberg, The Netherlands: TNO Human Factors. Hogema, J H and Burry, S (2002). An automatic stop and go system : Detailed design and implementation. TNO Report TM-02-D002, TNO Human Factors, Soesterberg, Netherlands. Hogema, J H. (5 september 2003). DECA: Changes in the MIXIC model. Internal Memo to the Transport Research Centre AVV, TNO Memo TNO-TM-2003-M026 (Unpublished), TNO Human Factors, Soesterberg, Netherlands. Jansson, J; Johansson, J and Gustafsson, F (2002). Decision making for collision avoidance systems. Report No. 2002-01-0403, Society of Automotive Engineers, Troy, Michigan. Katteler, H (2003). Acceptance of Lane Departure Warning Assistant (LDWA) System: Final report. TNO report TM-03-C022, TNO-Human Factors, Soesterberg, Netherlands. Korse, M J; Schermers, G; Radewalt, N M D; de Hoog, A and Alkim, T (2003). On track: Results with the trial with the Lane Departure Warning Assistant system. Transport Research Centre – AVV, Directorate-General Public Works and Water Management, Ministry of Transport, Public Works and Water Management, Rotterdam, Netherlands. Levinson, D M and Zou, Xi (2002). Evaluation of Adaptive Cruise Control in mixed traffic. Paper submitted for TRR publication and CD-Rom at the 82nd annual meeting of the TRB, Transportation Research Board, Washington DC. Minderhoud, M M and Bovy, P H L (1999). Impact of Intelligent Cruise Control on motorway capacity. TRB paper No. 990049, Proceedings of the 79th Annual General Meeting of the TRB, Transportation Research Board, Washington DC. Minderhoud, M M (1998). Modelling driver behaviour on motorways : Description of the SiMoNE model. Traffic Engineering Section, Delft University of Technology, Delft, Netherlands. NHTSA (2002). Automotive Collision Avoidance Systems : Field Operational Test Phase 1. Interim Report DOT HS 809 454, National Highway Traffic Safety Administration, US Department of Transport, National Technical Information Service, Springfield, Virginia. Rook, A M and Hogema, J H (2002). Analysis of the driving task and the role of lane departure warnings. TNO report TM-02-C056, TNO Human Factors, Soesterberg, Netherlands. Seiler, P; Song, B and Hendrick, J K (1998). Development of a collision avoidance system. Report Number 98 PC – 417, Society of Automotive Engineers, Troy, Michigan. Stardust (2002). Critical analysis of ADAS/AVG options to 2010; Selection of options to be investigated. Deliverable 1, European Commission 5th Framework Programme, European Commission, Brussels. Tampere, C M J (1999). Dynamisch dwarsprofiel: een verkenning van de verkeersafwikkeling op smalle stroken – een verkennende simulatiestudie met het microsimulatie model MIXIC. TNO-INRO report 99/NK/072, Adviesdienst Verkeer en Vervoer (AVV), RWS, Ministerie van Verkeer en Waterstaat, Rotterdam, Nederland.
Dutch evaluation of Chauffeur Assistant 53

Transportation Research Group (Univ. of Southampton – April 1999). DIATS -Deployment of Interurban ATT Test Scenarios: Deliverable 17 Evaluation of ATT system scenario deployment options. DIATS Report RO-96-SC-301, European Union DG VII 4th Framework programme, Brussels. Transportation Research Group (Univ. of Southampton – May 1999). DIATS -Deployment of Interurban ATT Test Scenario. DIATS Final Report RO-96-SC-301, European Union DG VII 4th Framework programme, Brussels. TUHH (Reviewed by TRG, Univ. of Southampton – 1998). DIATS -Deployment of Interurban ATT Test Scenarios: Deliverable 10-12: Investigation of impacts of selected ATT functions by simulation models. DIATS Report RO-96-SC.301, European Union DG VII 4th Framework programme, Brussels. Van Arem, B; Hogema, J H; Vanderchuren, M J W A and Verheul, C H. (1996) An assessment of the impact of Autonomous Intelligent Cruise Control. TNO Inro Report Inro-VVG 1995-17a, TNO Inro, Delft, Netherlands Van Arem, B; de Vos, A P and Vanderschuren, M J W A (1997). The Microscopic traffic simulation model MIXIC 1.3. TNO-INRO report 97/NV/025, Transport Research Centre-AVV, DG Public Works and Water Management, Ministry of Transport, Public Works and Water Management, Rotterdam, Netherlands. Van Katwijk, R T (10 September 2003). DECA: Changes in the MIXIC driver model. Internal Memo to the Transport Research Centre AVV, TNO Memo 03-M-000-00000 (Unpublished), TNO INRO, Delft, Netherlands. Van der Werf, J: Shladover, S E; Miller, M A and Kourjanskaia, N (2002). Evaluation of the effects of Adaptive Cruise Control systems on Highway traffic flow capacity and implications for deployment of future automated systems. Paper submitted for TRR publication review at the 81st Annual meeting of the TRB, Transportation Research Board, Washington DC.
Dutch evaluation of Chauffeur Assistant 54
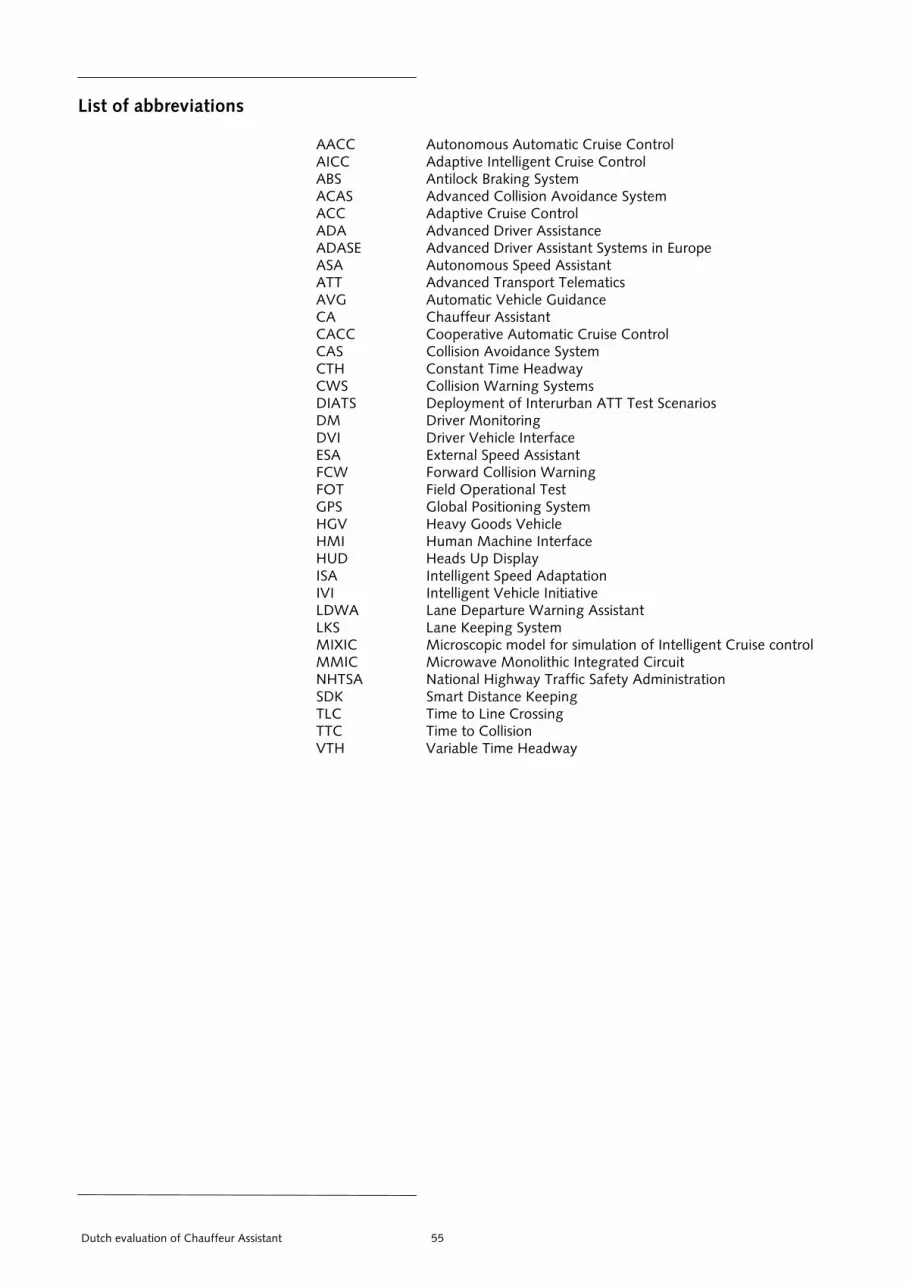
List of abbreviations
AACC Autonomous Automatic Cruise Control AICC Adaptive Intelligent Cruise Control ABS Antilock Braking System ACAS Advanced Collision Avoidance System ACC Adaptive Cruise Control ADA Advanced Driver Assistance ADASE Advanced Driver Assistant Systems in Europe ASA Autonomous Speed Assistant ATT Advanced Transport Telematics AVG Automatic Vehicle Guidance CA Chauffeur Assistant CACC Cooperative Automatic Cruise Control CAS Collision Avoidance System CTH Constant Time Headway CWS Collision Warning Systems DIATS Deployment of Interurban ATT Test Scenarios DM Driver Monitoring DVI Driver Vehicle Interface ESA External Speed Assistant FCW Forward Collision Warning FOT Field Operational Test GPS Global Positioning System HGV Heavy Goods Vehicle HMI Human Machine Interface HUD Heads Up Display ISA Intelligent Speed Adaptation IVI Intelligent Vehicle Initiative LDWA Lane Departure Warning Assistant LKS Lane Keeping System MIXIC Microscopic model for simulation of Intelligent Cruise control MMIC Microwave Monolithic Integrated Circuit NHTSA National Highway Traffic Safety Administration SDK Smart Distance Keeping TLC Time to Line Crossing TTC Time to Collision VTH Variable Time Headway
Dutch evaluation of Chauffeur Assistant 55

Appendix A: General description of the MIXIC simulation model
The model MIXIC emerged from efforts at both TNO and the Transport Research Centre (AVV) of the Dutch Ministry of Transport, Public Works and Water Management. MIXIC is a microscopic traffic simulation model suitable for the assessment of the impacts of modern telematic technologies in traffic. By means of computer simulation, the consequences for safety, exhaust-gas emission, noise emission, and traffic performance can be weighed in an integrated manner. One important class of modern telematic technologies are Automated Vehicle Guidance (AVG) systems. Automated vehicle guidance is regarded as a promising tool to improve road network traffic performance and safety. AVG systems can be defined as systems in which the driving task of a driver is taken over partly or entirely by an automated system. Such systems may even involve communication with road-side systems and/or other vehicles. For studying the impacts of AVG systems on a number of consecutive motorway stretches, the microscopic simulation model MIXIC 1.3 was developed. The model MIXIC 1.3 contains detailed submodels describing drivers, vehicles, assisting systems and their interfaces. The model has been filled for 4 driver and 4 vehicles types. Passenger cars or trucks may be equipped with AVG systems. Drivers of equipped vehicles can switch their systems on or off depending on the prevailing traffic conditions. This interaction model is motivated by the fact that first generation AVG- systems are expected to have a limited deceleration range, and must be overruled by the driver if strong decelerations are required, e.g. when approaching a queue. The output of MIXIC ranges from the possibility of recording vehicle/driver combinations, to the measurement of aggregated traffic quantities and the occurrence and severity of shockwaves. The model offers the possibility of narrowing situations and dedicated lanes for equipped vehicles. The MIXIC model generates extensive outputs for specified roadway links and
er time interval and these include: p - Traffic volumes (vph and pcuph) per lane and per vehicle category - Average speed per lane (km/h) - Standard deviation of speed per lane (km/h) - Proportion of Time To Collision (TTC) below critical TTC per lane - Proportion of TTC below critical TTC of AICC vehicles - Proportion of headways below critical per lane - Headway distribution (12 intervals) - Density per lane (pcu/h) - Average travel time AICC vehicles - Average travel time non AICC vehicles - Standard deviation of travel times - Number of shockwaves - Average shockwave speed - Average number of vehicles in a shockwave - Number of vehicles removed from the simulation due to unsolved
conflicts Number of vehicles removed from the simulation due to failure to merge (not relevant in the case of no lane drop or exclusive use of a lane by certain types of vehicles) In a previous study MIXIC was calibrated using traffic measurements from different motorways in the Netherlands. The calibration took place with respect to traffic performance and shock-waves. For cases in which a detailed calibration was possible, MIXIC corresponded well to real-life situations. In situations where a detailed calibration was not possible, the MIXIC results were found to be credible.
Dutch evaluation of Chauffeur Assistant 56

MIXIC is currently being applied in the European Union 5th Framework programme IST project CartTALK 2000 (www.cartalk2000.net). CarTALK focuses on new driver assistance systems which are based upon inter-vehicle communication. The main objectives are the development of co-operative driver assistance systems and the development of a self-organising ad-hoc radio network as a communication basis with the aim of preparing a future standard. This project also explores the costs and benefits of such systems, including traffic stream effects.
Dutch evaluation of Chauffeur Assistant 57

Appendix B: Changes to the MIXIC model
ACC parameter values The following parameter values were provided by TNO Automotive for the DECA project. For the definition of these parameters, see Van Arem et al. (1997). %Cruise Control KV = 0.3; % CC Gain %Adaptive Cruise Control KdX = 0.1; KdV = 0.58; s0 = 6; TimeHeadway = 1.3; MaxBraking = -3; ACC test scenarios The following scenarios were used to demonstrate that the ACC in the TNO Driving Simulator behaves the same as in the MIXIC reference model. Wensafstand: Dref = 6.0 + 1.3 * v (v in m/s) Eindtijd: 60 s Vl0 = snelheid leader op t=0 Vf0= snelheid volger (met ACC aan) op t=0 D0= volgafstand op t=0 Dref = wensafstand ACC Vref=wenssnelheid ACC nr omschrijving initiele toetstand event 1 naderen Vl0=50 km/u Vf0=80 km/u Vref=80km/u D0= 200 m - 2 versnellen Vl0=Vf0=50 km/u Vref=120 km/u D0=Dref voorligger versnelt na t=3 s met vaste acceleratie van 0.2 m/s^2 tot Vl=75 km/u 3 cut-in Vl0=Vf0=80 km/u Vref=120 km/u D0=Dref afstand halveert instantaan op t=3 s 4 vertragen Vl0=Vf0=80 km/u Vref=120 km/u D0=Dref voorligger vertraagt na t=3 s met vaste deceleratie van 3m/s^2 tot Vl=50 km/u 5 weglopen Vl0=Vf0=50 km/u Vref=75 km/u D0=Dref voorligger versnelt na t=3 s met vaste acceleratie van 0.2 m/s^2 en blijft dat doen The figures show the behaviour of the ACC in the Driving Simulator (DS) and in the reference model (ref). There are some minor differences in the transients. Causes: � The reference model had an 'ideal' vehicle and accelerator controller model, i.e., the ACC's acceleration setpoint was used as the acutal acceleration of the vehicle.
Dutch evaluation of Chauffeur Assistant 58

� The DS model has a shifting gear module, and the gear shifts cause some transient phenomena. � The DS model has a PI controller as an acceleration controller. Thus, the ACC's acceleration setpoint is not followed perfectly. Run numbers: � Nr 1 was practice run � Nr 2-3-4-5 were experimental runs Table 2 Coding of conditions condition nr traffic volume CA 1 1=low 1=off 2 1=low 2=on 3 2=high 1=off 4 2= high 2=on Braking lead car events: actie (0,1,2): volgnummer van event in 1 rit ernst (0,1,2,3): deceleration level of lead car (0=Missing Data, 1 and 2 = 3 m/s², 3 = 4 m/s²) Lead car deceleration level: 1=3 m/s², 2=4 m/s²
0 50 100 150 200 250 300-0.3
0
0.3
y (m
)
0 50 100 150 200 250 300-0.5
0
0.5
fi(de
gr)
0 50 100 150 200 250 300-2
0
2
dels
(deg
r)
time (s)
Figure 1 Performance of LKS with a SD of the lateral position of 0.1 m: lateral position (top), heading angle (middle), and steering wheel angle (bottom).
Dutch evaluation of Chauffeur Assistant 59

0 10 20 30 40 50 6010
15
20
25
spee
d (m
/s)
Scenario 1
DS ref
0 10 20 30 40 50 600
100
200
dist
(m) DS
ref
0 10 20 30 40 50 60-2
-1
0
1
acc
time (s)
DS ref
Figure 2 Test results of Scenario 1: driving simulator (DS) versus reference model (ref).
0 10 20 30 40 50 6010
15
20
25
spee
d (
Scenario 2
m/s
) DS ref
0 10 20 30 40 50 6020
25
30
35
dist
(m) DS
ref
0 10 20 30 40 50 60-0.5
0
0.5
acc
time (s)
DS ref
Figure 3 Test results of Scenario 2: driving simulator (DS) versus reference model (ref).
Dutch evaluation of Chauffeur Assistant 60

0 10 20 30 40 50 6020
21
22
23
spee
d (
s)
Scenario 3
m/ DS
ref
0 10 20 30 40 50 6010
20
30
40
dist
(m) DS
ref
0 10 20 30 40 50 60-2
-1
0
1
acc
time (s)
DS ref
Figure 4 Test results of Scenario 3: driving simulator (DS) versus refermodel (ref).
ence
0 10 20 30 40 50 6010
15
20
25
spee
d (m
/s)
Scenario 4
DS ref
0 10 20 30 40 50 6020
25
30
35
dist
(m) DS
ref
0 10 20 30 40 50 60-4
-2
0
2
acc
time (s)
DS ref
Figure 5 Test results of Scenario 4: driving simulator (DS) versus reference model (ref).
Dutch evaluation of Chauffeur Assistant 61

0 10 20 30 40 50 6010
15
20
25
spee
d (m
/s)
Scenario 5
DS ref
0 10 20 30 40 50 60
50
0
100
dist
(m) DS
ref
0 10 20 30 40 50 60-0.5
0
0.5
acc
time (s)
DS ref
igure 6 Test results of Scenario 5: driving simulator (DS) versus reference odel (ref).
Fm
Dutch evaluation of Chauffeur Assistant 62

Appendix C: Survey question
orgvuldig door!
te van e en em
halve
n en ermee rijden: d waarmee over de snelweg wilt rijden door te remmen (boven de 40 en onder de 120 km/u). t uiteinde van de rechterpook aan het stuur. Er gaat ngestelde snelheid. van het gaspedaal halen. De wagen rijdt de door u gekozen afstand tot een voorligger aan. stuur houden, maar u kunt ze er ook vanaf halen. U anzelf rechtdoor rijdt. ur Assistant kan maar tot een bepaald maximum rligger te dichtbij komt en het systeem kan het zelf
on (u moet nu dus zelf bij remmen). edaal trapt is de Chauffeur Assistant
weer opnieuw instellen door op het uiteinde
Chauffeur Assistant kunt u uw wenssnelheid aar voren (sneller) en naar achteren
t lampje bij de ingestelde snelheid verspringen. de rijstrook bijstellen door de rechterpook en en dan naar voren of achteren te duwen. moet u eerst de Chauffeur Assistant uitzetten e draaien. Anders kunt u namelijk niet naar
lf de inhaalmanoevre en stelt de Chauffeur Assistant bent op de rechterstrook.
laat de proefleider u kennismaken met drie oorligger. Probeert u ze tijdens het oefenen rustig het eind van de rit vragen welke afstand u het
dan instellen tijdens de twee ritten met de
eld als automaat. U hoeft dus niet te schakelen. ropkomend
de Chauffeur ld.
vliegende e kunnen
tor makkelijker
Dus dezelfde n.
naire
Lees deze instructie z U gaat zometeen 5 ritten maken in onze vrachtwagen-simulator. De eersdeze 5 ritten is een oefenrit. Hierin heeft u de tijd gewend te raken aan dwagen, het rijden en de omgeving. Daarnaast rijdt u twee gewone ritten twee ritten met een zogenaamde “Chauffeur Assistant”. Dit is een systedat voor u automatisch: • uw ingestelde snelheid handhaaft, • afstand houdt tot de voorligger • uw vrachtwagen binnen de lijnen houdt Na in werking stellen van het systeem hoeft u dus niets meer te doen, bein de gaten houden of het gaat zoals u wilt. Chauffeur Assistant instelle• U kiest een snelheihiernaar op te trekken of af• Dan drukt u op heeen lampje branden bij de i• U kunt nu uw voetautomatisch door en houdtU kunt uw handen aan het zult merken dat de wagen v• Let op! De Chaufferemmen. Wanneer een vooniet meer aan klinkt een alarmto• Zodra u zelf op het rempuitgeschakeld. U moet ‘m hiernavan de rechterpook te drukken. • Tijdens het rijden met deaanpassen door de rechterpook n(langzamer) te duwen. U ziet he• U kunt ook uw positie ineerst een tikje naar boven te zett• Wanneer u wilt inhalen door de rechterpook naar “off”tlinks sturen. U maakt nu zeweer in zodra u weer terug Afstand kiezen: • Tijdens de oefenritmogelijke afstanden tot de vuit. De proefleider zal u aan prettigst vond. Deze zal hij Chauffeur Assistant. De wagen • De wagen is ingest• U heeft een linker- en een rechterspiegel, waarin u achteverkeer kunt zien. • Voor u, in het dashboard, kunt u zien hoe hard u rijdt, ofAssistant aan of uit staat en met welke snelheid hij staat ingeste Het rijden: • U begint elke rit met snelheid (u maakt een zogenaamde “start”). Houdt uw voet alvast bij het gaspedaal om direct door trijden. • Stuur voorzichtig! Onze ervaring is dat er in de rijsimulageslingerd wordt omdat het heel licht stuurt. • Rijdt u zoveel mogelijk zoals u normaal ook zou rijden. snelheid houden en inhalen wanneer u dat anders ook zou doe
Dutch evaluation of Chauffeur Assistant 63

• De proefleider zal u aan het begin van elke rit vertellen of u met Chauffeur Assistant gaat rijden of zonder.
gelijk t
zelf heeft geremd.
t alleen over de snelweg en u hoeft alleen maar rechtdoor.
agen? Vraag het de proefleider!
5 antwoordmogelijkheden. Als u een term perfect van toepassing een kruisje in het vakje dat het dichtst bij die term staat. Als u kere mate van toepassing vindt zet het dan aan die kant een ks of rechts van het middelste vakje. Als u er geen uitgesproken
mening over hebt, zet dan een kruisje in het midden (a.u.b. op iedere regel een kruisje plaatsen)
os
__| Slaapverwekkend
• Zet u, in de rit met Chauffeur Assistant, het systeem zo snel moaan (zie hierboven bij “Chauffeur Assistant instellen” hoe dit gaat) en laat hesysteem zo veel mogelijk aan. Stel hem dus zo snel mogelijk weer in nadat u
De omgeving:• U rijd Heeft u nog vr Acceptance Er zijn telkens vindt, zet dan een term in zekruisje, dus lin
Nuttig |__|__|__|__|__| Zinloos Plezierig |__|__|__|__|__| Onplezierig Slecht |__|__|__|__|__| Goed Leuk |__|__|__|__|__| Vervelend Effectief |__|__|__|__|__| Onnodig Irritant |__|__|__|__|__| Aangenaam Behulpzaam |__|__|__|__|__| WaardeloOngewenst |__|__|__|__|__| Gewenst Waakzaamheidverhogend |__|__|__|__|
Dutch evaluation of Chauffeur Assistant 64

Appendix D: Detailed results of driving simulator study
--------------------------------+ aan_a.sta) | | | ----------+----------+----------+ MS | | | | Error | F | p-level |
--------+----------+----------+ 4.88859 | .782 | .388971 | 0.33369*| 1882.510*| .000000*| 4.88859 | .782 | .388971 | --------+----------+----------+
-+ | 0| | -+ | | --+
2 1 | 0.00000 |
+-------------------------+----------+----------+----------+----------+
% of total run time with CA in ON-state +----------+---------------------------------| STAT. |Summary of all Effects; design: (| GENERAL |1-VOLUME, 2- CA | MANOVA | +----------+----------+----------+----------+| | df | MS | df |Effect | Effect | Effect | Error |
+----------+----------+----------+----------+--| 1 | 1 | 35.1 | 17 | 4| 2 | 1*| 132403.9*| 17*| 7| 12 | 1 | 35.1 | 17 | 4+----------+----------+----------+----------+-- +--------------------+--------------------+ | STAT. |Means (aan_a.sta) | | GENERAL |F(1,17)=.78; p<.3890| | MANOVA | | +--------------------+--------------------+ | Depend. | |
| VOLUME CA | Var.1 | +--------------------+--------------------+ | 1 .... | 42.18482 | | 2 .... | 43.58098 | +--------------------+--------------------+ +--------------------+-----------------------| STAT. |Means (aan_a.sta) | GENERAL |F(1,17)=1882.51; p<.000| MANOVA | +--------------------+-----------------------| | Depend. | VOLUME CA | Var.1 -------------------+----------------------+-
| .... 1 | 0.00000 | | .... 2 | 85.76580 | +--------------------+------------------------+ +--------------------+--------------------+ | STAT. |Means (aan_a.sta) | | GENERAL |F(1,17)=.78; p<.3890| | MANOVA | | +--------------------+--------------------+ | | Depend. | | VOLUME CA | Var.1 | +--------------------+--------------------+ | 1 1 | 0.00000 | 1 2 | 84.36964 | |
| | 2 2 | 87.16196 | +--------------------+--------------------+ +-------------------------+-------------------------------------------+ | STAT. |Tukey HSD test; variable Var.1 (aan_a.sta) | | GENERAL |Probabilities for Post Hoc Tests | | MANOVA |INTERACTION: 1 x 2 | +-------------------------+----------+----------+----------+----------+ | | {1} | {2} | {3} | {4} | | VOLUME CA | 0.000000 | 84.36964 | 0.000000 | 87.16196 | +-------------------------+----------+----------+----------+----------+ | 1 1 {1} | | .000178*| 1.000000 | .000178*| | 1 2 {2} | .000178*| | .000178*| .605065 |
2 1 {3} | 1.000000 | .000178*| | .000178*| | | 2 2 {4} | .000178*| .605065 | .000178*| |
Dutch evaluation of Chauffeur Assistant 65

Due to non-normal distribution, ANOVA is formally not justified. Therefore, an
fic volume as the only independent
--------+-------------------------------------------+ | | | -------+ umul. | ercent | -------+ 5.5556 | 0.0000 | 0.0000 | -------+ 0.0000 | -------+
ardless
---+ | | | ---+ | evel |
| 17 | 5.899782 | .037736 | .848277 |
additional ANOVA on runs with CA only, with trafvariable. +-----------+--------------------+ | STAT. |Means (aan_a.sta) | | GENERAL |F(1,17)=.78; p<.3890| | MANOVA | | +-----------+--------------------+ | | Depend. | | VOLUME | Var.1 | +-----------+--------------------+ | 1 | 84.36964 | | 2 | 87.16196 | +-----------+--------------------+ Frequency table of selected time headway: +--| STAT. | THW_SET (set_thw.sta) | BASIC | | STATS | +----------+----------+----------+----------+---| | | Cumul. | | C| Value | Count | Count | Percent | P+----------+----------+----------+----------+---| 1.00000 | 1 | 1 | 5.55556 | | 1.30000 | 8 | 9 | 44.44444 | 5| 1.60000 | 9 | 18 | 50.00000 | 10+----------+----------+----------+----------+---| Missing | 0 | 18 | 0.00000 | 10+----------+----------+----------+----------+--- Mean speed Mean over entire run, including lane changes and braking lead car events, regof CA state: data file: speed_a.STA [ 18 cases with 5 variables ] Recoded data (speed.sta) +----------+--------------------------------------------------------------| STAT. |Summary of all Effects; design: (speed_a.sta) | GENERAL |1-VOLUME, 2- CA | MANOVA | +----------+----------+----------+----------+----------+----------+-------| | df | MS | df | MS | | Effect | Effect | Effect | Error | Error | F | p-l|
+----------+----------+----------+----------+----------+----------+----------+ | 1 | 1 | .69182 | 17 | 2.860164 | .241882 | .629140 | | 2 | 1*| 49.73352*| 17*| 6.774983*| 7.340760*| .014881*| 12 | 1 | .22263|
+----------+----------+----------+----------+----------+----------+----------+
Dutch evaluation of Chauffeur Assistant 66

+--------------------+--------------------+ | STAT. |Means (speed_a.sta) | | GENERAL |F(1,17)=.24; p<.6291| | MANOVA | | +--------------------+--------------------+ | | Depend. | | VOLUME CA | Var.1 | +--------------------+--------------------+ | 1 .... | 80.58434 | | 2 .... | 80.38830 | +--------------------+--------------------+ +--------------------+----------------------+ | STAT. |Means (speed_a.sta) | | GENERAL |F(1,17)=7.34; p<.0149 | | MANOVA | | +--------------------+----------------------+ | | Depend. | | VOLUME CA | Var.1 | +--------------------+----------------------+ | .... 1 | 81.31743 | | .... 2 | 79.65520 | +--------------------+----------------------+ +--------------------+--------------------+ | STAT. |Means (speed_a.sta) | | GENERAL |F(1,17)=.04; p<.8483| | MANOVA | | +--------------------+--------------------+ | | Depend. | | VOLUME CA | Var.1 | +--------------------+--------------------+ | 1 1 | 81.35985 | | 1 2 | 79.80884 | | 2 1 | 81.27501 | | 2 2 | 79.50158 | +--------------------+--------------------+ +-------------------------+--------------------------------------------+ | STAT. |Tukey HSD test; variable Var.1 (speed_a.sta)| | GENERAL |Probabilities for Post Hoc Tests | | MANOVA |INTERACTION: 1 x 2 | +-------------------------+----------+----------+----------+----------++ | | {1} | {2} | {3} | {4} | | VOLUME CA | 81.35985 | 79.80884 | 81.27501 | 79.50158 | +-------------------------+----------+----------+----------+----------+ | 1 1 {1} | | .258564 | .999610 | .138503 | | 1 2 {2} | .258564 | | .302448 | .980846 | | 2 1 {3} | .999610 | .302448 | | .165874 | | 2 2 {4} | .138503 | .980846 | .165874 | | +-------------------------+----------+----------+----------+----------+ The same analysis, now excluding run fragment with CA state = OFF in runs with C----------------------------------------------------+
A:
| STAT. |Summary of all Effects; design: (x_speed_a.sta) | | GENERAL |1-VOLUME, 2-CA | | MANOVA | | +----------+----------+----------+----------+----------+----------+----------+ | | df | MS | df | MS | | | | Effect | Effect | Effect | Error | Error | F | p-level | +----------+----------+----------+----------+----------+----------+----------+ | 1 | 1 | 8.459002 | 17 | 3.890421 | 2.174315 | .158610 | | 2 | 1 | .286285 | 17 | 6.273795 | .045632 | .833387 | | 12 | 1 | 7.522222 | 17 | 5.161795 | 1.457288 | .243891 | +----------+----------+----------+----------+----------+----------+----------+
Dutch evaluation of Chauffeur Assistant 67

+--------------------+----------------------+ | STAT. |Means (x_speed_a.sta) | | GENERAL |F(1,17)=2.17; p<.1586 | | MANOVA | | +--------------------+----------------------+ | | Depend. |
------------------+----------------------+
tion speed run, including lane changes and braking lead car
| VOLUME CA | Var.1 | +--------------------+----------------------+ | 1 .... | 81.60942 | | 2 .... | 80.92390 | +--------------------+----------------------+ +--------------------+---------------------+ | STAT. |Means (x_speed_a.sta)| | GENERAL |F(1,17)=.05; p<.8334 | | MANOVA | | +--------------------+--------------------++ | | Depend. | | VOLUME CA | Var.1 | +--------------------+--------------------+ | .... 1 | 81.32971 | | .... 2 | 81.20360 | +--------------------+--------------------+ +--| STAT. |Means (x_speed_a.sta) | | GENERAL |F(1,17)=1.46; p<.2439 | | MANOVA | | +--------------------+----------------------+ | | Depend. |
| VOLUME CA | Var.1 | +--------------------+----------------------+ | 1 1 | 81.34925 | | 1 2 | 81.86959 | | 2 1 | 81.31018 | | 2 2 | 80.53761 | +--------------------+----------------------+ +-------------------------+----------------------------------------------+ | STAT. |Tukey HSD test; variable Var.1 (x_speed_a.sta)| | GENERAL |Probabilities for Post Hoc Tests | | MANOVA |INTERACTION: 1 x 2 | +-------------------------+----------+----------+----------+----------+--+ | | {1} | {2} | {3} | {4} | | VOLUME CA | 81.34925 | 81.86959 | 81.31018 | 80.53761 | +-------------------------+----------+----------+----------+----------+ | 1 1 {1} | | .900671 | .999953 | .710820 | | 1 2 {2} | .900671 | | .880229 | .326017 | | 2 1 {3} | .999953 | .880229 | | .740249 | | 2 2 {4} | .710820 | .326017 | .740249 | | +-------------------------+----------+----------+----------+----------+ Standard deviaStandard deviation (sd) over entireevents, regardless of CA state +----------+-----------------------------------------------------------------+ | STAT. |Summary of all Effects; design: (speedsd_a.sta) | | GENERAL |1-VOLUME, 2-CA | | MANOVA | | +----------+----------+----------+----------+----------+----------+----------+ | | df | MS | df | MS | | | | Effect | Effect | Effect | Error | Error | F | p-level | +----------+----------+----------+----------+----------+----------+----------+ | 1 | 1 | 3.44719 | 17 | 2.735011 | 1.26039 | .277182 | | 2 | 1*| 52.52493*| 17*| 3.378550*| 15.54659*| .001049*| | 12 | 1 | 4.51266 | 17 | 3.120148 | 1.44630 | .245606 | +----------+----------+----------+----------+----------+----------+----------+
Dutch evaluation of Chauffeur Assistant 68

+--------------------+----------------------+ | STAT. |Means (speedsd_a.sta) | | GENERAL |F(1,17)=1.26; p<.2772 | | MANOVA | | +--------------------+----------------------+ | | Depend. | | VOLUME CA | Var.1 | +--------------------+----------------------+ | 1 .... | 8.018622 | | 2 .... | 7.581003 | +--------------------+----------------------+ +--------------------+----------------------+ | STAT. |Means (speedsd_a.sta) | | GENERAL |F(1,17)=15.55; p<.0010| | MANOVA | | +--------------------+----------------------+ | | Depend. |
------------------+----------------------+
excluding run fragment with CA state = OFF in runs with CA:
--------------+ |
| VOLUME CA | Var.1 | +--------------------+----------------------+ | .... 1 | 6.945697 | | .... 2 | 8.653928 | +--------------------+----------------------+ +--| STAT. |Means (speedsd_a.sta) | | GENERAL |F(1,17)=1.45; p<.2456 | | MANOVA | | +--------------------+----------------------+ | | Depend. |
| VOLUME CA | Var.1 | +--------------------+----------------------+ | 1 1 | 6.914155 | | 1 2 | 9.123089 | | 2 1 | 6.977239 | | 2 2 | 8.184767 | +--------------------+----------------------+ +-------------------------+----------------------------------------------+ | STAT. |Tukey HSD test; variable Var.1 (speedsd_a.sta)| | GENERAL |Probabilities for Post Hoc Tests | | MANOVA |INTERACTION: 1 x 2 | +-------------------------+----------+----------+----------+----------+--+ | | {1} | {2} | {3} | {4} | | VOLUME CA | 6.914155 | 9.123089 | 6.977239 | 8.184767 | +-------------------------+----------+----------+----------+----------+ | 1 1 {1} | | .007945*| .999583 | .175179 | | 1 2 {2} | .007945*| | .009902*| .408196 | | 2 1 {3} | .999583 | .009902*| | .209017 | | 2 2 {4} | .175179 | .408196 | .209017 | | +-------------------------+----------+----------+----------+----------+ The same analysis, now +----------+---------------------------------------------------STAT. |Summary of all Effects; design: (x_speedsd_a.sta) |
| GENERAL |1-VOLUME, 2-CA | | MANOVA | | +----------+----------+----------+----------+----------+----------+----------+ | | df | MS | df | MS | | | | Effect | Effect | Effect | Error | Error | F | p-level | +----------+----------+----------+----------+----------+----------+----------+ | 1 | 1 | .69526 | 17 | 3.161579 | .219908 | .645068 | | 2 | 1 | 12.89304 | 17 | 7.155241 | 1.801902 | .197135 | | 12 | 1 | .88241 | 17 | 2.032319 | .434190 | .518767 | +----------+----------+----------+----------+----------+----------+----------+
Dutch evaluation of Chauffeur Assistant 69

+--------------------+-----------------------+
-+
4.4 Lane use % of total run time in right lane +----------+-----------------------------------------------------------------+ | STAT. |Summary of all Effects; design: (rightlan_a.sta) | | GENERAL |1-VOLUME, 2-CA | | MANOVA | | +----------+----------+----------+----------+----------+----------+----------+ | | df | MS | df | MS | | | | Effect | Effect | Effect | Error | Error | F | p-level | +----------+----------+----------+----------+----------+----------+----------+ | 1 | 1*| 829.9281*| 17*| 94.3084*| 8.800147*| .008650*| | 2 | 1 | 111.6641 | 17 | 135.9496 | .821364 | .377449 | | 12 | 1 | 32.7230 | 17 | 70.8344 | .461965 | .505858 | +----------+----------+----------+----------+----------+----------+----------+
| STAT. |Means (x_speedsd_a.sta)|| GENERAL |F(1,17)=.22; p<.6451 || MANOVA | |+--------------------+--------------------+--+| | Depend. | | VOLUME CA | Var.1 | +--------------------+--------------------+ | 1 .... | 6.357472 | | 2 .... | 6.554006 | +--------------------+--------------------+ +--------------------+-----------------------+ | STAT. |Means (x_speedsd_a.sta)| | GENERAL |F(1,17)=1.80; p<.1971 | | MANOVA | | +--------------------+----------------------++ | | Depend. | | VOLUME CA | Var.1 | +--------------------+----------------------+ | .... 1 | 6.878906 | | .... 2 | 6.032572 | +--------------------+----------------------+ +--------------------+-----------------------+| STAT. |Means (x_speedsd_a.sta)|| GENERAL |F(1,17)=.43; p<.5188 || MANOVA | |+--------------------+--------------------+--+| | Depend. | | VOLUME CA | Var.1 | +--------------------+--------------------+ | 1 1 | 6.891345 | | 1 2 | 5.823600 | | 2 1 | 6.866467 | | 2 2 | 6.241544 | +--------------------+--------------------+ +-------------------------+------------------------------------------------+| STAT. |Tukey HSD test; variable Var.1 (x_speedsd_a.sta)|| GENERAL |Probabilities for Post Hoc Tests || MANOVA |INTERACTION: 1 x 2 |+-------------------------+----------+----------+----------+----------+---| | {1} | {2} | {3} | {4} | | VOLUME CA | 6.891345 | 5.823600 | 6.866467 | 6.241544 | +-------------------------+----------+----------+----------+----------+ | 1 1 {1} | | .150593 | .999951 | .535377 | | 1 2 {2} | .150593 | | .164692 | .815418 | | 2 1 {3} | .999951 | .164692 | | .566374 | | 2 2 {4} | .535377 | .815418 | .566374 | |
-----------------------+----------+----------+----------+----------+ +--
Dutch evaluation of Chauffeur Assistant 70

+--------------------+----------------------+ | STAT. |Means (rightlan_a.sta)| | GENERAL |F(1,17)=8.80; p<.0087 | | MANOVA | | +--------------------+----------------------+ | | Depend. |
----------------------------+ iable Var.1 (rightlan_a.sta)| ost Hoc Tests | |
-----------------------+----------+----------+----------+----------+---+ | {1} | {2} | {3} | {4} |
7 | 83.55495 | 84.69733 | --+----------+----------+ 7 | .249143 | .441093 | | .019742*| .044678*| 2*| | .976533 | 8*| .976533 | | --+----------+----------+
un (of 15 min):
-------------------------------+ anech_a.sta) |
ENERAL |1-VOLUME, 2-CA |
+----------+----------+----------+----------+----------+----------+----------+ | | df | MS | df | MS | | | | Effect | Effect | Effect | Error | Error | F | p-level | +----------+----------+----------+----------+----------+----------+----------+ | 1 | 1 | 21.12500 | 17 | 27.86029 | .758248 | .396008 | | 2 | 1 | 58.68056 | 17 | 19.94526 | 2.942080 | .104468 | | 12 | 1 | 2.34722 | 17 | 25.20016 | .093143 | .763924 | +----------+----------+----------+----------+----------+----------+----------+
| VOLUME CA | Var.1 | +--------------------+----------------------+ | 1 .... | 90.91637 | | 2 .... | 84.12614 | +--------------------+----------------------+ +--------------------+----------------------+ | STAT. |Means (rightlan_a.sta)| | GENERAL |F(1,17)=.82; p<.3774 | | MANOVA | | +--------------------+--------------------+-+ | | Depend. | | VOLUME CA | Var.1 |
------------------+--------------------+ +--| .... 1 | 86.27590 | | .... 2 | 88.76660 | +--------------------+--------------------+ +--------------------+----------------------+ | STAT. |Means (rightlan_a.sta)| | GENERAL |F(1,17)=.46; p<.5059 | | MANOVA | | +--------------------+--------------------+-+ | | Depend. | | VOLUME CA | Var.1 | +--------------------+--------------------+ | 1 1 | 88.99686 | | 1 2 | 92.83587 | | 2 1 | 83.55495 | | 2 2 | 84.69733 | +--------------------+--------------------+ +-------------------------+-------------------| STAT. |Tukey HSD test; var| GENERAL |Probabilities for P| MANOVA |INTERACTION: 1 x 2 +--| | VOLUME CA | 88.99686 | 92.8358+-------------------------+----------+--------| 1 1 {1} | | .53479| 1 2 {2} | .534797 | | 2 1 {3} | .249143 | .01974| 2 2 {4} | .441093 | .04467+-------------------------+----------+-------- Lane change frequency Number of lane changes that occurred in each r +----------+----------------------------------| STAT. |Summary of all Effects; design: (l| G| MANOVA | |
Dutch evaluation of Chauffeur Assistant 71

+--------------------+--------------------+ | STAT. |Means (lanech_a.sta)| | GENERAL |F(1,17)=.76; p<.3960| | MANOVA | | +--------------------+--------------------+ | | Depend. | | VOLUME CA | Var.1 | +--------------------+--------------------+ | 1 .... | 6.500000 | | 2 .... | 7.583333 | +--------------------+--------------------+ +--------------------+----------------------+ | STAT. |Means (lanech_a.sta) |
--------------------------+ iable Var.1 (lanech_a.sta)| ost Hoc Tests | | +----------+----------+-+ | {3} | {4} | | 8.666667 | 6.500000 | +----------+----------+ | .823534 | .972289 |
| .341265 | .972289 | 5 | | .578443 | 9 | .578443 | | --+----------+----------+
| GENERAL |F(1,17)=2.94; p<.1045 | MANOVA | | |
+--------------------+----------------------+ | | Depend. | | VOLUME CA | Var.1 | +--------------------+----------------------+ | .... 1 | 7.944445 | | .... 2 | 6.138889 | +--------------------+----------------------+ +--------------------+--------------------+ | STAT. |Means (lanech_a.sta)| | GENERAL |F(1,17)=.09; p<.7639| | MANOVA | | +--------------------+--------------------+
| Depend. | | | VOLUME CA | Var.1 | +--------------------+--------------------+ | 1 1 | 7.222222 | | 1 2 | 5.777778 | | 2 1 | 8.666667 | | 2 2 | 6.500000 | +--------------------+--------------------+ +-------------------------+-------------------| STAT. |Tukey HSD test; var| GENERAL |Probabilities for P| MANOVA |INTERACTION: 1 x 2 +-------------------------+----------+----------| | {1} | {2} | VOLUME CA | 7.222222 | 5.777778 +-------------------------+----------+----------| 1 1 {1} | | .823534 | 1 2 {2} | .823534 | | 2 1 {3} | .823534 | .34126| 2 2 {4} | .972289 | .97228+-------------------------+----------+--------
Dutch evaluation of Chauffeur Assistant 72

Mean lateral position Mean distance between right side of the truck and the right lane boundary. With a vehicle width of 2.5 m, and a lane width of 3.5 m: � a lateral position of 0.5 m corresponds to the middle of the lane � a lateral position of 1.0 m corresponds to driving on the left lane boundary.
---+ | | | ---+ |
Effect | Effect | Effect | Error | Error | F | p-level | ---+----------+----------+----------+
17 | .028262 | .346590 | .563791 |
1 .... | .236125 |
+----------+--------------------------------------------------------------| STAT. |Summary of all Effects; design: (baan_r_a.sta) | GENERAL |1-VOLUME, 2-CA | MANOVA | +----------+----------+----------+----------+----------+----------+-------| | df | MS | df | MS | | | +----------+----------+----------+-------
| 1 | .009795 | | 1| 2 | 1 | .020862 | 17 | .054804 | .380675 | .545418 | | 12 | 1 | .015872 | 17 | .024080 | .659118 | .428094 | +----------+----------+----------+----------+----------+----------+----------+ +--------------------+--------------------+ | STAT. |Means (baan_r_a.sta)| | GENERAL |F(1,17)=.35; p<.5638| | MANOVA | | +--------------------+--------------------+ | | Depend. | | VOLUME CA | Var.1 | +--------------------+--------------------+ | | 2 .... | .259453 | +--------------------+--------------------+ +--------------------+--------------------+ | STAT. |Means (baan_r_a.sta)| | GENERAL |F(1,17)=.38; p<.5454| | MANOVA | | +--------------------+--------------------+ | | Depend. | | VOLUME CA | Var.1 | +--------------------+--------------------+
.... 1 | .230767 | | | .... 2 | .264811 | +--------------------+--------------------+ +--------------------+--------------------+ | STAT. |Means (baan_r_a.sta)| | GENERAL |F(1,17)=.66; p<.4281| | MANOVA | | +--------------------+--------------------+ | | Depend. | | VOLUME CA | Var.1 | +--------------------+--------------------+ | 1 1 | .233950 | | 1 2 | .238300 | | 2 1 | .227583 | | 2 2 | .291322 | +--------------------+--------------------+
Dutch evaluation of Chauffeur Assistant 73

+-------------------------+---------------------------------------------+ | STAT. |Tukey HSD test; variable Var.1 (baan_r_a.sta)| | GENERAL |Probabilities for Post Hoc Tests | | MANOVA |INTERACTION: 1 x 2 | +-------------------------+----------+----------+----------+----------+-+ | | {1} | {2} | {3} | {4} | | VOLUME CA | .2339500 | .2383000 | .2275833 | .2913222 | +-------------------------+----------+----------+----------+----------+ | 1 1 {1} | | .999798 | .999369 | .689039 | | 1 2 {2} | .999798 | | .996794 | .737473 | | 2 1 {3} | .999369 | .996794 | | .615890 | | 2 2 {4} | .689039 | .737473 | .615890 | | +-------------------------+----------+----------+----------+----------+ The same analysis, now excluding run fragment with CA state = OFF in runs with CA: +----------+-----------------------------------------------------------------+ | STAT. |Summary of all Effects; design: (x_baan_r_a.sta) | | GENERAL |1-VOLUME, 2-CA | | MANOVA | | +----------+----------+----------+----------+----------+----------+----------+ | | df | MS | df | MS | | | | Effect | Effect | Effect | Error | Error | F | p-level | +----------+----------+----------+----------+----------+----------+----------+ | 1 | 1 | .015202 | 17 | .030952 | .491148 | .492897 | | 2 | 1 | .039509 | 17 | .063403 | .623134 | .440757 | | 12 | 1 | .022592 | 17 | .028409 | .795238 | .384970 | +----------+----------+----------+----------+----------+----------+----------+
+--------------------+----------------------+ | STAT. |Means (x_baan_r_a.sta)| | GENERAL |F(1,17)=.49; p<.4929 | | MANOVA | | +--------------------+--------------------+-+ | | Depend. | | VOLUME CA | Var.1 | +--------------------+--------------------+ | 1 .... | .239661 | | 2 .... | .268722 |
------------------+--------------------+ +-- +--------------------+----------------------+ | STAT. |Means (x_baan_r_a.sta)| | GENERAL |F(1,17)=.62; p<.4408 | | MANOVA | | +--------------------+--------------------+-+ | | Depend. | | VOLUME CA | Var.1 | +--------------------+--------------------+ | .... 1 | .230767 | | .... 2 | .277617 | +--------------------+--------------------+ +--------------------+----------------------+ | STAT. |Means (x_baan_r_a.sta)| | GENERAL |F(1,17)=.80; p<.3850 | | MANOVA | | +--------------------+--------------------+-+ | | Depend. | | VOLUME CA | Var.1 | +--------------------+--------------------+ | 1 1 | .233950 | | 1 2 | .245372 | | 2 1 | .227583 | | 2 2 | .309861 |
------------------+--------------------+ +--
Dutch evaluation of Chauffeur Assistant 74

+-------------------------+-----------------------------------------------+ | STAT. |Tukey HSD test; variable Var.1 (x_baan_r_a.sta)| | GENERAL |Probabilities for Post Hoc Tests | | MANOVA |INTERACTION: 1 x 2 | +-------------------------+----------+----------+----------+----------+---+ | | {1} | {2} | {3} | {4} | | VOLUME CA | .2339500 | .2453722 | .2275833 | .3098611 | +-------------------------+----------+----------+----------+----------+ | 1 1 {1} | | .996969 | .999507 | .544992 | | 1 2 {2} | .996969 | | .988676 | .666251 | | 2 1 {3} | .999507 | .988676 | | .479164 | | 2 2 {4} | .544992 | .666251 | .479164 | | +-------------------------+----------+----------+----------+----------+ 4.7 Standard deviation lateral position
(baan_sd_a.sta) | GENERAL |1-VOLUME, 2-CA |
| ---+----------+----------+----------+----------+----------+
------------------+----------------------+
------------------+----------------------+ | | Depend. | | VOLUME CA | Var.1 | +--------------------+----------------------+ | 1 1 | .348739 | | 1 2 | .278050 | | 2 1 | .363461 | | 2 2 | .225828 | +--------------------+----------------------+
+----------+-----------------------------------------------------------------+ | STAT. |Summary of all Effects; design: | | MANOVA | ---------+-------+-
| | df | MS | df | MS | | | | Effect | Effect | Effect | Error | Error | F | p-level | +----------+----------+----------+----------+----------+----------+----------+ | 1 | 1 | .006328 | 17 | .003260 | 1.94129 | .181480 | | 2 | 1*| .195292*| 17*| .006836*| 28.56614*| .000054*| | 12 | 1*| .020167*| 17*| .002731*| 7.38392*| .014635*| +----------+----------+----------+----------+----------+----------+----------+ +--------------------+----------------------+ | STAT. |Means (baan_sd_a.sta) | | GENERAL |F(1,17)=1.94; p<.1815 | | MANOVA | | +--| | Depend. | | VOLUME CA | Var.1 | +--------------------+----------------------+ | 1 .... | .313394 | | 2 .... | .294644 | +--------------------+----------------------+ +--------------------+----------------------+ | STAT. |Means (baan_sd_a.sta) | | GENERAL |F(1,17)=28.57; p<.0001| | MANOVA | |
------------------+----------------------+ +--| | Depend. | | VOLUME CA | Var.1 | +--------------------+----------------------+ | .... 1 | .356100 | | .... 2 | .251939 | +--------------------+----------------------+ +--------------------+----------------------+ | STAT. |Means (baan_sd_a.sta) | | GENERAL |F(1,17)=7.38; p<.0146 | | MANOVA | | +--
Dutch evaluation of Chauffeur Assistant 75

+-------------------------+----------------------------------------------+ iable Var.1 (baan_sd_a.sta)| ost Hoc Tests | | --+----------+----------+--+ | {3} | {4} | 0 | .3634611 | .2258278 | --+----------+----------+ 4*| .832359 | .000184*| | .000844*| .036899*| 4*| | .000179*| 9*| .000179*| | --+----------+----------+
ith CA:
--+ | | | ---+ | el | ---+ 23 | 00*| 214 |
---------+----------+----------+----------+----------+----------+----------+
| +
|
| STAT. |Tukey HSD test; var| GENERAL |Probabilities for P| MANOVA |INTERACTION: 1 x 2 +-------------------------+----------+--------| | {1} | {2} | VOLUME CA | .3487389 | .278050+-------------------------+----------+--------| 1 1 {1} | | .00423| 1 2 {2} | .004234*| | 2 1 {3} | .832359 | .00084| 2 2 {4} | .000184*| .03689+-------------------------+----------+-------- The same analysis, now excluding run fragment with CA state = OFF in runs w +----------+---------------------------------------------------------------| STAT. |Summary of all Effects; design: (x_baan_sd_a.sta) | GENERAL |1-VOLUME, 2-CA | MANOVA | +----------+----------+----------+----------+----------+----------+-------| | df | MS | df | MS | | | Effect | Effect | Effect | Error | Error | F | p-lev+----------+----------+----------+----------+----------+----------+-------| 1 | 1 | .001312 | 17 | .000553 | 2.3734 | .1418| 2 | 1*| .963943*| 17*| .008092*| 119.1240*| .0000| 12 | 1 | .000689 | 17 | .001745 | .3946 | .538+- +--------------------+-----------------------+ STAT. |Means (x_baan_sd_a.sta)| |
| GENERAL |F(1,17)=2.37; p<.1418 | | MANOVA | | +--------------------+----------------------++ | | Depend. | | VOLUME CA | Var.1 | +--------------------+----------------------+ | 1 .... | .236125 | | 2 .... | .244661 | +--------------------+----------------------+ +--------------------+------------------------+ | STAT. |Means (x_baan_sd_a.sta) | | GENERAL |F(1,17)=119.12; p<.0000 |
ANOVA | | | M+--------------------+------------------------+| | Depend. || VOLUME CA | Var.1 |+--------------------+------------------------+| .... 1 | .356100 || .... 2 | .124686 +--------------------+------------------------ +--------------------+-----------------------+| STAT. |Means (x_baan_sd_a.sta)|| GENERAL |F(1,17)=.39; p<.5382 |
ANOVA | | M+--------------------+--------------------+--+ | | Depend. | | VOLUME CA | Var.1 | +--------------------+--------------------+ | 1 1 | .348739 | | 1 2 | .123511 | | 2 1 | .363461 | | 2 2 | .125861 | +--------------------+--------------------+
Dutch evaluation of Chauffeur Assistant 76

+-------------------------+------------------------------------------------+ able Var.1 (x_baan_sd_a.sta)| st Hoc Tests | | -+----------+----------+----+ | {3} | {4} | 1 | .3634611 | .1258611 | --+----------+----------+ 8*| .719197 | .000178*| | .000178*| .998292 | 8*| | .000178*| 2 | .000178*| | --+----------+----------+
the , see
---+ | | | ---+ |
Effect | Effect | Effect | Error | Error | F | p-level | ---------+----------+----------+----------+----------+----------+----------+
.366419 | 1.01734 | .327292 | .703738*| 12.22317*| .002767*|
| STAT. |Tukey HSD test; vari| GENERAL |Probabilities for Po| MANOVA |INTERACTION: 1 x 2 +-------------------------+----------+---------| | {1} | {2} | VOLUME CA | .3487389 | .123511+-------------------------+----------+--------| 1 1 {1} | | .00017| 1 2 {2} | .000178*| | 2 1 {3} | .719197 | .00017| 2 2 {4} | .000178*| .99829+-------------------------+----------+-------- Time to Line Crossing TLC was first determined for each sample using the approach that is based on distance to the line (D) and the lateral velocity (vlat) (i.e., TLC = D/vlat)Van Winsum, Brookhuis and De Waard (2000). Mean of TLC minima +----------+--------------------------------------------------------------| STAT. |Summary of all Effects; design: (tlc_m_a.sta) | GENERAL |1-VOLUME, 2-CA | MANOVA | +----------+----------+----------+----------+----------+----------+-------| | df | MS | df | MS | | | +-| 1 | 1 | .372773 | 17 | 2 | 1*| 8.601915*| 17*| |
| 12 | 1 | .002395 | 17 | .309501 | .00774 | .930924 | +----------+----------+----------+----------+----------+----------+----------+ +--------------------+----------------------+ | STAT. |Means (tlc_m_a.sta) | | GENERAL |F(1,17)=1.02; p<.3273 | | MANOVA | | +--------------------+----------------------+ | | Depend. | | VOLUME CA | Var.1 | +--------------------+----------------------+ | 1 .... | 2.811556 | | 2 .... | 2.667647 |+--------------------+----------------------+ +--------------------+----------------------+ | STAT. |Means (tlc_m_a.sta) | | GENERAL |F(1,17)=12.22; p<.0028| | MANOVA | | +--------------------+----------------------+ | | Depend. | | VOLUME CA | Var.1 | +--------------------+----------------------+ | .... 1 | 2.393955 |
.... 2 | 3.085247 || +--------------------+----------------------+
Dutch evaluation of Chauffeur Assistant 77

+--------------------+--------------------+ | STAT. |Means (tlc_m_a.sta) | | GENERAL |F(1,17)=.01; p<.9309| | MANOVA | | +--------------------+--------------------+ | | Depend. | | VOLUME CA | Var.1 | +--------------------+--------------------+ | 1 1 | 2.471678 | | 1 2 | 3.151433 | | 2 1 | 2.316233 | | 2 2 | 3.019061 | +--------------------+--------------------+ +-------------------------+--------------------------------------------+ | STAT. |Tukey HSD test; variable Var.1 (tlc_m_a.sta)| | GENERAL |Probabilities for Post Hoc Tests | | MANOVA |INTERACTION: 1 x 2 | +-------------------------+----------+----------+----------+----------++ | | {1} | {2} | {3} | {4} | | VOLUME CA | 2.471678 | 3.151433 | 2.316233 | 3.019061 | +-------------------------+----------+----------+----------+----------+ | 1 1 {1} | | .009481*| .835672 | .040423*| | 1 2 {2} | .009481*| | .001742*| .890317 | | 2 1 {3} | .835672 | .001742*| | .007337*| | 2 2 {4} | .040423*| .890317 | .007337*| | +-------------------------+----------+----------+----------+----------+ The same analysis, now excluding run fragment with CA state = OFF in runs with CA: +----------+-----------------------------------------------------------------+ | STAT. |Summary of all Effects; design: (x_tlc_m_a.sta) | | GENERAL |1-VOLUME, 2-CA | | MANOVA | | +----------+----------+----------+----------+----------+----------+----------+ | | df | MS | df | MS | | | | Effect | Effect | Effect | Error | Error | F | p-level | +----------+----------+----------+----------+----------+----------+----------+ | 1 | 1 | .39559 | 17 | .490914 | .80582 | .381896 | | 2 | 1*| 19.47515*| 17*| 1.195380*| 16.29201*| .000857*| | 12 | 1 | .00093 | 17 | .402426 | .00232 | .962170 | +----------+----------+----------+----------+-
---------+----------+----------+
------------------+----------------------+
+--------------------+---------------------+ | STAT. |Means (x_tlc_m_a.sta)| | GENERAL |F(1,17)=.81; p<.3819 | | MANOVA | | +--------------------+--------------------++ | | Depend. | | VOLUME CA | Var.1 | +--------------------+--------------------+ | 1 .... | 2.988164 | | 2 .... | 2.839917 |
------------------+--------------------+ +-- +--------------------+----------------------+ | STAT. |Means (x_tlc_m_a.sta) | | GENERAL |F(1,17)=16.29; p<.0009| | MANOVA | | +--------------------+----------------------+ | | Depend. | | VOLUME CA | Var.1 | +--------------------+----------------------+ | .... 1 | 2.393955 | | .... 2 | 3.434125 | +--
Dutch evaluation of Chauffeur Assistant 78

+--------------------+---------------------+ | STAT. |Means (x_tlc_m_a.sta)| | GENERAL |F(1,17)=.00; p<.9622 | | MANOVA | | +--------------------+--------------------++ | | Depend. | | VOLUME CA | Var.1 | +--------------------+--------------------+ | 1 1 | 2.471678 | | 1 2 | 3.504650 | | 2 1 | 2.316233 | | 2 2 | 3.363600 | +--------------------+--------------------+ +-------------------------+----------------------------------------------+ | STAT. |Tukey HSD test; variable Var.1 (x_tlc_m_a.sta)| | GENERAL |Probabilities for Post Hoc Tests | | MANOVA |INTERACTION: 1 x 2 | +-------------------------+----------+----------+----------+----------+--+ | | {1} | {2} | {3} | {4} | | VOLUME CA | 2.471678 | 3.504650 | 2.316233 | 3.363600 | +-------------------------+----------+----------+----------+----------+ | 1 1 {1} | | .000870*| .881700 | .003059*| | 1 2 {2} | .000870*| | .000330*| .908088 | | 2 1 {3} | .881700 | .000330*| | .000777*| | 2 2 {4} | .003059*| .908088 | .000777*| | +-------------------------+----------+----------+----------+----------+ 4.8.2 Percentage of time with TLC < 1 s +----------+-----------------------------------------------------------------+ | STAT. |Summary of all Effects; design: (tlc_1_a.sta) | | GENERAL |1-VOLUME, 2-CA | | MANOVA | | +----------+----------+----------+----------+----------+----------+----------+ | | df | MS | df | MS | | | | Effect | Effect | Effect | Error | Error | F | p-level | +----------+----------+----------+----------+----------+----------+----------+ | 1 | 1 | 32.64239 | 17 | 299.5226 | .108981 | .745340 | | 2 | 1 | 37.41615 | 17 | 490.5165 | .076279 | .785734 | | 12 | 1 | 66.58503 | +----------+----------+----------+-----
17 | 258.9626 | .257122 | .618618 | -----+----------+----------+----------+
---+ a) | 453| | ---+ | | ---+ |
| 33.26808 | +--------------------+
+--------------------+-----------------| STAT. |Means (tlc_1_a.st| GENERAL |F(1,17)=.11; p<.7| MANOVA | +--------------------+-----------------| | Depend. | VOLUME CA | Var.1 +--------------------+-----------------| 1 .... | 34.61473 | 2 .... +-------------------- +--------------------+--------------------+ | STAT. |Means (tlc_1_a.sta) | | GENERAL |F(1,17)=.08; p<.7857| | MANOVA | | +--------------------+--------------------+ | | Depend. | | VOLUME CA | Var.1 | +--------------------+--------------------+ | .... 1 | 34.66228 | | .... 2 | 33.22052 | +--------------------+--------------------+
Dutch evaluation of Chauffeur Assistant 79

+--------------------+--------------------+ sta) | .6186| | -----+ | | -----+ | | |
2 | 31.58554 | -----+
th CA state = OFF in runs with CA:
-----------------------------+ lc_1_a.sta) | | | -------+----------+----------+ MS | | | Error | F | p-level | -------+----------+----------+ 9.0462 | .197408 | .662426 | 48.0977 | .279510 | .603857 | 3.3277 | .376300 | .547711 | -------+----------+----------+
| STAT. |Means (tlc_1_a.| GENERAL |F(1,17)=.26; p<| MANOVA | +--------------------+---------------| | Depend. | VOLUME CA | Var.1 +--------------------+---------------| 1 1 | 34.37395 | 1 2 | 34.85551 | 2 1 | 34.95062| 2+--------------------+--------------- +-------------------------+--------------------------------------------+ STAT. |Tukey HSD test; variable Var.1 (tlc_1_a.sta)| |
| GENERAL |Probabilities for Post Hoc Tests | | MANOVA |INTERACTION: 1 x 2 | +-------------------------+----------+----------+----------+----------++ | | {1} | {2} | {3} | {4} | | VOLUME CA | 34.37395 | 34.85551 | 34.95062 | 31.58554 | +-------------------------+----------+----------+----------+----------+ | 1 1 {1} | | .999754 | .999579 | .953235 | | 1 2 {2} | .999754 | | .999998 | .927699 | | 2 1 {3} | .999579 | .999998 | | .921922 | | 2 2 {4} | .953235 | .927699 | .921922 | | +-------------------------+----------+----------+----------+----------+ The same analysis, now excluding run fragment wi +----------+------------------------------------| STAT. |Summary of all Effects; design: (x_t| GENERAL |1-VOLUME, 2-CA | MANOVA | +----------+----------+----------+----------+---| | df | MS | df | | Effect | Effect | Effect | Error | +----------+----------+----------+----------+---| 1 | 1 | 64.9563 | 17 | 32
| 1 | 153.1988 | 17 | 5| 2| 12 | 1 | 110.3793 | 17 | 29+----------+----------+----------+----------+--- +--------------------+---------------------+ | STAT. |Means (x_tlc_1_a.sta)| | GENERAL |F(1,17)=.20; p<.6624 | | MANOVA | | +--------------------+--------------------++ | | Depend. | | VOLUME CA | Var.1 | +--------------------+--------------------+ | 1 .... | 34.15343 | | 2 .... | 32.25378 | +--------------------+--------------------+ +--------------------+---------------------+ | STAT. |Means (x_tlc_1_a.sta)| | GENERAL |F(1,17)=.28; p<.6039 | | MANOVA | | +--------------------+--------------------++ | | Depend. | | VOLUME CA | Var.1 | +--------------------+--------------------+ | .... 1 | 34.66228 | | .... 2 | 31.74492 |
------------------+--------------------+ +--
Dutch evaluation of Chauffeur Assistant 80

+--------------------+---------------------+ | STAT. |Means (x_tlc_1_a.sta)| | GENERAL |F(1,17)=.38; p<.5477 | | MANOVA | | +--------------------+--------------------++ | | Depend. | | VOLUME CA | Var.1 | +--------------------+--------------------+ | 1 1 | 34.37395 | | 1 2 | 33.93291 | | 2 1 | 34.95062 | | 2 2 | 29.55693 | +--------------------+--------------------+ +-------------------------+----------------------------------------------+
were ndent variable in the ANOVA. ---------------------------+ sd_a.sta) | | | ------+----------+----------+ MS | | | Error | F | p-level | -------+----------+----------+ 000404*| 5.423744*| .032456*| -------+----------+----------+
steering wheel signal by 6 Hz divided by the energy in the
---------------------------+ a.sta) |
| | ---------+----------+----------+ MS | | | Error | F | p-level | ---------+----------+----------+ .004831 | .905746 | .354582 |
--------+----------+----------+----------+----------+----------+----------+
| STAT. |Tukey HSD test; variable Var.1 (x_tlc_1_a.sta)| | GENERAL |Probabilities for Post Hoc Tests | | MANOVA |INTERACTION: 1 x 2 | +-------------------------+----------+----------+----------+----------+--+ | | {1} | {2} | {3} | {4} | | VOLUME CA | 34.37395 | 33.93291 | 34.95062 | 29.55693 | +-------------------------+----------+----------+----------+----------+ | 1 1 {1} | | .999843 | .999650 | .833016 | | 1 2 {2} | .999843 | | .997968 | .868416 | | 2 1 {3} | .999650 | .997968 | | .781606 | | 2 2 {4} | .833016 | .868416 | .781606 | | +-------------------------+----------+----------+----------+----------+ Standard deviation steering wheel angle
this (and other steering wheel angle related measures), only runs without CAForanalysed. Thus, traffic volume was the only indepe+----------+--------------------------------------| STAT. |Summary of all Effects; design: (stuur| GENERAL |1-VOLUME | MANOVA |
-+----------+----------+----------+----------+---| | df | MS | df | | Effect | Effect | Effect | Error | +----------+----------+----------+----------+---| 1 | 1*| .002192*| 17*| .+----------+----------+----------+----------+--- +-----------+----------------------+ | STAT. |Means (stuursd_a.sta) | | GENERAL |F(1,17)=5.42; p<.0325 | | MANOVA | | +-----------+----------------------+ | | Depend. | | VOLUME | Var.1 | +-----------+----------------------+ | 1 | .103489 | | 2 | .119094 | +-----------+----------------------+ High-Frequency Area The High-Frequency Area (HFA) is derived from the determining the power in the frequency band 0.3-0.frequency band 0.0-0.6 Hz. +----------+--------------------------------------
fa_| STAT. |Summary of all Effects; design: (h| GENERAL |1-VOLUME | MANOVA | +----------+----------+----------+----------+-| | df | MS | df | | Effect | Effect | Effect | Error | +----------+----------+----------+----------+-| 1 | 1 | .004376 | 17 | +--
Dutch evaluation of Chauffeur Assistant 81

+-----------+--------------------+ | STAT. |Means (hfa_a.sta) | | GENERAL |F(1,17)=.91; p<.3546| | MANOVA | | +-----------+--------------------+ | | Depend. | | VOLUME | Var.1 | +-----------+--------------------+ | 1 | .463489 | | 2 | .441439 | +-----------+--------------------+ Headway Percentage of time in car-following
a time headway <= 5 s was analysed.
---------+-----------------------------------------------------------------+
The percentage of time of the total run with +-| STAT. |Summary of all Effects; design: (vlgclose_a.sta) | | GENERAL |1-VOLUME, 2-CA | | MANOVA | | +----------+----------+----------+----------+----------+----------+----------+ | | df | MS | df | MS | | | | Effect | Effect | Effect | Error | Error | F | p-level | +----------+----------+----------+----------+----------+----------+----------+ | 1 | 1 | 1062.852 | 17 | 289.5045 | 3.671281 | .072330 | | 2 | 1 | 51.909 | 17 | 325.9171 | .159270 | .694798 | | 12 | 1 | 12.004 | 17 | 217.8488 | .055102 | .817216 | +----------+----------+----------+----------+----------+----------+----------+ +--------------------+----------------------+
TAT. |Means (vlgclose_a.sta)| | S| GENERAL |F(1,17)=3.67; p<.0723 | | MANOVA | | +--------------------+----------------------+ | | Depend. | | VOLUME CA | Var.1 | +--------------------+----------------------+ | 1 .... | 59.33720 | | 2 .... | 67.02143 | +--------------------+----------------------+ +--------------------+----------------------+ | STAT. |Means (vlgclose_a.sta)| | GENERAL |F(1,17)=.16; p<.6948 | | MANOVA | | +--------------------+--------------------+-+ | | Depend. | | VOLUME CA | Var.1 | +--------------------+--------------------+ | .... 1 | 62.33023 | | .... 2 | 64.02841 | +--------------------+--------------------+ +--------------------+----------------------+
TAT. |Means (vlgclose_a.sta)| | S| GENERAL |F(1,17)=.06; p<.8172 | | MANOVA | | +--------------------+--------------------+-+ | | Depend. | | VOLUME CA | Var.1 | +--------------------+--------------------+ | 1 1 | 58.89643 | | 1 2 | 59.77798 | | 2 1 | 65.76403 | | 2 2 | 68.27884 | +--------------------+--------------------+
Dutch evaluation of Chauffeur Assistant 82

+-------------------------+-----------------------------------------------+ | | | +
| STAT. |Tukey HSD test; variable Var.1 (vlgclose_a.sta)| GENERAL |Probabilities for Post Hoc Tests | MANOVA |INTERACTION: 1 x 2 +-------------------------+----------+----------+----------+----------+---| | {1} | {2} | {3} | {4} | | VOLUME CA | 58.89643 | 59.77798 | 65.76403 | 68.27884 | +-------------------------+----------+----------+----------+----------+ | 1 1 {1} | | .997937 | .518696 | .261998 | | 1 2 {2} | .997937 | | .625195 | .340590 | | 2 1 {3} | .518696 | .625195 | | .955369 | | 2 2 {4} | .261998 | .340590 | .955369 | | +-------------------------+----------+----------+----------+----------+ The same analysis, now excluding run fragment with CA state = OFF in runs with CA: +----------+-----------------------------------------------------------------+ | STAT. |Summary of all Effects; design: (x_vlgclose_a.sta) | | GENERAL |1-VOLUME, 2-CA | | MANOVA | | +----------+----------+----------+----------+----------+----------+----------+ | | df | MS | df | MS | | | | Effect | Effect | Effect | Error | Error | F | p-level | +----------+----------+----------+----------+----------+----------+----------+ | 1 | 1 | 1136.531 | 17 | 290.5830 | 3.911211 | .064410 | | 2 | 1 | 87.345 | 17 | 349.3445 | .250026 | .623467 | | 12 | 1 | 20.937 | 17 | 249.5569 | .083898 | .775586 | +----------+----------+----------+----------+----------+----------+----------+ +--------------------+------------------------+ | STAT. |Means (x_vlgclose_a.sta)| | GENERAL |F(1,17)=3.91; p<.0644 | | MANOVA | | +--------------------+----------------------+-+ | | Depend. | | VOLUME CA | Var.1 | +--------------------+----------------------+ | 1 .... | 59.45860 | | 2 .... | 67.40470 | +--------------------+----------------------+ +--------------------+------------------------+ | STAT. |Means (x_vlgclose_a.sta)| | GENERAL |F(1,17)=.25; p<.6235 | | MANOVA | | +--------------------+--------------------+---+ | | Depend. | | VOLUME CA | Var.1 | +--------------------+--------------------+ | .... 1 | 62.33023 | | .... 2 | 64.53307 | +--------------------+--------------------+ +--------------------+------------------------+ | STAT. |Means (x_vlgclose_a.sta)| | GENERAL |F(1,17)=.08; p<.7756 | | MANOVA | | +--------------------+--------------------+---+ | | Depend. | | VOLUME CA | Var.1 | +--------------------+--------------------+ | 1 1 | 58.89643 | | 1 2 | 60.02076 | | 2 1 | 65.76403 | | 2 2 | 69.04538 | +--------------------+--------------------+
Dutch evaluation of Chauffeur Assistant 83
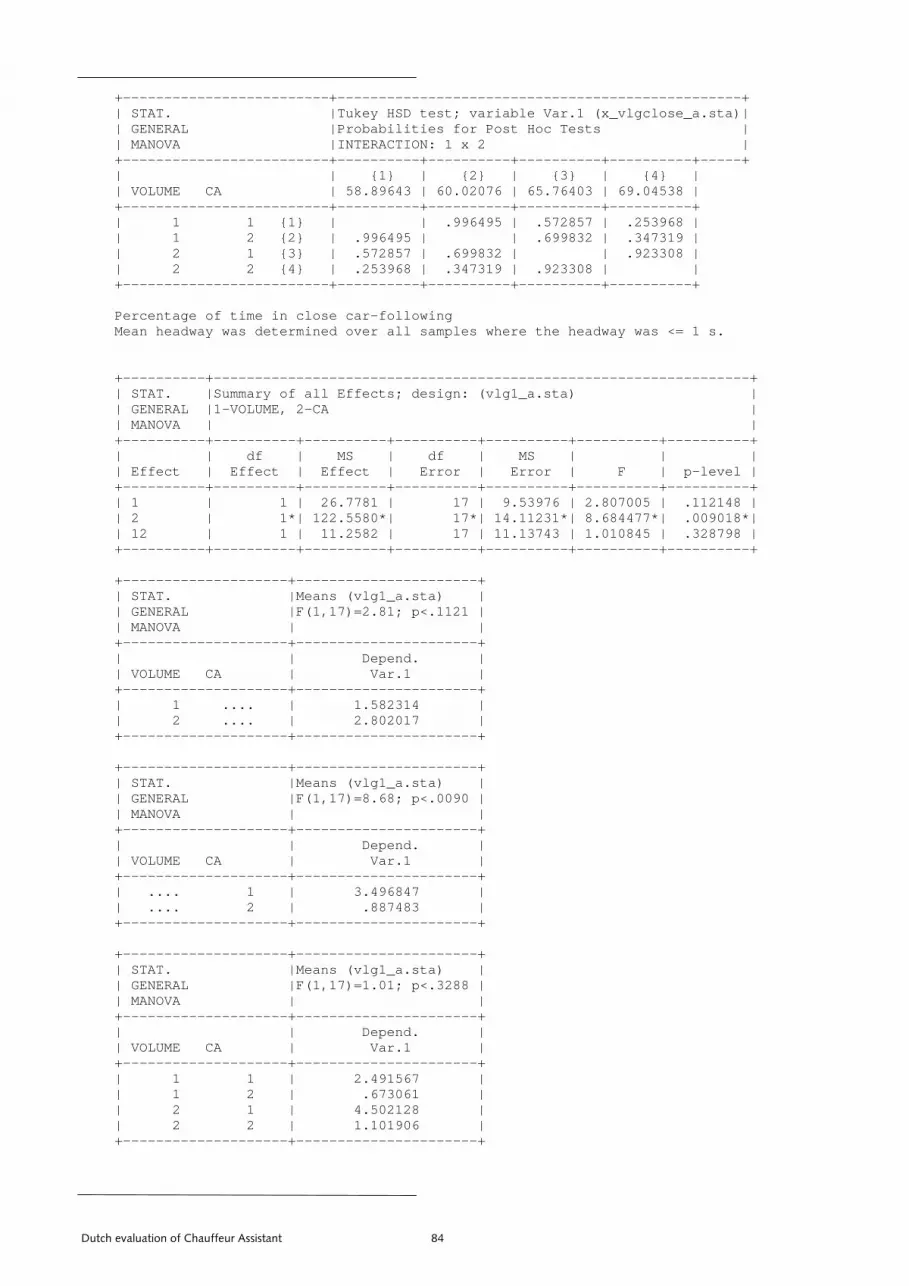
+-------------------------+-------------------------------------------------+ | | | +
rcentage of time in close car-following as determined over all samples where the headway was <= 1 s.
--------+-----------------------------------------------------------------+
| STAT. |Tukey HSD test; variable Var.1 (x_vlgclose_a.sta)| GENERAL |Probabilities for Post Hoc Tests | MANOVA |INTERACTION: 1 x 2 +-------------------------+----------+----------+----------+----------+-----| | {1} | {2} | {3} | {4} | | VOLUME CA | 58.89643 | 60.02076 | 65.76403 | 69.04538 | +-------------------------+----------+----------+----------+----------+ | 1 1 {1} | | .996495 | .572857 | .253968 | | 1 2 {2} | .996495 | | .699832 | .347319 | | 2 1 {3} | .572857 | .699832 | | .923308 | | 2 2 {4} | .253968 | .347319 | .923308 | | +-------------------------+----------+----------+----------+----------+ PeMean headway w +--| STAT. |Summary of all Effects; design: (vlg1_a.sta) | | GENERAL |1-VOLUME, 2-CA | | MANOVA | | +----------+----------+----------+----------+----------+----------+----------+ | | df | MS | df | MS | | | | Effect | Effect | Effect | Error | Error | F | p-level | +----------+----------+----------+----------+----------+----------+----------+ | 1 | 1 | 26.7781 | 17 | 9.53976 | 2.807005 | .112148 | | 2 | 1*| 122.5580*| 17*| 14.11231*| 8.684477*| .009018*| | 12 | 1 | 11.2582 | 17 | 11.13743 | 1.010845 | .328798 | +----------+----------+----------+----------+----------+----------+----------+ +--------------------+----------------------+ | STAT. |Means (vlg1_a.sta) | | GENERAL |F(1,17)=2.81; p<.1121 | | MANOVA | | +--------------------+----------------------+ | | Depend. | | VOLUME CA | Var.1 | +--------------------+----------------------+ | 1 .... | 1.582314 | | 2 .... | 2.802017 | +--------------------+----------------------+ +--------------------+----------------------+ | STAT. |Means (vlg1_a.sta) | | GENERAL |F(1,17)=8.68; p<.0090 | | MANOVA | | +--------------------+----------------------+ | | Depend. | | VOLUME CA | Var.1 | +--------------------+----------------------+ | .... 1 | 3.496847 | | .... 2 | .887483 | +--------------------+----------------------+
------------------+----------------------+ +--| STAT. |Means (vlg1_a.sta) | | GENERAL |F(1,17)=1.01; p<.3288 | | MANOVA | | +--------------------+----------------------+ | | Depend. | | VOLUME CA | Var.1 | +--------------------+----------------------+ | 1 1 | 2.491567 | | 1 2 | .673061 | | 2 1 | 4.502128 | | 2 2 | 1.101906 | +--------------------+----------------------+
Dutch evaluation of Chauffeur Assistant 84

+-------------------------+-------------------------------------------+ | STAT. |Tukey HSD test; variable Var.1 (vlg1_a.sta)| | GENERAL |Probabilities for Post Hoc Tests | | MANOVA |INTERACTION: 1 x 2 | +-------------------------+----------+----------+----------+----------+ | | {1} | {2} | {3} | {4} | | VOLUME CA | 2.491567 | .6730611 | 4.502128 | 1.101906 | +-------------------------+----------+----------+----------+----------+ | 1 1 {1} | | .386792 | .303999 | .605724 | | 1 2 {2} | .386792 | | .015006*| .979946 | | 2 1 {3} | .303999 | .015006*| | .032817*| | 2 2 {4} | .605724 | .979946 | .032817*| | +-------------------------+----------+----------+----------+----------+ The same analysis, now excluding run fragment with CA state = OFF in runs with CA:
---------+-----------------------------------------------------------------+ TAT. |Summary of all Effects; design: (x_vlg1_a.sta) |
+-| S| GENERAL |1-VOLUME, 2-CA | | MANOVA | | +----------+----------+----------+----------+----------+----------+----------+ | | df | MS | df | MS | | | | Effect | Effect | Effect | Error | Error | F | p-level | +----------+----------+----------+----------+----------+----------+----------+ | 1 | 1 | 21.5324 | 17 | 10.05735 | 2.14096 | .161656 | | 2 | 1*| 151.8203*| 17*| 14.29010*| 10.62416*| .004617*| | 12 | 1 | 15.1304 | 17 | 10.29003 | 1.47039 | .241866 | +----------+----------+----------+----------+----------+----------+----------+ +--------------------+----------------------+ | STAT. |Means (x_vlg1_a.sta) | | GENERAL |F(1,17)=2.14; p<.1617 | | MANOVA | | +--------------------+----------------------+ | | Depend. | | VOLUME CA | Var.1 | +--------------------+----------------------+ | 1 .... | 1.497875 | | 2 .... | 2.591606 | +--------------------+----------------------+ +--------------------+----------------------+ | STAT. |Means (x_vlg1_a.sta) | | GENERAL |F(1,17)=10.62; p<.0046| | MANOVA | | +--------------------+----------------------+ | | Depend. | | VOLUME CA | Var.1 | +--------------------+----------------------+ | .... 1 | 3.496847 | | .... 2 | .592633 | +--------------------+----------------------+ +--------------------+----------------------+
TAT. |Means (x_vlg1_a.sta) | | S| GENERAL |F(1,17)=1.47; p<.2419 | | MANOVA | | +--------------------+----------------------+ | | Depend. | | VOLUME CA | Var.1 |
+--------------------+----------------------+ | 1 1 | 2.491567 | | 1 2 | .504183 | | 2 1 | 4.502128 | | 2 2 | .681083 | +--------------------+----------------------+
Dutch evaluation of Chauffeur Assistant 85

+-------------------------+---------------------------------------------+ | STAT. |Tukey HSD test; variable Var.1 (x_vlg1_a.sta)| | GENERAL |Probabilities for Post Hoc Tests | | MANOVA |INTERACTION: 1 x 2 | +-------------------------+----------+----------+----------+----------+-+ | | {1} | {2} | {3} | {4} | | VOLUME CA | 2.491567 | .5041834 | 4.502128 | .6810833 | +-------------------------+----------+----------+----------+----------+ | 1 1 {1} | | .281855 | .272831 | .357359 | | 1 2 {2} | .281855 | | .008154*| .998390 | | 2 1 {3} | .272831 | .008154*| | .011456*| | 2 2 {4} | .357359 | .998390 | .011456*| | +-------------------------+----------+----------+----------+----------+ Mean headway Mean headway was determined over all samples where the headway was <= 5 s (i.e., whenthe driver wa
| | | -------+----------+ | | F | p-level | -------+----------+ 080846*| .007827*| 674879 | .212912 | 000423 | .331233 | -------+----------+
| ---------------------+
end. | O r.1 | --- -----------+
s in a car-following situation).
----------------+ +----------+-------------------------------------------------STAT. |Summary of all Effects; design: (vlgtijd_a.sta) |
| GENERAL |1-VOLUME, 2-CA | MANOVA | +----------+----------+----------+----------+----------+---| | df | MS | df | MS | | Effect | Effect | Effect | Error | Error | +----------+----------+----------+----------+----------+---| 1 | 1*| .966931*| 17*| .106480*| 9.| 2 | 1 | .222956 | 17 | .133118 | 1.| 12 | 1 | .103497 | 17 | .103454 | 1.+----------+----------+----------+----------+----------+--- +--------------------+----------------------+ | STAT. |Means (vlgtijd_a.sta) | GENERAL |F(1,17)=9.08; p<.0078 | |
| MANOVA | +--------------------+-| | Dep| V LUME CA | Va
----------------+-----------+-| 1 .... | 2.892644 | | 2 .... | 2.660872 | +--------------------+----------------------+ +--------------------+----------------------+ | STAT. |Means (vlgtijd_a.sta) | | GENERAL |F(1,17)=1.67; p<.2129 | | MANOVA | | +--------------------+----------------------+ | | Depend. | | VOLUME CA | Var.1 | +--------------------+----------------------+ | .... 1 | 2.832406 | | .... 2 | 2.721111 |
------------------+----------------------+ +-- +--------------------+----------------------+ | STAT. |Means (vlgtijd_a.sta) | | GENERAL |F(1,17)=1.00; p<.3312 | | MANOVA | | +--------------------+----------------------+ | | Depend. | | VOLUME CA | Var.1 | +--------------------+----------------------+ | 1 1 | 2.910378 | | 1 2 | 2.874911 | | 2 1 | 2.754433 | | 2 2 | 2.567311 | +--------------------+----------------------+
Dutch evaluation of Chauffeur Assistant 86

+-------------------------+----------------------------------------------+
vlgtijd_a.sta)| | | +----------+--+ | {4} | | 2.567311 | +----------+ | .024597*| | .047564*| | .332311 | | | +----------+
with CA state = OFF in runs with CA:
-------+ | | | -------+ |
| p-level | +----------+ | .023755*| | .249581 | | .501510 | +----------+
-------------------+-----------------------+
| GENERAL |F(1,17)=.47; p<.5015 | | MANOVA | | +--------------------+--------------------+--+ | | Depend. | | VOLUME CA | Var.1 | +--------------------+--------------------+ | 1 1 | 2.910378 | | 1 2 | 2.858550 | | 2 1 | 2.754433 | | 2 2 | 2.589439 | +--------------------+--------------------+
| STAT. |Tukey HSD test; variable Var.1 (| GENERAL |Probabilities for Post Hoc Tests| MANOVA |INTERACTION: 1 x 2 +-------------------------+----------+----------+----------| | {1} | {2} | {3} | VOLUME CA | 2.910378 | 2.874911 | 2.754433 +-------------------------+----------+----------+----------| 1 1 {1} | | .987135 | .484816 | 1 2 {2} | .987135 | | .680486 | 2 1 {3} | .484816 | .680486 | | 2 2 {4} | .024597*| .047564*| .332311 +-------------------------+----------+----------+---------- The same analysis, now excluding run fragment +----------+----------------------------------------------------------| STAT. |Summary of all Effects; design: (x_vlgtijd_a.sta) | GENERAL |1-VOLUME, 2-CA | MANOVA | +----------+----------+----------+----------+----------+----------+---
| | | df | MS | df | MS | | Effect | Effect | Effect | Error | Error | F +----------+----------+----------+----------+----------+----------| 1 | 1*| .813025*| 17*| .131861*| 6.165784*| 2 | 1 | .211553 | 17 | .148855 | 1.421206 | 12 | 1 | .057630 | 17 | .122200 | .471605 +----------+----------+----------+----------+----------+---------- +--------------------+-----------------------+ | STAT. |Means (x_vlgtijd_a.sta)| | GENERAL |F(1,17)=6.17; p<.0238 | | MANOVA | | +--------------------+----------------------++ | | Depend. | | VOLUME CA | Var.1 | +--------------------+----------------------+ | 1 .... | 2.884464 | | 2 .... | 2.671936 | +--------------------+----------------------+ +-| STAT. |Means (x_vlgtijd_a.sta)| | GENERAL |F(1,17)=1.42; p<.2496 | | MANOVA | | +--------------------+----------------------++ | | Depend. | | VOLUME CA | Var.1 | +--------------------+----------------------+ | .... 1 | 2.832406 | | .... 2 | 2.723994 | +--------------------+----------------------+ +--------------------+-----------------------+ | STAT. |Means (x_vlgtijd_a.sta)|
Dutch evaluation of Chauffeur Assistant 87

+-------------------------+------------------------------------------------+
+----+ | | + | |
2 1 {3} | .552576 | .808341 | | .506994 | | +
nts per run =
ssing Data).
CA
--+ T ts.sta) |
+----------+----------+----------+----------+ 28 | 1 | 108 | 26 | 5 | 108 | 0 | 0 | 0 |
+----------+----------+----------+----------+----------+ | zonderCA | 66 | 37 | 5 | 108 | | metCA | 90 | 17 | 1 | 108 | | Missing | 0 | 0 | 0 | 0 | +----------+----------+----------+----------+----------+ | All Grps | 156 | 54 | 6 | 216 | +----------+----------+----------+----------+----------+
| STAT. |Tukey HSD test; variable Var.1 (x_vlgtijd_a.sta)|| GENERAL |Probabilities for Post Hoc Tests || MANOVA |INTERACTION: 1 x 2 |+-------------------------+----------+----------+----------+----------| | {1} | {2} | {3} | {4} | VOLUME CA | 2.910378 | 2.858550 | 2.754433 | 2.589439 +-------------------------+----------+----------+----------+----------| 1 1 {1} | | .969793 | .552576 | .059439 | 1 2 {2} | .969793 | | .808341 | .135065 | | 2 2 {4} | .059439 | .135065 | .506994 | +-------------------------+----------+----------+----------+---------- Braking lead vehicle events Total number of events: 18 subjects x 2 traffic volumes x 2 CA x 3 eve216 events. In 6 events, the scenario was not realised as intended (-> 2.7% MiDistinction in reaction of subjects: changing lane, or not. +----------+-------------------------------------------+ | STAT. |MOVELANE (events.sta) | | BASIC | | | STATS | | +----------+----------+----------+----------+----------+ | | | Cumul. | | Cumul. | | Value | Count | Count | Percent | Percent | +----------+----------+----------+----------+----------+ | niet | 156 | 156 | 72.22222 | 72.2222 | | wel | 54 | 210 | 25.00000 | 97.2222 | +----------+----------+----------+----------+----------+ | Missing | 6 | 216 | 2.77778 | 100.0000 | +----------+----------+----------+----------+----------+ Cross tables of lane change reaction vs.: - traffic volume - - lead car deceleration level
-+-- -------+-----------------------------------------| S AT. |Summary Frequency Table (even| BASIC |Table: VOLUME(2) x MOVELANE(2) | | STATS | | +----------+----------+----------+----------+----------+ | | MOVELANE | MOVELANE | Missing | Row | | VOLUME | niet | wel | Data | Totals | +----------| laag | 79 | | hoog | 77 | | Missing | 0 | +----------+----------+----------+----------+----------+ | All Grps | 156 | 54 | 6 | 216 | +----------+----------+----------+----------+----------+ +----------+-------------------------------------------+ | STAT. |Summary Frequency Table (events.sta) | | BASIC |Table: CA(2) x MOVELANE(2) | | STATS | | +----------+----------+----------+----------+----------+ | | MOVELANE | MOVELANE | Missing | Row |
A | niet | wel | Data | Totals | | C
Dutch evaluation of Chauffeur Assistant 88

+----------+-------------------------------------------+
ents.sta) | NE(2) | | -----+----------+ sing | Row | ta | Totals | -----+----------+ 0 | 127 | 0 | 67 |
Missing | 12 | 4 | 6 | 22 | -------+----------+----------+----------+ 156 | 54 | 6 | 216 | -------+----------+----------+----------+
------+----------------+ 28 | 107 | 26 | 103 | ------+----------------+ 54 | 210 | ------+----------------+ -------------------------------------+ VOLUME(2) x MOVELANE(2) (events.sta)| | | --+------------+------------+---------+
| | | |
OVELANE | Row | wel | Totals | ---------+------------+ 37 | 103 | 17 | 107 | ---------+------------+ 54 | 210 | ---------+------------+
| STAT. |Summary Frequency Table (ev| BASIC |Table: DEC_LEAD(2) x MOVELA| STATS | +----------+----------+----------+-----| | MOVELANE | MOVELANE | Mis| DEC_LEAD | niet | wel | Da+----------+----------+----------+-----| G_1:3 | 101 | 26 | | G_2:4 | 43 | 24 | | +----------+---| All Grps | ---------+---+-
Chi square tests on these sets of variables: +----------+------------------------------------------------------+ | STAT. |2-Way Summary Table: Observed Frequencies (events.sta)| | BASIC | | | STATS | | +----------+----------------+----------------+----------------+---+ | | MOVELANE | MOVELANE | Row |
OLUME | niet | wel | Totals | | V+----------+----------------+----------| laag | 79 | | hoog | 77 | +----------+----------------+----------| Totals | 156 | +----------+----------------+----------+--------------------------+-----------| STAT. |Statistics:| BASIC | | STATS | +--------------------------+----------| | Statistic | Chi-square | df | p | +--------------------------+------------+------------+------------+ | Pearson Chi-square | .0235332 | df=1 | p=.87808 | | M-L Chi-square | .0235377 | df=1 | p=.87807 | +--------------------------+------------+------------+------------+ +---------------------+------------------------------------------------------+ | STAT. |2-Way Summary Table: Observed Frequencies (events.sta)| | BASIC | | | STATS | |
-------------------+------------+------------+------------+---------------+ +--| | MOVELANE | M| CA | niet | +---------------------+------------+---| zonderCA: zonder_CA | 66 | | metCA : | 90 | +---------------------+------------+---| Column Totals | 156 | +---------------------+------------+---
Dutch evaluation of Chauffeur Assistant 89

+--------------------------+| STAT. |S
--------------------------------------------+
---------------------------+ ed Frequencies (events.sta)| | | ------+----------------+---+ NE | Row | | Totals | ------+----------------+ 26 | 127 | 24 | 67 |
---------+----------------+----------------+----------------+ Totals | 144 | 50 | 194 |
------------+----------------+----------------+
----+------------+------------+
ng the scenario lly
, CA, and lead car deceleration level. l factorial ANOVA (only 3 subjects for which all
main effects only. Results in following
mum Time to Collision
tatistics: CA(2) x MOVELANE(2) (events.sta)| | BASIC | | | STATS | | +--------------------------+------------+------------+------------+-----+ | | | | | | Statistic | Chi-square | df | p | +--------------------------+------------+------------+------------+ | Pearson Chi-square | 11.02753 | df=1 | p=.00090 | | M-L Chi-square | 11.21762 | df=1 | p=.00081 | +--------------------------+------------+------------+------------+ +----------+---------------------------| STAT. |2-Way Summary Table: Observ| BASIC | | STATS | +----------+----------------+----------| | MOVELANE | MOVELA| DEC_LEAD | niet | wel+----------+----------------+----------| G_1:3 | 101 | | G_1:4 | 43 | +-| +----------+----+--------------------------+--------------------------------------------------+ | STAT. |Statistics: DEC_LEAD(2) x MOVELANE(2) (events.sta)| | BASIC | | | STATS | | +--------------------------+------------+------------+------------+-----------+ | | | | | | Statistic | Chi-square | df | p | +--------------------------+------------+------------+------------+ | Pearson Chi-square | 5.401036 | df=1 | p=.02013 | | M-L Chi-square | 5.253262 | df=1 | p=.02191 | +--------------------------+-------- Sub-set of data (144 cases remain): - subject did not change lane duri- scenario was completed successfu Breakdown by: subject, traffic volumeToo many empty cells to perform a ful2x2x2=8 conditions were complete). Thus, ANOVAs were carried out to testsections. MiniLead car deceleration level +----------+-----------------------------------------------------------------+ | STAT. |Summary of all Effects; design: (bc_lead_a.sta) | | GENERAL |1-LEAD_DEC | | MANOVA | | +----------+----------+----------+----------+----------+----------+----------+ | | df | MS | df | MS | | | | Effect | Effect | Effect | Error | Error | F | p-level | +----------+----------+----------+----------+----------+----------+----------+ | 1 | 1*| 9.362073*| 15*| 1.152755*| 8.121478*| .012171*|
--------+----------+----------+----------+----------+----------+----------+ +--
Dutch evaluation of Chauffeur Assistant 90

+-----------+----------------------+ | STAT. |Means (bc_lead_a.sta) | | GENERAL |F(1,15)=8.12; p<.0122 | | MANOVA | | +-----------+----------------------+ | | Depend. | | LEAD_DEC | Var.1 | +-----------+----------------------+ | 1 | 5.339914 | | 2 | 4.258129 | +-----------+----------------------+ Traffic volume
------------------------------+ ca_a.sta) | | | -------+----------+----------+ MS | | | Error | F | p-level | -------+----------+----------+ 001750*| 10.62570*| .004919*| -------+----------+----------+
+----------+-----------------------------------------------------------------+ | STAT. |Summary of all Effects; design: (bd_vol_a.sta) | | GENERAL |1-VOLUME | | MANOVA | | +----------+----------+----------+----------+----------+----------+----------+ | | df | MS | df | MS | | | | Effect | Effect | Effect | Error | Error | F | p-level | +----------+----------+----------+----------+----------+----------+----------+ | 1 | 1*| 4.020214*| 16*| .787084*| 5.107729*| .038119*| +----------+----------+----------+----------+----------+----------+----------+ +-----------+----------------------+ | STAT. |Means (bd_vol_a.sta) | | GENERAL |F(1,16)=5.11; p<.0381 | | MANOVA | | +-----------+----------------------+ | | Depend. | | VOLUME | Var.1 | +-----------+----------------------+ | 1 | 5.161157 | | 2 | 4.473432 | +-----------+----------------------+ CA
--------+-----------------------------------+--| STAT. |Summary of all Effects; design: (bd_| GENERAL |1-CA | MANOVA | +----------+----------+----------+----------+---| | df | MS | df | | Effect | Effect | Effect | Error | +----------+----------+----------+----------+---| 1 | 1*| 10.64429*| 16*| 1.+----------+----------+----------+----------+--- +-----------+----------------------+
TAT. |Means (bd_ca_a.sta) | | S| GENERAL |F(1,16)=10.63; p<.0049| | MANOVA | | +-----------+----------------------+ | | Depend. | | CA | Var.1 | +-----------+----------------------+ | 1 | 4.091722 | | 2 | 5.210771 | +-----------+----------------------+
Dutch evaluation of Chauffeur Assistant 91

Maximum deceleration Lead car deceleration level +----------+-----------------------------------------------------------------+
| | | ---+ | el | ---+ 49*| ---+
STAT. |Means (bc_lead_a.sta) | GENERAL |F(1,15)=12.44; p<.0030|
| |
|
----------------------+ ol_a.sta) | | | ------+----------+----------+ MS | | | rror | F | p-level | ------+----------+----------+ 21573 | .202585 | .658680 | ------+----------+----------+
GENERAL |1-CA | | | ----------+----------+----------+----------+----------+----------+
| STAT. |Summary of all Effects; design: (bc_lead_a.sta) | GENERAL |1-LEAD_DEC | MANOVA | +----------+----------+----------+----------+----------+----------+-------| | df | MS | df | MS | | | Effect | Effect | Effect | Error | Error | F | p-lev+----------+----------+----------+----------+----------+----------+-------| 1 | 1*| 5.213140*| 15*| .419058*| 12.44014*| .0030+----------+----------+----------+----------+----------+----------+-------+-----------+----------------------+ | | | MANOVA +-----------+----------------------+ | | Depend. | | LEAD_DEC | Var.1 | ----------+----------------------+ +-
| 1 | -3.47197 | 2 | -4.27922 | +-----------+----------------------+ Traffic volume +----------+-------------------------------------------| STAT. |Summary of all Effects; design: (bd_v| GENERAL |1-VOLUME | MANOVA | +----------+----------+----------+----------+----| | df | MS | df | | Effect | Effect | Effect | Error | E+----------+----------+----------+----------+----| 1 | 1 | .085405 | 16 | .4+----------+----------+----------+----------+---- +-----------+--------------------+ | STAT. |Means (bd_vol_a.sta)| | GENERAL |F(1,16)=.20; p<.6587| MANOVA | | |
+-----------+--------------------+ | | Depend. | | VOLUME | Var.1 | +-----------+--------------------+ | 1 | -3.72924 | | 2 | -3.82948 | +-----------+--------------------+ CA
+----------+-----------------------------------------------------------------+ | STAT. |Summary of all Effects; design: (bd_ca_a.sta) | | | MANOVA +----------+| | df | MS | df | MS | | | | Effect | Effect | Effect | Error | Error | F | p-level | +----------+----------+----------+----------+----------+----------+----------+ | 1 | 1 | 4.850826 | 16 | 1.161104 | 4.177772 | .057780 | +----------+----------+----------+----------+----------+----------+----------+
Dutch evaluation of Chauffeur Assistant 92

+-----------+----------------------+ | STAT. |Means (bd_ca_a.sta) | | GENERAL |F(1,16)=4.18; p<.0578 | | MANOVA | | +-----------+----------------------+ | | Depend. | | CA | Var.1 | +-----------+----------------------+ | 1 | -4.29611 | | 2 | -3.54067 | +-----------+----------------------+ RSME +----------+-----------------------------------------------------------------+ | STAT. |Summary of all Effects; design: (bsmi_a.sta) | | GENERAL |1-VOLUME, 2-CA | | MANOVA | | +----------+----------+----------+----------+----------+----------+----------+ | | df | MS | df | MS | | | | Effect | Effect | Effect | Error | Error | F | p-level | +----------+----------+----------+----------+----------+----------+----------+ | 1 | 1 | 382.722 | 17 | 136.3399 | 2.80712 | .112141 |
| 1*| 9476.056*| 17*| 650.7908*| 14.56083*| .001382*| | 2| 12 | 1 | 162.000 | 17 | 92.5588 | 1.75024 | .203367 |
--------+----------+----------+
| -----+ | | ------+
1 .... | 44.36111 | | 2 .... | 48.97222 | +--------------------+----------------------+ +--------------------+----------------------+ | STAT. |Means (bsmi_a.sta) | | GENERAL |F(1,17)=14.56; p<.0014| | MANOVA | | +--------------------+----------------------+ | | Depend. | | VOLUME CA | Var.1 | +--------------------+----------------------+ | .... 1 | 58.13889 | | .... 2 | 35.19444 | +--------------------+----------------------+ +--------------------+----------------------+ | STAT. |Means (bsmi_a.sta) | | GENERAL |F(1,17)=1.75; p<.2034 | | MANOVA | | +--------------------+----------------------+ | | Depend. | | VOLUME CA | Var.1 | +--------------------+----------------------+ | 1 1 | 54.33333 | | 1 2 | 34.38889 | | 2 1 | 61.94444 | | 2 2 | 36.00000 | +--------------------+----------------------+
+----------+----------+----------+----------+-- +--------------------+----------------------+ | STAT. |Means (bsmi_a.sta) |
1121 | | GENERAL |F(1,17)=2.81; p<.| MANOVA | +--------------------+-----------------| | Depend. | VOLUME CA | Var.1
-+--------------------+---------------|
Dutch evaluation of Chauffeur Assistant 93

+-------------------------+------------| STAT. |Tukey HSD te
-------------------------------+ st; variable Var.1 (bsmi_a.sta)|
| GENERAL |Probabilities for Post Hoc Tests | | MANOVA |INTERACTION: 1 x 2 | +-------------------------+----------+----------+----------+----------+ | | {1} | {2} | {3} | {4} | | VOLUME CA | 54.33333 | 34.38889 | 61.94444 | 36.00000 | +-------------------------+----------+----------+----------+----------+ | 1 1 {1} | | .000223*| .120652 | .000304*| | 1 2 {2} | .000223*| | .000178*| .957465 | | 2 1 {3} | .120652 | .000178*| | .000179*| | 2 2 {4} | .000304*| .957465 | .000179*| | +-------------------------+----------+----------+----------+----------+ Acceptance The results of the acceptance questionnaire with 9 items were processed as indicated by (Van der Laan et al., 1997). Scales were inverted where necessary, such that 0 was the neutral score, and –2 and +2 the worst and best possible rating, respectively. Mean and sd of the 9 ite +----------+---------------------------------------+ | STAT. |Descriptive Statistics (acceptance.sta)| | BASIC | | | STATS | +----------+------------| | | Variable | Mean +----------+------------| NUTTIG | 1.222222| PLEZIERI | 1.250000| GOED | 1.055556 | .753826 | | LEUK | .861111| EFFECTIE | 1.138889| AANGENAA | 1.333333| BEHULPZA | 1.388889| GEWENST | 1.222222| WAAKZAAM | -.166667+----------+------------ The data were transformed to the 2 underlying variables: 'usefulness' and 'satisfaction', again following the procedure of (Van der Laan et al., 1997). Usefulness was determined by averaging the ratings on 5 items (useful-useless, good-bad, effective-superfluous, assisting-worthless and raising alertness-sleep inducing). Satisfaction was determined by averaging the ratings with respect to the remaining four items (pleasant-unpleasant, nice-annoying, likeable-irritating and desirable-undesirable). ANOVAs were carried out on these variables, using traffic volume as the independent variable. USEFULNESS +----------+-----------------------------------------------------------------+ | STAT. |Summary of all Effects; design: (acceptance_2fact_a.sta) | | GENERAL |1-VOLUME | | MANOVA | | +----------+----------+----------+----------+----------+----------+----------+ | | df | MS | df | MS | | | | Effect | Effect | Effect | Error | Error | F | p-level | +----------+----------+----------+----------+----------+----------+----------+ | 1 | 1 | .010000 | 17 | .045294 | .220779 | .644418 | +----------+----------+----------+----------+----------+----------+----------+
ms:
| ----+----------------+-----+ | | | Std.Dev. | ----+----------------+ | .680803 |
| .906327 |
| 1.125110 | | .930523 | | .717137 | | .766356 | | .929243 | | 1.108409 |
-------+ ----+---------
Dutch evaluation of Chauffeur Assistant 94

+-----------+-----------| STAT. |Means (acce| GENERAL |F(1,17)=.22| MANOVA | +-----------+----------------------+-------+ | | Dep | VOLUME | Va+-----------+-----------| 1 | .94| 2 | .91+-----------+----------- SATISFACTION +----------+-----------------------------------------------------------------+ | STAT. |Summary of all Effects; design: (acceptance_2fact_a.sta) | | GENERAL |1-VOLUME | | MANOVA | | +----------+----------+----------+----------+----------+----------+----------+ | | df | MS | df | MS | | | | Effect | Effect | Effect | Error | Error | F | p-level | +----------+----------+----------+----------+----------+----------+----------+ | 1 | 1 | .250000 | 17 | .084559 | 2.956522 | .103685 | +----------+----------+----------+----------+----------+----------+----------+ +-----------+-----------| STAT. |Means (acce| GENERAL |F(1,17)=2.9| MANOVA | +-----------+-----------| | Dep| VOLUME | Va+-----------+-----------| 1 | 1.08| 2 | 1.25+-----------+-----------
-------------------+ ptance_2fact_a.sta)| ; p<.6444 |
|
end. | r.1 | -----------+ 4444 | 1111 | -----------+
-------------------+ ptance_2fact_a.sta)| 6; p<.1037 | | -----------+-------+ end. | r.1 | -----------+ 3333 | 0000 | -----------+
Dutch evaluation of Chauffeur Assistant 95

Appendix E: Example of a MI
a
= 0.5 = 0.25 = 30
= 1.0
= 300
hold = -5.0 = 3.0 old = 50.0 hold = 3
= 0
XIC input file
* Simulation control dat icc_mode = 0 init_seed = 7 trunc_normal = 3.0 critical_headway
headway_interval_width n_headway_intervals critical_TTC = 4.0
TTC_interval_width n_TTC_intervals = 30 max_trips = 100000 start_up_time = 0
5 statistics_start = 1 subinterval_length
5 max_time = 25 backup_look_back = 1.0 speed_cat_lower = 50
_upper = 150 speed_cat speed_cat_width = 5 sim_time_incr = 0.1 link_meas_interval = 5.0
= 5.0 veh_meas_interval shock_wave_accel_tres shock_wave_timer shock_wave_headway_tresh
tres shock_wave_vehicles_* Road network data n_links = 6 n_nodes = 7 n_origins = 1 orgn[1] = 1 n_destinations = 1 dest[1] = 7 * Node data
node_id = 1 in_flow = 0 out_flow = 1 pre_warning_distance * Node data node_id = 2 in_flow = 1 out_flow = 2
0 pre_warning_distance =* Node data node_id = 3 in_flow = 2 out_flow = 3 pre_warning_distance = 1350 * Node data node_id = 4 in_flow = 3 out_flow = 4 pre_warning_distance = 1350 * Node data
= 5 node_id in_flow = 4 out_flow = 5 pre_warning_distance = 1350 * Node data node_id = 6
Dutch evaluation of Chauffeur Assistant 96

in_flow = 5 out_flow = 6 pre_warning_distance = 0
out_flow = 0
exit_n = 2 0 0
hard_sh_l = 0
l_width[1] = 3.5
3.5 = 3.5 = 3.5
l_type[3] = 1
d_obs_pt = 4.5 .5
= 750
= 110.0
entry_n = 2
speed_max = 130 0
hard_sh_r = 0
= 3.5 = 3.5 = 3.5
* Node data node_id = 7 in_flow = 6
pre_warning_distance = 0* Link data link_id = 1 link_type = 1 * Homogenous motorway link data entry_n = 1
speed_max = 13 length = 100 n_lanes = 3
hard_sh_r = 0
l_width[2] = 3.5 l_width[3] = 3.5 l_width_standard[1] = l_width_standard[2] l_width_standard[3] l_type[1] = 1 l_type[2] = 1
rd_condition = 0 water_depth = 0.0 rd_surf_text = 0
hght_rd = -1 hght_obs = 1.0 b_fact = 0.2 crp_fact = 0.0 wind_angle = 0 wind_speed = 0 visibility_range slope = 0.0 n_meas = 1 meas_p[1] = 500 equipment = 0 ICC_static_ref_speed ICC_int_hw_tau = .64 * Link data link_id = 2 link_type = 1 * Homogenous motorway link data
exit_n = 3
length = 100 n_lanes = 3 hard_sh_l = 0
l_width[1] = 3.5 l_width[2] = 3.5 l_width[3] = 3.5 l_width_standard[1] l_width_standard[2] l_width_standard[3]
Dutch evaluation of Chauffeur Assistant 97
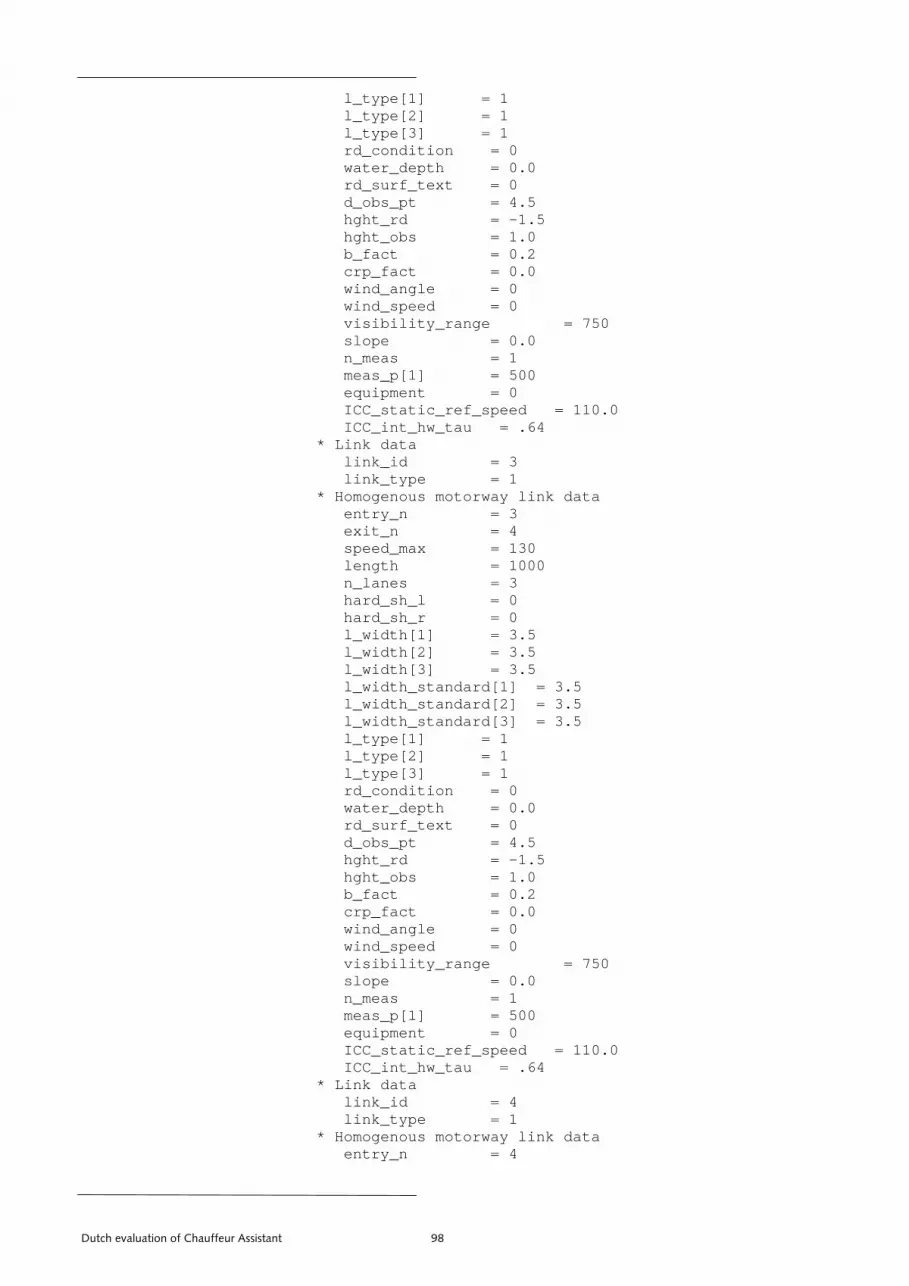
l_type[1] = 1 l_type[2] = 1 l_type[3] = 1 rd_condition = 0 water_depth = 0.0 rd_surf_text = 0 d_obs_pt = 4.5
= -1.5 hght_rd hght_obs = 1.0
crp_fact = 0.0
wind_speed = 0 = 750
meas_p[1] = 500
= 110.0
exit_n = 4 0 0
3.5 = 3.5 = 3.5
l_type[3] = 1
d_obs_pt = 4.5
hght_obs = 1.0 0.2
750
y link data
b_fact = 0.2
wind_angle = 0
visibility_range slope = 0.0 n_meas = 1
equipment = 0 ICC_static_ref_speed ICC_int_hw_tau = .64 * Link data link_id = 3 link_type = 1 * Homogenous motorway link data entry_n = 3
speed_max = 13 length = 100 n_lanes = 3 hard_sh_l = 0 hard_sh_r = 0 l_width[1] = 3.5 l_width[2] = 3.5 l_width[3] = 3.5 l_width_standard[1] = l_width_standard[2] l_width_standard[3] l_type[1] = 1 l_type[2] = 1
rd_condition = 0 water_depth = 0.0 rd_surf_text = 0
hght_rd = -1.5
b_fact = crp_fact = 0.0 wind_angle = 0 wind_speed = 0 visibility_range = slope = 0.0 n_meas = 1 meas_p[1] = 500 equipment = 0 ICC_static_ref_speed = 110.0 ICC_int_hw_tau = .64 * Link data link_id = 4 link_type = 1 * Homogenous motorwa entry_n = 4
Dutch evaluation of Chauffeur Assistant 98

exit_n = 5 speed_max = 130 length = 1000 n_lanes = 3 hard_sh_l = 0 hard_sh_r = 0 l_width[1] = 3.5 l_width[2] = 3.5 l_width[3] = 3.5 l_width_standard[1] = 3.5
.5 l_width_standard[2] = 3 = 3.5
= 750
entry_n = 5
3.5 = 3.5
d[3] = 3.5
l_width_standard[3] l_type[1] = 1 l_type[2] = 1 l_type[3] = 1 rd_condition = 0 water_depth = 0.0 rd_surf_text = 0 d_obs_pt = 4.5 hght_rd = -1.5 hght_obs = 1.0 b_fact = 0.2 crp_fact = 0.0 wind_angle = 0 wind_speed = 0 visibility_range slope = 0.0 n_meas = 1 meas_p[1] = 500 equipment = 0 ICC_static_ref_speed = 110.0 ICC_int_hw_tau = .64 * Link data link_id = 5 link_type = 1 * Homogenous motorway link data
exit_n = 6 speed_max = 130 length = 1000 n_lanes = 3 hard_sh_l = 0 hard_sh_r = 0 l_width[1] = 3.5 l_width[2] = 3.5 l_width[3] = 3.5 l_width_standard[1] = l_width_standard[2] l_width_standar l_type[1] = 1 l_type[2] = 1 l_type[3] = 1 rd_condition = 0 water_depth = 0.0 rd_surf_text = 0 d_obs_pt = 4.5 hght_rd = -1.5 hght_obs = 1.0 b_fact = 0.2 crp_fact = 0.0 wind_angle = 0 wind_speed = 0
Dutch evaluation of Chauffeur Assistant 99

visibility_range = 750 slope = 0.0 n_meas = 1 meas_p[1] = 500
3.5 = 3.5 = 3.5
l_width_standard[3] = 3.5
750
110.0
ns
1 8 2 36 3500 1500 800
equipment = 0 ICC_static_ref_speed = 110.0 ICC_int_hw_tau = .64 * Link data link_id = 6 link_type = 1 * Homogenous motorway link data entry_n = 6 exit_n = 7 speed_max = 130 length = 1000 n_lanes = 3 hard_sh_l = 0 hard_sh_r = 0 l_width[1] = 3.5 l_width[2] = 3.5 l_width[3] = l_width_standard[1] l_width_standard[2]
l_type[1] = 1 l_type[2] = 1 l_type[3] = 1 rd_condition = 0 water_depth = 0.0 rd_surf_text = 0 d_obs_pt = 4.5 hght_rd = -1.5 hght_obs = 1.0 b_fact = 0.2 crp_fact = 0.0 wind_angle = 0 wind_speed = 0 visibility_range = slope = 0.0 n_meas = 1 meas_p[1] = 500 equipment = 0 ICC_static_ref_speed = ICC_int_hw_tau = .64 * Vehicle type specificatio n_veh_types = 3 * Vehicle type data v_type_nr = 1 v_cat = 2 aut_transm_fr = 0 n_gears = 4 transm_ratio[1] = 0.002 transm_ratio[2] = 0.003 transm_ratio[3] = 0.0057 transm_ratio[4] = 0.008 engine_rot_speed_high = engine_rot_speed_low = engine_rot_speed_stat = mean_power = 74.0 stdev_power = 7.0 torqueMax = 150 torquePowerMax = 118
Dutch evaluation of Chauffeur Assistant 100

rpmEnginePowerMax = 6000
00 ro = 1300
veh_dyn[2] = 0 veh_dyn[3] = 0
veh_dyn[5] = 0.2 5
veh_dyn[9] = 0.0
= 0.0
veh_dyn[17] = 0.0
= 2.00 = 1.70
= 10.0 = 0.25 = 1.5 = 0.1 = 0.2
rpmEngineTorqueMax = 36 frTorquePowerMax = 1.27 rpmEngineGasMinTorqueZe frTorqueMax = -0.0168 aer_coeff = 0.37 mean_mass = 1050 stdev_mass = 100 mean_f_r = 0.011 stdev_f_r = 0.00033 veh_dyn[1] = 0.76
veh_dyn[4] = 0.2
veh_dyn[6] = 0.5 veh_dyn[7] = 0.0 veh_dyn[8] = 500
veh_dyn[10] = 0.0 veh_dyn[11] = 0.0 veh_dyn[12] = 0.0
.0 veh_dyn[13] = 0 veh_dyn[14] veh_dyn[15] = 0.0 veh_dyn[16] = 0.0
veh_dyn[18] = 0.0 veh_dyn[19] = 0.0 veh_dyn[20] = 0.0 veh_length_upper = 4.7 veh_length_lower = 1.0 mean_veh_length = 4.0 stdev_veh_length = 0.1 veh_width_including_mirrors veh_width_excluding_mirrors cat_conv_fr = 0.34 fuel_fr[1] = 0.801 fuel_fr[2] = 0.108 fuel_fr[3] = 0.091 equipment_fr = 0 ICC_max_acc = 2 ICC_max_dec = -2 ICC_em_dec = -5 ICC_det_range = 135 ICC_det_delay = 0.1 ICC_act_delay = 0.1 ICC_tau = 0.64 ICC_M = 10 ICC_engage_rt = 0.5 ICC_disengage_rt = 1.0 ICC_gain = 0.04 ICC_acc_c = 0.08 ICC_act_gain = 6.00 ISA_K = 0.1 CF_activating_acc_threshold = -2.0 CF_influence_distance = 250.0 CF_influence_time CF_exponent_distance CF_exponent_time CF_K CF_Kd
Dutch evaluation of Chauffeur Assistant 101

CF_Kv = 3.0
= 1.0 ld = -1.0 = 200.0 = 10.0 = 0.001 = 1.0 = 0.1
0.2 3.0 0.5
ld = -1.0 = 200.0 = 10.0 = 0.001
= 1.0 = 0.1
= 0.2 5
v_type_nr = 2
65 56 74 75 3000 1200 700
0 00 ro = 1000
CF_Kc EB_activating_acc_thresho EB_influence_distance EB_influence_time EB_exponent_distance EB_exponent_time EB_K EB_Kd = EB_Kv = EB_Kc = BW_activating_acc_thresho BW_influence_distance
BW_influence_time BW_exponent_distance BW_exponent_time BW_K BW_Kd BW_Kv = 3.0
= 0. BW_Kc * Vehicle type data
v_cat = 3 aut_transm_fr = 0 n_gears = 5
9 transm_ratio[1] = 0.0019 transm_ratio[2] = 0.003 transm_ratio[3] = 0.005 transm_ratio[4] = 0.007 transm_ratio[5] = 0.009 engine_rot_speed_high = engine_rot_speed_low = engine_rot_speed_stat = mean_power = 75.0 stdev_power = 5.0 torqueMax = 250 torquePowerMax = 205 rpmEnginePowerMax = 350 rpmEngineTorqueMax = 22 frTorquePowerMax = 1.22 rpmEngineGasMinTorqueZe frTorqueMax = -0.0535 aer_coeff = 0.94 mean_mass = 1600 stdev_mass = 100 mean_f_r = 0.011 stdev_f_r = 0.00033 veh_dyn[1] = 0.76 veh_dyn[2] = 0 veh_dyn[3] = 0 veh_dyn[4] = 0.2 veh_dyn[5] = 0.2 veh_dyn[6] = 0.5 veh_dyn[7] = 0.05 veh_dyn[8] = 500 veh_dyn[9] = 0.0 veh_dyn[10] = 0.0 veh_dyn[11] = 0.0 veh_dyn[12] = 0.0 veh_dyn[13] = 0.0 veh_dyn[14] = 0.0 veh_dyn[15] = 0.0
Dutch evaluation of Chauffeur Assistant 102

veh_dyn[16] = 0.0
= 12 = 4.7
= 2.14 = 1.84
= 0.1 = 0.2 = 3.0
= 1.0 ld = -2.0 = 250.0
= 10.0 = 0.25 = 1.5
= 0.2 EB_Kv = 3.0
= 1.0 BW_activating_acc_threshold = -2.0
50.0 0.0 .25
veh_dyn[17] = 0.0 veh_dyn[18] = 0.0 veh_dyn[19] = 0.0 veh_dyn[20] = 0.0 veh_length_upper veh_length_lower mean_veh_length = 5 stdev_veh_length = 0.1 veh_width_including_mirrors veh_width_excluding_mirrors cat_conv_fr = 0 fuel_fr[1] = 0.238 fuel_fr[2] = 0.719 fuel_fr[3] = 0.043 equipment_fr = 0 ICC_max_acc = 2 ICC_max_dec = -2 ICC_em_dec = -5 ICC_det_range = 135 ICC_det_delay = 0.1 ICC_act_delay = 0.1 ICC_tau = 1.3 ICC_M = 6 ICC_engage_rt = 0.5 ICC_disengage_rt = 1.0 ICC_gain = 0.04 ICC_acc_c = 0.06 ICC_act_gain = 10.00 ISA_K = 0.1 CF_activating_acc_threshold = -2.0 CF_influence_distance = 250.0 CF_influence_time = 10.0 CF_exponent_distance = 0.25 CF_exponent_time = 1.5 CF_K CF_Kd
CF_Kv CF_Kc EB_activating_acc_thresho EB_influence_distance EB_influence_time EB_exponent_distance EB_exponent_time EB_K = 0.1 EB_Kd
EB_Kc
BW_influence_distance = 2 BW_influence_time = 1 BW_exponent_distance = 0 BW_exponent_time = 1.5 BW_K = 0.1 BW_Kd = 0.2 BW_Kv = 3.0 BW_Kc = 1.0 * Vehicle type data v_type_nr = 3 v_cat = 4 aut_transm_fr = 0 n_gears = 8
Dutch evaluation of Chauffeur Assistant 103

transm_ratio[1] = 0.00177 transm_ratio[2] = 0.00268 transm_ratio[3] = 0.004 transm_ratio[4] = 0.0063 transm_ratio[5] = 0.00955 transm_ratio[6] = 0.01193 transm_ratio[7] = 0.01433 transm_ratio[8] = 0.01777
160100
12
M = 1 0 00 ro = 00
yn[12] = 0.0
-3
5
engine_rot_speed_high = 0 engine_rot_speed_low = 0 engine_rot_speed_stat = 500 mean_power = 350.0 stdev_power = torqueMax = 2160 torquePowerMax = 1836 rpmEnginePower ax 80 rpmEngineTorqueMax = 10 frTorquePowerMax = 1.18 rpmEngineGasMinTorqueZe 7
85 frTorqueMax = -1. aer_coeff = 3.94 mean_mass = 20500
500 stdev_mass = 0 mean_f_r = 0.006 stdev_f_r = 0.00033 veh_dyn[1] = 0.76 veh_dyn[2] = 0.0 veh_dyn[3] = 0.0 veh_dyn[4] = 0.2 veh_dyn[5] = 0.2 veh_dyn[6] = 0.3 veh_dyn[7] = 0.05 veh_dyn[8] = 500 veh_dyn[9] = 0.0
eh_dyn[10] = 0.0 v veh_dyn[11] = 0.0 veh_d veh_dyn[13] = 0.0 veh_dyn[14] = 0.0 veh_dyn[15] = 0.0 veh_dyn[16] = 0.0 veh_dyn[17] = 0.0 veh_dyn[18] = 0.0 veh_dyn[19] = 0.0 veh_dyn[20] = 0.0 veh_length_upper = 20 veh_length_lower = 12 mean_veh_length = 15 stdev_veh_length = 1.0 veh_width_including_mirrors = 2.80 veh_width_excluding_mirrors = 2.50 cat_conv_fr = 0 fuel_fr[1] = 0.043 fuel_fr[2] = 0.955 fuel_fr[3] = 0.002 equipment_fr = 0 ICC_max_acc = 1.0 ICC_max_dec = ICC_em_dec = -5 ICC_det_range = 13 ICC_det_delay = 0.1 ICC_act_delay = 0.1
Dutch evaluation of Chauffeur Assistant 104

ICC_tau = 1.3 ICC_M = 6 ICC_engage_rt = 0.5 ICC_disengage_rt = 1.0
= 0.1 eshold = -1.0
50.0 0.0 .0
CF_Kd = 0.2
0.2
1.0 -1.
ce = 250.0
cat ns 4
_factor_vdt = 0.0012
int_hw_c2 = 0.25 int_hw_c3 = 0.01
ICC_gain = 0.02 ICC_acc_c = 0.05 ICC_act_gain = 300.00
ISA_K CF_activating_acc_thr CF_influence_distance = 2 CF_influence_time = 1 CF_exponent_distance = 1 CF_exponent_time = 1.0 CF_K = 0.1
CF_Kv = 3.0 CF_Kc = 1.0 EB_activating_acc_threshold = -1.0 EB_influence_distance = 250.0
.0 EB_influence_time = 10 EB_exponent_distance = 1.0 EB_exponent_time = 1.0
0.1 EB_K = EB_Kd = EB_Kv = 3.0
EB_Kc = BW_activating_acc_threshold = 0 BW_influence_distan BW_influence_time = 10.0 BW_exponent_distance = 1.0 BW_exponent_time = 1.0 BW_K = 0.1 BW_Kd = 0.2 BW_Kv = 3.0 BW_Kc = 1.0 * Driver type specifi io n_dr_types =* Driver type data dr_type_nr = 1 mean_int_speed = 121.0 stdev_int_sp = 12.0 pref_lane[1] = 1 pref_lane[2] = 1 pref_lane[3] = 2 pref_lane[4] = 2 mean_reac_time = 0.3 stdev_reac_time = 0.05 max_comf_dec = -5 max_comf_acc = 3 gear_shift_delay = 0.5 lane_change_delay = 1.0 pedal_change_delay = 0.2 norm_max_dec_perc = 0.5 int_sp_error_threshold_da = 0.0 int_sp_error_factor_da = 0.4 dist_dev_factor_ard = 0.3 sp_dev_p_factor_ard = 1.5 sp_dev_pp_factor_ard = 0.2 v_dif int_hw_c1 = 3
Dutch evaluation of Chauffeur Assistant 105

lim_sp_treshold_llc = 0.95 rel_sp_treshold_llc = 0.95 int_sp_treshold_llc = 0.95
= 0.25 = 0.75
= 0.021 = 0.5
elay = 0.5 e_tresh = 70
= 5 r_1 = 1
tor_2 = 1 = -1.5 = 100 = 0
5 1.80
l_default = 0.04 ceedance_lateral = 0.5
= 0.022 teral = 0.026
_vs_intended_lane
_left_lane =
_right_lane =
0.89 1.0
tion 0.25 _switch = 1 0.5
ter _clo 1
tat = 0.
2
int_sp_treshold_rlc = 0.95 max_acc_treshold_rlc = 0.95 no_coll_time_rlc = 30 mlc_prewarndist_var_1 mlc_prewarndist_fix_1 mlc_prewarndist_var_2 = 0.1 mlc_prewarndist_fix_2 = 0.9 mlc_dist_dev_factor_ard_alpha = 3 mlc_sp_dev_factor_p_ard_alpha = 3 mlc_headway_var = 0.75
5 mlc_headway_fix = 0.2 mlc_gap_var = 0.75 mlc_gap_fix = 0.25 mlc_speeddif_tresh = 0.1 mlc_fwd_speed_tresh = 0.95 mlc_angspeed_tresh mlc_hw_accept mlc_lane_change_d congestion_lane_chang out_of_sight_hw lane_change_speed_facto lane_change_speed_fac right_suc_max_neg_acc visibility_distance mean_position_lateral timestep_position_lateral = margin_lateral_default = prob_exceedance_latera factor_adjust_prob_ex stdev_position_lateral_default factor_adjust_stdev_position_la threshold_speed_intended_current_lane= 0.95 threshold_speed_intended_effective1 threshold_speed_intended_effective1 margin_lateral_min = 0.28 margin_lateral_max = 1.78 factor_adjusted_lane_width = factor_adjusted_speed_limit = factor_width_own = 0.1 factor_threat_other = 0.2 min_acceptable_lateral_sepera = acceptable_lateral_seperation treshold_proportion_adjacent = influence_range_lat al_preer d = 40 factor_sensibility_to_la al seness = factor_headway_deviation_passing = 0 factor_speed_deviation_passing = -1.5 factor_headway_deviation_locked = 0.3 factor_speed_deviation_locked = -1.5 lanechange_lanewidth_speedfactor = 0.95; lat_lock_hw = 5; sensitivity_lock_s e 5;* Driver type data dr_type_nr = mean_int_speed = 94.0
Dutch evaluation of Chauffeur Assistant 106

stdev_int_sp = 15.0 pref_lane[1] = 1 pref_lane[2] = 1
0.3
= 1
p_dev_pp_factor_ard = 0.2
int_hw_c3 = 0.01
rel_sp_treshold_llc = 0.95
5 mlc_gap_var = 0.75
= 0.5 elay = 0.5
e_tresh = 70 = 5
r_1 = 1 tor_2 = 1 = -1.5 = 100 = 0
5 1.80
l_default = 0.04 lateral = 0.5 = 0.022 teral = 0.026
_vs_intended_lane
_left_lane =
pref_lane[3] = 2 pref_lane[4] = 2 mean_reac_time = stdev_reac_time = 0.05 max_comf_dec = -5 max_comf_acc = 3 gear_shift_delay .5 lane_change_delay = 1.0 pedal_change_delay = 0.2 norm_max_dec_perc = 0.5 int_sp_error_threshold_da = 0.0 int_sp_error_factor_da = 0.4 dist_dev_factor_ard = 0.3 sp_dev_p_factor_ard = 1.5 s v_dif_factor_vdt = 0.0012 int_hw_c1 = 3 int_hw_c2 = 0.25 lim_sp_treshold_llc = 0.95 int_sp_treshold_llc = 0.95 int_sp_treshold_rlc = 0.95 max_acc_treshold_rlc = 0.95 no_coll_time_rlc = 30
= 0.25 mlc_prewarndist_var_1 mlc_prewarndist_fix_1 = 0.75 mlc_prewarndist_var_2 = 0.1 mlc_prewarndist_fix_2 = 0.9 mlc_dist_dev_factor_ard_alpha = 3 mlc_sp_dev_factor_p_ard_alpha = 3 mlc_headway_var = 0.75 mlc_headway_fix = 0.2
mlc_gap_fix = 0.25 mlc_speeddif_tresh = 0.1 mlc_fwd_speed_tresh = 0.95
= 0.021 mlc_angspeed_tresh mlc_hw_accept mlc_lane_change_d congestion_lane_chang out_of_sight_hw lane_change_speed_facto lane_change_speed_fac right_suc_max_neg_acc visibility_distance mean_position_lateral timestep_position_lateral = margin_lateral_default = prob_exceedance_latera factor_adjust_prob_exceedance_ stdev_position_lateral_default factor_adjust_stdev_position_la threshold_speed_intended_current_lane= 0.95 threshold_speed_intended_effective1
Dutch evaluation of Chauffeur Assistant 107
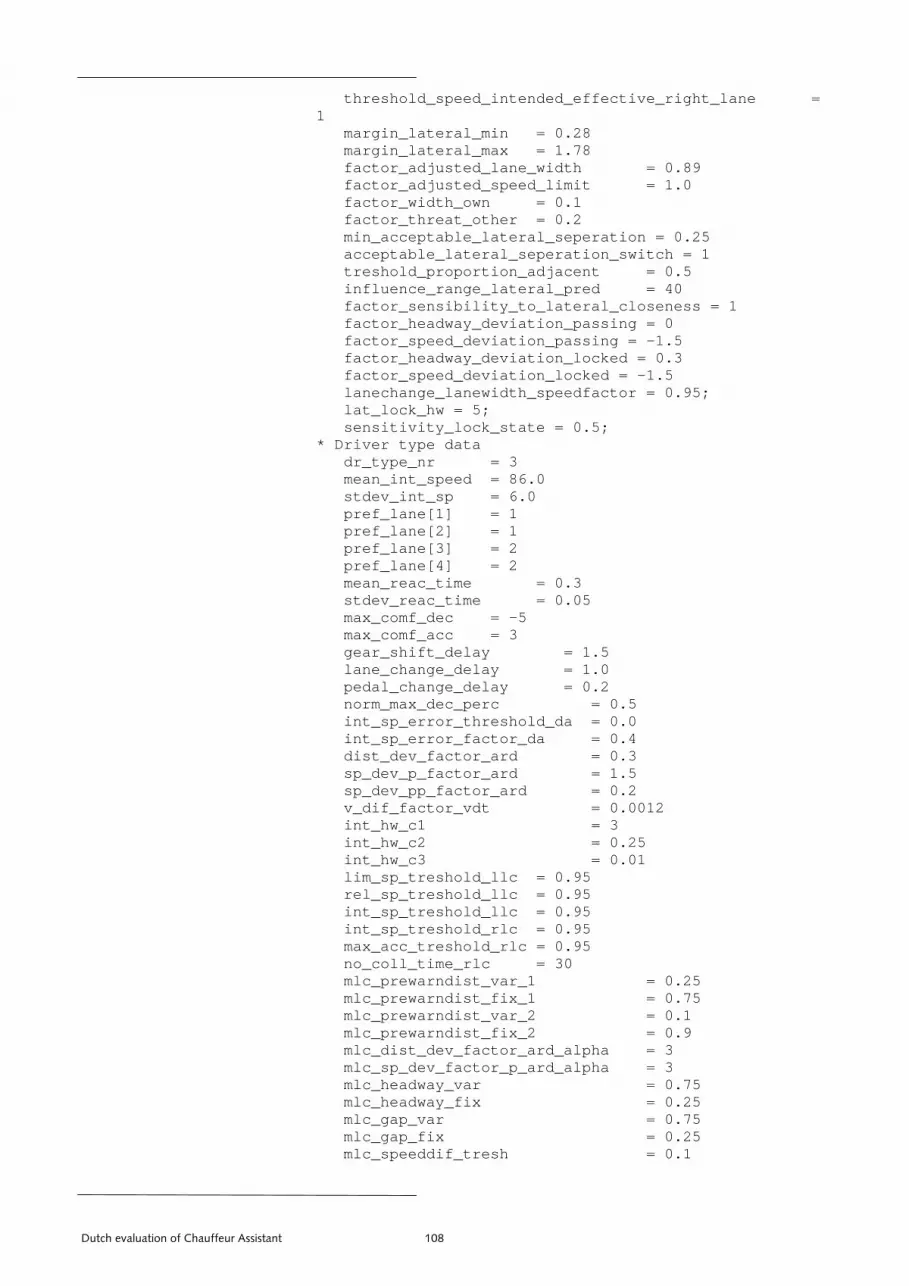
threshold_speed_intended_effective_right_lane =
0.89 = 1.0
tion = 0.25 _swi h = 1
pre ter _clo 1
=
th_ eedf tor
stat = 0.
1
2
p_dev_p_factor_ard = 1.5
int_hw_c2 = 0.25
lim_sp_treshold_llc = 0.95
= 0.25
5 5
1 margin_lateral_min = 0.28 margin_lateral_max = 1.78 factor_adjusted_lane_width = factor_adjusted_speed_limit factor_width_own = 0.1 factor_threat_other = 0.2 min_acceptable_lateral_sepera acceptable_lateral_seperation tc
_a t = 0.5 treshold_proportion djacen influence_range_lateral_ d = 40 factor_sensibility_to_la al seness = factor_headway_deviation_passing = 0 factor_speed_deviation_passing = -1.5 factor_headway_deviation_locked 0.3 factor_speed_deviation_locked = -1.5 lanechange_lanewid sp ac = 0.95; lat_lock_hw = 5;
c sensitivity_lo k_ e 5;* Driver type data dr_type_nr = 3 mean_int_speed = 86.0 stdev_int_sp = 6.0 pref_lane[1] = pref_lane[2] = 1 pref_lane[3] = 2 pref_lane[4] = mean_reac_time = 0.3 stdev_reac_time = 0.05 max_comf_dec = -5 max_comf_acc = 3 gear_shift_delay = 1.5 lane_change_delay = 1.0 pedal_change_delay = 0.2 norm_max_dec_perc = 0.5 int_sp_error_threshold_da = 0.0 int_sp_error_factor_da = 0.4 dist_dev_factor_ard = 0.3 s sp_dev_pp_factor_ard = 0.2 v_dif_factor_vdt = 0.0012 int_hw_c1 = 3 int_hw_c3 = 0.01 rel_sp_treshold_llc = 0.95 int_sp_treshold_llc = 0.95 int_sp_treshold_rlc = 0.95 max_acc_treshold_rlc = 0.95 no_coll_time_rlc = 30 mlc_prewarndist_var_1 mlc_prewarndist_fix_1 = 0.75 mlc_prewarndist_var_2 = 0.1 mlc_prewarndist_fix_2 = 0.9 mlc_dist_dev_factor_ard_alpha = 3 mlc_sp_dev_factor_p_ard_alpha = 3 mlc_headway_var = 0.7 mlc_headway_fix = 0.25 mlc_gap_var = 0.75 mlc_gap_fix = 0.2 mlc_speeddif_tresh = 0.1
Dutch evaluation of Chauffeur Assistant 108

mlc_fwd_speed_tresh = 0.95
= 0.021 = 0.5
= 0.5
tor_1 = 1 = 1 = -1.5 = 100 = 0
al = 5 = 1.80 default = 0.04 edance_lateral = 0.5 efault = 0.022 ition_lateral = 0.026
urrent_lane_vs_intended_lane
_effective_left_lane =
_effective_right_lane =
.28
.78 th = 0.89 mit = 1.0 .1 .2 eperation = 0.25 ion_switch = 1
acent = 0.5 _pred = 40 teral_closeness = 1 n_passing = 0 passing = -1.5 on_locked = 0.3 _locked = -1.5 eedfactor = 0.95;
= 0.5 = 0.0
ctor_da = 0.4 ard = 0.3
5
mlc_angspeed_tresh mlc_hw_accept mlc_lane_change_delay congestion_lane_change_tresh = 70 out_of_sight_hw = 5 lane_change_speed_fac lane_change_speed_factor_2 right_suc_max_neg_acc visibility_distance mean_position_lateral timestep_position_later margin_lateral_default prob_exceedance_lateral_ factor_adjust_prob_exce stdev_position_lateral_d factor_adjust_stdev_pos threshold_speed_intended_c= 0.95 threshold_speed_intended1 threshold_speed_intended1 margin_lateral_min = 0 margin_lateral_max = 1 factor_adjusted_lane_wid factor_adjusted_speed_li factor_width_own = 0 factor_threat_other = 0 min_acceptable_lateral_s acceptable_lateral_seperat treshold_proportion_adj influence_range_lateral factor_sensibility_to_la factor_headway_deviatio factor_speed_deviation_ factor_headway_deviati factor_speed_deviation lanechange_lanewidth_sp lat_lock_hw = 5; sensitivity_lock_state = 0.5; * Driver type data dr_type_nr = 4 mean_int_speed = 100.0 stdev_int_sp = 5.0 pref_lane[1] = 1 pref_lane[2] = 1 pref_lane[3] = 2 pref_lane[4] = 2 mean_reac_time = 0.3 stdev_reac_time = 0.05 max_comf_dec = -5 max_comf_acc = 3 gear_shift_delay = 0.5 lane_change_delay = 1.0 pedal_change_delay = 0.2 norm_max_dec_perc int_sp_error_threshold_da int_sp_error_fa dist_dev_factor_ sp_dev_p_factor_ard = 1.
Dutch evaluation of Chauffeur Assistant 109

sp_dev_pp_factor_ard = 0.2
0012
25
.25 x_1 = 0.75 ar_2 = 0.1
t_fix_2 = 0.9 _ard_alpha = 3 _ard_alpha = 3
headway_var = 0.75 mlc_headway_fix = 0.25 mlc_gap_var = 0.75 mlc_gap_fix = 0.25 mlc_speeddif_tresh = 0.1 mlc_fwd_speed_tresh = 0.95 mlc_angspeed_tresh = 0.021 mlc_hw_accept = 0.5 mlc_lane_change_delay = 0.5 congestion_lane_change_tresh = 70 out_of_sight_hw = 5 lane_change_speed_factor_1 = 1 lane_change_speed_factor_2 = 1 right_suc_max_neg_acc = -1.5 visibility_distance = 100 mean_position_lateral = 0 timestep_position_lateral = 5 margin_lateral_default = 1.80 prob_exceedance_lateral_default = 0.04 factor_adjust_prob_exceedance_lateral = 0.5 stdev_position_lateral_default = 0.022 factor_adjust_stdev_position_lateral = 0.026 threshold_speed_intended_current_lane_vs_intended_lane = 0.95 threshold_speed_intended_effective_left_lane = 1 threshold_speed_intended_effective_right_lane = 1 margin_lateral_min = 0.28 margin_lateral_max = 1.78 factor_adjusted_lane_width = 0.89 factor_adjusted_speed_limit = 1.0 factor_width_own = 0.1 factor_threat_other = 0.2 min_acceptable_lateral_seperation = 0.25 acceptable_lateral_seperation_switch = 1 treshold_proportion_adjacent = 0.5 influence_range_lateral_pred = 40 factor_sensibility_to_lateral_closeness = 1 factor_headway_deviation_passing = 0 factor_speed_deviation_passing = -1.5 factor_headway_deviation_locked = 0.3 factor_speed_deviation_locked = -1.5 lanechange_lanewidth_speedfactor = 0.95;
v_dif_factor_vdt = 0. int_hw_c1 = 3 int_hw_c2 = 0. int_hw_c3 = 0.01 lim_sp_treshold_llc = 0.95 rel_sp_treshold_llc = 0.95 int_sp_treshold_llc = 0.95 int_sp_treshold_rlc = 0.95 max_acc_treshold_rlc = 0.95 no_coll_time_rlc = 30 mlc_prewarndist_var_1 = 0 mlc_prewarndist_fi
t_v mlc_prewarndis mlc_prewarndis mlc_dist_dev_factor mlc_sp_dev_factor_p mlc_
Dutch evaluation of Chauffeur Assistant 110

Dutch evaluation of Chauffeur Assistant 111
lat_lock_hw = 5; sensitivity_lock_state = 0.5; * Traffic demand specification orgn_id = 1 n_routes = 1 route[1] = 1 - 2 - 3 - 4 - 5 - 6 -7 veh_gen_mode = 1 inj_file = V20.INJ flow = 4000 fl_fr_route[1] = 1.0 comb_fr[1][1] = 0.17 comb_fr[1][2] = 0.0 comb_fr[1][3] = 0.0 comb_fr[1][4] = 0.17 comb_fr[2][1] = 0.0 comb_fr[2][2] = 0.33 comb_fr[2][3] = 0.0 comb_fr[2][4] = 0.0 comb_fr[3][1] = 0.0 comb_fr[3][2] = 0.0 comb_fr[3][3] = 0.33 comb_fr[3][4] = 0.0 fl_fr[1][1] = 0.10 fl_fr[1][2] = 0.12 fl_fr[1][3] = 0.10 fl_fr[2][1] = 0.30 fl_fr[2][2] = 0.02 fl_fr[2][3] = 0.01 fl_fr[3][1] = 0.35 fl_fr[3][2] = 0.00 fl_fr[3][3] = 0.00 * ICC Control specification AICC_k = 0.3 AICC_kd = 0.1 AICC_kv = 0.58 inter_pl_hw = 1.5 intra_pl_hw = 1.0 platoon_size = 10 ICC_ref_lower = 50 ICC_ref_upper = 140 curdec_thresh_diseng = 0.1 desdec_thresh_diseng = 0.5 curaiccmaxdecalarmcorr = 0.25 min_acc_eng = -0.5 max_acc_eng = 0.5 a_re_eng = -1 CF_extrapolation_time = 1.0 CF_send_delay_time = 0.1 CF_receive_delay_time = 0.1 CF_spot_all_lanes = 1 EB_extrapolation_time = 1.0 EB_send_delay_time = 0.1 EB_receive_delay_time = 0.1 EB_spot_all_lanes = 1 BW_extrapolation_time = 1.0 BW_send_delay_time = 0.1 BW_receive_delay_time = 0.1 BW_spot_all_lanes = 1 * ISA Algorithmic parameters link = 2 position = 500 OnBeaconOffset = -500

Dutch evaluation of Chauffeur Assistant 112
OffBeaconOffset = 500 StartingTime = 0 TimeInterval = 30 V_freeflow = 120 V_ISA_reduction = 0.8 V_ISA_Crude_diff = 5 LaneCapacityReductionFactor = 0.6667 Threshold_ISA_off = 0.05 Factor_ISA_off = 223 V_ISA_Congestion = 70 ISA_receive_delay_time = 0.1 ISA_look_backwards_distance = 50.0 * Observation point link = 1 position = 1 StartingTime = 0 TimeInterval = 60 * End C

![Bi-deca-y-media-diálogo, máximas de diseño [Español] (2012)](https://img.pdfslide.net/doc/110x75/631f75673b43b66d3c0fc705/bi-deca-y-media-dialogo-maximas-de-diseno-espanol-2012.jpg)


