Embed Size (px)
Citation preview
DWPF Startup Frit Viscosity Measurement Round Robin Results
Jarrod V. Crum,‡,† Tommy B. Edwards,§ Renee L. Russell,‡ Phyllis J. Workman,§
Michael J. Schweiger,‡ Ray F. Schumacher,§ Don E. Smith,‡ David K. Peeler,§ and John D. Vienna‡
‡Pacific Northwest National Laboratory, Richland, Washington 99352
§Savannah River National Laboratory, Aiken, South Carolina 29808
A viscosity standard is needed to replace the National Institute
of Standards and Technology (NIST) glasses currently being
used to calibrate viscosity measurement equipment. The current
NIST glasses are either unavailable or less than ideal for cali-brating equipment to measure the viscosity of high-level waste
glasses. This report documents the results of a viscosity round
robin study conducted on the Defense Waste Processing Facility
(DWPF) startup frit. DWPF startup frit was selected becauseits viscosity-temperature relationship is similar to most DWPF
and Hanford high-level waste glass compositions. The glass
underwent grinding and blending to homogenize the large
batch. Portions of the batch were supplied to eight laboratoriesfor viscosity measurements, which were conducted following a
specified temperature schedule with a temperature range of
1150°C–950°C, with an option to measure viscosity at temper-atures below 950°C if their equipment was capable. Results
were used to fit the Vogel-Fulcher-Tamman-Hesse and Arrhe-
nius equations to viscosity as a function of temperature for the
entire temperature range of 460°C through 1250°C as well asthe limited temperature interval of ~ 950°C through 1250°C.The standard errors for confidence and prediction were deter-
mined for the fitted models.
I. Background
THE U.S. Department of Energy (DOE) is responsible forpermanently disposing of large quantities of radioactive
waste at its facilities. The Savannah River Site in South Car-olina has 130 million liters of waste that is currently beingtreated at the Defense Waste Processing Facility (DWPF) byvitrification. The Hanford Site in Washington State has210 million liters of waste that will be treated at the HanfordTank Waste Treatment and Immobilization Plant (WTP)that is still under construction. Both DOE sites conductresearch to optimize the glass formulations for waste feed tomelters.
Viscosity is a critical property for operating a glass melterthat is designed to operate within a specific viscosity range.The viscosity range generally considered for waste vitrifica-tion is from 2 to 10 Pa·s at a nominal operating temperatureof 1150°C. For this reason, glass formulation efforts requirethe ability to accurately measure the viscosity of glasses as afunction of temperature.
Viscosity-measuring equipment was previously calibrated,and glass-viscosity results were validated with standard refer-ence materials (SRM) from the National Institute of Stan-dards and Technology (NIST), such as SRM 711, and 710a.
These glasses are similar in composition to commercialglasses (e.g., soda-lime-silicates), but differ significantly fromhigh-level waste (HLW) glasses in composition (e.g., borosili-cates) and viscosity-temperature relationships. For example,the predicted viscosity of SRM 711 at 1150°C = 439 Pa·swhereas a typical HLW glass is between 2 and 10 Pa·s at1150°C. In general, commercial glasses melt at significantlyhigher temperatures than HLW glasses. Also, it is becomingdifficult to acquire SRM 711 and SRM 710a glasses as theyare no longer available for purchase from NIST. Finally, theSRM 711 glass contains a significant fraction of lead, makingdisposal of the glass and furnace parts used in its measure-ment difficult. Hence, for several reasons, there is a need toreplace the glass standard used for viscosity measurements ofHLW glass.
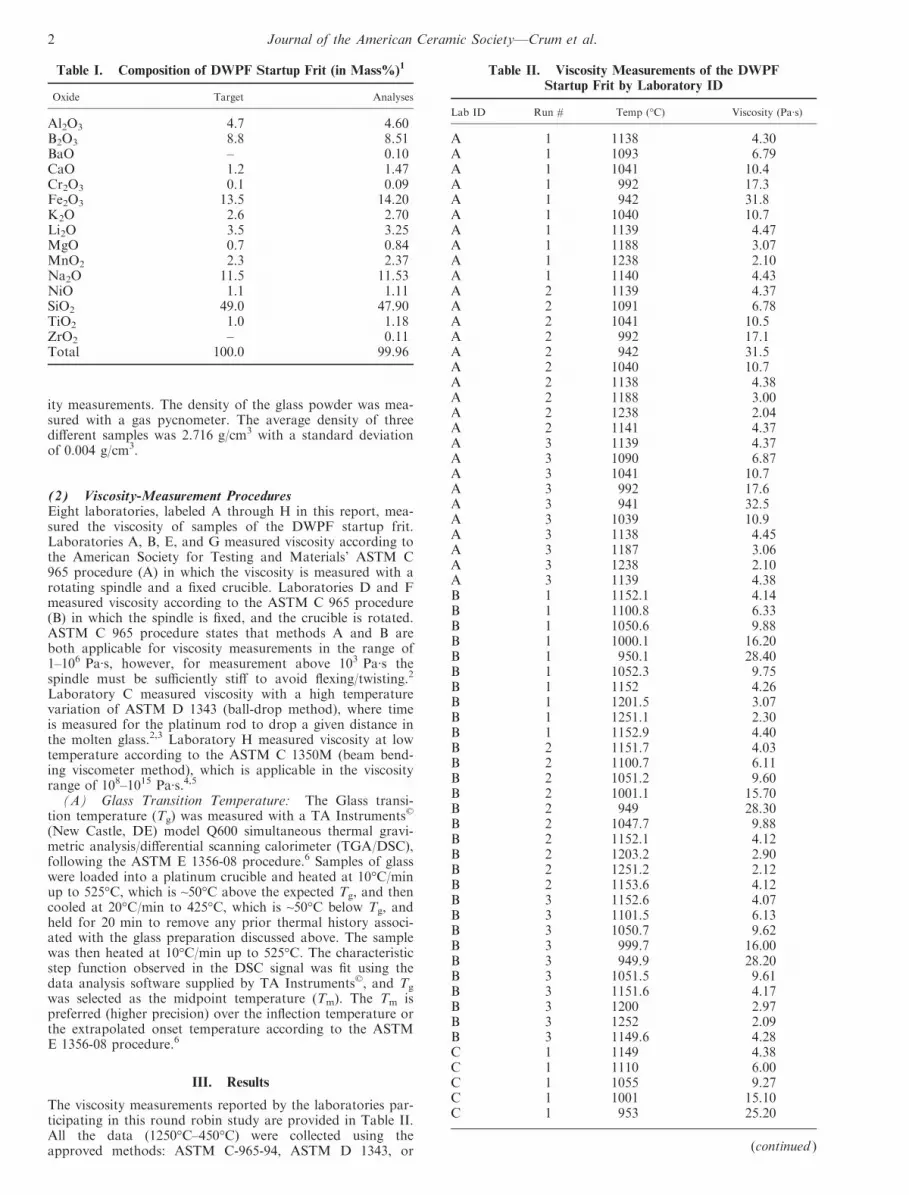
The DWPF startup frit was identified as a good candidateto be characterized and used as a viscosity standard for cali-brating viscosity-measurement equipment and for validatingviscosity measurements for HLW glasses. Its compositionand viscosity-temperature relationship are typical of a HLWglass, and it is available in sufficient quantities to provide asupply of standard glass to labs in the nuclear waste glassfield that require its use. The target composition and theaverage composition from several measurements conductedby Corning Engineering Laboratory Services of this glass areshown in Table I.1 Glass composition is given for generalbackground information and is considered only a closeapproximation of the present glass composition due to glasspreparation steps taken, particularly ball milling, for thisround robin study.
To thoroughly characterize the viscosity-temperature rela-tionship of the DWPF startup frit, several different laborato-ries participated in a viscosity measurement round robin.Each laboratory was given a letter with the temperaturesequence and enough glass for three viscosity measurements.
II. Experimental Procedure
(1) Glass PreparationSavannah River Technology Center (SRTC) supplied 45 kgof DWPF startup frit glass to Pacific Northwest NationalLaboratory. Ferro Corporation fabricated the glass forSRTC. This portion of glass is from lot number 10-27-87 ofproduct number SG-565.1
The glass was ground and mixed to minimize any compo-sitional differences that may have been present. The entirebatch of glass was loaded into an alumina ball mill for grind-ing and blending, in a one step process, to less than 150 lm.The glass was split into 600- to 700-g samples that were indi-vidually numbered and tracked in a logbook, for use in thisstudy as well as future calibration of equipment. Sampleswere then supplied to the participating laboratories in thepowdered form.
Since the glass is in a powdered form, the density wasmeasured to calculate the volume of glass needed for viscos-
T. Rouxel—contributing editor
Manuscript No. 29720. Received May 11, 2011; approved March 22, 2012.†Author to whom correspondence should be addressed. e-mail: Jarrod.Crum@
pnl.gov
1
J. Am. Ceram. Soc., 1–10 (2012)
DOI: 10.1111/j.1551-2916.2012.05220.x
© 2012 The American Ceramic Society
Journal
ity measurements. The density of the glass powder was mea-sured with a gas pycnometer. The average density of threedifferent samples was 2.716 g/cm3 with a standard deviationof 0.004 g/cm3.
(2) Viscosity-Measurement ProceduresEight laboratories, labeled A through H in this report, mea-sured the viscosity of samples of the DWPF startup frit.Laboratories A, B, E, and G measured viscosity according tothe American Society for Testing and Materials’ ASTM C965 procedure (A) in which the viscosity is measured with arotating spindle and a fixed crucible. Laboratories D and Fmeasured viscosity according to the ASTM C 965 procedure(B) in which the spindle is fixed, and the crucible is rotated.ASTM C 965 procedure states that methods A and B areboth applicable for viscosity measurements in the range of1–106 Pa·s, however, for measurement above 103 Pa·s thespindle must be sufficiently stiff to avoid flexing/twisting.2
Laboratory C measured viscosity with a high temperaturevariation of ASTM D 1343 (ball-drop method), where timeis measured for the platinum rod to drop a given distance inthe molten glass.2,3 Laboratory H measured viscosity at lowtemperature according to the ASTM C 1350M (beam bend-ing viscometer method), which is applicable in the viscosityrange of 108–1015 Pa·s.4,5
(A) Glass Transition Temperature: The Glass transi-tion temperature (Tg) was measured with a TA Instruments©
(New Castle, DE) model Q600 simultaneous thermal gravi-metric analysis/differential scanning calorimeter (TGA/DSC),following the ASTM E 1356-08 procedure.6 Samples of glasswere loaded into a platinum crucible and heated at 10°C/minup to 525°C, which is ~50°C above the expected Tg, and thencooled at 20°C/min to 425°C, which is ~50°C below Tg, andheld for 20 min to remove any prior thermal history associ-ated with the glass preparation discussed above. The samplewas then heated at 10°C/min up to 525°C. The characteristicstep function observed in the DSC signal was fit using thedata analysis software supplied by TA Instruments©, and Tg
was selected as the midpoint temperature (Tm). The Tm ispreferred (higher precision) over the inflection temperature orthe extrapolated onset temperature according to the ASTME 1356-08 procedure.6
III. Results
The viscosity measurements reported by the laboratories par-ticipating in this round robin study are provided in Table II.All the data (1250°C–450°C) were collected using theapproved methods: ASTM C-965-94, ASTM D 1343, or
Table II. Viscosity Measurements of the DWPFStartup Frit by Laboratory ID
Lab ID Run # Temp (°C) Viscosity (Pa·s)
A 1 1138 4.30A 1 1093 6.79A 1 1041 10.4A 1 992 17.3A 1 942 31.8A 1 1040 10.7A 1 1139 4.47A 1 1188 3.07A 1 1238 2.10A 1 1140 4.43A 2 1139 4.37A 2 1091 6.78A 2 1041 10.5A 2 992 17.1A 2 942 31.5A 2 1040 10.7A 2 1138 4.38A 2 1188 3.00A 2 1238 2.04A 2 1141 4.37A 3 1139 4.37A 3 1090 6.87A 3 1041 10.7A 3 992 17.6A 3 941 32.5A 3 1039 10.9A 3 1138 4.45A 3 1187 3.06A 3 1238 2.10A 3 1139 4.38B 1 1152.1 4.14B 1 1100.8 6.33B 1 1050.6 9.88B 1 1000.1 16.20B 1 950.1 28.40B 1 1052.3 9.75B 1 1152 4.26B 1 1201.5 3.07B 1 1251.1 2.30B 1 1152.9 4.40B 2 1151.7 4.03B 2 1100.7 6.11B 2 1051.2 9.60B 2 1001.1 15.70B 2 949 28.30B 2 1047.7 9.88B 2 1152.1 4.12B 2 1203.2 2.90B 2 1251.2 2.12B 2 1153.6 4.12B 3 1152.6 4.07B 3 1101.5 6.13B 3 1050.7 9.62B 3 999.7 16.00B 3 949.9 28.20B 3 1051.5 9.61B 3 1151.6 4.17B 3 1200 2.97B 3 1252 2.09B 3 1149.6 4.28C 1 1149 4.38C 1 1110 6.00C 1 1055 9.27C 1 1001 15.10C 1 953 25.20
(continued )
Table I. Composition of DWPF Startup Frit (in Mass%)1
Oxide Target Analyses
Al2O3 4.7 4.60B2O3 8.8 8.51BaO – 0.10CaO 1.2 1.47Cr2O3 0.1 0.09Fe2O3 13.5 14.20K2O 2.6 2.70Li2O 3.5 3.25MgO 0.7 0.84MnO2 2.3 2.37Na2O 11.5 11.53NiO 1.1 1.11SiO2 49.0 47.90TiO2 1.0 1.18ZrO2 – 0.11Total 100.0 99.96
2 Journal of the American Ceramic Society—Crum et al.

Table II. (continued )
Lab ID Run # Temp (°C) Viscosity (Pa·s)
C 1 1055 9.06C 1 1151 4.54C 1 1197 3.46C 1 1250 2.53C 1 1164 4.11C 2 1155 4.06C 2 1115 5.52C 2 1062 8.47C 2 1006 14.70C 2 956 24.20C 2 1053 8.79C 2 1158 4.27C 2 1201 3.13C 2 1246 2.58C 2 1162 4.06D 1 1167.4 4.07D 1 1109.9 6.11D 1 1054 9.68D 1 994.7 17.4D 1 947.3 30.1D 1 881.4 73.4D 1 833.5 164D 1 760.1 759D 1 711 3050D 1 662.7 16800D 1 616.6 141000D 2 1152.3 4.26D 2 1117.9 5.62D 2 1059.8 9.26D 2 999.5 16.7D 2 942.8 31.1D 2 874.6 81.5D 2 827.8 181D 2 723.2 2060D 2 698.8 4550D 2 651.3 26800D 3 1165.3 3.92D 3 1121.2 5.47D 3 1056.2 9.3D 3 998.2 16.2D 3 941.9 31.1D 3 885.9 69D 3 816.5 225D 3 766.5 657D 3 715.3 2670D 3 652.4 24100D 3 621.6 108000E 1 1155.6 3.62E 1 1105.3 5.51E 1 1055.1 8.71E 1 1005.6 14.5E 1 955.8 25.8E 1 1056.5 8.70E 1 1155.7 3.70E 1 1204.8 2.59E 1 1254 1.87E 1 1154.9 3.73E 2 1160 3.71E 2 1108.9 5.68E 2 1058.3 8.99E 2 1008.3 15.0E 2 958.4 26.6E 2 1059.2 8.96E 2 1158.1 3.84E 2 1207.1 2.68E 2 1255.9 1.92
(continued )
Table II. (continued )
Lab ID Run # Temp (°C) Viscosity (Pa·s)
E 2 1156.7 3.88E 3 1160.1 3.60E 3 1108.9 5.50E 3 1058.2 8.74E 3 1008.1 14.6E 3 958.3 25.8E 3 1059.1 8.64E 3 1158.1 3.67E 3 1206.9 2.57E 3 1255.9 1.84E 3 1156.7 3.73F 1 1081 8.09F 1 1006 16.7F 1 949 33F 1 888 76.2F 1 846 166F 1 785 561F 1 732 2850F 1 698 9100F 2 1075 7.80F 2 1025 12.9F 2 962 28.4F 2 903 64.6F 2 842 183F 2 787 537F 2 732 2610F 2 686 10800F 3 1069 8.61F 3 1031 12.6F 3 959 30.8F 3 916 55.3F 3 837 202F 3 784 692F 3 752 1580F 3 707 6790G 1 1206.5 2.78G 1 1151 4.21G 1 1097 6.58G 1 1044 10.8G 1 991 18.9G 1 938 35.7G 2 1205 2.82G 2 1152.5 4.23G 2 1096 6.63G 2 1042 10.9G 2 989 19.0G 2 935.5 36.2G 3 1204 2.78G 3 1149.5 4.19G 3 1095.5 6.55G 3 1042 10.8G 3 989 18.9G 3 936 35.4H 1 462.18 4.23E + 11H 1 463.17 3.57E + 11H 1 464.1 3.05E + 11H 1 465.07 2.69E + 11H 1 466.07 2.34E + 11H 1 467.03 2.00E + 11H 1 467.99 1.71E + 11H 1 468.84 1.52E + 11H 1 469.76 1.33E + 11H 1 470.61 1.16E + 11H 1 471.65 9.96E + 10H 1 472.51 8.49E + 10H 1 473.49 7.04E + 10
(continued )
Viscosity Measurement Round Robin Results 3

ASTM C 1350M.2–4 These data serve as the basis for estab-lishing a viscosity-temperature relationship for the DWPFstartup frit intended for use in calibrating viscosity-measur-ing equipment to determine the viscosity of glass in accor-dance with ASTM C-965-94.2 They are also used to validateviscosity-temperature data-measurement techniques. Notethat the temperature ranges over which the viscosity-measurement procedures of the various laboratories wereconducted are not the same. Laboratories were asked to mea-sure viscosity over the temperature range of 1150°C–950°C.In addition, laboratories were encouraged to make additionalmeasurements outside this range if their equipment was capa-ble of doing so. These temperature intervals are summarizedin Table III.
Table II shows that over the interval from ~ 460°C to1250°C, there are some temperatures for which only one ortwo laboratories provide data. For example, Laboratory Hprovides the only data in the interval from 460°C to 500°C,and Laboratory D and F provided the only data in the inter-val from ~ 617°C to 936°C. On the other hand, data wereprovided by seven of the eight laboratories in the intervalfrom ~ 936°C to 1080°C. These observations are made tocaution the reader to the assumptions underlying the use ofthe data in Table II. Namely, it is assumed that no apprecia-ble bias is present in the viscosity measurements from any ofthe participating laboratories over the temperature intervalsfor which several laboratories provided data. This is checkedby looking for any inconsistency between the values fromone laboratory to another laboratory. However, for sometemperature intervals (with only one or two laboratories pro-viding data), there is no opportunity for such an assessment.
The Tg was measured to provide an opportunity to checkthe low-temperature, high-viscosity data collected by Labora-tory H with data given in Table IV. This was done based onthe relationship between Tg and viscosity, given as1011.3 Pa·s.7 Laboratory H was the only one that collectedviscosity data in that temperature range, and it was the onlyone that used the beam bending method.
Plots of the natural logarithms of viscosity, ln(g, [Pa·s]),versus 1/T (K) are provided in Figs. 1–3. Different symbolsare used to represent the different laboratories, whereas dif-ferent colors are used to represent the different “runs” by alaboratory. Figure 1 provides a plot of all of the availabledata over the full range of temperatures whereas Fig. 2 con-centrates only on the low-end temperatures and Fig. 3 on thedata for temperatures from 600ºC to 1250ºC.
These plots indicate consistent results across these temper-ature intervals for the measurements generated by the partici-pating laboratories. There is no set of laboratory data thatappears to be grossly inconsistent with the results from theother laboratories.
IV. Discussion
The nonlinear fitting platform of JMP® Version 4.0 fromSAS Institute, Inc.8 was used to fit the Vogel-Fulcher-Tam-man-Hesse (VFTH) model to all the available viscosity dataand a restricted range of viscosity data more applicable tonuclear waste glass processing. This model was of the form:
lnðgÞ ¼ Aþ B
TðoCÞ � C(1)
where g represents the viscosity in Pascal seconds (Pa·s), andA, B, and C are temperature-independent parameters whose
Table II. (continued )
Lab ID Run # Temp (°C) Viscosity (Pa·s)
H 1 474.44 6.28E + 10H 1 475.48 5.76E + 10H 1 476.5 4.96E + 10H 1 477.46 4.34E + 10H 1 478.48 3.76E + 10H 1 479.57 3.32E + 10H 1 480.55 2.85E + 10H 1 481.45 2.49E + 10H 1 482.51 2.09E + 10H 2 460.3138 4.70E + 11H 2 461.157 3.94E + 11H 2 462.1096 3.41E + 11H 2 463.0227 2.87E + 11H 2 463.9411 2.52E + 11H 2 464.7303 2.17E + 11H 2 465.6677 1.85E + 11H 2 466.715 1.61E + 11H 2 467.7029 1.38E + 11H 2 468.6408 1.19E + 11H 2 469.6873 1.01E + 11H 2 470.6216 8.68E + 10H 2 471.667 7.55E + 10H 2 472.6667 6.55E + 10H 2 473.6915 5.61E + 10H 2 474.7836 4.89E + 10H 2 475.7408 4.27E + 10H 2 476.6783 3.73E + 10H 2 477.6645 3.26E + 10H 2 478.5901 2.89E + 10H 2 479.6298 2.52E + 10H 2 480.6107 2.21E + 10H 3 461.3023 4.38E + 11H 3 462.2307 3.84E + 11H 3 463.1021 3.30E + 11H 3 463.9231 2.88E + 11H 3 464.8872 2.48E + 11H 3 465.911 2.14E + 11H 3 466.8886 1.73E + 11H 3 467.7707 1.50E + 11H 3 468.7025 1.29E + 11H 3 469.6384 1.12E + 11H 3 470.6155 9.77E + 10H 3 471.6078 8.59E + 10H 3 472.5378 7.28E + 10H 3 473.6055 6.28E + 10H 3 474.8264 5.25E + 10H 3 475.6331 4.52E + 10H 3 476.3489 4.03E + 10H 3 477.3402 3.56E + 10H 3 478.2872 3.11E + 10H 3 479.3658 2.69E + 10H 3 480.4343 2.33E + 10
Table III. Temperature Intervals by Laboratory
Lab Method Min Temp (°C) Max Temp (°C)
A ASTM C 965 (A) 941 1238B ASTM C 965 (A) 949 1252C ASTM D 1343 953 1250D ASTM C 965 (B) 616.6 1167.4E ASTM C 965 (A) 955.8 1255.9F ASTM C 965 (B) 686 1081G ASTM C 965 (A) 935.5 1206.5H ASTM C 1350M 460.3 482.5
Table IV. Tg Measurements of the DWPF Startup Frit, °C
Measurement # 1 2 3 Mean STD
DWPF Startup Frit 466.22 466.64 465.37 466.08 0.65
4 Journal of the American Ceramic Society—Crum et al.

values were fitted with the available data. Natural logarithmwas chosen for easy comparison with fits done using the Ar-rhenius equation, given later in the article. The resultingVFTH curve from the JMP® nonlinear fitting process forEq. (1) is plotted along with data in Fig. 4. See SAS Insti-tute, Inc. for details associated with this fitting process andfor a complete description of the JMP® statistical software.8
The estimated VFTH equation relating the natural logarithmof viscosity in Pa·s to temperature in °C for all the availabledata is given by:
lnðgÞ ¼ �5:2892þ 5831:114
TðoCÞ � 280:1372(2)
The sum of squares for error (SSE) for this fit is 3.1903with 246 degrees of freedom (DFE). This leads to a mean
squared error (MSE) of 0.01297 and a root mean squarederror (RMSE) of 0.11388. The RMSE is the estimated stan-dard deviation for the scatter (due to measurement and pro-cedural effects for the various laboratories) around theVFTH equation for this glass.
The JMP software uses all the available data to determinea pooled estimate of this scatter. However, the sources ofvariation contributing to this scatter include those from lab-to-lab, run-to-run, and within-run for the various laborato-ries. Unfortunately, such a division of the sources of the vari-ation is not supported by the fitting of Eq. (1) to all thedata, which assumes that the variation around the fittedcurve is adequately represented as a single, random variablewith a constant variance. Even though one might expectmore variation from lab-to-lab or run-to-run, there are manymore DFE for within-run than between runs or betweenlaboratories for the available data.
Fig. 2. Close up of viscosity data collected below 500°C.
Fig. 3. Close up of viscosity data collected above 600°C.Fig. 1. All viscosity data collected over full temperature range.
Fig. 4. Fitted VFTH equation to all viscosity data.
Viscosity Measurement Round Robin Results 5

To assess the impact of these limitations in the fitting ofEq. (1) on the estimates of the associated errors, a subset ofthe available data was used in fitting the equation. The fittingof Eq. (1) was conducted with only one observation fromeach laboratory, while the full temperature range was cov-ered. For this approach, the random error representing thescatter about the fitted equation captures a single occurrenceof the lab-to-lab, run-to-run, and within-run variations. TheRMSE error and its associated degrees of freedom from thisfit are readily interpretable. For the data selected, the result-ing fit led to an RMSE of 0.185 with 5 degrees of freedom ascompared to the RMSE of 0.114 with 246 degrees of free-dom. How do these results influence the interpretation of theresults associated with the fitted Eq. (2)? First, consider thefollowing details from that fit.
Table V provides the model predictions, their standarddeviations, 95% confidence intervals, and 95% predictionlimits [in ln(g), Pa·s] for the fitted model given by Eq. (2)over the temperature interval from 450°C to 1250°C. Thevalues in this table were generated with results from JMP’sNonlinear Model-fitting platform. The standard deviation ofeach fitted point as an estimate of the mean viscosity is pro-vided at each of these temperatures (labeled standard errorfor confidence), and the standard deviation of each fittedpoint as an estimate of an individual viscosity determinationalso is provided at each of these temperatures (labeled stan-dard error for prediction). These standard errors were usedto generate approximate 95% confidence intervals for meanviscosity values and 95% prediction limits for individual vis-cosity values at temperatures within the interval of 450°C–1250°C. The 95% confidence interval at a given temperatureprovides a confidence interval for the true mean viscosity atthat temperature. The 95% prediction limits at a given tem-perature provide a prediction interval for a future viscositymeasurement at that temperature.
The 95% confidence limits for the fitted model are used toprovide estimates of the uncertainties for mean viscosity val-ues predicted via Eq. (2). For example, this interval runs from5.898 to 5.957 (in ln g [Pa·s]) for a temperature of 800°C.Thus, the interval from 5.898 to 5.957 covers the true meanviscosity (in ln g [Pa·s]) of the DWPF startup frit at thistemperature with 95% confidence.
Similarly, 95% prediction limits are used to provide esti-mates of the uncertainties for individual viscosity values pre-dicted via Eq. (2). Table V provides these uncertainties aslower prediction limit and upper prediction limit values. Forexample, these limits are 5.701 and 6.154, respectively, (in lng [Pa·s]) for a temperature of 800°C. Thus, a future viscositymeasurement (in ln g [Pa·s]) at a temperature of 800°C isexpected to fall within the interval from 5.898 to 5.957 with95% confidence.
Now, consider the special fit of Eq. (1) using only a singleobservation from each laboratory while covering the fulltemperature interval of the study. The standard error forconfidence from this special fit ranged from a low of 0.072 at950°C to a high of 0.238 at 450°C, while the standard errorfor prediction ranged from a low of 0.199 at 950°C to a highof 0.301 at 450°C (both these errors being expressed in ln g[Pa·s]). Although these uncertainties are based on only eightobservations from the available data, they do suggest thatthe standard errors for confidence in Table V may be under-stated. Thus, the uncertainties offered in Table V should beused with some caution because of the error assumptionsinherent in the fitting of Eq. (2). However, they should pro-vide guidance in evaluating and assessing future sets of vis-cosity measurements of the DWPF startup frit over this fulltemperature range, and it may be beneficial to update theseuncertainties with the results generated by such studies.
An additional model fit was performed using data from ~930°C to 1250°C, the temperature range of most interest toHLW glass producers. The VFTH equation fit to therestricted data set is shown in Fig. 5. The estimated VFTH
Table
V.
Estim
atedViscosities
UsingtheFullFitWithin
theTem
perature
Intervalof450°C
–1250°C
andTheirAssociatedConfidence
IntervalsandPredictionLim
its
Tem
perature
(°C)
ln(g
[Pa·s])OverallFit
Standard
ErrorforConfidence
†Standard
ErrorforPrediction‡
95%
Confidence
Interval
95%
PredictionLim
its
Lower
Confidence
Lim
itUpper
Confidence
Lim
itLower
PredictionLim
itUpper
PredictionLim
it
450
29.039
0.027
0.117
28.985
29.093
28.809
29.270
500
21.232
0.018
0.115
21.197
21.268
21.005
21.459
550
16.319
0.025
0.117
16.269
16.368
16.089
16.548
600
12.941
0.026
0.117
12.889
12.992
12.711
13.171
650
10.476
0.024
0.116
10.429
10.524
10.247
10.706
700
8.599
0.021
0.116
8.557
8.641
8.371
8.827
750
7.121
0.018
0.115
7.086
7.157
6.894
7.348
800
5.927
0.015
0.115
5.898
5.957
5.701
6.154
850
4.943
0.012
0.115
4.919
4.968
4.718
5.169
900
4.118
0.010
0.114
4.097
4.139
3.893
4.343
950
3.416
0.009
0.114
3.398
3.434
3.191
3.641
1000
2.811
0.009
0.114
2.794
2.828
2.586
3.036
1050
2.285
0.009
0.114
2.268
2.302
2.060
2.510
1100
1.823
0.009
0.114
1.805
1.841
1.598
2.048
1150
1.414
0.010
0.114
1.394
1.434
1.189
1.640
1200
1.050
0.011
0.114
1.028
1.072
0.825
1.275
1250
0.723
0.013
0.115
0.699
0.748
0.497
0.949
†Thiscolumnrepresents
thestandard
deviationofthefitted
pointasanestimate
ofthemeanviscosity
atthespecified
temperature
fortheindicatedmodel.
‡Thestandard
errors
presentedin
thiscolumnrepresentthestandard
deviationsofthefitted
points
asestimatesofindividualviscosity
determinationsatthesetemperaturesfortheindicatedmodel.
6 Journal of the American Ceramic Society—Crum et al.

equation relating the natural logarithm of viscosity in Pa·s totemperature in °C over this restricted temperature interval isgiven by:
lnðgÞ ¼ �5:5065þ 6339:696
TðoCÞ � 235:8669(3)
The predicted natural logarithm of viscosity, approximate95% confidence intervals, and approximate 95% predictionlimits for the fitted model and individuals are provided at50°C intervals in Table VI. The SSE for this fit is 0.46129with 149 DFE. This leads to an MSE of 0.0030959 and anRMSE of 0.0556407. The RMSE is the estimated standarddeviation for the scatter (due to measurement and proceduraleffects for the various laboratories) around the VFTH equa-tion for this glass.
Comparing Tables V and VI reveals that the two fittedmodels provide very similar, although certainly not identical,results. For example, at 1150°C, the model using all the datapredicts ln (g [Pa·s]) of 1.414 whereas the restricted model pre-dicts a value of 1.429. Comparing the confidence intervals andprediction limits shows that the restricted fit is supported bydata that have a much smaller degree of scatter in relation tothe fitted models. This might be explained by the use of onlytwo methods to measure viscosity over the 950°C–1250°Ctemperature interval, whereas the overall fit requiredadditional methods, which add additional sources of error.
The restricted temperature range, 930°C–1250°C, data setwas also fit by the Arrhenius function given in Eq. (4),
ln g ¼ Aþ B=T (4)
where A and B are temperature-independent coefficients, andT is in Kelvin. The Arrhenius function is often preferred overVFTH equation for modeling viscosity as a function of glasscomposition within the viscosity range of 1–1000 Pa·s.9 Fig-ure 5 shows Eq. (4) fitted to viscosity data from all laborato-ries within the restricted temperature range.
The estimated Arrhenius Equation for the restricted tem-perature data set is given by:
ln g ¼ �10:10231þ 16424:788=T (5)
The SSE for this fit is 0.608686 with 150 DFE. This leadsto an MSE of 0.0041 and an RMSE of 0.063702. Table VII
Fig. 5. Fitted VFTH and Arrhenius equations to restricted (~950°C–1250°C) viscosity data set.
Table
VI.
VFTH
Estim
atedViscosities
UsingtheRestrictedFitWithin
theTem
perature
Intervalof950°C
–1250°C
andTheirAssociatedConfidence
IntervalsandPredictionLim
its
Tem
perature
(°C)
ln(g
[Pa·s])OverallFit
Standard
ErrorforConfidence
†Standard
ErrorforPrediction‡
95%
Confidence
Interval
95%
PredictionLim
its
Lower
Confidence
Lim
itUpper
Confidence
Lim
itLower
PredictionLim
itUpper
PredictionLim
it
950
3.371
0.011
0.057
3.349
3.393
3.259
3.483
1000
2.790
0.007
0.056
2.777
2.803
2.679
2.901
1050
2.281
0.007
0.056
2.267
2.294
2.170
2.391
1100
1.830
0.006
0.056
1.818
1.842
1.719
1.941
1150
1.429
0.006
0.056
1.418
1.440
1.318
1.539
1200
1.069
0.008
0.056
1.054
1.084
0.958
1.180
1250
0.745
0.012
0.057
0.720
0.769
0.632
0.858
†Thiscolumnrepresents
thestandard
deviationofthefitted
pointasanestimate
ofthemeanviscosity
atthespecified
temperature
fortheindicatedmodel.
‡Thestandard
errors
presentedin
thiscolumnrepresentthestandard
deviationsofthefitted
points
asestimatesofindividualviscosity
determinationsatthesetemperaturesfortheindicatedmodel.
Viscosity Measurement Round Robin Results 7

gives the predicted viscosity, estimated standard error of con-fidence and prediction, estimated 95% confidence limits, andestimated 95% prediction limits for Eq. (5).
If we compare the Arrhenius model to the VFTH model,the Arrhenius fit has a slightly higher RMSE to the restrictedtemperature data set. The standard error and estimated 95%limits of both models are very comparable. There are differ-ences in the calculated viscosities between the two modelsrelated to the curved (VFTH) versus linear (Arrhenius) rela-tionships of the two models. Maximum differences of0.045 Pa·s and 0.064 Pa·s on a natural logarithm basis areobserved at the upper and lower temperatures of the rangefitted.
Arrhenius and VFTH fits were also made to individuallaboratory runs to access the differences in the fitted coeffi-cients that can be expected when fitting data to an individualset of viscosity data because this will typically be the case forviscosity measurements of glasses in general. Table VII givesthe A, B, C, RMSE, and DFE for each run in the restrictedtemperature range. In a few cases, the DFE are 1 because oflimited data within the temperature range. The individual fitsshow quite a large variation of fitted A, B, and C. The equa-tions fit to individual laboratory runs are also plotted interms of natural logarithm viscosity versus inverse tempera-ture in Fig. 6, along with Eqs. (3 and 5), respectively. Basedon these differences from run-to-run and lab-to-lab, a singlerun can lead to difficulties in calibrating equipment. Itappears preferable to make at least two or three calibration
Table
VII.
ArrheniusEstim
atedViscosities
UsingtheRestrictedFitWithin
theTem
perature
Intervalof950°C
–1250°C
andTheirAssociatedConfidence
IntervalsandPredictionLim
its
Tem
perature
(°C)
ln(g
[Pa·s])OverallFit
Standard
ErrorforConfidence
†Standard
ErrorforPrediction‡
95%
Confidence
Interval
95%
PredictionLim
its
Lower
Confidence
Lim
itUpper
Confidence
Lim
itLower
PredictionLim
itUpper
PredictionLim
it
950
3.326
0.010
0.064
3.306
3.346
3.199
3.453
1000
2.799
0.007
0.064
2.784
2.813
2.672
2.925
1050
2.311
0.006
0.064
2.300
2.322
2.185
2.437
1100
1.859
0.005
0.064
1.849
1.869
1.733
1.985
1150
1.439
0.006
0.064
1.426
1.451
1.312
1.565
1200
1.047
0.008
0.064
1.031
1.063
0.920
1.174
1250
0.681
0.010
0.064
0.662
0.701
0.554
0.809
†Thiscolumnrepresents
thestandard
deviationofthefitted
pointasanestimate
ofthemeanviscosity
atthespecified
temperature
fortheindicatedmodel.
‡Thestandard
errors
presentedin
thiscolumnrepresentthestandard
deviationsofthefitted
points
asestimatesofindividualviscosity
determinationsatthesetemperaturesfortheindicatedmodel.
(a)
(b)
Fig. 6. Predicted Ln( ) versus 1/T for fits to individual laboratoryruns by (a) Arrhenius and (b) VFTH equations.
8 Journal of the American Ceramic Society—Crum et al.

runs with any new or modified equipment before deemingthe equipment calibrated. For established equipment, a singlerun may be adequate to demonstrate that the equipment isfunctioning properly and within calibration.
Arrhenius fits were also made to the individual laboratoryruns holding A fixed, where A = �11.5, with results given inTable VIII. Hrma found that a single A was sufficient fordescribing Hanford waste glasses, which allowed for moreprecise measuring/modeling of B without significantlyimpacting the goodness-of-fit to individual glasses.10 Thevalue of B with A fixed is similar to the average B obtainedby fits to all of the individual runs. However, the variabilityof B is significantly smaller with A fixed. For many of theruns, the R2 also remains acceptable.
V. Conclusions
The aim of the round robin study was to provide a glass toreplace the viscosity standards available from NIST. TheDWPF startup frit viscosity profile was measured and shownto have a viscosity-temperature relationship similar to a typi-cal HLW glass. It is also abundant, allowing it to be avail-able for many years as a viscosity standard. Fits to theround robin data using the VFTH equation show an erroron par with that reported for SRM 711 from NIST, whichhas been a preferred standard for calibrating viscometers inthe past. Fits were also done using the Arrhenius functionbetween the temperature range of 1250°C and 930°C to pro-vide an alternative model. Based on these findings, DWPFstartup frit is recommended as a replacement for SRM 711as a viscosity standard for calibrating and verifying measure-ment equipment.
All the data generated by the laboratories participating inthis round robin study of DWPF startup frit viscosity havebeen used to fit the VFTH equation given by (2). A subset ofthis data limited to temperatures above 930°C was used to fitthe VFTH Eq. (3) and Arrhenius Eq. (5). Uncertainties inthe form of confidence intervals for the fitted models andprediction limits for individual predictions, associated withEqs. (2, 3, 5), are given in Tables V, VI, and VII, respec-tively. This information should be of value to laboratories
wanting to use DWPF startup frit for validating test methodsand calibrating equipment to determine the viscosity of glass.
Typical use of this glass is expected to be for calibrationof equipment following the ASTM C 965 procedure over atemperature range of 950°C to 1250°C. Equations (3) or (5)are more precise within their range of validity compared tothe overall fit to data, Eq. (2). Also, seven of the eight labo-ratories measured data within the 950°C–1250°C temperaturerange. No significant bias was seen when comparing data ofthe seven laboratories. All the data used for the restricted fitsfall within the 95% prediction limits. For these reasons, therestricted fits are preferred for calibrating equipment withinits range of validity.
Comparing the VFTH and Arrhenius fits to the restricteddata show very similar predictions, RMSE, and 95% confi-dence and prediction limits. The Arrhenius model (linear)has one fitting parameter less than the VFTH model (curve).Beyond that, these two models perform almost the same so itcomes down to personal preference between the VFTH andArrhenius model fits to the DWPF startup frit glass.
The overall fit was done to provide a full VFTH curve foruse in calibrating equipment over the entire temperaturerange of 460°C to 1250°C. However, the overall fit to data issupported by data from two and in some areas only one lab-oratory for the temperature regions below 930°C. In addi-tion, some of the data used for the fit are suspect for thefollowing reasons. There is some bias in Laboratory H datain relation to the VFTH model. The reason for the bias wasnot determined; however, it was the only data collected usingthe beam bending method, which adds an additional sourceof deviation in relation to the other laboratories, which mea-sured viscosity according to the ASTM C-965 method. TheTg of the glass was measured and agrees well with the pre-dicted viscosity at Tg using the model fit to all data. Thisdata point provides some confidence to the low-temperature,high-viscosity data collected by Laboratory H and the beambending method. Second, data provided by Laboratory Fagree with the model between the temperatures of 1080°Cand 800°C, but below 800°C, there is an upward shift in thedata away from the VFTH model. The reason for the shiftwas also not determined. As such, the uncertainty of the
Table VIII. Arrhenius Fits to Individual Runs With and Without A Coefficient Fixed
Lab-Run A Fixed† B Fit R2 A Fit B Fit R2
A-1 �11.5 18287.07 0.9897 �10.33 16701.44 0.99878A-2 �11.5 18274.82 0.9918 �10.42 16804.08 0.999461A-3 �11.5 18291.07 0.9922 �10.45 16869.69 0.999343B-1 �11.5 18376.1 0.9665 �9.50 15638.26 0.997229B-2 �11.5 18325.81 0.9763 �9.77 15959.62 0.998291B-3 �11.5 18332.53 0.9772 �9.79 15994.66 0.998663C-1 �11.5 18386.61 0.9209 �8.61 14432.88 0.995999C-2 �11.5 18359.35 0.9282 �8.77 14616.12 0.993678D-1 �11.5 18723.78 0.9637 �14.19 21791.51 0.983551D-2 �11.5 18815.69 0.9595 �14.68 22399.41 0.985222D-3 �11.5 18726.43 0.9608 �14.37 21997 0.98297E-1 �11.5 18242.46 0.9875 �10.24 16519.11 0.998449E-2 �11.5 18323.33 0.9882 �10.26 16612.11 0.998825E-3 �11.5 18274.2 0.9901 �10.35 16699.82 0.99899F-1 �11.5 18345.11 0.9972 �10.92 17599 0.999007F-2 �11.5 18288.39 0.9969 �12.13 19105.84 0.998694F-3 �11.5 18342.12 0.9967 �12.23 19279.95 0.999071G-1 �11.5 18335.06 0.9932 �10.51 17022.85 0.999133G-2 �11.5 18327.55 0.9912 �10.38 16836.05 0.99904G-3 �11.5 18304.51 0.9929 �10.48 16949.87 0.999309Min 18242.46 �14.68 14432.88Max 18815.69 �8.61 22399.41Avg 18384.1 �10.92 17491.46SD 164.77 1.73 2283.92
†Fixed A for Hanford waste glasses, from Hrma (2008).
Viscosity Measurement Round Robin Results 9

overall fit at temperatures below 950°C could be higher thanthe 95% confidence intervals and 95% prediction limitsdetermined by the model fit. The overall fit is given for cali-brating equipment. However, the overall fit should be usedwith a sense of caution because of its higher uncertainty.
Acknowledgments
The authors would like to thank the following laboratories for participating inthe round robin study: Pacific Northwest National Laboratory, SavannahRiver National Laboratory, Idaho National Laboratory, Corning EngineeringLaboratory Services, Monarch Services, Commissariat a lEnergie Atomique(France), and the Institute of Chemical Technology (Czech Republic). PacificNorthwest National Laboratory is operated for the U.S. Department ofEnergy by Battelle under Contract DE-AC05-76RL01830.
References
1C. M. Jantzen, Characterization of the Defense Waste Processing Facility(DWPF) Startup Frit. WSRC-RP-89-18. Westinghouse Savannah River Com-pany, Aiken, SC, 1989.
2ASTM C 965-94, Standard Practice for Measuring Viscosity of Glass Abovethe Softening Point. American Society for Testing and Materials, West Cons-hohocken, PA, 1994.
3ASTM D 1343-95, Standard Test Method for Viscosity of Cellulose Deriva-tives by Ball-Drop Method. American Society for Testing and Materials, WestConshohocken, PA, 1995.
4ASTM C 1350M-96, Standard Test Method for Measurement of Viscosity ofGlass Between Softening Point and Annealing Range (Approximately 108 Pa•sto Approximately 1013 Pa•s) by Beam Bending (Metric). American Society forTesting and Materials, West Conshohocken, PA, 1996.
5H. E. Hagy, “Experimental Evaluation of Beam-Bending Method of Deter-mining Glass Viscosities in the Range 108 to 1015 Poises,” J. Am. Ceram. Soc.,46 [2] 93–7 (1963).
6ASTM E1356-08, Standard Test Method for Assignment of the Glass Transi-tion Temperatures by Differential Scanning Calorimetry. American Society forTesting and Materials, West Conshohocken, PA, 2008.
7C. T. Moynihan, “Correlation Between the Width of the Glass TransitionRegion and the Temperature Dependence of the Viscosity of High-TgGlasses,” J. Am. Ceram. Soc., 76 [5] 1081–7 (1993).
8S. I. Inc., JMP® Statistics and Graphics Guide, JMP Version 4. pp. 634.SAS Institute Inc., Cary, NC, 2001.
9P. Hrma, G. F. Piepel, P. E. Redgate, D. E. Smith, M. J. Schweiger, J. D.Vienna, and D. S. Kim, “Prediction of Processing Properties for NuclearWaste Glasses”; pp. 505–13 in Proc of the Environmental Issues and WasteManagement Technologies in the Ceramic and Nuclear Industries: CeramicTransactions, Vol. 61, Edited by V. Jain and R. Palmer. The American Cera-mic Society, Westerville, OH, 1995.
10P. Hrma, “Glass Viscosity as a Function of Temperature and Composi-tion: A Model Based on Adam-Gibbs Equation,” J. Non-Cryst. Solids, 354
[29] 3389–99 (2008). h
10 Journal of the American Ceramic Society—Crum et al.


