Embed Size (px)
Citation preview

International Journal of Cardiology, 36 (1992) 151-162 0 1992 Elsevier Science Publishers B.V. All rights reserved 0167-5273/92/$05.00
151
CARD10 01490
Dynamic changes of the QRS complex in unstable angina pectoris
Mikael Dellborg, Gunnar Gustafsson, Martin Riha and Karl Swedberg
Department of Medicine, Unirlersity of Giiteborg, &tra Hospital 416 85 GGteborg, Sweden
(Received 25 November 1991; revision accepted 26 February 1992)
Dellborg M, Gustafsson G, Riha M, Swedberg K. Dynamic changes of the QRS complex in unstable angina pectoris. Int J Cardiol 1992;36:151-162.
Despite intensive medical treatment to control chest pain, about one-third of patients with unstable angina have an unfavourable outcome within a period of 1 to 2 months. Holter monitoring can identify patients with silent myocardial ischaemia that are at a high risk of sustaining a major cardiovascular event. The present paper describes the use of dynamic, continuous, computerized on-line vectorcardiog- raphy for real-time monitoring of QRS-complex and ST-segment changes in patients with unstable coronary disease. In many patients a pattern of frequent repetitive episodes of QRS change was observed, with or without concomitant ST change. Whereas no patient had episodes of ST-vector change without also having episodes of significant QRS change, 15 patients had several episodes of QRS changes without any episode of significant ST change. The number of episodes of significant increase of the QRS vector difference correlated weakly but significantly with the number of episodes of significant ST-vector magnitude change (r = 0.34, p < 0.05). The present study suggests that myocardial ischaemia will influence the QRS complex as well as the ST segment. The mechanism behind the QRS changes observed is not clear but episodes of QRS change without ST change or chest pain, may reflect sudden depressions of left ventricular function, as has been reported by others to occur in patients with coronary artery disease. Dynamic vectorcardiography offers the opportunity to monitor all parts of the QRST complex in real time.
Key words: Unstable angina; ECG monitoring; Vector cardiography
Introduction Correspondence to: M. Dellborg M.D., Dept. of Medicine,
&tra Hospital, 416 85 Gteborg, Sweden. Tel. 46-31-374000. Fax 46-31-258933.
Supported by a grant from AFA, the Labour Market Insurance Company, Stockholm, Sweden, TryggHansa Insur- ante Company, Stockholm, Sweden, The Heart-Lung Founda- tion, Stockholm, Sweden and AB Hassle Cardiovascular Re- search Laboratories, Molndal, Sweden.
Unstable angina is a condition caused by my- ocardial ischaemia, characterized by symptoms of recent onset, a crescendo pattern or the occur- rence of symptoms at rest. Despite intensive med- ical treatment to control chest pain, about one-

152
third of patients with unstable angina have an unfavourable outcome within a period of 1 to 2 months [l-3]. Continuous 2-channel Holter mon- itoring can identify patients with silent myocar- dial ischaemia that are at a high risk of sustaining a major cardiovascular event and thus have an impaired short-term prognosis [4,51.
We have previously described the use of dy- namic, continuous, computerized on-line vector- cardiography to monitor patients with acute my- ocardial infarction as well as during coronary angioplasty [6-81. This system allows on-line monitoring of QRS-complex and ST-segment changes with analysis and presentation in real time, potentially identifying high-risk patients and allowing monitoring of acute interventions in un- stable coronary disease. The present report de- scribes the system and summarizes our experi- ence with real-time, dynamic vectorcardiography in patients with unstable angina.
Methods
Normal subjects
Twenty healthy volunteers, 10 men and 10 women, aged under 30, with normal standard 1Zlead eIectrocardiogram were monitored from 6 p.m. to 6 a.m. while resting in bed. They were all without on-going medication and experienced no symptoms during the 12-h monitoring period.
Patient series
Patients with unstable angina pectoris as de- fined below, included in a randomized trial of intravenous vs buccal nitroglycerin (n = 28) or included in a comparative multi-centre study of vectorcardiography vs Holter-monitoring (n = 151, were monitored with continuous dynamic vector- cardiography for 24 h after admission to the coronary care unit. Patients were treated with beta-blockers, aspirin and if necessary calcium antagonists in addition to high-dose nitrates. Changes in the resting 12-lead scalar electrocar- diogram were not necessary for inclusion. All patients were closely followed throughout the hospital stay and were, if not stabilized medically,
subject to coronary angiography and if required, revascularization was performed.
Continuous vectorcardiography
The monitoring system (MIDA, Myocardial Infarction Diagnosis and Analysis, Ortivus Medi- cal AB, Taby, Sweden) consists of a microproces- sor controlled data-acquisition module, an IBM compatible personal computer and a graphic printer. Electrocardiographic signals are continu- ously collected from conventional body surface electrodes applied to the patient’s chest accord- ing to the Frank lead system [9]. The sensitivity of the system is 1 PV and the sampling rate of each lead is 500 samples/s. Electrocardiographic com- plexes are detected, collected and placed accord- ing to their shape into 1 of 5 classes. The most dominant beat type is automatically determined during the first 10 s of recording and termed the zero class. The 3 orthogonal vectorcardiographic leads X, Y and Z are computed from sampled unipolar Frank leads and continuously displayed on the colour monitor and averaged to form mean vectorcardiographic complexes. Averaging is performed for consecutive periods, each period being 10 s to 4 min long. For this study, averaging periods of 1 min were used. Only beats classified as class zero were used for subsequent analysis. For each period the resulting mean vectorcardio- graphic complex was analyzed and compared a reference complex collected during the second averaging period. Any of the trend parameters may be presented as a trend curve updated con- tinuously during the whole recording period. The screen of a colour monitor attached to the per- sonal computer may be divided in several win- dows with different information, such as running vectorcardiographic signal, any mean vectorcar- diographic complex collected or trend curves, presented in each window. The data collection and calculations are all done on-line. An alarm may be set to identify a change in any of the trend parameters to alert the attending staff to significant changes in the QRS complex or the ST segment. The computer will automatically store all mean complexes and trend curves on the hard disk and keep them available for on-line review-

153
ing at any time during the recording. The record- ing may then also be reviewed and summarized in off-line mode. The data may be transferred to a floppy disk and stored. Coronary care unit nurses were trained to connect the patient, start moni- toring and recording and to supervise signal qual- ity. Initial training took approximately 3 h.
Monitored vectorcardiographic variables
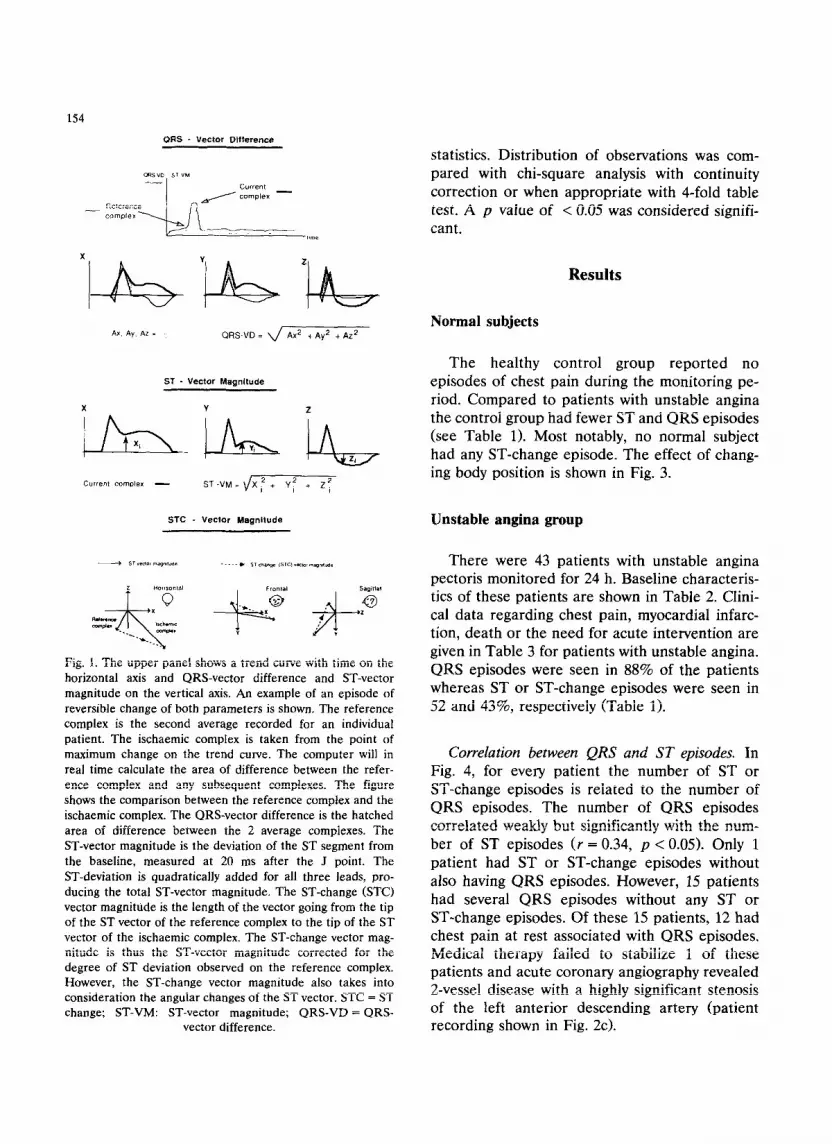
Based on previous results and observations [6-81 3 trend parameters were closely studied: the QRS-vector difference, which summarizes all changes within the QRS complex, the ST-vector magnitude, which is the deflection of the ST segment from the isoelectric level 20 ms after the J point and the ST change vector magnitude which is the length of the difference vector between the initial ST vector and the current ST vector. These parameters are described in Fig. 1.
In Fig. 2 trend curves from 3 patients are shown. Fig. 2a shows the simultaneous changes occurring with and without chest pain in ST-vec- tor magnitude, ST-change vector magnitude and QRS-vector difference in a patient with unstable angina. Fig. 2b shows a patient who develops an acute myocardial infarction illustrated by the con- tinuous and persistent increase in QRS vector difference. This patient was not part of the pre- sent study but is shown for comparative reasons only. A patient with episodes of significant QRS- vector difference change but without significant increase in either the ST-vector magnitude or the ST-change vector magnitude is illustrated in Fig. 2c.
Monitoring of chest pain
Pain was evaluated hourly during vectorcardio- graphic monitoring by the attending nurse, asking the patient to recall the time, number and sever- ity of episodes of chest pain.
Definitions
Unstable angina. Recent onset angina or a sud- den change in a previously stable pattern, with
chest pain occurring at rest or at a very low level of exercise. The pain should give strong suspicion of ischaemic heart disease but not myocardial infarction and last for at least 5 but not more than 30 min and should have been present at least twice during the last 24 h.
Significant vectorcardiographic change. Based on findings from previous studies [7,8,10] we pos- tulated that a significant change in the QRS-vec- tor difference indicating ischaemia would consist of a reversible increase of more than 15 ~VS, lasting > 1 min and with > 1 min between episodes. Such episodes will be referred to as “QRS-episodes” in the text. For ST-vector mag- nitude and ST-change vector magnitude an in- crease to above 0.1 mV (corresponding to an ST-segment change of > 1 mm in either 1 of the 3 orthogonal leads) was considered to indicate ischaemia. These changes will be referred to as “ST episodes” or “ST-change episodes”. Vector- cardiographic changes are expressed as number of episodes and/or total duration per patient per 24-h period.
Intervention. Coronary angiography, percuta- neous transluminal coronary angioplasty or coro- nary artery bypass grafting during the hospitai stay due to failure to achieve medical stabiiiza- tion of angina were considered interventions.
Myocardial infarction. Myocardial infarction was defined with the usual criteria, i.e. 2 out of 3 of: typical chest pain, elevation of cardiac en- zymes, electrocardiographic changes. Vectorcar- diographic changes were not used for diagnosis. There were 4 patients in whom a definite acute myocardial infarction was documented by release of cardiac enzymes during the initial 24 h of monitoring. These patients were considered to have had an ongoing myocardial infarct already when included; they were therefore not included in the analysis. One of these patients is illustrated in Fig. 2b for comparative reasons.
Statistics
All values are expressed as mean + SEM. Groups were compared using Mann-Whitney U-
154
ORS - Vector Difference
Ax Ay. AZ i QRS-VD = Ax2 t Ay2 + AZ’
ST - Vecior Magnitude
ih_ir\, in, Current complex - ST-VM=\/Xf+ Y: + 2:
STC - Vector Magnitude
statistics. Distribution of observations was com- pared with chi-square analysis with continuity correction or when appropriate with 4-fold table test. A p value of < 0.05 was considered signifi- cant.
Results
Normal subjects
The healthy control group reported no episodes of chest pain during the monitoring pe- riod. Compared to patients with unstable angina the control group had fewer ST and QRS episodes (see Table 1). Most notably, no normal subject had any ST-change episode. The effect of chang- ing body position is shown in Fig. 3.
Unstable angina group
Fig. 1. The upper panel shows a trend curve with time on the horizontal axis and QRS-vector difference and ST-vector magnitude on the vertical axis. An example of an episode of reversible change of both parameters is shown. The reference complex is the second average recorded for an individual patient. The ischaemic complex is taken from the point of maximum change on the trend curve. The computer will in real time calculate the area of difference between the refer- ence complex and any subsequent complexes. The figure shows the comparison between the reference complex and the ischaemic complex. The QRS-vector difference is the hatched area of difference between the 2 average complexes. The ST-vector magnitude is the deviation of the ST segment from the baseline, measured at 20 ms after the J point. The ST-deviation is quadratically added for all three leads, pro- ducing the total ST-vector magnitude. The ST-change (STC) vector magnitude is the length of the vector going from the tip of the ST vector of the reference complex to the tip of the ST vector of the ischaemic complex. The ST-change vector mag- nitude is thus the ST-vector magnitude corrected for the degree of ST deviation observed on the reference complex. However, the ST-change vector magnitude also takes into consideration the angular changes of the ST vector. STC = ST change; ST-VM: ST-vector magnitude; QRS-VD = QRS-
vector difference.
There were 43 patients with unstable angina pectoris monitored for 24 h. Baseline characteris- tics of these patients are shown in Table 2. Clini- cal data regarding chest pain, myocardial infarc- tion, death or the need for acute intervention are given in Table 3 for patients with unstable angina. QRS episodes were seen in 88% of the patients whereas ST or ST-change episodes were seen in 52 and 43%, respectively (Table 1).
Correlation between QRS and ST episodes. In Fig. 4, for every patient the number of ST or ST-change episodes is related to the number of QRS episodes. The number of QRS episodes correlated weakly but significantly with the num- ber of ST episodes (r = 0.34, p < 0.05). Only 1 patient had ST or ST-change episodes without also having QRS episodes. However, 15 patients had several QRS episodes without any ST or ST-change episodes. Of these 15 patients, 12 had chest pain at rest associated with QRS episodes. Medical therapy failed to stabilize 1 of these patients and acute coronary angiography revealed 2-vessel disease with a highly significant stenosis of the left anterior descending artery (patient recording shown in Fig. 2~).

155
Silent myocardial ischaemia. The occurrence of ocardial ischaemia. The unstable angina group ST-change episodes without concomitant chest was divided according to the presence (n = 17) or pain was analyzed as an indication of silent my- absence (n = 25) of asymptomatic ST-change
(b)
Fig. 2. a. Part of the trend curve from a patient with unstable angina. The QRS-vector difference, the ST-vector magnitude and the
ST-change vector magnitude are shown. Simultaneous changes occur in all 3 parameters, in some cases associated with chest pain
(arrow). b. The same parameters recorded from a patient with unstable angina who develops an acute myocardial infarction. Note
the sustained increase of the QRS-vector difference. This patient was not part of the present report but is included for comparative reasons. c. Patient with repeated QRS episodes. The patient has no ST or ST-change episodes. Angiography during the hospital
stay revealed a high-grade stenosis of the left anterior descending artery; an uncomplicated angioplasty was performed. Arrows
indicate chest pain. ~VS = microvoltseconds, unit for QRS-vector difference; mV = millivolt, unit for ST and ST-change vector magnitude; STC-VM = ST-change vector magnitude; ST-VM = ST-vector magnitude; QRS-VD = QRS-vector difference.

156
TABLE 1
Comparison of vectorcardiographic parameters between normal subjects and patients with unstable angina.
Normal subjects Unstable angina
No. 9% No. %
Patients 20 43
ST episodes
no. of episodes/patient 4*2 5*1
duration/patient (mitt) 144 * 78 140 f 56
patients with episodes 5 25 23 52
ST-change episodes
no. of episodes/patient 0 2+1
duration/patient (min) 0 27* 15
patients with episodes 0 19 43
QRS episodes
no. of episodes/patient 6+2 11+1
duration/patient (mitt) 118+38 180 f 24
patients with episodes 14 70 38 88
Episodes of chest pain 0 3*1
NS = not significant. ST change: ST-change vector magnitude. Values are given as mean f SEM.
P
NS
NS
< 0.05
< 0.001
< 0.001
< 0.001
< 0.05
< 0.05
NS
< 0.001
episodes (see Table 4). Overall 62 of 78 ST-change episodes (79%) were asymptomatic. Only 1 pa- tient had symptomatic ST-change episodes with- out having asymptomatic ST-change episodes.
Znteruention. Patients with unstable angina were divided according to the need for interven-
TABLE 2
Baseline characteristics of 43 patients with unstable angina.
No. % Clinical data, patients with unstable angina.
Age, yr (range) 59+F3
Previous infarction 16
Men/women 29/14
Previous CABG/PTCA 0 Medication on admission
beta-blockers 32
aspirin 17
long-acting nitrates 12 calcium antagonists 7
Electrocardiogram on admission
ST elevation 3
ST depression 13
T abnormalities 14
normal 13
(39-75)
37
67/33
74
40
28 16
7
30
33
30
CABG = coronary artery bypass grafting; PTCA = percuta-
neous transluminal coronary angioplasty.
tion. In the 12 patients that failed medical ther- apy, ST and ST-change episodes occurred more frequently and were of longer duration as com- pared to patients who responded to medical ther- apy and thus were not subject to intervention (see Table 5).
Myocardial infarction. Myocardial infarction after the initial 24-h monitoring but before hospi-
TABLE 3
No. %
During initial 24 h Patients with chest pain at rest 29 67
l-3 episodes 12 28
> 3 episodes 17 39
Patients without chest pain at rest 14 33 Death 0 Total 43 100
From 24 h to hospital discharge Coronary angiography/
CABG/PTCA 12 28
Myocardial infarction 2 7
Death 0
CABG = coronary artery bypass grafting; PTCA = percuta-
neous transluminal coronary angioplasty.

157
tal discharge developed in 2 of the 43 patients (5%).
Discussion
The present study investigated the use of com- puterized on-line vectorcardiographic monitoring of patients with unstable angina. The definition of unstable angina is often difficult and therefore it is difficult to compare different studies. In the present study 28% needed acute intervention as they could not be stabilized medically. Observa- tions from these patients were compared to ob- servations made in a group of normal subjects.
ST-vector changes in myocardial ischaemia
The ST-vector magnitude with the presently used limit for defining myocardial ischaemia (ST- VM > 0.1 mV) seems to have a low specificity since normal subjects had a similar number and duration of ST episodes as the unstable patients. The healthy volunteers were all young and many had a high baseline ST-vector magnitude at rest due to vagotonic ST-segment elevation. A possi- ble solution to this problem would be to measure the ST-vector magnitude as a percentage of change from baseline in the individual patient.
The ST-change vector magnitude is a measure- ment of change in relation to the initial ST vector in an individual patient. In the present study it was superior to the ST-vector magnitude and the QRS-vector difference in separating normal sub- jects from patients with coronary disease. The ST-change vector magnitude also identified a group of patients with electrocardiographic changes without symptoms, tentatively defined as having silent myocardial ischaemia. With conven- tional ST monitoring, patients with unstable angina and frequent asymptomatic ST changes are at high risk of sustaining a coronary event within the following 1 to 2 months after hospital- ization for unstable angina 14,111. In the present study, patients that could not be stabilized medi- cally had a significantly higher number and a longer total duration of ST-change episodes. Al- though the decision to intervene was not based on the results of the vectorcardiographic monitor-
ing, we cannot completely rule out that such information influenced the attending physician in the making of this decision. Therefore, our iden- tification of high-risk patients by monitoring the ST-change vector magnitude must be cautiously interpreted and subjected to further study.
QRS-vector changes in myocardial ischaemia
Although QRS episodes were frequently seen among normal subjects they were observed in a
(I.3 1 STC-VM
0.1s
0.5 ST-VM
I
QRS-VD
SUPiTlC left side supine qht sldc sup,nc sIllins sup,nc
Fig. 3. Mean f standard deviation of the QRS-vector differ-
ence, the ST-vector magnitude and the ST-change-vector
magnitude of 20 healthy volunteers. Body position was
changed every 5 min in a non-random way as indicated in the
figure. For every position and person, the maximum value was
used. STC-VM = ST-change vector magnitude; ST-VM = ST-
vector magnitude: QRS-VD = QRS-vector difference.

158
significantly higher frequency and were of longer duration in patients with unstable angina. As shown in Figs. 2c and 4, many QRS episodes occurred without ST or ST-change episodes. Ac- tually, in many patients a pattern of frequent repetitive QRS episodes with or without ST or ST-change episodes was detected. This pattern was not seen among controls.
In previous reports we have found that my- ocardial infarction will result in a persistent in- crease of the QRS-vector difference after 24 h of recording [6,8]. The QRS-vector difference thus seems to be reversibly influenced by myocardial ischaemia but the development of necrosis will cause sustained changes.
Mechanism behind the QRS changes during myocardial ischaemia
The precise mechanism behind QRS changes during myocardial ischaemia is not known. Sev- eral mechanisms have been proposed, including the Brodie effect 1121. In normal subjects posi- tional changes will cause relatively large QRS changes (see Fig. 3). The distance from the elec- trode to the left ventricular wall is of critical importance. This distance has been shown to decrease significantly when the subject is in the left supine position [13]. Simultaneous changes in the QRS complex occur and the QRS-vector loop will then increase its area, “dilate”. With the
ST episodes 35
30 I 0
25
ORS rpisodes
STC episodes
20
18
16
14
12
10
a
6
4
2
0
0 5 10 15 20 25 30 35
ORS episodes
Fig. 4. Number of ST (a) or ST-change episodes (b) per 24 h is plotted against the number of QRS episodes for individual patients. Overlaps are indicated by increased size of the symbols used. STC = ST change.

present technique, this will appear as a simuIta- neous increase in the QRS-vector difference, i.e. a QRS episode. We have previously reported that changes in the QRS loops and of the QRS-vector difference occur during myocardial ischaemia in all patients during percutaneous coronary angio- plasty [71. Reversible changes of the QRS com- plex occur when a coronary artery is temporarily occluded by the angioplasty balloon. This is- chaemic reaction of the QRS complex is believed to be caused by delayed activation of the is- chaemic myocardium. Since non-ischaemic my- ocardium will be depolarized earlier, the delayed activation of the ischaemic part of the my- ocardium will be unopposed electrically and pro- duce a larger vector loop [14]. Myocardial is- chaemia will also induce increased end-systolic volume [15,16], which will shorten the distance from the myocardium to the electrode. Tamaki and co-workers monitored ejection fraction by an ambulatory radionucleide recorder in patients with coronary artery disease [17]. They reported a
high incidence of simultaneously occurring chest pain, ST-segment depression and a decrease in ejection fraction. Among 39 patients they also observed 20 episodes in 14 patients of transiently depressed ejection fraction without concomitant ST-segment changes. They suggested that is- chaemia may not always produce neither pain nor ST depression but its sole manifestation may be depressed left ventricular function. We speculate that the QRS episodes that we have observed in patients with unstable angina may reflect sudden depressions of left ventricular function, with or without ST-segment changes and chest pain. Sim- ilar episodes of changes in left ventricular func- tion in the absence of ECG changes or chest pain have also been reported following coronary an- gioplasty [ 181.
The mechanism behind a change in the QRS- vector difference is different between normal sub- jects and patients with myocardial ischaemia. The appearance of the vector loop is, however, similar in both instances. Therefore, the present tech-
TABLE 4
Vectorcardiographic and clinical data for patients with and without asymptomatic ST-change episodes (=“silent ischaemia”).
With asymptomatic No asymptomatic P
episodes episodes
No. % No. %
Patients 17 2.5
Chest pain at rest,
no. of episodes/patient 3+ 1 4 + 1 NS
patients with episodes 13 76 15 60 NS ST episodes
no. of episodes/patient 6+ 2 5 f 2 NS
duration/patient (min) 182 k 124 118 f 53 NS
patients with episodes 13 71 10 40 = 0.05 ST-change episodes
no. of episodes/patient 55 1 0.04 t 0.04 < 0.00 1
duration/patient (min) 66~ 34 0.08 k 0.08 < 0.001
patients with episodes 14 100 1 4 < 0.001 QRS episodes
no. of episodes/patient 13* 2 10 f? NS
duration/patient (min) 202+ 31 173 * 35 NS
patients with episodes 17 100 21 84 NS
AMI or intervention 9 53 4 16 = 0.05
AMI = acute myocardial infarction; intervention = coronary angiography, angioplasty or coronary artery bypass surgery during
hospital stay. NS = not significant. All values are given as mean + SEM. One patient had no information about chest pain.

160
TABLE 5
Vectorcardiographic and clinical data for patients with acute intervention (=“intervention”l and for patients stabilized medically.
Intervention Stabilized medically I-J
No. % No. %
Patients 12 31 Mean age (yr) 60 F 9 59 f 7 Male/female 8/4 21/10
Chest pain at rest, no. of episodes/patient 2.5 + 1 3.5 * 1 NS patients with episodes 11 92 18 58 NS
ST episodes
no. of episodes/patient 8* 3 4+1 < 0.05 duration/patient (min) 334 f 177 63 + 28 < 0.05 patients with episodes 10 83 13 42 = 0.05
ST-change episodes no. of episodes/patient 4.8 f 2 0.7 f 0.2 < 0.001 duration/patient (min) 76 + 49 7+ 4 < 0.05 patients with episodes 8 67 11 35 NS
ST-change episodes, silent no. of episodes 4* 1 0.5 + 0.1 < 0.001 duration/patient (min) 65 + 46 5 +13 < 0.01 patients with episodes 8 67 10 32 NS
QRS episodes no. of episodes/patient 12 + 2 10 + 2 NS duration/patient (min) 191 + 42 176 + 30 NS patients with episodes 12 100 26 84 NS
Intervention = coronary angiography, angioplasty or coronary artery bypass surgery during hospital stay. NS = not significant. All
values are given as mean f SEM.
nique cannot differentiate and pathogenetically separate individual episodes of QRS-vector dif- ference change.
Because of a low number of patients and con- trols the statistical power of the present study is limited. Our findings are preliminary and the relative value of the different vectorcardiographic parameters for detection and quantification of myocardial ischaemia are at present not clear.
Other monitoring systems
Holter recording and off-line analysis is today a frequently used technique to monitor myocar- dial ischaemia. The merit of ischaemia monitor- ing as a guide to therapy and intervention in unstable angina pectoris has not been proven in controlled clinical trials. However, it is of sub- stantial practical value if the results of ischaemia monitoring in patients with unstable angina can
be made available to the responsible clinician in real time. The “Monitor One” is a solid-state Holter recorder for on-line analysis and its use in patients with stable angina and during exercise testing has been reported 119,201. It has been pointed out that multi-lead recordings provide improved detection of ischaemic episodes and may also provide important prognostic informa- tion when used for evaluation of the total is- chaemic burden [21].
At present there are only 2 systems that will allow multiple-lead, on-line monitoring of elec- trocardiographic changes. The Mortara system, which uses continuous real-time monitoring of the conventional 12-lead electrocardiogram, has been extensively investigated by Krucoff and co- workers in patients with acute myocardial is- chaemia [22] and has also been applied to pa- tients with unstable angina [lo]. Von Essen and co-workers [23] described a multiple-lead system

for real-time monitoring of patients with myocar- dial infarction and unstable angina. Their system would also allow monitoring of QRS changes in addition to ST changes.
The relative sensitivity and specificity for de- tecting myocardial ischaemia for the vectorcar- diographic system we have used in relation to other monitoring systems cannot be assessed at present.
In conclusion, continuous on-line vectorcardio- graphy is feasible for monitoring of patients with coronary artery disease. Myocardial ischaemia will influence the QRS complex as well as the ST segment and this technique offers the opportu- nity to monitor all parts of the QRST complex in real time. Vectorcardiography has the advantage over other multiple lead systems to summarize all changes in the QRS complex in one easily moni- tored parameter, the QRS-vector difference. In addition it offers several ST-vector parameters. The present study suggests that continuous vec- torcardiography may be helpful in identifying pa- tients with unstable angina at high risk and sepa- rate the patients with acute myocardia1 infarc- tion.
Acknowledgements
We are grateful to Kerstin Korssell R.N. and Ann-Marie Svensson R.N. for technical assis- tance and to the nursing staff at the coronary care unit of &tra Hospital. We are also indebted to Johan Ubby M.S., Ortivus Medical for soft- ware support and development.
References
1 Russel RO Jr, Moraski RE, Kouchoukos N et al. Unstable
angina pectoris: national cooperative study group to com-
pare medical and surgical therapy. II. In-hospital experi-
ence and initial follow-up results in patients with one, two
and three vessel disease. Am J Cardiol 1978;42:839-848.
2 Gerstenblith G. Ouyang P, Achuff SC et al. Nifedipine in
unstable angina: a double-blind, randomized trial. N Engl
J Med 1982;306:885-889.
3 Gottlieb SO, Weisfeldt ML, Ouyang P et al. Effect of the
addition of propranolol to therapy with nifedipine for
unstable angina pectoris: a randomized, double-blind
placebo-controlled trial. Circulation 1986:73:331-337.
4
5
6
7
8
9
10
11
12
13
14
15
I6
I61
Gottlieb SO, Weisfeldt ML, Ouyang P, Mellits ED, Ger-
stenblith G. Silent ischemia as a marker for early un-
favourable outcomes in patients with unstable angina. N
Engl J Med 1986:314:1214-1219.
Johnson SM, Mauritson DR. Winniford MD et al. Contin-
uous electrocardiographic monitoring in patients with un-
stable angina pectoris: identification of high-risk subgroup
with severe coronary disease, variant angina and/or im-
paired early prognosis. Am Heart J 1982;103:4-12.
Dellborg M, Riha M, Swedberg K. Dynamic QRS- and
ST-segment changes in myocardial infarction monitored by
continuous on-line vectorcardiography. J Electrocardiol
1990;23(suppl): l-9.
Dellborg M, Emanuelsson H, Riha M, Swedberg K. Dy-
namic QRS-complex and ST-segment monitoring by con-
tinuous vectorcardiography during coronary angioplasty.
Coronary Artery Dis 1991;2:43-53.
Dellborg M, Riha M, Swedberg K, for the TEAHAT
study-group. Dynamic QRS-complex and ST-segment
monitoring in acute myocardial infarction during recombi-
nant tissue plasminogen activator therapy. Am J Cardiol
1991;67:343-349x.
Frank E. Accurate, clinically practical system for spatial
vectorcardiography. Circulation 1956:13:737-744.
von Arnim TH, Reuschel-Janetschek E. Continuous bed-
side monitoring of the ECG for detection of silent myocar-
dial ischemia. Eur Heart J 1988:9(suppl N):89-92.
Nademanee K, lntarachot V, Josephson M et al. Prognos-
tic significance of silent myocardial ischemia in patients
with unstable angina. J Am Coll Cardiol 1987:10:1-9.
Brody D. A theoretical analysis of intracavitary blood mass
influence on the heart-lead relationship. Circ Res 1956;4:731-738.
Feldman T, Borow K. Neumann A, Lang R, Childers R. Relation of electrocardiographic R-wave amplitude to
changes in left ventricular chamber size and position in normal subjects. Am J Cardiol 1985:55:1168-l 174.
Selvester R, Wagner N, Wagner G. Ventricular excitation
during percutaneous transluminal angioplasty of the left
anterior descending coronary artery. Am J Cardiol
19X8:62:1116-1121,
Visser C, David G, Kan G et al. Two-dimensional echocar-
diography during percutaneous transluminal coronary an-
gioplasty. Am Heart J 1986;lll: 1035-1041.
Bertrand M, Lablanche J, Fourrier J. Traisnel G. Mirsky I.
Left ventricular systolic and diastolic function during acute
coronary artery balloon occlusion in humans. J Am Cob Cardiol 1988: 12:341-347.
17 Tamaki N. Yasuda T, Moore R et al. Continuous monitor-
ing of left ventricular function by an ambulatory radionu-
cleide detector in patients with coronary artery disease. J
Am Coil Cardiol 1988;12:669-679.
18 Breisblatt W, Schulman D, Follansbee W. Continuous
on-line monitoring of left ventricular function with a new
nonimaging detector: validation and clinical use in the
evaluation of patients post angioplasty. Am Heart J
1991:121:1609-1617.

162
19 Barry J, Cambell S, Nabel EG, Mead K, Selwyn AP.
Ambulatory monitoring of the digitized electrocardiogram
for detection and early warning of transient myocardial
ischemia in angina pectoris. Am J Cardiol 1987;60:483-488.
20 Jamal SM, Mitra-Duncan L, Kelly DT, Freedman SB.
Validation of a real-time electrocardiographic monitor for
detection of myocardial ischemia secondary to coronary
artery disease. Am J Cardiol 1987;60:525-527.
21 Krucoff M. Identification of high-risk patients with silent
myocardial ischemia after percutaneous transluminal coro-
nary angioplasty by multi-lead monitoring. Am J Cardiol
1988:61:29F_34F.
22 Krucoff M, Wagner N, Pope J et al. The portable pro-
grammable microprocessor-driven real-time 1Zlead elec-
trocardiographic monitor: a preliminary report of a new
device for the noninvasive detection of successful reperfu-
sion or silent coronary reocclusion. Am J Cardiol
1990;65:143-148.
23 Von Essen R, Hinsen R, Louis R et al. On-line monitoring
of multiple precordial leads in high risk patients with
coronary artery disease - a pilot study. Eur Heart J
1984;5:203-210.


