Embed Size (px)
Citation preview

This article was downloaded by: [Univ Studi Della Calabria]On: 08 April 2013, At: 07:55Publisher: Taylor & FrancisInforma Ltd Registered in England and Wales Registered Number: 1072954 Registeredoffice: Mortimer House, 37-41 Mortimer Street, London W1T 3JH, UK
Molecular Crystals and Liquid CrystalsScience and Technology. Section A.Molecular Crystals and Liquid CrystalsPublication details, including instructions for authors andsubscription information:http://www.tandfonline.com/loi/gmcl19
Dynamical Response of CholestericLiquid Crystals Under Electric FieldsN. Scaramuzza a b , V. Carbone a b , C. Ferrero a c & C. Versace a ba Dipartimento di Fisica, Universita della Calabria, 87036, Rende,(CS), ITALYb Consorzio I.N.F.M., Unitàdi Cosenzac European Synchrotron Radiation Facility, BP 200, F-38043,Grenoble, CEDEX, FranceVersion of record first published: 23 Sep 2006.
To cite this article: N. Scaramuzza , V. Carbone , C. Ferrero & C. Versace (1995): Dynamical Responseof Cholesteric Liquid Crystals Under Electric Fields, Molecular Crystals and Liquid Crystals Science andTechnology. Section A. Molecular Crystals and Liquid Crystals, 262:1, 379-390
To link to this article: http://dx.doi.org/10.1080/10587259508033541
PLEASE SCROLL DOWN FOR ARTICLE
Full terms and conditions of use: http://www.tandfonline.com/page/terms-and-conditions
This article may be used for research, teaching, and private study purposes. Anysubstantial or systematic reproduction, redistribution, reselling, loan, sub-licensing,systematic supply, or distribution in any form to anyone is expressly forbidden.
The publisher does not give any warranty express or implied or make any representationthat the contents will be complete or accurate or up to date. The accuracy of anyinstructions, formulae, and drug doses should be independently verified with primarysources. The publisher shall not be liable for any loss, actions, claims, proceedings,demand, or costs or damages whatsoever or howsoever caused arising directly orindirectly in connection with or arising out of the use of this material.

Mol. Cryst. Liq. Cryst. 1995, Vol. 262, pp. 379-390 Reprints available directly from the publisher Photocopying permitted by license only
0 1995 OPA (Overseas Publishers Association) Amsterdam B. V. Published under license by
Gordon and Breach Science Publishers SA Printed in Malaysia
DYNAMICAL RESPONSE OF CHOLESTERIC LIQUID CRYSTALS UNDER ELECTRIC FIELDS
N. SCARAMUZZA', V. CARBONE*, C. FERRERO' and C. VERSACE*
Dipartimento di Fisica , Universita' della Calabria, 87036 Rende (CS) ITALY
*) Consorzio I.N.F.M.; Uniti di Cosenza.
+) Present address: European Synchrotron Radiation Facility, BP 200, F-38043 Grenoble CEDEX, France
Abstract: In a previous paper [ l ] we suggested that, in a cholesteric liquid crystal undergoing a step-like d.c. electric field applied parallel to the helical axis, the behavior of the relative variation of the maximum intensity wavelength of the Bragg-reflected light is related to two different relaxation phenomena. In this paper we present the time behavior of the relative variation of the maximum intensity wavelength of the Bragg- reflected light for different sample thicknesses. Moreover, the disagreement between the experimental behavior of relaxation times vs E and theoretical one (z - 1E2) can be related to an increase of the medium apparent viscosity which is due to the increase of dislocation density with the external applied field.
INTRODUCTION
Since many years it has been recognized that the orientation pattern of liquid crystals can
be changed by magnetic and electric field. This phenomenon arise because of the
diamagnetic, dielectric and conductivity anisotropy of liquid crystals.
Let us consider, for instance, a cholesteric liquid crystal (CLC) with positive dielectric
anisotropy [AE = (E ,, - E ~ ) > 01 and a planar orientation between two glass plates. If an
[ 166711379
Dow
nloa
ded
by [
Uni
v St
udi D
ella
Cal
abri
a] a
t 07:
55 0
8 A
pril
2013

380/[ 16681 N. SCARAMUZZA ET AL.
external electric field is applied perpendicularly to the walls of the cell, the experimentally
observed deformation consist in a two-dimensional spatially periodic deformation which
has the form of a square grid [1,2,31.
On the contrary, in the case of negative dielectric anisotropy, for the above mentioned
reasons, we should expect the texture would be stabilized. Nevertheless, it has been
found that also in this case instabilities can be generated by an external elecmc field in a
reversible way. Infact, as there is positive anisotropy in the elecmcal conductivity [Ao =
(oil - ol) > 01, a planar texture of cholesteric liquid crystal in an electric field
perpendicular to the walls of the cell is unstable for any sign of AE . The instability is due
by the competition between the torque induced by the electrical conductivity acting and the
elastic torque of the cholesteric, which also results in the appearance of a two-dimensional
peilodic pattern for the distribution of the director [4,5].
In a previous paper [6] we presented the study of the static deformations generated by
a d.c. electric field in a CLC with Pdd<<l (where Po is the unperturbed pitch of the CLC
and d is the sample thickness). Furthermore, we studied the optical properties [7] of a
CLC sample in the same configuration with a particular regard to the rotatory power and
the spectrum of reflected and transmitted light.
Using the technique reported in ref. [8], which allows us to study the time-resolved
reflection spectrum of a CLC submitted to an external field, we studied the time-
dependent behavior of a CLC undergoing mechanical deformations [9-121.
In the present paper, by means of the above mentioned technique, we study the
dynamical behavior of the apparent pitch in a planar sample of a CLC, with positive
dielectric anisotropy, subject to a step-like d.c. electric field applied parallel to the helical
axis, for different sample thicknesses.
EXPERIMENTAL SET-UP AND RESULTS
Our observations has been performed on a cholesteric sample that is a room temperature
mixture of cholesterol nonanoate, chloride and oleyl carbonate, with an equilibrium pitch
P0=0.4 pm, in a planar configuration. The dielectric anisotropy of this CLC was found to be positive 171, AE GI.
To prevent electrode effects and to obtain the planar texture, the indium oxide coating
Dow
nloa
ded
by [
Uni
v St
udi D
ella
Cal
abri
a] a
t 07:
55 0
8 A
pril
2013
[ I669]/38 1 CHOLESTERIC LIQUID CRYSTALS UNDER ELECTRIC FIELDS
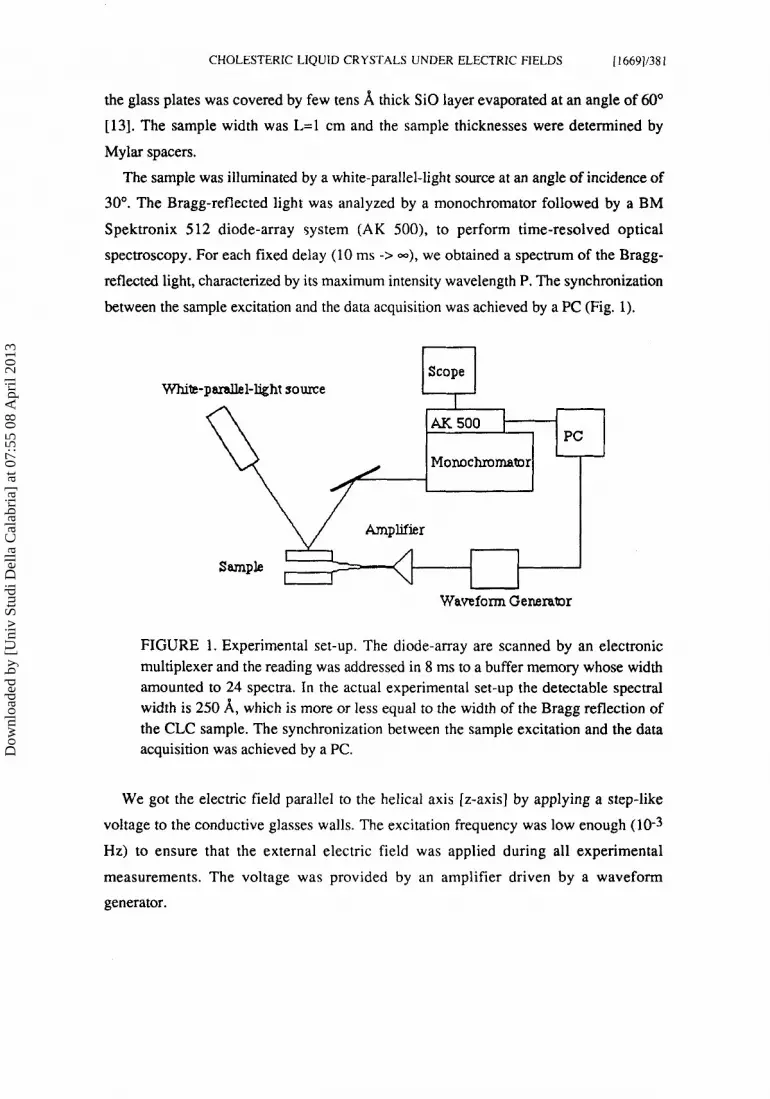
the glass plates was covered by few tens 8, thick SiO layer evaporated at an angle of 60" [13]. The sample width was L=l cm and the sample thicknesses were determined by
Mylar spacers.
The sample was illuminated by a white-parallel-light source at an angle of incidence of 30". The Bragg-reflected light was analyzed by a monochromator followed by a BM
Spektronix 5 12 diode-array system (AK 500), to perform time-resolved optical
spectroscopy. For each fixed delay (10 ms -> -), we obtained a spectrum of the Bragg-
reflected light, characterized by its maximum intensity wavelength P. The synchronization
between the sample excitation and the data acquisition was achieved by a PC (Fig. 1).
White-parallel-light some Scope 0
PC Monochromator
Waveform Generator
FIGURE 1 . Experimental set-up. The diode-array are scanned by an electronic multiplexer and the reading was addressed in 8 ms to a buffer memory whose width amounted to 24 spectra. In the actual experimental set-up the detectable spectral width is 250 A, which is more or less equal to the width of the Bragg reflection of the CLC sample. The synchronization between the sample excitation and the data acquisition was achieved by a PC.
We got the electric field parallel to the helical axis [z-axis] by applying a step-like
voltage to the conductive glasses walls. The excitation frequency was low enough (10-3
Hz) to ensure that the external electric field was applied during all experimental
measurements. The voltage was provided by an amplifier driven by a waveform
generator.
Dow
nloa
ded
by [
Uni
v St
udi D
ella
Cal
abri
a] a
t 07:
55 0
8 A
pril
2013

382/[ 16701 N. SCARAMUZZA ET AL.
In Fig. 2 are shown the instantaneous relative variation of the maximum intensity
wavelength of the Bragg-reflected light [AP(t) = P(t) - Po] for two different thicknesses
of the CLC sample. The quantity AP(t) diminishes in time in a manner that suggests us a
behavior of the type:
0
-20
-40
-60
-80 0 10 20 30 t (s)
FIGURE 2. Instantaneous relative variation of the maximum intensity wavelength of the Bragg-reflected light [AP(t) = P(t) - Po]. White squares refer to the sample thickness of 50 pm and an applied electric field of 13 kV/cm. Black squares refer to the sample thickness of 100 pm and an applied electric field of 21 kV/cm. The solid lines represent the fits made by eq. (1).
Fitting eq. (1) on the experimental data by a least square method, we obtain, for each
value of E, the characteristic times and the pre-exponentials.
In Fig.s (3 - 6) we show the behavior of z,(E) and zL(E) vs. E.
DISCUSSION
For the geometry under discussion here the experimentally observed deformation [ 14,151
is a two-dimensional spatially periodic deformation which has the form of a square grid,
Dow
nloa
ded
by [
Uni
v St
udi D
ella
Cal
abri
a] a
t 07:
55 0
8 A
pril
2013

CHOLESTERIC LIQUID CRYSTALS UNDER ELECTRIC FIELDS
4 -
3 -
2 -
I I67 111383
with the size:
The dielectric torque tends to re-orientate the molecules into an arrangement
corresponding to the fingerprint texture. Instead, the elastic torque tends to preserve the
cholesteric layers. If the applied electric field is equal or slightly above a threshold value
for the deformation E,,, i.e. E = E,,, a pattern which undulates in x and y direction
appears as a compromise alternative for the distribution of the director. The wave vector
of this deformation pattern along the z-axis is approximately x/d 121.
o ! I I 1
5 10 15 20 25 E (kVlcm)
FIGURE 3. The faster characteristic times fS vs external applied field for the sample of thickness 50 pm.
When the intensity of the applied electric field is increased, the deviation angle of the
director n also increases and it tends towards the limit 6=d2 in the whole volume 1171.
In our experiment we apply to the CLC samples, step-like d.c. external electric fields
which amplitude are greater than threshold ones. Infact, the obtained experimental
threshold fields for the CLC material under investigation were found to be 3.60 kV/cm
and 2.55 kV/cm for the 50 pm and 100 pm sample thickness respectively [7]. For this
reason we think that, at first the CLC responds to external electric fields by the
Dow
nloa
ded
by [
Uni
v St
udi D
ella
Cal
abri
a] a
t 07:
55 0
8 A
pril
2013

38411 16721 N. SCARAMUZZA ET AL.
establishment of the two dimensional spatially periodic deformation, followed, in time, by an increase of the angle of deviation of the director corresponding to a decrease of the
p e @ d deformation size.
5 15 25 35 45 E (kVlcm)
FIGURE 4. The faster characteristic times T~ vs external applied field for the sample of thickness 100 pm.
25
20
15
10
5
0
E (kVlcm)
FIGURE 5. The slower characteristic times zL vs external applied field for the sample of thickness 50 pm.
Dow
nloa
ded
by [
Uni
v St
udi D
ella
Cal
abri
a] a
t 07:
55 0
8 A
pril
2013

CHOLESTERIC LIQUID CRYSTALS UNDER ELECTRIC FIELDS [ 167311385
7
40 -
30 -
20 -
10 -
0
P P P
P f i n 0
I I I
FIGURE 6. The slower characteristic times T~ vs external applied field for the sample of thickness 100 pm.
Moreover, when the external electric field is further increased a large number of dislocations, which constitute an obstacle to the relaxation of the cholesteric structure,
merges in the sample [18]. Since the number of dislocations increases with E until a
certain value for which the increasing dielectric torque causes a breaking of the
dislocations, we aspect that the medium apparent viscosity Yapp(E> will increases with E
up to a saturation value.
Under the small 8 approximation, the equation of motion of the deviation angle 8 of
the director n may be obtained from the free energy function 13,171
and from the dissipation function
Then, the characteristic time for the establishment of the two-dimensional spatially
periodic deformation is given by
Dow
nloa
ded
by [
Uni
v St
udi D
ella
Cal
abri
a] a
t 07:
55 0
8 A
pril
2013

386/[ 16741 N. SCARAMUZZA ET AL
As second step the angle 0 continues to increase. This should excite wavevectors
greater than (w)-l, thus generating smaller spatial structures. The observed relaxation time
is then related to the growth rate of a given wavevector q(E), and can be written in a way
analogous to eq. (5) [l]
-L L k E2 - K[q(E)I2 4x:
where K is an elastic constant.
Let us remember that the angle 0 is related to the pitch variation AP [ 191, so that we
can compare the experimentally obtained relaxation times with those derived from the
theory.
From eq. (5 ) we found the discrete value of y (E) , which are shown in Fig. (7) by
black squares and white squares for the sample thickness of 50 pm and 100 pm
respectively.
aPP
These experimental behaviors of yapp(E) suggests us the following heuristic function
which is represented in Fig. (7), taking y, = 1, both for 50 pm and 100 pm thicknesses.
The values of the constants F,
following:
and h which have been determined by the fit are the
d = 100 pm F = 719.1 6 = 35.0 h = 3.1
d = 5 0 p m F = 655.7 E = 8.1 h = 7.6 cgs units.
From Fig. (7) we can note that for a fixed value of external applied field, the medium
apparent viscosity is greater for the thinner samples. This result could indicate that, at a
Dow
nloa
ded
by [
Uni
v St
udi D
ella
Cal
abri
a] a
t 07:
55 0
8 A
pril
2013

CHOLESTERIC LIQUID CRYSTALS UNDER ELECTRIC FIELDS 1167531387
fixed value of applied electric field, the dislocation density is greater for thinner samples
(obviously, supposing that the number of dislocation merging in the sample depend only
on applied electric field, the dislocation density is greater in thinner samples).
Y (Poise) 1250
1000
750
500
250
0 5 10 15 20 25 30 35 40 45
E (kVlcm)
FIGURE 7. Behavior of yap,(E), cgs units, vs external applied electric field. Black squares and white squares refer to the 50 pm and 100 pm samples respectively. The values are calculated from the eq. ( 5 ) using the parameter values previously estimated by us for the examining material. The solid line represent the best fit made by eq. (7) for the sample thickness of 100 pm. The dashed line represent the best fit made by eq. (7) for the sample thickness of 50 pm.
By introducing the discrete values of yap,(E) into eq. (6), we found the corresponding
The sizes of the corresponding spatial structures A(E) = x/q(E) are reported in Fig. (8) values of q(E).
both for the 50 pm and the 100 pm samples respectively.
In order to confirm this result, we underline that, when the applied electric field tends
to the threshold value E,,, A(E) tends to the threshold value of the size of the two-
dimensional spatially periodic deformation (6.10-4 and 4.10-4 cgs units for the sample
thickness of 50 pm and 100 pm respectively). Moreover, as long as the external electric
field increases, A(E) seems to tend to the value of the unperturbed pitch Po. ObviousIy as
E + - we expect a cholesteric-nematic transition.
Dow
nloa
ded
by [
Uni
v St
udi D
ella
Cal
abri
a] a
t 07:
55 0
8 A
pril
2013

38811 16761
2 -
1 -
N. SCARAMUZZA ET AL.
k € P 5
si
E (kVlcm)
FIGURE 8. Behavior of A(E), cgs units, vs external applied electric field. Black squares and white squares refer to the sample thickness of 50 pm and 100 pm respectively.
CONCLUSION
In this paper we presented the time behavior of the relative variation of the maximum
intensity wavelength of the Bragg-reflected light for different sample thicknesses. We
have shown that the behavior of the relative variation of the maximum intensity
wavelength of theBragg-reflected light of a cholesteric liquid crystal, undergoing a step-
like d.c. electric field applied parallel to the helical axis, is related to two different
relaxation phenomena.
Moreover, the disagreement between the experimental behavior of relaxation times vs E
and theoretical one (T 1/E2) can be related to an increase of the medium apparent
viscosity which is due to the increase of dislocation density with external applied field.
Acknowledgement
The authors are greatly indebted with A. Alexe-lonescu, G. Barber0 , R. Bartolino and S.
Dow
nloa
ded
by [
Uni
v St
udi D
ella
Cal
abri
a] a
t 07:
55 0
8 A
pril
2013
CHOLESTERIC LIQUID CRYSTALS UNDER ELECTRIC FIELDS
A. Rkin for useful discussions and suggestions.
[ 167711389
References
1.
2.
3.
4. 5 .
6 .
7 .
8.
9.
10.
11.
12.
13.
14.
15. 16.
N. Scararnuzza, C. Ferrero, V. Carbone, C. Versace: submitted to J . of Applied
Phys. C.S. Gerritsma, P.van Zanten: Phys. Lett.; 37A, 47 (1971).
F. Rondelez, H. Arnould, C. Gerritsrna: Phys. Rev. Lett.; 28, 735 (1972).
W.J.A. Goossens: Phys. Lett.; 40A, 95 (1972)
I.W. Smith, Y. Galerne, S.T. Lagerwall, E. Dubois-Violette, G. Durand: J . Phys.
(Paris); 36, C1-237 (1975)
F. Sirnoni, R. Bartolino, N. Scaramuzza: Springer Verlag Series on Chem. - Phys.; 11, 205 (1980).
R. Bartolino, F. Simoni: Optica Acta; 27, 1179 (1980).
R. Bartolino, A. Ruffolo, F. Simoni, N. Scararnuzza: Nuovo Cimento; l D , 607
(1982).
N. Scaramuzza, N. Guarracino, F.P. Nicoletta, F. Sirnoni, R. Bartolino: Applied
Optics; 25, 1571 (1986).
N. Scaramuzza, V. Carbone, R. Barberi: MoZ. Cryst. Liq. Cryst.; 195, 31 (1991).
N. Scaramuzza, V. Carbone, J. P. Marcerou, R. Bartolino: J . Appl. Phys.; 67 ,
169 (1990).
N. Scaramuzza, F. Simoni, R. Bartolino, G. Durand: Phys. Rev. Lett.; 53, 2246
(1984).
V. Carbone, N. Scaramuzza, N. Guarracino: Mol. Cryst. Liq. Cryst.; 188, 57
(1990).
M. Monkade, M. Boix, G. Durand, Europhys. Lert.; 5, 697 (1988).
W. Helfrich, Appl . Phys. Lett.; 17, 531, (1970).
J. P. Hurault, J . Chem. Phys.; 59, 2068 (1973).
W. Helfrich: J. Chem. Phys.; 55, 839 (1971).
17. L. M. Blinov: Electro-Optical and Magneto-Optical Properties of Liquid Crystals;
Dow
nloa
ded
by [
Uni
v St
udi D
ella
Cal
abri
a] a
t 07:
55 0
8 A
pril
2013

390/[ 16781 N. SCARAMUZZA ET AL.
(Wiley-Interscience Publication, Belfast) 1983.
18. W. Helfrich: Mol. Cryst. Liq. Cryst.; 22, 187 (1973).
19. N. Scaramuzza, R. Barberi, F. Simoni, F. Xu, G. Barbero, R. Bartolino: Phys.
Rev. A; 32, 1134 (1985).
Dow
nloa
ded
by [
Uni
v St
udi D
ella
Cal
abri
a] a
t 07:
55 0
8 A
pril
2013


