Embed Size (px)
Citation preview

OPEN
ORIGINAL ARTICLE
Dysregulated choline metabolism in T-cell lymphoma:role of choline kinase-α and therapeutic targetingJ Xiong1,6, J Bian2,6, L Wang1,3, J-Y Zhou2, Y Wang2, Y Zhao1,3, L-L Wu4, J-J Hu5, B Li5, S-J Chen1,3, C Yan2 and W-L Zhao1,3
Cancer cells have distinct metabolomic profile. Metabolic enzymes regulate key oncogenic signaling pathways and have anessential role on tumor progression. Here, serum metabolomic analysis was performed in 45 patients with T-cell lymphoma (TCL)and 50 healthy volunteers. The results showed that dysregulation of choline metabolism occurred in TCL and was related to tumorcell overexpression of choline kinase-α (Chokα). In T-lymphoma cells, pharmacological and molecular silencing of Chokαsignificantly decreased Ras-GTP activity, AKT and ERK phosphorylation and MYC oncoprotein expression, leading to restoration ofcholine metabolites and induction of tumor cell apoptosis/necropotosis. In a T-lymphoma xenograft murine model, Chokα inhibitorCK37 remarkably retarded tumor growth, suppressed Ras-AKT/ERK signaling, increased lysophosphatidylcholine levels and inducedin situ cell apoptosis/necropotosis. Collectively, as a regulatory gene of aberrant choline metabolism, Chokα possessed oncogenicactivity and could be a potential therapeutic target in TCL, as well as other hematological malignancies with interrupted Rassignaling pathways.
Blood Cancer Journal (2015) 5, 287; doi:10.1038/bcj.2015.10; published online 13 March 2015
INTRODUCTIONT-cell lymphoma (TCL) is the malignant proliferation of CD3+lymphocytes and represents one of the main subtypes of non-Hodgkin’s lymphoma.1,2 TCL patients are generally resistant toconventional chemotherapy and have poor clinical outcome.Varied with pathological, immunophenotypic and molecularfeatures, TCL constitutes a heterogeneous group of diseases.3,4
Therefore, biomarkers commonly expressed and closely related totumor progression need to be further investigated in TCL, helpingto develop targeted therapeutic approaches and to eventuallyimprove prognosis of the patients.In addition to genomic, epigenomic and proteomic alterations,
perturbation of cellular metabolism occurs in cancers andcontributes fundamentally to tumorigenicity.5 Dysregulated cho-line metabolism has recently emerged as an important metabolichallmark of cancer cells. The biosynthesis of phosphocholinemediates mitogenic activity and is required for uncontrolledtumor cell growth.6 Moreover, choline metabolism could interactwith multiple oncogenic cascades, facilitating tumor progression.7
However, the metabolomic profile, particularly choline meta-bolism and its relation with cellular signaling pathways have notyet been illustrated in TCL.Choline kinase-α (Chokα), a family member of initial enzyme
involved in the regulation of choline metabolism, leads to thephosphorylation of choline to phosphocholine.7 Chokα is fre-quently overexpressed in cancers and associated with adversedisease outcome and high histological grade.8,9 Here, we assessedthe metabolic phenotype of the TCL patients, as well as themolecular mechanism and the interconnected network underlying
this phenotype. Our results provided direct evidence that aberrantcholine metabolism occurred in TCL, relating to the upregulationof Chokα and downstream activation of Ras-AKT/ERK-MYCsignaling pathway. Both in vitro and in vivo, therapeutic inhibitionof Chokα displayed significant antiproliferative effect by inducingtumor cell apoptosis and necroptosis, making Chokα an attractivemolecular target for treating TCL, as well as other Ras-activatedhematological malignancies.
MATERIALS AND METHODSPatientsA metabolomic assay was performed on serum samples of 45 patients withTCL (including 16 peripheral TCL, not other specified, 11 natural killer/TCL,6 cutaneous TCL), 6 T-lymphoblastic lymphoma, 3 anaplastic large-celllymphoma and 3 angioimmunoblastic TCL (AITL)). Quantitative reversetranscription-PCR was performed on frozen tumor samples of 81 TCL cases(including 28 peripheral TCL, not other specified, 16 natural killer/TCL, 4cutaneous TCL, 11 T-lymphoblastic lymphoma, 8 anaplastic large-celllymphoma and 14 AITL). Histological diagnoses were established accord-ing to the World Health Organization classification.10 Fifty age- and sex-matched healthy volunteers and 33 cases of reactive hyperplasia werereferred as controls. Informed consent was obtained from all the patientsand volunteers in accordance with the Declaration of Helsinki. The studywas approved by the Hospital Review Board.
Metabolomic assay by UPLC-QTOFMSSerum sample (100 μl) was added by 50 μl L-2-chlorophenylalanine(0.2 mg/ml), vortexed for 30 s and then mixed with 350 μl organicsolvents (methanol/acetonitrile, 2/1). After incubation for 15 min at 4 °C,
1State Key Laboratory of Medical Genomics, Shanghai Institute of Hematology, Shanghai Rui Jin Hospital, Shanghai Jiao Tong University School of Medicine, Shanghai, China;2School of Pharmacy, Shanghai Jiao Tong University, Shanghai, China; 3Pôle de Recherches Sino-Français en Science du Vivant et Génomique, Laboratory of Molecular Pathology,Shanghai, China; 4Department of Pathology, Shanghai Rui Jin Hospital, Shanghai Jiao Tong University School of Medicine, Shanghai, China and 5Department of Nuclear Medicine,Shanghai Rui Jin Hospital, Shanghai Jiao Tong University School of Medicine, Shanghai, China. Correspondence: Professor C Yan, School of Pharmacy, Shanghai Jiao TongUniversity, 800 Dongchuan Road, Shanghai 200240, China or Professor W-L Zhao, State Key Laboratory of Medical Genomics, Shanghai Institute of Hematology, Shanghai Rui JinHospital, Shanghai Jiao Tong University School of Medicine, 197 Rui Jin Er Road, Shanghai 200025, China.E-mail: [email protected] or [email protected] authors contributed equally to this work.Received 10 July 2014; revised 12 December 2014; accepted 13 January 2015
Citation: Blood Cancer Journal (2015) 5, 287; doi:10.1038/bcj.2015.10
www.nature.com/bcj
the mixture was centrifuged at 15 000 r.p.m. for 15 min and 200 μlsupernatant was used for ultra-performance liquid chromatographyquadrupole time-of-flight mass spectrometry (UPLC-QTOFMS) analysis.The in-house quality control sample was prepared by pooling the samevolume of serum samples from healthy volunteers, as reportedpreviously.11
Reversed-phase separation was performed on a 2.1 × 100mm2 ACQUITY1.7 μm BEH C18 column (Waters Corp., Milford, MA, USA) according to themanufacturer’s instruction. The mobile phase consisted of (A) water with0.1% formic acid and (B) acetonitrile with 0.1% formic acid. MS wasperformed on Waters Q-TOF Micromass (Waters Corp.) in both positive andnegative ion modes at a resolution of 8000. The detailed conditions ofmobile phase and parameters of MS analysis were provided inSupplementary Experimental procedures.
Analysis of metabolites by UPLC-3QMSMetabolites of cells (1 × 10⁷/ml) were extracted using freeze-thawmethod.12 Cell lysate (100 μl) was mixed with 100 μl organic solvents(methanol/acetonitrile, 1/1). After incubation for 15min at 4 °C, the mixturewas centrifuged at 15 000 r.p.m. for 15min and 150 μl supernatant wasused for ultra-performance liquid chromatography-triple quadrupole MS(UPLC-3QMS) analysis.The quantitative analysis using multiple reaction monitoring approach
was performed on a 2.1 × 50mm2 ACQUITYTM 1.7 μm BEH C18 column(Waters Corp.) for lipid metabolites, a 2.1 × 50mm2 ACQUITYTM 1.7 μmBEH HILIC column (Waters Corp.) for choline and SCIEX SelexION TripleQuad S5500 System mass spectrometer (AB Corp., Short Hills, NJ, USA) inpositive and negative ion modes, respectively. The detailed parameterswere provided in Supplementary Experimental procedures.
Quantitative real-time PCRTotal mRNA was extracted from frozen tumor samples using TRIzolreagent (Invitrogen, Shanghai, China) and complementary DNA wassynthesized from 100 ng RNA using PrimeScript RT Reagent Kit withgDNA Eraser (TaKaRa, Dalian, China). Quantitative real-time PCR wasperformed using SYBR Premix Ex TaqTM II (TaKaRa) and ABI Prism 7500(Applied Biosystems, Bedford, MA, USA) with primers against SLC44A1,CHKA, PCYT1A, PLD2, PLCG2, PLA1A and PLA2G4A. GAPDH was used as anendogenous control. Primer sequences are listed in SupplementaryExperimental procedures.
Cell lines and reagentsT-lymphoma cell lines Jurkat and H9 (American Type Culture Collection,Manassas, VA, USA) were cultured in RPMI-1640 medium supplementedwith 10% heat-inactivated fetal bovine serum in a humidified atmosphereof 95% air and 5% CO2 at 37 °C. Chokα inhibitor (CK37), phosphatidylino-sitol 3-kinase (PI3K) inhibitor (LY294002) and ERK inhibitor (FR180204) wereobtained from Merck KGaA (Darmstadt, Germany). Pancaspase inhibitor(Z-VAD-FMK) was from APEXBIO (Houston, TX, USA).
Cell viability and cell apoptosisCell growth was assessed by MTT (3-(4,5-dimethylthiazol-2-yl)-2,5-diphe-nyltetrazolium bromide) and absorbance was measured at 490 nm byspectrophotometry. Cell apoptosis were detected by flow cytometry(BD, Biosciences, San Jose, CA, USA) using Annexin V-FITC Apoptosis Kit(BD, Pharmingen, San Diego, CA, USA).
Small-interfering RNA transfectionCells were transfected with 50 nM Chokα siGENOME SMARTpool and Non-Targetingpool (Dharmacon, Denver, CO, USA) as a negative control usingDharmaFECT2 transfection reagents (Dharmacon).
Ras activation assayRas activity was assessed by Ras Pull-down Activation Assay Biochem Kit(bead pull-down format) (Cytoskeleton, Denver, CO, USA) according to themanufacturer’s protocol.
Western blotWestern blot was performed as described previously.10 Antibodies againstChokα, c-MYC and ERK were obtained from Abcam (Cambridge, UK).
Antibodies against Ras, phosphorylation of AKT (p-AKT) (Ser473), AKT,phosphorylation of ERK (p-ERK) (Thr202/Tyr204) and RIP3 were from CellSignaling (Beverly, MA, USA). Actin (Cell Signaling) was used to ensureequivalent loading of total protein.
Co-immunoprecipitation assayCo-immunoprecipitation assay was performed by Pierce Co-Immuno-precipitation Kit (Thermo, Pierce, Rockford, IL, USA) according to themanufacturer’s protocol. Cell lysate was immunoprecipitated with resinscoupled with anti-human RIP1 (BD Pharmingen, San Diego, CA, USA)overnight at 4 °C.
Human TNF-α immunoassayTumor necrosis factor-α (TNF-α) was measured using Human TNF-αQuantikine ELISA Kit (R&D Systems, Minneapolis, MN, USA) according tothe manufacturer’s protocol.
Immunohistochemistry and immunofluorescence assayImmunohistochemistry was performed on 5-μm paraffin sections with anindirect immunoperoxidase method using antibodies against Chokα (SantaCruz Biotechnology, Dallas, TX, USA), p-AKT, p-ERK (Cell Signaling) and MYC(Abcam). Immunofluorescence assay was performed on acetone-fixed cellsusing rabbit anti-human MYC as a primary antibody and diamino-triazinylaminofluorescein-labeled donkey anti-rabbit-IgG antibody (Abcam)as a secondary antibody. Nuclei were counterstained with DAPI(4',6-diamidino-2-phenylindole).
Transmission electron microscopyCells and tissue samples were fixed for 2 h in 2% glutaraldehyde/0.1 M
phosphate-buffered saline (pH 7.3) at 4 °C, rinsed with 0.1 M phosphate-buffered saline two times for 10 min at 4 °C, postfixed in 1% osmiumtetroxide/0.1 M phosphate-buffered saline for 2 h at 4 °C, dehydratedin graded ethanol, saturated in graded Epikote and embedded.Ultrathin sections were prepared with LKB V ultramicrotome(LKB, Bromma, Sweden), stained with lead citrate and finally viewedwith Philip CM-120 transmission electron microscopy (Philips, Eindhoven,The Netherlands).
Gene network and pathway analysisHuman Genome U133 Plus 2.0 Array GeneChip microarray (Affymetrix,Santa Clara, CA, USA) was performed on frozen tumor samples of 8 TCLpatients. Genes were subsequently filtered by comparing their expressionlevels according to Chok-α (CHKA) expression. Statistical differences werecalculated and genes with Po0.05 were analyzed for enrichment of KEGG(Kyoto Encyclopedia of Genes and Genomes) pathways. Genes significantlyinvolved in the pathways were hierarchical clustered using MEV v.4.8.1(Dana-Farber Cancer Institute, Boston, MA, USA).
Murine modelNude mice (5–6 weeks old; Shanghai Laboratory Animal Center, Shanghai,China) were injected subcutaneously with 4 × 10⁷ Jurkat cells into theflank. Treatments (10 mice per group) were started after tumor becomeabout 0.5× 0.5 cm2 in surface (day 0). The untreated group received vehicledimethyl sulfoxide, whereas the treated group received CK37 (4 mg/kgper day) once daily for 8 days. Tumor volume was calculated as 0.5 × a(length) × b (width)2. Animals were used according to the protocolsapproved by the Shanghai Rui Jin Hospital Animal Care and UseCommittee.
Micro-PET/CT imagingMice were subjected to positron emission tomography-computedtomography (PET/CT) analysis after 1 week of treatment. PET/CT imagingwas performed on an Inveon MM Platform (Siemens Preclinical Solutions,Knoxville, TN, USA) with 8.5 cm transaxial and 5.7 cm axial fields of view.18F-fluorodeoxyglucose (0.1 ml per injection with an activity of 10 MBq)was injected to anesthetized mice through the tail vein. Mice were placedprone on the PET scanner bed 45min later near the central field of view forscanning process in Inveon Acquisition Workplace 1.5.0.28. Ten-minute CTX-ray for attenuation correction was scanned with a power of 80 kVand 500 μA and an exposure time of 1100ms before PET scan.
Chokα and choline metabolism in TCLJ Xiong et al
2
Blood Cancer Journal

Ten-minute static PET scans were then acquired, and images werereconstructed by an OSEM3D (three-dimensional ordered subsets expecta-tion maximum) algorithm followed by MAP (maximization/maximum aposteriori) or FastMAP provided by Inveon Acquisition Workplace.The three-dimensional regions of interest were drawn over the heartguided by CT images and tracer uptake was measured using the softwareof Inveon Research Workplace (IRW) 3.0. Individual quantification of the18F-fluorodeoxyglucose uptake in each of them was calculated. Meanstandardized uptake values were determined by dividing the relevantregions of interest concentration by the ratio of the injected activity to thebody weight.
Statistical analysisThe UPLC-QTOFMS ESI+ and ESI− data were analyzed by the MarkerLynxApplications Manager version 4.1 (Waters Corp.). Multivariate analysis wasperformed using SIMCA-P software version 12.0 (Umetrics AB, Umeå,Sweden). The combinative effects were determined by the computersoftware CalcuSyn (Biosoft, Cambridge, UK). Variance between differentgroups was determined by two-tailed Student’s t-test or Mann–WhitneyU-test. Association between different factors or parameters was determinedby χ2 test. Po0.05 was considered significant. Values were presented asmean± s.e.m. (N=3 unless otherwise noted in the Figure legends). Statisticalanalyses were performed on SPSS 13.0 software (IBM Corp., Armonk, NY, USA).
Figure 1. Metabolomic profile indicated aberrant choline metabolism in patients with TCL. (a) Representative base peak intensitychromatograms of the TCL patients and the healthy volunteers detected by UPLC-QTOFMS under ESI+ and ESI− mode. Different peaks weremarked by arrows. (b) The score plots of the principal component analysis (PCA) model was set up using data from 45 TCL patients (blueplots), 50 healthy volunteers (green plots) and 17 repeated quality controls (QCs, black plots). (c) The score plots of the orthogonal partialleast-squared discrimination analysis (OPLS-DA) models (upper panels) discriminated the TCL group (blue plots) from the healthy volunteers(green plots), and was confirmed by response permutation test (RPT, lower panels). (d) The score plots of the PCA models according tohistological subtypes of TCL (peripheral TCL, not other specified (PTCL-NOS), N= 16, light blue plots, natural killer/TCL (NK/T) lymphoma,N= 11, yellow plots, cutaneous TCL (CTCL), N= 6, red plots, T-lymphoblastic lymphoma (T-LBL), N= 6, purple plots, anaplastic large-celllymphoma (ALCL), N= 3, dark blue plots, AITL, N= 3, green plots). (e) Metabolites with variable importance in projection (VIP)42 were dividedinto two groups according to abundance ratio (TCLs/healthy volunteers): upregulation (abundance ratio 41) and downregulation(abundance ratio o1). (f) Receiver operating characteristic (ROC) curve for LysoPC (18:0), LysoPC (16:0), choline, arachidonic acid (AA) andtotal between TCL patients and healthy volunteers. The sensitivity and specificity were 0.828 and 0.936 for LysoPC (18:0), 0.714 and 0.975 forLysoPC (16:0), 0.812 and 0.975 for choline, 0.797 and 0.974 for AA and 0.822 and 0.960 for Total, respectively. (g) Schematic descriptionof choline metabolism. CTP, phosphocholine cytidylyltransferase; PCT, diacylglycerol choline phosphotransferase; PLD, phospholipase D;PLC, phospholipase C; and PLA, phospholipase A.
Chokα and choline metabolism in TCLJ Xiong et al
3
Blood Cancer Journal
RESULTSSerum metabolomic profile revealed dysregulation of cholinemetabolism in patients with TCLSerum metabolomic profile was assessed by UPLC-QTOFMS ESI+and ESI− in 45 patients with TCL and 50 healthy volunteers as thenormal control. The clinical characteristics of the patients werelisted in Supplementary Table S1. As shown in Figure 1a,chromatogram of base peak intensity in TCL cases apparentlydiffered from that of healthy controls. Principal componentanalysis score plots were analyzed on 1306 features obtainedafter normalization, including 778 spectral features for UPLC-QTOFMS ESI+ and 528 spectral features for UPLC-QTOFMS ESI− .The results showed the separation trend among the TCL patients,healthy volunteers and the repeated quality controls (Figure 1b).Subsequently, two cross-validated orthogonal partial least-squaresdiscrimination analysis models were established and revealedsatisfactory modeling and predictive abilities with one predictivecomponent and three orthogonal components (R2X= 0.449,R2Y= 0.915, and Q2Y= 0.708) for UPLC-QTOFMS ESI+, one pre-dictive component and two orthogonal components (R2X= 0.236,R2Y= 0.895 and Q2Y= 0.737) for UPLC-QTOFMS ESI− , respectively(Figure 1c (upper panel) and Supplementary Table S2), indicatingthe distinct serum metabolomic profile of TCL patients. A responsepermutation test with 200 random permutations was thenperformed in the partial least-squares discriminant analysismodels and R2 and Q2 values derived from the permuted analysis
were all significantly lower than corresponding original values(R2Y= 0.915 and Q2Y= 0.708 for ESI+, R2Y= 0.895 and Q2Y= 0.737for ESI− ; Figure 1c (lower panel) and Supplementary Table S2),which validated the fitness of data and the predictive ability of themetabolomic method.According to histological types of TCL, principal component
analysis score plots showed similar distribution among thesubgroups (Figure 1d). As for orthogonal partial least-squareddiscrimination analysis models, most of the Q2 values of UPLC-QTOFMS ESI+ were o0.5, whereas those of UPLC-QTOFMS ESI−in natural killer/TCL vs AITL, cutaneous TCL vs AITL and anaplasticlarge-cell lymphoma vs AITL were 0.693, 0.641 and 1, respectively(Supplementary Table S3). However, R2 and Q2 values of responsepermutation test were higher than or equal to correspondingoriginal values in these subgroups, suggesting that the metabo-lomic profile was similar in all these histological types studied(Supplementary Figure S1A).Significantly altered serum metabolites with the variable
importance in projection threshold 42 in the above-mentionedorthogonal partial least-squared discrimination analysis modelsand selected by the Mann–Whitney U-test (Po0.05) wereidentified in patients with TCL and listed in Figure 1e, including16 metabolites lower (abundance ratio o1) and 7 higher(abundance ratio 41) than healthy volunteers. Interestingly, 17of these 23 metabolites were related to lipid metabolism. Amongthem, lysophosphatidylcholine (LysoPC) (18:0), LysoPC (16:0),choline and arachidonic acid (AA) presented relatively higher
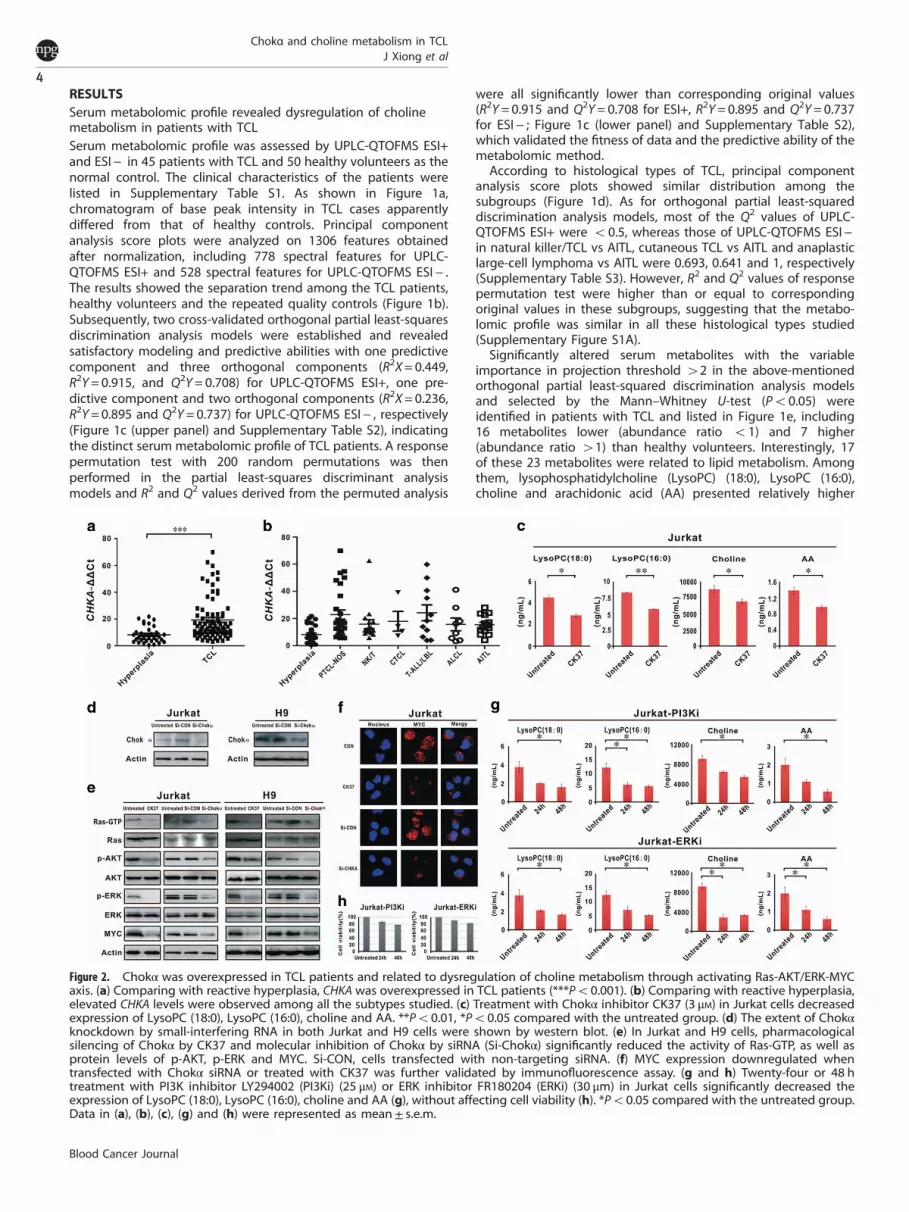
Figure 2. Chokα was overexpressed in TCL patients and related to dysregulation of choline metabolism through activating Ras-AKT/ERK-MYCaxis. (a) Comparing with reactive hyperplasia, CHKA was overexpressed in TCL patients (***Po0.001). (b) Comparing with reactive hyperplasia,elevated CHKA levels were observed among all the subtypes studied. (c) Treatment with Chokα inhibitor CK37 (3 μM) in Jurkat cells decreasedexpression of LysoPC (18:0), LysoPC (16:0), choline and AA. **Po0.01, *Po0.05 compared with the untreated group. (d) The extent of Chokαknockdown by small-interfering RNA in both Jurkat and H9 cells were shown by western blot. (e) In Jurkat and H9 cells, pharmacologicalsilencing of Chokα by CK37 and molecular inhibition of Chokα by siRNA (Si-Chokα) significantly reduced the activity of Ras-GTP, as well asprotein levels of p-AKT, p-ERK and MYC. Si-CON, cells transfected with non-targeting siRNA. (f) MYC expression downregulated whentransfected with Chokα siRNA or treated with CK37 was further validated by immunofluorescence assay. (g and h) Twenty-four or 48 htreatment with PI3K inhibitor LY294002 (PI3Ki) (25 μM) or ERK inhibitor FR180204 (ERKi) (30 μm) in Jurkat cells significantly decreased theexpression of LysoPC (18:0), LysoPC (16:0), choline and AA (g), without affecting cell viability (h). *Po0.05 compared with the untreated group.Data in (a), (b), (c), (g) and (h) were represented as mean± s.e.m.
Chokα and choline metabolism in TCLJ Xiong et al
4
Blood Cancer Journal

Figure 3. PI3K and MAPK pathway expression in patients with TCL. (a) Gene sets of PI3K and MAPK pathway were analyzed by gene networkand pathway analysis on microarray data of TCL according to CHKA expression. The key genes in PI3K and MAPK pathway were indicated onthe right side of the heat maps. (b) As revealed by immunohistochemistry, increased positivity of p-AKT, p-ERK and MYC expression wereobserved in tumor samples of TCL patients with high CHKA expression. The tissue samples of reactive hyperplasia were referred as a negativecontrol. **Po0.01, *Po0.05 comparied with those with low CHKA expression. Data in (b) were represented as mean± s.e.m.
Chokα and choline metabolism in TCLJ Xiong et al
5
Blood Cancer Journal
variable importance in projection value and were all significantlydecreased in the TCL group. Validated by the receiver operatingcharacteristic analysis (Figure 1f), the area under curve values ofthe four metabolites were 0.917, 0.897, 0.899 and 0.858,respectively, with the total area under curve value as 0.938,confirming the efficiency of these metabolic markers in differ-entiating between TCL cases and healthy controls. Therefore,choline metabolism was dysregulated in TCL, as schematicallysummarized in Figure 1g.
Chokα was overexpressed in TCL and related to aberrant cholinemetabolismThe main regulatory enzymes of choline metabolism weremeasured by real-time quantitative PCR, namely Chokα (CHKA),Chok transporter (SLC44A), phosphocholine Cytidylyltransferase(PCYT1A), phospholipase D (PLD2), phospholipase C (PLCG2),phospholipase A1 (PLA1A) and phospholipase A2 (PLA2G4A).Comparing with reactive hyperplasia, CHKA was overexpressedin patients with TCL (Po0.001; Figure 2a), without statisticalvariation in other regulatory enzymes (Supplementary Figure S1B).As shown in Figure 2b, upregulation of CHKA was found
irrespective of TCL subgroups, consistent with their similarmetabolomic profile (Figure 1d).To determine whether Chokα was functionally relevant to
choline metabolism, Jurkat cells were treated with CK37, a specificinhibitor of Chokα. Assessed by (UPLC-3QMS), the levels of LysoPC(18:0), LysoPC (16:0), choline and AA were significantly reducedupon CK37 treatment (Figure 2c), confirming the biological role ofChokα on regulating choline metabolites in T-lymphoma cells.
Chokα modulated choline metabolism through Ras-AKT/ERKsignaling pathwayTo gain insight into the molecular mechanism of Chokα in theregulation of choline metabolism in TCL, Chokα was modulatedin Jurkat and H9 cells by treatment with Chokα inhibitor CK37 ortransfection with specific small-interfering RNA (siRNA) targetingChokα (Si-Chokα). Based on previous reports,13,14 we focused onRas-AKT/ERK signaling pathway. Pharmacological and molecularsilencing of Chokα significantly reduced the activity of Ras-GTP,an active form of Ras protein (Figure 2d). Meanwhile, p-AKT andp-ERK were decreased in CK37-treated or Si-Chokα-transfectedlymphoma cells, whereas total AKT and ERK levels remainedunchanged (Figure 2d). MYC has an important role in lymphoma
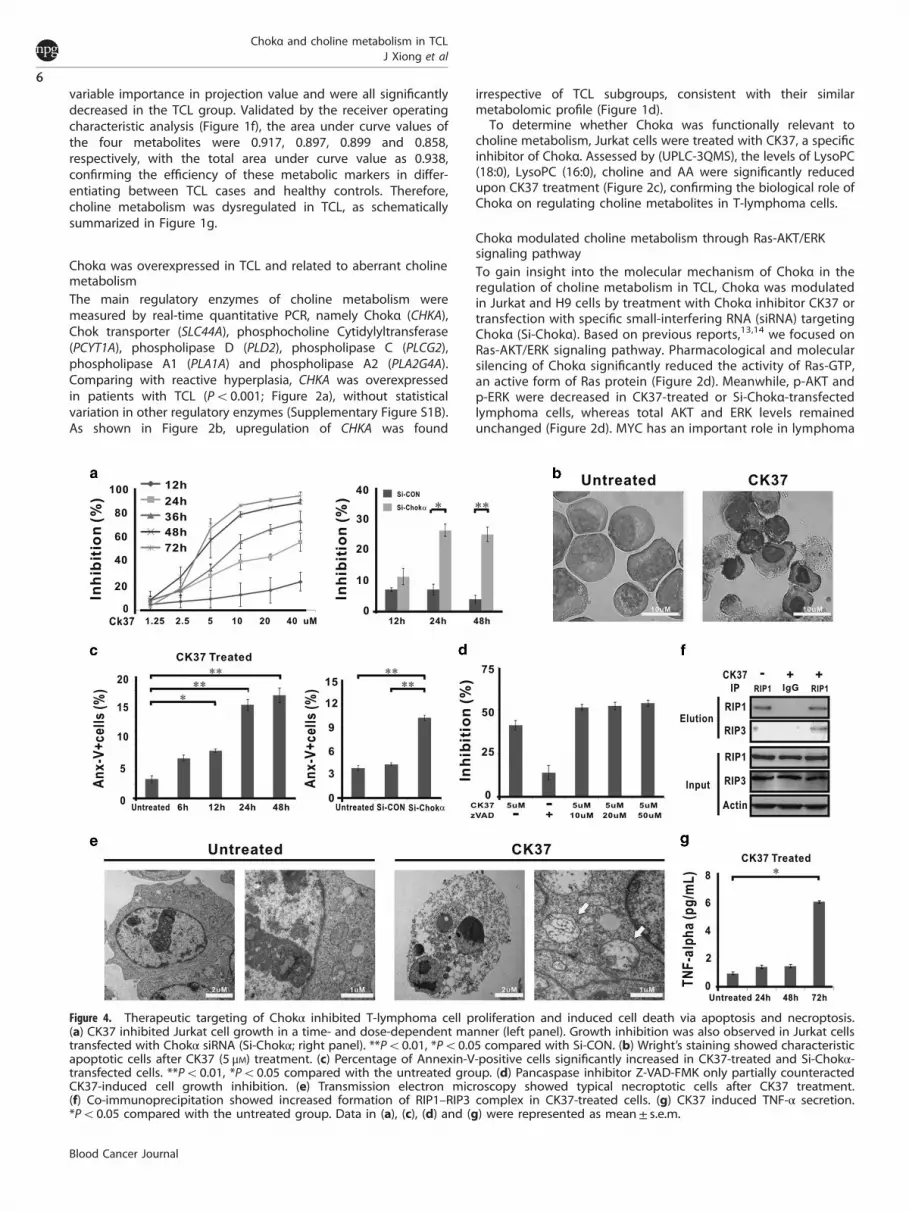
Figure 4. Therapeutic targeting of Chokα inhibited T-lymphoma cell proliferation and induced cell death via apoptosis and necroptosis.(a) CK37 inhibited Jurkat cell growth in a time- and dose-dependent manner (left panel). Growth inhibition was also observed in Jurkat cellstransfected with Chokα siRNA (Si-Chokα; right panel). **Po0.01, *Po0.05 compared with Si-CON. (b) Wright’s staining showed characteristicapoptotic cells after CK37 (5 μM) treatment. (c) Percentage of Annexin-V-positive cells significantly increased in CK37-treated and Si-Chokα-transfected cells. **Po0.01, *Po0.05 compared with the untreated group. (d) Pancaspase inhibitor Z-VAD-FMK only partially counteractedCK37-induced cell growth inhibition. (e) Transmission electron microscopy showed typical necroptotic cells after CK37 treatment.(f) Co-immunoprecipitation showed increased formation of RIP1–RIP3 complex in CK37-treated cells. (g) CK37 induced TNF-α secretion.*Po0.05 compared with the untreated group. Data in (a), (c), (d) and (g) were represented as mean± s.e.m.
Chokα and choline metabolism in TCLJ Xiong et al
6
Blood Cancer Journal

progression and is regulated by AKT and ERK in TCL.13 In Jurkatand H9 cells, the extent of Chokα knockdown were validated bywestern blot (Figure 2d). In parallel with dephosphorylation ofAKT and ERK, MYC expression was downregulated when treatedwith CK37 or Si-Chokα, as revealed by western blot (Figure 2e)and immunofluorescence assay (Figure 2f). When Jurkat cellswere treated with the PI3K inhibitor LY294002 or the ERKinhibitor FR180204, expressions of LysoPC (18:0), LysoPC (16:0),choline and AA were remarkably downregulated (Figure 2g),whereas cell viability remained480% (Figure 2h), indicating thatChokα regulated choline metabolism in a PI3K- and mitogen-activated protein kinase (MAPK)-dependent manner. Theseresults demonstrated that Chokα regulated choline metabolismby targeting Ras, as well as downstream AKT, ERK and MYCexpression.Clinically, gene expression profile was analyzed in tissue
samples of eight patients with TCL. Using KEGG database, alteredgenes were enriched in PI3K and MAPK pathways according toCHKA expression of the TCL cases (Figure 3a). Moreover, p-ERK,p-AKT and MYC expression were detected by immunohisto-chemistry in 23 TCL tumor sections, including 12 cases with highCHKA expression group (4median level of CHKA expression inTCL) and 11 cases with low CHKA expression group (omedianlevel of CHKA expression in TCL). Upregulation of CHKAcorrelated with increased positivity of p-AKT (P= 0.008),p-ERK (P= 0.029) and MYC expression (P= 0.047, Figure 3b).These data further confirmed that Chokα was related to theactivation of PI3K and MAPK signaling cascades, as well as MYCoverexpression.
Therapeutic targeting of Chokα inhibited T-lymphoma cellproliferation via inducing apoptosis and necroptosisAs shown in Figure 4a, CK37 exhibited a remarkable reduction inJurkat cell growth in a time- and dose-dependent manner (leftpanel), which was also observed in Jurkat cells transfected with Si-Chokα (right panel). CK37-treated cells displayed characteristicmorphological changes of apoptosis, such as shrinking cytoplasm,condensed chromatin and nuclear fragmentation with intactcell membrane (Figure 4b). Accordingly, the percentage ofAnnexin-V+ cells was significantly increased in CK37-treated andSi-Chokα-transfected cells (Figure 4c).However, the addition of pancaspase inhibitor Z-VAD-FMK
failed to rescue cell growth inhibition induced by CK37(Figure 4d), raising the hypothesis that other biological effectcould be involved in CK37-mediated lymphoma cell death.Besides apoptosis, necroptosis is another important modality ofcell death.15 Indeed, under transmission electron microscopy,CK37-treated Jurkat cells presented loss of plasma membraneintegrity, swelling mitochondria and intact nuclei membrane,which are typical morphological characteristics of necroptosis(Figure 4e). To verify that necroptosis occurred simultaneouslywith apoptosis upon CK37 treatment, co-immunoprecipitationwas performed and showed increased binding activity betweenRIP1 and RIP3 (RIP1/RIP3 complex, also known as necrosome;Figure 4f). It has been recently reported that TNF-α is a maininducer of necroptosis.16 Detected by ELISA (enzyme-linkedimmunosorbant assay), TNF-α concentration of cell culturesupernatant elevated gradually, reaching the peak at 72 hafter CK37 treatment (Figure 4g), confirming that CK37stimulated TNF-α synthesis and induced necroptosis inT-lymphoma cells.Furthermore, the combined effect of CK37 with chemo-
therapeutic and biotherapeutic agents applied in lymphomatreatment was evaluated. Of note, combination index plotsshowed synergistic interactions of CK37 with second-linechemotherapeutic agents such as cisplatin and gemcitabine, butnot first-line agents such as doxorubicin and cyclophosphamide.
Synergism was also observed in cells cotreated with CK37 andhistone deacetylase inhibitor valproic acid, but not with protea-some inhibitor bortezomib (Figure 5).
Therapeutic targeting of Chokα suppressed tumor growth in vivothrough the downregulation of Ras-AKT/ERK-MYC axis andinduction of cell apoptosis/necroptosisIn the murine model established with subcutaneous injection ofJurkat cells, xenograft tumors formed at the site of injection in allmice. The sizes of tumors in the CK37 group were significantlysmaller than those of the untreated group since 2 days oftreatment (Figure 6a). 18F-fluorodeoxyglucose small-animal PET/CTwas further performed to visualize tumors implanted in the flankof nude mice at 8 days of treatment (Figure 6b). Comparing withthe healthy and the untreated mice, standardized uptake valueintensity of the CK37-treated tumors was significantly decreased(Figure 6b). Accordingly, serum levels of LysoPC (18:0) andLysoPC (16:0) were also restored following treatment with CK37(Figure 6c)As in vitro study, compared with the untreated group, p-AKT,
p-ERK and MYC expression were significantly decreased in thetumor of the CK37 group (Figure 6d), along with reduced activityof Ras-GTP (Figure 6e). To search for more evidence of tumor cellapoptosis and necroptosis, TUNEL (terminal deoxynucleotidyltransferase-mediated dUTP nick-end labeling assay) assay andultrastructural study were also performed on mice tumorsections, respectively. The number of apoptotic tumor cells wassignificantly higher in the CK37 group than those in theuntreated group (P= 0.008; Figure 6f). Meanwhile, CK37-treated
Figure 5. Therapeutic targeting of Chokα synergized with chemo-therapeutic and biotherapeutic agents. Combination index plotsshowed the data points under the curve (CI= 1), indicating that thecombination was synergistic in Jurkat cells cotreated with CK37 andcisplatin, gemcitabine or valproic acid.
Chokα and choline metabolism in TCLJ Xiong et al
7
Blood Cancer Journal

tumors were frequently accompanied by the presence of typicalnecroptosis, as revealed by transmission electron microscopy(Figure 6g).
DISCUSSIONCancer cells are characterized by their metabolic readouts. As fornon-Hodgkin’s lymphoma, previous research only reported onurine metabolites, using matrix-assisted laser desorption/ioniza-tion MS of low-mass range, resluting the alteration of purinemetabolism.17 In this first time serum metabolomic study on TCL,distinct metabolomic profile was identified by high-throughputUPLC-QTOFMS, providing direct evidence of aberrant cholinemetabolism in this disease. This is in accordance with the dataobtained by less sensitive metabolomics study (proton nuclearmagnetic resonance and liquid chromatography MS) from otherhematological malignancies such as acute myeloid leukemia,chronic lymphocytic leukemia and multiple myeloma, in whichabnormal expression of choline and its phosphorylatedderivatives were detected.18,19 Importantly, dysregulation ofcholine metabolism was present in all histological types of TCLstudied, consistent with acute myeloid leukemia that metabolomicstatus is independent of morphological classification or geneticfeatures.20 Therefore, manifested with a heterogeneous group ofdisease, TCL may share the similar profile of disturbed cholinemetabolism, and this metabolic pathway can be exploited as asource of biomarkers for TCL aggression.
Chokα is a key regulator of choline metabolism. As an initialenzyme, Chokα overexpression resulted in significantly increasedtumor cell uptake of the affected metabolites such as choline,LysoPC (18:0), LysoPC (16:0) and AA, activation of the correspond-ing choline metabolic pathway and thereby decreased serum levelof choline and other metabolites observed in TCL patients. Recentstudies have suggested that Chokα is closely related to tumorprogression in solid tumors such as breast, ovarian and bladdercancer.21–23 Here, we demonstrated that Chokα was upregulatedand contributed to aberrant choline metabolism in TCL. Impor-tantly, specific inhibition of Chokα in T-lymphoma cells not onlyrestored choline metabolites but also retarded tumor cell growthand enhanced tumor cell sensitivity to chemotherapeutic andbiotherapeutic agents. Therefore, responsible for dysregulation ofcholine metabolism, Chokα may also have a pivotal role in tumorproliferation and progression in TCL.A reciprocal interaction between metabolic enzymes and
oncogenic signaling pathways linked these enzymes to tumorprogression.24 As a mechanism of action, Chokα is able tostimulate constitutive elevation of phospholipid-derived secondmessengers and interacted with cellular signaling pathways.7,25
For example, Chokα activity is responsible for the downstreamproduction of diacylglycerol, phosphatidic acid and lysophaspha-tidic acid, promoters of several Ras signaling pathways.26,27 Insolid tumors, molecular knockdown of Chokα leads to thesimultaneous attenuation of AKT and ERK cascades and wasassociated with the inhibition of tumor cell proliferation.28 Ourobservation confirmed that Chokα acted on T-lymphoma cells
Figure 6. In vivo activity of CK37 on murine xenograft T-lymphoma model. (a) In the CK37 group, tumors grew more slowly than the untreatedgroup. (b) Micro-PET/CT showed decreased standardized uptake value (SUV) intensity after CK37 treatment. (c) CK37 restored serum levels ofcholine metabolites LysoPC (18:0) and LysoPC (16:0). (d and e) CK37 inhibited protein levels of p-AKT, p-ERK and MYC (d), as well as the activityof Ras-GTP (e). (f) TUNEL assay showed significantly increased apoptotic cells in the CK37 group. **Po0.01 compared with the untreatedgroup. (g) CK37-treated tumors presented typical necroptosis morphology under transmission electron microscopy. Data in (a), (c) and (f)were represented as mean± s.e.m.
Chokα and choline metabolism in TCLJ Xiong et al
8
Blood Cancer Journal

through Ras-AKT/ERK-MYC axis, reinforcing the proposed role ofChokα as an oncogene in TCL, with its overexpression contributing,through a positive feedback loop, to activate oncogenic signalingpathways.Specific inhibitors of Chokα promote apoptotic cell death in
solid tumors and leukemic T cells, whereas the viability ofnormal primary cells is not affected, indicating the therapeuticpotential of targeting Chokα in cancer treatment.29 Indeed, aChokα inhibitor TCD-717 is currently under phase I doseescalation trial in advanced solid tumors.30 Both in vitro andin vivo, our study showed that depletion of Chokα generatedwith antitumoral activity of TCL through inducing tumor cellapoptosis in a Ras-AKT/ERK-dependent manner. Combinationtherapies targeting Ras-induced activation of AKT and ERKsignaling have proven more effective than single pathwaydisruption in cancer treatment.31 Given that selective inhibitionof Chokα targeted simultaneously the two pathways, weexpected that therapeutic targeting of Chokα may havepromising activity against TCL, as well as a broad rangeof hematological malignancies propagated by a diverseinterruption of Ras signaling pathway.Apart from apoptosis, we also found necroptosis in T-lymphoma
cells, possibly mediated by CK37-induced TNF-α secretion.Considering that tumor cells often develop resistance tochemotherapy through acquiring antiapoptotic behavior, necrop-totic susceptibility is still a weak point of cancer.32 Recent studyshowed that AKT inhibitor perifosine and ERK inhibitor sorafenibinduce tumor cell necrosis in Hodgkin's lymphoma xenograft.33
Chokα, cotargeting AKT and ERK, also inhibited tumor growththrough necroptosis, suggestive a novel molecular mechanism ofChokα on TCL. Moreover, Chokα inhibitors displayed a synergisticantiproliferative effect in combination with the chemotherapeuticagent.30 In our study, instead of first-line chemotherapeutic agentssuch as doxorubicin and cyclophosphomide, CK37 synergisticallyinteracted with second-line agents such as cisplatin andgemcitabine, as well as biotherapeutic agent histone deacetylaseinhibitor valproic acid, providing useful information on the clinicalefficacy of the Chokα inhibitor combined with other therapeuticagents in treating TCL.Collectively, altered choline metabolism occurred in TCL. Choline-
related enzyme Chokα was essential for tumor progression throughthe activation of downstream oncogenic Ras-AKT/ERK signalingpathways, providing a potential therapeutic target in treating TCLand other Ras-initiated hematological malignancies.
CONFLICT OF INTERESTThe authors declare no conflict of interest.
ACKNOWLEDGEMENTSThis work was supported, in part, by the National Natural Science Foundation ofChina (81325003, 81172254 and 81101793), the Shanghai Commission of Science andTechnology (11JC1407300) and the Program of Shanghai Subject Chief Scientists(13XD1402700).
REFERENCES1 Lin HN, Liu CY, Pai JT, Chang FP, Yang CF, Yu YB et al. How to predict the outcome
in mature T and NK cell lymphoma by currently used prognostic models? BloodCancer J 2012; 2: e93.
2 Vose J, Armitage J, Weisenburger D. International peripheral T-cell and naturalkiller/T-cell lymphoma study: pathology findings and clinical outcomes. J ClinOncol 2008; 26: 4124–4130.
3 Zhao WL. Targeted therapy in T-cell malignancies: dysregulation of the cellularsignaling pathways. Leukemia 2010; 24: 13–21.
4 Valdez BC, Zander AR, Song G, Murray D, Nieto Y, Li Y et al. Synergistic cytotoxicityof gemcitabine, clofarabine and edelfosine in lymphoma cell lines. Blood Cancer J2014; 4: e171.
5 Hanahan D, Weinberg RA. Hallmarks of cancer: the next generation. Cell 2011;144: 646–674.
6 Ridgway ND. The role of phosphatidylcholine and choline metabolitesto cell proliferation and survival. Crit Rev Biochem Mol Biol 2013; 48:20–38.
7 Glunde K, Bhujwalla ZM, Ronen SM. Choline metabolism in malignant transfor-mation. Nat Rev Cancer 2011; 11: 835–848.
8 Ramirez de Molina A, Sarmentero-Estrada J, Belda-Iniesta C, Taron M, Ramirez deMolina V, Cejas P et al. Expression of choline kinase alpha to predict outcome inpatients with early-stage non-small-cell lung cancer: a retrospective study. LancetOncol 2007; 8: 889–897.
9 Ramirez de Molina A, Gutierrez R, Ramos MA, Silva JM, Silva J, Bonilla F et al.Increased choline kinase activity in human breast carcinomas: clinicalevidence for a potential novel antitumor strategy. Oncogene 2002; 21:4317–4322.
10 Piccaluga PP, Fuligni F, De Leo A, Bertuzzi C, Rossi M, Bacci F et al. Molecularprofiling improves classification and prognostication of nodal peripheral T-celllymphomas: results of a phase III diagnostic accuracy study. J Clin Oncol 2014; 31:3019–3025.
11 Zhang H, Wang Y, Gu X, Zhou J, Yan C. Metabolomic profiling of human plasma inpancreatic cancer using pressurized capillary electrochromatography. Electro-phoresis 2010; 32: 340–347.
12 Tran MQ, Nygren Y, Lundin C, Naredi P, Bjorn E. Evaluation of cell lysis methodsfor platinum metallomic studies of human malignant cells. Anal Biochem 2009;396: 76–82.
13 Yan ZX, Wu LL, Xue K, Zhang QL, Guo Y, Romero M et al. MicroRNA187overexpression is related to tumor progression and determinessensitivity to bortezomib in peripheral T-cell lymphoma. Leukemia 2014; 28:880–887.
14 Oki T, Kitaura J, Watanabe-Okochi N, Nishimura K, Maehara A, Uchida T et al.Aberrant expression of RasGRP1 cooperates with gain-of-function NOTCH1mutations in T-cell leukemogenesis. Leukemia 2012; 26: 1038–1045.
15 Fulda S. Alternative cell death pathways and cell metabolism. Int J Cell Biol 2013;2013: 463637.
16 Cai Z, Jitkaew S, Zhao J, Chiang HC, Choksi S, Liu J et al. Plasma membranetranslocation of trimerized MLKL protein is required for TNF-induced necroptosis.Nat Cell Biol 2013; 16: 55–65.
17 Yoo BC, Kong SY, Jang SG, Kim KH, Ahn SA, Park WS et al. Identification ofhypoxanthine as a urine marker for non-Hodgkin lymphoma by low-mass-ionprofiling. BMC Cancer 2010; 10: 55.
18 Piszcz J, Lemancewicz D, Dudzik D, Ciborowski M. Differences and similaritiesbetween LC-MS derived serum fingerprints of patients with B-cell malignancies.Electrophoresis 2013; 34: 2857–2864.
19 Wang Y, Zhang L, Chen WL, Wang JH, Li N, Li JM et al. Rapid diagnosis andprognosis of de novo acute myeloid leukemia by serum metabonomic analysis.J Proteome Res 2013; 12: 4393–4401.
20 Wang JH, Chen WL, Li JM, Wu SF, Chen TL, Zhu YM et al. Prognostic significance of2-hydroxyglutarate levels in acute myeloid leukemia in China. Proc Natl Acad SciUSA 2013; 110: 17017–17022.
21 Gadiya M, Mori N, Cao MD, Mironchik Y, Kakkad S, Gribbestad IS et al. Phos-pholipase D1 and choline kinase-alpha are interactive targets in breast cancer.Cancer Biol Ther 2014; 15: 593–601.
22 Granata A, Nicoletti R, Tinaglia V, De Cecco L, Pisanu ME, Ricci A et al.Choline kinase-alpha by regulating cell aggressiveness and drug sensitivityis a potential druggable target for ovarian cancer. Br J Cancer 2014; 110:330–340.
23 Hernando E, Sarmentero-Estrada J, Koppie T, Belda-Iniesta C, Ramirez de Molina V,Cejas P et al. A critical role for choline kinase-alpha in the aggressiveness ofbladder carcinomas. Oncogene 2009; 28: 2425–2435.
24 Benjamin DI, Cravatt BF, Nomura DK. Global profiling strategies formapping dysregulated metabolic pathways in cancer. Cell Metab 2012; 16:565–577.
25 Marchan R, Lesjak MS, Stewart JD, Winter R, Seeliger J, Hengstler JG.Choline-releasing glycerophosphodiesterase EDI3 links the tumor metabolome tosignaling network activities. Cell Cycle 2012; 11: 4499–4506.
26 Riese MJ, Wang LC, Moon EK, Joshi RP, Ranganathan A, June CH et al. Enhancedeffector responses in activated CD8+ T cells deficient in diacylglycerol kinases.Cancer Res 2013; 73: 3566–3577.
27 Stewart JD, Marchan R, Lesjak MS, Lambert J, Hergenroeder R, Ellis JK et al.Choline-releasing glycerophosphodiesterase EDI3 drives tumor cell migration andmetastasis. Proc Natl Acad Sci USA 2012; 109: 8155–8160.
28 Clem BF, Clem AL, Yalcin A, Goswami U, Arumugam S, Telang S et al.A novel small molecule antagonist of choline kinase-alpha thatsimultaneously suppresses MAPK and PI3K/AKT signaling. Oncogene 2011; 30:3370–3380.
Chokα and choline metabolism in TCLJ Xiong et al
9
Blood Cancer Journal

29 Banez-Coronel M, Ramirez de Molina A, Rodriguez-Gonzalez A, Sarmentero J,Ramos MA, Garcia-Cabezas MA et al. Choline kinase alpha depletion selectivelykills tumoral cells. Curr Cancer Drug Targets 2008; 8: 709–719.
30 de la Cueva A, Ramirez de Molina A, Alvarez-Ayerza N, Ramos MA, Cebrian A, DelPulgar TG et al. Combined 5-FU and ChoKalpha inhibitors as a new alternativetherapy of colorectal cancer: evidence in human tumor-derived cell lines andmouse xenografts. PLoS One 2013; 8: e64961.
31 Watson AL, Anderson LK, Greeley AD, Keng VW, Rahrmann EP, Halfond AL et al.Co-targeting the MAPK and PI3K/AKT/mTOR pathways in two geneticallyengineered mouse models of schwann cell tumors reduces tumor grade andmultiplicity. Oncotarget 2014; 5: 1502–1514.
32 Declercq W, Vanden Berghe T, Vandenabeele P. RIP kinases at the crossroads ofcell death and survival. Cell 2009; 138: 229–232.
33 Locatelli SL, Giacomini A, Guidetti A, Cleris L, Mortarini R, Anichini A et al.Perifosine and sorafenib combination induces mitochondrial cell death andantitumor effects in NOD/SCID mice with Hodgkin lymphoma cell line xenografts.Leukemia 2013; 27: 1677–1687.
This work is licensed under a Creative Commons Attribution-NonCommercial-NoDerivs 4.0 International License. The images or
other third party material in this article are included in the article’s Creative Commonslicense, unless indicatedotherwise in the credit line; if thematerial is not included underthe Creative Commons license, users will need to obtain permission from the licenseholder to reproduce the material. To view a copy of this license, visit http://creativecommons.org/licenses/by-nc-nd/4.0/
Supplementary Information accompanies this paper on Blood Cancer Journal website (http://www.nature.com/bcj)
Chokα and choline metabolism in TCLJ Xiong et al
10
Blood Cancer Journal


