Embed Size (px)
Citation preview

Franz Barjak, Julia Lane, Meik
Poschen, Rob Procter, Simon
Robinson & Gordon Wiegand
E-INFRASTRUCTURE ADOPTION
IN THE SOCIAL SCIENCES AND
HUMANITIES
Cross-national evidence from the
AVROSS survey
This paper is a first attempt to describe and compare the adoption of e-Infrastructureacross the UK, continental Europe, and the USA in the social sciences and huma-nities. A survey of early adopters identified three differences across these countries,each potentially affecting adoption: funding approaches, the technical configurationof projects, and research support. Our findings also suggest that the sustainableadoption of e-Infrastructure co-varies with the role of intrinsic and extrinsic motiv-ations and the involvement of other people in the adoption decision.
Keywords e-Social Science; e-Infrastructure; research infrastructure;adoption
1. Introduction
In this paper, we describe and compare the adoption of e-Infrastructure byscientists in the social sciences and humanities (SSH) in the USA, the UK, andcontinental Europe. At the turn of the century, the USA and the UK weredescribed as the pace setters in terms of adopting science and technology policiesto develop and promote e-Infrastructure (Schroeder et al. 2007). Since then,many other regions and countries, including continental Europe, Australia,China, and India, have followed the leaders, launched e-Infrastructure initiatives,and started building their own national e-Infrastructures. The European
RICS409757 Techset Composition Ltd, Salisbury, U.K. 3/4/2010CopyEditedby:RK
MasterCopy:
QA:
Information, Communication & Society Vol. 00, No. 0, Month 2010, pp. 1–17
ISSN 1369-118X print/ISSN 1468-4462 online # 2010 Taylor & Francis
http://www.tandf.co.uk/journals DOI: 10.1080/13691180903095849
5
10
15
20
25
30
35
40

Commission has also become an important promoter of e-Infrastructure as aresult of its policy focus on the development of cross-national infrastructure(European Commission 2000, 2001). These efforts have led some experts topropose that Europe is currently a global leader of e-Infrastructure provision(Gentzsch 2005).
While the scale of public investments may differ across countries, thereare a number of shared characteristics to these national programmes (Schroeder& Fry 2007; Schroeder et al. 2007). One is the investment in large-scaleinfrastructure. For example, the US National Science Foundation has investedin the development of e-Infrastructure (known as ‘cyberinfrastructure’ in theUSA) that caters mainly for large-scale scientific research such as particlephysics and genomic research. Similarly, the core of European Union policyhas been focused on particle physics, in particular, the Large Hadron Collider,which is considered to be the largest scientific experiment, in terms of bothinvestment and worldwide participation (see http://lcg.web.cern.ch/LCG/overview.html Q1).
Another common feature of these initiatives has been their strong compu-tational and engineering focus, as is evident from documents such as the Euro-pean e-Infrastructure Reflection Group’s (e-IRG) e-Infrastructures Roadmap(Leenaars et al. 2005). Similarly, in the UK, as of 30 January 2005, two-thirds of the projects in the UK e-Science programme shared a computationalorientation (Wouters & Beaulieu 2006), despite the deliberately cross-disciplinaryagenda of the Research Councils’ contributions to the e-Science programme (seehttp://www.rcuk.ac.uk/escience/default.htm).
National e-Science programmes have, however, generally espoused abroader agenda of reaching beyond specific application domains and developinge-Infrastructure for use by the wider research community. For example, in theUK and USA, significant efforts have been made to explore the potential ofe-Infrastructure adoption within the SSH. In the UK, the Economic and SocialResearch Council commissioned a set of exploratory studies in 2003. These pre-liminary investigations subsequently led to the establishment of the NationalCentre for e-Social Science (Procter et al. 2006; Halfpenny et al. in press).Similarly, the Arts and Humanities Research Council launched its ‘ICT in Artsand Humanities Research’ programme in 2003. In the USA, reports such asCyberinfrastructure and the Social Sciences (Berman & Brady 2005) and Our CulturalCommonwealth (American Council of Learned Societies Commission on Cyberin-frastructure for the Humanities and Social Sciences 2006) explored in somedetail the potential of e-Infrastructure and mapped out long-term visions.These statements have kicked off e-Infrastructure developments in the SSH invarious countries.
The efforts of the USA and the UK appear to be exceptional, as, to date, noother country has explicitly adopted an initiative that promotes e-Infrastructureuptake by the SSH.1 However, the European Strategy Forum on Research
2 I N F O R M A T I O N , C O M M U N I C A T I O N & S O C I E T Y
45
50
55
60
65
70
75
80

Infrastructures has recognized the importance of including these domains ofscience in its Roadmap report. This foundational report identified three long-term strategic goals for SSH research infrastructures including comparativedata and modelling, data integration and language tools, and coordination (Euro-pean Strategy Forum on Research Infrastructures 2006).
This raises two questions about engaging social scientists and scholars fromthe humanities which we attempt to address in this paper: (1) how do differente-Infrastructure national policies influence researchers’ involvement withe-Infrastructure? and (2) what are the catalysts and barriers encountered byearly adopters in different countries?
In the remainder of the paper, we present and extend findings from a studyof e-Infrastructure adoption in the SSH, the ‘Accelerating Transition to VirtualResearch Organisation in Social Science’ (AVROSS) study for the EuropeanCommission, DG Information Society, and Media. The paper summarizesthe results of the final report, which covers the full results of the survey one-Infrastructure adoption (including breakdowns by countries, fields, andother subsets of respondents) and eight case studies on e-Infrastructure projects(see also the companion paper to this article Barjak et al. in press).2
2. Data
Data for this study were collected through an email survey in the spring of 2007.Our aim was to cast the net wide enough to ensure as large a number ofresponses from social scientists and humanity scholars who were activelyengaged in e-Science as possible. Since no frame existed, we compiled oursample from participant lists in UK and US e-Infrastructure events and activities.In particular, we relied on lists provided by the National Centre for e-SocialScience as well as on publicly available lists of participants in NSF workshops.To broaden the list, we also conducted targeted Internet searches of thevarious pertinent programmes, projects, and conference pages. We also ident-ified additional participants using a snowball approach in the survey. The finalsample involved more than 1900 individuals who were interested and potentiallyinvolved in e-Infrastructure work. This purposive sample included scientists from45 countries and various institutional domains – such as universities, govern-mental research organizations, and commercial firms. Of the 450 usableresponses we received (24 per cent of the sample), the UK and the USA eachmade up roughly one-third; one-fourth came from continental Europe andaround 9 per cent from other countries.
The survey asked for respondent input on items in a number of areas: (1) therespondent’s current involvement in e-Infrastructure project(s); (2) if the respon-dent was a recipient of funding, questions were asked about the source of funding,the project’s technological configuration, the project’s scientific results and other
E - I N F R A S T R U C T U R E A D O P T I O N I N T H E S S H 3
85
90
95
100
105
110
115
120

characteristics of this project; and (3) the respondent’s identification of catalystsand barriers to the development and implementation of their e-Infrastructureprojects. General background information was also collected, namely, the respon-dent’s organizational affiliation, allocation of time (research/teaching), collabor-ators, and level of experience with e-Infrastructure.
We should note that in the survey we relied upon a common definition ofe-Infrastructure. According to this definition, e-Infrastructure is viewed as anintegrated ICT-based research infrastructure (Leenaars et al. 2005). Key elementsinclude networking infrastructure, middleware, and various types of interoper-able computational resources such as supercomputers, sensors, data, and storagefacilities. Though the definition is broad enough to include standard componentssuch as the World Wide Web and e-mail as well as newer technologies, ourapproach follows the perspective of bodies such as the e-IRG that consider e-Infrastructure to be an integrated technological platform.
3. Country differences
3.1 Involvement with e-Infrastructure
Respondents’ involvement with e-Infrastructure was assessed through a numberof questions on their background and the e-Infrastructure projects on which theyreported: the experience with e-Infrastructure, the number of projects in whichthey have been involved, and the size of the main project (measured throughseveral input and output variables).
Not surprisingly, since the sample focused on respondents who were alreadyengaged on some level with e-Infrastructure activities in the SSH, around 50 percent currently use these technologies; 12 per cent had previously used e-Infrastructure but did not use it any more (continental Europe: 14.3 per cent,UK: 10.7 per cent, and USA: 12.4 per cent), and around 35 per cent did notutilize e-Infrastructure. However, the proportion of respondents who intendedto use e-Infrastructure in the future was highest in continental Europe (15.3per cent), followed by the UK (13.7 per cent) and the USA (9.3 per cent,total of all responses is 13.6 per cent).
We also asked the respondents about the year in which they first becameengaged with e-Infrastructure and in how many e-Infrastructure projects inthe SSH they had been involved: median values for these responses are reportedin Figure 1. As is evident from a perusal of Figure 1, respondents from the USAexhibit more enduring and enhanced involvement than European respondents.UK efforts are relatively recent, with the median response being four years.
One-third to one-fourth of the respondents provided data on their currente-Infrastructure projects (Table 1). UK projects are smaller compared withthose in other regions, with regard to both number of people and budget;
4 I N F O R M A T I O N , C O M M U N I C A T I O N & S O C I E T Y
125
130
135
140
145
150
155
160

they involve only half as many scientists as continental European and US projectsand very few graduate students. According to the project budgets given bycontinental European and US respondents, their projects were 1.5–2 timeslarger than those noted by UK respondents. However, we suspect that budgetdifferences may be just a consequence of longer project durations in thesecountries. When considering annualized budgets, the difference is reduced toonly 20 per cent.
There is a wide variation in the structure of funding across regions (Table 2).Funding portfolios of continental European projects are most diverse. These pro-jects have received roughly equal support from national research councils orresearch foundations, the European Union, education ministries, and the respon-dents’ own institutions. UK projects mainly rely on funding from research
FIGURE 1 Experience in e-Infrastructure projects by region of the respondent (median).
Source: AVROSS early adopter survey.
TABLE 1 Characteristics of projects (median values).
continental
Europe UK USA totala respondents
People involved Total 15 10 20 14 178
Scientists 8 4 7 5 167
Graduate students 4 1 5 3 165
Funding in 1000E Total 734 307 522 335 119
Annualb 188 151 164 149 116
Scheduled funding period in months 36 30 36 36 160
Source: AVROSS early adopter survey.aIncluding 14 projects from other regions worldwide.bPartially estimated from total budget and project duration figures.
E - I N F R A S T R U C T U R E A D O P T I O N I N T H E S S H 5
165
170
175
180
185
190
195
200

councils, with limited internal institutional contributions. In the USA, both theNational Science Foundation and the respondents’ own institutions provided thebulk of the funding for e-Infrastructure in the SSH. Local education bodies,private foundations, and other unidentified sources contributed to up to one-fourth of the projects’ budgets. Taking together all sources listed in Table 2,responses from the USA and continental Europe point to multiple sources perproject – on average, 1.8 in the USA and 1.5 in Europe. In the UK, it adds upto only 1.1 different funding sources per project, which highlights the dominantrole research councils and their affiliates play in promoting e-Infrastructure use inBritish SSH.
Among the technological features, the clearest differences are (Table 3): thecomparatively low importance of high bandwidth in the UK, the high importanceof learning environments and high performance computing and communicationin the USA, and the relative low reliance on high quality, scalable videoconfer-encing technology in continental Europe.
Although project maturity was not assessed in the survey, it was clear thatsome projects were relatively new and therefore very likely to still be underdevelopment. Consequently, it is premature to make any sweeping conclusionsabout the projects’ impact. However, the vast majority – 80–90 per cent –of the projects had published, developed new tools, established further collabor-ations, and engaged in new methods of research. However, US respondents weremore likely than Europeans to report such project outcomes as collaboration,new tool developments, new data sources, and methods. Again, we interpretthese differences as a result of the longer experience of US scientists with e-Infrastructure (Figure 1).
TABLE 2 Funding structure of projectsa.
continental
Europe UK USA total
National research council or research foundation (per
cent)
36.4 63.3 54.9 52.8
European Union (per cent) 30.3 6.3 2.8 11.5
National/state research or education ministries (per cent) 28.8 12.7 21.1 20.4
Own institution (per cent) 33.3 19.0 50.7 34.0
Private foundation (per cent) 9.1 1.3 26.8 12.3
Other (per cent) 12.1 7.6 22.5 13.2
Respondents 66 79 71 235
Source: AVROSS early adopter survey.aPositive responses (in per cent) of total responses (multiple funding sources per project
possible).
6 I N F O R M A T I O N , C O M M U N I C A T I O N & S O C I E T Y
205
210
215
220
225
230
235
240

3.2 Information sources, catalysts, and barriers on e-Infrastructure
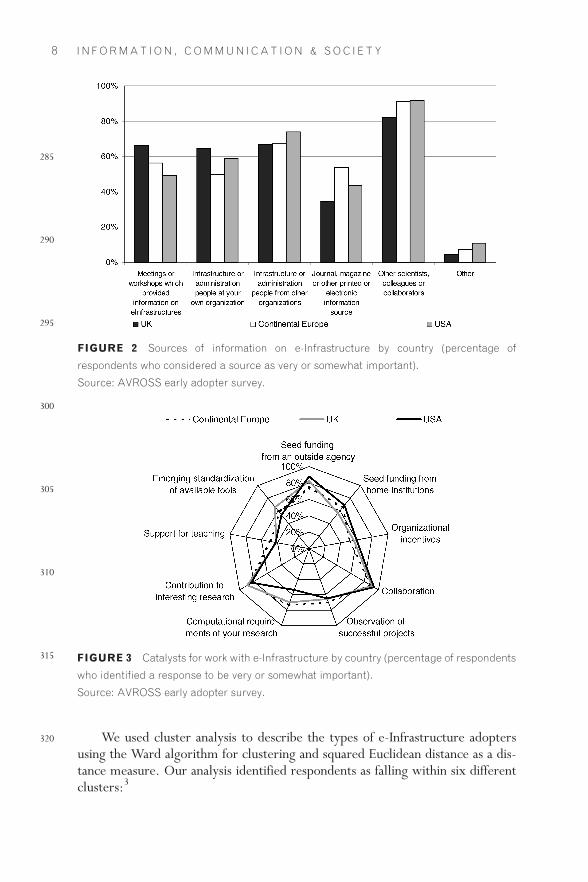
Another section of the survey asked respondents how they learnt about e-Infrastructure and the catalysts and barriers they experienced in the adoptionprocess. Personal networks are the most important source of informationabout the new technology (Figure 2). Staff responsible for computers and ITinfrastructure also served as an important source of information. Interestingly,written information on e-Infrastructure was the least cited source for learningabout these technologies. Formal personal interactions in the form of meetingsor workshops on the topic were of higher significance in the UK compared withthe other countries.
As evident in Figure 3, a trio of catalysts appears to drive e-Infrastructureadoption in the SSH: funding, collaboration, and contribution to interestingresearch. Financial barriers were prominently noted, including fundinglevels and costs associated with staff (Figure 4). There were some differencesacross regions. In the UK, confidentiality problems regarding data and theapplicability of the technology were of higher importance than elsewhere.In Europe, computational requirements played a larger role than in the USA.Support for teaching was seemingly irrelevant as were the other listedresponses options. Our findings are confirmed by a recent survey of a similarpopulation: respondents to that survey mentioned formal training and fundingavailability for e-Science as dominant facilitators of adoption (Dutton & Meyer2008).
TABLE 3 Technological features of projectsa.
continental
Europe UK USA total
Collaboration tools/systems (per cent) 83.9 77.3 83.1 82.0
Distributed data and data repository (per cent) 89.3 81.8 69.0 79.1
High bandwidth (per cent) 71.4 48.5 70.4 63.0
High performance communication (per cent) 39.3 40.9 56.3 47.9
Learning environments (per cent) 41.1 33.3 47.9 39.8
High performance computing (per cent) 32.1 34.8 42.3 36.5
High quality, scalable videoconferencing (per cent) 17.9 36.4 32.4 30.3
Innovative data collection methods (per cent) 26.8 21.2 25.4 26.1
Virtual/3D environments (per cent) 14.3 13.6 21.1 16.1
Other (per cent) 17.9 9.1 8.5 12.3
Respondents 56 66 71 211
Source: AVROSS early adopter survey.aPositive responses (in per cent) of total responses.
E - I N F R A S T R U C T U R E A D O P T I O N I N T H E S S H 7
245
250
255
260
265
270
275
280
We used cluster analysis to describe the types of e-Infrastructure adoptersusing the Ward algorithm for clustering and squared Euclidean distance as a dis-tance measure. Our analysis identified respondents as falling within six differentclusters:3
FIGURE 2 Sources of information on e-Infrastructure by country (percentage of
respondents who considered a source as very or somewhat important).
Source: AVROSS early adopter survey.
FIGURE 3 Catalysts for work with e-Infrastructure by country (percentage of respondents
who identified a response to be very or somewhat important).
Source: AVROSS early adopter survey.
8 I N F O R M A T I O N , C O M M U N I C A T I O N & S O C I E T Y
285
290
295
300
305
310
315
320

. Localists and information isolates (44 individuals or 26 per cent of the clus-tered respondents). Respondents from this cluster highlight the importanceof their local organization, rather than external sources, for motivating theuse of e-Infrastructure.
. Technology-averse scholars (28 individuals, 17 per cent). This cluster con-sists of respondents who turned to e-Infrastructure to find support for theirteaching; as a consequence, they are less affected by research-related cata-lysts such as expected benefits for research, particularly computationallydemanding research, or barriers such as IPR Q2or confidentiality problems.Their adoption potential is more likely to be inhibited by a lack of staffand infrastructure support.
. Research-oriented low raters (13 individuals, 8 per cent). This (rather infor-mal) label is used for a cluster of respondents who gave all variables in theareas of information sources, catalysts, and barriers lower than averageratings. This means that they benefited less from information sources;they were less often drawn to e-Infrastructure through seed funding, butthey were also less often burdened by funding problems. They weredrawn to e-Infrastructure mainly through their research and encounteredfew barriers in the course of using it.
. High raters (45 individuals, 27 per cent). The opposite of the previouscluster is a cluster in which all the variables received higher than averageratings. All information sources played a more important role, particularlypeople from infrastructure departments and administration. Among the cat-alysts, all were rated highly too. Collaboration was deemed important by all
FIGURE 4 Barriers against work with e-Infrastructure by country (percentage of
respondents who identified a response to be very or somewhat important).
Source: AVROSS early adopter survey.
E - I N F R A S T R U C T U R E A D O P T I O N I N T H E S S H 9
325
330
335
340
345
350
355
360

respondents in this cluster, seed funding from outside, and contribution toresearch by all but one. Like other respondents, the most important barrierscited were funding and staff related. However, the other problems, in par-ticular, those of IPR, confidentiality, and sustainability were also ratedhighly.
. Locally isolated researchers (15 individuals, 9 per cent). A fifth cluster con-sists of respondents who received little information, funding, or othersupport from their own organizations, but nevertheless decided tobecome involved with e-Infrastructure. They did so because their researchrequired it. They considered themselves well informed, particularlythrough other scientists and meetings. They cited difficulties with IPR, con-fidentiality, and sustainability problems to nearly the same extent as difficul-ties with funding, cost, and staff.
. External fund raisers (24 individuals, 14 per cent). The sixth and last clusterconsists of respondents who received information and technical and person-nel support at their organizations but not funding. The acquisition of initialfunds for which they had to turn to other organizations was by far theirbiggest problem in the adoption process.
The distribution of the clusters across countries shows that UK respondentswere spread rather evenly across the clusters with localists/information isolatesconstituting the largest share (25.5 per cent) and locally isolated respondents alsobeing over proportionally represented (16 per cent). Very few of the respondentsfrom continental Europe were identified as locally isolated researchers (only 4.4per cent). Many more Europeans (more than two-thirds) could be categorized aslocalists/information isolates (27 per cent), high raters (22 per cent), and tech-nology-averse scholars (20 per cent). US respondents are also featured in thesethree groups, with nearly a third among the high raters (31.6 per cent); a dis-proportionally large share, 20 per cent, of the US respondents was classifiedas external fund raisers.
4. Sustaining e-Infrastructure adoption
One of the results of the survey was that 12 per cent of the early adopters nolonger used e-Infrastructure. There is some evidence that those who discontin-ued their engagement with e-Infrastructure were more heavily dependent onfunding. Although there was a consistent level of sustainability betweencurrent and former4 users in most clusters, two types of adopters stood out.No former users were clustered into the low rater category (the mostresearch-oriented category); but proportionately twice as many former usersas would be expected were clustered into the external fund raisers category,suggesting that a lack of (sustainable) local funding has deterred some
1 0 I N F O R M A T I O N , C O M M U N I C A T I O N & S O C I E T Y
365
370
375
380
385
390
395
400

respondents from e-Infrastructure use. This very interesting correlation was con-firmed by an examination of the responses to the question that asked respondentsdirectly about their reasons for stopping involvement with e-Infrastructure.Here, 70 per cent of the former users rated a lack of sustainable funding asimportant or very important, 60 per cent lacked staff, 45 per cent were notsatisfied with the scientific payoff, and one-third lamented that the technologyhad not been mature enough.
Similarly, former users were more likely to be dependent on externalsources for information. They were more likely than current users to rate infra-structure and administration people from other organizations and printed infor-mation to be of higher importance as information sources (Figure 5).
Former and current users also evaluated catalysts and barriers differently(Tables 4 and 5). Former users rated several external catalysts such as fundingand organizational incentives higher, whereas they rated catalysts involvingother people lower, such as the necessities of collaborations and the supportfor teaching activities. The asymmetry between the responses of former andcurrent users was similarly evident in their identification of barriers. Whileboth groups stressed the importance of funding and costs barriers, the formerusers were more likely to identify these as issues (Table 5). By contrast,current users were more likely than former users to identify insufficient applica-bility of technology to social science and problems with protecting the confiden-tiality of data.
FIGURE 5 Sources of information on e-Infrastructure by involvement status (percentage
of respondents who identified a source to be very or somewhat important).
Source: AVROSS early adopter survey.
E - I N F R A S T R U C T U R E A D O P T I O N I N T H E S S H 1 1
405
410
415
420
425
430
435
440

These differences, taken together, are consistent with the idea that if extrin-sic incentives, such as seed funding, incentives from the own organization of therespondents, or from e-Infrastructure providers, i.e. incentives not related to thecore tasks of research and teaching, were important in the decision to use e-Infra-structures, then respondents were less committed and the discontinuance offunding led them to discontinue e-Infrastructure use. Continuing users weremore likely to rate other extrinsic incentives such as collaboration and teachinghighly and were more willing to deal with problems of protecting the
TABLE 4 Catalysts for work with e-Infrastructure by user involvement (percentage
of respondents who identified a response to be very or somewhat important).
current users former users
Seed funding from an outside agency (per cent) 78.1 85.2
Seed funding from home institutions (per cent) 59.1 70.4
Organizational incentives within your institution (per cent) 51.1 59.3
Collaboration (per cent) 92.0 85.2
Observation of successful projects in other areas (per cent) 62.0 59.3
Computational requirements of your research (per cent) 56.9 63.0
Contribution to interesting research expected (per cent) 81.0 81.5
Support for teaching activities (per cent) 43.1 29.6
Emerging standardization of available tools (per cent) 55.5 48.1
Source: AVROSS early adopter survey.
TABLE 5 Barriers to work with e-Infrastructure by user involvement (percentage of
respondents who identified a response to be very or somewhat important).
current
users
former
users
Lack of initial funding (per cent) 72.3 81.5
Costs associated with development and deployment (per cent) 74.6 85.2
Lack of information about usefulness (per cent) 46.2 40.7
Lack of staff available to help (per cent) 66.2 63.0
Insufficient applicability of technology to social science (per cent) 47.7 33.3
Problems with IPR, ownership, publication conventions, or attributing
credits (per cent)
37.7 40.7
Lack of confidence in the sustainability (per cent) 43.8 44.4
Problems with protecting confidentiality of data (per cent) 40.8 25.9
Locked into other technologies (per cent) 26.9 33.3
Source: AVROSS early adopter survey.
1 2 I N F O R M A T I O N , C O M M U N I C A T I O N & S O C I E T Y
445
450
455
460
465
470
475
480

confidentiality of their data and trying to make ends meet, i.e. align the techno-logical capacities with their actual needs.
5. Summary and conclusions
Overall, the responses to our survey suggest a still modest state of e-Infrastructureuse in the SSH: out of nearly 2000 people who received the AVROSS questionnaire,only around one-fourth responded, of which only half were current e-Infrastruc-ture users. This low level of activity is mirrored by a similar survey sent to agroup of social scientists who had been identified as interested in ICT and Internetissues in which the largest share of respondents classified themselves as observersand not enthusiasts or promoters (Dutton & Meyer 2008). Adoption of e-Sciencetools is clearly ‘not just a matter of time’ (Kling & McKim 2000), and e-Infrastruc-ture is usually not included among the core concerns of researchers in SSH, but anactivity of a few with a particular technical inclination and research interests whichare demanding in regard to data, collaboration, or computing.
While our exploratory data on e-Infrastructure adoption in the SSH in con-tinental Europe, the UK, and the USA do not always paint a clear picture, certainfacets can be investigated further. One of the interesting differences betweencontinental Europe, the UK and the USA appears to be funding models andthe problems associated with funding in general. The annualized projectbudgets are quite similar in all three countries, and mainly, shorter project dur-ations cause smaller total budgets in the UK. However, funding structures differacross countries, and we see a much more pronounced role of private foun-dations and institutional allocation in the USA. This is compensated in continen-tal Europe by the EU and national (or regional) government grants and in the UKby the research councils and the Joint Information Systems Committee as a par-ticularly significant funder. This seems to have created a slightly more relaxedfunding situation in the UK than elsewhere, as UK respondents less oftenpointed to funding barriers. It also reduced the pressure on UK scientists tolook for funds from other sources outside the ‘regular’ range of sciencefunding. At the moment, it is hard to say whether this is an asset or a liability.Sufficient internal science funding probably eases initial adoption. However, inthe long run, this funding is not sustainable, and it might prove difficult tokeep the projects alive and convert them into sustainable, ‘production quality’e-Infrastructure that is suitable for use by follow-up research and other research-ers who have not participated in the original development.
A second issue relates to the technical configuration: in continental Europeand the UK, the computational requirements of the research constituted a biggerincentive to use e-Infrastructure than in the USA. We may conclude that currentavailability of computational resources for SSH is poorer in continental Europeand UK than in the USA. However, at the same time, 40 per cent of the US
E - I N F R A S T R U C T U R E A D O P T I O N I N T H E S S H 1 3
485
490
495
500
505
510
515
520

respondents stated that high-performance computing was a feature of theirproject compared with only one-third in Europe. These survey responsesmight appear contradictory at first sight, but they are not: in Europe, SSHresearchers in need of better computing infrastructure turned to e-Infrastruc-ture, but have not necessarily found what they were looking for. If this is so,it creates an adoption problem in the long run. Drop-out rates are still quitesimilar in all countries, and the rate of former users varies between 10 and15 per cent. But we would expect this to shift to the negative, if the Europeane-Infrastructure framework were not be able to accommodate the technicalneeds of SSH to a sufficient extent.
Thirdly, a source of adoption potential relates to information sources and thesupporting information infrastructure of e-Infrastructure developments for SSH.In the UK, we find that meetings and workshops for learning about e-Infrastruc-ture are more important compared with continental Europe and the USA. Thismade it possible for UK respondents to adopt e-Infrastructure bypassing theirlocal organizations – the rate of respondents who are classified as ‘locallyisolated’ is highest in the UK (16 per cent compared with 9 per cent overall).A support system of e-Science centres, as has been established in the UK, isobviously well suited to help researchers who would otherwise not have suffi-cient local support for becoming involved with e-Infrastructure.
Besides these country differences, we find two important dimensions thatinfluence the sustainability of adoption. The first dimension is the research-teachingdimension, and the second dimension is one of extrinsic versus intrinsic motiv-ations and the involvement of other people.
. The promise of interesting research is clearly an important incentive forinvesting time in e-Infrastructure. Without this incentive, many wouldnot be willing to bear the associated learning and other costs. However,using e-Infrastructure for research also raises the stakes in many regards,e.g. quality, professionalism, or data protection, as the results will be com-municated to research community peers. In teaching, the audience is morerestricted; the target group usually being students at the same organizationand the interest is not so much on the mere results of the work but more onthe process and the ‘how-to-do things’. Generational influence is alsoimportant, with younger people being more open to innovative technologyand willing to improvize if necessary. Taking these arguments seriously, it issurprising to find that support for teaching is not an important driver forSSH involvement with e-Infrastructure. However, those who becameinvolved for teaching reasons encountered fewer problems, became lessoften frustrated, and consequently were more frequently listed among e-Infrastructure users. Thus, a promising strategy for enhancing adoptioncould be to provide particular support for teaching that uses e-Infrastructureor at least resources associated with these technologies.
1 4 I N F O R M A T I O N , C O M M U N I C A T I O N & S O C I E T Y
525
530
535
540
545
550
555
560

. The distinction between locally constrained and more nationally integratedresearchers is also an important one, as we could see in several occasions inour analysis. Though initial funding and support from the local university ororganization is without doubt important, support that projects receive mustquickly expand beyond these narrow means. Information from other exter-nal sources is important to avoid reinventing wheels and to match or exceedthe (inter)national state-of-the-art quickly; collaborators with complemen-tary knowledge may also be more easily found outside a single organization.And last but not the least, if barriers in the use of an infrastructure appear,scientists will be more willing to work around them and sustain their com-mitment to e-Infrastructure if they are committed because of obligations totheir peers and other scientists.
Though we were able to shed light on some important aspects of e-infrastructureinvolvement in the SSHs, we are still many steps away from understanding com-pletely the adoption process and the role of national policies in it.
Notes
1 Maybe with the Netherlands as an exception, where various e-researchinitiatives in the SSHs have been reported (Wouters & Beaulieu 2007).
2 The final report on AVROSS is available for download at http://web.fhnw.ch/plattformen/avross/papers-and-prensentations/final-report/ or canbe obtained from the authors upon request.
3 Of course, because of the small cluster sizes, the results should not betaken as more than an initial attempt to identify some typical schemesof adoption.
4 For those who have stopped using e-Infrastructure, it is important to notethat this analysis is only descriptive in nature. There are multiple problemswith interpreting the results as inferential – not least the sampling frameand strategy, item non-response, the overlap between respondents andprojects, different starting (and hence stopping) dates, and the inherentlytruncated nature of the distribution.
References
American Council of Learned Societies Commission on Cyberinfrastructure for theHumanities and Social Sciences (2006) Our Cultural Commonwealth. The Report ofthe American Council of Learned Societies Commission on Cyberinfrastructure for theHumanities and Social Sciences, American Council of Learned Societies,New York.
E - I N F R A S T R U C T U R E A D O P T I O N I N T H E S S H 1 5
565
570
575
580
585
590
595
600

Barjak, F., Lane, J., Kertcher, Z., Poschen, M., Procter, R. & Robinson, S. (Inpress) ‘Case studies of e-Infrastructure adoption’, Social Science ComputerReview. Q3
Berman, F. & Brady, H. (2005) Final Report: NSF SBE-CISE Workshop on Cyberinfras-tructure and the Social Sciences, [Online] Available at: http://vis.sdsc.edu/sbe/reports/SBE-CISE-FINAL.pdf (3 October 2006). Q1
Dutton, W. H. & Meyer, E. T. (2008) ‘e-Social Science as an experience technology:distance from, and attitudes toward, e-Research’, paper presented at theFourth International Conference on e-Social Science, Manchester, [Online]Available at: http://www.ncess.ac.uk/events/conference/programme/thurs/1bMeyerb.pdf (17 March 2009).
European Commission (2000) Towards a European Research Area, COM(2000) 6,[Online] Available at: http://ec.europa.eu/research/era/pdf/com2000-6-en.pdf (5 August 2008).
European Commission (2001) A European Research Area for Infrastructures. SEC(2001)356, [Online] Available at: ftp://ftp.cordis.europa.eu/pub/improving/docs/ infrastructures_sec_2001_356.pdf (5 August 2008). Q1
European Strategy Forum on Research Infrastructures (2006) European Roadmap onResearch Infrastructures (Report 2006), Office for Official Publications of theEuropean Communities, Luxembourg, [Online] Available at: http://cordis.europa.eu/esfri/roadmap.htm (19 October 2006).
Gentzsch, W. (2005) ‘Grid computing: how Europe is leading the pack’, GRID Today,April 18, [Online] Available at: http://news.taborcommunications.com/msgget.jsp?mid¼366726&xsl¼story.xsl (5 August 2008). Q1
Halfpenny, P., Procter, R., Lin, Y. & Voss, A. (In press) ‘Developing the UK e-SocialScience research programme’, in e-Research, Transformation in Scholarly Practice,ed. N. Jankowski, Routledge. Q3
Kling, R. & McKim, G. (2000) ‘Not just a matter of time: field differences and theshaping of electronic media in supporting scientific communication’, Journal ofthe American Society for Information Science, vol. 51, no. 14, pp. 1306–1320.
Leenaars, M., Heikkurinen, M., Louridas, P. & Karayannis, F. (2005) e-InfrastructuresRoadmap, [Online] Available at: http://www.e-irg.org/roadmap/eIRG-roadmap.pdf (23 November 2006). Q1
Procter, R., Batty, M., Birkin, M., Crouchley, R., Dutton, W., Edwards, P., Fraser,M. & Rodden, T. (2006) ‘The National Centre for e-Social Science’, UKe-Science All Hands Meeting, September.
Schroeder, R. & Fry, J. (2007) ‘Social science approaches to e-Science: framing anagenda’, Journal of Computer-Mediated Communication, vol. 12, no. 2,pp. 563–582.
Schroeder, R., Den Besten, M. & Fry, J. (2007) ‘Catching up or latecomer advan-tage? Lessons from e-Research strategies in Germany, in the UK and beyond’,paper presented at the German e-Science Conference 2007, Baden-Baden,[Online] Available at: http://edoc.mpg.de/get.epl?fid¼36027&did¼315462&ver¼0 (5 August 2008).
1 6 I N F O R M A T I O N , C O M M U N I C A T I O N & S O C I E T Y
605
610
615
620
625
630
635
640

Voss, A., Mascord, M., Fraser, M., Jirotka, M., Procter, R., Halfpenny, P. et al.(2007) ‘e-Research infrastructure development and community engagement’,UK e-Science 2007 All Hands Meeting, [Online] Available at: http://www.allhands.org.uk/2007/%20proceedings/papers/866.pdf (31 October 2007). Q4
Wouters, P. & Beaulieu, A. (2006) ‘Imagining e-Science beyond computation’, inNew Infrastructure for Knowledge Production: Understanding E-Science, ed. C.Hine, Idea Group, Hershey, pp. 48–70.
Wouters, P. & Beaulieu, A. (2007) ‘Critical accountability: dilemmas for interven-tionist studies of e-Science’, Journal of Computer-Mediated Communication, vol.12, no. 2, pp. 583–599.
Franz Barjak. Address: University of Applied Sciences Northwestern Switzer-
land, Olten, Switzerland. [email: [email protected]]
Julia Lane. Address: University of Chicago, Chicago, USA. [email: [email protected]]
Meik Poschen. Address: National Centre for e-Social Science, University of
Manchester, Manchester, UK. [email: [email protected]]
Rob Procter. Address: National Centre for e-Social Science, University of
Manchester, Manchester, UK. [email: [email protected]]
Simon Robinson. Address: Empirica Communication and Technology
Research, Bonn, Germany. [email: [email protected]]
Gordon Wiegand. Address: University of Applied Sciences Northwestern
Switzerland, Olten, Switzerland [email: [email protected]]
E - I N F R A S T R U C T U R E A D O P T I O N I N T H E S S H 1 7
645
650
655
660
665
670
675
680


