Embed Size (px)
Citation preview

Disclaimer & Disclosures: This report must be read with the disclosures and the analyst certifications in the Disclosure appendix, and with the Disclaimer, which forms part of it
https://www.research.hsbc.com
Play interview withAnderson Chow
EQUITIESINDUSTRIALSNovember 2018
By: Anderson Chow
China InfrastructureOn the move again
We estimate an additional RMB2trn is required by the end of 2019e to bring infrastructure spending in line with growth in fixed asset investment
Central government financing could be the key funding source as local governments continue to deleverage
Buy ideas include CRCC, Gezhouba, Anhui Conch, and CRRC Corp

1
EQUITIES ● INDUSTRIALS
November 2018
THIS CONTENT MAY NOT BE DISTRIBUTED TO THE PEOPLE'S REPUBLIC OF CHINA (THE
"PRC") (EXCLUDING SPECIAL ADMINISTRATIVE REGIONS OF HONG KONG AND MACAO)
Why read this report?
Our analysis shows that China needs to increase
infrastructure investment by RMB2trn by the end
of 2019e to stabilise the growth rate of fixed
asset investment at around 5%.
We identify where the money is likely to be spent
and why the central government is likely to play a
major role in financing new projects through
several different channels.
We show which companies should benefit most
and why this current increase in infrastructure
investment should be more sustainable than
those in the past.

EQUITIES ● INDUSTRIALS
November 2018
2
Source: Wind, local governments, Ministry of Finance PPP Centre, HSBC
Financing China’s infrastructure
Local governments’ explicit debt as of July 2018 –
97% in the form of municipal bonds
BUY
CRCC (1186 HK)
Construction: A major
infrastructure contractor that
will benefit from increases in
infrastructure investment.
Strong balance sheet and
positive cash flow will help
increase asset turnover and
help gain market share in
Chinese construction
BUY
CRRC (1766 HK)
Machinery: Leveraged to
increasing locomotive and
freight wagon orders driven
by shift of freight transport
from highway to railway by
2020. Internal restructuring
should lower overhead costs
and enhance profitability
and ROE over the long term
BUY
BUY
Anhui Conch
(914 HK / 600585 CH)
Construction Materials:
Indisputable cost leader of
the industry. GP/ton
expansion driven by
supply-side control.
Attractive dividend yield of
around 6% for 2018e
BUY
Gezhouba (600068 CH)
Construction: Strong
earnings growth over 20%
p.a. with a 5-year order
backlog to revenue ratio.
Rapid expansion in
environmental division; focus
on recycling of solid waste
offers long term upside
Provincial municipal bonds and LGFV debt
outstanding as % of government income, 2017
Operating cash flows are expected to be positive in the coming years
Total gross output value of construction (RMBtrn)
China’s fixed asset investment growth
Worth of projects in the Ministry of Finance’s PPP
approved database at the end of June 2018
PPP projects by type of project as at 2Q18
RMB17.2trnRMB2trn RMB11.9trnIncrease in infrastructure investment is required to
stabilise fixed asset investment growth at +5%
We have Buy ratings on four industry leaders
RMB192bn2 provinces
30%-100%
RMB8.8trn10 provinces
100%-150%
RMB32.8trn19 provinces
100%-150%
RMB9trn Total fixed assets
y-o-y
RMB6trn
RMB3trn
Jan-18
21.4 22.5 23.7 25.0
Sep-18
0
15%
10%
5%
0%
+5%
31%
29%
13%
27%
Municipal
projects
Transport
infrastructure
Land
development
Others
2017
7%2020e
8%
The 3 major infrastructure
contractors combined would see
market share increase
2017 2018e 2019e 2020e

3
EQUITIES ● INDUSTRIALS
November 2018
Sizing up the investment 4
RMB2trn reasons for optimism 4
Where is the project funding
coming from? 5
Ranking of Chinese
construction companies 6
More sustainable growth 7
RMB2trn to stabilise infrastructure
investment by the end of 2019e 7
Funding infrastructure investment in
a deleveraging environment 9
PPP focus should shift towards
commercial projects 17
Chinese construction industry
consolidation 19
ESG matters for the Chinese
construction industry 22
Outlook for companies 25
Chinese construction companies 25
Capital goods – demand to
hold up in 2019 26
Disclosure appendix 53
Disclaimer 56
Contents
EQUITIES ● INDUSTRIALS
November 2018
4
RMB2trn reasons for optimism
In July 2018, the Chinese government announced its intention to increase infrastructure
investment to stabilise domestic demand in light of the challenging economic conditions caused
by trade tensions. This is clearly much-needed good news for construction companies, which
have suffered due to the rapid fall in infrastructure investment, as a result of China’s
deleveraging process. The fall in share prices over the past few quarters means that these
companies are trading at either close to or below levels last seen in 2014, another period of
crisis for the industry. However, investors are unsure about the magnitude and timing of the
increase, where the money is coming from, and who stands to benefit most. This report aims to
answer these questions.
Highlights
We estimate RMB2trn will be required by the end of 2019 for growth in total infrastructure
investment to recover to a rate similar to China’s overall fixed asset investment (FAI) growth
of 5.4%.
To put this in context, growth in Chinese infrastructure investment has been negative since
May 2018. RMB2trn would represent a hefty boost, given that total infrastructure investment
in 2017 was cRMB17trn.
The first green shoots are already visible – in September the broad measure of
infrastructure investment declined 2.6% y-o-y, an improvement on August’s fall of 5.4%.
We stress that the current policy initiative is different in nature from the huge stimulus
package of 2008-10 that was a response to the Global Financial Crisis. Back then, the pace
of construction and new project tenders soared immediately after the policy statement. We
think the current increase in investment is taking place in a more orderly fashion and is
focused on stabilising rather than stimulating domestic demand.
Our discussions with regulators, contractors, and government think tanks indicate that the
central government is likely to play an important role in providing project funding.
Sizing up the investment
Investors are unsure about the magnitude and timing of the increase
in China’s infrastructure investment, where the money is coming
from, and who stands to benefit most. We estimate that a further
RMB2trn is required by the end of 2019e to stabilise the growth rate
of fixed asset investment at around 5%. Increased funding from the
central government over the coming months should allay concerns
about the financing of existing and new projects. Meanwhile, we think
PPP financing should shift towards commercial projects in order to
attract private capital for infrastructure investment. Buy ideas include
CRCC, Gezhouba, Anhui Conch, and CRRC Corp.
Some much-needed good
news for construction
companies

5
EQUITIES ● INDUSTRIALS
November 2018
We think the first stage of the rise in infrastructure investment should benefit construction
company earnings in 2H18. The second stage should see an increase in new project
tenders in 2019.
Private involvement in infrastructure development would depend on public-private-
partnership (PPP) project financing shifting focus to more user-pay projects with reasonable
commercial returns. More transparent regulations on infrastructure returns can be expected
in the coming years, especially for toll roads and the railway sector.
Construction companies should benefit from faster project execution and more new projects
in 2019e. We think they are gradually gaining market share as small and medium sized
companies struggle to get financing.
Based on six key metrics, we prefer CRCC (1186 HK) and Gezhouba (600068 CH) among
the eight listed Chinese construction companies in the Hong Kong/China market under our
coverage.
Where is the project funding coming from?
Two major concerns among investors about the policy to increase infrastructure investment are:
(1) the current deleveraging process may hold back project funding availability; and (2) local
governments in China generally have a high level of financial leverage and would not be able to
provide funding. Our discussions with regulators, contractors, and government think tanks
indicate that the central government is likely to play an important role in providing project
funding.
We include research from HSBC’s China Fixed Income Research team on 31 provinces, 297
prefecture level cities, and 1,815 local government financing vehicles (LGFVs) in our
assessment of the local government debt issue. We think that while 35 cities out of the 297
prefecture level cities would be considered as having high financial leverage, a sharp rise in the
number of default is unlikely in China.
In this report we discuss ways in which the central government could increase funding support
to facilitate the increase in infrastructure investment. They include:
1. Increase transfer payments to local governments,
2. Increase the local government project-specific bond issuance programme, and
3. Increase the municipal bond swap quota.
The PPP financing model has been a major source of funding for a variety of public works since
2015. A major regulatory review of the PPP project database and financing structure was
completed in March 2018. Stricter equity financing for PPP projects and rigid monitoring of local
government repayment capability for PPP projects would benefit the major Chinese construction
companies. The Chinese construction industry has a total gross output value of c.RMB22trn per
annum and we expect potential industry consolidation will help major contractors gain market
share in the coming years.
We also think China’s PPP model should shift its focus to projects that generate commercial
returns. This would attract private capital to participate in either greenfield new infrastructure
development projects or invest in existing brownfield projects. This would help achieve the
government’s policy of encouraging private investment and also help local governments to
generate capital by selling their existing infrastructure assets to private enterprises. In our view,
more private involvement broadens the funding sources for local government while at the same
time improving the services provided by local government for residents.
The central government is
increasing leverage while
local governments continue
to deleverage
The PPP model should focus
on commercial returns in
order to attract private capital

EQUITIES ● INDUSTRIALS
November 2018
6
Ranking of Chinese construction companies
Our preferences within the Chinese construction sector is based on six key factors that we
consider to be most relevant for share price performance. From an operational perspective, we
think new contract growth, ROE, and 3-year EPS CAGR are the most important indicators.
From a valuation perspective, we think investors should focus on PBV, PER, and EV/EBITDA.
Based on this ranking exercise, we prefer CRCC (1186 HK) and Gezhouba (600068 CH) among
the eight listed Chinese construction companies in the Hong Kong/China market under our
coverage.
Figure 1: Construction company rankings based on six key factors
Ticker TP
(LC)
Rating FY19e new contract
growth
2019 ROE
3-year EPS
CAGR
FY18e PBV
FY18e
PE
FY18e
EV / EBITDA
Score Rank
CRCC 1186 HK HKD14.9 Buy 4 3 3 3 4 1 18 1 Gezhouba 600068 CH RMB10.5 Buy 1 1 1 6 3 6 18 2 CSCI 3311 HK HKD9.70 Buy 5 4 5 2 1 2 19 3 CSCEC RMB Buy 3 2 8 6 3 4 26 4 CRG 390 HK HKD8.6 Buy 6 5 4 4 5 3 27 5 CCCC 1800 HK HKD9.10 Buy 7 6 6 1 2 5 27 6 MCC RMB Buy 2 7 2 5 7 7 30 7 PCC RMB Buy 1 8 7 6 6 8 36 8
Source: HSBC estimates
Figure 2: Top Buy ideas – beneficiaries from rising infrastructure investment
Analyst Sector Stock Ticker Rating/TP /upside
Investment thesis
Anderson Chow* The Hong Kong and Shanghai Banking
Corporation Limited
Construction CRCC 1186 HK/ 601186 CH
Buy/Buy, HKD14.9/RMB13.3, +42.4%/+20.6%
A major infrastructure contractor that will benefit from increases in infrastructure investment.
Strong balance sheet and positive cash flow will help increase asset turnover and help gain market share in the Chinese construction industry.
Machinery CRRC 1766 HK Buy, HKD8.8 +23.0%
Leveraged to increasing locomotive and freight wagon orders driven by a shift in freight transport from highway to railway by 2020.
Internal restructuring would lower overhead costs and enhance profitability and ROE over the long term.
Howard Lau* The Hong Kong and Shanghai Banking
Corporation Limited
Construction Materials
Anhui Conch
914 HK/ 600585 CH
Buy/Buy, HKD58/RMB53, +35.8%/+55%
Indisputable cost leader of the industry.
GP/ton expansion driven by supply-side control.
Attractive dividend yield of around 6% for 2018e.
Corey Chan* HSBC Qianhai
Securities Limited
Construction Gezhouba 600068 CH Buy/RMB10.50/ +60.8%
Strong earnings growth over 20% p.a. with a 5-year order backlog to revenue ratio.
Rapid expansion in environmental division focus on recycling of solid waste offers long-term upside.
Note: Priced as of 7 November 2018.* Employed by a non-US affiliate of HSBC Securities (USA) Inc, and is not registered/ qualified pursuant to FINRA regulations. Source: HSBC estimates, HSBC Qianhai Securities estimates
Prefer CRCC and Gezhouba

7
EQUITIES ● INDUSTRIALS
November 2018
RMB2trn to stabilise infrastructure investment by the end of 2019e
On 23 July 2018, the Chinese government stated that it would use fiscal policy to support
domestic demand and monetary policy would ensure reasonable liquidity in the financial
system. The following is a summary of the key government policy statements to support the
initiative:
1. The People’s Daily, in an article published on 19 July 2018, it stated that the
deleveraging process had achieved initial results and that China was entering a phase
of stable leverage.
2. On 7 August 2018, China Railway Corporation (private, not rated) stated that it
intended to increase its railway infrastructure investment budget to RMB800bn for
2018, up from the initial budget of RMB732bn. Please see our report, China
Industrials, Rising tide lifts all boats, 7 August 2018.
3. The National Development and Reform Commission (NDRC), China’s key
macroeconomic planning body, announced on 19 September 2018 its intention to
speed up existing infrastructure project execution. The NDRC also stated that the
government will accelerate a batch of significant new project tenders to ensure the
sustainability of investment. This indicates the investment recovery could last well into
2019 and beyond. Please see our report, China Infrastructure, More new projects and
more sustainable investment, 19 September 2018.
4. The PBoC has reduced most of Chinese banks’ reserve requirement ratios (RRR) by
250bp in 2018 y-t-d to help liquidity.
5. The planned RMB1.35trn local government project-specific bond issuance programme
was completed in October 2018 to speed up existing project execution. Most of the
bond issuance happened between July and October as only c.RMB200-300bn was
issued in 1H18.
More sustainable growth
China plans to increase infrastructure investment to stabilise
domestic demand, while continuing to deleverage local governments
and state-owned companies
The seemingly contradictory nature of these policies may produce a
more sustainable investment growth rate than previous stimulus
programmes
We prefer contractors and building materials companies and selected
capital goods manufacturers
Using fiscal policy to
stabilise Chinese domestic
demand

EQUITIES ● INDUSTRIALS
November 2018
8
6. On 1 November 2018, The Ministry of Finance advanced its 2019 budget payment
amounting to RMB227bn to 33 provincial governments to help reduce their financial
burden.
The current policy stance is to stabilise domestic demand rather than to stimulate the economy
as was the case in 2008-10. There has been no official estimate of the meaning of
“stabilisation”. Growth in Chinese infrastructure investment (in a broad sense – transportation,
utilities, and other municipal works) has been negative since May 2018. We finally saw green
shoots emerging in September 2018 where the broad measure of infrastructure investment
declined 2.6% y-o-y, a smaller decline than the -5.4% in August.
Based on our estimate, we think about RMB2trn investment in infrastructure is required between
now and the end of 2019e in order to stabilise the growth rate of infrastructure investment at
around 5%, which is similar to the current FAI growth rate and consistent with HSBC China
Economist’s forecast of FAI growth of 5.4% in 2019e.
Figure 3: c.RMB2trn needed to stabilise infrastructure investment by the end of 2019e
(RMBm) Total infrastructure
investment
y-o-y
growth
Sept 2017 y-t-d infrastructure investment 12,167 Sept 2018 y-t-d infrastructure investment 12,260 0.8% 2017 total investment 16,980 Implied total infra investment (assuming +5.4% growth will be achieved in 2018e) 17,897 5.4% Total incremental infra investment required to achieve +5.4% growth for FY18e is 5,637 17.1%
less: planned investment in 4Q18 (assume similar to 4Q17) 4,800 Estimated increase for infrastructure investment in 4Q18 800 to 1000 Estimated increase in investment in 2019 to maintain +5.4% growth 966 Total increase in infrastructure investment by 2019 1,766 to 1,966
Source: HSBC estimates, Wind
Figure 4: China infrastructure investment trend – green shoots emerging
Source: WIND, HSBC calculations
The current policy is to
stabilise domestic demand
rather than stimulate the
economy as was the case in
2008-10

9
EQUITIES ● INDUSTRIALS
November 2018
Figure 5: China total FAI trend – hovering at around +5%
Source: CEIC, HSBC calculations
Funding infrastructure investment in a deleveraging environment
Many Chinese construction companies and capital goods manufacturers have outperformed the
Hong Kong/China equity market since late July 2018 as illustrated in Figure 6. Building material
suppliers, such as cement companies, have enjoyed strong share price performance since 2017
and some stocks may have seen profit taking in recent months. However, we believe the key
driver for cement stocks in this upcycle is pricing rather than a potential increase in demand. We
expect cement prices in China to rise c.5% in 2019e due to supply coordination among major
regional players. Thus, we think the recent weakness in share price could offer a good buying
opportunity.
At the same time we see more upside for Chinese infrastructure-related companies in the
coming quarters. The most common push back from investors is the concern about project
funding, especially at the local government level. It is not an easy task to finance infrastructure
investment when deleveraging remains in place.
Our recent trips to China included meetings with regulators, government think tanks,
contractors, and capital goods manufacturers. We think it is likely that project funding will come
in the form of greater contribution by the central government. This could be achieved through a
higher transfer of payments to local governments in 2019. These transfers have been one of the
major sources of funding for local governments historically and could play a pivotal role in the
near future. Moreover, an increase in local government project-specific bond issuance in 2019
is also a possibility. We have already seen a similar type of project-specific issuance
programme increased to RMB1.35trn in 2018 from RMB850bn in 2017.
Outperformance by Chinese
contractors and capital
goods companies to continue

EQUITIES ● INDUSTRIALS
November 2018
10
Figure 6: Chinese industrial companies relative price performance vs. HSCEI Index
Company Ticker Relative performance since
19 July 2018
Capital Goods Zhuzhou CRRC Times 3898.HK 2.8% CRRC Corp 1766.HK 17.5% CRRC Corporation-A 601766.SS 17.2% Zoomlion Heavy Industry 1157.HK -8.6% Zoomlion Heavy Industry-A 000157.SZ -11.1% Lonking Holdings 3339.HK -40.6% Weichai Power-A 000338.SZ -7.2% Weichai Power 2338.HK -11.7% Sinotruk 3808.HK -9.5% China Yuchai CYD.N -21.7% Construction CRCC 1186.HK 33.4% CRCC-A 601186.SS 28.9% CCCC 1800.HK 4.2% CCCC-A 601800.SS 12.3% CRG 0390.HK 29.9% CRG-A 601390.SS 6.8% CSCI 3311.HK -29.2% Building Materials Anhui Conch 0914.HK -2.5% Anhui Conch-A 600585.SS 0.1% BBMG 2009.HK -17.6% BBMG Corp-A 601992.SS -1.8% CNBM 3323.HK -16.5% CR Cement 1313.HK 0.8% Asia Cement China 0743.HK 28.4% Taiwan Cement 1101.TW 51.0% Asia Cement 1102.TW -41.7% China Conch Venture 0586.HK -10.6%
Note: Priced as of 7 November 2018. Source: Refinitiv Datastream, HSBC
Figure 7: Breakdown of local government financing source for FY17
Source: Wind, HSBC
41%
29%
29%
1%
General public income
Transfer payment from central govt.
Govt funding income
Income from SOE ownership

11
EQUITIES ● INDUSTRIALS
November 2018
A summary of Chinese local government debt situation
HSBC China Fixed Income Analyst, Helen Huang, published a detailed report, China Onshore
Insights Local Government Debt: the knowns and unknowns, looking at the local government debt
situation, including the financial position of 1,815 LGFVs. While we think there are default risks for
some LGFVs, this should not cause a sharp rise in the default rate. If we combine government and
LGFV debt, we think that 35 cities out of the 297 prefecture level cities would be considered as
having high financial leverage. The conclusion is that the total explicit and implicit debt from local
government amounts to around RMB47trn. The following is an extract from her report that provides
background information on the Chinese local government debt situation.
Managing the debt of local governments and their related entities is one of the most important factors
determining China’s financial stability. Ideally, the market would like to be able to differentiate
between weak and strong local governments in order to manage exposure to the sector. However,
given the limited amount of information available, it is very difficult to do this effectively.
The reason is ‘implicit debt’ – borrowing mainly by LGFVs as opposed to ‘explicit’ debt in the
form of municipal bonds incurred by the local governments themselves. We have discussed this
developing theme in earlier reports (LGFV: Market-driven default mechanism is unrealistic,
China Onshore Insights, 5 July 2018; LGFV bond stand-off: It’s time to reach a compromise,
China Onshore Insights, 19 October 2017).
In a nutshell, an LGFV is a shell company created by a local government for the purpose of
borrowing money from the market and then investing in local infrastructure projects. They were
originally formed because the issuance quota of municipal bonds was very limited and strictly
controlled. LGFVs’ borrowing is booked on their balance sheets, not those of the local
governments. In other words, LGFVs help to enlarge China’s fiscal expansion without inflating
the government deficit, at least not visibly. And the reason why LGFVs can keep borrowing from
the market is that local governments still provide them with what many investors regard as an
implicit guarantee.
This report seeks to narrow the information gap in terms of what is known about the debt levels
of different local governments. We have sifted through debt and revenue data for 31 provinces,
297 prefecture-level cities, and 1,815 LGFVs contained in hundreds of local budget reports and
databases. When necessary, we have also made our own educated guesses. As in previous
reports, we use a Q&A format. A full list of data is provided at the end of the report.
1. How much explicit debt do local governments have?
As of July 2018, local governments’ explicit debt amounted to RMB17.2trn, 97% in the form of
municipal bonds. As Figure 8 shows, the share of municipal bonds in local debt has increased
significantly over the past four years. Some RMB12.7trn of municipal bonds have been issued
between 2015 and 2018 to refinance various other forms of local debt. By doing this, the
government was hoping to thoroughly clean up its implicit debt.
35 out of 297 prefecture cities
have high levels of financial
leverage
The market would like to be
able to differentiate between
weak and strong local
governments
Local government explicit
debt totals RMB17.2trn…

EQUITIES ● INDUSTRIALS
November 2018
12
Figure 8: Local government explicit debt outstanding
Source: Wind, HSBC estimates
This local explicit debt amount is not big – just 20.5% of China’s estimated nominal GDP in
2018e and 76.2% of local governments’ estimated income in 2018e. And the percentage has
dropped significantly over the past four years as the municipal bond swap programme has
progressed, as illustrated in Figures 9 and 10.
Note that there are four parts to local government income (Figure 11): general public income
(mainly from taxes and fees), government fund income (mainly land sales), transfer payments
from central government (Beijing redistributes fiscal or tax revenue among local governments),
and income from local SOEs.
Figure 9: Local government explicit debt as % of GDP
Figure 10: Local government explicit debt as % of local government income
Source: Wind, HSBC estimates Source: Wind, HSBC estimates
-
2,000
4,000
6,000
8,000
10,000
12,000
14,000
16,000
18,000
2013E 2014 2015 2016 2017 2018E
RM
Bbn
Municipal bonds Other forms
19%
20%
21%
22%
23%
24%
25%
2013E 2014 2015 2016 2017 2018E
Local gov debt / GDP
74%
76%
78%
80%
82%
84%
86%
88%
2013E 2014 2015 2016 2017 2018E
Local gov debt / local gov income

13
EQUITIES ● INDUSTRIALS
November 2018
Figure 11: Local government income, broken down by source of income
Source: Wind, HSBC estimates
When we break down the outstanding amount of municipal bonds by province and municipality,
the result is not too alarming either. There are two thresholds of sustainable government debt
referred to by such organisations as the IMF and widely quoted in the China onshore market by
researchers and officials: they are 60% of GDP and 150% of government income. As Figures 5
and 6 illustrate, only Guizhou exceeds both. Many provinces are not even close.
Figure 12: Municipal bonds outstanding as % of GDP (2017)
Source: Wind, Local governments, HSBC
-
5,000
10,000
15,000
20,000
25,000
30,000
2012 2013 2014 2015 2016 2017 2018E
RM
Bbn
General public income Gov fund income Transfer payment from central gov Income from SOE ownership
0%
10%
20%
30%
40%
50%
60%
70%
Gui
zhou
Liao
ning
Inne
r M
ongo
lia
Yun
nan
Hun
an
Sha
anxi
Hai
nan
Nin
gxia
Fuj
ian
Tia
njin
Jilin
Qin
ghai
Sic
huan
Hei
long
jiang
Xin
jiang
Gua
ngxi
Sha
ndon
g
Jian
gsu
Anh
ui
Zhe
jiang
Heb
ei
Hub
ei
Cho
ngqi
ng
Hen
an
Jian
gxi
Gan
su
Sha
nxi
Gua
ngdo
ng
Sha
ngha
i
Bei
jing
Tib
et
Threshold
EQUITIES ● INDUSTRIALS
November 2018
14
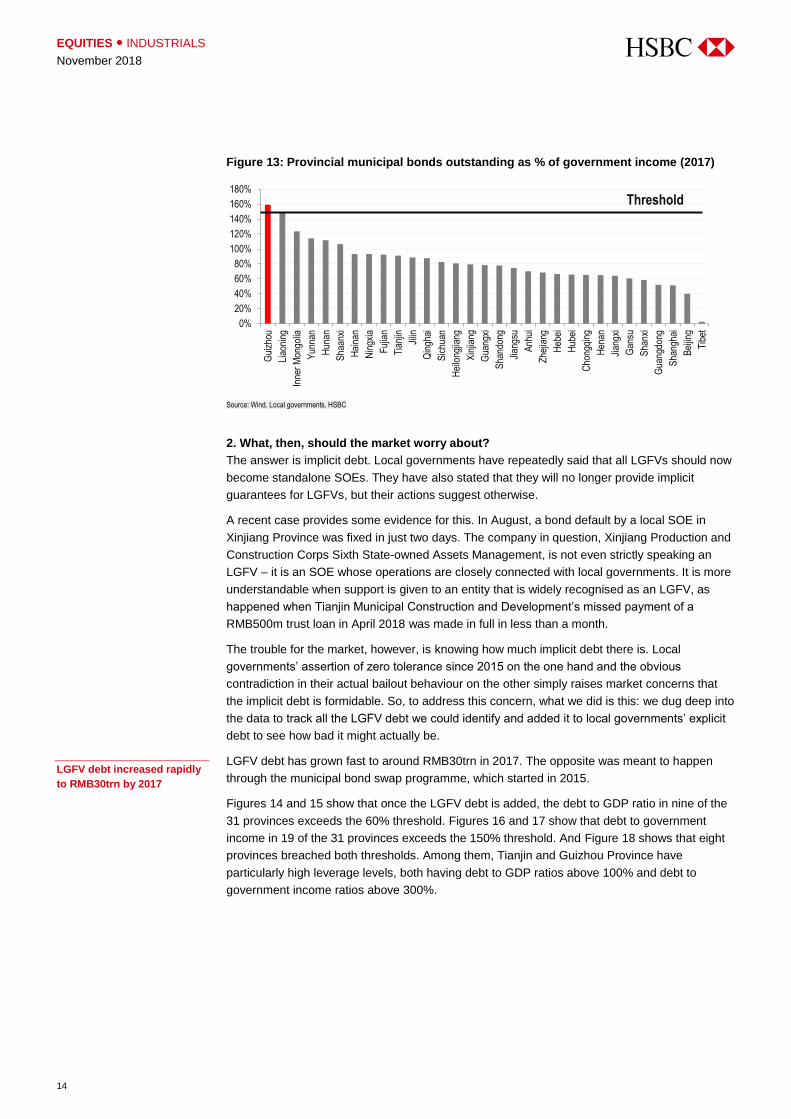
Figure 13: Provincial municipal bonds outstanding as % of government income (2017)
Source: Wind, Local governments, HSBC
2. What, then, should the market worry about?
The answer is implicit debt. Local governments have repeatedly said that all LGFVs should now
become standalone SOEs. They have also stated that they will no longer provide implicit
guarantees for LGFVs, but their actions suggest otherwise.
A recent case provides some evidence for this. In August, a bond default by a local SOE in
Xinjiang Province was fixed in just two days. The company in question, Xinjiang Production and
Construction Corps Sixth State-owned Assets Management, is not even strictly speaking an
LGFV – it is an SOE whose operations are closely connected with local governments. It is more
understandable when support is given to an entity that is widely recognised as an LGFV, as
happened when Tianjin Municipal Construction and Development’s missed payment of a
RMB500m trust loan in April 2018 was made in full in less than a month.
The trouble for the market, however, is knowing how much implicit debt there is. Local
governments’ assertion of zero tolerance since 2015 on the one hand and the obvious
contradiction in their actual bailout behaviour on the other simply raises market concerns that
the implicit debt is formidable. So, to address this concern, what we did is this: we dug deep into
the data to track all the LGFV debt we could identify and added it to local governments’ explicit
debt to see how bad it might actually be.
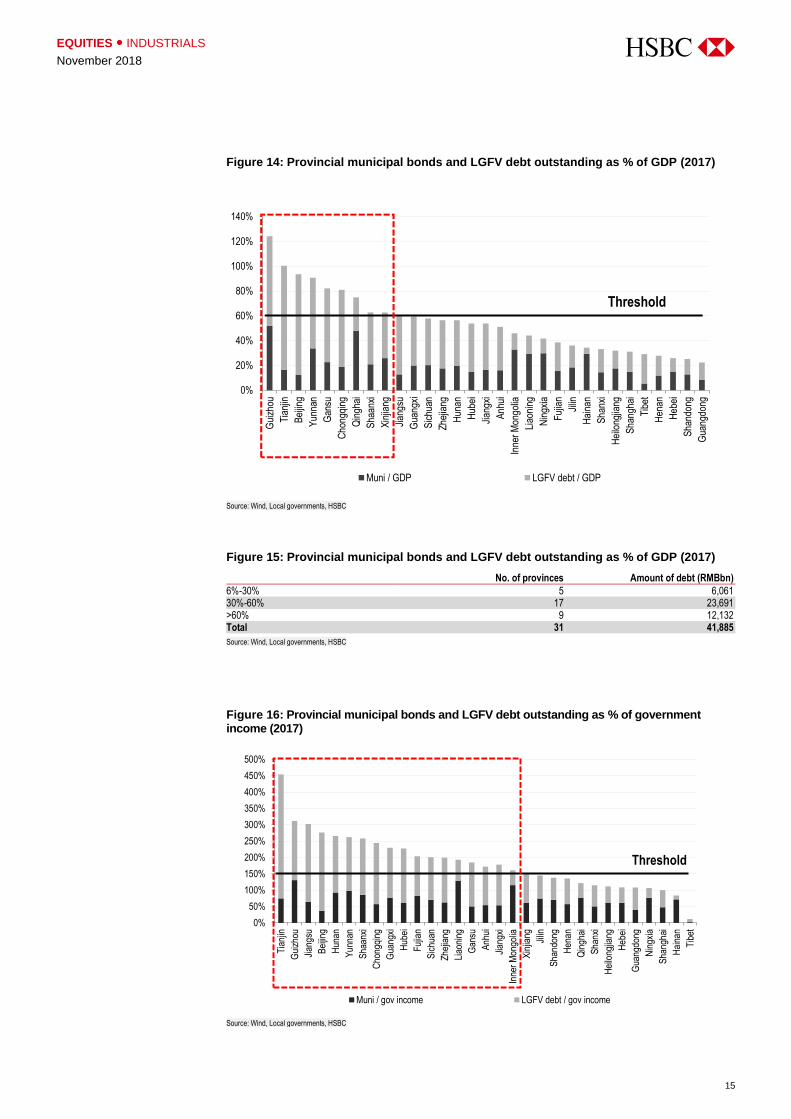
LGFV debt has grown fast to around RMB30trn in 2017. The opposite was meant to happen
through the municipal bond swap programme, which started in 2015.
Figures 14 and 15 show that once the LGFV debt is added, the debt to GDP ratio in nine of the
31 provinces exceeds the 60% threshold. Figures 16 and 17 show that debt to government
income in 19 of the 31 provinces exceeds the 150% threshold. And Figure 18 shows that eight
provinces breached both thresholds. Among them, Tianjin and Guizhou Province have
particularly high leverage levels, both having debt to GDP ratios above 100% and debt to
government income ratios above 300%.
0%
20%
40%
60%
80%
100%
120%
140%
160%
180%
Gui
zhou
Liao
ning
Inne
r M
ongo
lia
Yun
nan
Hun
an
Sha
anxi
Hai
nan
Nin
gxia
Fuj
ian
Tia
njin
Jilin
Qin
ghai
Sic
huan
Hei
long
jiang
Xin
jiang
Gua
ngxi
Sha
ndon
g
Jian
gsu
Anh
ui
Zhe
jiang
Heb
ei
Hub
ei
Cho
ngqi
ng
Hen
an
Jian
gxi
Gan
su
Sha
nxi
Gua
ngdo
ng
Sha
ngha
i
Bei
jing
Tib
et
Threshold
LGFV debt increased rapidly
to RMB30trn by 2017
15
EQUITIES ● INDUSTRIALS
November 2018
Figure 14: Provincial municipal bonds and LGFV debt outstanding as % of GDP (2017)
Source: Wind, Local governments, HSBC
Figure 15: Provincial municipal bonds and LGFV debt outstanding as % of GDP (2017)
No. of provinces Amount of debt (RMBbn)
6%-30% 5 6,061 30%-60% 17 23,691 >60% 9 12,132 Total 31 41,885 Source: Wind, Local governments, HSBC
Figure 16: Provincial municipal bonds and LGFV debt outstanding as % of government income (2017)
Source: Wind, Local governments, HSBC
0%
20%
40%
60%
80%
100%
120%
140%
Gui
zhou
Tia
njin
Bei
jing
Yun
nan
Gan
su
Cho
ngqi
ng
Qin
ghai
Sha
anxi
Xin
jiang
Jian
gsu
Gua
ngxi
Sic
huan
Zhe
jiang
Hun
an
Hub
ei
Jian
gxi
Anh
ui
Inne
r M
ongo
lia
Liao
ning
Nin
gxia
Fuj
ian
Jilin
Hai
nan
Sha
nxi
Hei
long
jiang
Sha
ngha
i
Tib
et
Hen
an
Heb
ei
Sha
ndon
g
Gua
ngdo
ng
Muni / GDP LGFV debt / GDP
Threshold
0%
50%
100%
150%
200%
250%
300%
350%
400%
450%
500%
Tia
njin
Gui
zhou
Jian
gsu
Bei
jing
Hun
an
Yun
nan
Sha
anxi
Cho
ngqi
ng
Gua
ngxi
Hub
ei
Fuj
ian
Sic
huan
Zhe
jiang
Liao
ning
Gan
su
Anh
ui
Jian
gxi
Inne
r M
ongo
lia
Xin
jiang
Jilin
Sha
ndon
g
Hen
an
Qin
ghai
Sha
nxi
Hei
long
jiang
Heb
ei
Gua
ngdo
ng
Nin
gxia
Sha
ngha
i
Hai
nan
Tib
et
Muni / gov income LGFV debt / gov income
Threshold

EQUITIES ● INDUSTRIALS
November 2018
16
Figure 17: Provincial municipal bonds and LGFV debt outstanding as % of government income (2017)
No. of provinces Amount of debt (RMBbn)
30%-100% 2 192 100%-150% 10 8,867 >150% 19 32,826 Total 31 41,885
Source: Wind, Local governments, HSBC
Figure 18: Provincial government debt level (2017)
Source: Wind, Local governments, HSBC
Current government debt policies essentially rely on a limited explicit debt swap quota and various
government bailouts to maintain both an artificially low explicit debt level and a low default rate.
However, there is no free lunch. In our view, one consequence of this strategy is that the
government will gradually move towards fiscal austerity, i.e. using cash flow to pay back debt.
This year, government income (central plus local, including both general public and government
fund income) grew 14% y-o-y as of August, when nominal GDP grew 10% y-o-y as of the first
half (Figure 19).
An official from the PBoC wrote an article in July this year criticising slow fiscal spending and an
over-dependence on monetary policy to support economic growth (source: Fiscal policy has
much bigger room/当前形势下财政政策大有可为, Xu Zhong, Head of Research Department,
PBoC, 13 July 2018). We believe it is a fair criticism, but local governments have to preserve
more cash to prepare for future debt repayment obligations. Also, LGFVs, rather than local
treasuries, are the main drivers of infrastructure investment. Figure 20 shows that the 1,815
Tianjin
GuizhouJiangsu
BeijingHunanYunnanShaanxi
ChongqingGuangxi
Hubei
FujianSichuan
Zhejiang
Liaoning Gansu
AnhuiJiangxi
Inner Mongolia XinjiangJilinShandong Henan
QinghaiShanxi
HeilongjiangHebei
Guangdong Ningxia
ShanghaiHainan
Tibet0%
50%
100%
150%
200%
250%
300%
350%
400%
450%
500%
0% 20% 40% 60% 80% 100% 120% 140%
(Gov + LGFV debt) / GDP, 2017
(Go
v +
LGF
V d
ebt)
/ Go
v in
com
e, 2
017
Most leveraged:8 provinces
Least leveraged:11 provinces

17
EQUITIES ● INDUSTRIALS
November 2018
LGFVs invested around RMB3trn per year between 2015 and 2017, much more than the net
municipal project bond issuance quota, which officially is the main funding channel for local
fiscal investment in infrastructures. Now these LGFVs are supposed to wind down, according to
current government policies – so no wonder local infrastructure investment is slowing down.
Figure 19: Nominal GDP and government income, growth y-o-y
Source: Wind, HSBC
Figure 20: Explicit and implicit fiscal spending budget in local infrastructure
Source: Wind, Central government, HSBC
PPP focus should shift towards commercial projects
Public-private partnerships (PPPs) have been an important source of Chinese infrastructure
project funding since 2014. During 2017, the government embarked on a major review of project
structure, financing arrangements, and local government fiscal capability to ensure PPP project
financing would be sustainable over the long term. The review of the PPP project database at
the Ministry of Finance was completed in March 2018; however, reviews or restructuring of
existing PPP projects appears to be ongoing at the local government level.
At the end of June 2018, Ministry of Finance’s PPP project database had RMB11.9trn worth of
projects in the approved database (i.e. under active management process, 管理库) and about
RMB5.4trn worth of projects in the reserves database (i.e. awaiting formal approval,储备库).
-10%
-5%
0%
5%
10%
15%
20%
Mar2013
Jul2013
Nov2013
Mar2014
Jul2014
Nov2014
Mar2015
Jul2015
Nov2015
Mar2016
Jul2016
Nov2016
Mar2017
Jul2017
Nov2017
Mar2018
Jul2018
Growth YoY, nominal GDP Growth YoY, Gov income (general public income + gov fund income)
-
500
1,000
1,500
2,000
2,500
3,000
3,500
2015 2016 2017 2018
RM
Bb
n
LGFV investing cash flow Muni net issuance quota, project bonds

EQUITIES ● INDUSTRIALS
November 2018
18
The small decline in March and April 2018 in the database was a result of the project database
review.
We think there will be further potential amendments to the PPP regulations over the next 6 to 12
months. These potential changes could impact new PPP projects and private participation. We
think two potential changes may be more impactful from equity investors’ perspective:
1. Linking the local government debt level to the 10% fiscal account threshold in
determining whether a local government could propose additional new PPP projects.
Currently no local government can allocate more than 10% of their annual fiscal
revenue to finance PPP projects (including initial investment in PPP projects,
repayment or government subsidies of PPP projects). In order to ensure local
government debt remains under control, we think the Ministry of Finance is likely to
impose restrictions on the balance sheet of all local governments along with the
existing threshold on government revenue. This should lower credit risk of PPP
projects, however, it could slow down new PPP project inflows.
2. Private participation in PPP projects remains low and the NDRC has been stressing
the importance of getting the private sector involved in infrastructure investment.
Currently only c.9% of PPP projects are using the user-pay system to generate
repayment or project returns. Almost 63% of PPP projects rely on a mix of government
subsidies and user pay. We think a shift towards more user-pay systems for PPP
projects could encourage private sector participation. This should also include putting
up existing or brownfield assets or services as PPP projects to attract private sector
investment. Other regulatory changes may be required to improve the transparency on
project returns, such as the pending revision to Expressway Management Ordinance.
Figure 22: PPP by payment method (2Q18) Figure 23: PPP by type of project (2Q18)
Source: Ministry of Finance PPP Center Source: Ministry of Finance PPP Center
User pay9%
Government subsidy and user …
Goverment pay29%
Municipal projects
31%
Transport infra29%
Land development
13%
Others27%
Figure 21: Total MOF PPP approved project database
(RMBbn) Dec-17 Jan-18 Feb-18 Mar-18 Apr-18 May-18 Jun-18
Total 10,760 11,350 11,960 11,560 11,390 11,880 11,900
Project in 准备阶段 preparatory stage 2,860 2,730 2,880 2,650 2,470 2,650 2,570
Project in 采购阶段 procurement stage 3,300 3,720 3,710 3,400 3,260 3,360 3,330
Project in 执行阶段 execution stage 4,600 4,900 5,370 5,510 5,660 5,870 6,000
Proportion of projects under execution 42.8% 43.2% 44.9% 47.7% 49.7% 49.4% 50.4%
Source: Ministry of Finance PPP Center

19
EQUITIES ● INDUSTRIALS
November 2018
Chinese construction industry consolidation
As at the end of 2017, there were 88,059 construction companies in China. It has always been
a fragmented industry with a total gross output value of RMB21.4trn in 2017. The three major
Chinese infrastructure contractors listed in Hong Kong (CRCC, CRG, and CCCC) only had
about a combined 7% market share in 2017. This compares to a 10.8% market share back in
2010.
Major contractors lost market share after the 2008-10 fiscal stimulus. Small and medium-sized
contractors, either private or controlled by local government and LGFVs, gained market share
as investment-related projects became more important than cash construction projects. Also,
shadow banking products were helping project financing for many smaller players. The de-
leveraging process and tightening of PPP regulations meant the small and medium-sized
contractors found it increasingly difficult to secure financing. Since April 2018 wealth
management and trust products have not been allowed to participate in PPP project equity
funding. We believe this was a key negative for the smaller players.
Based on our current revenue forecast, we expect the major infrastructure contractors to
gradually increase their market share up to 2020. Their financial position has improved in recent
years, with lower financial leverage and operating cash flows expected to be positive in the
coming years. The three major infrastructure contractors combined should see market share
increase from 7% in 2017 to 8% in 2020e.
Not only would revenue growth from the major contractors outpace industry growth (i.e.
infrastructure investment growth), we think more rational competition for projects could also help
profitability for the construction sector in general.
Figure 24: Construction companies' market share to increase going forward
Source: CEIC, Company data, HSBC estimates
Major Chinese contractors in much better financial positions than 2011
Financial leverage ratios for the construction companies under our coverage are under control.
Net debt to equity reached a low point for CRCC, CRG, and CCCC at the end of 2017
compared to 2011, the year after the fiscal stimulus was completed. Seasonality in 1H18 and
initial investment into PPP projects led to increasing leverage for construction companies in
2.6%3.1%
2.7%
3.1%
1.6% 1.8%
0.0%
0.5%
1.0%
1.5%
2.0%
2.5%
3.0%
3.5%
4.0%
4.5%
5.0%
0
5,000,000
10,000,000
15,000,000
20,000,000
25,000,000
30,000,000
2008 2009 2010 2011 2012 2013 2014 2015 2016 2017 2018e 2019e 2020e
Construction companies market share (%)
Total gross output value of construction (Rmb m)
Total Gross Output Value of Construction 1186.HK 390.HK 1800.HK 601668.SS
The three major
infrastructure contractors
should see market share
increase from 7% in 2017 to
8% in 2020e

EQUITIES ● INDUSTRIALS
November 2018
20
1H18. However, we expect financial leverage at the end of 2018 to be similar or an
improvement on 2017’s. This should be driven by project repayments in 2H18 and faster project
execution from improvements in funding. A stronger balance sheet is important in this capital
intensive sector. It would also facilitate project execution and bidding for new contracts. This
supports our view that major contractors will gain market share from non-listed contractors.
Figure 25: Healthy net debt/equity ratios for all companies
Source: Company data, HSBC estimates
Big enough backlog and execution improving
The construction companies’ order backlog has grown over the past few years as new contract
growth was strong and execution could not keep up with the new order inflow. For example, the
Chinese construction sector over the past two years has seen very strong 20-30% new contract
growth, while revenue growth was only in single digits.
Figure 26: Order backlog/revenue ratio
Company 2008a 2009a 2010a 2011a 2012a 2013a 2014a 2015a 2016a 2017a 2018e 2019e 2020e
CRCC 2.1x 2.0x 2.1x 2.6x 3.1x 3.0x 3.0x 3.0x 3.1x 3.5x 4.3x 4.7x 5.0x CRG 1.9x 2.1x 2.2x 2.6x 3.2x 3.6x 3.3x 3.2x 3.5x 4.0x 4.9x 5.5x 6.0x CSCI 2.0x 2.3x 2.7x 3.1x 2.9x 3.1x 2.9x 3.3x 3.3x 3.7x 4.5x 4.7x 4.7x CCCC 1.9x 1.9x 1.9x 2.0x 2.4x 2.2x 2.2x 2.1x 2.7x 3.0x 3.3x 3.5x 3.6x
Source: Company data, HSBC estimates
We see this backlog build up as a double-edged sword. We would prefer to see the ratio go
down to the historical levels of between 2x and 3x from the current 3-4x. Having said that, we
continue to believe that the order books of these construction companies are healthy. We think
sector revenue and earnings growth will soon start to be in sync with new contract growth. This
will be due to a combination of improvement in project execution and a deceleration in the new
contract growth rate to low single digits or flat growth in 2019e and 2020e.
Valuation yet to build in a positive scenario
The massive de-rating that we have seen in construction companies over the past few quarters
means that the companies are trading at either close to or even below their 2011 levels. Back
then, most railway construction projects were suspended and the number of new contracts
shrank after the fatal accident on the Yongtaiwen high-speed-rail line in July 2011.
We think the current situation today is very different and believe current projects under
construction and those with confirmed project funding will continue to move forward. We believe
the construction companies in our coverage trade at attractive valuations based on a number of
different metrics – forward PE, forward EV/EBITDA, and EV/order backlog.
9%
44%
5%
93%
54%
25%
87%
102%
68%
8%
62%
41%
-40%
-20%
0%
20%
40%
60%
80%
100%
120%
140%
2011A 2012A 2013A 2014A 2015A 2016A 2017A 1H18 2018E
CRCC CRG CCCC CSCI

21
EQUITIES ● INDUSTRIALS
November 2018
Figure 27: EV/order backlog
Source: Company data, Refinitiv Datastream, HSBC estimates
Improving profitability trend
Profitability has improved over the past three years (especially net profit margins) as the construction
companies have benefited from operating leverage, a higher proportion of PPP projects and, most
importantly, diversifying away to non-infrastructure businesses such as real estate.
Figure 28: Construction company profitability improvement to continue
FY15a FY16a FY17a FY18e FY19e FY20e
CRCC (1186 HK) GP 11.5% 9.2% 9.2% 9.1% 9.0% 8.9% EBIT 3.6% 3.4% 3.5% 3.8% 4.3% 4.2% NPAT 2.2% 2.4% 2.5% 2.7% 3.1% 3.0% CRG (390 HK) GP 8.1% 7.9% 9.1% 9.7% 9.7% 9.6% EBIT 3.3% 3.4% 3.2% 4.4% 4.7% 4.9% NPAT 2.0% 2.0% 2.1% 2.7% 2.9% 3.1% CCCC (1800 HK) GP 12.3% 13.4% 13.1% 13.3% 13.5% 13.6% EBIT 6.4% 7.2% 6.9% 6.8% 7.0% 7.2% NPAT 3.9% 4.4% 4.7% 4.0% 4.1% 4.5% CSCI (3311 HK) GP 13.5% 12.9% 15.2% 14.6% 14.5% 14.4% EBIT 13.3% 13.0% 13.5% 12.9% 12.8% 12.9% NPAT 11.4% 11.2% 10.9% 9.8% 9.9% 10.1%
Source: Company data, HSBC estimates
For CRCC, the infrastructure construction business used to contribute the bulk of both revenue
and operating profit (c.90% of FY09 revenues and 63% of FY09 PBT). However, over the years
higher-margin and fast-growing businesses like real estate have accounted for an increasing
share of profitability. As a result, while infrastructure construction still generates the bulk of
revenues (c.82% in FY17), it accounts for only 49.3% of the FY17 PBT.
CRCC wants to continue to focus on its high-margin real estate property development business
– 6% of FY17 revenues but c.16% of FY17 PBT – and grow the share of revenue to between
10% and 15% in FY18e. Company management wants to continue to focus on tier 2 and tier 3
cities as these offer fast asset turnover opportunities as opposed to tier 1 cities where
developers are often required to operate rental property.
0.05 0.05
0.12 0.06
0.25 0.20
0.42
0.32
-
0.10
0.20
0.30
0.40
0.50
0.60
0.70
0.80
2011A 2012A 2013A 2014A 2015A 2016A 2017A 2018E
CRCC CRG CCCC CSCI

EQUITIES ● INDUSTRIALS
November 2018
22
ESG matters for the Chinese construction industry
Carbon dioxide reduction of Chinese construction companies
Chinese construction companies under our coverage – CRCC, CCCC, CRG, and CSCI –
consume c87,575 million Kwh per annum. Figure 29 shows the energy consumption trend in
2016 and 2017. Apart from CRCC, which maintained its energy intensity, the other three
contractors have reduced their energy consumption.
Figure 29: Construction companies energy usage (in million Kwh)
Source: Company data, HSBC
All four companies have a CO2 reduction policy and reduced their combined energy usage in
2017 by 4.2% over 2016. Similarly, CRG, CCCC, and CSCI have collectively reduced their
combined GHG emissions by about 10.3% in 2017 to 18,422 million KG.
Figure 30: GHG emission (in million KG)
Source: Company data, HSBC
Increase pre-fabrication to enhance precision and save on building materials
The Chinese government is encouraging companies to change their method of construction
from labour intensive to prefabrication. The target is for c30% of all construction projects to use
pre-fabrication in 10 years compared with around 5% in 2017. This could reduce building
material waste and increase construction efficiency (i.e. higher precision rate and less repetitive
work done by humans).
-
5,000
10,000
15,000
20,000
25,000
30,000
35,000
40,000
45,000
50,000
CRCC CCCC CRG CSCI
2016 2017
-
2,000
4,000
6,000
8,000
10,000
12,000
14,000
CCCC CRG CSCI
2016 2017
Construction companies
have been reducing energy
consumption
Greenhouse gas emissions
are also falling
Increase pre-fabrication from
5% in 2017 to 30% in 10 years

23
EQUITIES ● INDUSTRIALS
November 2018
Pre-fabrication is commonly used in developed countries. Factories manufacture standardised
building parts, such as window frames, kitchens and toilets, on a modular basis with a high level
of precision. Rising labour cost is a key reason behind the increased use of prefabrication in
overseas markets. A similar trend in China in recent years is likely to increase the use of
prefabrication in more affluent cities. The government will focus on the Pearl River Delta,
Yangtze River Delta, and Beijing-Tianjin-Hebei Economic zone, and also cities with populations
over 3 million. The increased use of prefabrication should save construction costs through lower
wage bills and better management of building materials.
Other long-term ESG trends – smart buildings
The NDRC and Ministry of Housing and Urban Renewal and Development announced a Green
Building Action Plan in 2013 to improve the energy efficiency of existing and new buildings.
Green building initiatives could reduce the power consumption required for climate control of
buildings. Increasing wages and a decreasing payback period for the adoption of automation
and robots, especially in manufacturing, has the potential to replace humans on a major scale.
We see smart buildings with a higher technology content as a global trend and China is moving
in a similar direction.
According to Edward Perry, Michael Hagmann, and Puneet Garg in their report Building
Technology – Smart Buildings The Key to Future Growth, 2 October 2018, a wide range of
industries could benefit from smart buildings. They range from cement admixtures to high-rise
elevators, where building technology companies design and manufacture products which
enhance the performance of buildings.
Building automation: Rapid growth in the Internet of Things and cloud computing has led
to the delivery of intelligent systems at a lower cost to traditional platforms. Whilst older
systems were previously too expensive for small/medium-sized buildings, which constitute
c.90% of total building stock, new technology has made building automation an economic
reality for almost all buildings.
Schneider Electric (SU FP, Buy, EUR64.82, TP EUR88) estimates that buildings currently
represent 40% of global energy demand, and that 30% of energy used in buildings is
wasted due to inefficient management systems. Greater environmental awareness and
policy are also driving investment in smarter buildings, which – as a result of being more
energy efficient – are almost always greener buildings. Smarter buildings using less energy
are highlighted as a policy option for making cities more efficient.
Smart buildings are the
future trend in China and
globally

EQUITIES ● INDUSTRIALS
November 2018
24
Key definitions for smart buildings
Building technology: Ranging from cement adhesives to high-rise elevators, building
technology companies design and manufacture products that enhance the performance of
buildings. Within building technology, we cover the sub-segments of elevators, low-voltage
equipment, building products, engineering software, and access controls. We also cover the
system integrators, or rather those who sell entire automation systems, which include companies
with diversified portfolios such as Siemens and Schneider. Building technology companies are
typically high-margin and have relatively low capital requirements, leading to strong returns on
investment. Barriers to entry are often high, growth is solid, and pricing power is significant. For
these reasons, the segment often trades at a significant premium to the broader capital goods
sector.
Smart buildings: Smart buildings connect systems and components across areas
including access control, lighting and heating to reduce energy consumption and optimise
building performance. Smart buildings are becoming an increasingly important theme within
the sector, and a fundamental driver of top-line growth. For more detail on the development,
mechanics, and economics of smart buildings please see our sector thematic Smart
Buildings and the IoT 27 March 2018. Smart buildings and improved building energy
efficiency are a key component of smart cities, which we cover in greater depth in the
thematic report The future of cities, 19 September 2018.

25
EQUITIES ● INDUSTRIALS
November 2018
Chinese construction companies
Earnings and cash flow improvement in 2018
The RMB1.35trn project-specific bonds issued by local governments so far in FY18 will mostly
be used to speed up existing projects. Operating cash flows for construction companies will
improve in 2H18 leading to a move into positive territory for FY18 for most contractors.
However, the bulk of these repayments will experience a lag after the recent liquidity
improvement and they will likely come in 4Q18, so 3Q18 operating cash flows might remain
subdued. Faster execution of existing projects would support both economic growth and
increase asset turnover for the companies, resulting in better return ratios.
Figure 31: 1H18 results summary and forecasts
(RMBm) 1H18a 2H18e FY18e FY19e FY20e
CRCC
Rev 308,981 431,203 740,184 817,140 893,456 GP 29,956 37,418 67,374 73,725 79,519 EBIT 13,352 15,098 28,451 35,130 37,888 NPAT 8,009 10,924 18,933 23,682 25,160
y-o-y growth 22.8% 14.6% 17.9% 25.1% 6.2%
CRG
Rev 316,102 434,335 750,437 827,898 891,331 GP 31,132 41,773 72,905 80,067 86,010 EBIT 13,999 19,275 33,274 38,826 43,629 NPAT 9,552 10,081 19,633 23,301 26,287
y-o-y growth 23.9% 20.6% 22.2% 18.7% 12.8%
CCCC
Rev 207,586 306,808 514,394 556,277 605,112 GP 27,859 40,548 68,407 74,936 82,471 EBIT 15,041 20,004 35,045 38,736 43,435 NPAT 7,389 11,332 18,721 21,124 25,125
y-o-y growth 5.6% 25.5% 10.8% 12.8% 18.9%
CSCI
Rev 27,106 30,322 57,428 67,265 77,805 GP 4,105 4,262 8,367 9,725 11,242 EBIT 3,653 3,736 7,388 8,629 10,040 NPAT 2,522 3,104 5,626 6,635 7,831
y-o-y growth 20.6% 5.1% 11.5% 17.9% 18.0%
Source: Company data, HSBC estimates
Outlook for companies
Better project execution should help earnings in 2018, while new
contract growth should improve in 2019
Upstream demand to hold up for construction machinery and building
materials; emission upgrade will also help machinery sales
Plan to increase railway freight will benefit rail equipment demand
more than an increase in investment over the next 12 months
Operating cash flows for
construction companies will
improve in 2H18

EQUITIES ● INDUSTRIALS
November 2018
26
Potential upside for new contract growth in 2019
We think the current policy to increase infrastructure investment is different from the stimulus we
saw back in 2008-10 or 2014-15. New projects are still proceeding in an orderly fashion. The
requirement to complete survey and design, project approval, and financing arrangement
means we may only start to see a positive impact on new contract flows in 1H19. Following the
review of the PPP project database and likely further refinements in PPP regulations, all major
contractors have slowed down the intake of new PPP projects during 2018. Most prefer to focus
on traditional engineering-procurement-construction contracts instead of PPP or investment
projects.
We also think the de-leveraging process for local governments is likely to continue and central
government is likely to increase project funding directly for infrastructure development.
Figure 32: New contract summary table
(RMBm) Sep-18 FY18e FY19e FY20e
CRCC 891,657 1,603,182 1,630,883 1,655,115 y-o-y growth 5.3% 6.3% 1.7% 1.5%
CRG 951,300 1,629,868 1,631,056 1,635,901 y-o-y growth 5.9% 4.7% 0.1% 0.3%
CCCC 154,038 856,591 834,673 847,322 y-o-y growth -16.9% -4.8% -2.6% 1.5%
CSCI* 90,430 120,782 121,053 120,678 y-o-y growth 11.6% 17.1% 0.2% -0.3%
Source: Company data, HSBC estimates
Capital goods – demand to hold up in 2019
Strong infrastructure should offset property construction slow down: The property
construction market has been quite good during 2018. New starts and the land area purchased
by developers both grew 16% y-t-d to September. However, the best leading indicator is
property transaction volumes, which showed a 3% decline in September and property prices
appear to have weakened during 2H18. We think the property construction activity outlook in
2019 could face downward pressure. The pick-up in infrastructure investment should be able to
offset any weakness in property construction activity.
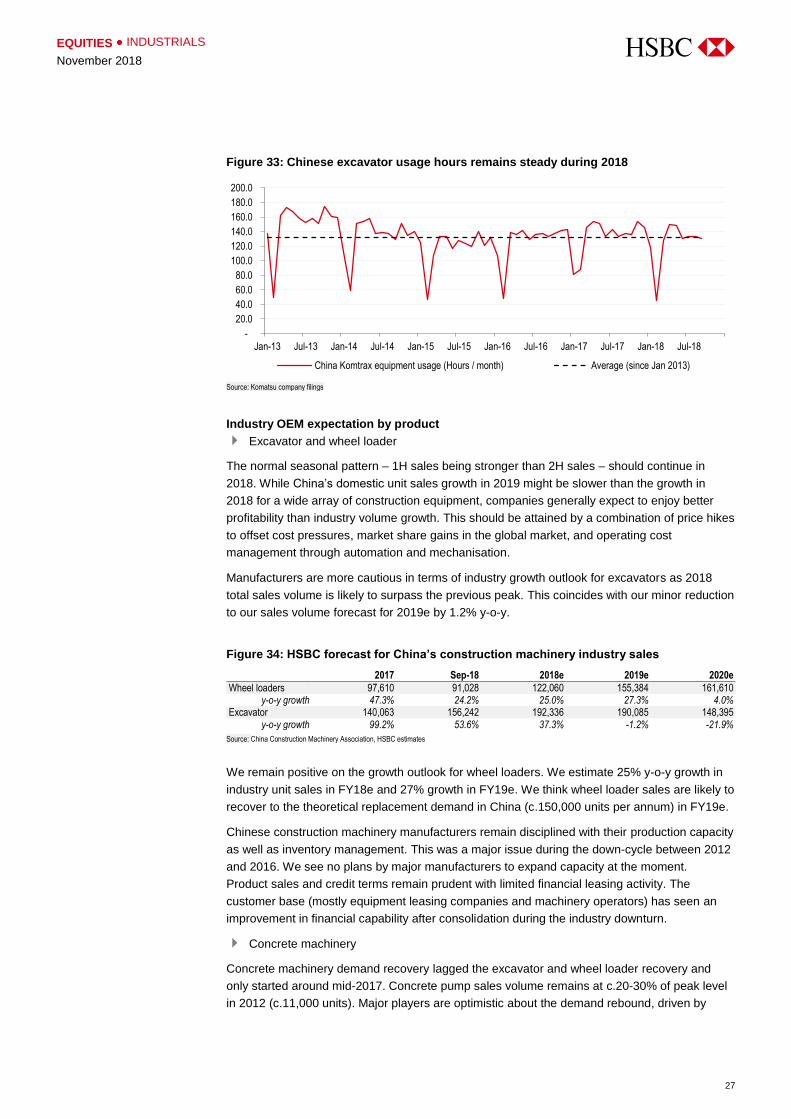
Chinese excavator usage hours remained stable during 2018 at above 130 hours per month.
This is in line with the last 5-year average of c.132 hours, according to the Komtrax data
provided by Komatsu (6301 JP, not rated). In theory, usage hours above 110 hours per month
should result in new demand for excavators or an expansion of the installed base, assuming no
change in the number of idle machines among the installed base.
27
EQUITIES ● INDUSTRIALS
November 2018
Figure 33: Chinese excavator usage hours remains steady during 2018
Source: Komatsu company filings
Industry OEM expectation by product
Excavator and wheel loader
The normal seasonal pattern – 1H sales being stronger than 2H sales – should continue in
2018. While China’s domestic unit sales growth in 2019 might be slower than the growth in
2018 for a wide array of construction equipment, companies generally expect to enjoy better
profitability than industry volume growth. This should be attained by a combination of price hikes
to offset cost pressures, market share gains in the global market, and operating cost
management through automation and mechanisation.
Manufacturers are more cautious in terms of industry growth outlook for excavators as 2018
total sales volume is likely to surpass the previous peak. This coincides with our minor reduction
to our sales volume forecast for 2019e by 1.2% y-o-y.
Figure 34: HSBC forecast for China’s construction machinery industry sales
2017 Sep-18 2018e 2019e 2020e
Wheel loaders 97,610 91,028 122,060 155,384 161,610 y-o-y growth 47.3% 24.2% 25.0% 27.3% 4.0%
Excavator 140,063 156,242 192,336 190,085 148,395 y-o-y growth 99.2% 53.6% 37.3% -1.2% -21.9%
Source: China Construction Machinery Association, HSBC estimates
We remain positive on the growth outlook for wheel loaders. We estimate 25% y-o-y growth in
industry unit sales in FY18e and 27% growth in FY19e. We think wheel loader sales are likely to
recover to the theoretical replacement demand in China (c.150,000 units per annum) in FY19e.
Chinese construction machinery manufacturers remain disciplined with their production capacity
as well as inventory management. This was a major issue during the down-cycle between 2012
and 2016. We see no plans by major manufacturers to expand capacity at the moment.
Product sales and credit terms remain prudent with limited financial leasing activity. The
customer base (mostly equipment leasing companies and machinery operators) has seen an
improvement in financial capability after consolidation during the industry downturn.
Concrete machinery
Concrete machinery demand recovery lagged the excavator and wheel loader recovery and
only started around mid-2017. Concrete pump sales volume remains at c.20-30% of peak level
in 2012 (c.11,000 units). Major players are optimistic about the demand rebound, driven by
-
20.0
40.0
60.0
80.0
100.0
120.0
140.0
160.0
180.0
200.0
Jan-13 Jul-13 Jan-14 Jul-14 Jan-15 Jul-15 Jan-16 Jul-16 Jan-17 Jul-17 Jan-18 Jul-18
China Komtrax equipment usage (Hours / month) Average (since Jan 2013)

EQUITIES ● INDUSTRIALS
November 2018
28
replacement demand and emission standards upgrade. However, it is more likely to reach
around 70% of the peak level due to the historical over-supply situation.
Truck crane
Truck crane and crawler crane enjoyed strong sales rebound in 2017 and 2018. The sales
volume has returned to around 80% of the previous peak level and industry players expect
sales growth to slow in 2019, instead of seeing 50-100% sales volume growth during 2018.
Figure 35: ROE vs. PB for 2018e chart for China capital goods and construction companies
Note: Bubble sizes represents the ROE of the company. Source: HSBC estimates
Positive outlook for rail equipment demand
CRRC Corp (1766 HK)
Upcoming strong rail freight will drive equipment demand: CRCC is optimistic about the
policy to shift more transport from road to rail. It is not only China Railway Corporation’s or
CRC’s (private, not rated) target to increase freight volume by 30% over the next three years but
also part of the national strategy for a modern transportation upgrade over the long term. CRRC
Qiqihar is focusing on new product R&D including: (1) heavy loading for commodity goods and
(2) fast delivery and non-commodity transportation – e.g. cold-chain, container, and car
transportation. The commodity goods shift from road to rail will be key over the next three years
due to environmental concerns.
In the future, modern integrated transportation, including high speed rail delivery, rail+truck and
rail+ship models, should drive rail freight efficiency improvements. These models will also aid
non-commodity transport volume growth, although the process will be gradual as it takes time
for equipment upgrades and investment in network facilities. CRCC management believes the
next 3-5 years will be the golden period for rail freight and expects wagon (and locomotive)
tenders to hit a historical high.
No price cut on standard MU: CRCC reiterated that there is no price cut on standard MU
(multiple units, high speed passenger train) 350km/h unit due to an agreement with CRC last
year. If there is a price cut, CRRC will transfer the price pressure to component providers,
including external and internal providers. According to CRC, the MU demand in 2018-20 should
be 900 sets at least – 500 sets are 350km/h and 400 sets 250km/h. As CRC has tendered 372
sets of 350km/h MU in 2018, the upcoming tender may see more 250km/h sets. CRCC still
thinks there is potential demand for more than 900 MUs over the coming years and high-grade
MU maintenance demand may help revenue from the high-speed or MU business remain
stable.
Zoomlion
Zhuzhou CRRC
CRRC Corp
Lonking
Weichai PowerCSCI
CRCC
CCCC
CRG
Sinotruk
China Yuchai0.00
0.50
1.00
1.50
2.00
2.50
3.00
0 2 4 6 8 10 12 14 16 18 20 22 24
Chinese industrials PB/ROE chart
ROE(%)
P/B (x)

29
EQUITIES ● INDUSTRIALS
November 2018
Zhuzhou CRRC (3898 HK)
At the 2Q18 post-results briefing in August 2018, company management was cautiously
optimistic that new orders for locomotives would improve over the coming months as the
government encourages the shift of commodity transport from the highway to the railway in the
coming years.
Figure 35: Zhuzhou CRRC FY18e revenue breakdown
Source: HSBC estimates
Valuation and Risks
CRCC H-shares (1186 HK, HKD10.46, Buy, TP HKD14.90)
We value the stock using a PE method using the following formula:
Target PE = ROE - g/ROE * (Cost of Equity - g)
Where: FY18e ROE is 12.3%, g is 0%, and cost of equity is 10.5%. Our risk free rate is 3.0%
and equity risk premium is 5.0%, in line with our HSBC global strategy recommendations. Our
Equity Beta is 1.5 as we think CRCC’s business could remain volatile based on the policy
directives of China’s central government.
We derive a target PE of 9.5x, which we apply to our FY18e EPS estimate of RMB1.39
(unchanged) and use a 4Q18 RMB-HKD exchange rate of 1.12 to derive our target price of
HKD14.90. The H-share has traded at an average forward PE 10.7x since listing, which
continues to be at a premium to our fair value target multiple of 9.5x. We think the company
offers a healthy earnings growth outlook at 18% in 2018e and 17% CAGR from 2017-20e with a
dividend yield of c4%. Our H-share TP of HKD14.90 implies 42.4% upside from current levels;
accordingly, we rate the stock Buy.
Key downside risks: Potential slower-than-expected construction project progress; potential
lower-than-expected PPP project returns; volatility in profit margins; and overseas construction
project risks.
CRCC A-shares (601186 CH, RMB11.03, Buy, TP RMB13.30)
We value CRCC’s A-shares at the same target PE multiple of 9.5x as the H-shares as
described above. Applying this target multiple to our FY18e EPS forecast of RMB1.39 per
share, we derive a fair value target price of RMB13.30. Our A-share TP of RMB13.30 implies
20.6% upside from current levels. We maintain our Buy rating on the stock because the
18%
23%
17%4%
20%
18%
Locomotive
EMU
Metro
Safety
Maintenance
Eletrical component

EQUITIES ● INDUSTRIALS
November 2018
30
company is likely to continue to benefit from the pro-investment policy stance taken by the
government.
Key downside risks: Potential slower-than-expected construction project progress; potential
lower-than-expected PPP project returns; volatility in profit margins; and overseas construction
project risks.
CRG H-shares (390 HK, HKD7.58, Buy, TP HKD8.60)
We value the stock using a PE method using the following formula:
Target PE = ROE - g/ROE * (Cost of Equity - g)
Where: FY18e ROE is 11.4%, g is 0%, and cost of equity is 9.5%. Our risk-free rate is 3.0% and
equity risk premium is 5.0%, in line with our HSBC global strategy recommendations. Our equity
beta is 1.5 as we think CRG’s business could remain volatile based on the policy directives of
China’s central government.
We derive a target PE of 9.5x, which we apply to our FY18e EPS estimate of RMB0.80
(unchanged) and use an end-2018 RMB-HKD exchange rate forecast of 1.12 to derive our
target price of HKD8.60. Our fair value target multiple of 9.5x is in line with the average forward
PE of 9.7x at which the H-share has traded since listing. We think the company offers a healthy
earnings growth outlook at 19% in 2018e and a 17% EPS CAGR for 2017-20e with a dividend
yield of c2%.
Our H-share TP of HKD8.60 implies 13.5% upside from current levels. We maintain our Buy
rating on the stock as the company is likely to continue to benefit from the pro-investment policy
stance taken by the government.
Key downside risks: Slower-than-expected construction progress; a potential lower-than-
expected return from PPP projects; worsening property market conditions; and overseas project
risks.
CRG A-shares (601390 CH, RMB7.52, Hold, TP RMB7.60)
We value CRG’s A-shares at the same fair value target PE multiple of 9.5x as we do for its H-
shares. Applying this target multiple to our FY18e EPS forecast of RMB0.80, we derive a fair
value TP of RMB7.60. Our TP implies upside of 1.1%. We maintain our Hold rating on the A-
shares as we believe the company is likely to continue to benefit from the pro-investment policy
stance taken by the government.
Key upside risks: A potential increase in government funding to boost infrastructure
investment and a reduction in financial leverage through better management of operations.
Key downside risks: Slower-than-expected construction progress; a potential lower-than-
expected return from PPP projects; worsening property market conditions; and overseas project
risks.
CSCI (3311 HK, HKD5.67, Buy, TP HKD9.70)
We value the stock using a PE method using the following formula:
Target PE = ROE - g/ROE * (Cost of Equity - g)
Where: FY18e ROE is 13.7%, g is 0%, and cost of equity is 9.5%. Our risk free rate to 3.0% and
Equity risk premium is 5.0% based on HSBC Global strategist. Our Equity Beta is high at 1.7 as
we think CSCI’s business could remain volatile based on the policy directives of China’s central
government.
We derive a target PE of 8.7x. This is lower than the company’s long-term PE trading multiple of
9.8x.

31
EQUITIES ● INDUSTRIALS
November 2018
We apply our target multiple of 8.7x to our revised FY18e EPS estimate of HKD1.11 and derive
our target price of HKD9.70. Our target price implies 71.1% upside from current levels;
accordingly, we maintain our Buy rating on the stock.
CCCC H-shares (1800 HK, HKD7.56, Buy, TP HKD9.10)
We forecast 2018 new contract growth to be -4.8%. We think the company might continue to
trade in a PE range reflective of a down-cycle environment. During the last down-cycle in 2013,
the H-shares traded in a range of 5-8.3x one-year forward PE. We set our target 2018e PE at
7x, which is at the middle of the range (vs. 8.3x previously, which was at the upper end of the
range); 7x is also the average forward PE of the H-shares since 2011 and during 2013.
Using our FY18 EPS forecast of RMB1.16, we calculate our H-share fair value target price at
HKD9.10 based on HSBC FX team’s end-2018 RMB-HKD exchange rate forecast of 1.12. Our
target price implies 20.4% upside from current levels; accordingly, we rate CCCC H-shares Buy.
Downside risks: Higher-than-expected financial leverage, potential overseas acquisitions of
construction business and projects, project execution risk of overseas infrastructure projects,
potential operation risk for infrastructure operating assets.
CCCC A-shares (601800 CH, RMB12.43, Reduce, TP RMB8.10)
We value CCCC’s A-shares at the same target 2018e PE multiple of 7.0x as the H-shares as
described above. Applying this target multiple to our FY18e EPS forecast of RMB1.12 per
share, we derive a fair value target price of RMB8.10. Our target price implies 34.8% downside
from current levels. We maintain our Reduce rating on the A-shares as they are trading at a
c.80% premium to the H-shares.
Key upside risks: Faster-than-expected asset restructuring to strengthen the balance sheet
and potential A-share equity private placement; positive policy announcement on infrastructure
project funding; and potential new financing source or partners to develop the company’s BOT
portfolio in China.
CRRC (1766 HK, HKD7.16, Buy, TP HKD8.80) / (601766 CH, RMB8.62, Hold, TP RMB7.80)
We value CRRC Corp using a discounted cash flow model. We assume a WACC of 8.95%
based on our key assumptions of a risk-free rate of 3.0%, equity risk premium of 5.0%, long-
term target debt/(debt + equity) of 10%, equity beta of 1.27, and a terminal growth rate of 0.5%.
Our DCF-based fair value target price for the A-share is RMB7.80, which implies 9.5%
downside from current levels. We maintain our Hold rating on the A-share as the A-share trades
at a significant valuation premium to the H-share.
Our H-share target price of HKD8.80 implies 22.9% upside from current levels; hence, we
maintain our Buy rating on the stock.
Our TP of HKD8.80 implies a FY18e PE of 18.6x, which is slightly higher than the company’s
long-term trading PE of 17.1x since the listing of its H-shares in 2008. We think this slight
premium is justified as the restructuring initiatives at the company should yield benefits over the
long term.
We maintain our Hold rating on the A-share as it is trading at c.35% premium to the H-share
price, which looks stretched to us.
Key upside risks for A-shares: Stronger-than-expected new orders for China Railway
Corporation; rapid transit vehicle demand remaining high due to the restart of subway project
tenders; and higher profitability improvement from internal restructuring.
Key downside risks for A- and H-shares: Worse-than-expected cost control for production
and overheads, potential acquisition risk in the overseas market and potential higher

EQUITIES ● INDUSTRIALS
November 2018
32
competition in the international rail equipment industry, and potential operation risk in the US
subway train market due to trade tensions between China and the US.
Zhuzhou CRRC (3898 HK, HKD42.75, Buy, TP HKD46.00)
We value Zhuzhou using DCF methodology based on a WACC of 7.86%. Our key assumptions
include a risk-free rate of 3.0%, equity risk premium of 5.0% based on HSBC Global Strategists’
long-term target debt/(debt + equity) of 20%, equity beta of 1.18, and terminal growth rate of
1.0%.
Our DCF-based TP is HKD46.00 using our end-2018e RMB-HKD exchange assumptions of
1.12. Our TP of HKD46.00 implies 7.6% upside from current levels. We rate the stock Buy as
we believe the recovery in rail equipment order and development in non-railway businesses
offer medium-to-long-term upside. Our target price also implies a FY18e PE of 16.2x vs. a
historical average of 16.4x.
Key downside risks: These include an emerging new competitor in the domestic market,
insufficient production yield from the new IGBT plant, potential overseas acquisitions, expansion
and potential business risks related to the deep-sea robotics business.
Zoomlion (1157 HK, HKD2.77, Buy, TP HKD3.90) / (000157 CH, RMB3.44, Hold, TP RMB3.50)
We value Zoomlion based on a PB methodology.
The historical average trading PBV for the H-share has been about 1x since the stock listed. We
continue to apply a discount to the BV to account for the delinquency rate of finance lease
receivables. Our fair value target PB is 0.7x (unchanged). We do not expect the company to
return to historical valuation levels (1x PB since the stock listed) but do believe that the recent
recovery in growth momentum, after a sustained industry downturn, which compressed
sentiment over recent years and subsequent to the company’s restructuring, will drive a
valuation re-rating off the current 0.5x PB valuation.
In determining the A-shares’ target price, we use Zoomlion’s 2018e per share book value of
RMB5.0 (unchanged) to which we apply our target PB of 0.7x to derive our adjusted fair book
value of RMB3.50 (unchanged). Our A-share target price implies 1.7% upside from current
levels. We maintain our Hold rating on the A-shares as the A-shares’ premium to the H-shares
has subsided.
For the H-shares’ target price, we use the same methodology as above and, using an end-
2018e forecast for RMB-HKD exchange rate of 1.12, we derive our fair value target price of
HKD3.90. Our H-share TP implies 40.8% upside from current levels; accordingly we rate the
stock Buy.
Key downside risks for A- and H-shares: The company’s expansion into earthmoving
machinery and aerial working platforms may take time to realise; slowdown in property sales
would slow down property construction activity and machinery demand; and the tightening of
project financing for infrastructure PPP projects could slow down infrastructure construction
activity. Lack of industry data for product sales in concrete machinery and cranes.
Key upside risks for A-share: Stronger-than-expected 2018 sales for construction machinery,
potential benefit from VAT tax reduction and a potential recovery in the agriculture machinery
business.

33
EQUITIES ● INDUSTRIALS
November 2018
Lonking (3339 HK, HKD2.00, Buy, TP HKD3.00)
We value the company using a target PB multiple. Our fair value target PB multiple is 1.4x,
which is in line with the long-term average PB of 1.4x since 2007.
The historical average ROE since 2007 is 14.8%, and we estimate 2018e and 2019e ROE of
c.17%, which continues to directionally support our view that the stock can trade at least at its
historical PB trading level.
Our target price of HKD3.00 is based on our 2018e book value estimate of RMB1.92 and using
HSBC FX team’s end-2018e forecast RMB-HKD exchange rate of 1.12. Our TP of HKD3.00
implies 50% upside from current levels; accordingly, we rate the stock Buy.
Key downside risks: Lower-than-expected returns from fork lift production expansion, price
competition on products; a potential slowdown in property construction; and increased raw
material prices.
Anhui Conch (914 HK, HKD42.70, Buy, TP HKD58.00) / (600585 CH, RMB34.20, Buy, TP
RMB53.00)
We value Conch-H based on a blended forward book value multiple of 2.3x. Our PB multiple is
derived from our Gordon growth model, assuming ROE of 22% for 2018-19e and a discount
rate of 9.5% (a risk-free rate of 3.0%, an equity risk premium of 5%, and a beta of 1.25) and no
growth after 2019e.
Our target price for Conch-A is converted from our H-share target price based on HSBC
YE2019 RMB-HKD forecast of 1.12. Our target prices on Conch H/A-shares of
HKD58.00/RMB53.00, which imply 35.8%/55% upside, respectively. We rate both Conch-H and
Conch-A as Buy as we expect GP/t to further expand in 2019 and 2020, benefiting from the
successful implementation of supply-side controls.
Key downside risks: (1) additional property price-curbing measures hurt investment sentiment,
leading to lower-than-expected cement demand; (2) political and FX risks in overseas markets
to which Conch has exposure, including Indonesia and Myanmar; and (3) production
coordination fails to be implemented.
Gezhouba (600068 CH, Buy, RMB6.53, TP RMB10.50)
Our TP is based on a sum-of-the-parts (SOTP) valuation analysis combining various
methodologies. We use price to earnings (PE) to value Gezhouba’s E&C, property, and cement
businesses. We use discounted cash flow (DCF) to value its operation of infrastructure projects,
and price-to-book (PB) to value its environment business. Our TP of RMB10.50 implies 60.8%
upside and hence we rate the stock Buy.
Valuation by division
Engineering & construction: We value this division by applying a forward PE of 10x. This
is in line with the prevailing average multiple of global E&C players.
Operation of infrastructure projects: We value this division on DCF as we expect the
business to generate stable free cash flow over the long run with limited capex. We use a
WACC of 8.0% (cost of equity 11.4%, after-tax cost of debt 4.5%, and a long-term debt-to-
capital ratio assumption of 50%).
Property development: We value this division by applying a forward PE of 7x. This is
close to the prevailing average PE of A-share property companies.
Environment: We value this division by applying a PB of 1.6x. This is close to the
prevailing average multiple of A-share environmental companies.
Howard Lau*, CFA Analyst, Materials & Infrastructure The Hongkong and Shanghai Banking Corporation Limited [email protected]
+852 2996 6625
*Employed by a non-US affiliate of HSBC Securities (USA) Inc, and is not registered/ qualified pursuant to FINRA regulations.
Corey Chan* (S1700518100001) Head of A-share Infrastructure Research
HSBC Qianhai Securities Limited
+86 755 8898 3404
*Employed by a non-US affiliate of HSBC Securities (USA) Inc, and is not registered/ qualified pursuant to FINRA regulations.

EQUITIES ● INDUSTRIALS
November 2018
34
Cement: We value this division by applying a forward PE of 7x. This is in line with the
prevailing average multiple of A-share cement companies.
Figure 36: Gezhouba: SOTP analysis
(RMBm) Fair value Business Valuation procedure % Stake 2018e %
Engineering & Construction PE - 10x 2019e Various 41,865 39% Operation of Infrastructure Projects DCF@WACC of 8% Various 20,724 19% Property Development PE - 7x 2019e Various 11,801 11% Environment PB - 1.6x 2018e Various 13,843 13% Cement PE - 7x 2019e Various 13,773 13% Civil Explosive PE - 10x 2019e Various 5,009 5% Equipment Manufacturing EV/EBITDA - 6x 2019e Various 1,532 1% Gross asset value 108,547 100% Less: Net Debt (incl. perpetual) End 2018e (60,290) Total equity value 48,257 / No. of shares 4,605 Fair value (RMB) 10.5
Source: Wind, Company data, HSBC Qianhai Securities estimates
Figure 37: A-share environmental comp
Stock Currency Price Mkt cap _____ PE ______ _____ PB ______ Company name code (USDbn) 2018e 2019e 2018e 2019e
South Huiton 000920 CH RMB 4.99 0.3 16.2 13.4 2.5 2.2 Xingrong Environment 000598 CH RMB 4.05 1.7 11.4 9.9 1.1 1.0 Zhongshan Public Utilities 000685 CH RMB 6.57 1.4 8.1 7.2 0.8 0.7 CEC Environmental Protection 300172 CH RMB 5.22 0.4 20.8 18.0 NA NA Grandblue Environment 600323 CH RMB 12.23 1.3 11.7 10.1 1.6 1.4 Hongcheng Waterworks 600461 CH RMB 5.70 0.6 13.3 11.5 1.3 1.2 Average 13.1 11.3 1.5 1.3
Source: Wind, company data, HSBC Qianhai Securities estimates
Downside risks:
Weaker-than-expected margin on intensified competition: Rising competition could
undercut prices and adversely affect Gezhouba’s gross margins. A 1ppt weaker-than-
expected gross margin could reduce our 2018e earnings by 16%.
A slowdown in infrastructure spending in China: E&C accounted for around 50% of the
company’s revenue in 2017 and is closely related to infrastructure investment. Hence, a
slowdown in infrastructure investment could negatively impact the company’s revenue.
Higher-than-expected receivable provision: As of end-2017, the company has RMB17bn
trade receivables on its balance sheet. Should receivable provision be higher-than-
expected, we see downside risks to our earnings forecasts.
Project delay or cancellation: Any project delay or cancellation might dim the earnings
outlook.
Non-recurring items leading to bottom-line uncertainty: Any higher-than-expected non-
recurring losses or lower-than-expected non-recurring gains might put pressure on the
earnings outlook.

35
EQ
UIT
IES
● IN
DU
ST
RIA
LS
No
ve
mb
er 2
01
8
Figure 38: China Infrastructure & Industrials: Valuation comparison tables
Ticker Mkt cap Rating Price TP Share
perf (%) _____ PE (x) _____ __ EV/EBITDA (x) _ __ Div yield (%) ___ _ Net gearing (%) __ ____ ROE (%) ___ _____ PB (x) ______
Company (USDm) (local) (local) YTD 17a 18e 19e 17a 18e 19e 17a 18e 19e 17a 18e 19e 17a 18e 19e 17a 18e 19e
HSI# (15.8%)
HSCEI# (9.1%)
Capital Goods
Zhuzhou CRRC Times 3898.HK 2,988 Buy 42.75 46.00 (15.9%) 17.6 16.6 14.2 12.7 11.7 9.4 1.2 1.2 1.4 (19) (29) (37) 15.0 14.8 15.5 2.5 2.4 2.0
CRRC Corp 1766.HK 34,274 Buy 7.16 8.80 (14.4%) 16.8 15.0 13.0 9.6 8.8 7.6 1.9 2.1 2.7 (9) (9) (16) 9.5 9.6 10.4 1.5 1.4 1.3
CRRC Corporation-A 601766.SS 34,274 Hold 8.62 7.80 (28.8%) 20.2 18.0 15.6 9.6 8.8 7.6 1.6 1.7 2.2 (9) (9) (16) 9.5 9.6 10.4 1.8 1.7 1.6
Zoomlion 1157.HK 3,672 Buy 2.77 3.90 (17.3%) 13.9 11.2 11.3 19.9 11.6 12.0 8.4 1.8 1.8 56 52 60 3.6 4.4 4.3 0.5 0.5 0.5
Zoomlion-A 000157.SZ 3,672 Hold 3.44 3.50 (23.0%) 19.5 15.8 15.8 19.9 11.6 12.0 5.9 1.3 1.3 56 52 60 3.6 4.4 4.3 0.7 0.7 0.7
Lonking Holdings 3339.HK 1,093 Buy 2.00 3.00 (41.7%) 7.2 5.6 4.8 3.5 3.0 2.5 8.0 9.2 10.1 (21) (20) (20) 13.5 16.4 17.6 1.0 0.9 0.8
Weichai Power-A 000338.SZ 8,653 Buy 7.52 11.50 (9.8%) 8.8 8.2 7.6 2.8 2.2 1.6 5.3 5.8 6.2 8 (7) (19) 20.3 19.8 19.2 1.7 1.5 1.4
Weichai Power 2338.HK 8,653 Buy 8.38 13.70 (2.1%) 8.7 8.0 7.5 2.8 2.2 1.6 5.4 5.9 6.3 8 (7) (19) 20.3 19.8 19.2 1.7 1.5 1.4
Sinotruk 3808.HK 4,027 Hold 11.42 15.00 29.8% 9.2 7.2 6.6 3.3 2.4 2.4 6.9 6.9 7.5 (0) (0) (0) 14.2 16.3 16.3 1.2 1.1 1.0
China Yuchai CYD.N 632 Buy 15.47 34.60 (35.5%) 4.6 3.8 3.3 1.4 0.9 1.0 5.7 10.6 11.9 (0) (0) (0) 11.9 13.2 13.8 0.5 0.5 0.4
Railway Operators
Daqin Railway 601006.SS 17,279 Buy 8.05 10.50 (11.2%) 9.0 8.4 8.2 4.2 3.7 3.4 5.8 5.9 6.1 (4) (7) (10) 14.1 13.8 13.3 1.2 1.1 1.1
Guangshen Railway 0525.HK 3,106 Buy 2.93 4.80 (44.2%) 18.1 17.1 11.9 6.5 6.9 6.2 3.1 2.6 3.8 (4) (3) (7) 3.6 3.7 5.1 0.6 0.6 0.6
Guangshen Railway-A 601333.SS 3,106 Buy 3.15 4.30 (43.4%) 22.0 20.7 14.5 6.5 6.9 6.2 2.5 2.2 3.1 (4) (3) (7) 3.6 3.7 5.1 0.8 0.8 0.7
Construction
CRCC 1186.HK 21,093 Buy 10.46 14.90 15.5% 7.8 6.6 5.3 4.0 3.6 3.1 1.9 2.7 3.4 (2) 1 (1) 11.4 12.3 14.3 0.8 0.8 0.7
CRCC-A 601186.SS 21,093 Buy 11.03 13.30 (1.0%) 9.3 7.9 6.3 4.0 3.6 3.1 1.6 2.3 2.8 (2) 1 (1) 11.4 12.3 14.3 1.0 0.9 0.9
CCCC 1800.HK 25,357 Buy 7.56 9.10 (14.9%) 6.4 5.8 5.1 6.6 7.2 6.8 3.6 3.7 4.1 71 83 83 10.5 10.6 10.9 0.7 0.6 0.6
CCCC-A 601800.SS 25,357 Reduce 12.43 8.10 (2.9%) 11.9 10.7 9.5 6.6 7.2 6.8 1.9 2.0 2.2 64 83 83 9.3 10.6 10.9 1.1 1.1 1.0
CRG 0390.HK 24,308 Buy 7.58 8.60 31.1% 10.0 8.4 7.1 6.7 5.2 4.2 1.7 1.8 2.1 36 31 24 11.3 11.4 11.5 1.1 0.8 0.8
CRG-A 601390.SS 24,308 Hold 7.52 7.60 (10.4%) 11.2 9.4 7.9 6.7 5.2 4.2 1.5 1.6 1.9 36 31 24 11.3 11.4 11.5 1.2 0.9 0.9
CSCI 3311.HK 3,656 Buy 5.67 9.70 (48.2%) 4.8 5.1 4.3 4.2 4.1 3.4 6.2 5.9 7.0 41 46 40 13.2 13.7 14.5 0.8 0.7 0.6
Automation, Robotics and other manufacturing
Shenzhen Inovance Technol
300124.SZ 5,800 Hold 24.14 22.00 (16.8%) 37.1 34.1 30.8 29.5 26.8 23.8 1.2 1.4 1.5 (38) (43) (48) 19.4 18.9 18.8 7.2 6.4 5.8
Siasun Robot & Automation 300024.SZ 3,291 Reduce 14.61 12.00 (22.4%) 52.7 42.8 39.2 43.2 34.7 31.8 0.3 0.4 0.5 (2) (3) 0 7.5 8.7 8.8 3.8 3.6 3.3
Shanghai Step Electric 002527.SZ 494 Reduce 5.52 4.70 (44.2%) 25.1 41.9 36.7 13.1 18.2 17.0 1.8 1.1 1.2 9 8 8 4.6 2.7 3.1 1.2 1.1 1.1
Shanghai Mech & Elec. Ind 600835.SS 2,140 Buy 15.24 20.00 (37.8%) 11.2 10.4 10.3 - - - 3.1 3.4 3.4 (116) (104) (93) 13.9 13.6 12.6 1.6 1.4 1.3
Canny Elevator Company Lt 002367.SZ 579 Reduce 5.03 3.50 (41.4%) 12.3 34.9 29.4 7.0 13.4 11.3 2.0 0.7 0.8 (7) (12) (16) 8.7 3.0 3.5 1.1 1.0 1.0
Hongfa Technology 600885.SS 2,405 Buy 22.37 22.00 (24.3%) 17.4 27.2 23.8 11.8 12.4 11.1 1.8 1.1 1.3 2 (2) (2) 17.4 13.4 13.8 3.0 3.6 3.3
Fanuc 6954.T 37,579 Buy 20,875 22,000 (22.9%) 31.7 22.2 24.3 17.5 12.1 14.9 1.9 2.7 2.5 (56) (50) (52) 9.2 12.4 10.9 2.9 2.7 2.6
Note: Priced as of 7 November 2018 #Consensus PEs and PBs for HSI, HSCEI & SSE. NA – Not Applicable Source: Refinitiv Datastream, HSBC estimates

36
EQ
UIT
IES
● IN
DU
ST
RIA
LS
No
ve
mb
er 2
01
8
Figure 40: China Infrastructure & Industrials: Valuation comparison tables
Ticker Mkt cap Rating Price TP Share
perf (%) _____ PE (x) _____ __ EV/EBITDA (x) _ __ Div yield (%) ___ _ Net gearing (%) __ ____ ROE (%) ___ _____ PB (x) ______
Company (RIC) (USDm) (local) (local) YTD 17a 18e 19e 17a 18e 19e 17a 18e 19e 17a 18e 19e 17a 18e 19e 17a 18e 19e
HSI# (15.8%) HSCEI# (9.1%) Building Materials Anhui Conch 0914.HK 26,836 Buy 42.70 58.00 16.2% 12.6 6.8 6.2 2.0 1.0 0.6 3.2 6.6 7.3 4 (2) (14) 19.2 30.2 28.2 2.2 1.9 1.6 Anhui Conch-A 600585.SS 26,836 Buy 34.20 53.00 16.6% 11.4 6.2 5.6 5.3 3.0 2.5 3.5 7.3 8.0 4 (2) (14) 19.2 30.2 28.2 2.0 1.7 1.5 BBMG 2009.HK 4,744 Hold 2.30 1.90 (35.2%) 9.6 5.8 6.4 6.8 5.3 5.0 2.4 3.6 3.3 90 88 73 4.7 7.1 6.0 0.4 0.4 0.4 BBMG Corp-A 601992.SS 4,744 Reduce 3.37 1.70 (37.9%) 15.9 9.6 10.6 9.2 7.1 6.9 1.4 2.2 2.0 90 88 73 4.7 7.1 6.0 0.7 0.7 0.6 CNBM 3323.HK 3,088 Buy 6.25 9.00 (10.6%) 9.5 4.4 3.8 5.6 4.5 3.9 1.8 3.9 4.5 149 130 107 8.0 15.5 15.8 0.7 0.6 0.6 CR Cement 1313.HK 6,867 Buy 7.70 10.50 49.8% 13.9 6.7 6.3 8.7 3.5 3.0 3.5 7.5 7.9 39 1 (11) 12.8 22.6 19.8 1.7 1.3 1.2 Asia Cement China 0743.HK 1,349 Buy 6.74 9.80 146.0% 15.5 3.8 3.4 6.2 2.6 2.0 2.6 10.6 11.7 39 16 (2) 6.3 22.3 20.8 0.9 0.8 0.7 Taiwan Cement 1101.TW 5,897 Buy 35.50 48.00 7.1% 17.5 7.3 7.4 9.8 4.0 3.4 4.2 10.1 10.0 25 (1) (5) 6.2 14.6 14.0 1.0 1.0 1.0 Asia Cement 1102.TW 3,684 Buy 33.70 48.00 19.5% 19.3 8.5 8.3 8.0 3.9 3.1 3.6 8.3 8.4 49 41 32 4.4 10.0 9.6 0.8 0.8 0.7 China Conch Venture 0586.HK 5,555 Buy 24.10 36.00 33.1% 11.3 7.1 6.3 28.2 20.9 13.5 2.3 4.1 4.6 (4) 9 11 17.8 24.4 23.6 1.9 1.6 1.4 Aerodefense Jonhon 002179.SZ 4,527 Buy 39.00 44.70 (1.0%) 37.4 28.0 21.4 26.0 20.1 15.5 n.a. 0.3 0.4 (17) (11) (13) 18.3 20.4 21.9 6.3 5.2 4.3 Hikvision 002415.SZ 36,157 Buy 27.14 40.00 (30.4%) 26.6 20.9 16.7 21.9 16.8 13.2 1.9 2.4 3.0 (42) (40) (36) 34.4 36.0 37.5 8.3 6.9 5.7 Avichina Industry Tech 2357.HK 4,191 Buy 5.50 6.80 32.2% 23.7 21.9 17.2 5.9 5.3 4.4 0.6 0.7 0.8 (7) (4) (4) 8.7 8.5 9.8 2.0 1.8 1.6 CSSC Offshore & Marine 0317.HK 1,583 Buy 5.68 24.60 (53.4%) 80.8 13.5 12.6 86.3 5.8 4.7 0.3 1.9 2.0 (10) (10) (8) 0.8 4.9 5.1 0.7 0.7 0.6 CSSC Offshore & Marine-A
600685.SS 1,583 Buy 9.73 21.20 (63.5%) n.m. 26.2 24.4 155.6 10.5 8.4 0.2 1.0 1.1 (10) (10) (8) 0.8 4.9 5.1 1.3 1.3 1.2
China Avionics System 600372.SS 3,538 Buy 13.93 23.90 1.8% 45.2 39.3 31.6 28.1 24.7 21.0 0.4 0.5 0.6 42 38 36 8.3 8.5 9.8 3.5 3.2 3.0 Avic hongdu 600316.SS 878 Reduce 8.48 5.60 (40.1%) n.m. 99.0 73.9 45.2 27.6 24.8 0.2 0.3 0.4 34 27 27 0.6 1.2 1.7 1.2 1.2 1.2 Avic Aviation Engine 600893.SS 7,773 Buy 23.93 38.40 (11.1%) 56.1 31.3 25.7 17.2 12.2 10.4 0.5 1.0 1.2 3 3 2 4.6 6.5 7.6 2.1 2.0 1.9 Haige Communications 002465.SZ 2,585 Buy 7.76 11.00 (19.1%) 61.1 29.5 19.8 31.8 16.6 11.9 1.0 2.1 3.2 (6) (10) (8) 4.0 7.3 10.6 2.2 2.1 2.1 Avic Electromechanical 002013.SZ 4,145 Buy 7.91 9.70 10.0% 32.9 32.2 28.5 20.9 17.5 15.6 0.3 0.3 0.4 1 2 2 7.2 9.9 10.3 2.2 3.1 2.8 Avic Aircraft 000768.SZ 6,064 Buy 15.17 21.50 (10.2%) 89.1 36.0 24.7 31.9 18.3 13.9 0.6 1.4 2.0 (28) (22) (16) 3.0 7.3 10.2 2.7 2.6 2.4 Avic Helicopter 600038.SS 3,160 Buy 37.13 45.00 (20.2%) 48.1 34.5 25.7 21.9 17.1 13.2 0.6 0.9 1.2 (41) (45) (50) 6.5 8.5 10.7 3.0 2.9 2.7 CSICL 601989.SS 13,808 Buy 4.18 5.80 (30.7%) 92.9 37.6 21.7 14.2 9.4 6.7 0.3 0.8 1.4 (51) (52) (54) 1.4 3.9 6.6 1.3 1.5 1.4
Note: Priced as of 7 November 2018. #Consensus PEs and PBs for HSI, HSCEI & SSE. NA – Not Applicable. Source: Refinitiv Datastream, HSBC estimates

37
EQ
UIT
IES
● IN
DU
ST
RIA
LS
No
ve
mb
er 2
01
8
Figure 41: China Infrastructure & Industrials: Valuation comparison tables
Ticker Mkt cap Rating Price TP Share perf _____ PE (x) _____ __ EV/EBITDA (x) _ __ Div yield (%) ___ _ Net gearing (%) __ ____ ROE (%) ___ _____ PB (x) ______ Company (RIC) (USDm) (local) (local) (%) YTD 17a 18e 19e 17a 18e 19e 17a 18e 19e 17a 18e 19e 17a 18e 19e 17a 18e 19e
HSI# (15.8%) HSCEI# (9.1%) Auto Geely 0175.HK 17,659 Hold 15.40 15.90 (43.2%) 12.4 8.9 7.5 7.5 5.5 4.4 1.8 2.3 2.7 (35) (25) (42) 34.2 33.5 30.2 3.5 2.5 2.0 Great Wall 2333.HK 7,273 Reduce 4.72 3.50 (47.3%) 7.5 9.0 6.5 2.4 2.8 2.9 4.1 3.4 4.8 18 26 28 10.4 8.2 11.2 0.8 0.7 0.7 Great Wall Motor-A 601633.SS 2,255 Reduce 5.32 3.20 (27.0%) 9.6 11.5 8.2 5.2 5.4 5.4 3.2 2.6 3.8 18 26 28 10.4 8.2 11.2 1.0 0.9 0.9 Brilliance Auto 1114.HK 4,671 Buy 7.25 13.10 (65.3%) 6.6 4.4 3.8 - - - 1.5 1.4 3.4 (3) (3) (4) 19.6 24.2 22.9 1.2 1.0 0.8 GAC Group 2238.HK 14,963 Buy 8.48 9.40 (35.9%) 4.7 6.2 5.6 36.6 6.4 2.2 7.1 5.3 6.1 (68) (50) (52) 19.4 16.8 16.6 0.8 1.0 0.9 GAC Group-A 601238.SS 14,963 Reduce 11.28 8.60 (35.9%) 7.0 9.3 8.4 3.3 4.2 2.5 4.7 3.5 4.1 (68) (50) (52) 19.4 16.8 16.6 1.2 1.5 1.3 Yongda Auto 3669.HK 1,026 Hold 4.37 4.50 (51.4%) 4.5 5.0 4.2 3.5 3.2 3.0 7.0 6.6 7.8 62 51 59 22.8 16.3 17.3 0.6 0.6 0.5 Dongfeng Motor 0489.HK 2,925 Buy 8.02 9.40 (15.2%) 4.2 3.9 3.9 - - - 4.9 5.1 5.1 (23) (11) (13) 14.2 13.8 12.3 0.6 0.5 0.5 Fuyao Glass Industry-A 600660.SS 8,003 Buy 22.80 29.00 (21.4%) 18.9 14.8 13.4 11.3 8.1 8.2 3.3 4.8 4.6 6 5 8 16.3 18.9 18.6 3.0 2.6 2.4 Fuyao Glass Industry-H 3606.HK 8,003 Buy 25.10 32.10 (23.8%) 18.4 14.4 13.1 11.3 8.1 8.2 3.4 4.9 4.8 6 5 8 16.3 18.9 18.6 2.9 2.5 2.3 China Changan-A 000625.SZ 4,223 Reduce 6.46 2.70 (48.7%) 4.3 22.6 n.m. - - - 6.9 1.4 n.a. (47) (41) (33) 15.5 3.4 0.1 0.7 0.7 0.7 China Changan-B 200625.SZ 4,223 Reduce 5.08 3.00 (40.9%) 3.0 15.7 n.m. - - - 9.9 2.0 n.a. (47) (41) (33) 15.5 3.4 0.1 0.5 0.5 0.5 UMW Holdings UMWS.KL 1,288 Reduce 4.59 3.50 (11.7%) 49.7 14.3 11.9 13.9 9.3 7.9 n.a. 4.2 5.0 38 63 59 2.8 11.3 12.2 1.7 1.5 1.4 Kia Motors 000270.KS 10,302 Hold 28,550 33,000 (14.8%) 11.9 6.4 6.1 - - - 2.8 3.9 3.9 (3) (8) (10) 3.6 6.5 6.3 0.4 0.4 0.4 BAIC 1958.HK 1,420 Hold 4.41 5.00 (56.7%) 10.1 4.3 3.7 0.3 - - 2.6 9.0 9.4 (10) (23) (32) 7.2 15.2 16.1 0.7 0.6 0.6 Hyundai Motor 005380.KS 24,241 Hold 107,500 118,000 (31.1%) 7.2 7.5 6.3 5.6 6.0 5.2 3.7 3.7 3.7 57 56 53 6.2 5.7 6.3 0.4 0.4 0.4 Zhengtong Auto 1728.HK 1,182 Hold 3.77 3.40 (52.3%) 6.2 5.6 4.9 7.7 8.2 9.0 4.2 4.7 5.6 137 168 204 12.5 12.1 12.2 0.7 0.6 0.6 Zhongsheng Auto 0881.HK 4,427 Hold 15.26 16.00 (14.5%) 9.3 7.4 6.3 6.5 5.7 4.9 2.7 3.2 3.8 86 89 67 23.8 24.0 23.8 1.9 1.7 1.4 Toll Roads Anhui Expressway 0995.HK 1,214 Hold 4.79 5.20 (26.5%) 6.5 6.4 7.0 3.4 3.3 4.0 5.4 5.5 5.1 (1) 0 17 11.9 11.1 9.4 0.7 0.7 0.6 Anhui Expressway-A 600012.SS 1,214 Reduce 5.42 4.30 (50.7%) 8.3 8.2 8.9 3.4 3.3 4.0 4.2 4.3 4.0 (1) 0 17 11.9 11.1 9.4 1.0 0.9 0.8 Hopewell Highway* 0737.HK 1,519 Hold 3.86 4.38 (22.5%) 16.2 17.6 17.0 8.3 7.5 6.6 8.9 5.3 5.9 92 80 54 11.2 11.4 11.8 1.9 2.0 2.0 Jiangsu Expressway 0177.HK 6,758 Hold 10.44 11.50 (12.3%) 13.6 10.4 10.3 10.1 9.5 8.3 4.8 5.3 5.7 54 59 49 13.9 16.2 15.3 2.0 1.9 1.8 Jiangsu Expressway-A 600377.SS 6,758 Hold 9.31 10.30 (5.5%) 13.7 10.5 10.4 10.1 9.5 8.3 4.7 5.2 5.6 54 59 49 13.9 16.2 15.3 2.0 1.9 1.8 Shenzhen Expressway 0548.HK 2,348 Buy 7.36 10.30 (7.2%) 9.7 7.4 6.8 6.1 5.0 5.2 4.6 6.2 6.8 77 83 75 9.0 11.9 12.0 1.0 1.0 0.9 Shenzhen Expressway-A 600548.SS 2,348 Hold 7.95 9.20 (11.5%) 11.8 9.0 8.3 6.1 5.0 5.2 3.8 5.1 5.5 77 83 75 9.0 11.9 12.0 1.3 1.2 1.1 YueXiu Transport 1052.HK 1,331 Buy 6.23 9.00 8.5% 9.7 8.7 8.1 6.0 4.4 3.7 5.3 6.2 6.4 56 28 17 10.7 11.5 11.2 1.0 0.9 0.9 Zhejiang Expressway 0576.HK 1,132 Buy 6.18 9.40 (28.1%) 8.4 7.9 7.5 4.3 3.6 3.0 5.8 7.0 7.1 29 16 5 16.4 15.7 15.3 1.3 1.2 1.1 Sichuan Expressway 0107.HK 1,293 Hold 2.38 2.65 (16.5%) 7.2 6.9 6.7 8.0 7.9 7.0 4.8 5.0 5.1 99 95 83 8.8 7.7 6.2 0.5 0.4 0.4 Sichuan Expressway-A 601107.SS 1,293 Reduce 2.38 2.40 (16.5%) 8.1 7.8 7.5 8.0 7.9 7.0 4.2 4.4 4.5 99 95 83 8.8 7.7 6.2 0.5 0.5 0.5
Note: Priced as of 7 November 2018. #Consensus PEs and PBs for HSI, HSCEI & SSE. NA – Not Applicable. Source: Refinitiv Datastream, HSBC estimates

EQUITIES ● INDUSTRIALS
November 2018
38
Financial statements
Year to 12/2017a 12/2018e 12/2019e 12/2020e
Profit & loss summary (RMBm)
Revenue 680,981 740,184 817,140 893,456
EBITDA 36,551 41,833 48,252 50,761
Depreciation & amortisation -12,420 -13,382 -13,122 -12,873
Operating profit/EBIT 24,132 28,451 35,130 37,888
Net interest -2,876 -3,408 -3,805 -4,607
PBT 21,256 25,043 31,325 33,281
HSBC PBT 21,256 25,043 31,325 33,281
Taxation -4,337 -5,009 -6,265 -6,656
Net profit 16,057 18,933 23,682 25,160
HSBC net profit 16,057 18,933 23,682 25,160
Cash flow summary (RMBm)
Cash flow from operations 25,404 32,124 42,891 51,830
Capex -30,231 -36,006 -35,712 -35,434
Cash flow from investment -36,688 -36,006 -35,712 -35,434
Dividends -2,173 -2,444 -3,406 -4,260
Change in net debt -32,277 6,678 -3,773 -12,136
Balance sheet summary (RMBm)
Intangible fixed assets 34,304 45,961 57,501 68,926
Tangible fixed assets 64,352 70,073 76,443 81,583
Current assets 644,244 650,713 694,030 746,557
Cash & others 129,393 122,715 126,487 138,623
Total assets 821,887 845,735 906,962 976,054
Operating liabilities 517,259 530,243 576,328 629,669
Gross debt 125,086 125,086 125,086 125,086
Net debt -4,307 2,372 -1,401 -13,537
Shareholders' funds 149,412 159,155 172,902 187,169
Invested capital 96,248 113,789 125,159 128,774
Ratio, growth and per share analysis
Year to 12/2017a 12/2018e 12/2019e 12/2020e
Y-o-y % change
Revenue 8.2 8.7 10.4 9.3
EBITDA 7.8 14.4 15.3 5.2
Operating profit 11.2 17.9 23.5 7.9
PBT 12.1 17.8 25.1 6.2
HSBC EPS 14.7 17.9 25.1 6.2
Ratios (%)
Revenue/IC (x) 6.3 7.0 6.8 7.0
ROIC 17.7 21.7 23.5 23.9
ROE 11.4 12.3 14.3 14.0
ROA 2.8 3.0 3.5 3.4
EBITDA margin 5.4 5.7 5.9 5.7
Operating profit margin 3.5 3.8 4.3 4.2
EBITDA/net interest (x) 12.7 12.3 12.7 11.0
Net debt/equity -2.4 1.3 -0.7 -6.1
Net debt/EBITDA (x) -0.1 0.1 0.0 -0.3
CF from operations/net debt 1354.5
Per share data (RMB)
EPS Rep (diluted) 1.18 1.39 1.74 1.85
HSBC EPS (diluted) 1.18 1.39 1.74 1.85
DPS 0.18 0.25 0.31 0.33
Book value 11.00 11.72 12.73 13.78
Valuation data
Year to 12/2017a 12/2018e 12/2019e 12/2020e
EV/sales 0.2 0.2 0.2 0.2
EV/EBITDA 4.0 3.6 3.1 2.7
EV/IC 1.5 1.3 1.2 1.1
PE* 7.8 6.6 5.3 5.0
PB 0.8 0.8 0.7 0.7
Dividend yield (%) 1.9 2.7 3.4 3.6
* Based on HSBC EPS (diluted)
ESG metrics
Environmental Indicators 12/2017a Governance Indicators 12/2017a
GHG emission intensity* 27.6 No. of board members 9
Energy intensity* 448.7 Average board tenure (years) 3.0
CO2 reduction policy Yes Female board members (%) 11.1
Social Indicators 12/2017a Board members independence (%) 44.4
Employee costs as % of revenues 7.7
Employee turnover (%) n/a
Diversity policy n/a
Source: Company data, HSBC
* GHG intensity and energy intensity are measured in kg and kWh respectively against revenue in USD ‘000s
Issuer information
Share price (HKD) 10.46 Free float 35%
Target price (HKD) 14.90 Sector Construction & Engineering
Reuters (Equity) 1186.HK Country China
Bloomberg (Equity) 1186 HK Analyst Anderson Chow
Market cap (USDm) 21,111 Contact +852 2996 6669
Price relative
Source: HSBC Note: Priced at close of 07 Nov 2018
5.50
6.50
7.50
8.50
9.50
10.50
11.50
12.50
5.50
6.50
7.50
8.50
9.50
10.50
11.50
12.50
2016 2017 2018
CRCC Rel to HSCEI
Financials & valuation: CRCC Buy

39
EQUITIES ● INDUSTRIALS
November 2018
Financial statements
Year to 12/2017a 12/2018e 12/2019e 12/2020e
Profit & loss summary (RMBm)
Revenue 680,981 740,184 817,140 893,456
EBITDA 36,551 41,833 48,252 50,761
Depreciation & amortisation -12,420 -13,382 -13,122 -12,873
Operating profit/EBIT 24,132 28,451 35,130 37,888
Net interest -2,876 -3,408 -3,805 -4,607
PBT 21,256 25,043 31,325 33,281
HSBC PBT 21,256 25,043 31,325 33,281
Taxation -4,337 -5,009 -6,265 -6,656
Net profit 16,057 18,933 23,682 25,160
HSBC net profit 16,057 18,933 23,682 25,160
Cash flow summary (RMBm)
Cash flow from operations 25,404 32,124 42,891 51,830
Capex -30,231 -36,006 -35,712 -35,434
Cash flow from investment -36,688 -36,006 -35,712 -35,434
Dividends -2,173 -2,444 -3,406 -4,260
Change in net debt -32,277 6,678 -3,773 -12,136
Balance sheet summary (RMBm)
Intangible fixed assets 34,304 45,961 57,501 68,926
Tangible fixed assets 64,352 70,073 76,443 81,583
Current assets 644,244 650,713 694,030 746,557
Cash & others 129,393 122,715 126,487 138,623
Total assets 821,887 845,735 906,962 976,054
Operating liabilities 517,259 530,243 576,328 629,669
Gross debt 125,086 125,086 125,086 125,086
Net debt -4,307 2,372 -1,401 -13,537
Shareholders' funds 149,412 159,155 172,902 187,169
Invested capital 96,248 113,789 125,159 128,774
Ratio, growth and per share analysis
Year to 12/2017a 12/2018e 12/2019e 12/2020e
Y-o-y % change
Revenue 8.2 8.7 10.4 9.3
EBITDA 7.8 14.4 15.3 5.2
Operating profit 11.2 17.9 23.5 7.9
PBT 12.1 17.8 25.1 6.2
HSBC EPS 14.7 17.9 25.1 6.2
Ratios (%)
Revenue/IC (x) 6.3 7.0 6.8 7.0
ROIC 17.7 21.7 23.5 23.9
ROE 11.4 12.3 14.3 14.0
ROA 2.8 3.0 3.5 3.4
EBITDA margin 5.4 5.7 5.9 5.7
Operating profit margin 3.5 3.8 4.3 4.2
EBITDA/net interest (x) 12.7 12.3 12.7 11.0
Net debt/equity -2.4 1.3 -0.7 -6.1
Net debt/EBITDA (x) -0.1 0.1 0.0 -0.3
CF from operations/net debt 1354.5
Per share data (RMB)
EPS Rep (diluted) 1.18 1.39 1.74 1.85
HSBC EPS (diluted) 1.18 1.39 1.74 1.85
DPS 0.18 0.25 0.31 0.33
Book value 11.00 11.72 12.73 13.78
Valuation data
Year to 12/2017a 12/2018e 12/2019e 12/2020e
EV/sales 0.2 0.2 0.2 0.2
EV/EBITDA 4.0 3.6 3.1 2.7
EV/IC 1.5 1.3 1.2 1.1
PE* 9.3 7.9 6.3 6.0
PB 1.0 0.9 0.9 0.8
Dividend yield (%) 1.6 2.3 2.8 3.0
* Based on HSBC EPS (diluted)
ESG metrics
Environmental Indicators 12/2017a Governance Indicators 12/2017a
GHG emission intensity* 27.6 No. of board members 9
Energy intensity* 448.7 Average board tenure (years) 3.0
CO2 reduction policy Yes Female board members (%) 11.1
Social Indicators 12/2017a Board members independence (%) 44.4
Employee costs as % of revenues 7.7
Employee turnover (%) n/a
Diversity policy n/a
Source: Company data, HSBC
* GHG intensity and energy intensity are measured in kg and kWh respectively against revenue in USD ‘000s
Issuer information
Share price (RMB) 11.03 Free float 35%
Target price (RMB) 13.30 Sector Construction & Engineering
Reuters (Equity) 601186.SS Country China
Bloomberg (Equity) 601186 CH Analyst Anderson Chow
Market cap (USDm) 21,111 Contact +852 2996 6669
Price relative
Source: HSBC Note: Priced at close of 07 Nov 2018
7.20
9.20
11.20
13.20
15.20
7.20
9.20
11.20
13.20
15.20
2016 2017 2018
CRCC A Rel to CSI 300 Index
Financials & valuation: CRCC A Buy
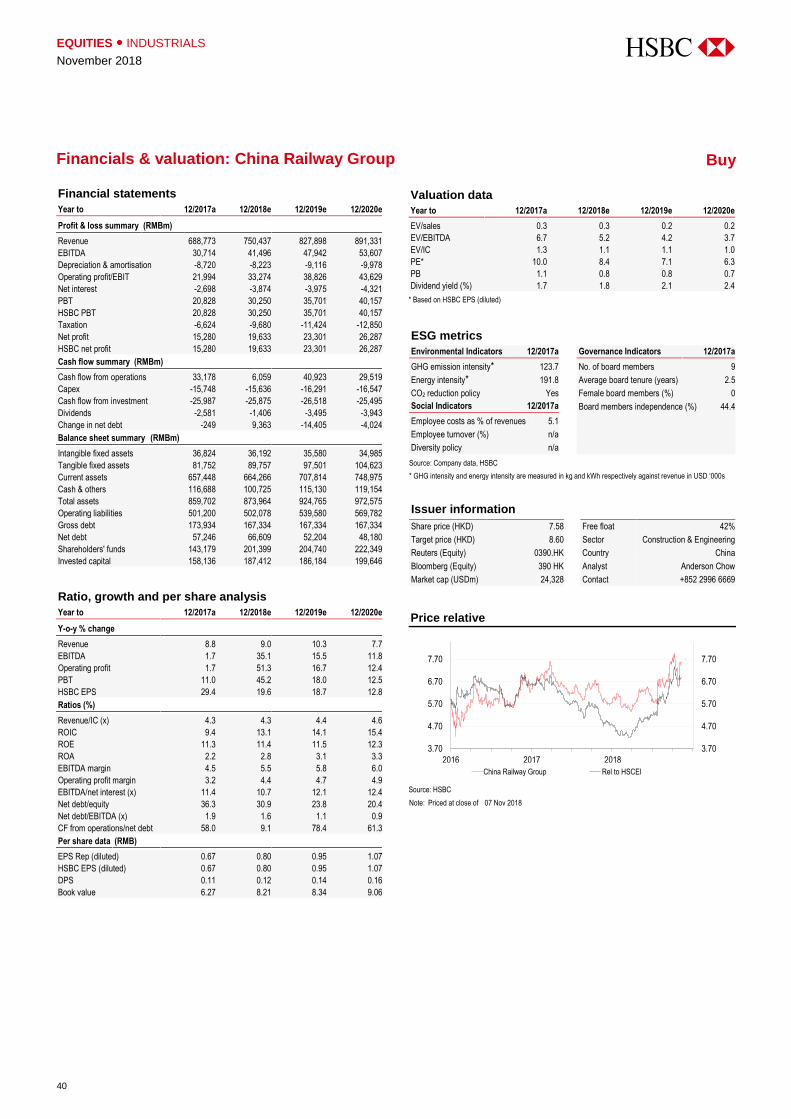
EQUITIES ● INDUSTRIALS
November 2018
40
Financial statements
Year to 12/2017a 12/2018e 12/2019e 12/2020e
Profit & loss summary (RMBm)
Revenue 688,773 750,437 827,898 891,331
EBITDA 30,714 41,496 47,942 53,607
Depreciation & amortisation -8,720 -8,223 -9,116 -9,978
Operating profit/EBIT 21,994 33,274 38,826 43,629
Net interest -2,698 -3,874 -3,975 -4,321
PBT 20,828 30,250 35,701 40,157
HSBC PBT 20,828 30,250 35,701 40,157
Taxation -6,624 -9,680 -11,424 -12,850
Net profit 15,280 19,633 23,301 26,287
HSBC net profit 15,280 19,633 23,301 26,287
Cash flow summary (RMBm)
Cash flow from operations 33,178 6,059 40,923 29,519
Capex -15,748 -15,636 -16,291 -16,547
Cash flow from investment -25,987 -25,875 -26,518 -25,495
Dividends -2,581 -1,406 -3,495 -3,943
Change in net debt -249 9,363 -14,405 -4,024
Balance sheet summary (RMBm)
Intangible fixed assets 36,824 36,192 35,580 34,985
Tangible fixed assets 81,752 89,757 97,501 104,623
Current assets 657,448 664,266 707,814 748,975
Cash & others 116,688 100,725 115,130 119,154
Total assets 859,702 873,964 924,765 972,575
Operating liabilities 501,200 502,078 539,580 569,782
Gross debt 173,934 167,334 167,334 167,334
Net debt 57,246 66,609 52,204 48,180
Shareholders' funds 143,179 201,399 204,740 222,349
Invested capital 158,136 187,412 186,184 199,646
Ratio, growth and per share analysis
Year to 12/2017a 12/2018e 12/2019e 12/2020e
Y-o-y % change
Revenue 8.8 9.0 10.3 7.7
EBITDA 1.7 35.1 15.5 11.8
Operating profit 1.7 51.3 16.7 12.4
PBT 11.0 45.2 18.0 12.5
HSBC EPS 29.4 19.6 18.7 12.8
Ratios (%)
Revenue/IC (x) 4.3 4.3 4.4 4.6
ROIC 9.4 13.1 14.1 15.4
ROE 11.3 11.4 11.5 12.3
ROA 2.2 2.8 3.1 3.3
EBITDA margin 4.5 5.5 5.8 6.0
Operating profit margin 3.2 4.4 4.7 4.9
EBITDA/net interest (x) 11.4 10.7 12.1 12.4
Net debt/equity 36.3 30.9 23.8 20.4
Net debt/EBITDA (x) 1.9 1.6 1.1 0.9
CF from operations/net debt 58.0 9.1 78.4 61.3
Per share data (RMB)
EPS Rep (diluted) 0.67 0.80 0.95 1.07
HSBC EPS (diluted) 0.67 0.80 0.95 1.07
DPS 0.11 0.12 0.14 0.16
Book value 6.27 8.21 8.34 9.06
Valuation data
Year to 12/2017a 12/2018e 12/2019e 12/2020e
EV/sales 0.3 0.3 0.2 0.2
EV/EBITDA 6.7 5.2 4.2 3.7
EV/IC 1.3 1.1 1.1 1.0
PE* 10.0 8.4 7.1 6.3
PB 1.1 0.8 0.8 0.7
Dividend yield (%) 1.7 1.8 2.1 2.4
* Based on HSBC EPS (diluted)
ESG metrics
Environmental Indicators 12/2017a Governance Indicators 12/2017a
GHG emission intensity* 123.7 No. of board members 9
Energy intensity* 191.8 Average board tenure (years) 2.5
CO2 reduction policy Yes Female board members (%) 0
Social Indicators 12/2017a Board members independence (%) 44.4
Employee costs as % of revenues 5.1
Employee turnover (%) n/a
Diversity policy n/a
Source: Company data, HSBC
* GHG intensity and energy intensity are measured in kg and kWh respectively against revenue in USD ‘000s
Issuer information
Share price (HKD) 7.58 Free float 42%
Target price (HKD) 8.60 Sector Construction & Engineering
Reuters (Equity) 0390.HK Country China
Bloomberg (Equity) 390 HK Analyst Anderson Chow
Market cap (USDm) 24,328 Contact +852 2996 6669
Price relative
Source: HSBC Note: Priced at close of 07 Nov 2018
3.70
4.70
5.70
6.70
7.70
3.70
4.70
5.70
6.70
7.70
2016 2017 2018
China Railway Group Rel to HSCEI
Financials & valuation: China Railway Group Buy

41
EQUITIES ● INDUSTRIALS
November 2018
Financial statements
Year to 12/2017a 12/2018e 12/2019e 12/2020e
Profit & loss summary (RMBm)
Revenue 688,773 750,437 827,898 891,331
EBITDA 30,714 41,496 47,942 53,607
Depreciation & amortisation -8,720 -8,223 -9,116 -9,978
Operating profit/EBIT 21,994 33,274 38,826 43,629
Net interest -2,698 -3,874 -3,975 -4,321
PBT 20,828 30,250 35,701 40,157
HSBC PBT 20,828 30,250 35,701 40,157
Taxation -6,624 -9,680 -11,424 -12,850
Net profit 15,280 19,633 23,301 26,287
HSBC net profit 15,280 19,633 23,301 26,287
Cash flow summary (RMBm)
Cash flow from operations 33,178 6,059 40,923 29,519
Capex -15,748 -15,636 -16,291 -16,547
Cash flow from investment -25,987 -25,875 -26,518 -25,495
Dividends -2,581 -1,406 -3,495 -3,943
Change in net debt -249 9,363 -14,405 -4,024
Balance sheet summary (RMBm)
Intangible fixed assets 36,824 36,192 35,580 34,985
Tangible fixed assets 81,752 89,757 97,501 104,623
Current assets 657,448 664,266 707,814 748,975
Cash & others 116,688 100,725 115,130 119,154
Total assets 859,702 873,964 924,765 972,575
Operating liabilities 501,200 502,078 539,580 569,782
Gross debt 173,934 167,334 167,334 167,334
Net debt 57,246 66,609 52,204 48,180
Shareholders' funds 143,179 201,399 204,740 222,349
Invested capital 158,136 187,412 186,184 199,646
Ratio, growth and per share analysis
Year to 12/2017a 12/2018e 12/2019e 12/2020e
Y-o-y % change
Revenue 8.8 9.0 10.3 7.7
EBITDA 1.7 35.1 15.5 11.8
Operating profit 1.7 51.3 16.7 12.4
PBT 11.0 45.2 18.0 12.5
HSBC EPS 29.4 19.6 18.7 12.8
Ratios (%)
Revenue/IC (x) 4.3 4.3 4.4 4.6
ROIC 9.4 13.1 14.1 15.4
ROE 11.3 11.4 11.5 12.3
ROA 2.2 2.8 3.1 3.3
EBITDA margin 4.5 5.5 5.8 6.0
Operating profit margin 3.2 4.4 4.7 4.9
EBITDA/net interest (x) 11.4 10.7 12.1 12.4
Net debt/equity 36.3 30.9 23.8 20.4
Net debt/EBITDA (x) 1.9 1.6 1.1 0.9
CF from operations/net debt 58.0 9.1 78.4 61.3
Per share data (RMB)
EPS Rep (diluted) 0.67 0.80 0.95 1.07
HSBC EPS (diluted) 0.67 0.80 0.95 1.07
DPS 0.11 0.12 0.14 0.16
Book value 6.27 8.21 8.34 9.06
Valuation data
Year to 12/2017a 12/2018e 12/2019e 12/2020e
EV/sales 0.3 0.3 0.2 0.2
EV/EBITDA 6.7 5.2 4.2 3.7
EV/IC 1.3 1.1 1.1 1.0
PE* 11.2 9.4 7.9 7.0
PB 1.2 0.9 0.9 0.8
Dividend yield (%) 1.5 1.6 1.9 2.1
* Based on HSBC EPS (diluted)
ESG metrics
Environmental Indicators 12/2017a Governance Indicators 12/2017a
GHG emission intensity* 123.7 No. of board members 9
Energy intensity* 191.8 Average board tenure (years) 2.5
CO2 reduction policy Yes Female board members (%) 0
Social Indicators 12/2017a Board members independence (%) 44.4
Employee costs as % of revenues 5.1
Employee turnover (%) n/a
Diversity policy n/a
Source: Company data, HSBC
* GHG intensity and energy intensity are measured in kg and kWh respectively against revenue in USD ‘000s
Issuer information
Share price (RMB) 7.52 Free float 42%
Target price (RMB) 7.60 Sector Construction & Engineering
Reuters (Equity) 601390.SS Country China
Bloomberg (Equity) 601390 CH Analyst Anderson Chow
Market cap (USDm) 24,328 Contact +852 2996 6669
Price relative
Source: HSBC Note: Priced at close of 07 Nov 2018
6.00
7.00
8.00
9.00
10.00
11.00
12.00
6.00
7.00
8.00
9.00
10.00
11.00
12.00
2016 2017 2018
China Railway Group A Rel to CSI 300 Index
Financials & valuation: China Railway Group A Hold

EQUITIES ● INDUSTRIALS
November 2018
42
Financial statements
Year to 12/2017a 12/2018e 12/2019e 12/2020e
Profit & loss summary (RMBm)
Revenue 460,067 514,394 556,277 605,112
EBITDA 41,664 42,780 47,232 52,628
Depreciation & amortisation -9,896 -7,734 -8,496 -9,193
Operating profit/EBIT 31,768 35,045 38,736 43,435
Net interest -8,105 -8,686 -9,447 -9,221
PBT 23,651 26,460 29,541 34,671
HSBC PBT 23,651 26,460 29,541 34,671
Taxation -5,109 -5,821 -6,499 -7,628
Net profit 20,943 19,739 22,142 26,143
HSBC net profit 16,895 18,721 21,124 25,125
Cash flow summary (RMBm)
Cash flow from operations 53,093 18,074 31,286 35,780
Capex -40,712 -45,620 -46,519 -47,484
Cash flow from investment -45,619 -47,666 -48,637 -49,670
Dividends -4,163 -4,931 -4,966 -5,446
Change in net debt -32,755 34,523 15,282 13,688
Balance sheet summary (RMBm)
Intangible fixed assets 161,158 194,332 227,300 260,064
Tangible fixed assets 62,256 66,968 72,023 77,550
Current assets 449,545 456,812 458,213 448,261
Cash & others 129,197 104,674 91,392 62,704
Total assets 849,888 909,357 958,239 998,325
Operating liabilities 375,245 409,107 438,165 472,110
Gross debt 261,202 271,202 273,202 258,202
Net debt 132,005 166,528 181,810 195,498
Shareholders' funds 161,491 176,264 192,960 212,856
Invested capital 168,517 204,331 227,979 251,060
Ratio, growth and per share analysis
Year to 12/2017a 12/2018e 12/2019e 12/2020e
Y-o-y % change
Revenue 13.2 11.8 8.1 8.8
EBITDA 6.9 2.7 10.4 11.4
Operating profit 8.1 10.3 10.5 12.1
PBT 4.5 11.9 11.6 17.4
HSBC EPS 5.1 10.8 12.8 18.9
Ratios (%)
Revenue/IC (x) 2.4 2.8 2.6 2.5
ROIC 12.9 14.7 14.0 14.1
ROE 10.5 10.6 10.9 11.8
ROA 3.6 3.3 3.4 3.6
EBITDA margin 9.1 8.3 8.5 8.7
Operating profit margin 6.9 6.8 7.0 7.2
EBITDA/net interest (x) 5.1 4.9 5.0 5.7
Net debt/equity 81.7 94.5 94.2 91.8
Net debt/EBITDA (x) 3.2 3.9 3.8 3.7
CF from operations/net debt 40.2 10.9 17.2 18.3
Per share data (RMB)
EPS Rep (diluted) 1.24 1.22 1.37 1.62
HSBC EPS (diluted) 1.04 1.16 1.31 1.55
DPS 0.24 0.24 0.27 0.32
Book value 9.98 10.90 11.93 13.16
Valuation data
Year to 12/2017a 12/2018e 12/2019e 12/2020e
EV/sales 0.6 0.6 0.6 0.6
EV/EBITDA 6.6 7.2 6.8 6.4
EV/IC 1.6 1.5 1.4 1.3
PE* 6.4 5.8 5.1 4.3
PB 0.7 0.6 0.6 0.5
Dividend yield (%) 3.6 3.7 4.1 4.8
* Based on HSBC EPS (diluted)
ESG metrics
Environmental Indicators 12/2017a Governance Indicators 12/2017a
GHG emission intensity* 69.7 No. of board members 9
Energy intensity* 258.9 Average board tenure (years) 3.3
CO2 reduction policy Yes Female board members (%) 0
Social Indicators 12/2017a Board members independence (%) 33.3
Employee costs as % of revenues n/a
Employee turnover (%) n/a
Diversity policy n/a
Source: Company data, HSBC
* GHG intensity and energy intensity are measured in kg and kWh respectively against revenue in USD ‘000s
Issuer information
Share price (HKD) 7.56 Free float 36%
Target price (HKD) 9.10 Sector Construction & Engineering
Reuters (Equity) 1800.HK Country China
Bloomberg (Equity) 1800 HK Analyst Anderson Chow
Market cap (USDm) 25,378 Contact +852 2996 6669
Price relative
Source: HSBC Note: Priced at close of 07 Nov 2018
5.10
6.10
7.10
8.10
9.10
10.10
11.10
12.10
5.10
6.10
7.10
8.10
9.10
10.10
11.10
12.10
2016 2017 2018
China Communications Co Rel to HSCEI
Financials & valuation: China Communications Co Buy

43
EQUITIES ● INDUSTRIALS
November 2018
Financial statements
Year to 12/2017a 12/2018e 12/2019e 12/2020e
Profit & loss summary (RMBm)
Revenue 460,067 514,394 556,277 605,112
EBITDA 41,664 42,780 47,232 52,628
Depreciation & amortisation -9,896 -7,734 -8,496 -9,193
Operating profit/EBIT 31,768 35,045 38,736 43,435
Net interest -8,105 -8,686 -9,447 -9,221
PBT 23,651 26,460 29,541 34,671
HSBC PBT 23,651 26,460 29,541 34,671
Taxation -5,109 -5,821 -6,499 -7,628
Net profit 19,925 18,721 21,124 25,125
HSBC net profit 16,895 18,721 21,124 25,125
Cash flow summary (RMBm)
Cash flow from operations 53,093 18,074 38,321 41,429
Capex -40,712 -45,620 -46,519 -47,484
Cash flow from investment -45,619 -47,666 -48,637 -49,670
Dividends -4,163 -4,931 -4,966 -5,446
Change in net debt -32,755 34,523 15,282 13,688
Balance sheet summary (RMBm)
Intangible fixed assets 161,158 194,332 227,300 260,064
Tangible fixed assets 62,256 66,968 72,023 77,550
Current assets 449,545 456,812 458,213 448,261
Cash & others 129,197 104,674 91,392 62,704
Total assets 849,888 909,357 958,239 998,325
Operating liabilities 375,925 409,787 438,845 472,790
Gross debt 261,202 271,202 273,202 258,202
Net debt 132,005 166,528 181,810 195,498
Shareholders' funds 180,922 176,264 192,960 212,856
Invested capital 167,837 203,651 227,299 250,380
Ratio, growth and per share analysis
Year to 12/2017a 12/2018e 12/2019e 12/2020e
Y-o-y % change
Revenue 13.2 11.8 8.1 8.8
EBITDA 6.9 2.7 10.4 11.4
Operating profit 8.1 10.3 10.5 12.1
PBT 4.5 11.9 11.6 17.4
HSBC EPS 5.1 10.8 12.8 18.9
Ratios (%)
Revenue/IC (x) 2.4 2.8 2.6 2.5
ROIC 13.0 14.7 14.0 14.2
ROE 9.3 10.6 10.9 11.8
ROA 3.6 3.3 3.4 3.6
EBITDA margin 9.1 8.3 8.5 8.7
Operating profit margin 6.9 6.8 7.0 7.2
EBITDA/net interest (x) 5.1 4.9 5.0 5.7
Net debt/equity 73.0 94.5 94.2 91.8
Net debt/EBITDA (x) 3.2 3.9 3.8 3.7
CF from operations/net debt 40.2 10.9 21.1 21.2
Per share data (RMB)
EPS Rep (diluted) 1.24 1.16 1.31 1.55
HSBC EPS (diluted) 1.04 1.16 1.31 1.55
DPS 0.24 0.24 0.27 0.32
Book value 11.19 10.90 11.93 13.16
Valuation data
Year to 12/2017a 12/2018e 12/2019e 12/2020e
EV/sales 0.6 0.6 0.6 0.6
EV/EBITDA 6.6 7.2 6.8 6.4
EV/IC 1.6 1.5 1.4 1.3
PE* 11.9 10.7 9.5 8.0
PB 1.1 1.1 1.0 0.9
Dividend yield (%) 1.9 2.0 2.2 2.6
* Based on HSBC EPS (diluted)
ESG metrics
Environmental Indicators 12/2017a Governance Indicators 12/2017a
GHG emission intensity* 69.7 No. of board members 9
Energy intensity* 258.9 Average board tenure (years) 3.3
CO2 reduction policy Yes Female board members (%) 0
Social Indicators 12/2017a Board members independence (%) 33.3
Employee costs as % of revenues n/a
Employee turnover (%) n/a
Diversity policy n/a
Source: Company data, HSBC
* GHG intensity and energy intensity are measured in kg and kWh respectively against revenue in USD ‘000s
Issuer information
Share price (RMB) 12.43 Free float 36%
Target price (RMB) 8.10 Sector Construction & Engineering
Reuters (Equity) 601800.SS Country China
Bloomberg (Equity) 601800 CH Analyst Anderson Chow
Market cap (USDm) 25,378 Contact +852 2996 6669
Price relative
Source: HSBC Note: Priced at close of 07 Nov 2018
9.00
11.00
13.00
15.00
17.00
19.00
21.00
9.00
11.00
13.00
15.00
17.00
19.00
21.00
2016 2017 2018
China Communications Co A Rel to CSI 300 Index
Financials & valuation: China Communications Co A Reduce

EQUITIES ● INDUSTRIALS
November 2018
44
Financial statements
Year to 12/2017a 12/2018e 12/2019e 12/2020e
Profit & loss summary (HKDm)
Revenue 50,153 57,428 67,265 77,805
EBITDA 7,052 7,695 8,945 10,365
Depreciation & amortisation -282 -307 -316 -325
Operating profit/EBIT 6,770 7,388 8,629 10,040
Net interest -871 -1,515 -1,633 -1,625
PBT 6,790 6,813 7,978 9,446
HSBC PBT 6,790 6,813 7,978 9,446
Taxation -1,256 -1,173 -1,328 -1,597
Net profit 5,490 5,626 6,635 7,831
HSBC net profit 5,044 5,626 6,635 7,831
Cash flow summary (HKDm)
Cash flow from operations -4,846 -1,673 2,698 11,512
Capex -324 -380 -392 -403
Cash flow from investment -6,450 -380 -392 -403
Dividends -1,565 -1,010 -1,688 -1,990
Change in net debt 5,975 3,345 -619 -9,119
Balance sheet summary (HKDm)
Intangible fixed assets 6,327 6,146 5,972 5,803
Tangible fixed assets 41,349 39,707 45,303 41,865
Current assets 55,439 64,468 70,633 86,844
Cash & others 17,593 20,248 20,867 29,986
Total assets 118,479 126,638 139,219 152,868
Operating liabilities 46,255 45,528 53,319 61,277
Gross debt 33,277 39,277 39,277 39,277
Net debt 15,684 19,030 18,411 9,292
Shareholders' funds 38,088 40,997 45,771 51,445
Invested capital 39,267 44,545 47,722 43,249
Ratio, growth and per share analysis
Year to 12/2017a 12/2018e 12/2019e 12/2020e
Y-o-y % change
Revenue 8.5 14.5 17.1 15.7
EBITDA 9.5 9.1 16.2 15.9
Operating profit 13.0 9.1 16.8 16.3
PBT 15.8 0.3 17.1 18.4
HSBC EPS 2.1 -6.2 17.9 18.0
Ratios (%)
Revenue/IC (x) 1.6 1.4 1.5 1.7
ROIC 17.1 14.6 15.6 18.3
ROE 13.2 13.7 14.5 15.2
ROA 6.3 5.8 6.2 6.5
EBITDA margin 14.1 13.4 13.3 13.3
Operating profit margin 13.5 12.9 12.8 12.9
EBITDA/net interest (x) 8.1 5.1 5.5 6.4
Net debt/equity 40.8 46.0 39.9 17.9
Net debt/EBITDA (x) 2.2 2.5 2.1 0.9
CF from operations/net debt 14.7 123.9
Per share data (HKD)
EPS Rep (diluted) 1.19 1.11 1.31 1.55
HSBC EPS (diluted) 1.19 1.11 1.31 1.55
DPS 0.35 0.33 0.39 0.47
Book value 7.54 8.12 9.07 10.19
Valuation data
Year to 12/2017a 12/2018e 12/2019e 12/2020e
EV/sales 0.6 0.6 0.4 0.3
EV/EBITDA 4.2 4.1 3.4 1.9
EV/IC 0.7 0.7 0.6 0.5
PE* 4.8 5.1 4.3 3.7
PB 0.8 0.7 0.6 0.6
Dividend yield (%) 6.2 5.9 7.0 8.2
* Based on HSBC EPS (diluted)
ESG metrics
Environmental Indicators 12/2017a Governance Indicators 12/2017a
GHG emission intensity* 165.4 No. of board members 11
Energy intensity* 804.2 Average board tenure (years) 9.2
CO2 reduction policy Yes Female board members (%) 0
Social Indicators 12/2017a Board members independence (%) 36.4
Employee costs as % of revenues n/a
Employee turnover (%) 23.2
Diversity policy Yes
Source: Company data, HSBC
* GHG intensity and energy intensity are measured in kg and kWh respectively against revenue in USD ‘000s
Issuer information
Share price (HKD) 5.67 Free float 43%
Target price (HKD) 9.70 Sector Construction & Engineering
Reuters (Equity) 3311.HK Country China
Bloomberg (Equity) 3311 HK Analyst Anderson Chow
Market cap (USDm) 3,656 Contact +852 2996 6669
Price relative
Source: HSBC Note: Priced at close of 07 Nov 2018
3.90
5.90
7.90
9.90
11.90
13.90
15.90
3.90
5.90
7.90
9.90
11.90
13.90
15.90
2016 2017 2018
China State Construction Rel to HSCEI
Financials & valuation: China State Construction Buy

45
EQUITIES ● INDUSTRIALS
November 2018
Financial statements
Year to 12/2017a 12/2018e 12/2019e 12/2020e
Profit & loss summary (RMBm)
Revenue 8,994 12,176 14,088 14,030
EBITDA 1,718 1,962 2,290 2,266
Depreciation & amortisation -357 -368 -388 -402
Operating profit/EBIT 1,361 1,593 1,903 1,864
Net interest 63 94 78 71
PBT 1,424 1,688 1,981 1,935
HSBC PBT 1,424 1,688 1,981 1,935
Taxation -378 -338 -396 -387
Net profit 1,046 1,349 1,584 1,547
HSBC net profit 1,046 1,349 1,584 1,547
Cash flow summary (RMBm)
Cash flow from operations 1,600 1,130 1,210 2,005
Capex -165 -190 -213 -195
Cash flow from investment 678 -190 -213 -195
Dividends -311 -864 -803 -912
Change in net debt -148 -37 -156 -859
Balance sheet summary (RMBm)
Intangible fixed assets 0 0 0 0
Tangible fixed assets 3,002 2,830 2,655 2,448
Current assets 10,815 11,686 13,348 14,173
Cash & others 3,099 3,137 3,293 4,152
Total assets 13,817 14,516 16,003 16,621
Operating liabilities 4,415 4,594 5,279 5,262
Gross debt 1,503 1,503 1,503 1,503
Net debt -1,596 -1,634 -1,790 -2,649
Shareholders' funds 7,728 8,214 8,995 9,630
Invested capital 6,303 6,785 7,431 7,207
Ratio, growth and per share analysis
Year to 12/2017a 12/2018e 12/2019e 12/2020e
Y-o-y % change
Revenue 74.8 35.4 15.7 -0.4
EBITDA 90.7 14.2 16.7 -1.1
Operating profit 162.9 17.1 19.4 -2.0
PBT 154.7 18.5 17.4 -2.3
HSBC EPS 126.3 29.1 17.4 -2.3
Ratios (%)
Revenue/IC (x) 1.6 1.9 2.0 1.9
ROIC 17.3 19.5 21.5 20.4
ROE 13.5 16.4 17.6 16.1
ROA 7.8 9.5 10.1 9.5
EBITDA margin 19.1 16.1 16.3 16.1
Operating profit margin 15.1 13.1 13.5 13.3
EBITDA/net interest (x)
Net debt/equity -20.7 -19.9 -19.9 -27.5
Net debt/EBITDA (x) -0.9 -0.8 -0.8 -1.2
CF from operations/net debt
Per share data (RMB)
EPS Rep (diluted) 0.24 0.32 0.37 0.36
HSBC EPS (diluted) 0.24 0.32 0.37 0.36
DPS 0.14 0.16 0.18 0.18
Book value 1.81 1.92 2.10 2.25
Valuation data
Year to 12/2017a 12/2018e 12/2019e 12/2020e
EV/sales 0.7 0.5 0.4 0.4
EV/EBITDA 3.5 3.0 2.5 2.2
EV/IC 0.9 0.9 0.8 0.7
PE* 7.2 5.6 4.8 4.9
PB 1.0 0.9 0.8 0.8
Dividend yield (%) 8.0 9.2 10.1 9.9
* Based on HSBC EPS (diluted)
ESG metrics
Environmental Indicators 12/2017a Governance Indicators 12/2017a
GHG emission intensity* 107.0 No. of board members 9
Energy intensity* 206.1 Average board tenure (years) n/a
CO2 reduction policy Yes Female board members (%) 11.1
Social Indicators 12/2017a Board members independence (%) 33.3
Employee costs as % of revenues 6.1
Employee turnover (%) 12.9
Diversity policy n/a
Source: Company data, HSBC
* GHG intensity and energy intensity are measured in kg and kWh respectively against revenue in USD ‘000s
Issuer information
Share price (HKD) 2.00 Free float 44%
Target price (HKD) 3.00 Sector Machinery
Reuters (Equity) 3339.HK Country China
Bloomberg (Equity) 3339 HK Analyst Anderson Chow
Market cap (USDm) 1,093 Contact +852 2996 6669
Price relative
Source: HSBC Note: Priced at close of 07 Nov 2018
0.51
1.01
1.51
2.01
2.51
3.01
3.51
4.01
4.51
0.51
1.01
1.51
2.01
2.51
3.01
3.51
4.01
4.51
2016 2017 2018
Lonking Rel to HSCEI
Financials & valuation: Lonking Buy

EQUITIES ● INDUSTRIALS
November 2018
46
Financial statements
Year to 12/2017a 12/2018e 12/2019e 12/2020e
Profit & loss summary (RMBm)
Revenue 20,608 34,480 43,000 45,404
EBITDA 2,090 3,498 3,710 3,886
Depreciation & amortisation -924 -742 -750 -752
Operating profit/EBIT 1,166 2,757 2,960 3,133
Net interest -1,443 -931 -873 -1,020
PBT 9,379 2,105 2,098 2,124
HSBC PBT 9,379 2,105 2,098 2,124
Taxation 1,425 -316 -315 -319
Net profit 10,888 1,699 1,694 1,715
HSBC net profit 1,342 1,699 1,694 1,715
Cash flow summary (RMBm)
Cash flow from operations 2,453 2,869 -1,936 2,469
Capex 2,493 -810 -787 -801
Cash flow from investment -852 -810 -787 -801
Dividends -1,179 -1,403 -462 -339
Change in net debt -4,726 -935 4,056 -305
Balance sheet summary (RMBm)
Intangible fixed assets 4,338 4,311 4,262 4,219
Tangible fixed assets 15,603 18,612 20,395 20,966
Current assets 50,674 47,720 48,987 51,174
Cash & others 7,148 4,083 -2,973 -2,669
Total assets 75,892 76,049 79,061 81,787
Operating liabilities 15,793 18,510 23,077 24,340
Gross debt 28,644 24,644 21,644 21,644
Net debt 21,496 20,561 24,617 24,313
Shareholders' funds 37,540 38,900 40,255 41,628
Invested capital 47,674 48,050 53,540 54,687
Ratio, growth and per share analysis
Year to 12/2017a 12/2018e 12/2019e 12/2020e
Y-o-y % change
Revenue 43.0 67.3 24.7 5.6
EBITDA 67.4 6.1 4.7
Operating profit 136.4 7.4 5.9
PBT -77.6 -0.3 1.2
HSBC EPS 23.9 -0.3 1.2
Ratios (%)
Revenue/IC (x) 0.4 0.7 0.8 0.8
ROIC 3.0 5.3 5.3 5.2
ROE 3.6 4.4 4.3 4.2
ROA 15.7 3.6 3.4 3.2
EBITDA margin 10.1 10.1 8.6 8.6
Operating profit margin 5.7 8.0 6.9 6.9
EBITDA/net interest (x) 1.4 3.8 4.3 3.8
Net debt/equity 56.3 51.9 59.9 57.1
Net debt/EBITDA (x) 10.3 5.9 6.6 6.3
CF from operations/net debt 11.4 14.0 10.2
Per share data (RMB)
EPS Rep (diluted) 1.43 0.22 0.22 0.22
HSBC EPS (diluted) 0.18 0.22 0.22 0.22
DPS 0.20 0.04 0.04 0.04
Book value 4.92 4.99 5.16 5.34
Valuation data
Year to 12/2017a 12/2018e 12/2019e 12/2020e
EV/sales 2.0 1.2 1.0 1.0
EV/EBITDA 19.9 11.6 12.0 11.4
EV/IC 0.9 0.8 0.8 0.8
PE* 13.9 11.2 11.3 11.1
PB 0.5 0.5 0.5 0.5
Dividend yield (%) 8.4 1.8 1.8 1.8
* Based on HSBC EPS (diluted)
ESG metrics
Environmental Indicators 12/2017a Governance Indicators 12/2017a
GHG emission intensity* 34.4 No. of board members 7
Energy intensity* 66.0 Average board tenure (years) 4.5
CO2 reduction policy Yes Female board members (%) 14.3
Social Indicators 12/2017a Board members independence (%) 57.1
Employee costs as % of revenues 10.1
Employee turnover (%) n/a
Diversity policy n/a
Source: Company data, HSBC
* GHG intensity and energy intensity are measured in kg and kWh respectively against revenue in USD ‘000s
Issuer information
Share price (HKD) 2.77 Free float 48%
Target price (HKD) 3.90 Sector Machinery
Reuters (Equity) 1157.HK Country China
Bloomberg (Equity) 1157 HK Analyst Anderson Chow
Market cap (USDm) 3,676 Contact +852 2996 6669
Price relative
Source: HSBC Note: Priced at close of 07 Nov 2018
1.60
2.10
2.60
3.10
3.60
4.10
4.60
1.60
2.10
2.60
3.10
3.60
4.10
4.60
2016 2017 2018
Zoomlion Heavy Industry Rel to HSCEI
Financials & valuation: Zoomlion Heavy Industry Buy

47
EQUITIES ● INDUSTRIALS
November 2018
Financial statements
Year to 12/2017a 12/2018e 12/2019e 12/2020e
Profit & loss summary (RMBm)
Revenue 20,608 34,480 43,000 45,404
EBITDA 2,090 3,498 3,710 3,886
Depreciation & amortisation -924 -742 -750 -752
Operating profit/EBIT 1,166 2,757 2,960 3,133
Net interest -1,443 -931 -873 -1,020
PBT 9,379 2,105 2,098 2,124
HSBC PBT 9,379 2,105 2,098 2,124
Taxation 1,425 -316 -315 -319
Net profit 10,888 1,699 1,694 1,715
HSBC net profit 1,342 1,699 1,694 1,715
Cash flow summary (RMBm)
Cash flow from operations 2,453 2,869 -1,936 2,469
Capex 2,493 -810 -787 -801
Cash flow from investment -852 -810 -787 -801
Dividends -1,179 -1,403 -462 -339
Change in net debt -4,726 -935 4,056 -305
Balance sheet summary (RMBm)
Intangible fixed assets 4,338 4,311 4,262 4,219
Tangible fixed assets 15,603 18,612 20,395 20,966
Current assets 50,674 47,720 48,987 51,174
Cash & others 7,148 4,083 -2,973 -2,669
Total assets 75,892 76,049 79,061 81,787
Operating liabilities 15,793 18,510 23,077 24,340
Gross debt 28,644 24,644 21,644 21,644
Net debt 21,496 20,561 24,617 24,313
Shareholders' funds 37,540 38,900 40,255 41,628
Invested capital 47,674 48,050 53,540 54,687
Ratio, growth and per share analysis
Year to 12/2017a 12/2018e 12/2019e 12/2020e
Y-o-y % change
Revenue 43.0 67.3 24.7 5.6
EBITDA 67.4 6.1 4.7
Operating profit 136.4 7.4 5.9
PBT -77.6 -0.3 1.2
HSBC EPS 23.9 -0.3 1.2
Ratios (%)
Revenue/IC (x) 0.4 0.7 0.8 0.8
ROIC 3.0 5.3 5.3 5.2
ROE 3.6 4.4 4.3 4.2
ROA 15.7 3.6 3.4 3.2
EBITDA margin 10.1 10.1 8.6 8.6
Operating profit margin 5.7 8.0 6.9 6.9
EBITDA/net interest (x) 1.4 3.8 4.3 3.8
Net debt/equity 56.3 51.9 59.9 57.1
Net debt/EBITDA (x) 10.3 5.9 6.6 6.3
CF from operations/net debt 11.4 14.0 10.2
Per share data (RMB)
EPS Rep (diluted) 1.43 0.22 0.22 0.22
HSBC EPS (diluted) 0.18 0.22 0.22 0.22
DPS 0.20 0.04 0.04 0.04
Book value 4.92 4.99 5.16 5.34
Valuation data
Year to 12/2017a 12/2018e 12/2019e 12/2020e
EV/sales 2.0 1.2 1.0 1.0
EV/EBITDA 19.9 11.6 12.0 11.4
EV/IC 0.9 0.8 0.8 0.8
PE* 19.5 15.8 15.8 15.6
PB 0.7 0.7 0.7 0.6
Dividend yield (%) 5.9 1.3 1.3 1.3
* Based on HSBC EPS (diluted)
ESG metrics
Environmental Indicators 12/2017a Governance Indicators 12/2017a
GHG emission intensity* 34.4 No. of board members 7
Energy intensity* 66.0 Average board tenure (years) 4.5
CO2 reduction policy Yes Female board members (%) 14.3
Social Indicators 12/2017a Board members independence (%) 57.1
Employee costs as % of revenues 10.1
Employee turnover (%) n/a
Diversity policy n/a
Source: Company data, HSBC
* GHG intensity and energy intensity are measured in kg and kWh respectively against revenue in USD ‘000s
Issuer information
Share price (RMB) 3.44 Free float 48%
Target price (RMB) 3.50 Sector Machinery
Reuters (Equity) 000157.SZ Country China
Bloomberg (Equity) 000157 CH Analyst Anderson Chow
Market cap (USDm) 3,675 Contact +852 2996 6669
Price relative
Source: HSBC Note: Priced at close of 07 Nov 2018
2.80
3.30
3.80
4.30
4.80
5.30
5.80
2.80
3.30
3.80
4.30
4.80
5.30
5.80
2016 2017 2018
Zoomlion Heavy Industry A Rel to CSI 300 Index
Financials & valuation: Zoomlion Heavy Industry A Hold

EQUITIES ● INDUSTRIALS
November 2018
48
Financial statements
Year to 12/2017a 12/2018e 12/2019e 12/2020e
Profit & loss summary (RMBm)
Revenue 207,044 218,401 238,045 246,816
EBITDA 22,346 24,203 26,228 29,087
Depreciation & amortisation -6,036 -6,278 -6,196 -6,159
Operating profit/EBIT 16,310 17,925 20,032 22,927
Net interest -1,437 -1,472 -1,399 -1,325
PBT 15,399 16,979 19,160 22,129
HSBC PBT 15,399 16,979 19,160 22,129
Taxation -2,388 -3,033 -3,257 -3,762
Net profit 10,799 12,131 13,993 16,370
HSBC net profit 10,799 12,131 13,993 16,370
Cash flow summary (RMBm)
Cash flow from operations 13,474 10,230 23,727 27,200
Capex -10,856 -8,072 -8,204 -8,257
Cash flow from investment -2,975 -8,072 -8,204 -8,257
Dividends -3,389 -3,779 -4,852 -6,297
Change in net debt -9,129 -816 -12,408 -14,468
Balance sheet summary (RMBm)
Intangible fixed assets 4,186 3,545 3,042 2,647
Tangible fixed assets 103,893 108,435 108,664 107,262
Current assets 255,878 239,262 260,812 277,983
Cash & others 56,264 54,980 65,289 77,656
Total assets 375,171 362,982 384,785 400,684
Operating liabilities 176,638 156,260 169,140 174,744
Gross debt 43,998 41,898 39,798 37,698
Net debt -12,266 -13,083 -25,491 -39,958
Shareholders' funds 121,559 129,910 139,051 149,124
Invested capital 131,055 140,002 138,091 135,492
Ratio, growth and per share analysis
Year to 12/2017a 12/2018e 12/2019e 12/2020e
Y-o-y % change
Revenue -7.6 5.5 9.0 3.7
EBITDA -6.2 8.3 8.4 10.9
Operating profit -8.1 9.9 11.8 14.5
PBT -9.1 10.3 12.8 15.5
HSBC EPS -9.1 12.3 15.3 17.0
Ratios (%)
Revenue/IC (x) 1.6 1.6 1.7 1.8
ROIC 10.8 10.9 12.0 13.9
ROE 9.5 9.6 10.4 11.4
ROA 4.0 4.1 4.6 5.0
EBITDA margin 10.8 11.1 11.0 11.8
Operating profit margin 7.9 8.2 8.4 9.3
EBITDA/net interest (x) 15.5 16.4 18.8 22.0
Net debt/equity -8.6 -8.6 -15.6 -22.8
Net debt/EBITDA (x) -0.5 -0.5 -1.0 -1.4
CF from operations/net debt
Per share data (RMB)
EPS Rep (diluted) 0.38 0.42 0.49 0.57
HSBC EPS (diluted) 0.38 0.42 0.49 0.57
DPS 0.12 0.13 0.17 0.22
Book value 4.24 4.53 4.85 5.20
Valuation data
Year to 12/2017a 12/2018e 12/2019e 12/2020e
EV/sales 1.0 1.0 0.8 0.7
EV/EBITDA 9.6 8.8 7.6 6.3
EV/IC 1.6 1.5 1.4 1.4
PE* 16.8 15.0 13.0 11.1
PB 1.5 1.4 1.3 1.2
Dividend yield (%) 1.9 2.1 2.7 3.5
* Based on HSBC EPS (diluted)
ESG metrics
Environmental Indicators 12/2017a Governance Indicators 12/2017a
GHG emission intensity* n/a No. of board members 8
Energy intensity* n/a Average board tenure (years) 2.1
CO2 reduction policy n/a Female board members (%) 0
Social Indicators 12/2017a Board members independence (%) 50
Employee costs as % of revenues 14
Employee turnover (%) n/a
Diversity policy n/a
Source: Company data, HSBC
* GHG intensity and energy intensity are measured in kg and kWh respectively against revenue in USD ‘000s
Issuer information
Share price (HKD) 7.16 Free float 98%
Target price (HKD) 8.80 Sector Machinery
Reuters (Equity) 1766.HK Country China
Bloomberg (Equity) 1766 HK Analyst Anderson Chow
Market cap (USDm) 34,305 Contact +852 2996 6669
Price relative
Source: HSBC Note: Priced at close of 07 Nov 2018
4.60
5.60
6.60
7.60
8.60
9.60
10.60
4.60
5.60
6.60
7.60
8.60
9.60
10.60
2016 2017 2018
CRRC Corporation Rel to HSCEI
Financials & valuation: CRRC Corporation Buy

49
EQUITIES ● INDUSTRIALS
November 2018
Financial statements
Year to 12/2017a 12/2018e 12/2019e 12/2020e
Profit & loss summary (RMBm)
Revenue 207,044 218,401 238,045 246,816
EBITDA 22,346 24,203 26,228 29,087
Depreciation & amortisation -6,036 -6,278 -6,196 -6,159
Operating profit/EBIT 16,310 17,925 20,032 22,927
Net interest -1,437 -1,472 -1,399 -1,325
PBT 15,399 16,979 19,160 22,129
HSBC PBT 15,399 16,979 19,160 22,129
Taxation -2,388 -3,033 -3,257 -3,762
Net profit 10,799 12,131 13,993 16,370
HSBC net profit 10,799 12,131 13,993 16,370
Cash flow summary (RMBm)
Cash flow from operations 13,474 10,230 23,727 27,200
Capex -10,856 -8,072 -8,204 -8,257
Cash flow from investment -2,975 -8,072 -8,204 -8,257
Dividends -3,389 -3,779 -4,852 -6,297
Change in net debt -9,129 -816 -12,408 -14,468
FCF equity 2,983 4,384 17,125 20,373
Balance sheet summary (RMBm)
Intangible fixed assets 4,186 3,545 3,042 2,647
Tangible fixed assets 103,893 108,435 108,664 107,262
Current assets 255,878 239,262 260,812 277,983
Cash & others 56,264 54,980 65,289 77,656
Total assets 375,171 362,982 384,785 400,684
Operating liabilities 176,638 156,260 169,140 174,744
Gross debt 43,998 41,898 39,798 37,698
Net debt -12,266 -13,083 -25,491 -39,958
Shareholders' funds 121,559 129,910 139,051 149,124
Invested capital 131,055 140,002 138,091 135,492
Ratio, growth and per share analysis
Year to 12/2017a 12/2018e 12/2019e 12/2020e
Y-o-y % change
Revenue -7.6 5.5 9.0 3.7
EBITDA -6.2 8.3 8.4 10.9
Operating profit -8.1 9.9 11.8 14.5
PBT -9.1 10.3 12.8 15.5
HSBC EPS -9.1 12.3 15.3 17.0
Ratios (%)
Revenue/IC (x) 1.6 1.6 1.7 1.8
ROIC 10.8 10.9 12.0 13.9
ROE 9.5 9.6 10.4 11.4
ROA 4.0 4.1 4.6 5.0
EBITDA margin 10.8 11.1 11.0 11.8
Operating profit margin 7.9 8.2 8.4 9.3
EBITDA/net interest (x) 15.5 16.4 18.8 22.0
Net debt/equity -8.6 -8.6 -15.6 -22.8
Net debt/EBITDA (x) -0.5 -0.5 -1.0 -1.4
CF from operations/net debt
Per share data (RMB)
EPS Rep (diluted) 0.38 0.42 0.49 0.57
HSBC EPS (diluted) 0.38 0.42 0.49 0.57
DPS 0.12 0.13 0.17 0.22
Book value 4.24 4.53 4.85 5.20
Valuation data
Year to 12/2017a 12/2018e 12/2019e 12/2020e
EV/sales 1.0 1.0 0.8 0.7
EV/EBITDA 9.6 8.8 7.6 6.3
EV/IC 1.6 1.5 1.4 1.4
PE* 22.9 20.4 17.7 15.1
PB 2.0 1.9 1.8 1.7
FCF yield (%) 1.3 1.9 7.6 9.1
Dividend yield (%) 1.4 1.5 2.0 2.5
* Based on HSBC EPS (diluted)
ESG metrics
Environmental Indicators 12/2017a Governance Indicators 12/2017a
GHG emission intensity* n/a No. of board members 8
Energy intensity* n/a Average board tenure (years) 2.1
CO2 reduction policy n/a Female board members (%) 0
Social Indicators 12/2017a Board members independence (%) 50
Employee costs as % of revenues 14
Employee turnover (%) n/a
Diversity policy n/a
Source: Company data, HSBC
* GHG intensity and energy intensity are measured in kg and kWh respectively against revenue in USD ‘000s
Issuer information
Share price (RMB) 8.62 Free float 64%
Target price (RMB) 7.80 Sector Machinery
Reuters (Equity) 601766.SS Country China
Bloomberg (Equity) 601766 CH Analyst Anderson Chow
Market cap (USDm) 34,305 Contact +852 2996 6669
Price relative
Source: HSBC Note: Priced at close of 07 Nov 2018
6.50
7.50
8.50
9.50
10.50
11.50
12.50
13.50
6.50
7.50
8.50
9.50
10.50
11.50
12.50
13.50
2016 2017 2018
CRRC Corporation A Rel to CSI 300 Index
Financials & valuation: CRRC Corporation A Hold

EQUITIES ● INDUSTRIALS
November 2018
50
Financial statements
Year to 12/2017a 12/2018e 12/2019e 12/2020e
Profit & loss summary (RMBm)
Revenue 15,144 15,232 16,729 17,767
EBITDA 3,201 3,311 3,819 4,005
Depreciation & amortisation -375 -360 -396 -438
Operating profit/EBIT 2,826 2,951 3,423 3,567
Net interest 32 0 10 24
PBT 2,874 2,967 3,450 3,608
HSBC PBT 2,874 2,967 3,450 3,608
Taxation -312 -326 -380 -397
Net profit 2,523 2,681 3,117 3,260
HSBC net profit 2,523 2,681 3,117 3,260
Cash flow summary (RMBm)
Cash flow from operations 2,129 2,954 3,977 4,245
Capex -107 -1,098 -910 -795
Cash flow from investment -604 -1,538 -1,350 -1,236
Dividends -529 -536 -623 -652
Change in net debt -552 -2,089 -2,724 -3,098
Balance sheet summary (RMBm)
Intangible fixed assets 1,153 1,076 1,008 947
Tangible fixed assets 3,614 3,928 4,510 4,928
Current assets 21,613 21,056 24,302 27,752
Cash & others 3,808 5,897 8,621 11,719
Total assets 26,650 26,330 30,090 33,897
Operating liabilities 8,096 7,135 7,737 8,264
Gross debt 424 424 424 424
Net debt -3,384 -5,473 -8,197 -11,295
Shareholders' funds 17,764 18,501 21,704 25,032
Invested capital 14,475 13,028 13,462 13,644
Ratio, growth and per share analysis
Year to 12/2017a 12/2018e 12/2019e 12/2020e
Y-o-y % change
Revenue 3.3 0.6 9.8 6.2
EBITDA -11.5 3.5 15.3 4.9
Operating profit -14.6 4.4 16.0 4.2
PBT -13.8 3.2 16.3 4.6
HSBC EPS -13.1 6.2 16.3 4.6
Ratios (%)
Revenue/IC (x) 1.1 1.1 1.3 1.3
ROIC 18.3 19.1 23.0 23.4
ROE 15.0 14.8 15.5 13.9
ROA 10.1 10.0 10.9 10.0
EBITDA margin 21.1 21.7 22.8 22.5
Operating profit margin 18.7 19.4 20.5 20.1
EBITDA/net interest (x) 103276.4
Net debt/equity -18.7 -29.2 -37.4 -44.8
Net debt/EBITDA (x) -1.1 -1.7 -2.1 -2.8
CF from operations/net debt
Per share data (RMB)
EPS Rep (diluted) 2.15 2.28 2.65 2.77
HSBC EPS (diluted) 2.15 2.28 2.65 2.77
DPS 0.45 0.46 0.53 0.55
Book value 15.11 15.74 18.46 21.30
Valuation data
Year to 12/2017a 12/2018e 12/2019e 12/2020e
EV/sales 2.7 2.5 2.1 1.8
EV/EBITDA 12.7 11.7 9.4 8.2
EV/IC 2.8 3.0 2.7 2.4
PE* 17.6 16.6 14.2 13.6
PB 2.5 2.4 2.0 1.8
Dividend yield (%) 1.2 1.2 1.4 1.5
* Based on HSBC EPS (diluted)
ESG metrics
Environmental Indicators 12/2017a Governance Indicators 12/2017a
GHG emission intensity* n/a No. of board members 10
Energy intensity* n/a Average board tenure (years) 5.1
CO2 reduction policy n/a Female board members (%) 10
Social Indicators 12/2017a Board members independence (%) 50
Employee costs as % of revenues 11.2
Employee turnover (%) 2.8
Diversity policy Yes
Source: Company data, HSBC
* GHG intensity and energy intensity are measured in kg and kWh respectively against revenue in USD ‘000s
Issuer information
Share price (HKD) 42.75 Free float 42%
Target price (HKD) 46.00 Sector Electrical Equipment
Reuters (Equity) 3898.HK Country China
Bloomberg (Equity) 3898 HK Analyst Anderson Chow
Market cap (USDm) 6,417 Contact +852 2996 6669
Price relative
Source: HSBC Note: Priced at close of 07 Nov 2018
27.00
32.00
37.00
42.00
47.00
52.00
57.00
27.00
32.00
37.00
42.00
47.00
52.00
57.00
2016 2017 2018
Zhuzhou CRRC Times Rel to HSCEI
Financials & valuation: Zhuzhou CRRC Times Buy

51
EQUITIES ● INDUSTRIALS
November 2018
Notes

EQUITIES ● INDUSTRIALS
November 2018
52
Notes
53
EQUITIES ● INDUSTRIALS
November 2018
Disclosure appendix
Analyst Certification
The following analyst(s), economist(s), or strategist(s) who is(are) primarily responsible for this report, including any analyst(s)
whose name(s) appear(s) as author of an individual section or sections of the report and any analyst(s) named as the covering
analyst(s) of a subsidiary company in a sum-of-the-parts valuation certifies(y) that the opinion(s) on the subject security(ies) or
issuer(s), any views or forecasts expressed in the section(s) of which such individual(s) is(are) named as author(s), and any other
views or forecasts expressed herein, including any views expressed on the back page of the research report, accurately reflect
their personal view(s) and that no part of their compensation was, is or will be directly or indirectly related to the specific
recommendation(s) or views contained in this research report: Anderson Chow, Lesley Liu, Howard Lau, CFA and Corey Chan
Important disclosures
Equities: Stock ratings and basis for financial analysis
HSBC and its affiliates, including the issuer of this report (“HSBC”) believes an investor's decision to buy or sell a stock should
depend on individual circumstances such as the investor's existing holdings, risk tolerance and other considerations and that
investors utilise various disciplines and investment horizons when making investment decisions. Ratings should not be used or
relied on in isolation as investment advice. Different securities firms use a variety of ratings terms as well as different rating
systems to describe their recommendations and therefore investors should carefully read the definitions of the ratings used in
each research report. Further, investors should carefully read the entire research report and not infer its contents from the rating
because research reports contain more complete information concerning the analysts' views and the basis for the rating.
From 23rd March 2015 HSBC has assigned ratings on the following basis:
The target price is based on the analyst’s assessment of the stock’s actual current value, although we expect it to take six to 12
months for the market price to reflect this. When the target price is more than 20% above the current share price, the stock will
be classified as a Buy; when it is between 5% and 20% above the current share price, the stock may be classified as a Buy or a
Hold; when it is between 5% below and 5% above the current share price, the stock will be classified as a Hold; when it is between
5% and 20% below the current share price, the stock may be classified as a Hold or a Reduce; and when it is more than 20%
below the current share price, the stock will be classified as a Reduce.
Our ratings are re-calibrated against these bands at the time of any 'material change' (initiation or resumption of coverage, change
in target price or estimates).
Upside/Downside is the percentage difference between the target price and the share price.
Prior to this date, HSBC’s rating structure was applied on the following basis:
For each stock we set a required rate of return calculated from the cost of equity for that stock’s domestic or, as appropriate,
regional market established by our strategy team. The target price for a stock represented the value the analyst expected the
stock to reach over our performance horizon. The performance horizon was 12 months. For a stock to be classified as Overweight,
the potential return, which equals the percentage difference between the current share price and the target price, including the
forecast dividend yield when indicated, had to exceed the required return by at least 5 percentage points over the succeeding 12
months (or 10 percentage points for a stock classified as Volatile*). For a stock to be classified as Underweight, the stock was
expected to underperform its required return by at least 5 percentage points over the succeeding 12 months (or 10 percentage
points for a stock classified as Volatile*). Stocks between these bands were classified as Neutral.
*A stock was classified as volatile if its historical volatility had exceeded 40%, if the stock had been listed for less than 12 months
(unless it was in an industry or sector where volatility is low) or if the analyst expected significant volatility. However, stocks which
we did not consider volatile may in fact also have behaved in such a way. Historical volatility was defined as the past month's
average of the daily 365-day moving average volatilities. In order to avoid misleadingly frequent changes in rating, however,
volatility had to move 2.5 percentage points past the 40% benchmark in either direction for a stock's status to change.
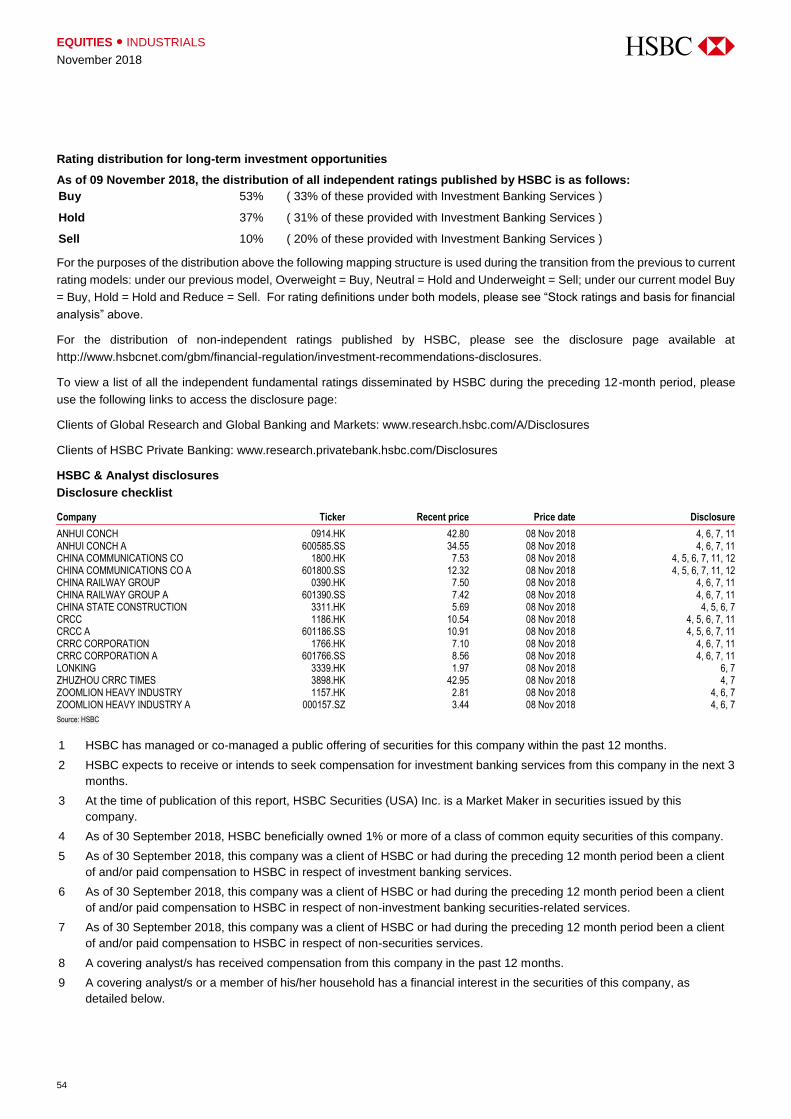
EQUITIES ● INDUSTRIALS
November 2018
54
Rating distribution for long-term investment opportunities
As of 09 November 2018, the distribution of all independent ratings published by HSBC is as follows:
For the purposes of the distribution above the following mapping structure is used during the transition from the previous to current
rating models: under our previous model, Overweight = Buy, Neutral = Hold and Underweight = Sell; under our current model Buy
= Buy, Hold = Hold and Reduce = Sell. For rating definitions under both models, please see “Stock ratings and basis for financial
analysis” above.
For the distribution of non-independent ratings published by HSBC, please see the disclosure page available at
http://www.hsbcnet.com/gbm/financial-regulation/investment-recommendations-disclosures.
To view a list of all the independent fundamental ratings disseminated by HSBC during the preceding 12-month period, please
use the following links to access the disclosure page:
Clients of Global Research and Global Banking and Markets: www.research.hsbc.com/A/Disclosures
Clients of HSBC Private Banking: www.research.privatebank.hsbc.com/Disclosures
HSBC & Analyst disclosures
Disclosure checklist
Company Ticker Recent price Price date Disclosure
ANHUI CONCH 0914.HK 42.80 08 Nov 2018 4, 6, 7, 11 ANHUI CONCH A 600585.SS 34.55 08 Nov 2018 4, 6, 7, 11 CHINA COMMUNICATIONS CO 1800.HK 7.53 08 Nov 2018 4, 5, 6, 7, 11, 12 CHINA COMMUNICATIONS CO A 601800.SS 12.32 08 Nov 2018 4, 5, 6, 7, 11, 12 CHINA RAILWAY GROUP 0390.HK 7.50 08 Nov 2018 4, 6, 7, 11 CHINA RAILWAY GROUP A 601390.SS 7.42 08 Nov 2018 4, 6, 7, 11 CHINA STATE CONSTRUCTION 3311.HK 5.69 08 Nov 2018 4, 5, 6, 7 CRCC 1186.HK 10.54 08 Nov 2018 4, 5, 6, 7, 11 CRCC A 601186.SS 10.91 08 Nov 2018 4, 5, 6, 7, 11 CRRC CORPORATION 1766.HK 7.10 08 Nov 2018 4, 6, 7, 11 CRRC CORPORATION A 601766.SS 8.56 08 Nov 2018 4, 6, 7, 11 LONKING 3339.HK 1.97 08 Nov 2018 6, 7 ZHUZHOU CRRC TIMES 3898.HK 42.95 08 Nov 2018 4, 7 ZOOMLION HEAVY INDUSTRY 1157.HK 2.81 08 Nov 2018 4, 6, 7 ZOOMLION HEAVY INDUSTRY A 000157.SZ 3.44 08 Nov 2018 4, 6, 7
Source: HSBC
1 HSBC has managed or co-managed a public offering of securities for this company within the past 12 months.
2 HSBC expects to receive or intends to seek compensation for investment banking services from this company in the next 3
months.
3 At the time of publication of this report, HSBC Securities (USA) Inc. is a Market Maker in securities issued by this
company.
4 As of 30 September 2018, HSBC beneficially owned 1% or more of a class of common equity securities of this company.
5 As of 30 September 2018, this company was a client of HSBC or had during the preceding 12 month period been a client
of and/or paid compensation to HSBC in respect of investment banking services.
6 As of 30 September 2018, this company was a client of HSBC or had during the preceding 12 month period been a client
of and/or paid compensation to HSBC in respect of non-investment banking securities-related services.
7 As of 30 September 2018, this company was a client of HSBC or had during the preceding 12 month period been a client
of and/or paid compensation to HSBC in respect of non-securities services.
8 A covering analyst/s has received compensation from this company in the past 12 months.
9 A covering analyst/s or a member of his/her household has a financial interest in the securities of this company, as
detailed below.
Buy 53% ( 33% of these provided with Investment Banking Services )
Hold 37% ( 31% of these provided with Investment Banking Services )
Sell 10% ( 20% of these provided with Investment Banking Services )

55
EQUITIES ● INDUSTRIALS
November 2018
10 A covering analyst/s or a member of his/her household is an officer, director or supervisory board member of this
company, as detailed below.
11 At the time of publication of this report, HSBC is a non-US Market Maker in securities issued by this company and/or in
securities in respect of this company
12 As of 05 Nov 2018, HSBC beneficially held a net long position of more than 0.5% of this company’s total issued share
capital, calculated according to the SSR methodology.
13 As of 05 Nov 2018, HSBC beneficially held a net short position of more than 0.5% of this company’s total issued share
capital, calculated according to the SSR methodology. HSBC and its affiliates will from time to time sell to and buy from customers the securities/instruments, both equity and debt
(including derivatives) of companies covered in HSBC Research on a principal or agency basis or act as a market maker or
liquidity provider in the securities/instruments mentioned in this report.
Analysts, economists, and strategists are paid in part by reference to the profitability of HSBC which includes investment banking,
sales & trading, and principal trading revenues.
Whether, or in what time frame, an update of this analysis will be published is not determined in advance.
Non-U.S. analysts may not be associated persons of HSBC Securities (USA) Inc, and therefore may not be subject to FINRA
Rule 2241 or FINRA Rule 2242 restrictions on communications with the subject company, public appearances and trading
securities held by the analysts.
Economic sanctions imposed by the EU and OFAC prohibit transacting or dealing in new debt or equity of Russian SSI entities.
This report does not constitute advice in relation to any securities issued by Russian SSI entities on or after July 16 2014 and as
such, this report should not be construed as an inducement to transact in any sanctioned securities.
For disclosures in respect of any company mentioned in this report, please see the most recently published report on that company
available at www.hsbcnet.com/research. HSBC Private Banking clients should contact their Relationship Manager for queries
regarding other research reports. In order to find out more about the proprietary models used to produce this report, please contact
the authoring analyst.
Additional disclosures
1 This report is dated as at 09 November 2018.
2 All market data included in this report are dated as at close 07 November 2018, unless a different date and/or a specific
time of day is indicated in the report.
3 HSBC has procedures in place to identify and manage any potential conflicts of interest that arise in connection with its
Research business. HSBC's analysts and its other staff who are involved in the preparation and dissemination of
Research operate and have a management reporting line independent of HSBC's Investment Banking business.
Information Barrier procedures are in place between the Investment Banking, Principal Trading, and Research businesses
to ensure that any confidential and/or price sensitive information is handled in an appropriate manner.
4 You are not permitted to use, for reference, any data in this document for the purpose of (i) determining the interest
payable, or other sums due, under loan agreements or under other financial contracts or instruments, (ii) determining the
price at which a financial instrument may be bought or sold or traded or redeemed, or the value of a financial instrument,
and/or (iii) measuring the performance of a financial instrument.
Production & distribution disclosures
1. This report was produced and signed off by the author on 08 Nov 2018 10:15 GMT.
2. In order to see when this report was first disseminated please see the disclosure page available at
https://www.research.hsbc.com/R/34/PhVmVLV

EQUITIES ● INDUSTRIALS
November 2018
56
Disclaimer
Legal entities as at 30 November 2017
‘UAE’ HSBC Bank Middle East Limited, Dubai; ‘HK’ The Hongkong and Shanghai Banking Corporation Limited, Hong Kong;
‘TW’ HSBC Securities (Taiwan) Corporation Limited; 'CA' HSBC Securities (Canada) Inc.; HSBC Bank, Paris Branch; HSBC
France; ‘DE’ HSBC Trinkaus & Burkhardt AG, Düsseldorf; 000 HSBC Bank (RR), Moscow; ‘IN’ HSBC Securities and Capital
Markets (India) Private Limited, Mumbai; ‘JP’ HSBC Securities (Japan) Limited, Tokyo; ‘EG’ HSBC Securities Egypt SAE,
Cairo; ‘CN’ HSBC Investment Bank Asia Limited, Beijing Representative Office; The Hongkong and Shanghai Banking
Corporation Limited, Singapore Branch; The Hongkong and Shanghai Banking Corporation Limited, Seoul Securities
Branch; The Hongkong and Shanghai Banking Corporation Limited, Seoul Branch; HSBC Securities (South Africa) (Pty) Ltd,
Johannesburg; HSBC Bank plc, London, Madrid, Milan, Stockholm, Tel Aviv; ‘US’ HSBC Securities (USA) Inc, New York;
HSBC Yatirim Menkul Degerler AS, Istanbul; HSBC México, SA, Institución de Banca Múltiple, Grupo Financiero HSBC;
HSBC Bank Australia Limited; HSBC Bank Argentina SA; HSBC Saudi Arabia Limited; The Hongkong and Shanghai Banking
Corporation Limited, New Zealand Branch incorporated in Hong Kong SAR; The Hongkong and Shanghai Banking
Corporation Limited, Bangkok Branch; PT Bank HSBC Indonesia; HSBC Qianhai Securities Limited
Issuer of report
The Hongkong and Shanghai Banking Corporation
Limited
Level 19, 1 Queen’s Road Central
Hong Kong SAR
Telephone: +852 2843 9111
Fax: +852 2596 0200
Website: www.research.hsbc.com
This document has been issued by The Hongkong and Shanghai Banking Corporation Limited (“HSBC”) in the conduct of its Hong Kong regulated business for the information of its institutional
and professional investor (as defined by Securities and Future Ordinance (Chapter 571)) customers; it is not intended for and should not be distributed to retail customers in Hong Kong. The
Hongkong and Shanghai Banking Corporation Limited is regulated by the Hong Kong Monetary Authority. All enquires by recipients in Hong Kong must be directed to your HSBC contact in Hong
Kong. If it is received by a customer of an affiliate of HSBC, its provision to the recipient is subject to the terms of business in place between the recipient and such affiliate. This document is not
and should not be construed as an offer to sell or the solicitation of an offer to purchase or subscribe for any investment. HSBC has based this document on information obtained from sources it
believes to be reliable but which it has not independently verified; HSBC makes no guarantee, representation or warranty and accepts no responsibility or liability as to its accuracy or completeness.
Expressions of opinion are those of the Research Division of HSBC only and are subject to change without notice. From time to time research analysts conduct site visits of covered issuers. HSBC
policies prohibit research analysts from accepting payment or reimbursement for travel expenses from the issuer for such visits. HSBC and its affiliates and/or their officers, directors and employees
may have positions in any securities mentioned in this document (or in any related investment) and may from time to time add to or dispose of any such securities (or investment). HSBC and its
affiliates may act as market maker or have assumed an underwriting commitment in the securities of companies discussed in this document (or in related investments), may sell them to or buy
them from customers on a principal basis and may also perform or seek to perform investment banking or underwriting services for or relating to those companies.
HSBC Securities (USA) Inc. accepts responsibility for the content of this research report prepared by its non-US foreign affiliate. All U.S. persons receiving and/or accessing this report and wishing
to effect transactions in any security discussed herein should do so with HSBC Securities (USA) Inc. in the United States and not with its non-US foreign affiliate, the issuer of this report.
In the UK this report may only be distributed to persons of a kind described in Article 19(5) of the Financial Services and Markets Act 2000 (Financial Promotion) Order 2005. The protections
afforded by the UK regulatory regime are available only to those dealing with a representative of HSBC Bank plc in the UK. In Singapore, this publication is distributed by The Hongkong and
Shanghai Banking Corporation Limited, Singapore Branch for the general information of institutional investors or other persons specified in Sections 274 and 304 of the Securities and Futures Act
(Chapter 289) (“SFA”) and accredited investors and other persons in accordance with the conditions specified in Sections 275 and 305 of the SFA. This publication is not a prospectus as defined
in the SFA. It may not be further distributed in whole or in part for any purpose. The Hongkong and Shanghai Banking Corporation Limited Singapore Branch is regulated by the Monetary Authority
of Singapore. Recipients in Singapore should contact a "Hongkong and Shanghai Banking Corporation Limited, Singapore Branch" representative in respect of any matters arising from, or in
connection with this report. In Australia, this publication has been distributed by The Hongkong and Shanghai Banking Corporation Limited (ABN 65 117 925 970, AFSL 301737) for the general
information of its “wholesale” customers (as defined in the Corporations Act 2001). Where distributed to retail customers, this research is distributed by HSBC Bank Australia Limited (ABN 48 006
434 162, AFSL No. 232595). These respective entities make no representations that the products or services mentioned in this document are available to persons in Australia or are necessarily
suitable for any particular person or appropriate in accordance with local law. No consideration has been given to the particular investment objectives, financial situation or particular needs of any
recipient. This publication is distributed in New Zealand by The Hongkong and Shanghai Banking Corporation Limited, New Zealand Branch incorporated in Hong Kong SAR.
In Japan, this publication has been distributed by HSBC Securities (Japan) Limited. It may not be further distributed in whole or in part for any purpose. In Korea, this publication is distributed by
The Hongkong and Shanghai Banking Corporation Limited, Seoul Securities Branch ("HBAP SLS") for the general information of professional investors specified in Article 9 of the Financial
Investment Services and Capital Markets Act (“FSCMA”). This publication is not a prospectus as defined in the FSCMA. It may not be further distributed in whole or in part for any purpose. HBAP
SLS is regulated by the Financial Services Commission and the Financial Supervisory Service of Korea.
In Canada, this document has been distributed by HSBC Securities (Canada) Inc. (member IIROC), and/or its affiliates. The information contained herein is under no circumstances to be construed
as investment advice in any province or territory of Canada and is not tailored to the needs of the recipient. No securities commission or similar regulatory authority in Canada has reviewed or in
any way passed judgment upon these materials, the information contained herein or the merits of the securities described herein, and any representation to the contrary is an offense.
If you are an HSBC Private Banking (“PB”) customer with approval for receipt of relevant research publications by an applicable HSBC legal entity, you are eligible to receive this publication. To
be eligible to receive such publications, you must have agreed to the applicable HSBC entity’s terms and conditions (“KRC Terms”) for access to the KRC, and the terms and conditions of any
other internet banking service offered by that HSBC entity through which you will access research publications using the KRC. Distribution of this publication is the sole responsibility of the HSBC
entity with whom you have agreed the KRC Terms.
If you do not meet the aforementioned eligibility requirements please disregard this publication and, if you are a customer of PB, please notify your Relationship Manager. Receipt of research
publications is strictly subject to the KRC Terms, which can be found at https://research.privatebank.hsbc.com/ – we draw your attention also to the provisions contained in the Important Notes
section therein.
© Copyright 2018, The Hongkong and Shanghai Banking Corporation Limited, ALL RIGHTS RESERVED. No part of this publication may be reproduced, stored in a retrieval system, or transmitted,
on any form or by any means, electronic, mechanical, photocopying, recording, or otherwise, without the prior written permission of The Hongkong and Shanghai Banking Corporation Limited.
MCI (P) 116/01/2018, MCI (P) 016/02/2018.
[1107474]

Industrials
Analyst Michael Hagmann +44 20 7991 2405 [email protected]
Analyst Scott Cagehin +44 20 7992 1444 [email protected]
Head of Research, Korea Brian Cho +822 3706 8750 [email protected]
Analyst Paul Choi +822 3706 8758 [email protected]
Analyst Anderson Chow +852 2996 6669 [email protected]
Analyst Puneet Gulati +91 22 2268 1235 [email protected]
Analyst Yeon Lee +822 3706 8778 [email protected]
Analyst Helen Fang +852 2996 6942 [email protected]
Analyst Sean McLoughlin +44 20 7991 3464 [email protected]
Analyst Edward Perry +44 20 7991 8415 [email protected]
Analyst Shrinidhi Karlekar +91 22 6164 0689 [email protected]
Analyst Puneet Garg +91 80 4555 2756 [email protected]
Analyst Nick Webster +27 11 676 4537 [email protected]
Analyst Jörg-André Finke, CFA +49 211 910 3722 [email protected]
Analyst Somesh Agarwal +65 6658 0616 [email protected]
Analyst Richard Schramm +49 211 910 2837 [email protected]
Analyst Philip Saliba +49 211 910 2672 [email protected]
Autos
Analyst Horst Schneider +49 211 910 3285 [email protected]
Analyst Yogesh Aggarwal +91 22 2268 1246 [email protected]
Analyst Henning Cosman +44 207 991 0369 [email protected]
Analyst Wei Sim +852 2996 6602 [email protected]
Analyst Tracy Li +852 2996 6751 [email protected]
Analyst Vivek Gedda +91 22 6164 0693 [email protected]
Analyst Vikas Ahuja +91 22 6164 0690 [email protected]
Analyst Jeremy Chen +8862 6631 2866 [email protected]
Transportation
Analyst Andrew Lobbenberg +44 20 7991 6816 [email protected]
Analyst Edward Stanford +44 20 7992 4207 [email protected]
Analyst Parash Jain +852 2996 6717 [email protected]
Analyst Achal Kumar +91 80 4555 2751 [email protected]
Analyst Joe Thomas +44 20 7992 3618 [email protected]
Analyst Alexandre Falcao +1 212 525 4449 [email protected]
Analyst Augusto A Ensiki +1 212 525 4915 [email protected]
Analyst Mauricio Arellano +52 55 5721 3863 [email protected]
Analyst Teresa Yan +852 2914 9934 [email protected]
Associate Deepak Maurya +852 2822 4292 [email protected]
Construction & Engineering
Head of French Research Pierre Bosset +33 1 56 52 43 10 [email protected]
Analyst Jonathan Brandt, CFA +1 212 525 4499 [email protected]
Analyst Eduardo Altamirano +1 212 525 8333 [email protected]
Analyst, LatAm Cement and Constructions, Real Estate Javier Santiago +52 55 5721 2397 [email protected]
Analyst Coleman Clyde +1 212 525 2441 [email protected]
Global Equity Head of Building Materials John Fraser-Andrews +44 20 7991 6732 [email protected]
Analyst Lesley Liu +852 2822 4524 [email protected]
Analyst Nicholas Paton, CFA +971 4 423 6923 [email protected]
Analyst Emily Li +852 2996 6599 [email protected]
Analyst Howard Lau, CFA +852 2996 6625 [email protected]
Specialist Sales
Rod Turnbull +44 20 7991 5363 [email protected]
Oliver Magis +49 21 1910 4402 [email protected]
Billal Ismail +44 20 7991 5362 [email protected]
Jean Gael Tabet +44 20 7991 5342 [email protected]
Global Industrials Research Team

*Employed by a non-US affiliate of HSBC Securities (USA) Inc, and is not registered/qualified pursuant to FINRA regulations.
Main contributors
Issuer of report:The Hongkong and Shanghai Banking Corporation Limited
Level 19, 1 Queen’s Road CentralHong Kong SAR
Telephone: +852 2843 9111Fax: +852 2596 0200
Website: www.research.hsbc.com
Anderson Chow* Global Co-Head of Industrials Research The Hongkong and Shanghai Banking Corporation Limited +852 2996 6669 | [email protected]
Anderson Chow joined HSBC in July 2011 and is Global Co-Head of Industrials Research based in Hong Kong. Led by Anderson, the HSBC Asia Pacific Industrials Research team was ranked No. 1 in the Asiamoney Brokers Poll in 2015 and 2017. He won the Thomson Reuters Best Stock Picker Award for the automotive and machinery sector in 2017 for the HK/China market. He has worked in the financial industry for about two decades, most recently as Head of Asia Infrastructure and Transport Research for a leading Asian brokerage, where he managed a team of over 10 analysts that was highly ranked in a number of key industry polls. He holds a master’s degree in commerce from the University of Sydney, Australia. Anderson started his career as an equity analyst at Accident Compensation Corp in New Zealand in 1998.
Lesley Liu* Analyst, Infrastructure & Industrials Research The Hongkong and Shanghai Banking Corporation Limited +852 2822 4524 | [email protected]
Lesley Liu joined HSBC in July 2013 as an infrastructure and industrials research analyst focusing on China. Prior to HSBC, she worked for another broker for two years, where she covered several sectors including infrastructure. Lesley has also worked for two years in an auditing firm in Hong Kong. She holds a bachelor’s degree in accounting from Hong Kong Baptist University.
Howard Lau*, CFA Analyst, Materials & Infrastructure Research The Hongkong and Shanghai Banking Corporation Limited +852 2996 6625 | [email protected]
Howard Lau joined HSBC Research in January 2018 and is an analyst covering the China building materials and environmental services sectors. Before joining HSBC, he worked for four years at a US investment bank in Hong Kong where he covered the China basic materials and utilities sectors. Prior to that, he was a research associate at another US investment bank where his team was ranked second in the 2012-13 Institutional Investor All-Asia survey (materials sector). Howard is a CFA charterholder and has a bachelor’s degree in accounting and finance from the University of Michigan’s Ross School of Business.
Corey Chan* (S1700518100001) Head of A-share Infrastructure Research HSBC Qianhai Securities Limited +86 755 8898 3404 | [email protected]
Corey Chan joined HSBC Qianhai Securities Limited in 2018 as Head of A-share Infrastructure Research. Previously, Corey worked as an equity analyst for a US investment bank in Hong Kong, where he focused on the China capital goods sector. He holds a bachelor of finance degree from the University of Hong Kong.
Pratik Gothi* Associate Bangalore


