Embed Size (px)
Citation preview
EBSD investigation on microstructuretransformation in low carbon steel duringcontinuous cooling
B. Su1, H.-P. Lin1, J.-C. Kuo*1 and Y.-T. Pan2
In this study the microstructure in low carbon steel during phase transformation was
systematically investigated using dilatometry, optical microscopy as well as EBSD. The
specimens after annealing at 900uC for 3 min were subsequently cooled at 0?3–100uC s21 for
dilatometry, in order to determine the continuous cooling transformation (CCT) diagram. Then the
microstructures were analysed by optical microscopy (OM) and electron backscattering
diffraction (EBSD). Dilatometry, optical microscopy as well as image quality technique in EBSD
were combined together to determine the continuous cooling transformation diagram of low
carbon steel. As increasing in the cooling rate from 1 to 30uC s21, the fraction of ferrite is almost
90% and the phase transformation occurs from pearite to bainite at the cooling rate between 10 to
20uC s21.
Dans cette etude, on a examine systematiquement la microstructure de l’acier a faible teneur en
carbone lors de la transformation de phase en utilisant la dilatometrie, la microscopie optique
ainsi que la DERD. Apres un recuit a 900uC pendant 3 min, on a ensuite refroidi les echantillons
entre 0?3 et 100uC s21 pour l’etude de dilatometrie, afin de determiner le diagramme de
transformation en refroidissement continu (CCT). On a ensuite analyse la microstructure par
microscopie optique (MO) et par diffraction des electrons retrodiffuses (DERD). On a combine la
dilatometrie, la microscopie optique ainsi que la technique de haute qualite de l’image de DERD
pour determiner le diagramme de transformation en refroidissement continu de l’acier a faible
teneur en carbone. Avec l’augmentation de la vitesse de refroidissement de 1 a 30uC s21, la
fraction de ferrite atteint presque 90% et la transformation de phase de perlite a bainite a lieu a
une vitesse de refroidissement entre 10 et 20uC s21.
Keywords: Image quality, EBSD, Phase transformation, Steel, Dilatometry
IntroductionPhase analysis of steels is usually based on the appearanceof microstructure using optical and scanning electronmicroscope. Electron backscatter diffraction (EBSD)technique has been widely applied in analysing grainsize, grain orientation, texture analysis, boundary char-acteristics, and phase identification. Recently, the EBSDbased parameters have been employed to investigaterecrystallisation behaviour and phase transformations in
metals. These parameters are image quality (or called thediffraction pattern quality), orientation and misorienta-tion. Black and Higginson,1 Wilson and Spanos,2 Wilsonet al.3 and Tarasiuk at al.4 proposed the quality ofdiffraction patterns obtained from EBSD to determinethe fraction of partial recrystallisation and phasetransformation in steels. Wu et al.5 developed a newprocedure to characterise complex multi-componentmicrostructures of ferrite and bainite, which was basedon that the distribution of the number distribution of IQvalues. Ryde6 used the contrast of Kikuchi diffractionbands (‘band slope’) to distinguish bainite and ferritephases. Kang et al.7 adopted the grain average of IQto characterise martensite, bainite and ferrite in TRIPsteel.
1Department of Materials Science and Engineering, National Cheng KungUniversity, Tainan 701, Taiwan2China Steel Corporation, Kaohsiung 81233, Taiwan
*Corresponding author, email [email protected]
352
� 2014 Canadian Institute of Mining, Metallurgy and PetroleumPublished by Maney on behalf of the InstituteReceived 15 October 2013; accepted 19 February 2014DOI 10.1179/1879139514Y.0000000126 Canadian Metallurgical Quarterly 2014 VOL 53 NO 3
For the case of orientation, Gourgues et al.8 reportedcrystallographic features of acicular ferrite, bainite, andmartensite microstructures in low alloy steels. Kitaharaet al.9 confirmed that the lath martensite in the steelinvestigated maintained Kurdjumov–Sachs (K–S) orien-tation relationship using EBSD analysis.
Considering misorientation, Lu et al.10 developed amethod to estimate the fraction of recrystallised Alalloys which was based on the point-to-point misor-ientation within the grains. Jazaeri and Humphreys11
quantified the volume fraction of recrystallisation basedon the changes of high angle grain boundary (HAGB)
content for Al–Fe–Mn alloy (AA8066). Zaefferer et al.12
proposed a method based on the kernel averagemisorientation (KAM) to distinguish ferrite and bainiticferrite in a low alloyed TRIP steel. Dziaszyk et al.13
employed the misorientation based methods of kernelaverage misorientation and grain average misorientationto characterise the recrystallised fraction in a Tistabilised interstitial-free (IF) steel.
Although the image quality (IQ) method has beenapplied to characterise microstructures of steels,5 thegoal of the present work is to determine the continuouscooling transformation (CCT) diagram of low carbon
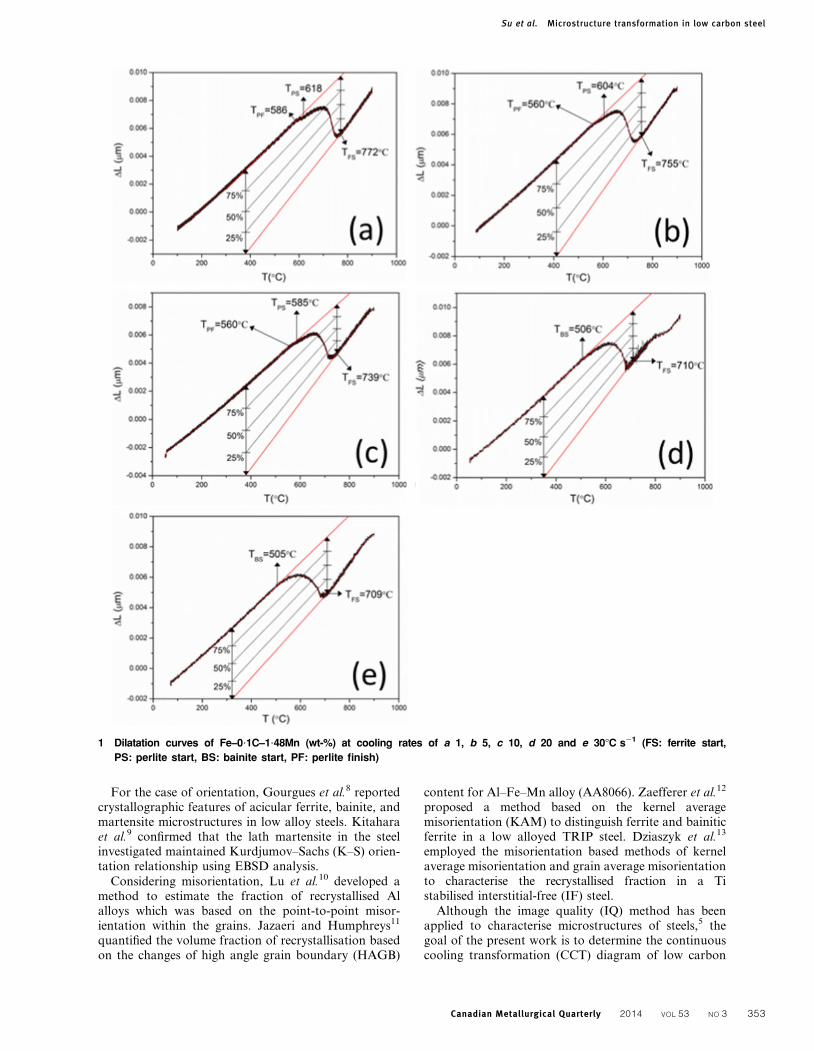
1 Dilatation curves of Fe–0?1C–1?48Mn (wt-%) at cooling rates of a 1, b 5, c 10, d 20 and e 30uC s21 (FS: ferrite start,
PS: perlite start, BS: bainite start, PF: perlite finish)
Su et al. Microstructure transformation in low carbon steel
Canadian Metallurgical Quarterly 2014 VOL 53 NO 3 353
steel. Both the dilatometric method and the imagequality (IQ) method are used to obtain CCT diagramand to understand phase transformations during coolingfor a low carbon steel.
Materials and methodsLow carbon steel consisting of 0?1 wt-%C and 1?48 wt-%Mn was used as an experimental material to investigatethe microstructure transformation of austenite duringcooling. The specimens with 8mm diameter and 12 mmlength were used for determination of continuous coolingtransformation (CCT) diagram. Before austenitising it isimportant to understand the upper critical temperatureAc3 for low carbon steel. In this study the PANDAsoftware was used to calculate and to obtain Ac35819uC.In addition a low austenitising temperature and a shortannealing time were chosen at 900uC and for 3 min toavoid grain coarsening and to measure the microstructureby using EBSD. They were heated up to 900uC with aheating rate of 10uC s21 and then at this temperature for3 min. Subsequently, the cooling rate of 0?3, 0?5, 1, 3, 5, 10,20, 30, 50 and 100uC s21 was chosen for the continuouscooling transformation from 900uC to room temperature.During cooling the elongation change of specimens wasrecorded as a function of temperature.
After cooling the microstructures of low carbon steelwere analysed by optical microscopy (OM) and electronbackscattering diffraction (EBSD). The grain size andphase fraction obtained from OM and EBSD werecompared. The sample preparation for OM analysis andEBSD measurements was grinded, polished with 5, 1and 0?3 mm alumina, and at the end polished with0?04 mm colloidal silica. EBSD measurement wasperformed using a field emission electron microscope(SEM, JEOL 7001F) with EBSD system (EDAX/TSLTechnology) at 20 kV with a step size of 70 nm. TheEBSD measured area was 2406150 mm. For OManalysis nital etching solution composing of 2 mL nitricacid and 98 mL alcohol was used for revealing themicrostructure of carbon steels.
Results and discussion
Continuous cooling transformationThe phase transformation of low carbon steel containing0?1 wt-%C was investigated by varying the cooling rateof 0?3–100uC s21 from the austenitising temperature of900uC to room temperature. Some of continuous coolingtransformation plots were chosen for cooling rates of 1,5, 10, 20 and 30uC s21 as displayed in Fig. 1a–e. Thelength change recorded during cooling is shown as anexample of 1uC s21 in Fig. 1a. In this curve shown, thephase transformation from austenite to ferrite begins atthe start temperature of ferrite TFS5772uC. On sub-sequent cooling, the other transformation from austeniteto pearlite occurs at the start temperature of pearliteTPS5618uC. As another example of 20uC s21 in Fig. 1d,the transformation from austenite to bainite at the starttemperature of bainite TBS5506uC is observed. A leverrule can be used to calculate the ferrite fraction and by
the way to determine the corresponding temperature ofthe ferrite fraction as shown in Fig. 1.
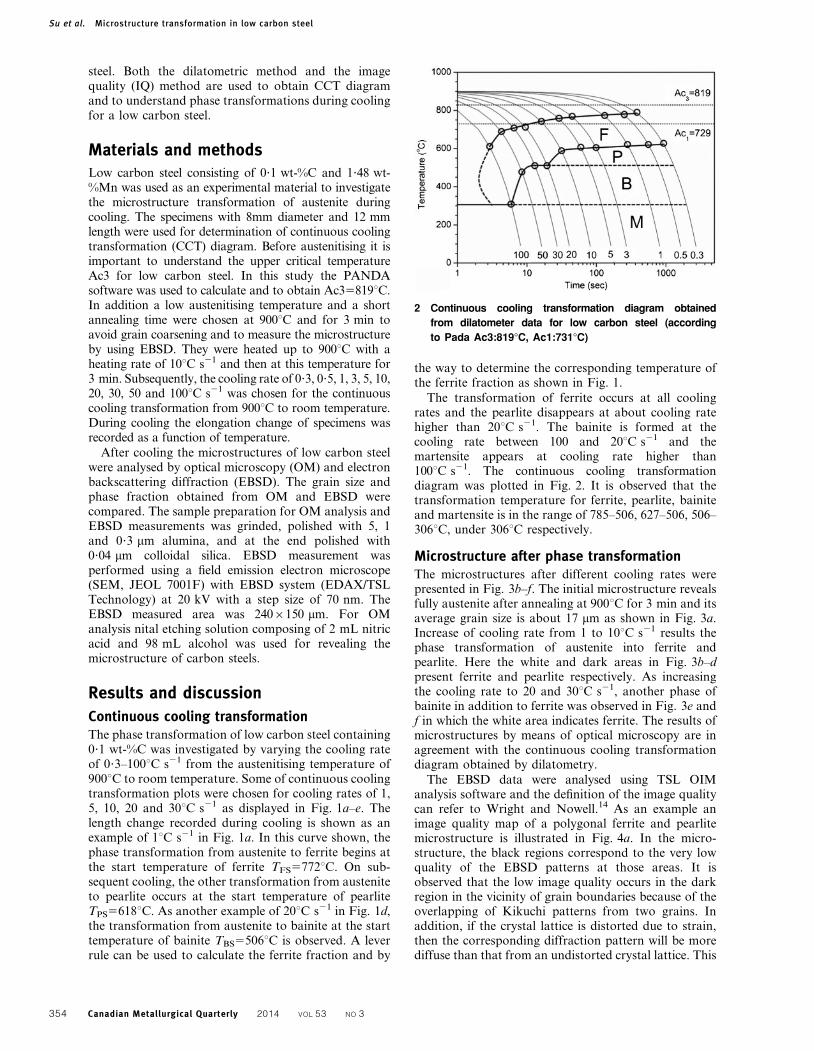
The transformation of ferrite occurs at all coolingrates and the pearlite disappears at about cooling ratehigher than 20uC s21. The bainite is formed at thecooling rate between 100 and 20uC s21 and themartensite appears at cooling rate higher than100uC s21. The continuous cooling transformationdiagram was plotted in Fig. 2. It is observed that thetransformation temperature for ferrite, pearlite, bainiteand martensite is in the range of 785–506, 627–506, 506–306uC, under 306uC respectively.
Microstructure after phase transformationThe microstructures after different cooling rates werepresented in Fig. 3b–f. The initial microstructure revealsfully austenite after annealing at 900uC for 3 min and itsaverage grain size is about 17 mm as shown in Fig. 3a.Increase of cooling rate from 1 to 10uC s21 results thephase transformation of austenite into ferrite andpearlite. Here the white and dark areas in Fig. 3b–dpresent ferrite and pearlite respectively. As increasingthe cooling rate to 20 and 30uC s21, another phase ofbainite in addition to ferrite was observed in Fig. 3e andf in which the white area indicates ferrite. The results ofmicrostructures by means of optical microscopy are inagreement with the continuous cooling transformationdiagram obtained by dilatometry.
The EBSD data were analysed using TSL OIManalysis software and the definition of the image qualitycan refer to Wright and Nowell.14 As an example animage quality map of a polygonal ferrite and pearlitemicrostructure is illustrated in Fig. 4a. In the micro-structure, the black regions correspond to the very lowquality of the EBSD patterns at those areas. It isobserved that the low image quality occurs in the darkregion in the vicinity of grain boundaries because of theoverlapping of Kikuchi patterns from two grains. Inaddition, if the crystal lattice is distorted due to strain,then the corresponding diffraction pattern will be morediffuse than that from an undistorted crystal lattice. This
2 Continuous cooling transformation diagram obtained
from dilatometer data for low carbon steel (according
to Pada Ac3:819uC, Ac1:731uC)
Su et al. Microstructure transformation in low carbon steel
354 Canadian Metallurgical Quarterly 2014 VOL 53 NO 3
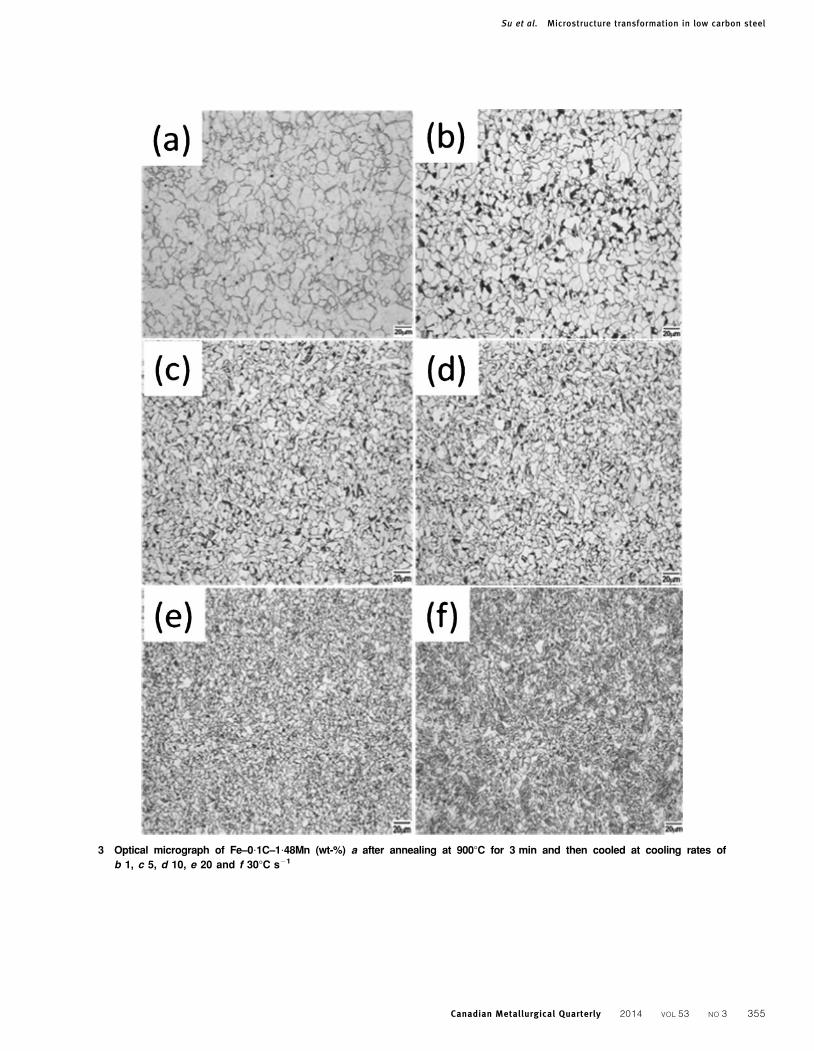
3 Optical micrograph of Fe–0?1C–1?48Mn (wt-%) a after annealing at 900uC for 3 min and then cooled at cooling rates of
b 1, c 5, d 10, e 20 and f 30uC s21
Su et al. Microstructure transformation in low carbon steel
Canadian Metallurgical Quarterly 2014 VOL 53 NO 3 355
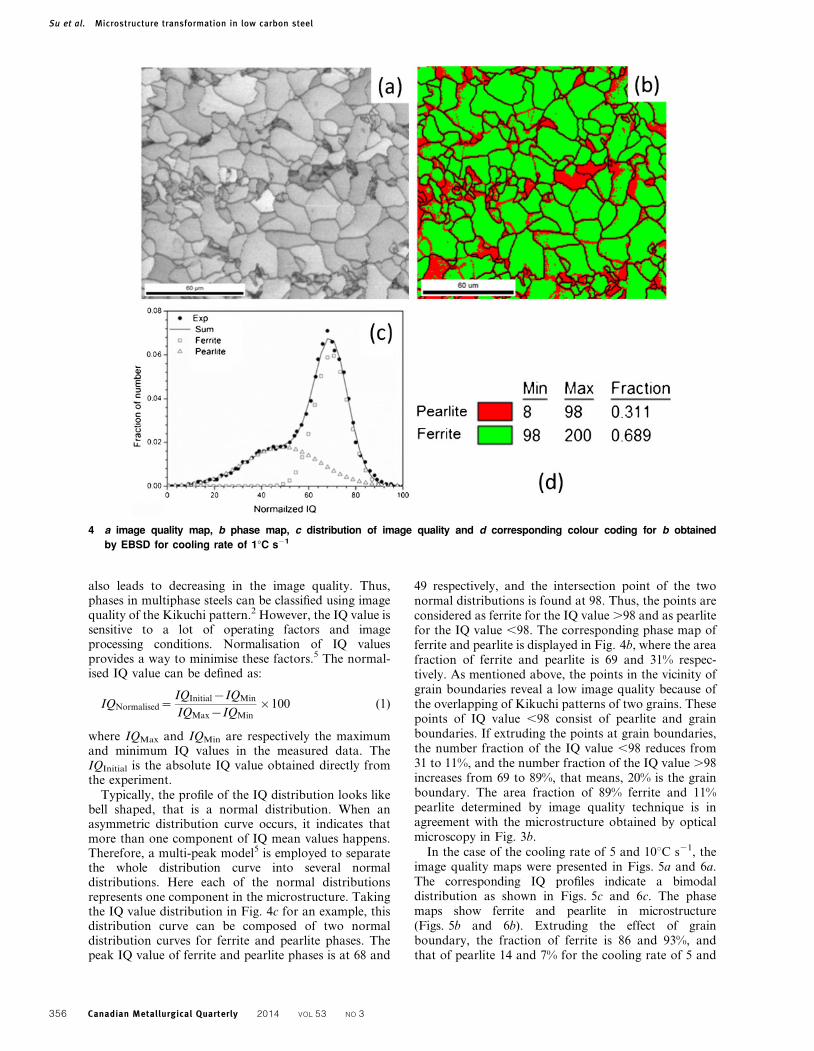
also leads to decreasing in the image quality. Thus,phases in multiphase steels can be classified using imagequality of the Kikuchi pattern.2 However, the IQ value issensitive to a lot of operating factors and imageprocessing conditions. Normalisation of IQ valuesprovides a way to minimise these factors.5 The normal-ised IQ value can be defined as:
IQNormalised~IQInitial{IQMin
IQMax{IQMin
|100 (1)
where IQMax and IQMin are respectively the maximumand minimum IQ values in the measured data. TheIQInitial is the absolute IQ value obtained directly fromthe experiment.
Typically, the profile of the IQ distribution looks likebell shaped, that is a normal distribution. When anasymmetric distribution curve occurs, it indicates thatmore than one component of IQ mean values happens.Therefore, a multi-peak model5 is employed to separatethe whole distribution curve into several normaldistributions. Here each of the normal distributionsrepresents one component in the microstructure. Takingthe IQ value distribution in Fig. 4c for an example, thisdistribution curve can be composed of two normaldistribution curves for ferrite and pearlite phases. Thepeak IQ value of ferrite and pearlite phases is at 68 and
49 respectively, and the intersection point of the twonormal distributions is found at 98. Thus, the points areconsidered as ferrite for the IQ value .98 and as pearlitefor the IQ value ,98. The corresponding phase map offerrite and pearlite is displayed in Fig. 4b, where the areafraction of ferrite and pearlite is 69 and 31% respec-tively. As mentioned above, the points in the vicinity ofgrain boundaries reveal a low image quality because ofthe overlapping of Kikuchi patterns of two grains. Thesepoints of IQ value ,98 consist of pearlite and grainboundaries. If extruding the points at grain boundaries,the number fraction of the IQ value ,98 reduces from31 to 11%, and the number fraction of the IQ value .98increases from 69 to 89%, that means, 20% is the grainboundary. The area fraction of 89% ferrite and 11%pearlite determined by image quality technique is inagreement with the microstructure obtained by opticalmicroscopy in Fig. 3b.
In the case of the cooling rate of 5 and 10uC s21, theimage quality maps were presented in Figs. 5a and 6a.The corresponding IQ profiles indicate a bimodaldistribution as shown in Figs. 5c and 6c. The phasemaps show ferrite and pearlite in microstructure(Figs. 5b and 6b). Extruding the effect of grainboundary, the fraction of ferrite is 86 and 93%, andthat of pearlite 14 and 7% for the cooling rate of 5 and
4 a image quality map, b phase map, c distribution of image quality and d corresponding colour coding for b obtained
by EBSD for cooling rate of 1uC s21
Su et al. Microstructure transformation in low carbon steel
356 Canadian Metallurgical Quarterly 2014 VOL 53 NO 3
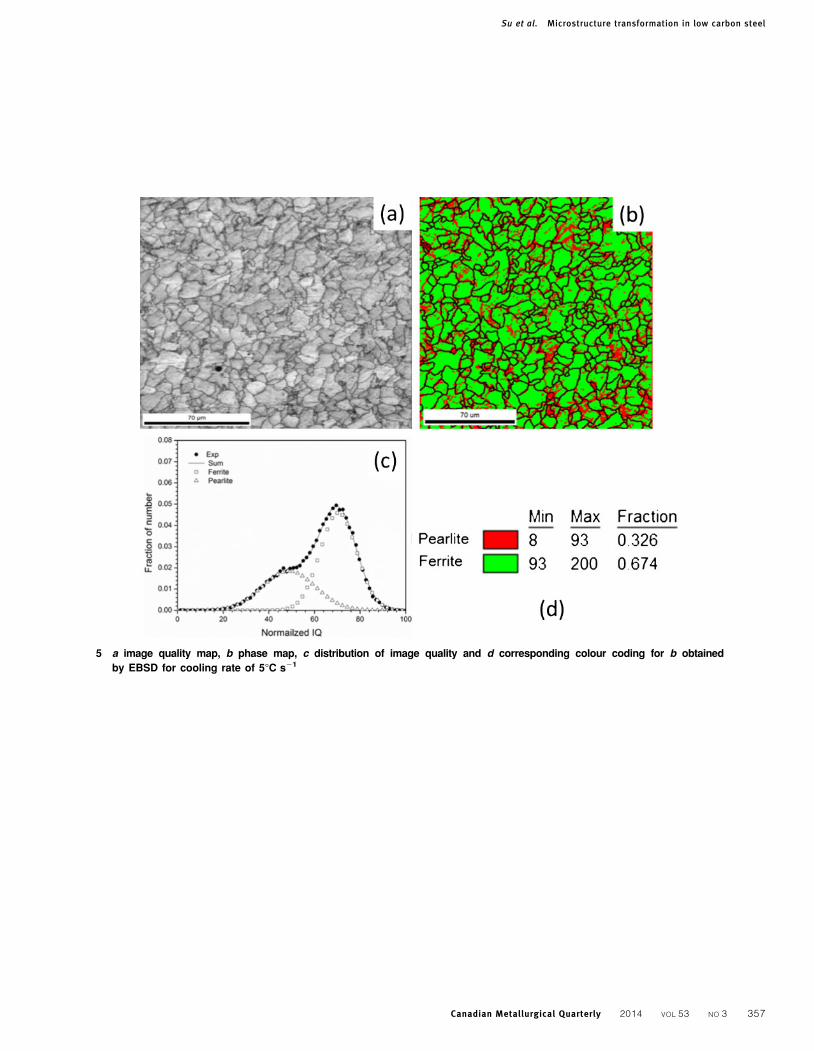
5 a image quality map, b phase map, c distribution of image quality and d corresponding colour coding for b obtained
by EBSD for cooling rate of 5uC s21
Su et al. Microstructure transformation in low carbon steel
Canadian Metallurgical Quarterly 2014 VOL 53 NO 3 357
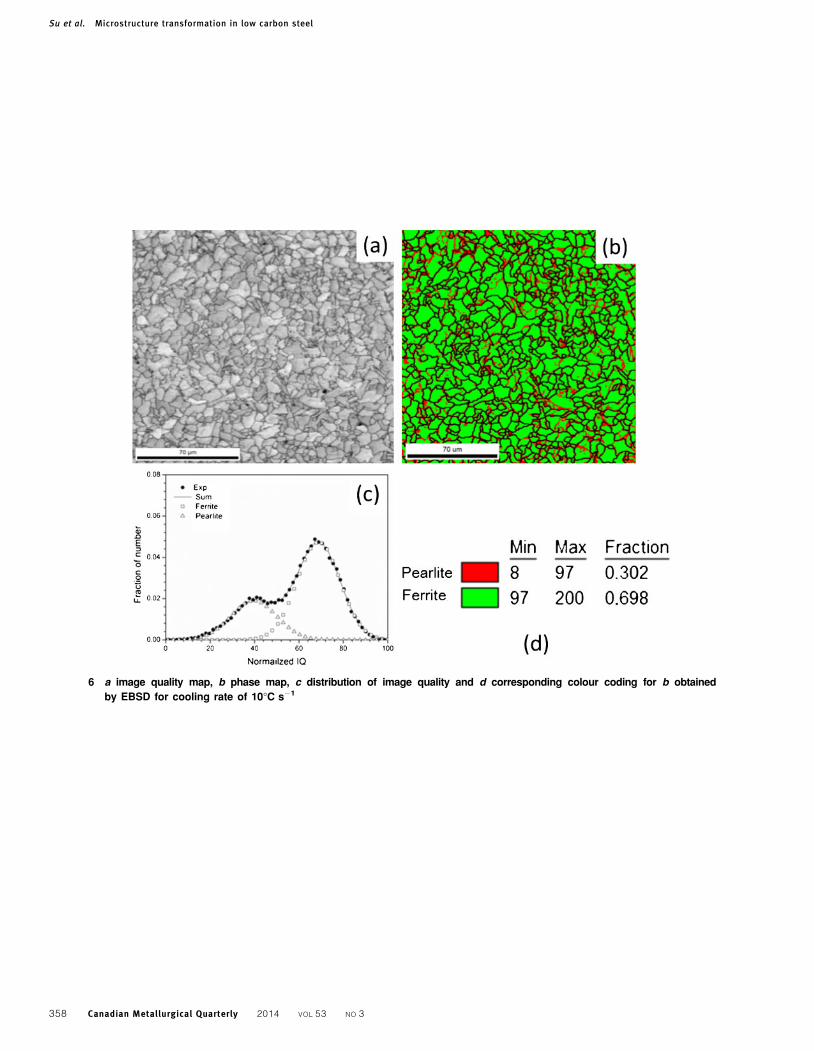
6 a image quality map, b phase map, c distribution of image quality and d corresponding colour coding for b obtained
by EBSD for cooling rate of 10uC s21
Su et al. Microstructure transformation in low carbon steel
358 Canadian Metallurgical Quarterly 2014 VOL 53 NO 3
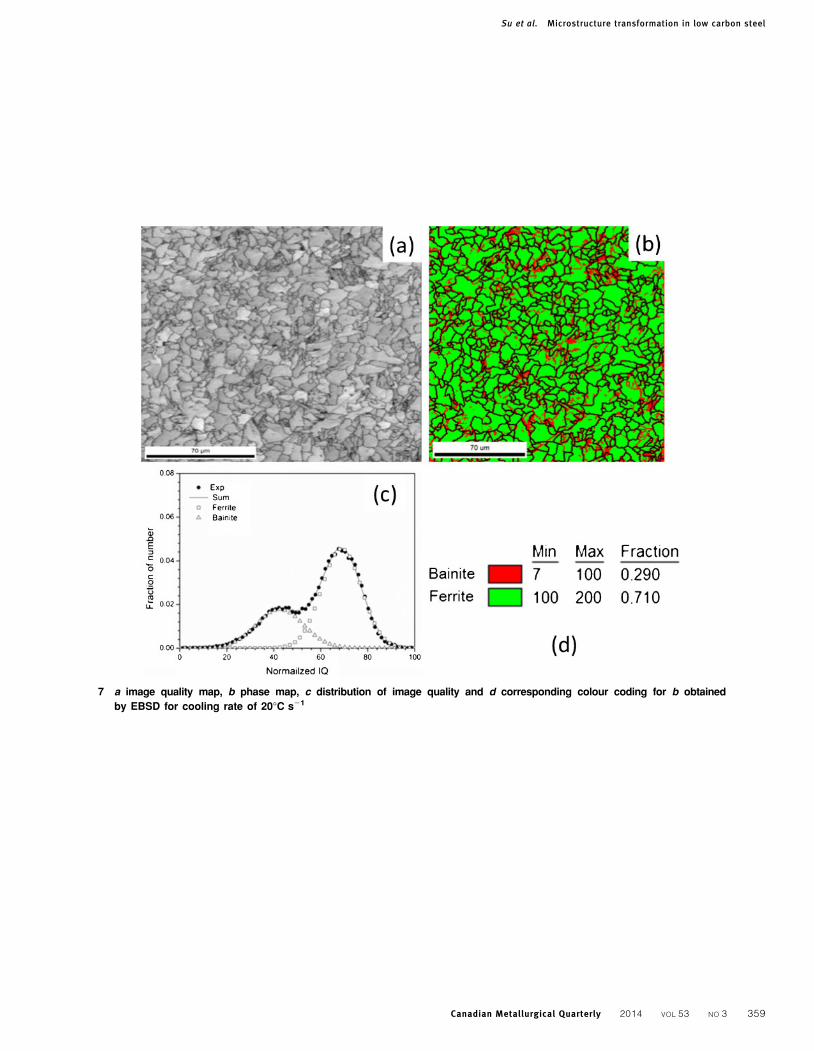
7 a image quality map, b phase map, c distribution of image quality and d corresponding colour coding for b obtained
by EBSD for cooling rate of 20uC s21
Su et al. Microstructure transformation in low carbon steel
Canadian Metallurgical Quarterly 2014 VOL 53 NO 3 359
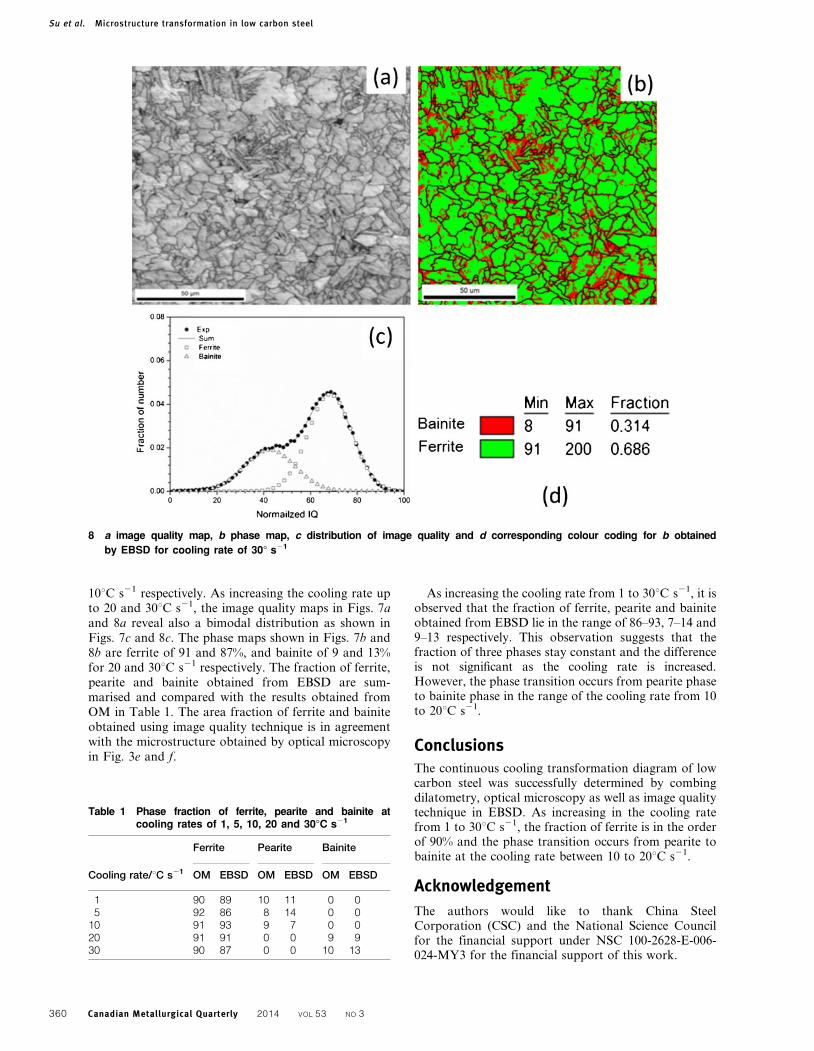
10uC s21 respectively. As increasing the cooling rate upto 20 and 30uC s21, the image quality maps in Figs. 7aand 8a reveal also a bimodal distribution as shown inFigs. 7c and 8c. The phase maps shown in Figs. 7b and8b are ferrite of 91 and 87%, and bainite of 9 and 13%for 20 and 30uC s21 respectively. The fraction of ferrite,pearite and bainite obtained from EBSD are sum-marised and compared with the results obtained fromOM in Table 1. The area fraction of ferrite and bainiteobtained using image quality technique is in agreementwith the microstructure obtained by optical microscopyin Fig. 3e and f.
As increasing the cooling rate from 1 to 30uC s21, it isobserved that the fraction of ferrite, pearite and bainiteobtained from EBSD lie in the range of 86–93, 7–14 and9–13 respectively. This observation suggests that thefraction of three phases stay constant and the differenceis not significant as the cooling rate is increased.However, the phase transition occurs from pearite phaseto bainite phase in the range of the cooling rate from 10to 20uC s21.
ConclusionsThe continuous cooling transformation diagram of lowcarbon steel was successfully determined by combingdilatometry, optical microscopy as well as image qualitytechnique in EBSD. As increasing in the cooling ratefrom 1 to 30uC s21, the fraction of ferrite is in the orderof 90% and the phase transition occurs from pearite tobainite at the cooling rate between 10 to 20uC s21.
Acknowledgement
The authors would like to thank China SteelCorporation (CSC) and the National Science Councilfor the financial support under NSC 100-2628-E-006-024-MY3 for the financial support of this work.
8 a image quality map, b phase map, c distribution of image quality and d corresponding colour coding for b obtained
by EBSD for cooling rate of 30u s21
Table 1 Phase fraction of ferrite, pearite and bainite atcooling rates of 1, 5, 10, 20 and 30uC s21
Cooling rate/uC s21
Ferrite Pearite Bainite
OM EBSD OM EBSD OM EBSD
1 90 89 10 11 0 05 92 86 8 14 0 0
10 91 93 9 7 0 020 91 91 0 0 9 930 90 87 0 0 10 13
Su et al. Microstructure transformation in low carbon steel
360 Canadian Metallurgical Quarterly 2014 VOL 53 NO 3
References1. M. P. Black and R. L. Higginson: ‘An investigation into the use of
electron back scattered diffraction to measure recrystallised
fraction’, Scr. Mater., 1999, 41, 125–129.
2. A. W. Wilson and G. Spanos: ‘Application of orientation imaging
microscopy to study phase transformations in steels’, Mater.
Charact., 2001, 46, 407–418.
3. A. W. Wilson, J. D. Madison and G. Spanos: ‘Determining phase
volume fraction in steels by electron backscattered diffraction’, Scr.
Mater., 2001, 45, 1335–1340.
4. J. Tarasiuk, Ph. Gerber and B. Bacroix: ‘Estimation of recrystal-
lized volume fraction from EBSD data’, Acta Mater., 2002, 50,
1467–1477.
5. J. Wu, P. J. Wray, C. I. Garcia, M. Hua and A. Deardo: ‘Image
quality analysis: a new method of characterizing microstructures’,
ISIJ Int., 2005, 45, 254–262.
6. L. Ryde: ‘Application of EBSD to analysis of microstructures in
commercial steels’, Mater. Sci. Technol., 2006, 22, 1297–1306L.
7. J. Y. Kang, D. H. Kim, S. I. Baik, T. H. Ahn, Y. W. Kim, H. N.
Han, K. H. Oh, H. C. Lee and S. H. Han: ‘Phase analysis of steels
by grain-averaged EBSD functions’, ISIJ Int., 2011, 51, 130–136.
8. A. F. Gourgues, H. M. Flower and T. C. Lindley: ‘Electron
backscattering diffraction study of acicular ferrite, bainite, and
martensite steel microstructures’, Mater. Sci. Technol., 2000, 16,
26–40.
9. H. Kitahara, R. Ueji, N. Tsuji and Y. Minamino: ‘Crystallographic
features of lath martensite in low-carbon steel’, Acta Mater., 2006,
54, 1279–1288.
10. H. Lu, P. Sivaprasad and C. H. J. Davies: ‘Treatment of
misorientation data to determine the fraction of recrystallized
grains in a partially recrystallized metal’, Mater. Charact., 2003, 51,
293–300.
11. H. Jazaeri and F. J. Humphreys: ‘Quantifying recrystallization by
electron backscatter diffraction’, J. Micros., 2004, 213, 241–246.
12. S. Zaefferer, P. Romano and F. Friedel: ‘EBSD as a tool to identify
and quantify bainite and ferrite in low-alloyed Al-TRIP steels’, J.
Micros., 2008, 230, 499–508.
13. S. Dziaszyk, E. J. Payton, F. Friedel, V. Marx and G. Eggeler: ‘On the
characterization of recrystallized fraction using electron backscatter
diffraction: A direct comparison to local hardness in an IF steel using
nanoindentation’, Mater. Sci. Eng. A, 2010, A527, 7854–7864.
14. S. I. Wright and M. M. Nowell: ‘EBSD image quality mapping’,
Micros. Microanal., 2006, 12, 72–84.
Su et al. Microstructure transformation in low carbon steel
Canadian Metallurgical Quarterly 2014 VOL 53 NO 3 361


