Embed Size (px)
Citation preview

1
Ecological magnitude and fine scale dynamics of the mediterranean narrow endemic 1
therophyte, Arenaria provincialis (Caryophyllaceae) 2
3
4
by Alex Baumel, Laurence Affre, Errol Véla, Pascal Auda, Franck Torre, Sami Youssef, and 5
Thierry Tatoni 6
7
University Paul Cézanne, Aix-Marseille III, UMR CNRS 6116/ IRD UMR-193, Institut méditerranéen 8
d’écologie et de paléoécologie, Bât. Villemin, Europole de l'Arbois, BP80, 13545 Aix en Provence 9
Cedex 04 ; [email protected] 10
11
12
13
14
15
16

2
Résumé 1
Dans le contexte de la rareté des espèces végétales dans les écosystèmes méditerranéens, l’objectif de 2
cette étude consiste à préciser l’autoécologie d’une plante annuelle endémique, Arenaria provincialis 3
(Caryophyllaceae), en quantifiant les caractéristiques des habitats et de la végétation associée ainsi que 4
les paramètres démographiques. Ses populations s’étalent, de manière surprenante, le long d’un large 5
gradient altitudinal, mais sur de petites distances géographiques. Ceci implique une importante 6
différenciation des habitats, du littoral sec thermophile (niveau de la mer) aux sommets froids 7
supraméditerranéens (1105 m d’altitude), au sein d’habitats ouverts, calcaires rocheux tels que les 8
éboulis pentus, les corniches, les anfractuosités des rochers ou les crêtes. Parmi les 163 espèces 9
végétales associées à A. provincialis, sur des surfaces de 100 m², 92% appartient au pôle stress des 10
stratégies écologiques de Grime, ce qui met en exergue les conditions stressantes au sein des différents 11
habitats du fait de la sècheresse, de vents forts et d’importants contrastes de température. Les suivis 12
démographiques révèlent de fortes fluctuations spatiales et temporelles. 13
Mots clés : autoécologie – démographie – endémisme - milieux rocheux - plante annuelle. 14
15
Abstract 16
In the context of plant species rarity in mediterranean ecosystems, this study aims to precise the 17
autoecology of the local annual endemic plant, Arenaria provincialis (Caryophyllaceae), by 18
quantifying habitat and vegetation characteristics, and demographic parameters. Its populations are 19
surprisingly scattered along a wide altitudinal and topological range, but over small geographical 20
distances. This implies an important habitat differentiation from the thermophilous dry coast (seal 21
level) to the colder supra-mediterranean summits (1105 m altitude) in open limestone rocky habitats 22
such as steep screes, ledges, cracks or crests. Among the 163 plant species identified in presence of A. 23
provincialis within 100 m² area, 92% belong to the stress Grime pole, highlighting the stressful 24
conditions within the different habitats caused by drought, strong wind, and high thermic contrasts. 25
Demographical surveys reveal strong spatial and temporal fluctuations. 26
Key words: annual plant species – autoecology - rocky habitats – endemism - demography. 27
28

3
I. INTRODUCTION 1
Mediterranean ecosystems are recognized as hot spots of biodiversity characterized by a high 2
number of rare and endemic plant species (Myers et al., 2000). Despite the high influence of man on 3
natural habitats, the floristic diversity of the Mediterranean area represents around 10% of the world 4
plant species richness in only 1.6% of the worldwide area (Médail & Quézel, 1997). The 5
Mediterranean flora is characterized by 50% to 59% of endemics (Quézel, 1985 ; Greuter, 1991) and, 6
within those endemic taxa, 60% show a very restricted geographical distribution in the Mediterranean 7
region (Thompson, 2005). Such frequencies imply that isolation is a major factor behind population 8
differentiation and the speciation process (Stebbins, 1950). However, it also implies that plant species 9
persistence in restricted areas, even in small pockets of suitable habitats (Petit et al., 2001), is possible 10
over long periods of time. Despite general trends about ecology and traits of endemics (Médail & 11
Verlaque, 1997 ; Lavergne et al., 2004 ; Thompson, 2005) each species is unique because its very 12
restricted distribution may be attributed to non exclusive and fundamental causes : historical, niche 13
magnitude, competition and/or migration constraint. Restricted distributions could be first explained 14
either by very recent origin of the endemics i.e. neoendemics (Stebbins, 1950 ; Lessica et al., 2006). 15
Nevertheless, around 30 % of endemic taxa, listed as paleoendemics or patroendemics are found 16
within the Western Mediterranean basin (Verlaque et al., 1997). Furthermore, in Southeast France, the 17
most threatened endemics, mainly localized at low altitudes, are palaeoendemics (Verlaque & 18
Contandriopoulos, 1990) and, in Provence, 12 % of endemic taxa are also paleoendemics (Favarger & 19
Contandriopoulos, 1961). On the other hand, resctricted distributions could be resulted from the 20
migration process limited by dispersal abilities or too much sparse suitable habitats (Hanski, 1999), 21
probably the key constraint for endemic species (Gaston, 2003). 22
Another important point concerns the endemism of annual plant species; whereas 27 % of the 23
whole vascular flora of Southeastern France are annual plants (therophytes), only 6 % of its endemic 24
flora are therophytes (Verlaque et al., 1997). This statement is general in the Mediterranean islands 25
and the European border where therophytes represent more or less 10 % of the endemic flora while 26
they account for nearly 50 % of the whole vascular flora (Rivas-Martinez et al., 1991 ; Shmida & 27
Werger, 1992 ; Bocchieri, 1995 ; Alziar, 1995 ; Verlaque et al., 1997). Furthermore, in the 28

4
Mediterranean flora, life-forms like therophytes and geophytes include more rare species than 1
hemicryptophytes, chamephytes and phanerophytes (Verlaque et al. 2001). Indeed, some comparative 2
ecology studies of endemic and widespread pairs of plants including annuals were provided (Lavergne 3
2003, Lavergne et al., 2003; Lavergne et al., 2004) but no specific work on a Mediterranean narrow 4
endemic annual plant is recorded in Europe. Now, descriptions of habitat variation and population 5
dynamics of narrow annual endemics is the first step to understand their ecology and to dress 6
hypothesis about their rarity. 7
The “Sandwort of Marseilles”, Arenaria provincialis Chater & Halliday (Caryophyllaceae), is 8
a winter annual plant confined to 145 km² on the low calcareous mountains surroundings the 9
Marseilles urban area, and is supposed to be a paleoendemic of very ancient origin (Véla et al., 2007 ). 10
Its distribution (Fig. 1) is fragmented within sites of different sizes, the larger one is located in the 11
Southern part whereas isolated smaller sites are found near the Northern and Eastern limits. Arenaria 12
provincialis is protected by national laws, European directives and international conventions. 13
Furthermore, Arenaria provincialis was assigned by UICN like a “Rare” species following old 14
categories of threat (Walter & Gillet, 1998) and is now reevaluated like a “Near Threatened” species 15
following the new criteria in force to the red list assessment (Véla et al., 2008). 16
In this paper, we thus describe the ecology and population dynamics of A. provincialis 17
following two guidlines : a description of habitats and associated plant species occurring with A. 18
provincialis, and a four years census of ten populations. We are interested in the following questions : 19
(1) is A. provincialis found in restricted ecological habitats relatively to its restricted geographic 20
distribution ? (2) are populations of A. provincialis increasing, stable, or decreasing over years at a 21
fine scale ? 22
23
24
25
26
27

5
II. MATERIAL AND METHODS 1
A. Study species 2
The study species is a winter annual herbaceous Caryophyllaceae formerly named Gouffeia 3
arenarioides DC., differing from other Arenaria taxa by a bi-styled gynoecium. However, based on 4
vegetative morphology and ribosomal DNA spacer sequences (rDNA ITS), the study species belongs 5
to Arenaria subgenus Arenaria (A. Baumel, unpublished data, GenBank accession of the sequence : 6
DQ810289). We therefore prefer to refer to the study species as Arenaria provincialis Chater & 7
Halliday (Flora Europaea), point of view shared with Jauzein and Tison (in press). This species is 8
characterized by clusters of numerous, fragile and vertical stems up to 15-20 cm height. Bulges are 9
scattered along each stem, from which two small (1-2 cm) opposite lanceolate leaves are inserted. One 10
main, long root is extended by numerous thin ones that firmly fix the plant within the substrate or rock 11
crevices. Several small, white, hermaphroditic flowers are produced at the top of each stem. Each 12
flower contains ten stamens (five small stamens alternate with five longer ones), two pistils and a 13
unilocular ovary containing two ovules. Arenaria provincialis is mainly pollinated by Hymenoptera 14
(i.e. bees) searching for nectar produced at the base of ovaries, and more rarely by Coleoptera and 15
Diptera eating pollen grains. Numerous ants (Hymenoptera) have also been frequently observed 16
visiting the flowers of A. provincialis. Fruits are frequently one-seeded capsules, though the two-17
seeded capsules also exists. Fruits and seeds are likely to be dispersed by barochory and/or 18
anemochory over small distances. 19
20
B. Habitat characteristics and vegetation scoring 21
Habitat and floristic surveys were conducted along North-South and East-West gradients and 22
represents the entire distribution of the species (Fig. 1). At each site, we selected two to four stations 23
with contrasting ecological conditions. Habitat variables and floristic relevés of fifty five stations 24
were recorded according to the BASECO protocol (Gachet et al., 2005) for a 5.63 m radius circle (100 25
m2) centered on each station. The following parameters (and their abbreviations) were scored: GPS 26
coordinates, altitude (alti), slope (slop), slope orientation (orie), the % cover of vegetation strata (rec) 27
[herbaceous plants (< 0.5 m, herb), shrubs (from 0.5 to 4 m, shru), trees (from 4 to > 10 m, tree)], and 28

6
granulometry (gra). In addition, all plant species and their cover (%) were recorded. For overall 1
vegetation cover, five classes were defined: (1) < 10%, (2) 10-25%, (3) 25-50%, (4) 50-75%, and (5) > 2
75%. For granulometry (gra), the cover of bare soil, gravels, rocks and stones was coded as 0, 1, 2 and 3
3 respectively. Finally, meteorological data, i.e. mean annual maximum temperature (tmax), mean 4
annual minimal temperature (tmin), the difference between tmax and tmin (tdiff), and annual 5
precipitation (ann), were interpolated from the meteorological stations by altitude modelling (linear 6
regression) and kriging of the residuals (Burrough, 1986) using a GIS software (TNTmips 6.0 7
Microimages). We used 82 meteorological stations with at least the last 30 years records in the period 8
1966-1998, from the French meteorological administration (Meteo France). All relevés were scored 9
between April and June, thus permitting the identification of a maximum of plant species. Plant 10
nomenclature is following taxonomical referential of Brisse & Kerguélen (1994), except for Arenaria 11
provincialis like explained above. Grime strategies and Raunkier biological life forms were used to 12
typify the relevés according to the BASECO references set (Gachet et al., 2005). 13
Multivariate analyses were conducted using the ADE4, STATS and VEGAN packages from R 14
statistical software (R Development Core Team, 2006). Principal Component Analysis (PCA) was 15
conducted to investigate the relationships between ecological variables (ADE4 package). Ordination 16
of the stations according to the floristic similarity was done by a non-metric multidimensional scaling 17
(NMDS) using the “metaMDS” function of VEGAN package. The analysis was based on the Bray-18
curtis dissimilarity index and the number of random starts in search of stable solution was set to 50. 19
To further visualize the stations on the ordination, we performed in paralell a hierarchical cluster 20
analysis (HCA) using the hclust fonction (STATS package) set with the Bray-curtis dissimilarity index 21
and the Ward's minimum variance method of clustering. The cutree function (STATS package) 22
provided 7 groups of stations cut at the same hierarchical level and they were graphically displayed by 23
the “s.class” function (ADE4 package). The data matrix for NMDS was composed of 163 columns 24
corresponding to species and 55 rows corresponding to sites. 25

7
C. Fine scale dynamics 1
On the Western part of the Calanques, near the campus of Luminy, 10 stations were monitored 2
during four years from 2004 to 2007. The stations, coded as n° 1 to n° 5, are situated on stony ledges 3
(slope 0%), and n° 6 to n° 10 are situated on screes (slope 10 % to 40 %) Southward or South-4
eastward. Each station was composed of 4 permanent plots of 1 m² where each A. provincialis plant 5
was counted and mapped in a 10 x 10 cm grid. The 1 m² plot was linked by one side along a straigth 6
or a "L" shaped transect. As the populations were locally small, their area was covered entirely or in 7
majority by the 4 plots. We did not observe important plant movements at the station level during the 8
four years, then the monitoring of these permanents plots is a good indicator of the population 9
dynamics. The census was done one day per year, at the beginning of March, when individuals are not 10
too much branched and can be quickly counted without risk errors and tall enough to be not mistaken 11
with another plant species. 12
All counts were summed by quadrat and analysed by a Kruskal-Wallis test (Stats package, R 13
software) in order to verify for a station effect or a year effect. The data was displayed by a boxplot to 14
show the variation in dynamics between and within the stations (Graphic package, R software). In a 15
second analysis, the sum of the four plots by stations of year t+1 was divided by the sum of year t to 16
calculate the demographic rate (r). For each year the station effect on the demographic rate was tested 17
by a Kruskal-Wallis test (Stats package, R software). 18
19
III. RESULTS 20
A. Habitat and vegetation variations for A. provincialis 21
Arenaria provincialis have been found within open rocky habitats such as steep screes, ledges, 22
cracks or crest sumits. The altitude of habitats ranged from 40 meters above sea level to 1105 meters 23
near the summit of the Sainte-Baume mountain. All slope orientations were observed and the slope 24
ranged from 0 to 70 % with a median of 32.5 % and an interquartil range of 14-40%. The mean 25
annual minimal and maximal temperatures interpolated from meteorological stations for the A. 26
provincialis stations ranged from 3.4 to 13.1 °C (median of 8.2 °C, interquartil range of 6.3-10 °C) and 27
from 15.8 to 18.4 °C (median of 17.4 °C, interquartil range of 17.1-17.5 °C) respectively. The annual 28

8
precipitations ranged from 635 to 933 mm (median of 704 mm, interquartil range of 670-716 mm), but 1
the values for littoral stations are clearly biased by the fact that the interpolation model do not account 2
for coastline effect increasing aridity. Indeed, precipitations in the gulf of Marseilles are severely 3
decreased and do not reach 500 mm (Kessler & Chambraud, 1990). Thus, populations occurring near 4
the sea level in the western part of the Calanques area (like Callelongue) are under a more dryer climat 5
than the other ones. 6
A total of 163 species were observed with A. provincialis over all the stations. However, only 7
23 species were present in at least 20% of the stations (Table I). The most frequent species was 8
Brachypodium retusum, found in 76.4 % of the stations, followed by Quercus coccifera (58.2%), 9
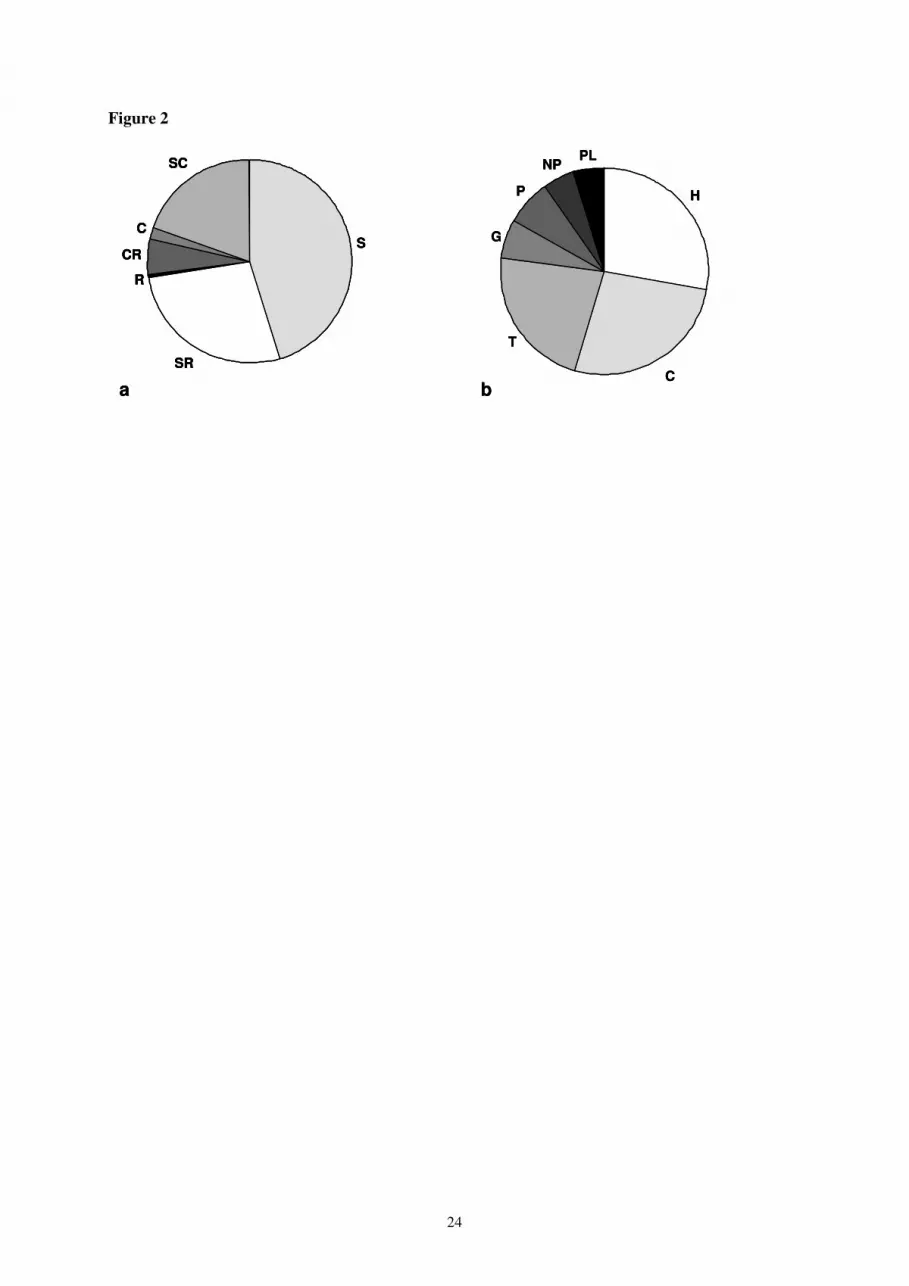
Thymus vulgaris (54.5%), Laserpitium gallicum (45.5%) and Staehelina dubia (43.6%). Three Grime 10
strategies, “stress” (S), “stress-ruderal” (SR), and “stress-competitive” (SC), represent 92% of all plant 11
species (Fig. 2a) and three Raunkier biological life forms, i.e. the hemicryptophytes, chamaephytes 12
and therophytes, correspond to 77 % of all plant species (Fig. 2b). 13
The first two axis of the PCA conducted on the ecological variable representing 48 % of the 14
variance are shown on Figure 3. The first axis is mostly explained by the altitude gradient and the 15
second axis is explained by an opposite relationship of orientation and slope caused by the steepy 16
North slope of Etoile moutain, where A. provincialis grows on its Northern limit (Fig. 3a, 3b). 17
Classification by HCA (Fig. 4a) and ordination by NMDS (3 axis, stress value = 17, Fig. 4b) 18
reflect the floristic variation of the small mountains surrounding Marseilles. This variation is partially 19
structured by the altitudinal and climatic magnitudes separating the stations of Callelongue, situated 20
under the most xeric French microclimat, from the stations of the Sainte-Beaume, situated under 21
mountain conditions (Fig. 3c). The stations of Callelongue (cluster n° 4) are in the South-Western part 22
of A. provincialis geographical distribution, situated at sea level, under xeric conditions, and in 23
association with mediterranean and littoral plant species such as Erica multiflora, Pinus halepensis 24
and Pistacia lentiscus. The Sainte-Baume stations (cluster n° 7) are located 1000 meters higher in 25
altitude, on crests, under mountain conditions, i.e. stronger wind, higher thermic contrasts, and higher 26
annual precipitation, and associated with oromediterranean or orophyte plant species such as the 27
endemic Genista lobelii, Iberis saxatilis or Anthyllis montana. The cluster n° 6 rallied the stations 28

9
situated at the Northern limit of the geographical distribution in the Etoile mountain chain. These 1
stations are found on Northerly, highly inclined slopes, under low winter temperatures (Fig. 3c), and 2
associated with a supra-mediterranean forest dominated by Pinus sylvestris, Juniperus oxycedrus and 3
Quercus ilex. The fourth well discriminated cluster of stations gathered all the stations of the Castellet 4
(cluster n° 5), wich are situated within an isolated patch of A. provincialis populations at the eastern 5
limit of the distribution. These stations are characterized by high annual precipitation, where A. 6
provincialis populations are near or under the cover of Pinus halepensis. Stations of cluster n° 1, 2 7
and 3 are less discriminated by the NMDS ordination. They are characterized by mattoral communities 8
dominated by Quercus coccifera. Most of them are geographically close to the center of A. 9
provincialis distribution, i.e. the Calanques mountain chain, but they can be found also within the 10
Etoile moutain chain (Cad and Roq2). 11
12
B. Fine scale dynamics of A. provincialis 13
The number of individuals counted from the whole 40 plots of 1 m² was 2410 in 2004, 1557 14
in 2005, 2656 in 2006 and 649 in 2007. The median and interquartil range of the number of 15
individuals by 1 m² plot were 31 (15-56) in 2004, 23 (8-44) in 2005, 30 (15-76) in 2006, and 10 (5-16
15) in 2007. Within the 1 m² plot, the variance/mean ratio of individuals counted (10 cm*10 cm grid) 17
revealed an aggregated distribution since the ratio was superior to 7 for 2004, 2005 and 2006, and 2.8 18
for 2007. Box plots (Fig. 5) showed a strong effect of annual and stations level on the variation of A. 19
provincialis density (Kruskal-Wallis rank sum test, p values = 8.10-5
and 4.6 10-5
respectively). Most 20
of the individuals are contained within stations n° 4, 6, 9 and 10. Those stations are impacted by a 21
strong inter-annual variation, alternating a decrease and increase. The other stations have small 22
densities, and presented less variation at the inter-annual level. All stations are similarly impacted by 23
the year 2007 with a general decrease of effectives, excepted for station n° 7 where a slight increase is 24
observed. 25
The “r” demographic ratio revealed a decrease for the transition 2004-2005 (median 0.85, 26
interquartil range 0.5-1.22), an increase for the transition 2005-2006 (median 1.27 interquartil range 27
0.8-2.7). Interquartil range revealed a strong inter-plot variance of “r” during this period whereas a 28

10
strong general decrease of effective is observed for the 2006-2007 transition (“r” median 0.23, 1
interquartil range 0.14-0.36). Moreover, Kruskal-Wallis rank sum test show a strong inter-plot effect 2
on “r” for each annual transition (all p values < 5 10-2
). 3
Therefore, the 40 plots did not support the same densities nor have the same dynamic through 4
years but all were negatively impacted during the 2006-2007 transition. 5
6
7
IV. DISCUSSION 8
A. Ecological magnitude and specialization 9
The first important feature of this study concerns the altitudinal and habitat aspects linked to 10
the rarity of the study species. Rare and very narrowly distributed mediterranean plant species may 11
show strict ecological requirements, and can be restricted to particular habitats (e.g. Colas et al., 12
1997). Remarkably, although rare and restricted to only 145 km² of limestone moutain chains close to 13
Marseilles, A. provincialis is found along a wide altitudinal, i.e. from the thermophilous, dry coastline 14
(sea level) to the northern, colder and humid situation (1105 m altitude) in the Etoile or Sainte-15
Beaume moutain chains, within open rocky habitats such as steep screes, ledges, cracks or crest 16
sumits. This ecological magnitude is supported by the diversity of plant species associated with A. 17
provincialis. Indeed, among the 23 plant species present at least in 20% of the relevés, only 5 plant 18
species, i.e. Brachypodium retusum, Quercus coccifera, Thymus vulgaris, Laserpitium gallicum and 19
Staehelina dubia, are found in more than 40 % of the stations. Former phytosociological studies 20
(Molinier, 1934 ; Loisel, 1976) have described a plant association, i.e. “Gouffetum arenarioidis”, 21
restricted to screes, and characterized by the presence of A. provincialis, Crucianella latifolia, Linaria 22
supina, Pimpinella tragium and Ptychotis saxifraga. However, those last plant species are rare or 23
absent in our relevés (see Tables I and II). Furthermore, whereas screes have been commonly 24
described as the optimal habitat for A. provincialis in the Natura 2000 directives (even if criticized by 25
Véla et al., 2007), the high frequency of A. provincialis on low slopes and rocky edges or crests does 26
not be in agreement with this formerly supposed optimality of screes. 27

11
Endemic plant species are often found in low competitive habitats, called azonal/unusual 1
habitats by Lesica et al. (2006) associated with extreme edaphic conditions, where forest etablishment 2
is prevented by high constraints. Evans et al. (2000) have besides reported a narrow endemic annual 3
scrub, Warea carteri (Brassicaceae), in xeric sandhills. Médail and Verlaque (1997) have also shown 4
that 91 % of endemics belong to the stress pole (S, SR or SC) in South-Eastern France. Our study 5
highlights that 92% of the plant species associated with A. provincialis belong to the stress Grime 6
pole. Whereas A. provincialis is found along a wide altitudinal range, it persists within open patches 7
(i.e., steep screes, ledges, cracks or crest summits) where competition is low. Indeed, soil drought of 8
calcareous lithosol, winds up to 120 km/h and high temperature contrasts are important external 9
constraints. Many populations are found at the edge of open low mattoral communities dominated by 10
Quercus coccifera. Such vegetation had a larger distribution before land-use changes, mostly 11
abandonment of pasture one century ago, but now its re-expansion is favored by recurring fires (Tatoni 12
et al., 2004). We do not know if Q. coccifera is able to colonize the open and rocky spaces where A. 13
provincialis grows. But since 4 years, we did not observe competition effects by Q. coccifera cover 14
within the 4 m² plots. 15
Ordination of the vegetation associated to A. provincialis brings evidence that A. provincialis 16
is growing in different habitats characterized by distinct vegetation communities. On one hand, at the 17
periphery of A. provincialis distribution, we observe rather uncommon communities relatively to the 18
Basse Provence. The xeric and coastline stations of Callelongue are associated to species belonging 19
to the thermophilous mediterranean flora (n° 4), but at the oposite A. provincialis is found on the 20
North slope of the Etoile chain (n° 6) and the summital crests of the Sainte-Baume (n° 7) where it is 21
associated to species belonging to the mountain or temperate flora. One remarkable situation 22
corresponds to the Eastern stations (n° 5) where the isolated patch of A. provincialis is found under or 23
beside an open formation dominated by Pinus halepensis. On the other hand, populations of A. 24
provincialis, located in central position within the Southern mountains chain (Calanques, Saint-Cyr 25
and Cap Canaille), are associated to plant species common in the Basse Provence mattoral 26
communities. Here, the floristic groups (n° 1, 2, and 3), less discriminated by the ordination, are not 27
correlated with the altitude or climatic variable and are composed approximately of the same plant 28

12
species. Their difference resides principally in the frequence of the plant species and may be 1
explained by fine scale factors, such as slope, substrat or history (e.g., fire). More relevés focusing 2
this aspect are needed to explain variation of A. provincialis habitats but some evidences are yet 3
observed. For example, the floristic group n° 1, widely distributed in our data is dominated by plant 4
species, Centranthus ruber, Linaria supina, Rhus coriaria, Staehelina dubia or Globularia alypum, 5
observed in diverse situations like screes, cliff foots or first stages after fires. The floristic group n° 2, 6
sharing with n° 1 the same geographic distribution, corresponds to more mature steps of the mattoral, 7
dominated by Brachypodium retusum and Quercus coccifera. The last group of this kind (n° 3) shares 8
a 100% frequency of Quercus coccifera and Laserpitium gallicum, the last one being a scree 9
specialist. This group corresponds to a mosaic situation mixing patches of Q. coccifera and open 10
space of screes. 11
12
B. Demographical assessment 13
The second important feature concerns the fluctuations of A. provincialis densities monitored 14
during 4 years. To explain the inter-station variability of densities and inter-annual dynamics, we 15
hypothetize a potential role of fine scale spatial heterogenity for water availability. Such hypothesis 16
could be tested by digging out and analyse soil but this is not possible as we want to carry on 17
monitoring of the same stations year after year. For example, the station n° 4, 9 and 10, having the 18
highest density, are spread out on relatively profound soil at the limit of Quercus coccifera shrubs. The 19
stations n° 6 having also a high density is situated on a multi craked and horizontal step that may 20
collect water. Relatively to these situations, the stations n° 1, 2, 3, 5 and 8 are situated on more 21
mineral steps or screes where soil is not perceptible and limited to a very thin layer above the rock. In 22
parallel, we observe important inter-annual fluctuations concerning the stations having the highest 23
densities and which alternate between a decreasing/increasing state during the first three years. Effects 24
of intraspecific competition, density-dependent, on germination or individual fitness may be the cause 25
of such fluctuations. However, the effect of seed bank has to be also investigated as we have 26
experimentaly observed (data not shown) a better germination rate for 2 years old seeds (40%) than for 27
1 year ones (27%). Finally, a general decrease for the 2007 census could be explained by the 28

13
droughtness of autumn 2006 (320 mm of rain in Marseilles for all the year 2006). Furthermore, the 1
quasi-absence of movements of A. provincialis individuals within the 4 m² stations associated with the 2
aggregation of individuals support a low capacity of dispersal, as it has already been proposed for 3
endemic plant species (i.e. poors competitors and dispersors; Lesica et al., 2006). Fruits and seeds do 4
not have any specialized structures to facilitate dispersal in A. provincialis. The low connectedness of 5
the habitats plus the low dispersal capacities associated with low (re)colonization potentialities of 6
suitable habitats, and the recent decreases of the demographic rates may explain the actual restricted 7
distribution of A. provincialis and suggest non-negligible local extinction probabilities. 8
9
V. CONCLUSION 10
Rarity and endemism are often studied in the context of extinction risks and conservation 11
priorities (Lesica et al., 2006). Numerous scientific publications (Etterson & Shaw, 2001 ; Thuiller et 12
al., 2005 ; del Barrio et al., 2006 ; Jump et al., 2005) assert that plant species will not cope with 13
current global change due to slow adaptation abilities and/or lack of close favourable refugia. 14
Understanding how the process of plant species persistence is conditioned by a set of numerous and 15
spatially heterogeneous factors (ecological, historical and landscape-related) will then determine our 16
ability to protect the endemic flora in the perspective of a multivariate global change. In this 17
perspective, the rare endemic annual plant species, A. provincialis, is an interesting model because we 18
have shown here that this species is scattered over a wide altitudinal and topological range, but along 19
small geographical distances, in low competitive unusual habitats characterized by highly spatial and 20
temporal fluctuating populations. 21
22
Acknowledgements 23
We would like to thank Virginie Gonçalves, Sarah Daniel, Magali Serrano, Jean-Luc Cellier, Ouiza 24
Tarek, Héloïse Vanderpert and Daniel Pavon for their help in the field, Philip Roche for climatic 25
variables and Carey M. Suehs for her helpful comments. This work was supported by the ONF 26
National Forest Organism, FEDD program (Fond d'intervention de l'environnement et du 27
développement durable).28
14
1
References 2
Alziar G., 1995. - La flore de Chypre. Ecologia Mediterranea, 21, 47-52. 3
Bocchieri E., 1995. - La connaissance et l'état de conservation de la flore en Sardaigne. Ecologia 4
Mediterranea, 21, 71-81. 5
Brisse H., & M. Kerguélen, 1994. - Code informatisé de la Flore de France. Association 6
d'Informatique Appliquée à la Botanique (AIAB), Strasbourg, I-V +, 1-128. 7
Burrough P.A., 1986. - Principles of Geographical Information Systems for land Resources 8
Assessment. Clarendon. Oxford, 193p. 9
Colas B., I. Oliveri I, M. Riba, 1997. - Centaurea corymbosa, a cliff dwelling species tottering on the 10
brink of extinction: a demographic and genetic study. Proc. Natl. Acad. Sci. USA, 94, 3471-3476. 11
del Barrio G., P.A. Harrison, P.M. Berry, N. Butt, M.E. Sanjuan, R.G. Pearson, & T. Dawson, 2006. - 12
Integrating multiple modelling approaches to predict the potential impacts of climate change on 13
species' distributions in contrasting regions: comparison and implications for policy. Environ. Sci. 14
Pol., 9, 129-147. 15
Etterson J.R. & R.G. Shaw, 2001. - Constraint to adaptative evolution in response to global warming. 16
Science, 294, 151-154. 17
Evans M.E.K., R.W. Dolan, E.S. Menges & D.R. Gordon, 2000. – Genetic diversity and reproductive 18
biology in Warea carteri (Brassicaceae), a narrowly endemic Florida scrub annual. Amer. J. Bot., 19
87(3), 372-381. 20
Favarger C. & J. Contandriopoulos, 1961. - Essai sur l'endémisme. Bull. Soc. Bot. Suisse, 71, 384–21
408. 22
Gachet S., E. Véla & T. Tatoni, 2005. - BASECO: a floristic and ecological database of Mediterranean 23
Fench flora. Biodivers. and Conserv., 14, 1023-1034. 24
Gaston K.J., 2003. - The structure and dynamics of geographic ranges. Oxford University Press 25
Oxford, UK, 280p. 26
Greuter W., 1991. - Botanical diversity, endemism, rarity and extinction in the Mediterranean area : an 27
analysis based on the published volumes of Med-Checklist. Bot. Chron., 10, 63-79. 28

15
Hanski I., 1999. - Metapopulation Ecology. Oxford University Press, New York, 313p. 1
Jauzein P. & J.-M. Tison, in press. Flore de la France méditerranéenne continentale. Projet édit. 2
Conservatoire Botanique National Méditerranéen de Porquerolles, Hyères. 3
Jump A.S. & J. Peñulas, 2005. - Running to stand still: adaptation and the response of plants to rapid 4
climate change. Ecol. Letters, 8, 1010-1020. 5
Kessler J. & A. Chambraud, 1990. - Météo de la France. J.C. Lattès, France, 391p. 6
Lavergne S., 2003. - Les espèces végétales rares ont-elles des caractéristiques écologiques et 7
biologiques qui leur sont propres ? Applications à la conservation de la flore en Languedoc-8
Rousssillon. PhD Thesis, Ecole Nationale Supérieure Agronomique de Montpellier, 86p. 9
Lavergne S., E. Garnier & M. Debussche, 2003. - Do rock endemic and widespread plant species 10
differ under the Leaf - Height - Seed plant ecology strategy scheme ? Ecology Letters, 6(5), 398-404. 11
Lavergne S., M. Debussche & J.D. Thompson, 2004. - The biology and ecology of endemic and 12
widespread plants : A comparative study of trait variation in 20 congeneric pairs. Oikos, 107, 505-518. 13
Lesica P., R. Yurkewycz & E.E. Crone, 2006. - Rare plants are common where you find them. Amer. 14
J. Bot., 93, 454-459. 15
Loisel R., 1976. - La végétation de l'étage méditerranéen dans le sud est continental français. 16
Marseille: Aix-Marseille III, 384p. 17
Médail F. & P. Quézel, 1997. - Hot-Spots analysis for conservation of plant biodiversity in the 18
Mediterranean Basin. Ann. Missouri Bot. Gard., 84, 112-127. 19
Médail F. & R. Verlaque, 1997. - Ecological characteristics and rarity of endemic plants from 20
southeast France and Corsica: implications for biodiversity conservation. Biol. Conserv., 80, 269-281. 21
Molinier R., 1934. - Etudes phytosociologiques et écologiques en Provence occidentale. Ann. Mus. 22
Hist. Nat. Marseille, 27, 1-274. 23
Myers N., R.A. Mittermeir, C.G. Mittermeir,G.A.B. da Fonseca G.A.B. & J. Kent, 2000. - 24
Biodiversity hotspots conservation priorities. Nature, 403, 853-858. 25
Petit C., H. Fréville, A. Mignot, B. Colas, M. Riba, E. Imbert, S. Hurtrez-Boussés, M. Virevaire & I. 26
Oliveri, 2001. - Gene flow and local adaptation in two endemic plant species. Biol. Conserv., 100, 21-27
34. 28

16
Quézel P., 1985. - Definition of the Mediterranean region and the origin of its flora. Geobotany, 7, 9-1
24. 2
Rivas-Martinez S., A. Asensi & J. Molero-Mesa & F. Valle, 1991. - Endemismos vasculares de 3
Andalucia. Rivasgodaya, 5, 5-76. 4
Shmida A. & M.J.A Werger, 1992. - Growth form diversity on the Canary Islands. Vegetatio, 102, 5
183-199. 6
Stebbins G.L., 1950. - Variation and evolution in plants. Columbia University Press, New York, 643p. 7
Tatoni T., F. Médail, P. Roche & M. Barbero, 2004. - The impact of changes in land use on ecological 8
patterns in Provence (Mediterranean France). In: Recent Dynamics of Mediterranean Vegetation and 9
Landscape. S. Mazzoleni (ed.), 328p. 10
Thompson J.D., 2005. - Plant evolution in the mediterranean. Oxford University Press, New York, 11
312p. 12
Thuiller W., S. Lavorel, M.B. Araujo & M.T. Sykes, 2005. - Climate change threats to plant diversity 13
in Europe. Proc. Natl. Acad. Sci. USA, 102, 8245-8250. 14
Véla E., D. Pavon & P. Auda, 2007. - Analyse et révision de la fiche-espèce 1453 des cahiers 15
d'habitats Natura 2000 : "Gouffeia arenarioïdes DC." J. Bot. Soc. Bot. France, 36, 39-44. 16
Véla E., Auda P., Léger J.-F., Gonçalves V. & A. Baumel, 2008. Exemple d'une nouvelle évaluation 17
du statut de menace suivant les critères de l’UICN version 3.1. : le cas de l’endémique provençale 18
Arenaria provincialis Chater & Halliday (= Gouffeia arenarioides DC., Caryophyllaceae). Act. Bot. 19
Gal. in press. 20
Verlaque R. & J. Contandriopoulos, 1990. - Analyse des variations chromosomiques en région 21
méditerranéenne: Polyploidie, différenciation et adaptation. Ecol. Medit., 16, 93–112. 22
Verlaque, R., F. Médail, P. Quézel & J.F. Babinot, 1997. - Endémisme végétal et paléogéographie 23
dans le bassin méditerranéen. Geobios, 21, 159–166. 24
Verlaque, R., F. Médail & A. Aboucaya, 2001. - Valeur prédictive des types biologiques pour la 25
conservation de la flore méditerranéenne. C. R. Acad. Sci. Paris, Ser. III, 324, 1157–1165. 26
Walter K.S. & H.J. Gillet, (eds), 1998. – 1997. - IUCN Red List of Threatened Plants. IUCN. Gland 27
(CH) & Cambridge (UK), LXIV, 862 p. 28

17
1

18
Table I. The frequency of plant species occurring in at least 20% of the 55 relevés used to describe 1
associations with Arenaria provincialis. 2
Plant species Frequency
Brachypodium retusum 76.4
Quercus coccifera 58.2
Thymus vulgaris 54.5
Laserpitium gallicum 45.5
Staehelina dubia 43.6
Amelanchier ovalis 40.0
Euphorbia characias 40.0
Galium corrudifoium 40.0
Pinus halepensis 40.0
Rubia peregrina 40.0
Centranthus ruber 38.2
Coronilla juncea 38.2
Rhus coriaria 36.4
Rosmarinus officinalis 36.4
Geranium robertianum 27.3
Globularia alypum 27.3
Asparagus acutifolius 25.5
Smilax aspera 25.5
Lactuca perennis 23.6
Linaria supina 23.6
Senecio cineraria 21.8
Cistus albidus 20.0
Helichrysum stoechas 20.0
3

19
Table II. The 10 most frequent plant species of each cluster of station. N = number of relevés.
Cluster 1 2 3 4 5 6 7
N 13 11 9 5 5 8 4 species % species % species % species % species % species % species %
Lactuca perennis
85 Brachypodium retusum
91 Brachypodium retusum
100 Cistus albidus 100 Pinus halepensis 100 Amelanchier ovalis
88 Centaurea paniculata
100
Brachypodium retusum
77 Quercus coccifera
82 Laserpitium gallicum
100 Coronilla juncea
100 Quercus coccifera
100 Quercus coccifera
88 Iberis saxatilis 100
Centranthus ruber
69 Rhus coriaria 73 Rosmarinus officinalis
100 Erica multiflora
100 Lonicera implexa 80 Brachypodium retusum
63 Thymus vulgaris 100
Linaria supina 69 Rubia peregrina 73 Amelanchier ovalis
78 Globularia alypum
100 Pistacia terebinthus
80 Thymus vulgaris 63 Genista lobelii 75
Rhus coriaria 54 Staehelina dubia
73 Coronilla juncea 78 Rosmarinus officinalis
100 Brachypodium retusum
40 Bupleurum fruticosum
50 Juniperus phoenicea
75
Staehelina dubia 54 Euphorbia characias
64 Euphorbia characias
78 Brachypodium retusum
80 Euphorbia characias
40 Euphorbia characias
50 Santolina chamaecyparissus
75
Sedum sediforme
54 Galium corrudifoium
27 Geranium robertianum
78 Fumana laevipes
80 Rosmarinus officinalis
40 Laserpitium gallicum
50 Amelanchier ovalis 75
Galium corrudifoium
46 Amelanchier ovalis
27 Thymus vulgaris 78 Pistacia lentiscus
80 Helichrysum stoechas
40 Rubia peregrina 50 Anthyllis montana 50
Globularia alypum
46 Laserpitium gallicum
27 Quercus coccifera
67 Juniperus phoenicea
60 Staehelina dubia 40 Sedum sediforme
50 Cerastium pumilum
50

20
Table legends / Légendes des tableaux :
Table I. The frequency of plant species occurring in at least 20% of the 55 relevés used to describe
associations with Arenaria provincialis.
Tableau I. Fréquence des espèces végétales présentes dans au moins 20% des 55 relevés utilisés pour
décrire les associations végétales d’Arenaria provincialis.
Table II. The 10 most frequent plant species of each cluster of station. N = number of relevés.
Tableau II. Les 10 espèces végétales les plus fréquentes pour chaque groupe de station. N = nombre
de relevés.
21
Figure legends / Légende des figures :
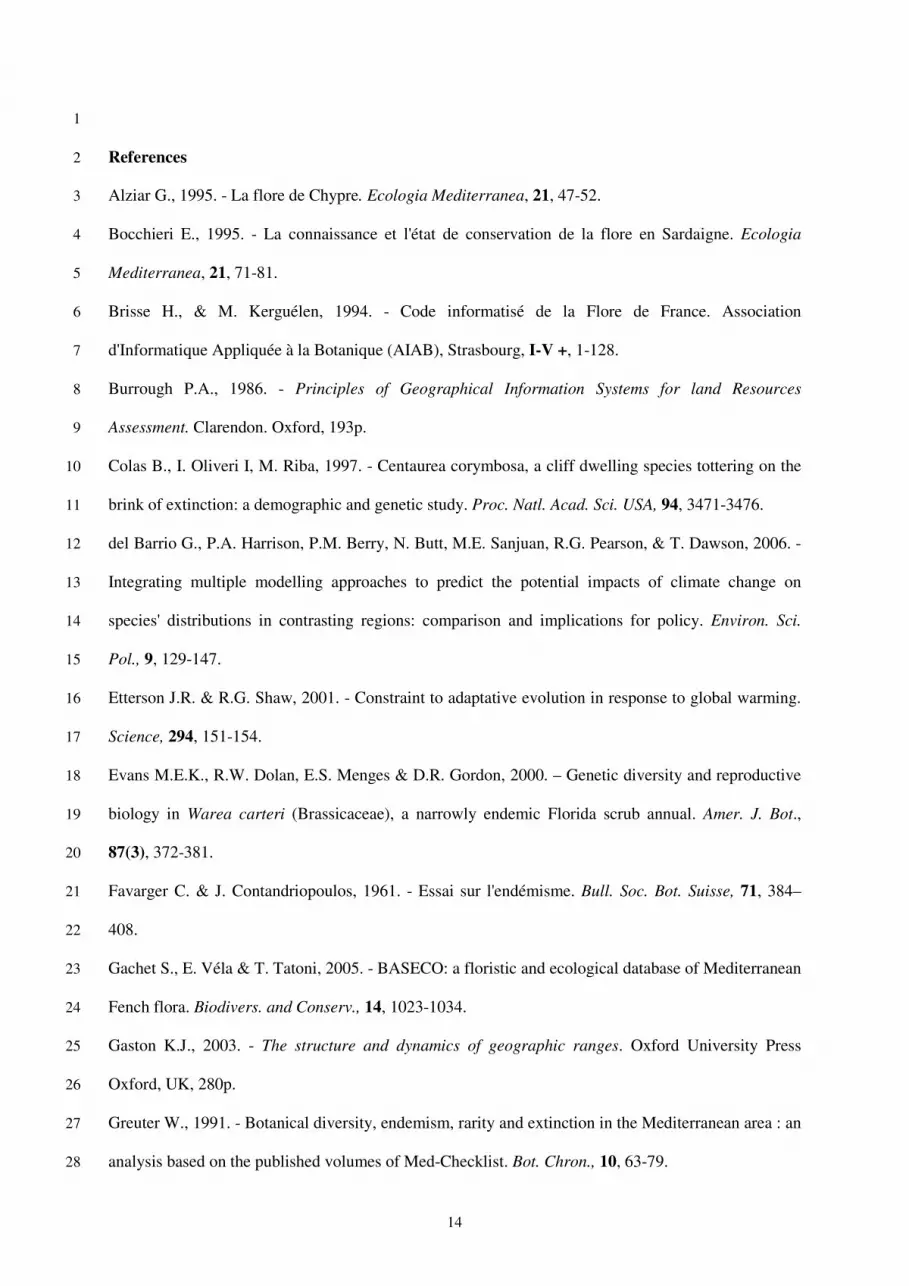
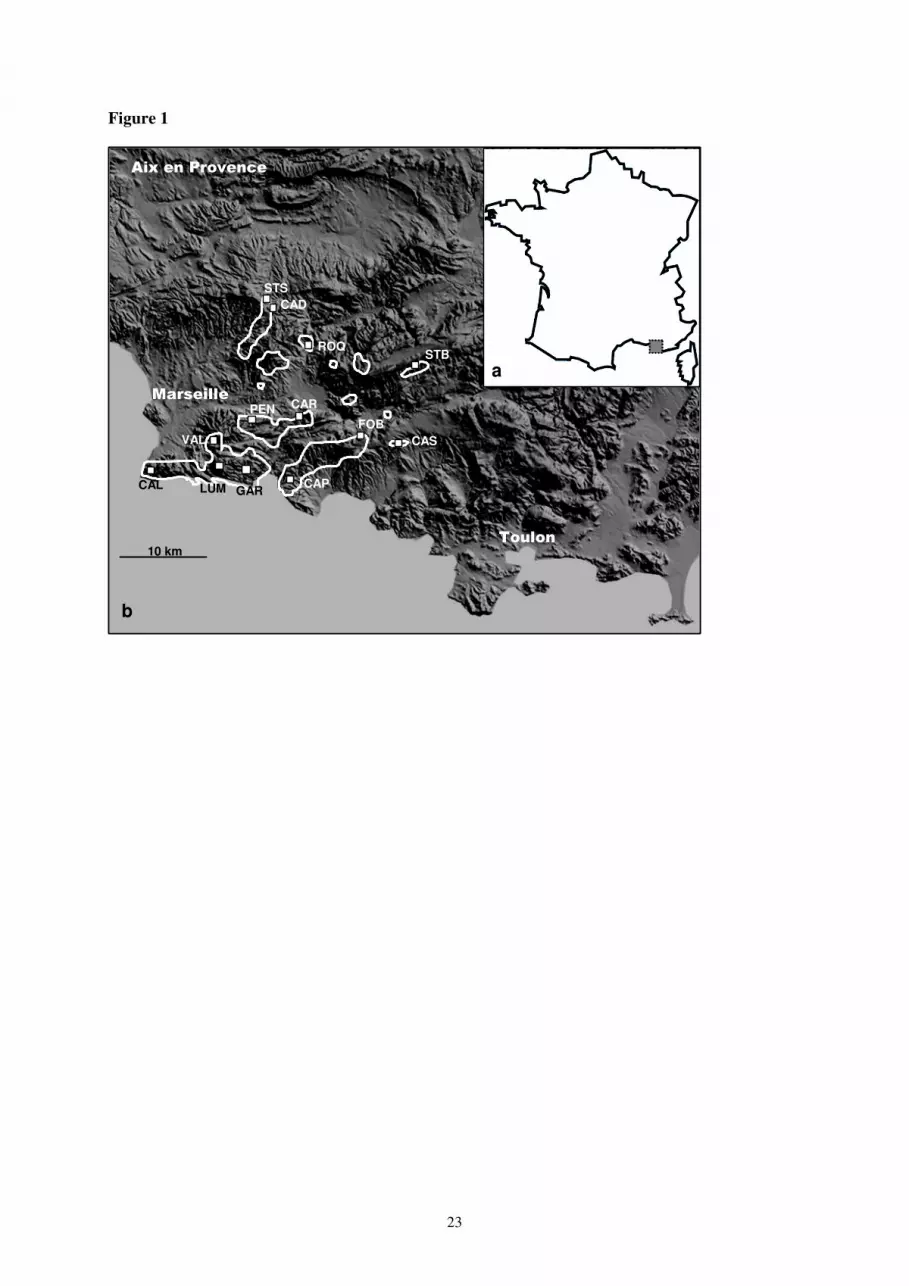
Figure 1. Geographical distribution of Arenaria provincialis. (a) Distribution of A. provincialis in
France. Most populations are found in the Bouches-du-Rhône department, but eastern populations are
situated on the western part of the Var department. (b) Polygons show the known distribution of A.
provincialis, and squares indicate the sites where surveys were conducted; STS = Saint Savournin,
CAD = Cadolive, ROQ = Roquevaire, STB = Sainte-Baume, PEN = La Penne-sur-Huveaune, CAR =
Carnoux, FOB = Fonblanche, CAS = Le Castellet, CAL = Callelongue, LUM = Luminy, VAL =
Vallon des Cerisiers, GAR = Gardiole, CAP = Cap Canaille.
Figure 1. Distribution géographique d’Arenaria provincialis. (a) Distribution d’Arenaria provincialis
en France. La plupart des populations se rencontre dans le département des Bouches-du-Rhône, mais
les populations dans la partie est sont situées dans la partie ouest du départment du Var. (b) Les
polygones montrent la distribution connue d’Arenaria provincialis et les carrés indiquent les sites où
les études ont été conduites. STS = Saint-Savournin, CAD = Cadolive, ROQ = Roquevaire, STB =
Sainte-Baume, PEN = La Penne-sur-Huveaune, CAR = Carnoux, FOB = Fonblanche, CAS = Le
Castellet, CAL = Callelongue, LUM = Luminy, VAL = Vallon des Cerisiers, GAR = Gardiole, CAP =
Cap Canaille.
Figure 2. Frequency of plant species classified according to (a) Grime ecological strategies and (b)
Raunkier biological life forms. S = stress strategy, SR = stress ruderal strategy, R = ruderal strategy,
CR = competitive ruderal strategy, C = competitive strategy. PH = phanerophytes, NP =
nanophanerophytes, CH = chamaephytes, HE = hemicryptophytes, TH = therophytes, GEO =
geophytes.
Figure 2. Fréquence des espèces végétales classifiées selon (a) les stratégies écologiques de Grime
and (b) les formes de vie de Raunkier. S = stress stratégie, SR = stress sudérale stratégie, R = rudérale
stratégie, CR = compétitive rudérale stratégie, C = compétitive stratégie. PH = phanérophytes, NP =
nanophanérophytes, CH = chamaephytes, HE = hémicryptophytes, TH = thérophytes, GEO =
géophytes.

22
Figure 3. Principal component analysis (PCA) of ecological variables, (a) ordination of the stations of
relevés, (b) correlations between variables and (c) ordination of floristic groups.
Figure 3. Analyses en composantes principales (ACP) des variables écologiques, (a) ordination des
stations, (b) corrélations entre ces variables et (c) ordination des groupes floristiques.
Figure 4. (a) Hierarchical cluster analysis (HCA) and (b) non-metric multidimensional scaling
(NMDS) of floristic diversity associated to Arenaria provincialis.
Figure 4. Analyses hiérarchiques des clusters (HCA) et (b) non-metric multidimensional scaling
(NMDS) de la diversité floristique associée à Arenaria provincialis.
Figure 5. Population dynamics of Arenaria provincialis monitored over 4 years.
Figure 5. Dynamique des populations d’Arenaria provincialis suivies durant 4 ans.
23
Figure 1
Marseille
Toulon
CAD
ROQSTB
CAS
FOB
CAP
CAR
CAL LUM GAR
a
b
STS
PEN
VAL
Aix en Provence
10 km
Marseille
Toulon
CAD
ROQSTB
CAS
FOB
CAP
CAR
CAL LUM GAR
a
b
STS
PEN
VAL
Aix en Provence
Marseille
Toulon
CAD
ROQSTB
CAS
FOB
CAP
CAR
CAL LUM GAR
a
b
STS
PEN
VAL
Aix en Provence
10 km
24
Figure 2
S
SR
R
CR
C
SC
a
H
C
T
G
P
NPPL
b
S
SR
R
CR
C
SC
a
S
SR
R
CR
C
SC
S
SR
R
CR
C
SC
a
H
C
T
G
P
NPPL
b
H
C
T
G
P
NPPL
b

25
Figure 3
1
2 3
4 5
6
7
alti
slop
orie
gra
veg
herb
shru
tree
tmin
tmax
tdiff
ann
COG1
CRE2
CRE3
GOR4
CAP5
CAP6
CAD1
CAD2
CAL1 CAL2
CAL3 CAL4
CAL5
CAP1
CAP2
CAP3
CAR1
CAR2
CAR3 CAS1
CAS2
CAS3
FOB1
FOB2
FOB3
FOB4
GAR1 GAR2
GAR3
LUM1
LUM2
LUM3
LUM4
LUM5 LUM6 LUM7
PH1
PH2
ROQ1
ROQ2 ROQ3
SS1 SS2 SS3
SS4
SS5
CAS5 CAS6
STB1
STB2 STB3
STB4
SS6
VC1
VC2
a
b c

26
Figure 4
CA
S3
CA
S1
CA
S2
CA
S5
CA
S6
GO
R4
CA
P5
CA
R3
CA
R1
CA
R2
FO
B1
FO
B3
FO
B4
CA
P1
CA
P2
CA
P3
CA
L3
CA
L4
CA
L5
CA
L1
CA
L2
CA
D1
CA
D2
GA
R3
GA
R1
GA
R2
FO
B2
LU
M6
LU
M5
LU
M7
SS
5S
S6
SS
3S
S1
SS
2S
S4
RO
Q1
RO
Q3
ST
B1
ST
B2
ST
B3
ST
B4
CO
G1
CR
E2
CR
E3
PH
2L
UM
1R
OQ
2L
UM
4P
H1
VC
1V
C2
LU
M2
CA
P6
LU
M3
7634 15 2
1
3 4
5
6
7
1 2
3
4
5
6 7
2
NMDS Axis 1
NM
DS
Ax
is 2
NM
DS
Ax
is 3
a)
b)
CA
S3
CA
S1
CA
S2
CA
S5
CA
S6
GO
R4
CA
P5
CA
R3
CA
R1
CA
R2
FO
B1
FO
B3
FO
B4
CA
P1
CA
P2
CA
P3
CA
L3
CA
L4
CA
L5
CA
L1
CA
L2
CA
D1
CA
D2
GA
R3
GA
R1
GA
R2
FO
B2
LU
M6
LU
M5
LU
M7
SS
5S
S6
SS
3S
S1
SS
2S
S4
RO
Q1
RO
Q3
ST
B1
ST
B2
ST
B3
ST
B4
CO
G1
CR
E2
CR
E3
PH
2L
UM
1R
OQ
2L
UM
4P
H1
VC
1V
C2
LU
M2
CA
P6
LU
M3
7634 15 2
1
3 4
5
6
7
1 2
3
4
5
6 7
2
NMDS Axis 1
NM
DS
Ax
is 2
NM
DS
Ax
is 3
1
3 4
5
6
7
1 2
3
4
5
6 7
2
NMDS Axis 1
NM
DS
Ax
is 2
NM
DS
Ax
is 3
a)
b)

27
Figure 5
01
00
20
03
00
40
05
00
1 2 3 5 6 7 8 9 104 1 2 3 5 6 7 8 9 104 1 2 3 5 6 7 8 9 104 1 2 3 5 6 7 8 9 104
2004 2005 2006 2007
Nu
mb
er
of
ind
ivid
ua
ls
01
00
20
03
00
40
05
00
1 2 3 5 6 7 8 9 104 1 2 3 5 6 7 8 9 104 1 2 3 5 6 7 8 9 104 1 2 3 5 6 7 8 9 104
2004 2005 2006 2007
01
00
20
03
00
40
05
00
1 2 3 5 6 7 8 9 1041 2 3 5 6 7 8 9 104 1 2 3 5 6 7 8 9 1041 2 3 5 6 7 8 9 104 1 2 3 5 6 7 8 9 1041 2 3 5 6 7 8 9 104 1 2 3 5 6 7 8 9 1041 2 3 5 6 7 8 9 104
2004 2005 2006 2007
Nu
mb
er
of
ind
ivid
ua
ls


