Embed Size (px)
Citation preview

JOURNAL OF THE WORLD AQUACULTURE SOCIETY
Vol. 27, No. 3 September, 1996
Economic Evaluation of Commercial-Scale, Saltwater Pond Production of Florida Red Tilapia in Puerto Rico
WILLIAM D. HEAD,' ALFONSO ZERBI AND WADE 0. WATANABE2 Caribbean Marine Research Center, 805 East 46th Place, Vero Beach, Florida 32963 USA
Abstract An economic analysis was performed of a proposed commercial-scale 20-ha saltwater pond
culture operation for Florida red tilapia in Dorado, northern Puerto Rico. The analysis was based on actual cost and production data from a commercial-scale hatchery, pilot-scale grow- out trials conducted in six 0.2-ha saltwater (avg. = 22.7 ppt) ponds at the Dorado facility and on wholesale market prices ($4.9&5.18/kg) fetched by dressed-out (gilled, gutted and scaled) product. The proposed 20-ha growout facility is comprised of 25 0.8-ha earthen ponds, each supplied with seawater, brackish well water, drainage and aeration, which account for 60.8% of the capital costs. Ponds are stocked with fingerlings (0.85 g avg. wt.) at a density of 3.0 hh/m2 (30,000/ha), and are harvested at 160 and 220 d, at an average weight of 545 g for a total yield of 11,445 kglha per crop. Imported feed ($0.55kg), processing and distribution ($OSO/kg) and sex-reversed fry ($O.ll/fry) are the highest variable costs, accounting for 30.7%, 15.4% and 13.9%, respectively, of the total annual costs. Salaries and benefits, and depreciation represent the highest fixed costs, accounting for 8.4% and 5.5%, respectively, of the total annual costs. Under these conditions, a wholesale price of $4.55/kg results in a positive cash flow by year eight, and a breakeven price, internal rate of return (IRR), net present value (NPV) and discounted payback period (DPP) of $4.08/kg, 7.6%, ($235,717) and >10 yr, respectively, suggesting that the proposed 20-ha operation is not economically feasible under these conditions. The proposed enterprise is marginally feasible if stocking density is increased to 3.5 fish/m2 while at 4.0 hh/mz economic outlook is favorable. Costs can be lowered considerably by targeting production and market variables most sensitive to profit- ability indices, using locally-prepared feeds, and vertically integrating hatchery and growout operations.
Tilapias have been promoted for their po- tential economic importance for Caribbean countries and U.S. Gulf states (Glude 1977, 1981; Stickney and Davis 1981; Conner 1985; Sandifer 1991). Although there are studies on the economics of tilapia aqua- culture in Asia (IDRC 1982; Smith et al. 1985; Escover et al. 1987; Bimbao and Smith 1988; Yap et al. 1989) and of hy- pothetical tilapia production systems in Ku- wait (Hopkins et al. 1986), there is little published information on the economics of tilapia aquaculture in North America (Nel- son et al. 1981) or the Caribbean (Brass et
I Present address: California State University Mon- terey Bay, 100 Campus Center, Seaside, California 93955 USA.
* Corresponding author's present address: Sea Change Foundation, 4731 N. Hwy AIA, Vero Beach, Florida 32963 USA.
al. 1990; Chakalall and Noriega-Curtis 1992). A lack of economic data can be an important constraint to the successful de- velopment of tilapia aquaculture in these ar- eas.
A cultural bias against freshwater fish and against fish with the dark appearance of most tilapias has limited market demand and commercial production in many areas of the Caribbean (Sandifer 1991; Chakallal and Noriega-Curtis 1992). However, the culture of red tilapia hybrids in saltwater could produce a more broadly accepted product with good potential for commercial expansion (Watanabe et al. 1989; Sandifer 1991; Watanabe 1991; Head et al. 1994).
From 1991-1992 the Caribbean Marine Research Center (CMRC) conducted a col- laborative project with a commercial aqua- culture enterprise in Dorado, northern Puer-
0 Copyright by the World Aquaculture Society 1996
275

HEAD ET AL 276
500
400
- 300 m E v
m .- zoo
100
0 0 40 80 120 160
Culture period (d)
FIGURE 1. Body weights of sex-reversed male Florida red tilapia grown over 160 d in 0.2-ha saltwater (22.7 2 1.2 ppi) ponds stocked at a density of 3.0 jsWm2. Plotted points represent means (?.YE) for six replicate ponds ( 2 W O O fiswpond).
to Rico to evaluate commercial-scale, salt- water production of Florida red tilapia in coastal aquaculture ponds. In this paper we present an economic analysis, based on pi- lot-scale results, of a proposed 20-ha salt- water culture operation for Florida red ti- lapia in Puerto Rico.
Materials and Methods Pilot-Scale Growout Trials
A pilot-scale, commercial growout trial was conducted at a marine shrimp farming enterprise in Dorado, northern Puerto Rico. Sixty thousand all-male, sex-reversed Flor- ida red tilapia fry (14-21 d posthatching; avg. wt. = 0.04 g) (Watanabe et al. 1993) were produced at CMRC's tilapia hatchery located on Lee Stocking Island, Bahamas and shipped in oxygenated plastic bags to Puerto Rico on 27 April 1991. Fry were held in 9-m3 concrete pools at a salinity of 16 ppt for an additional 22 d and fed #3 salmon starter (Zeigler Bros., Gardners, Pennsylvania, USA) at a feed conversion
FIGURE 2. Average perceni distribution of sex-re- versed male Florida red tilapia (N = I . 708) grown for 160 d in 0.2-ha saltwater (20-27 ppt) ponds stocked at a density of 3.0fisWm2.
ratio (FCR) of 1.4 and a final survival of 64%.
On 18 May 1991, fingerlings (avg. wt. = 0.85 g) were stocked at a rate of 3 fish/m2 (30,000ha) into six 0.2-ha earthen ponds filled with brackishwater (20-30 ppt) from a shallow well (25 m) and fed twice daily to satiation a sinking, pelletized tilapia grower containing 25% protein (Zeigler Bros., Gardners, Pennsylvania, USA). In- dividual fish weights were sampled (200- 400 fisldpond) at 40-d intervals for 160 d (Fig. 1). On day 160, fish averaged 452 2 15 g (mean ? SE) and feed conversion ratio was 1.8 -+ 0.1, with 50% of the fish reach- ing a harvestable weight of 2451 g (Fig. 2). The average weight of harvestable fish was 545 ? 10 g and the dress-out (gilled, gutted and scaled) percentage increased with fish size from 75.5% in fish of 300 g to 83.5% in fish of 600 g (Fig. 3).
Because of the limited availability of groundwater, only minimal water exchange (< 1 O%/d) was maintained during the study. Hence, aeration was required, particularly toward the end of the growout period, and was accomplished using two 1 -horsepower paddle wheel aerators during nighttime hours. During the first 160 d, maximum (31.2 2 0.1 C) and minimum (25.8 ? 0.1

RED TlLAPlA PRODUCTION IN PUERTO RICO 277
600
500
- v cn
g 400
'f
: c
H 300
200
85
82
79 - .s c
76 1 73
n
70
67 I 100 200 300 400 500 600 706'
Live weight (9)
FIGURE 3. Relationship between live body weight (x) and dress-out (gilled, gutted and scaled) weight ( y ) of sex-reversed male Florida red tilapia: y = -47.558 + 0.914 x (N = 29, R2 = 0.994, P < 0.001). The relationship between dress-out percent- age (calculated from the regression equation above) and live body weight is shown as the curved line.
C) water temperatures, salinity (22.7 t 1.2 ppt) and morning (before 0800 h) dissolved oxygen (3.3 2 0.2 mgL) were measured daily. NH,-N (0.60 2 0.04 mg/L), NO,-N (0.03 2 0.01 mg/L), alkalinity (185 2 14 mg/L), and pH (average 7.38; range = 6.15-9.86) were measured weekly.
In conjunction with the pilot growout tri- als, a marketing study (Head et al. 1994) was conducted to determine consumer ac- ceptance of saltwater-cultured Florida red tilapia in Puerto Rico. Fish were sold dressed-out (gilled, gutted and scaled) at an on-site retail store at $7.70/kg and to nine restaurants at wholesale prices ranging from $4.96 to $5.18/kg. Farm outlet store cus- tomers and restaurants preferred dressed- out fish between 454-567 g and 567-580 g, respectively.
An economic analysis was conducted of a proposed 20-ha facility based on produc- tion and marketing data from these pilot- scale trials as well as on costs of buildings, equipment, materials, pond excavation,
overhead, land lease, property taxes and 10- cal labor in Puerto Rico.
Capital Costs
Facilities and equipment costs and eco- nomic life for the proposed 20-ha tilapia operation are presented in Table 1. The pro- duction system consists of 25 0.8-ha rect- angular earthen ponds with an average depth of 1.8 m and an average water depth of 1.37 m. Ponds are arranged in a 5 X 5 array with common levees among ponds to reduce construction costs. Levees have a 3: 1 outside perimeter slope and a steeper, 2.5: 1 inside slope, to reduce nest building ac- tivity by tilapia. Traffic levees are 4.3-m wide and non-traffic levees are 3.7-m wide. Pond bottoms are contoured to provide a harvest basin at the drainage end. An ad- ditional 20% is added to earthmoving vol- ume to allow for levee settling and com- paction (SCS 1976).
Availability of groundwater is a major limitation to expanding brackishwater fish production at the Dorado facility. There- fore, for the economic analysis, it is as- sumed that fish will be grown in full- strength seawater which can be pumped from the shore adjacent to the facility. High growth and survival of the Florida red ti- lapia from fingerling to marketable size in full-strength seawater is well documented (Ernst et al. 1989; Clark et al. 1990; Ellis and Watanabe 1993; Watanabe et al., in press). Since tilapias reared in full-strength seawater are susceptible to infection by the marine ectoparasitic flatworm Neobeneden- ia melleni (Kaneko et al. 1988; Gallet de St. Aurin et al. 1990) a buried seawater in- take system is used to minimize introduc- tion of ectoparasites (Watanabe 1991). In addition, treatment with brackishwater (1 5 ppt for 5 d) is an effective therapeutant (Mueller et al. 1992; Ellis and Watanabe 1993) and a brackishwater supply system is required.
Ponds are supplied with water from two seawater intake systems and two brackish- water wells. The buried seawater intake
278 HEAD ET AL
TABLE 1. Facilities and equipment costs ($US) for a 20-ha saltwater pond aquaculture operation for Florida red tilapia located in Puerto Rico.
Economic Annual Total Cost Life Depreciation
Item Number 6) (yr) 6) Pond Construction
Earthmoving @ $1. 10/m3 Gravel and ground cover @ $4.00/m2
Subtotal
Water Supply and Drainage Wells (25 m deep X 20 cm diameter) Well pumps (35 hp) Saltwater pumps (50 hp) Plumbing (pipe, valves, couplings)
Subtotal
Aeration Paddle wheel aerators (2 hp)
Electric Service Poles, wire and junction boxes
Feed Distribution and Storage Blower feeder (570 kg) Refrigerated containers (72.5 m3)
Subtotal
Buildings Office (93 m2) Lab and fry conditioning (150 m2) Transfer shed (93 m2)
Subtotal
Operations Equipment Tractor (80 hp with mower and loader) Pickup truck (314 ton) Boat (4.6 m) and trailer 15 hp outboard engine Transport bins (1.5 m3) Gasoline fuel tank (3.8 in3) Diesel fuel tank (7.6 m3) Storage containers (72.5 m3) Farm shop equipment
Subtotal
Harvest Equipment Seines Dipnets Scales Harvest tubs Fish baskets & buckets Waders
Subtotal
Backup Systems Pumps Generator (200 kw) Aerators Blower
Subtotal
115,600 m3 127,160 6.000 m2 24,000
2 2 2
50
1 2
1 1 1
1 1 1 1 2 1 1 2
3 12 3 6
20 8
2 1 4 1
15 1,160
41,000 14,000 24,000
100,000 179,000
70,000
40.000
3,200 6,400 9,600
35,000 40,000
8,000 83,000
15,000 15,000 2,000 1,500 5,000 1 ,000 2,000 4,000 5.000
50,500
3.000 420 525
1,100 200 720
5,965
19.000 14,000 5,600 1,500
40.100
15 15
15 7 7
15
7
15
5 10
15 15 15
10 5
10 5 7
15 15 10 5
3 3 3 3 2 2
10 15 10 10
8,477 1.600
10,077
2,733 2,000 3,429 6,667
14,829
10,000
2,667
640 640
1,280
2,333 2,667
533 5,533
1,500 3,000
200 300 714 67
133 400
1 ,ooo 7.314
1 ,ooo 140 175 367 100 360
2.142
1,900 933 560 150
3,543

RED TILAPIA PRODUCTION IN PUERTO RICO 279
TABLE 1. Conrinued.
Economic Annual Total Cost Life Depreciation
Item Number ($) (yr) 6) Lab and Conditioning Equipment
Tanks (8.5 m’) and plumbing Air blower (3.5 hp) and airline Automatic belt feeders Water quality equipment Microscope Freezedrefrigerator Lab furniture Misc. lab equip. (scales, glass, etc.)
Subtotal
Office Equipment Computer and printer Copier Telephone/fax Desks, chairs and cabinets Miscellaneous
Subtotal Grand Total
6 1
12 1 1 1
1 1 I
9,600 1,500 2,100 3,200 1,500 600
1 ,000 2,500
22,000
2,500 1,200 1 ,ooo 1,300
500 6,500
657,825
15 5 5 5
10 7 7 5
5 5 5
10 5
640 300 420 640 150 86
I43 500
2,879
500 240 200 130 100
1,170 61,434
consists of a 20.3-cm diameter slotted (0.25 mm) PVC pipe manifold buried vertically in sand and connected to a 40.6-cm diam- eter PVC main pipe and 30.5-cm distribu- tion pipes. Seawater is delivered to each pond through 15.2-cm diameter PVC pipes. The seawater system is powered by two 50-hp centrifugal pumps, each with a ca- pacity of 11.5 m3/min after adjusting for head and friction losses. Seawater flow rate to ponds is adjusted to provide an exchange rate of lO%/d. The brackishwater wells (20.3-cm diameter) are 25-m deep, and wa- ter is distributed through 20.3-cm PVC main pipes and 15.2-cm distribution pipes by 35-hp vertical submersible pumps, each with a capacity of 4.2 m3/min. It is assumed that each pond will undergo two 5-d brack- ishwater (1 5 ppt) treatments to control pos- sible infection by N. melleni (Ellis and Wa- tanabe 1993). Drainage is accomplished by a cement monk and screened standup pipe (Hepher and Pruginin 198 1 ). Stand-up drain pipes are 30.5 cm in diameter and are con- nected to 45.7-cm low pressure drain lines that feed into a 61-cm main drain line. Each
pond is aerated for 12 h a night with two 2-hp paddle wheel aerators.
Feed is stored in two 72.5-m3 refrigerated containers and is distributed by a 570-kg blower feeder. Operations equipment in- clude a 80-hp tractor (with mower and front end loader), a pickup truck, two 1.5-m3 fish transport bins, a 4.6-m boat with 15-hp en- gine, 3.8-m3 gasoline and 7.6-m3 diesel fuel storage tanks, two 72.5-m3 storage contain- ers and general farm shop equipment. Back- up systems include pumps, aerators, a blower and an emergency generator.
Building requirements include a 93-m2 office, a 150-m2 analytical lab and fry hold- ing area for acclimating fry to seawater and a 93-m2 shed for sorting harvested fish. The office is of standard wooden frame con- struction. The lab and fry holding area is a prefabricated metal building that contains six 8.5-m3 circular fiberglass tanks. The shed is partially enclosed with a sheet metal roof and has a concrete floor.
Stocking, Production and Harvesting In Puerto Rico, air and surface seawater
temperatures are similar and range from

280 HEAD ET AL.
TABLE 2. Continuous production cycle for a 20-ha saltwater pond aquaculture facility for Florida red tilapia. All 25 0.8-ha ponds are stocked out by monrh 12 andfirst harvest begins by month 13. Each pond is harvested three times during a 2-yr cycle.
Month Ponds 1-5 Ponds 6-10 Ponds 11-15 Ponds 16-20 Ponds 21-25
8 Stock 9 Stock
10 Stock 11 Stock 12 Stock
13 50% Harvest 14 15 50% Harvest
16 Restock
17
18
19
20 21 50% Harvest 22 23 50% Harvest
24 Restock
50% Harvest 50% Harvest
50% Harvest 50% Harvest Restock
50% Harvest 50% Harvest
50% Harvest Restock
Restock
50% Harvest Restock
50% Harvest 50% Harvest
50% Harvest Restock
50% Harvest
25
26
21
28 29 50% Harvest 30 31 50% Harvest
32 Restock
33
34
35
50% Harvest 50% Harvest
50% Harvest Restock
Restock
50% Harvest Restock
50% Harvest 50% Harvest
50% Harvest 50% Harvest Restock
50% Harvest 50% Harvest
50% Harvest Restock
Restock
50% Harvest Restock
36
about 29 C in late summer to about 26 C in January or February (Glynn 1973). Hence, Puerto Rico is one of the few areas in the United States where saltwater tilapia culture can be practiced year-round under
ambient conditions without risk of winter kill. Based on a growout duration of 220 d, a stocking and harvesting schedule was de- vised for the 20-ha operation to permit con- tinuous, year-round production (Table 2): A

RED TILAPIA PRODUCTION IN PUERTO RICO 28 1
TABLE 3. Parameters used for the economic analysis of a saltwater pond aquaculture faciliry for Florida red tilapia in Puerto Rico.
TABLE 4. Initial capital investment requirements for a 20-ha saltwater pond aquaculture facility for Flor- ida red tilapia.
Parameter Value
Farm Size Total farm area (ha) 30 Pond size (ha) 0.8 Total pond area (ha) 20
Stocking Data Average initial wt. of reversed males
Stocking density (no./m2) 3.0 (noha) 30,000
Duration of growout (d) 220 Pond preparation time (d) 20
Average final weight (g) 545
(9 ) 0.85
Harvest Data
Avg number of crops per year per pond 1.5
Survival (%) 70 Feed conversion ratio (dry wt./wet
wt.) 1.8 Yield per crop (kg/ha) 11,445 Average annual yield (kg/ha per yr) Total farm yield (even years)’ (kg) Total farm yield (odd years)’ (kg)
Dress-out (%)b 82.7
17,168 366,240 320,460
Unmarketable fish (%) 4
See Table 1. Gilled, gutted and scaled.
set of five ponds are stocked on month eight of the first year and subsequent sets of five ponds are stocked at monthly intervals until all 25 ponds are stocked out by the end of the first year. Based on growth rate data from the pilot study (Fig. 1). 50% of the fish reach market size (>451 g) on day 160 at an average weight of 545 g (Fig. 2). It is assumed that the remaining 50% of the fish reach market weight by day 220. This is based on past growth studies of Florida red tilapia (Ellis and Watanabe 1993) and the assumption that individual growth variation in the Florida red tilapia is primarily based on competition for food and space (Tave 1986). which would be greatly reduced upon harvest of the larger fish. Twenty days are allowed for pond cleanup, levee repair, pond refilling and restocking. Each pond is
Item cosr % of ($) Total
Water Supply and Drainage Pond Construction Buildings Aeration Operations Equipment Backup Systems Electric Service Lab and Conditioning Equipment Feed Distribution and Storage Office Equipment Harvest Equipment Total Cost
179,000 151,160 83,000 70,000 50,500 40,100 40,000 22,000
9,600 6,500 5,965
657,825
27.2 23.0 12.6 10.6 7.7 6.1 6.1 3.3 1.5 1 .O 0.9
-
harvested three times during a two year cy- cle (Table 2).
Table 3 summarizes production and har- vest information used for the economic analysis. Duration of growout, average weight at harvest, percentage of unmarket- able fish (due to stunting or deformities) and dress-out percentage are based on the results of the pilot study. A final survival rate could not be determined during the pi- lot study as fish were lost during a major flood near the end of the study. Based on the high health and relatively few mortali- ties observed during the pilot trials a sur- vival rate of 70% is used for this economic analysis, which is a conservative estimate for pond culture of sex-reversed tilapia (Sin and Chiu 1983; Rakocy and McGinty 1989).
Variable Costs
Sex-reversed 14-21 day old Florida red tilapia fry are purchased from a commercial hatchery at $0.1 l/fry (Head and Watanabe 1995) and fry are grown in 8.5-m3 tanks for an additional 22 d prior to stocking into ponds. Fry are fed #3 salmon starter at a cost of $1.30/kg and a food conversion ratio of 1.4. After stocking into ponds, fish are fed tilapia grower twice daily to satiation at a cost of $0.55/kg and a food conversion ratio of 1.8. Processing and distribution is

282 HEAD ET AL
TABLE 5. Annual even and odd year enterprise budgets for a 20-ha salhvater pond aquaculture facility for Florida red tilapia in Puerto Rico. A stocking density of 3.0fisWm2 and a dressed-out (gilled, gutted and scaled) wholesale price of $4.55& are assumed.
Even years Odd years % variable % total
Production (kg) Dress-out yield 290,765 254,420
Gross Receipts ($) 1,322.98 1 1,157,611
Variable Costs ($)
Sex-reversed fry 144,375 165,000 17.1 Feed 363,878 318.755 31.8 Processing and distributing 1 83,120 160,230 19.0
Labor 53,820 53,820 6.0 Repair and maintenance (equipment, levees) 13,000 13,000 1.4 Fuel, oil, lubrication (vehicles) 4,200 4,200 0.5 Advertising 6,000 6,000 0.7 Chemicals 2,400 2,400 0.3 Misc. (telephone, materials & supplies) 10,000 10,000 1.1 Interest on operating capital (@ 9.5%) 46,315 44.064 5.0
Total Variable costs ($) 927,608 877,969 100.0
Fixed costs ($) % Fixed Salaries and benefits 93,750 93,750 44.7 Overhead (insurance, taxes, fees & permits) 14,000 14,000 6.7 Land lease 1 1,250 1 1,250 5.4 Depreciation 61,434 61,434 29.3 Interest on investment capital” 29,100 29,100 13.9
Total Fixed Costs ($) 209,534 209,534 100.0
Electricity 100,500 100,500 11.1
Total Annual Costs ($) 1 , I 37,142 1,087.503 Net Returns ($) 185,839 70,108
a Equipment @ 9.5%; buildings, ponds, water supply and drainage, and electric service @ 8.5%. Values do not add to 100% due to rounding errors.
13.9 30.7 15.4 9.0 4.8 1.2 0.4 0.5 0.2 0.9 4.1
81.1
8.4 1.3 1 .o 5.5 2.6
18.8
99.9b
contracted out at a cost of $OSO/kg. Elec- tricity is purchased at a cost of $0.088/kwh. Labor requirements include hourly wages ($4.50) for five full time laborers with 15% added for benefits. Annual repair and main- tenance is estimated at 3% of pond con- struction costs and 5% of operating equip- ment costs. Vehicle fuel, oil and lubrication costs are estimated at $350/mo. Advertising is estimated at $500/mo and includes the cost for promotional material and local ad- vertising in newspapers and magazines. Chemicals include costs for analytical re- agents, lime and therapeutants. Miscella- neous costs include telephone, materials and supplies. Interest charges for operating capital (including salaries) are based on 1992 bank loan rates for this type of busi-
ness enterprise and are calculated on an av- erage investment basis (Brumfield et al. 1981; Bauer et al. 1983; Crews and Jensen 1989).
Fixed Costs
Salaries are included for a general man- ager, a production manager and an account- antkecretary at $30,000, $25,000 and $20,000 per year, respectively, with 20% added for benefits. Overhead includes the costs of insurance, property taxes, license fees and permits, and land is assumed leased from the Land Authority of Puerto Rico at a rate of $375/ha. The depreciation schedule is based on the straight line meth- od (Fitzgerald 1988) and assets are assumed to have no residual value at the end of their

RED TILAPIA PRODUCTION IN PUERTO RICO 283
useful life (Table 1). Interest rates for equipment, pond construction and water supply are calculated on an average invest- ment basis.
Annual Production and Cash Flow Budgets
An annual production budget is devel- oped from the variable and fixed costs fol- lowing well established methods (Allen et al. 1984; Zimet 1988; Crews and Jensen 1989; Pomeroy et al. 1989), and cash-flow budgets were developed to examine profit- ability in relation to the timing of expen- ditures and earnings (Gittinger 1982; Shang 1990). Net cash flow was determined by projecting estimated revenues and costs over a IO-yr period, because it is unlikely that an aquaculture enterprise would be an attractive investment opportunity if it was not profitable within this period (Staniford and Kuznecovs 1988; Staniford 1989). The cash flow analyses were performed at con- stant prices assuming that general inflation will exert the same relative effect on both costs and benefits (Gittinger 1982). The ini- tial capital investment was charged in the first year, and costs in subsequent years in- cluded annual variable and fixed (excluding depreciation) costs, and replacement costs of depreciable items (Pounds et al. 1992). Construction and fish acquisition occur the first year and variable costs were adjusted to account for no sales until the second year of operation. Internal rate of return (IRR), net present value (NPV) and discounted payback period (DPP) were calculated as indicators of profitability (Bhandari 1986; Shang 1990). A discount rate of 15% was used in the NPV and DPP analyses as an estimate of the opportunity cost of capital (Gittinger 1982).
Sensitivity of breakeven price, 10-yr pro- jected IRR, NPV and DPP to important pro- duction and market variables (unmarketable fish, wholesale price, average final weight, survival, production feed price, food con- version ratio, and fry price) were performed
for stocking densities of 3.0, 3.5, and 4.0 fish/m2.
Results Major capital expenses for a 20-ha red
tilapia aquaculture enterprise include water supply and drainage, pond construction, buildings and aeration which represent 27.2, 23.0, 12.6 and 10.6%, respectively, of the total investment cost (Table 4). Table 1 provides details of investment costs and economic life.
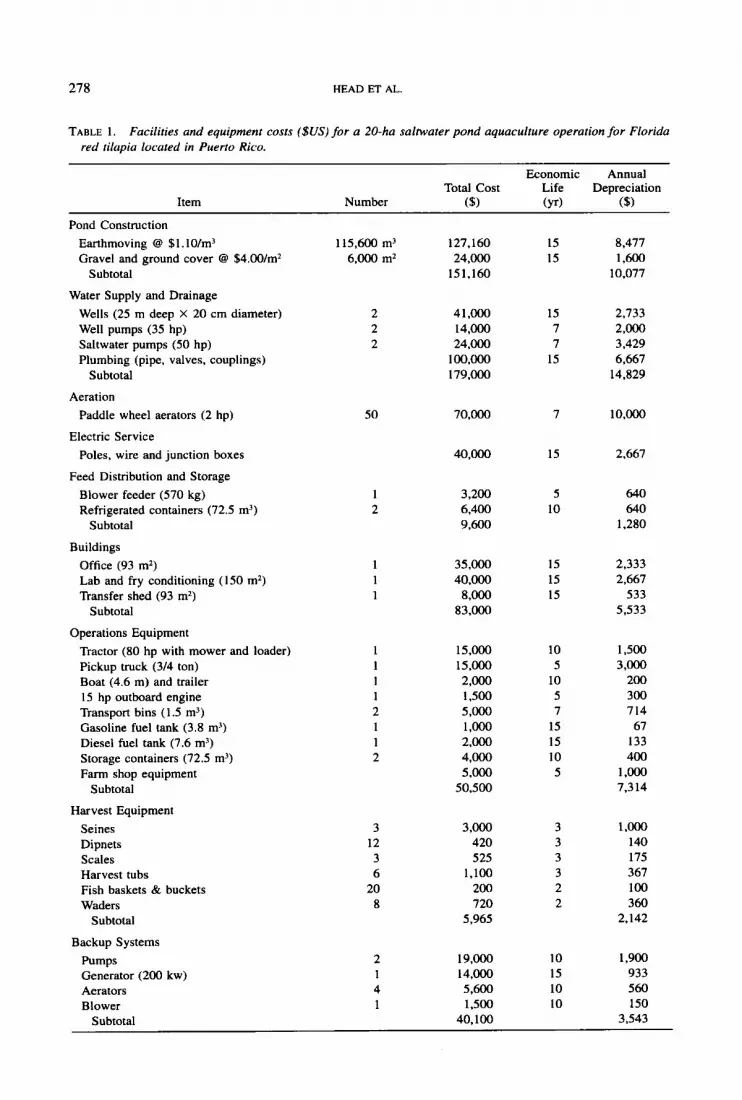
Imported feed, processing and distribu- tion, and sex-reversed fry are the highest variable costs, accounting for 30.7%, 15.4% and 13.9%, respectively, of the total annual costs (Table 5 ) . Salaries and benefits, and depreciation represent the highest fixed costs, accounting for 8.4% and 5.5%, re- spectively, of the total annual costs. Under the basic assumptions in this study (fry price of $0.1 l/fry, production feed price of $0.55/kg and stocking density of 3.0 fish/m2) a wholesale price of $4.55/kg re- sults in a positive cash flow by year 8 (Ta- ble 6), a breakeven price of $4.08/kg, an IRR of 7.6%, a negative NPV of ($235,717) and a DPP >10 yr (Table 7). Increasing the stocking density to 3.5 and 4.0 fish/m2 low- ers the breakeven price by 5.4% and 9.3%, respectively; increases IRR by 10.6% and 19.3%, respectively; and results in a posi- tive NPV and a DPP of < I 0 yr (Table 7).
Breakeven prices are more sensitive to changes in percent unmarketable fish, av- erage final weight, survival, and production feed price than food conversion ratio or fry price (Table 7). At a stocking density of 3.0 fish/m2, decreasing the percent of unmar- ketable fish by 2% (from 4% to 2%) reduc- es breakeven price by $O.O8/kg. In contrast, a 9.1 % decrease in fry price (from $0.1 1 to $0. lO/fry) reduces the breakeven price by only $O.O5/kg.
The profitability indices (IRR, NPV and DPP) are sensitive to changes in production and market variables. The ranked order of importance of changes in these variables to the profitability indices are: percent unmar-
284 HEAD ET AL.
TABLE 6. Ten-yr cash flow for a 20-ha saltwater pond aquaculture facility for Florida red tilapia in Puerto Rico. A stocking density of 3.0fish/m2 and a dressed-out (gilled, gutted and scaled) wholesale price of $4S& are assumed.
Year 1 6)
Variable Cost 322,064 Fixed Cost 148,100 Investment 657,825 Total Cost I , 137,989 Receipts 0 Net Returns (1,137,989) Cum u 1 at i v e (1,137,989)
Year 2 6 )
Year 3 ($)
Year 4 6)
Year 5 ($)
Year 6 ($1
927,608 148,100
0 1,075,708 1,322.98 1
247.273 (890,716)
877,969 148,100
920 1,026,989 1,157,611
130,622 (760.094)
927,608 148,100
5,045 1,080,753 1,322.98 1
242,228 (5 17,866)
877,969 148,100
920 1,026.989 1,157.61 1
130,622 (387,244)
927,608 148,100 39,200
I , 1 14,908 1,322,981
208,073 ( 179.17 I )
ketable fish, wholesale price, average final weight, survival rate, production feed price, food conversion ratio and fry price (Table 7). At a stocking density of 3.0 fisWm2 the profitability indices are not economically favorable. The IRR, NPV, and DPP are gen- erally under 15%, negative, and < 10 yr, re- spectively. At a stocking density of 3.5 fish/m2 the profitability indices are margin- ally favorable. However, a small change in a production or market variable can signif- icantly influence economic feasibility. For example, a 2% increase in unmarketable fish (from 4% to 6%) drops the IRR to 14.6%, results in a negative NPV and a DPP of >10 yr. Increasing the stocking density to 4.0 fish/m2 results in an IRR > 15%, a positive NPV, and a DPP < 10 yr throughout most of the range of changes in production and market variables (Table 7).
Discussion Although a minimum IRR of 15%, a pos-
itive NPV and a payback period of less than ten years are often used as business invest- ment criteria (Staniford and Kuznecovs 1988; Newnan 1991), the relative attrac- tiveness of an investment should also in- clude an evaluation of markets and realistic sales projections, site selection, technology and management requirements (Gittinger 1982; Rhodes and Hollin 1990; Rhodes 1991). In Puerto Rico, fresh, dressed-out (gilled, gutted and scaled) saltwater-raised red tilapia fetched wholesale prices ranging from $4.96-$5.18/kg at restaurants and a
retail price of $7.70/kg at a farm outlet store in 1991-1992 (Head et al. 1994). The eco- nomic analysis showed that under the basic assumptions used in the present study (fry price of $0.1 l/fry, production feed price of $0.55/kg and a stocking density of 3.0 fish/m2), a wholesale price of $4.55/kg re- sulted in an IRR of 7.6%, a negative NPV and a DPP > 10 yr (Table 7), suggesting that the proposed 20-ha operation is not economically feasible under these condi- tions. Increasing the stocking density to 3.5 or 4.0 fish/m2 improves economic feasibil- ity (e.g., IRR > 15%, positive NPV, and a DPP <I0 yr). The stocking densities used for the sensitivity analysis in the present study (3.0, 3.5, and 4.0 fish/m2) (Table 7), and their respective projected annual pro- duction values ( 1 7.2-22.9 t/ha per yr). are within the ranges (2-11 fisWm2; 5-28 t/ha per yr) reported for intensive pond culture of tilapia (Sarig and Marek 1974; Hepher and Pruginin 1982; Balarin and Haller 1983; Liao and Chen 1983; Sin and Chiu 1983; Rakocy and McGinty 1989). Aera- tion and/or water exchange are necessary at these higher stocking densities (Sin and Chiu 1983; Rakocy and McGinty 1989) and have been accounted for in the present eco- nomic analysis.
Profitability can be improved by target- ing production and market areas that have the greatest impact on IRR, NPV and DPP (Rhodes and Hollin 1990). With regard to production, profitability indices were most sensitive to changes in percent unmarketa-

RED TILAPIA PRODUCTION IN PUERTO RICO 285
TABLE 6. Extended.
877,969 927,608 877,969 927.608 148,100 148,100 148,100 148,100
1,032,034 1,190,308 1,026,989 1,080,753 1.157.61 I 1,322,981 1.157.61 1 1,322,981
125,577 132,673 130,622 242,228 (53,594) 79,079 209,701 45 1,929
5,965 114,600 920 5,045
ble fish, followed by average final weights and survival. In general, fish are rendered unmarketable by stunting and deformities, characteristics which are presumably genet- ically-based, and which are related to low- ered growth rates (i.e.. final average weights) and survival. Overall farm pro- ductivity, as well as the percentage of un- marketable fish, will therefore depend in large part on the ability of the farmer to maintain and to improve fish stock genetic integrity (Tave 1986).
IRR, NPV and DPP were very sensitive to changes in wholesale price. Since salt- water-cultured red tilapia is a new product in Puerto Rico, consumer demand and wholesale price are likely to be greatly in- fluenced by product promotion and the abil- ity of producers to maintain quality and availability (Head et al. 1994). Early pro- ducers can command premium prices for a short time, but competition from other ti- lapia producers entering the market may lower the wholesale price (Nelson et al. 1983). At a stocking density of 3.5 fish/m2, a slight increase in wholesale price to $4.70/kg boosts the IRR to 23.5% and NPV to $31 1,352, and reduces DPP to 6.5 yr, but a decrease in wholesale price to $4.40/kg reduces the IRR to 12.4%, making the pro- posed operation uneconomical. At a stock- ing density of 4.0 fish/m2, the profitability indices remain favorable throughout a rel- atively broad range of wholesale prices ($4.25-4.85/kg) (Table 7).
Since imported feed accounts for 39.1 %
of the variable costs and shipping repre- sents 32% of the feed cost, profitability could be improved by using a locally pro- duced feed. At a stocking density of 3.5 fish/m2, reducing feed costs by 18.2% (from $0.55 to $0.45/kg) boosts the IRR and NPV to 26.8% and $448,000, respectively and reduces the DPP from 8.5 to 5.8 yr. Reduc- ing feed costs by the cost of shipping (from $0.55 to $0.375/kg) significantly increases profitability (Table 7).
Vertical integration of a hatchery opera- tion with the growout phase can substan- tially improve economic feasibility. At a stocking density of 3.5/m2, the proposed 20-ha facility has a sex-reversed fry re- quirement of approximately 1.7 million each year which can be produced by a com- mercial facility at a breakeven price of $O.O6/fry (Head and Watanabe 1995). At a stocking density of 3.5 fish/m2, this increas- es the IRR from 18.2% to 28.9%, the NPV from $1 11,720 to $515,188, and reduces the DPP from 8.5 to 5.5 yr (Table 7). A lowering of both fry and feed costs to $O.O6/fry and $0.45/kg, respectively, in- creases the IRR to 38.8% and the NPV to $923,635, and reduces the DPP to 4.2 yr, significantly improving profitability.
To summarize, results of an economic analysis of a proposed 20-ha saltwater pond production system for Florida red tilapia, based on pilot production data, suggests the enterprise would be commercially feasible at current wholesale prices at a stocking density of 4.0 fish/m2, marginally feasible at 3.5 fish/m2, and uneconomical at 3.0 fish/m2. Costs can be lowered considerably by reducing the percentage of unmarketable fish, improving growth and survival, using locally-prepared feeds, and vertically inte- grating hatchery and growout operations. This economic analysis is intended as a guide and must be modified to reflect in- dividual situations.
Acknowledgments We would like to thank Eureka Marine
Products Company of Puerto Rico for their

286 HEAD ET AL.
TABLE 7. Sensitivity of breakeven price, 10-yr projected internal rate of return (IRR), net preseni value (NPV) and discounted payback period (DPP) to production (unmarketable fish, average final weight, survival, and food conversion ratio) and market (wholesale price, produciion feed price, and fry price) variables at three stocking densities. Variables are arranged in rank order of importance of their impaci on the profitabiliiy indices.
Stockine densitv
3 fish/m2 3.5 fish/m2
Break- Break- even IRR NPV DPP even IRR NFV DPP
Variable ($/kg) (%) ($) (yrs) ( $ k g ) (%) ($) (yrs) Unmarketable Fish (%)
2 4.00 11.1 4" 4.08 7.6 6 4.17 3.8 8 4.26 -b
10 4.35 -b
Wholesale Price ($/kg) 4.25 4.08 9
4.40 4.08 I .5 4.55' 4.08 7.6 4.70 4.08 13.1 4.85 4.08 18.1
Average Final Weight (g) b 49 1 4.31 -
518 4.18 2.6 5450 4.08 7.6 572 3.98 12.5 600 3.88 17.0
Survival (%) 60 4.38 -b
65 4.19 2.6 70" 4.08 7.6 75 3.97 12.5 80 3.88 16.8
Production Feed Price ($/kg) 0.375 3.66 21.4 0.45 3.84 16.6 0.50 3.96 12.4 0.55' 4.08 7.6 0.60 4.20 2.6 0.65 4.32 - b
Food Conversion Ratio 1.4 3.79 18.5 1.6 3.94 13.2 1.8' 4.08 7.6 2.0 4.23 1.4 2.2 4.37 -h
Fry Price ($/fry) 0.06 3.81 18.2 0.09 3.97 12.0 0.10 4.03 9.8 O . l l a 4.08 7.6 0.12 4.13 5.3 0.13 4.19 2.9
(1 27,608) (235.7 17) (343,825) (45 1,932) (560.049)
(577,862) (406,790) (235,717) (64,644) 106.426
(52 1,699) (375,697) (235,717) (83,683) 67,723
(602,492) (377,002) (235.7 17) (82,300) 65,059
234.6 17 52,530
(85,749) (235.7 17) (376,840) (566,767)
116,582 (59,566)
(235,717) (4 1 1,854) (587,994)
110,031 (97,418)
( 166,565) (235.7 17) (304.864) (374.014)
> 10.0 >IO.O >10.0 > 10.0 > 10.0
> 10.0 >10.0 > 10.0 > 10.0
8.6
> 10.0 > 10.0 > 10.0 > 10.0
9.1
> 10.0 > 10.0 >10.0 > 10.0
9.2
7.2 9.3
> 10.0 > 10.0 > 10.0 > 10.0
8.4 >10.0 > 10.0 > 10.0 >10.0
8.5 > 10.0 > 10.0 >10.0 > 10.0 >10.0
3.78 3.86 3.95 4.03 4.12
3.86 3.86 3.86 3.86 3.86
4.12 3.99 3.86 3.76 3.65
4.07 3.96 3.86 3.77 3.69
3.45 3.63 3.74 3.86 3.98 4.10
3.57 3.72 3.86 4.01 4.15
3.59 3.75 3.81 3.86 3.92 3.97
21.6 18.2 14.6 10.8 6.8
6.1 12.4 18.2 23.5 28.6
5.9 12.3 18.2 23.5 29.1
7.9 13.2 18.2 22.8 26.7
33.9 26.8 22.8 18.3 13.4 8.3
29.1 23.7 18.2 12.3 6.0
28.9 22.6 20.4 18.2 15.9 13.6
237,885 I 1 1,762 (14,375)
(140,502) (266,403)
(287,423) (87,834) 1 1 1,762 3 1 1,352 5 10,944
(293,548) (93,499) 11 1,762 3 12,702 523,093
(232,079) (60,166) 111,762 283,688 43 1,302
709,338 448,000 279,838 1 1 1,762 (56.494)
(224,655)
522,788 323,560 11 1,762 (93,631)
(299,020)
515,188 275,115 192,467 1 11,762 3 1.092
(49,583)
7.1 8.5
>10.0 > 10.0 > 10.0
> 10.0 > 10.0
8.5 6.5 5.5
> 10.0 > 10.0
8.5 6.5 5.4
> 10.0 > 10.0
8.5 6.7 5.8
4.7 5.8 6.7 8.5
> 10.0 > 10.0
5.4 6.4 8.5
> 10.0 > 10.0
5.5 6.8 7.5 8.5 9.6
> 10.0 . . .
a Base case used in the text. Negative IRR.

RED TlLAPlA PRODUCTION IN PUERTO RICO 287
TABLE 7. Extended. cooperation; Evelyn Cepeda, Dallas Alston and John Glude for providing information on her to Rico aquaculture; Robert Wick- lund and Bori Olla for helpful advice; Sheri Hall for her assistance; Carole Engle, Kerry Tudor and anonymous reviewers for useful
Break- comments on the manuscript. This study even IRR NPV DPP was supported by a grant from the National
($kg) (96) 6) (yrs) Undersea Research Program, National Oce-
Stocking density
4 fish/m2
3.63 3.70 3.78 3.86 3.95
3.70 3.70 3.70 3.70 3.70
3.93 3.81 3.70 3.60 3.5 1
3.84 3.75 3.70 3.58 3.50
3.29 3.46 3.58 3.70 3.82 3.94
3.41 3.56 3.70 3.85 3.99
3.43 3.59 3.65 3.70 3.76 3.81
30.4 26.9 23.6 19.9 17.2
15.1 21.2 26.9 32.4 37.7
15.1 21.2 26.9 32.7 38.3
18.8 23.7 26.9 32.8 37.0
43.7 36.5 31.8 26.9 22.0 16.9
37.9 32.6 26.9 20.9 14.7
39.0 31.7 29.3 26.9 24.6 22.2
603,130 458,982 314,838 184,908 80,996
2,792 230,886 458,982 687,078 915,175
2,262 232,557 458,982 696,786 928,010
139,098 329,188 458,982 700,246 899,436
1,131,751 843,357 65 1,169 458,982 266,793 67,308
917.5 18 693.780 458,982 224.2 I I (10.499)
928,399 643,378 55 1,180 458,982 366,784 274,583
5.2 5.7 6.5 7.8 8.8
10.0 7.2 5.7 4.9 4.2
10.0 7.2 5.7 4.8 4.2
8.2 6.4 5.7 4.8 4.3
3.8 4.4 5 .o 5.7 7.0 9.2
4.2 4.9 5.7 7.3
> 10.0
4.1 5.0 5.3 5.7 6.2 6.9
anic and Atmospheric Administration, U.S. Department of Commerce and by the Perry Foundation.
Literature Cited Allen, P. G., L. W. Botsford, A. T. Schuur and W.
E. Johnston. 1984. Bioeconomics of aquacul- ture. Developments in aquaculture and fisheries science, Number 13. Elsevier Science Publishers, New York, New York. USA.
Balarin, J. D. and R. D. Haller. 1983. Commercial tank culture of tilapia. Pages 473-483 in L. Fish- elson and Z. Yaron, editors. International sympo- sium on tilapia in aquaculture. Tel Aviv Univer- sity, Tel Aviv. Israel.
Bauer, L. L., P. A. Sandifer, T. I. J. Smith and W. E. Jenkins. 1983. Economic feasibility of prawn Macrobrachiurn production in South Carolina, USA. Aquacultural Engineering 2: 181-201.
Bhandari, S. B. 1986. Discounted payback: a crite- rion for capital investment decisions. Journal of Small Business Management 24(2): 15-22.
Bimhao, M. P. and I. R. Smith. 1988. Philippine tilapia economics: Industry and growth potential. Pages 539-551 in R. S. V. Pullin, T. Bhukaswan, K. Tonguthai and J. L. Maclean, editors. The Sec- ond International Symposium on Tilapia in Aqua- culture. ICLARM Conference Proceedings, De- partment of Fisheries, Bangkok, Thailand, and In- ternational Center for Living Aquatic Resources Management, Manila, Philippines.
Brass, J. L., M. B. Rust, B. L. Olla and R. I. Wick- lund. 1990. Preliminary investigations into the socio-economic feasibility of saltwater cage cul- ture of Florida red tilapia in Haiti. Journal of the World Aquaculture Society 2 1 : 192-200.
Brumfield, R. G., R. V. Nelson, A. J. Coutu, D. H. Willits and R. S. Sowell. 1981. Overhead costs of greenhouse firms differentiated by size of firm and market channel. North Carolina Agricultural Research Service, technical bulletin number 269. North Carolina State University, Raleigh, North Carolina, USA.
Chakallal, B. and P. Noriega-Curtis. 1992. Tilapia fanning in Jamaica. Gulf and Caribbean Fisheries Institute 41545-569.
Clark, A. E., W. 0. Watanabe, B. L. Olla and R. I.

288 HEAD ET AL.
Wicklund. 1990. Growth, feed conversion, and protein utilization of Florida red tilapia fed iso- caloric diets with different protein levels in sea- water pools. Aquaculture 87:75-85.
Conner, D. 1985. Florida aquaculture plan. Florida Department of Agriculture and Consumer Ser- vices, Tallahassee, Florida, USA.
Crews, J. and J. W. Jensen. 1989. Budget and sen- sitivity analyses for Alabama catfish production. Alabama Cooperative Extension Service, Auburn University, Alabama, USA.
Ellis, E. P. and W. 0. Watanabe. 1993. The effects of hyposalinity on eggs, juveniles and adults of the marine monogenean, Neobenedeniu melleni. Treatment of ecto-parasitosis in seawater-cultured tilapia. Aquaculture 117: 15-27.
Emst, D. H., L. J. Ellingson, B. L. Olla, R. I. Wick- lund, W. 0. Watanabe and J. J. Grover. 1989. Production of Florida red tilapia in seawater pools: nursery rearing with chicken manure and growout with prepared feed. Aquaculture 80:247- 260.
Escover, E. M., 0. T. Salon and E. R. Smith. 1987. The economics of tilapia fingerling production and marketing in the Philippines. Aquaculture and Fisheries Management 18:l-13.
Fitzgerald, W. J. 1988. Comparative economics of four aquaculture species under monoculture and polyculture production in Guam. Journal of the World Aquaculture Society 19: 132-142.
Gallet de Saint Aurin, D., J. C. Raymond and V. Vianas. 1990. Marine finfish pathology: specific problems and research in the French West Indies. Pages 143-160 in Advances in tropical aquacul- ture. Actes de Colloque No. 9. AQUACOI? IFRE- MER. Workshop at Tahiti, French Polynesia, Feb-
Gittinger, J. P. 1982. Economic analysis of agricul- tural projects, 2nd edition. Johns Hopkins Univer- sity Press, Baltimore, Maryland, USA.
Glude, J. B. 1977. NOAA aquaculture plan. U.S. De- partment of Commerce, Washington, D.C., USA.
Glude, J. B. 1981. Aquaculture development master plan for Puerto Rico. Corporation for the Devel- opment and Administration of the Marine, Lacus- trine and Fluvial Resources of Puerto Rico, San Juan, Puerto Rico.
Glynn, P. W. 1973. Ecology of a Caribbean coral reef. The forires reef-flat biotope. Part 1: mete- orology and hydrography. Marine Biology 20:
Head, W. D. and W. 0. Watanabe. 1995. Economic analysis of a commercial-scale, recirculating brackishwater hatchery for Florida red tilapia. Journal of Applied Aquaculture S(2): 1-23.
Head, W. D., A. Zerbi, and W. 0. Watanabe. 1994. Preliminary observations on the marketability of saltwater-cultured Florida red tilapia in Puerto
ruary 20-Mar~h 4, 1989.
297-3 18.
Rico. Journal of the World Aquaculture Society
Hepher, B. and Y. Pruginin. 1981. Commercial fish fanning. John Wiley and Sons, New York, New York. USA.
Hepher, B. and Y. Pruginin. 1982. Tilapia culture in ponds under controlled conditions. Pages 185- 203 in R. S. V. Pullin and R. H. Lowe-McConnell, editors. The biology and culture of tilapias. ICLARM Conference Proceedings. International Center for Living Aquatic Resources Manage- ment, Manila, Philippines.
Hopkins, K., M. Hopkins, D. Leclercq and A. A. Al-Ameeri. 1986. Tilapia culture in Kuwait: a preliminary economic analysis of production sys- tems. Kuwait Bulletin of Marine Science 7:45-64.
IDRC (International Development Research Cen- ter). 1982. Aquaculture economics research in Asia. Proceedings of a workshop held in Singa- pore, June 2-5, 1981. IDRC, Ottawa, Ontario, Canada.
Kaneko, J. J., R. Yamada, J. A. Brock and R. M. Nakamura. 1988. Infection of tilapia. Oreo- chromis mossumbicus (Trewavas), by a marine monogenean, Neobenedeniu melleni (MacCallum, 1927) Yamaguti, 1963 in Kaneohe Bay, Hawaii, USA, and its treatment. Journal of Fish Diseases
Liao, I-C. and T-P. Chen. 1983. Status and prospects of tilapia culture in Taiwan. Pages 588-596 in L. Fishelson and Z. Yaron, editors. International Symposium on Tilapia in Aquaculture. Tel Aviv University, Tel Aviv, Israel.
Mueller, K. W., W. 0. Watanabe and W. D. Head. 1992. Effect of salinity on hatching in Neobene- deniu melleni, a monogenean ectoparasite of sea- water-cultured tilapia. Journal of the World Aqua- culture Society 23: 199-204.
Nelson, R. G., L. L. Behrends, E. L. Waddell and D. W. Burch. 1981. Tilapia culture in heated ef- fluents: Economic aspects. Pages 397-404 in S . Sengupta and S . S . Lee, editors. Third Waste Heat Management and Utilization Conference. Hemi- sphere Publishing, New York, New York, USA.
Nelson, R. G., L. L. Behrends, E. L. Waddell and D. W. Burch. 1983. Estimating relative sales po- tential of tilapia in supermarkets. Proceedings An- nual Conference Southeast Association Fish and Wildlife Agencies 37:314-326.
Newnan, D. G. 1991. Engineering economic analysis. Engineering Press, Inc., San Jose, California, USA.
Pomeroy, R. S., D. B. Luke and T. Schwedler. 1989. Commercial catfish budgets and cashflow state- ments. Clemson University Extension Economics Report No. 108. Clemson University, South Car- olina, USA.
Pounds, G. L., C. Engle and L. W. Dorman. 1992.
25:432-441.
1 1 :295-300.
RED TILAPIA PRODUCTION IN PUERTO RICO 289
Economic effects of intensification of baitfish pro- duction. Journal of the World Aquaculture Society 2354-76.
Rakocy, J. E. and A. S. McGinty. 1989. Pond cul- ture of tilapia. Florida Cooperative Extension Ser- vice. Southern Regional Aquaculture Center Pub- lication No. 280. University of Florida, Gaines- ville, Florida, USA.
Rhodes, R. J. 1991. Economics of aquaculture pro- duction: Financial feasibility. Pages 192-208 in J. A. Hargreaves and D. E. Alston. editors. Status and potential of aquaculture in the Caribbean. The World Aquaculture Society, Baton Rouge, Loui- siana, USA.
Rhodes, R. J. and D. Hollin. 1990. Financial analysis of a commercial red drum aquaculture enterprise. Pages 189-208 in G. W. Chamberlain, R. J. Miget and M. G. Haby, compilers. Red drum aquacul- ture, Texas A&M Sea Grant Publication 90-633. Galveston, Texas, USA.
Sandifer, P. A. 1991. Species with aquaculture po- tential for the Caribbean. Pages 30-60 in J. A. Hargreaves and D. E. Alston, editors. Status and potential of aquaculture in the Caribbean. The World Aquaculture Society, Baton Rouge, Loui- siana, USA.
Sarig, S. and M. Marek. 1974. Results of intensive and semi-intensive fish breeding techniques in Is- rael in 1971-1973 Bamidgeh 26: 28-48.
SCS (Soil Conservation Service). 1976. SCS tech- nical guide, section IV. engineering standards for ponds. USDNSCS Code 378. Soil Conservation Service, United States Department of Agriculture, Washington, D.C., USA.
Shang, Y. C. 1990. Aquaculture economic analysis: an introduction. Advances in world aquaculture, volume 2. The World Aquaculture Society, Baton Rouge, Louisiana, USA.
Sin, A. W. and M. T. Chiu. 1983. The intensive monoculture of the tilapia hybrid, Surofherodon nilofica (male) X S. mossambicu (female) in Hong Kong. Pages 506516 in L. Fishelson and Z. Ya- ron. editors. International Symposium on Tilapia in Aquaculture. Tel Aviv University, Tel Aviv. Is- rael.
Smith, I. R., E. B. Torres and E. 0. Tan, editors. 1985. Philippine tilapia economics. ICLARh4 Conference Proceedings 12. Philippine Council for Agriculture and Resources Research and De-
velopment, Los Banos, Laguna and International Center for Living Aquatic Resources Manage- ment, Manila, Philippines.
Staniford, A. J. 1989. The effect of yield and price variability on the economic feasibility of fresh- water crayfish Cherax destrucror Clark (Decapo- da: Parastacidae) production in Australia. Aqua- culture 81:225-235.
Staniford, A. J. and J. Kuznecovs. 1988. Aquacul- ture of the yabbie, Cherax destructor Clark (De- capoda: Parastacidae): an economic evaluation. Aquaculture and Fisheries Management 19:325- 340.
Stickney, R. R. and J. T. Davis. 1981. Aquaculture in Texas. A status report and development plan. Texas A&M Sea Grant Report TAMU-SG-8 1 - 1 19, College Station, Texas, USA.
Tave, D. 1986. Genetics for fish hatchery managers. AVI Publishing Company, Inc., Westport, Con- necticut, USA.
Watanabe, W. 0. 1991. Saltwater culture of tilapia in the Caribbean. World Aquaculture 22:49-54.
Watanabe, W. O., R. I. Wicklund, B. L. OUa, D. H. Ernst and L. J. Ellingson. 1989. Potential for saltwater tilapia culture in the Caribbean. Gulf and Caribbean Fisheries Institute 39:435-445.
Watanabe, W. O., K. W. Mueller, W. D. Head and S. C. Ellis. 1993. Sex reversal of Florida red ti- lapia in brackish water tanks under different treat- ment durations of 17 a-ethynyltestosterone admin- istered in feed. Journal of Applied Aquaculture
Watanabe, W. O., J. R. Chang, S. J. Smith and R. I. Wicklund. In press. Production of Florida red tilapia (Oreochromis sp.) in flowthrough seawater pools at three stocking densities. fn R. S. V. Pullin, J. Larard. M. Legendre, J. B. Amon Kothias and D. Pauly, editors. The Third International Sym- posium on Tilapia in Aquaculture. ICLARM Con- ference Proceedings 4 1.
Yap, S.-Y., H.-T. Ong and K.4. Lim. 1989. For- mulation of aquaculture development at an ox- bow lake in Malaysia: economic feasibility anal- ysis. Aquaculture and Fisheries Management 20:
Zimet, D. J. 1988. Aquaculture investments and bud- gets. Institute of Food and Agricultural Sciences, University of Florida Staff Paper No. 338. Gaines- ville, Florida, USA.
2( 1):29-41.
427-439.