Embed Size (px)
Citation preview

December 2021
Economic Impacts of Hunting and Target Shooting - Technical Report Within U.S. States and Congressional Districts
Produced for the:
Sportsmen’s Alliance Foundation
This report was funded by the U.S. Fish and Wildlife Service’s Multistate Conservation Grant Program
(grant # F21AP00607), which is jointly managed by the Association of Fish and Wildlife Agencies and the
Service’s Wildlife and Sport Fish Restoration Program.
Produced by:
PO Box 6435 ■ Fernandina Beach, FL 32035 ■ Office (904) 277-9765

Economic Impact of Hunting and Shooting in 2020: Technical Report | ii
Southwick Associates | PO Box 6435 ■ Fernandina Beach, FL 32035 ■ Office (904) 277-9765
Table of Contents
Introduction ............................................................................................................................................ 1
Interpretation.......................................................................................................................................... 1
Data & Methods ...................................................................................................................................... 2
Hunting Estimates................................................................................................................................ 2
Target Shooting Estimates ................................................................................................................... 2
Spending ......................................................................................................................................... 2
Participation .................................................................................................................................... 3
Economic Impacts ............................................................................................................................ 3
Congressional District-Level Estimates ................................................................................................. 3
Limitations and Notes .......................................................................................................................... 4
Results .................................................................................................................................................... 5
References ............................................................................................................................................ 64
Appendix A. Definitions of Economic Contribution................................................................................. 65
Appendix B. Methodology for Estimating Economic Contribution .......................................................... 67
List of Tables
Table 1. Economic Contributions of Recreational Hunting in the U.S. by Type .......................................... 6
Table 2. Participation and Days of Recreational Hunting by State, 2020 ................................................... 6
Table 3. Economic Contributions of All Recreational Hunting by State, 2020 ............................................ 8
Table 4. Statewide Economic Contributions of Recreational Hunting by Congressional District, 2020 ..... 11
Table 5. Economic Contributions of Target Shooting in the U.S. by Type ................................................ 31
Table 6. Participation and Days of Target Shooting by State, 2020 ......................................................... 31
Table 7. Economic Contributions of All Target Shooting Activities, 2020 ................................................ 34
Table 8. Economic Contributions of Handgun Target Shooting Activities, 2020 ...................................... 36
Table 9. Economic Contributions of Rifle Target Shooting Activities, 2020 ............................................. 38
Table 10. Economic Contributions of Shotgun Target Shooting Activities, 2020...................................... 40
Table 11. Economic Contributions of Muzzleloader Target Shooting Activities, 2020 ............................. 42
Table 12. Statewide Economic Contributions of Target Shooting by Congressional District, 2020 ........... 44

Economic Impact of Hunting and Shooting in 2020: Technical Report | 1
Southwick Associates | PO Box 6435 ■ Fernandina Beach, FL 32035 ■ Office (904) 277-9765
Introduction
Recreational hunting and target shooting created a substantial economic impact in the U.S. during 2020, generating over
$65 billion in combined retail sales, and contributing $149 billion to the national economy. The spending by hunters and
shooters supported nearly 970,000 jobs, creating over $45 billion in wages and income. These effects are immense when
considering them on a national level, but these sports also have crucial impacts on state and local economies. In this
study we estimate the contributions that hunters and shooters make to their respective state economies based on their
residence in each of the 435 U.S. congressional districts. Results are presented at the national, state, and congressional
district level, and by major type of hunting or target shooting.
Interpretation
These results report the economic contributions from hunters and shooters by state, and to the respective state
economies based on the number of hunters and shooters living within each congressional district. These results do not
represent the economic contributions that occur within any given district as a result of hunter or shooter spending. For
example, the presence or absence of a large manufacturing firm within a district is not reflected in the equipment
spending by a district’s residents. Such firms serve a market area well beyond the boundaries of any single district.
Likewise, the presence or absence of a hunting destination within a congressional district does not determine the trip-
related spending reported for a district. The trip expenditures made by hunters who live in one congressional district
and hunt in a different district within the state are counted as statewide spending. The results, therefore, show the total
statewide spending within each district as determined by the number of hunters and shooters who live in that district,
not on the hunting and shooting activity occurring within each district.

Economic Impact of Hunting and Shooting in 2020: Technical Report | 2
Southwick Associates | PO Box 6435 ■ Fernandina Beach, FL 32035 ■ Office (904) 277-9765
Data & Methods
Hunting Estimates
Participation and spending on recreational hunting in all 50 states were last reported in the 2011 National Survey of
Fishing, Hunting, and Wildlife-Associated Recreation- FHWAR (USFWS, 2011). This report utilizes that information and
updates the number of hunters and associated spending 2020 levels using the following methodology:
• The historical record of licensed hunters in each state provided by the U.S. Fish and Wildlife Service (USFWS,
2020) was used to update 2011 participation and spending estimates to 2019 levels.
• 2019 – 2020 hunting license trends provided by the Council to Advance Hunting and Shooting Sports were then
used to update the state-level hunting participation and spending estimates to 2020 levels. Spending was also
adjusted to account for inflation between 2011 and 2020.
• For states with large year-over-year variation in hunting license sales, individual conversations were held with
agency staff to determine whether these indicated real changes in participation or changes in reporting
methodology. Large year-over-year variations that agency staff did not believe were reflective of true
participation changes were smoothed using the overall trend from 2011-2019, excluding the problem year(s).
• Economic contributions from hunting were then estimated for the U.S. and for each state using national and
state-specific economic models provided by IMPLAN.
Target Shooting Estimates
Several data sources were utilized to estimate the economic impact of target shooting in 2020.
Spending
National firearm and ammunition sales were first estimated for 2020 using federal excise tax data. Researchers divided
the total amount collected by the tax rate to determine the value of all firearm and ammunition shipments. For 2020, it
was assumed that all product produced and shipped at wholesale was sold at retail. No inventory was on-hand at the
end of the year. To estimate the proportion of firearm and ammunition sales attributable to target shooting, researchers

Economic Impact of Hunting and Shooting in 2020: Technical Report | 3
Southwick Associates | PO Box 6435 ■ Fernandina Beach, FL 32035 ■ Office (904) 277-9765
applied ratios obtained from Southwick Associates’ Hunter/Shooter Survey panels. Within these surveys, respondents
are asked to indicate the purpose for each of their reported purchases (hunting, target shooting, personal defense, etc.).
The amount spent for target shooting supplies and equipment other than firearms and ammunition were taken from
Southwick Associates’ 2020 Market Size report, which is based upon the panel surveys described above. Trip
expenditures for target shooting were estimated using an online survey of target shooters originally conducted in 2017
for the National Shooting Sports Foundation (NSSF). The assumption was made that per shooter annual trip spending
(food, lodging, etc.) has not changed between 2017 and 2020. Inflation data were used to update per shooter trip
expenditures to 2020 levels.
Participation
State-level target shooting participation estimates are prepared by the National Sporting Goods Association (NSGA) for
the NSSF by on an annual basis (NSGA, 2021). Participation estimates are provided for all target shooting activities, as
well as by type of firearm used. Due to large year-over-year variation in some of the state-level estimates, researchers
used an average of five-year (2016-2020) participation by state rather than using the 2020 participation estimates
directly.
Economic Impacts
Since state-level spending information was not available for target shooters, an assumption was made that spending per
participant does not vary by state. Researchers took the total estimated annual spending by target shooters in the U.S.
and allocated the spending to each state based on the percentage of the total target shooting days recorded in each
state per the NSGA five-year averages. The per-state spending was run through state-specific IMPLAN models to
estimate state-level economic impacts.
Congressional District-Level Estimates
The estimates of hunters and target shooters by congressional district are based, in part, on a dataset obtained from
ESRI®. This company uses detailed geographic, socioeconomic and lifestyle information in combination with third party
sources of data to estimate numbers of adult hunters and target shooters in each congressional district. ESRI® estimates
of hunters and shooters are available at a variety of spatial scales, including congressional districts. Other data sources,
discussed above, are relied on to generate state-level hunter and target shooter participation estimates. The ESRI®

Economic Impact of Hunting and Shooting in 2020: Technical Report | 4
Southwick Associates | PO Box 6435 ■ Fernandina Beach, FL 32035 ■ Office (904) 277-9765
estimates establish the distribution of hunters and target shooters within the state as a proportional distribution. These
percentages were then used to apportion the state-level estimates to corresponding districts. This apportionment also
relies on a simplifying assumption about geographic variability: the average spending per hunter and target shooter is
the same for all districts in a given state.
Limitations and Notes
The most recent state-level hunter spending estimates come from 2011. The more recent 2016 FHWAR survey only
reported hunting participation and spending at the Census Division level, and thus could not be used for this effort
(USFWS, 2016). Sample sizes from the 2011 FHWAR report were not adequate to enable breaking out resident and non-
resident spending, so only the total spending on hunting in each state is presented in this report. Another assumption
made in this report is that spending per target shooter does not vary by state. The use of multiple data sources, each
reporting for different years, introduces an unknown level of error to each reported estimate. Until up-to-date hunter
and shooter spending data are available for each state, the approach applied here is considered the best available
method.
Colorado had conducted a study of the economic impacts of hunting in their state in 2017, with Southwick Associates’
assistance, and requested that these estimates be updated to 2020 levels rather than relying on the 2011 FHWAR
estimates as a starting point. Due to this methodology difference, Colorado’s impact of hunting should not be compared
directly to other states.

Economic Impact of Hunting and Shooting in 2020: Technical Report | 5
Southwick Associates | PO Box 6435 ■ Fernandina Beach, FL 32035 ■ Office (904) 277-9765
Results
All tables follow this initial list:
Table 1 presents national-level economic impacts resulting from all hunting activities, as well as by major type of
hunting.
Table 2 presents participation and the number of days spent hunting by state. All types of hunting activities are
combined.
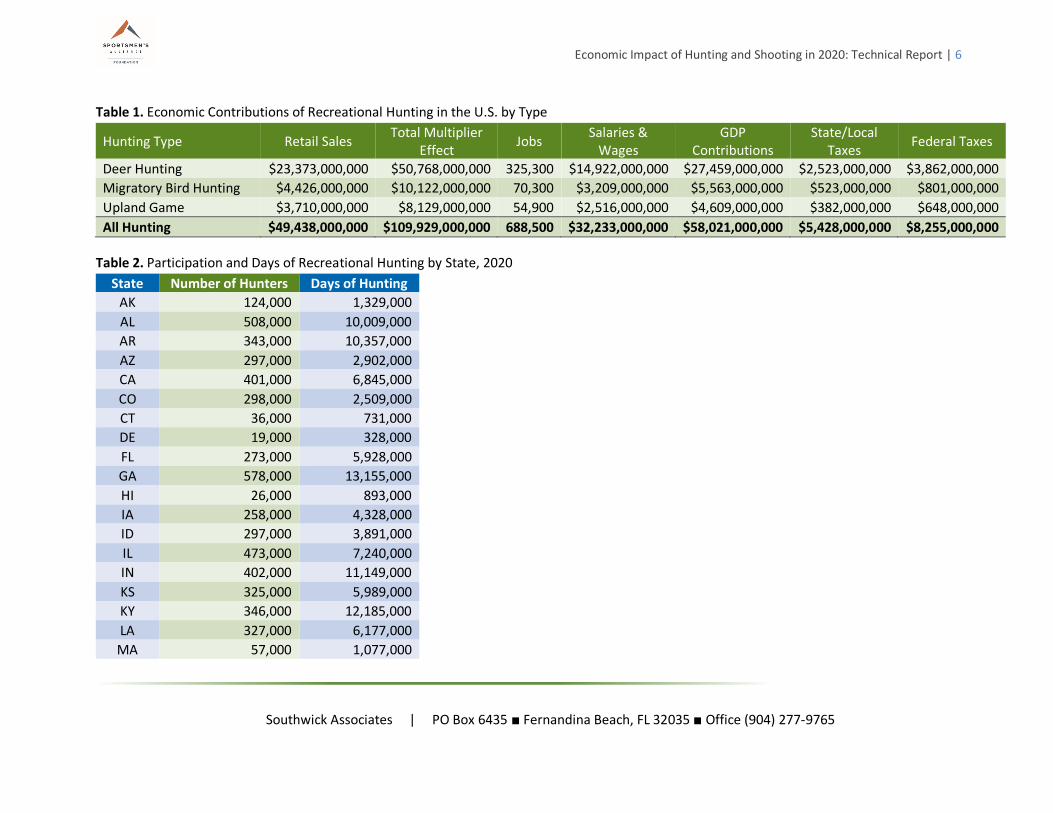
Table 3 presents state-level economic impacts resulting from all hunting activities.
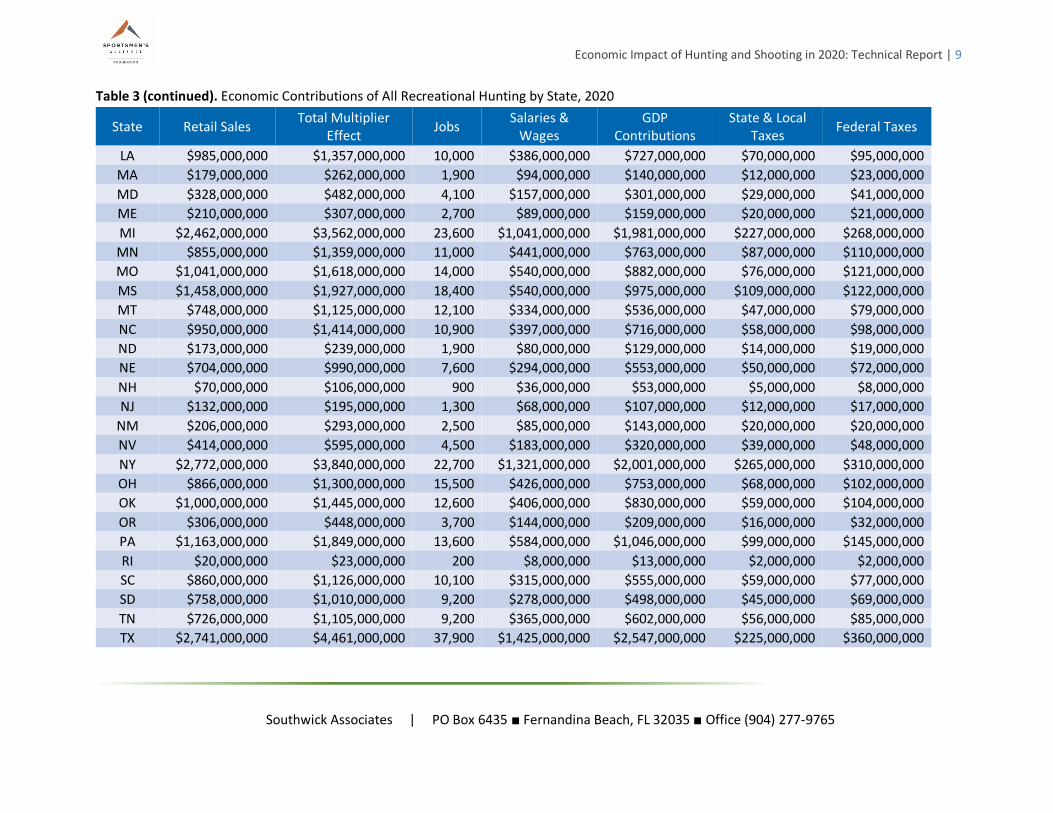
Table 4 presents congressional district-level economic impacts resulting from all hunting activities.
Table 5 presents national-level economic impacts resulting from all target shooting activities, as well as by major type of
shooting.
Table 6 presents participation and the number of days spent target shooting by state and by type of shooting.
Tables 7 through 11 presents state-level economic impacts resulting from all target shooting activities and by firearm
type.
Table 12 presents congressional district-level economic impacts resulting from all target shooting activities.
Economic Impact of Hunting and Shooting in 2020: Technical Report | 6
Southwick Associates | PO Box 6435 ■ Fernandina Beach, FL 32035 ■ Office (904) 277-9765
Table 1. Economic Contributions of Recreational Hunting in the U.S. by Type
Hunting Type Retail Sales Total Multiplier
Effect Jobs
Salaries & Wages
GDP Contributions
State/Local Taxes
Federal Taxes
Deer Hunting $23,373,000,000 $50,768,000,000 325,300 $14,922,000,000 $27,459,000,000 $2,523,000,000 $3,862,000,000
Migratory Bird Hunting $4,426,000,000 $10,122,000,000 70,300 $3,209,000,000 $5,563,000,000 $523,000,000 $801,000,000
Upland Game $3,710,000,000 $8,129,000,000 54,900 $2,516,000,000 $4,609,000,000 $382,000,000 $648,000,000
All Hunting $49,438,000,000 $109,929,000,000 688,500 $32,233,000,000 $58,021,000,000 $5,428,000,000 $8,255,000,000
Table 2. Participation and Days of Recreational Hunting by State, 2020
State Number of Hunters Days of Hunting
AK 124,000 1,329,000
AL 508,000 10,009,000
AR 343,000 10,357,000
AZ 297,000 2,902,000
CA 401,000 6,845,000
CO 298,000 2,509,000
CT 36,000 731,000
DE 19,000 328,000
FL 273,000 5,928,000
GA 578,000 13,155,000
HI 26,000 893,000
IA 258,000 4,328,000
ID 297,000 3,891,000
IL 473,000 7,240,000
IN 402,000 11,149,000
KS 325,000 5,989,000
KY 346,000 12,185,000
LA 327,000 6,177,000
MA 57,000 1,077,000

Economic Impact of Hunting and Shooting in 2020: Technical Report | 7
Southwick Associates | PO Box 6435 ■ Fernandina Beach, FL 32035 ■ Office (904) 277-9765
Table 2 (continued). Participation and Days of Recreational Hunting by State, 2020
State Number of Hunters Days of Hunting
MD 93,000 1,088,000
ME 152,000 2,122,000
MI 471,000 9,805,000
MN 475,000 5,567,000
MO 520,000 9,097,000
MS 465,000 8,758,000
MT 151,000 2,511,000
NC 418,000 9,498,000
ND 83,000 798,000
NE 137,000 1,662,000
NH 55,000 1,340,000
NJ 91,000 2,333,000
NM 83,000 1,117,000
NV 70,000 1,205,000
NY 865,000 19,364,000
OH 479,000 7,765,000
OK 306,000 6,229,000
OR 206,000 2,318,000
PA 780,000 18,375,000
RI 18,000 385,000
SC 283,000 4,853,000
SD 242,000 3,347,000
TN 460,000 12,079,000
TX 1,266,000 22,501,000
UT 244,000 3,435,000
VA 387,000 9,007,000

Economic Impact of Hunting and Shooting in 2020: Technical Report | 8
Southwick Associates | PO Box 6435 ■ Fernandina Beach, FL 32035 ■ Office (904) 277-9765
Table 2 (continued). Participation and Days of Recreational Hunting by State, 2020
State Number of Hunters Days of Hunting
VT 75,000 1,311,000
WA 214,000 2,486,000
WI 857,000 11,669,000
WV 228,000 2,921,000
WY 135,000 1,658,000
US 15,067,000 310,599,000
Table 3. Economic Contributions of All Recreational Hunting by State, 2020
State Retail Sales Total Multiplier
Effect Jobs
Salaries & Wages
GDP Contributions
State & Local Taxes
Federal Taxes
AK $512,000,000 $600,000,000 5,100 $201,000,000 $326,000,000 $32,000,000 $55,000,000
AL $1,322,000,000 $1,757,000,000 17,800 $515,000,000 $865,000,000 $85,000,000 $119,000,000
AR $1,144,000,000 $1,680,000,000 15,100 $497,000,000 $913,000,000 $94,000,000 $121,000,000
AZ $441,000,000 $668,000,000 5,100 $217,000,000 $338,000,000 $39,000,000 $49,000,000
CA $1,360,000,000 $2,183,000,000 16,100 $760,000,000 $1,206,000,000 $140,000,000 $186,000,000
CO $626,000,000 $1,121,000,000 10,600 $372,000,000 $608,000,000 $58,000,000 $88,000,000
CT $259,000,000 $374,000,000 2,600 $124,000,000 $242,000,000 $27,000,000 $36,000,000
DE $41,000,000 $58,000,000 500 $21,000,000 $37,000,000 $2,000,000 $5,000,000
FL $1,276,000,000 $1,955,000,000 14,300 $532,000,000 $966,000,000 $93,000,000 $143,000,000
GA $1,688,000,000 $2,689,000,000 26,000 $891,000,000 $1,500,000,000 $136,000,000 $211,000,000
HI $71,000,000 $105,000,000 800 $31,000,000 $51,000,000 $7,000,000 $7,000,000
IA $537,000,000 $750,000,000 6,600 $232,000,000 $367,000,000 $41,000,000 $50,000,000
ID $666,000,000 $981,000,000 9,300 $283,000,000 $442,000,000 $50,000,000 $64,000,000
IL $1,433,000,000 $2,050,000,000 14,500 $571,000,000 $1,238,000,000 $132,000,000 $166,000,000
IN $276,000,000 $394,000,000 3,400 $121,000,000 $219,000,000 $21,000,000 $29,000,000
KS $545,000,000 $774,000,000 6,500 $235,000,000 $421,000,000 $42,000,000 $58,000,000
KY $1,213,000,000 $1,642,000,000 17,100 $481,000,000 $863,000,000 $76,000,000 $115,000,000
Economic Impact of Hunting and Shooting in 2020: Technical Report | 9
Southwick Associates | PO Box 6435 ■ Fernandina Beach, FL 32035 ■ Office (904) 277-9765
Table 3 (continued). Economic Contributions of All Recreational Hunting by State, 2020
State Retail Sales Total Multiplier
Effect Jobs
Salaries & Wages
GDP Contributions
State & Local Taxes
Federal Taxes
LA $985,000,000 $1,357,000,000 10,000 $386,000,000 $727,000,000 $70,000,000 $95,000,000
MA $179,000,000 $262,000,000 1,900 $94,000,000 $140,000,000 $12,000,000 $23,000,000
MD $328,000,000 $482,000,000 4,100 $157,000,000 $301,000,000 $29,000,000 $41,000,000
ME $210,000,000 $307,000,000 2,700 $89,000,000 $159,000,000 $20,000,000 $21,000,000
MI $2,462,000,000 $3,562,000,000 23,600 $1,041,000,000 $1,981,000,000 $227,000,000 $268,000,000
MN $855,000,000 $1,359,000,000 11,000 $441,000,000 $763,000,000 $87,000,000 $110,000,000
MO $1,041,000,000 $1,618,000,000 14,000 $540,000,000 $882,000,000 $76,000,000 $121,000,000
MS $1,458,000,000 $1,927,000,000 18,400 $540,000,000 $975,000,000 $109,000,000 $122,000,000
MT $748,000,000 $1,125,000,000 12,100 $334,000,000 $536,000,000 $47,000,000 $79,000,000
NC $950,000,000 $1,414,000,000 10,900 $397,000,000 $716,000,000 $58,000,000 $98,000,000
ND $173,000,000 $239,000,000 1,900 $80,000,000 $129,000,000 $14,000,000 $19,000,000
NE $704,000,000 $990,000,000 7,600 $294,000,000 $553,000,000 $50,000,000 $72,000,000
NH $70,000,000 $106,000,000 900 $36,000,000 $53,000,000 $5,000,000 $8,000,000
NJ $132,000,000 $195,000,000 1,300 $68,000,000 $107,000,000 $12,000,000 $17,000,000
NM $206,000,000 $293,000,000 2,500 $85,000,000 $143,000,000 $20,000,000 $20,000,000
NV $414,000,000 $595,000,000 4,500 $183,000,000 $320,000,000 $39,000,000 $48,000,000
NY $2,772,000,000 $3,840,000,000 22,700 $1,321,000,000 $2,001,000,000 $265,000,000 $310,000,000
OH $866,000,000 $1,300,000,000 15,500 $426,000,000 $753,000,000 $68,000,000 $102,000,000
OK $1,000,000,000 $1,445,000,000 12,600 $406,000,000 $830,000,000 $59,000,000 $104,000,000
OR $306,000,000 $448,000,000 3,700 $144,000,000 $209,000,000 $16,000,000 $32,000,000
PA $1,163,000,000 $1,849,000,000 13,600 $584,000,000 $1,046,000,000 $99,000,000 $145,000,000
RI $20,000,000 $23,000,000 200 $8,000,000 $13,000,000 $2,000,000 $2,000,000
SC $860,000,000 $1,126,000,000 10,100 $315,000,000 $555,000,000 $59,000,000 $77,000,000
SD $758,000,000 $1,010,000,000 9,200 $278,000,000 $498,000,000 $45,000,000 $69,000,000
TN $726,000,000 $1,105,000,000 9,200 $365,000,000 $602,000,000 $56,000,000 $85,000,000
TX $2,741,000,000 $4,461,000,000 37,900 $1,425,000,000 $2,547,000,000 $225,000,000 $360,000,000

Economic Impact of Hunting and Shooting in 2020: Technical Report | 10
Southwick Associates | PO Box 6435 ■ Fernandina Beach, FL 32035 ■ Office (904) 277-9765
Table 3 (continued). Economic Contributions of All Recreational Hunting by State, 2020
State Retail Sales Total Multiplier
Effect Jobs
Salaries & Wages
GDP Contributions
State & Local Taxes
Federal Taxes
UT $813,000,000 $1,313,000,000 10,900 $410,000,000 $654,000,000 $60,000,000 $95,000,000
VA $1,024,000,000 $1,466,000,000 17,700 $492,000,000 $886,000,000 $73,000,000 $127,000,000
VT $286,000,000 $400,000,000 3,200 $122,000,000 $214,000,000 $27,000,000 $30,000,000
WA $423,000,000 $643,000,000 4,700 $201,000,000 $343,000,000 $42,000,000 $53,000,000
WI $2,880,000,000 $3,851,000,000 25,000 $1,021,000,000 $2,057,000,000 $209,000,000 $275,000,000
WV $456,000,000 $549,000,000 4,200 $151,000,000 $260,000,000 $32,000,000 $35,000,000
WY $339,000,000 $443,000,000 4,000 $134,000,000 $227,000,000 $38,000,000 $37,000,000
US $49,438,000,000 $109,929,000,000 688,500 $32,233,000,000 $58,021,000,000 $5,428,000,000 $8,255,000,000

Economic Impact of Hunting and Shooting in 2020: Technical Report | 11
Southwick Associates | PO Box 6435 ■ Fernandina Beach, FL 32035 ■ Office (904) 277-9765
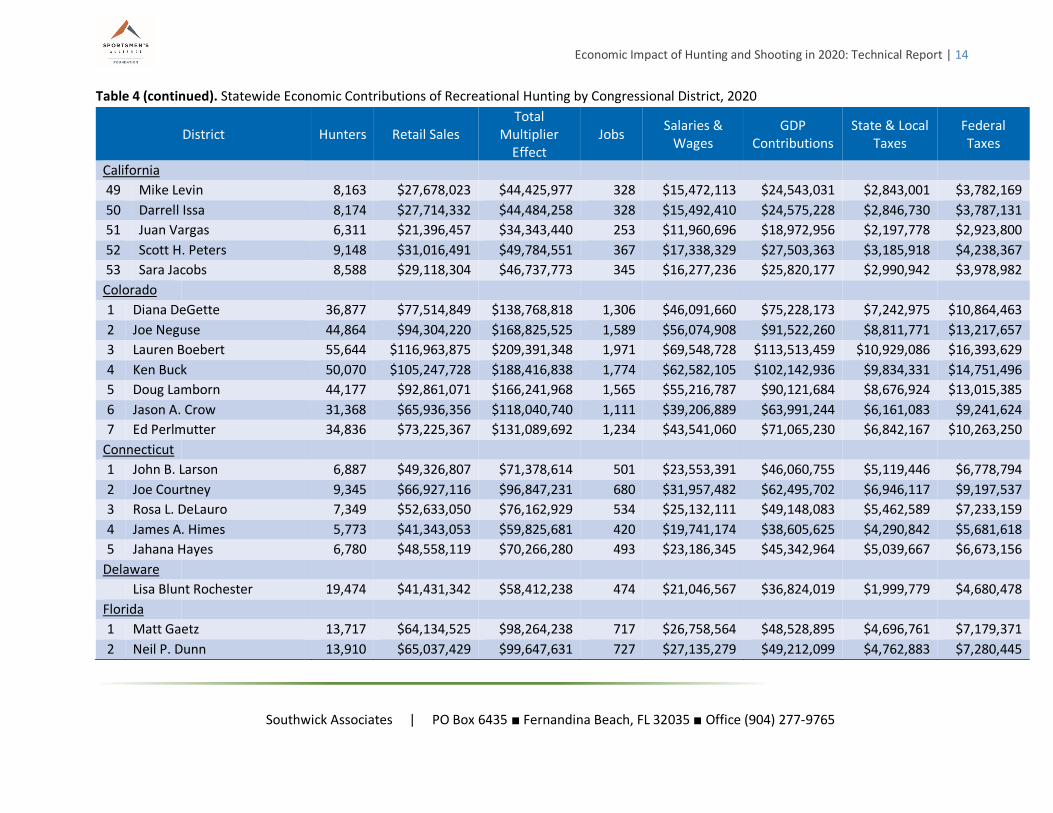
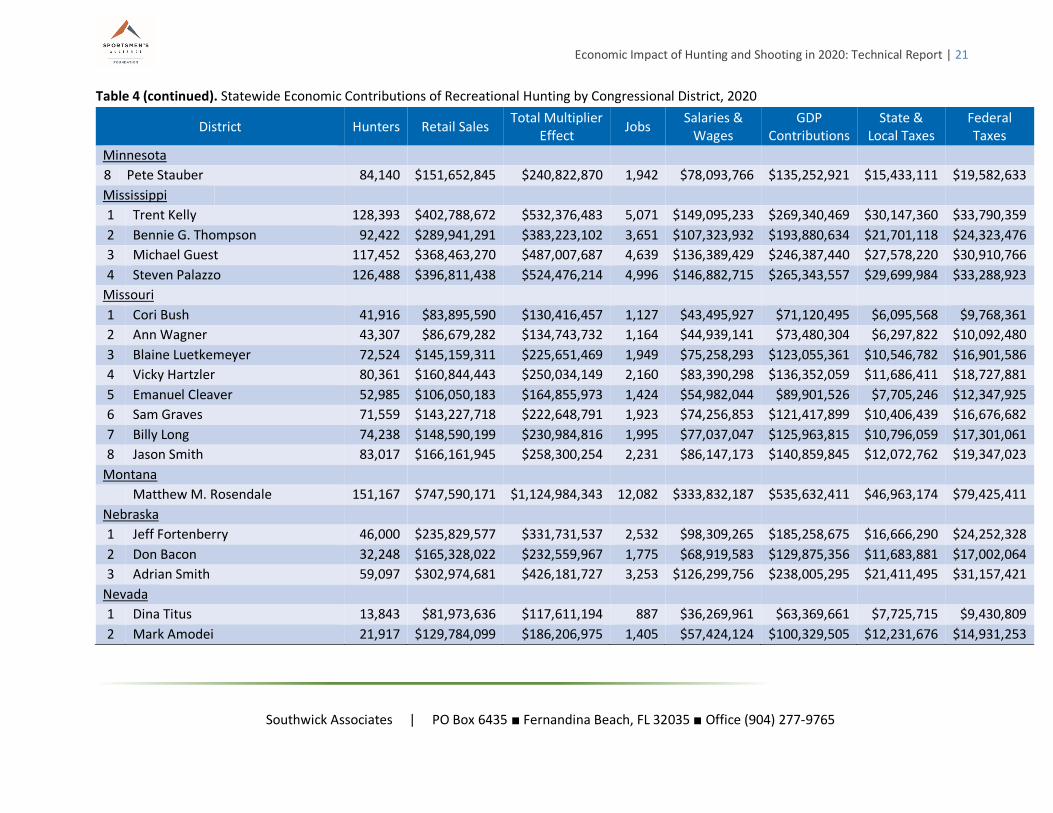
Table 4. Statewide Economic Contributions of Recreational Hunting by Congressional District, 2020
District Hunters Retail Sales Total Multiplier
Effect Jobs
Salaries & Wages
GDP Contributions
State & Local Taxes
Federal Taxes
Alabama
1 Jerry L Carl 73,610 $191,616,391 $254,758,852 2,587 $74,675,454 $125,364,032 $12,344,894 $17,236,410
2 Barry Moore 71,636 $186,475,653 $247,924,110 2,518 $72,672,040 $122,000,731 $12,013,701 $16,773,987
3 Mike Rogers 79,579 $207,153,255 $275,415,507 2,797 $80,730,376 $135,528,945 $13,345,857 $18,633,993
4 Robert B. Aderholt 87,798 $228,548,342 $303,860,817 3,086 $89,068,326 $149,526,570 $14,724,236 $20,558,538
5 Mo Brooks 74,177 $193,092,042 $256,720,767 2,607 $75,250,535 $126,329,469 $12,439,962 $17,369,149
6 Gary J. Palmer 63,070 $164,178,164 $218,279,033 2,217 $63,982,412 $107,412,714 $10,577,185 $14,768,268
7 Terri A. Sewell 57,886 $150,682,801 $200,336,606 2,034 $58,723,090 $98,583,443 $9,707,745 $13,554,323
Alaska
Don Young 124,455 $511,613,566 $599,603,550 5,083 $201,199,903 $326,302,292 $32,318,097 $54,802,289
Arizona
1 Tom O'Halleran 45,568 $67,724,048 $102,602,719 776 $33,328,035 $51,958,721 $5,913,144 $7,495,845
2 Ann Kirkpatrick 34,159 $50,767,920 $76,913,988 582 $24,983,666 $38,949,771 $4,432,665 $5,619,104
3 Raúl M. Grijalva 28,466 $42,306,380 $64,094,656 485 $20,819,613 $32,457,973 $3,693,868 $4,682,562
4 Paul A. Gosar 45,333 $67,375,064 $102,074,004 772 $33,156,295 $51,690,976 $5,882,674 $7,457,219
5 Andy Biggs 31,408 $46,679,255 $70,719,613 535 $22,971,572 $35,812,897 $4,075,674 $5,166,562
6 David Schweikert 30,154 $44,815,363 $67,895,795 514 $22,054,322 $34,382,896 $3,912,934 $4,960,262
7 Ruben Gallego 19,106 $28,395,930 $43,020,163 325 $13,974,069 $21,785,706 $2,479,315 $3,142,924
8 Debbie Lesko 29,711 $44,157,052 $66,898,447 506 $21,730,358 $33,877,832 $3,855,455 $4,887,399
9 Greg Stanton 32,803 $48,752,009 $73,859,858 559 $23,991,605 $37,403,139 $4,256,651 $5,395,979
Arkansas
1 Eric A. “Rick” Crawford
87,946 $293,311,742 $430,738,764 3,869 $127,419,797 $233,939,293 $24,198,822 $31,018,619
2 J. French Hill 75,235 $250,918,225 $368,482,372 3,310 $109,003,306 $200,127,114 $20,701,269 $26,535,374
3 Steve Womack 83,235 $277,597,985 $407,662,552 3,662 $120,593,464 $221,406,331 $22,902,404 $29,356,841
4 Bruce Westerman 96,635 $322,290,096 $473,294,513 4,252 $140,008,506 $257,051,822 $26,589,596 $34,083,169
Economic Impact of Hunting and Shooting in 2020: Technical Report | 12
Southwick Associates | PO Box 6435 ■ Fernandina Beach, FL 32035 ■ Office (904) 277-9765
Table 4 (continued). Statewide Economic Contributions of Recreational Hunting by Congressional District, 2020
District Hunters Retail Sales Total Multiplier
Effect Jobs
Salaries & Wages
GDP Contributions
State & Local Taxes
Federal Taxes
California
1 Doug LaMalfa 13,972 $47,369,944 $76,033,469 561 $26,479,968 $42,004,518 $4,865,694 $6,473,047
2 Jared Huffman 10,565 $35,820,457 $57,495,393 424 $20,023,763 $31,763,200 $3,679,366 $4,894,823
3 John Garamendi 10,648 $36,102,865 $57,948,686 428 $20,181,630 $32,013,621 $3,708,375 $4,933,414
4 Tom McClintock 12,621 $42,791,905 $68,685,261 507 $23,920,827 $37,945,017 $4,395,452 $5,847,463
5 Mike Thompson 8,510 $28,853,042 $46,312,001 342 $16,128,954 $25,584,960 $2,963,695 $3,942,734
6 Doris O. Matsui 8,552 $28,996,264 $46,541,885 343 $16,209,015 $25,711,959 $2,978,406 $3,962,305
7 Ami Bera 8,921 $30,246,929 $48,549,327 358 $16,908,141 $26,820,966 $3,106,871 $4,133,207
8 Jay Obernolte 10,410 $35,294,976 $56,651,944 418 $19,730,017 $31,297,238 $3,625,391 $4,823,016
9 Jerry McNerney 8,584 $29,104,184 $46,715,108 345 $16,269,343 $25,807,656 $2,989,492 $3,977,052
10 Josh Harder 9,301 $31,534,912 $50,616,668 374 $17,628,128 $27,963,064 $3,239,169 $4,309,208
11 Mark DeSaulnier 6,949 $23,559,906 $37,815,990 279 $13,170,071 $20,891,358 $2,420,001 $3,219,433
12 Nancy Pelosi 7,655 $25,955,332 $41,660,888 307 $14,509,123 $23,015,464 $2,666,051 $3,546,765
13 Barbara Lee 8,115 $27,512,612 $44,160,477 326 $15,379,648 $24,396,356 $2,826,010 $3,759,566
14 Jackie Speier 6,004 $20,357,598 $32,675,968 241 $11,379,970 $18,051,765 $2,091,069 $2,781,842
15 Eric Swalwell 6,493 $22,015,738 $35,337,447 261 $12,306,876 $19,522,093 $2,261,388 $3,008,424
16 Jim Costa 7,119 $24,137,834 $38,743,622 286 $13,493,135 $21,403,827 $2,479,364 $3,298,406
17 Ro Khanna 5,821 $19,735,291 $31,677,104 234 $11,032,098 $17,499,945 $2,027,148 $2,696,804
18 Anna G. Eshoo 6,599 $22,373,791 $35,912,158 265 $12,507,029 $19,839,591 $2,298,167 $3,057,352
19 Zoe Lofgren 6,156 $20,871,985 $33,501,610 247 $11,667,514 $18,507,888 $2,143,906 $2,852,132
20 Jimmy Panetta 7,418 $25,150,469 $40,369,002 298 $14,059,202 $22,301,764 $2,583,378 $3,436,782
21 David G Valadao 5,943 $20,150,835 $32,344,093 239 $11,264,389 $17,868,421 $2,069,831 $2,753,588
22 Devin Nunes 8,824 $29,919,133 $48,023,183 354 $16,724,902 $26,530,299 $3,073,201 $4,088,414
23 Kevin McCarthy 9,457 $32,064,427 $51,466,593 380 $17,924,129 $28,432,603 $3,293,559 $4,381,566
24 Salud O. Carbajal 10,257 $34,776,555 $55,819,827 412 $19,440,218 $30,837,537 $3,572,140 $4,752,175

Economic Impact of Hunting and Shooting in 2020: Technical Report | 13
Southwick Associates | PO Box 6435 ■ Fernandina Beach, FL 32035 ■ Office (904) 277-9765
Table 4 (continued). Statewide Economic Contributions of Recreational Hunting by Congressional District, 2020
District Hunters Retail Sales Total Multiplier
Effect Jobs
Salaries & Wages
GDP Contributions
State & Local Taxes
Federal Taxes
California
25 Mike Garcia 6,689 $22,677,380 $36,399,449 269 $12,676,736 $20,108,793 $2,329,350 $3,098,837
26 Julia Brownley 6,651 $22,551,305 $36,197,086 267 $12,606,260 $19,996,998 $2,316,400 $3,081,609
27 Judy Chu 6,624 $22,458,514 $36,048,146 266 $12,554,389 $19,914,717 $2,306,869 $3,068,929
28 Adam B. Schiff 8,049 $27,288,703 $43,801,080 323 $15,254,482 $24,197,808 $2,803,011 $3,728,969
29 Tony Cárdenas 5,527 $18,739,802 $30,079,246 222 $10,475,616 $16,617,211 $1,924,894 $2,560,772
30 Brad Sherman 6,877 $23,314,816 $37,422,596 276 $13,033,065 $20,674,029 $2,394,826 $3,185,942
31 Pete Aguilar 6,814 $23,103,009 $37,082,626 274 $12,914,665 $20,486,213 $2,373,070 $3,156,999
32 Grace F. Napolitano 5,383 $18,250,631 $29,294,077 216 $10,202,168 $16,183,447 $1,874,648 $2,493,927
33 Ted Lieu 6,964 $23,612,353 $37,900,173 280 $13,199,389 $20,937,865 $2,425,388 $3,226,600
34 Jimmy Gomez 6,476 $21,955,222 $35,240,313 260 $12,273,047 $19,468,431 $2,255,172 $3,000,155
35 Norma J. Torres 5,804 $19,679,818 $31,588,065 233 $11,001,089 $17,450,755 $2,021,450 $2,689,224
36 Raul Ruiz 9,298 $31,525,835 $50,602,098 373 $17,623,054 $27,955,015 $3,238,236 $4,307,968
37 Karen Bass 7,124 $24,152,963 $38,767,906 286 $13,501,592 $21,417,242 $2,480,918 $3,300,474
38 Linda T. Sánchez 5,272 $17,874,423 $28,690,225 212 $9,991,866 $15,849,850 $1,836,005 $2,442,519
39 Young Kim 6,329 $21,457,982 $34,442,193 254 $11,995,088 $19,027,512 $2,204,097 $2,932,208
40 Lucille Roybal-Allard 4,099 $13,896,502 $22,305,266 165 $7,768,194 $12,322,494 $1,427,406 $1,898,940
41 Mark Takano 6,734 $22,830,687 $36,645,522 270 $12,762,436 $20,244,736 $2,345,098 $3,119,786
42 Ken Calvert 8,724 $29,578,226 $47,475,993 350 $16,534,334 $26,228,005 $3,038,184 $4,041,829
43 Maxine Waters 5,734 $19,439,771 $31,202,765 230 $10,866,901 $17,237,897 $1,996,793 $2,656,422
44 Nanette Diaz Barragan
4,700 $15,933,875 $25,575,453 189 $8,907,093 $14,129,101 $1,636,678 $2,177,345
45 Katie Porter 7,725 $26,190,336 $42,038,093 310 $14,640,491 $23,223,849 $2,690,190 $3,578,878
46 J. Luis Correa 5,516 $18,700,467 $30,016,108 222 $10,453,628 $16,582,331 $1,920,854 $2,555,397
47 Alan S. Lowenthal 6,161 $20,887,114 $33,525,893 247 $11,675,971 $18,521,304 $2,145,460 $2,854,199
48 Michelle Steel 6,644 $22,527,098 $36,158,232 267 $12,592,728 $19,975,533 $2,313,914 $3,078,301
Economic Impact of Hunting and Shooting in 2020: Technical Report | 14
Southwick Associates | PO Box 6435 ■ Fernandina Beach, FL 32035 ■ Office (904) 277-9765
Table 4 (continued). Statewide Economic Contributions of Recreational Hunting by Congressional District, 2020
District Hunters Retail Sales Total
Multiplier Effect
Jobs Salaries &
Wages GDP
Contributions State & Local
Taxes Federal Taxes
California
49 Mike Levin 8,163 $27,678,023 $44,425,977 328 $15,472,113 $24,543,031 $2,843,001 $3,782,169
50 Darrell Issa 8,174 $27,714,332 $44,484,258 328 $15,492,410 $24,575,228 $2,846,730 $3,787,131
51 Juan Vargas 6,311 $21,396,457 $34,343,440 253 $11,960,696 $18,972,956 $2,197,778 $2,923,800
52 Scott H. Peters 9,148 $31,016,491 $49,784,551 367 $17,338,329 $27,503,363 $3,185,918 $4,238,367
53 Sara Jacobs 8,588 $29,118,304 $46,737,773 345 $16,277,236 $25,820,177 $2,990,942 $3,978,982
Colorado
1 Diana DeGette 36,877 $77,514,849 $138,768,818 1,306 $46,091,660 $75,228,173 $7,242,975 $10,864,463
2 Joe Neguse 44,864 $94,304,220 $168,825,525 1,589 $56,074,908 $91,522,260 $8,811,771 $13,217,657
3 Lauren Boebert 55,644 $116,963,875 $209,391,348 1,971 $69,548,728 $113,513,459 $10,929,086 $16,393,629
4 Ken Buck 50,070 $105,247,728 $188,416,838 1,774 $62,582,105 $102,142,936 $9,834,331 $14,751,496
5 Doug Lamborn 44,177 $92,861,071 $166,241,968 1,565 $55,216,787 $90,121,684 $8,676,924 $13,015,385
6 Jason A. Crow 31,368 $65,936,356 $118,040,740 1,111 $39,206,889 $63,991,244 $6,161,083 $9,241,624
7 Ed Perlmutter 34,836 $73,225,367 $131,089,692 1,234 $43,541,060 $71,065,230 $6,842,167 $10,263,250
Connecticut
1 John B. Larson 6,887 $49,326,807 $71,378,614 501 $23,553,391 $46,060,755 $5,119,446 $6,778,794
2 Joe Courtney 9,345 $66,927,116 $96,847,231 680 $31,957,482 $62,495,702 $6,946,117 $9,197,537
3 Rosa L. DeLauro 7,349 $52,633,050 $76,162,929 534 $25,132,111 $49,148,083 $5,462,589 $7,233,159
4 James A. Himes 5,773 $41,343,053 $59,825,681 420 $19,741,174 $38,605,625 $4,290,842 $5,681,618
5 Jahana Hayes 6,780 $48,558,119 $70,266,280 493 $23,186,345 $45,342,964 $5,039,667 $6,673,156
Delaware
Lisa Blunt Rochester 19,474 $41,431,342 $58,412,238 474 $21,046,567 $36,824,019 $1,999,779 $4,680,478
Florida
1 Matt Gaetz 13,717 $64,134,525 $98,264,238 717 $26,758,564 $48,528,895 $4,696,761 $7,179,371
2 Neil P. Dunn 13,910 $65,037,429 $99,647,631 727 $27,135,279 $49,212,099 $4,762,883 $7,280,445

Economic Impact of Hunting and Shooting in 2020: Technical Report | 15
Southwick Associates | PO Box 6435 ■ Fernandina Beach, FL 32035 ■ Office (904) 277-9765
Table 4 (continued). Statewide Economic Contributions of Recreational Hunting by Congressional District, 2020
District Hunters Retail Sales Total Multiplier
Effect Jobs
Salaries & Wages
GDP Contributions
State & Local Taxes
Federal Taxes
Florida
3 Kat Cammack 13,176 $61,604,977 $94,388,571 689 $25,703,172 $46,614,853 $4,511,514 $6,896,208
4 John H. Rutherford 11,638 $54,413,565 $83,370,190 608 $22,702,731 $41,173,302 $3,984,866 $6,091,184
5 Al Lawson 10,902 $50,974,040 $78,100,294 570 $21,267,673 $38,570,705 $3,732,979 $5,706,155
6 Mike Waltz 12,884 $60,242,369 $92,300,840 674 $25,134,657 $45,583,804 $4,411,726 $6,743,674
7 Stephanie N. Murphy 9,040 $42,266,785 $64,759,402 473 $17,634,784 $31,982,156 $3,095,321 $4,731,444
8 Bill Posey 12,054 $56,360,822 $86,353,695 630 $23,515,176 $42,646,740 $4,127,469 $6,309,164
9 Darren Soto 11,407 $53,333,851 $81,715,898 596 $22,252,247 $40,356,312 $3,905,795 $5,970,318
10 Val Butler Demings 8,934 $41,771,720 $64,000,884 467 $17,428,230 $31,607,553 $3,059,066 $4,676,026
11 Daniel Webster 12,782 $59,761,448 $91,563,994 668 $24,934,004 $45,219,904 $4,376,507 $6,689,839
12 Gus M. Bilirakis 10,883 $50,885,636 $77,964,844 569 $21,230,788 $38,503,812 $3,726,505 $5,696,259
13 Charlie Crist 9,766 $45,660,340 $69,958,864 510 $19,050,661 $34,549,969 $3,343,841 $5,111,327
14 Kathy Castor 8,784 $41,071,556 $62,928,122 459 $17,136,104 $31,077,758 $3,007,791 $4,597,648
15 Scott Franklin 11,360 $53,113,429 $81,378,176 594 $22,160,281 $40,189,524 $3,889,653 $5,945,644
16 Vern Buchanan 11,190 $52,320,146 $80,162,741 585 $21,829,303 $39,589,268 $3,831,559 $5,856,842
17 W. Gregory Steube 12,417 $58,055,831 $88,950,717 649 $24,222,377 $43,929,308 $4,251,600 $6,498,908
18 Brian J. Mast 9,873 $46,161,299 $70,726,413 516 $19,259,674 $34,929,031 $3,380,528 $5,167,406
19 Byron Donals 11,478 $53,668,610 $82,228,801 600 $22,391,916 $40,609,614 $3,930,311 $6,007,792
20 VACANT 6,545 $30,600,926 $46,885,460 342 $12,767,489 $23,154,910 $2,240,996 $3,425,540
21 Lois Frankel 7,956 $37,199,439 $56,995,425 416 $15,520,557 $28,147,829 $2,724,225 $4,164,194
22 Theodore E. Deutch 7,807 $36,501,633 $55,926,276 408 $15,229,414 $27,619,818 $2,673,122 $4,086,080
23 Debbie Wasserman Schultz
7,445 $34,807,802 $53,331,060 389 $14,522,705 $26,338,141 $2,549,078 $3,896,468
24 Frederica S. Wilson 6,617 $30,939,221 $47,403,781 346 $12,908,634 $23,410,888 $2,265,770 $3,463,410
25 Mario Diaz-Balart 6,999 $32,726,171 $50,141,671 366 $13,654,195 $24,763,026 $2,396,634 $3,663,445
26 Carlos A. Gimenez 6,833 $31,947,032 $48,947,908 357 $13,329,119 $24,173,473 $2,339,575 $3,576,227

Economic Impact of Hunting and Shooting in 2020: Technical Report | 16
Southwick Associates | PO Box 6435 ■ Fernandina Beach, FL 32035 ■ Office (904) 277-9765
Table 4 (continued). Statewide Economic Contributions of Recreational Hunting by Congressional District, 2020
District Hunters Retail Sales Total Multiplier
Effect Jobs
Salaries & Wages
GDP Contributions
State & Local Taxes
Federal Taxes
Florida
27 Maria Elvira Salazar 6,541 $30,584,424 $46,860,176 342 $12,760,604 $23,142,423 $2,239,788 $3,423,693
Georgia
1 Buddy Carter 43,962 $128,488,099 $204,628,641 1,979 $67,783,375 $114,151,736 $10,324,607 $16,058,449
2 Sanford D. Bishop Jr. 39,900 $116,615,121 $185,719,874 1,797 $61,519,833 $103,603,513 $9,370,558 $14,574,564
3 A. Drew Ferguson IV 48,539 $141,864,475 $225,931,700 2,186 $74,840,028 $126,035,611 $11,399,460 $17,730,229
4 Henry C. “Hank” Johnson Jr.
28,921 $84,528,891 $134,619,721 1,302 $44,592,873 $75,097,380 $6,792,283 $10,564,425
5 Nikema Williams 34,053 $99,527,062 $158,505,633 1,533 $52,505,098 $88,422,095 $7,997,455 $12,438,897
6 Lucy McBath 25,388 $74,200,611 $118,171,023 1,143 $39,144,231 $65,921,502 $5,962,359 $9,273,596
7 Carolyn Bourdeaux 28,559 $83,468,803 $132,931,438 1,286 $44,033,628 $74,155,574 $6,707,100 $10,431,935
8 Austin Scott 46,762 $136,671,423 $217,661,307 2,106 $72,100,454 $121,421,986 $10,982,174 $17,081,201
9 Andrew S. Clyde 60,729 $177,494,425 $282,675,541 2,734 $93,636,463 $157,690,065 $14,262,489 $22,183,262
10 Jody B. Hice 53,064 $155,092,163 $246,997,961 2,389 $81,818,241 $137,787,388 $12,462,365 $19,383,426
11 Barry Loudermilk 37,247 $108,861,338 $173,371,292 1,677 $57,429,357 $96,714,877 $8,747,507 $13,605,496
12 Rick W. Allen 47,530 $138,915,505 $221,235,204 2,140 $73,284,310 $123,415,679 $11,162,496 $17,361,667
13 David Scott 33,988 $99,337,073 $158,203,058 1,530 $52,404,869 $88,253,304 $7,982,188 $12,415,152
14 Marjorie Taylor Greene 48,963 $143,103,538 $227,905,017 2,205 $75,493,690 $127,136,423 $11,499,024 $17,885,088
Hawaii
1 Ed Case 11,272 $30,904,480 $45,352,745 353 $13,265,270 $22,020,619 $3,206,805 $3,111,756
2 Kaiali'i Kahele 14,716 $40,346,044 $59,208,368 461 $17,317,915 $28,748,092 $4,186,509 $4,062,421
Idaho
1 Russ Fulcher 154,697 $346,743,081 $510,880,754 4,832 $147,563,989 $230,413,278 $26,029,300 $33,204,086
2 Michael K. Simpson 142,266 $318,880,642 $469,829,081 4,444 $135,706,528 $211,898,487 $23,937,724 $30,535,982
Illinois
1 Bobby L. Rush 21,514 $65,216,201 $93,275,706 659 $26,000,362 $56,330,816 $5,994,953 $7,552,775

Economic Impact of Hunting and Shooting in 2020: Technical Report | 17
Southwick Associates | PO Box 6435 ■ Fernandina Beach, FL 32035 ■ Office (904) 277-9765
Table 4 (continued). Statewide Economic Contributions of Recreational Hunting by Congressional District, 2020
District Hunters Retail Sales Total
Multiplier Effect
Jobs Salaries &
Wages GDP
Contributions State & Local
Taxes Federal Taxes
Illinois
2 Robin L. Kelly 23,822 $72,213,301 $103,283,333 730 $28,789,963 $62,374,596 $6,638,156 $8,363,118
3 Marie Newman 19,558 $59,288,296 $84,797,297 599 $23,637,028 $51,210,558 $5,450,034 $6,866,256
4 Jesús "Chuy" Garcia 13,303 $40,326,848 $57,677,619 407 $16,077,488 $34,832,515 $3,707,017 $4,670,306
5 Mike Quigley 20,786 $63,008,536 $90,118,184 637 $25,120,211 $54,423,934 $5,792,015 $7,297,102
6 Sean Casten 19,748 $59,863,305 $85,619,706 605 $23,866,272 $51,707,225 $5,502,892 $6,932,849
7 Danny K. Davis 22,100 $66,992,033 $95,815,595 677 $26,708,350 $57,864,700 $6,158,195 $7,758,436
8 Raja Krishnamoorthi 16,193 $49,088,233 $70,208,622 496 $19,570,472 $42,400,204 $4,512,401 $5,684,974
9 Janice D. Schakowsky 20,353 $61,696,868 $88,242,167 623 $24,597,276 $53,290,975 $5,671,441 $7,145,196
10 Bradley Scott Schneider 18,463 $55,967,560 $80,047,803 566 $22,313,119 $48,342,256 $5,144,778 $6,481,678
11 Bill Foster 18,425 $55,852,096 $79,882,661 564 $22,267,086 $48,242,524 $5,134,164 $6,468,306
12 Mike Bost 36,443 $110,471,040 $158,001,601 1,116 $44,042,539 $95,419,907 $10,154,972 $12,793,798
13 Rodney Davis 38,256 $115,967,112 $165,862,377 1,172 $46,233,710 $100,167,166 $10,660,194 $13,430,306
14 Lauren Underwood 26,008 $78,840,917 $112,762,504 797 $31,432,257 $68,099,232 $7,247,395 $9,130,672
15 Mary E. Miller 44,558 $135,071,734 $193,186,832 1,365 $53,850,331 $116,668,878 $12,416,373 $15,642,837
16 Adam Kinzinger 39,291 $119,105,415 $170,350,947 1,204 $47,484,887 $102,877,891 $10,948,680 $13,793,757
17 Cheri Bustos 35,865 $108,720,611 $155,498,043 1,099 $43,344,678 $93,907,965 $9,994,065 $12,591,079
18 Darin LaHood 38,138 $115,609,174 $165,350,436 1,168 $46,091,007 $99,857,996 $10,627,291 $13,388,852
Indiana
1 Frank J. Mrvan 38,753 $26,643,237 $37,995,940 325 $11,617,077 $21,120,723 $1,977,992 $2,774,811
2 Jackie Walorski 44,929 $30,888,928 $44,050,722 377 $13,468,297 $24,486,382 $2,293,191 $3,216,986
3 Jim Banks 47,284 $32,508,127 $46,359,863 397 $14,174,306 $25,769,960 $2,413,400 $3,385,621
4 James R. Baird 50,693 $34,851,611 $49,701,908 425 $15,196,120 $27,627,695 $2,587,380 $3,629,687
5 Victoria Spartz 35,160 $24,172,664 $34,472,654 295 $10,539,849 $19,162,242 $1,794,576 $2,517,508
6 Greg Pence 51,203 $35,202,281 $50,201,998 430 $15,349,021 $27,905,679 $2,613,414 $3,666,209

Economic Impact of Hunting and Shooting in 2020: Technical Report | 18
Southwick Associates | PO Box 6435 ■ Fernandina Beach, FL 32035 ■ Office (904) 277-9765
Table 4 (continued). Statewide Economic Contributions of Recreational Hunting by Congressional District, 2020
District Hunters Retail Sales Total
Multiplier Effect
Jobs Salaries &
Wages GDP
Contributions State & Local
Taxes Federal Taxes
Indiana
7 André Carson 31,635 $21,749,161 $31,016,494 266 $9,483,145 $17,241,074 $1,614,656 $2,265,108
8 Larry Bucshon 50,703 $34,858,672 $49,711,977 426 $15,199,199 $27,633,292 $2,587,905 $3,630,423
9 Trey Hollingsworth 51,674 $35,525,885 $50,663,491 434 $15,490,120 $28,162,208 $2,637,439 $3,699,911
Iowa
1 Ashley Hinson 65,909 $136,935,228 $191,328,397 1,678 $59,159,504 $93,675,169 $10,484,463 $12,784,411
2 Mariannette Miller-Meeks 64,509 $134,027,191 $187,265,235 1,643 $57,903,158 $91,685,828 $10,261,808 $12,512,914
3 Cindy Axne 54,606 $113,452,539 $158,517,956 1,390 $49,014,385 $77,611,042 $8,686,508 $10,592,044
4 Randy Feenstra 73,270 $152,229,436 $212,697,743 1,866 $65,766,991 $104,137,689 $11,655,465 $14,212,294
Kansas
1 Tracey Mann 97,350 $163,330,353 $231,806,876 1,934 $70,303,547 $126,039,237 $12,641,699 $17,357,071
2 Jake LaTurner 91,736 $153,911,781 $218,439,552 1,822 $66,249,439 $118,771,087 $11,912,705 $16,356,162
3 Sharice Davids 58,489 $98,130,562 $139,271,964 1,162 $42,239,097 $75,725,675 $7,595,263 $10,428,307
4 Ron Estes 77,351 $129,777,762 $184,187,304 1,537 $55,861,246 $100,147,277 $10,044,743 $13,791,446
Kentucky
1 James Comer 64,737 $226,990,149 $307,187,131 3,202 $89,904,280 $161,454,782 $14,302,129 $21,465,925
2 Brett Guthrie 62,275 $218,356,816 $295,503,590 3,080 $86,484,864 $155,314,018 $13,758,162 $20,649,491
3 John A. Yarmuth 37,089 $130,045,154 $175,990,887 1,835 $51,507,151 $92,499,221 $8,193,847 $12,298,064
4 Thomas Massie 48,457 $169,906,604 $229,935,628 2,397 $67,295,127 $120,852,089 $10,705,426 $16,067,668
5 Harold Rogers 84,467 $296,169,960 $400,808,585 4,178 $117,304,416 $210,661,372 $18,660,990 $28,008,097
6 Andy Barr 49,005 $171,826,647 $232,534,033 2,424 $68,055,601 $122,217,787 $10,826,403 $16,249,242
Louisiana
1 Steve Scalise 51,660 $155,358,279 $214,198,151 1,572 $60,928,427 $114,688,644 $11,052,338 $14,913,058
2 Troy Carter 37,495 $112,760,041 $155,466,400 1,141 $44,222,245 $83,241,758 $8,021,858 $10,823,994
3 Clay Higgins 65,077 $195,705,563 $269,826,429 1,980 $76,751,829 $144,473,830 $13,922,683 $18,786,050

Economic Impact of Hunting and Shooting in 2020: Technical Report | 19
Southwick Associates | PO Box 6435 ■ Fernandina Beach, FL 32035 ■ Office (904) 277-9765
Table 4 (continued). Statewide Economic Contributions of Recreational Hunting by Congressional District, 2020
District Hunters Retail Sales Total
Multiplier Effect
Jobs Salaries &
Wages GDP
Contributions State & Local
Taxes Federal Taxes
Louisiana
4 Mike Johnson 60,116 $180,786,169 $249,256,514 1,829 $70,900,739 $133,460,030 $12,861,303 $17,353,917
5 Julia Letlow 61,416 $184,696,518 $254,647,856 1,869 $72,434,301 $136,346,729 $13,139,489 $17,729,277
6 Garret Graves 51,616 $155,224,799 $214,014,117 1,571 $60,876,079 $114,590,106 $11,042,842 $14,900,245
Maine
1 Chellie Pingree 70,098 $96,993,718 $141,594,498 1,225 $40,895,699 $73,462,990 $9,131,411 $9,889,380
2 Jared Golden 81,737 $113,097,933 $165,103,941 1,428 $47,685,759 $85,660,314 $10,647,532 $11,531,349
Maryland
1 Andy Harris 17,514 $61,730,065 $90,658,232 778 $29,455,903 $56,612,562 $5,406,386 $7,676,630
2 C. A. Dutch Ruppersberger 11,255 $39,670,323 $58,260,774 500 $18,929,596 $36,381,602 $3,474,370 $4,933,324
3 John P. Sarbanes 10,051 $35,427,595 $52,029,803 446 $16,905,082 $32,490,601 $3,102,787 $4,405,706
4 Anthony G. Brown 9,547 $33,651,190 $49,420,933 424 $16,057,430 $30,861,463 $2,947,208 $4,184,796
5 Steny H. Hoyer 11,213 $39,523,648 $58,045,363 498 $18,859,606 $36,247,086 $3,461,524 $4,915,083
6 David Trone 12,770 $45,009,044 $66,101,346 567 $21,477,088 $41,277,736 $3,941,941 $5,597,236
7 Kweisi Mfume 10,472 $36,909,291 $54,205,856 465 $17,612,106 $33,849,462 $3,232,556 $4,589,967
8 Jamie Raskin 10,258 $36,156,899 $53,100,876 456 $17,253,085 $33,159,445 $3,166,661 $4,496,401
Massachusetts
1 Richard E. Neal 7,666 $24,152,371 $35,264,605 257 $12,693,515 $18,833,632 $1,655,201 $3,065,303
2 James P. McGovern 7,211 $22,718,558 $33,171,111 241 $11,939,961 $17,715,568 $1,556,940 $2,883,331
3 Lori Trahan 5,578 $17,573,103 $25,658,290 187 $9,235,717 $13,703,224 $1,204,313 $2,230,294
4 Jake Auchincloss 5,573 $17,557,214 $25,635,090 187 $9,227,366 $13,690,834 $1,203,224 $2,228,278
5 Katherine Clark 5,401 $17,015,085 $24,843,534 181 $8,942,445 $13,268,091 $1,166,071 $2,159,473
6 Seth Moulton 5,200 $16,382,708 $23,920,207 174 $8,610,093 $12,774,973 $1,122,733 $2,079,215
7 Ayanna Pressley 7,005 $22,067,749 $32,220,873 234 $11,597,922 $17,208,077 $1,512,339 $2,800,733
8 Stephen F. Lynch 5,404 $17,025,254 $24,858,382 181 $8,947,789 $13,276,020 $1,166,768 $2,160,764

Economic Impact of Hunting and Shooting in 2020: Technical Report | 20
Southwick Associates | PO Box 6435 ■ Fernandina Beach, FL 32035 ■ Office (904) 277-9765
Table 4 (continued). Statewide Economic Contributions of Recreational Hunting by Congressional District, 2020
District Hunters Retail Sales Total Multiplier
Effect Jobs
Salaries & Wages
GDP Contributions
State & Local Taxes
Federal Taxes
Massachusetts
9 William Keating 7,883 $24,833,686 $36,259,385 264 $13,051,587 $19,364,910 $1,701,893 $3,151,773
Michigan
1 Jack Bergman 47,600 $248,977,999 $360,241,098 2,386 $105,278,218 $200,335,878 $22,995,730 $27,129,654
2 Bill Huizenga 37,676 $197,069,262 $285,135,424 1,888 $83,329,052 $158,568,403 $18,201,414 $21,473,468
3 Peter Meijer 33,939 $177,522,204 $256,853,192 1,701 $75,063,746 $142,840,198 $16,396,038 $19,343,541
4 John Moolenaar 44,319 $231,812,801 $335,405,130 2,221 $98,020,061 $186,524,196 $21,410,344 $25,259,265
5 Daniel Kildee 31,719 $165,911,087 $240,053,307 1,590 $70,154,084 $133,497,511 $15,323,629 $18,078,346
6 Fred Upton 39,610 $207,182,287 $299,767,750 1,985 $87,605,258 $166,705,675 $19,135,458 $22,575,424
7 Tim Walberg 39,554 $206,891,290 $299,346,713 1,982 $87,482,213 $166,471,529 $19,108,581 $22,543,716
8 Elissa Slotkin 32,499 $169,988,630 $245,953,019 1,629 $71,878,238 $136,778,436 $15,700,233 $18,522,652
9 Andy Levin 28,142 $147,197,500 $212,977,007 1,410 $62,241,204 $118,439,945 $13,595,233 $16,039,238
10 Lisa C. McClain 37,757 $197,489,590 $285,743,589 1,892 $83,506,785 $158,906,612 $18,240,236 $21,519,268
11 Haley Stevens 25,757 $134,724,171 $194,929,606 1,291 $56,966,964 $108,403,494 $12,443,191 $14,680,093
12 Debbie Dingell 29,502 $154,314,339 $223,274,214 1,479 $65,250,499 $124,166,387 $14,252,548 $16,814,717
13 Rashida Tlaib 22,380 $117,059,609 $169,371,118 1,122 $49,497,655 $94,190,007 $10,811,683 $12,755,291
14 Brenda Lawrence 20,170 $105,502,379 $152,649,203 1,011 $44,610,779 $84,890,681 $9,744,252 $11,495,968
Minnesota
1 Jim Hagedorn 72,194 $130,121,184 $206,630,855 1,666 $67,006,018 $116,049,720 $13,241,919 $16,802,292
2 Angie Craig 46,856 $84,451,931 $134,108,638 1,081 $43,488,596 $75,319,196 $8,594,339 $10,905,111
3 Dean Phillips 40,324 $72,679,544 $115,414,231 930 $37,426,395 $64,819,890 $7,396,310 $9,384,966
4 Betty McCollum 41,604 $74,986,596 $119,077,801 960 $38,614,414 $66,877,454 $7,631,089 $9,682,871
5 Ilhan Omar 45,007 $81,119,797 $128,817,250 1,039 $41,772,711 $72,347,403 $8,255,241 $10,474,839
6 Tom Emmer 56,147 $101,199,053 $160,702,863 1,296 $52,112,541 $90,255,264 $10,298,628 $13,067,634
7 Michelle Fischbach 88,375 $159,285,383 $252,943,247 2,039 $82,024,148 $142,060,067 $16,209,844 $20,568,207
Economic Impact of Hunting and Shooting in 2020: Technical Report | 21
Southwick Associates | PO Box 6435 ■ Fernandina Beach, FL 32035 ■ Office (904) 277-9765
Table 4 (continued). Statewide Economic Contributions of Recreational Hunting by Congressional District, 2020
District Hunters Retail Sales Total Multiplier
Effect Jobs
Salaries & Wages
GDP Contributions
State & Local Taxes
Federal Taxes
Minnesota
8 Pete Stauber 84,140 $151,652,845 $240,822,870 1,942 $78,093,766 $135,252,921 $15,433,111 $19,582,633
Mississippi
1 Trent Kelly 128,393 $402,788,672 $532,376,483 5,071 $149,095,233 $269,340,469 $30,147,360 $33,790,359
2 Bennie G. Thompson 92,422 $289,941,291 $383,223,102 3,651 $107,323,932 $193,880,634 $21,701,118 $24,323,476
3 Michael Guest 117,452 $368,463,270 $487,007,687 4,639 $136,389,429 $246,387,440 $27,578,220 $30,910,766
4 Steven Palazzo 126,488 $396,811,438 $524,476,214 4,996 $146,882,715 $265,343,557 $29,699,984 $33,288,923
Missouri
1 Cori Bush 41,916 $83,895,590 $130,416,457 1,127 $43,495,927 $71,120,495 $6,095,568 $9,768,361
2 Ann Wagner 43,307 $86,679,282 $134,743,732 1,164 $44,939,141 $73,480,304 $6,297,822 $10,092,480
3 Blaine Luetkemeyer 72,524 $145,159,311 $225,651,469 1,949 $75,258,293 $123,055,361 $10,546,782 $16,901,586
4 Vicky Hartzler 80,361 $160,844,443 $250,034,149 2,160 $83,390,298 $136,352,059 $11,686,411 $18,727,881
5 Emanuel Cleaver 52,985 $106,050,183 $164,855,973 1,424 $54,982,044 $89,901,526 $7,705,246 $12,347,925
6 Sam Graves 71,559 $143,227,718 $222,648,791 1,923 $74,256,853 $121,417,899 $10,406,439 $16,676,682
7 Billy Long 74,238 $148,590,199 $230,984,816 1,995 $77,037,047 $125,963,815 $10,796,059 $17,301,061
8 Jason Smith 83,017 $166,161,945 $258,300,254 2,231 $86,147,173 $140,859,845 $12,072,762 $19,347,023
Montana
Matthew M. Rosendale 151,167 $747,590,171 $1,124,984,343 12,082 $333,832,187 $535,632,411 $46,963,174 $79,425,411
Nebraska
1 Jeff Fortenberry 46,000 $235,829,577 $331,731,537 2,532 $98,309,265 $185,258,675 $16,666,290 $24,252,328
2 Don Bacon 32,248 $165,328,022 $232,559,967 1,775 $68,919,583 $129,875,356 $11,683,881 $17,002,064
3 Adrian Smith 59,097 $302,974,681 $426,181,727 3,253 $126,299,756 $238,005,295 $21,411,495 $31,157,421
Nevada
1 Dina Titus 13,843 $81,973,636 $117,611,194 887 $36,269,961 $63,369,661 $7,725,715 $9,430,809
2 Mark Amodei 21,917 $129,784,099 $186,206,975 1,405 $57,424,124 $100,329,505 $12,231,676 $14,931,253

Economic Impact of Hunting and Shooting in 2020: Technical Report | 22
Southwick Associates | PO Box 6435 ■ Fernandina Beach, FL 32035 ■ Office (904) 277-9765
Table 4 (continued). Statewide Economic Contributions of Recreational Hunting by Congressional District, 2020
District Hunters Retail Sales Total
Multiplier Effect
Jobs Salaries &
Wages GDP
Contributions State & Local
Taxes Federal Taxes
Nevada
3 Susie Lee 18,428 $109,127,366 $156,569,848 1,181 $48,284,369 $84,360,832 $10,284,855 $12,554,761
4 Steven Horsford 15,803 $93,580,125 $134,263,536 1,013 $41,405,355 $72,342,049 $8,819,584 $10,766,099
New Hampshire
1 Chris Pappas 27,218 $34,294,806 $51,883,346 445 $17,454,083 $25,794,847 $2,324,374 $3,966,491
2 Ann Kuster 28,185 $35,513,529 $53,727,107 461 $18,074,342 $26,711,509 $2,406,975 $4,107,446
New Jersey
1 Donald Norcross 7,932 $11,497,396 $16,953,228 117 $5,920,623 $9,336,469 $1,024,598 $1,509,227
2 Jeff Van Drew 10,562 $15,308,979 $22,573,513 156 $7,883,410 $12,431,667 $1,364,270 $2,009,561
3 Andy Kim 8,576 $12,431,066 $18,329,950 127 $6,401,419 $10,094,655 $1,107,803 $1,631,787
4 Chris Smith 7,750 $11,232,547 $16,562,701 114 $5,784,238 $9,121,398 $1,000,996 $1,474,461
5 Josh Gottheimer 7,792 $11,294,331 $16,653,803 115 $5,816,053 $9,171,569 $1,006,502 $1,482,571
6 Frank Pallone Jr. 6,801 $9,857,750 $14,535,525 100 $5,076,281 $8,004,993 $878,480 $1,293,996
7 Tom Malinowski 7,132 $10,336,899 $15,242,042 105 $5,323,020 $8,394,086 $921,180 $1,356,892
8 Albio Sires 7,472 $10,830,737 $15,970,220 110 $5,577,324 $8,795,107 $965,188 $1,421,716
9 Bill Pascrell Jr. 6,568 $9,519,884 $14,037,332 97 $4,902,296 $7,730,628 $848,371 $1,249,645
10 Donald Payne Jr. 7,194 $10,427,630 $15,375,828 106 $5,369,743 $8,467,764 $929,265 $1,368,802
11 Mikie Sherrill 6,871 $9,959,715 $14,685,875 101 $5,128,788 $8,087,794 $887,567 $1,307,380
12 Bonnie Watson Coleman 6,579 $9,536,302 $14,061,541 97 $4,910,750 $7,743,961 $849,834 $1,251,800
New Mexico
1 Melanie Ann Stansbury 21,894 $54,306,021 $77,392,342 651 $22,496,532 $37,748,791 $5,249,749 $5,251,528
2 Yvette Herrell 32,704 $81,120,988 $115,606,762 972 $33,604,762 $56,388,208 $7,841,944 $7,844,602
3 Teresa Leger Fernandez 28,363 $70,352,785 $100,260,831 843 $29,143,982 $48,903,096 $6,800,985 $6,803,290
New York
1 Lee Zeldin 23,463 $75,186,960 $104,175,744 617 $35,838,784 $54,288,815 $7,177,238 $8,401,497

Economic Impact of Hunting and Shooting in 2020: Technical Report | 23
Southwick Associates | PO Box 6435 ■ Fernandina Beach, FL 32035 ■ Office (904) 277-9765
Table 4 (continued). Statewide Economic Contributions of Recreational Hunting by Congressional District, 2020
District Hunters Retail Sales Total Multiplier
Effect Jobs
Salaries & Wages
GDP Contributions
State & Local Taxes
Federal Taxes
New York
2 Andrew R. Garbarino 19,515 $62,536,124 $86,647,303 513 $29,808,608 $45,154,267 $5,969,608 $6,987,875
3 Thomas Suozzi 22,549 $72,255,987 $100,114,717 592 $34,441,700 $52,172,504 $6,897,452 $8,073,986
4 Kathleen Rice 21,141 $67,745,292 $93,864,896 556 $32,291,621 $48,915,552 $6,466,867 $7,569,955
5 Gregory W. Meeks 23,999 $76,903,766 $106,554,475 631 $36,657,120 $55,528,437 $7,341,122 $8,593,336
6 Grace Meng 28,157 $90,226,963 $125,014,511 740 $43,007,785 $65,148,464 $8,612,935 $10,082,089
7 Nydia M. Velázquez 24,285 $77,820,919 $107,825,242 638 $37,094,292 $56,190,668 $7,428,672 $8,695,820
8 Hakeem Jeffries 23,763 $76,146,544 $105,505,301 624 $36,296,181 $54,981,683 $7,268,838 $8,508,723
9 Yvette D. Clarke 23,832 $76,368,488 $105,812,818 626 $36,401,973 $55,141,939 $7,290,025 $8,533,523
10 Jerrold Nadler 26,661 $85,435,573 $118,375,772 701 $40,723,910 $61,688,836 $8,155,556 $9,546,692
11 Nicole Malliotakis 24,171 $77,455,363 $107,318,744 635 $36,920,046 $55,926,718 $7,393,776 $8,654,972
12 Carolyn Maloney 27,222 $87,230,712 $120,863,038 715 $41,579,585 $62,985,018 $8,326,917 $9,747,283
13 Adriano Espaillat 19,506 $62,506,749 $86,606,602 513 $29,794,606 $45,133,057 $5,966,803 $6,984,593
14 Alexandria Ocasio-Cortez
25,958 $83,180,226 $115,250,861 682 $39,648,871 $60,060,360 $7,940,263 $9,294,676
15 Ritchie Torres 15,168 $48,605,843 $67,346,118 399 $23,168,569 $35,095,895 $4,639,843 $5,431,286
16 Jamaal Bowman 23,506 $75,324,043 $104,365,681 618 $35,904,126 $54,387,796 $7,190,324 $8,416,815
17 Mondaire Jones 23,184 $74,292,654 $102,936,634 609 $35,412,502 $53,643,081 $7,091,869 $8,301,566
18 Sean Patrick Maloney 25,825 $82,755,920 $114,662,962 679 $39,446,621 $59,753,990 $7,899,760 $9,247,264
19 Antonio Delgado 53,175 $170,397,882 $236,095,810 1,397 $81,222,234 $123,035,951 $16,265,934 $19,040,501
20 Paul D. Tonko 39,369 $126,155,859 $174,796,009 1,034 $60,133,733 $91,090,957 $12,042,655 $14,096,834
21 Elise Stefanik 60,860 $195,023,929 $270,216,577 1,599 $92,960,540 $140,817,212 $18,616,701 $21,792,250
22 Claudia L. Tenney 52,807 $169,216,354 $234,458,737 1,388 $80,659,044 $122,182,828 $16,153,147 $18,908,475
23 Tom Reed 56,355 $180,587,746 $250,214,436 1,481 $86,079,356 $130,393,552 $17,238,644 $20,179,131
24 John Katko 47,410 $151,924,268 $210,499,582 1,246 $72,416,559 $109,697,060 $14,502,470 $16,976,233
25 Joseph Morelle 40,759 $130,611,069 $180,968,951 1,071 $62,257,362 $94,307,845 $12,467,943 $14,594,666

Economic Impact of Hunting and Shooting in 2020: Technical Report | 24
Southwick Associates | PO Box 6435 ■ Fernandina Beach, FL 32035 ■ Office (904) 277-9765
Table 4 (continued). Statewide Economic Contributions of Recreational Hunting by Congressional District, 2020
District Hunters Retail Sales Total
Multiplier Effect
Jobs Salaries &
Wages GDP
Contributions State & Local
Taxes Federal Taxes
New York
26 Brian Higgins 39,147 $125,444,331 $173,810,147 1,029 $59,794,574 $90,577,198 $11,974,734 $14,017,327
27 Chris Jacobs 53,192 $170,450,105 $236,168,167 1,398 $81,247,126 $123,073,659 $16,270,919 $19,046,336
North Carolina
1 G. K. Butterfield 31,535 $71,634,207 $106,620,540 822 $29,905,884 $53,986,300 $4,386,051 $7,374,331
2 Deborah K. Ross 24,093 $54,729,787 $81,459,958 628 $22,848,619 $41,246,478 $3,351,019 $5,634,118
3 Gregory Francis Murphy 35,316 $80,223,421 $119,404,748 920 $33,491,713 $60,459,463 $4,911,955 $8,258,541
4 David Price 28,387 $64,484,215 $95,978,474 740 $26,920,902 $48,597,791 $3,948,268 $6,638,280
5 Virginia Foxx 38,697 $87,903,795 $130,836,237 1,008 $36,698,120 $66,247,689 $5,382,212 $9,049,192
6 Kathy E. Manning 26,399 $59,968,502 $89,257,275 688 $25,035,680 $45,194,576 $3,671,778 $6,173,413
7 David Rouzer 35,548 $80,751,090 $120,190,133 926 $33,712,005 $60,857,135 $4,944,263 $8,312,862
8 Richard Hudson 32,042 $72,787,212 $108,336,677 835 $30,387,242 $54,855,250 $4,456,647 $7,493,026
9 Dan Bishop 26,305 $59,754,179 $88,938,276 686 $24,946,204 $45,033,053 $3,658,655 $6,151,350
10 Patrick T. McHenry 36,975 $83,993,071 $125,015,506 964 $35,065,469 $63,300,417 $5,142,765 $8,646,605
11 Madison Cawthorn 42,941 $97,545,635 $145,187,177 1,119 $40,723,400 $73,514,152 $5,972,567 $10,041,764
12 Alma Adams 22,478 $51,061,873 $76,000,625 586 $21,317,336 $38,482,196 $3,126,439 $5,256,527
13 Ted Budd 37,489 $85,160,998 $126,753,851 977 $35,553,056 $64,180,611 $5,214,275 $8,766,836
North Dakota
Kelly Armstrong 82,638 $173,310,178 $239,238,808 1,897 $80,448,850 $129,343,410 $13,901,878 $18,965,376
Ohio
1 Steve Chabot 25,482 $46,092,589 $69,182,138 827 $22,689,849 $40,051,220 $3,641,598 $5,416,891
2 Brad Wenstrup 29,398 $53,175,560 $79,813,241 954 $26,176,560 $46,205,823 $4,201,196 $6,249,296
3 Joyce Beatty 23,556 $42,608,920 $63,953,364 765 $20,974,955 $37,024,156 $3,366,367 $5,007,483
4 Jim Jordan 35,115 $63,516,606 $95,334,514 1,140 $31,267,114 $55,191,465 $5,018,203 $7,464,595
5 Robert E. Latta 35,158 $63,593,694 $95,450,218 1,141 $31,305,061 $55,258,449 $5,024,293 $7,473,655

Economic Impact of Hunting and Shooting in 2020: Technical Report | 25
Southwick Associates | PO Box 6435 ■ Fernandina Beach, FL 32035 ■ Office (904) 277-9765
Table 4 (continued). Statewide Economic Contributions of Recreational Hunting by Congressional District, 2020
District Hunters Retail Sales Total Multiplier
Effect Jobs
Salaries & Wages
GDP Contributions
State & Local Taxes
Federal Taxes
Ohio
6 Bill Johnson 40,065 $72,468,946 $108,771,425 1,301 $35,674,053 $62,970,419 $5,725,493 $8,516,692
7 Bob Gibbs 35,581 $64,358,899 $96,598,744 1,155 $31,681,746 $55,923,359 $5,084,749 $7,563,583
8 Warren Davidson 30,632 $55,406,560 $83,161,834 994 $27,274,807 $48,144,405 $4,377,459 $6,511,487
9 Marcy Kaptur 25,611 $46,324,985 $69,530,950 831 $22,804,250 $40,253,155 $3,659,959 $5,444,203
10 Michael Turner 26,243 $47,467,692 $71,246,083 852 $23,366,767 $41,246,087 $3,750,240 $5,578,496
11 Shontel Brown 20,860 $37,730,875 $56,631,720 677 $18,573,655 $32,785,478 $2,980,971 $4,434,206
12 Troy Balderson 29,139 $52,707,367 $79,110,513 946 $25,946,085 $45,798,997 $4,164,206 $6,194,273
13 Tim Ryan 29,274 $52,949,966 $79,474,638 950 $26,065,508 $46,009,798 $4,183,373 $6,222,783
14 David Joyce 28,553 $51,647,416 $77,519,591 927 $25,424,306 $44,877,973 $4,080,464 $6,069,705
15 Mike Carey 33,653 $60,871,829 $91,364,866 1,092 $29,965,178 $52,893,340 $4,809,249 $7,153,776
16 Anthony Gonzalez 30,519 $55,202,505 $82,855,560 991 $27,174,358 $47,967,096 $4,361,338 $6,487,506
Oklahoma
1 Kevin Hern 46,399 $151,744,187 $219,310,646 1,914 $61,585,079 $126,014,986 $8,963,698 $15,783,783
2 Markwayne Mullin 77,373 $253,042,364 $365,713,412 3,192 $102,696,744 $210,137,406 $14,947,495 $26,320,387
3 Frank Lucas 73,291 $239,690,831 $346,416,900 3,024 $97,278,051 $199,049,711 $14,158,805 $24,931,618
4 Tom Cole 62,574 $204,640,904 $295,760,449 2,582 $83,053,107 $169,942,725 $12,088,366 $21,285,874
5 Stephanie I. Bice 46,025 $150,518,834 $217,539,685 1,899 $61,087,772 $124,997,399 $8,891,315 $15,656,327
Oregon
1 Suzanne Bonamici 36,196 $53,594,563 $78,545,229 652 $25,220,678 $36,604,467 $2,891,468 $5,624,365
2 Cliff Bentz 49,312 $73,015,051 $107,006,823 888 $34,359,625 $49,868,436 $3,939,219 $7,662,406
3 Earl Blumenauer 32,591 $48,256,933 $70,722,694 587 $22,708,881 $32,958,928 $2,603,499 $5,064,219
4 Peter DeFazio 47,484 $70,308,837 $103,040,746 855 $33,086,127 $48,020,123 $3,793,216 $7,378,409
5 Kurt Schrader 40,864 $60,506,629 $88,675,170 736 $28,473,377 $41,325,328 $3,264,379 $6,349,737

Economic Impact of Hunting and Shooting in 2020: Technical Report | 26
Southwick Associates | PO Box 6435 ■ Fernandina Beach, FL 32035 ■ Office (904) 277-9765
Table 4 (continued). Statewide Economic Contributions of Recreational Hunting by Congressional District, 2020
District Hunters Retail Sales Total Multiplier
Effect Jobs
Salaries & Wages
GDP Contributions
State & Local Taxes
Federal Taxes
Pennsylvania
1 Brian Fitzpatrick 27,350 $40,745,372 $64,789,957 477 $20,454,010 $36,644,195 $3,477,927 $5,086,352
2 Brendan Boyle 23,636 $35,212,938 $55,992,732 412 $17,676,751 $31,668,621 $3,005,692 $4,395,723
3 Dwight Evans 34,633 $51,595,930 $82,043,626 604 $25,900,946 $46,402,603 $4,404,105 $6,440,855
4 Madeleine Dean 28,089 $41,846,281 $66,540,532 490 $21,006,662 $37,634,293 $3,571,898 $5,223,781
5 Mary Gay Scanlon 25,316 $37,715,671 $59,972,374 441 $18,933,113 $33,919,444 $3,219,319 $4,708,146
6 Chrissy Houlahan 31,035 $46,235,238 $73,519,492 541 $23,209,900 $41,581,484 $3,946,529 $5,771,666
7 Susan Wild 38,616 $57,529,095 $91,478,060 673 $28,879,371 $51,738,572 $4,910,546 $7,181,508
8 Matt Cartwright 50,115 $74,660,705 $118,719,344 873 $37,479,369 $67,145,820 $6,372,859 $9,320,092
9 Dan Meuser 57,209 $85,227,963 $135,522,533 997 $42,784,089 $76,649,443 $7,274,855 $10,639,230
10 Scott Perry 42,069 $62,674,009 $99,659,081 733 $31,462,097 $56,365,631 $5,349,703 $7,823,761
11 Lloyd Smucker 50,823 $75,714,642 $120,395,228 886 $38,008,441 $68,093,674 $6,462,820 $9,451,658
12 Fred Keller 64,233 $95,692,469 $152,162,334 1,119 $48,037,229 $86,060,656 $8,168,080 $11,945,542
13 John Joyce 60,500 $90,130,677 $143,318,428 1,054 $45,245,232 $81,058,680 $7,693,338 $11,251,249
14 Guy Reschenthaler 53,497 $79,698,464 $126,729,977 932 $40,008,304 $71,676,510 $6,802,870 $9,948,969
15 Glenn Thompson 63,951 $95,272,655 $151,494,781 1,115 $47,826,484 $85,683,099 $8,132,245 $11,893,136
16 Mike Kelly 50,980 $75,948,035 $120,766,350 888 $38,125,603 $68,303,575 $6,482,742 $9,480,793
17 Conor Lamb 39,802 $59,296,421 $94,288,316 694 $29,766,561 $53,328,010 $5,061,400 $7,402,128
18 Michael Doyle 38,509 $57,369,096 $91,223,643 671 $28,799,052 $51,594,678 $4,896,888 $7,161,535
Rhode Island
1 David Cicilline 8,387 $9,044,113 $10,499,174 106 $3,754,776 $5,706,320 $741,599 $874,689
2 James Langevin 10,083 $10,873,120 $12,622,440 127 $4,514,110 $6,860,320 $891,573 $1,051,579
South Carolina
1 Nancy Mace 34,717 $105,609,200 $138,276,641 1,236 $38,667,054 $68,170,537 $7,295,346 $9,443,469
2 Joe Wilson 37,053 $112,718,081 $147,584,469 1,319 $41,269,853 $72,759,306 $7,786,418 $10,079,138

Economic Impact of Hunting and Shooting in 2020: Technical Report | 27
Southwick Associates | PO Box 6435 ■ Fernandina Beach, FL 32035 ■ Office (904) 277-9765
Table 4 (continued). Statewide Economic Contributions of Recreational Hunting by Congressional District, 2020
District Hunters Retail Sales Total Multiplier
Effect Jobs
Salaries & Wages
GDP Contributions
State & Local Taxes
Federal Taxes
South Carolina
3 Jeff Duncan 47,701 $145,109,015 $189,994,690 1,698 $53,129,255 $93,667,593 $10,023,941 $12,975,503
4 William Timmons 40,322 $122,659,657 $160,601,211 1,435 $44,909,796 $79,176,575 $8,473,169 $10,968,104
5 Ralph Norman 43,481 $132,270,588 $173,185,032 1,548 $48,428,679 $85,380,413 $9,137,079 $11,827,504
6 James E. Clyburn 36,132 $109,914,996 $143,914,322 1,286 $40,243,550 $70,949,920 $7,592,784 $9,828,489
7 Tom Rice 43,279 $131,656,179 $172,380,572 1,541 $48,203,723 $84,983,813 $9,094,637 $11,772,564
South Dakota
Dusty Johnson 241,739 $757,721,546 $1,009,642,137 9,248 $278,366,641 $498,198,089 $45,030,312 $68,513,352
Tennessee
1 Diana Harshbarger 61,879 $97,762,522 $148,802,481 1,234 $49,181,245 $81,045,507 $7,503,600 $11,416,200
2 Tim Burchett 55,565 $87,786,847 $133,618,695 1,108 $44,162,797 $72,775,634 $6,737,934 $10,251,292
3 Chuck Fleischmann 54,690 $86,404,139 $131,514,102 1,091 $43,467,200 $71,629,364 $6,631,806 $10,089,827
4 Scott DesJarlais 59,212 $93,548,127 $142,387,830 1,181 $47,061,115 $77,551,757 $7,180,131 $10,924,065
5 Jim Cooper 37,564 $59,346,457 $90,330,117 749 $29,855,333 $49,198,441 $4,555,039 $6,930,171
6 John W. Rose 62,886 $99,353,087 $151,223,450 1,254 $49,981,408 $82,364,092 $7,625,681 $11,601,938
7 Mark Green 54,590 $86,245,987 $131,273,381 1,089 $43,387,639 $71,498,255 $6,619,668 $10,071,359
8 David Kustoff 45,446 $71,799,859 $109,285,204 906 $36,120,247 $59,522,360 $5,510,879 $8,384,415
9 Steve Cohen 27,712 $43,782,716 $66,640,842 553 $22,025,705 $36,296,040 $3,360,470 $5,112,718
Texas
1 Louie Gohmert 52,257 $113,111,268 $184,063,443 1,564 $58,812,343 $105,089,673 $9,290,708 $14,845,824
2 Dan Crenshaw 24,941 $53,985,097 $87,848,744 746 $28,069,617 $50,156,596 $4,434,216 $7,085,530
3 Van Taylor 31,364 $67,889,279 $110,474,710 939 $35,299,114 $63,074,725 $5,576,274 $8,910,450
4 Pat Fallon 53,864 $116,590,176 $189,724,593 1,612 $60,621,205 $108,321,865 $9,576,457 $15,302,430
5 Lance Gooden 39,895 $86,354,400 $140,522,588 1,194 $44,900,076 $80,230,341 $7,092,958 $11,333,992
6 Jake Ellzey 34,424 $74,511,227 $121,250,458 1,030 $38,742,204 $69,227,060 $6,120,186 $9,779,579

Economic Impact of Hunting and Shooting in 2020: Technical Report | 28
Southwick Associates | PO Box 6435 ■ Fernandina Beach, FL 32035 ■ Office (904) 277-9765
Table 4 (continued). Statewide Economic Contributions of Recreational Hunting by Congressional District, 2020
District Hunters Retail Sales Total Multiplier
Effect Jobs
Salaries & Wages
GDP Contributions
State & Local Taxes
Federal Taxes
Texas
7 Lizzie Fletcher 24,857 $53,803,804 $87,553,730 744 $27,975,354 $49,988,160 $4,419,325 $7,061,735
8 Kevin Brady 51,222 $110,872,783 $180,420,805 1,533 $57,648,439 $103,009,936 $9,106,843 $14,552,024
9 Al Green 21,583 $46,718,129 $76,023,369 646 $24,291,149 $43,404,985 $3,837,323 $6,131,742
10 Michael T. McCaul 40,723 $88,146,333 $143,438,562 1,219 $45,831,794 $81,895,195 $7,240,143 $11,569,183
11 August Pfluger 50,381 $109,052,224 $177,458,251 1,508 $56,701,838 $101,318,487 $8,957,307 $14,313,076
12 Kay Granger 38,727 $83,825,846 $136,407,930 1,159 $43,585,352 $77,881,107 $6,885,268 $11,002,120
13 Ronny Jackson 47,676 $103,195,521 $167,927,769 1,427 $53,656,638 $95,877,129 $8,476,250 $13,544,385
14 Randy Weber 38,178 $82,636,949 $134,473,263 1,143 $42,967,183 $76,776,524 $6,787,615 $10,846,078
15 Vicente Gonzalez 28,093 $60,807,421 $98,950,559 841 $31,616,893 $56,495,096 $4,994,586 $7,980,958
16 Veronica Escobar 22,786 $49,321,108 $80,259,139 682 $25,644,571 $45,823,367 $4,051,126 $6,473,382
17 Pete Sessions 48,425 $104,817,612 $170,567,362 1,449 $54,500,046 $97,384,184 $8,609,485 $13,757,284
18 Sheila Jackson Lee 23,735 $51,374,485 $83,600,553 710 $26,712,226 $47,731,122 $4,219,786 $6,742,888
19 Jodey Arrington 45,521 $98,531,533 $160,338,165 1,362 $51,231,591 $91,543,899 $8,093,161 $12,932,238
20 Joaquin Castro 25,866 $55,988,856 $91,109,417 774 $29,111,475 $52,018,253 $4,598,800 $7,348,523
21 Chip Roy 41,911 $90,716,871 $147,621,540 1,254 $47,168,348 $84,283,436 $7,451,282 $11,906,565
22 Troy E. Nehls 32,208 $69,715,563 $113,446,580 964 $36,248,693 $64,771,493 $5,726,281 $9,150,149
23 Tony Gonzales 36,760 $79,568,335 $129,479,776 1,100 $41,371,653 $73,925,528 $6,535,566 $10,443,323
24 Beth Van Duyne 29,435 $63,713,826 $103,680,088 881 $33,128,082 $59,195,386 $5,233,312 $8,362,423
25 Roger Williams 48,171 $104,268,010 $169,673,006 1,442 $54,214,280 $96,873,558 $8,564,342 $13,685,149
26 Michael Burgess 35,569 $76,990,164 $125,284,376 1,065 $40,031,130 $71,530,196 $6,323,801 $10,104,939
27 Michael Cloud 41,354 $89,512,707 $145,662,030 1,238 $46,542,242 $83,164,668 $7,352,374 $11,748,519
28 Henry Cuellar 27,594 $59,727,299 $97,192,901 826 $31,055,282 $55,491,574 $4,905,867 $7,839,192
29 Sylvia Garcia 15,744 $34,079,178 $55,456,286 471 $17,719,510 $31,662,360 $2,799,188 $4,472,883
30 Eddie Bernice Johnson 24,734 $53,538,545 $87,122,079 740 $27,837,432 $49,741,712 $4,397,537 $7,026,920

Economic Impact of Hunting and Shooting in 2020: Technical Report | 29
Southwick Associates | PO Box 6435 ■ Fernandina Beach, FL 32035 ■ Office (904) 277-9765
Table 4 (continued). Statewide Economic Contributions of Recreational Hunting by Congressional District, 2020
District Hunters Retail Sales Total Multiplier
Effect Jobs
Salaries & Wages
GDP Contributions
State & Local Taxes
Federal Taxes
Texas
31 John Carter 39,752 $86,045,249 $140,019,513 1,190 $44,739,333 $79,943,114 $7,067,565 $11,293,416
32 Colin Allred 26,307 $56,943,028 $92,662,118 787 $29,607,597 $52,904,757 $4,677,173 $7,473,757
33 Marc Veasey 17,015 $36,829,099 $59,931,171 509 $19,149,335 $34,217,263 $3,025,060 $4,833,810
34 Filemon Vela 26,736 $57,870,482 $94,171,344 800 $30,089,828 $53,766,438 $4,753,352 $7,595,486
35 Lloyd Doggett 30,265 $65,509,576 $106,602,272 906 $34,061,785 $60,863,786 $5,380,811 $8,598,115
36 Brian Babin 48,372 $104,703,112 $170,381,038 1,448 $54,440,512 $97,277,804 $8,600,080 $13,742,256
Utah
1 Blake D. Moore 64,311 $214,643,033 $346,807,213 2,891 $108,275,572 $172,733,126 $15,715,489 $25,160,194
2 Chris Stewart 66,166 $220,836,097 $356,813,590 2,974 $111,399,631 $177,716,969 $16,168,926 $25,886,137
3 John R. Curtis 61,431 $205,033,107 $331,280,077 2,761 $103,427,894 $164,999,576 $15,011,880 $24,033,730
4 Burgess Owens 51,619 $172,284,615 $278,367,047 2,320 $86,908,087 $138,645,358 $12,614,139 $20,194,992
Vermont
Peter Welch 74,567 $285,810,450 $400,051,237 3,217 $122,488,951 $213,510,603 $27,120,410 $29,880,353
Virginia
1 Robert J. Wittman 37,872 $100,215,890 $143,391,473 1,735 $48,171,501 $86,679,345 $7,153,500 $12,387,783
2 Elaine Luria 29,938 $79,220,869 $113,351,256 1,371 $38,079,672 $68,520,202 $5,654,857 $9,792,568
3 Robert C. Scott 29,507 $78,079,694 $111,718,434 1,352 $37,531,135 $67,533,170 $5,573,398 $9,651,506
4 A. Donald McEachin 35,695 $94,453,822 $135,146,958 1,635 $45,401,806 $81,695,582 $6,742,198 $11,675,528
5 Bob Good 47,536 $125,788,578 $179,981,533 2,178 $60,463,712 $108,797,832 $8,978,901 $15,548,847
6 Ben Cline 46,226 $122,321,828 $175,021,217 2,118 $58,797,323 $105,799,349 $8,731,442 $15,120,319
7 Abigail Spanberger 33,579 $88,856,014 $127,137,471 1,538 $42,711,067 $76,853,892 $6,342,622 $10,983,578
8 Don Beyer 20,811 $55,068,165 $78,792,946 953 $26,470,016 $47,629,896 $3,930,815 $6,807,029
9 Morgan Griffith 62,558 $165,539,498 $236,858,171 2,866 $79,571,076 $143,179,443 $11,816,358 $20,462,497
10 Jennifer Wexton 25,242 $66,795,464 $95,572,668 1,156 $32,107,062 $57,773,145 $4,767,920 $8,256,652
11 Gerald E. "Gerry" Connolly 18,179 $48,104,405 $68,829,020 833 $23,122,695 $41,606,759 $3,433,736 $5,946,232

Economic Impact of Hunting and Shooting in 2020: Technical Report | 30
Southwick Associates | PO Box 6435 ■ Fernandina Beach, FL 32035 ■ Office (904) 277-9765
Table 4 (continued). Statewide Economic Contributions of Recreational Hunting by Congressional District, 2020
District Hunters Retail Sales Total Multiplier
Effect Jobs
Salaries & Wages
GDP Contributions
State & Local Taxes
Federal Taxes
Washington
1 Suzan DelBene 20,958 $41,466,427 $63,097,505 461 $19,692,303 $33,627,297 $4,120,311 $5,223,188
2 Rick Larsen 22,676 $44,866,460 $68,271,175 498 $21,306,971 $36,384,562 $4,458,155 $5,651,462
3 Jaime Herrera Beutler 23,862 $47,211,949 $71,840,194 524 $22,420,837 $38,286,642 $4,691,214 $5,946,905
4 Dan Newhouse 21,005 $41,560,987 $63,241,392 462 $19,737,209 $33,703,981 $4,129,706 $5,235,099
5 Cathy McMorris Rodgers 25,724 $50,897,716 $77,448,653 565 $24,171,199 $41,275,624 $5,057,450 $6,411,171
6 Derek Kilmer 24,888 $49,242,924 $74,930,633 547 $23,385,342 $39,933,666 $4,893,022 $6,202,730
7 Pramila Jayapal 17,704 $35,028,154 $53,300,688 389 $16,634,783 $28,406,164 $3,480,572 $4,412,211
8 Kim Schrier 21,626 $42,788,205 $65,108,793 475 $20,320,013 $34,699,197 $4,251,649 $5,389,682
9 Adam Smith 14,643 $28,973,258 $44,087,239 322 $13,759,328 $23,495,932 $2,878,927 $3,649,525
10 Marilyn Strickland 20,462 $40,484,858 $61,603,897 450 $19,226,158 $32,831,291 $4,022,777 $5,099,548
West Virginia
1 David McKinley 69,927 $139,966,766 $168,633,221 1,275 $46,259,923 $79,773,462 $9,760,402 $10,880,848
2 Alex Mooney 67,793 $135,693,702 $163,484,994 1,236 $44,847,647 $77,338,047 $9,462,425 $10,548,666
3 Carol Miller 89,999 $180,142,656 $217,037,494 1,641 $59,538,315 $102,671,539 $12,562,016 $14,004,074
Wisconsin
1 Bryan Steil 98,365 $330,498,308 $441,948,647 2,873 $117,170,333 $236,071,687 $24,000,313 $31,600,220
2 Mark Pocan 99,461 $334,180,346 $446,872,339 2,905 $118,475,712 $238,701,731 $24,267,697 $31,952,274
3 Ron Kind 133,265 $447,757,054 $598,749,281 3,892 $158,741,639 $319,828,455 $32,515,474 $42,811,782
4 Gwen Moore 64,172 $215,611,644 $288,320,007 1,874 $76,439,992 $154,009,274 $15,657,408 $20,615,462
5 Scott Fitzgerald 87,738 $294,789,621 $394,198,309 2,562 $104,510,665 $210,565,324 $21,407,199 $28,185,975
6 Glenn Grothman 118,544 $398,297,371 $532,610,850 3,462 $141,206,882 $284,499,891 $28,923,783 $38,082,751
7 Thomas P. Tiffany 140,820 $473,141,873 $632,694,346 4,113 $167,741,225 $337,960,581 $34,358,883 $45,238,923
8 Mike Gallagher 114,791 $385,686,392 $515,747,207 3,352 $136,735,959 $275,491,992 $28,007,992 $36,876,966
Wyoming
Liz Cheney 134,609 $338,983,411 $442,973,078 3,977 $134,092,527 $227,294,653 $38,206,823 $37,436,584

Economic Impact of Hunting and Shooting in 2020: Technical Report | 31
Southwick Associates | PO Box 6435 ■ Fernandina Beach, FL 32035 ■ Office (904) 277-9765
Table 5. Economic Contributions of Target Shooting in the U.S. by Type
Shooting Type Retail Sales Total Multiplier
Effect Jobs Salaries & Wages
GDP Contributions
State/Local Taxes
Federal Taxes
Handgun Shooting $6,044,000,000 $15,211,000,000 108,500 $4,930,000,000 $8,182,000,000 $867,000,000 $1,218,000,000
Rifle Shooting $4,882,000,000 $12,285,000,000 87,600 $3,982,000,000 $6,608,000,000 $700,000,000 $984,000,000
Shotgun Shooting $3,999,000,000 $10,065,000,000 71,800 $3,262,000,000 $5,414,000,000 $574,000,000 $806,000,000
Muzzleloader Shooting $650,000,000 $1,612,000,000 11,500 $523,000,000 $866,000,000 $92,000,000 $129,000,000
All Shooting $15,666,000,000 $39,448,000,000 281,200 $12,785,000,000 $21,210,000,000 $2,247,000,000 $3,158,000,000
Table 6. Participation and Days of Target Shooting by State, 2020 Number of Shooters Days of Shooting
State All
Shooting Handgun Rifle Shotgun
Muzzleloader
All Shooting
Handgun Rifle Shotgun Muzzleload
er
AK 126,600 81,200 93,400 62,400 10,667 2,707,800 985,200 1,074,200 713,400 125,333
AL 411,600 265,000 270,400 91,600 128,500 6,717,800 2,972,600 2,734,600 966,200 1,087,000
AR 258,600 203,800 149,600 142,200 117,200 6,155,600 2,211,600 1,882,800 2,450,600 684,600
AZ 447,800 365,400 270,200 292,000 29,333 11,869,800 4,656,000 3,942,000 3,854,200 231,333
CA 1,538,200 1,024,800 986,800 894,000 123,400 31,316,800 12,613,000 10,696,600 9,207,400 589,200
CO 324,600 211,800 196,000 208,400 78,000 5,357,800 2,283,200 1,775,200 1,467,800 465,200
CT 171,000 126,200 76,000 81,250 12,000 2,297,600 1,039,800 616,200 932,000 97,000
DC 26,200 12,400 11,500 17,250 7,000 369,600 223,800 78,250 104,500 32,500
DE 60,200 33,800 35,000 34,000 18,667 1,259,800 310,400 504,800 528,800 224,667
FL 1,169,400 770,800 510,000 413,200 158,600 17,710,200 9,379,200 4,861,200 3,767,000 1,191,800
GA 765,800 578,600 371,000 367,400 51,600 15,216,200 6,743,200 4,432,400 4,830,600 459,800
HI1 27,800 19,600 23,200 25,250 - 463,800 133,400 182,600 225,500 -
IA 281,800 210,800 156,400 120,800 32,750 3,322,000 1,607,600 935,400 844,600 397,250
ID 250,200 194,600 179,600 122,000 41,600 6,913,600 2,605,800 2,722,600 1,754,000 284,400
IL 433,800 291,400 191,400 240,800 75,000 7,396,400 2,904,400 2,076,000 2,873,400 670,200
1 Sample sizes were too low to present results for muzzleloader participation in HI

Economic Impact of Hunting and Shooting in 2020: Technical Report | 32
Southwick Associates | PO Box 6435 ■ Fernandina Beach, FL 32035 ■ Office (904) 277-9765
Table 6 (continued). Participation and Days of Target Shooting by State, 2020 Number of Shooters Days of Shooting
State All
Shooting Handgun Rifle Shotgun Muzzleloader All Shooting Handgun Rifle Shotgun Muzzleloader
IN 445,400 369,000 229,600 301,200 56,000 12,441,200 5,541,800 3,472,400 4,035,000 775,200
KS 267,800 190,800 171,600 153,000 50,000 6,293,800 2,536,000 2,370,200 1,885,750 381,333
KY 286,600 158,600 171,000 168,000 24,000 4,676,600 1,312,400 2,417,600 998,400 158,000
LA 330,800 264,400 138,600 99,200 64,750 5,969,000 3,590,000 1,402,600 995,800 413,250
MA 149,400 103,200 107,200 95,600 36,333 2,661,400 1,128,200 1,104,400 479,400 265,000
MD 255,400 134,000 133,000 126,600 48,667 4,520,400 1,657,800 1,335,200 1,824,200 728,333
ME 152,800 97,800 99,800 70,600 46,600 2,978,600 1,261,000 960,400 876,600 224,600
MI 541,200 373,200 330,000 314,200 168,800 10,935,600 5,111,400 3,291,200 2,929,800 904,000
MN 401,800 209,600 214,600 206,200 72,000 5,058,200 2,096,400 1,610,800 1,499,600 485,333
MO 459,600 341,600 294,400 204,000 102,800 11,171,400 4,961,200 4,102,600 2,268,000 664,600
MS 297,000 199,200 212,800 194,400 19,250 6,192,200 2,331,000 2,292,600 1,786,400 240,750
MT 184,000 109,400 147,600 74,200 15,667 3,717,400 1,213,400 1,823,800 707,400 133,667
NC 706,000 530,000 408,800 396,600 169,000 19,532,200 7,402,200 6,475,200 6,839,800 1,425,400
ND 85,600 45,600 62,400 56,000 13,000 1,195,600 375,800 419,200 401,800 86,250
NE 126,000 87,800 79,000 68,200 18,000 2,620,200 929,600 929,600 889,800 140,000
NH 104,800 61,400 67,000 28,200 10,500 1,588,200 805,800 516,000 253,000 29,000
NJ 325,400 225,600 181,600 119,400 137,333 3,046,800 1,474,800 980,600 644,000 483,667
NM 165,200 121,400 65,200 94,000 32,400 2,961,800 1,434,000 717,400 971,800 256,800
NV 232,200 187,600 158,400 176,000 68,500 7,814,600 2,917,000 2,524,200 2,861,600 325,250
NY 778,000 404,600 351,600 479,000 83,600 12,536,200 4,882,400 3,653,600 4,733,000 311,800
OH 718,400 464,200 415,800 386,800 89,400 17,118,800 7,305,800 4,996,000 3,873,800 357,000
OK 396,800 302,600 275,000 226,000 98,000 10,124,600 3,925,400 2,493,800 3,099,600 373,250
OR 338,000 240,000 237,000 220,200 29,500 5,664,800 2,166,800 1,645,600 1,603,200 180,000
PA 861,400 575,400 524,800 404,000 113,400 17,182,400 7,543,400 4,254,200 3,565,600 951,400
RI 57,200 47,000 23,000 19,200 24,500 1,205,400 611,400 357,800 160,400 118,250
SC 327,600 277,000 156,400 87,800 42,500 4,843,400 2,725,000 1,094,000 894,800 377,500

Economic Impact of Hunting and Shooting in 2020: Technical Report | 33
Southwick Associates | PO Box 6435 ■ Fernandina Beach, FL 32035 ■ Office (904) 277-9765
Table 6 (continued). Participation and Days of Target Shooting by State, 2020 Number of Shooters Days of Shooting
State All
Shooting Handgun Rifle Shotgun Muzzleloader All Shooting Handgun Rifle Shotgun Muzzleloader
SD 78,800 47,600 61,200 50,600 35,750 1,389,000 461,000 495,600 379,600 203,500
TN 699,800 506,600 474,000 417,400 114,800 22,266,600 8,017,600 6,633,400 7,321,600 760,600
TX 1,806,000 1,323,800 979,200 783,600 104,400 31,839,000 14,680,000 8,893,200 7,720,800 642,600
UT 291,600 219,400 188,400 194,600 13,000 5,150,600 2,008,000 1,446,600 1,722,800 100,333
VA 504,800 390,200 284,200 265,400 112,250 8,648,600 3,628,200 2,449,000 2,441,600 446,750
VT 69,600 45,200 51,200 34,800 46,600 1,172,600 450,800 331,600 301,000 294,800
WA 486,000 288,800 304,200 213,800 41,800 11,310,800 3,690,800 5,364,800 1,854,400 309,800
WI 404,800 267,400 233,000 249,000 42,600 6,069,400 3,207,200 1,001,200 1,573,600 233,600
WV 222,800 130,800 168,600 120,000 77,800 5,049,400 1,928,200 1,615,000 1,354,600 488,000
WY 112,800 85,200 89,200 62,400 9,500 2,374,200 843,200 700,600 742,800 39,500
US 19,964,600 13,815,000 11,607,600 10,218,000 2,718,200 398,396,200 166,824,400 134,735,200 110,382,000 18,032,200

Economic Impact of Hunting and Shooting in 2020: Technical Report | 34
Southwick Associates | PO Box 6435 ■ Fernandina Beach, FL 32035 ■ Office (904) 277-9765
Table 7. Economic Contributions of All Target Shooting Activities, 2020
State Retail Sales Total Multiplier
Effect Jobs Salaries & Wages
GDP Contributions
State & Local Taxes
Federal Taxes
AK $106,000,000 $134,000,000 1,400 $48,000,000 $77,000,000 $7,000,000 $13,000,000
AL $264,000,000 $419,000,000 3,900 $133,000,000 $223,000,000 $24,000,000 $31,000,000
AR $242,000,000 $381,000,000 3,600 $114,000,000 $205,000,000 $25,000,000 $29,000,000
AZ $467,000,000 $842,000,000 7,200 $284,000,000 $455,000,000 $52,000,000 $66,000,000
CA $1,231,000,000 $2,277,000,000 17,300 $816,000,000 $1,312,000,000 $154,000,000 $201,000,000
CO $211,000,000 $387,000,000 3,100 $134,000,000 $217,000,000 $24,000,000 $33,000,000
CT $90,000,000 $148,000,000 1,200 $56,000,000 $90,000,000 $11,000,000 $15,000,000
DC $15,000,000 $19,000,000 100 $8,000,000 $11,000,000 $1,000,000 $1,000,000
DE $50,000,000 $67,000,000 700 $25,000,000 $39,000,000 $4,000,000 $5,000,000
FL $696,000,000 $1,291,000,000 10,900 $421,000,000 $686,000,000 $73,000,000 $108,000,000
GA $598,000,000 $1,064,000,000 9,300 $340,000,000 $575,000,000 $57,000,000 $82,000,000
HI $18,000,000 $29,000,000 200 $10,000,000 $16,000,000 $2,000,000 $2,000,000
IA $131,000,000 $211,000,000 2,000 $71,000,000 $104,000,000 $13,000,000 $15,000,000
ID $272,000,000 $441,000,000 4,500 $138,000,000 $208,000,000 $24,000,000 $31,000,000
IL $291,000,000 $515,000,000 4,100 $177,000,000 $294,000,000 $33,000,000 $44,000,000
IN $489,000,000 $795,000,000 7,500 $265,000,000 $423,000,000 $48,000,000 $60,000,000
KS $247,000,000 $407,000,000 3,800 $126,000,000 $207,000,000 $25,000,000 $30,000,000
KY $184,000,000 $293,000,000 2,800 $95,000,000 $156,000,000 $17,000,000 $22,000,000
LA $235,000,000 $374,000,000 3,400 $123,000,000 $207,000,000 $24,000,000 $29,000,000
MA $105,000,000 $182,000,000 1,500 $72,000,000 $105,000,000 $10,000,000 $17,000,000
MD $178,000,000 $290,000,000 2,400 $101,000,000 $165,000,000 $20,000,000 $25,000,000
ME $117,000,000 $190,000,000 1,800 $59,000,000 $100,000,000 $13,000,000 $14,000,000
MI $430,000,000 $731,000,000 6,500 $236,000,000 $390,000,000 $51,000,000 $57,000,000
MN $199,000,000 $355,000,000 3,000 $118,000,000 $199,000,000 $25,000,000 $30,000,000
MO $439,000,000 $767,000,000 7,100 $258,000,000 $409,000,000 $40,000,000 $59,000,000

Economic Impact of Hunting and Shooting in 2020: Technical Report | 35
Southwick Associates | PO Box 6435 ■ Fernandina Beach, FL 32035 ■ Office (904) 277-9765
Table 7 (continued). Economic Contributions of All Target Shooting Activities, 2020
State Retail Sales Total Multiplier
Effect Jobs Salaries & Wages
GDP Contributions
State & Local Taxes
Federal Taxes
MS $243,000,000 $372,000,000 3,700 $111,000,000 $185,000,000 $26,000,000 $25,000,000
MT $146,000,000 $237,000,000 2,400 $76,000,000 $115,000,000 $11,000,000 $18,000,000
NC $768,000,000 $1,322,000,000 12,200 $417,000,000 $690,000,000 $64,000,000 $99,000,000
ND $47,000,000 $65,000,000 600 $22,000,000 $34,000,000 $3,000,000 $5,000,000
NE $103,000,000 $170,000,000 1,700 $56,000,000 $89,000,000 $9,000,000 $13,000,000
NH $62,000,000 $105,000,000 1,000 $38,000,000 $58,000,000 $6,000,000 $9,000,000
NJ $120,000,000 $203,000,000 1,500 $77,000,000 $120,000,000 $14,000,000 $20,000,000
NM $116,000,000 $180,000,000 1,800 $53,000,000 $87,000,000 $12,000,000 $12,000,000
NV $307,000,000 $490,000,000 4,000 $162,000,000 $273,000,000 $35,000,000 $41,000,000
NY $493,000,000 $816,000,000 6,300 $314,000,000 $477,000,000 $68,000,000 $75,000,000
OH $673,000,000 $1,191,000,000 10,700 $381,000,000 $646,000,000 $72,000,000 $90,000,000
OK $398,000,000 $662,000,000 6,100 $212,000,000 $347,000,000 $37,000,000 $49,000,000
OR $223,000,000 $385,000,000 3,800 $129,000,000 $195,000,000 $18,000,000 $30,000,000
PA $676,000,000 $1,205,000,000 10,600 $424,000,000 $655,000,000 $70,000,000 $98,000,000
RI $47,000,000 $67,000,000 700 $25,000,000 $39,000,000 $5,000,000 $6,000,000
SC $190,000,000 $301,000,000 2,800 $94,000,000 $159,000,000 $20,000,000 $23,000,000
SD $55,000,000 $88,000,000 800 $27,000,000 $43,000,000 $4,000,000 $6,000,000
TN $876,000,000 $1,509,000,000 13,200 $521,000,000 $835,000,000 $88,000,000 $121,000,000
TX $1,252,000,000 $2,298,000,000 18,400 $782,000,000 $1,282,000,000 $136,000,000 $192,000,000
UT $203,000,000 $362,000,000 3,200 $115,000,000 $189,000,000 $20,000,000 $28,000,000
VA $340,000,000 $566,000,000 4,900 $189,000,000 $313,000,000 $33,000,000 $47,000,000
VT $46,000,000 $72,000,000 700 $24,000,000 $39,000,000 $6,000,000 $6,000,000
WA $445,000,000 $740,000,000 6,000 $235,000,000 $408,000,000 $57,000,000 $63,000,000
WI $239,000,000 $402,000,000 3,800 $127,000,000 $206,000,000 $24,000,000 $30,000,000
WV $199,000,000 $295,000,000 3,000 $92,000,000 $148,000,000 $20,000,000 $21,000,000
WY $93,000,000 $133,000,000 1,200 $39,000,000 $68,000,000 $11,000,000 $11,000,000
US $15,666,000,000 $39,448,000,000 281,200 $12,785,000,000 $21,210,000,000 $2,247,000,000 $3,158,000,000

Economic Impact of Hunting and Shooting in 2020: Technical Report | 36
Southwick Associates | PO Box 6435 ■ Fernandina Beach, FL 32035 ■ Office (904) 277-9765
Table 8. Economic Contributions of Handgun Target Shooting Activities, 2020
State Retail Sales Total Multiplier
Effect Jobs Salaries & Wages
GDP Contributions
State & Local Taxes
Federal Taxes
AK $36,000,000 $45,000,000 500 $16,000,000 $26,000,000 $2,000,000 $4,000,000
AL $108,000,000 $171,000,000 1,600 $54,000,000 $91,000,000 $10,000,000 $13,000,000
AR $80,000,000 $126,000,000 1,200 $38,000,000 $68,000,000 $8,000,000 $9,000,000
AZ $169,000,000 $305,000,000 2,600 $103,000,000 $165,000,000 $19,000,000 $24,000,000
CA $457,000,000 $845,000,000 6,400 $303,000,000 $487,000,000 $57,000,000 $75,000,000
CO $83,000,000 $152,000,000 1,200 $53,000,000 $85,000,000 $9,000,000 $13,000,000
CT $38,000,000 $62,000,000 500 $23,000,000 $38,000,000 $5,000,000 $6,000,000
DC $8,000,000 $10,000,000 100 $4,000,000 $6,000,000 $1,000,000 $1,000,000
DE $11,000,000 $15,000,000 100 $6,000,000 $9,000,000 $1,000,000 $1,000,000
FL $340,000,000 $629,000,000 5,300 $205,000,000 $335,000,000 $35,000,000 $53,000,000
GA $244,000,000 $434,000,000 3,800 $139,000,000 $235,000,000 $23,000,000 $33,000,000
HI $5,000,000 $8,000,000 100 $3,000,000 $4,000,000 $1,000,000 $1,000,000
IA $58,000,000 $94,000,000 900 $32,000,000 $46,000,000 $6,000,000 $7,000,000
ID $94,000,000 $153,000,000 1,600 $48,000,000 $72,000,000 $9,000,000 $11,000,000
IL $105,000,000 $186,000,000 1,500 $64,000,000 $106,000,000 $12,000,000 $16,000,000
IN $201,000,000 $326,000,000 3,100 $109,000,000 $174,000,000 $20,000,000 $24,000,000
KS $92,000,000 $151,000,000 1,400 $47,000,000 $77,000,000 $9,000,000 $11,000,000
KY $48,000,000 $76,000,000 700 $25,000,000 $40,000,000 $4,000,000 $6,000,000
LA $130,000,000 $207,000,000 1,900 $68,000,000 $115,000,000 $13,000,000 $16,000,000
MA $41,000,000 $71,000,000 600 $28,000,000 $41,000,000 $4,000,000 $7,000,000
MD $60,000,000 $98,000,000 800 $34,000,000 $56,000,000 $7,000,000 $8,000,000
ME $46,000,000 $75,000,000 700 $23,000,000 $39,000,000 $5,000,000 $5,000,000
MI $185,000,000 $315,000,000 2,800 $102,000,000 $168,000,000 $22,000,000 $25,000,000
MN $76,000,000 $136,000,000 1,200 $45,000,000 $76,000,000 $10,000,000 $11,000,000
MO $180,000,000 $314,000,000 2,900 $106,000,000 $168,000,000 $16,000,000 $24,000,000
MS $84,000,000 $129,000,000 1,300 $38,000,000 $64,000,000 $9,000,000 $9,000,000
MT $44,000,000 $71,000,000 700 $23,000,000 $35,000,000 $3,000,000 $5,000,000

Economic Impact of Hunting and Shooting in 2020: Technical Report | 37
Southwick Associates | PO Box 6435 ■ Fernandina Beach, FL 32035 ■ Office (904) 277-9765
Table 8 (continued). Economic Contributions of Handgun Target Shooting Activities, 2020
State Retail Sales Total Multiplier
Effect Jobs Salaries & Wages
GDP Contributions
State & Local Taxes
Federal Taxes
NC $268,000,000 $776,000,000 5,900 $146,000,000 $241,000,000 $22,000,000 $35,000,000
ND $14,000,000 $19,000,000 200 $6,000,000 $10,000,000 $1,000,000 $1,000,000
NE $34,000,000 $56,000,000 500 $18,000,000 $29,000,000 $3,000,000 $4,000,000
NH $29,000,000 $49,000,000 400 $18,000,000 $27,000,000 $3,000,000 $4,000,000
NJ $53,000,000 $91,000,000 700 $34,000,000 $54,000,000 $6,000,000 $9,000,000
NM $52,000,000 $80,000,000 800 $24,000,000 $39,000,000 $5,000,000 $5,000,000
NV $106,000,000 $169,000,000 1,400 $56,000,000 $94,000,000 $12,000,000 $14,000,000
NY $177,000,000 $293,000,000 2,300 $113,000,000 $171,000,000 $24,000,000 $27,000,000
OH $265,000,000 $468,000,000 4,200 $150,000,000 $254,000,000 $28,000,000 $35,000,000
OK $142,000,000 $237,000,000 2,200 $76,000,000 $124,000,000 $13,000,000 $18,000,000
OR $79,000,000 $136,000,000 1,300 $46,000,000 $69,000,000 $6,000,000 $11,000,000
PA $273,000,000 $487,000,000 4,300 $172,000,000 $265,000,000 $28,000,000 $40,000,000
RI $22,000,000 $31,000,000 300 $12,000,000 $18,000,000 $2,000,000 $3,000,000
SC $99,000,000 $156,000,000 1,500 $49,000,000 $82,000,000 $10,000,000 $12,000,000
SD $17,000,000 $27,000,000 300 $8,000,000 $13,000,000 $1,000,000 $2,000,000
TN $290,000,000 $501,000,000 4,400 $173,000,000 $277,000,000 $29,000,000 $40,000,000
TX $532,000,000 $976,000,000 7,800 $332,000,000 $544,000,000 $58,000,000 $82,000,000
UT $73,000,000 $130,000,000 1,100 $41,000,000 $68,000,000 $7,000,000 $10,000,000
VA $131,000,000 $219,000,000 1,900 $73,000,000 $121,000,000 $13,000,000 $18,000,000
VT $16,000,000 $26,000,000 200 $9,000,000 $14,000,000 $2,000,000 $2,000,000
WA $134,000,000 $223,000,000 1,800 $71,000,000 $123,000,000 $17,000,000 $19,000,000
WI $116,000,000 $195,000,000 1,800 $62,000,000 $100,000,000 $12,000,000 $15,000,000
WV $70,000,000 $104,000,000 1,100 $33,000,000 $52,000,000 $7,000,000 $7,000,000
WY $31,000,000 $43,000,000 400 $13,000,000 $22,000,000 $4,000,000 $4,000,000
US $6,044,000,000 $15,211,000,000 108,500 $4,930,000,000 $8,182,000,000 $867,000,000 $1,218,000,000

Economic Impact of Hunting and Shooting in 2020: Technical Report | 38
Southwick Associates | PO Box 6435 ■ Fernandina Beach, FL 32035 ■ Office (904) 277-9765
Table 9. Economic Contributions of Rifle Target Shooting Activities, 2020
State Retail Sales Total Multiplier
Effect Jobs Salaries & Wages
GDP Contributions
State & Local Taxes
Federal Taxes
AK $39,000,000 $49,000,000 500 $17,000,000 $28,000,000 $3,000,000 $5,000,000
AL $99,000,000 $157,000,000 1,500 $50,000,000 $84,000,000 $9,000,000 $12,000,000
AR $68,000,000 $107,000,000 1,000 $32,000,000 $58,000,000 $7,000,000 $8,000,000
AZ $143,000,000 $258,000,000 2,200 $87,000,000 $140,000,000 $16,000,000 $20,000,000
CA $387,000,000 $716,000,000 5,400 $257,000,000 $413,000,000 $48,000,000 $63,000,000
CO $64,000,000 $118,000,000 1,000 $41,000,000 $66,000,000 $7,000,000 $10,000,000
CT $22,000,000 $36,000,000 300 $14,000,000 $22,000,000 $3,000,000 $4,000,000
DC $3,000,000 $4,000,000 0 $2,000,000 $2,000,000 $0 $0
DE $18,000,000 $25,000,000 200 $9,000,000 $15,000,000 $1,000,000 $2,000,000
FL $176,000,000 $326,000,000 2,800 $106,000,000 $173,000,000 $18,000,000 $27,000,000
GA $161,000,000 $285,000,000 2,500 $91,000,000 $154,000,000 $15,000,000 $22,000,000
HI $7,000,000 $11,000,000 100 $3,000,000 $6,000,000 $1,000,000 $1,000,000
IA $34,000,000 $55,000,000 500 $19,000,000 $27,000,000 $3,000,000 $4,000,000
ID $99,000,000 $160,000,000 1,600 $50,000,000 $76,000,000 $9,000,000 $11,000,000
IL $75,000,000 $133,000,000 1,100 $46,000,000 $76,000,000 $9,000,000 $11,000,000
IN $126,000,000 $204,000,000 1,900 $68,000,000 $109,000,000 $12,000,000 $15,000,000
KS $86,000,000 $141,000,000 1,300 $44,000,000 $72,000,000 $9,000,000 $10,000,000
KY $88,000,000 $139,000,000 1,300 $45,000,000 $74,000,000 $8,000,000 $10,000,000
LA $51,000,000 $81,000,000 700 $27,000,000 $45,000,000 $5,000,000 $6,000,000
MA $40,000,000 $70,000,000 600 $28,000,000 $40,000,000 $4,000,000 $7,000,000
MD $48,000,000 $79,000,000 600 $28,000,000 $45,000,000 $5,000,000 $7,000,000
ME $35,000,000 $57,000,000 500 $18,000,000 $30,000,000 $4,000,000 $4,000,000
MI $119,000,000 $203,000,000 1,800 $66,000,000 $108,000,000 $14,000,000 $16,000,000
MN $58,000,000 $104,000,000 900 $35,000,000 $58,000,000 $7,000,000 $9,000,000
MO $149,000,000 $259,000,000 2,400 $87,000,000 $139,000,000 $13,000,000 $20,000,000
MS $83,000,000 $127,000,000 1,300 $38,000,000 $63,000,000 $9,000,000 $9,000,000
MT $66,000,000 $107,000,000 1,100 $34,000,000 $52,000,000 $5,000,000 $8,000,000

Economic Impact of Hunting and Shooting in 2020: Technical Report | 39
Southwick Associates | PO Box 6435 ■ Fernandina Beach, FL 32035 ■ Office (904) 277-9765
Table 9 (continued). Economic Contributions of Rifle Target Shooting Activities, 2020
State Retail Sales Total Multiplier
Effect Jobs Salaries & Wages
GDP Contributions
State & Local Taxes
Federal Taxes
NC $235,000,000 $679,000,000 5,900 $209,000,000 $349,000,000 $33,000,000 $50,000,000
ND $17,000,000 $24,000,000 200 $8,000,000 $13,000,000 $1,000,000 $2,000,000
NE $34,000,000 $56,000,000 500 $18,000,000 $29,000,000 $3,000,000 $4,000,000
NH $19,000,000 $32,000,000 300 $11,000,000 $17,000,000 $2,000,000 $3,000,000
NJ $36,000,000 $60,000,000 500 $23,000,000 $36,000,000 $4,000,000 $6,000,000
NM $26,000,000 $40,000,000 400 $12,000,000 $19,000,000 $3,000,000 $3,000,000
NV $91,000,000 $146,000,000 1,200 $48,000,000 $81,000,000 $10,000,000 $12,000,000
NY $132,000,000 $219,000,000 1,700 $84,000,000 $128,000,000 $18,000,000 $20,000,000
OH $229,000,000 $405,000,000 3,600 $129,000,000 $220,000,000 $24,000,000 $30,000,000
OK $126,000,000 $209,000,000 1,900 $67,000,000 $110,000,000 $12,000,000 $16,000,000
OR $77,000,000 $133,000,000 1,300 $45,000,000 $68,000,000 $6,000,000 $10,000,000
PA $224,000,000 $400,000,000 3,500 $141,000,000 $218,000,000 $23,000,000 $33,000,000
RI $16,000,000 $22,000,000 200 $8,000,000 $13,000,000 $2,000,000 $2,000,000
SC $45,000,000 $71,000,000 700 $22,000,000 $37,000,000 $5,000,000 $5,000,000
SD $22,000,000 $35,000,000 300 $10,000,000 $17,000,000 $2,000,000 $2,000,000
TN $291,000,000 $501,000,000 4,400 $173,000,000 $278,000,000 $29,000,000 $40,000,000
TX $369,000,000 $677,000,000 5,400 $230,000,000 $378,000,000 $40,000,000 $57,000,000
UT $60,000,000 $107,000,000 900 $34,000,000 $56,000,000 $6,000,000 $8,000,000
VA $103,000,000 $171,000,000 1,500 $57,000,000 $95,000,000 $10,000,000 $14,000,000
VT $17,000,000 $27,000,000 200 $9,000,000 $14,000,000 $2,000,000 $2,000,000
WA $214,000,000 $357,000,000 2,900 $113,000,000 $197,000,000 $27,000,000 $30,000,000
WI $53,000,000 $89,000,000 800 $28,000,000 $46,000,000 $5,000,000 $7,000,000
WV $71,000,000 $106,000,000 1,100 $33,000,000 $53,000,000 $7,000,000 $7,000,000
WY $33,000,000 $47,000,000 400 $14,000,000 $24,000,000 $4,000,000 $4,000,000
US $4,882,000,000 $12,285,000,000 87,600 $3,982,000,000 $6,608,000,000 $700,000,000 $984,000,000

Economic Impact of Hunting and Shooting in 2020: Technical Report | 40
Southwick Associates | PO Box 6435 ■ Fernandina Beach, FL 32035 ■ Office (904) 277-9765
Table 10. Economic Contributions of Shotgun Target Shooting Activities, 2020
State Retail Sales Total Multiplier
Effect Jobs Salaries & Wages
GDP Contributions
State & Local Taxes
Federal Taxes
AK $26,000,000 $32,000,000 300 $12,000,000 $18,000,000 $2,000,000 $3,000,000
AL $35,000,000 $23,000,000 300 $8,000,000 $13,000,000 $1,000,000 $2,000,000
AR $88,000,000 $139,000,000 1,300 $42,000,000 $75,000,000 $9,000,000 $10,000,000
AZ $139,000,000 $251,000,000 2,100 $85,000,000 $136,000,000 $16,000,000 $20,000,000
CA $332,000,000 $613,000,000 4,700 $220,000,000 $353,000,000 $41,000,000 $54,000,000
CO $53,000,000 $97,000,000 800 $34,000,000 $54,000,000 $6,000,000 $8,000,000
CT $34,000,000 $55,000,000 400 $21,000,000 $34,000,000 $4,000,000 $6,000,000
DC $4,000,000 $5,000,000 0 $2,000,000 $3,000,000 $0 $0
DE $19,000,000 $26,000,000 300 $10,000,000 $15,000,000 $1,000,000 $2,000,000
FL $136,000,000 $251,000,000 2,100 $82,000,000 $134,000,000 $14,000,000 $21,000,000
GA $174,000,000 $309,000,000 2,700 $99,000,000 $167,000,000 $17,000,000 $24,000,000
HI $8,000,000 $13,000,000 100 $4,000,000 $7,000,000 $1,000,000 $1,000,000
IA $30,000,000 $49,000,000 500 $17,000,000 $24,000,000 $3,000,000 $4,000,000
ID $63,000,000 $103,000,000 1,000 $32,000,000 $49,000,000 $6,000,000 $7,000,000
IL $104,000,000 $183,000,000 1,500 $63,000,000 $105,000,000 $12,000,000 $16,000,000
IN $145,000,000 $236,000,000 2,200 $79,000,000 $126,000,000 $14,000,000 $18,000,000
KS $68,000,000 $112,000,000 1,000 $35,000,000 $57,000,000 $7,000,000 $8,000,000
KY $36,000,000 $57,000,000 500 $19,000,000 $30,000,000 $3,000,000 $4,000,000
LA $36,000,000 $57,000,000 500 $19,000,000 $32,000,000 $4,000,000 $4,000,000
MA $17,000,000 $30,000,000 200 $12,000,000 $17,000,000 $2,000,000 $3,000,000
MD $66,000,000 $107,000,000 900 $37,000,000 $61,000,000 $7,000,000 $9,000,000
ME $32,000,000 $51,000,000 500 $16,000,000 $27,000,000 $4,000,000 $4,000,000
MI $106,000,000 $179,000,000 1,600 $58,000,000 $96,000,000 $13,000,000 $14,000,000
MN $54,000,000 $96,000,000 800 $32,000,000 $54,000,000 $7,000,000 $8,000,000
MO $82,000,000 $143,000,000 1,300 $48,000,000 $76,000,000 $7,000,000 $11,000,000
MS $64,000,000 $99,000,000 1,000 $29,000,000 $49,000,000 $7,000,000 $7,000,000
MT $25,000,000 $41,000,000 400 $13,000,000 $20,000,000 $2,000,000 $3,000,000

Economic Impact of Hunting and Shooting in 2020: Technical Report | 41
Southwick Associates | PO Box 6435 ■ Fernandina Beach, FL 32035 ■ Office (904) 277-9765
Table 10 (continued). Economic Contributions of Shotgun Target Shooting Activities, 2020
State Retail Sales Total Multiplier
Effect Jobs Salaries & Wages
GDP Contributions
State & Local Taxes
Federal Taxes
NC $246,000,000 $424,000,000 3,900 $134,000,000 $221,000,000 $21,000,000 $32,000,000
ND $14,000,000 $20,000,000 200 $7,000,000 $11,000,000 $1,000,000 $2,000,000
NE $32,000,000 $53,000,000 500 $18,000,000 $28,000,000 $3,000,000 $4,000,000
NH $9,000,000 $15,000,000 100 $6,000,000 $8,000,000 $1,000,000 $1,000,000
NJ $23,000,000 $39,000,000 300 $15,000,000 $23,000,000 $3,000,000 $4,000,000
NM $35,000,000 $54,000,000 500 $16,000,000 $26,000,000 $4,000,000 $4,000,000
NV $103,000,000 $165,000,000 1,300 $54,000,000 $92,000,000 $12,000,000 $14,000,000
NY $171,000,000 $282,000,000 2,200 $109,000,000 $165,000,000 $24,000,000 $26,000,000
OH $140,000,000 $247,000,000 2,200 $79,000,000 $134,000,000 $15,000,000 $19,000,000
OK $112,000,000 $186,000,000 1,700 $60,000,000 $98,000,000 $10,000,000 $14,000,000
OR $58,000,000 $100,000,000 1,000 $33,000,000 $51,000,000 $5,000,000 $8,000,000
PA $128,000,000 $229,000,000 2,000 $81,000,000 $125,000,000 $13,000,000 $19,000,000
RI $6,000,000 $8,000,000 100 $3,000,000 $5,000,000 $1,000,000 $1,000,000
SC $32,000,000 $51,000,000 500 $16,000,000 $27,000,000 $3,000,000 $4,000,000
SD $14,000,000 $22,000,000 200 $7,000,000 $11,000,000 $1,000,000 $2,000,000
TN $264,000,000 $455,000,000 4,000 $157,000,000 $252,000,000 $26,000,000 $36,000,000
TX $278,000,000 $510,000,000 4,100 $174,000,000 $285,000,000 $30,000,000 $43,000,000
UT $62,000,000 $111,000,000 1,000 $35,000,000 $58,000,000 $6,000,000 $8,000,000
VA $88,000,000 $146,000,000 1,300 $49,000,000 $81,000,000 $9,000,000 $12,000,000
VT $11,000,000 $17,000,000 200 $6,000,000 $9,000,000 $1,000,000 $1,000,000
WA $67,000,000 $111,000,000 900 $35,000,000 $61,000,000 $9,000,000 $10,000,000
WI $57,000,000 $95,000,000 900 $30,000,000 $49,000,000 $6,000,000 $7,000,000
WV $49,000,000 $73,000,000 700 $23,000,000 $36,000,000 $5,000,000 $5,000,000
WY $27,000,000 $38,000,000 400 $11,000,000 $19,000,000 $3,000,000 $3,000,000
US $3,999,000,000 $10,065,000,000 71,800 $3,262,000,000 $5,414,000,000 $574,000,000 $806,000,000

Economic Impact of Hunting and Shooting in 2020: Technical Report | 42
Southwick Associates | PO Box 6435 ■ Fernandina Beach, FL 32035 ■ Office (904) 277-9765
Table 11. Economic Contributions of Muzzleloader Target Shooting Activities, 20202
State Retail Sales Total Multiplier
Effect Jobs Salaries & Wages
GDP Contributions
State & Local Taxes
Federal Taxes
AK $4,000,000 $2,000,000 0 $1,000,000 $1,000,000 $0 $0 AL $34,000,000 $54,000,000 500 $17,000,000 $29,000,000 $3,000,000 $4,000,000 AR $21,000,000 $34,000,000 300 $10,000,000 $18,000,000 $2,000,000 $3,000,000 AZ $7,000,000 $13,000,000 100 $4,000,000 $7,000,000 $1,000,000 $1,000,000 CA $18,000,000 $34,000,000 300 $12,000,000 $20,000,000 $2,000,000 $3,000,000 CO $14,000,000 $27,000,000 200 $9,000,000 $15,000,000 $2,000,000 $2,000,000 CT $3,000,000 $5,000,000 0 $2,000,000 $3,000,000 $0 $0 DC $1,000,000 $1,000,000 0 $1,000,000 $1,000,000 $0 $0 DE $7,000,000 $9,000,000 100 $4,000,000 $6,000,000 $1,000,000 $1,000,000 FL $37,000,000 $69,000,000 600 $22,000,000 $37,000,000 $4,000,000 $6,000,000 GA $14,000,000 $25,000,000 200 $8,000,000 $14,000,000 $1,000,000 $2,000,000 HI -- -- -- -- -- -- -- IA $12,000,000 $20,000,000 200 $7,000,000 $10,000,000 $1,000,000 $1,000,000 ID $9,000,000 $14,000,000 100 $4,000,000 $7,000,000 $1,000,000 $1,000,000 IL $21,000,000 $37,000,000 300 $13,000,000 $21,000,000 $2,000,000 $3,000,000 IN $24,000,000 $39,000,000 400 $13,000,000 $21,000,000 $2,000,000 $3,000,000 KS $12,000,000 $20,000,000 200 $6,000,000 $10,000,000 $1,000,000 $1,000,000 KY $5,000,000 $8,000,000 100 $3,000,000 $4,000,000 $0 $1,000,000 LA $13,000,000 $21,000,000 200 $7,000,000 $11,000,000 $1,000,000 $2,000,000 MA $8,000,000 $14,000,000 100 $6,000,000 $8,000,000 $1,000,000 $1,000,000 MD $23,000,000 $37,000,000 300 $13,000,000 $21,000,000 $3,000,000 $3,000,000 ME $7,000,000 $11,000,000 100 $4,000,000 $6,000,000 $1,000,000 $1,000,000 MI $28,000,000 $48,000,000 400 $15,000,000 $26,000,000 $3,000,000 $4,000,000 MN $15,000,000 $27,000,000 200 $9,000,000 $15,000,000 $2,000,000 $2,000,000
MO $21,000,000 $36,000,000 300 $12,000,000 $19,000,000 $2,000,000 $3,000,000
MS $8,000,000 $11,000,000 100 $3,000,000 $6,000,000 $1,000,000 $1,000,000
2 State-level muzzleloader results rely on small sample sizes and should be viewed with caution. Estimates of 0 reflect rounded results and may not imply zero economic effect.

Economic Impact of Hunting and Shooting in 2020: Technical Report | 43
Southwick Associates | PO Box 6435 ■ Fernandina Beach, FL 32035 ■ Office (904) 277-9765
Table 11 (continued). Economic Contributions of Muzzleloader Target Shooting Activities, 2020
State Retail Sales Total Multiplier
Effect Jobs Salaries & Wages
GDP Contributions
State & Local Taxes
Federal Taxes
MT $4,000,000 $7,000,000 100 $2,000,000 $3,000,000 $0 $1,000,000
NC $44,000,000 $76,000,000 700 $24,000,000 $40,000,000 $4,000,000 $6,000,000
ND $3,000,000 $4,000,000 0 $1,000,000 $2,000,000 $0 $0
NE $4,000,000 $7,000,000 100 $2,000,000 $4,000,000 $0 $1,000,000
NH $1,000,000 $2,000,000 0 $1,000,000 $1,000,000 $0 $0
NJ $15,000,000 $26,000,000 200 $10,000,000 $15,000,000 $2,000,000 $2,000,000
NM $8,000,000 $12,000,000 100 $4,000,000 $6,000,000 $1,000,000 $1,000,000
NV $10,000,000 $16,000,000 100 $5,000,000 $9,000,000 $1,000,000 $1,000,000
NY $10,000,000 $16,000,000 100 $6,000,000 $9,000,000 $1,000,000 $1,000,000
OH $11,000,000 $20,000,000 200 $6,000,000 $11,000,000 $1,000,000 $1,000,000
OK $12,000,000 $19,000,000 200 $6,000,000 $10,000,000 $1,000,000 $1,000,000
OR $6,000,000 $10,000,000 100 $3,000,000 $5,000,000 $0 $1,000,000
PA $30,000,000 $53,000,000 500 $19,000,000 $29,000,000 $3,000,000 $4,000,000
RI $4,000,000 $5,000,000 100 $2,000,000 $3,000,000 $0 $0
SC $12,000,000 $19,000,000 200 $6,000,000 $10,000,000 $1,000,000 $1,000,000
SD $6,000,000 $10,000,000 100 $3,000,000 $5,000,000 $0 $1,000,000
TN $24,000,000 $41,000,000 400 $14,000,000 $23,000,000 $2,000,000 $3,000,000
TX $20,000,000 $37,000,000 300 $13,000,000 $20,000,000 $2,000,000 $3,000,000
UT $3,000,000 $6,000,000 0 $2,000,000 $3,000,000 $0 $0
VA $14,000,000 $23,000,000 200 $8,000,000 $13,000,000 $1,000,000 $2,000,000
VT $9,000,000 $14,000,000 100 $5,000,000 $8,000,000 $1,000,000 $1,000,000
WA $10,000,000 $16,000,000 100 $5,000,000 $9,000,000 $1,000,000 $1,000,000
WI $7,000,000 $12,000,000 100 $4,000,000 $6,000,000 $1,000,000 $1,000,000
WV $15,000,000 $23,000,000 200 $7,000,000 $11,000,000 $2,000,000 $2,000,000
WY $1,000,000 $2,000,000 0 $1,000,000 $1,000,000 $0 $0
US $650,000,000 $1,612,000,000 11,500 $523,000,000 $866,000,000 $92,000,000 $129,000,000

Economic Impact of Hunting and Shooting in 2020: Technical Report | 44
Southwick Associates | PO Box 6435 ■ Fernandina Beach, FL 32035 ■ Office (904) 277-9765
Table 12. Statewide Economic Contributions of Target Shooting by Congressional District, 2020
District Participants Retail Sales Total Multiplier
Effect Jobs
Salaries & Wages
GDP Contributions
State & Local Taxes
Federal Taxes
Alabama
1 Jerry L Carl 59,813 $38,388,351 $60,932,145 572 $19,255,398 $32,462,955 $3,557,668 $4,538,400
2 Barry Moore 58,018 $37,236,374 $59,103,662 555 $18,677,572 $31,488,790 $3,450,907 $4,402,209
3 Mike Rogers 61,046 $39,179,786 $62,188,354 584 $19,652,377 $33,132,228 $3,631,014 $4,631,966
4 Robert B. Aderholt 62,980 $40,420,956 $64,158,410 602 $20,274,942 $34,181,819 $3,746,041 $4,778,701
5 Mo Brooks 62,056 $39,828,008 $63,217,250 593 $19,977,522 $33,680,395 $3,691,089 $4,708,601
6 Gary J. Palmer 57,607 $36,972,562 $58,684,925 551 $18,545,245 $31,265,699 $3,426,458 $4,371,021
7 Terri A. Sewell 50,081 $32,142,298 $51,018,059 479 $16,122,410 $27,181,005 $2,978,810 $3,799,971
Alaska
Don Young 126,600 $106,480,547 $134,230,329 1,364 $47,619,562 $76,502,760 $7,006,612 $12,695,596
Arizona
1 Tom O'Halleran 53,466 $55,730,617 $100,547,732 854 $33,897,122 $54,343,788 $6,264,158 $7,864,560
2 Ann Kirkpatrick 48,568 $50,624,365 $91,335,164 776 $30,791,338 $49,364,602 $5,690,212 $7,143,979
3 Raúl M. Grijalva 42,222 $44,009,830 $79,401,391 674 $26,768,169 $42,914,666 $4,946,734 $6,210,553
4 Paul A. Gosar 65,726 $68,509,730 $123,603,476 1,050 $41,669,782 $66,804,899 $7,700,539 $9,667,916
5 Andy Biggs 57,201 $59,623,503 $107,571,175 914 $36,264,898 $58,139,801 $6,701,721 $8,413,914
6 David Schweikert 48,863 $50,932,762 $91,891,566 780 $30,978,915 $49,665,325 $5,724,876 $7,187,500
7 Ruben Gallego 31,474 $32,806,408 $59,188,470 503 $19,953,894 $31,990,037 $3,687,462 $4,629,555
8 Debbie Lesko 52,006 $54,208,853 $97,802,204 831 $32,971,537 $52,859,892 $6,093,111 $7,649,813
9 Greg Stanton 48,273 $50,317,652 $90,781,801 771 $30,604,786 $49,065,522 $5,655,738 $7,100,697
Arkansas
1 Eric A. “Rick” Crawford 65,095 $60,931,224 $95,869,492 906 $28,744,032 $51,522,114 $6,219,026 $7,181,007
2 J. French Hill 59,287 $55,495,219 $87,316,455 825 $26,179,621 $46,925,547 $5,664,193 $6,540,351
3 Steve Womack 68,756 $64,358,708 $101,262,313 957 $30,360,933 $54,420,320 $6,568,857 $7,584,951
4 Bruce Westerman 65,462 $61,275,437 $96,411,078 911 $28,906,413 $51,813,173 $6,254,159 $7,221,574

Economic Impact of Hunting and Shooting in 2020: Technical Report | 45
Southwick Associates | PO Box 6435 ■ Fernandina Beach, FL 32035 ■ Office (904) 277-9765
Table 12 (continued). Statewide Economic Contributions of Target Shootingby Congressional District, 2020
District Participants Retail Sales Total Multiplier
Effect Jobs
Salaries & Wages
GDP Contributions
State & Local Taxes
Federal Taxes
California
1 Doug LaMalfa 41,707 $33,390,839 $61,745,406 469 $22,136,003 $35,562,433 $4,163,383 $5,444,845
2 Jared Huffman 35,133 $28,127,438 $52,012,473 395 $18,646,703 $29,956,724 $3,507,109 $4,586,574
3 John Garamendi 36,281 $29,046,978 $53,712,860 408 $19,256,299 $30,936,067 $3,621,763 $4,736,517
4 Tom McClintock 43,644 $34,941,512 $64,612,868 491 $23,164,001 $37,213,956 $4,356,731 $5,697,704
5 Mike Thompson 30,991 $24,811,762 $45,881,218 348 $16,448,621 $26,425,412 $3,093,689 $4,045,906
6 Doris O. Matsui 31,021 $24,835,467 $45,925,052 349 $16,464,336 $26,450,658 $3,096,645 $4,049,771
7 Ami Bera 36,502 $29,223,774 $54,039,787 410 $19,373,504 $31,124,361 $3,643,807 $4,765,347
8 Jay Obernolte 34,543 $27,655,322 $51,139,449 388 $18,333,720 $29,453,904 $3,448,242 $4,509,588
9 Jerry McNerney 32,200 $25,779,699 $47,671,099 362 $17,090,301 $27,456,298 $3,214,377 $4,203,742
10 Josh Harder 32,952 $26,381,202 $48,783,382 371 $17,489,060 $28,096,921 $3,289,377 $4,301,825
11 Mark DeSaulnier 26,437 $21,165,211 $39,138,116 297 $14,031,189 $22,541,704 $2,639,014 $3,451,285
12 Nancy Pelosi 30,616 $24,511,505 $45,325,990 344 $16,249,569 $26,105,626 $3,056,251 $3,996,945
13 Barbara Lee 29,242 $23,411,218 $43,291,370 329 $15,520,149 $24,933,782 $2,919,060 $3,817,528
14 Jackie Speier 27,161 $21,744,985 $40,210,219 305 $14,415,542 $23,159,184 $2,711,304 $3,545,825
15 Eric Swalwell 29,607 $23,703,574 $43,831,987 333 $15,713,963 $25,245,151 $2,955,513 $3,865,200
16 Jim Costa 25,182 $20,160,730 $37,280,659 283 $13,365,282 $21,471,896 $2,513,769 $3,287,490
17 Ro Khanna 33,528 $26,842,453 $49,636,315 377 $17,794,840 $28,588,170 $3,346,888 $4,377,039
18 Anna G. Eshoo 26,805 $21,460,530 $39,684,213 301 $14,226,967 $22,856,230 $2,675,836 $3,499,441
19 Zoe Lofgren 26,617 $21,309,413 $39,404,772 299 $14,126,786 $22,695,285 $2,656,994 $3,474,799
20 Jimmy Panetta 26,374 $21,114,839 $39,044,970 297 $13,997,795 $22,488,056 $2,632,733 $3,443,071
21 David G Valadao 22,073 $17,671,751 $32,678,108 248 $11,715,247 $18,821,045 $2,203,427 $2,881,627
22 Devin Nunes 32,887 $26,329,842 $48,688,409 370 $17,455,011 $28,042,220 $3,282,973 $4,293,450
23 Kevin McCarthy 33,002 $26,421,697 $48,858,265 371 $17,515,905 $28,140,049 $3,294,426 $4,308,429
24 Salud O. Carbajal 33,790 $27,052,831 $50,025,340 380 $17,934,307 $28,812,230 $3,373,120 $4,411,344

Economic Impact of Hunting and Shooting in 2020: Technical Report | 46
Southwick Associates | PO Box 6435 ■ Fernandina Beach, FL 32035 ■ Office (904) 277-9765
Table 12 (continued). Statewide Economic Contributions of Recreational Hunting by Congressional District, 2020
District Participants Retail Sales Total Multiplier
Effect Jobs
Salaries & Wages
GDP Contributions
State & Local Taxes
Federal Taxes
California
25 Mike Garcia 27,937 $22,366,242 $41,359,030 314 $14,827,396 $23,820,845 $2,788,766 $3,647,130
26 Julia Brownley 26,008 $20,822,482 $38,504,353 292 $13,803,982 $22,176,686 $2,596,280 $3,395,398
27 Judy Chu 26,480 $21,199,780 $39,202,041 298 $14,054,106 $22,578,521 $2,643,324 $3,456,922
28 Adam B. Schiff 30,683 $24,564,840 $45,424,616 345 $16,284,927 $26,162,430 $3,062,901 $4,005,642
29 Tony Cárdenas 20,812 $16,662,332 $30,811,518 234 $11,046,067 $17,745,977 $2,077,566 $2,717,027
30 Brad Sherman 27,204 $21,779,554 $40,274,143 306 $14,438,460 $23,196,001 $2,715,614 $3,551,462
31 Pete Aguilar 27,914 $22,348,463 $41,326,154 314 $14,815,610 $23,801,910 $2,786,549 $3,644,231
32 Grace F. Napolitano 19,648 $15,729,952 $29,087,388 221 $10,427,958 $16,752,960 $1,961,311 $2,564,989
33 Ted Lieu 27,109 $21,703,502 $40,133,509 305 $14,388,042 $23,115,003 $2,706,131 $3,539,061
34 Jimmy Gomez 25,875 $20,715,812 $38,307,100 291 $13,733,266 $22,063,078 $2,582,980 $3,378,004
35 Norma J. Torres 22,421 $17,950,279 $33,193,155 252 $11,899,894 $19,117,688 $2,238,155 $2,927,045
36 Raul Ruiz 34,317 $27,474,575 $50,805,217 386 $18,213,896 $29,261,402 $3,425,705 $4,480,115
37 Karen Bass 27,042 $21,650,167 $40,034,883 304 $14,352,684 $23,058,199 $2,699,481 $3,530,364
38 Linda T. Sánchez 20,289 $16,243,551 $30,037,121 228 $10,768,442 $17,299,961 $2,025,350 $2,648,739
39 Young Kim 27,813 $22,267,473 $41,176,389 313 $14,761,919 $23,715,652 $2,776,451 $3,631,024
40 Lucille Roybal-Allard 18,527 $14,833,130 $27,429,009 208 $9,833,422 $15,797,812 $1,849,489 $2,418,750
41 Mark Takano 26,354 $21,099,035 $39,015,747 296 $13,987,319 $22,471,225 $2,630,762 $3,440,494
42 Ken Calvert 37,104 $29,705,767 $54,931,074 417 $19,693,035 $31,637,701 $3,703,905 $4,843,942
43 Maxine Waters 22,219 $17,788,298 $32,893,624 250 $11,792,511 $18,945,172 $2,217,959 $2,900,632
44 Nanette Diaz Barragan
18,666 $14,943,751 $27,633,567 210 $9,906,757 $15,915,627 $1,863,282 $2,436,788
45 Katie Porter 36,511 $29,230,688 $54,052,572 411 $19,378,088 $31,131,725 $3,644,669 $4,766,474
46 J. Luis Correa 20,166 $16,144,782 $29,854,480 227 $10,702,964 $17,194,768 $2,013,035 $2,632,633
47 Alan S. Lowenthal 24,296 $19,451,568 $35,969,297 273 $12,895,153 $20,716,614 $2,425,346 $3,171,851
48 Michelle Steel 29,185 $23,365,784 $43,207,356 328 $15,490,029 $24,885,393 $2,913,395 $3,810,119

Economic Impact of Hunting and Shooting in 2020: Technical Report | 47
Southwick Associates | PO Box 6435 ■ Fernandina Beach, FL 32035 ■ Office (904) 277-9765
Table 12 (continued). Statewide Economic Contributions of Recreational Hunting by Congressional District, 2020
District Participants Retail Sales Total Multiplier
Effect Jobs
Salaries & Wages
GDP Contributions
State & Local Taxes
Federal Taxes
California
49 Mike Levin 30,944 $24,774,230 $45,811,815 348 $16,423,740 $26,385,438 $3,089,009 $4,039,786
50 Darrell Issa 32,067 $25,673,028 $47,473,847 361 $17,019,585 $27,342,690 $3,201,077 $4,186,348
51 Juan Vargas 23,103 $18,496,472 $34,203,160 260 $12,261,985 $19,699,402 $2,306,258 $3,016,109
52 Scott H. Peters 37,109 $29,709,718 $54,938,380 417 $19,695,654 $31,641,908 $3,704,397 $4,844,586
53 Sara Jacobs 32,102 $25,700,684 $47,524,986 361 $17,037,919 $27,372,144 $3,204,525 $4,190,857
Colorado
1 Diana DeGette 43,692 $28,358,890 $52,097,613 423 $18,093,765 $29,217,057 $3,179,698 $4,437,250
2 Joe Neguse 48,277 $31,334,873 $57,564,740 467 $19,992,526 $32,283,096 $3,513,376 $4,902,895
3 Lauren Boebert 49,006 $31,808,201 $58,434,282 475 $20,294,523 $32,770,748 $3,566,447 $4,976,956
4 Ken Buck 52,244 $33,910,069 $62,295,586 506 $21,635,573 $34,936,220 $3,802,116 $5,305,830
5 Doug Lamborn 47,392 $30,760,894 $56,510,294 459 $19,626,312 $31,691,748 $3,449,019 $4,813,086
6 Jason A. Crow 42,362 $27,495,655 $50,511,780 410 $17,542,997 $28,327,700 $3,082,909 $4,302,182
7 Ed Perlmutter 41,628 $27,019,607 $49,637,240 403 $17,239,265 $27,837,245 $3,029,533 $4,227,695
Connecticut
1 John B. Larson 34,630 $18,297,075 $29,916,514 235 $11,241,464 $18,254,178 $2,326,080 $3,000,719
2 Joe Courtney 39,426 $20,831,044 $34,059,663 268 $12,798,299 $20,782,206 $2,648,219 $3,416,290
3 Rosa L. DeLauro 35,097 $18,544,172 $30,320,528 239 $11,393,277 $18,500,696 $2,357,493 $3,041,243
4 James A. Himes 28,015 $14,802,018 $24,201,943 190 $9,094,150 $14,767,315 $1,881,758 $2,427,530
5 Jahana Hayes 33,832 $17,875,681 $29,227,515 230 $10,982,565 $17,833,771 $2,272,508 $2,931,611
Delaware Lisa Blunt Rochester 60,200 $49,539,919 $66,779,189 653 $25,062,784 $39,310,538 $3,596,389 $5,459,470
Florida
1 Matt Gaetz 47,021 $28,003,328 $51,898,290 438 $16,945,506 $27,598,964 $2,915,276 $4,346,377
2 Neil P. Dunn 47,071 $28,032,880 $51,953,058 439 $16,963,389 $27,628,088 $2,918,352 $4,350,963

Economic Impact of Hunting and Shooting in 2020: Technical Report | 48
Southwick Associates | PO Box 6435 ■ Fernandina Beach, FL 32035 ■ Office (904) 277-9765
Table 12 (continued). Statewide Economic Contributions of Recreational Hunting by Congressional District, 2020
District Participants Retail Sales Total Multiplier
Effect Jobs
Salaries & Wages
GDP Contributions
State & Local Taxes
Federal Taxes
Florida
3 Kat Cammack 47,952 $28,557,419 $52,925,181 447 $17,280,800 $28,145,053 $2,972,959 $4,432,377
4 John H. Rutherford 49,912 $29,724,703 $55,088,497 465 $17,987,153 $29,295,482 $3,094,479 $4,613,550
5 Al Lawson 39,110 $23,291,506 $43,165,917 364 $14,094,266 $22,955,179 $2,424,754 $3,615,058
6 Mike Waltz 49,957 $29,751,792 $55,138,700 465 $18,003,545 $29,322,180 $3,097,299 $4,617,754
7 Stephanie N. Murphy 42,557 $25,344,514 $46,970,737 396 $15,336,592 $24,978,543 $2,638,481 $3,933,704
8 Bill Posey 48,011 $28,592,717 $52,990,597 447 $17,302,160 $28,179,841 $2,976,634 $4,437,855
9 Darren Soto 48,499 $28,883,306 $53,529,145 452 $17,478,003 $28,466,235 $3,006,886 $4,482,957
10 Val Butler Demings 44,455 $26,474,859 $49,065,593 414 $16,020,592 $26,092,565 $2,756,155 $4,109,144
11 Daniel Webster 52,287 $31,139,071 $57,709,730 487 $18,843,022 $30,689,426 $3,241,721 $4,833,073
12 Gus M. Bilirakis 49,341 $29,384,861 $54,458,671 460 $17,781,506 $28,960,547 $3,059,100 $4,560,803
13 Charlie Crist 40,153 $23,912,908 $44,317,556 374 $14,470,292 $23,567,609 $2,489,444 $3,711,505
14 Kathy Castor 40,638 $24,201,856 $44,853,060 379 $14,645,142 $23,852,384 $2,519,525 $3,756,353
15 Scott Franklin 45,741 $27,240,736 $50,484,984 426 $16,484,043 $26,847,382 $2,835,887 $4,228,015
16 Vern Buchanan 51,118 $30,442,969 $56,419,651 476 $18,421,793 $30,003,376 $3,169,254 $4,725,031
17 W. Gregory Steube 50,560 $30,110,514 $55,803,517 471 $18,220,617 $29,675,722 $3,134,644 $4,673,431
18 Brian J. Mast 44,040 $26,227,776 $48,607,676 410 $15,871,076 $25,849,050 $2,730,433 $4,070,794
19 Byron Donals 49,729 $29,615,527 $54,886,161 463 $17,921,088 $29,187,882 $3,083,113 $4,596,605
20 VACANT 32,163 $19,154,296 $35,498,467 300 $11,590,738 $18,877,710 $1,994,051 $2,972,925
21 Lois Frankel 39,483 $23,513,963 $43,578,194 368 $14,228,881 $23,174,424 $2,447,912 $3,649,585
22 Theodore E. Deutch 38,633 $23,007,483 $42,639,540 360 $13,922,397 $22,675,258 $2,395,185 $3,570,975
23 Debbie Wasserman Schultz
38,391 $22,863,830 $42,373,309 358 $13,835,469 $22,533,679 $2,380,230 $3,548,679
24 Frederica S. Wilson 28,976 $17,256,433 $31,981,177 270 $10,442,295 $17,007,252 $1,796,475 $2,678,359
25 Mario Diaz-Balart 35,577 $21,187,604 $39,266,775 331 $12,821,143 $20,881,657 $2,205,728 $3,288,513
26 Carlos A. Gimenez 35,279 $21,010,295 $38,938,170 329 $12,713,849 $20,706,908 $2,187,269 $3,260,993

Economic Impact of Hunting and Shooting in 2020: Technical Report | 49
Southwick Associates | PO Box 6435 ■ Fernandina Beach, FL 32035 ■ Office (904) 277-9765
Table 12 (continued). Statewide Economic Contributions of Recreational Hunting by Congressional District, 2020
District Participants Retail Sales Total Multiplier
Effect Jobs
Salaries & Wages
GDP Contributions
State & Local Taxes
Federal Taxes
Florida
27 Maria Elvira Salazar 32,747 $19,502,347 $36,143,506 305 $11,801,353 $19,220,736 $2,030,285 $3,026,945
Georgia
1 Buddy Carter 54,491 $42,576,634 $75,691,048 660 $24,228,025 $40,892,493 $4,069,968 $5,825,574
2 Sanford D. Bishop Jr. 47,130 $36,825,156 $65,466,299 571 $20,955,175 $35,368,518 $3,520,175 $5,038,624
3 A. Drew Ferguson IV 58,539 $45,739,233 $81,313,391 709 $26,027,687 $43,929,993 $4,372,286 $6,258,298
4 Henry C. “Hank” Johnson Jr.
47,017 $36,736,672 $65,308,995 570 $20,904,823 $35,283,533 $3,511,717 $5,026,517
5 Nikema Williams 50,676 $39,595,285 $70,390,924 614 $22,531,503 $38,029,072 $3,784,977 $5,417,649
6 Lucy McBath 51,616 $40,330,275 $71,697,560 626 $22,949,745 $38,734,990 $3,855,235 $5,518,214
7 Carolyn Bourdeaux 56,170 $43,888,199 $78,022,696 681 $24,974,365 $42,152,178 $4,195,343 $6,005,029
8 Austin Scott 54,464 $42,555,227 $75,652,990 660 $24,215,843 $40,871,932 $4,067,922 $5,822,644
9 Andrew S. Clyde 65,973 $51,547,798 $91,639,626 800 $29,333,022 $49,508,797 $4,927,536 $7,053,058
10 Jody B. Hice 61,370 $47,951,340 $85,245,986 744 $27,286,475 $46,054,599 $4,583,745 $6,560,971
11 Barry Loudermilk 57,392 $44,842,973 $79,720,055 696 $25,517,674 $43,069,185 $4,286,611 $6,135,667
12 Rick W. Allen 54,709 $42,746,467 $75,992,970 663 $24,324,667 $41,055,607 $4,086,203 $5,848,811
13 David Scott 51,635 $40,344,547 $71,722,932 626 $22,957,867 $38,748,697 $3,856,600 $5,520,167
14 Marjorie Taylor Greene
54,619 $42,676,536 $75,868,649 662 $24,284,873 $40,988,442 $4,079,518 $5,839,243
Hawaii
1 Ed Case 13,087 $8,585,515 $13,724,798 112 $4,518,500 $7,345,687 $1,028,169 $1,035,799
2 Kaiali'i Kahele 14,713 $9,652,789 $15,430,941 126 $5,080,200 $8,258,836 $1,155,982 $1,164,560
Idaho
1 Russ Fulcher 134,441 $146,083,585 $236,773,512 2,420 $74,079,848 $111,879,810 $13,141,272 $16,469,775 2 Michael K. Simpson 115,759 $125,784,319 $203,872,290 2,084 $63,785,971 $96,333,382 $11,315,206 $14,181,192
Illinois
1 Bobby L. Rush 20,611 $13,819,034 $24,473,841 196 $8,403,387 $13,976,243 $1,568,207 $2,099,544

Economic Impact of Hunting and Shooting in 2020: Technical Report | 50
Southwick Associates | PO Box 6435 ■ Fernandina Beach, FL 32035 ■ Office (904) 277-9765
Table 12 (continued). Statewide Economic Contributions of Recreational Hunting by Congressional District, 2020
District Participants Retail Sales Total Multiplier
Effect Jobs
Salaries & Wages
GDP Contributions
State & Local Taxes
Federal Taxes
Illinois
2 Robin L. Kelly 19,672 $13,189,438 $23,358,812 187 $8,020,528 $13,339,486 $1,496,759 $2,003,889
3 Marie Newman 20,830 $13,965,796 $24,733,759 198 $8,492,633 $14,124,675 $1,584,861 $2,121,842
4 Jesús "Chuy" Garcia 16,229 $10,881,333 $19,271,102 155 $6,616,964 $11,005,122 $1,234,831 $1,653,215
5 Mike Quigley 21,667 $14,527,560 $25,728,658 206 $8,834,243 $14,692,830 $1,648,611 $2,207,191
6 Sean Casten 23,977 $16,075,958 $28,470,907 228 $9,775,828 $16,258,843 $1,824,326 $2,442,441
7 Danny K. Davis 22,242 $14,912,964 $26,411,217 212 $9,068,608 $15,082,618 $1,692,348 $2,265,746
8 Raja Krishnamoorthi 21,685 $14,539,276 $25,749,407 207 $8,841,368 $14,704,680 $1,649,941 $2,208,971
9 Janice D. Schakowsky 22,574 $15,135,573 $26,805,463 215 $9,203,977 $15,307,760 $1,717,610 $2,299,568
10 Bradley Scott Schneider
21,693 $14,544,826 $25,759,236 207 $8,844,743 $14,710,292 $1,650,571 $2,209,815
11 Bill Foster 23,154 $15,524,060 $27,493,483 221 $9,440,217 $15,700,666 $1,761,696 $2,358,591
12 Mike Bost 26,824 $17,985,093 $31,852,032 256 $10,936,777 $18,189,697 $2,040,978 $2,732,499
13 Rodney Davis 28,588 $19,167,820 $33,946,670 272 $11,655,996 $19,385,879 $2,175,196 $2,912,192
14 Lauren Underwood 27,167 $18,215,102 $32,259,384 259 $11,076,646 $18,422,323 $2,067,080 $2,767,445
15 Mary E. Miller 31,180 $20,905,528 $37,024,193 297 $12,712,701 $21,143,356 $2,372,394 $3,176,204
16 Adam Kinzinger 29,110 $19,517,458 $34,565,888 277 $11,868,612 $19,739,495 $2,214,873 $2,965,313
17 Cheri Bustos 26,798 $17,967,211 $31,820,362 255 $10,925,903 $18,171,611 $2,038,948 $2,729,782
18 Darin LaHood 29,799 $19,979,326 $35,383,866 284 $12,149,475 $20,206,617 $2,267,287 $3,035,485
Indiana
1 Frank J. Mrvan 44,231 $48,583,394 $78,944,292 749 $26,353,473 $42,035,900 $4,772,975 $5,924,367
2 Jackie Walorski 48,008 $52,732,623 $85,686,472 813 $28,604,172 $45,625,946 $5,180,607 $6,430,333
3 Jim Banks 50,144 $55,079,319 $89,499,672 849 $29,877,109 $47,656,381 $5,411,153 $6,716,494
4 James R. Baird 54,374 $59,725,095 $97,048,702 920 $32,397,154 $51,676,055 $5,867,568 $7,283,011
5 Victoria Spartz 49,824 $54,727,314 $88,927,692 843 $29,686,168 $47,351,816 $5,376,572 $6,673,570
6 Greg Pence 52,883 $58,087,510 $94,387,752 895 $31,508,866 $50,259,164 $5,706,687 $7,083,320

Economic Impact of Hunting and Shooting in 2020: Technical Report | 51
Southwick Associates | PO Box 6435 ■ Fernandina Beach, FL 32035 ■ Office (904) 277-9765
Table 12 (continued). Statewide Economic Contributions of Recreational Hunting by Congressional District, 2020
District Participants Retail Sales Total Multiplier
Effect Jobs
Salaries & Wages
GDP Contributions
State & Local Taxes
Federal Taxes
Indiana
7 André Carson 40,294 $44,259,013 $71,917,504 682 $24,007,765 $38,294,308 $4,348,135 $5,397,042
8 Larry Bucshon 52,077 $57,201,547 $92,948,131 882 $31,028,286 $49,492,601 $5,619,647 $6,975,284
9 Trey Hollingsworth 53,566 $58,837,432 $95,606,318 907 $31,915,652 $50,908,021 $5,780,362 $7,174,767
Iowa
1 Ashley Hinson 69,268 $32,110,442 $51,844,234 499 $17,561,217 $25,471,651 $3,190,907 $3,697,639
2 Mariannette Miller-Meeks
68,909 $31,943,877 $51,575,307 496 $17,470,123 $25,339,524 $3,174,355 $3,678,458
3 Cindy Axne 66,805 $30,968,783 $50,000,959 481 $16,936,844 $24,566,029 $3,077,457 $3,566,173
4 Randy Feenstra 76,817 $35,610,023 $57,494,519 553 $19,475,140 $28,247,699 $3,538,671 $4,100,629
Kansas
1 Tracey Mann 75,106 $69,411,656 $114,040,283 1,056 $35,369,034 $58,059,292 $6,914,427 $8,471,524
2 Jake LaTurner 69,612 $64,334,078 $105,698,047 979 $32,781,731 $53,812,158 $6,408,625 $7,851,818
3 Sharice Davids 60,297 $55,725,451 $91,554,454 848 $28,395,164 $46,611,483 $5,551,079 $6,801,156
4 Ron Estes 62,784 $58,023,928 $95,330,748 883 $29,566,364 $48,534,041 $5,780,041 $7,081,679
Kentuckey
1 James Comer 50,376 $32,324,553 $51,427,211 485 $16,679,507 $27,386,651 $3,001,531 $3,800,721
2 Brett Guthrie 52,461 $33,662,256 $53,555,449 505 $17,369,764 $28,520,007 $3,125,745 $3,958,008
3 John A. Yarmuth 39,598 $25,408,859 $40,424,589 381 $13,111,001 $21,527,400 $2,359,367 $2,987,574
4 Thomas Massie 46,779 $30,016,192 $47,754,692 450 $15,488,390 $25,430,916 $2,787,186 $3,529,304
5 Harold Rogers 49,583 $31,815,756 $50,617,733 477 $16,416,967 $26,955,578 $2,954,286 $3,740,897
6 Andy Barr 47,803 $30,673,310 $48,800,143 460 $15,827,464 $25,987,653 $2,848,203 $3,606,568
Louisiana
1 Steve Scalise 59,549 $42,253,559 $67,289,151 616 $22,134,099 $37,341,727 $4,335,405 $5,140,774
2 Troy Carter 46,817 $33,219,704 $52,902,660 484 $17,401,806 $29,358,027 $3,408,491 $4,041,671
3 Clay Higgins 56,410 $40,026,454 $63,742,467 583 $20,967,453 $35,373,515 $4,106,894 $4,869,814

Economic Impact of Hunting and Shooting in 2020: Technical Report | 52
Southwick Associates | PO Box 6435 ■ Fernandina Beach, FL 32035 ■ Office (904) 277-9765
Table 12 (continued). Statewide Economic Contributions of Recreational Hunting by Congressional District, 2020
District Participants Retail Sales Total Multiplier
Effect Jobs
Salaries & Wages
GDP Contributions
State & Local Taxes
Federal Taxes
Louisiana
4 Mike Johnson 54,053 $38,353,565 $61,078,378 559 $20,091,127 $33,895,094 $3,935,248 $4,666,282
5 Julia Letlow 55,629 $39,472,238 $62,859,873 575 $20,677,132 $34,883,724 $4,050,029 $4,802,385
6 Garret Graves 58,342 $41,397,276 $65,925,512 603 $21,685,544 $36,584,983 $4,247,546 $5,036,594
Maine
1 Chellie Pingree 75,685 $58,016,799 $94,342,071 904 $29,384,974 $49,498,800 $6,504,506 $6,879,156
2 Jared Golden 77,115 $59,112,590 $96,123,955 921 $29,939,983 $50,433,708 $6,627,360 $7,009,086
Maryland
1 Andy Harris 38,132 $26,539,755 $43,305,823 354 $15,146,200 $24,650,952 $3,008,862 $3,658,371
2 C. A. Dutch Ruppersberger
33,170 $23,086,203 $37,670,544 308 $13,175,263 $21,443,185 $2,617,327 $3,182,317
3 John P. Sarbanes 31,555 $21,962,422 $35,836,832 293 $12,533,922 $20,399,382 $2,489,921 $3,027,409
4 Anthony G. Brown 27,731 $19,300,624 $31,493,487 257 $11,014,839 $17,927,022 $2,188,148 $2,660,494
5 Steny H. Hoyer 32,630 $22,710,279 $37,057,136 303 $12,960,724 $21,094,015 $2,574,707 $3,130,497
6 David Trone 35,716 $24,858,074 $40,561,767 332 $14,186,467 $23,088,954 $2,818,207 $3,426,560
7 Kweisi Mfume 26,741 $18,611,829 $30,369,557 248 $10,621,744 $17,287,247 $2,110,058 $2,565,547
8 Jamie Raskin 29,726 $20,689,388 $33,759,580 276 $11,807,404 $19,216,949 $2,345,595 $2,851,928
Massachusetts
1 Richard E. Neal 18,433 $12,912,446 $22,429,626 183 $8,883,583 $12,919,964 $1,273,993 $2,120,664
2 James P. McGovern 18,493 $12,954,832 $22,503,254 184 $8,912,744 $12,962,375 $1,278,175 $2,127,625
3 Lori Trahan 15,464 $10,832,942 $18,817,414 154 $7,452,913 $10,839,249 $1,068,821 $1,779,138
4 Jake Auchincloss 15,575 $10,910,436 $18,952,026 155 $7,506,228 $10,916,789 $1,076,467 $1,791,866
5 Katherine Clark 14,682 $10,284,916 $17,865,462 146 $7,075,879 $10,290,904 $1,014,751 $1,689,134
6 Seth Moulton 15,023 $10,523,393 $18,279,710 149 $7,239,948 $10,529,520 $1,038,280 $1,728,300
7 Ayanna Pressley 17,014 $11,918,719 $20,703,469 169 $8,199,913 $11,925,659 $1,175,948 $1,957,460
8 Stephen F. Lynch 15,147 $10,610,306 $18,430,684 150 $7,299,743 $10,616,484 $1,046,855 $1,742,574
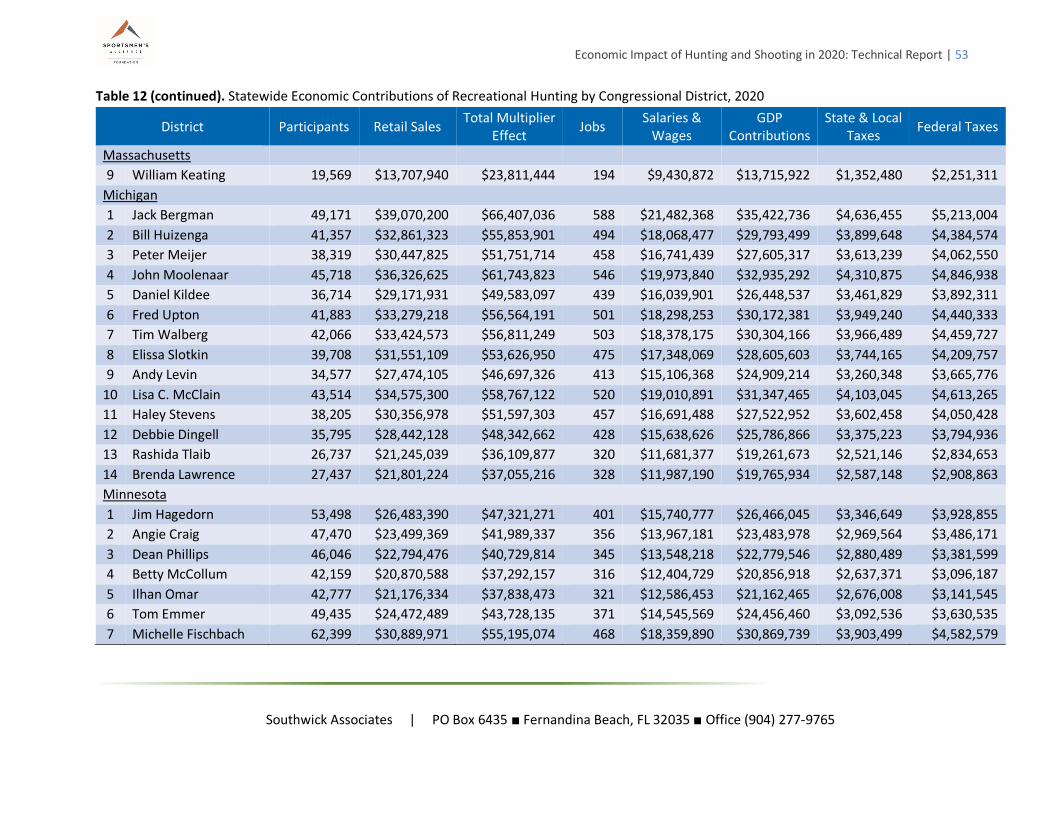
Economic Impact of Hunting and Shooting in 2020: Technical Report | 53
Southwick Associates | PO Box 6435 ■ Fernandina Beach, FL 32035 ■ Office (904) 277-9765
Table 12 (continued). Statewide Economic Contributions of Recreational Hunting by Congressional District, 2020
District Participants Retail Sales Total Multiplier
Effect Jobs
Salaries & Wages
GDP Contributions
State & Local Taxes
Federal Taxes
Massachusetts
9 William Keating 19,569 $13,707,940 $23,811,444 194 $9,430,872 $13,715,922 $1,352,480 $2,251,311
Michigan
1 Jack Bergman 49,171 $39,070,200 $66,407,036 588 $21,482,368 $35,422,736 $4,636,455 $5,213,004
2 Bill Huizenga 41,357 $32,861,323 $55,853,901 494 $18,068,477 $29,793,499 $3,899,648 $4,384,574
3 Peter Meijer 38,319 $30,447,825 $51,751,714 458 $16,741,439 $27,605,317 $3,613,239 $4,062,550
4 John Moolenaar 45,718 $36,326,625 $61,743,823 546 $19,973,840 $32,935,292 $4,310,875 $4,846,938
5 Daniel Kildee 36,714 $29,171,931 $49,583,097 439 $16,039,901 $26,448,537 $3,461,829 $3,892,311
6 Fred Upton 41,883 $33,279,218 $56,564,191 501 $18,298,253 $30,172,381 $3,949,240 $4,440,333
7 Tim Walberg 42,066 $33,424,573 $56,811,249 503 $18,378,175 $30,304,166 $3,966,489 $4,459,727
8 Elissa Slotkin 39,708 $31,551,109 $53,626,950 475 $17,348,069 $28,605,603 $3,744,165 $4,209,757
9 Andy Levin 34,577 $27,474,105 $46,697,326 413 $15,106,368 $24,909,214 $3,260,348 $3,665,776
10 Lisa C. McClain 43,514 $34,575,300 $58,767,122 520 $19,010,891 $31,347,465 $4,103,045 $4,613,265
11 Haley Stevens 38,205 $30,356,978 $51,597,303 457 $16,691,488 $27,522,952 $3,602,458 $4,050,428
12 Debbie Dingell 35,795 $28,442,128 $48,342,662 428 $15,638,626 $25,786,866 $3,375,223 $3,794,936
13 Rashida Tlaib 26,737 $21,245,039 $36,109,877 320 $11,681,377 $19,261,673 $2,521,146 $2,834,653
14 Brenda Lawrence 27,437 $21,801,224 $37,055,216 328 $11,987,190 $19,765,934 $2,587,148 $2,908,863
Minnesota
1 Jim Hagedorn 53,498 $26,483,390 $47,321,271 401 $15,740,777 $26,466,045 $3,346,649 $3,928,855
2 Angie Craig 47,470 $23,499,369 $41,989,337 356 $13,967,181 $23,483,978 $2,969,564 $3,486,171
3 Dean Phillips 46,046 $22,794,476 $40,729,814 345 $13,548,218 $22,779,546 $2,880,489 $3,381,599
4 Betty McCollum 42,159 $20,870,588 $37,292,157 316 $12,404,729 $20,856,918 $2,637,371 $3,096,187
5 Ilhan Omar 42,777 $21,176,334 $37,838,473 321 $12,586,453 $21,162,465 $2,676,008 $3,141,545
6 Tom Emmer 49,435 $24,472,489 $43,728,135 371 $14,545,569 $24,456,460 $3,092,536 $3,630,535
7 Michelle Fischbach 62,399 $30,889,971 $55,195,074 468 $18,359,890 $30,869,739 $3,903,499 $4,582,579

Economic Impact of Hunting and Shooting in 2020: Technical Report | 54
Southwick Associates | PO Box 6435 ■ Fernandina Beach, FL 32035 ■ Office (904) 277-9765
Table 12 (continued). Statewide Economic Contributions of Recreational Hunting by Congressional District, 2020
District Participants Retail Sales Total Multiplier
Effect Jobs
Salaries & Wages
GDP Contributions
State & Local Taxes
Federal Taxes
Minnesota
8 Pete Stauber 58,016 $28,720,209 $51,318,082 435 $17,070,262 $28,701,398 $3,629,311 $4,260,691
Mississippi
1 Trent Kelly 81,075 $66,470,506 $101,515,853 1,003 $30,191,564 $50,588,669 $7,072,330 $6,933,635
2 Bennie G. Thompson 63,209 $51,823,072 $79,145,830 782 $23,538,554 $39,440,955 $5,513,872 $5,405,740
3 Michael Guest 75,439 $61,850,053 $94,459,353 933 $28,092,909 $47,072,184 $6,580,723 $6,451,669
4 Steven Palazzo 77,276 $63,356,201 $96,759,588 956 $28,777,016 $48,218,467 $6,740,974 $6,608,777
Missouri
1 Cori Bush 40,764 $38,963,382 $68,018,123 629 $22,927,187 $36,304,313 $3,520,830 $5,198,114
2 Ann Wagner 51,664 $49,382,392 $86,206,522 797 $29,058,036 $46,012,275 $4,462,318 $6,588,116
3 Blaine Luetkemeyer 62,858 $60,081,966 $104,884,699 969 $35,353,977 $55,981,653 $5,429,158 $8,015,549
4 Vicky Hartzler 64,939 $62,070,808 $108,356,608 1,001 $36,524,269 $57,834,766 $5,608,875 $8,280,881
5 Emanuel Cleaver 50,120 $47,906,532 $83,630,122 773 $28,189,597 $44,637,135 $4,328,955 $6,391,222
6 Sam Graves 65,686 $62,784,667 $109,602,786 1,013 $36,944,324 $58,499,907 $5,673,381 $8,376,117
7 Billy Long 60,618 $57,940,391 $101,146,166 935 $34,093,812 $53,986,230 $5,235,640 $7,729,841
8 Jason Smith 62,950 $60,169,953 $105,038,298 971 $35,405,751 $56,063,635 $5,437,109 $8,027,287
Montana Matthew M. Rosendale
184,000 $146,181,692 $237,019,222 2,383 $76,072,581 $114,574,553
$11,029,772 $17,995,610
Nebraska
1 Jeff Fortenberry 41,218 $33,705,856 $55,754,293 540 $18,383,294 $29,121,862 $2,980,215 $4,146,880
2 Don Bacon 35,002 $28,622,780 $47,346,160 458 $15,610,966 $24,730,083 $2,530,778 $3,521,502
3 Adrian Smith 49,780 $40,707,161 $67,335,450 652 $22,201,831 $35,170,990 $3,599,258 $5,008,260
Nevada
1 Dina Titus 45,063 $59,636,688 $95,015,518 775 $31,361,555 $52,900,008 $6,754,870 $7,983,949
2 Mark Amodei 61,293 $81,116,192 $129,237,510 1,055 $42,657,130 $71,953,145 $9,187,789 $10,859,549

Economic Impact of Hunting and Shooting in 2020: Technical Report | 55
Southwick Associates | PO Box 6435 ■ Fernandina Beach, FL 32035 ■ Office (904) 277-9765
Table 12 (continued). Statewide Economic Contributions of Recreational Hunting by Congressional District, 2020
District Participants Retail Sales Total Multiplier
Effect Jobs
Salaries & Wages
GDP Contributions
State & Local Taxes
Federal Taxes
Nevada
3 Susie Lee 68,970 $91,276,731 $145,425,680 1,187 $48,000,323 $80,965,929 $10,338,643 $12,219,806
4 Steven Horsford 56,874 $75,268,892 $119,921,360 979 $39,582,170 $66,766,367 $8,525,483 $10,076,733
New Hampshire
1 Chris Pappas 52,171 $31,090,638 $52,423,106 478 $19,075,728 $28,762,953 $2,823,635 $4,437,140
2 Ann Kuster 52,629 $31,363,164 $52,882,624 482 $19,242,937 $29,015,075 $2,848,385 $4,476,034
New Jersey
1 Donald Norcross 29,728 $10,945,818 $18,564,251 140 $7,044,278 $10,966,316 $1,275,161 $1,791,551
2 Jeff Van Drew 32,876 $12,105,013 $20,530,260 154 $7,790,288 $12,127,681 $1,410,205 $1,981,281
3 Andy Kim 31,282 $11,518,116 $19,534,875 147 $7,412,585 $11,539,685 $1,341,833 $1,885,221
4 Chris Smith 28,267 $10,407,725 $17,651,638 133 $6,697,983 $10,427,215 $1,212,475 $1,703,479
5 Josh Gottheimer 26,821 $9,875,471 $16,748,929 126 $6,355,447 $9,893,965 $1,150,469 $1,616,362
6 Frank Pallone Jr. 26,395 $9,718,632 $16,482,927 124 $6,254,511 $9,736,831 $1,132,197 $1,590,692
7 Tom Malinowski 26,335 $9,696,524 $16,445,432 124 $6,240,284 $9,714,682 $1,129,622 $1,587,073
8 Albio Sires 25,046 $9,221,834 $15,640,351 118 $5,934,793 $9,239,103 $1,074,321 $1,509,379
9 Bill Pascrell Jr. 22,511 $8,288,305 $14,057,073 106 $5,334,012 $8,303,826 $965,568 $1,356,584
10 Donald Payne Jr. 22,637 $8,335,023 $14,136,308 106 $5,364,078 $8,350,631 $971,010 $1,364,230
11 Mikie Sherrill 25,749 $9,480,869 $16,079,679 121 $6,101,497 $9,498,624 $1,104,499 $1,551,776
12 Bonnie Watson Coleman
27,751 $10,217,932 $17,329,747 130 $6,575,840 $10,237,067 $1,190,365 $1,672,415
New Mexico
1 Melanie Ann Stansbury
51,209 $36,103,129 $55,689,392 548 $16,373,463 $26,981,968 $3,784,478 $3,801,119
2 Yvette Herrell 57,075 $40,238,753 $62,068,627 611 $18,249,047 $30,072,759 $4,217,991 $4,236,539
3 Teresa Leger Fernandez
56,916 $40,126,870 $61,896,046 610 $18,198,306 $29,989,143 $4,206,263 $4,224,759
New York
1 Lee Zeldin 27,980 $17,729,199 $29,359,125 227 $11,305,117 $17,137,996 $2,443,001 $2,690,626

Economic Impact of Hunting and Shooting in 2020: Technical Report | 56
Southwick Associates | PO Box 6435 ■ Fernandina Beach, FL 32035 ■ Office (904) 277-9765
Table 12 (continued). Statewide Economic Contributions of Recreational Hunting by Congressional District, 2020
District Participants Retail Sales Total Multiplier
Effect Jobs
Salaries & Wages
GDP Contributions
State & Local Taxes
Federal Taxes
New York
2 Andrew R. Garbarino 22,402 $14,194,448 $23,505,662 182 $9,051,164 $13,721,115 $1,955,929 $2,154,184
3 Thomas Suozzi 24,990 $15,834,459 $26,221,480 203 $10,096,926 $15,306,437 $2,181,915 $2,403,076
4 Kathleen Rice 23,706 $15,020,822 $24,874,116 192 $9,578,106 $14,519,932 $2,069,799 $2,279,596
5 Gregory W. Meeks 22,676 $14,368,264 $23,793,496 184 $9,161,999 $13,889,134 $1,979,880 $2,180,562
6 Grace Meng 26,360 $16,702,788 $27,659,412 214 $10,650,620 $16,145,811 $2,301,566 $2,534,856
7 Nydia M. Velázquez 24,956 $15,812,732 $26,185,501 203 $10,083,071 $15,285,435 $2,178,921 $2,399,778
8 Hakeem Jeffries 24,369 $15,441,126 $25,570,130 198 $9,846,115 $14,926,221 $2,127,715 $2,343,383
9 Yvette D. Clarke 23,016 $14,584,035 $24,150,808 187 $9,299,586 $14,097,710 $2,009,612 $2,213,308
10 Jerrold Nadler 24,718 $15,662,141 $25,936,127 201 $9,987,047 $15,139,866 $2,158,170 $2,376,925
11 Nicole Malliotakis 24,759 $15,688,364 $25,979,550 201 $10,003,767 $15,165,214 $2,161,784 $2,380,904
12 Carolyn Maloney 30,324 $19,214,125 $31,818,125 246 $12,251,987 $18,573,404 $2,647,617 $2,915,982
13 Adriano Espaillat 24,264 $15,374,447 $25,459,711 197 $9,803,596 $14,861,765 $2,118,527 $2,333,263
14 Alexandria Ocasio-Cortez
24,950 $15,808,986 $26,179,297 203 $10,080,683 $15,281,814 $2,178,405 $2,399,210
15 Ritchie Torres 19,648 $12,449,548 $20,616,150 160 $7,938,520 $12,034,401 $1,715,490 $1,889,374
16 Jamaal Bowman 22,248 $14,097,051 $23,344,375 181 $8,989,059 $13,626,966 $1,942,508 $2,139,403
17 Mondaire Jones 23,870 $15,124,961 $25,046,569 194 $9,644,511 $14,620,599 $2,084,149 $2,295,401
18 Sean Patrick Maloney 27,865 $17,656,527 $29,238,780 226 $11,258,777 $17,067,746 $2,432,987 $2,679,597
19 Antonio Delgado 43,630 $27,645,684 $45,780,582 354 $17,628,415 $26,723,801 $3,809,447 $4,195,576
20 Paul D. Tonko 34,142 $21,633,309 $35,824,236 277 $13,794,593 $20,911,918 $2,980,969 $3,283,123
21 Elise Stefanik 41,349 $26,200,466 $43,387,337 336 $16,706,865 $25,326,777 $3,610,302 $3,976,246
22 Claudia L. Tenney 37,348 $23,665,155 $39,188,923 303 $15,090,210 $22,876,008 $3,260,948 $3,591,481
23 Tom Reed 38,745 $24,549,967 $40,654,150 315 $15,654,415 $23,731,315 $3,382,871 $3,725,762
24 John Katko 35,232 $22,324,077 $36,968,131 286 $14,235,065 $21,579,651 $3,076,154 $3,387,956
25 Joseph Morelle 33,184 $21,026,453 $34,819,297 269 $13,407,628 $20,325,298 $2,897,347 $3,191,025

Economic Impact of Hunting and Shooting in 2020: Technical Report | 57
Southwick Associates | PO Box 6435 ■ Fernandina Beach, FL 32035 ■ Office (904) 277-9765
Table 12 (continued). Statewide Economic Contributions of Recreational Hunting by Congressional District, 2020
District Participants Retail Sales Total Multiplier
Effect Jobs
Salaries & Wages
GDP Contributions
State & Local Taxes
Federal Taxes
New York
26 Brian Higgins 31,092 $19,701,108 $32,624,558 252 $12,562,515 $19,044,148 $2,714,721 $2,989,888
27 Chris Jacobs 40,179 $25,458,753 $42,159,078 326 $16,233,907 $24,609,797 $3,508,098 $3,863,682
North Carolina
1 G. K. Butterfield 48,713 $52,996,573 $91,212,600 843 $28,804,878 $47,608,881 $4,439,536 $6,856,063
2 Deborah K. Ross 57,306 $62,344,709 $107,301,713 992 $33,885,810 $56,006,676 $5,222,632 $8,065,413
3 Gregory Francis Murphy
54,425 $59,209,964 $101,906,491 942 $32,182,002 $53,190,612 $4,960,033 $7,659,877
4 David Price 55,440 $60,314,945 $103,808,278 960 $32,782,585 $54,183,259 $5,052,598 $7,802,827
5 Virginia Foxx 55,750 $60,651,539 $104,387,591 965 $32,965,532 $54,485,635 $5,080,794 $7,846,371
6 Kathy E. Manning 47,824 $52,029,290 $89,547,806 828 $28,279,137 $46,739,933 $4,358,506 $6,730,928
7 David Rouzer 58,558 $63,706,386 $109,645,299 1,014 $34,625,912 $57,229,922 $5,336,700 $8,241,571
8 Richard Hudson 52,360 $56,964,304 $98,041,476 906 $30,961,433 $51,173,248 $4,771,914 $7,369,361
9 Dan Bishop 50,768 $55,232,034 $95,060,060 879 $30,019,904 $49,617,083 $4,626,801 $7,145,260
10 Patrick T. McHenry 54,321 $59,097,766 $101,713,387 940 $32,121,020 $53,089,820 $4,950,634 $7,645,363
11 Madison Cawthorn 64,964 $70,676,264 $121,641,182 1,124 $38,414,204 $63,491,235 $5,920,568 $9,143,250
12 Alma Adams 51,548 $56,080,319 $96,520,047 892 $30,480,967 $50,379,130 $4,697,862 $7,255,001
13 Ted Budd 54,023 $58,773,072 $101,154,554 935 $31,944,541 $52,798,135 $4,923,435 $7,603,358
North Dakota Kelly Armstrong 85,600 $47,015,342 $64,844,329 642 $21,980,997 $34,425,292 $3,213,090 $5,164,850
Ohio
1 Steve Chabot 42,346 $39,679,772 $70,177,546 632 $22,445,689 $38,078,482 $4,228,288 $5,284,623
2 Brad Wenstrup 43,142 $40,426,061 $71,497,431 644 $22,867,843 $38,794,654 $4,307,813 $5,384,015
3 Joyce Beatty 40,772 $38,205,061 $67,569,375 609 $21,611,487 $36,663,283 $4,071,143 $5,088,218
4 Jim Jordan 47,819 $44,808,964 $79,249,023 714 $25,347,123 $43,000,684 $4,774,857 $5,967,738
5 Robert E. Latta 48,977 $45,893,351 $81,166,867 731 $25,960,529 $44,041,310 $4,890,409 $6,112,159

Economic Impact of Hunting and Shooting in 2020: Technical Report | 58
Southwick Associates | PO Box 6435 ■ Fernandina Beach, FL 32035 ■ Office (904) 277-9765
Table 12 (continued). Statewide Economic Contributions of Recreational Hunting by Congressional District, 2020
District Participants Retail Sales Total Multiplier
Effect Jobs
Salaries & Wages
GDP Contributions
State & Local Taxes
Federal Taxes
Ohio
6 Bill Johnson 50,134 $46,977,738 $83,084,711 748 $26,573,935 $45,081,936 $5,005,962 $6,256,579
7 Bob Gibbs 49,263 $46,161,356 $81,640,859 735 $26,112,131 $44,298,499 $4,918,968 $6,147,852
8 Warren Davidson 46,824 $43,875,759 $77,598,558 699 $24,819,236 $42,105,139 $4,675,414 $5,843,452
9 Marcy Kaptur 37,874 $35,489,282 $62,766,257 565 $20,075,251 $34,057,101 $3,781,749 $4,726,526
10 Michael Turner 41,210 $38,616,001 $68,296,163 615 $21,843,944 $37,057,639 $4,114,933 $5,142,948
11 Shontel Brown 33,757 $31,631,393 $55,943,203 504 $17,892,956 $30,354,898 $3,370,651 $4,212,726
12 Troy Balderson 49,081 $45,990,932 $81,339,449 733 $26,015,728 $44,134,953 $4,900,808 $6,125,155
13 Tim Ryan 42,954 $40,250,140 $71,186,298 641 $22,768,329 $38,625,833 $4,289,067 $5,360,586
14 David Joyce 45,552 $42,684,170 $75,491,117 680 $24,145,189 $40,961,637 $4,548,438 $5,684,754
15 Mike Carey 49,892 $46,750,965 $82,683,641 745 $26,445,656 $44,864,315 $4,981,797 $6,226,377
16 Anthony Gonzalez 48,805 $45,732,549 $80,882,472 729 $25,869,568 $43,886,997 $4,873,274 $6,090,743
Oklahoma
1 Kevin Hern 72,296 $72,539,140 $120,672,190 1,110 $38,716,508 $63,191,679 $6,714,213 $8,953,083
2 Markwayne Mullin 86,117 $86,407,022 $143,742,049 1,322 $46,118,249 $75,272,532 $7,997,822 $10,664,715
3 Frank Lucas 87,306 $87,600,060 $145,726,723 1,341 $46,755,013 $76,311,835 $8,108,249 $10,811,964
4 Tom Cole 80,360 $80,630,328 $134,132,254 1,234 $43,035,040 $70,240,229 $7,463,132 $9,951,731
5 Stephanie I. Bice 70,721 $70,959,556 $118,044,481 1,086 $37,873,433 $61,815,642 $6,568,007 $8,758,124
Oregon
1 Suzanne Bonamici 65,649 $43,266,452 $74,756,718 734 $25,092,771 $37,913,151 $3,496,762 $5,801,378
2 Cliff Bentz 74,425 $49,049,965 $84,749,596 832 $28,446,972 $42,981,078 $3,964,181 $6,576,860
3 Earl Blumenauer 57,964 $38,201,781 $66,005,868 648 $22,155,469 $33,475,125 $3,087,439 $5,122,282
4 Peter DeFazio 73,292 $48,303,196 $83,459,313 819 $28,013,876 $42,326,705 $3,903,828 $6,476,729
5 Kurt Schrader 66,670 $43,939,151 $75,919,022 745 $25,482,909 $38,502,618 $3,551,129 $5,891,577

Economic Impact of Hunting and Shooting in 2020: Technical Report | 59
Southwick Associates | PO Box 6435 ■ Fernandina Beach, FL 32035 ■ Office (904) 277-9765
Table 12 (continued). Statewide Economic Contributions of Recreational Hunting by Congressional District, 2020
District Participants Retail Sales Total Multiplier
Effect Jobs
Salaries & Wages
GDP Contributions
State & Local Taxes
Federal Taxes
Pennsylvania
1 Brian Fitzpatrick 43,025 $33,748,555 $60,197,009 528 $21,189,027 $32,719,354 $3,501,478 $4,910,293
2 Brendan Boyle 33,468 $26,251,657 $46,824,857 411 $16,482,101 $25,451,083 $2,723,660 $3,819,521
3 Dwight Evans 40,407 $31,694,730 $56,533,620 496 $19,899,533 $30,728,164 $3,288,389 $4,611,469
4 Madeleine Dean 42,428 $33,280,468 $59,362,087 521 $20,895,139 $32,265,543 $3,452,913 $4,842,188
5 Mary Gay Scanlon 36,881 $28,928,763 $51,599,988 453 $18,162,921 $28,046,548 $3,001,415 $4,209,030
6 Chrissy Houlahan 42,676 $33,474,461 $59,708,111 524 $21,016,937 $32,453,620 $3,473,040 $4,870,413
7 Susan Wild 48,153 $37,771,097 $67,371,984 591 $23,714,580 $36,619,225 $3,918,824 $5,495,558
8 Matt Cartwright 54,075 $42,415,669 $75,656,468 663 $26,630,674 $41,122,156 $4,400,708 $6,171,327
9 Dan Meuser 55,627 $43,633,446 $77,828,605 683 $27,395,255 $42,302,795 $4,527,054 $6,348,509
10 Scott Perry 48,436 $37,992,625 $67,767,121 594 $23,853,666 $36,833,997 $3,941,808 $5,527,790
11 Lloyd Smucker 52,816 $41,428,182 $73,895,094 648 $26,010,680 $40,164,782 $4,298,254 $6,027,651
12 Fred Keller 57,520 $45,117,807 $80,476,247 706 $28,327,211 $43,741,888 $4,681,060 $6,564,478
13 John Joyce 55,717 $43,703,534 $77,953,620 684 $27,439,259 $42,370,745 $4,534,326 $6,358,706
14 Guy Reschenthaler 52,291 $41,016,415 $73,160,630 642 $25,752,152 $39,765,573 $4,255,532 $5,967,740
15 Glenn Thompson 56,340 $44,192,897 $78,826,494 691 $27,746,506 $42,845,185 $4,585,098 $6,429,907
16 Mike Kelly 50,102 $39,299,263 $70,097,760 615 $24,674,038 $38,100,787 $4,077,374 $5,717,901
17 Conor Lamb 47,183 $37,010,143 $66,014,677 579 $23,236,815 $35,881,477 $3,839,874 $5,384,842
18 Michael Doyle 44,257 $34,714,766 $61,920,432 543 $21,795,663 $33,656,100 $3,601,724 $5,050,873
Rhode Island
1 David Cicilline 26,498 $21,958,778 $31,017,398 311 $11,628,150 $17,861,750 $2,271,120 $2,739,435
2 James Langevin 30,702 $25,441,935 $35,937,455 360 $13,472,636 $20,695,025 $2,631,370 $3,173,970
South Carolina
1 Nancy Mace 49,576 $28,822,664 $45,534,341 424 $14,163,382 $23,995,314 $3,038,872 $3,419,808
2 Joe Wilson 45,524 $26,466,991 $41,812,824 389 $13,005,810 $22,034,179 $2,790,505 $3,140,308

Economic Impact of Hunting and Shooting in 2020: Technical Report | 60
Southwick Associates | PO Box 6435 ■ Fernandina Beach, FL 32035 ■ Office (904) 277-9765
Table 12 (continued). Statewide Economic Contributions of Recreational Hunting by Congressional District, 2020
District Participants Retail Sales Total Multiplier
Effect Jobs
Salaries & Wages
GDP Contributions
State & Local Taxes
Federal Taxes
South Carolina
3 Jeff Duncan 48,364 $28,117,701 $44,420,632 413 $13,816,965 $23,408,421 $2,964,545 $3,336,164
4 William Timmons 46,894 $27,263,226 $43,070,724 401 $13,397,078 $22,697,057 $2,874,455 $3,234,781
5 Ralph Norman 46,858 $27,242,364 $43,037,766 400 $13,386,826 $22,679,689 $2,872,255 $3,232,306
6 James E. Clyburn 40,770 $23,702,769 $37,445,877 348 $11,647,479 $19,732,922 $2,499,064 $2,812,333
7 Tom Rice 49,614 $28,844,395 $45,568,672 424 $14,174,061 $24,013,405 $3,041,163 $3,422,387
South Dakota Dusty Johnson 78,800 $54,620,533 $87,712,787 846 $26,585,832 $43,439,504 $4,060,468 $6,307,465
Tennessee
1 Diana Harshbarger 84,523 $105,757,354 $182,295,570 1,597 $62,911,905 $100,860,100 $10,570,328 $14,585,383
2 Tim Burchett 81,839 $102,399,039 $176,506,791 1,547 $60,914,143 $97,657,297 $10,234,668 $14,122,225
3 Chuck Fleischmann 78,907 $98,730,316 $170,182,958 1,491 $58,731,729 $94,158,461 $9,867,984 $13,616,258
4 Scott DesJarlais 87,602 $109,609,364 $188,935,340 1,656 $65,203,351 $104,533,738 $10,955,332 $15,116,627
5 Jim Cooper 70,092 $87,700,499 $151,170,693 1,325 $52,170,419 $83,639,396 $8,765,566 $12,095,096
6 John W. Rose 88,497 $110,729,788 $190,866,631 1,672 $65,869,858 $105,602,279 $11,067,317 $15,271,149
7 Mark Green 82,588 $103,336,174 $178,122,146 1,561 $61,471,617 $98,551,037 $10,328,334 $14,251,469
8 David Kustoff 72,689 $90,949,432 $156,770,929 1,374 $54,103,112 $86,737,882 $9,090,293 $12,543,168
9 Steve Cohen 53,062 $66,391,755 $114,440,485 1,003 $39,494,481 $63,317,385 $6,635,781 $9,156,329
Texas
1 Louie Gohmert 50,896 $35,284,288 $64,767,180 519 $22,043,077 $36,118,542 $3,843,431 $5,410,144
2 Dan Crenshaw 48,705 $33,764,858 $61,978,143 496 $21,093,847 $34,563,186 $3,677,924 $5,177,169
3 Van Taylor 62,360 $43,231,458 $79,354,858 635 $27,007,895 $44,253,613 $4,709,097 $6,628,684
4 Pat Fallon 59,112 $40,979,856 $75,221,858 602 $25,601,257 $41,948,774 $4,463,836 $6,283,446
5 Lance Gooden 49,916 $34,604,906 $63,520,118 509 $21,618,648 $35,423,096 $3,769,428 $5,305,974
6 Jake Ellzey 52,805 $36,607,478 $67,196,002 538 $22,869,710 $37,473,016 $3,987,563 $5,613,028
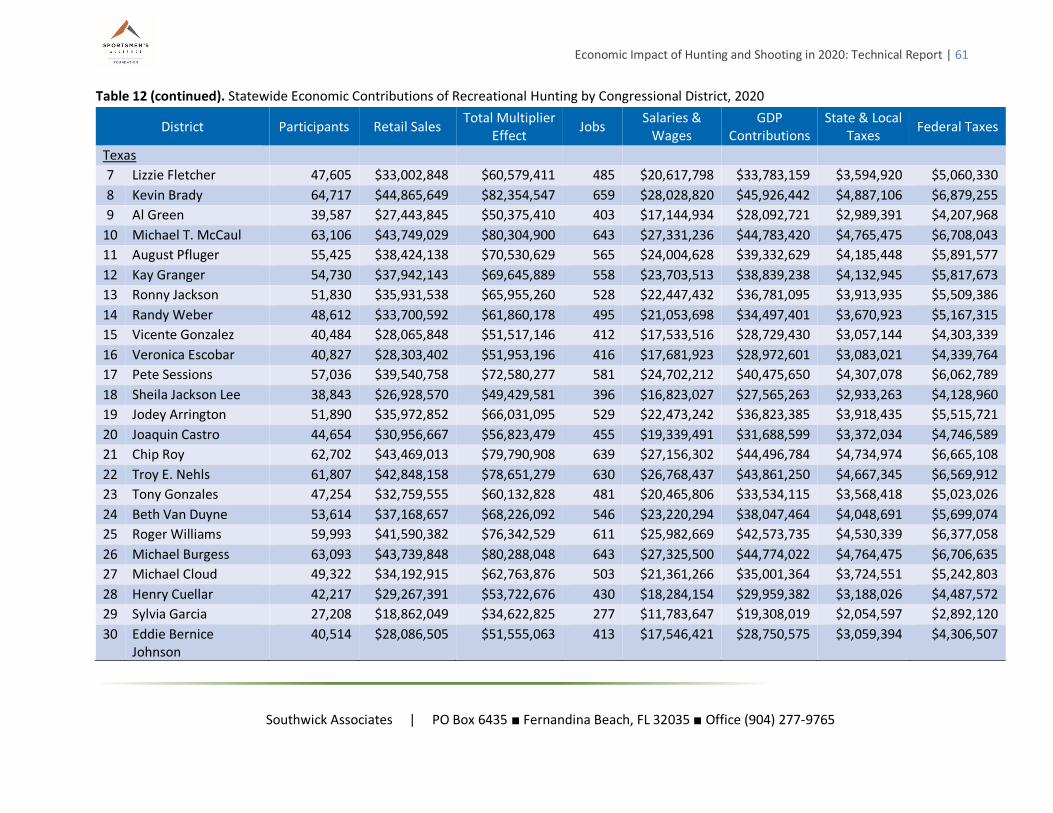
Economic Impact of Hunting and Shooting in 2020: Technical Report | 61
Southwick Associates | PO Box 6435 ■ Fernandina Beach, FL 32035 ■ Office (904) 277-9765
Table 12 (continued). Statewide Economic Contributions of Recreational Hunting by Congressional District, 2020
District Participants Retail Sales Total Multiplier
Effect Jobs
Salaries & Wages
GDP Contributions
State & Local Taxes
Federal Taxes
Texas
7 Lizzie Fletcher 47,605 $33,002,848 $60,579,411 485 $20,617,798 $33,783,159 $3,594,920 $5,060,330
8 Kevin Brady 64,717 $44,865,649 $82,354,547 659 $28,028,820 $45,926,442 $4,887,106 $6,879,255
9 Al Green 39,587 $27,443,845 $50,375,410 403 $17,144,934 $28,092,721 $2,989,391 $4,207,968
10 Michael T. McCaul 63,106 $43,749,029 $80,304,900 643 $27,331,236 $44,783,420 $4,765,475 $6,708,043
11 August Pfluger 55,425 $38,424,138 $70,530,629 565 $24,004,628 $39,332,629 $4,185,448 $5,891,577
12 Kay Granger 54,730 $37,942,143 $69,645,889 558 $23,703,513 $38,839,238 $4,132,945 $5,817,673
13 Ronny Jackson 51,830 $35,931,538 $65,955,260 528 $22,447,432 $36,781,095 $3,913,935 $5,509,386
14 Randy Weber 48,612 $33,700,592 $61,860,178 495 $21,053,698 $34,497,401 $3,670,923 $5,167,315
15 Vicente Gonzalez 40,484 $28,065,848 $51,517,146 412 $17,533,516 $28,729,430 $3,057,144 $4,303,339
16 Veronica Escobar 40,827 $28,303,402 $51,953,196 416 $17,681,923 $28,972,601 $3,083,021 $4,339,764
17 Pete Sessions 57,036 $39,540,758 $72,580,277 581 $24,702,212 $40,475,650 $4,307,078 $6,062,789
18 Sheila Jackson Lee 38,843 $26,928,570 $49,429,581 396 $16,823,027 $27,565,263 $2,933,263 $4,128,960
19 Jodey Arrington 51,890 $35,972,852 $66,031,095 529 $22,473,242 $36,823,385 $3,918,435 $5,515,721
20 Joaquin Castro 44,654 $30,956,667 $56,823,479 455 $19,339,491 $31,688,599 $3,372,034 $4,746,589
21 Chip Roy 62,702 $43,469,013 $79,790,908 639 $27,156,302 $44,496,784 $4,734,974 $6,665,108
22 Troy E. Nehls 61,807 $42,848,158 $78,651,279 630 $26,768,437 $43,861,250 $4,667,345 $6,569,912
23 Tony Gonzales 47,254 $32,759,555 $60,132,828 481 $20,465,806 $33,534,115 $3,568,418 $5,023,026
24 Beth Van Duyne 53,614 $37,168,657 $68,226,092 546 $23,220,294 $38,047,464 $4,048,691 $5,699,074
25 Roger Williams 59,993 $41,590,382 $76,342,529 611 $25,982,669 $42,573,735 $4,530,339 $6,377,058
26 Michael Burgess 63,093 $43,739,848 $80,288,048 643 $27,325,500 $44,774,022 $4,764,475 $6,706,635
27 Michael Cloud 49,322 $34,192,915 $62,763,876 503 $21,361,266 $35,001,364 $3,724,551 $5,242,803
28 Henry Cuellar 42,217 $29,267,391 $53,722,676 430 $18,284,154 $29,959,382 $3,188,026 $4,487,572
29 Sylvia Garcia 27,208 $18,862,049 $34,622,825 277 $11,783,647 $19,308,019 $2,054,597 $2,892,120
30 Eddie Bernice Johnson
40,514 $28,086,505 $51,555,063 413 $17,546,421 $28,750,575 $3,059,394 $4,306,507

Economic Impact of Hunting and Shooting in 2020: Technical Report | 62
Southwick Associates | PO Box 6435 ■ Fernandina Beach, FL 32035 ■ Office (904) 277-9765
Table 12 (continued). Statewide Economic Contributions of Recreational Hunting by Congressional District, 2020
District Participants Retail Sales Total Multiplier
Effect Jobs
Salaries & Wages
GDP Contributions
State & Local Taxes
Federal Taxes
Texas
31 John Carter 62,717 $43,479,341 $79,809,867 639 $27,162,755 $44,507,356 $4,736,099 $6,666,692 32 Colin Allred 46,970 $32,562,167 $59,770,506 479 $20,342,492 $33,332,059 $3,546,917 $4,992,760 33 Marc Veasey 27,499 $19,064,028 $34,993,573 280 $11,909,829 $19,514,773 $2,076,598 $2,923,089 34 Filemon Vela 36,771 $25,491,768 $46,792,213 375 $15,925,417 $26,094,489 $2,776,756 $3,908,655 35 Lloyd Doggett 46,986 $32,573,643 $59,791,571 479 $20,349,662 $33,343,807 $3,548,168 $4,994,520 36 Brian Babin 54,192 $37,569,171 $68,961,269 552 $23,470,507 $38,457,448 $4,092,318 $5,760,485 Utah 1 Blake D. Moore 70,332 $48,851,509 $87,414,625 770 $27,663,874 $45,661,022 $4,716,957 $6,663,883 2 Chris Stewart 74,794 $51,950,360 $92,959,693 819 $29,418,707 $48,557,487 $5,016,173 $7,086,600 3 John R. Curtis 71,745 $49,832,701 $89,170,366 786 $28,219,509 $46,578,133 $4,811,698 $6,797,728 4 Burgess Owens 74,729 $51,905,760 $92,879,887 818 $29,393,451 $48,515,800 $5,011,866 $7,080,516
Vermont Peter Welch 69,600 $46,110,898 $72,369,657 674 $24,260,252 $38,986,960 $5,667,562 $5,754,447
Virginia 1 Robert J. Wittman 51,754 $34,867,446 $58,054,673 506 $19,414,088 $32,137,322 $3,390,569 $4,827,279 2 Elaine Luria 42,539 $28,659,561 $47,718,477 416 $15,957,556 $26,415,515 $2,786,904 $3,967,819 3 Robert C. Scott 39,978 $26,933,917 $44,845,262 391 $14,996,723 $24,824,989 $2,619,100 $3,728,909 4 A. Donald McEachin 44,330 $29,865,873 $49,727,001 434 $16,629,228 $27,527,373 $2,904,208 $4,134,829 5 Bob Good 50,748 $34,190,100 $56,926,884 497 $19,036,944 $31,513,012 $3,324,703 $4,733,503 6 Ben Cline 49,999 $33,685,221 $56,086,256 489 $18,755,829 $31,047,665 $3,275,608 $4,663,604 7 Abigail Spanberger 48,577 $32,727,494 $54,491,630 475 $18,222,569 $30,164,928 $3,182,477 $4,531,010 8 Don Beyer 37,848 $25,499,253 $42,456,531 370 $14,197,907 $23,502,659 $2,479,590 $3,530,285 9 Morgan Griffith 51,623 $34,779,767 $57,908,687 505 $19,365,269 $32,056,508 $3,382,043 $4,815,141
10 Jennifer Wexton 46,887 $31,588,627 $52,595,404 459 $17,588,451 $29,115,234 $3,071,731 $4,373,338
11 Gerald E. "Gerry" Connolly
40,517 $27,297,160 $45,450,065 397 $15,198,976 $25,159,790 $2,654,422 $3,779,199

Economic Impact of Hunting and Shooting in 2020: Technical Report | 63
Southwick Associates | PO Box 6435 ■ Fernandina Beach, FL 32035 ■ Office (904) 277-9765
Table 12 (continued). Statewide Economic Contributions of Recreational Hunting by Congressional District, 2020
District Participants Retail Sales Total Multiplier
Effect Jobs
Salaries & Wages
GDP Contributions
State & Local Taxes
Federal Taxes
Washington
1 Suzan DelBene 52,011 $47,599,658 $79,209,288 645 $25,122,618 $43,672,955 $6,077,336 $6,772,663 2 Rick Larsen 50,979 $46,655,747 $77,638,552 632 $24,624,431 $42,806,912 $5,956,821 $6,638,359 3 Jaime Herrera
Beutler 51,690 $47,305,997 $78,720,614 641 $24,967,626 $43,403,520 $6,039,842 $6,730,879
4 Dan Newhouse 43,228 $39,561,735 $65,833,601 536 $20,880,284 $36,298,116 $5,051,086 $5,628,996 5 Cathy McMorris
Rodgers 51,044 $46,714,479 $77,736,287 633 $24,655,430 $42,860,799 $5,964,320 $6,646,716
6 Derek Kilmer 52,406 $47,961,840 $79,811,985 649 $25,313,774 $44,005,259 $6,123,578 $6,824,195 7 Pramila Jayapal 44,591 $40,809,096 $67,909,299 553 $21,538,628 $37,442,576 $5,210,344 $5,806,475 8 Kim Schrier 50,547 $46,260,004 $76,980,007 626 $24,415,562 $42,443,815 $5,906,294 $6,582,052 9 Adam Smith 41,266 $37,766,208 $62,845,713 511 $19,932,622 $34,650,710 $4,821,840 $5,373,522
10 Marilyn Strickland 48,238 $44,147,043 $73,463,886 598 $23,300,363 $40,505,162 $5,636,520 $6,281,411 West Virginia 1 David McKinley 74,599 $66,482,929 $98,717,224 1,016 $30,877,236 $49,467,935 $6,727,936 $6,933,405 2 Alex Mooney 75,010 $66,849,232 $99,261,130 1,021 $31,047,361 $49,740,490 $6,765,005 $6,971,606 3 Carol Miller 73,191 $65,228,618 $96,854,760 996 $30,294,686 $48,534,640 $6,601,002 $6,802,594
Wisconsin 1 Bryan Steil 47,995 $28,298,001 $47,624,495 447 $15,008,819 $24,366,339 $2,859,010 $3,573,407 2 Mark Pocan 52,929 $31,206,935 $52,520,123 493 $16,551,672 $26,871,112 $3,152,906 $3,940,741 3 Ron Kind 57,473 $33,886,216 $57,029,254 536 $17,972,721 $29,178,139 $3,423,599 $4,279,075 4 Gwen Moore 35,529 $20,948,195 $35,255,041 331 $11,110,596 $18,037,698 $2,116,443 $2,645,291 5 Scott Fitzgerald 47,424 $27,961,362 $47,057,944 442 $14,830,271 $24,076,472 $2,824,998 $3,530,897 6 Glenn Grothman 51,951 $30,630,498 $51,550,000 484 $16,245,939 $26,374,763 $3,094,667 $3,867,950 7 Thomas P. Tiffany 59,514 $35,089,817 $59,054,871 555 $18,611,093 $30,214,515 $3,545,202 $4,431,063 8 Mike Gallagher 51,984 $30,649,866 $51,582,597 485 $16,256,212 $26,391,441 $3,096,624 $3,870,396
Wyoming
Liz Cheney 112,800 $93,362,182 $132,775,142 1,235 $39,073,092 $68,034,211 $10,965,877 $11,056,146
Economic Impact of Hunting and Shooting in 2020: Technical Report | 64
Southwick Associates | PO Box 6435 ■ Fernandina Beach, FL 32035 ■ Office (904) 277-9765
References
ESRI. (2017). Methodology Statement: ESRI US-Market Potential Database. Retrieved from
http://www.esri.com/data/esri_data/methodology-statements
National Sporting Goods Association. (2021). Sports Participation in 2020 Shooting Sports. Prepared for
the National Shooting Sports Foundation.
U.S. Fish & Wildlife Service. (2011). 2011 National Survey of Fishing, Hunting, and Wildlife-Associated
Recreation.
U.S. Fish & Wildlife Service. (2016). 2016 National Survey of Fishing, Hunting, and Wildlife-Associated
Recreation.
U.S. Fish & Wildlife Service. (n.d.). Historical License Data. Retrieved September 2021, from
https://wsfrprograms.fws.gov/subpages/licenseinfo/LicenseIndex.htm
U.S. House of Representatives. (n.d.). Directory of Representatives. Retrieved December 2021, from
https://www.house.gov/representatives

Economic Impact of Hunting and Shooting in 2020: Technical Report | 65
Southwick Associates | PO Box 6435 ■ Fernandina Beach, FL 32035 ■ Office (904) 277-9765
Appendix A. Definitions of Economic Contribution
Economic benefits can be estimated by two types of economic measures: economic
contributions and economic values. An economic contribution addresses the business and financial
activity resulting from the use of a resource. Economic value, on the other hand, is a non-business
measure that estimates the value people receive from an activity after subtracting for their costs and
expenditures. This concept is also known as consumer surplus.
There are three types of economic contribution: direct, indirect, and induced. A direct
contribution is defined as the economic contribution of the initial purchase made by the consumer (the
original retail sale). Indirect contributions are the secondary effects generated from a direct
contribution, such as the retailer buying additional inventory, and the wholesaler and manufacturers
buying additional materials. Indirect contributions affect not only the industry being studied, but also
the industries that supply the first industry. An induced contribution results from the salaries and wages
paid by the directly and indirectly effected industries. The employees of these industries spend their
income on various goods and services. These expenditures are induced contributions, which, in turn,
create a continual cycle of indirect and induced effects.
The direct, indirect, and induced contribution effects sum together to provide the overall
economic contribution of the activity under study. As the original retail purchase (direct contribution)
goes through round after round of indirect and induced effects, the economic contribution of the
original purchase is multiplied, benefiting many industries and individuals. Likewise, the reverse is true.
If a particular item or industry is removed from the economy, the economic loss is greater than the
original lost retail sale. Once the original retail purchase is made, each successive round of spending is
smaller than the previous round. When the economic benefits are no longer measurable, the economic
examination ends.
This study presents several important measures:
Expenditures – these include expenditures made by anglers for equipment, travel expenses and
services related to their outdoor activities over the course of the year. These combined initial retail sales
represent the “direct output”.
Total Multiplier Effect – also known as “total output” or “total economic effect,” this measure
reports the sum of the direct, indirect, and induced contributions resulting from the original retail sale.
This figure explains the total activity in the economy generated by a retail sale. Another way to look at
this figure is, if the activity in question were to disappear and participants did not spend their money
elsewhere, the economy would contract by this amount.

Economic Impact of Hunting and Shooting in 2020: Technical Report | 66
Southwick Associates | PO Box 6435 ■ Fernandina Beach, FL 32035 ■ Office (904) 277-9765
Salaries & Wages – this figure reports the total salaries and wages paid in all sectors of the
economy as a result of the activity under study. These are not just the paychecks of those employees
directly serving recreationists or manufacturing their goods, it also includes portions of the paychecks of,
for example, the truck driver who delivers food to the restaurants serving recreationists and the
accountants who manage the books for companies down the supply chain, etc. This figure is based on
the direct, indirect, and induced effects, and is essentially a portion of the total economic effect figure
reported in this study.
Jobs – much like Salaries and Wages, this figure reports the total jobs in all sectors of the
economy as a result of the activity under study. These are not just the employees directly serving
recreationists or manufacturing their goods, they also include, for example, the truck driver who delivers
food to the restaurants serving recreationists and the accountants who manage the books for
companies down the supply chain, etc. This figure is based on direct, indirect, and induced effects.
Economic Impact of Hunting and Shooting in 2020: Technical Report | 67
Southwick Associates | PO Box 6435 ■ Fernandina Beach, FL 32035 ■ Office (904) 277-9765
Appendix B. Methodology for Estimating Economic Contribution
The extent of the economic contributions associated with spending for angling can be estimated
in two ways:
• Direct effects: These include the jobs, income and tax revenues that are tied directly to
the spending by anglers without including multiplier effects.
• Total effects: These include the jobs, income and tax revenues that are tied directly to
the spending by anglers plus the jobs, income and tax revenues that result from the multiplier effects of
angling spending. The multiplier effect occurs when a direct purchase from a business leads to increased
demand for goods and services from other businesses along their supply chain. Also included is
economic activity associated with household spending of incomes earned in the affected businesses.
The economic contributions, both direct effects and total effects, were estimated with an
IMPLAN input-output model for the U.S. economy. The IMPLAN model was developed by MIG, Inc.
originally for use by the U.S. Forest Service. Inherent in each IMPLAN model is the relationship between
the economic output of each industry (i.e., sales) and the jobs, income and taxes associated with a given
level of output. Through those models, it is possible to determine the jobs, income and taxes supported
directly by wildlife-based recreationists with and without the multiplier effects.
Input-output models describe how sales in one industry affect other industries. For example,
once a consumer makes a purchase, the retailer buys more merchandise from wholesalers, who buy
more from manufacturers, who, in turn, purchase new inputs and supplies. In addition, the salaries and
wages paid by these businesses stimulate more benefits. Simply, the first purchase creates numerous
rounds of purchasing. Input-output analysis tracks the flow of dollars from the consumer through all the
businesses that are affected, either directly or indirectly.
To apply the IMPLAN model, each specific expenditure for producer activities was matched to
the appropriate industry sector affected by the initial purchase. The spending was estimated with
models of the U.S. economy, therefore all the resulting contributions represent salaries and wages, total
economic effects, jobs and tax revenues that occur within the U.S.
Estimating Tax Revenues
The IMPLAN model estimates detailed tax revenues at the state and local level and at the
federal level. The summary estimates provided in this report represent the total taxes estimated by the
IMPLAN model including all income, sales, property and other taxes and fees that accrue to the various
local, state, and federal taxing authorities.