Embed Size (px)
Citation preview
Economic Preconditions for Monetary Integration
in East Asia
October 2002
Junichi Goto Kobe University
Research Institute for Economics
and Business Administration Kobe University 2-1, Rokkodai-cho Nada-ku, Kobe 657-8501 Japan (phone/fax) 81-70-803-7007 (e-mail) [email protected]
2
ABSTRACT
Asian Financial Crisis gave a devastating impact on East Asian countries,
which had been enjoying good economic performance. As a result, there emerged
various initiatives for monetary cooperation in order to avoid the next crisis in the
region. However, there are pros and cons on the regional financial integration and
cooperation in Asia. Some argue that in order to avoid the next Asian Financial
Crisis, Asian countries must closely united with each other, and others argues that
regional attempts, whether financial cooperation or trading arrangement, may
undermine the global efforts. In view of the above, the purpose of this paper is to
examine whether East Asian countries (or subset of them) constitute a preferable
grouping for monetary cooperation and integration. I examine the degree of
interdependence of East Asia in terms of trade, labor and macroeconomic variables.
The results of the examination suggest that economic preconditions for monetary
integration are met, and there is indeed a case for financial integration and cooperation
in East Asia.
3
I. Introduction
Asian Financial Crisis gave a devastating impact, at least temporarily, on East
Asian countries, which had been enjoying good economic performance. As a result,
there emerged various initiatives for monetary cooperation in order to avoid the next
crisis in the region: the Manila Framework Group for macroeconomic and financial
surveillance, the recent Chiang Mai Initiative of ASEAN+3 for financial cooperation
and so on.
There are pros and cons on the regional financial integration and cooperation
in Asia. Some argue that in order to avoid the next Asian Financial Crisis, Asian
countries must unite together, closely cooperate with each other, and in order to
achieve effective cooperation surveillance or peer review is necessary. On the other
hand, it is sometimes argued that regional attempts, whether financial cooperation or
trading arrangement, may undermine the global efforts. The difference of the opinion
culminated when Japan announced the idea of Asian Monetary Fund (AMF). The
United States, together with China, opposed the creation of AMF, arguing that it
would undermine the effectiveness of the IMF, and killed the initiative.
In view of the above, the major purpose of this paper is to examine the
economic rationale for taking a regional initiative for monetary cooperation in East
Asia. In other words, I will examine whether East Asian countries (or subset of them)
constitute a desirable grouping for monetary cooperation and integration. For that
purpose, I will examine the degree of interdependence of East Asia in terms of trade
and labor, because the closer the region unites together in terms of real variables such
as trade and migration, the stronger is the case for financial cooperation. After that, I
will examine macroeconomic preconditions for financial integration in East Asia,
using the theory of optimal currency Area.
The paper is organized as follows. Section II discusses the different channels of
economic interdependence in East Asia—international movements of goods and
services (trade) and labor mobility (migration)—and tries to see if the degree of
interdependence in East Asia is higher or lower than that in other regions (e.g.,
Europe), and if the region’s economic interdependence has deepened in the 1990s in
4
comparison to those in the 1980s. Generally speaking, the interdependence in terms of
trade in Asia is very strong, and international mobility of goods and labor has
increased markedly in the 1990s, but the Asian financial crisis proved to be a major
setback to the closer integration of the economies in East Asia. Section III investigates
whether the macroeconomic linkages among the East Asian economies is strong and
whether it has become tighter in the 1990s. Relying on the principal component
analysis, I have found that the real disturbances of the subset of Asian countries, i.e.,
Indonesia, Korea, Malaysia, the Philippines, Singapore, and Thailand, are pretty much
synchronized, and that the synchronization of those in the six countries with those in
Japan has increased in the 1990s, and the synchronization with Europe shows similar
trend with Japan, with lesser degree. On the other hand, the correlation with the U.S.
has been negative both in the 1980s and in the 1990s. The finding suggests that there
is indeed the case for financial integration and cooperation in East Asia, and that the
pegging to a basket of major currencies (or even to the yen) is better than the pegging
to the dollar. Section IV summarizes major findings of the paper, and provides some
agenda for future research of the subject.
II. Interdependence in East Asia in Trade and Migration
1. Flow of goods – trade
In this section, I will examine various data of international flows of goods and
labor in order to find out the degree of interdependence among East Asian countries.
In what follows, the main focus of our analysis is placed on EA14 countries, i.e.,
ASEAN 10 plus China, Hong Kong, Korea, and Taiwan.
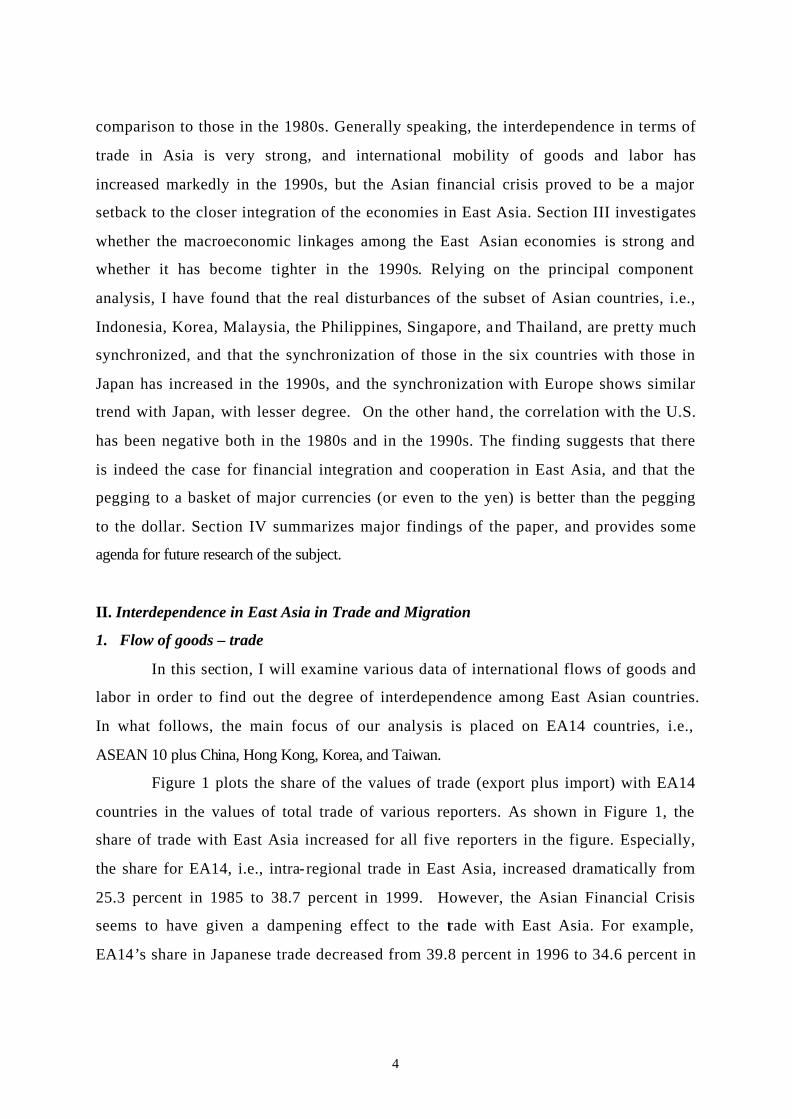
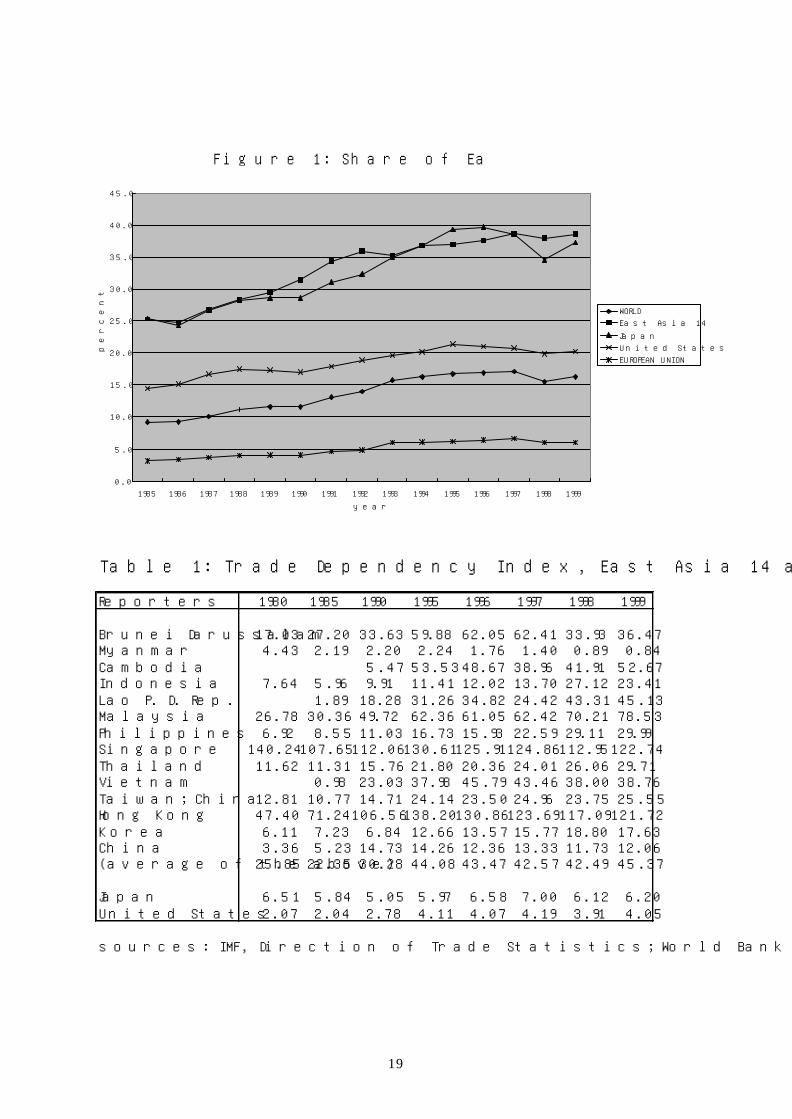
Figure 1 plots the share of the values of trade (export plus import) with EA14
countries in the values of total trade of various reporters. As shown in Figure 1, the
share of trade with East Asia increased for all five reporters in the figure. Especially,
the share for EA14, i.e., intra- regional trade in East Asia, increased dramatically from
25.3 percent in 1985 to 38.7 percent in 1999. However, the Asian Financial Crisis
seems to have given a dampening effect to the trade with East Asia. For example,
EA14’s share in Japanese trade decreased from 39.8 percent in 1996 to 34.6 percent in
5
1998.
The increased importance of intra- regional trade in East Asia is also
confirmed by Table 1. Table 1 summarizes ‘trade dependency index’ on EA14. As
discussed in Goto and Hamada (1994), trade dependency index is defined as the
amount of exports and imports of a country with a particular trading partner (EA14
here) as a percentage of the country’s GDP. For example, the last entry in the last
row (4.05) shows that the amount of US’s trade with East Asia is 4.05 percent of GDP
or the United States. They called it ‘trade dependency index’ because it shows the
degree to which a country depend on trade with specific partner for economic
activities. With few exceptions, trade dependency with East Asia has been
dramatically increasing in each country in East Asia. For example, for ASEAN 5
countries, with the exception of Singapore, the index in the late 1990s is several times
higher than that in 1980. However, it should be noted that trade dependency of Japan
on EA14 does not show no remarkable increase, i.e., the index in 1999 (6.20) is
slightly lower than that in 1980 (6.51).
However, one caveat may be necessary for assessing the interdependency of
East Asia in terms of trade. For example, Frankel (1991) doubts the existence of
growing trend in the inter- regional trade intensity. According to him, as for the level
of trade intensity, the share (37.4 percent) of inter- regional trade by Asian nations in
1989 is smaller than that of EC (59.9 percent) and there is very little difference from
that of the North America (36.0 percent). The reason for the increase in the share
from 33 percent in 1980 to 37 percent in 1989 was merely due to the increase of the
Asian share in the total trade volume in the world. He concludes, “it is likely that
there has in fact been no movement toward intra- regional bias in the evolving pattern
of trade.” In order to assess the degree of interconnectedness in trade, let us compare
East Asian nations with EU nations by the ‘trade intensity index’ that Yamazawa et al.
(1991) develops extensively. The trade intensity index between country i and
country j is defined as:
(1) Ti,j = (Ti,j / Ti ) / (Tw,j / Tw )
6
where Ti,j = trade volume of country i with country j,
Ti = the total trade volume of country i,
Tw,j = trade volume of the world with country j,
and Tw = the total trade volume of the world.
Accordingly, the index is the ratio of the share of the trade with j’th country in the
total trade of country i to the share of the j’th country’s trade in the total world trade.
The index is normalized by dividing by the relative share of the country in the total
world trade so that the effect of the mere size of the country is to be eliminated. If
the degree of trade interaction between country i and country j is equal to that between
the world and country j, then the index is equal to unity. The higher the index is, the
more closely are the two countries interrelated by trade.
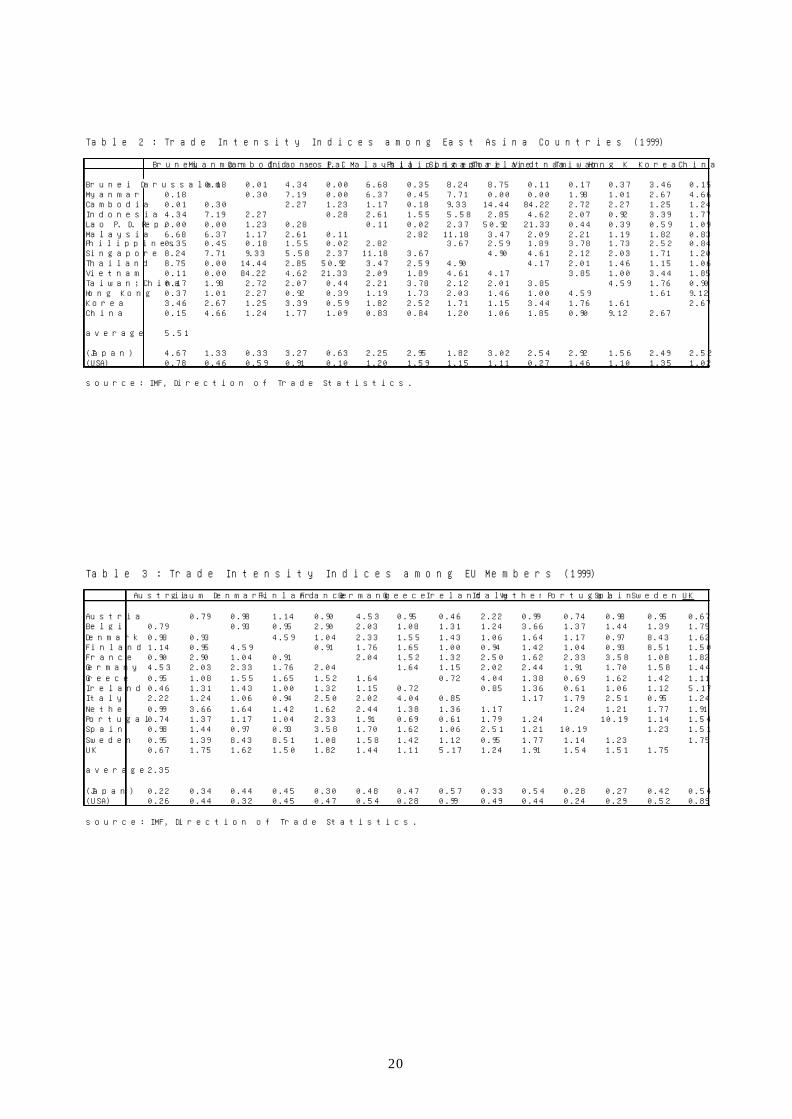
Table 2 and Table 3 depict respectively the trade intensity indexes among
Asian countries and among EU countries. As is easily seen, those indexes that adjust
for the size effect of trading partners show in many cases higher values in East Asia
than those in EU. For example, in EU those indexes exceed four only in seven cases,
i.e., Austria-Germany, Denmark-Finland, Denmark-Sweden, Finland-Sweden,
Greece-Italy, Ireland-UK, and Portugal-Spain, in East Asia they exceed four in twenty
one cases, and simple average of trade intensity indices for East Asia and EU are 5.51
and 2.35, respectively. It should be also noted that Japan’s trade intensity with East
Asia is substantially higher than U.S.’s trade intensity with East Asia. As far as we can
tell from the levels of trade intensity index, in spite of the slightly negative impression
that Frankel (1991) provide, we may say that the degree of trade interdependence is
quite strong among East Asian nations.
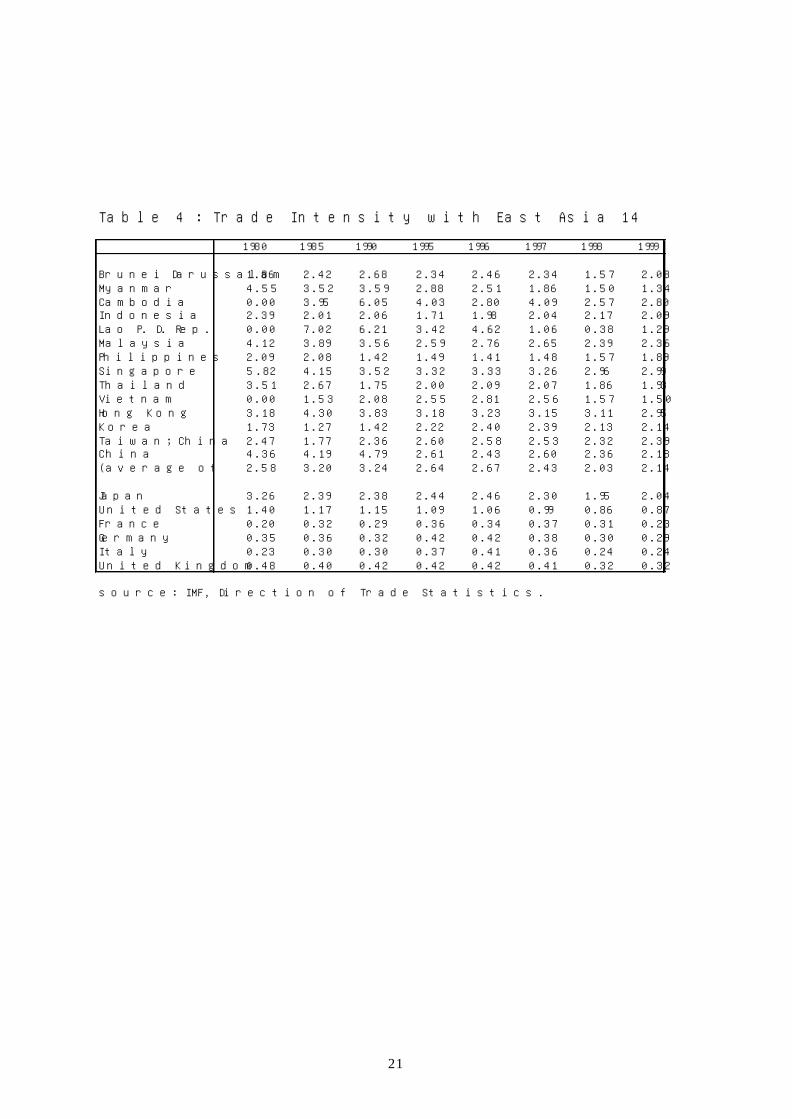
Let us now turn to the changes in the trade intensity indices in East Asia
during the 1980s and 1990s. Table 4 is given for that purpose. Table 4 does not show
any increasing trend of trade intensity index in East Asia. Some of the ind ices among
Asian nations increased, but some decreased. As far as the trend is concerned, the
trade intensity indexes confirm the argument of Frankel (1991). In short, though I
found the level of the trade intensity among East Asian nations to be even higher than
7
in Europe, I could not necessarily detect a distinct increasing trend. This may reflect
the fact that, while in Europe many programs toward market integration were realized
during the 1980s and 1990s, in Asia the move toward a FTA became active only
recently. Table 4 appears to indicate that trade intensity of East Asia with non-Asian
countries is not so strong, too.
2. Flow of labor – migration
Let us briefly examine the recent situation of migration in East Asian
countries. Although the data on migration in East Asia are sketchy, we can observe
several facts. First, while the degree of labor market integration in East Asia is not as
large as that in North America or in Europe, it has been rapidly increasing in the 1990s.
The foreign population share in total East/Southeast Asian countries is only 1.2
percent, which is substantially lower than that in North America (8.6 percent) and that
in Europe (5.0 percent). Some internationalized countries (areas) such as Hong Kong
(40.0 percent) and Singapore (15.5 percent) are notable exceptions. Recently,
however, the degree of labor market integration in Asia has been dramatically
increasing, at least until the Asian Financial Crisis. According to the ILO (1998),
intra-Asian migration has increased from one million in the beginning of 1980s to 6.5
million in 1997. Major host countries include Japan and the NIES such as Hong
Kong, Singapore, and Taiwan, while Indonesia and the Philippines are major exporters
of migrant workers. Korea, Malaysia, and Thailand are both exporters and importers
of migrant workers, i.e., they are receiving some types of foreign workers and sending
out other types of workers. The increasing trend of Asian migration can be observed
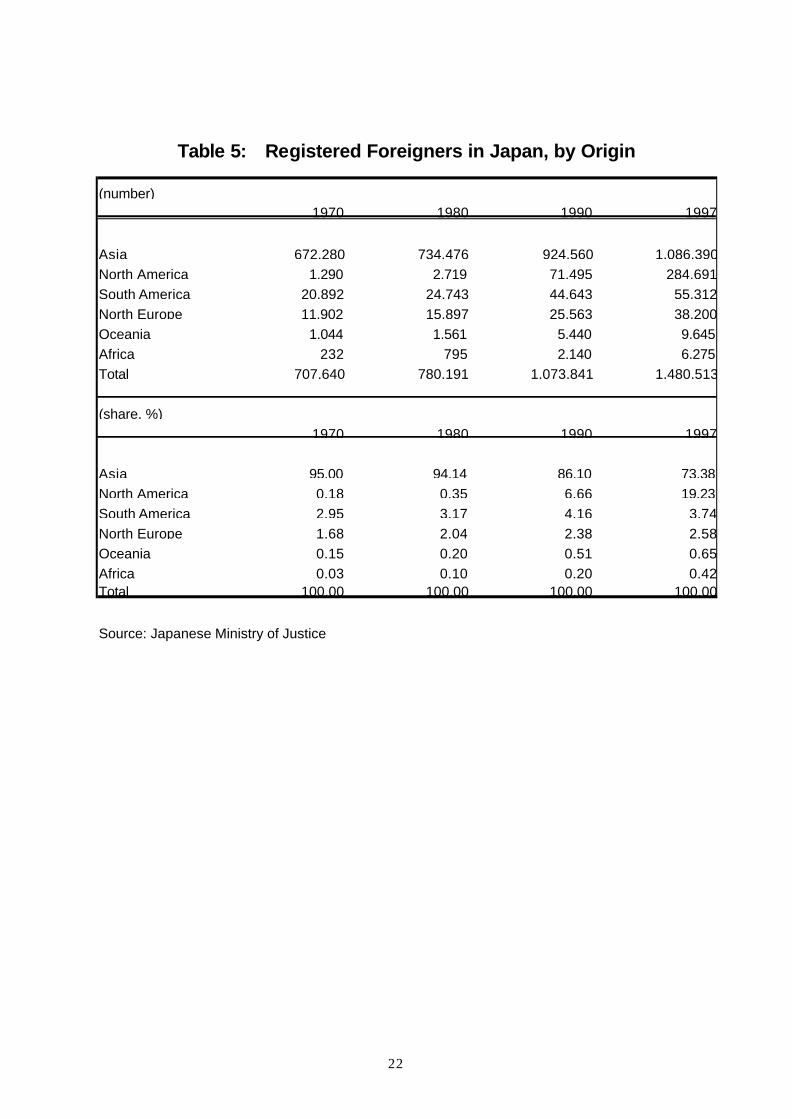
from the data both in receiving and sending countries. Table 5 lists the number of
registered foreigners in Japan, a typical receiving country, by sending countries. As
the table shows, the number of registered foreign residents originating in Asia has
increased by 48 percent from 734,476 in 1980 to 1,086,390 in 1997. Although the
Asian share in the total number of registered foreign residents is decreased due to the
dramatic increase in the foreign residents from North America, it is still as high as 73
percent in 1997. In addition to the legal residents, there are many illegal overstayers,
8
too. According to the estimate by the Japanese Ministry of Justice, the number of
illegal overstayers is 281,157 in 1997, almost all of which are from neighboring East
Asian countries, such as Korea, the Philippines, China, and Thailand.
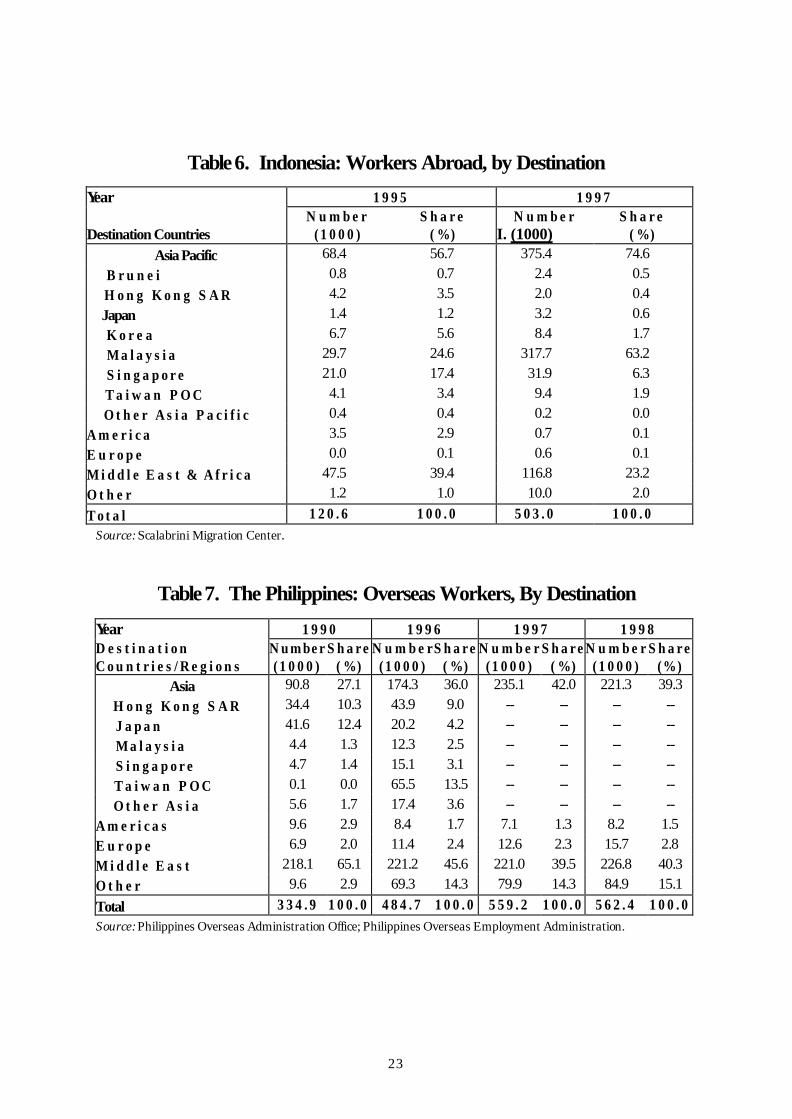
The increasing trend of intra-Asian migration can also be observed from the
data reported by sending countries. Table 6, Table 7, and Table 8 show the number of
emigration of workers by destination from Indonesia, the Philippines, and Thailand,
respectively. The number of deployed workers from these countries into Asian
countries has doubled in a few years. The increase in Indonesian emigrant workers
deployed in Asia is dramatic, i.e., it shows more than a five-fold increase in just two
years (from 68,436 in 1995 to 375,383 in 1997). Asia and the Middle East are the
two major destinations for these workers, and the importance of destinations in Asia is
increasing. For example, as shown in Table 8, while the number of Filipino workers
deployed in the Middle East has hardly increased in the 1990s, those deployed in
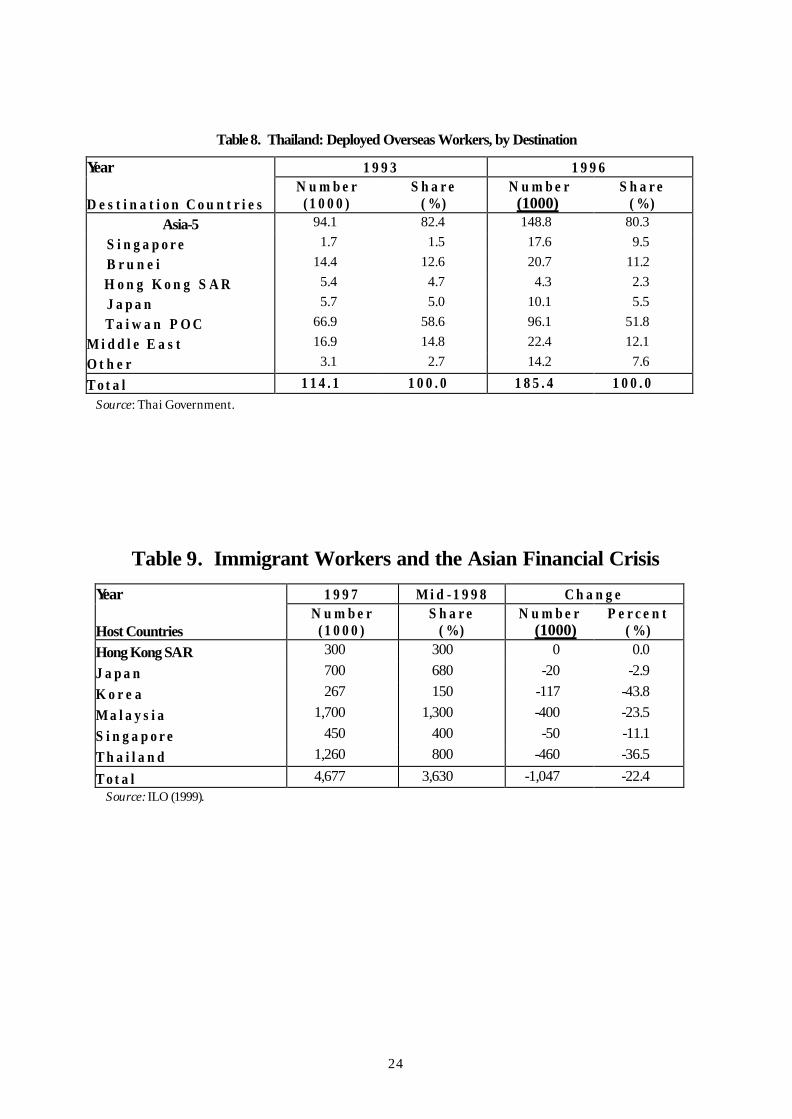
Asian countries has doubled during the same period. For Indonesia and Thailand, the
Asian share in the total number of deployed workers is as high as eighty percent.
The increasing trend of intra-Asian migration discussed above seems to be
suspended, at least temporarily, by the Asian Financial Crisis started in July 1997. In
order to cope with the dramatic depreciation of their currencies and inflationary
pressures, many countries were obliged to take deflationary monetary and fiscal
policies. As a result, many countries, perhaps with the exception of Taiwan, have
been suffering from negative economic growth and high unemployment. Due to the
severe unemployment problem, there are some changes in government polic ies
towards migration in both receiving and sending Asian countries.
Receiving countries, such as Korea, Malaysia, Singapore, and Thailand 1, took
various measures to reduce the number of immigrant workers in order to save
employment for native workers. For example, at the end of 1997, the governments of
Malaysia and Thailand announced the plan to repatriate one million immigrant
workers to save domestic jobs. In order to reduce the number of immigrant workers,
1 Thailand is both receiving and sending countries, and the Thai government took restrictive policies toward immigration and encouraged outflow of Thai workers in order to relieve the unemployment problem in the country.
9
especially illegal immigrants, various measures were taken by the governments of
receiving countries in East Asia. First, the enforcement of immigration laws was
strengthened in most countries. Second, amnesty programs taken by Korea and
Malaysia, coupled with the threat of stiff punishment after the amnesty period, brought
about a large number of exodus of illegal migrant workers. Third, in the hope of
encouraging employers to shift from foreign workers to native workers, some
countries, including Malaysia and Singapore, imposed fees (or increased existing fees)
against migrant workers. Through various restrictive measures, a large number of
migrant workers were forced out of many East Asian countries. As shown in Table 9,
from 1997 to mid-1998, the number of migrant workers decreased sharply in Korea
(43.8 % decline), Thailand (36.5 % decline), Malaysia (23.5 % decline), and
Singapore (11.1 % decline) in less than a year. In addition to the decline in the
number of migrant workers, worsening of working conditions has been reported.
While receiving countries took various restrictive measures to reduce
immigration, sending countries, such as Indonesia, the Philippines, and Thailand,
strengthened their efforts to increase emigration to mitigate unemployment problems
in their countries. For example, in the beginning of 1998, Thailand announced the
objective of sending out 210,000 Thai workers abroad. Similarly, the Filipino
government suspended their policy to reduce outflow of unskilled workers, and,
instead, encouraged the outflow of workers. Due to such efforts, the total number of
emigration does not seem to have decreased at all after the Crisis, in spite of the
decline in the emigrated workers destined to East Asia. Table 7 also lists the
outflow of Filipino workers by destination in 1997 and 1998. As shown in the table,
although the number of deployment (flow data) of Filipino workers in Asia decreased
by 13,872 (or six percent decline), the deployment in all other regions increased. In
other words, in spite of the substantially decreased job opportunities in East Asia, the
total number of emigration from the Philippines actually increased from 1997 to 1998.
III. Macroeconomic Interdependence in East Asia
1. The Principal Component Analysis
10
In the previous section, I have discussed the interdependence among East
Asian economies in terms of trade, and labor migration. In what follows, I will
investigate whether the macroeconomic variables of the East Asian economies have
been closely related with one another and whether macroeconomic confluence has
been strengthened or weakened in the region as a result of the Asian financial crisis.
More specifically, I examine how synchronized and interdependent macroeconomic
variables are in East Asia. To measure the degree of interdependence between a pair of
countries, a natural approach would be to examine the correlation coefficient between
them. To measure the degree of interdependence for a group of nations, however,
pair-wise correlation coefficients may not be satisfactory and well-defined criterion
need to be developed.
In this paper, as in Goto and Hamada (1994, 2001), I apply the analysis of the
principal component to measure the degree of confluence in macroeconomic time
series data in the East Asian countries. The principal components of a set of m
variables (or a particular variable from m countries) are a set of m artificially
constructed variables that are mutually orthogonal linear combinations of the original
variables. The first component explains as much as possible the variance of the
original variables, the second explains as much as possible the variance that is left
unexplained by the first, and so forth. The first to the m-th components explain the
entire variation of the original variables. I propose to measure the degree of
confluence in variables mostly by the ratio of the variance explained by the first
principal component to the total variance.
The rationale for this approach is as follows: If a set of variables are perfectly
correlated, the first component explains all the variance. If they are mutually
independent and have an identical variance, the first and any other components explain
1/m of the total variance. The higher the correlation of a set of variables is, the higher
the ratio of the variance explained by the first principal component to the total
variance. Thus, this ratio can be regarded as a multi-variable (or multi-country)
version of correlation coefficient.
As is well known, this approach potentially has its own problems. The
11
principal components are not independent of the scaling of the variables; it is hard to
interpret principal components in economic terms, even though the factor analysis that
is closely related to the principal component method provides a way to interpret them.
Despite these potential problems, I will apply the principal component method because
it is a useful tool that effectively serves our objectives.
In this section, I apply the principal component analysis to seven key
macroeconomic variables in the East Asian countries, i.e., changes in money supply,
interest rates, inflation rates, changes in stock prices, changes in exchange rates,
economic growth rates, and export activity in order to evaluate the degree of
confluence of each of these variables within the region. I solve the characteristic
equation of the correlation matrix of these macroeconomic variables. The principal
components are normalized in such a way that they have zero mean and unitary
variance. Applying the principal component analysis, I try to find whether the
macroeconomic variables are more synchronized in the 1990s than in the 1980s. When
monthly data are available, I will compare measures of confluence of each variable for
three sets of situations, i.e., pre-crisis, mid-crisis, and post-crisis.
2. Money Supply, Interest Rates, Inflation Rates, Stock Prices and Exchange Rates
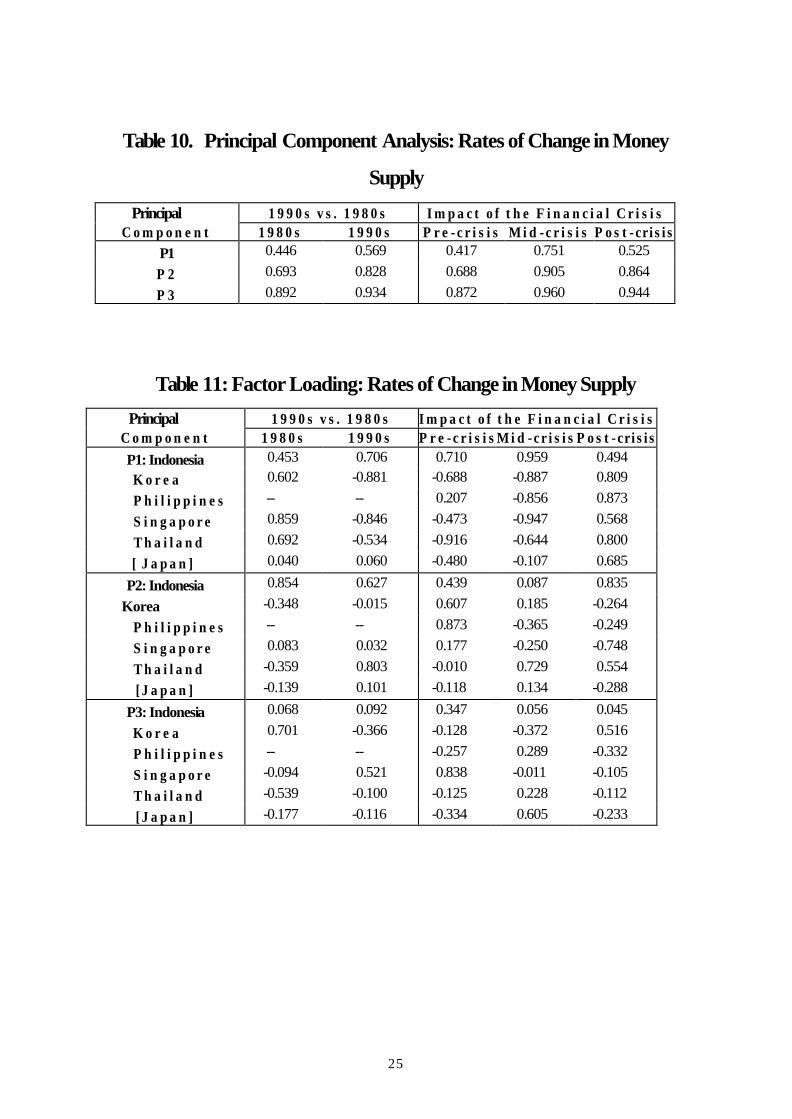
Money supply. Table 10 summarizes the proportion of the total variation in
the rate of growth of money supply, for Indonesia, Korea, the Philippines (1980s vs.
1990s only), Singapore, and Thailand, that is accounted for by the first three principal
components. For example, the table should read as follows: For the situation in the
1980s, the first principal component accounts for 44.6 percent of the total variation of
money supply changes in East Asia, the second for 24.7 percent (or 69.3 percent
cumulatively), and the third for an additional 19.9 percent (89.2 percent cumulatively).
For the situation in the 1990s, the first principal component accounts for 56.9 percent
of the total variation, the second for 25.9 percent (or 82.8 percent cumulatively), and
the third for 10.6 percent (93.4 percent cumulatively). As mentioned above, I measure
the degree of confluence in variables, i.e., money supply changes (or any other
variable) of selected East Asian countries, largely by the ratio of the variance
12
explained by the first component to the total variance.
The table shows that the percentage of variation in East Asia’s money supplies that is
explained by the first principal component is larger in the 1990s than in the 1980s.
Beyond the first principal component, the percentage of variation explained by the
second and third components is also larger in the 1990s than in the 1980s. This
confirms that confluence in money supply in East Asia has substantially increased in
the 1990s.
The table also indicates that the percentage of variation that is explained by
the first, second, and third principal components is the largest in the mid-crisis period,
the second largest in the post-crisis, and the smallest in the pre-crisis period. This
means that confluence in East Asia’s money supplies has risen substantially from the
pre-crisis to the post-crisis period, and declined somewhat in the post-crisis period.
The net result is that the confluence has become greater after the Asian financial
crisis.
It is also interesting to consider the contribution of each original variable to
the principal components, by examining the “factor loading.” The factor loading is the
correlation coefficient between a principal component and the original variable. The
sum of the squares of loading factor of a component equals its characteristic root.
Table 11 summarizes the factor loading for the first three principal components for
five East Asian countries, i.e., Indonesia, Korea, Philippines, Singapore, and Thailand,
where comparable monthly data are available. In order to find the affinity of each
principal component to the Japanese money supply, the correlation coefficient between
a principal component and the Japanese variable is calculated. The table indicates
that the first principal component is positively correlated with all the original
variables in the 1980s and that this ceases to be the case in the 1990s. So a comparison
between the 1990s and 1980s does not yield intuitive results. A close look at loading
factors, however, reveals that in the pre- and mid-crisis periods the first principal
component of money supply changes in East Asia is negatively correlated with the
original variable of some of these economies and of Japan while in the post-crisis
period the correlations become all positive. This means that the money supply change
13
of all countries listed in the table becomes synchronized with each other after the
Asian financial crisis.
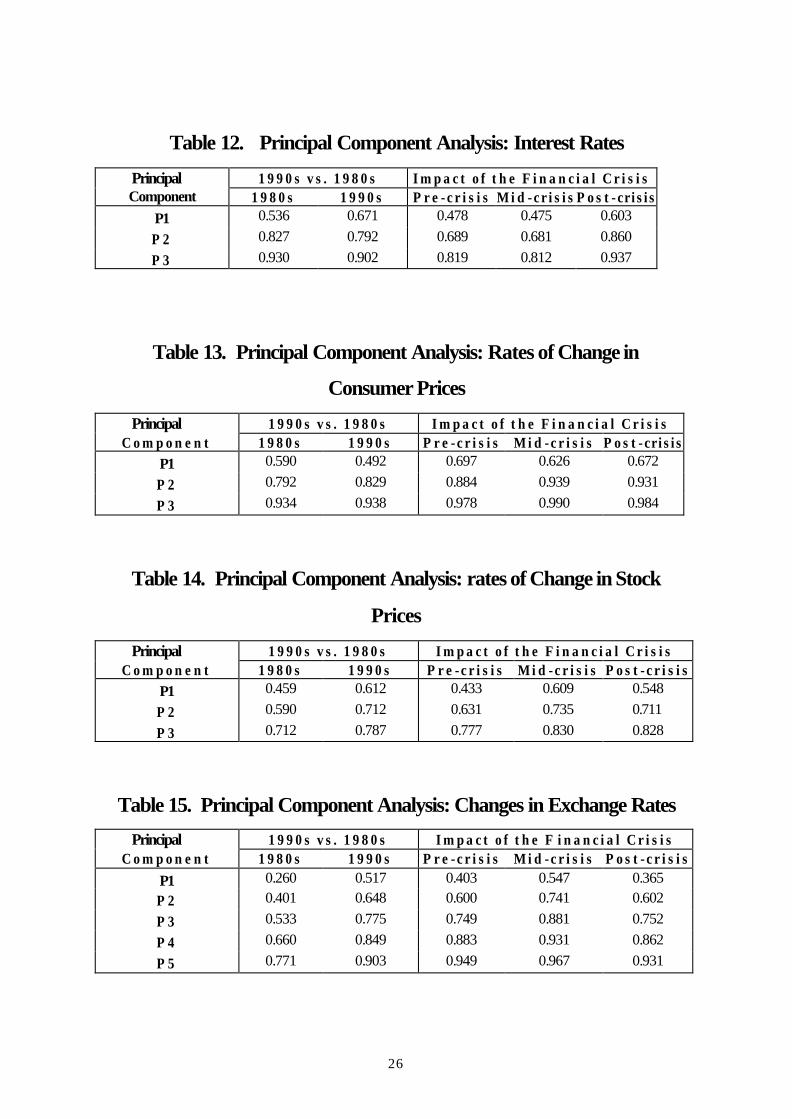
Interest rates . As indicated in Table 12, confluence of interest rates, for Hong
Kong SAR, Indonesia (pre-crisis, mid-crisis, and post-crisis only for these two
economies), Korea, Malaysia, the Philippines, Singapore, and Thailand, demonstrates
somewhat a different pattern from that of money supply changes. It shows that the
percentage of variation that is explained by the first principal component is larger in
the 1990s than in the 1980s, though the cumulative percentage of variation explained
by the second and third components is smaller in the 1990s than in the 1980s. In
addition, the percentage of variation explained by the first, second, and third principal
components is always larger in the post-crisis period than in the mid- or pre-crisis
period. Thus, the confluence in interest rates in East Asia has risen in the 1990s, and
the rise is especially substantial in the post-crisis period.
Inflation rates . Table 13 presents the degree of confluence of the rate of
change in consumer price indices, for Indonesia, Korea, the Philippines, Singapore,
and Thailand. Different from changes in money supply and interest rates examined
above, we observe that the percentage of variation explained by the first principal
component is greater in the 1990s than in the 1980s, while the percentage of variation
explained cumulatively by the second and third components is smaller in the 1990s.
The degree of confluence in inflation rates among the East Asian economies declined
as long as the first principal component is concerned, probably due to wider inflation
fluctuations in the 1990s. The percentage of variation explained by the first principal
component is smaller in the post-crisis period than in the pre-crisis period, though it is
the largest in the post-crisis period if explained by the second and third components.
Thus, the degree of confluence has declined in the 1990s and continued to decline
after the crisis.
Stock prices. Table 14 summarizes the degree of confluence of the rate of
change in leading stock price indicators for China (pre-crisis, mid-crisis, and
post-crisis only), Hong Kong SAR, Indonesia, Korea, Malaysia, the Philippines,
Singapore, Taiwan POC, and Thailand. The table indicates that the percentage of
14
variance explained by any of the principal components is larger in the 1990s than in
the 1980s; the percentage explained by the first component has dramatically increased
from 45.9 percent in the 1980s to 61.2 percent in the 1990s. The percentage of
variance explained by any of the principal components is larger in the post-crisis
period than in the pre-crisis period. Thus, the degree of confluence in stock price
changes in East Asia has substantially increased in the 1990s, and particularly after
the Asian financial crisis.
Exchange rates . Confluence in the rate of change in exchange rates, for China,
Hong Kong SAR, Indonesia, Korea, Malaysia (1980s vs. 1990s only), the Philippines,
Singapore, and Thailand, demonstrates a different pattern. As shown in Table 15, the
degree of confluence substantially increased in the 1990s, but the increased
synchronization seems to have been somewhat reversed by the Asian financial crisis.
This may be a natural result of a general move to more flexible exchange rate
arrangements adopted in the region.
3. Real GDP Growth Rates and Export Performance
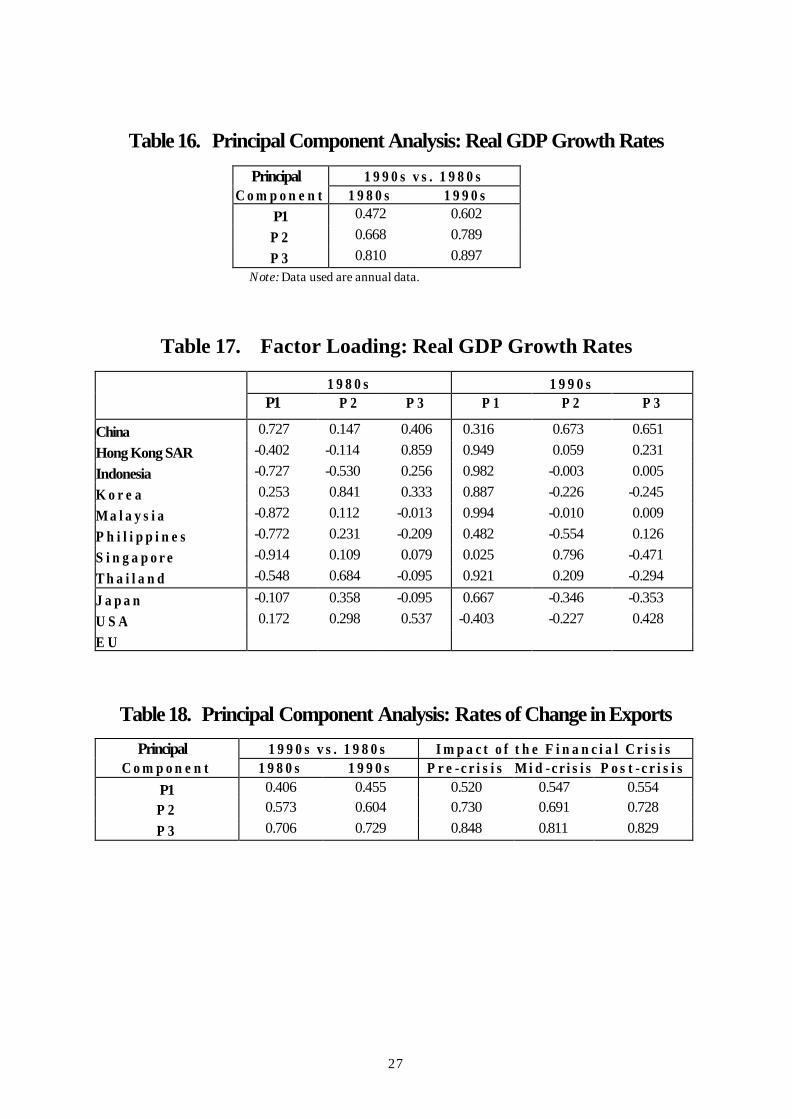
GDP growth rates. Table 16 compares the degree of confluence of real GDP
growth rates for China, Hong Kong SAR, Indonesia, Korea, Malaysia, the Philippines,
Singapore, and Thailand in the 1990s and in the 1980s. Since monthly data are not
available for the GDP growth rates, I cannot calculate the principal components before,
during and after the Asian financial crisis.
The table shows that the percentage of variance explained by any of the
principal components is larger in the 1990s than in the 1980s. Hence, fluctuations in
real economic activity in East Asia have become more synchronized in the 1990s.
Examination of factor loading for the first principal component supports this
conclusion. In the 1980s, as shown in Table 17, two countries in particular, China and
Korea, deviate from the general pattern, but in the 1990s all East Asian economies
listed in the table have real GDP growth rates very much synchronized with each other.
The table also demonstrates that in the 1990s the synchronization between East Asia’s
economic growth and Japanese growth has become stronger, while there is a negative
15
synchronization between East Asia’s economic growth and US growth. That is, East
Asia is much more synchronized with Japan in terms of economic fluctuations than
with the United States.
Export performance. Table 18 shows the first three principal components of
the rate of growth in exports for China, Hong Kong SAR, Indonesia, Korea, Malaysia,
the Philippines, Singapore, and Thailand. It demonstrates that the degree of confluence
in export performance in East Asia has risen in the 1990s, and also after the Asian
financial crisis. But this rise is not very significant.
4. IS Shocks
Finally, I identify IS shocks in East Asia by estimating investment functions,
and then examine the degree of synchronization of IS shocks by applying the principal
component analysis to the estimated shocks. I concentrate on disturbances on
investment functions because the consumption function is much more stable.
The following investment function is estimated for six countries in East Asia,
namely, Indonesia, Korea, Malaysia, the Philippines, Singapore, and Thailand:
lnZt = α + β1 lnrt-1 + β2 lnYt-1 + β3 t + ut
where lnZt = natural log of investment (in real terms) at time t,
lnrt-1 = natural log of the interest rate at time t-1,
lnYt-1 = natural log of real GNP at time t-1,
t = time trend,
ut = error term.
The estimation results are generally satisfactory for most countries, with expected
signs of coefficients (i.e., β1 < 0 and β2 > 0), and with statistical significance. The
estimated residuals are considered as a proxy for real disturbances, or IS shocks, in
each country.
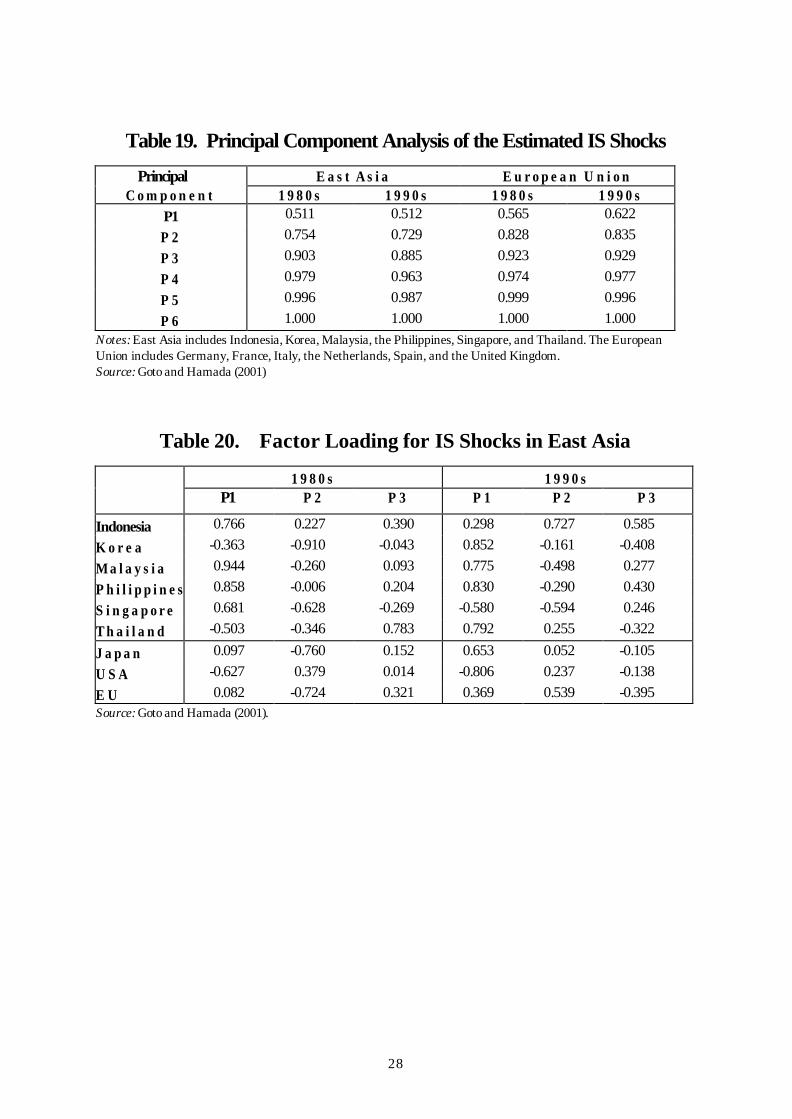
Application of the principal component analysis to the estimated IS shocks
yields the results summarized in Table 19. The table shows that the first principal
component explains a little more than 50 percent of the total variation in East Asian IS
16
shocks both in the 1980s and the 1990s (51.1 percent and 51.2 percent respectively).
This figure is lower than that for the EU (56.5 percent in the 1980s and 62.2 percent in
the 1990s). The result implies that the economic shocks among EU countries have
become more synchronized in the 1990s probably due to the political push toward
economic integration such as the ERM arrangement under the EMS and the EC92
initiative. From a pure economic viewpoint, these six East Asian countries are almost
as suitable for a currency union as the EU, most of the members of which have
surrendered monetary policy autonomy by adopting a common currency, the euro.
It is also interesting to consider the contribution of each additional variable to
the principal components. For that purpose, let us examine the “loading factor.” As
mentioned earlier, the loading factor is equivalent to the correlation coefficient
between a principal component and the original variable. The sum of the squares of
loading factors of a component equal its characteristic root.
Table 20 summarizes the loading factors for the first three principal
components for the Asian IS shocks in the 1980s and 1990s. One can make two
observations from the table. First, while Korea and Thailand were outliers in the East
Asian group in the 1980s moving in the same direction as the United States, in the
1990s they have been subject to shocks common to other East Asian economies.
Second, only Singapore is an outlier in the 1990s.
In order to find the affinity of each principal component to the three large
economies, the table reports the correlation coefficients between a principal
component with the Japanese, US, and EU variables. The correlation coefficient
between the first principal component (P1) and the real disturbances in Japan, the
United States, and Europe tells us three important facts. First, the IS shocks in East
Asia have a strong negative correlation with the IS shock in the U.S. both in the 1980s
(-0.627) and in the 1990s (-0.806). In other words, when the US faces a positive shock,
the East Asian economies face a negative shock, and vise versa. Second, East Asia’s
IS shocks had no correlation with Japan’s IS shock in the 1980s, but in the 1990s they
have a strong positive correlation with Japan’s IS shocks. Third, correlation with
Europe shows similar trend with Japan, to a lesser degree.
17
IV. Concluding Remarks
This paper has investigated economic rationale for monetary cooperation and
integration in East Asia. For that purpose, I have examined the degree of regional
economic interdependence in terms of trade, labor, and macroeconomic shocks in East
Asia.
First, I have examined real data on economic interdependence in East Asia to
answer the questions: (a) whether the various political initiatives in the 1990s toward
economic coordination have in fact produced closer economic integration in East Asia;
and (b) whether the trend toward economic integration in the region is reversed after
the Crisis. As examined above, answer to the first question is generally ‘yes’, i.e.,
interdependence among East Asia in terms of trade and migration have increased in
the 1990. The answer to the second question is mixed. Namely, as far as the
international movements of goods and labor are concerned, a temporary setback is
observed after the crisis.
Second, relying on the principal component analysis, I have found that
macroeconomic indicators of the subset of Asian countries, are pretty much
synchronized, and that the synchronization with those in Japan has increased in the
1990s, and the synchronization with Europe shows similar trend with Japan, with
lesser degree. On the other hand, the correlation with the U.S. has been negative
both in the 1980s and in the 1990s. The finding suggests that there is indeed the case
for financial integration and cooperation in East Asia, and that the pegging to a basket
of major currencies (or even to the yen) is better than the pegging to the dollar.
All these findings suggest a strong case for monetary cooperation and
integration among Asian countries. The next and probably more important question
is how to realized closer cooperation in such a heterogeneous group in terms of the
stage of economic development, economic system, language and so on.
18
REFERENCES Corden, W. M., 1972, “Monetary Integration,” Essays in International Finance, No. 93, Princeton University Press. Frankel, J. A., and A. K. Rose, 2000, “Estimating the Effect of Currency Unions on Trade and Output,” NBER Working Paper No. W7857. Fukuda,S. and Hamada,K. (1988), “Towards the Implementation of Desirable Rules of Monetary Coordination and Intervention”, Economic Growth Center Paper (#411), New Haven, CT: Yale University Goto, J. and Hamada, K. (1994), “Economic Preconditions for Asian Regional Integration,” in T.Ito and A.Krueger (eds.) Macroeconomic Linkage, The University of Chicago Press Goto, J. and Hamada, K. (2001), “Is East Asia an Optimal Currency Area?,” in P. Drysdale (ed.), East Asian Trade and Financial Integration, Asia Pacific Press Hamada, K. (1985), The Political Economy of International Monetary Interdependence, (Translated by Charles Y. Horioka and Chi-Hung Kwan) Ingram,J. (1973), The Case for European Monetary Integration, Essays in International Finance (#98), Princeton, NJ: Princeton University Press Kloek, T. (1987), “Principal Components,” in J. Eatwell et. al. eds. The New Palgrave a Dictionary of Economics. Lucas,R.E.Jr. (1982), “Interest Rates and Currency Prices in a Two-Country World”, Journal of Monetary Economics, vol.10, 335-359 Mckinnon,R. (1963), “Optimum Currency Area”, American Economic Review , vol.53, pp.717-24 Mundell,R. (1961), “The Theory of Optimum Currency Areas”, American Economic Review, vol.51, pp.657-64 Rose, A. J., “One Money, One Market: Estimating the Effect of Common Currencies on Trade.” NBER Working Paper 7432
19
Figure 1 : Share of East As ia in Trade
0.0
5.0
10.0
15.0
20.0
25.0
30.0
35.0
40.0
45.0
1985 1986 1987 1988 1989 1990 1991 1992 1993 1994 1995 1996 1997 1998 1999
year
perc
ent
WORLD
East Asia 14
Japan
United States
EUROPEAN UNION
Table 1: Trade Dependency Index, East Asia 14 as Partner
Reporters 1980 1985 1990 1995 1996 1997 1998 1999
Brunei Darussalam 17.03 27.20 33.63 59.88 62.05 62.41 33.93 36.47Myanmar 4.43 2.19 2.20 2.24 1.76 1.40 0.89 0.84Cambodia 5.47 53.53 48.67 38.96 41.91 52.67Indonesia 7.64 5.96 9.91 11.41 12.02 13.70 27.12 23.41Lao P. D. Rep. 1.89 18.28 31.26 34.82 24.42 43.31 45.13Malaysia 26.78 30.36 49.72 62.36 61.05 62.42 70.21 78.53Philippines 6.92 8.55 11.03 16.73 15.93 22.59 29.11 29.99Singapore 140.24 107.65 112.06 130.61 125.91 124.86 112.95 122.74Thailand 11.62 11.31 15.76 21.80 20.36 24.01 26.06 29.71Vietnam 0.98 23.03 37.98 45.79 43.46 38.00 38.76Taiwan; China 12.81 10.77 14.71 24.14 23.50 24.96 23.75 25.55Hong Kong 47.40 71.24 106.56 138.20 130.86 123.69 117.09 121.72Korea 6.11 7.23 6.84 12.66 13.57 15.77 18.80 17.63China 3.36 5.23 14.73 14.26 12.36 13.33 11.73 12.06(average of the above) 25.85 22.35 30.28 44.08 43.47 42.57 42.49 45.37
Japan 6.51 5.84 5.05 5.97 6.58 7.00 6.12 6.20United States 2.07 2.04 2.78 4.11 4.07 4.19 3.91 4.05
sources: IMF, Direction of Trade Statistics; World Bank database.
20
Tab l e 2 : T r a de I n t e n s i t y I n d i c e s among Ea s t As i n a Coun t r i e s ( 1 999 )
Brunei Myanmar Cambodia IndonesiaLao P. D. Rep.Malaysia Philippines Singapore Thailand Vietnam Taiwan Hong Kong Korea China
Brunei Darussalam 0.18 0.01 4.34 0.00 6.68 0.35 8.24 8.75 0.11 0.17 0.37 3.46 0.15Myanmar 0.18 0.30 7.19 0.00 6.37 0.45 7.71 0.00 0.00 1.98 1.01 2.67 4.66Cambodia 0.01 0.30 2.27 1.23 1.17 0.18 9.33 14.44 84.22 2.72 2.27 1.25 1.24Indonesia 4.34 7.19 2.27 0.28 2.61 1.55 5.58 2.85 4.62 2.07 0.92 3.39 1.77Lao P. D. Rep. 0.00 0.00 1.23 0.28 0.11 0.02 2.37 50.92 21.33 0.44 0.39 0.59 1.09Malaysia 6.68 6.37 1.17 2.61 0.11 2.82 11.18 3.47 2.09 2.21 1.19 1.82 0.83Philippines 0.35 0.45 0.18 1.55 0.02 2.82 3.67 2.59 1.89 3.78 1.73 2.52 0.84Singapore 8.24 7.71 9.33 5.58 2.37 11.18 3.67 4.90 4.61 2.12 2.03 1.71 1.20Thailand 8.75 0.00 14.44 2.85 50.92 3.47 2.59 4.90 4.17 2.01 1.46 1.15 1.06Vietnam 0.11 0.00 84.22 4.62 21.33 2.09 1.89 4.61 4.17 3.85 1.00 3.44 1.85Taiwan; China 0.17 1.98 2.72 2.07 0.44 2.21 3.78 2.12 2.01 3.85 4.59 1.76 0.90Hong Kong 0.37 1.01 2.27 0.92 0.39 1.19 1.73 2.03 1.46 1.00 4.59 1.61 9.12Korea 3.46 2.67 1.25 3.39 0.59 1.82 2.52 1.71 1.15 3.44 1.76 1.61 2.67China 0.15 4.66 1.24 1.77 1.09 0.83 0.84 1.20 1.06 1.85 0.90 9.12 2.67
average 5.51
(Japan) 4.67 1.33 0.33 3.27 0.63 2.25 2.95 1.82 3.02 2.54 2.92 1.56 2.49 2.52(USA) 0.78 0.46 0.59 0.91 0.10 1.20 1.59 1.15 1.11 0.27 1.46 1.10 1.35 1.02
source: IMF, Direction of Trade Statistics.
Tab le 3 : Trade In tens i ty Ind ices among EU Members (1999)
AustriaBelgium-LuxembourgDenmark Finland France Germany Greece Ireland Italy Netherlands Portugal Spain Sweden UK
Austria 0.79 0.98 1.14 0.90 4.53 0.95 0.46 2.22 0.99 0.74 0.98 0.95 0.67Belgium-Luxembourg0.79 0.93 0.95 2.90 2.03 1.08 1.31 1.24 3.66 1.37 1.44 1.39 1.75Denmark 0.98 0.93 4.59 1.04 2.33 1.55 1.43 1.06 1.64 1.17 0.97 8.43 1.62Finland 1.14 0.95 4.59 0.91 1.76 1.65 1.00 0.94 1.42 1.04 0.93 8.51 1.50France 0.90 2.90 1.04 0.91 2.04 1.52 1.32 2.50 1.62 2.33 3.58 1.08 1.82Germany 4.53 2.03 2.33 1.76 2.04 1.64 1.15 2.02 2.44 1.91 1.70 1.58 1.44Greece 0.95 1.08 1.55 1.65 1.52 1.64 0.72 4.04 1.38 0.69 1.62 1.42 1.11Ireland 0.46 1.31 1.43 1.00 1.32 1.15 0.72 0.85 1.36 0.61 1.06 1.12 5.17Italy 2.22 1.24 1.06 0.94 2.50 2.02 4.04 0.85 1.17 1.79 2.51 0.95 1.24Netherlands 0.99 3.66 1.64 1.42 1.62 2.44 1.38 1.36 1.17 1.24 1.21 1.77 1.91Portugal 0.74 1.37 1.17 1.04 2.33 1.91 0.69 0.61 1.79 1.24 10.19 1.14 1.54Spain 0.98 1.44 0.97 0.93 3.58 1.70 1.62 1.06 2.51 1.21 10.19 1.23 1.51Sweden 0.95 1.39 8.43 8.51 1.08 1.58 1.42 1.12 0.95 1.77 1.14 1.23 1.75UK 0.67 1.75 1.62 1.50 1.82 1.44 1.11 5.17 1.24 1.91 1.54 1.51 1.75
average 2.35
(Japan) 0.22 0.34 0.44 0.45 0.30 0.48 0.47 0.57 0.33 0.54 0.28 0.27 0.42 0.54(USA) 0.26 0.44 0.32 0.45 0.47 0.54 0.28 0.99 0.49 0.44 0.24 0.29 0.52 0.89
source: IMF, Direction of Trade Statistics.
21
Table 4 : Trade Intensity with East Asia 14
1980 1985 1990 1995 1996 1997 1998 1999
Brunei Darussalam 1.86 2.42 2.68 2.34 2.46 2.34 1.57 2.08Myanmar 4.55 3.52 3.59 2.88 2.51 1.86 1.50 1.34Cambodia 0.00 3.95 6.05 4.03 2.80 4.09 2.57 2.80Indonesia 2.39 2.01 2.06 1.71 1.98 2.04 2.17 2.09Lao P. D. Rep. 0.00 7.02 6.21 3.42 4.62 1.06 0.38 1.29Malaysia 4.12 3.89 3.56 2.59 2.76 2.65 2.39 2.36Philippines 2.09 2.08 1.42 1.49 1.41 1.48 1.57 1.89Singapore 5.82 4.15 3.52 3.32 3.33 3.26 2.96 2.99Thailand 3.51 2.67 1.75 2.00 2.09 2.07 1.86 1.93Vietnam 0.00 1.53 2.08 2.55 2.81 2.56 1.57 1.50Hong Kong 3.18 4.30 3.83 3.18 3.23 3.15 3.11 2.95Korea 1.73 1.27 1.42 2.22 2.40 2.39 2.13 2.14Taiwan; China 2.47 1.77 2.36 2.60 2.58 2.53 2.32 2.39China 4.36 4.19 4.79 2.61 2.43 2.60 2.36 2.18(average of the above) 2.58 3.20 3.24 2.64 2.67 2.43 2.03 2.14
Japan 3.26 2.39 2.38 2.44 2.46 2.30 1.95 2.04United States 1.40 1.17 1.15 1.09 1.06 0.99 0.86 0.87France 0.20 0.32 0.29 0.36 0.34 0.37 0.31 0.23Germany 0.35 0.36 0.32 0.42 0.42 0.38 0.30 0.29Italy 0.23 0.30 0.30 0.37 0.41 0.36 0.24 0.24United Kingdom 0.48 0.40 0.42 0.42 0.42 0.41 0.32 0.32
source: IMF, Direction of Trade Statistics.
22
(number) 1970 1980 1990 1997
Asia 672,280 734,476 924,560 1,086,390North America 1,290 2,719 71,495 284,691South America 20,892 24,743 44,643 55,312North Europe 11,902 15,897 25,563 38,200Oceania 1,044 1,561 5,440 9,645 Africa 232 795 2,140 6,275 Total 707,640 780,191 1,073,841 1,480,513
(share, %) 1970 1980 1990 1997
Asia 95.00 94.14 86.10 73.38 North America 0.18 0.35 6.66 19.23 South America 2.95 3.17 4.16 3.74 North Europe 1.68 2.04 2.38 2.58 Oceania 0.15 0.20 0.51 0.65 Africa 0.03 0.10 0.20 0.42 Total 100.00 100.00 100.00 100.00
Source: Japanese Ministry of Justice
Table 5: Registered Foreigners in Japan, by Origin
23
Table 6. Indonesia: Workers Abroad, by Destination
Year 1 9 9 5 1 9 9 7
Destination Countries N u m b e r
( 1 0 0 0 ) S h a r e
( % ) N u m b e r
I. (1000) S h a r e
( % ) Asia Pacific 68.4 56.7 375.4 74.6
B r u n e i 0.8 0.7 2.4 0.5 H o n g K o n g S A R 4.2 3.5 2.0 0.4 Japan 1.4 1.2 3.2 0.6 K o r e a 6.7 5.6 8.4 1.7 M a l a y s i a 29.7 24.6 317.7 63.2 S i n g a p o r e 21.0 17.4 31.9 6.3 T a i w a n P O C 4.1 3.4 9.4 1.9 O t h e r A s i a P a c i f i c 0.4 0.4 0.2 0.0 A m e r i c a 3.5 2.9 0.7 0.1 E u r o p e 0.0 0.1 0.6 0.1 M i d d l e E a s t & A f r i c a 47.5 39.4 116.8 23.2 O t h e r 1.2 1.0 10.0 2.0
T o t a l 120 .6 100 .0 503 .0 100 .0 Source: Scalabrini Migration Center.
Table 7. The Philippines: Overseas Workers, By Destination
Year 1 9 9 0 1 9 9 6 1 9 9 7 1 9 9 8 D e s t i n a t i o n C o u n t r i e s / R e g i o n s
Number( 1 0 0 0 )
Share( % )
N u m b e r( 1 0 0 0 )
Share( % )
N u m b e r( 1 0 0 0 )
Share( % )
N u m b e r( 1 0 0 0 )
Share(% )
Asia 90.8 27.1 174.3 36.0 235.1 42.0 221.3 39.3 H o n g K o n g S A R 34.4 10.3 43.9 9.0 -- -- -- -- J a p a n 41.6 12.4 20.2 4.2 -- -- -- -- M a l a y s i a 4.4 1.3 12.3 2.5 -- -- -- -- S i n g a p o r e 4.7 1.4 15.1 3.1 -- -- -- -- T a i w a n P O C 0.1 0.0 65.5 13.5 -- -- -- -- O t h e r A s i a 5.6 1.7 17.4 3.6 -- -- -- -- A m e r i c a s 9.6 2.9 8.4 1.7 7.1 1.3 8.2 1.5 E u r o p e 6.9 2.0 11.4 2.4 12.6 2.3 15.7 2.8 M i d d l e E a s t 218.1 65.1 221.2 45.6 221.0 39.5 226.8 40.3 O t h e r 9.6 2.9 69.3 14.3 79.9 14.3 84.9 15.1
Total 3 3 4 .9 100 .0 484 .7 100 .0 559 .2 100 .0 562 .4 100 .0 Source: Philippines Overseas Administration Office; Philippines Overseas Employment Administration.
24
Table 8. Thailand: Deployed Overseas Workers, by Destination
Year 1 9 9 3 1 9 9 6
D e s t i n a t i o n C o u n t r i e s N u m b e r (1 0 0 0 )
S h a r e ( % )
N u m b e r (1000)
S h a r e ( % )
Asia-5 94.1 82.4 148.8 80.3
S i n g a p o r e 1.7 1.5 17.6 9.5
B r u n e i 14.4 12.6 20.7 11.2
H o n g K o n g S A R 5.4 4.7 4.3 2.3
J a p a n 5.7 5.0 10.1 5.5
T a i w a n P O C 66.9 58.6 96.1 51.8
M i d d l e E a s t 16.9 14.8 22.4 12.1
O t h e r 3.1 2.7 14.2 7.6
T o t a l 114.1 100 .0 185 .4 100 .0 Source: Thai Government.
Table 9. Immigrant Workers and the Asian Financial Crisis
Year 1 9 9 7 M i d -1 9 9 8 C h a n g e
Host Countries N u m b e r ( 1 0 0 0 )
S h a r e ( % )
N u m b e r (1000)
P e r c e n t ( % )
Hong Kong SAR 300 300 0 0.0
J a p a n 700 680 -20 -2.9
K o r e a 267 150 -117 -43.8
M a l a y s i a 1,700 1,300 -400 -23.5
S i n g a p o r e 450 400 -50 -11.1
T h a i l a n d 1,260 800 -460 -36.5
T o t a l 4,677 3,630 -1,047 -22.4 Source: ILO (1999).
25
Table 10. Principal Component Analysis: Rates of Change in Money
Supply
Principal 1 9 9 0 s v s . 1 9 8 0 s I m p a c t o f t h e F i n a n c i a l C r i s i s C o m p o n e n t 1 9 8 0 s 1 9 9 0 s P r e - c r i s i s M i d - c r i s i s P o s t - crisis
P1 0.446 0.569 0.417 0.751 0.525
P 2 0.693 0.828 0.688 0.905 0.864
P 3 0.892 0.934 0.872 0.960 0.944
Table 11: Factor Loading: Rates of Change in Money Supply
Principal 1 9 9 0 s v s . 1 9 8 0 s I m p a c t o f t h e F i n a n c i a l C r i s i sC o m p o n e n t 1 9 8 0 s 1 9 9 0 s P r e - c r i s i s M i d - c r i s i s P o s t - crisisP1: Indonesia 0.453 0.706 0.710 0.959 0.494
K o r e a 0.602 -0.881 -0.688 -0.887 0.809
P h i l i p p i n e s -- -- 0.207 -0.856 0.873
S i n g a p o r e 0.859 -0.846 -0.473 -0.947 0.568
T h a i l a n d 0.692 -0.534 -0.916 -0.644 0.800
[ J a p a n ] 0.040 0.060 -0.480 -0.107 0.685
P2: Indonesia 0.854 0.627 0.439 0.087 0.835
Korea -0.348 -0.015 0.607 0.185 -0.264
P h i l i p p i n e s -- -- 0.873 -0.365 -0.249
S i n g a p o r e 0.083 0.032 0.177 -0.250 -0.748
T h a i l a n d -0.359 0.803 -0.010 0.729 0.554
[ J a p a n ] -0.139 0.101 -0.118 0.134 -0.288
P3: Indonesia 0.068 0.092 0.347 0.056 0.045
K o r e a 0.701 -0.366 -0.128 -0.372 0.516
P h i l i p p i n e s -- -- -0.257 0.289 -0.332
S i n g a p o r e -0.094 0.521 0.838 -0.011 -0.105
T h a i l a n d -0.539 -0.100 -0.125 0.228 -0.112
[ J a p a n ] -0.177 -0.116 -0.334 0.605 -0.233
26
Table 12. Principal Component Analysis: Interest Rates
Principal 1 9 9 0 s v s . 1 9 8 0 s I m p a c t o f t h e F i n a n c i a l C r i s i s Component 1 9 8 0 s 1 9 9 0 s P r e - c r i s i s M i d - c r i s i s P o s t - crisis
P1 0.536 0.671 0.478 0.475 0.603
P 2 0.827 0.792 0.689 0.681 0.860
P 3 0.930 0.902 0.819 0.812 0.937
Table 13. Principal Component Analysis: Rates of Change in
Consumer Prices
Principal 1 9 9 0 s v s . 1 9 8 0 s I m p a c t o f t h e F i n a n c i a l C r i s i s C o m p o n e n t 1 9 8 0 s 1 9 9 0 s P r e - c r i s i s M i d - c r i s i s P o s t - crisis
P1 0.590 0.492 0.697 0.626 0.672
P 2 0.792 0.829 0.884 0.939 0.931
P 3 0.934 0.938 0.978 0.990 0.984
Table 14. Principal Component Analysis: rates of Change in Stock
Prices
Principal 1 9 9 0 s v s . 1 9 8 0 s I m p a c t o f t h e F i n a n c i a l C r i s i s C o m p o n e n t 1 9 8 0 s 1 9 9 0 s P r e - c r i s i s M i d - c r i s i s P o s t - c r i s i s
P1 0.459 0.612 0.433 0.609 0.548
P 2 0.590 0.712 0.631 0.735 0.711
P 3 0.712 0.787 0.777 0.830 0.828
Table 15. Principal Component Analysis: Changes in Exchange Rates
Principal 1 9 9 0 s v s . 1 9 8 0 s I m p a c t o f t h e F i n a n c i a l C r i s i s C o m p o n e n t 1 9 8 0 s 1 9 9 0 s P r e - c r i s i s M i d - c r i s i s P o s t - c r i s i s
P1 0.260 0.517 0.403 0.547 0.365
P 2 0.401 0.648 0.600 0.741 0.602
P 3 0.533 0.775 0.749 0.881 0.752
P 4 0.660 0.849 0.883 0.931 0.862
P 5 0.771 0.903 0.949 0.967 0.931
27
Table 16. Principal Component Analysis: Real GDP Growth Rates
Principal 1 9 9 0 s v s . 1 9 8 0 s C o m p o n e n t 1 9 8 0 s 1 9 9 0 s
P1 0.472 0.602
P 2 0.668 0.789
P 3 0.810 0.897 Note: Data used are annual data.
Table 17. Factor Loading: Real GDP Growth Rates
1 9 8 0 s 1 9 9 0 s
P1 P 2 P 3 P 1 P 2 P 3
China 0.727 0.147 0.406 0.316 0.673 0.651
Hong Kong SAR -0.402 -0.114 0.859 0.949 0.059 0.231
Indonesia -0.727 -0.530 0.256 0.982 -0.003 0.005
K o r e a 0.253 0.841 0.333 0.887 -0.226 -0.245
M a l a y s i a -0.872 0.112 -0.013 0.994 -0.010 0.009
P h i l i p p i n e s -0.772 0.231 -0.209 0.482 -0.554 0.126
S i n g a p o r e -0.914 0.109 0.079 0.025 0.796 -0.471
T h a i l a n d -0.548 0.684 -0.095 0.921 0.209 -0.294
J a p a n -0.107 0.358 -0.095 0.667 -0.346 -0.353
U S A 0.172 0.298 0.537 -0.403 -0.227 0.428
E U
Table 18. Principal Component Analysis: Rates of Change in Exports
Principal 1 9 9 0 s v s . 1 9 8 0 s I m p a c t o f t h e F i n a n c i a l C r i s i s C o m p o n e n t 1 9 8 0 s 1 9 9 0 s P r e - c r i s i s M i d - c r i s i s P o s t - c r i s i s
P1 0.406 0.455 0.520 0.547 0.554
P 2 0.573 0.604 0.730 0.691 0.728
P 3 0.706 0.729 0.848 0.811 0.829
28
Table 19. Principal Component Analysis of the Estimated IS Shocks
Principal E a s t A s i a E u r o p e a n U n i o n C o m p o n e n t 1 9 8 0 s 1 9 9 0 s 1 9 8 0 s 1 9 9 0 s
P1 0.511 0.512 0.565 0.622
P 2 0.754 0.729 0.828 0.835
P 3 0.903 0.885 0.923 0.929
P 4 0.979 0.963 0.974 0.977
P 5 0.996 0.987 0.999 0.996
P 6 1.000 1.000 1.000 1.000 Notes: East Asia includes Indonesia, Korea, Malaysia, the Philippines, Singapore, and Thailand. The European Union includes Germany, France, Italy, the Netherlands, Spain, and the United Kingdom. Source: Goto and Hamada (2001)
Table 20. Factor Loading for IS Shocks in East Asia
1 9 8 0 s 1 9 9 0 s
P1 P 2 P 3 P 1 P 2 P 3
Indonesia 0.766 0.227 0.390 0.298 0.727 0.585
K o r e a -0.363 -0.910 -0.043 0.852 -0.161 -0.408
M a l a y s i a 0.944 -0.260 0.093 0.775 -0.498 0.277
P h i l i p p i n e s 0.858 -0.006 0.204 0.830 -0.290 0.430
S i n g a p o r e 0.681 -0.628 -0.269 -0.580 -0.594 0.246
T h a i l a n d -0.503 -0.346 0.783 0.792 0.255 -0.322
J a p a n 0.097 -0.760 0.152 0.653 0.052 -0.105
U S A -0.627 0.379 0.014 -0.806 0.237 -0.138
E U 0.082 -0.724 0.321 0.369 0.539 -0.395 Source: Goto and Hamada (2001).


