Embed Size (px)
Citation preview
Economic Recovery in the
Oil, Reforms, Rebound – or All of the Above?
Oleh HavrylyshynVisiting Fellow
Centre for European, Russian, and Eurasian Studies
O C C A S I O N A L PA P E R • N O . V II • 2 0 0 7
Oleh Havrylyshyn
ISBN 978-0-7727-0836-6ISSN 1715-3476
CONTROVERSIE S IN
GLOBAL POLITIC S
& SOCIETIES
Oleh Havrylyshyn (PhD, Massachusetts Institute of Technology) was Professor of Economics at Queen’s University, Kingston, and George Washington University, and has been a Visiting Professor at Université Libre de Bruxelles, the University of Geneva, and the Institute of World Economy in Kyiv. In his academic career, he focused on international economics and development issues, writing extensively on these topics and serving as a consultant on development to the World Bank, UNDP, UNCTAD, and CIDA. Since 1988, he has focused on post-communist transition, both in policy positions and analytical research. Dr. Havrylyshyn served as Deputy Minister of Finance, International Affairs, in the first independent Government of Ukraine, and then became Ukraine’s representative as Alternate Executive Director of the Board at the IMF. He has been a senior staff member of the IMF since 1996, including most recently as Deputy Director, European II Department, responsible for operations in countries of the former Soviet Union.
Commonwealth of Independent States:

C O N T R O V E R S I E S I N G L O B A LP O L I T I C S & S O C I E T I E S
E C O N O M I C R E C O V E R YI N T H E C O M M O N W E A LT H O F
I N D E P E N D E N T S T AT E S :O I L , R E F O R M S , R E B O U N D –
O R A L L O F T H E A B O V E ?
O L E H H AV RY LY S H Y NVi s i t i n g F e l l o w
C E N T R E F O R E U R O P E A N , R U S S I A N ,A N D E U R A S I A N S T U D I E S
a t t h eM U N K C E N T R E
f o rI N T E R N AT I O N A L S T U D I E S
MUNK CENTRE FOR INTERNATIONAL STUDIESUNIVERSITY OF TORONTO
The Munk Centre for International Studies at the University of Toronto seeks to be an internationally recognized leader in interdisciplinary academic research onglobal issues and to integrate research with teaching and public education. Weplace special emphasis on the fostering of innovative interdisciplinary knowledgethrough the exchange of ideas and research among academics as well as the public, private, and voluntary sectors.
CENTRE FOR EUROPEAN, RUSSIAN, AND EURASIAN STUDIESUniversity of Toronto1 Devonshire PlaceToronto, Ontario, Canada M5S 3K7Telephone: (416) 946-8994Fascimile: (416) 946-8939E-mail: [email protected]: www.utoronto.ca/ceres
The Centre for European, Russian, and Eurasian Studies (CERES) is one of North America’s leading academic institutes for the study of the membercountries of the European Union, the countries of the former Soviet Union, and Central and Eastern Europe. The Centre promotes interdisciplinary scholarship and teaching in the social sciences and humanities. Each yearCERES organizes several regionally focused seminar series and is host to a number of scholars in residence. Drawing upon the expertise of more than fifteen departments and dozens of faculty members, CERES also sponsors anundergraduate degree program in European Studies and a Master’s degree program in European, Russian, and Eurasian Studies. Through its intensiverelations with the European Commission, the German Academic ExchangeService, the wider local community in Toronto, and institutions of higher learn-ing across Europe, Ukraine, and Russia, CERES supports the exchange of ideasand scholars across the Atlantic.
Munk Centre for International StudiesUniversity of Toronto1 Devonshire PlaceToronto, Ontario, Canada M5S 3K7Telephone: (416) 946-8900Facsimile: (416) 946-8915E-mail: [email protected]: www.utoronto.ca/mcis
© Copyright held by author
ISBN 978-0-7727-0836-6ISSN 1715-3476
Library and Archives Canada Cataloguing in Publication
Havrylyshyn, Oleh 1980-Economic Recovery in the Commonwealth of Independent States: Oil, Reforms,Rebound – or All of the Above? / Oleh Havrylyshyn
(Controversies in global politics & societies, ISSN 1715-3476 ; no. 7) Includes bibliographical references. ISBN 978-0-7727-0836-6
1. Former Soviet republics – Economic conditions – 20th century. 2. Europe, Eastern – Economic conditions – 1989-. 3. Europe, Central –Economic conditions – 20th century. I. Munk Centre for International Studies II. Title. III. Series.HC336.27.H39 2007 330.947'0009049 C2007-905862-0
M C I S B R I E F I N G SM C I S B R I E F I N G S
E C O N O M I C R E C O V E R YI N T H E C O M M O N W E A LT H O F
I N D E P E N D E N T S TAT E S :O I L , R E F O R M S , R E B O U N D –
O R A L L O F T H E A B O V E ?
b y
O L E H H AV RY LY S H Y N
All transition countries experienced a sharp decline in output inthe early 1990s. Central Europe and the Baltics began to recoveraround 1993–95, while GDP decline continued elsewhere.Econometric analysis of growth determinants explained this bythe fact of earlier inflation stabilization, market liberalization, andinstitutional development, though there was disagreement in theliterature as to the effect of initial conditions and the sequencingregarding liberalization and institutions. Since 2000 there hasbeen not just a recovery but a growth surge in the Commonwealthof Independent States, even though it still lags behind on the three key policy determinants of growth. The energy boom in theregion can explain only part of the growth in the region and ismore relevant to energy exporters such as Russia. The post-transition recovery is best explained by a threshold model: recoverystarts when a certain threshold level of stabilization, liberaliza-tion, and institutional development is reached. The levels reachedby CIS countries around 1999–2000 were in fact very similar tothose that the early reformers of Central Europe and the Balticshad attained just before their GDP growth restarted. The empiri-cal comparisons reveal two important facts that are relevant todebates on the role of institutions and liberalization. The level ofinstitutional development needed to restart growth is not onlysimilar but surprisingly low for all the countries. Also, thesequencing was in all cases exactly the same, with liberalizationmoving much more quickly than institutions in both rapid andlagging reformers. Not a single instance exists of liberalizationbeing delayed to allow faster introduction of institutions.
Controversies in Global Politics & Societies
1. Beyond Nationhood: Citizenship Politics in Germany since Unification. ByThomas Faist and Triadafilos Triadafilopoulos.2006 ISBN 0-7727-0824-X
2. An Institutional Theory of WTO Decision-Making: Why Negotiation in the WTOResembles Law-Making in the U.S. Congress. By Gilbert R. Winham.2006 ISBN 0-7727-0825-8
3. Official Apologies and the Quest for Historical Justice. By Michael R. Marrus.2006 ISBN 0-7727-0826-6
4. The World Trade Organization: NGOs, New Bargaining Coalitions, and aSystem under Stress. By Sylvia Ostry.2006 ISBN 0-7727-0828-2
5. The Private Regulation of Global Corporate Conduct. By David Vogel.2006 ISBN 0-7727-0831-2
6. Revisiting Plessy and Brown: Why “Separate but Equal” Cannot Be Equal.By Mohammed Saif-Alden Wattad.2007 ISBN 978-0-7727-0833-5
7. Economic Recovery in the Commonwealth of Independent States: Oil, Reforms,Rebound – or All of the Above? By Oleh Havrylyshyn.2007 ISBN 978-0-7727-0836-6
M C I S B R I E F I N G S
1
This paper was originally prepared for presentation at the Seventh Annual GlobalDevelopment Conference, St. Petersburg, Russia, January 19, 2006. I am grateful for suggestions offered by Lucio Vinhas de Souza, Marek Rohozynski, and WaldemarSkrobacki, participants of a seminar presentation at the Munk Centre, October 2006, and for the comments provided by two anonymous reviewers. Nikola Milicic providedvaluable research assistance for this paper.
transition countries can be explained, a certain amount of consensusemerged that the most important determinants were as follows: earlystabilization, good progress on market reforms, and initial condi-tions. These seemed to explain why CEB recovered early whereasthe CIS continued to decline. The role of institutional developmentwas more ambiguous: it was little explored in these studies, and theresults varied. When the CIS growth surge began, this consensus didnot provide a fully satisfactory explanation because these states werestill far behind CEB in reform progress. Alternative factors such assoaring oil prices were often viewed as the explanation.
Thus the literature leaves us with one puzzle and one unexploreddimension. The puzzle is why many CIS countries where reformscontinued to lag behind the CEB group experienced a growth surgebeginning about 2000, with rates much higher than CEB countriesenjoyed in mid-1990s. The unexplored dimension concerns the roleplayed by institutions in explaining the growth recovery not only inthe CIS after 2000, but also among the CEB group in the 1990s.1
This paper has two objectives. First, it proposes explanations for the CIS growth surge and discusses how these relate to the earlierconsensus on transition growth. Second, it examines more closelythe sequencing of institutional development relative to other policyreforms – in particular, stabilization and market liberalization. This will allow some tentative conclusions to be drawn regarding thelink between institutions and growth during the transition period.2
Two related issues are not discussed here: How soon did countriesrecover to their previous GDP peaks? And what explains perform-ance beyond this recovery?
This paper contributes to the literature by using the additional yearsof data as a test of the earlier conclusions and as evidence providingnew insights. Two key conclusions come out. First, despite the roleof special one-time effects such as a surge in oil prices, the timing ofthe CIS recovery is best explained by the same factors as the earlierrecovery in CEB: a minimum threshold of reforms was reachedrelating to stabilization, liberalization, and institutional develop-ment. Second – and this is a new insight – in all transition countries,
1. INTRODUCTIONTransition countries in the European and Eurasian region all experi-enced a significant decline in output throughout the 1990s. While theextent of the decline is sometimes disputed because GDP measuresused during the Soviet era cannot be compared with those of themarket regime that followed, there is no doubt that all countries inthis region underwent a “transitional recession.” It is also agreed thatthe recovery came relatively early for Central Europe and the Baltics(CEB), which hit bottom from 1992 to 1994. Others countries, inparticular many members of the Commonwealth of IndependentStates (CIS), saw a continued decline through much of the 1990s;starting in 1999–2000, however, the latter not only began to recoverbut in fact experienced a growth surge, with annual GDP growthrates between 6 and 10 percent and sometimes more.
Many econometric studies in the late 1990s undertook to explain differences in output performances, as part of efforts to understandboth the reasons for differences in declines and the timing of recoveries. This literature was often based on the traditional literature on growth empirics, which had three main phases.Beginning with the Solow model of the 1950s, early growth theoryfocused on factors of production – capital, labour, natural resources– and their productivity. Revived interest in growth in the 1980s asexemplified by Barro and Sala-i-Martin (1995) inquired into a much broader range of conditions for higher factor accumulationand productivity, such as endogenous innovation and the expansionof human capital. Johnson and Subramanian (2005), in a useful survey of institutions, note that to answer these questions, “attention… turned increasingly to institutions.”
Surprisingly, some of the key findings in the traditional literature did not seem to apply to transition countries; in particular, thesestudies found that factor inputs and human capital were at bestinsignificant and sometimes generated negative rather than positiveeffects. Though disagreements remained regarding how growth in
C O N T R O V E R S I E S
32
1 Another puzzle, not addressed here, is the apparently strong performance in three CIScountries where reforms moved very slowly: Belarus, Turkmenistan, and Uzbekistan. 2 The analysis here builds on and updates. See Havrylyshyn (2006, pp. 59–62).
substantial efficiency gains are captured by correcting the severeinefficiencies of the communist period in two steps: first, by movingto the existing PPF; and second, by moving along this PPF to theoptimum allocation point that reflects the country’s internationalcomparative advantage. In other words, the first years of growthafter the transition recession do not involve long-term movementsfrom an equilibrium position on a low PPF to an equilibrium position on a higher one; rather, this movement constitutes a short-term adjustment from a non-equilibrium inefficiency pointbelow the PPF to an equilibrium on the PPF. Even the most optimistic views of transition in 1989 recognized that this adjust-ment would take several years – and it would seem that in manycountries it is not complete even today.5 So it is not surprising thatavailable econometric studies that do not go beyond the late 1990sshow insignificant and often negative results for the factor inputs(i.e., capital and labour). Some tentative evidence suggests that astransition nears completion among the advanced reformers, invest-ment (but not yet labour) begins to play its conventional role.6
That financial stabilization is a prerequisite for growth recovery isnot a surprising result, nor has it been controversial. Even critics ofthe Washington Consensus agreed on the need for stabilization.Some observers have argued for the use of exchange rate anchors as the centrepiece of any stabilization strategy; however, the econo-metric evidence on the effectiveness of anchors is inconclusive.7 Inthe 1990s, effective stabilization often meant a devaluation of thereal exchange rate. Some countries (the ones with currency boards,such as Estonia, Lithuania, and Bulgaria) achieved stabilizationusing an anchor. But many Central European and later most CIS andSEE countries achieved it without an anchor, though some hadcrawling/adjustable pegs (Poland), and some maintained a de factoproximity to a peg (Croatia). Arguably, Russia had a peg until 1998(Owen and Robinson 2003), with limited success in stabilization.Ukraine’s stabilization came without a clearly defined regime.
whatever the speed of policy reforms, institutions lagged behind stabilization and liberalization.
Section 2 of this paper reviews the empirical literature on determinants of recovery in transition – in particular stabilization,liberalization, initial conditions, and institutional development.Section 3 considers what lies behind the post-2000 growth surge inthe CIS and how this conforms to the earlier literature. Section 4turns to institutional development, inquiring in particular about itssequencing vis-à-vis liberalization. Finally, Section 5 summarizesthe policy implications of this study.
2. A REVIEW OF THE LITERATURE ON GROWTH IN TRANSITION
Several recent surveys on growth in the transition countries, based mainly on cross-country studies, point to a broad consensusroughly as follows: standard factor inputs are not important; priorstabilization of inflation is vital; market liberalization and structuralreforms are statistically significant; and good institutions do matter.3 Some controversy remains: Does budget control matterdirectly or as a factor in controlling inflation? Does privatizationalone have a positive effect, or does it also need adequate institu-tional change? It is generally agreed that unfavourable initial conditions negatively affect growth prospects, but several studieshave found that this effect recedes with time. It is widely agreed that good institutions are important, but how they matter, which onesare most important, and to what extent they should precede or follow other policy reforms are all open questions.4 Consider fivecore explanations: factor inputs, stabilization, liberalization, initialconditions, and institutions.
Factor inputs continue to play a large role in explanations of growthin most countries even as other explanatory variables have beenadded by the new growth economics (Barro and Sala-i-Martin1995). It is not, then, merely a matter of moving the economy towarda higher production-possibility frontier (PPF). More important,
C O N T R O V E R S I E S
54
3 This section draws on Campos and Coricelli (2002) and Havrylyshyn (2001).4 Some, including this author in Havrylyshyn (2006), infer from the econometric studiesof growth that rapid reformers generally fared better than gradual reformers. Others disagree, and the debate continues, though it is beyond the scope of this paper.
5 Gros and Steinherr (2004, pp. 116–27) use several quantitative measures to show thatafter ten years the transition was perhaps almost over for some of the CEB countries, butwas far from over in Southeast Europe (SEE) and the CIS.6 See for example Havlik (2006).7 Williamson (2005) discusses whether anchors should be seen as part of the WashingtonConsensus or not.
Eilat, and Sachs (2001) distinguished immutable initial conditions(geography, history) from changeable ones (degree of industrializa-tion, share of defence) and found that the latter mattered little aftera short time.
It is widely agreed that institutions are important for sustainedgrowth. Yet most econometric studies relating growth with institu-tions find that neither market liberalization, nor stabilization, norinstitution building has overwhelming explanatory power; instead,all of them matter in a complementary fashion.9 This last econo-metric result teaches, perhaps, a humble lesson both to big-bangreformers and to gradualists.10 Advocates of rapid reform by nowunderstand that it was not enough to recognize conceptually the roleplayed by institutions – the fact that they developed much moreslowly in some countries than in others may reflect that they weregiven less (i.e., insufficient) weight in policy recommendations.11
The lesson for gradualists: it was indeed necessary to move early on stabilization and liberalization, and probably there would havebeen little growth had institutional development been launched first, with the other two elements following. Section 4 elaborates onthese issues.
3. THE POST-2000 SURGE IN CIS GROWTH The transition process that began in 1989 in Central Europe, perhaps around 1992 for the Baltics, and generally later for the CIScountries, was accompanied by a transitional recession with a strongdecline in GDP (see Figure 1).12 Just how big this decline was, and what portion of it was attributable to continued socialist-era
Liberalization of markets and related structural reforms also showup as key determinants of growth during transition. In light of theargument that the main driver of early growth is the reallocation ofresources to more efficient uses, this is not surprising. But strongstatistical significance is generally found only for broader measuresof market reforms, such as the transition index of the European Bank for Reconstruction and Development (EBRD), less so for individual components. Thus, price liberalization alone is significant in only a few studies. In most, privatization also shows itself to be insignificant – although occasionally significant inrelation to a few parameters.8 This suggests that it is the combinedeffect of several policies that matters when it comes to creating new opportunities for efficient resource allocation and encouragingmore rational decisions by the new private sector. There emerges a clear consensus (a) that transfer of ownership alone has at most some small positive effects, and (b) that significant benefitscome only with the parallel development of competitive marketinstitutions. Some studies have found that rising exports also contribute to growth, but this may be only a proximate cause, in the sense that early export success resulted from early liberali-zation, which allowed reallocation to new markets, which attractedforeign investors to build a low-labour-cost platform for exports tonearby Europe.
Initial conditions have been measured using various yardsticks,including degree of (over)industrialization, the defence industry’sshare of the economy, the number of years under communism (a proxy for market memory), distance from Europe, the presence of war or civil conflict, and so forth. Because the possible number ofmeasures of initial conditions is so large, it is not surprising that theresults of such studies vary according to the variables chosen, theperiod chosen, and econometric parameters. De Melo, Denizer, andGelb (1997) found that initial conditions played a strong role.However, Havrylyshyn and van Rooden (2002), using the samemeasures but with access to additional years of data, point out thateven when this was true in early years, the statistical significance of initial conditions declined over time; Bakanova, Vinhas de Souza,and Abramov (2004) found the same. In the same spirit, Zinnes,
C O N T R O V E R S I E S
76
8 While many surveys of privatization effects exist, this particular point is perhaps mostthoroughly explored in the econometrics of Zinnes, Eilat, and Sachs (2001).
9 Any empirical estimate of institutional effects is fraught with difficulties. Institutionscomprise many vaguely defined elements that are highly correlated with one another, withliberalization actions, and with omitted variables. Thus econometrics has a high risk offalse attribution. The real problem is that we have not yet correctly identified the mostimportant institutions. I am grateful for this point to one of the anonymous reviewers.10 Kolodko (2004) provides a succinct review of the early debates between proponents ofgradualist-institutionalist and big-bang strategies of transition.11 International financial institutions (IFIs), such as the World Bank, the IMF, and theEBRD, are often criticized for ignoring institutions; Williamson (2005) and Havrylyshyn(2006) argue that this is a straw man, as many of their writings mention institutions beingpart of the package. A more reasonable criticism is by Moers (1999): the IFIs recognizedinstitutions but paid too little attention to them in early years. 12 The groupings shown reflect the degree of progress in transition as measured by theEBRD, following the analysis in Havrylyshyn (2006).
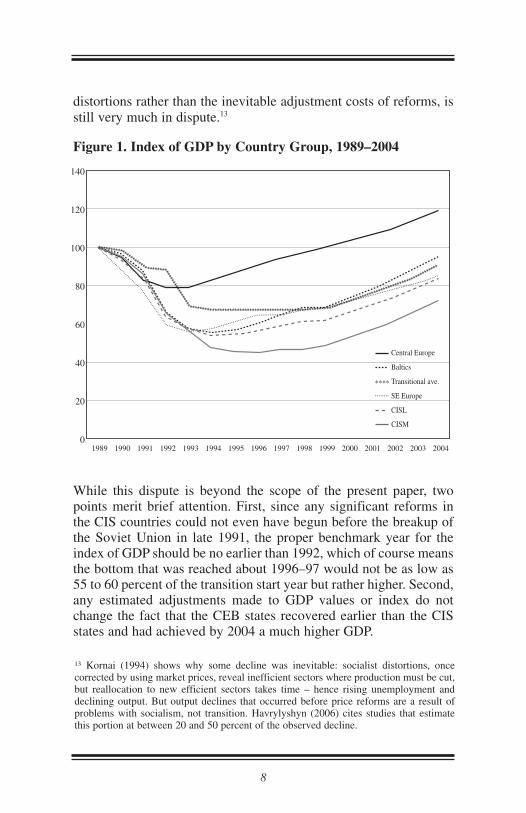
distortions rather than the inevitable adjustment costs of reforms, isstill very much in dispute.13
Figure 1. Index of GDP by Country Group, 1989–2004
While this dispute is beyond the scope of the present paper, twopoints merit brief attention. First, since any significant reforms in the CIS countries could not even have begun before the breakup ofthe Soviet Union in late 1991, the proper benchmark year for theindex of GDP should be no earlier than 1992, which of course meansthe bottom that was reached about 1996–97 would not be as low as55 to 60 percent of the transition start year but rather higher. Second,any estimated adjustments made to GDP values or index do notchange the fact that the CEB states recovered earlier than the CISstates and had achieved by 2004 a much higher GDP.
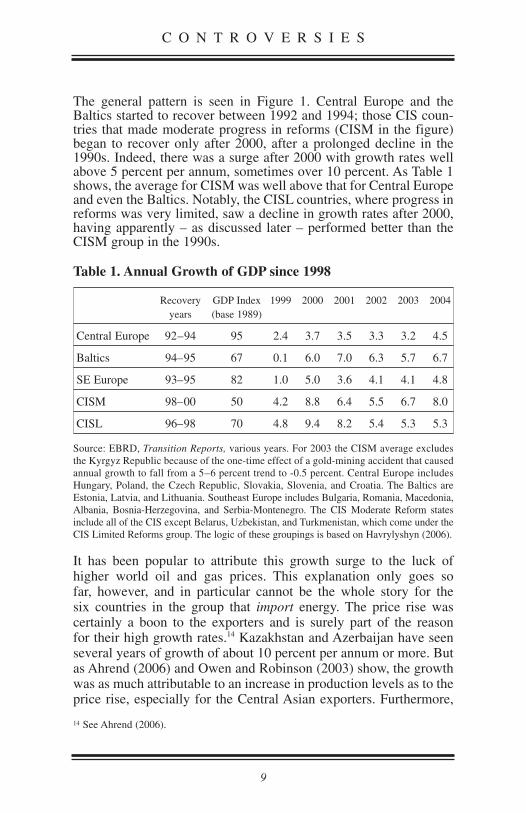
The general pattern is seen in Figure 1. Central Europe and theBaltics started to recover between 1992 and 1994; those CIS coun-tries that made moderate progress in reforms (CISM in the figure)began to recover only after 2000, after a prolonged decline in the1990s. Indeed, there was a surge after 2000 with growth rates wellabove 5 percent per annum, sometimes over 10 percent. As Table 1shows, the average for CISM was well above that for Central Europeand even the Baltics. Notably, the CISL countries, where progress inreforms was very limited, saw a decline in growth rates after 2000,having apparently – as discussed later – performed better than theCISM group in the 1990s.
Table 1. Annual Growth of GDP since 1998
Recovery GDP Index 1999 2000 2001 2002 2003 2004years (base 1989)
Central Europe 92–94 95 2.4 3.7 3.5 3.3 3.2 4.5
Baltics 94–95 67 0.1 6.0 7.0 6.3 5.7 6.7
SE Europe 93–95 82 1.0 5.0 3.6 4.1 4.1 4.8
CISM 98–00 50 4.2 8.8 6.4 5.5 6.7 8.0
CISL 96–98 70 4.8 9.4 8.2 5.4 5.3 5.3
Source: EBRD, Transition Reports, various years. For 2003 the CISM average excludes the Kyrgyz Republic because of the one-time effect of a gold-mining accident that causedannual growth to fall from a 5–6 percent trend to -0.5 percent. Central Europe includesHungary, Poland, the Czech Republic, Slovakia, Slovenia, and Croatia. The Baltics areEstonia, Latvia, and Lithuania. Southeast Europe includes Bulgaria, Romania, Macedonia,Albania, Bosnia-Herzegovina, and Serbia-Montenegro. The CIS Moderate Reform statesinclude all of the CIS except Belarus, Uzbekistan, and Turkmenistan, which come under theCIS Limited Reforms group. The logic of these groupings is based on Havrylyshyn (2006).
It has been popular to attribute this growth surge to the luck of higher world oil and gas prices. This explanation only goes so far, however, and in particular cannot be the whole story for the six countries in the group that import energy. The price rise was certainly a boon to the exporters and is surely part of the reason for their high growth rates.14 Kazakhstan and Azerbaijan have seenseveral years of growth of about 10 percent per annum or more. Butas Ahrend (2006) and Owen and Robinson (2003) show, the growthwas as much attributable to an increase in production levels as to theprice rise, especially for the Central Asian exporters. Furthermore,
C O N T R O V E R S I E S
98
14 See Ahrend (2006).
13 Kornai (1994) shows why some decline was inevitable: socialist distortions, once corrected by using market prices, reveal inefficient sectors where production must be cut,but reallocation to new efficient sectors takes time – hence rising unemployment anddeclining output. But output declines that occurred before price reforms are a result ofproblems with socialism, not transition. Havrylyshyn (2006) cites studies that estimatethis portion at between 20 and 50 percent of the observed decline.
140
120
100
80
60
40
20
01989 1990 1991 1992 1993 1994 1995 1996 1997 1998 1999 2000 2001 2002 2003 2004
Central Europe
Baltics
........****
SE Europe
CISM
CISL
Transitional ave.
..................................
************
..............................................................
.................................
.....................
....................
....................
...............
**********
************ **********
**********
**********
************
****
*********************************************
*****************
********
distortions rather than the inevitable adjustment costs of reforms, isstill very much in dispute.13
Figure 1. Index of GDP by Country Group, 1989–2004
While this dispute is beyond the scope of the present paper, twopoints merit brief attention. First, since any significant reforms in the CIS countries could not even have begun before the breakup ofthe Soviet Union in late 1991, the proper benchmark year for theindex of GDP should be no earlier than 1992, which of course meansthe bottom that was reached about 1996–97 would not be as low as55 to 60 percent of the transition start year but rather higher. Second,any estimated adjustments made to GDP values or index do notchange the fact that the CEB states recovered earlier than the CISstates and had achieved by 2004 a much higher GDP.
The general pattern is seen in Figure 1. Central Europe and theBaltics started to recover between 1992 and 1994; those CIS coun-tries that made moderate progress in reforms (CISM in the figure)began to recover only after 2000, after a prolonged decline in the1990s. Indeed, there was a surge after 2000 with growth rates wellabove 5 percent per annum, sometimes over 10 percent. As Table 1shows, the average for CISM was well above that for Central Europeand even the Baltics. Notably, the CISL countries, where progress inreforms was very limited, saw a decline in growth rates after 2000,having apparently – as discussed later – performed better than theCISM group in the 1990s.
Table 1. Annual Growth of GDP since 1998
Recovery GDP Index 1999 2000 2001 2002 2003 2004years (base 1989)
Central Europe 92–94 95 2.4 3.7 3.5 3.3 3.2 4.5
Baltics 94–95 67 0.1 6.0 7.0 6.3 5.7 6.7
SE Europe 93–95 82 1.0 5.0 3.6 4.1 4.1 4.8
CISM 98–00 50 4.2 8.8 6.4 5.5 6.7 8.0
CISL 96–98 70 4.8 9.4 8.2 5.4 5.3 5.3
Source: EBRD, Transition Reports, various years. For 2003 the CISM average excludes the Kyrgyz Republic because of the one-time effect of a gold-mining accident that causedannual growth to fall from a 5–6 percent trend to -0.5 percent. Central Europe includesHungary, Poland, the Czech Republic, Slovakia, Slovenia, and Croatia. The Baltics areEstonia, Latvia, and Lithuania. Southeast Europe includes Bulgaria, Romania, Macedonia,Albania, Bosnia-Herzegovina, and Serbia-Montenegro. The CIS Moderate Reform statesinclude all of the CIS except Belarus, Uzbekistan, and Turkmenistan, which come under theCIS Limited Reforms group. The logic of these groupings is based on Havrylyshyn (2006).
It has been popular to attribute this growth surge to the luck of higher world oil and gas prices. This explanation only goes so far, however, and in particular cannot be the whole story for the six countries in the group that import energy. The price rise was certainly a boon to the exporters and is surely part of the reason for their high growth rates.14 Kazakhstan and Azerbaijan have seenseveral years of growth of about 10 percent per annum or more. Butas Ahrend (2006) and Owen and Robinson (2003) show, the growthwas as much attributable to an increase in production levels as to theprice rise, especially for the Central Asian exporters. Furthermore,
C O N T R O V E R S I E S
98
14 See Ahrend (2006).
13 Kornai (1994) shows why some decline was inevitable: socialist distortions, once corrected by using market prices, reveal inefficient sectors where production must be cut,but reallocation to new efficient sectors takes time – hence rising unemployment anddeclining output. But output declines that occurred before price reforms are a result ofproblems with socialism, not transition. Havrylyshyn (2006) cites studies that estimatethis portion at between 20 and 50 percent of the observed decline.
140
120
100
80
60
40
20
01989 1990 1991 1992 1993 1994 1995 1996 1997 1998 1999 2000 2001 2002 2003 2004
Central Europe
Baltics
........****
SE Europe
CISM
CISL
Transitional ave.
..................................
************
..............................................................
.................................
.....................
....................
....................
...............
**********
************ **********
**********
**********
************
****
*********************************************
*****************
********
15 See Elborgh-Woytek (2003).
import-substituting domestic production. The latter is especiallyimportant. A devaluation of 40 to 50 percent was enough to makerather expensive the newly popular consumer imports with theirnon-Soviet packaging and attractive marketing. This created anincentive for domestic producers to retool the old Soviet factoriesfor modern packaging and better quality control, in order to competeagainst many Turkish, Polish, and Chinese products. The consumerdemand effect then led to a resurgence of investment in domesticindustry, further adding to growth.
Berengaut and colleagues (2003) discuss various possible factorsbehind the growth surge in Ukraine. These include, besides oilspillover and devaluation and stabilization, the simple possibilitythat Ukraine (and others) had fallen so low that the rebound, when it came, was bound to be strong. It is useful here to recall the veryhigh growth rates (5 to 10 percent) in the mid-1990s, when war and internal conflicts subsided in countries such as Azerbaijan,Armenia, Georgia, and Tajikistan. They also point to distinct budget-hardening policies under the more reform-minded Prime MinisterViktor Yushchenko and his energy minister, Yulia Tymoshenko,especially with regard to implicit energy rents and subsidies. Owenand Robinson (2003) describe a similar hardening in Russia underPresident Vladimir Putin, with regional budgets subordinated to thefederal one, tax collections greatly increased, oil revenues prudent-ly used to pay off substantial portions of the external debt – whichfell from over 60 percent of GDP in 1999 to about 17 percent in2005 – and a buildup of foreign reserves approaching $200 billion.
This surge in growth seems broadly inconsistent with the econometricconsensus described in Section 2: that earlier stabilization andgreater liberalization plus institutional development make for highergrowth. If this were true, the CEB countries, which were still muchmore advanced in structural reforms in 2000, should have continuedto enjoy the highest growth rates. In fact, their growth declined, toan average far below that of the CISM, as seen in Table 1. However,this is too static an interpretation of the relation between level ofmarket progress attained and growth. An alternative interpretation isto think of the effects of transition reforms on the restart of growthnot as a simple linear, homogeneous relation, but rather as a thresh-old effect; that is to say, for growth to restart after the transitionalrecession, a country needs to achieve some minimum threshold levelof stabilization, liberalization, and institutional development.
there are several other explanations that analyses have shown to beat least as important. Before reviewing these alternative explana-tions, consider the argument of a spillover for energy importers.
There is no doubt that increased domestic demand in Russia and among the Central Asian energy exporters spilled over to stimulate exports from their neighbours. As an example, Ukraine’sfood-processing industry experienced a sharp revival of exports toRussia after a decade of decline. But the spillover can explain onlypart of the growth in the other countries; it certainly is not enough to explain why they had growth rates as high as or even higher than the energy exporters – surely the terms of trade loss shouldhave kept their rates lower. Furthermore, the spillover effectdeclined over time; the diversification of trade away from intra-CIStrade continued, and for many in the region the share of exports toRussia had fallen from well over 50 percent in the 1990s to less than33 percent by 2002.15 In other words, their export boom was just asstrong in other directions, to the EU and Asia.
The first non-oil explanation relates to the achievement of macrostability – in particular, control of inflation. As demonstrated byVinhas de Souza and Havrylyshyn (2006), in Russia, Ukraine, andto a lesser extent Belarus, increasingly sensible fiscal and monetarypolicies began to be implemented in the mid-1990s, with inflationrates declining as a result. By 1999 inflation in the CIS countries,especially the CISM group, while still high, had fallen to low double-digits, similar to levels reached in the CEB countries only five years earlier.
The second important non-oil explanation is devaluation. Owen andRobinson (2003) demonstrate that even for Russia, oil was not thewhole story – at least as important were the beneficial side effects ofthe 1998 financial crisis, which entailed a real exchange rate deval-uation, initially about 50 percent. Their analysis demonstrates thatthere was strong growth in other sectors of the economy, some butnot all of which was a spillover effect from energy exports. Most ofthe other CISM currencies eventually followed the ruble devalua-tion, hence also benefiting from this effect on growth of export- and
C O N T R O V E R S I E S
1110
down the TPI into two components, liberalization (LIB) and institu-tions (INST).17 It is clear in Table 2 that the CEB threshold levelshad been reached by the CISM in 1999 – indeed, they had been surpassed for the LIB measure. In most CISM countries the CEBthreshold had actually been reached around 1997; and consistentwith the minimum threshold hypothesis of this paper, they hadbegun to show the first signs of a turnaround, with either very lownegative growth rates or slightly positive ones. However, the begin-ning of the recovery trend was halted by the 1998 financial crisis inRussia. From this, one can conclude that the restart of growth in theCISM countries can be explained by their having finally reached asufficient degree of progress toward a market economy to stimulatelocal economic activity. Indeed, levels of progress in the three mainpolicy areas were remarkably similar to those reached by the CEBcountries before their recovery.
In summary, we see that essentially all the CISM countries have achieved considerable progress on all three of the most impor-tant determinants described in the transition literature reviewed in Section 2. Progress is greatest for stabilization, less so for liberal-ization (structural reforms), and least for institutional development.Stabilization, as ever, requires continued vigilance, but budgets,monetary policy, and inflation levels are broadly under control.18
Liberalizing reforms still have a long way to go toward a fully functioning market economy level – a level essentially achieved inmost of the CEB countries – but even by 1999 the EBRD index ofliberalization had already surpassed the levels attained in CEBbetween 1992 and 1994. Similarly, institutional development hadreached the threshold levels seen in the CEB countries prior to theirrecovery. Thus the CISM had reached a threshold level sufficientlyhigh to stimulate growth recovery, similar to what had happened inCEB before 1995. Given the additional push from the energy boom,the post-1998 devaluations, and the much lower output levelsreached, the pace of CISM recovery since 2000 was much strongerthan seen in the mid-1990s for CEB.
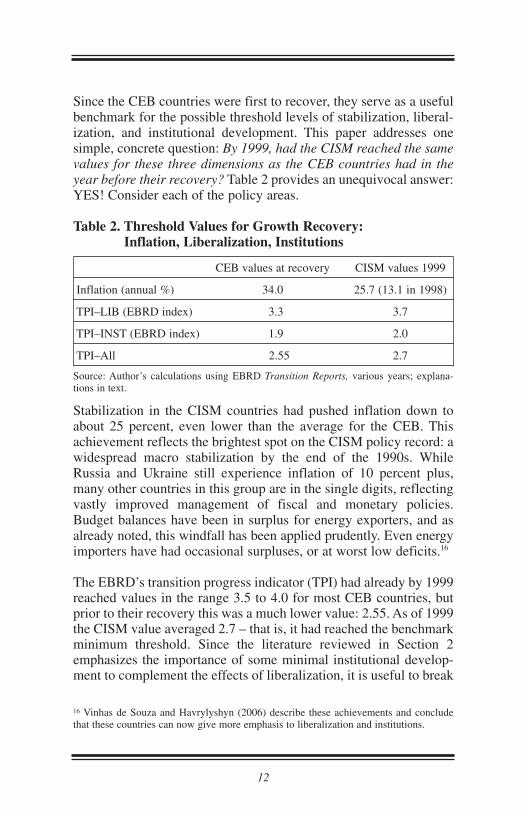
Since the CEB countries were first to recover, they serve as a usefulbenchmark for the possible threshold levels of stabilization, liberal-ization, and institutional development. This paper addresses onesimple, concrete question: By 1999, had the CISM reached the samevalues for these three dimensions as the CEB countries had in theyear before their recovery? Table 2 provides an unequivocal answer:YES! Consider each of the policy areas.
Table 2. Threshold Values for Growth Recovery: Inflation, Liberalization, Institutions
CEB values at recovery CISM values 1999
Inflation (annual %) 34.0 25.7 (13.1 in 1998)
TPI–LIB (EBRD index) 3.3 3.7
TPI–INST (EBRD index) 1.9 2.0
TPI–All 2.55 2.7
Source: Author’s calculations using EBRD Transition Reports, various years; explana-tions in text.
Stabilization in the CISM countries had pushed inflation down toabout 25 percent, even lower than the average for the CEB. Thisachievement reflects the brightest spot on the CISM policy record: awidespread macro stabilization by the end of the 1990s. WhileRussia and Ukraine still experience inflation of 10 percent plus,many other countries in this group are in the single digits, reflectingvastly improved management of fiscal and monetary policies.Budget balances have been in surplus for energy exporters, and asalready noted, this windfall has been applied prudently. Even energyimporters have had occasional surpluses, or at worst low deficits.16
The EBRD’s transition progress indicator (TPI) had already by 1999reached values in the range 3.5 to 4.0 for most CEB countries, butprior to their recovery this was a much lower value: 2.55. As of 1999the CISM value averaged 2.7 – that is, it had reached the benchmarkminimum threshold. Since the literature reviewed in Section 2emphasizes the importance of some minimal institutional develop-ment to complement the effects of liberalization, it is useful to break
C O N T R O V E R S I E S
1312
17 The definitions are elaborated in Section 4.18 The nearly universal populist attitudes of the early 1990s have been replaced by a strongconsensus that fiscal discipline is essential. Gros and Steinherr (2004, p. 244) commenton the Russia 1998 crisis as follows: “Russia did not collapse: the lesson that hyperinfla-tion has very high social and political costs had been learned by the new/old leadership,including the president of the Central bank, Mr. Gerashchenko, who had presided over theinflationary early 1990s.”
16 Vinhas de Souza and Havrylyshyn (2006) describe these achievements and concludethat these countries can now give more emphasis to liberalization and institutions.
down the TPI into two components, liberalization (LIB) and institu-tions (INST).17 It is clear in Table 2 that the CEB threshold levelshad been reached by the CISM in 1999 – indeed, they had been surpassed for the LIB measure. In most CISM countries the CEBthreshold had actually been reached around 1997; and consistentwith the minimum threshold hypothesis of this paper, they hadbegun to show the first signs of a turnaround, with either very lownegative growth rates or slightly positive ones. However, the begin-ning of the recovery trend was halted by the 1998 financial crisis inRussia. From this, one can conclude that the restart of growth in theCISM countries can be explained by their having finally reached asufficient degree of progress toward a market economy to stimulatelocal economic activity. Indeed, levels of progress in the three mainpolicy areas were remarkably similar to those reached by the CEBcountries before their recovery.
In summary, we see that essentially all the CISM countries have achieved considerable progress on all three of the most impor-tant determinants described in the transition literature reviewed in Section 2. Progress is greatest for stabilization, less so for liberal-ization (structural reforms), and least for institutional development.Stabilization, as ever, requires continued vigilance, but budgets,monetary policy, and inflation levels are broadly under control.18
Liberalizing reforms still have a long way to go toward a fully functioning market economy level – a level essentially achieved inmost of the CEB countries – but even by 1999 the EBRD index ofliberalization had already surpassed the levels attained in CEBbetween 1992 and 1994. Similarly, institutional development hadreached the threshold levels seen in the CEB countries prior to theirrecovery. Thus the CISM had reached a threshold level sufficientlyhigh to stimulate growth recovery, similar to what had happened inCEB before 1995. Given the additional push from the energy boom,the post-1998 devaluations, and the much lower output levelsreached, the pace of CISM recovery since 2000 was much strongerthan seen in the mid-1990s for CEB.
Since the CEB countries were first to recover, they serve as a usefulbenchmark for the possible threshold levels of stabilization, liberal-ization, and institutional development. This paper addresses onesimple, concrete question: By 1999, had the CISM reached the samevalues for these three dimensions as the CEB countries had in theyear before their recovery? Table 2 provides an unequivocal answer:YES! Consider each of the policy areas.
Table 2. Threshold Values for Growth Recovery: Inflation, Liberalization, Institutions
CEB values at recovery CISM values 1999
Inflation (annual %) 34.0 25.7 (13.1 in 1998)
TPI–LIB (EBRD index) 3.3 3.7
TPI–INST (EBRD index) 1.9 2.0
TPI–All 2.55 2.7
Source: Author’s calculations using EBRD Transition Reports, various years; explana-tions in text.
Stabilization in the CISM countries had pushed inflation down toabout 25 percent, even lower than the average for the CEB. Thisachievement reflects the brightest spot on the CISM policy record: awidespread macro stabilization by the end of the 1990s. WhileRussia and Ukraine still experience inflation of 10 percent plus,many other countries in this group are in the single digits, reflectingvastly improved management of fiscal and monetary policies.Budget balances have been in surplus for energy exporters, and asalready noted, this windfall has been applied prudently. Even energyimporters have had occasional surpluses, or at worst low deficits.16
The EBRD’s transition progress indicator (TPI) had already by 1999reached values in the range 3.5 to 4.0 for most CEB countries, butprior to their recovery this was a much lower value: 2.55. As of 1999the CISM value averaged 2.7 – that is, it had reached the benchmarkminimum threshold. Since the literature reviewed in Section 2emphasizes the importance of some minimal institutional develop-ment to complement the effects of liberalization, it is useful to break
C O N T R O V E R S I E S
1312
17 The definitions are elaborated in Section 4.18 The nearly universal populist attitudes of the early 1990s have been replaced by a strongconsensus that fiscal discipline is essential. Gros and Steinherr (2004, p. 244) commenton the Russia 1998 crisis as follows: “Russia did not collapse: the lesson that hyperinfla-tion has very high social and political costs had been learned by the new/old leadership,including the president of the Central bank, Mr. Gerashchenko, who had presided over theinflationary early 1990s.”
16 Vinhas de Souza and Havrylyshyn (2006) describe these achievements and concludethat these countries can now give more emphasis to liberalization and institutions.
the debate, but merely to describe the actual path followed in thetransition countries since 1989. Perhaps this will provide some ten-tative lessons. But first I review the main issues raised by the insti-tutions literature.
Key Issues Relating to Institutions and Growth 21
That institutions matter is not in dispute in the literature, but threebig questions remain very difficult to answer:
• Is a minimum critical mass required to stimulate growth?
• What are the most important market-enhancing institutions?
• Should those institutions be developed before, during, or after themain steps of stabilization and liberalization?
Regarding the first issue, no attempt has been made to quantify this, perhaps because the nature of institutions makes their many elements non-additive. This paper’s novel contribution is that it estimates for transition countries the threshold that needs to bereached prior to recovery from the transition recession. The secondand third questions are addressed only tangentially.
There is considerable disagreement on the relative importance of different institutions as well as on their sequencing, though aWorld Bank (2002) study lists institutions that should come early,some that can be developed at the same time other reforms are introduced, and others that can be allowed to evolve over a muchlonger period. The first category includes elements such as thestate’s ability to enforce basic law and order, as well as market-oriented laws and government agencies: a central bank, a financeministry that enforces budget discipline, a separate treasury fortransparent and uncorrupted implementation of budgets, regulatoryagencies for enforcing codes of commercial behaviour, and an anti-monopoly regulator.
Sequencing of institutions and liberalization was a hotly debatedissue in the transition discussions of the 1990s and continues to be a favourite topic for those who criticize the supposed failures of the Washington Consensus. These critics highlight the rush that
The apparently superior performance of the CISL countries, at leastuntil 2000, requires some attention. The official GDP values as usedin Figure 1 and Table 1 show that for these countries the decline wasnot as deep and that the turnaround came a little earlier. Similarly,the UNDP Human Development Index, which comprises manymeasures of well-being beyond GDP per capita, declined less in theCISL group than in the CISM.19 But the superior performance by theCISL countries is not seen in stabilization – indeed, even officialinflation values have been much higher in CISL countries. In addi-tion, there have been doubts about the accuracy of the statistics forthese still very Soviet-like environments. Uzbekistan’s latest ArticleIV review (IMF 2005) notes that officially, CPI inflation was 3.7percent; however, IMF staff estimates were in the range 9.1 to 15.5percent. At the same time, GDP growth rates have fallen back since2000, a trend opposite to that observed in the CISM countries. Theearlier estimates of poverty rates in Turkmenistan of 20 to 30 percentwere well below the levels of 50 percent-plus in countries such asthe Kyrgyz Republic, Moldova, and Tajikistan, but recent WorldBank estimates reverse the relationship, with the rates inTurkmenistan being much higher than in the others. In summary, thesuperior performance of the CISL countries in the 1990s comparedto the CISM countries was perhaps overstated by statistical errors,but even if this was not the case, since 2000 the performance on economic and social indicators has clearly been better in the CISMcountries. It would be too big a jump to conclude that the slow butforward-moving reforms in the CISMs were clearly superior to thevery limited reforms among the CISLs. But it would be equally toobig a jump to conclude that their apparently superior performancemakes them an example of a successful gradualist approach. Thatthey were not will be seen in the analysis of institutional develop-ments in Section 4.20
4. THE ACTUAL SEQUENCING OF INSTITUTIONS AND LIBERALIZATION: SOME LESSONS
The importance of institutional development and its relativesequencing vis-à-vis other policy reforms has been and will continueto be a hotly debated matter. This paper does not aim to engage in
C O N T R O V E R S I E S
1514
21 Comprehensive overviews are found in World Bank (2002) and Johnson andSubramanian (2005).
19 Havrylyshyn (2006, ch. 3) explores this in detail.20 Nevertheless, in the CISL group Belarus remains something of a puzzle deserving ofcloser study.
or nonexistence of formal laws and regulations. This is becauselooking only at laws “on paper” tells one little about the effective-ness of their implementation. Kremlinologists observed that inSoviet states, informal rules were far more important than paperlaws; for example, private economic activity was largely banned, but as Handelman (1994) elucidates, the existence of undergroundeconomic activity and a “Soviet mafia” speaks volumes about whatthe real “law” was. North (2006) emphasizes three levels of institu-tions: formal ones, their informal counterparts or complements, andenforcement ones. Recognizing this, the surveys from which datanow come have usually been designed carefully to reflect all of thisby relying on perceptions of affected agents and expert observers.
Early compilations of such synthetic indicators of market institu-tions were carried out by Freedom House, the Heritage Foundation,and Transparency International with its well-known CorruptionIndex. More recently, a comprehensive compilation of varioussources and many new indicators has been assembled by the WorldBank (Kaufman, Kraay, and Mastruzzi 2004); this is being updatedin annual surveys of the business or institutional climate – the“BEEPS” exercise carried out jointly with the EBRD. Such anapproach attempts to reflect the problem of informal institutions(which vested interests quickly develop to subvert the original poli-cy intentions 22) and the issue of enforcement by asking practitionersand experts such questions as “How easy is it to do business?” and“How much is bribery a problem?”
An early comparative assessment for transition countries was doneby Weder (2001). Table 3 summarizes her results for 1997–98 for the main country groups. Values for 2003 using a different scale are calculated from a World Bank study. Taken at face value, thenumbers in Table 3 suggest three broad conclusions. First, in the late 1990s transition economies were still far from the level of institutional quality prevailing in the advanced industrial countries,though the most advanced ones of the CEB group were at the samelevel as the leading emerging market countries of the developingworld. Second, the rank ordering of institutional development bycountry group was the same as that for progress toward free
was involved in liberalization and privatization, blaming the lack of prior institutional development for the poor results. In retrospect,this debate has been too theoretical and as a result has tossed manyred herrings in the path of practical solutions. It will be useful at this point to define some concepts. Transition aims to establish thebasis for a market economy through policies covering stabilization,liberalization, and institutions. Liberalization is easier to define: it includes freedom of private activity (either de novo or with privatized state assets), market determination of prices, and liberal-ized international trade and finance. Institutions are necessarily avaguer concept. Broadly, they cover the “rules of the game” for amarket economy and include such elements as a commercial code,judicial procedures for settling disputes and bankruptcies, fair traderegulations covering monopolies, stock market dealings, and techni-cal and sanitary standards. Perhaps surprisingly, there has been littledebate about the accuracy of quantitative estimates for institutions,though it is generally agreed that indices should measure not onlythe legal existence of institutions but also their effectiveness. Thedebate has always been over the relative sequencing of liberalizationand institutions – it widely agreed that financial stabilization mustcome early. Gradualists argue that liberalization should be slower, toallow institutions to be put in place. Big-bang proponents counterthat this is impractical and that it risks allowing opponents of reformto capture the process. Part of this latter argument is based on thepioneering work of Douglass North and other institutionalists, whoemphasize that institutions evolve over long periods of time. Big-bang proponents reply that it is surely not sensible or even possibleto delay all liberalization measures until “adequate” institutionshave been put in place. This paper tries to cast some light on thedebate using a retrospective examination of the actual sequencingfollowed since 1989.
The Path and Sequencing of Institutional Development since 1989Many quantitative measures of institutional development are avail-able for various types of institutions, which are then often averagedinto an overall index. These are largely measures of the effectivenessof institutions as perceived by local business and/or academicexperts, both domestic and foreign; hence they can be criticized forthe inaccuracies of subjectivity. However, this very subjectivity may paradoxically provide a better measure of the strength of these institutions than objective measures regarding the existence
C O N T R O V E R S I E S
1716
22 Alina-Pisano (2006) gives many examples of such “institutional facades” in the post-communist period.
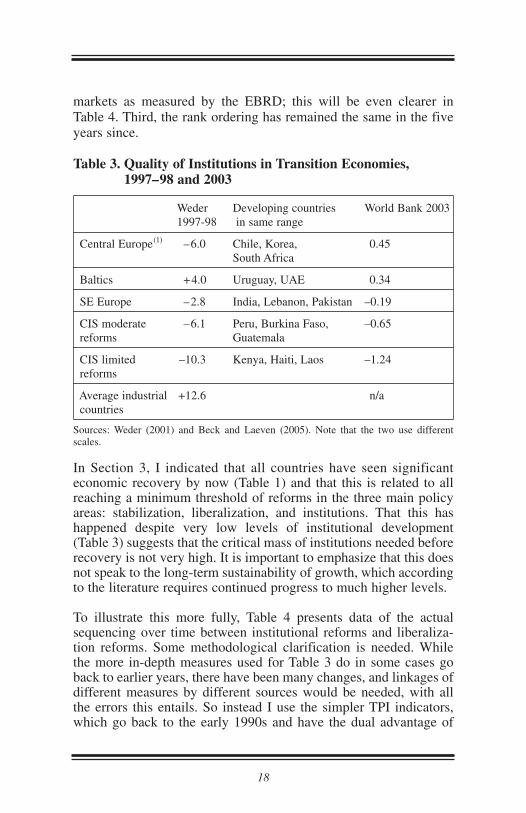
same-source consistency and same scaling for both the liberalizationindex and institutions. The well-known ten components of the TPI canbe grouped in two categories: those indicators which measure marketliberalization (EBRD’s initial phase reforms) and those which involveinstitutional changes (ERBD’s second-phase reforms). Table 4 showsvalues for LIB (liberalization) and INST (institutions) for three years:1994, 2000, and 2005. LIB includes price liberalization, foreign tradeliberalization, and small-scale privatization; INST comprises the restof EBRD’s indicators: governance and enterprise restructuring, large-scale privatization, competition policy, banking and financial sectorreform – which together can be thought of as institutional reforms.23
Indeed, in its own analysis the EBRD (2003) broadly equates second-phase reforms with institutional development. The EBRD measure isa good proxy for other, more elaborate indicators, as it has a very high rank correlation of 0.93 with the World Bank indicators used in Weder (2001).
Table 4. EBRD Transition Progress Index (TPI), Selected Years,Liberalization (LIB) vs. Institutional Development (INST)
1994 2000 2005
Central Europe LIB 3.7 4.2 4.3INST 2.7 3.1 3.3
Baltics LIB 3.7 4.1 4.3INST 2.3 2.9 3.2
SE Europe1 LIB 3.0 (n/a) 4.0 (3.9) 4.1 (4.0)INST 1.7 (n/a) 2.2 (1.9) 2.5 (2.3)
CISM LIB 2.2 3.7 3.9INST 1.4 2.1 2.2
CISL LIB 1.9 2.0 2.3INST 1.4 1.6 1.5
Source: Averages calculated from EBRD Transition Reports, 2000 and 2005, countrytables. Liberalization is the average of the following indicators: price liberalization, foreignexchange, trade liberalization, and small-scale privatization. Institutional reforms comprisegovernance, competition policy, banking reforms, and financial sector reforms.
1 For Southeast Europe the first number excludes Bosnia-Herzegovina and Serbia-Montenegro; the number in brackets includes these two.
markets as measured by the EBRD; this will be even clearer in Table 4. Third, the rank ordering has remained the same in the fiveyears since.
Table 3. Quality of Institutions in Transition Economies, 1997–98 and 2003
Weder Developing countries World Bank 20031997-98 in same range
Central Europe(1) –6.0 Chile, Korea, 0.45South Africa
Baltics +4.0 Uruguay, UAE 0.34
SE Europe –2.8 India, Lebanon, Pakistan –0.19
CIS moderate –6.1 Peru, Burkina Faso, –0.65reforms Guatemala
CIS limited –10.3 Kenya, Haiti, Laos –1.24reforms
Average industrial +12.6 n/acountries
Sources: Weder (2001) and Beck and Laeven (2005). Note that the two use differentscales.
In Section 3, I indicated that all countries have seen significant economic recovery by now (Table 1) and that this is related to allreaching a minimum threshold of reforms in the three main policyareas: stabilization, liberalization, and institutions. That this has happened despite very low levels of institutional development(Table 3) suggests that the critical mass of institutions needed beforerecovery is not very high. It is important to emphasize that this doesnot speak to the long-term sustainability of growth, which accordingto the literature requires continued progress to much higher levels.
To illustrate this more fully, Table 4 presents data of the actualsequencing over time between institutional reforms and liberaliza-tion reforms. Some methodological clarification is needed. Whilethe more in-depth measures used for Table 3 do in some cases goback to earlier years, there have been many changes, and linkages ofdifferent measures by different sources would be needed, with all the errors this entails. So instead I use the simpler TPI indicators,which go back to the early 1990s and have the dual advantage of
C O N T R O V E R S I E S
1918
23 Their index of infrastructure reform is arguably not relevant to either, and I have exclud-ed it. It typically has values lower than liberalization and about the same as institutionaldevelopment.
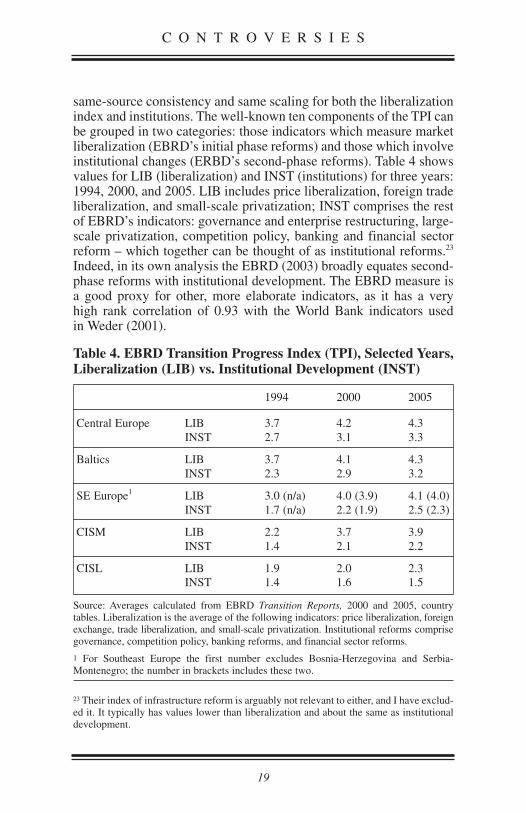
24 The table’s group averages are calculated from individual country values as in EBRD,but are not shown here to save space.25 See Havrylyshyn (2006).These three countries also lag very far behind in measures ofdemocracy and civil society.
Two facts are clear from the data in Table 4. First, throughout the region, no matter how quickly or how slowly liberalization proceeded, institutions lagged far behind. By 2005 even the mostadvanced reformers of the CEB group, which had reached LIB values of 4.3 – that is, they had essentially completed the process of achieving full liberalization equivalent to existing marketeconomies – still had INST values of about 3.2 to 3.3, well belowthe maximum. The other groups were even further behind, with therank ordering for INST exactly the same as the rank ordering forLIB. The observed sequencing is consistent with the conclusion thatgrowth can begin even when institutional development lags behindliberalization. This relative sequencing also suggests that where thewill and the capacity existed to move quickly on liberalization, therewas an equal will and capacity to move forward on institutionaldevelopment – and vice versa.
The second important fact is that there was not a single instance of a country following the theoretical path of an institutionalist-gradualist strategy, with institutions preceding or at least moving inparallel with market liberalization.24 The slower pace of reforms insome countries is sometimes attributed to their more difficult socialand political conditions. This may explain slower liberalization, butit cannot explain why institutional development was even slower.This is true not only for the more gradual reformers of the CISMgroup, but also – importantly – for the three CISL countries, wherethe political leadership often stated that they were pursuing a moregradual path to reforms to avoid the trauma of shock therapy of the sort suffered by their neighbours. Here, many outside observerspoint to the “success” of Belarus in maintaining better growth performance (see Table 1). Just how well these three countriesavoided the transition recession and the social costs of reform is not discussed here, but one thing is clear: none of them used the opportunity of gradual liberalization to move ahead with institu-tional development – indeed, they moved even more slowly on institutions than the CISM countries.25 I argue below that the mostplausible interpretation of the observable facts on liberalization-institutions sequencing concerns the sincerity of commitment to
reform. National leaders who pushed for rapid liberalization werealso sincerely committed to later institutional development; nationalleaders who argued for delays in liberalization were not sincere intheir commitment either to prior institutional development or to realliberalization.
The observed lag and slower pace of institutional reforms comparedto liberalization is consistent with the hypothesis stated earlier thatinstitutional reforms cannot be implemented as quickly as manycomponents of liberalization. But logically it is also consistent witha key criticism of the Washington Consensus: that institutions werenot given enough emphasis early on. This debate cannot be resolvedeasily, as there is no benchmark that reflects the useful command-ment of Vaclav Klaus: “Reform as fast as possible.” The evidence istherefore easily used by both gradualists and big-bang proponents insupport of their arguments. This dilemma merits a closer look; tothat end, let us compare the time patterns across groups.
By 1994 the CEB countries had reached the very high LIB level of3.7, broadly comparable to many mixed economies in the West. By1999 this had increased substantially, and by 2005 it had reached the maximum 4.3 rating of the EBRD index. It is especially notablethat the Baltics, having started later than the others, had alreadycaught up to them by 1994 and kept pace from then on in the finalliberalization drive.
Southeast Europe lagged somewhat behind, though not nearly as far behind as the CIS group, which in 1994 was well below the levelof SEE (no 1994 data available for war-torn Bosnia-Herzegovinaand Serbia-Montenegro). Indeed, at the mid-1990s point the gapbetween the CISM and CISL is invisible. That quickly changed,however, and by 1999 the CISM countries’ progress was evident:they had surged ahead in liberalizing measures and had achievedabout the same position as the CEB countries had reached five yearsearlier. Section 3 showed that it was not just a coincidence thatCISM’s output recovery began after that group reached about thesame level of TPI as had been reached by the CEB countries beforetheir recovery. What is striking is that by 2005, though the CISMcountries had not yet caught up to the liberalization levels of CentralEurope, they were very close to the 4.0 mark, reflecting reasonablywell-functioning market mechanisms, if not yet institutions. The
C O N T R O V E R S I E S
2120
models, this has been shown to be a stronger argument than the big-bang one.26 In practice, however, gradualism has been less effective than rapid reforms at preventing the flourishing of rent-seeking activities, which have often led to the oligarchic regimesand the capture of the state by vested interests. As I argue elsewhere(2006), the economics of rent seeking not only explain this well, butlead to the further prediction that these vested interests freeze furthertransition, both the liberalization and institutional components.
5. CONCLUSIONSThis paper addressed the CIS growth surge since 2000, askingwhether this was due to oil, reforms, rebound, or all of the above.Technically, all of these factors played a role. But the timing of thelong-delayed recovery in the CIS countries seems to be explainableby the very same policy factors as for the CEB countries earlier: sufficient progress in stabilization, liberalization, and institutions,the same factors that the econometric literature of the 1990s emphasized. Indeed, it is striking that in the CIS countries, beforetheir recovery, the levels of indices measuring each of these threepolicy areas reached magnitudes very similar to those of the CEB countries. However, the special factors of the oil boom and the rebound from very low levels of GDP are important in under-standing why the CIS recovery resulted in much higher growth rates.This solves the puzzle.
The unexplored dimension of the role of institutions was a secondtheme in this paper. The low levels of the institutional developmentthreshold for all countries, even those of the CEB, raise an importantquestion about the sequencing of institutions. This paper describedthe actual path followed by countries and pointed to some tentativeconclusions. First, all countries, regardless of the speed of reformsor the chosen strategy, moved much faster on stabilization and liberalization than on institutions. Second, those which liberalizedvery slowly are still lagging today, and most important, their lag oninstitutions is perhaps even greater. Third, in all countries the growthrecovery came when the level of institutional development was stillvery low, while liberalization was far more advanced.
nearly stagnant process of liberalization for CISL countries and theeven greater lag for institutions is particularly evident in Table 4.
What, then, does the comparison across countries imply for thedebates over the relative importance and sequencing of stabilization,liberalization, and institutions? First, note that the degree of institu-tional reform reached before growth started was not that high in theCEB. Indeed, even by 2003 the level of development of institutionsstill had a long way to go in the advanced countries, yet no majordamage to the performance of the economies seems to haveoccurred. Johnson and Subramanian (2005) propose that, generally,good economic policy alone can give growth a start, but sustainedgrowth requires improved institutions. The case of Central Europeseems to fit this hypothesis especially well. In the first recoveryphase, 1993 to 1998, GDP grew after the surge of liberalization butthen slowed as institutional reform lagged. As this picked up,stronger growth returned after 1999. Second, there is not a singleinstance of slow liberalizers moving ahead more rapidly (or even atthe same pace) with institutional reforms, as a true institutionalist-gradualist strategy would imply. On the contrary, those countriesthat liberalized the quickest also moved the quickest on institutionalreforms, albeit with a lag.
The EBRD makes the point that partial liberalization creates “winners … who block further progress in reforms” (EBRD 2000, p. 30). Perhaps the most salient point here is that the slow reformerswere not slow reformers for the reasons stated by politicians urging gradual liberalization – that is, because “the economy is notready for market operations” and “to avoid the huge pain of shocktherapy.” If that were the real motivation for gradual reform, wewould have seen after 15 years at least a few cases of institutionalreform moving faster than or as fast as liberalization. There is not asingle such case; on the contrary, where liberalization has been very slow, as in CISL countries, institutional development has beeneven slower.
In retrospect, this political economy of winners points to the mainproblem with gradualist arguments. Recall that proponents of gradualism were motivated by the idea that liberalizing too quicklyahead of institutional developments would be less effective and create more dislocation and pain. In theory, and using mathematical
C O N T R O V E R S I E S
2322
26 Although mathematical models with different assumptions do show big-bang superiorin some situations. Havrylyshyn (2006, ch. 2).
References
Ahrend, R. 2006. Russia’s Economic Expansion, 1999–2005. In Return toGrowth in CIS Countries: Monetary Policy and Macroeconomic Framework.,edited by L. Vinhas de Souza and O. Havrylyshyn, 90–121. Berlin: SpringerVerlag.
Alina-Pisano, Jessica. 2006. Klychkov i Pustota: Post-Soviet Bureaucrats andthe Production of Institutional Facades. Paper presented to Second AnnualDanyliw Research Seminar, October 12–14, University of Ottawa.
Bakanova, M., L.V. Vinhas de Souza, I. Kolesnikova, and I. Abramov. 2004.Transition and Growth in Belarus. In The Economic Prospects of the CIS:Sources of Long-Term Growth, edited by G. Ofer and R. Pomfret, 57–75.Cheltenham: Edward Elgar.
Barro, R. and X. Sala-i-Martin. 1995. Economic Growth. New York: McGraw-Hill.
Beck, T. and L. Laeven. 2006. Institution Building and Growth in TransitionEconomies. Journal of Economic Growth 11: 157–86.
Berengaut, J., E. de Vrijer, K. Elborgh-Woytek, and B. Lissovolik. 2003. AnInterim Assessment of Ukrainian Output Developments, 2000–01. IMF WorkingPaper No. 02/97. Washington: IMF.
Campos, N. and F. Coricelli. 2002. Growth in Transition: What We Know, WhatWe Don’t and What We Should. Journal of Economic Literature 50: 793–836.
De Melo, M., C. Denizer, and A. Gelb. 1997. From Plan to Market: Patterns ofTransition. In Macroeconomic Stabilization in Transition Economies, edited byM. Bléjer, and M. Skreb. Cambridge: Cambridge University Press.
EBRD (European Bank for Reconstruction and Development). [various years].Transition Report. London.
Elborgh-Woytek, K. 2003. Of Openness and Distance: Trade Development inthe Commonwealth of Independent States, 1993–2002. IMF Working Paper No.03/2077. Washington: IMF.
Gros, D. and A. Steinherr. 2004. Economic Transition in Central and EasternEurope: Planting the Seeds. Cambridge: Cambridge University Press.
Handelman, S. 1999. Comrade Criminal. London: Penguin.
Havlik, P. 2006. Economic Restructuring in the New EU Member States and Selected Newly Independent States: Effects on Growth Employment and Productivity. Vienna: Institute for International Economic Studies,http://www.wiiw.ac.at.
For all countries, the recovery threshold is found to be about 3.7 onthe EBRD index – that is, 80 percent toward a full-fledged market –in the category the EBRD defines as a “reasonably well-functioningmarket economy.” For institutions this growth threshold was only2.0 for both groups of countries – a mere one-third of the way to the market economy benchmark. The analysis here is too limited for policy conclusions to be drawn, but the results certainly point tothe following two hypotheses:
• Not a single transition country followed in practice the theoreticalideal of the institutionalist-gradualist strategy – that is, “developinstitutions before liberalizing” – either because this was not possible to do quickly enough or because the political elite used the“science” to justify a gradual approach for reasons of self-interest.
• Growth recovery appeared to be launched by establishing a solidprogram of stabilization and liberalization and only a very modestinitial development of institutions.
The above conclusions do not speak to the issue of sustained growth,which doubtless requires continued progress on institutions. Theydo, however, suggest the need for a more balanced approach to anypolicy recommendations pertaining to the sequencing of liberaliza-tion and institutions. The recognized pioneer on institutions theory,Douglass North, has many times emphasized that institutions take a long time to develop; hence, while they must be given carefulattention – perhaps more so than was the case in the 1990s – theseefforts must not be used as a reason or excuse to delay the good policies that can be put in place more quickly. In the words of VaclavKlaus, for each of the transformation elements in postcommunistcountries, “one should move as fast as possible.”
C O N T R O V E R S I E S
2524
and Globalization Economic Research, http://www.tiger.edu.pl/english/publikacje/dist.htm.
World Bank. 2002. World Development Report 2002. Washington.
Zinnes, C., Y. Eilat, and J. Sachs. 2001. The Gains from Privatization inTransition Economies: Is Change of Ownership Enough? IMF Staff Papers, vol.48. Special Issue on Transition Economies: How Much Progress?
Havrylyshyn, O. 2006. Divergent Paths in Post-Communist Transformation:Capitalism for All or Capitalism for the Few?. Houndmills: PalgraveMacmillan.
———. 2001. Recovery and Growth in Transition: A Decade of Evidence. IMFStaff Papers, vol. 48. Special Issue on Transition Economies: How MuchProgress?
Havrylyshyn, O. and R. van Rooden. 2003. Institutions Matter in Transition, butSo Do Policies. Comparative Economic Studies 45 (1): 2–24.
IMF (International Monetary Fund). 2005. Public Information Notice No.05/73. IMF Executive Board Concludes 2005 Article IV Consultation withRepublic of Uzbekistan. Washington. June 10.
Johnson, S. and A. Subramanian. 2005. Aid Government and the PoliticalEconomy of Growth and Institutions. Paper presented at Seminar on ForeignAid and Macroeconomic Management, March 14–15, Maputo, Mozambique.
Kauffman, D., A. Kraay, and M. Mastruzzi. 2004. Governance Matters III:Governance Indicators for 1996-2002. Washington: World Bank.
Kolodko, G. 2004. Institutions, Policies, and Growth. TIGER Working PaperNo. 56. Warsaw: Center for Transition, Integration, and GlobalizationEconomic Research, http://www.tiger.edu.pl/english/publikacje/working.htm.
Kornai, J. 1994. Transformational Recession: The Main Causes. Journal ofComparative Economics 19: 34–63.
Moers, L. 1999. How Important Are Institutions for Growth in TransitionCountries? Discussion Paper 99-004/2. Amsterdam: Tinbergen Institute,http://ftp.tinbergen.nl/discussionpapers/99004.pdf.
North, D.C. 2006. Understanding Economic Change and Economic Growth. TIGER Distinguished Lecture Series No. 7. Warsaw: Center forTransition, Integration, and Globalization Economic Research,http://www.tiger.edu.pl/english/publikacje/dist.htm.
Owen, D. and D. Robinson. 2003. Russia Rebounds. Washington: IMF.
Vinhas de Souza, L. and O. Havrylyshyn, eds. 2006. Return to Growth in CISCountries: Monetary Policy and Macroeconomic Framework. Berlin: SpringerVerlag.
Weder, B. 2001. Institutional Reform in Transition Economies: How Far Have They Come? IMF Working Paper No. 01/114. Washington: IMF,http://ssrn.com/abstract=879853.
Williamson, J. 2005. Differing Interpretations of the Washington Consensus.TIGER Distinguished Lecture Series No. 17. Center for Transition, Integration,
C O N T R O V E R S I E S
2726

C O N T R O V E R S I E S I N G L O B A LP O L I T I C S & S O C I E T I E S
E C O N O M I C R E C O V E R YI N T H E C O M M O N W E A LT H O F
I N D E P E N D E N T S T AT E S :O I L , R E F O R M S , R E B O U N D –
O R A L L O F T H E A B O V E ?
O L E H H AV RY LY S H Y NVi s i t i n g F e l l o w
C E N T R E F O R E U R O P E A N , R U S S I A N ,A N D E U R A S I A N S T U D I E S
a t t h eM U N K C E N T R E
f o rI N T E R N AT I O N A L S T U D I E S
MUNK CENTRE FOR INTERNATIONAL STUDIESUNIVERSITY OF TORONTO

Economic Recovery in the
Oil, Reforms, Rebound – or All of the Above?
Oleh HavrylyshynVisiting Fellow
Centre for European, Russian, and Eurasian Studies
O C C A S I O N A L PA P E R • N O . V II • 2 0 0 7
Oleh Havrylyshyn
ISBN 978-0-7727-0836-6ISSN 1715-3476
CONTROVERSIE S IN
GLOBAL POLITIC S
& SOCIETIES
Oleh Havrylyshyn (PhD, Massachusetts Institute of Technology) was Professor of Economics at Queen’s University, Kingston, and George Washington University, and has been a Visiting Professor at Université Libre de Bruxelles, the University of Geneva, and the Institute of World Economy in Kyiv. In his academic career, he focused on international economics and development issues, writing extensively on these topics and serving as a consultant on development to the World Bank, UNDP, UNCTAD, and CIDA. Since 1988, he has focused on post-communist transition, both in policy positions and analytical research. Dr. Havrylyshyn served as Deputy Minister of Finance, International Affairs, in the first independent Government of Ukraine, and then became Ukraine’s representative as Alternate Executive Director of the Board at the IMF. He has been a senior staff member of the IMF since 1996, including most recently as Deputy Director, European II Department, responsible for operations in countries of the former Soviet Union.
Commonwealth of Independent States:


