Embed Size (px)
Citation preview
EconomicReforms andSocial Policy
Edited by
Dr. B. Sarangapani
Phone: 9440828487
PREFACE
The Hindu College, Post -Graduate Department of Economics has conducted a National Seminar on
'Economic Reforms and Social Policy' in which many distinguished economists, policy analysts and
academicians participated. The National Seminar which was sponsored by the University Grants
Commission was organised to analyse the impact of economic reforms on social sectors, to examine
the trends in the social sector expenditures, to review the progress made on the human development
front and to identify the gaps in the social sector policies.
The focus of the seminar was on social policy issues with a particular reference to Andhra
Pradesh. Several far reaching and simultaneous reforms have been introduced in Andhra Pradesh
in the different sectors of the economy. Hence, it was felt to take stock of the reforms introduced and
assess their impact on different sectors and different sections of the community and to have a critical
assessment of the performance of Andhra Pradesh on the human development front. Identification
of the policy gaps for providing social safety nets to the marginalized was another important area of
the focus of the seminar.
Prof. G. Haragopal, Dean, Social Sciences, University of Hyderabad gave the keynote
address. The first technical session was chaired by Prof. S. Subrahmanyam, Centre for Social
Studies, Hyderabad and the issues of Political Economy of Reforms has been analysed in that
session. The second technical session on issues of social policy and human development was
chaired by Prof. I Ramabrahmam, University of Hyderabad. Prof. CSN Raju of Acharya Nagarjuna
University chaired the Valedictory session. The distinguished economist and former Professor of
Economics, Prof M L Kantha Rao, Sri Krishnadevaraya University delivered Valedictory address.
The Present publication is brought out with important papers submitted at the National
Seminar. The organisers are thankful to the UGC, Managing Committee of the Hindu College and
distinguished participants.
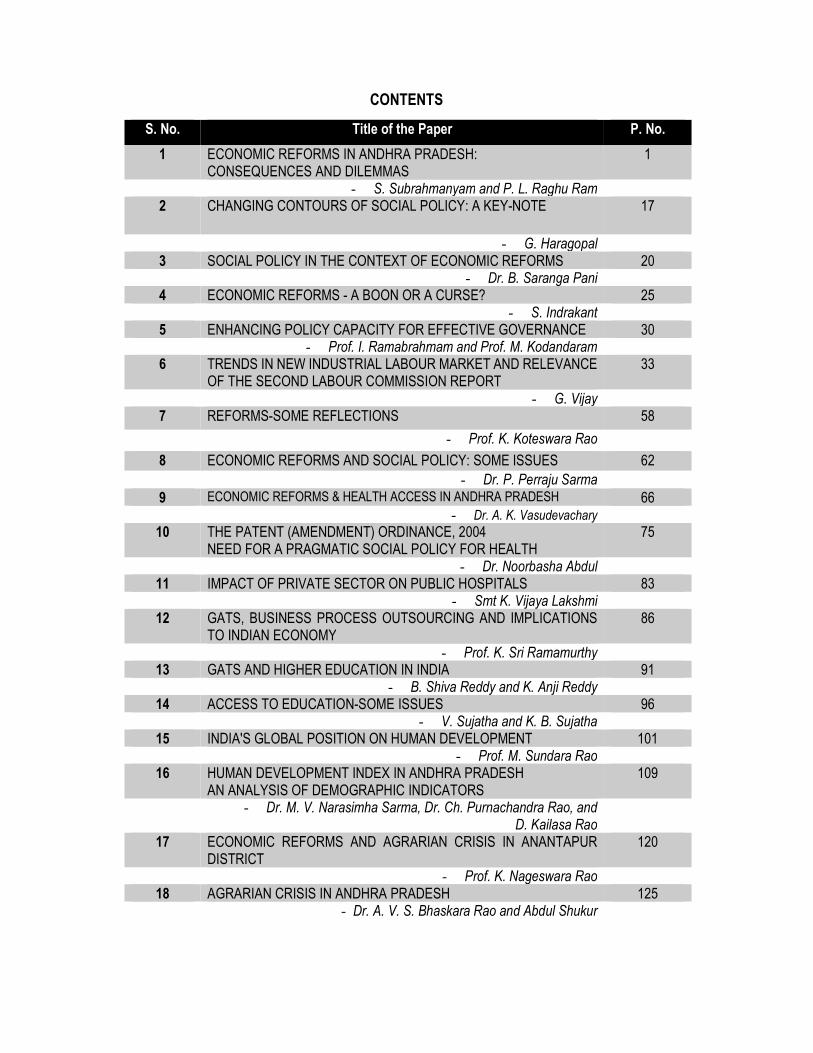
CONTENTS
S. No. Title of the Paper P. No.
1 ECONOMIC REFORMS IN ANDHRA PRADESH: CONSEQUENCES AND DILEMMAS
1
- S. Subrahmanyam and P. L. Raghu Ram 2 CHANGING CONTOURS OF SOCIAL POLICY: A KEY-NOTE 17
- G. Haragopal 3 SOCIAL POLICY IN THE CONTEXT OF ECONOMIC REFORMS 20 - Dr. B. Saranga Pani
4 ECONOMIC REFORMS - A BOON OR A CURSE? 25 - S. Indrakant
5 ENHANCING POLICY CAPACITY FOR EFFECTIVE GOVERNANCE 30 - Prof. I. Ramabrahmam and Prof. M. Kodandaram
6 TRENDS IN NEW INDUSTRIAL LABOUR MARKET AND RELEVANCE OF THE SECOND LABOUR COMMISSION REPORT
33
- G. Vijay 7 REFORMS-SOME REFLECTIONS 58
- Prof. K. Koteswara Rao
8 ECONOMIC REFORMS AND SOCIAL POLICY: SOME ISSUES 62
- Dr. P. Perraju Sarma
9 ECONOMIC REFORMS & HEALTH ACCESS IN ANDHRA PRADESH 66 - Dr. A. K. Vasudevachary
10 THE PATENT (AMENDMENT) ORDINANCE, 2004 NEED FOR A PRAGMATIC SOCIAL POLICY FOR HEALTH
75
- Dr. Noorbasha Abdul 11 IMPACT OF PRIVATE SECTOR ON PUBLIC HOSPITALS 83
- Smt K. Vijaya Lakshmi 12 GATS, BUSINESS PROCESS OUTSOURCING AND IMPLICATIONS
TO INDIAN ECONOMY 86
- Prof. K. Sri Ramamurthy 13 GATS AND HIGHER EDUCATION IN INDIA 91
- B. Shiva Reddy and K. Anji Reddy 14 ACCESS TO EDUCATION-SOME ISSUES 96
- V. Sujatha and K. B. Sujatha 15 INDIA'S GLOBAL POSITION ON HUMAN DEVELOPMENT 101
- Prof. M. Sundara Rao 16 HUMAN DEVELOPMENT INDEX IN ANDHRA PRADESH
AN ANALYSIS OF DEMOGRAPHIC INDICATORS 109
- Dr. M. V. Narasimha Sarma, Dr. Ch. Purnachandra Rao, and D. Kailasa Rao
17 ECONOMIC REFORMS AND AGRARIAN CRISIS IN ANANTAPUR DISTRICT
120
- Prof. K. Nageswara Rao 18 AGRARIAN CRISIS IN ANDHRA PRADESH 125
- Dr. A. V. S. Bhaskara Rao and Abdul Shukur
S. No. Title of the Paper P. No.
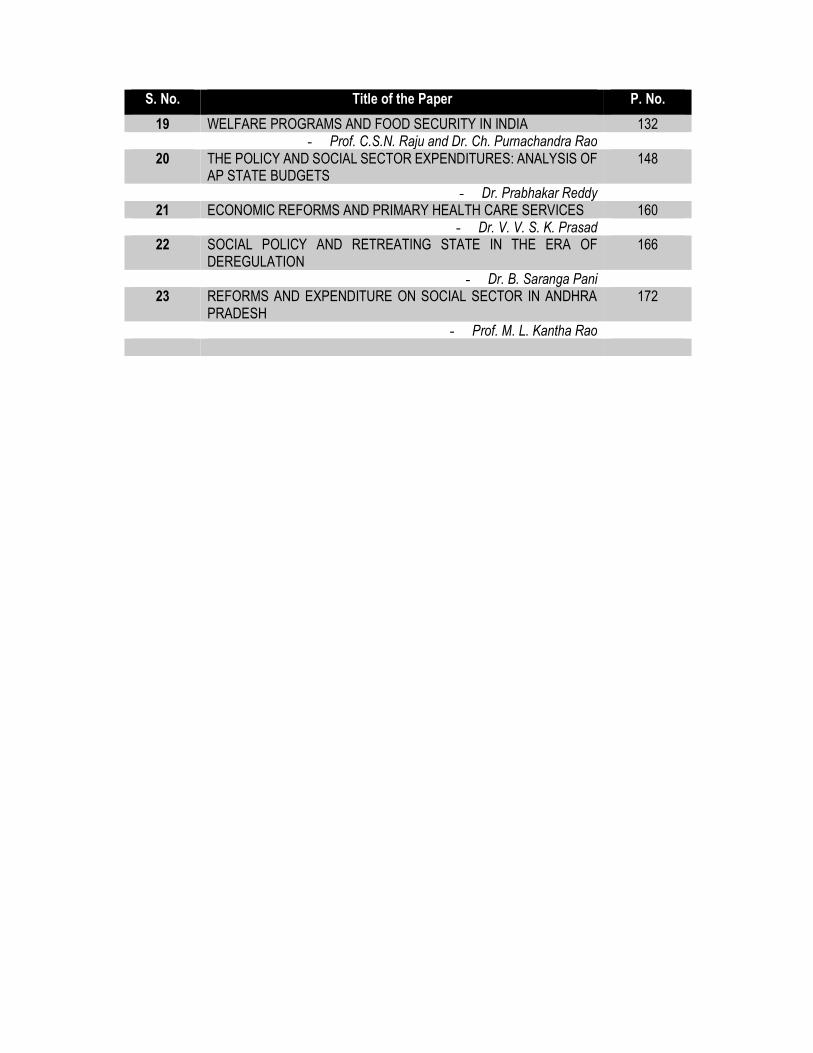
19 WELFARE PROGRAMS AND FOOD SECURITY IN INDIA 132 - Prof. C.S.N. Raju and Dr. Ch. Purnachandra Rao
20 THE POLICY AND SOCIAL SECTOR EXPENDITURES: ANALYSIS OF AP STATE BUDGETS
148
- Dr. Prabhakar Reddy 21 ECONOMIC REFORMS AND PRIMARY HEALTH CARE SERVICES 160
- Dr. V. V. S. K. Prasad 22 SOCIAL POLICY AND RETREATING STATE IN THE ERA OF
DEREGULATION 166
- Dr. B. Saranga Pani 23 REFORMS AND EXPENDITURE ON SOCIAL SECTOR IN ANDHRA
PRADESH 172
- Prof. M. L. Kantha Rao
Economic Reforms and Social Policy
| 1
ECONOMIC REFORMS IN ANDHRA PRADESH:
CONSEQUENCES AND DILEMMAS
S. Subrahmanyam
Senior Professor, Centre for Economic and Social Studies, Hyderabad.
P. L. Raghu Ram
Research Scholar, Centre for Economic and Social Studies, Hyderabad.
1 Introduction
With a geographical area of 274.40 lakh hectares and a population of 7.5 crores in
2001, Andhra Pradesh is the fifth largest state in the country both in area and
population density. The State has a share of 8.97 percent in and 7.42 percent of
population of the country. It has a large extent of forest area covering 23% of the
geographical arca, a long coastal line of 974 kms, which is second largest in the
country and 2764 TMC of water available from the river systems at 75% dependability.
The economy is basically agrarian in nature with 75 percent of the rural workers
depending on agriculture. The State has the highest proportion of agricultural labour
among Indian States at 47.5 percent of the rural workers. The corresponding
proportion for the nation is only 33.2 percent.
Land is scarce partly because of high density of population and partly due to
low proportion of geographical area under cultivation (35 percent). Even the irrigation
ratio is not high (40 percent). The State is backward both economically and
educationally with a lower per capita income as well as literacy rate as compared to
the national average.
The State experienced two significant shocks in the nineties. The first shock
was the severe balance of payments crisis. The nation availed the structural
adjustment loan from the International Monetary Fund and implemented economic
reforms that are conditional to the sanction of the loan. The second shock was the
fiscal crisis in 1995 96 due to fall in the tax revenue and increase in the expenditure
on rice subsidy. The State is found to be in severe fiscal crisis and hence approached
the World Bank for Structural Adjustment Loan (SAL). To fulfil the conditions imposed
by the. World Bank, the State had to introduce several reform measures. The
consequences of these two reform measures need scrutiny. The impact of national
level reforms can be understood by studying the dynamic changes that occurred in the
Economic Reforms and Social Policy
| 2
nineties. The impact of State level reforms can be understood by observing the
dynamic changes occurred between early nineties and the later period.
2 Growth Performance in the Eighties and Nineties
2.1 Steep deceleration in agricultural growth
Agricultural sector of Andhra Pradesh turned around from accelerated growth in the
eighties to deceleration in the nineties. The growth rate of NSDP from agriculture.
declined from 2.9 per cent per annum in the eighties to 1.3 per cent in the nineties.
The growth rate of crop output, calculated on the basis of Divisi index, which
takes into account changes in the production structure due to changes in prices, also
showed a similar decline in growth from 3.1 per cent to 2.3 per cent. Both food and
non-food grains exhibited this pattern of deceleration in output growth. Pulses are,
affected more severely than cereals and non-food grains more severely than food.
Almost all the crops were responsible for this deceleration of growth. For instance,
rice, the most important crop in the state accounting for 30 per cent of the cropped
area, showed a dismal performance in the nineties with steep fall in the growth rate
from 3.1 per cent per annum to 1.3 per cent. In the case of black gram even the
absolute level of yield declined. The growth rate of cotton yield declined from 3.4 per
cent to 1.4 per cent per annum. Though groundnut has not experienced deceleration,
the growth rate of yield was very low at 0.7 per cent per annum. Thus, almost all the
crops showed a poor performance in the nineties.
Stagnation in yields may take place if saturation is reached. But the situation is
not so. The yield levels are far below the levels attained in the other states in India.
For instance, yield of rice falls short by 27.8 per cent. For the remaining crops, the
yield levels in Andhra Pradesh are lower than in the other southern states (Table 3).
For instance, yield of sugarcane is lower than in Tamil Nadu by 39.5 Per cent.
This poor performance at the state level is due to the poor performance of certain
regions. Andhra Pradesh can be divided into five zones based on agricultural
development. Among these zones, North Coastal and South Telangana are the most
backward zones in agricultural development.
These two zones are mainly responsible for the poor performance of the state.
For instance, the poor performance of rice in the state is because of the poor
performance in North Coastal Andhra, yield of rice in this zone is lower by 47.8 per
cent than in South Coastal Andhra. Rice is an important crop in North Coastal Andhra
Economic Reforms and Social Policy
| 3
accounting for one-third of the gross cropped area. Similarly, jowar and pulses are
important crops in South Telangana accounting for 17.1 per cent and 8.2 per cent of
gross cropped area, respectively. While the former has a shortfall of 57.1 per cent, the
later has a shortfall of more than 130 per cent. Cotton is another crop with a wide
regional variation in yield. The crop is grown in South Coastal Andhra, North
Telangana, and Scanty Rainfall zones. The yield of the crop is lower in the latter-two-
zones-by-40.1-per--cent- and-64.7--per-cent- respectively. Similarly, groundnut,
which accounts for one-half of the cropped area in the scanty rainfall zone, has a low.
yield of 780 kgs per hectare, while the yield in South Coastal Andhra is as high as
1500 kgs per hectare. This variation in yields is partly due spread of a crop to areas
where the soil is not suitable for the crop. For instance, cotton is spread to North
Telangana region and groundnut became the dominant crop in South Telangana. The
soils appear to be not highly suitable for these crops and this has resulted in low yields.
2.2 Imbalance between surface and groundwater irrigation
Agricultural backwardness is generally related to irrigation, fertilizer use and seed
technology. Though irrigated area has been expanding continuously in the state, entire
expansion is contributed by groundwater in recent years. The proportion of net
irrigated area in net area sown increased from 35 per cent in 1988-89-to-43.5----
percent in 1998-99, the share of surface irrigated area declined from 73.1 per cent to
58.8 per cent. Further, there is absolute decline in the extent of surface irrigated area
from 27.23 lakh hectares to 25.25 lakh hectares during the period. It is striking to note
that even canal-irrigated area declined by 1.5 lakh hectares and tank irrigated area by
1.1 lakh hectares. This is an Indication of decline in public investment in agriculture.
The decline in surface irrigation and steep increase in groundwater irrigation resulted
in unsustainable agriculture. The ratio of groundwater to surface irrigation increased
from 0.23 in mid-seventies to 0.64 by the end of nineties. A very peculiar feature of
Andhra Pradesh is the positive association between rainfall and irrigation. As a result,
more rapid expansion of groundwater irrigation has taken place in the areas with low
rainfall and low surface irrigation.
2.3 Deceleration in growth of investment
Andhra Pradesh agriculture witnessed steep decline in the growth of investment from
6.9 per cent in the eighties to 1.1 per cent in the nineties. The share of public
investment declined steeply from 59.2 per cent in 1995-96 to 55 percent by 1998-99.
Economic Reforms and Social Policy
| 4
Gross fixed capital formation as a proportion of NSDP fell sharply from 24 per cent in
1989-90 to 13.9 percent in 1999-2000 (Subrahmanyam and Reddy, 2004).
2.4 Crisis in Andhra Pradesh Agriculture
Andhra Pradesh agriculture is subjected to crisis in recent times and more than 1000
farmers committed suicides during the last one year. Various explanations have been
offered for the crisis. High investment in bore-wells with a high failure rate, use of
spurious pesticides and seeds, high cost of cultivation, exploitation of traders through
interlinked markets have been identified as some of the reasons. The data from cost
of cultivation surveys indicate that there is a gradual decline in per hectare income
from agriculture. For instance, income from paddy cultivation declined from Rs. 1817
in 1994-95 to Rs. 1446 in 1999-2000 at current prices. The decline in real will be very
high. If we consider the paid-out cost (cost A2), income per hectare is Rs. 12990,
which forms only 69.9 per cent of the poverty line. In other words, a family of five
members requires 1.43 hectares of land to cross the poverty line. Income from
groundnut has been negative if total cost is considered and there is continuous decline
if only paid out cost is considered. Income per hectare is only Rs. 2094, which indicates
that a farmer requires 8.87 hectares of land. Even cotton gives a low income of Rs.
11413 per hectare, indicating that a family of five members needed 1.63 hectares of
land to come out of poverty. These results indicate that given the structure of input
and output prices, agriculture cannot provide adequate income to push a family out of
poverty.
Another factor responsible for crisis is the dependence of farmers on traders
and private moneylenders. A study in Ranga Reddy district in Andhra Pradesh
revealed that almost all the farmers with less than 2 hectares of land are depending
on informal credit market. Further, the major dependence is on traders. It is striking to
find that even among large farmers, more than one-half are depending on and the
proportion is as high as 73.3 per cent in the case of marginal and small farmers. It is
found that the implicit rate of interest on the inputs purchased on credit basis is as high
as 45 per cent. In addition to this, farmers lose about 5 per cent while selling the output
to traders because of wrong weight. Thus, the crisis in Andhra Pradesh agriculture is
mainly because of the failure of the organized credit market and steep increase in the
cost of production (Subrahmanyam et.al, 2003).
Economic Reforms and Social Policy
| 5
2.5 Low Development of Manufacturing Sector
Andhra Pradesh is industrially backward with a low share of manufacturing in NSDP
at (12.3 per cent) and there is not much improvement since the beginning of the
eighties. The growth rate of manufacturing is only 5 per cent in the eighties as well as
nineties. But the decade of nineties witnessed steep deceleration in the
growth of registered manufacturing.
2.6 Acceleration in the Growth of Working Age Population
Using the NSS data for the 50th and 55th rounds, many scholars have estimated the
employment growth at the aggregate as well as sectoral levels and found that there is
a steep decline in the growth rate of employment in the nineties (Chadha G:K and
Sahu, 2002). However, it is also argued that the 50th round data is an outlier and the
conclusions based on this data are erroneous (Sundaram K, 2001). We examine the
data relating to rural Andhra Pradesh to understand the dynamic changes and to find
out the proper participation rates to be used in labour force projections.
The NSS data indicate that work participation rate increased from 53.3 per cent
in 1987-88 to 57.5 per cent in 1993-94 and again came down to 54.4 per cent in 1999
2000. There is an increase in the work participation rate by 1.1 percentage points
between 1987-88 and 1999-00. As work participation rates are not likely to fluctuate
so wildly in a short period, the rates of 1993-94 appear to be outliers. Both male and
female rates exhibited the same extent of variation. If the rates of 1987-88 are low
because of drought in that year, we can say that work participation rates have not
increased but remained constant in the nineties. The trend in census rates and a
comparison between census and NSS rates also indicate the unreliability of 50th round
NSS rates. It can be observed that the 1991 Census rates are close to the NSS rates
of 1987-88 and 2001 Census rates are closure to NSS rates of 1999-2000, but not to
the NSS rates of 1993-94. However, census rates are always lower than the NSS rates
and the gap is wider for females than for males. While the male rates differ by
percentage points, female-rates differ-by-4.6 percentage-points. These results
indicate the appropriateness of 43rd and 55th round NSS rates of work participation.
While the use of 50th and 55th rounds data indicates that rural employment grew at a
low rate of 0.35 per cent per annum, the use of 43rd and 55th rounds NSS data
indicates a growth rate of 1.66 per cent per annum. Further female employment has
shown absolute decline according to the former source. However, employment must
Economic Reforms and Social Policy
| 6
grow at annual rate of 2.7 per cent, as the population in the working age is likely to
grow at this rate.
3 Economic Reforms in Andhra Pradesh
Growth rate of GSDP in Andhra Pradesh decelerated from 5.50% in the eighties to
5.31 % during the nineties, whereas the nation witnessed acceleration growth from
5.37% to 6.13% during the same period. The per capita GSDP was growing at lower
rate in the state (4.04 percent) as compared to the growth at the national level (4.38
percent) in the nineties. The absolute level of per capita income of the state was lower
at Rs. 10,591 as compared to Rs. 11,589 at the national level in 1999-00 (Dev and
Ravi, 2003). While this is the scenario of growth, the state witnessed fiscal crisis in the
year 1995-96. State's own tax revenues as per cent of GSDP dropped by neatly three
percentage points between 1990-91 and 1995-96, largely due to fall in excise revenue
due to the imposition of prohibition and rise in the rice subsidy due to poor targeting
(Rao and Dev, 2003). This tendency of deceleration in the growth rate of GSDP and
fiscal crisis compelled the Government of Andhra Pradesh to approach the World Bank
for loan and introduce economic reforms on mutually agreed conditions. The loan was
sought for improving the infrastructure. The World Bank prepared the pre-appraisal
report and approved the total cost at US $ 830 million of which loan will be US $ 543.2
(65.4 per cent) will be loan and the remaining amount is the margin money to be
invested by the GOAP.
The loan carries nine per cent rate of interest to the Government of India (GOI).
As the repayment must be in dollars, exchange rate fluctuations also affect the amount
to be repaid in rupee terms. To meet this risk, the GOI collects interest at 12.5 per cent
from the GOAP. The loan is sanctioned under the project title, Andhra Pradesh
Economic Restructuring Project (APERP). Reducing malnutrition, increasing the level
of educational achievement, improving access to and quality of health services,
reversing the deterioration in irrigation and road infrastructure, and putting state
finances on a sustainable path are the objectives of the assistance as stated by the
World Bank (World Bank, 1997). In fact, these are the goals specified in the Country
(India) Assistance Strategy (CAS) of the World Bank. The allocation of the project cost
to components reveals that 41.2 per cent will go for health and education, 55.6 per
cent for rural roads and irrigation rehabilitation and only 3.2 per cent for public
enterprise reform. Irrigation maintenance and rehabilitation is the single most
Economic Reforms and Social Policy
| 7
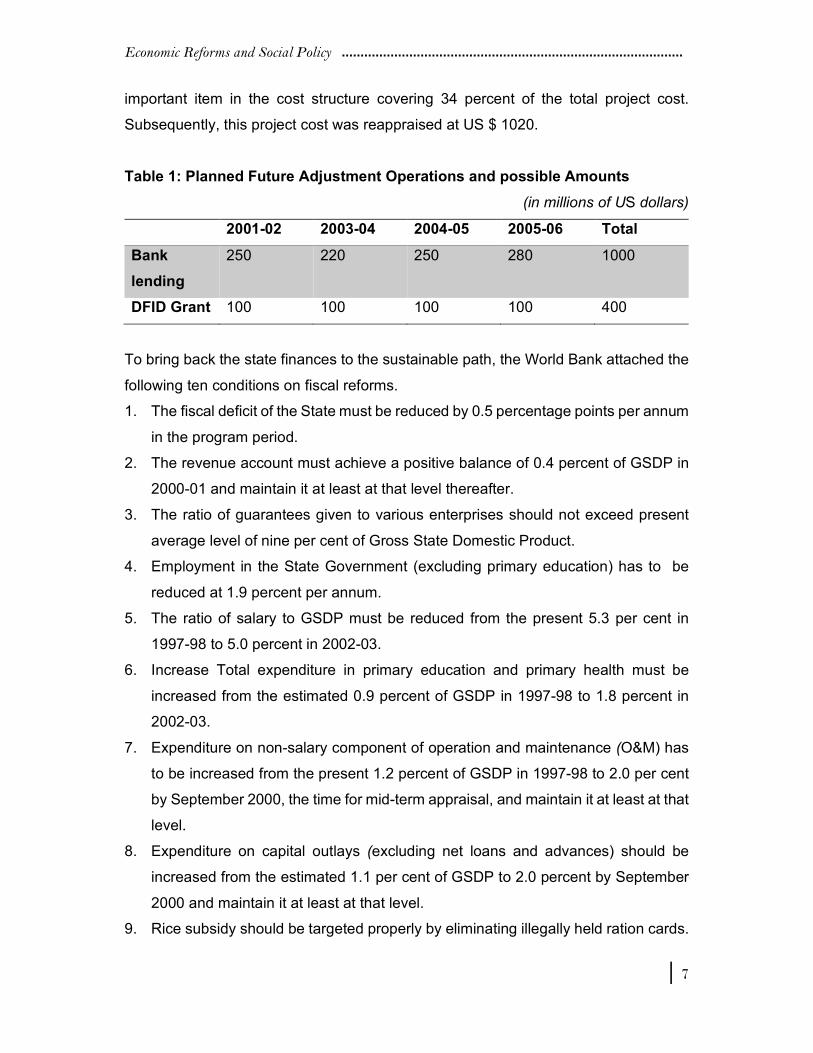
important item in the cost structure covering 34 percent of the total project cost.
Subsequently, this project cost was reappraised at US $ 1020.
Table 1: Planned Future Adjustment Operations and possible Amounts
(in millions of US dollars)
2001-02 2003-04 2004-05 2005-06 Total
Bank
lending
250 220 250 280 1000
DFID Grant 100 100 100 100 400
To bring back the state finances to the sustainable path, the World Bank attached the
following ten conditions on fiscal reforms.
1. The fiscal deficit of the State must be reduced by 0.5 percentage points per annum
in the program period.
2. The revenue account must achieve a positive balance of 0.4 percent of GSDP in
2000-01 and maintain it at least at that level thereafter.
3. The ratio of guarantees given to various enterprises should not exceed present
average level of nine per cent of Gross State Domestic Product.
4. Employment in the State Government (excluding primary education) has to be
reduced at 1.9 percent per annum.
5. The ratio of salary to GSDP must be reduced from the present 5.3 per cent in
1997-98 to 5.0 percent in 2002-03.
6. Increase Total expenditure in primary education and primary health must be
increased from the estimated 0.9 percent of GSDP in 1997-98 to 1.8 percent in
2002-03.
7. Expenditure on non-salary component of operation and maintenance (O&M) has
to be increased from the present 1.2 percent of GSDP in 1997-98 to 2.0 per cent
by September 2000, the time for mid-term appraisal, and maintain it at least at that
level.
8. Expenditure on capital outlays (excluding net loans and advances) should be
increased from the estimated 1.1 per cent of GSDP to 2.0 percent by September
2000 and maintain it at least at that level.
9. Rice subsidy should be targeted properly by eliminating illegally held ration cards.
Economic Reforms and Social Policy
| 8
10. Collection rate of irrigation charges must reach at least to 90 percent by March
2001.
To reduce fiscal deficit, reform of public enterprises and cooperatives is
considered as the most important tool. In Andhra Pradesh, Government is the
dominant shareholder in 39 public enterprises (PES) and more than 60 cooperatives.
These enterprises receive direct and indirect subsidies of more than one per cent of
GSDP. To implement reforms in these enterprises, the GOAP constituted a Working
Group (WG) to recommend a reform program for each enterprise and a Cabinet Sub-
committee to review the recommendations of the WG. The recommendations included
privatization of several units, closure of unviable ones, and merger and restructuring
of others. Following the recommendations, two enterprises have been privatized and
four were closed as a prelude to availing: the structural adjustment loan from the World
Bank. Consultants have completed the review of Singareni Coal Company, a large
company in the public sector, and the results were presented to GOAP in May 1998.
However, due to the sensitivities involved in privatizing a large enterprise such as the
Singareni, the government soft pedalled the issue, and instead, argued that small and
medium enterprises and cooperatives be targeted first and proceed further on the
basis of the experience gained. As a consequence, about 20 sugar and spinning mills
in the cooperative sector and several small and medium scale units such as Andhra
Pradesh Small Scale Industries Development Corporation (APSSIDC), Andhra
Pradesh Electronics, APANRICH and Alwin Watch were closed, apart from downsizing
several others such as APAGRO, Andhra Pradesh Irrigation Development Corporation
(APIDC) and Andhra Pradesh Industrial Development Corporation. A State Renewal
Fund was established in 1995, to-finance severance pay-under a voluntary retirement
scheme (VRS) and other retrenchment benefits. Over 2,000 employees have been
severed under this scheme by 1998 as a precondition for availing the loan.
Weaknesses in the institutional framework for privatization and lack of resources to
finance severance costs were identified as factors that would hinder progress in
implementing the reforms. The PE reform program was structured to have two
components to be implemented over a period of five years. The first component is the
implementation of the Phase-I Action Plan, which includes privatization and closure of
twelve medium and small size companies, and a social safety net program for the
affected workers, strengthening the institutional capacity to plan and implement the
Economic Reforms and Social Policy
| 9
PE reform program under technical assistance. The second component is the
preparation of the Phase-II Action Plan for the remaining companies and cooperatives.
APERP would support Phase-I through financing part of the severance cost to the
extent of 65% of the total cost. The social safety net program and an institutional
capacity building program are supported with technical assistance under parallel
financing from the Department for International Development (DFID) of the U.K.
Government. Phase-I of the APERP focused on twelve small and medium enterprises
that operate in competitive markets and whose restructuring and privatization would
not involve complex institutional and social issues. This. approach was considered
more likely to demonstrate the feasibility of the reform process and help build public
acceptance. The Government has chosen twelve units, which offer potential for easy
disposition and are relatively unobtrusive in terms of social impact. These enterprises
have nearly 14,000 employees, of which 7,250 would be surplus because of
restructuring, privatization, and closure. About 1,450 employees were in the five firms
to be wound up (APSSIDC, APTEX) or through the closure of unviable assets (Agro
Industries, Meat and Poultry Corporation). The remaining 5,550 are in the four
cooperative spinning mills and the PEs that are to be restructured and privatized,
including NSL, APSIDC and Alwin Watch (together accounted for about 60 percent of
the surplus). The surplus estimates were derived on the basis of earlier studies at the
enterprise level (as in the case of NSL), comparisons with industry norms (as in the
case of spinning mills), and information gathered by the Government from the
companies. Based on these estimates, the government calculated that the total cost
of extrait payment for voluntary retirement (VRS) for these twelve enterprises would
amount US$ 26.2 million.
APERP would cover all the rest of the public enterprises and cooperatives other
than the APSEB. The power sector reforms were treated as a separate item and loan
was sanctioned separately. While Phase-I of the public enterprise reform program
aimed at twelve enterprises for restructuring or closure, the target was revised to
eighteen enterprises2.
All conditions of negotiations were met. These conditions include (a)
requirements for establishing management structures for all enterprises and the
project as a whole (b) receipt by the Bank of satisfactory Program Implementation Plan
(PIP) for each component (c) passage of the Power Sector Reform Bill in the State
Economic Reforms and Social Policy
| 10
Assembly (d) receipt by the Bank of the agreed Letter of Development Policy (e)
approval of an Irrigation Sector Policy Statement and (f) approval of technical
assistance for preparation for the introduction of a Value Added Tax in the State. At
the Mid-Term Review conducted in September 2000 a detailed evaluation of progress
of implementation was conducted and it was stated in the report that continued support
from the Bank would be contingent on satisfactory performance.
3.1 Andhra Pradesh Economic Restructuring Loan - 2
The second Andhra Pradesh Economic Restructuring Loan/Credit (APERL-2) is
continuation of APERL-1 to support the ongoing reform program and it includes six
components viz., (I) improving poverty monitoring and pro-poor policy formulation and
implementation (ii) implementing structural measures to foster economic growth (iii)
restructuring and privatizing public enterprises (iv) improving fiscal discipline, the
composition of spending, public expenditure management, and financial accountability
(v) strengthening governance, and (vi) facilitating sectoral reforms in education, health
and power. The World Bank appraisal document on APERL-2 expects the following
benefits: (a) Improvement in the state's investment climate through increased
competition in agriculture and greater labour market flexibility (b) fiscal savings from
further public enterprise reform (c) improved delivery of public services as a result of
public expenditure, financial management and governance reforms and (d) freed up
resources for other development priorities from the continued curtailment of power
sector losses.
The appraisal document perceived several risks. They stem from tightening of
fiscal targets in the next few years, leaving very little room for slackness, the difficulties
in metering of agricultural connections and fixing tariffs for power, vulnerability to
exogenous shocks like poor monsoons, and risk of changes in policy priorities as a
result of elections due in 2004.
There is a noticeable shift in the strategy for APERL-2. The overall medium-
term development strategy has two main objectives (I) eradicating poverty and
focusing on human development, and (ii) accelerating economic growth. The goals of
eradicating poverty and accelerating human development are to be achieved through
the Velugu Program, financed by DFID. grant which was initially initiated in six districts
(two districts in each of the three regions) which was financed entirely. by way of grant
from DFID. However, the program has been extended throughout the state with a loan
Economic Reforms and Social Policy
| 11
component from World Bank. The program aims at building the capabilities of the poor
and disadvantaged groups (by improving literacy and health), empowering women by
addressing gender inequalities in education and increasing gender sensitivity in health
programs and by accelerating pro-poor growth.
APERL-2 is the second operation in a series of planned SALs of Andhra
Pradesh. It is based on the strength of State's overall reform program and on progress
on the fourteen key indicative actions that were documented in APERL-1. The loan
supports the state's medium-term reform program through another single tranche
loan/credit to the extent of US$ 220 million (50 percent IBRD, 50 percent IDA). Like
the first, this operation will also be co-financed by DFID with a grant amount of about
US$ 100 million. This has been disbursed January 2004.
The appraisal document notes that the state has fulfilled the APERL-2
conditions. However, implementation of the reform program to underpin APERL-2 has
fallen short of the steps envisaged at the time of APERL-1. For instance, the financial
performance of the power sector was weak in 2001-02; with losses exceeding Rs. 490
crores. IV Performance in the Pre and Post Reform Periods in Andhra Pradesh The
World Bank claims that with its reform agenda gaining momentum, the lineage of
Andhra Pradesh as a backward state began to change. Many of these reforms were
projected as producing encouraging results and the state must bridge the wide
development gap that existed between Andhra Pradesh and more developed Indian
States. In this study, Andhra Pradesh was designated as the "Fastest Mover". The
World Bank supports its argument by taking recourse to a study undertaken by India
Today, which ranked Indian states. However, an in-depth analysis of the data gives a
contrary picture.
3.2 Post reform fiscal position of A.P.
Experience and evidence suggest that the APERP was poorly formulated. While the
major goal was to enhance the GSDP, the results achieved are negative in effect. All
the sectors except tertiary sector experienced steep deceleration in the late nineties
as compared to early nineties.
Andhra Pradesh has a literacy rate of 61.1% (2001) as against the neighbouring
Kerala's 90.9%, Tamandu’s 73.3%. Even the smaller hill state of Himachal Pradesh
accounts for a better 77.1%. In the last decade 1991-2001, population grew in Andhra
Pradesh at 13.9% while the neighbouring Tamil Nadu has shown a better figure of
Economic Reforms and Social Policy
| 12
11.4% and Kerala 9.4%. Surely, AP's performance is way behind neighbouring states
in what is certainly an important social development indicator. The figures for life
expectancy and infant mortality provide an adequate insight into the sorry situation of
healthcare in the state as well as the inadequacy of the system.
Quite the contrary picture emerges from the Human Development Index
brought out by the Planning Commission. The state has slipped down between 1991
and 2001.
Fiscal Position
The financial position of A.P, marked as it is, by a continuous run of revenue and fiscal
deficits, year after year, is in disarray. Economic reforms were aimed at improving the
state finances and stabilize the position. Indeed, that is the processed aim of structural
reforms and the structural adjustment programs. The APERP is expected to achieve
fiscal stability. However, the financial position of the state has seen a marked
deterioration. The fiscal situation in the state has been going from bad to worse and is
now precarious and even unsustainable. The state is becoming more and more
dependent on external loans even for current expenditure and implementation of the
plan. We are not able to create capital assets due to reduction: of capital expenditure.
Social services sector is worst hit. As the Andhra Pradesh Government put in its
memorandum to the 12th Finance Commission, “the state governments over the years
are utilizing the increased proportion of borrowed funds to meet the current
expenditure needs, leaving fewer funds for the developmental activities in the states.
Even though the state governments are using the borrowed funds for capital formation,
the returns from them are not susceptible to monetization and hence it has not been
possible to generate returns for payment of borrowed loans either from the Central
Government or for other sources".
A look at the finances of the state from 1995-96 to 2003-04 leaves us with the
conclusion that the reforms have accentuated the fiscal problems of the state. The
fiscal deficit increased from Rs. 2417 crores in 1995-96 to Rs. 7426 crores in 2003-
04. While the World Bank has set the targets at 3% of GSDP for the year 1998-99, it
turned out to the 5%. For the years 1999-2000 and 2000-01, the fiscal deficits are 5
and 6.13% respectively. Revenue expenditure has increased from 86.35% in 1995-
96. to 88.03% in 2003-04. Public debt has ballooned from Rs. 15163 crores in 1995-
96 to Rs. 57588 crores in 2003-04. Interest payments have seen a sharp rise from Rs.
Economic Reforms and Social Policy
| 13
1527 in 1995-96 to Rs. 6919 crores in 2003-04. The state is servicing Rs. 20 crores
interest everyday debt outstanding as percent of GSDP has gone up from 18.99
percent in 1995-96 to 32.37 percent in 2003-2004, in spite of the increased debt and
consequential interest burden, the capital expenditure in the total outlay has declined
from 19.70 percent in 1995 -1996 to 10.08 percent in 2003-2004 (GOAP, 2004).
The planning commission of the government of India has brought out the
Human Development Report, India. The central government has been prodding all the
state governments to bring out Human Development Reports. In fact, Tamil Nadu,
Karnataka, Madhya Pradesh were among the first states to bring out the HDRs for,
their respective states. The government of Andhra Pradesh has availed a grant from
the government of India for bringing out the Human Development Report for Andhra
Pradesh. Till date, the HIOR for the state has not seen the light of the day. Obviously,
the government did not bring out the HDR, simply be lustre performance on the Human
Development front and the poor Human Development indices. Yet, let us look at some
of the indicators.
There was steep fall in the revenues of the state government by the mid-
nineties. The own tax revenue of the state as a percentage of the Gross State
Domestic Product declined by three percentage points between 1990-91 and 1995-
96. Fall in the revenue from state excise consequent to the introduction of prohibition,
untargeted subsidy on rice and the low electricity rates for agricultural use are
identified as the factory responsible for the fiscal crisis. Beginning with 1996 the
Government of Andhra Pradesh has initiated several reforms as a prelude to avail the
World Bank loan called the Andhra Pradesh Economic Restructuring Loan (APERL).
The total amount of the loan is US $1000 million, and it will be distributed in four
instalments. The first instalment of US $ 250 million called APERL - 1 was disbursed
in March 2002 and the second instalment known as APERL-2 of US $ 220 million was
released in: January 2004. The APERL-3 estimated at US $ 250 million and APERL-
4 for US $ 280 1. ...million are expected to become operational during 2005-06 and
2006-07 respectively.
As these loans are intended for structural adjustment: several conditions
accompanied them as in the case of structural adjustment loans provided by the World
Bank. The economic reform measures introduced at the national and state levels
imposed severe strain on the economy and led to some adverse consequences: The
Economic Reforms and Social Policy
| 14
period of nineties is also classified into pre-reform and post-reform periods at the state
level.
4 Policy Dilemmas in Andhra Pradesh
There are several dilemmas before the government on the SAP. This is particularly ...
so with reference to the sustainability of the conditionalities. For instance, the power:
sector reforms. Till date supply of power is metered. On the contrary the new
government has already waived off power charges to the farmers and has made a
commitment to give free power to the farmers. This year alone the government has
written off Rs. 1400 crores on account of power dues from farmers. The dilemma is
how does one reconcile the government's promise with the conditionalities already
agreed with the World Bank on the front.
Secondly, the growth indicators such as the GSDP and Sectoral growth rates
have shown declined. This is attributed to the general decline in the allocation on
account of capital expenditure. The dilemma is weather to increase allocations in
infrastructure or to pursue the upfront tasks suggested APERL-2, which mainly
focuses on poverty alleviation programs.
Thirdly, the interest rates of Indian financial institutions coming down, it now
appears more attractive to borrow from our institutions rather than borrowed
multilateral agencies such as the World Bank. This dilemma is already evident in the
case of power sector loans where the government of Andhra Pradesh has backed out
after availing the 50 % of the loans from the World Bank for the power sector reforms.
Lastly, a change in the government in the elections of May 2004 has brought
into focus a shift on the policy formulations. For instance, the government has
allocated for the financial year 2004-05 Rs. 4000 crores on creating irrigation
infrastructure as against Rs.1300 crores in the previous year. This again is an answer
to the dilemma in pursuing of the originally conceived formulation under the APRP,
which has emphasized more on social infrastructure.
Notes
1. Restructuring of the State Electricity Board (APSEB) was supported under the
operation of the power sector reform, a separate loan approved for US $ 1000 million
at an interest rate of 12.5 percent as in the case of APERP. The GOAP utilized half of
the amount in three years from 1999-2000 onwards and informed the Bank in the
Economic Reforms and Social Policy
| 15
fourth year (2004-05) that the remaining portion of the loan is not needed in view of
the availability of financial resources from domestic sources at lower rate of interest...!
2. Enterprises privatized are: Sri hanuman Co-operative Sugar Mill, ASM Co-operative
Sugar Mill, Adilabad Cooperative Spinning Mill, Rajahmundry Co-operative Spinning
Mill, Nizam Sugar Limited, Chagallu Distillery, Shakarnagar Sugar Mill, Shakarnagar
Distillery, Momboojipalli Sugar Mill, Metpalli Sugar Mill, Latchyapet Sugar Mill,
Madunagar Sugar Mill, Momboojipally distillery, Nandyal Co-operative Sugar Mill,
Nagarjuna Co-operative sugar Mill and Purchur Co-operative Spinning Mill.
Enterprises closed are:
Andhra Pradesh Small Scale Industries Development Corporation, Andhra Pradesh
Textile Development Corporation, Alwyn Watches Limited, Nellore Co-operative
Spinning Mill and Chilakaluripet Co-operative Spinning Mill. Enterprise restructured
are:
Andhra Pradesh State Irrigation Development Corporation, Andhra Pradesh State
Meat Development Corporation, Andhra Pradesh State Agro Industries Development
Corporation and Andhra Pradesh Handicrafts Development Corporation.
References
1. C.H. Hanumantha Rao and S. Mahendra Dev: 'Economic Reforms and
Challenges Ahead: An Overview', Economic and Political Weekly, Vol.38 (12 and 13)
pp.1130-1141, March 28-April 4, 2003.
2. Chadha, GK and Sahu, PF (2002): 'Post Reforms Setbacks in Rural
Employment: Issues That Need Further Scrutiny', Economic and Political Weekly, Vol.
37 (21) pp 1998-2026, May 25-31.
3. GOAP (2004): Economic Survey 2003-2004, Planning Department, Andhra
Pradesh, Secretariat, Hyderabad
4. J.V.M. Sarma: 'Fiscal Management: A Review', Economic and Political Weekly,
Vol.38 i (12 and 13) p.1158-1170, March 28-April 4, 2003.
5. Mahendra Dev and C. Ravi: 'Macro-economic Scene: Performance and
Policies’, Economic and Political Weekly, Vol.38 (12 and 13) p.1143-1157, March 28-
April 4, 2003.
6. S. Subrahmanyam and K.C. Reddy( 2004): 'Capital Formation and Economic
Growth in Andhra Pradesh', paper presented at the Annual Conference of Andhra
Economic Reforms and Social Policy
| 16
Pradesh Economic Association held at Bhimavaram.
7. S. Subrahmanyam and P. Satya Sekhar: 'Agricultural Growth: Pattern and
Prospects', Economic and Political Weekly, Vol.38 (12 and 13) p.1202-1211, March
28-April 4, 2003.
8. S. Subrahmanyam, S. Sudhakar Reddy, Karin Verstralen (2003):'Labour and
Financial markets from Employers-Perspective - The Case of Ranga Reddy District in
Andhra Pradesh', Centre for Economic and Social Studies, Hyderabad.
9. Sundaram, K (2001):' Employment and Poverty in 1990s: Further Results from
NSS 55th Round Employment - Unemployment Survey, 1999-2000, Economic and
Political Weekly, Vol. 36 (32), pp 3039-3049, August 11.
10. T.L. Sankar: 'Power Sector: The Rise, Fall and reform', Economic and Political
Weekly, Vol.38 (12 and 13) p.1171-1178, March 28-April 4, 2003
11. World Bank (1998): 'Project Appraisal Document on Proposed Credit for
Andhra Pradesh Economic Restructuring Project’ Report No: 17710-IN, Poverty
Reduction and Economic Management Unit, South Asia Region
12. World Bank (2004): 'International Development Association and International
Bank for Reconstruction and Development for The Second Andhra Pradesh Economic
Reform Loan/Credit' Report No: 26534-IN, Poverty Reduction and Economic
Management, South Asia Region.
Economic Reforms and Social Policy
| 17
CHANGING CONTOURS OF SOCIAL POLICY: A KEY-NOTE
G. Haragopal
Professor and Dean, School of Social Sciences, University of Hyderabad.
Indian Constitution envisaged a pro-active role for the state. This is in a way a
departure from the earlier liberal notions of the state - which basically expect the state
as the maintainer of the order. In contrast the Indian state in essence must not maintain
the order but transform the existing order. 'This has drawn the state into a wide range
of activities starting with agricultural and industrial development to changing the caste,
gender and other social relationships. It is also to endeavour for growth but combine
it with Justice. Added to it, the state has a huge task of nation-building. It is, in this
wide terrain the question of social policy is to be located.
The vision emanating from the Constitutional mandate determined the nature
of social policy in the early fifties. In 1954, at Avadi Congress session, they adopted
socialist pattern of society. It is in a way reiteration of Article 38, 39 of the Indian
Constitution. However, the drift from the vision began from the Second Five Year Plan
itself, when we went for a Soviet model of development with an emphasis on heavy
industry and major irrigation projects. While these initiatives were considered as a part
of infrastructure development, they had the inner propensity to tilt the developmental
process in favour of the propertied resulting in widening of the gap between the rich
and the poor. The manifestations of this process became clear by the Third Five Year
Plan period. And therefore, by the late sixties, poverty had to be recognized as an
important challenge to the Indian planners and policy formulators. It was this hard
reality that led Mrs. Gandhi to talk about poverty and make it as one of es which not
only won her the power but the good will of the large millions of the people. This
popularity continues to be one of the political resources for the Nehru Gandhi family.
It also continues to be one of the reference points to the social policy.
Mr. Gandhi’s phase could be characterized as the phase of social articulation
giving rise to policy packages for the poor. The entire target group approach taking the
vulnerability of the socio-economic groups as the defining factor for public policy
formulation is a significant development in the evolution of social policy. However, the
experience with this social policy was two sold; one) it raised the levels of expectations
Economic Reforms and Social Policy
| 18
without matching performance, two) it brought in institutional mechanisms without the
ability to deliver the goods. It also led to serious ups and downs in the political fortunes
of the political parties. It was the political uncertainties that became a cause of serious
anxiety to the political masters.
Paradox of Development
The paradox of development has been that those who benefited from the
developmental process got better organized, while those who did not benefit started
resisting the path of development. The Indian state got caught in this crossfire and has
not been in a position, to cope with the crisis. It was at this stage of development in
1980s they chose the path of borrowing the capital and technology from the outside.
This paved the way for the process of globalization, privatization, and liberalization.
This brought in the conditionalities that eroded the autonomy and freedom of the Indian
state to formulate their own policies not to talk of social policies.
The reckless borrowing of capital and technology, while benefited a small
section of the neo-rich, it led to serious imbalances in the foreign exchange reserves.
It was this deep crisis that compelled India to become a part of the process of
globalization and it has come to be widely believed that it is irreversible. Globalization
in its very nature results in inclusion-exclusion syndrome. And many the vulnerable
that figured in as an important factor in the fourth plan and after are no more cared.
The neo-liberal model not only excludes them but also offers ideological justification
for the exclusion. One of the arguments has been that the state both as allocator, of
values and deliverer of the goods and services is incapable of performing those tasks.
Hence, the argument for the minimalist state.
The pilgrimage of the Indian state from a pro-active interventionists state to that
of a retreating state with a minimalist role in socio-economic progress has hit the entire
terrain of social policy. The fallout of this path of development has been graphically
narrated by Joseph Stiglitz in his Nobel Prize winning brook Globalization and its
Discontents and in his latest work the Roaring Nineties. In Indian context, one can see
the consequences of what Stiglitz describes as root-less, ruthless, and jobless growth.
The growing deprivation, appearance of ultra-poor, suicides of farmers, growing urban
slums, and large reservoir of army of educated unemployed. This is the volcano on
which the system is resting. It may explode at any point. The widespread unrest, crime,
Economic Reforms and Social Policy
| 19
violence, social strife is all the result of deprivation and destitution.
It is this context, in which the seminar on social policy is being organized. It is
necessary that. academia addresses this question so that we signal and act as a
warning system. That is, in fact, one of the functions of institutions of higher learning.
At this stage, a seminar on social policy is swimming against the current fashion. But
questioning the fashions and raising the basic concerns about the poor, deprived,
vulnerable is the need of the hour. It is that historic need that this seminar is responding
to.
Economic Reforms and Social Policy
| 20
SOCIAL POLICY IN THE CONTEXT OF ECONOMIC REFORMS
Dr. B. Sarangapani
Reader and Head, Post Graduate Department of Economics, The Hindu College,
Machilipatnam.
The focus of attention of the 1991 economic reforms has been, almost exclusively, on
the opening-up of the Indian Economy. The liberalization agenda is largely influenced
by the assumption, that India's past failures, are due to over-regulation and insufficient
market incentives. Hence, radical deregulation is being pursued to kick-start the
economy.
But over-regulation and stifling of markets in certain sectors are only partly
responsible for India's slow growth. There are other equally important factors, such as
widespread illiteracy, inadequate infrastructure, endemic political and bureaucratic
corruption, the paralysis of the legal system, the malfunctioning of democratic
institutions, low levels of human development, which have contributed substantially to
India's sluggish growth.
However, economic reforms initiated, overlooked these factors, and thereby
ignored the lack of pre-conditions in the Indian economy for the kind of take-off, that
has followed market-oriented reforms in countries such as China and Vietnam.
Reforms emphasized only deregulation. Deregulation policies never seriously took
into consideration the deep complementarities between market efficiency and state
action. The fact that market efficiency is contingent upon various forms of state action
has been conveniently ignored. It is believed that deregulation by itself would lead to
rapid economic growth. The experience of rural India suggests that deregulation by
itself is not a sufficient condition for sustained growth. Despite the deregulation
initiated long back, and with free play of market forces, the rural economy is not
prospering. In fact, in recent times, it is stagnating.
Too much of Government in certain areas
India has too much government in certain areas and insufficient and ineffective
Governance in certain other areas. In areas where there is excessive regulation, it has
led to the consolidation of vested interests of the ruling elites and concentration of
Economic Reforms and Social Policy
| 21
economic and political power. In areas where there is ineffective regulation, it has
negative impacts on the poor. For example, in areas like environmental protection,
social security arrangements, public health and education, public distribution,
provision of necessary inputs for agriculture and handlooms, rehabilitation of the
displaced due to big dams and projects, etc., there is ineffective and insufficient
regulation. Thus, the twin problems of over-regulation and ineffective regulation must
be addressed. This requires an altogether different approach from what is now being
followed in the present form of reforms.
Much of the public debate about economic reforms has been largely around the
need for, the content of, the sequence and pace of, and consequences of such
reforms. The issues of social policy and governance have not attracted the attention
of the scholars and policy as they ought to be. The implications of GATS for social
sector policies are also not examined critically. Hence there is a need to take the
debate on economic policy well beyond the issue of economic reforms in the present
form.
Increased Deprivation
There is now unanimity among the scholars that economic expansion associated with
LPG Policies has resulted in jobless economic growth. It expanded employment to a
few thousands in narrow fields- in high technology areas such as ITC sector and in
low technology areas such as garment factories. The employment opportunities in
other areas such as traditional manufacturing, agriculture and non-farm activities have
been shrinking. The stipulated benefits of economic reforms in terms of better income
earning and employment opportunities and more choice in consumption occurred only
for a minority in India. The majority are suffering from fewer employment opportunities,
increased deprivation, and higher incidence of poverty. Markets have been free in the
negative sense in rising the prices of goods and services and hurting the poor without
providing them the opportunities. Markets are in fact, discriminating against the poor
and unorganized with the emergence of a powerful rentier class which has access to
all economic opportunities thrown open by the reforms.
The uneducated, semiskilled and unskilled workers and those dependent on
public services, small firms, producers of primary products, firms without much market
access and no branding, and producers and sellers who operate in the local markets
Economic Reforms and Social Policy
| 22
are being severely hurt because of the reforms.
Trade liberalization is hurting the domestic producers and is leading to
unemployment at the expense of the poor. Financial market liberalization is making it
difficult for the poor farmers to procure credit at reasonable terms. Fiscal austerity,
which is pursued blindly, is also leading to unemployment. In other words, liberalization
before safety nets were put in place, privatization without adequate regulation and
downsizing public enterprises before employment opportunities were created in the
private sector have adverse consequences on the poor and the unorganized.
Need for a Coherent Social Policy
Markets exclude people as consumers if they do not have any incomes or sufficient
incomes. This exclusion is attributable to the lack of entitlements. Markets exclude
such people as producers if they have neither assets nor skills nor capabilities. People
without assets - physical or financial are excluded. Similarly, people without
CAPABILITIES are also excluded. In the ultimate analysis, such CAPABILITIES are
defined by the market itself. The government must introduce correctives to pre-empt
exclusion or interventions to limit adverse consequences of exclusion. The reason is
simple. Governments are accountable to the people. Markets are not. Globalization is
a market driven process which reinforces exclusion. In the context of globalization, it
may be difficult for the governments to limit such exclusions through economic policies
alone. Hence there is a need for a coherent and consistent social policy.
Reforms have resulted in the dismantling of the traditional support systems in
the community. The social bond between social groups has weakened. In most cases
the Governments are unwilling to step in and provide safety nets. Even if some
Governments are willing, they do not have the ability at their tax revenues are falling
steeply due to reduced tax rates, tax holidays to the private sector and tariff reductions
to the foreign companies. Whenever governments tried to bring down their deficits, the
axe inevitably falls on social expenditures and within social expenditures, primary
education, primary health care and food subsidies for the poor are the worst hit.
Besides many governments have yet to design suitable safety nets to the poor.
Thus, institutions and mechanisms needed to assist the economic transition are
not simply there or if they exist, they remain weak. Market regulation, which is meant
Economic Reforms and Social Policy
| 23
for protecting the poor and unorganized, has been very poor and ineffective. In the
event of job destruction, outmatching job creation and exposure to risk outmatching,
the ability to create institution for coping with risk, designing and implementing
effective social safety nets becomes very important. In two important sectors of the
economy - agriculture and small business, suitable social safety nets are not available.
Family and community risk sharing, and other informal arrangements may be
insufficient to deal with the situations arising out of exclusions. Social safety nets are
required for this purpose. Social safety nets comprise policies and programmes that
provide short term income support and access to basic social services to the poor and
marginalized. Ensuring food security, providing employment, and maintaining access
to critical services become the basic objectives of social safety nets.
Social Safety Nets
In these circumstances, the State must play a key role in accelerating human
development and in providing social security to the vulnerable. The achievements in
human development largely influence the success of either individuals or national
economies in the Globalized economy. It is also necessary to spend as much time and
resources on correcting social fundamentals as on correcting economic fundamentals.
There lies the importance of focusing on social policy.
There are people who argue that inefficiencies of the markets are relatively
small, and inefficiencies of the governments are relatively large. We must realize that
both markets and governments failed to produce efficient outcomes. There are both
market and government failures. Hence, we must introduce corrective devices against
them. An unbridled economic role for the government in the name of distributive justice
is often recipe for disaster in the long run, but on the other hand market solutions are
ruthless to the poor. There are desirable interventions by the government which can
improve upon the efficiency of the market. If government suddenly withdraws from an
activity, there is no guarantee that a vibrant private sector will emerge automatically.
Many of these policies fiscal austerity, privatization and market liberalization is being
pursued as ends in themselves, rather than means to more equitable and sustainable
growth These policies are pursued to the exclusion of other policies needed. The
process of development and rapid changes are putting enormous stress on society.
The sizable food grain stocks and foreign exchange reserves would seem to suggest
Economic Reforms and Social Policy
| 24
that the economy has some cushion to absorb higher fiscal deficit to finance increases
in public expenditure for the implementation of needed social policies.
Governments at the state level are closer to the people and reforms at that level
can have greater effect on the people. The responsibility of the delivery of social
services lies with state and local governments. The quality of delivery of social services
depends upon the quality of governance at the state and local levels. Hence
Governance reforms at the state and local levels for better delivery of public services
with greater accountability to the people becomes important from the social policy
perspective.
Economic Reforms and Social Policy
| 25
ECONOMIC REFORMS - A BOON OR A CURSE?
S. Indra Kant
Professor of Economics, Osmania University.
Introduction:
The large number of papers that have been published in reputed National Journals I.
and large number of Seminars on Economic Reforms being held in Universities and
Research Institutes in the recent past reflect the concerns of the social scientists il...
(perhaps rightly so) on the impact of economic reforms that are being implemented in
the country. The same degree of concern however has not been exhibited in the
methodology adopted for the research study on impact of reforms. As a result, the
findings of the study are not reliable and, in many cases, they only reemphasize the
point of view held by the authors of the works. Consequently, the results of the study
do not have much policy implications. Therefore, there is a need to devote some
attention on the methodology to be used for studying the impact of reforms.
In the literature, basically three methods have been used to study the impact of
a program. The first method is the comparison of situation before the implementation
of the programmer with the situation after the implementation of L. the program. This
is the most popular method used in social science research and is also appealing to
the common man. In this method, first difficulty encountered by. the researcher is the
definition of 'before' and 'after'. What is the appropriate time which reflects the 'before'
situation and what is the reasonable time-period for the full impact of the program to
be felt? The difficulty involved in this method is that in many cases, the respondents
will not be able to furnish the information relating to the earlier period. The longer the
time gap, lesser is the reliability of the information furnished by the respondents. In
addition to this problem, it is recognized that the impact of a program cannot be fully
realized in. the short-run and it involves quite some time for the full impact of the
program to be felt. In this regard, it is not clear how long one should wait to examine
the full impact of the program. Further, there is a tendency to attribute all the observed
changes to the program, which may not be correct. The second method used for
impact study is to compare group under treatment with controlled group which is like
the treatment group. In this case, the difficulty is the selection of controlled group
having similar characters-possessed by the treatment group. In many cases, group
Economic Reforms and Social Policy
| 26
which are not comparable are used for the study which reduces the usefulness of such
comparative study. The third method, which is a combination of the first and the
second methods is more scientific. In this method, the differences that are observed
between before situation and after situation in the treatment group are compared with
changes that are observed in the controlled group during the same period. The
advantage of this method is that the results of the study would be more reliable
provided proper control group is selected and bias in the response is less.
Besides these three methods, one can also carry out simulation exercises using
a model constructed for the economy based on the past data. The reliability of this
method depends upon whether the past behaviour of the economic agents and
economic relationship hold true for the future. Building up the model requires large
amount of statistical data and good number of approximations in the absence of the
required data. This imposes big constraint on the use of simulation method. Social
scientists can also use SWOT (strength, weakness, opportunity, and threats) analysis
which is generally employed by the managers. This basically depends upon assessing
our strengths and weaknesses and how best we can seize the opportunities and meet
the challenges that we may face.
The implementation of economic reforms is taking place when the process of
globalization is underway. Therefore, it is not out of place to briefly invention few
important features of World Trade Organization which will also clear some of the
misconceptions. World Trade Organization (WTO) was established in 1995 he is
replacing General Agreement on Tariff and Trade (GATT) which was in existence from
1948 to 1994. GATT covered only trade aspects while the coverage of Two’s more
comprehensive, wider, and increasing with passage of time. The Agreement on
Agriculture seeks to make free and market-oriented trading system in agriculture. Its
main features are:
1. Tariffication: It implies the replacement of non-tariff barriers by tariff. Further,
the developed countries were to reduce the tariff bindings by higher percentage points,
and in shorter time compared to developing countries. Least developed countries were
exempted from the condition.
2. Market access: It implies that the member countries should provide market
access to exports in terms of certain percentage point of its total expenditure, the
percentage point is slightly higher for developed countries. This clause is not
Economic Reforms and Social Policy
| 27
applicable to commodity which is traditionally staple diet of developing countries.
3. Domestic Support: Aggregate Measure of Support (AMS) covering both
product specific subsidy i.e., price support and non-product specific subsidy i.e., input
subsidy should not exceed 5% of GDP in case of developed countries and by 10% in
case of developing countries. In case it exceeds, it should be brought down in phased
manner. There is some exemption to this clause.
Green Box Support: The support given to items which have minimal impact on trade
like research, pest and disease control, training and advisory services, infrastructure
services, food security, buffer stock operations are exempted.
Blue Box: It is product limited subsidy and covers the fixed cost of farmers. Special
and Differential Treatment Box: Investment subsidy in agriculture on farm
development work, input subsidy to poor farmers etc., are exempted from inclusion in
AMS.
4. Export Competition: The member countries are expected to reduce direct
export subsidy by stipulated rate within stipulated timeframe. There are some
misconceptions which need to be cleared at the outset. Generally, there is an
allegation that the subsidy per farmer in America is more compared to many other
countries. This necessarily does not imply violation of WTO restriction. The restriction
is only on aggregate measure of support which should not exceed 5% of GDP. A
country with a smaller number of farmers and having high GDP can have high subsidy
per farmer, and still it may be within the restrictions imposed by WTO negotiations.
However, it is possible that subsidies to the farmers may be provided in a disguised
form in the name of green box, blue box, etc., On the other hand, in less developed
countries, the subsidy per farmer may be low but it may violate WTO condition
because the number of farmers may be more and the subsidy may be more. than 10%
of GDP (which is very low in absolute terms).
Review of Government Policy:
The first and foremost issue that strikes the mind of a reviewer of government
agricultural policy during the post-reform era is the agricultural subsidy. There are no
two opinions regarding whether there should be subsidy or not. So long as there. is
imperfection in the market and so long as there are wide inequalities in income and
wealth there is a need for government to provide subsidy. However, the important
Economic Reforms and Social Policy
| 28
considerations are for whom subsidy should be given and for what purpose. The policy
of unrestricted free supply of power to farmers is likely to benefit richer farmers more
than the others. Another important issue is that in dry area, underground water may
be excessively exploited without adequate replenishment. The procurement policy is
benefiting the large farmer growing superior cereals and having surplus grain. The
minimum support price policy for coarse cereals is not effective. The government is
not having comprehensive seed policy. For various reasons the farmers depend upon
trader (who combines the role of input supplier, purchaser of output and financer). The
news of farmers committing suicide is "becoming more and more common but the
news of trader committing suicide is rare.
The impact of reforms on agriculture depends upon how the economy gets
adjusted to the changed conditions. No developed country can afford to have 50-60%
of its labour force working in agriculture sector. In many developed countries, less than
10% of labour force working in agriculture sector can feed the ninety percent of their
population. Sometimes they are in a position even to export food to other countries.
So, there is an urgent need to increase the productivity in agriculture Sector in less
developed countries and simultaneously re-deploy the existing work force in
agriculture in other sectors like medium and small scale industries and in - tertiary
sector. Sooner it is done, lesser will be the hardship imposed by the reforms process.
This does not necessarily imply that persons working in agricultural sector should
migrate to urban area. They may be productively employed in non-farm sector and
rural industries. Secondly, the agriculturists must shift from traditional crops which are
not remunerative to crops which are suitable from climatic conditions prevailing in the
country. The agriculture scientists recommend that floriculture and horticulture would
be more appropriate in Indian conditions. So, Indian farmers must shift from the
traditional agriculture to horticulture and floriculture. Sooner the better. All this cannot
take place without government intervention. Generally, one is under the impression
that liberalization, privatization, and globalization implies no role for government, but
this is not true. The role of government shifts in the post-economic reform’s era from
an active partner in production process to a regulator. Government cannot be a silent
spectator. There can be no game without an umpire. So also, in the market economy,
there cannot be smooth functioning without active and alert government. Government
must play the role of regulator and facilitator of development process. This involves
Economic Reforms and Social Policy
| 29
building up of infrastructure in the form of connecting villages to the regulated markets
by roads and providing transport and communication facilities. There is also urgent
need to provide storing facilities for the perishable items in the village as well as in the
market yards. Government also should provide facilities for processing of food, grading
and packaging of items. The extent of realization of potential benefits of reforms
greatly depends upon the efficiency of the government in providing these facilities.
Whether the reforms will a boon or a curse greatly depends upon the performance of
the government in its new role during the post reform period.
Economic Reforms and Social Policy
| 30
ENHANCING POLICY CAPACITY FOR EFFECTIVE GOVERNANCE
Prof. I. Ramabrahmam
Department of Political Science, University of Hyderabad, Hyderabad.
Prof. M. Kodandaram
Department of Political Science, University of Hyderabad, Hyderabad.
According to Ali Kazancajel (1999) Governance can be analysed and assessed in
social science literature from two perspectives: rational choice theory and Public Policy
on the one hand and historical and sociology of institutions on the other (Leca: 1996).
The advocates of rational choice theory consider governance as the best political
framework for policy making whereas sociologists and historians opt for critical and
comparative perspectives. Governance is mostly used in urban context, especially,
the problem-solving approaches with accent on efficiency. But, over a period,
governance model is being extensively used at the Central Government level besides
to those in the management of transition economies.
According to Daniel Bell, the State had become too big for small problems and
too small for big ones. Traditional government, with its vertical framework, large
bureaucracies and intervention is unable to adapt to a fast changing economic, social,
and cultural context. This is leading to crisis on account of creating complexity of
issues as also plurality of agencies of government, civil society in policy processes
(Dror 1999).
Institutional Reforms Needed
In response to compulsions of neo-liberal economies, institutional reform towards
enhanced policy capacity is attempted in developing countries. The OECD offered a
forum for this debate. A greater State-society interaction followed by governance
reforms it was thought would improve quality of policy process thereby leading to
better governance. Emphasis was on achieving greater efficiency. The re-enactment
of Taylorism perhaps! Being effective at the least possible cost and through increased
output and shrinking bureaucracies in sum and substance accounts for governance
reforms. If one observes the titles of reports, one will easily understand this. In 1993
the Vice-President of US Mr. Gore submitted a report to the President entitled
"Creating a Government that Works Better and Costs Less: From Red Tape to
Economic Reforms and Social Policy
| 31
Results". He proposed improved public service with lower budget, less bureaucracy,
and fewer regulations (Leca: 1996).
Non-State organizations started showing interest in this issue, particularly, in
relation to the debate on development, advocating adoption by developing and
transitional countries of both neo-liberal economic policies and through a new
governance model.
Further features are attributed to the governance reforms which concern
efficiency, such as fiscal rigour (Indian Government also passed an Act in this regard
called Fiscal Responsibility Act), market oriented policies, a reduced role for
government intervention and privatization. The list includes such other issues that
cover (a) accountability (b) transparency (c) equality (d) justice (e) promotion of rule
of law (1) civic and socio-economic rights and (1) decentralization.
Good Governance Reports
One should see in this perception only adjectives that include good governance by the
World Bank and OECD, sound governance by the UNDP, democratic governance in
UNESCO (IBRD, OECD, DAC). The Commission on Global Governance stated that
some of ways of strengthening institutions: public and private managing their common
affairs is what is governance. Further, it is stated that a continuing process through
which conflicting and diverse interests may be accommodated and cooperative action
is taken is referred to as governance. It includes. formal institutions empowered to
enforce compliance as well as informal arrangements cither agreed or perceived to be
in their interest. Coming to the policy capacity', one should regard governance as a
horizontal policy making mechanism which may include certain missions of
governance, the process of governance, limiting, the number of public agencies shows
a trend towards privatization with limited control by politically controlled executive.
Certain policy fields and actors, il appears, resist democratic politics. The general
interest may have to be sacrificed in this process. It was pointed out by critical social
scientists that the task of public administration shifts from serving society to sectoral
interests and. customers/consumers. This has the risk of aggravating inequalities
between citizens and regions of the country.
Economic Reforms and Social Policy
| 32
Policy Capacity:
Institutional Effectiveness enhancing policy capacity new studies must be initiated and
to know why do some institutions do better than others, how to appraise public
institutions? A new perspective should also be taken on institutional transformation.
Perhaps one should probe whether the civil society is weak institution or whether
character of social relations have an impact on institutions.
Enhancing policy capacity includes absorbing the information disseminated through
national/international agencies on the success stories of development interventions.
These are known with different labels. Wazin & Oudenhova in an interesting article
stated that replication, dissemination, going to scale extension, adoption, and
transmission,
Policy capacity refers to multi-agency partnerships. An understanding of the
blurring of responsibilities between public and non-public sectors, the emergence of
self-governing networks and the development of new governmental tasks. So are, the
policy capacity is restricted by weak normative underpinnings, blame avoiding and
scape-gloating, proliferation of unintended consequences and inadequate
accountability. In an interesting article entitled 'Governance & Modern Welfare States'
Francois Xavier Merrien stated that the new theory of governance represents
emergence of new thinking about welfare states.
The complexity of the modern world is forcing states to limit their field of action
and enter new action networks with private sector partners. The call for good
governance, therefore, sound too simple and tend to underestimate what states
inherited in the way of institutions and standards. All governments produce policy
analysis. However, the task of assessing the social desirability of the possible role for
policy capacity is complicated. It cannot be isolated from the political regime.
Policy analysis enhances policy capacity which will improve public discourse by
contributing policy alternatives. It provides better predictions of the consequences of
proposed policies. It makes provision for explicit arguments for the consideration of
the full range of proposed policies, social values especially those that were
underrepresented in a representative democracy. Professionalization of policy
analysis and capacity promotes virtues of humility, patience and fortitude besides
analytical integrity which will promote good society.
Economic Reforms and Social Policy
| 33
TRENDS IN NEW INDUSTRIAL LABOUR MARKET AND RELEVANCE OF THE
SECOND LABOUR COMMISSION REPORT
G. Vijay
Fellow, Centre for Social Concerns, Hyderabad.
Introduction:
The past two decades have seen an intense debate within liberal democratic capitalist
plank, between two perspectives on the role of labour unions. The two schools of
thought; characterized as institutionalists and free market thinkers have emerged as
the dominant perspectives at loggerheads with each other on the issue. In the post-
cold war era, Capitalism has unleashed itself in its pre-welfare variant form,
threatening the quality of life of workers and organized working class, while promising
an increased number of employment opportunities achieved through competition
which metaphorically reminds us of battlegrounds for survival, with not many rules.
While the promise is that many will participate in the battle, the fear is many more will
perish. The battle is justified, nevertheless on the grounds that prosperity comes at a
price. However, perverse purpose of competition is self-evident and leaves very little
space for wisdom of the welfare era with no institutions or mechanisms for
redistribution of new wealth in place. The price seems to be far higher for the third
world economies where regulating institutions in their initial instance itself have been
weak. The · policies of liberalization and deregulation contribute towards further
weakening of these institutions. With traditional social norms and hierarchies being
extremely disadvantageous for those deprived, the decades of welfare era have been
unsuccessful in accomplishing the task of decreasing inequalities. And deregulation
at this point would leave these sections with very: little defence mechanisms in this
battle. This paper focuses on the manufacturing industrial working classes and their
experience in this process. The Second Labour Commission Report therefore was
looked at by the working classes as a hope towards building this defence. In this
backdrop this paper tries to identify trends in the labour market in the backdrop of
debates around role played by organizations of the working class and the nature of
the newly emerging labour relations. The paper presents experiences of workers -
both organized and unorganized working in the industries of an industrial town; Kothur
in Mahbubnagar district of Andhra Pradesh and tries to analyse the outcomes for
Economic Reforms and Social Policy
| 34
workers in contexts where trade unions exist and where they don't. Based on this
analysis and the experiences of workers elsewhere referred to in literature, we analyse
the contributions made by the Second Labour Commission Report with reference to
the consequences it has had for the organized and unorganized working classes and
their rights, in enhancing access to various protections ensuring security and dignity
of employment.
2.1 Trade Unions Bargaining for Fairness - An Institutionalist Perspective
It is maintained that "a capitalist environment has consequences with important
implications for the nature of industrial relations. Most fundamentally, work has the
status of wage-labour. Jobs are located within the labour market; the prospective
worker must find an employer willing to pay a wage or salary in return for the disposal
of his skill), knowledge or physical strength. The capacity to work is thus bought and
sold, rather like fruit or vegetables...from the fact that labour is treated as a commodity
stem many of the fundamental conflicts in industry. The wages and conditions which
the worker naturally seeks, as a means to a decent life are a cost to the employer,
cutting into his profits, and he will equally naturally resist pressure for
improvements...because the employer must regard labour as a cost to be minimized,
it is in his interest to retain a worker in employment only while it is profitable to do so.
This means that worker's jobs are always at the mercy of economic and technological
vagaries". It is further maintained that "within capitalist industry, workers - are treated
less as men and women with distinctive needs and aspirations than as de humanized
'factors of production'. Their upbringing and education are devoted primarily to
rendering them in some narrow often devoted primarily to rendering them in some
narrow respect useful to an employer. In the absence of an immediate use, they are
declared redundant - useless, unwanted, surplus to requirements. So long as they are
employed it is their narrowly defined sphere of usefulness which dominates their work
experience. Utilitarian criteria may prescribe that they perform tasks which are
excessively strenuous or degrading or so monotonously repetitive as to eliminate any
significant scope for intrinsic employment in work... Pay differentials run in close
parallel with other inequalities at work. The highest paid normally have pleasant
working conditions, flexible working hours, long holidays, generous sickness and
pension schemes, secure employment. The lower paid are often exposed to accident
and disease and to insecurity of earnings and employment, -have the longest standard
Economic Reforms and Social Policy
| 35
hours of work, often have to work shifts and unsociable hours, and usually enjoy few
'fringe' benefits. They are also commonly required. to 'clock in' at work and are subject
to a range of other regulations and conditions which underline their inferior status. The
link between the hierarchies of pay and control is very close: in general, it is the
occupations with the least. formal autonomy, in the most subordinate positions, which
receive the lowest earnings. As the extent of control over subordinates increases, and
the closeness of direction from above diminishes, so income normally rises. At the
extreme, those rich enough to live comfortably on their unearned income can choose
work which altogether free from subordination. Economic inequalities pervade the rest
of the social life. The level of income defines the general possibilities of a family's
quality of living to material and cultural impoverishment or. enrichment. Health and life-
expectation vary directly with income and occupational status. The children of the rich
enjoy educational privileges, and hence are well placed to enjoy the same career
success as their parents. The political influence wielded by the wealthy and the
industrially powerful is disproportionately great." It is therefore argued that "there exist
two fundamental social groupings or classes. On the one hand are those who work in
a variety of manual occupations, in clerical positions, as technicians, or in minor
supervisory grades: men and women who make an obvious contribution to production
which is not adequately reflected in their pay and conditions. On the other, there are
those whose property allows them to live from the labour of others; and the top levels
of managers who, whether or not they have a major stake as hare holders of the
companies they control, pay themselves salaries which far exceed any contribution
they may make to the productive process. Between these two classes there exists a
radical conflict of interests..."
It is argued that "Marx denied, that there was any 'iron law of wages'... The level
of wages he insisted, was 'only settled by the continuous struggle between capital and
labour, the capitalist constantly tending to reduce wages to their physical minimum,
while the working man constantly pressed in the opposite direction'. Trade unionism
provided some protection and even a means of advancement..." The Marxist approach
further maintains that "trade unionists have often proclaimed far more radical aims:
the reconstruction of the social order: the abolition of the dominating role of profit; the
establishment of workers control of industry; the reorganization of the economy to
serve directly the needs of the producers and the general members of the society; the
Economic Reforms and Social Policy
| 36
humanization of work; the elimination of gross inequalities in standards of living and
conditions of life; the transformation of cultural richness from the privilege of a minority
to the property of all." (Hyman, 1985).
The rise of trade unions or organized working class cannot be rooted merely
through demands for higher wages or emoluments. Consciousness, structural
transformations, and changing social relations underlie this 'trivial exercise and to draw
rationale for existence of trade unions from the bargain between workers and
managements is very superficial. E.P. Thompson states that "the making of the
working class is a fact of political and cultural, as much as of economic, history. It was
not the spontaneous generation of the factory system. Nor should we think of an
external force - the 'industrial revolution' - working upon some nondescript
undifferentiated: raw material of humanity and turning it out at the other end as a 'fresh
race of beings'. The changing productive relations and working conditions of the
industrial revolution were imposed, not upon raw material, but upon free-born
Englishman - and the free-born Englishman as Paine had left him as the Methodists
had moulded him. The factory hand or stockinger was also the inheritor of Bunyan, of
remembered village rights, of notions of equality before law, of craft traditions. He was
the object of massive religious indoctrination and the creator of political traditions. The
working class made itself as much as it was made" (Thompson, 1968).
Thompson further states that "this growth in self-respect and political
consciousness was one real gain of the Industrial Revolution. It dispelled some forms
of superstition and of deference and made' certain kinds of oppression no longer
tolerable. We can find abundant testimony as to the steady growth of the ethos of
mutuality in the strength and ceremonial pride of the unions and the trades. clubs..."
(Thompson, 1968). Thompson maintains that "Luddism lingers in the popular mind as
an uncouth, spontaneous affair of illiterate hand workers, blindly resisting machinery.
But machine-breaking has a far longer history. The destruction of materials, looms,
threshing-machines, the flooding of pits or damage to pit-head gear, or the robbing or
firing of houses. or property of unpopular employers - these, and other forms of violent
direct action, were employed in the eighteenth century and the first half of the
nineteenth... more often they were means of enforcing customary conditions,
intimidating blacklegs, 'illegal men, or masters, or were (often effective) ancillary
means 'to strike or other trade union' action." (Thompson, 1968). Solow's observations
Economic Reforms and Social Policy
| 37
explain these actions. Solow maintains that the labour market is guided by the
common-sense idea of fairness. He quotes Marshall who states that "an employer acts
unfairly if he endeavours to make his profits not so much by able and energetic
management.
of his business as by paying his labour at a lower rate than his competitors; if he takes:
advantage of the necessities of individual workers, and perhaps of their ignorance of
what is going on elsewhere... In fact, trade unions arise as a natural response to the
unfair behaviour of the employers." (Solow, 1990)
The idea of fairness is intrinsic to aspirations of social security. And social
security comes as an alternative to mere increase in wages which can lead to inflation.
(ILO, 1979). It needs to be stated here that when dealing with sale of labour, one thing
which flows from extrapolating Solow's argument is that it is very different from the
sale of other commodities in that sale of labour comes as a package which includes
its dignity. The trade unions are commonly collective bar gainers who try to protect the
link between dignity and sale of labour.
2.2. Trade Unions as Arm Twisters - A Free Market Perspective:
The free market thinkers on the other hand propose that the prices (wages) in the
labour market should be determined by the market forces of demand and supply in a
competitive environment. They vehemently denounced any protections suggesting
that this would distort efficient prices and lead to misallocation of resources.
It is held by the free market thinkers that "trade unions.., are organizations whose
purpose is to improve the material welfare of members, principally by improving
working conditions and raising wages above the competitive wage level. There is little
dispute that, if unions emerge in competitive markets, higher union wages will
introduce allocative inefficiencies into the economy. The ability of the unions to achieve
wage gains is called the 'monopoly' role of. trade unions. (Booth, 1995). It is held by
Hayek that "It is the continuous change of real live market prices and particularly
wages which alone can bring about that steady adjustment of the proportions of the
different efforts to the distribution of demand, and thus a steady flow of the stream of
products. It is this incessant adaptation of wage to the ever changing, magnitudes, .at
which the trade unions have set out to inhibit. Wages are no longer determined by
demand and supply but by alleged considerations of justice, which means in effect not
only simply custom and tradition but increasingly sheer power. The market is thereby
Economic Reforms and Social Policy
| 38
deprived of the function of guiding labour to where it can be sold." (Havek, 1980). A
similar view is voiced by other writers (Burkitt & Bowers, 1979, Freeman & Medoff,
1984, Pencavel, 1991). Hayek further holds "these legalized. powers of the unions
have become the biggest Obstacle to raising the living standards of the working class.
They are the chief cause of the unnecessary big difference between the best - and
worst-paid workers. They are the prime source of unemployment...the crucial truth,
which is not generally understood, is that all the powers employed by the individual
trade unions to raise the remuneration of their members rest on depriving other
workers of opportunities"
Following this logic is the analysis that trade unions are rent seekers. Buchanan
states that "rent is that part of the payment to an owner of resources over and above
that which those resources could command in any alternative use. Rent is receipt more
than opportunity cost. In one sense, it is an allocatively unnecessary payment not
required to attract the resources to the particular employment.” It is maintained that
"the term rent-seeking is designed to describe behaviour in institutional settings where
individual efforts to maximize value generate social waste rather than social surplus."
It is further maintained that "all economic rent tends to be eroded or dissipated as
adjustments take place through time. Above-cost payments to any entrepreneurs or
resource owners must attract other profit rent seekers to enter identical or closely
related employments. As such entry proceeds, rents earned initially are driven down
and, in the limit, disappear altogether." However, trade unions prevent free entry of
new employees in to markets where they have monopoly power and thus become
rent-seekers. (Rosen, 1969, Calvo, 1978)
The Neo-liberal argument therefore suggests that trade unionism essentially
reflects an interest group. It is maintained that "the aim of the union is primarily to
benefit the group of workers concerned rather than workers as a whole or society as
a whole, its theories which attempt to explain the determination of wages, hours,
conditions of employment etc., are not general but primarily group theories. They are
attempts to explain how the wages, hours and conditions of employment are
determined for a group of workers. the principles of action which it lays down are
primarily group principles and its economic policies, demands and methods are
primarily intended to protect and benefit the group of workers concerned... The
principal economic aims of the union are to prevent the lowering and, if possible, to
Economic Reforms and Social Policy
| 39
raise the wages of all the members of the group; to shorten the hours of work of the
group; to increase the security and continuity of employment of the members of the
group and, if possible, to secure steady and assured work for all in it; to prevent the
deterioration and, if . possible the general conditions of employment of all the members
of the group - especially to. better the conditions of safety and sanitation in the shop
and to prevent arbitrary discipline, demotion and discharge of workers and arbitrary
fining and docking of wages.". (Hoxie, 1985). I It is reflected in the idea that "despite
new methods of selecting management and training, management, there are still too
many at the top of the tree who look upon the unions as organizations solely directed
at creating barriers to efficiency or prevent increased productivity." (Bergh, 1970).
2.3. Competitive Global Capitalism and the Role of Trade Unions:
While debates around how to analyse the role of trade unions gains momentum, in the
real world there is a growing danger that trade unions might well be a thing of the past.
Although theoreticians like Wallerstein have been very optimistic in their reading, of
possible direction, emerging trends would take, reality seems to have gone overboard.
Let us summarize some important arguments in Wallerstein's model. Firstly, in
Wallerstein's analytical framework capitalism is viewed as one big system. Secondly,
it is seen as a system operating in cycles. Thirdly, labour is seen in this process as
moving upwards in a secular trend, in terms of employment benefits and conditions.
Fourthly, it is predicted that all the labour will be formalized over the long term,
implying-eventual-homogeneity-in-the-labour market: - And fifthly, this process-in-the
labour market, along with certain other processes, is seen as reducing capital
accumulation and leading to a crisis in capitalism.
Alternatively what seems to be a more plausible trend in the real world situation
is proposed by scholars like Schwab and Smadja (1996) who contend that, in the era
of restructuring, "labour reductions, made possible by technological and organizational
changes, also contribute to the higher remuneration of capital. Clearly productivity
increases no longer necessarily translate secured jobs and higher wages. Whilst in
the past "higher profits meant ignore job security and better wages", global competition
'tends to de-link the fate of the corporation from the fate of its employees' (quoted in
Sideri, 1997:40).
This de-linking is operationalized through the process of informalization. 'For
many years’ informal employment, although its existence was not denied, was
Economic Reforms and Social Policy
| 40
assigned to be in decline and/or of. little relevance for understanding and interpreting
advanced economies and their prospects. Instead, an assumption prevailed that
informal employment was a mere leftover from a previous era of production. Work and
welfare would become increasingly formalized and result in an end-state of full
employment and comprehensive and universal formal welfare provision. However, the
history of the past twenty years in advanced economies and beyond has taught us
that such an assumption can no longer be accepted' (Williams and Windebank,
1998:5).
Williams and Windebank argue that ‘a popular prejudice that characterizes the
study of economic development, and one that is seldom questioned, is that there is a
natural and inevitable shift towards the formalization of goods and services provision
as societies become more "advanced" (i.e. the "formalization of work thesis"). Indeed,
this is frequently taken as the "measuring rod” that defines third world countries as
"developing" and the first world as "advanced". In this view, the existence of the
supposedly "traditional" informal activities is a manifestation of "backwardness, and it
is assumed that they will disappear with economic "advancement" and
"modernization”. However, there are good reasons for questioning the universality of
this unit-dimensional trajectory of economic development. Although over the long
wave of history, a relative formalization of work has undoubtedly taken place, there is
good deal of evidence that the natural culmination of formalization - full-employment -
has not only never been achieved but also that some advanced economies are moving
even further away from this holy grail' (Williams and Windebank, 1999). .
Edmund Heery and Jolin Salmon observe that 'for some, we live in an "age of
insecurity," and risk and instability have become defining features of contemporary
social life. Underlying this viewpoint is a coherent set of statements about the nature,
causes and effects of recent change in employment relations which can be labelled
the "insecurity thesis". This thesis informs a great deal of contemporary debate and
commentary and includes among its key propositions; that economic risk is being
transferred increasingly from employers to employees, through shortened job tenure
and : contingent employment and remuneration; that insecurity is damaging to long-
term economic performance, through its promotion of employment relationship
founded on opportunism, mistrust and low commitment; and that the emergence of an
insecure workforce imposes severe costs on both individuals and the wider society'
Economic Reforms and Social Policy
| 41
(Heery and Salmon, 2000:1).
They go on to suggest an insecurity thesis with the following ten propositions (ilvid.:2-
10):
Proposition One: Employment in the developed economies has become more
insecure or unstable in the sense that both continued employment and the level of
remuneration have become less predictable and contingent on factors which lie
beyond the employee's control; Proposition Two: The trend towards insecure
employment has been compounded by changes in the external labour market and
national systems of employment regulation that serve to exacerbate insecurity;
Proposition Three: Employees increasingly regard themselves as insecure and the
issue of job insecurity has become more salient in recent years; Proposition Four: The
incidence of both job instability and feelings of insecurity is changing, and previously
secure groups are now finding themselves in a precarious position; Proposition Five:
The increase in work-force insecurity can be traced either to globalization of the world
economy and resultant pressure for cost reduction within national economics, or to
national systems of capitalism which promote dominance of financial interests and the
short-term management of company assets in the interest of 'shareholder value';
Proposition Six: The emergence of the insecure work-force is prompting a change in
the balance of expectations within the employment relationships and is associated
with the erosion of employees' commitment, encouragement of opportunistic
bargaining, higher transaction costs and il disincentive for employers to train;
Proposition Seven: The spread of insecure employment imposes both economic and
psychological costs on employees and has been associated with both the
intensification of work and the widespread abuse of management authority; .
Proposition Eight: The emergence of a more insecure work-force is stimulating
demand from employees for protective legislation and is furnishing a new
representative opportunity to trade unions; Proposition Nine: The emergence of a
more insecure work-force is associated with a range of wider social Ills, including
barriers to skill development in the system of production, erosion of consumer
confidence the field of consumption, rising inequality in income and wealth and a
reduction in social cohesion which is manifest in rising crime, family breakdown and
political alienation; Proposition Ten: The emergence of an insecure work-force
necessitates action to reform the system of employment, which may take the form of
Economic Reforms and Social Policy
| 42
voluntary action by employers to rebuild job security or promote 'employability', legal
regulation to eliminate insecure work, or the reform of corporate governance to ensure
companies become more responsive to the interests of employees.
With reference to Trade Unions scholars maintain that 'An almost complete
erosion of possible action strategies has occurred in Third World countries. With
structural adjustment the state is no longer able to share benefits. The ceremonial side
of collective bargaining, whether in the form of corporatist state controls, may still be
there but any nominal wage increases are more than neutralized by subsequent
inflationary pressures. Instead of benefits, trade unions receive messages. of
retrenchment, reductions, in tenured employment and worsening contractual
conditions' (Thomas, 1995:15). Further, 'it goes without saying that the large and
increasing proportion of workers who are engaged in various categories of informal
work relations, and who are victims of casualization of. work in medium and large-
scale enterprises, represents a further problem to trade union recruitment (ibid.).
To follow up on the debate on the role of trade unions, the above discussed
diverging readings of trends suggest different roles for trade unions. Trade unions
have been perceived by institutionalists as agencies ensuring dignity for workers while
the free market thinkers have seen trade unions as rent seekers, monopolizing
opportunities at the cost of large sections of unorganized workers. While Wallerstein's
reading reinforces the free market argument indirectly - that trade unions are indeed
taking far more share than the system can afford, suggested by the undeterred secular
upward mobility of labour, thus, contributing to crisis. Heery and Solomon suggest that
the times to come are likely to become far more unjust for the working class denying
them not only dignity but minimum security and stability of employment. In this
process, while Wallerstein foresees strengthening of class war as the trend, scholars
like Thomas see it as leaving very little substance in the Trade Union movement
implying, that there could be a denial of survival opportunities for working class
organizations.
Even before we analyse the concrete trends, in the following few paragraphs
we try to show the difference between an organized secure working class and the
emerging insecure employment patterns.
3.1 What Does Secured and In-secured Employment Mean:
It is stated that 'India has enacted several legislations to provide social security to the
Economic Reforms and Social Policy
| 43
industrial workers. the most important legislations are:
Workmen's Compensation Act, 1923: provides for compensation to workmen or
survivors in case of industrial accidents and occupational diseases, resulting in
disablement or death.
Employee's State Insurance Act, 1948: provides for health care and cash benefits in
cases of sickness, maternity, and employment injury.
Employees' Provident Fund and Miscellaneous Provisions Act, 1952; The Pension
Ordinance, 1995 (amended in 1996): provides for provident fund, employees' deposit
linked insurance and a pension to the workers and their-families.
Maternity Benefit Act, 1961: Regulates the employment of women before and after
childbirth and provides for 12 weeks of maternity leave, medical bonus, and certain
other benefits.
Payment of Gratuity Act, 1972: provides for payment of gratuity at half month's wages
for every completed year of service or part of thereof, more than seven months.
for the workmen
Industrial Disputes Act: provided for job and income security covered under the act.
The Minimum Wages Act: guarantees the minimum wages.
Payment of Wages Act: guarantees that wages are paid as stipulated and in
accordance with certain norms on time limits for payments, payment for extra work,
permissible deductions etc., the act also provides for the payment of compensation in
the event of retrenchment. Any retrenchment, closure or lay-off requires notice,
consultation, compensation, and prior notice of administrative clearance by a
competent authority.
1957 Resolution, 'Automation without Tears': ensures that there will not be any
retrenchment because of automation.
Apart from these there are some legislations made for some specific groups of
workers:
Separate laws to cover coal mines and tea plantations.
Separate legislations for workers employed in beedi, cine and mining industries,
which provide for housing, medical, educational, and recreational facilities. There is a
separate legislation for ports and docks, which deals with their employment. conditions
and safety and health aspects. (Thakur and Venkata Ratnam, 2001).
Economic Reforms and Social Policy
| 44
3.2. Perspectives on Regulating Labour Markets:
In developing countries legal restrictions, it is argued have contributed to different
types of labour market rigidities. Labour Market flexibility is thus interpreted to mean
the marginal role for if not absence of norms and institutions and is regarded as
essential for maximization of both employment and economic growth (Ajit, K.Gosh,
1995; Minor Mora Salas, 1998). In India, there are different 'rigidities' placed by the
existing legal system:
i. Restrictions on hiring. The Contract Labour (Regulation and Abolition) Act, (1970)
pronounces clearly that the system must be abolished in the long run and it must be
permitted only where permanent labour is also not used to perform the same functions.
The Children (Pledging of Labour) Act, 1933, Child Labour (Prohibition and
Regulation) Act, 1986 and Employment of Children Act, 1938 prohibits children being
employed in hazardous jobs.
ii. Protection against dismissal: The Industrial Disputes. Act (IDA 1976) stipulates that
factories with more than 300 workers are required to take permission from the
government before retrenching workers. The amendment to IDA in 1982 requires all
factories with more than 200 workers to take permission from the respective state
governments before laying off or closing the factories (K.V. Ramaswamy, 1999).
iii. Restrictions on working time and functions: The Industrial Employment (standing
orders) Act sets rights and obligations of employees and employers relating to
classification of employees, shift working, hours of work, entry and exit, attendance,
stoppage of work, leave and holidays, punishments for misconduct, suspension or
dismissal, separation, on retirement, grievances, redressal procedures etc., (Ajeet N.
Mathur, 1992).
iv. Regulations on pay and social security: Payment of Wages - Act, 1936, Minimum
Wages Act, 1948, Payment of Bonus Act, 1965, Equal Remuneration Act, 1976,
regulate the pay and Workmen's Compensation Act, 1923, Employees State
Insurance Act, 1948, Employee's Provident Fund Miscellaneous Provisions Act, 1952,
Maternity Benefit Act, 1961, Payment of Gratuity Act, 1972, regulate social security of
workers.
v. Regulation of Association: In India, any seven individuals could form a trade union
according to the Trade Unions Act. After economic reforms, in 1993 this act was
Economic Reforms and Social Policy
| 45
amended. Now, the act requires a minimum membership of ten percent of the
employees in any firm to form a union (Agarwal Pradeep, 1997).
It has been observed by Guy Standing (1997) that the era of social regulation had
assured different forms of securities:
i. Labour market security: Adequate full employment; employment opportunities,
through state guaranteed.
ii. Employment security: protection against arbitrary dismissal, regulations on
hiring and firing, imposition of costs on the employers, etc.,
iii. Job security: A niche designated as an occupation or 'career', plus tolerance of
demarcation practices, barriers to skill dilution, craft boundaries, job qualifications,
restrictive practices, etc.,
iv. Work security: Protection against accidents and illness at work, through safety and
health regulations, limiting on working time, unsociable hours, night work for women,
etc.,
iv. Skill reproduction security: Widespread opportunities to gain and retain skills,
through apprenticeships, employment training, etc.,
v. Income security: protection of income through minimum wage machinery, wage
indexation, comprehensive social security, progressive taxation, etc.,
vi. Representation security: Protection of collective voice in the labour market, through
independent trade unions and employer associations incorporated economically and
politically into the state, with the right to strike, etc.,
In the post flexibilization phase Guy Standing argues that these securities have
manifest themselves in their respective forms of insecurities.
It is quite evident from the above analysis, that even at the level of analyzing
the several legislations, the divergence of ideas is manifest clearly. While for a set of
scholars the labour market related legislations are construed as 'rigidities' and
'restrictions', for others it connotes different types of 'securities. How do we know if an
established norm is to be defined as a ‘rigidity', 'restrictions' or as 'security'? To answer
this question, we need to answer the question what does 'rigidity' or 'restriction' mean
and what does 'security' mean? As already stated, the claim of free market thinkers is
that the present legal regulations of the labour market leads to unproductive
investment of resources on labour who by exercising their monopoly power get a share
Economic Reforms and Social Policy
| 46
of resource that they do not deserve and as a result, this becomes a constraint on the
expansion of the organized sector. The claim of those constructing legal regulations
as ''security' is that without these regulations, labour suffer 'deprivation and
vulnerability to deprivation'. Implying that they lose their capacity to resist a rapid
decline in labour standards. In what follows we present the recent trends in the labour
markets with reference to shares of organized and unorganized sectors in the total
labour force.
4.1. Is Informalization a Dominant Trend in the Labour Market?
(i) Evidence Suggesting Rough Weather for Trade Unions:
According to Bhattacharjee (2001) 'shows decline in unions submitting annual ‘returns'
to central government'. It is argued that the power balance has shifted towards capital.
This is suggested by the increased number of strikes that failed. And the number of
closures (account of lock outs being more than the number of closures on account of
strikes. The man days lost on account of strikes were 70.7 percent and man days lost
on account of lockouts was 29.3 percent during 1965-69. However, the man day's lost
on account of strikes has decreased to 38.6 percent and the man days lost on account
of lock outs has increased to 61.40 percent during 1995-98 (Anil.K. Sen Gupta, 2003).
All this means that the agencies monopolizing opportunities have become lesser of a
constraint on capital's expansion in the organized sector. One would naturally
therefore expect expansion of the organized sector. Further, it is almost over one and
a half decades since the structural reforms have been introduced. And in the parlance
of economic theoreticians this period suffices the requirement to assess the long-term
impact of reforms. Although 'optimistic' economists owing their allegiance to the reform
package, still think their 'long term is longer than this. Nevertheless, given that the
existence of the conventional idea of 'long term has been around longer than these
economists, we go with conventional wisdom rather than wisdom of convenience.
Is Kothur an Exception to the Rule:
Kothur is not an exceptional case- it represents a general pattern of what has come to
be known as the new industrialization model. Labour conditions like those in the new
industries of Kothur, have also been observed by researchers in other regions of the
country. These scholars have studied the new industries located in both old industrial
areas as well as new industri.il towns (Holmstróm, 1998; Kattuman, 1998; Tewari,
Economic Reforms and Social Policy
| 47
1998; Knorringa, 1998). For example, Rajsamand in Rajasthan and Tiruchengodu in
Tamil Nadu (Cadene, 1998), Tiruppur in Tamil Nadu (Swaminathan and Jeyaranjan,
1999), Vapi in Gujarat (Gorter 1996 and 1998), and Patancheru, Jeedimetla,
Gaddapotharam and Bollaram in Andhra Pradesh (Vijay, 2000; Vanamala, 2000) have
all grown into industrial towns only over the past 15 years. Let us briefly look at the
observations of these researchers about trends in industrialization and conditions of
labor to establish the point that new industrialization is a reality and a general trend.
Peter Knorringa observed the process of growing informalization in the Agra
footwear industry in northern India. He points to the presence of 'informal, insecure,
and low-paying sweat-shop employment conditions' (1996:178). The decade of the
1990s was a watershed period during which the nature of the labour market changed,
with a marked increase in informal sweat-shop employment patterns in new units.
Commenting on the industry's prospects, Knorringa states that 'continuing on the
same footing with predominantly sweat-shop employment would result in stagnation,
decreasing employment and further deterioration of employment conditions
(ibid.:178). He identifies the increased role of sub-contracting and introduction of
flexibility in the labor markets. as factors contributing towards this deterioration. The
observations made about trends of employment patterns in the new industries of
Kothur are like Knorringa's findings. Knorringa also observes that 'most large firms and
a few. "independents” follow a runaway strategy, while direct exporters and suppliers
to domestic premium market segments: serve leading actors who follow a premium
artisanal strategy' (ibid.:178). Thus, the fact that there is multiple employment. patterns
and that the quality of employment opportunities depends on various factors, which in
this instance is identified as the market to which these industries cater, is akin to the
classification of industries made in the work on Kothur. Obviously, the essence of this
observation is that the stability of markets has come to determine the stability of
employment patterns. ' ..
The findings of Peter Gorter, who studied another newly emerging industrial
estate, Vapi in the western Indian state of Gujarat, at around the same time, indicate
that informalization is not limited to the labour market but is all pervasive. Gorter refers
to the increased role of informal cliques of industrialists that lobby the bureaucracy
and political representatives over matter such as 'subsidies, transport facilities,
pilferages, pollution, licensing, and even labour unrest (1996:135). Thus, these
Economic Reforms and Social Policy
| 48
industries succeed in escaping the administration and various regulating institutions,
violating several legally set norms and standards. In Vapi's industries, Gorter notes
that industrialists · recruit workers from different linguistic backgrounds. He quotes one
industrialist as saying, 'if workers are from different communities, they will not unite so
easily against me' (ibid.:121). With respect to working class movements, Gorter also
notes that 'it is much easier for industrialists to deal with labour unrest in small. units
where most of the workers are neither permanently employed nor organized.
Punalekar and Desai (1994:93) found only_27.6 percent of the interviewed workers in
Vapi's-small-scale enterprises had the status of permanent employees. Of course, this
is a major reason for decentralizing production wherever possible' (ibid.:122). Gorter
also points out that the often-used tactics to break strikes in small units include closing
a unit and starting a new one with new workers, bribing the unionists, or using police
force to intimidate and criminalize politically. active workers' (ibid.:122). The
observations made in the work on Kothur about the predominance of informal
employment patterns and conscious recruitment of workers from various regional
backgrounds holds true even in the Vapi industries. Although Gorter does not identify
the workers of Various linguistic backgrounds, the phrase clearly suggests recruitment
of migrant labour. The methods used to disorganize workers and dismantle trade
unions in Vapi are also quite like the strategies employed by industrialists in Kothur.
Observations on migrant workers and their role in the overall transition of labour
market patterns emerge more clearly in Veronique Dupont's study of the industrial
town Jetpur in Gujarat. Dupont notes that 'the system of contract labour is still limited
in the Jetpur textile printing industry. Interstate migrant contract workers form about 5
to 10 percent of the total workforce of industry, depending on the level of economic
activity. However, this type of recruitment which is far from exceptional in India is
indicative of a new' economic logic and likely to lead to reinforced trend... they ensure
a very elastic labour supply. (1998:321-2). Thus, the trend of employers taking
advantage of migrant labour’s vulnerability and the crucial role of the vulnerability of
this section of the workforce in. advancing the process of informalization is confirmed
by Dupont's study.
Swaminathan and Jeyaranjan (1999) present a case from southern India with
a special focus. on gender discrimination in employment opportunities in the new
industries, where the experiences of female workers are like those of female
Economic Reforms and Social Policy
| 49
employees in Kothur. Ambattur industrial estate in Chennai, with 2000 industries, is
the biggest in South Asia. Although it is also one of the oldest, its boom began only
during the 1990s, and instead of the traditional engineering industry it experienced an
increase in garment and leather industries. Swaminathan and Jeyaranjan note that
'One important factor that has enabled the Indian exporters in gaining ground in the
international market, albeit at the lower end of the product spectrum, is the availability
of relatively cheap labour. More specifically, women labour is available to the industry
in large numbers and at an even lower wage' (ibid.).
They argue that 'the complex interplay of poor material conditions and
patriarchal forces, both at home and in the labour market, is an important reason why
capital is not only assured of a continuous supply of women labour but is also able to
get this supply relatively cheap...Such an interplay of material conditions and
patriarchal ideology is a boon to employers assuring them of a steady supply of cheap
labour. More important, it subsidizes considerably the cost of production for employers
in several ways: by enabling employers to hire workers on temporary basis without
entering into contractual arrangement that are legally tenable, thereby also enabling
the evasion of payment of any benefits (statutory or otherwise) to workers like
maternity leave with pay, ESI, PF etc. From the women's point of view, this
arrangement inhibits the accumulation of experience apart from exploiting them in
every way' (ibid.).
In the new industrial town of Patancheru in Andhra Pradesh, informal
employment patterns, characterized as fleeting employment by M. Vanamala (2000),
is to be found among female workers. This is the same as the employment pattern
that Peter Knorringa refers to as runaway employment. In both, there is a preference
for young; unmarried women who cannot be long-term employees because eventually,
after marriage, they would have to migrate to their in-law’s place of residence. Thus,
their employment creates a rise in informal patterns of employment, relieving
employers of the need to provide benefits, including security and career benefits, that
come with long service.
Production costs can also be kept low in other ways, as observed by Vijay
(1998, 2003) with reference to the new chemical industries that emerged in India after
1987. In the newly emerging industrial town of Gaddapotharam, Andhra Pradesh,
industries have been releasing untreated toxic effluents into the village tank with
Economic Reforms and Social Policy
| 50
impunity. No action has been initiated against then even though they have caused
considerable damage to the health, livelihoods, cattle, and land of the village
community over the past decade. This shifting of costs suggests both a shift-of-dirty
industries from developed countries, taking advantage of the collapse of formal
institutions or lack of institutions in the developing world. Also, since the findings
suggest that most of the victims are Dalits and · minorities, it may be argued that
vulnerable sections ultimately end up paying these costs. Similar observations are
made in studies of other new industrial areas, including Bollaram, Patancheru and
Jedimetla, where people have suffered a similar fate (Ratna V. Reddy and Bhagirath
Behera, 2002). Thus, the observation in study on Kothur about non-functioning of
formal institutions or lack of institutions in the new industrial towns leading to shifting
of costs to certain vulnerable social groups is true not only of labour but also of other
vulnerable sections of society and other kinds of social costs.
The above studies establish that the new industrialization, wherever it has come
up, in northern, western or southern India, displays similar trends, especially with
reference to organization of production, social background of workers, employment
patterns, conditions of labour, workers' Organizations, and regulatory institutions.
Given the objective of several laws providing social security being removing certain
undesirable practices and forms of employment, and capital being unsuccessful in
expanding the organized sector, we raise the question of appropriateness of the
present policy approach towards labour given the experiences of new industrial labour
in Kothur and elsewhere in India. In what follows therefore we propose to review the
Second Labour Commission Report by raising this fundamental question - What has
the Second Labour Commission Report suggested to address the problem of
vulnerability which is at the crux of the problem of informalization and insecurity.
Relevance of the Second Labour Commission:
It is one year since the Labour Law Journal published the details of the
recommendations made by the Second Labour Commission Report. Let us analyze
the policy framework relating to labour as enumerated in the Second Labour
Commission Report and see how it proposes to address the problems of vulnerability,
informalization and insecurity found in the newly emerging industries. Is the Labour
Commission Report a compass meant to change the direction of trends or is it merely
Economic Reforms and Social Policy
| 51
a torchlight helping us walk in the direction already known ?
The Second Labour Commission Report discusses the significance of
Gandhian and Nehruvian thought in the making of labour policy. However, the report
itself it seems is designed to accommodate the demands of the newly emerging trends
in the market, and all the other concerns must take a back seat. While there is rhetoric
about the problems of rural. Poverty, choice of technology, self-reliance, inequality,
backwardness, illiteracy, vulnerability, discrimination, and democratization of labour
relations, the report focuses more on the un-organized sector than on the organized
sector. This may not in itself be a weakness. However, it treats trade unions and
employers unequally. In the case of the organized sector, the report gives a history of
the trade union movement and presents a critique of its strategies, methods, and
leadership. It identifies the perversions in the movement. As part of this critique, the
report homes in on the competitive militancy, the adventurism of leaders, the
involvement of the mafia in unions, the corruption, the non-work culture, and the
monopoly. It notes that there has been a decrease in unionization over the years. The
report states that, therefore, central unions are not only taking joint actions but are
also critiquing government policy. The report cautions that the methods adopted by
the unions are leading to loss of public sympathy. Unfortunately, however, the report
does not provide a quality detailed critique of employers' strategies to weaken the
workers and dismantle trade unions. While noting that 'the. forces ranged against them
(unions) are strong and further strengthened by multinational forces...governments
themselves are under pressure to withdraw from the field (Second Labour Commission
Report: 122), it does not suggest alternatives for workers to express their demands.
The Commission states that 'the system of social security envisaged in this report
comprises social, assistance programs for people at the bottom of the income
hierarchy., social insurance programs for those at the top of the hierarchy and a
combination of the two for those in between' (Ibid., : 58). While our evidence suggests
what may be called the 'downward spiral in conditions of all categories of workers, and
it seems odd that the report does not suggest how to prevent further deterioration in
the conditions of workers in relatively higher levels of the hierarchy.
Instead of advising a strong role for the state in the wake of the threat to the
trade union movement, the report merely maintains that 'we have no doubt that
bilateralism is an essential ingredient of industrial, relations, and that both parties (the

Economic Reforms and Social Policy
| 52
management and unions) should rely on it as far as possible' (ibid.: 16). A lack of
orientation seems to be the hallmark of the report. For example, when discussing the
problem of a rise in contractual employment, far from addressing it with the kind of
seriousness.it deserves, the report uses it as a comical instance to critique corruption
in the trade unions (ibid.,: 130) As if implying that contractualization is totally a result
of the failure of unions. Though the commission reports the increasing role of mafia in
trade unions, it fails to point out that the cause of the decreasing space for civilized
negotiations. The Commission notes that there is fragmentation in the unions. This is
not a valid critique at all, not because it is not true but because there is nothing wrong
with such fragnientatic.17. India as a nation has been led by unstable coalition
governments because of the multi-layered and complex fragmentation in the society.
The so-called competitive militancy is only an expression of the larger context, and
any attempt to regulate it would scuttle democracy. It would amount to forcing people
to vote for a large party to have a stable government. When large trade unions become
vulnerable to corruption, there must be scope for alternative initiatives, even if they
represent a minority to begin with.
In its discussion on social security, the report states that one of the basic
requirements of social protection policy is to preserve the delicate balance implied by
this notion of shared. responsibility. Thus, attention should also be paid to the
encouragement of individual thrift and initiative, the traditional strength of family or
community support, as well as the development of institutionalized schemes based on
national or group solidarity...' (ibid: 48). However, the report: does not actually address
the problems with and complexities involved in dealing with the individual, groups,
community, and institutional levels of providing social security. Thus, this reference to
shared responsibility is reduced to superficiality.
With reference to un-organized workers, the report notes that 'they (people who
are employed on casual, temporary or intermittent basis) need continuity of
employment. Various decasualization measures would be relevant in this context.'
Though from this it seems casualization is recognized as a problem, when it comes to
suggesting measures to prevent it, the report recommends constituting welfare boards
with contributions from workers. Thus, while most of the casual workers earn less than
the minimum wages, the commission wants contributions from them. Worse, this is
supposedly a decasualization policy. The threat of casualization is highest in small-
Economic Reforms and Social Policy
| 53
scale industries. However, data from the Commissioner of Sales and Excise Tax show
that small-scale industries make good profits in case of Kothur for instance. It is not
true that small-scale industries are always making low profits. The Commission,
however, is swayed by stereotypical constructs and declares in its report that, ‘, the
liability of small and tiny industries may be minimized. Similarly, persons employed on
contract or temporary basis may be covered for ... limited benefits such as health care
and old age benefit at less cost' (ibid.: 58). This is more dangerous, given that large
industries are choosing to outsource their production to small units. It would have a
negative impact on the prospects of workers in small industries. In addition, the
Commission warns that 'there should not be harassment by inspectors or the
imposition of extra administrative burdens to file returns' (ibid.,73). As it is the Assistant
Labour Commissioner's Office and other similar formal bodies are not doing their job
properly. Such statements would be misinterpreted to mean nothing should be done.
However, the Commission does propose comprehensive social security measures for
unorganized workers. This report apparently is a very promising report for the un-
organized sector. It states that in its proposed umbrella legislation 'protection includes
protection of the ability to meet the essential requirements of life and a minimum
standard and quality of life, as well as protection of the rights that are essential to
"protect" one's bargaining power and social status. The absence of bargaining power
will pave the way to a life of deprivation, distress sale of one's work power, violation of
human dignity, and exploitation' (ibid: 10). It further notes that “it is equally clear that a
scheme of protection and welfare has to include assistance to meet exigencies that
arise as a result of unemployment, temporary unemployment, under-employment,
accidents al places of work, the need for insurance cover against accidents and
occupational health hazards; the demands of pensionary, domiciliary ani other kinds
of care in the old age; the need for housing, allocation of children, medical and
nutritional care of the family - particularly-dependents.--and the constant up-gradation
of the skills necessary for continued employment (ibid: 10). However, we have seen
that there is lot of stratification and segmentation in the market, based on gender and
region (caste, class skill may also be mentioned) and other similar factors. Access to
resources, institutions, organizations, and services itself is heterogeneous and
unequal. Under such circumstances, to propose an umbrella legislation without getting
into the complexities of the process and the inclusion-exclusion dynamics, would
Economic Reforms and Social Policy
| 54
ultimately deny access to many the workforce. Even with the legislation in place it will
be yet another farce. Further, this strong insistence on the un-organized sector and
the casual! analysis of the organized sector has strengthened fears about what the
commission was constituted for. Trade unions have voiced many apprehensions. They
have viewed the Commission mainly as an onslaught on the security and emoluments
of unionized workers, though there is insufficient evidence in the report itself to
substantiate this viewpoint. The fears of the trade unions include 'loss of rights,
increase in number of hours of work, loss of number of holidays, increase in contract
labour' translated from Telugu daily, Vaarta, 5 December 2002). This very
conventional unionist view, being very protective about those who are secure without
looking into the context of those that are unorganized, can be counterproductive for
the trade union movement. It is only by mobilizing those at the bottom of the hierarchy
that the trade union movement can survive. The Commission in a way has only paved
the way for what is inevitable through the liberalization, privatization, and globalization
policies. It has not suggested any way to counter the emerging trends. It has
recommended minimum protections for un-organized workers. By doing so, it has
effectively prepared the institutional ground for the process of informalization. When
the unions know that informalization is coming on a large scale, instead of sticking to
the conventional political base of secured employees, the unions must take this as a
challenge to mobilize the new categories of workers and make a comeback to
influence policy through a larger democratic channel. If they do not do so, not only will
what is now protected labour probably lose all its benefits, which almost seems
inevitable, the unions may also find it too late to mobilize an insecure, highly mobile,
conflict-ridden, diverse, vulnerable, and impoverished working population.
References:
1. Bergh, Tony Van Den (1970), The Trade Unions - What are they? Pergamon
Press; Oxford.
2. Burkitt, Brian and David Bowers (1979), Trade Unions and the Economy, The
Macmillan Press Ltd, London.
3. Cadene, Philippe (1998), 'Network specialists, industrial clusters and the
integration of space in India', in Philippe Cadéne and Mark Holmstrom (eds)
Decentralized Production in India; Industrial districts, flexible specialization and
Economic Reforms and Social Policy
| 55
employment, French Institute of Pondicherry, and Sage Publications: New Delhi.
4. Dev Mahendra. S and Vijay Mahajan (2003), 'Employment and Unemployment,
C.H.Hanumantha Rao and S. Mahendra Dev (eds.): Andhra Pradesh Development;
Economic Reforms and Challenges Ahead, Centre for Economic and Social Studies;
Hyderabad.
5. Dutta, Dilip (2002), 'Effects of globalization on employment and poverty in
dualistic economies: the case of India', School of Economics and Political Science,
University of Sydney.
6. Freeman, Richard.B, James, L. Medoff (1984), What do Unions do? Basic
Books Inc., Publishers; New York.
7. Ghose, Ajit.K. (2000), 'Trade liberalization, employment and global inequality',
International Labour Review, Vol. 139, No. 3.
8. Garter, Peter (1996), Small industrialists, big ambitions: economic and political
networks on a large industrial estate in West India, Oxford University Press: Delhi.
9. Gorter, Peter (1998), 'Representation or racket? Political Networks in an
Industrial Estate in West India' in Philppe Cadene and Mark Holmstrom (eds)
Decentralized Production in Indian; Industrial districts, flexible-specialization and
employment, French Institute of Pondicherry, and Sage Publications: New Delhi,
10. Holmstróm, Mark (1998) ’Introduction: Industrial districts and flexible
specialization - the outlook for smaller firms in India', in Philppe Cadéne and Mark
Holmstrom (eds) Decentralized Production in India; Industrial districts, flexible
specialization and employment, French Institute of Pondicherry, and Sage
Publications: New Delhi.
11. Hayek, Friedrich (1980), 1980s Unemployment and the Unions: The Distortion
of Relative Prices by Monopoly in the Labour Market, Institute of Economic Affairs
(IEA): London
12. Hoxie, R. F (1985), "The Economic Program of Trade Unions”, in W.E.J.Mc
Carthy, Trade Unions, Penguin Books; Middlesex.
13. ILO (1979), Role of Trade Unions in Social Security in Asia and the Pacific;
Report of a Regional Seminar, 21 March-3 April, International Labour Office;
Trivandrum.
14. Kattuman, Paul. A. (1998) 'The role of history in the transition to an industrial
district: The case of the Indian bicycle industry' in Philppe Cadene and Mark
Economic Reforms and Social Policy
| 56
Holmstrom (eds) Decentralised Production in India; Industrial districts, flexible
specialization and employment, French Institute of Pondicherry and . Sage
Publications: New Delhi.
15. Knorringa, Peter (1996) Economics of Collaboration: Indian Shoemakers
Between Market and Hierarchy, Sage Publications; New Delhi.
16. Knorringa, Peter (1996) 'Operationalization of flexible specialization: Agra's
footwear industry’, Economic and Political Weekly, Vol. 31, No.52,
17. Knorringa, Peter (1998).' Barriers to flexible specialization in Agra's footwear
industry', in Philppe Cadene and Mark Holmstrom (eds) Decentralized Production in
Indian industrial districts, flexible specialization and employment, French Institute of
Pondicherry and Sage Publications: New Delhi.
18. Pencavel, John (1991), Labour Markets Under Trade Unionism; Employment,
wages and Hours, Blackwell; Oxford.
19. Reddy Ratna. V and Bhagirath Behera (2002), 'Environment and
Accountability: Impact of Industrial Pollution on Rural Communities', Economic and
Political Weekly, Vol.37, No.2, January 11-17.:
20. GoI (2002), Report of the Second Labour Commission, Ministry of labour,
Government of India.
21. Salmon John and Edmund Heery (2000), Tile Insecure Workforce, Routledge
Studies in Employment Relations; London.
22. Sen Gupta, Anil.K (2003), 'Decline of Trade Union. Power in India', The Indian
Journal of Labour Economics, 46(4), Oct-Dec.
23. Sideri, Sandro (1997), ASEM and Asian Prospects within the Evolving World
Economy'. Working paper series, ISS: The Hague.
24. Solow, Robert. M (1990), The Labour Market as a Social Institution, Basil
Blackwell; Oxford.
25. Standing, Guy: (1997),Globalization, Labour Flexibility and Insecurity: The Era
of Market regulation', European Journal of Industrial Relations, Vol. 3, No.1
26. Swaminathan, Padmini and J. Jeyaranjan (1999), Resilience of gender
inequalities : Women and Employment in Chennai, Economic and Political Weekly,
April 17.
27. Tewari, Meenu (1998), 'The State and the shaping of the conditions of
accumulation in Ludhiana's industrial regime: A historical interpretation' in Philppe
Economic Reforms and Social Policy
| 57
Cadene and Mark Holmstrom (eds), Decentralized Production in India; Industrial
districts, flexible specialization and employment, French Institute of Pondicherry, and
Sage Publications: New Delhi.
28. Thakur, S.N. (1972),Unemployment in the Indian Rural Sector, Indian Journal
of Labour Economics, Vol. 14, Issues 3&4.
29. Thomas, Henk (ed.) (1995), Globalization and Third World Trade Unions :The
Challenge of Rapid Economic Change, Zed Books: London.
30. Thompson, E.P. (1968), The Making of English working Class, Harmondsworth:
London.
31. Vanamala, M. (2000), Structural Adjustment, Flexible Labour Markets and
Female employment: A Study of India and Southeast Asian countries, Indo-Dutch
Program on Alternatives in Development, Working paper / IDPAD 2000-2, The Hague.
32. Vijay, G. (1998),'Neo-liberalism and Conflict for Environmental Resources; A
Case Study', Indian Journal of Human Rights, Vol. 2, No. 1&2, Jan-Dec.
33. Vijay, G. (2001), 'Impact of Flexibilization on Quality of Life and Social Security
of Labour in New Industrial Towns', in S. Mahendra Dev, V. Gayathri, R.P. Mamgain
(eds) Social and Economic Security in India, Institute for Human Development; New
Delhi.
34. Vijay, G. (2003), 'Other side of new industrialization', Economic and Political
Weekly, Vol.38, No.48, November 29-December 5.
35. Williams, C. Colin, and Jan Windebank (1998), Informal Employment in the
Advanced Economies: Implications for Work and Welfare, Routledge: London.
Economic Reforms and Social Policy
| 58
REFORMS-SOME REFLECTIONS
Prof. K. Koteswara Rao
Dean, Commerce and Management Studies, Ambedkar Open University,
Hyderabad.
The scope of the reforms undertaken since 1991 has been wide ranging covering such
spheres as international trade, industrial production, financial markets, and foreign
investment. The reforms related to two major areas - 1. Trade Liberalization aimed at
out word orientation and integrating with the rest of the world and 2. Deregulation and
privatization aimed at putting the private sector as the 'dominant player.
Trade liberalization involved abolition of import quotas, and rationalization of tariffs,
introduction of market determined foreign exchange rate and current account
convertibility. Deregulation involved abolition of industrial licensing system, promotion
of Foreign Direct Investment and Portfolio Investment, interest rate deregulation and
privatization and restructuring of public enterprises.
Indian economy grew at an annual rate of 3.5 percent for about 3 decades since
1950s. It was called as the Hindu rate of growth. During the period between 1981-90
the growth rate accelerated to 5.6 percent. However, the high growth has been
achieved with severe macro-economic imbalances reflected in huge fiscal deficit, large
current account deficit, high volume of public debt and a high debt service ratio. The
unsustainable nature of this growth has resulted in 1991 economic crisis when it ·
could not meet the oil price rise and other shocks arising from the Gulf war.
The reform measures introduced since 1991 have resulted in a higher growth
rate of 7.5 percent for three consecutive years - 1994-95 to 1996-97. However, the
growth rate has fallen to 5.5 percent since 1997-98. This growth rate seems to be
sustainable because of the following reasons:
The economy has withstood the East Asian economic crisis, global depression,
the war in Iraq, oil price fluctuations, a major drought without any large-scale
disruption.
The growth rates in the liberalization period seem to have taken place in a
competitive environment when compared to 1980s.
Inflation is low, exchange rate is reasonably stable, foreign exchange reserves
have been rising, short term external debt is low and food grain stocks are adequate
Economic Reforms and Social Policy
| 59
even after a drought year.
These achievements are by no means smaller and the reforms introduced must
be credited for these achievements. However, there are regional variations in the.:
growth performance of the states. Some states like Gujarat, Haryana, Karnataka,
Kerala, Punjab, and Rajasthan have done well both on the growth front and on the
poverty front. On the other hand, states like Orissa, Assam, Bihar have been lagging
on both growth as well as poverty fronts.
The source of higher growth since 1992 has been the service sector. In fact,
average annual growth rates in both the agriculture, and industrial sectors seem to be
lower by about half percent during the post liberalization era compared to the pre-
liberalization period. It is only the service sector that lies accelerated to 7.8 percent
during 1992-2002 from 6.7 percent during 1981-90. Thus, the service sector has been
the principle engine of growth.
However, it would be difficult to maintain a high growth rate of 7 to 8 percent
without a strong expansion of the manufacturing sector. Agriculture continues to be
the main source of employment. About 60 percent of the total workforce are still
employed in the agriculture, though its share in GDP has fallen to about a quarter. This
implies that production of a typical worker in agriculture is one fourth of that of his
counterpart in the non-agriculture.
The NSS data suggests that employment growth decelerated in the Indian
economy in 1990s. The employment growth relative to the income growth has fallen
sharply in recent years. There has been hardly any employment growth in the
agricultural sector. Another feature of the labor market is the increasing casualization
of the labour force as revealed by an increase in the share of casual workers in total
employment. The casual workers are most vulnerable sections of the society.
Comparison with China:
In this context, a comparison of performance of China and India reveal several
interesting aspects. China has enjoyed a fastest economic advance in human history
averaging real per capital growth of 8.1 percent per annum over the past decade. In
India it is only 4.4 percent. The per capita income of China in 2001 is $3976 in
purchasing power parity terms. While the per capita income of India is only $2358.
Thus, there are considerable differences in the per capita income levels of China and
India and between their growth rates.
Economic Reforms and Social Policy
| 60
The one reason for China's exceptional growth is that it started market-based
reforms in 1978 well before India's reforms started in 1991. China is the largest
recipient of foreign direct investment among the developing countries with annual
investments ranging from zero in 1978 to about $52 billion in 2002. This constitutes
nearly 5 percent of G.D.P of China. F.D.I in India has also increased significantly
though at much lower levels, growing from $129 million in 1991 to $4. billions in 2002.
This constitutes less than one percent of G.D.P of India. China had commendable
success in its export performance. Its exports reached $320 billion in 2001 compared
to $35 billion for India. China has had success in moving from labour intensive to
technology intensive exports. Telecommunications equipment and computers now
account for a quarter of its exports. India has yet to significantly diversify its export
base.
These numbers do not mean that everyone in China and India are experiencing
greater wellbeing. China and India still have larger pockets persistent poverty and
deprivation that require the attention of suitable domestic policies.
However, China has made considerable progress on the social front. Literacy
stands at 84 percent in China, infant mortality rate at 32 per 1000 live births and under
5 mortality rate at 40 per 1000 live births. India's Human development indicators are
very poor in relation to those of China. Literacy stands at 65 percent, infant mortality
at 68 per 1000 live births and under five mortality is 96 per 1000 live births. This is not
surprising since China is spending 2.3 percent of its. G.D.P on education and 2.1
percent on health whereas India is spending only 1.3 percent of its G.D.P on health.
The expenditure on education has increased significantly from 0.8 percent of G.D.P in
1950 to around 3.2 percent today.
Conclusions:
It seems that a sound manufacturing base is a precondition for getting benefited from
the economic reforms. This is one of the important lessons which we can draw from
China's development experience. India must strengthen its manufacturing sector and
through suitable policies expand the same. Reliance on the service sector is not a
sustainable solution. Secondly, the structural constrains for sustained growth and
economic governance constrains to these thresholds have to be clearly distinguished
and measures must be initiated to improve economic governance. Thirdly, major
Economic Reforms and Social Policy
| 61
progresses must be made in sectors like health, nutrition, education, water, and
sanitation. Big gains in education and health are required before per capital incomes
are substantially raised. Fourthly, social safety nets must be designed and
implemented to safeguard the interests of those who are going to be bypassed by the
reforms. Fifthly, political institutions must allow poor people to participate in the
decisions that affect their lives and protect them from arbitrary and unaccountable
actions by the governments. Strategies ensuring women's right to education,
reproductive health services, property ownership, labour force participation and
secure land tenure will go a long way in empowering women, particularly poorer
women. Lastly, given the low employment - income elasticities, a very high-income
growth would be needed for solving the unemployment problem within a reasonable
time.
A Task Force setup by the government had suggested 9 percent GDP growth
target per annum to generate adequate employment. But it might be difficult to realize
above 7 percent growth rate without drastic policy changes. Against this background,
it would be important to have agricultural growth for: employment generation.
Economic Reforms and Social Policy
| 62
ECONOMIC REFORMS AND SOCIAL POLICY: SOME ISSUES
Dr. P. Perraju Sarma
Reader in Economics (Retd.), The Hindu College, Machilipatnam.
Economic reforms are a drastic change in economic policy which is an aspect of social
policy. The question is who formulates Social Policy? A policy is a plan of action with
a definite goal. The problem lies with the qualifying word 'Social'. The word social is
derived from the word society and society is a collection of individuals. Every individual
has his own mind, but society has no mind of its own. So social policy must be obtained
from individual preferences. There will be conflicts in individual preferences since real
life economics is a' case of pareto optimality. Thus, the important question is what are
the sources of social policy?
Sources of Social Policy
In the case of our country, the constitution is an important guidebook for social policy.
For example, the directive principles given in our constitution are ready references for
formulating and implementing social policy. In a dynamic society there is need for a
change in social policy and there must be provision for making such changes. So, the
government must have the power to formulate and change social policy. The courts
can and will interfere wherever such changes are in contravention of the constitution.
This is one of the limitations on the Governments' power to change social policy.
The second important source of social policy is the "election manifesto" of the party in
power (a common minimum program in the case of a coalition government.) The
"election manifestos" must be given a legal status which is very important if want to
avoid the “stealth character" of reforms. No public debate proceeded the introduction
of the 1990s reforms. A public debate must precede whenever the government
contemplates major changes in socio economic policy affecting millions of people.
India arrived at an “ideological consensus” in the 1950s, also known as Nehru
Model. It relied on extensive industrialization to generate faster economic growth.
Secondary, the major initiative for economic and social change must come from the
state. But the 1990s economic reforms where introduced without arriving at an
“ideological consensus”. It is frequently argued that the reforms got a ‘Post-facto'
approval from the people (as revealed by the 1999 election results). Another indicator
Economic Reforms and Social Policy
| 63
of acceptance is the limited opposition from the people. This is no doubt an important
indicator if we consider the fact it is much easier to mobilize people in LDCs against
something rather than for something.
Disenchantment with Government
The important question is how reforms could consolidate (themselves) in 1990s? Why
there is only limited opposition to them? Though many factors are cited as answer, the
most important factor responsive for this is the people’s disenchantment many with
governments. In Peter Drucker's "Age of Discontinuity" the last discontinuity is
“disenchantment with government". "What explains this disenchantment with
government”? he asks; and answerers. “we expected miracles - and thus always
produces disillusionment". There is the popular "revolution of rising expectations about
the government thesis (thaumaturgic expectations). The thesis is correct, but it cannot
be held responsible for disenchantment with government. Nobody imagined that the
government has a magic wand in its hand and that it can produce development with a
sleight of hand.
Drucker defends government against clichés. Yes, government resists
changes, but its "inability to innovate is grounded in government's legitimate and
necessary function as society's protective and conserving organ". Yes, government is
a poor manager, but "government is also properly conscious of the fact that it
administers public funds and must account for every penny. It has no choice by to be
bureaucratic....... Any government there is not a "government of a forms" degenerates
rapidly into a mutual looting society". A government cannot be run like a business. We
are all familiar with the defending characteristics of government and they cannot be
held responsible for people's disenchantment with government. No doubt some
changes are necessary, and the proposed changes are called governance reforms.
Some other factors must have brought on the disenchantment. In this context
there are two perceptive observations. “The generations the reached manhood
between 1918 and 1960”. Drucker says, were "in love" with government. They were
as the turn of affairs when the disenchantment with government started 2)The--former
V.S Vice-- President Al Gore's "performance review" of the federal government begins
with the words, “The federal government is not simply broke, it is broken". Who is
responsible for this? Naturally, the people of the helm of affairs corruption,
Economic Reforms and Social Policy
| 64
malperformance and the abuse of power, not thaumaturgic expectations or the
defining characteristics of government, are responsible for the crisis of confidence is
government.
Darwinian capitalism
Drucker wants to fix government, not tear is down to clear the field for. Darwinian
capitalism. Never, he writes, "has strong, effective, truly performing government been
needed more than in this dangerous world of ours". Government is not simply a drain
on the economic "Effective government is a prerequisite of social and economic
growth”. The cardinal difference between government and business or non-profit
organizations is democratic accountability government is the only institution which is
answerable to the people at large.
Gkun strongly feels that "the market needs a place, and the market needs to
be kept in its place". He values the market as a decentralized and efficiency system
and for spurring and channelling productive effort and for promoting experiment and
innovation. But he insists that other values must be protected from the potential
tyranny of the market or demand and supply. "The domain of rights is part of what
checks and balances on the market designed to preserve values that are not
denominated in dollars. Economic reforms are meant for promoting efficiency or total
factor productivity in the economy. But social policy incorporates explicit value
judgments of the society and efficiency must also be measured in terms of
achievement of social objectives. Society also adopts a portfolio approach, and it
diversifies its mechanism for production, distribution, and allocation”.
Globalization and disenchantments with government make a dangerous
combination. The former affects the lives and livelihoods of millions of people and the
government must protect them with its portfolio approach. While there is talk of the
retreat of the state (Probably meaning retreat from welfare responsibility) the capitalist
class will need the state more than ever because the regulative tasks will increase.
The state will be expected to manage the popular agitation against globalization the
state will be crucial in providing necessary "nationalist” backing during the process of
globalization. These are only examples.
Economic Reforms and Social Policy
| 65
Keeping the market in its place
But we must recognize that the regulative tasks of government include “keeping the
market in its place”. It does not simply mean price control and taxing or the corporate
sector. It mainly means implicitly and explicitly increasing the domain of rights of the
people. The recent judgments of the Supreme Court increasing people's access to
education food etc., must be viewed against this background. This is dubbed as
“judicial activism". But it is based on the assertion that the courts have a right to pass
judgment including value judgments (no more an anathema for the social scientists)
when the devises of the community are obvious but ignored by the state for different
reasons. judicial activism is also an important source of social policy when other
institutions in the society are dillydallying.
The state in the North-Western European Countries two hundred years ago
was generally means more corrupt and much less soft than the state in the present
day LDCs. During the liberal interlude between feudalism and modern welfare state,
the strong and hard state came into being". One of the characteristics of the liberal
state because a system of a politics and administration marked by a high degree of
personal integrity and efficiency”. “It was probably accomplished by strengthening of
morals in the higher strata backed by legislated sanctions". This has not sharpened in
post independent India. The situation has become so desperate that people are crying
for a halt in the proliferation of the activities of the state.
To restore people's confidence in government there is need for concerted
action on the part of people working in the government and in public sector in general.
They should not forget the fact that they are the beneficiaries of the political capital
accumulated by previous generations and enter this capital is almost spent. They must
build up that capital again by increasing their efficiency in work and by providing
corruption free administration.
Economic Reforms and Social Policy
| 66
ECONOMIC REFORMS & HEALTH ACCESS IN ANDHRA PRADESH
Dr. A. K. Vasudeva chary
Associate Professor, Dept of Economics, Osmania University, Hyderabad.
Introduction:
Health and Medicare does not mean mere focus on an increasing provision of health
services. It should mean a more holistic approach that looks at people’s access and
social security (Hanumanth Rao, 1998). Therefore, the main objective in the national
health policy of 2002 is to achieve an acceptable standard of health amongst the
general population of the country, through an increased access to the decentralized
public health system. This objective is planned to be achieved by establishing new
infrastructure in deficient areas, and by upgrading the infrastructure in the existing
institutions. Equitable access to health services will receive focus. This paper is related
to some aspects of health care in Andhra Pradesh.
Government expenditure and public health
To achieve the objective set forth in the New National Health Policy 2002, Central
government has planned to increase total health sector expenditure from 5.27 per cent
of GDP as at present to 6 percent of GDP. But the allocation to Health Sector reveals
that there has been continuous decline in expenditure on health between the First Plan
and Eighth Plan. Can we take it as an indication of the government to withdraw from
the sector?
In Andhra Pradesh expenditure on health sector has been on the following
items: a) National diseases b) Hospital and dispensaries c) maternal and child health
d) family welfare e) medical education & Research and. f) Health administration.
The component-wise expenditure made by state government between 1960 to
1995 was presented in Table:1: Expenditure on each item is given as a percentage of
total health expenditure. Over a period, the percentage of expenditure to the total
health expenditure reveals that the highest percentage of expenditure was made on
the hospitals and dispensaries, followed by national diseases programmes.
Expenditure on family welfare and maternal and child health was made since 1980s
only. And about 4-10% of the total health expenditure was spent on health
administration during the above period.
Economic Reforms and Social Policy
| 67
A mere 32% of all hospitals, 20% of all beds and about 41% of all trained
Doctors were in rural areas where over 70% of India's population lived. In recent years
since the introduction of liberalization policies the gap taking place even in between
public and private health care also. It is estimated that about 85% of all qualified
Doctors in India are in the private sector and about 65% of all hospitals are privately
owned. Among out-patients 75% in Rural Andhra Pradesh use private health care as
against 72%in Urban areas while among In-Patients in Rural areas 70% use private
health care as against 62% in Urban areas (Sheela Prasad, 2002). It clearly shows
that private health care is used more in rural than in Urban, thereby pointing to the lack
of access to public health services in rural areas in the state. It reflects on the
government's abdication of its responsibility of providing basic health to its population.
Table 2 shows that there are 379 allopathic (General & Special Treatment)
hospitals, 1386 Primary Health Centers, 263 dispensaries in A.P. In all the hospitals,
bed strength is 34,948, of which, 23,100 for common purpose, 5,546 for men, 5,024
for women and 1,278 for children. Number of Doctors including available are 8,617
who were drawn from different departments like medical education development, AP
Vaidya Vidhana Parishad, Directorate of Health, Insurance & Medical services. The
per capita figures in the state shows that, on an average there is one Doctor for 8,844
persons, one bed for 2,181 persons while the one hospital must serve the needs of
about 43,252 persons,
District wise Medical facilities:
District-wise Medical statistics of Andhra Pradesh in Table 3 reveals that the East
Godavari district is in first place in terms of number of hospitals (94), Visakhapatnam
is in the first position in terms of number of beds (2637) and Doctors (632) among the
coastal Andhra districts.
In Rayalaseema region, Chittoor district is in the first position in terms of number
of hospitals (104) and number of Doctors (583) While Kurnool with the highest number
of beds (2083) is in the top position. As regards Telangana region, excluding
Hyderabad, the district of Mahbubnagar has the highest number of hospitals (93) while
Warangal district has the highest number of beds (1531) as well as Doctors (448).
In fact, medical disparities are glaringly visible if we observe region-wise analysis of
medical facilities. In A.P, according to 2001 census, out of a total population is 762
Economic Reforms and Social Policy
| 68
lakhs, 40.66 percent are living in Telangana, 41,6 per cent are in Coastal Andhra and
17.74 per cent are in Rayalaseema. But the percentage of hospitals available in
Coastal Andhra is 40.9 per cent, 38.8 per cent in Telangana and 20.3 percent in
Rayalaseema, The percentage availability of hospitals are more than the requirement
level in Coastal Andhra and Rayalaseema but less in Telangana. Similar situation can
be seen about number of beds and number of Doctors also.
Per capital Availability of health facilities:
A P State as a whole, the Doctor-population ratio is 1:8844, Beds-population ratio is
1:2181 and Hospital Population ratio is 1: 43252. About 14 districts in the State are
found to be below the state average pertaining to Doctor-population Ratio and Beds
population Ratio is also below the state average in about 16 districts (Table-IV). Even
hospital- population Ratio is also not an exception because about Nine districts are
having the less than the state average figure. This shows that still several districts in
the state are in the pathetic situation in terms of medical facilities offered by public
sector. So that there is an emergency need of upgradation/modernization of the
existing facilities and establishment of new facilities in these districts.
Conclusion:
At the outset, State is not equipped with the sufficient medical/health facilities to meet
the requirements of increasing population. Further, Government is reducing budget
allotment to health sector. Private sector is being pampered. The corporate sector
almost exclusively monopolizes cure of heart diseases rather than the infectious
diseases because they wanted to fetch more money. Particularly after the introduction
of the new economic policy health has eased to be a basic right of the people, either
in the country or in the state: those who pay for it only get it, if poor don't have the
means to pay, it is their look out.
The trend of growing privatization in the 90s has been only widen the regional
inequalities in the health sector and the withdrawal of the government will add to the
burden of the people. The analyses pertaining to per capita availability of health
facilities reveals that either the number of doctors, beds or the number of hospitals is
unable to serve the requirements of the minimum number of people in the society. So
that it is suggested that government must take immediate policy decision to establish/
modernize a greater number of health facilities. Government should also withdraw
Economic Reforms and Social Policy
| 69
user fee in public hospitals because global experience of user fees at any level shows
that it will drive out the poor and the indigent. And government should judiciously
allocate funds to the backward regions and districts.
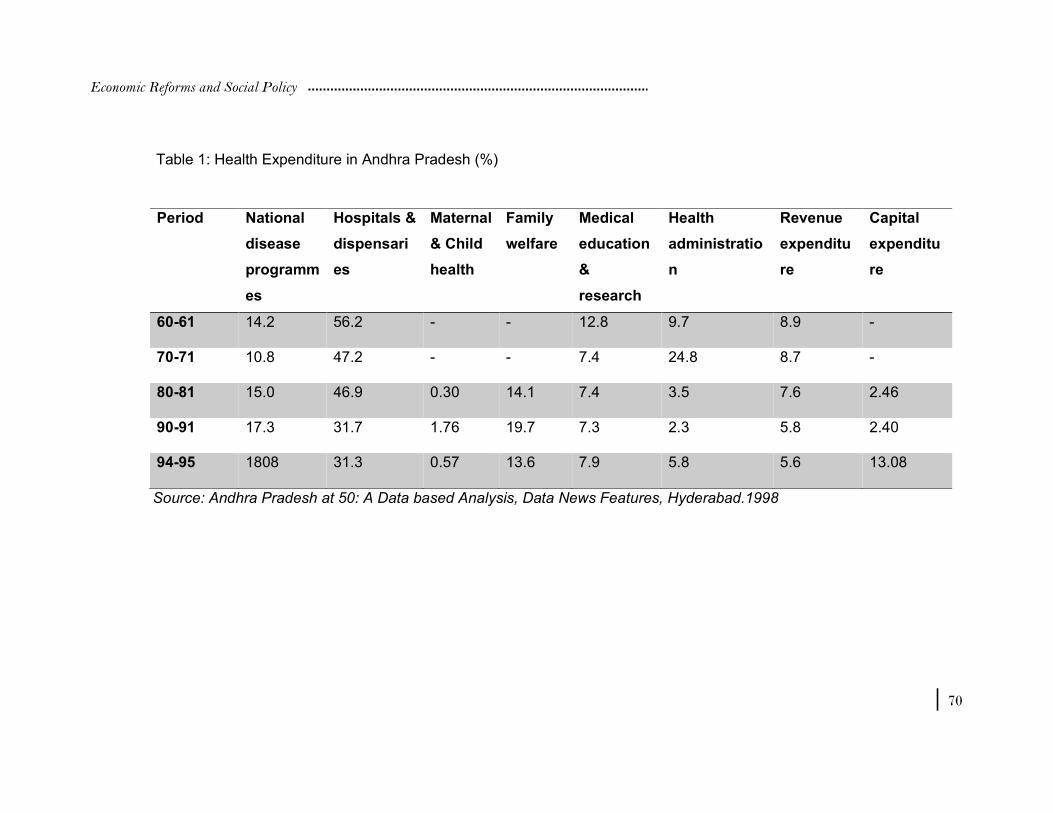
Economic Reforms and Social Policy
| 70
Table 1: Health Expenditure in Andhra Pradesh (%)
Source: Andhra Pradesh at 50: A Data based Analysis, Data News Features, Hyderabad.1998
Period National
disease
programm
es
Hospitals &
dispensari
es
Maternal
& Child
health
Family
welfare
Medical
education
&
research
Health
administratio
n
Revenue
expenditu
re
Capital
expenditu
re
60-61 14.2 56.2 - - 12.8 9.7 8.9 -
70-71 10.8 47.2 - - 7.4 24.8 8.7 -
80-81 15.0 46.9 0.30 14.1 7.4 3.5 7.6 2.46
90-91 17.3 31.7 1.76 19.7 7.3 2.3 5.8 2.40
94-95 1808 31.3 0.57 13.6 7.9 5.8 5.6 13.08
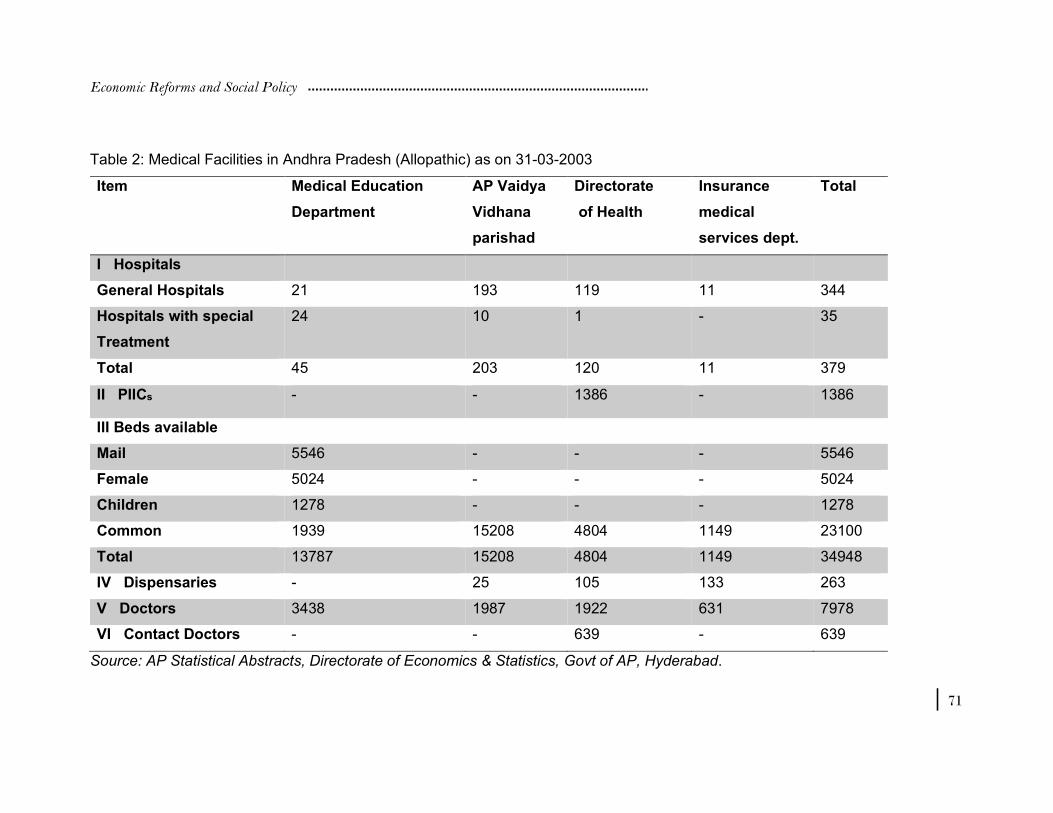
Economic Reforms and Social Policy
| 71
Table 2: Medical Facilities in Andhra Pradesh (Allopathic) as on 31-03-2003
Item Medical Education
Department
AP Vaidya
Vidhana
parishad
Directorate
of Health
Insurance
medical
services dept.
Total
I Hospitals
General Hospitals 21 193 119 11 344
Hospitals with special
Treatment
24 10 1 - 35
Total 45 203 120 11 379
II PIICs - - 1386 - 1386
III Beds available
Mail 5546 - - - 5546
Female 5024 - - - 5024
Children 1278 - - - 1278
Common 1939 15208 4804 1149 23100
Total 13787 15208 4804 1149 34948
IV Dispensaries - 25 105 133 263
V Doctors 3438 1987 1922 631 7978
VI Contact Doctors - - 639 - 639
Source: AP Statistical Abstracts, Directorate of Economics & Statistics, Govt of AP, Hyderabad.
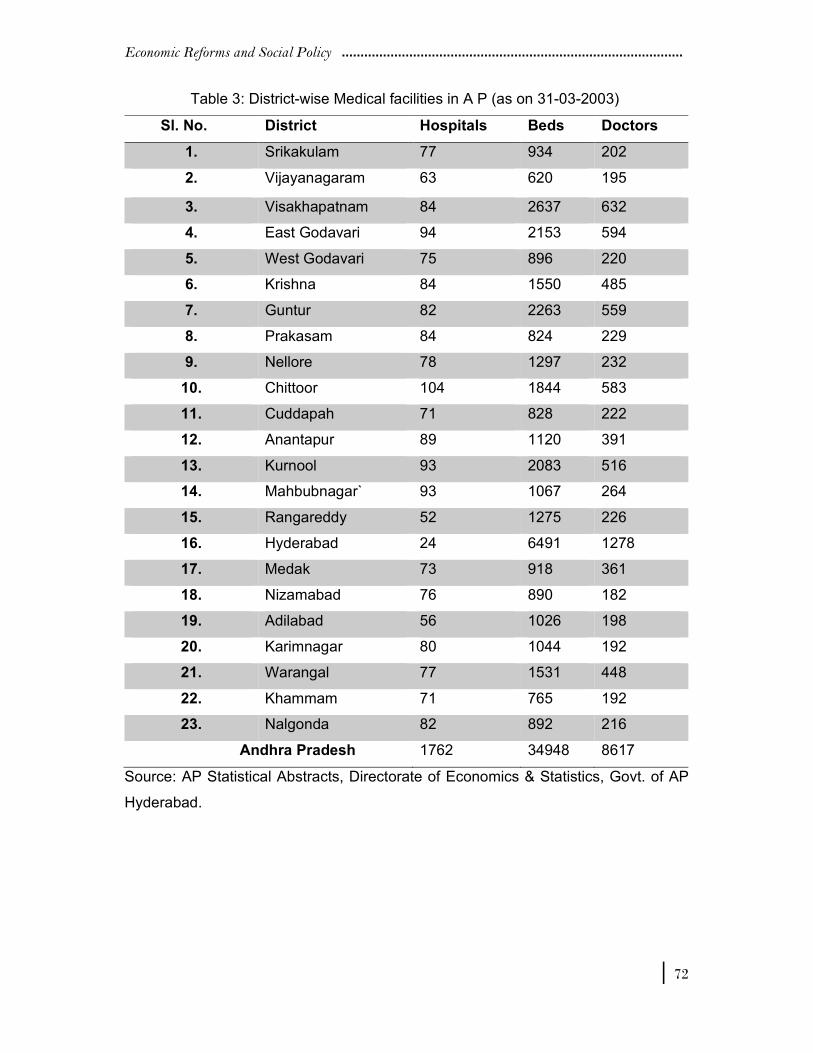
Economic Reforms and Social Policy
| 72
Table 3: District-wise Medical facilities in A P (as on 31-03-2003)
Sl. No. District Hospitals Beds Doctors
1. Srikakulam 77 934 202
2. Vijayanagaram 63 620 195
3. Visakhapatnam 84 2637 632
4. East Godavari 94 2153 594
5. West Godavari 75 896 220
6. Krishna 84 1550 485
7. Guntur 82 2263 559
8. Prakasam 84 824 229
9. Nellore 78 1297 232
10. Chittoor 104 1844 583
11. Cuddapah 71 828 222
12. Anantapur 89 1120 391
13. Kurnool 93 2083 516
14. Mahbubnagar` 93 1067 264
15. Rangareddy 52 1275 226
16. Hyderabad 24 6491 1278
17. Medak 73 918 361
18. Nizamabad 76 890 182
19. Adilabad 56 1026 198
20. Karimnagar 80 1044 192
21. Warangal 77 1531 448
22. Khammam 71 765 192
23. Nalgonda 82 892 216
Andhra Pradesh 1762 34948 8617
Source: AP Statistical Abstracts, Directorate of Economics & Statistics, Govt. of AP
Hyderabad.
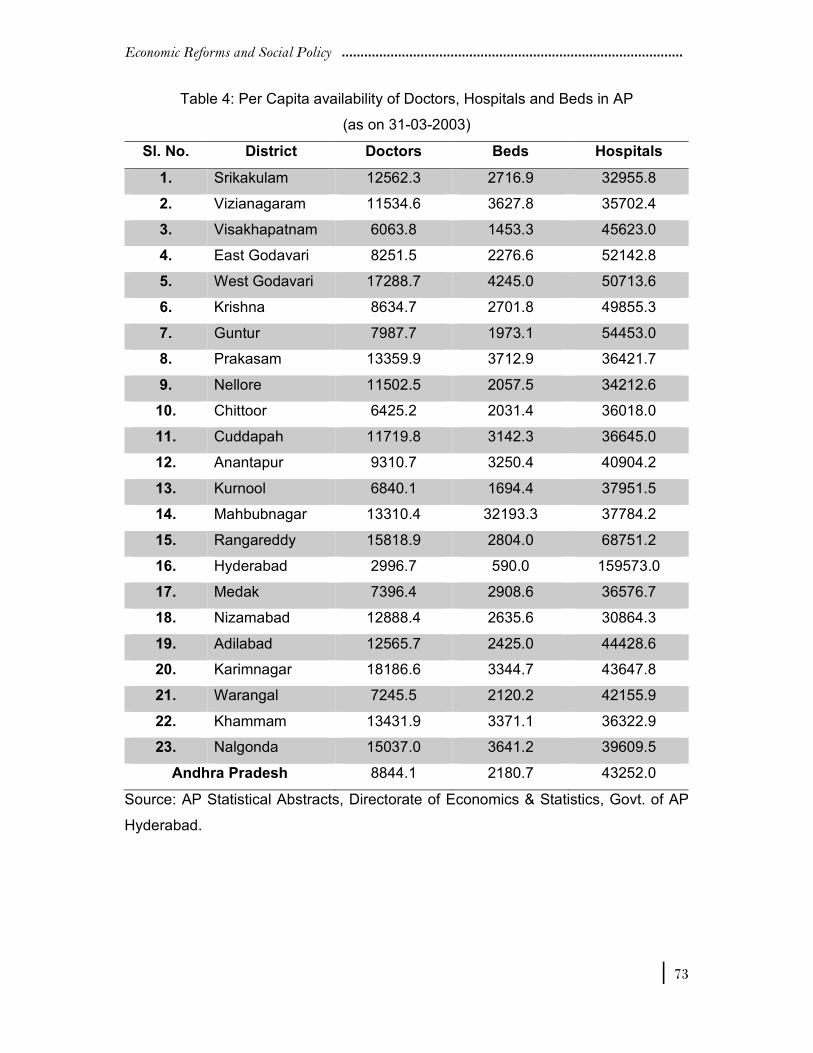
Economic Reforms and Social Policy
| 73
Table 4: Per Capita availability of Doctors, Hospitals and Beds in AP
(as on 31-03-2003)
Sl. No. District Doctors Beds Hospitals
1. Srikakulam 12562.3 2716.9 32955.8
2. Vizianagaram 11534.6 3627.8 35702.4
3. Visakhapatnam 6063.8 1453.3 45623.0
4. East Godavari 8251.5 2276.6 52142.8
5. West Godavari 17288.7 4245.0 50713.6
6. Krishna 8634.7 2701.8 49855.3
7. Guntur 7987.7 1973.1 54453.0
8. Prakasam 13359.9 3712.9 36421.7
9. Nellore 11502.5 2057.5 34212.6
10. Chittoor 6425.2 2031.4 36018.0
11. Cuddapah 11719.8 3142.3 36645.0
12. Anantapur 9310.7 3250.4 40904.2
13. Kurnool 6840.1 1694.4 37951.5
14. Mahbubnagar 13310.4 32193.3 37784.2
15. Rangareddy 15818.9 2804.0 68751.2
16. Hyderabad 2996.7 590.0 159573.0
17. Medak 7396.4 2908.6 36576.7
18. Nizamabad 12888.4 2635.6 30864.3
19. Adilabad 12565.7 2425.0 44428.6
20. Karimnagar 18186.6 3344.7 43647.8
21. Warangal 7245.5 2120.2 42155.9
22. Khammam 13431.9 3371.1 36322.9
23. Nalgonda 15037.0 3641.2 39609.5
Andhra Pradesh 8844.1 2180.7 43252.0
Source: AP Statistical Abstracts, Directorate of Economics & Statistics, Govt. of AP
Hyderabad.
Economic Reforms and Social Policy
| 74
References:
1. P. R Panchmukhi (1987): 'Cost-benefit analysis of Health Services in metropolitan.
areas (mimeo), Centre for Policy Research, Bombay.
2. Sheela prasad (2002): Health Status and Services in AP- A Regional perspective in
'Development of Andhra Pradesh-1956-2001: A study of Regional disparities” (Ed) YV
Krishna Rao, CR Foundation, Hyderabad.
3. Hanmantha Rao (1998): ' Andhra Pradesh at 50: A Data based analysis, Data News
Features, Hyderabad
4. Rama V Baru (1993): 'Inter-regional variations in Health services in AP ‘Economic
Political Weekly, May 15.
5. V R Muralee ((1993): When is Access to Health Care Equal? Some public policy
Issues, Economic Political Weekly, June 19.
6. Alternative Economic Survey (2002): Draft NHP; 2001- A Brief Critique, Praja Shakti
Book House, Hyderabad.
Economic Reforms and Social Policy
| 75
THE PATENT (AMENDMENT) ORDINANCE, 2004
NEED FOR A PRAGMATIC SOCIAL POLICY FOR HEALTH
Dr. Noor Basha Abdul
Professor of Commerce, Acharya Nagarjuna University
"A better world is one in which medical discoveries would be free from patent and there
will be no profiteering from life and death."
- Smt. Indira Gandhi, Late Prime Minister of India
The Patent (Amendment) Ordinance released hurriedly, by the UPA Govt., in
December 2004 has got every tendency for creating an MNC-centered monopolistic
drug market in India and thus disrupting the minimum access to health, especially for
the poor. The Ordinance proposes the third amendment to the Indian Patents Act,
1970, under the dictates of the WTO. The Act was previously amended twice first in
1999 and secondly in 2002. The present ordinance facilitated the product patents in
pharmaceuticals, food, and agricultural chemicals operative from January 1,2005.
With this, the ongoing era of process patenting which facilitated the availability of
medicines to the nation at the world's lowest prices shall therefore become history.
Prior to 1970, when India had product patents for the drug industry, MNCs
especially from the US, UK and Germany dominated the domestic market for
pharmaceuticals, with a share of 85 per cent. However, after changes in the law in
1970, recognizing only process patents, the share of MNCs has gradually declined
over the years and was at about 35 per cent, while Indian companies increased their
market share to nearly 65 per cent in 2003. (1) Now, TRIPS has been the result of an
active lobbying by MNCs and also strong pressures from the US and the other such
developed countries.
.
Impact of the Ordinance
Once the Ordinance is passed by the parliament, the medicines that would be newly
patented command monopoly prices laid down by the sole patent holder, and all.
others shall be prevented from manufacturing, selling, distributing, or importing the
patented product. The term of patent protection would also be extended from seven
Economic Reforms and Social Policy
| 76
to 20 years and Exclusive Marketing Rights (EMR) shall be made available, for the
manufacturers, even before their patent applications are approved.
This apart, what is more embarrassing is the fact that the present Ordinance
appears to have failed in properly utilizing the rarest positive provisions being offered
by the Doha Declaration, and thus would ultimately damage the interests of both its
own country as well as the world's poor. The ordinance also is all set to put the
country's hard- earned sovereignty, status, prestige, and obligations on the altar of the
global giants. The ordinance in the final analysis go contrary to the spirit of the basic
humane and pro-poor health policy as was propounded by several international
covenants such as 1978 Alma Ata Declaration and the 2000 Peoples' Charter for
Health as well as the domestic ones like the 1946 Report of the Health Survey and
1983 National Health Policy
Drug Prices Set to Skyrocket:
One of the potential threats of the withdrawal of the process patent system would be
the skyrocketing of prices. Among those likely to be affected are the large numbers of
people suffering from a wide range of illness such as diabetes, asthma, · hypertension,
coronary heart disease, depression, cancer, HIV/AIDS, arthritis and respiratory and
urinary tract infections. Because, the relatively low cost, locally manufactured generic
drugs that are currently available to patients have to be withdrawn from the market
once the product patenting is introduced. (2)
Consider certain facts relating to the Indian Health sector. While India
comprises 16 per cent of the world's population, it accounts for a mere 1 per cent of
global health care spending. Its per capita consumption of drug amounts to less than
$ 3 per annum compared to$ 191 in the US. India's domestic health care system only
covers 3.7 per cent of its population of over one billion. Therefore, 75 per cent of
expenditure on medicines is borne privately by patients. Given these circumstances
and low per capita incomes, prices must be maintained at an affordable level. (2A).
Experience with Product Patent Regime
If the experience is any indication, the product patent regime is believed, to inflate the
prices to the maximum extent. For example, the generic version of the drug produced
in India to treat CML, costs only Rs.9000 to Rs.12,000 per month. The minute the EMR
holding-Gleevec, the Cancer drug, manufactured by the Swiss MNC Novelties gets a
product patent, the generic versions are bound to disappear · from the market and the
Economic Reforms and Social Policy
| 77
Gleevec shall further shoot up from its present astronomical price of Rs.1,20,000 per
month.(3)
For health volunteers, the worries are more pressing. Medicines Sans Frontiers
(MSF), the Noble Prize-Winning medical relief Organization says it sources more than
a third of the anti-retroviral (ARV) AIDS drugs from India. Indian makers of combination
drugs have been instrumental in crashing the price from about $ 10,500 per patient
per month to just $ 350 per year. It further observed that “India revolutionized the
treatment and care of AIDS across the world".
The pricing position of some of the generic drugs in India where the process
patenting is in vogue and the rest of the world with the product patenting system, can
be taken as an eye opener for the proponents of the new world order with the product
patenting system. (See Table 1)
Initially, the TRIPS agreement may affect a small proportion of drugs (newly
patented) in India. However, the impact will gradually increase over time as virtually
all new drugs entering the market in future would be patent protected and many of the
old drugs can be expected to become ineffective over time as the disease causing
bacteria viruses develop resistance to them, thereby forcing people to switch to the
new more expensive drugs. (4).
Domestic Companies Apprehensive:
While the Government- along with foreign multinationals- is keen to implement the
TRIPS agreement, it has faced resistance from local drug manufacturers and
consumers. The Indian Drug Manufacturers Association (IDMA) protested in 1994 that
" prices of drugs shall go up by 5 to 20 times as a consequence of accepting the TRIPS
proposals". Leading firms like Nicholas Piramal, Cipla, Ranbaxy, Dr. Reddy's,
Wockhardt, Sun pharma and Zydus Cadila have already expressed their
apprehensions over the product patent regime.
Even those companies with larger exposure to R&D, such as Dr. Reddy's and
Ranbaxy are eyeing, growth driven by first mover benefits in the regulated Generic
markets of the US and EU. Particularly, the small and medium sized companies in
India’s Rs. 19,700 crore ($ 3.9 bn) pharmaceutical industry are not prepared to face
the new patent regime. In other words, 95% of the 20,000 pharma companies are
bound to fall in an unprecedented risk (5). The only solace offered in the TRIPS
Economic Reforms and Social Policy
| 78
agreement is that the 49 countries which were designated by the UN as the Least
Developed Countries were extended time to enforce the new patent. regime up to
2016.
The difficulty of ensuring even a minimum degree of democratic access to life
saving drugs is compounded by the high degree of concentration in the international
drug industry. The top 10 companies controlled 36 per cent of the market and the top
20 companies controlled 57 per cent of the world sales.
The product patent Regime would not ensure the speedy spread and marketing of the
new drugs for they take abnormally long time of about 10-15 years to arrive at the rest
of the world. Keayla had also observed that in the process patent system, India was
able to introduce the new drugs within a period of. three-five years only. Table II
demonstrates the facts.
UPA Desires a Trips Plus Regime:
The Doha declaration 2001 specifically indicated that the WTO and TRIPS agreement
“Can and should be interpreted and implemented in a manner supportive of WTO
members' right to protect public health and, in particular, to promote access to
medicine for all...and enable access to existing medicines and research and
development into new medicines".
The Doha declaration also permits over riding corporate patents to provide cheap
drugs to deal with AIDS, Tuberculosis, Malaria and other epidemics. The TRIPS thus
permit the member-Governments the freedom to institute a liberal regime of
compulsory licensing that would keep the patent monopolies under check. Yet the
proposed third amendment has done nothing to build this flexibility into the law. The
Economic and Political Weekly has aptly remarked that both the NDA and the UPA
Governments were keen in stretching the limits of the TRIPS agreement, as was
evident in the Ordinance, and were thus proved to have been enthusiastic in
establishing in India a TRIPS- plus regime. (6). Because, all the harmful provisions of
the NDA's 2003 proposal, were sufficiently legitimized through the present NDA's
Ordinance.
Loose ends in the Ordinance:
The following points in the Ordinance would reveal the deficiencies and objectionable
Economic Reforms and Social Policy
| 79
provisions from the viewpoint of the people at grass roots.
a) Patentability: One of the deficiencies of the ordinance is related to its improper
definition of patentability. In the present condition, there are chances for manufacturers
coming up with spurious applications with doubtful antecedents or with only minor
modifications to the original products. Such cases may lead to endless litigation as is
already happening with the anti- cancer drug, Gleevec. The ultimate sufferer anyhow,
shall be the society only. The Indian Drug Manufacturers Association and the Bulk
Drug Manufacturers Association want the scope of patentability to be restricted to new
chemical entities (NCES), but not the MNCs practice of "ever greening" - making
variations on the same drug through the use of different salts and derivatives, to extend
the scope of the patent life beyond the original 20 years. In fact, even the US could
not be able to surmount this sort of the problem. In the US, out of the 1,035 patents
awarded during the years1989-2000, it was identified that only 35 per cent of the drugs
got new molecules.
b) Pre-grant opposition: The Third Amendment Bill and the Ordinance that followed
have done away with the pre grant opposition that was available in the Indian Patents
Act, 1970. TRIPS is silent on the matter relating to the pre-grant opposition, to allow
the individual countries for full powers to decide. Most EU countries, in fact, have got
these provisions in their legislations. As against this, in India, 4,700 applications are
already pending with the Mailbox. Once patents are granted to them, the MNCs will
not only monopolize the Rs.36,000 crore drug market (inclusive of exports of
Rs.15,000 crore) but will also squeeze down the Indian pharma in the legal battle. In
fact, the second amendment not only approved the pre grant opposition but also
strengthened it. The present Ordinance does away with this right and replaces it by a.
week' Representation by way of opposition' (7), the provision which is available only
after the patent is granted.
c) Compulsory Licensing; Yet another omission is related to the Compulsory Licensing
(CL) procedure. The I present procedure, being very lengthy and time consuming,
defeats the very purpose of the CL and ends up in abusive pricing and inadequate
supply by the monopoly patent holder. It is observed that about two-thirds of patented
products by MNCs were never produced. (8). They were patented just to from the field,
while the firms concerned continue to produce a similar product catering to the same
type of consumer need. Besides, the original August 30 resolution maintains that any
Economic Reforms and Social Policy
| 80
member country that grants patents is authorized to issue a CL to meet the
emergencies in the LDCs and also to export to such depriving countries. However, the
present ordinance provides that only the suffering required to issue the CL, if any.
d) False claims of MNCs Rewarded: The MNCs' argument that they invest billions of
dollars of money on R&D prior to the commercial production cannot stand for scrutiny.
Generally speaking, most basic scientific research is undertaken with public fund,
mainly by the universities and research institutions patronized by the Government.
With public subsidy, "once discovered, an invention can be disseminated virtually
without cost" and it can be shown that such common 'knowledge products are efficient
to finance publicly. MNCs use fruits of such basic research free of cost and monopolize
the patent rights only by adaptive research.(9) This logic is grossly ignored in the
present ordinance and therefore offers an unduly long period of patent duration in the
name of ploughing back the initial R&D outlay
One needs to understand that the US, EU and Japan put together capture as
high as 90 per cent share in the world drug market. The world's top 10 drug companies
spend only 8-19 per cent of their sales on R&D, while most Indian Drug firms still
averages a mere 2 per cent of their total turnover. the drug monopolies spend a ·
meager amount of less than 10 per cent of their total R&D expenditure on the diseases
of the poor. (10) At the same time the big firms' profit margins range between 20-30
per cent. Besides, the drug monopolists have already enjoyed lot of tax benefits and
foundation funds from the Government agencies.
Suggestions
Exporting rights to assist the least Developed countries with no technical ability to
utilize their compulsory licensing as provided for under the Doha Declaration are to be
exercised by India; India has to exercise its right of enforcing the CL at a reasonable
royalty of say 10 per cent of the cost of producing it in the host country. It has to enforce
the price controls also, say, after the first five years of an invention at least in the case
of life saving drugs and drugs of mass consumption.
India should make use of the positive aspects of even the TRIPS. According to Art. 7
& 8(2), priority shall be given to the public welfare goals over the intellectual property
rights. Hence the social policy with regard to the public health must offer top priority in
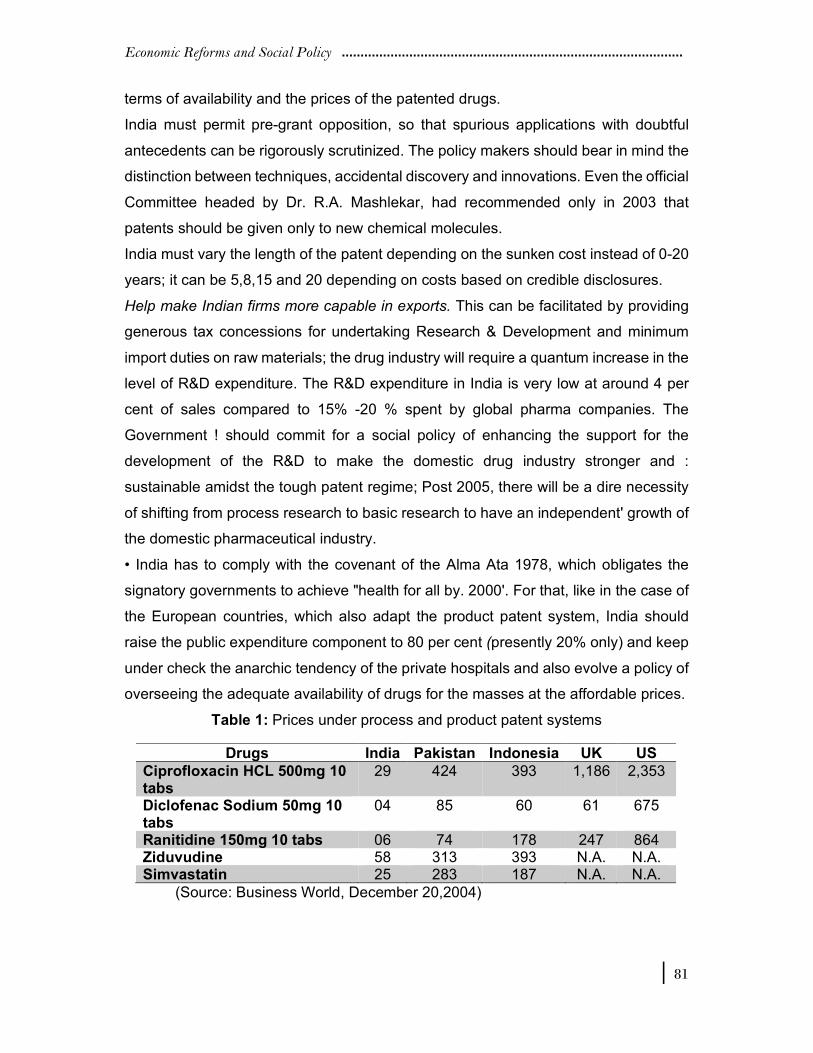
Economic Reforms and Social Policy
| 81
terms of availability and the prices of the patented drugs.
India must permit pre-grant opposition, so that spurious applications with doubtful
antecedents can be rigorously scrutinized. The policy makers should bear in mind the
distinction between techniques, accidental discovery and innovations. Even the official
Committee headed by Dr. R.A. Mashlekar, had recommended only in 2003 that
patents should be given only to new chemical molecules.
India must vary the length of the patent depending on the sunken cost instead of 0-20
years; it can be 5,8,15 and 20 depending on costs based on credible disclosures.
Help make Indian firms more capable in exports. This can be facilitated by providing
generous tax concessions for undertaking Research & Development and minimum
import duties on raw materials; the drug industry will require a quantum increase in the
level of R&D expenditure. The R&D expenditure in India is very low at around 4 per
cent of sales compared to 15% -20 % spent by global pharma companies. The
Government ! should commit for a social policy of enhancing the support for the
development of the R&D to make the domestic drug industry stronger and :
sustainable amidst the tough patent regime; Post 2005, there will be a dire necessity
of shifting from process research to basic research to have an independent' growth of
the domestic pharmaceutical industry.
• India has to comply with the covenant of the Alma Ata 1978, which obligates the
signatory governments to achieve "health for all by. 2000'. For that, like in the case of
the European countries, which also adapt the product patent system, India should
raise the public expenditure component to 80 per cent (presently 20% only) and keep
under check the anarchic tendency of the private hospitals and also evolve a policy of
overseeing the adequate availability of drugs for the masses at the affordable prices.
Table 1: Prices under process and product patent systems
(Source: Business World, December 20,2004)
Drugs India Pakistan Indonesia UK US
Ciprofloxacin HCL 500mg 10 tabs
29 424 393 1,186 2,353
Diclofenac Sodium 50mg 10 tabs
04 85 60 61 675
Ranitidine 150mg 10 tabs 06 74 178 247 864 Ziduvudine 58 313 393 N.A. N.A. Simvastatin 25 283 187 N.A. N.A.
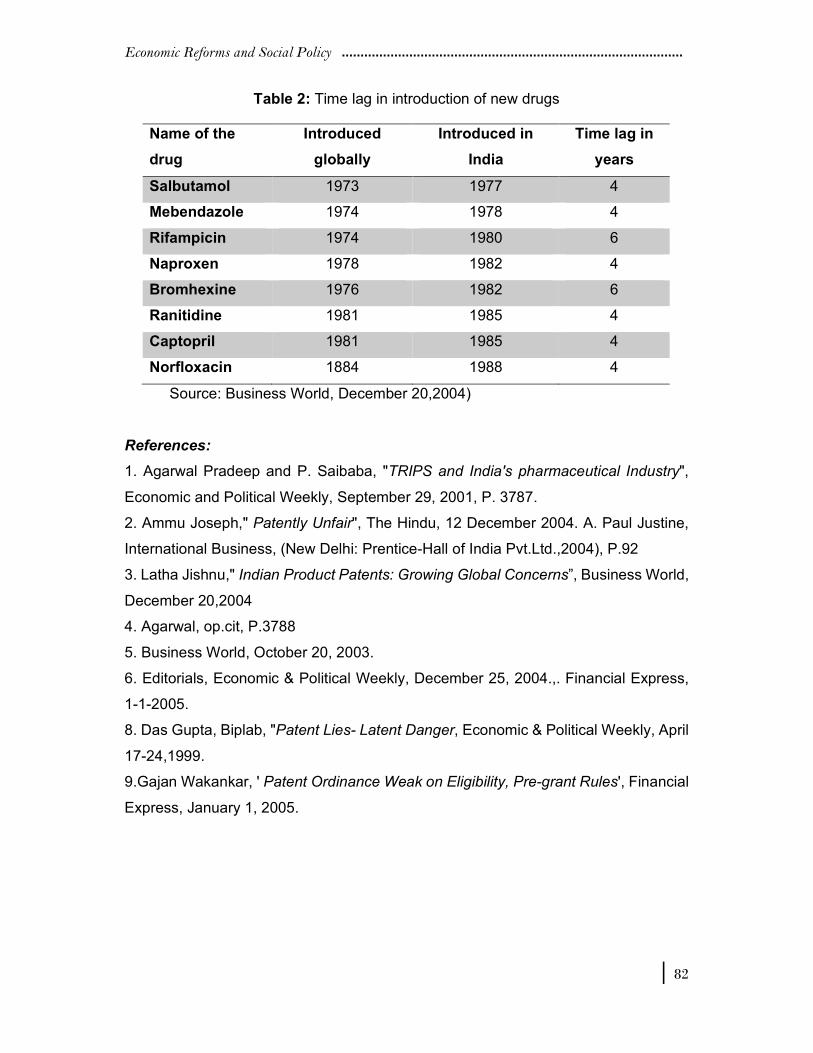
Economic Reforms and Social Policy
| 82
Table 2: Time lag in introduction of new drugs
Source: Business World, December 20,2004)
References:
1. Agarwal Pradeep and P. Saibaba, "TRIPS and India's pharmaceutical Industry",
Economic and Political Weekly, September 29, 2001, P. 3787.
2. Ammu Joseph," Patently Unfair", The Hindu, 12 December 2004. A. Paul Justine,
International Business, (New Delhi: Prentice-Hall of India Pvt.Ltd.,2004), P.92
3. Latha Jishnu," Indian Product Patents: Growing Global Concerns”, Business World,
December 20,2004
4. Agarwal, op.cit, P.3788
5. Business World, October 20, 2003.
6. Editorials, Economic & Political Weekly, December 25, 2004.,. Financial Express,
1-1-2005.
8. Das Gupta, Biplab, "Patent Lies- Latent Danger, Economic & Political Weekly, April
17-24,1999.
9.Gajan Wakankar, ' Patent Ordinance Weak on Eligibility, Pre-grant Rules', Financial
Express, January 1, 2005.
Name of the
drug
Introduced
globally
Introduced in
India
Time lag in
years
Salbutamol 1973 1977 4
Mebendazole 1974 1978 4
Rifampicin 1974 1980 6
Naproxen 1978 1982 4
Bromhexine 1976 1982 6
Ranitidine 1981 1985 4
Captopril 1981 1985 4
Norfloxacin 1884 1988 4
Economic Reforms and Social Policy
| 83
IMPACT OF PRIVATE SECTOR ON PUBLIC HOSPITALS
K. Vijaya Lakshmi
Lecturer, Department of Economics, K.T.R. Women's College, Gudivada.
The purpose of this paper is to examine the impact of private sector on public hospitals.
In the First section it deals with the concept of Health Care. The Second section deals
with the impact of private sector on public hospitals.
Health Care implies "Services provided to individuals or communities by a
health care system or by professionals to promote, maintain, monitor, or restore
health. Health care contains a broad spectrum of services and activities delivered by
a team of health personnel. Services provided to individuals or communities by agents
of the health services or professions to promote, maintain, monitor, or restore health.
Health care is not limited to, medical care, which implies therapeutic action by or under
the supervision of a physician. The term is sometimes extended to include self-care
includes all reasonable and necessary medical aid, medical examinations, medical
treatments, medical diagnoses, medical evaluations, and medical services. The term
does not include vocational rehabilitation. Healthcare means the preservation of
mental and physical health by preventing or treating illness through services offered
by the health profession.
The bulk of the private sector consists of individual practitioners, both trained
and untrained followed by nursing homes and hospitals which are owned by a single
owner or in partnership. Privatization has influenced the perception and practice of the
medical professional. With an increased reliance on high technology, there is a greater
emphasis on specialization and a devalued role assigned to general practice. Private
practitioners, nursing homes and hospitals are mainly located in urban areas. The real
spurt in the growth of private hospitals occurred mainly in the 1980s and the 1990s.
The growth of private diagnostic centres is an even more recent phenomenon. Most
of them were established only during 1990s.
The growth of private hospitals and diagnostic centres was encouraged directly
by the central and state governments by offering tax exemptions, land at concession
rates etc. in return for provision of free treatment for the poor, free treatment to at least
40% of our patients and 10% of inpatients. Apart from availing the tax concessions
some hospitals received special benefits like allotment of government land at an
Economic Reforms and Social Policy
| 84
insignificant part of market price. For instance, in 1989 à corporate hospital in
Hyderabad was given 30 acres of government land in a posh locality at a throw away
price on the condition of reserving additional 15% of beds for the poor.
Recently private sector's share is increasing when compared to public sector.
Rapid urbanization, expansion of middle class with higher purchasing power and
growing health awareness have together provided necessary conditions for the rise of
private sector in medical care. Urbanization accompanied by the increase in size of
middle classes, created. market for the medical care.
Impact of Private Sector on Public Hospitals
The state's patronage to the private sector is sometimes justified on the ground that it
would ease out pressure on the government hospitals. But the private hospitals are
replacing rather than complementing the public hospitals by weaning away the
resources from the govt hospitals. The adverse impact of Privatization on public
hospitals is identified on the following grounds.
1. Lack of patronage to public hospitals
2. Luring away specialists from public hospitals
3. Transfer of critical cases from private to public hospitals
4. Growing capital intensity etc.
1. Lack of patronage to public hospitals
a) With the large-scale expansion of private health care in 1980s and 1990s the rich
and middle classes no longer go to the govt hospitals.
b) The public hospitals are used mostly by the poor at present.
c) The public hospitals are facing unfair competition in mobilizing resources.
d) Apart from depravation of resources the day-day maintenance of public hospitals
is also neglected.
e) Whenever public services are used exclusively by the poor their quality is
degenerating due to lack of resources and effective supervision.
f) The growth of private cooperate hospitals was found to have adverse impact on
govt hospitals.
2. Luring away specialists from public hospitals:
There is severe competition between corporate hospitals to attract reputed specialists
by offering higher remuneration. This tendency has further adverse effect on the image
of govt hospitals. The govt sector has thus become a cheap source of well-trained
Economic Reforms and Social Policy
| 85
specialists.
3. Transfer of critical cases from private to public hospitals:
Public hospitals are used for dumping unwanted cases, to transfer serious cases and
AIDS patients etc.
4. Growing capital intensity:
With privatization and corporatization, the medical care became very capital intensive
and added to escalation of cost inflation.
Conclusion:
The private sector in medical care forms a very strong bureaucratic and political lobby
and would manipulate the state and further weaken the public health care system by
draining out the resources. Public policy towards the private sector should be confined
to the regulation of quality and pricing of medical care. The basic need is to increase
the allocations to the health sector in the state budget. Medical care has unique
economic characteristic, which deviate from the basic prerequisites market model of
economy.
As a system the private hospitals are highly prone to unethical and harmful practices.
Given the complexity of medical care, it may be more difficult for the state to regulate
private sector than providing the medical care directly.
References:
1. Dept of Health, Medical and Family welfare, Government of A.P (1998),Project
implementation Plan for the Primary Health Care Component of A.P Economic
Rehabilitation Project
2. Narayana K.V (1998), Public and Private mix in the Medical care in A.P.,
Centre for Economic and Social studies, Hyderabad.
3. Ministry of Health and family welfare, Govt of India 1981- Health Policy
statement, New Delhi.
4. Govt of Andhra .Pradesh (1999), Vision 2020, Page: 93
Economic Reforms and Social Policy
| 86
GATS, BUSINESS PROCESS OUTSOURCING AND IMPLICATIONS TO
INDIAN ECONOMY
Prof. K. Sri Ramamurthy
Dept. Of Economics, Andhra University, Visakhapatnam.
.
Introduction
The Uruguay round of GATT is considered as the landmark in the economic history of
the world. It has not only widened the scope of GATT but also led to the replacement
of GATT with World Trade Organization (WTO). This supra-national phenomenon of
globalization has far reaching Economic; Social, Political, Cultural, Environmental and
Technological consequences to the world at large. The General Agreement on trade
in services (GATS) is legally enforceable multi-lateral agreement under WTO with an
objective of a) progressively liberalizing trade in services and b) providing secure,
transparent, nondiscriminatory, free, fair, and open market in services similar to that
of trade in goods and merchandise. Further, the service sector has experienced a
phenomenal growth in recent years in developed and. developing countries. The
general agreement on trade in services (GATS) was introduced in 1995 under WTO
regime to promote further globalization of the services trade. According to GATS, there
are four possible modes of supply viz.,
Mode 1: Cross-border supply i.e., supply of a service from one country to another
country.
Mode 2: Consumption abroad i.e., supply of a service in one country to the service
consumer of any other member country.
Mode 3: Commercial presence i.e., supply of services by a service supplier of one
country through commercial presence in another country.
Mode 4: Movement of natural persons i.e., temporary cross-border movement of
service providers.
However, it is pertinent to observe that developed countries are showing
interest in the first three modes of service as they have competitive edge. Despite
liberalization of markets in developing countries such as India, the developed countries
have not liberalized Mode 4 services because of the fear that it may adversely affect
their domestic employment.
However, with the advent of faster communication through satellites the whole
Economic Reforms and Social Policy
| 87
world is shrinking into a global village. This prompted the multi-national corporations
(MNCs) to opt for outsourcing to enhance their profitability without compromising on
quality. Thus, outsourcing has emerged as a major trade in the world today. Many
corporate giants in the US, Europe, Australia, and Japan have opened International
procurement organization (IPOs) in developing countries like India, China, Mexico,
and Brazil.
The Debate:
A heated and unending debate is going on in many developed countries like the US
on the issue of outsourcing. according to the antagonists outsourcing as global white-
collar migration which is resulting in job losses in several areas. It is estimated that in
US alone more than 2.2 million people lost their jobs in the last four years. It is further
estimated that another 3.3 million would lose their jobs by 2015 which, of course is a
small fraction of the employment level of 132 million.
On the other hand, the protagonists argue that outsourcing would help the
developed economics in the long run. Greggory Mankiw, Chairman of the presidential
council of economic advisers, remarked that outstanding is probably plus for the
economy in the long-un. Joining the debate Mr. Alan Green Span, the federal reserve
chairman, argued that protectionist cures might worsen the situation for US economy.
He hopes that US would manage foreign competition with jobs in advanced industries
as it has done in the past.
The Political Economy of Outsourcing:
Global sourcing or outsourcing is as old as the East India Company. Further it is held
that the rise of the multinational corporation (MNCs) would not have been possible
without outsourcing. During the post-world war period, several manufacturing firms
producing light engineering goods, were relocated from developed countries to
developing countries which are low wage destinations. Companies such as Nike,
Adidas, Reebok, are known for this style of operations.
However, with revolutionary changes in electronics, telecommunications and
information technology on the one hand and ever increasing wage structure in ·
developed countries on the other influenced the process of relocation of production
units and service centers in developing countries like India , china , Malaysia and
brazil. Most of the corporate giants of the developed countries have been segmenting
their production chains and shifting their labor-intensive parts to low-wage location.
Economic Reforms and Social Policy
| 88
Business Process Outsourcing - The Process:
The process of business process outsourcing (BPO) refers to the digitization of labor
or service and access it from abroad through wires. In other words, it is the process of
producing a service without relocating the entire unit. Initially, these services were
restricted to back office functions such as call centers, helpdesks and customer
support etc., today outsourcing covers a wide range of activities including 11 enabled
services such as engineering design, architecture, radiology, pharmaceuticals, and
soon. Further, several organizations around the world are striving to improve the
quality of their bottom lines. This makes BPO as the new imperative which positioned
services as tradable items in the world market.
India- Major Destination for BPO:
Through many developing countries are visiting with each other in this new business,
India has emerged as a superpower when it comes to IT solutions. Several fortune -
500 companies like Microsoft, oracle, Citibank, AT&T, General Electric, Reebok, IBM,
General Motors, Sony, Boeing, Swiss air, Phillips, Lucas, British Aerospace' have their
outsourcing business in India. Today, India's contributing to the IT industry is worth
$16 billion accounting for 3.2 percent of GDP. It is projected that the exports in the
next five years are like to touch $50 billion.
Next to the IT industry, Indian pharmaceutical industry is all set to take a big
leap is tapping BPO. Several drug majors including Ranbaxy, Dr Reddy Labs, Cipla,
Glaxo and Zydus have already begun tapping the outsourcing market which is
estimated at $10 billion annually in generic drugs. According to Pankaj Patel,
Chairman and Managing Director of Zydus cedilla, India had definite advantages in
manufacturing generic formulation. These include good customer service, lower costs
and regulatory know how" he also pointed out that India is in a position to capture 30
percent of the pharma BPO market closely competed by China, Brazil and Mexico.
Further, the developed countries like US are finding it profitable to use the Indian IT
companies as the retirement plan provides and third-party administrators (TPAs). For
example, a single. company called congruent solutions Pvt. Limited clinched an
outsourcing deal with California based third party administrator which has an asset
base of $20 million, handling 450 plans for 70 odd clients. It operates on verticals such
as financial accounting, insurance, retail, and e-learning.
Thus BPO firms in India are engaged in providing full spectrum of BPO services
Economic Reforms and Social Policy
| 89
covering all five levels viz., 1) data entry : 2) rules-set processing 3) decision making
4) direct customer interface and 5) expert knowledge services,
Advantage India:
India along with China is billed as the most important source of skilled manpower with
slight edge over its big brother in terms of knowledge of software and English.
According to the future world of work study the workface in Asia growing in numbers
and skills and shrinking in region such as Europe and japan. Multinational companies
can ill-afford to ignore this. This has been emphasized by Mr. Herbertson, Managing
Director of manpower. Inc. of US, who pointed out that half of the worlds labor force
will be in India and china within a decade.
Indian advantage as a potential power in BPO may be attributed to
1) Availability of highly qualified and technically skilled English-speaking computer
professionals.
2) Low personal costs and wage costs compared to the developed countries.
3) Standard quality of IT firms
4) Reliable communication facilities
5) Fast growth of the economy
6) Location of technologically advanced outsourcing firms
7) Stable government policies
8) Reliable infrastructure facilities
9) Well-structured tax system.
In view of these advantages, India can provide an integrated and highly flexible mix of
on-site, off-site, near-shore and off-shore delivery option. India already carved a niche
in terins of world class project management with reduced outsourcing risk, consistent
and quality outsourcing delivery system.
A Cause for Concern:
Though outsourcing is helpful in generating employment and income to a growing
economy like ours, there are certain areas of concern to us. They include.
1) with BPO workers defying tome zones to interact with clients worldwide, a pander
as box of psychological issues and ailments is opening. Stiff targets and career
competition are often affecting the health of the young professionals who strive to work
more and more. In view of the low personal costs and low literacy rates, the
pharmaceuticals majors are conducting clinical trials of genetically engineered drugs
Economic Reforms and Social Policy
| 90
on human beings without proper safeguards of genetic engineering approval.
committee (GEAC). This is causing severe damage to health and life of the poor and
destitute population. In the euphoria of BPO, the state and the public are neglecting
the importance of basic sciences. As a result of the conventional universities, colleges
and other educational institution are being neglected. This may have serious
consequences in the long run.
Conclusion:
Given the opportunities and concerns, it may be still argued that outsourcing is a.
bonanza for developing countries like India. As such the government and the corporate
bodies must evolve plans to successfully transform India as a global service
outsourcing hub.
References:
1) Sudip Chaudhuri (2003): ‘Trade in Services: Policy Issues”, “Economic and Political
Weekly”, Aug23,2003.
2) Goyal, P.K. (2004): 'Outsourcing: Win-Win for All Business Line’, November
16,2004
3) Subramanyam, K (2004).: 'The Economic Fallout of Outsourcing', Business Line,
Nov.24,2004.
4) Indrani Dutta (2004): 'Pharma Sector Begins Tapping BPO Segment' THE HINDU,
Dec.5, 2004.
5) AIU (2005): GATS and Its Implications on Higher Education.
Economic Reforms and Social Policy
| 91
GATS AND HIGHER EDUCATION IN INDIA
B. Shiva Reddy
Professor, Department of Economics, Osmania University.
K. Anji Reddy
Reader, Department of Economics, Osmania University.
Introduction:
In this paper, a modest attempt has been made to examine the implications of WTO
for higher education sector in India. It is based on secondary sources of information
and on the available data. Some of the studies related to the theme are used to
examine the issues rather than making any special attempt to analyze them.
The last decade is known for several important developments all over the world. There
has been a perceptible change in the values and goals. New goals, policies and
practices replaced traditional and well-established values, concepts, and approaches.
Market driven policies have been replacing social democratic and welfare-oriented
policies. The world is moving towards globalization making existing arrangements
economic, cultural, and legal - obsolete and irrelevant. The most important
development in the 1990s is the emergence of WTO, that has significantly affecting
almost all sectors, sections, and regions of the world. India is not an exception to this.
Internationally education is a trillion- dollar industry. The global market for international
higher education was estimated at 27 billion dollars in 1995.
Education Services under GATS:
GATS rules apply to education services in four ways: Each member country, including
India, has to give Most Favored Nation (MFN) status to all member countries; Each
member country, including India, has to make a request offer or a particular service to
be a part of the agreement .Each member country, including India, must eliminate any
restraint on competition when requested by another member country .Each member
country, including India, must ensure that all measures are administered in reasonable
and impartial manner.
Five levels of education have been identified for trade. They are: Primary
Education, secondary Education, Higher Education, Adult Education and Other
Education. Though identified the first two are still restricted to domestic providers. The
last three have received more attention as tradable services. Even among them higher
Economic Reforms and Social Policy
| 92
education has become focus of attention because it in this sector that trade is already
in existence and likely to expand under WTO regime. WTO has identified four modes
of trade in education which are having different implications.
Mode-1: Cross Border Supply: This mode of trade does not require the students
to move physically, Cross border supply of service includes any type of course that is
provided through distance education, web based program, any testing service and
educational material which can cross national boundaries. Emergence of new
technologies and IT revolution has expanded the scope of distance education through
cross border supply. India's presence in this mode is limited though efforts are being
made to increase the scope of it. When compared to other modes, Mode-1 is generally
non-controversial in nature. However, even under this mode there are certain barriers,
particularly related to the use of national satellites or receiving dishes and certain types
of educational materials.
Mode-2: Consumption Abroad: This mode involves the education of foreign
students. Students have to move to the country of supplier for pursuing all or part of
their education in another country. Of the four modes of trade in education services,
Consumption Abroad (Mode-II) has existed for centuries. Quite a few Indian students
have been going abroad for higher education which has been tagged along with brain
drain. Available Statistics suggest that most of the Indians are going to developed
counties for studies. And very few from these countries are coming for studies in India.
During 1994-95 and 1996-96 the number of foreign students enrolled in Indian
universities has declined. However, there is some increase in foreign students in
recent years. Most of those coming for studies in India are from developing countries.
At present this is the major mode of trade in higher education services and on this
front India is losing considerable amount. The number of Indian students studying in
USA alone increased more than two-fold in the last decade. As proportion of foreign
students, Indians increased from about 8% to 13% during the same period indicating
the dependence of American Higher Education system. There is excess supply in
counties like USA and excess demand for higher education in countries like India.
Therefore, excess demand in India is satisfied by the excess supply available in USA.
The net direct gainer in the process is USA as many institutions/ courses there
are supported by fees contributions from foreign students. For USA education and
Economic Reforms and Social Policy
| 93
training services generated 7.5 billion dollars in export. Higher education accounted
for the fifth largest service sector of exports by the USA. In another way also India is
losing in the form of brain drain. Most of those go for higher studies settle there and
make significant contribution for the development of the USA economy and in return
India gets hardly anything. Needless to say, most of those going abroad for higher
studies have been the beneficiaries of subsidized education in India.
Two types of organizations are functioning in India to deal with the consumption
abroad. They are:((i) Centers set up by Embassies to provide information on various
aspects of higher education abroad such as United states Education Foundation in
India (USEFI), Canadian Education Centre (CEC). They provide information and
counseling services to Indian students interested in pursuing higher education in their
countries. (ii) Private Agencies: Private Agencies are commercial organizations whose
main business is to advertise courses offered by their collaborative foreign institutions
and render paid services to interested Indian students for securing admission and
sending them to these institutions. Many Indian students are approaching these
agencies, existing in almost all major cities; provide necessary help in getting
admission for a payment.
The way foreign universities are marketing their higher education in India
through information centers and by tying up with private organizations to maintain their
commercial presence, they have generated a demand for themselves in India in the
field of higher education. Limited number of seats in colleges and universities in
professional as well as non-professional courses in India and increasing willingness
of parents to send their children abroad for higher studies irrespective of the heavy
costs, have further increased the demand for foreign universities in India.
Mode-3: Commercial Presence: This mode involves the service provider
establishing.an educational facility in another country to provide the service. In other
words, the actual presence of the foreign investors in the host country, such as foreign
universities setting up of institutions and courses in other country, are covered under
this mode. This mode also includes offshore campuses, joint ventures, and
subsidiaries.
With the GATS coming into effect shortly, Mode-3 may become the important
mode of trade in higher education and again India is likely to be net loser than gainer.
As a part of this foreign providers of education establish their own branch in one form
Economic Reforms and Social Policy
| 94
or the other and supply the education services. Mode-2 may gradually be replaced by
Mode-III as it is cheaper for students to study within their country of origin than going
abroad for the same purpose. In India presence of foreign providers of education has
already felt 1990s saw the entering of Foreign Providers in the higher education
market under Mode-III. The number of providers increased sharply in the last few
years. The main providers are from the developed world and that too selected
counties-UK, USA, Canada, and Australia. Indian higher education market is likely to
be dominated by providers from these countries once the GATS come into existence
in the next few months.
Mode-4: Presence of Natural Persons: This mode refers to the ability and the
freedom for the people to move between countries to provide education service
through temporary stay.
As far as the mode-4 is concerned India is already has a presence. Brain drain from
India inherently implied movement for employment in jobs abroad for a short period.
However, the scope under GATS is restricted to movement to and presence in foreign
Implications for India: Increased trade in educational services has both advantages
and risks. Except in Information Technology India has not realized its potential despite
having a vast pool of highly skilled and mobile human resources.
According to Kaushik, India is in a strong position to benefit from both export
and import of higher education. India is in an advantageous position both politically
and economically by exporting education, particularly to developing countries that
have substantial Indian diaspora. This is the appropriate time to change and attract
the students. “Any loss of time would cause irreversible damage in terms of loss of
market, credibility, resources and opportunity to transform to meet the new challenges.
Import of education also helps India as local provision of education may benefit from
international collaboration with quality institution and competition with them.
However, according to Altbatch, multinational higher education always has elements
of inequality. When the reputed providers enter the country with high quality programs
the access to these services are open only privileged few with economic means to pay
for them. The inequality in education leads to inequality in economic opportunities as
most of the courses offered by these institutions guarantees entry to given profession.
Therefore, the very purpose of education to create a democratic and more equitable
society is put to acid test.
Economic Reforms and Social Policy
| 95
Further, they (foreign suppliers) provide ‘off-the-shelf “programs, which are
simply used overseas. The decision about curriculum, standard, faculty and
requirement are always made by the sponsoring institution. The motive for establishing
institutions by them is always to make money. British and Australian institutions have
been active internationally, including in India, as a way of making up for budget cuts
at home.
India is not in a comfortable position as far as internationalization of higher
education is concerned. India has to take crucial decisions related to
internationalization of higher education. First, important step in this direction is to lay
down a viable regulatory mechanism to control the inflow of foreign institutions, vying
with one another to open their campuses in India or enter into some kind of
arrangement with their ever too willing Indian counterparts.
Conclusion:
Available statistics suggest that India continues to be net importer of higher education
despite having huge human resources. Indian higher education system developed
more on democratic, equity-s oriented lines and hence not paid much attention to the
efficiency and quality concerns. Now the new situation demands that every action
should be based on these concerns. Therefore, it is time to re-look into the relevance
of earlier concerns in the new situation which demands more market orientation in
every sphere of activity including in education. It is not an easy task to completely
reorient the system that has been built over the last half century and which has become
immune to adjust to the changing global scenario.
Economic Reforms and Social Policy
| 96
ACCESS TO EDUCATION-SOME ISSUES
V. Sujatha
Lecturer in Economics
K. B. Sujatha
Lecturer in English
K. T. Reddy Women's College, Gudivada
The purpose of this paper is to study the trends in literacy rates and rural – urban,
gender and regional disparities enrolment and dropout ratios and access to education.
The paper is divided in to three parts. The first part states the problem. The second
part deals. with the trends in literacy rates and disparities in access to education. The
policy implications are discussed in the third part.
Introduction:
Education is one of the most important social indicators that is directly linked with
economic development. Level of literacy or education is directly associated with gross
product, indirectly with poverty, population growth, health, and crime rate. Despite its
importance education continues to be a neglected area at the policy level. After 50
years of planning, enormous funding and promises, total literacy remains to be a
distant dream. The dead- line for achieving total literacy is postponed year after year.
Apart from overall low: levels of literacy at the national level, disparities across regions,
genders, social groups etc. are of serious concern. Education is recognized as a basic
input for empowerment to the individual and to the I development of the society.
Expenditure on education and its sectoral allocation in general appears to be the main
factor influencing literacy levels.
Trends in Literacy Rates:
Literacy rate in A.P. has been much below the all- India level during the last four
decades. The gap between the two narrowed down during the last decade (2001). The
gap is more in the case of male literacy than that of female literacy. The estimates of
literacy rates from different sources especially National council for Applied economic
Research (NCAER) during the 1990's have also shown some improvement in the
states performance. Female literacy has recorded a significant improvement in the
state when compared to the all- India level. This could be attributed to the literacy
campaign focused on women (Akshara. Sankranthi) in the state during 2000.The
Economic Reforms and Social Policy
| 97
literacy rates of S.T. and SC population at all India level are relatively high indicating
a social gap in rural A.P. The female literacy rates of these groups are still only around
10 per cent. In rural A.P. there are 731 households for every 1000 households without
a female literate and 465 households without any literate in the family. As a result, the
effective literacy rate will be much below that of all India level.
Rural and Urban Disparities:
Three fourths of the urban and more than half of the rural people had attained literacy
by the year 2001 in A.P. The increase in literacy rate both urban and rural is higher in
1991-2001 compared to earlier decades in all regions except coastal Andhra. Inter
district variation are steadily increasing over the period both in rural and urban areas.
Interestingly by 1991 all regions attained equal status in urban Literacy rates but by
2001, Rayalaseema has fallen behind marginally.
Gender and Social Disparities:
Telangana region has been lagging in terms of both male and female literacy rates for
the last four decades. Over the period, inter- district variations in female literacy - have
declined faster than that of male literacy rates. The decline was prominent during;
1990s, which may be due to the realization of the importance of female literacy. The
gender disparity in the state has been shrinking steadily, from 55 per cent to 28 percent
though the gap is still substantial. Among the regions, disparities have declined faster
in Rayalaseema and Telangana when compared to coastal Andhra and hence the
narrowing of the inter- regional variations. Similarly, social disparities are also
shrinking across the regions.
To sum up the performance of A.P. in primary education does not reflect its
position in economic development. As per the 2001 census it occupies the 28th
position among the 35 states and union territories in the country. Its growth in literacy
rate was slightly better than Bihar, U.P. and Rajasthan but lower than M.P. and
Arunachal Pradesh among the low literacy rate states. It compares poorly with all India
Averages in all respects except in the case of ST literacy rates.
Access to Education:
The poor performance in attaining higher literacy rates could be viewed from the
supply as well as demand sides. The supply side aspects include availability of schools
in vicinity, Infrastructure, quality of education etc. On the demand side the problems
are high opportunity costs, high costs of education, low returns from education · etc.
Economic Reforms and Social Policy
| 98
Since primary education has been made a fundamental right the stress is often on the
supply side factors, though demand factors also play an important role. Moreover, the
demand side factors are directly linked with economic development, provided a
threshold level of development has been achieved with reasonable equity across
regions and socio- economic groups.
Physical access to schools is an important dimension in terms of both supply
and demand factors. Access is often defined as availability of school to all school going
children within a radius of 1 km. of late, location of the school is also considered
important in defining access. For it is observed that children from lower social strata
are not comfortable going to schools located in the areas where upper social strata
people live and vice versa.
At all India level every two out of three villages have less than 500 population
and a quarter of the rural population lives in these small villages (1991). only a sixth
of the total villages were in the category of above 2000 population housing less than
50 percent of the people. Therefore, majority of the people live in villages with
unfavorable conditions for supply of basic amenities including education. In this regard
A.P. is placed in a favorable position. Only 10.5 per cent of the population lives in
villages with less than 1,000 population (census 1981 and 1991. NCERT1997.).
Compared to all India situation, a large proportion of the state's rural population
has the advantage of easy access. (supply side). Though the distribution of habitations
by their size explains the social disparities, it does not really explain the overall
performance of the state in literacy rates.
All India educational surveys have attempted to examine the problem of
remoteness in terms of access to primary and upper primary schools. In A.P. the
percentage of habitations having a primary school has increased. This is clearly
reflected in the coverage of scheduled tribe population by primary schools. Only 82
percent of the tribal population is being covered by primary schools within 3 km of the
habitations against above 97 percent in the case of scheduled castes and all
categories of population. The situation is similar even in the case of upper primary
schools. The sixth All India Educational Survey estimated that about 93 per cent of
population in 70 per cent of habitations was covered by primary schools. The
proportion of population having access to a school within walking distance is 98 per
cent in 89 per cent of the habitations.
Economic Reforms and Social Policy
| 99
Enrollment vis-à-vis Dropouts: Enrolment is a necessary condition for obtaining
literacy in a formal system but not sufficient to attain literacy. Higher enrolment leads
to higher literacy rates provided dropouts do not increase at the same rate. As per the
estimates of the education department enrolment ratio in the state was as high as 90
percent in 2000 compared to 73 per cent in 1991-1992.
Coastal Andhra region seems to have reached saturation in enrolment ratios
and Rayalaseema has the highest enrolment ratios in both the periods, while
Telangana moved from third position to second position. Interestingly, drop- out ratios
are also high in the state, which may be due to fictitious enrolment. There are wide
variations in drop out ratios across districts. Telangana recorded the highest dropout
ratios followed by coastal Andhra and Rayalaseema regions. Rayalaseema with
highest enrolment ratio recorded the lowest: drop out ratio. Similarly, girls have
recorded higher drop out ratios 100. One of the recent field studies in the three regions
of Andhra Pradesh indicates the high enrolment ratios through the variations across
the regions are not the same. On the contrary drop out ratios are quite low (between
10 and 15 percent) in all the three regions.
While the differences across regions are marginal in the case of enrolment, they
are substantial in the case of dropouts. This is true even in the care of developed and
backward regions within the regions. Backward regions record the highest dropout
ratios. This indicates that the problem is of retention rather than enrolment.
Policy initiatives and implications
The performance of A.P. in attaining literacy has been dismal. It compares
poorly with all India averages in almost all indicators such as rural-urban disparities,
gender disparities etc. The vision 2020 document rightly identifies the problem calling
the education system in the state. The document identified low literacy levels of
parents, poverty, lack of access to school and poor infrastructure facilities as the main
causes of low literacy rates.
The three important programmes initiated in tune with the new education policy
1986 or Operation Black board (OBB), A.P. Primary Education Project (APPEP) and
District t Primary Education (DEEP). The OBB. Program supported by the Government
of India, focuses on supportive infrastructure such as construction of School Buildings
providing teaching aids, playgrounds, and creation of additional teacher posts. The
APPE Project was assisted by the overseas Development authority (ODA) with the
Economic Reforms and Social Policy
| 100
objective of improving the quality of schooling, construction of additional classrooms
and teacher training centers. This program was merged with the DPEP after 1995.
This program has many incentive schemes such as midday meal /supply of dry rations
to enhance enrolment, regular attendance of the students and to reduce drop out and
to maintain nutritional status of the students.
Suggestions to improve access to education:
1. The schemes designed to solve these problems such as residential schools, Angan
vadi centers, pre-primary schools, supply of dry, ration, textbooks, uniform etc. are
more supply side in nature.
2. The State Government has also adopted the bridge school concept of MV
foundation in the name of Back to School programmes.
3. From the demand side, generation of productive employment and minimum wages
go a long way in reducing the households, dependence on children. In other words,
rural economy has to be liberated from the vicious circle of agricultural involution, that
is, low employment, low wages and high participation rates.
4. Specific policies are required to address the problems of the disadvantaged groups
such as gender and social disparities. Employment of more female teachers appears
to be an effective instrument in improving the female literacy and enrolment.
5. Socio cultural aspects ought to be taken into account while planning more schools
for SC and ST populations. Even designing of the curriculum for these groups needs
special attention.
References:
1. PROBE (1999), Public Report on Basic Education in INDIA, Oxford University
Press, New Delhi.
2. Enrolment ratios in Primary Schools (5 to 9 age group) - Department of Education,
Government of A.P.E.P.W, March 22nd – 29th 2003.
3. a) Expansion of Primary and Upper Primary Schools - All India Education survey
1997 (N.C.E.R.T.) E.P.W March 22nd – 29th 2003. b) Availability of Primary Schools
by Social Groups (1993) All India Education survey 1997 (N.C.E.R.T.) E.P.W March
22nd - 29th 2003.
C) Access to Primary School by Regions and Social Groups.
4. Tilak, J.B.G. (1999), Exploding some Economic Myths of Elementary study, The
Hindu Oct 5th. s
Economic Reforms and Social Policy
| 101
INDIA'S GLOBAL POSITION ON HUMAN DEVELOPMENT
Prof. M. Sundara Rao
Department of Economics, Andhra University.
Introduction
Social development is a process of transformation in values, institutions and practices,
brought about the deliberate use of instruments of policy and planning with the active
involvement of concerned people for the purpose of raising their levels of living and
quality of life. Social sector refers to those activities, which contribute to human capital
formation and human development. Education, health and medical care, housing and
sanitation, drinking water, etc., are the main factors, which contribute to the process
of development of the human capital. As far as the importance of the social sector in
the economic development is concerned, it does not need nay emphasis. In fact, both
are complimentary to each other. The issue of development of the social sector has
acquired increased importance in recent times. It is being increasingly recognized that
economic development, should be adequately matched by development of social
sector if the process of development is to lead to increase in welfare of the concern
man.
In the context of Indian planning, the development of social sector has always
been an area of prime concern for planners and academicians and has therefore
figured at the core of Five- Year Plans since its inception. After attaining political
independence, efforts to develop social sector were also taken up and given equal
weightage just like the economic sector. The impact of planned efforts became more
conspicuous on economic sectors where the nation emerged as a leader in many
areas by achieving path-breaking success. However, on the social sector front, the
progress achieved was relatively slow and its impact is a mixed one. The introduction
of different welfare schemes and empowerment programmes in different Five-Year
Plans stands testimony to the government's commitment to ensure the basic
requirements of the society.
However, the benefits of the programmes reach different segments of the
population at different rates, thorough different means and channels. Social sector
planning in each plan has tried to ensure that appropriate policy and programmes
initiatives should be taken and adequate investment should be provided by the state
Economic Reforms and Social Policy
| 102
in the social sector so that the poorer and vulnerable segments of the population can
have access to essential commodities, facilities and services. By introducing the public
distribution system (PDS) from the very beginning of the Five-Year Plans, the
government has introduced many programmes, e.g. family welfare planning
programme, Literacy programme, Command Area Development Programme, the
Integrated Rural Development Programme, Basic Minimum Services, etc. in the
subsequent five year plans, it has shown its concern towards socially deprived sectors.
However, with the passage of time, it became clear that the impact of these
programmes has not been uniformly distributed and the benefits of the development
have been concerned by a small section of population and people at large have ·been
sidelined, isolated and gradually marginalized.
Against this background an attempt is made in the present study to examine
the impact of recent new economic reform on resource allocation to social sector
(section 1) and India's global position on human development (section 2). Conclusions
are presented at the end (section 3).
1. Impact of Economic Reforms on Allocation of Resources to the Social
Sector: The impact of development strategy of the last two decades on social sector-
a sector of high priority-as measured in indicators such as poverty, demographics,
education and health indicate significant improvements. Yet there is a need to
accelerate improvements in the quality. of life and human well-being through
enhanced availability of public services, and. development of economic and social
opportunities.
Indian planning, since its inception, in early fifties till the late eighties could to be
working on centralized pattern, wherein, the government played a pivotal role in all
major sectors and all the decisions regarding the plan and programmes, its
implementation, etc. were pre conceived at the central or top levels and the entire
planning process-was--quite-rigid. However, by the early nineties, the government
initiated economic reforms package, the role of the state was also redefined. The
major thrust was on dismantling the control over the economy and pulling the
government out of business to enable it to devote its resources to social sector.
In 1991, India witnessed significant changes in its economic policy when we
adopted the economic reform measures in the wake of acute balance of payments
crisis and mounting fiscal deficit. There are many apprehensions that new economic
Economic Reforms and Social Policy
| 103
reforms have not succeeded so for in achieving the objectives laid down in the 1991
Industrial Policy Statement. Notwithstanding the significant achievements of the Indian
Economy during the past 50 years, admittedly, the performance had fallen short of
expectations. Some economists have argued that in the short run, the adjustment
process would affect the poor adversely because the costs would be felt quickly,
whereas the benefits would take time to materialize. Therefore, it is the responsibility
of the Government to take care of the poor as far as possible by maintaining the social
sector expenditure during the adjustment period. This is important even for the
success of economic reforms. The Indian constitution in the various articles gives a
prominent place to the development of the human factor.
The major thrust was on dismantling the control over the economy and pulling
the government out of business to enable it to devote its resources to social sector.
The main planks of economic reforms were liberalization, privatization, and
globalization (LPG). All this is undertaken with a view to loosen the hold of the
government on the economy, on one hand, and to provide a check on the deficit in the
Plan outlays. The subsequent cuts in plan expenditure, in all directions, affected the
outlay of all major sectors. However, the initial brunt of the expenditure reduction was
borne by subsidies and the social sectors. Also, recent economic policy contains an
important fiscal component, i.e. bringing down the size of the fiscal deficit. Normally,
the economic sectors or the commodity sector gets the priority over the social sector
spending. Whenever any cut is contemplated to reduce the fiscal deficit, it is always
the social sector, which has to bear the brunt of deficit reduction.
Trends witnessed in the total plan and non-plan expenditure on the social
sectors by both Centre and States given in the Table 1 indicate that there had been a
continuous decline in. the share of Social Sector in total expenditure since 2000-01.
However, available evidence so far, reveals that slowing down in the plan expenditure
has also adversely affected the state plans and outlay for vital sectors like agriculture,
irrigation and social sectors where the outlay for them has considerably reduced
Further, it has also become abundantly clear that unless crucial issues like poverty
alleviation and social objectives are placed on high national. agenda by mobilizing the
requisite resources and mustering necessary will for social engineering, it would be
difficult to prevent market forces, unleashed under the existing package of economic
reforms from further marginalizing the weaker sections.
Economic Reforms and Social Policy
| 104
Likewise, the less developed states, which deserve additional capital
investment, have also been severely hit hard because of resource crunch. It has also
been feared that the downsizing of fiscal deficits would not affect the economic or, so
much, because they are treated as non-negotiable sectors hence government
expenditure for these sectors could not be reduced, significantly. It would only be the
social sector, which would have to bear the brunt of deficit reduction, and the adverse
impact of economic reforms on social sector, in the ling-term, would have long-term
damaging effect on the economy in the form of slowing: down of human capital
formation.
2. India's Global position on Human Development:
The need for rapid improvement in the social sector is manifest from India's rank of
127 among 175 countries in terms of the UNDP Human Development Index (HDI) with
an HDI of 0.590 for the year 2001 (Table- 2). The ranking however is down from 124
among 173 countries. in 2000 partly because of a change in the composition of
countries in the calculation for 2000 and 2001. the HDI measures the overall
achievements in a country in three basic dimensions of human development-longevity
and health, education and knowledge and a decent standard of living. The HDI and
the Gender Development Index (GDI) have improved in the last decade, but these
continue to be low compared to even some countries in the region.:
In socio-demographic parameters, despite considerable progress over the last
two decades the country continues to lag sever-al other countries in the region (Table
3). To correct this deficiency the Tenth Plan envisages a reduction in Infant Mortality
Rate (IMR) to 45 per 1,000 by 2007 and 28 per 1,000 by 2012, reduction in Maternal
Mortality Rate (MMR) to 2 per 1,000 live births by 2007 and 1 per 1,000 live births by
2012.and reduction in decadal growth rate of the population between 2001-2011 to
16.2 per cent. As against the allocation of Rs.15,120 crore for the Ninth Five Year
Plan, the allocation for the Department of Family Welfare is Rs.27,125 crore for the
Tenth Plan for the Annual Plan 2003-2004, the allocation increased to Rs.4,930 crore
from Rs.4,150 crore in 2002-03 (RE). The development experience of various
countries of the world reveals that the nations with rich human resources, consisting
of healthy and educated people, with a sense of discipline, dedication and work culture
could ultimately gear the economic system in the desired channels of: growth. Thus,
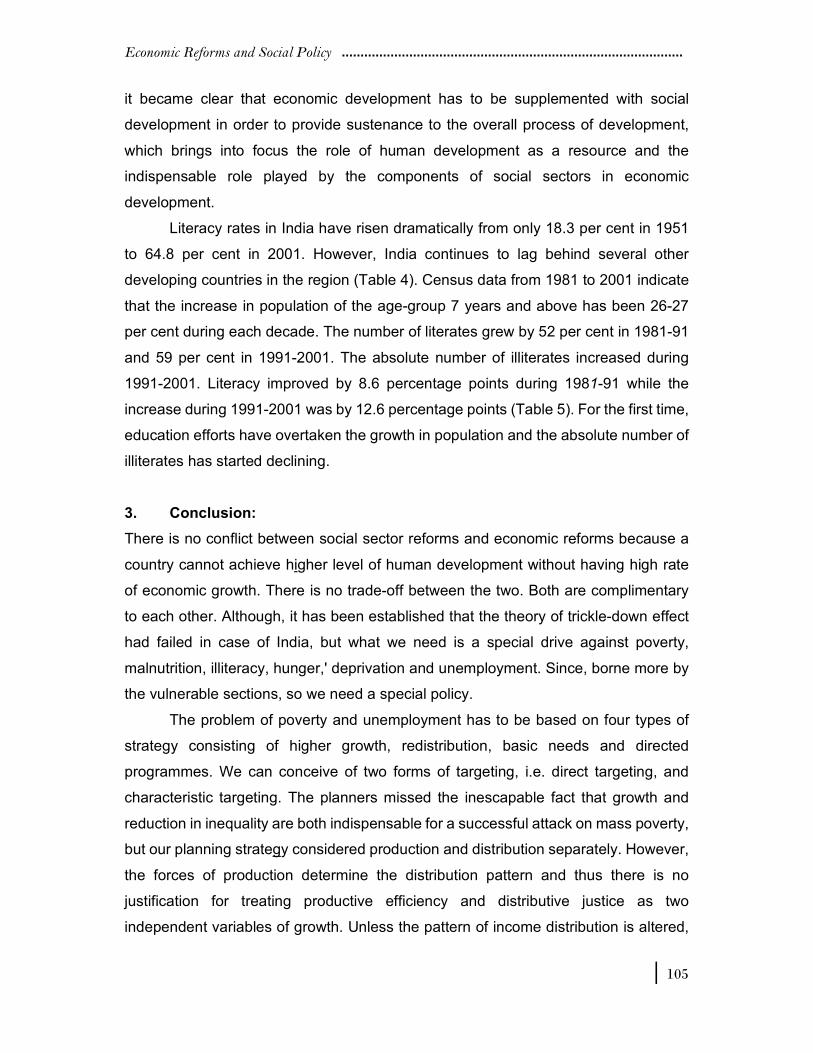
Economic Reforms and Social Policy
| 105
it became clear that economic development has to be supplemented with social
development in order to provide sustenance to the overall process of development,
which brings into focus the role of human development as a resource and the
indispensable role played by the components of social sectors in economic
development.
Literacy rates in India have risen dramatically from only 18.3 per cent in 1951
to 64.8 per cent in 2001. However, India continues to lag behind several other
developing countries in the region (Table 4). Census data from 1981 to 2001 indicate
that the increase in population of the age-group 7 years and above has been 26-27
per cent during each decade. The number of literates grew by 52 per cent in 1981-91
and 59 per cent in 1991-2001. The absolute number of illiterates increased during
1991-2001. Literacy improved by 8.6 percentage points during 1981-91 while the
increase during 1991-2001 was by 12.6 percentage points (Table 5). For the first time,
education efforts have overtaken the growth in population and the absolute number of
illiterates has started declining.
3. Conclusion:
There is no conflict between social sector reforms and economic reforms because a
country cannot achieve higher level of human development without having high rate
of economic growth. There is no trade-off between the two. Both are complimentary
to each other. Although, it has been established that the theory of trickle-down effect
had failed in case of India, but what we need is a special drive against poverty,
malnutrition, illiteracy, hunger,' deprivation and unemployment. Since, borne more by
the vulnerable sections, so we need a special policy.
The problem of poverty and unemployment has to be based on four types of
strategy consisting of higher growth, redistribution, basic needs and directed
programmes. We can conceive of two forms of targeting, i.e. direct targeting, and
characteristic targeting. The planners missed the inescapable fact that growth and
reduction in inequality are both indispensable for a successful attack on mass poverty,
but our planning strategy considered production and distribution separately. However,
the forces of production determine the distribution pattern and thus there is no
justification for treating productive efficiency and distributive justice as two
independent variables of growth. Unless the pattern of income distribution is altered,
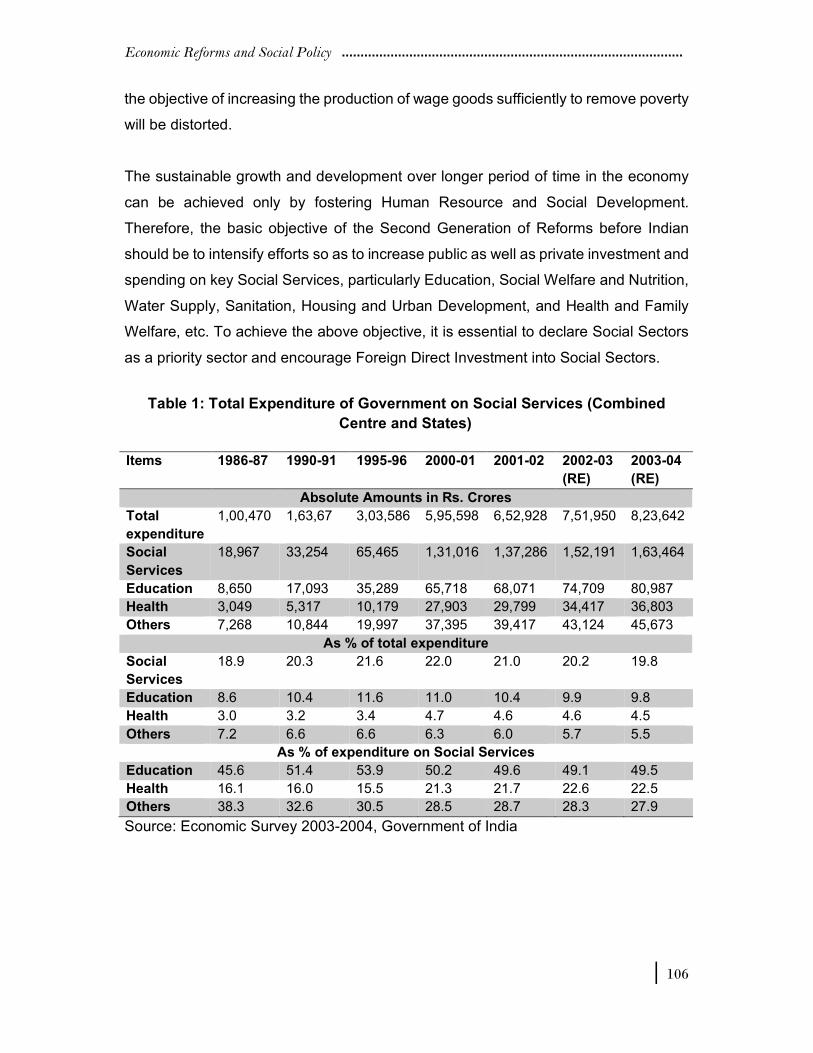
Economic Reforms and Social Policy
| 106
the objective of increasing the production of wage goods sufficiently to remove poverty
will be distorted.
The sustainable growth and development over longer period of time in the economy
can be achieved only by fostering Human Resource and Social Development.
Therefore, the basic objective of the Second Generation of Reforms before Indian
should be to intensify efforts so as to increase public as well as private investment and
spending on key Social Services, particularly Education, Social Welfare and Nutrition,
Water Supply, Sanitation, Housing and Urban Development, and Health and Family
Welfare, etc. To achieve the above objective, it is essential to declare Social Sectors
as a priority sector and encourage Foreign Direct Investment into Social Sectors.
Table 1: Total Expenditure of Government on Social Services (Combined
Centre and States)
Source: Economic Survey 2003-2004, Government of India
Items 1986-87 1990-91 1995-96 2000-01 2001-02 2002-03
(RE)
2003-04
(RE)
Absolute Amounts in Rs. Crores
Total
expenditure
1,00,470 1,63,67 3,03,586 5,95,598 6,52,928 7,51,950 8,23,642
Social
Services
18,967 33,254 65,465 1,31,016 1,37,286 1,52,191 1,63,464
Education 8,650 17,093 35,289 65,718 68,071 74,709 80,987 Health 3,049 5,317 10,179 27,903 29,799 34,417 36,803
Others 7,268 10,844 19,997 37,395 39,417 43,124 45,673
As % of total expenditure
Social
Services
18.9 20.3 21.6 22.0 21.0 20.2 19.8
Education 8.6 10.4 11.6 11.0 10.4 9.9 9.8
Health 3.0 3.2 3.4 4.7 4.6 4.6 4.5
Others 7.2 6.6 6.6 6.3 6.0 5.7 5.5 As % of expenditure on Social Services
Education 45.6 51.4 53.9 50.2 49.6 49.1 49.5
Health 16.1 16.0 15.5 21.3 21.7 22.6 22.5 Others 38.3 32.6 30.5 28.5 28.7 28.3 27.9
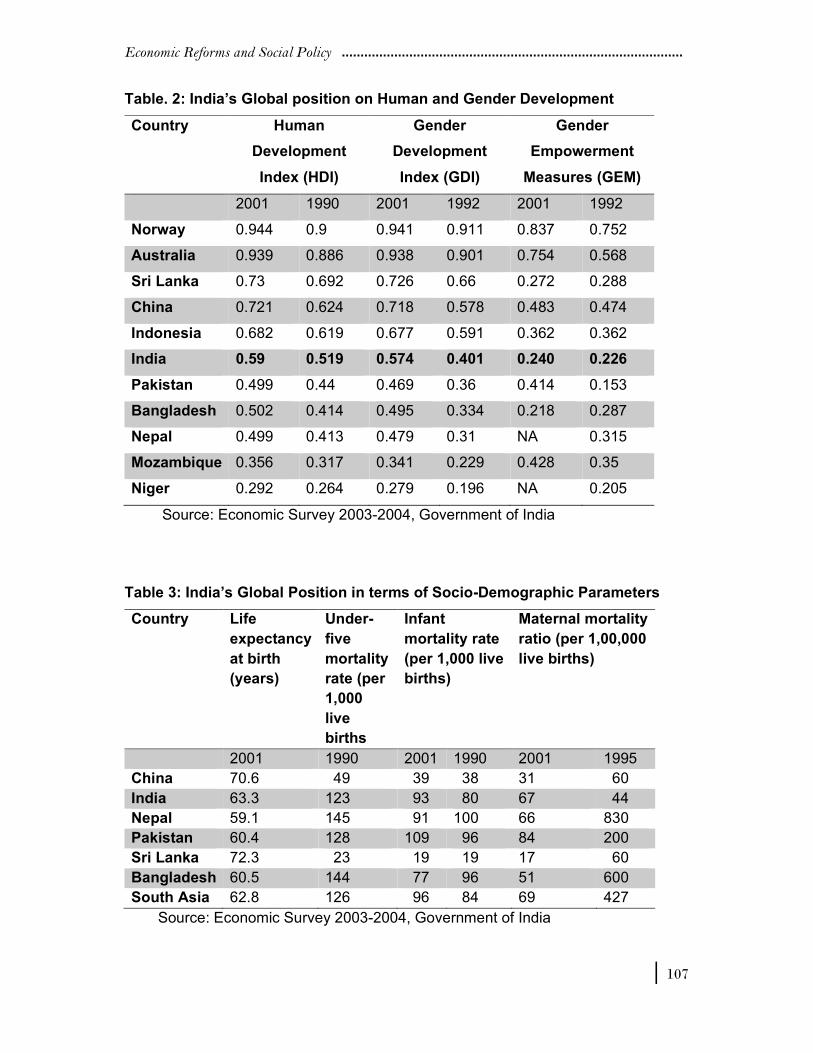
Economic Reforms and Social Policy
| 107
Table. 2: India’s Global position on Human and Gender Development
Country Human
Development
Index (HDI)
Gender
Development
Index (GDI)
Gender
Empowerment
Measures (GEM)
2001 1990 2001 1992 2001 1992
Norway 0.944 0.9 0.941 0.911 0.837 0.752
Australia 0.939 0.886 0.938 0.901 0.754 0.568
Sri Lanka 0.73 0.692 0.726 0.66 0.272 0.288
China 0.721 0.624 0.718 0.578 0.483 0.474
Indonesia 0.682 0.619 0.677 0.591 0.362 0.362
India 0.59 0.519 0.574 0.401 0.240 0.226
Pakistan 0.499 0.44 0.469 0.36 0.414 0.153
Bangladesh 0.502 0.414 0.495 0.334 0.218 0.287
Nepal 0.499 0.413 0.479 0.31 NA 0.315
Mozambique 0.356 0.317 0.341 0.229 0.428 0.35
Niger 0.292 0.264 0.279 0.196 NA 0.205
Source: Economic Survey 2003-2004, Government of India
Table 3: India’s Global Position in terms of Socio-Demographic Parameters
Country Life
expectancy
at birth
(years)
Under-
five
mortality
rate (per
1,000
live
births
Infant
mortality rate
(per 1,000 live
births)
Maternal mortality
ratio (per 1,00,000
live births)
2001 1990 2001 1990 2001 1995
China 70.6 49 39 38 31 60
India 63.3 123 93 80 67 44
Nepal 59.1 145 91 100 66 830
Pakistan 60.4 128 109 96 84 200
Sri Lanka 72.3 23 19 19 17 60
Bangladesh 60.5 144 77 96 51 600
South Asia 62.8 126 96 84 69 427
Source: Economic Survey 2003-2004, Government of India
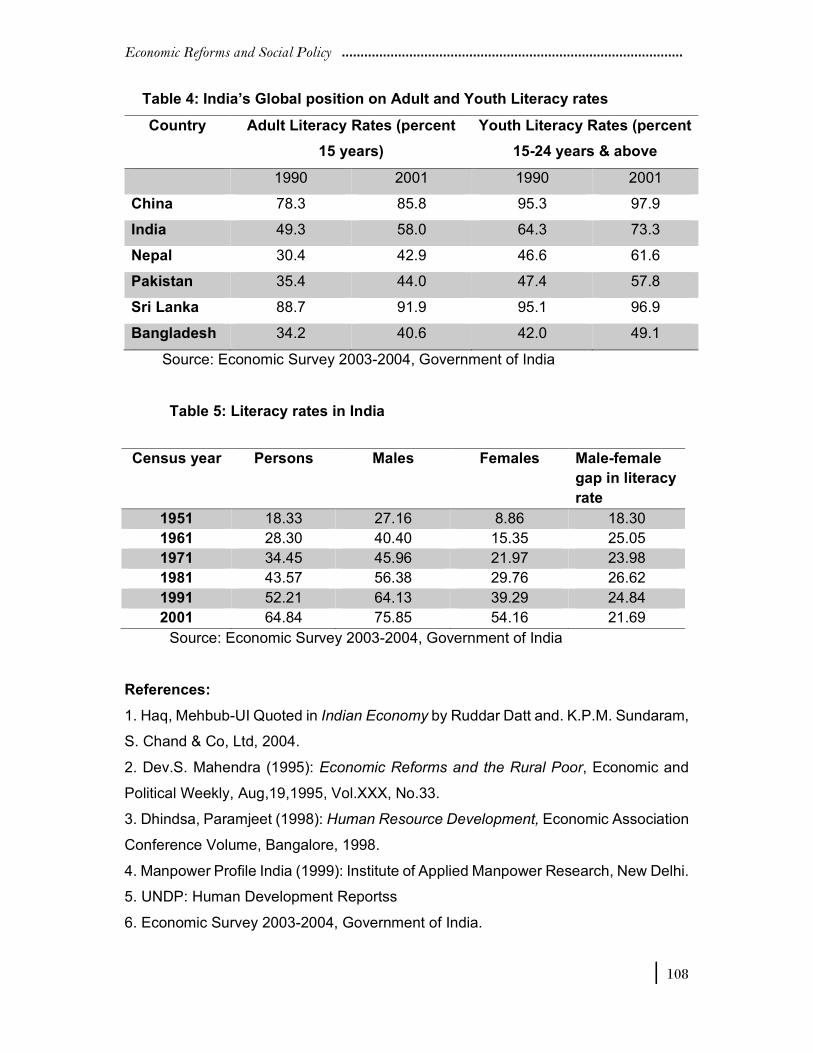
Economic Reforms and Social Policy
| 108
Table 4: India’s Global position on Adult and Youth Literacy rates
Country Adult Literacy Rates (percent
15 years)
Youth Literacy Rates (percent
15-24 years & above
1990 2001 1990 2001
China 78.3 85.8 95.3 97.9
India 49.3 58.0 64.3 73.3
Nepal 30.4 42.9 46.6 61.6
Pakistan 35.4 44.0 47.4 57.8
Sri Lanka 88.7 91.9 95.1 96.9
Bangladesh 34.2 40.6 42.0 49.1
Source: Economic Survey 2003-2004, Government of India
Table 5: Literacy rates in India
Source: Economic Survey 2003-2004, Government of India
References:
1. Haq, Mehbub-UI Quoted in Indian Economy by Ruddar Datt and. K.P.M. Sundaram,
S. Chand & Co, Ltd, 2004.
2. Dev.S. Mahendra (1995): Economic Reforms and the Rural Poor, Economic and
Political Weekly, Aug,19,1995, Vol.XXX, No.33.
3. Dhindsa, Paramjeet (1998): Human Resource Development, Economic Association
Conference Volume, Bangalore, 1998.
4. Manpower Profile India (1999): Institute of Applied Manpower Research, New Delhi.
5. UNDP: Human Development Reportss
6. Economic Survey 2003-2004, Government of India.
Census year Persons Males Females Male-female
gap in literacy
rate
1951 18.33 27.16 8.86 18.30
1961 28.30 40.40 15.35 25.05
1971 34.45 45.96 21.97 23.98
1981 43.57 56.38 29.76 26.62
1991 52.21 64.13 39.29 24.84
2001 64.84 75.85 54.16 21.69
Economic Reforms and Social Policy
| 109
HUMAN DEVELOPMENT INDEX IN ANDHRA PRADESH
AN ANALYSIS OF DEMOGRAPHIC INDICATORS
Dr. M. V. Narasimha Sarma
Professor, Department of Economics, Acharya Nagarjuna University.
Dr. Ch. Purnachandra Rao
CESS, Hyderabad.
D. Kailasa Rao
Reader, Department of Economics, Sarada College, Vijayawada.
The concept of development has undergone a lot of change in emphasis because of
recent debates. The objectives and underlying values of development showed a
perceptible structural change over time. In the classical era, the word development
refers to progress, Classical conception of development was development of
productive resources. It is the development of resources which directly adds to the
output and well-being. Traditionally, development is explained in terms of income per
head of the population, education, and labor force participation. However, in recent
times, with the introduction of Human Development Index (HDI) in the Human
Development Report 1990 of UNDP, social indicators of development are also
included in measuring development. The human development index measures the
overall achievement in three basic dimensions of human development namely,
longevity, knowledge, and standard of living1.
Noble Laureate Amartya Sen has, for some time, argued persuasively that
human development is best defined as the expansion of individual freedoms or
capabilities in education, health, income, political processes, and economic exchange.
Enhancing the capabilities of the members of society to live the kind of lives they have
reason to value characterizes Sen's development ideology. Only when each of
society's members has the capacity to avoid impediments to happiness like poverty,
under education, malnutrition and gender inequality can that society be referred to as
developed. Human Development thus concerns more than the form capabilities such
as improved health and knowledge. Human development is the end-economic growth
a means. So, the purpose of growth should be to enrich people's lives. People should
have, include a long and healthy life, access to knowledge and income, assets, and
employment for a decent standard of living. In the ultimate analysis, human
Economic Reforms and Social Policy
| 110
development is development of the people, and by the people.
The present study falls under the new approach of development, where an
attempt is made to work out a composite index for measurement of human
development. The present study is based on UNDP's methodology for constructing
human development index for different districts of Andhra Pradesh.
Human Development
Human Development has traditionally been perceived by economic thinkers as a
progressive transformation of society. Human development is the end-means of
economic growth. The purpose of growth should be to enrich people's lives. Human
development is an essential input for promoting economic growth and development.
Only when each of society's members have the capacity to avoid impediments to
happiness like poverty, malnutrition, and gender inequality that society can be referred
to as developed. Inequality is not a new phenomenon in the history of economic
thought. In fact, some schools of economic thought desired some tolerable level of
inequality as an inducing factor for the overall development of a state. The idea behind
the above approach was that the benefits of economic growth, which will be emerged
out from the selected better off packets will automatically and slowly trickle down to
the poor states. The view of human development as a progressive transformation of
society was inherent in the writings of all the schools of economic thought. Though all
these schools shared this common vision, what was lacking was a coherent and
comprehensive analytical framework for its measurement.
Studies in Andhra Pradesh:
S.A.R. Sastry (1978)2 says that there has been a shift in the focus, on the structure of
development as well as direct and relevant indicators of welfare like consumer
expenditure and nutritional intake. Conveying the strong nexus between per capita
expenditure and levels of development, he has taken per capita expenditure as a proxy
for the level of development. His exercise uses 26th round NSS (1971-72, State
Sample) data. The per capita household consumer expenditure data are corrected for
discrepancies in the distribution by adopting Sen's welfare. index. Finally, all the
districts were ranked based on their index.
Another important study relating to evaluation of levels of development across
different districts of Andhra Pradesh, was done by Appa Rao (1979)3. The study
considers all the districts of Andhra Pradesh with variables relating to agricultural
Economic Reforms and Social Policy
| 111
sector, manufacturing, health, and education for the year 1975-76. The study works
out sector-wise indices by using principal component are used for calculating an
overall index. By using the percentile method, the class intervals are fixed, and all the
districts are classified into five groups, as very low, low, medium, high, very high.
Based on the above methodology, the identified very low districts were Nalgonda,
Mahabubnagar, Cuddapah, Nellore and Karimnagar. Low development districts were,
Anantapur, Khammam, Chittoor, Warangal, Srikakulam and Adilabad. Medium
developed districts were Medak, Prakasam, Krishna, East Godavari. High developed
districts were Kurnool, West Godavari, Nizamabad. and very high development
districts were Guntur, Visakhapatnam and Hyderabad.
In the year 1984, the Centre for Economic and Social Studies (CESS)4 also
attempted to identify backward areas at district level. This study was a follow-up to the
study in the backward area in Andhra Pradesh by technical committee constituted
under the Chairmanship of Sri B.P.R. Vithal. This study was an update version of the
earlier report using 1984 data. For classifying the districts by different dimensions of
development, factor loading approach was used.
K.S. Chalam (2000)5 analyzed the human development in the South Indian
states is found to be much higher than what is expected of them in terms of their ranks
in per capita NSDP. Most of these states are now experiencing demographic
transition. Andhra Pradesh is found to be backward in educational development
compared with its record in other components of human development. According to
the study the factors responsible for the educational underdevelopment in Andhra
Pradesh are examined through an in-depth study. The inter-caste and intra-caste
differences among the scheduled castes, which constitute 16 per cent of the
population, and the alienation of these communities in rural areas, are some of the
factors identified as responsible for this backwardness.
S. Mahendra Dev (2002)6 developed the analysis of Income Poverty and
Human Development. Poverty ratios show very low levels of rural poverty (11%) and
high levels of urban poverty (26.6%) for Andhra Pradesh as compared with All-India
(27% and 23.6% respectively) for 1999-2000. The concept of poverty is multi -
dimensional (viz., income poverty and non-income poverty). It covers not only levels
of income and consumption, but also health and education, vulnerability and risk, and
marginalization and exclusion of the poor from the mainstream of society. The official
Economic Reforms and Social Policy
| 112
estimates of poverty ratio in urban areas of Andhra Pradesh are more than double
than those for rural areas in the 1990s. This is quite contrary to what one would expect
on the basis of the rural-urban differences in per capita income and wages. It is,
nevertheless, a matter of concern that the decline in rural poverty in Andhra Pradesh
was much slower than for all-India and the growth of mean consumption for rural
Andhra Pradesh was the lowest among southern states in the - 1990s.
Objectives of The Study
The present study addresses itself to the following objectives:
To analyze human development with the help of demographic indicators for Andhra
Pradesh.
To assess the impact of demographic indicators on Human in Andhra Pradesh
To study the behavior of demographic factors on HDI in Andhra Pradesh
To suggest suitable plans and reforms in demographic indicators to achieve a better
HIDI.
Methodology for Human Development:
United Nations Development Program (UNDP) was adopted for calculation of Human
Development Index. The report, recognizing the broad-based consensus that exists
on the three critical dimensions of well-being, focuses on identifying the various
contextually relevant indicators on each of them. These dimensions of well-being are
related to:
Longevity: The ability to live long and healthy life; Education The ability to read, write
and acquire knowledge; and the ability to enjoy a decent standard of living and have
a socially meaningful life. The HD1 is a summary measure of human development.
HDI measure the average achievement in three basic dimensions of human
development. These are: A long and healthy life, as measured by life expectancy at
birth, Knowledge (educational attainment), as measured by a combination of the adult
literacy rate (with two-thirds weight) and the combined primary, secondary and tertiary
gross enrolment ratio (with one-third weight).
However, in the present study only the demographic indicators like Total
Fertility Rate (TFR), Infant Mortality Rate (IMR), Population growth and sex ratio are
taken into consideration for the analysis of variations in HDI during 1981 and 2001
census in Andhra Pradesh.
Andhra Pradesh is fourth lowest state in literacy among the major 16 states.
Economic Reforms and Social Policy
| 113
Despite a higher rate of improvement in literacy during the nineties than the national
average. Literacy is likely to be influenced by the level of economic development. It is
of interest to see the strength of association between per capita income and literacy
rate. The high performance in literacy in the nineties is mainly due to the
implementation of an organized mass campaign for literacy. The National Literacy
Mission (NLM), established in 1988, provided financial assistance for Total Literacy,
Campaign. The mission defines a person as literate if he/she has acquired basic
literacy and numeric skills, functional knowledge, and social awareness. But the
census does not use such a rigorous definition. Though literacy rate increased:
significantly as per the 2001 census, it is necessary to ensure that these neo-lite rates
do not relapse to illiteracy after eight to ten months in the absence of continuing
education programs. The data relating to NSS 47th round relating to 1991 reveals that
11.3 per cent of the male literates and 3.1 per cent of the female literates in Andhra
Pradesh relapsed into-illiteracy. It is proper to calculate this proportion for those who
acquired literacy through adult literacy programs as the question of sustainability of
literacy arises mainly for these literates. The danger of relapse into illiteracy is likely to
be quite high in the recent period because of the spurt in literacy. (Table-I)
Human Development Impact on Demographic Indicators in Andhra Pradesh
In this study, an attempt has been made to analyze the relationship between HDI and
some of the demographic parameters, viz., the Total Fertility Rate (TFR), Infant
Mortality Rate (IMR), Population growth and sex ratio on the basis of district-level data
of the Andhra Pradesh. We have also carried out a rank correlation coefficient analysis
to find out the relationship between HDI and demographic parameters. Table 1
presents the some of the demographic indicators.
Table - 2 gives rank correlation matrix between different demographic indicators
in Andhra Pradesh. In assigning of ranks for calculation of rank correlation the HDI
and sex ratio are ranked from highest to lowest while Total Fertility Rate (TFR), Infant
Mortality Rate (IMR) and population growth rate are ranked such that the lowest figure
is ranked first and the highest rate gets the higher rank. This is because the HDI and
sex ratio should be higher for better economic development whereas the TFR, IMR
and population growth rate should have lower rates.
The Human Development index (HDI) has a positive impact on the Infant
Mortality Rate (IMR) and the Total Fertility Rate (TFR) in all the districts in the state.
Economic Reforms and Social Policy
| 114
The HDI has a positive correlation with the TFR, the IMR in 1981. But HDI and the
population growth rate, the sex ratio has negative correlation. The HDI has a positive
correlation with the TFR, the IMR and the population growth rate, but HDI and sex
ratio shows a negative correlation in 2001. (Table-III)
From the above analysis, it may be deducted that the TFR has contributed more
when compared to any other indicator for HDI. Taking the correlation between HDI
and IMR, the later has proven its impact for an improved HDI in the year 1991 when
compared to the year 1981. However, the value of correlation has decreased in 1991
when compared to 1981 which indicates the contribution of IMR for an improvement
of HDI has decreased.
The relationship between HDI and population growth rate is very interesting. In
the year 1981, the relationship is negative but due to the massive hard work of
government there is a substantial decrease in population growth rate by the year 2001
which in turn could help for improvement in HDI as well as in their inter relation. The
relationship between the HDI and sex ratio is negative in both the time periods which
indicates that the sex ratio is falling and is not helping for an improvement in HDI.
However, from the rank correlation results it may be observed that there is an increase
in its value which supports the increase in sex ratio for growth in HDI.
In case of human resource development, the state improved its male and
female literacy between 1981 and 2001. This may be due to three major important
programs initiated in tune with the new education policy (1986) viz., Operation Block
Board (OBB), Andhra Pradesh Primary Education Project (APPEP) and District
Primary Education Project (DPEP). The OBB program supported by the government
of India, focuses on supportive infrastructure such as construction of social building,
providing teacher aids and creation of additional teacher posts. The APPE project was
assisted by the Overseas Development Authority (ODA) with the objective of
improving the quality of schooling, construction of additional classrooms and teacher
training centers. This program was merged with the DPEP after 1995.
The enrolment ratio has increased between 1981 and 2001 in the State. The
school data always indicates very high participation of children in education because
children are not removed from the roll as soon as they discontinue. Some of them
might have been enrolled in some other school: Some children may study for more
than five years in which case the enrolment ratio comes out as an overestimate. Since
Economic Reforms and Social Policy
| 115
age of enrollment varies, some of the children to be enrolled soon will also be shown
as not attending school. This is likely to give an underestimate of participation in
education.
Government medical facilities have been improved in the state between 1981
and 2001. Number of hospitals, beds and doctors have improved during the period.
This is because Andhra Pradesh is one of the few states where the private sector in
medical care has outgrown the size of public sector through direct and indirect state
patronage. The financial incentives to the private sector and overcrowding at the public
hospitals have created conditions for the rapid growth of private hospitals in the state.
Private hospitals dominate the public sector in the state.
The Gross District Domestic Product has increased between 1981 and 2001 in
the State. Among the districts, Visakhapatnam, East Godavari, West Godavari,
Krishna, Guntur, and Hyderabad districts have recorded the highest GDDP while
Srikakulam, Vizianagaram and Adilabad districts have the lowest GDDP. However, all
the districts have improved GDDP during the period. Andhra Pradesh has been
pursuing economic reforms to step up the GDDP growth rate and alleviating poverty,
while protecting the environment. Significant strides have been made in respect of
participatory management of land, water and forest resources through the watershed
development committees, water users association and joint forest management.
Women's self - help groups are a success story in the ". state and have formed a
central element in the strategy for poverty: eradication through social mobilization,
community empowerment and capacity building. Agriculture has been an era of
strength for Andhra Pradesh but has not received adequate priority in the last two
decades. The promotion of female literacy, family planning facilities, as well as open
and informed public discussion can enhance the voice and decisional role of women
in family affairs, women empowerment can have a very strong effect in reducing
fertility rates and population growth.
Suggestions
An analysis of the policy initiatives of Andhra Pradesh revels that it has made
substantial progress. Between 1981 and 2001 the literacy level increased in the state,
the next step is to achieve the goal of universal elementary education for all children
in the age group of 6-14. The problem of dropout at the primary level must be tackled
especially in some of districts viz., Mahbubnagar, Adilabad, Medak and Nizamabad.
Economic Reforms and Social Policy
| 116
There should be a shift in approach in dealing with the provision of health facilities to
the poor. It is evident that substantive part of provision as well: as financing of health
care in Andhra Pradesh is private. In such situations the critical role of the Government
should be to ensure equitable access for poor to essential clinical care including public
health services and make sure people get value for the money being spent. Building
on the lessons learnt from ICDS, (Integrated Child Development Services) and the
experience of APERP Nutrition Project the Government could look at further
strengthening the ICDS Program. Decentralization efforts of the program should be
strengthened, including providing and targeting of food supplements, to the mother's
committees to improve community ownership. The targeting of the program could be
improved to focus on children under 3 years to improve the program's nutrition focus.
In addition, an external assessment of the effectiveness of the food supplements in
improving nutritional status should be done and an assessment of which social and
economic groups are capturing the benefits of- ICDS should also be undertaken.
Sustaining the social mobilization and empowerment programmes should be a primary
focus of the human development strategy. The experience gained so far from the
working of Panchayati Raj institutions in the state has brought out the need for greater
devolution of functions, finances and powers, along with capacity building of the
functionaries, for ensuring the relevance and quality of works designed as well as for
their effective implementation. Andhra Pradesh needs to make significant progress
towards financially and administratively strengthening these institutions, making them
self-sustaining.
References:
1. UNDP (1996), Human Development Report, 1996, Oxford University, New York.
2. Sastry SAR. “Inequality, Welfare and Ranking: A study of Andhra Pradesh, Artha
Vijnana, Vol. xx, No.4, Dec 1978.
3. Narava Appa Rao, “Levels of Development – A study of Inter-districts Variations in
Andhra Pradesh”, An Unpublished M.Phil. Dissertation, Andhra university, 1979.
4. Project Work, Centre for economic and Social Studies (CESS), Hyderabad,1984.
5. Chalam K.S, “Human Resources Development in South India”, Journal of Social
and Economic Development, vol 11, No2, Dec 2000.
6. Dev Mahendra S “Human Development in Andhra Pradesh”, Development of
Andhra Pradesh: 1956-2001 – A Study of regional Disparities, vol.1, No.3, May
2002.
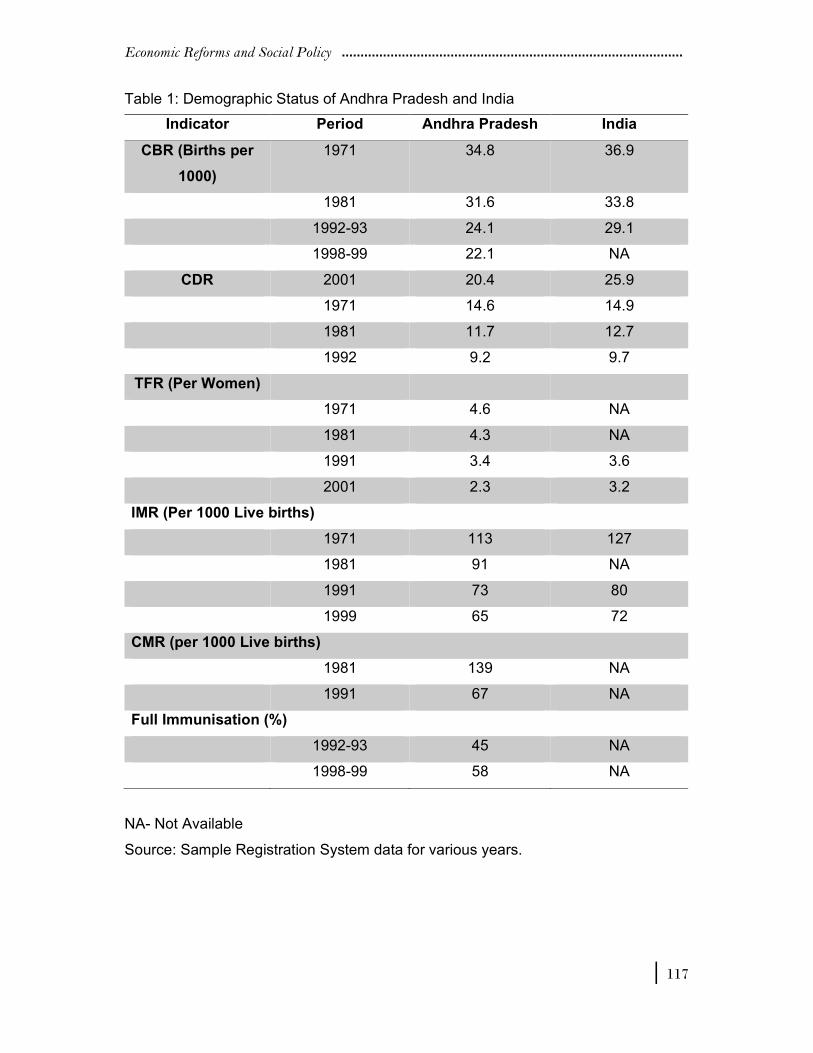
Economic Reforms and Social Policy
| 117
Table 1: Demographic Status of Andhra Pradesh and India
NA- Not Available
Source: Sample Registration System data for various years.
Indicator Period Andhra Pradesh India
CBR (Births per
1000)
1971 34.8 36.9
1981 31.6 33.8
1992-93 24.1 29.1
1998-99 22.1 NA
CDR 2001 20.4 25.9
1971 14.6 14.9
1981 11.7 12.7
1992 9.2 9.7
TFR (Per Women)
1971 4.6 NA
1981 4.3 NA
1991 3.4 3.6
2001 2.3 3.2
IMR (Per 1000 Live births)
1971 113 127
1981 91 NA
1991 73 80
1999 65 72
CMR (per 1000 Live births)
1981 139 NA
1991 67 NA
Full Immunisation (%)
1992-93 45 NA
1998-99 58 NA
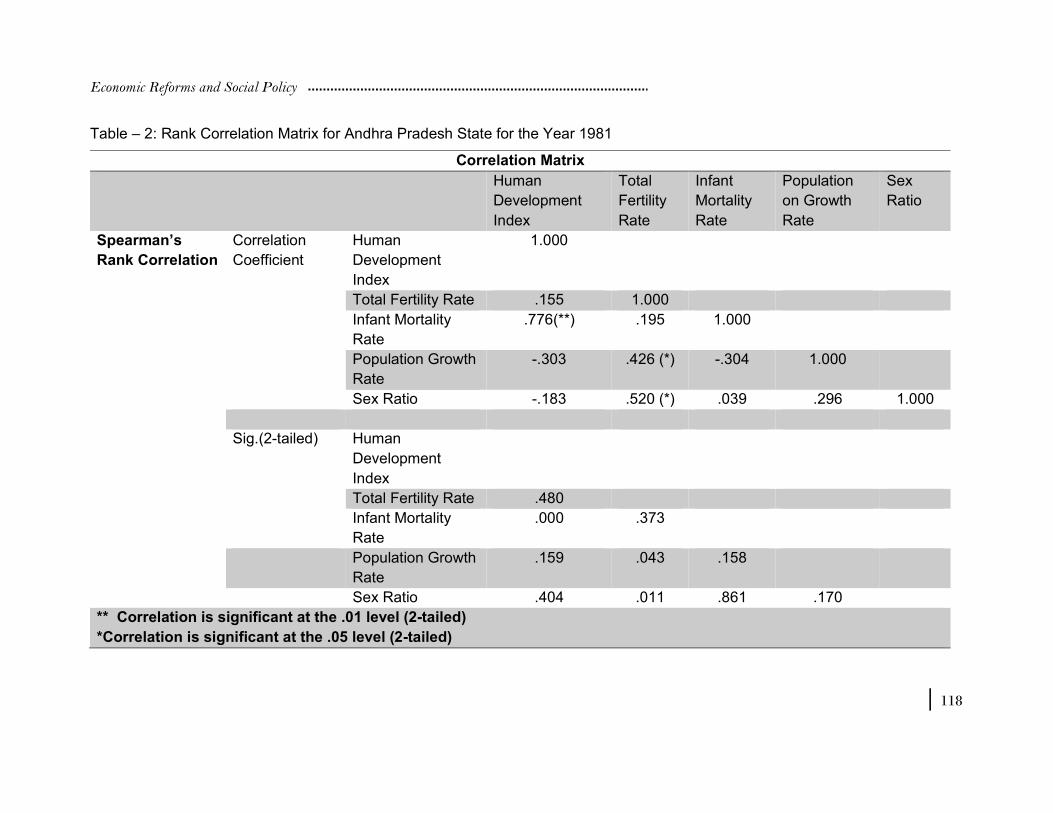
Economic Reforms and Social Policy
| 118
Table – 2: Rank Correlation Matrix for Andhra Pradesh State for the Year 1981
Correlation Matrix
Human
Development
Index
Total
Fertility
Rate
Infant
Mortality
Rate
Population
on Growth
Rate
Sex
Ratio
Spearman’s
Rank Correlation
Correlation
Coefficient
Human
Development
Index
1.000
Total Fertility Rate .155 1.000
Infant Mortality
Rate
.776(**) .195 1.000
Population Growth
Rate
-.303 .426 (*) -.304 1.000
Sex Ratio -.183 .520 (*) .039 .296 1.000
Sig.(2-tailed) Human
Development
Index
Total Fertility Rate .480
Infant Mortality
Rate
.000 .373
Population Growth
Rate
.159 .043 .158
Sex Ratio .404 .011 .861 .170
** Correlation is significant at the .01 level (2-tailed)
*Correlation is significant at the .05 level (2-tailed)
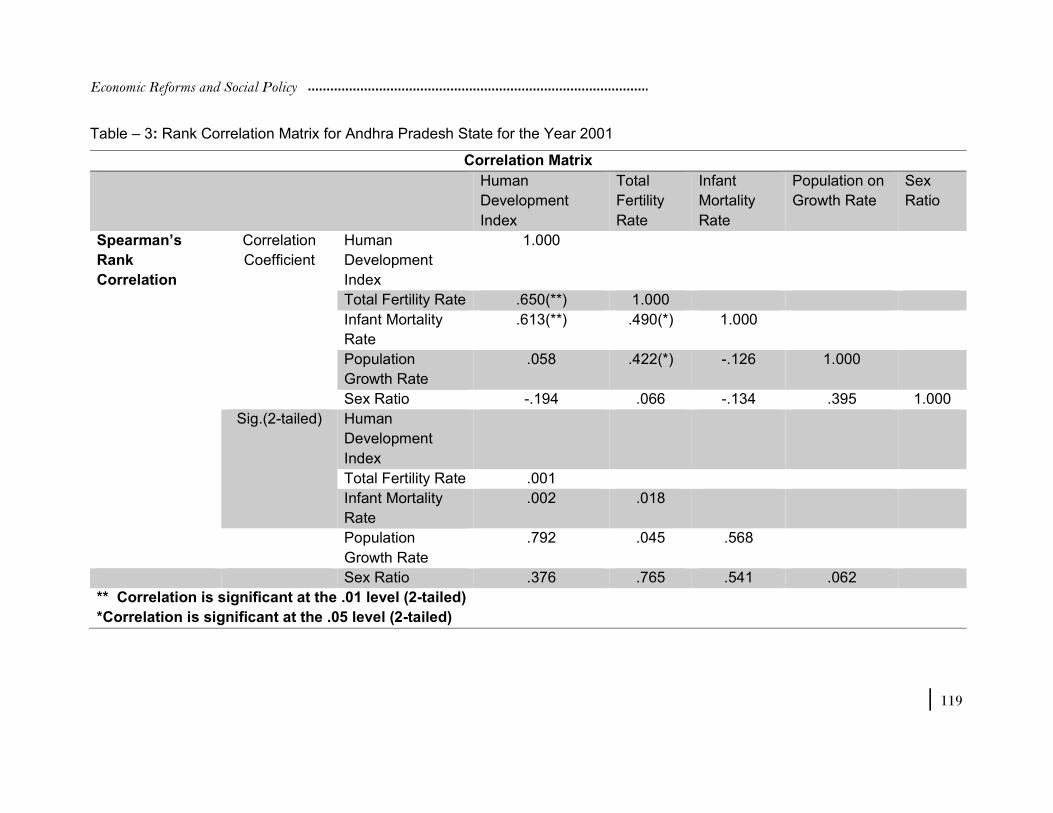
Economic Reforms and Social Policy
| 119
Table – 3: Rank Correlation Matrix for Andhra Pradesh State for the Year 2001
Correlation Matrix
Human
Development
Index
Total
Fertility
Rate
Infant
Mortality
Rate
Population on
Growth Rate
Sex
Ratio
Spearman’s
Rank
Correlation
Correlation
Coefficient
Human
Development
Index
1.000
Total Fertility Rate .650(**) 1.000
Infant Mortality
Rate
.613(**) .490(*) 1.000
Population
Growth Rate
.058 .422(*) -.126 1.000
Sex Ratio -.194 .066 -.134 .395 1.000
Sig.(2-tailed) Human
Development
Index
Total Fertility Rate .001
Infant Mortality
Rate
.002 .018
Population
Growth Rate
.792 .045 .568
Sex Ratio .376 .765 .541 .062
** Correlation is significant at the .01 level (2-tailed)
*Correlation is significant at the .05 level (2-tailed)
Economic Reforms and Social Policy
| 120
ECONOMIC REFORMS AND AGRARIAN CRISIS IN ANANTAPUR DISTRICT
Prof. K. Nageswara Rao
Department of Economics, Sri Krishnadevaraya University, Anantapur
The tempo and intensity with which economic reforms have been implemented in the
agriculture sector are undoubtedly low and diffused. Globalization facilitated
modernization and use of improved technologies in agriculture. However, these new
technologies increased reliance on outside inputs, economic viability and sustainability
have adversely affected the agriculture sector during the period of economic reforms.
Cultivation of new crops like cotton, chilly, oil seeds, pulses with hybrids in different
parts of the state, more specifically in the drought prone areas, and intensive use of
chemical fertilizers in addition to the problems of irrigation, soil fertility, credit, low
prices have resulted in a serious an agrarian crisis leading to the suicides of farmers.
The perceptions of the agrarian crisis range from the failure of specific crops, recurring
drought conditions, outbreak of pest, failure of technology increasing debt burden etc.
on the rise. Though, Andhra Pradesh state, along with some other states, witnessed
farmers' suicides in 1997-98, the trend has been on the rise in an alarming magnitude.
The changed role of the State in the context of liberalization and globalization during
the last decade is stated to be one of the main factors that failed to resolve the crisis
in agriculture sector.
Purpose of the study:
Development and stabilization of agriculture and thereby promoting the living
standards of the rural people, to a larger extent, depends on the magnitude of support
extended by the government to the farmers and the rural population. New Agricultural
strategies and the package of Agricultural development programmes failed to yield the
expected results in the drought prone areas. On the other hand, the distress among
the farmers has been increasing leading to suicide deaths. In view of these
circumstances an attempt is made here to examine the factors that contributed to the
agrarian crisis in the drought prone Anantapur district. Further, this paper enquires into
the causes for the present crisis and presents a set of measures to minimize the
intensity of crisis in agriculture sector of Anantapur district.
Anantapur district:
Anantapur is geographically the largest district in Andhra Pradesh state with lowest
Economic Reforms and Social Policy
| 121
rainfall embracing the status of a drought prone district. This district occupies first
place based on rain fed cultivation and last place based on irrigated crops among the
districts in the state. Groundnut has been the major crop in the district and the district
is the lead district in producing ground nut. However, recurring drought conditions
force the farmers of the district to cultivate ground- nut crop in alternative years.
Further, it is interesting to note that the yield of the crop realized in the alternative
years does not exceed one half of its potential.
Budget allocations are crucial for the effective implementation of the
developmental programmes in agriculture and social sector, more specifically, in
backward and drought prone zones. In fact, these allocations for the development of
rural areas, irrigation, agriculture, and human development programmes are to be
increased over a period. Special packages and increased allocations are to be granted
to the drought prone areas. Unfortunately, such allocations to drought prone areas are
decreasing over a period and the indifference of the government resulted in smaller
allocations to the backward districts. Further, these funds could not be utilized and
spent in time due to the delay in the release of the funds by the government.
Allocation of funds to the drought district has been fluctuating and is not keeping
pace with the intensity of drought. On an average, the plan allocation to the district has
been around Rs. 4.00 Crores. In 2001-02 budget amount sanctioned for crop irrigation
in Anantapur district was Rs. 42.25 lakhs and this also was not spent fully. In 2002-03
budget, only two crores were allocated to Anantapur district by the Irrigation
Department while more than fifteen crores were allocated for Tungabhadra High Level
canal works. Thus, the allocations by all the Departments to Anantapur district have
been meager and inadequate to meet the requirements of the district.
Agrarian crisis: Apart from several natural, physical, and other factors indifferent
policies of the government of Andhra Pradesh also contributed for the agricultural
crisis in Anantapur district. Introduction of some programmes in some years and
discontinuing them after some period reveals the indifference and non-commitment of
the government to develop agriculture in drought prone areas.
In 1992 a package programme for the development of agriculture in Anantapur district
was formulated by the district collector and a group of National Experts at an estimated
cost of Rs.1086 crores Government of Andhra Pradesh rejected this package and
proposed employment assurance schemes and watershed programmes for the
Economic Reforms and Social Policy
| 122
development of agriculture. However, with a change in the government in 1993, even
these proposed schemes were not implemented properly. Further, funds sanctioned
to these schemes were mis- utilized and a High-level Vigilance Committee was
appointed to probe into the irregularities in the execution of these programmes.
In 1998 the district collector of Anantapur prepared 3 schemes for the
development of minor irrigation and rural development. These schemes failed to see
the light. On the directions of the state government, a new package programme was
proposed by the district collector for the development of horticulture, dairying, and
watershed development on one lakh hectares with an estimated cost of 300 crores.
However, Agricultural experts viewed that these estimates were unrealistic as the
development of horticulture requires Rs. 600 crores - sinking of bore wells in one lakh
hectares needs Rs. 200 crores, erection of submersible pump sets needs Rs. 150
crores and the expenditure on drip irrigation another Rs. 150. crores. This package
also could not be implemented due to recurring drought conditions. In fact, orchard
gardens on 50,000 acres in the district were destroyed because of the depletion of
ground water table. For instance, in Rapthadu manual alone orchard gardens on 500
acres were destroyed for the problem of water shortage.
Effects of reforms on agriculture:
It is very clear that the agrarian crisis in Anantapur district is the result of many factors
such as recurring drought conditions, neglect of agriculture sector by the earlier
government, defective policies of the government relating to electricity policy, subsidy
policy, fertilizer, pesticide and seed supply operations etc. Mainly Government policies
on the budget allocations to agriculture and electricity charges affected the agricultural
sector adversely. Change in the role of the State during the reforms period and the
influence of world Bank stipulations are suspected to be the reasons for the
indifference of the government to the development of agriculture sector.
The advent of globalization resulted in the exploitation of the farmers by the
middlemen and money lenders. Crop cultivation became uncertain and the cost of
cultivation is increasing over time imposing heavy burden on the farmers. The average
cost of cultivating ground nut crop in the district is estimated to be Rs. 3,000 per acre
while the revenue realized is Rs. 3,500 thus yielding a net benefit of Rs. 500 in many
years to small and marginal farmers.
Rationalization of subsidies resulting in inadequate financial support to farmers
Economic Reforms and Social Policy
| 123
and the increasing burden of electricity bills are stated to be the reasons for the
distress of the farers. In fact, electricity supply to 21,000 pump sets in the district was
stopped as the farmers did not clear the payment of bills. The farmers in Anantapur
district suffer from non-remunerative price to the ground nuts.
Further, the import policy of the government permitting the import of palm oil is
adding to the miseries of groundnut farmers. In fact, the palm oil imports exceeded 40
million tons a year leading to a steep fall in the demand for groundnut. On an average,
Rs. 1500/- per hectare is provided for the development of palm oil production by the
Central government through the Department of Biotechnology. But the governmental
expenditure per hectare on groundnut crop works out to Rs. 8/- only. The Bio-
technology Department has been implementing 15 programmes for the development
of agriculture covering several crops in Andhra Pradesh. Unfortunately, groundnut
crop failed to find a place in the package of crops for development by Bio-technology
Department.
Under the Oil Seeds Development Programme Anantapur district should get
Rs. 5.85 crores assistance but it received only Rs. 33.96 lakhs and even this amount
was not also spent in the district for the development of groundnut crop due to the
delay in the release of the funds by the government. The National Oil Seeds and Oil
Development Corporation implemented programmes covering a set of crops raised in
the districts of Kurnool, Chittoor, Mahbubnagar and Adilabad. The programmes
implemented by this Corporation failed to cover the groundnut crop and the Anantapur
district.
Bank officials started the recovery of loans and announced the auction of gold
pledged by 568 farmers in February 2002. Later, the Transco officials insisted upon
the payment of the electricity bills by the farmers. Moneylenders also recovered loans
forcibly from the farmers. Unable to bear with the sufferings inflicted by all these
agencies many farmers ended their lives by committing suicides. During the period of
one and a half year from September 2002, more than 80 suicide deaths of the farmers
were recorded in the district. In fact, the number of farmers' suicide deaths increased
alarmingly in the last year. (approximately to 178).
We have taken up a study to probe into the agrarian crisis or the causes for the
farmers' suicides in Anantapur district under U.G.C sponsored Special Assistance
Programme and the survey is in progress. However, it is acknowledged that the data
Economic Reforms and Social Policy
| 124
relating to the suicide deaths of the farmers in Anantapur district may be different for
different agencies and groups.
Measures to mitigate agrarian crisis:
As the present survey and study is in progress, a few measures have been presented
hereunder to meet the challenges of agrarian crisis in Anantapur district.
o In the wake of World Trade Organization Stipulations Government of India must
enforce the anti-dumping measures to protect the demand for Indian agricultural
product. It is most urgent to mitigate the effects of globalization by cutting down the
import of palm oi on a large scale. Blue box measures are to be made use of fully by
the government to enhance financial support to the agriculture sector.
o For the benefit of farmers in drought prone areas groundnut prices are to be
made more remunerative through price-support measures. Crop insurance measures
are to be extended to the ground farmers to save them from distress.
o Budget allocations to agriculture are to be enhanced to benefit the farmers in
backward and drought prone areas. Excessive use of fertilizers and pesticides are to
be discouraged to reduce the cost of cultivation in drought prone areas.
o Supply of quality seeds to the farmers by the Department of Agriculture is to
be ensured to prevent farmers' distress.
o Sinking of bore wells and deep wells in drought prone areas is to be abandoned
to prevent the depletion of ground water resources. On the other hand, minor irrigation
tanks and percolation tanks are to be reconstructed and maintained to preserve the
rainwater for the purpose of recharging the wells around.
o Drip irrigation under the watershed programme with reasonable subsidy is to
be encouraged for the benefit of orchard garden growers.
o Bank credit to farmers is to be enhanced to farmers to save them from the
exploitation of middlemen. Uniform policy of the government for the development of
agriculture may have different effects of regions with different level of development.
Hence, special package programmes are to be implemented for the benefit of
backward and drought prone areas in the state.
o Rationalization of power tariff for agricultural uses through a flexible and
accommodative tariff policy rather than a policy of free supply of power to all regions
and all farmers is to be implemented for the benefit of drought prone areas. Revenues
realized by implementing a rational power tariff policy may be utilized for the
development of agriculture in backward and drought prone areas.
Economic Reforms and Social Policy
| 125
AGRARIAN CRISIS IN ANDHRA PRADESH
Dr. A. V. S. Bhaskara Rao
Senior Faculty, Post-Graduate Department of Commerce A.N.R. College, Gudivada
Abdul Shukur
Senior Faculty, Post-Graduate Department of Commerce A.N.R. College, Gudivada
Agriculture occupied a prominent place in the over- all. strategy of development in the
Indian economy. In fact, the importance of agriculture in the economy is well
recognized at the beginning of the planning process itself. Though agriculture is a state
subject, most of the agricultural policies are designed at the central level, and they are
implemented by the states. In addition to this, states also design some policies for
meeting their specific needs. The main objectives of these policies are to improve
agricultural performance and living conditions of rural masses, and to ensure food
security in the country. The success of these policies mainly depends on the nature of
the policies and the actions initiated at the State level.
Indian Agricultural Policy in the Planning Era:
In India, an era of planning started in 1951 when the First Five Year Plan was
launched. During the first three decades of planning, the focus of agricultural policy
was on the following issues:
Bringing agrarian reforms on three fronts, viz., the abolition of intermediary
tenures like Zamindars and Inams, the security of tenure to tenants in the
ryotwari area, the imposition of ceiling on land holdings and the distribution of
surplus lands to the landless and uneconomic classes,
Associating agricultural classes with the formulation and execution
of development programmes.
iii Providing irrigation through major and medium irrigation projects and of
power for minor irrigation through rural electrification, and
Providing credit through co-operatives.
The first two measures represent major institutional reforms and the other two
constitute the core of the infrastructure, which are beyond the means of individual
cultivators and which could be provided only through active participation of
government. Regarding abolition of zamindars, inams and intermediary tenures, there
Economic Reforms and Social Policy
| 126
was complete success. In respect of other measures, the achievements are quite
substantial, though they cannot be treated as a success considering the requirements
of Indian Agriculture.
Policy Instruments
For the adoption of technology, improving the resource use efficiency and for
achieving high growth of output, the policy instruments chosen arc prices, credit, and
subsidies. So, the policies on agricultural prices, policies on agricultural credit and the
policies on input subsidies in agriculture, gained prominence.
The effectiveness of these policies on growth of output was quite substantial.
During this period agricultural output recorded a growth rate of about 2.5 per cent per
annum. However, on the equity side there was a failure. The landowners seem to have
gained proportionately more than the landless labourers and large farmers gained
proportionately more than the small. These developments are traceable to the
deficiency in public investment in irrigation, the dominance of rich in credit societies
and the large technological gap between rice and the other crops in dry regions. The
policies of land reform, taxation, credit, and prices have also been heavily biased
towards big farmers who wield considerable political power at the state level and who
influence the formulation as well as implementation of such policies.
In the eighties there was no specific policy for the creation of agricultural infrastructure.
Public investment had been slowed down. However, the policies on prices, credit and
input subsidies were continued during this period. The infrastructure created earlier,
and the continuation of other policies made possible the achievement of a high rate of
growth of output.
In the nineties India launched a program of economic reforms and became a
signatory to the new world trade arrangement, which for the first time included.
agriculture. Then, the agricultural policy. framework was subjected to a rigorous
review. With the advent of W.T.O., like many other countries, India also faces the
challenges of removing domestic support in the form of subsidies, removing
quantitative restrictions and other non-tariff and tariff barriers on imports and exports.
Though several steps have been taken to implement the various clauses of W.T.O.,
the process has been very gradual and cautious. This may be due to the concern for
household food security, levels of poverty and regional disparities in
Economic Reforms and Social Policy
| 127
development. Most of these policies were implemented in Andhra Pradesh along with
some State specific policies.
Trends in the Agricultural Economy of Andhra Pradesh:
Andhra Pradesh is a centrally located place in the country with varied agro-climatic
conditions conducive to diversified agriculture and the farmers are known for their
enterprise and willingness to take risk. It was among a few states in the country which
heralded the green revolution especially in respect of rice in the seventies. The
adoption of HYV technology and the other policy interventions of the government
brought some variations in the performance of agriculture in the state, over the last
fifty years. These variations can be traced over distinct periods, viz., pre-green
revolution period (before 1969-70), the first phase of green revolution (the seventies),
the second phase of green revolution (the eighties) and the economic liberalization
period (the nineties).
The aggregate output recorded a growth rate of 1.9 percent per annum during
the pre-green revolution period and it accelerated to 3.5 per cent per annum in the
first phase of green 'revolution. This high acceleration is not merely due to rise, but
also due to good performance of all food grain crops. However, the performance of
non- food grain crops, except cotton was not satisfactory. The second phase of green
revolution maintained the growth rate attained in the first phase. In the nineties, the
period of economic liberalization, there was a deceleration in the growth of aggregate
output. The growth rate declined from 3.4 per cent of the eighties to 2.3 per cent per
annum in the nineties.
The area under cultivation, an important determinant of agricultural output
marginally increased in the pre-green revolution period but declined continuously in
the first and second phases of green revolution. The decline was mainly due to
increase in the fallow lands. However, the area under cultivation recovered marginally
in the economic liberalization period. Thus, the area under cultivation is not a factor
responsible for deceleration in the growth of aggregate output in the nineties. Even the
cropping intensity is not responsible for the deceleration as the cropping intensity
increased steeply in the nineties. It is only the deceleration in the growth of yields of
several crops that is mainly responsible for the deceleration in the growth of
agricultural output in Andhra Pradesh.
Economic Reforms and Social Policy
| 128
The critical factors behind the crop yields are technology, irrigation, and
fertilizer. In Andhra Pradesh, the adoption of HYV technology is very high. The
proportion of total area under HYV in the total cropped area increased from 53.17 per
cent in 1980 81 to 85.92 per cent in 1995-96. For individual crops, during the same
period, this proportion increased from 76,75 per cent to 94.07 per cent for paddy, from
16.16 per cent to 53.32 per cent for Jowar, from 47.16 per cent to 81.82 per cent for
Bazra and from 36.18 per cent to 84.08 percent for Maize. At the time of the formation
of the State, the gross irrigated area in groșs cropped area was only 26.01 per cent,
which increased to 43.34 per cent by triennium ending 1999-2000. In the seventies it
increased at a rate of 1.5 per cent per annum but in the eighties, there was a
deceleration to 0.6 per cent per annum. However, in the nineties the growth
accelerated to reach 1.9 per cent per annum. The high growth in the irrigated area in
the seventies was contributed by both canal and ground water sources. The eighties
witnessed a slowdown in the growth of canal irrigation and an increase in the ground
water irrigation. In the nineties there was a decline in the canal irrigation and a
phenomenal rise in the ground water irrigation
The consumption of chemical fertilizer is relatively higher in Andhra Pradesh.
During 1999-2000 the average intake-was-140 kgs per hectare, while it was 90 kgs
per hectare at all India level. The level of application is higher than the recommended
level for most of the crops.
High Cost of Cultivation
The deceleration/ stagnation in the growth of yields and high input use are leading to
increase in the cost of cultivation. For instance, the cost of production of paddy,
increased from Rs.77.06 per qtl. in 1974-75 to Rs. 405.82 per qtl. in 1996-97. Likewise,
the cost of production of groundnut increased from Rs.343.45 per qtl. in 1981-82 to
Rs. 1244.85 per qtl. in 1996-97 and for cotton it increased from Rs.537.88 per qtl.
in 1975-76 to Rs. 1832.91 per qtl. in 1996-97. The increase in the cost of production
without the proportionate increase in the product prices reduces the profit rate and
consequently the farm incomes. In the absence of adequate opportunities for non-
farm employment, many of the farmhouse holds especially the small and marginal are
entering into debt trap which is leading to great distress among farmers often resulting
Economic Reforms and Social Policy
| 129
in the farmers committing suicides. During the five- year period 1997-2002, a total of
877 cases of farmers suicides in the state were reported in the newspapers.
Another important area for promoting agricultural development is marketing. In
between the product and input markets in Andhra Pradesh, the State intervention is
mostly found in the product markets, and the prices in these markets are relatively
stable and imperfections are relatively less. On the other hand, in the case of input
markets the private sector has been enjoying a dominant position. About 90 percent
of the seed of HYV, fertilizers, plant protection chemicals, farm implements and
machinery are being supplied to the farmers through private agencies and the State
has been playing a regulatory role in maintaining the quality of inputs. However, some
studies conducted in the state revealed that many multinational companies involved
in seed, fertilizer, pesticide markets, are very often deceiving gullible farmers through
their marketing strategies and supplying spurious inputs. The consequence is crop
loss and misery to farmers.
Against this background, an attempt has been made in this paper to bring out
the State's concern on agriculture and to record the State's view on the changing
economic situation. This study is based on the information drawn from both the primary
and secondary sources. The secondary sources are the documents prepared by the
State Government Departments arid various issues of Season and Crop Reports. The
primary data are collected through the discussions held with various government
officials in charge of agriculture and some other stake holders of agriculture like
farmers' organizations, entrepreneurs of agro-processing industries, etc.
Important Issues and Concerns
The following are the main concerns:
Deceleration in the rate of growth of output
Existence of large chunk of under -utilized lands and their increase over time,
especially the fallow lands,
Shift in the cropping pattern in favour of high-risk crop under the conditions of
low risk bearing capacity of the farmers,
Stagnation/deceleration of crop yields,
Decline in the surface irrigation and increase in the ground water irrigation,
Economic Reforms and Social Policy
| 130
large areas of rain fed agriculture with erratic rain fall and frequent occurrence
of droughts,
Inadequate public investments for creation of agricultural
infrastructure, especially irrigation
Inadequacies in the timely supply of quality seed, excess/ deficient or
imbalanced use of fertilizer, supply of spurious pesticides and inappropriate
application of pesticides by farmers, on some crops,
Declining access to institutional sources of credit and increasing dependence
on private money lenders/ traders for credit,
inadequate market infrastructure and marketing, covering mainly the product
markets, leaving input markets to private sector.
Almost all the government officials in charge of agriculture and allied activities
in the state, with whom we interacted, expressed the view that the above-mentioned
factors are indeed the major issues of concern in the state,
State Officials’ views on changing economic situation:
The views of government officials on the factors responsible for the changes in
agriculture in reform period are divergent. However, none of them expressed directly
that the implementation of W.T.O. Agreements is mainly responsible for these
changes. Majority of them expressed the view that broadly the economic policy and
specifically, the agricultural policy designed at the national level, which is implemented
in the state is responsible for these changes in the agrarian economy The policy
designed with economic reforms favouring liberalization, globalization and
privatization as a base failed to address the basic problems of irrigation, marketing,
provision of credit, extension services and development of post harvesting technology.
A few also expressed the view that W.T.O. is indirectly responsible for these
undesirable changes in the agrarian economy: Regarding the perceptions of these
officials on the changes in the agrarian economy, the W.T.O. Agreements and their
impact on agriculture, our assessment is that most of the officials have very clear idea
about the changes that are taking place in agriculture and allied sectors. But, for
majority of them there is no proper understanding of W.T:0. Agreements and
commitments our country must meet. Therefore, their assessment of the likely impact
Economic Reforms and Social Policy
| 131
of W.T.O. on agriculture in the State and correlating the changes in agriculture with
W.T.O. should be read with caution.
References:
1. Acharya, S.S., and Agarwal (1994): Agricultural Prices - Analysis and Policy, Oxford
and IBH Publishing
2. AERC (2003), Agricultural Policy in Andhra Pradesh : A Policy Matrix (Part-I), Agro-
Economic Research Centre, Andhra University, Visakhapatnam.
3. Government of Andhra Pradesh, Season and Crop Report of Andhra Pradesh,
various issues, Bureau of Economics and Statistics, Hyderabad
4. Hanumantha Rao, Ch. (1980), 'Agricultural Policy' in J.S.Mongia (ed) Indian
Economic Policies 1947-77, Allied Publishers Private Limited
5. Parthasarathy, G. (2000), Agricultural Development in Andhra Pradesh - Problems
and Prospects, Occasional Paper - 14, NABARD, Mumbai.
Economic Reforms and Social Policy
| 132
WELFARE PROGRAMS AND FOOD SECURITY IN INDIA
Prof. C.S.N. Raju
Department of Economics, Acharya Nagarjuna University.
Dr. Ch. Purnachandra Rao
Centre for Economic and Social Studies (CESS), Hyderabad.
1. Introduction
Food security is always defined as access to enough food by all people. Food
insecurity is the lack of access to sufficient food, which may be either chronic or
transitory. The worst form transitory food insecurity is famine (Rautlinger, 1987).
Agricultural growth is an important tool for tackling chronic insecurity as it generates.
employment and income to the growing population. The transitory insecurity can be
addressed through the maintenance of buffer stocks.
Basically, food security implies that the entire population in a community has
“Access to enough food at all times for leading an active and healthy life” (World Bank:
1986). Food security also implies “Ensuring that all people at all times have both
physical and economic access to basic food they need” (FAO).
1.2. Ensuring Food security
Ensuring food security ought to be an issue of great importance for a country like India
where more than one-fourth of the population is estimated to be absolutely poor, and
one-half-of all children, malnourished in one way or another. There have been many
emerging issues in the context of food security particularly during the 1990s. These
are: a) economic liberalization in the 1990s and its impact on agriculture and food
security. b) Establishment of the WTO and particularly Agreement On Agriculture
(AOA) c) the phenomena of hunger amidst plenty., accumulation of more than 60
million tons of food stocks while 260 million or so people still live below the poverty
line d)the introduction of targeting in the public distribution system(PDS)for the first
time in the 1990s e)the ‘right to food campaign' for improving food security in the
country and the orders of the highest judicial body the supreme court of India-on mid-
day meal schemes; f) Monitorable targets under the Tenth Five Year Plan similar to
Millennium Development Goals (MDG's) on poverty and women and child nutrition.
These developments in the 1990s have provided opportunities and challenges for the
food and nutrition security of the country. It is well known that the question of food
Economic Reforms and Social Policy
| 133
security has several dimensions that goes beyond the production, availability, and
demand for food. There has been paradigmatic shift in the concept of food security
from food availability and stability to household food security, and from the assessment
of input measures like energy intake to output indicators such as anthropometrical
measures and clinical signs of malnutrition.
2. The Concept of Food Security ·
The concept of Food Security can be considered at three levels: State, household and
individual (George, 1999). Food security at the national level can be monitored in
terms of demand and supply. At the household level, it needs employment and income
generation. Even when these two levels are monitored, there is no guarantee that food
security is ensured for all since certain vulnerable sections like children and women
under special condition, like pregnant and lactating women, may not get enough food
despite adequate income at the household level. Special nutritional programs for these
target groups provide a solution to this problem.
Though food availability at the national level is not a sufficient condition for food
security, it is necessary and other interventions are possible only when this condition
is fulfilled. In other words, the balance between demand and supply of food is a
necessary condition for food security. Since the concept of food security must focus
on the lower income groups who spend their income mostly on food grains, the
balance between demand and supply of food grains should be the primary concern.
World Development Report (1986) defined food security as "Access by all people at
all times to enough food for an active, healthy life". However, Food and Agriculture
Organization (FAO 1983) defined food security as ensuring that all people at all times
have both physical and economic access to basic food they need”. Staatz (1990)
defined food security as” the ability to assure, on a long-term basis that the food
system provides the total population access to a timely, reliable and nutritionally
adequate supply of food".
Food security involves physical availability of food to the entire population in a
country. However, to make adequate food available to all, it is necessary that the
people have enough purchasing power so that they can acquire the food they need.
For healthy life, the food available should be adequate in quality as well as quantity to
meet nutritional requirements. A nation may acquire self-sufficiency in food at a point
of time, but the concept of food security necessities that timely, reliable, and
Economic Reforms and Social Policy
| 134
nutritionally adequate supply of food should be available on a long-term basis. This
implies that a nation must ensure the growth rate in food supply so that it takes care
of the increase in population as also the increase in demand resulting from increase
in the income of people.
The concept of food security has been discussed mostly in making available
minimum quantity of food grains to the entire population. In this sense, the concept is
narrow. But, in dynamic and developing economy, the concept of food security
undergoes a change with the stage of development reached by the society. From this
point of view, the following stages of food security may be visualized.
The most basic need from the point of view of human survival is to make an
adequate quantity of cereals available to all. In the second stage, we may think of food
security as the adequate 'availability of cereals and pulses. In the third stage, food
security should include cereals; pulses and milk and milk products. In the fourth stage
food security should include cereals, pulses, milk and milk products, and vegetables
and fruits, fish, eggs, and meal.
This paper delves into the problem of food security, in India. India has
achieved food security at the national level, which means that there is an adequate
supply of food for the entire population. But food security at the individual or household
level is yet to be achieved as a considerable large proportion of households do not
have access to enough food. Poverty is regarded as the principal cause of hunger,
and hence, food insecurity. In India, about 35 percent of population lives below the
poverty line (GOI 1997) which means that they do not have the means to buy enough
food that is considered biologically sufficient poverty is related to the inability to have
enough food, there will be wide variation in food security at the individual level.
Ensuring food security to the vulnerable sections of the society is the prime
responsibility of any welfare state. The Public Distribution System (PDS) in India plays
a pivotal role in providing essential food commodities to the poorer sections at
affordable prices, aiding thereby the process of social cohesion.
This paper consists of five sections. The first section is introduction, section II
analyses the concept of food security, need for food security is explained in section III.
This is followed in the IV section by food security in India. The V: section tells about
the shortcomings of food security finally; the section VI briefly outlines the suggestions
for improvement.
Economic Reforms and Social Policy
| 135
3. Access to Food Security
Food security is said to be prevalent in the society when all the citizens always have
sufficiently food available which is culturally acceptable and having sufficient means
to obtain the. When we say culturally acceptable it means that by and large the food
that is consumed by people locally. There are two dimensions, by definition, to food
security. One is the availability or physical access to food and the second is the
purchasing power or economic access to food. In India, food security exists at the
macro level in terms of physical access to food. The economic access is far from
satisfactory, both at micro as well as macro level. When we say that economic access
to food is far from satisfactory, it is reflected in fact that a significant proportion of the
society is under poverty and is mal nourished also. This section of the society is under
privileged and less voiced. The question that arises is that who will ensure their food
security? Is it the state, market and the civil society or combined? The Article 21 of
Indian Constitution refers to "Right to Life”. Thus, right to food can be directly or
indirectly interpreted under this Article.
The state, market and the civil society have played a role ensuring food security
to the people of the country. However, food insecurity persists in some sections of the
society. The state provides access to food to all its citizens. However, there is no
recourse mechanism in-built in the system that will ensure each citizen access to
adequate food.
The market mechanism to a certain extent ensures access to food to its people.
This is however, limited, subject to overall sufficiency. Though market may ensure
access to adequate food it may not be socially and culturally acceptable. For instance,
inferior cereals and pulses, non-vegetarian food, etc., the civil society has still not
made its, presence in the cause of access to adequate food. It is only in the recent
past that the civil society is trying to bridge the gap between the state, market and
people by creating an awareness regarding the presence of persistent hunger in the
society, inadequacies in the Government system to ensure food security system.
People's Union of Civil Liberties' writ to the Supreme Court in 2001 is one such
example similarly, a national public hearing was held in Delhi on January 10 to 11
2003 on “Right to Food” (Chamaraj, 2003). Thus, an attempt is being made in this
paper to study the food security situation and the role of the state, market, and civil
society from human right perspective in providing adequate food.
Economic Reforms and Social Policy
| 136
The impact of the new changes in policy is visible clearly from the available
data on quantities distributed under the PDS. First, let us look at the broad patron of
change during the last 15 years. The quantity of rice and wheat distributed through the
PDS network fell from 20.8 million in 1991 to 14 million tons in 1994. The quantity of
food grains supplied through the PDS rose again thereafter but the introduction of
targeting clearly led to a sharp reduction in off take. The provisional estimate for off
take in 200 was 12 million tones.
India is often cited as a land of paradoxes. This is certainly true when it comes
to food security. Despite a decline in poverty, close to 30 percent of its people are food
insecure and one-half of its children malnourished in one-way or another. And yet the
country has a stock of more than 60 million tons of food grains stored through
Government's procurement increased food prices, shrinkage of area under food grains
and escalating food subsidy are now the major concerns with regard to food security,
rather than freedom from hunger. Food security has several dimensions that go
beyond supply and demand. Ultimately, the key question is that of the ability to access
and effectively utilize food by all people, always to lead a health life.
4. Welfare Programs:
The following Programs have been strengthened and implemented effectively.
Public Distribution System (PDS): Public Distribution System is one of the
instruments for improving food security at the household level in India. PDS ensures
availability of essential commodities like rice, wheat, edible oils, and kerosene to the
consumers through a network of outlets or fair price shops. They are supplied at below
market prices to consumers, the access to the system till 1997 was universal. During
the first few decades of its existence, the PDS had never operated as an anti-poverty
program but merely as an instrument of price stabilization. Till late 1970s, the PDS
was mainly restricted to urban areas and food deficit regions. The main emphasis was
on price stabilization and as an alternative channel to private trade, Since the Sixth
Five Year Plan, however, the welfare importance of the PDS has been recognized.
Rural areas have also been covered in many states in the 1980s. In the 1990s the
Government has decided to restructure the PDS in the form of Revamped Public
Distribution System-(RPDS) and Targeted-Public Distribution System (TPDS). The
PDS has been effective during drought years, e.g. 1979-80 and 1987-88. It is also
effective in transferring food grains from surplus areas to few deficit regions. Over the
Economic Reforms and Social Policy
| 137
years it has emerged as an instrument of Government policy to moderate open market
prices and to ensure food security at the household level. Under the PDS the Centre
Government has assumed responsibility for procurement, storage, and supply of
essential commodities to the State Governments/ Union Territories for distribution at
uniform and affordable prices to the public through a network of Fair Price Shops
(FPS).
Annapurna Scheme: The program is linked to the Targeted PDS. It provides 10
kg. of food grains for month for free to indigent senior citizens living alone. Approved
during the 1999/2000 budget, it is now being operationalized. It is targeted at those
who are eligible for old age pension but do not receive them and who do not live with
their children in the same village. The Ministry of Rural Development is charged with
its implementations with an annual food grain requirement estimated at 166,000
tonnes, issued by FCI at economic costs. The evaluation of this scheme is not readily
available.
Anthyodaya Annayojana: This program was introduced in early 2001 is
addressed to the poorest of the poor, as identified by Grama Panchayats and Grama
Subhas. Anthyodaya household have special ration cards and are entitle to 35 kg. of
grain a month at highly subsidized prices. (Rs.2 kg. for wheat and Rs.3 kg. for rice). In
a survey of destitution in Five States (Andhra Pradesh, Chhattisgarh, Jharkhand,
Rajasthan, and Uttar Pradesh) indicates that the program is doing well, in contrast,
with other components of the PDS. In the budget 2003-04, an additional allocation of
Rs.507 crores have been provided. With this expansion, 25. percent of the population
below the poverty line is to be covered in the fiscal year 2003-04.
Nutrition Programmes
Integrated Child Development Services (ICDS): Malnutrition among children
and women is severe in India. Integrated Child Development Services (ICDS) is one
of the main Programs for providing nutrition. ICDS is perhaps the largest of all the food
supplementation Programs in the World. It was initiated in 1975. ICOS services were
much in demand-but there are problems in delivery, quality, and coordination. The
program might perhaps be improving food security at household level but fail to
effectively address the issue of prevention detention and management of under
nourished child / mother. This is a unique program under which a package of
integrated services consisting of supplementary nutrition, immunization, health
Economic Reforms and Social Policy
| 138
checkup, referral and education service are provided to the most vulnerable groups
even within children and women, i.e. children up 6 years of age and expectant/nursing
mother, through a common focal point called Anganwadi (the courtyard centers) in
each of the village/urban slums, to improve the nutritional and health status of children
in the age group 0-6 years to lay the foundation for proper psychological, physical, and
social development of the child., to reduce the incidence of mortality, morbidity,
malnutrition, and school dropout, to regulate effective coordination of policy and
program implementation amongst various departments to promote child development
to enhance the capability of the mother through proper nutrition education for taking
care of the normal health and nutritional needs and health of the child.
One ICDS project covers either a tribal or a rural Block, the territorial unit at sub district
level or a cluster of urban slums in an urban project. Preference in selection of Blocks
is given to those which have larger proportion of the population of tribal people and
other disadvantaged categories. The ICDS program was launched experimentally and
rather modestly, by covering 33 Blocks/slums in 1975-76. The author happened to be
the Director in charge of the program in the then Ministry of Education and Social
Welfare immediately thereafter when program was internally evaluated and expanded
to 66 Blocks. Since then, the program has been expanded gradually in a phased
manner and by the end of March 1993, it consisted of 3066 projects with 19.5 million
children and mothers receiving supplementary nutrition under the program. In addition,
9.34 million children were receiving pre-school stimulation. The entire expenditure of
the 287i centrally sponsored ICDS projects (of the total 3066 projects in place by the
end of March 1993) is borne by the Central Government, barring expenditure on
supplementary nutrition which concerned State Governments incur. Expenditure on
rest of the projects is borne of the state governments. How massive is the program
can be gauged by the fact that 21.4 million women and children are likely to have been
covered by one or other aspects of this program in 1993-94 and an amount of Rs.
4618 million is likely to have been spent by the Central Government itself. UNICEF
and some other international agencies are also assisting the program.
An evaluation of the ICDS program carried out in 1990-92 has revealed that
some of the positive impacts of program as follows:
(i) IMR in ICDS covered areas was significantly lower (66.6/1000) compared to
IMR in the non-ICDS areas (86/1000),
Economic Reforms and Social Policy
| 139
(ii) immunization coverage in ICDS areas has been much better than in non ICDS
areas,
(iii) there has been better coverage of prophylaxis program of Vitamin.A, and Iron,
(iv) the nutritional status of covered children was going up and
(v) the percentage of low birth weight babies was also found to be lower.
(vi) On the negative side, the report has brought out inadequate community
participation and perhaps too much dependence on Government. Another
status appraisal of ICDS, carried out in four States by the National Institute of
Nutrition, Hyderabad revealed that "Nutritional status of ICDS beneficiaries in
Bihar was better than their non ICDS counterparts and only marginal
differences were observed in the remaining three States of Andhra Pradesh,
Madhya Pradesh and Orissa". This report, therefore, suggests better training
and motivation of ICDS workers to monitor growth properly and continuously
identify the children and mothers at risk, arrange for clinical intervention in
their cases, increase the quantum of their supplementary nutrition and so on.
In fact, NIN is now starting the "nutrition surveillance" in ICDS blocks in Andhra
Pradesh on pilot basis for achieving the abovementioned purposes.
It is now well recognized that proper and continuous training of. ICDS functionaries
at all levels and functional monitoring is vital to the success of a program like ICDS
which seeks of deliver a package of services. At the same time, motivation of the
village people to support the program is also a much-needed element. In fact, the
worker in charge of the focal point of delivery in the village i.e. Anganwadi worker is
supposed to be a girl from the village itself so that she does not have too many
overheads and does not take it as a job. being performed like by a Government
employee. She must be able to feel that she is enabling the children and women,
many of whom are her relatives in her own community, to derive the benefits from
the program.
Special Nutrition Program (SNP): This program was launched way back in
1970-71 for the same target group as in ICDS i.e. children below 6 years age and
expectant and nursing mothers. The program is a confined to tribal areas and slums.
Main activity under this program is to provide supplementary food to the beneficiaries
for 300 days in a year, although some individual initiatives were made in some States
to link some other services with supplementary feeding. For example, in early
Economic Reforms and Social Policy
| 140
seventies in the small State of Tripura in North Eastern India, a school dropout tribal
girl was selected for running the feeding center, provided with some motivational
training and then encouraged to impart preschool education to the children, teach
them simple personal hygiene etc. Tribal communities were exhorted, and they
invariably did so, to construct a small hall where the pre-school activities could take
place. Under this program, every child is to receive .300 calories and 8 to 15 grams
of protein and every expectant and nursing mother 500 calories and 20 to 25 grams
of protein per day. As and when ICDS projects coyer 'tine areas having the SNP, the
program is merged with ICDS.
Bal wadi Nutrition Programme: Bal (children) wadi (home or center) Nutrition
Program is a contemporary of SNP and is being implemented since 1970-71 by the
Central Social Welfare Board and national level nongovernmental voluntary
organizations, namely, Indian Council for Child Welfare, Harijan (Scheduled Castes)
Sevak (Service) Sangh (Board), Bhartiya (Indian) Adivasi(Scheduled Tribe) Sevak
Sangh and Kasturba (wife of Mahatma Gandhi) National Memorial Trust. This segment
of nutrition program is thus implemented essentially by non-governmental
organizations. The Central Social Welfare Board, which is a semi-government
umbrella organization in the field of social work, gives in turn, grants-in-aid to voluntary
organizations to actually run the program and -so-do-the-other-four national--level
voluntary organizations, which also extend assistance lo various voluntary
organizations beside running some centers directly.
The beneficiaries of SNP are, basically from the disadvantaged section of the society
like tribal/scheduled caste people, urban slum dwellers and migrant laborers. The in-
charge of the Bal wadi Centre is an honorary worker, like Anganwadi worker of ICDS,
and is paid an honorarium which is Rs. 200 per month for trained and Rs. 150 for
untrained. She is assisted by a helper who is also an honorary worker. The Bal wadis
not only provide supplemental nutrition but also look after the social and emotional
development of children attending these Bal wadis.
A total number of 5641 Bal wadi centers are presently being run by the five
organizations. About 229 thousand children in the age group 3-5 years are covered
under the program. The budget for the SNP during 1993-94 stood at Rs. 100 million.
Creches for Children of Working and Ailing Women:
The scheme, implemented since 1975, has been designed to free the working, and in
Economic Reforms and Social Policy
| 141
some cases ailing mothers, from the task of looking after their children while they are
on work or are sick. The coverage under the scheme is available only to those children
whose parent's total monthly income does not exceed Rs. 1800. Children generally
belong to casual migrant vendors, construction laborer’s groups etc. The services
available to the children include sleeping and daycare facilities, supplementary
nutrition immunization, medicines, entertainment, and checkups at weekly intervals.
The scheme is implemented by the Central Social Welfare Board which gives grants-
in-aid to various 'non-governmental organizations to manage the creches. Two other
national level voluntary organizations namely, Indian Council for Child Welfare and
Bhartiya Sewak Sangh also implement this scheme.
A total of 12470 creches are being run under this scheme; during 1993-94,
covering three hundred thousand children. Assistance to the tune of Rs. 230 million is
being provided to the CSWB and voluntary organizations to implement the scheme.
Wheat Based Supplementary Nutrition Program: The scheme was started with the
twin objective of providing supplementary nutrition to children and popularizing wheat
intake. Min of Food places at the disposal of the Department of Women and child
Development about 100 thousand tons of wheat from the central reserves annually
and that Department, in turn, sub-allocates this wheat among States which utilize the
wheat mostly to produce wheat based ready-to-eat nutrition supplements. With the
spread of ICDS, this wheat or its products are increasingly being utilized for distribution
of supplementary nutrition in ICDS and mid-day-meal programs The wheat is supplied
to the State Governments by the Food Corporation of India at the same subsidized
rates as for the public distribution system.
World Food Program Project: World Food Program-UN provides foodstuffs so that
supplementary nutrition could be provided through the projects supported by them.
WFP-India project has been extended from time to time and the present extension
would last till the end of March 1995. WFP currently supports 12 projects in India, with
a total commitment of 292 million dollars’ worth of food aid. "A major part of WFP's
assistance to India supports projects in forestry, irrigation and supplementary nutrition.
WFP's food assistance to India is focused on poverty alleviation, directly targeting the
most vulnerable section of the society" (WFP News 'letter April 94). The WFP provides
Soya Fortified Bulger Wheat, Corn Soya Blend, and edible oil to benefit about 2.1
million pre-school children, expectant and nursing mothers. For the last three years or
Economic Reforms and Social Policy
| 142
so, the WFP obtains wheat or rice locally from the Food Corporation of India in
exchange for the butter oil it gets as donation from some European countries.
CARE Assisted Nutrition Programs: Under the Indo-CARE Agreement of 1950,
CARE-India extends food aid so that supplementary nutrition can be provided to pre-
school children of age less than six years and expectant/nursing mothers. The CARE
assistance is now dovetailed with ICDS projects and some of the ICDS projects utilize
this assistance for the nutrition component of the program. The program covers ICDS
projects in 10 States of the Indian Union. CARE has also monetized oil received by it
as donation for generating funds worth Rs. 100 million for implementing activities
supportive of ICDS program.
Tamilnadu Integrated Nutrition Project: This project located in the Southern
State of Tamilnadu, was started sometime in 1980-81 with the World Bank first time
extending assistance for nutrition programs in India. Second phase of the project with
a life of six years has started in 1990-91. The project would ultimately cover 316 of the
385 development Blocks in Tamilnadu. This will enable all the rural areas of the State
to come under the coverage of either this project or ICDS, as in most of nutrition
programs discussed earlier. The target groups in this project are also children up to 6
years of age and pregnant/nursing mothers. Like ICDS, pre-school education is
provided to children in 3 to 6 years group. The project seeks to provide enhanced
inputs in the areas of health, communications, training, project management,
operations, research, monitoring and evaluation. The NNMB repeat surveys for rural
areas in Tamilnadu showed that "the prevalence of severely underweight 1-5 (i.e.
below 60% NCHS median weight for age) dropped from 12.6% in 1975-79 to 4.2% in
1980-90, at a faster rate than all India improvement of 15%. to 8.7% in the same period
the rural IMR decreased from 121 in 1976 to 85 in 1988, as compared to all-India IMR
decrease from 139 to 102. A comparison of deaths among children 0-4 yrs. to total
deaths shows that Tamil Nadu at 22.2% (in 1987) is second only to Kerala (13.3%)
(with all India average was 42.0%)". (Ready, Mrs. Biondini, 1992) It, therefore, appears
that this project, implemented in just one state with strong political and administrative
back up, has been able to secure better coordination between nutrition, health and
educational services and certain strong points observed in this project need to be
replicated in other nutrition programs
UNICEF Assistance for Women and Children: India has been associated with
Economic Reforms and Social Policy
| 143
UNICEF since 1949 and is one of the major countries as far as activities of UNICEF
are concerned. The activities are guided by the provisions of the Master Plan of Action,
the latest of which was signed between India and UNICEF on 30 May 1991 and
extends up to 1995. During the Five-year period, UNICEF is likely to spend around
U.S. $ 175 million in India from its general resources. UNICEF's assistance covers a
wide spectrum and is available in the sectors of health, education, nutrition, water and
sanitation, rural development urban basic services etc. Of course, the focus of all its
programs is essentially on children and on women, with the ultimate objective of better
child health survival & development.
NPNSPE: The National Program for Nutritional Support to Primary Education
(NPNSPA) aims to promote improved nutrition and attendance of primary school
children in the whole country. The program more popularly known as the mid-day
meals program, seeks to attract children to enroll themselves in primary school,
encourage regular attendance by providing supplementary feeding and improve their
nutritional status.
Wage Employment Programmes:
India has a long experience in experimenting with labor intensive public works. After
Independence 1947, many schemes were sponsored by the Centre Government
beginning with the Rural Manpower Program in 1960. The Employment Guarantee
Scheme (EGS) of Maharashtra has received acclaim from several sources. It is
particularly interesting example because of its unprecedented feature of guaranteed
rural employment which makes it a model for other states in India and throughout the
developing World. At the national level Jawahar Rojgar Yojana (JRY) and Employment
Assurance Scheme (EAS) are the important programs in rural areas. Food for Work
(FFW) program was started in 2001-2002 as a component of the EAS in eight notified
drought effected states of Chhattisgarh, Gujarat, Himachal Pradesh, Madhya Pradesh,
Orrisa, Rajasthan, Maharashtra, and Uttaranchal. In terms of person days of
employment created India's Rural Public Works Program are the largest in the World.
The JRY's reached around a billion person days in recent years. JRY share is quite
high in the social sector expenditure. Recently JRY was revamped and named as
JGSY (Jawahar Grameen Sam Riddhi Yojana).
Economic Reforms and Social Policy
| 144
i. Employment Assurance Scheme
This employment generation scheme is being implemented in all the development
blocks of the State. The center and State are funding the scheme on 75:25 sharing
basis. The main objective of this program is to provide 100 days of assured casual
manual labor employment during lean agriculture season at statutory minimum wages
linked to the normal output of 8 hours of work. Creation of economic infrastructure and
community assets in the rural areas. The scheme is being implemented through
DRDAS and Panchayats.
ii. Jawahar Grama Samithi Yojana
Jawahar Gram Samridhi Yojana is a new program replacing Jawahar Rozgar Yojana,
which has been launched by the Government of India from the current financial year.
The Jawahar Gram Samridhi Yojna is being financed between center and state on
75:25 sharing basis. The central government will release funds directly to DRDAs on
the prescribed criteria of poverty arid population of SC/ST in the state.Creation of
durable assets / infrastructure at the village level, creation of productive assets,
exclusively for SC / ST for sustained employment and generation of supplementary
employment to the un-employed poor living below poverty line were the major activities
undertaken.
iii. Swarna Jayanti Gram Swarozgar Yojana
The Government of India by restructuring the self-employment programs has merged
IRDP, TRYSEM, DWCRA, SITRA, GKY and MWS into a new scheme namely "Swarna
Jayanti Gram Swarozgar Yojna" which has been launched from the current financial
year. This yojana is a holistic package covering all aspect of self-employment such as
organization of poor into self-help groups, training, credit, technology, infrastructure,
and marketing. The centre and state governments are funding the yojana on 75:25
sharing basis.
iv. Employment Guarantee Scheme
After independence, India embarked on an 'alternative' path of economic
development, which combined free with regulated market policies. Prompted by ideas
relating to democracy, nationalism, secularism and socialism, the elite in India devised
a programme of growth, which incorporated social obligations and a commitment to
social justice. As a part of this perspective, the state in India actively developed and
promoted anti-poverty programmes. In Maharashtra, the regional elite sponsored
Economic Reforms and Social Policy
| 145
three kinds of institutions, as part of of 'alternative development.” The first was the
establishment of co-operatives, mainly based in the agricultural activities of sugar,
cotton, oilseeds and rice but also in credit. The second was the introduction of the local
self-government. Lastly to offset any distress to the poor because of drought, the
government introduced a Right to work through an innovative Employment Guarantee
Scheme (EGS).
Some the interesting questions in this context are-
1. The role of the political leadership in implementing the EGS. What political
compulsions motivated them?
2. The role-played by protest movements in promoting and sponsoring anti-poverty
programmes. What socio-economic conditions and ideologies motivated the
mobilization of the rural poor?
3. The structures of governance could not ensure equal access to all without
discrimination. What interests mediated to discriminate against deprived groups at the
EGS site level and how was this related to district and taluka politics?
4. How subsequent mobilization of the rural poor was of uneven nature more
specifically, mobilization declined in the late eighties.?
Conclusions
Welfare Programmes designed to improve food security in India. The PDS (making
available food grains at affordable prices) and Employment Generation Schemes
(improving purchasing power through self and wage employment) and nutritional
programmes have already been discussed in detail. In the face of continuing poverty
and malnutrition an alternative strategy of development comprising a frontal attack on
poverty, unemployment and malnutrition became a national priority from the beginning
of the Fifth Five Year Plan. This shift in strategy has given rise to a number of
interventions to increase the purchasing power of the poor, to improve the provisions
of basic services to the poor and to devise a security system through which the most
vulnerable sections of the poor can be protected.
Economic Reforms and Social Policy
| 146
References:
1. Indra Kant, S. (2000), “Food Security and Public Support. A study of Andhra
Pradesh in N. Krislınaji and T.N. Krishna (eds), Public Support for Food Security – the
Public Distribution System in India, sage publications, New Delhi.
2. Nawani (1994), “Indian Experience on Household Food and Nutrition Security"
presented at Regional Expert Consultation, August 8-11, FAD-UN Bangkok, (Available
at www.fao.org/DOCREP/xo172e/).
3. Parikh K.S. (1994), “Who Gets How Much From PDS, How Effectively Does it reach
the Poor”. Sarvekshana, Vol.17 No.3.
4. Rao, V.M (1995), "Beyond 'surpluses': Food security in changing context', Economic
and Political Weekly, Vol.30. No.4, January 28.
5. Venupogal, K.R. (1992), Deliverance from Hunger- The Public Distribution System
in India, sage Publication, New Delhi.
6. Murthy, K.N. (1998), “Food grain Demand in India to 2020 - A Comment”, Economic
and Political Weekly, November 14, p.p. 2943-2944.
7. UNDP (2000), Human Development Report, Oxford University Press, New York.
8. World Bank (1999), World Development Report, Washington, D.C.
9. Mooij, Jas (1996), “Food Policy and the Indian State- The Public Distribution System
in South India, Oxford University Press, New Delhi.
10. Hanumantha Rao, C.H. (2000), "Declining Demand for Food grains in Rural India:
Causes and Implications” Economic and Political Weekly, Vol.35, No.4, p.p.201-206.
11. Planning Commission (2002), National Human Development Report, New Delhi.
12. UNFPA (1999), Population, Food Production and Nutrition in India, United Nations
Fund for Population Activities, New Delhi.
13. Ahluwalia, D. (1993),” Public Distribution of Food in India: Coverage Targeting and
Leakages”, Food Policy, Vol.18, No.1, p.p.33-54.
14. Radhakrishna, R. (1996), “Food Trends. Public Distribution and Food Security
Concerns”, Indian Journal of Agricultural Economics, Vol.51, No.1' nomics, Vol.51,
15. Mahendra Dev. S, Kannan, K.P, Ramachandran, Nira, “Towards a Food Secure
India - Issues and Policies", Institute for Human Development and Centre for
Economic and Social Studies.
16. Mahendra Dev, S. “Right to Food in India", Working Paper, Centre for Economic
and Social Studies (CESS) Hyderabad.
Economic Reforms and Social Policy
| 147
17. Amit Shah (1997), “Food Security and Access to Natural Resource: A Review of
Recent Trends", Economic and Political Weekly, Vol.32, No.26, p.p.A46-A55.
18. George P.S. (1999). “Some Reflections on Food Security in India “, Indian Journal
of Agricultural Economics, Vol.54. No.4 April - December p.p.465 490...
19. Mahendra Dev, S. (1996), "Food Security: PDS Vs EGS, A Tale of Two States",
Economic and Political Weekly, Vol.31, No.27. ss
Economic Reforms and Social Policy
| 148
THE POLICY AND SOCIAL SECTOR EXPENDITURES: ANALYSIS OF AP
STATE BUDGETS
Dr. Prabhakar Reddy,
Poverty Economist, Poverty and Social Analysis Monitoring Unit, Govt. of AP,
Hyderabad.
There has been a general opinion that the reforms would result in economic growth
and reduce poverty by creating a greater number of employment opportunities. While
it is true in the case of certain sections of society who possess some skills and
incomes. The situation of marginalized sections must be examined in view of ongoing
reforms. Besides, the government's strategy for poverty eradication recognizes that
long-term investment in core sectors such as agriculture, health and education will
accelerate the pace of poverty reduction in the state. Therefore, the rural poverty
reduction strategies are multi-pronged and multi-sectoral which can be classified into
three. a) intensive poverty reduction initiatives through social m pursuing rapid
agricultural growth, and c) provision of basic minimum services.
It is, in this context, important to mention an argument that the resource poor
will be affected adversely initially when the reforms are implemented. Therefore, there
is need for increasing public expenditures to the social sector. Against the above
background it is an attempt to examine the social sector expenditures (during nineties)
in relation to social policy and look into the utilization of funds particularly in the sectors
such as health and family welfare, education and drinking water.
The Policy
The policy with respect to the social sector is really ambitious and challenging and it
mentioned that the 'health for all' and 'compulsory education for all up to tenth e, if we
see the health sector strategy paper it is clear that several interventions were
undertaken with the following four broad goals (which are in a way similar to MDGs)
in perspective. They include reduction in maternal mortality rate, infant mortality rate,
increase in couple protection rate and reduction in fertility rate through social, political,
and economic empowerment of women, among others.
On the other hand, the interventions included decentralized organizational
structure, enhancing quality & expanding access of services, safe motherhood, child
Economic Reforms and Social Policy
| 149
survival, increasing contraceptive prevalence, sector reforms, implementation of IEC
activities, active participation of community and NGOs, and strengthening the
management information system for better programme management. In fact, the
interventions listed above require plan funds.
Though the resource allocation to health sector, in the budget, is increasing
gradually the composition of allocation made for plan and non-plan expenditures are
worrisome. The non-plan expenditures are increasing at a faster rate than the plan
expenditure. As a result, the objectives mentioned earlier are not being really achieved
despite the need for more funds are emphasized every time. For instance, of the total
expenditure made in health sector during 1994-95 to 2001-02 there is no sign of
decrease in the non-plan expenditure in the state. If this is the situation, how can we
expect to expand the services to the rural areas and more importantly its utilization per
se is a question.
Going by strategy paper of health department the performance in the last few
years is far from satisfactory. Some of the indicators such as IMR, immunization and
safe deliveries yet present a concern in so far as achieving progress when related to
the MDGs of the state. On the other hand, improving the delivery of service at the PHC
and SC is another challenge for the government.
Budget Analysis
A cursory look at the recent budget 2004-05 presented an alarming picture in so far
as the non-plan expenditure is concerned. Despite the repeated statements that it
should be reduced it continued unabated every year. Besides, the development
expenditure has decreased from 61.02 per cent to 59.03 per cent while non
development expenditure has increased from 39 per cent to 41 per cent (during 1999
00 to 2004-05). However, in this context, year 2003-04 seems to be a favorable year
in reducing the non-plan expenditure.
An analysis of revenue expenditure over a period of six years revealed that the
expenditure has come down while non-development expenditure has gone up due to
debt services, which has increased from 17.53 per cent to 21.87 per cent. It indicates
that the debt service has taken away the major chunk of resources hither to spent for
development. Therefore, this would have a negative impact on the development of the
economy in the long run in so far as reduced development expenditure is concerned
Economic Reforms and Social Policy
| 150
(consider table 1).
Further, an analysis of revenue expenditure highlighted the following facts (consider
table 2).
The share of general services has increased due to an increase in payments
and servicing of debt, administrative services, and pensions & miscellaneous general
services during the period under consideration.
The share of social services has declined indicating that it was not given due
importance by the government.
Although the share of education in total revenue expenditure has increased, the
revenue expenditure on health and family welfare, social welfare & nutrition have come
down. On the other, revenue expenditure on water supply & sanitation has come down
during 1999-2000 to 2002-03, it has picked up in the later period.
While the share of economic services in revenue expenditure has declined
during the period grants-in-aid has remained at the same level. The reason for the
decline is that the energy, industry and minerals, and science, technology and
environment have received less attention under revenue expenditure.
It seems that the revenue expenditure is biased towards general services than
that of social and economic services.
Table-3 has revealed the following changes in capital expenditure.
The composition of capital expenditure is in favor of economic services followed
by general and social services. From this it can be inferred that though economic
reforms are implemented in this decade the social sector expenditure has been
neglected.
The disaggregate data showed that the administrative services in general
services category has received much attention in the last three years wherein the
capital expenditure has grown from 0.31 per cent to 5.95 per cent. Further, the
education under social services category has been ignored continuously in so far as
capital expenditure is concerned. Similar is the case of health and family welfare
except for 1999-2000 during which 3.02 per cent of total capital expenditure is noticed.
Likewise, welfare of SCs, STs, and other backward classes has been neglected during
the period under consideration. All in all, the social services have been ignored during
the last nine-year period.
Though the capital expenditure on economic services has grown tremendously
Economic Reforms and Social Policy
| 151
the share of agriculture and allied activities within it has been neglected. The lion's
share of capital expenditure under economic services has been taken away by
irrigation and flood control especially the major and medium irrigation.
Given the demand for, and situation of social sector it seems that there is.
justifiability in allocating more funds for education and health. li is a fact that the rural
health services are receiving fewer resources than that of urban health services needs
immediate correction. Despite the increase in plan outlays from year to year it has not
resulted in increasing the social sector expenditure.
Apart from allocation, it is believed that the proper utilization of resources
allocated under elementary and secondary education is highly important.
Analysis of Human Development
According to the Human Development Report of UNDP India has moved from 'low'
human development category to 'medium' human development category. It is the
social sector placed in the 115th rank in the world. Despite its efforts in development
the performance is far from satisfactory. (Tables IV-V)
As regards the human development index for India (combined rural and urban)
and different states it revealed that the rank of AP has fallen from 8 to 10 during 1981-
. 2001. In fact, it is causing an alarming situation in so far as the decreasing
expenditure on social services and the concomitant fall in the quality of services is
concerned.
On the other hand, Punjab has improved its position tremendously from 20 to
2 whereas Tamilnadu has also moved up from 6 to 3.Both the states have put in efforts
during 1981-91 and achieved good results, which need a closer examination perhaps,
from which AP can learn a lot.
While analyzing the indicators of human development the literacy rate is the lowest
(61.1%) among the south Indian states especially the female literacy rate (51 %).
Again, infant mortality rate (66) is also high as compared to southern states. Maternal
mortality rate is less when compared to Kerala and Karnataka states.
Social Sector Expenditure
When we look at the social sector expenditure as a percentage of GSDP it has fallen
from 7.5 to 6.9 during 1980-81 to 2000-01. Again, within social sector the social
Economic Reforms and Social Policy
| 152
services expenditure also declined from 6.4 to 6 during the period under consideration.
While looking at the social sector expenditure as percentage of total public expenditure
it is obvious that it has come down from 43.8 to 35.7. Further, social services
expenditure as percentage of total public expenditure has also shown a decline from
37.4 to 32 per cent. Similarly, the expenditure on rural development has fallen from
6.4 to 3.6 per cent during the period consideration. While corroborating the above
trend a. study by NIPFP1, has noted that the aggregate government expenditures
allocated to poverty-oriented programmes during the years 2000 01and 2001-02 has
shown a constant percentage (around 23 per cent) whereas in the latter years (2002-
03 and 2003-04) it has risen a little though the actual figures may well be lower.
All this explains that the importance accorded to social services in the budget
allocations over a period has come down drastically. In fact, non-income poverty
aspects like health, education and drinking water and other services are essential in
our country as the expenditure on these items. is increasing to the households in rural
areas and pushing them into poverty is revealed in many studies. Hence, it is
appropriate not to neglect these sectors while budget allocations are made in the state.
Another important point is that though other sectors are given high priority based on
their need the relative shares of social services in the overall budget should go up from
year to year as it has a positive impact on the future generations. This is where exactly
the states like Punjab and Tamilnadu have made rapid strides with their conscious
efforts in the budget allocations.
Conclusions & Recommendations
From the foregoing analysis it is revealed that the share of social services in the budget
is decreasing from year to year. The composition of capital expenditure is in favor of
economic services followed by general and social services. From this it can be inferred
that though economic reforms are implemented in the nineties the social services have
been neglected. For instance, education under social services category has been
ignored continuously in so far as capital expenditure is concerned. Similar is the case
of health and family welfare apart from 1999-2000 during which 3.02 per cent of total
capital expenditure is noticed. The implications are such that the social services may
not be available to the increasing population and leading to deterioration in the quality
of service.
Economic Reforms and Social Policy
| 153
An analysis of revenue expenditure over a period of six y:ars revealed that the
development expenditure has come down while non-development expenditure has
gone up due to debt services, which has increased from 17.53 per cent to 21.87 per
cent. It indicates that the debt service has taken away the major chunk of resources
hither to spent for development. Therefore, this would have a negative impact on the
development of the economy in the long run in so far as reduced development
expenditure is concerned.
As regards the human development index for India (combined rural and urban)
and different states, it revealed that the rank of AP has fallen from 8 to 10 during 1981
2001. It shows that there is a decline in the expenditure on social services and the
concomitant fall in the quality of services. Similarly, when we look at the indicators of
human development the state of Andhra Pradesh is discouraging, and it is lagging
other southern states.
Therefore, we recommend that the social services such as education, health and
drinking water should get relatively higher. allocations in the budget without obstructing
the prospects of future generations. If there are compulsions on the part of state
government in the budget allocations they should explore other sources of -
mobilization, which is not-a-burden on the people, rather-than-hampering the
improvement of social services.
Another pertinent point is that though other sectors are given high priority based
on their need, the relative shares of social services in the overall budget should not
decrease rather they should go up from year to year as it has a positive impact on the
lives of future generations.
Notes
1. The expenditure on social services as a ratio of GSDP during 2000-01 to 2003-04
revealed that the revenue expenditure was predominant, and the total expenditure
was constant. Again, within it, the expenditure on poverty reduction programs was the
highest.
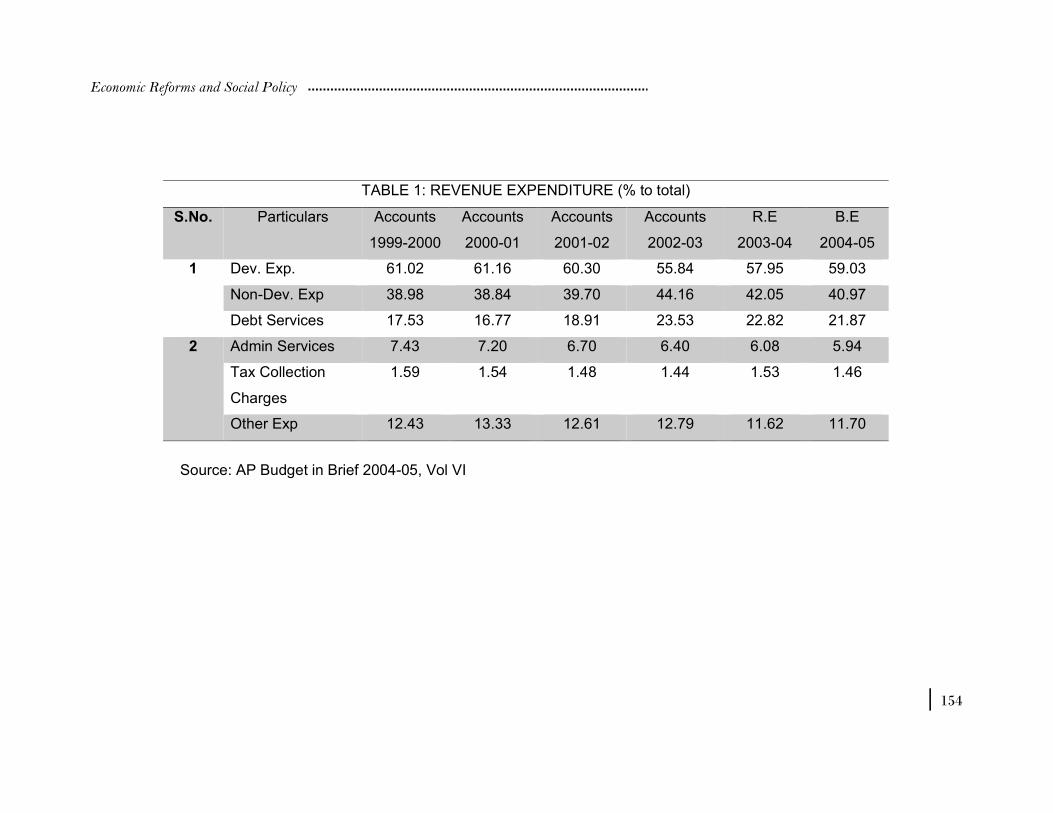
Economic Reforms and Social Policy
| 154
Source: AP Budget in Brief 2004-05, Vol VI
TABLE 1: REVENUE EXPENDITURE (% to total)
S.No. Particulars Accounts
1999-2000
Accounts
2000-01
Accounts
2001-02
Accounts
2002-03
R.E
2003-04
B.E
2004-05
1 Dev. Exp. 61.02 61.16 60.30 55.84 57.95 59.03
Non-Dev. Exp 38.98 38.84 39.70 44.16 42.05 40.97
Debt Services 17.53 16.77 18.91 23.53 22.82 21.87
2 Admin Services 7.43 7.20 6.70 6.40 6.08 5.94
Tax Collection
Charges
1.59 1.54 1.48 1.44 1.53 1.46
Other Exp 12.43 13.33 12.61 12.79 11.62 11.70
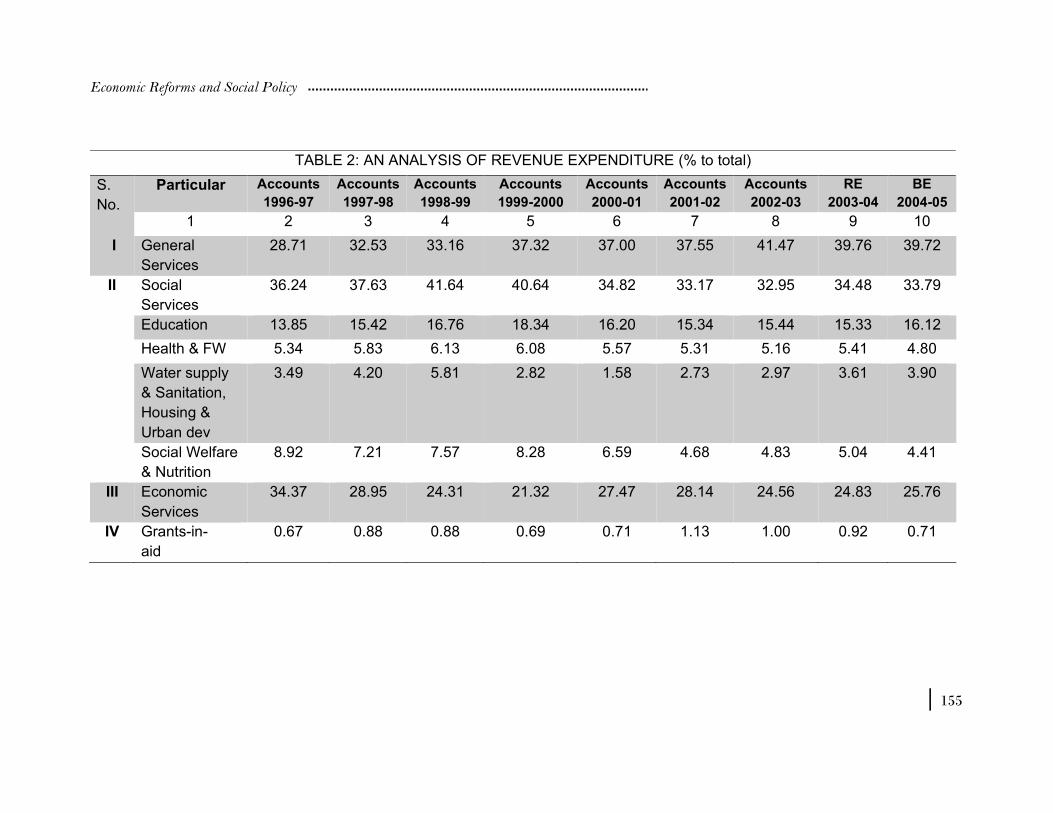
Economic Reforms and Social Policy
| 155
TABLE 2: AN ANALYSIS OF REVENUE EXPENDITURE (% to total)
S.
No.
Particular Accounts
1996-97
Accounts
1997-98
Accounts
1998-99
Accounts
1999-2000
Accounts
2000-01
Accounts
2001-02
Accounts
2002-03
RE
2003-04
BE
2004-05
1 2 3 4 5 6 7 8 9 10
I General
Services
28.71 32.53 33.16 37.32 37.00 37.55 41.47 39.76 39.72
II Social
Services
36.24 37.63 41.64 40.64 34.82 33.17 32.95 34.48 33.79
Education 13.85 15.42 16.76 18.34 16.20 15.34 15.44 15.33 16.12
Health & FW 5.34 5.83 6.13 6.08 5.57 5.31 5.16 5.41 4.80
Water supply
& Sanitation,
Housing &
Urban dev
3.49 4.20 5.81 2.82 1.58 2.73 2.97 3.61 3.90
Social Welfare
& Nutrition
8.92 7.21 7.57 8.28 6.59 4.68 4.83 5.04 4.41
III Economic
Services
34.37 28.95 24.31 21.32 27.47 28.14 24.56 24.83 25.76
IV Grants-in-
aid
0.67 0.88 0.88 0.69 0.71 1.13 1.00 0.92 0.71
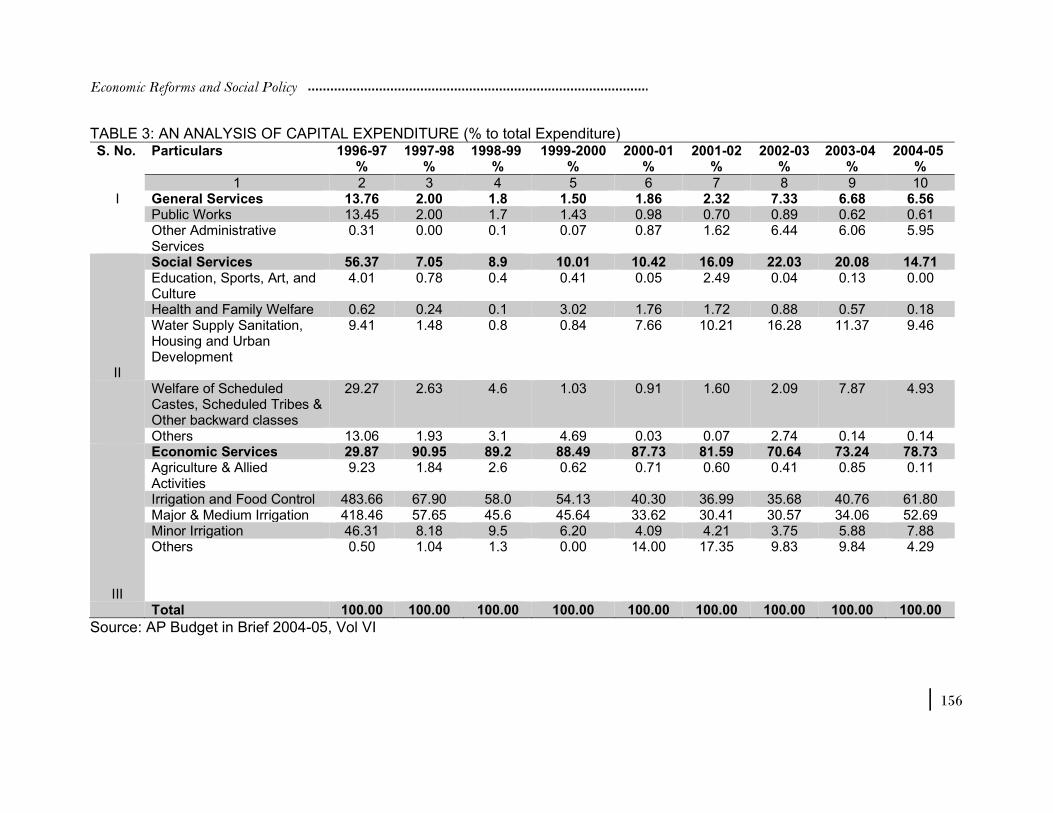
Economic Reforms and Social Policy
| 156
TABLE 3: AN ANALYSIS OF CAPITAL EXPENDITURE (% to total Expenditure) S. No. Particulars 1996-97
% 1997-98
% 1998-99
% 1999-2000
% 2000-01
% 2001-02
% 2002-03
% 2003-04
% 2004-05
%
1 2 3 4 5 6 7 8 9 10 I General Services 13.76 2.00 1.8 1.50 1.86 2.32 7.33 6.68 6.56
Public Works 13.45 2.00 1.7 1.43 0.98 0.70 0.89 0.62 0.61 Other Administrative Services
0.31 0.00 0.1 0.07 0.87 1.62 6.44 6.06 5.95
II
Social Services 56.37 7.05 8.9 10.01 10.42 16.09 22.03 20.08 14.71 Education, Sports, Art, and Culture
4.01 0.78 0.4 0.41 0.05 2.49 0.04 0.13 0.00
Health and Family Welfare 0.62 0.24 0.1 3.02 1.76 1.72 0.88 0.57 0.18 Water Supply Sanitation, Housing and Urban Development
9.41 1.48 0.8 0.84 7.66 10.21 16.28 11.37 9.46
Welfare of Scheduled Castes, Scheduled Tribes & Other backward classes
29.27 2.63 4.6 1.03 0.91 1.60 2.09 7.87 4.93
Others 13.06 1.93 3.1 4.69 0.03 0.07 2.74 0.14 0.14
III
Economic Services 29.87 90.95 89.2 88.49 87.73 81.59 70.64 73.24 78.73 Agriculture & Allied Activities
9.23 1.84 2.6 0.62 0.71 0.60 0.41 0.85 0.11
Irrigation and Food Control 483.66 67.90 58.0 54.13 40.30 36.99 35.68 40.76 61.80 Major & Medium Irrigation 418.46 57.65 45.6 45.64 33.62 30.41 30.57 34.06 52.69 Minor Irrigation 46.31 8.18 9.5 6.20 4.09 4.21 3.75 5.88 7.88 Others 0.50 1.04 1.3 0.00 14.00 17.35 9.83 9.84 4.29
Total 100.00 100.00 100.00 100.00 100.00 100.00 100.00 100.00 100.00
Source: AP Budget in Brief 2004-05, Vol VI
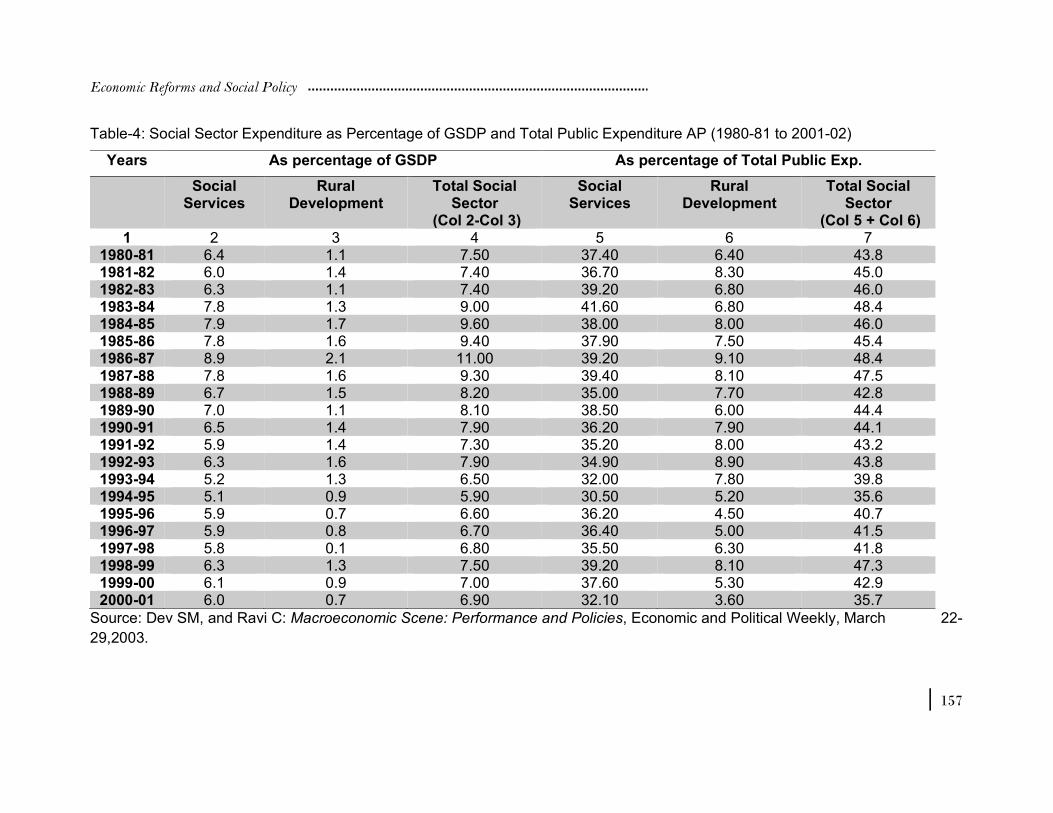
Economic Reforms and Social Policy
| 157
Table-4: Social Sector Expenditure as Percentage of GSDP and Total Public Expenditure AP (1980-81 to 2001-02)
Years As percentage of GSDP As percentage of Total Public Exp.
Social Services
Rural Development
Total Social Sector
(Col 2-Col 3)
Social Services
Rural Development
Total Social Sector
(Col 5 + Col 6) 1 2 3 4 5 6 7
1980-81 6.4 1.1 7.50 37.40 6.40 43.8 1981-82 6.0 1.4 7.40 36.70 8.30 45.0 1982-83 6.3 1.1 7.40 39.20 6.80 46.0 1983-84 7.8 1.3 9.00 41.60 6.80 48.4 1984-85 7.9 1.7 9.60 38.00 8.00 46.0 1985-86 7.8 1.6 9.40 37.90 7.50 45.4 1986-87 8.9 2.1 11.00 39.20 9.10 48.4 1987-88 7.8 1.6 9.30 39.40 8.10 47.5 1988-89 6.7 1.5 8.20 35.00 7.70 42.8 1989-90 7.0 1.1 8.10 38.50 6.00 44.4 1990-91 6.5 1.4 7.90 36.20 7.90 44.1 1991-92 5.9 1.4 7.30 35.20 8.00 43.2 1992-93 6.3 1.6 7.90 34.90 8.90 43.8 1993-94 5.2 1.3 6.50 32.00 7.80 39.8 1994-95 5.1 0.9 5.90 30.50 5.20 35.6 1995-96 5.9 0.7 6.60 36.20 4.50 40.7 1996-97 5.9 0.8 6.70 36.40 5.00 41.5 1997-98 5.8 0.1 6.80 35.50 6.30 41.8 1998-99 6.3 1.3 7.50 39.20 8.10 47.3 1999-00 6.1 0.9 7.00 37.60 5.30 42.9 2000-01 6.0 0.7 6.90 32.10 3.60 35.7
Source: Dev SM, and Ravi C: Macroeconomic Scene: Performance and Policies, Economic and Political Weekly, March 22-
29,2003.
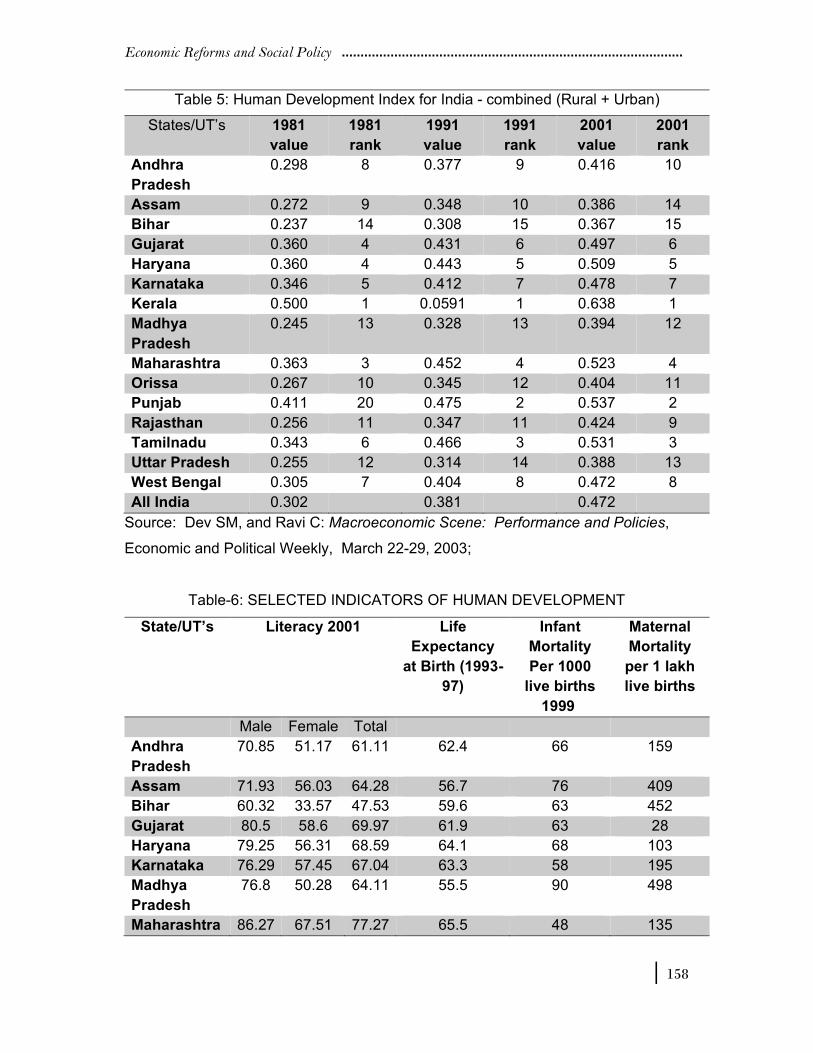
Economic Reforms and Social Policy
| 158
Table 5: Human Development Index for India - combined (Rural + Urban)
States/UT’s 1981
value
1981
rank
1991
value
1991
rank
2001
value
2001
rank
Andhra
Pradesh
0.298 8 0.377 9 0.416 10
Assam 0.272 9 0.348 10 0.386 14
Bihar 0.237 14 0.308 15 0.367 15
Gujarat 0.360 4 0.431 6 0.497 6
Haryana 0.360 4 0.443 5 0.509 5
Karnataka 0.346 5 0.412 7 0.478 7
Kerala 0.500 1 0.0591 1 0.638 1
Madhya
Pradesh
0.245 13 0.328 13 0.394 12
Maharashtra 0.363 3 0.452 4 0.523 4
Orissa 0.267 10 0.345 12 0.404 11
Punjab 0.411 20 0.475 2 0.537 2
Rajasthan 0.256 11 0.347 11 0.424 9
Tamilnadu 0.343 6 0.466 3 0.531 3
Uttar Pradesh 0.255 12 0.314 14 0.388 13
West Bengal 0.305 7 0.404 8 0.472 8
All India 0.302
0.381
0.472
Source: Dev SM, and Ravi C: Macroeconomic Scene: Performance and Policies,
Economic and Political Weekly, March 22-29, 2003;
Table-6: SELECTED INDICATORS OF HUMAN DEVELOPMENT
State/UT’s Literacy 2001 Life
Expectancy
at Birth (1993-
97)
Infant
Mortality
Per 1000
live births
1999
Maternal
Mortality
per 1 lakh
live births
Male Female Total
Andhra
Pradesh
70.85 51.17 61.11 62.4 66 159
Assam 71.93 56.03 64.28 56.7 76 409
Bihar 60.32 33.57 47.53 59.6 63 452
Gujarat 80.5 58.6 69.97 61.9 63 28
Haryana 79.25 56.31 68.59 64.1 68 103
Karnataka 76.29 57.45 67.04 63.3 58 195
Madhya
Pradesh
76.8 50.28 64.11 55.5 90 498
Maharashtra 86.27 67.51 77.27 65.5 48 135
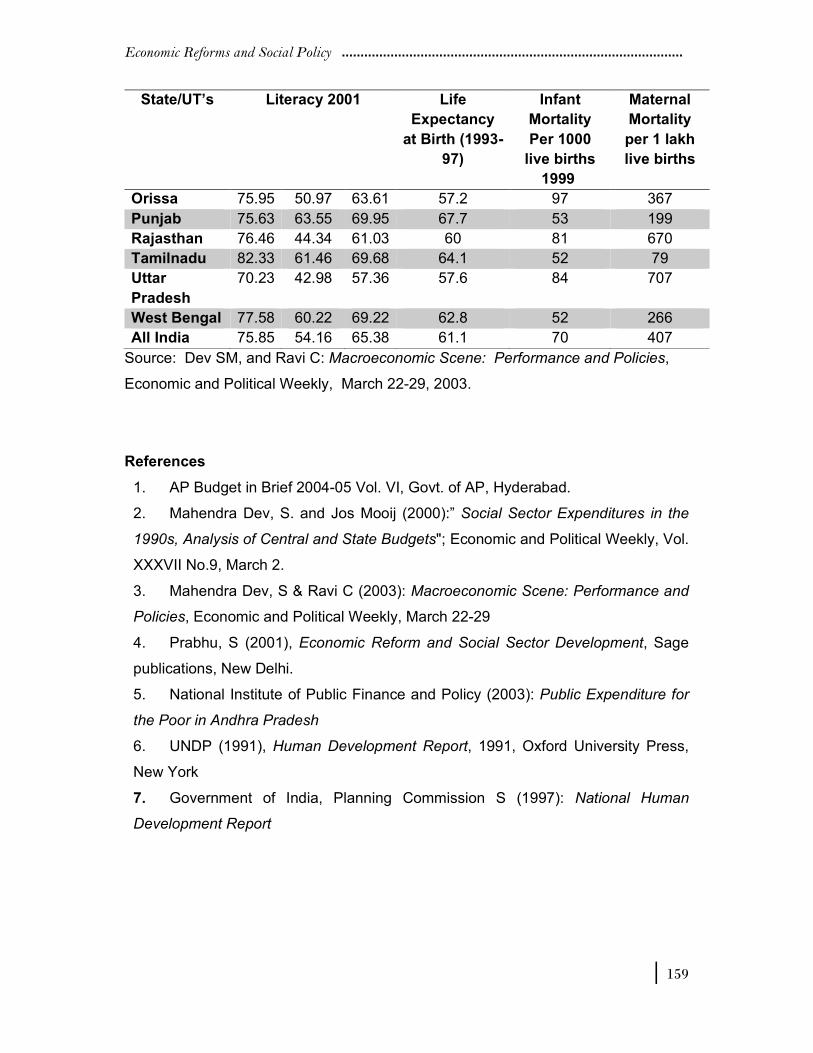
Economic Reforms and Social Policy
| 159
State/UT’s Literacy 2001 Life
Expectancy
at Birth (1993-
97)
Infant
Mortality
Per 1000
live births
1999
Maternal
Mortality
per 1 lakh
live births
Orissa 75.95 50.97 63.61 57.2 97 367
Punjab 75.63 63.55 69.95 67.7 53 199
Rajasthan 76.46 44.34 61.03 60 81 670
Tamilnadu 82.33 61.46 69.68 64.1 52 79
Uttar
Pradesh
70.23 42.98 57.36 57.6 84 707
West Bengal 77.58 60.22 69.22 62.8 52 266
All India 75.85 54.16 65.38 61.1 70 407
Source: Dev SM, and Ravi C: Macroeconomic Scene: Performance and Policies,
Economic and Political Weekly, March 22-29, 2003.
References
1. AP Budget in Brief 2004-05 Vol. VI, Govt. of AP, Hyderabad.
2. Mahendra Dev, S. and Jos Mooij (2000):” Social Sector Expenditures in the
1990s, Analysis of Central and State Budgets"; Economic and Political Weekly, Vol.
XXXVII No.9, March 2.
3. Mahendra Dev, S & Ravi C (2003): Macroeconomic Scene: Performance and
Policies, Economic and Political Weekly, March 22-29
4. Prabhu, S (2001), Economic Reform and Social Sector Development, Sage
publications, New Delhi.
5. National Institute of Public Finance and Policy (2003): Public Expenditure for
the Poor in Andhra Pradesh
6. UNDP (1991), Human Development Report, 1991, Oxford University Press,
New York
7. Government of India, Planning Commission S (1997): National Human
Development Report
Economic Reforms and Social Policy
| 160
ECONOMIC REFORMS AND PRIMARY HEALTH CARE SERVICES
Dr. V.V.S.K. Prasad
Department of Management Studies, The Hindu College, Machilipatnam
Health is an essential input for the development of the human resources and the
quality of life. A positive health status is defined as a state of complete physical, mental
and social well-being and not merely the absence of disease or infirmity' (WHO, 1946).
Health is regarded a priority for sustained development interventions at the individual,
community, and national levels. Improved health is a part of total socio-economic
development and is regarded as an index of social development. Therefore, the
primary goal of any health care delivery system is to organize the health services in
such a manner as to optimally utilize the available resources, knowledge and
technology, with a view to preventing and alleviating diseases, disabilities and
sufferings of the people. The present paper aims at examining the impact of the
economic reforms on health care services.
Primary Health Care
Primary Health Care is defined as 'essential healthcare and universally accessible to
all citizens and acceptable to them through their full participation and at a cost that the
community and country can afford' (WHO, 1978). It addresses the main health
problems in the community through preventive, curative, promotive and rehabilitative
medical and health services. Thus, the delivery of primary health care is the foundation
of rural health care system and forms an integral part of the National Health System.
The primacy accorded to primary health care reflects the essence of rural health care
system. India is one of the very few countries that had, from the very beginning,
planned health services as an integral part of general socio- economic development
and health was made a part of it.
With the announcement of the new program of reproductive and child health
(RCH), 1997 and the National Population Policy (2000),the local bodies or local self-
governments are going to be involved in the process of their implementation. The
Gram Sabha should be used to raise awareness levels of the people on crucial issues
of heath. It is expected that local self-governments will provide a better set of
administrative arrangements for the implementation of these policies as well as further
streamlining the health delivery system.
Economic Reforms and Social Policy
| 161
Achievements and Limitations
Undoubtedly, the Indian health services infrastructure and its physical spread is one
of the largest in the world. Marked improvements have been brought about in several
areas of health care. The Infant Mortality Rate has fallen considerably thought it is still
high. The rates of maternal and child mortality, owing to diseases and malnutrition,
have been declining due to better medical care and improvements in economic
conditions. Life Expectancy has more than doubled since independence. Above all,
the general health awareness among people has gone up significantly. Perhaps the
most impressive achievement is the widely spread public sector health infrastructure.
Among the major achievements of the country, the important ones are: I) the
declining trend in vaccine preventable disorders due to improvement in immunization
coverage and II) efforts are being made for eradication of poliomyelitis through
country-wide Public Polio Immunization Programs. Guinea worm disease is on the
verge of eradication.
Meagre per capita expenditure on health
The current annual per capita public health expenditure in the country is no more
than Rs.200. It is no surprise that the reach and quality of public health services has
been below the desirable standard. Under the constitutional structure, public health is
the responsibility of the states. In this framework, it has been the expectation that the
principal contribution for the funding of public health resources will be from the
resources of the states, with some supplementary input from Central resources,
The policy focuses on building up credibility for the alternative systems, by
encouraging evidence based research to determine their efficacy, safety and dosage
and also encouraging certification and quality-marking of products to enable wider
popular acceptance of these systems of medicine. The policy also envisages the
consolidation of documentary knowledge contained in these systems to protect it
against attack from foreign commercial entities by way of malafide action under patent
laws of other countries.
The problems of health care are enormous. Access to primary health care is
inadequate to the majority of the. people because of low availability of basic preventive
and promotive health care packages, clinics, doctors, drugs, and para-medical
personnel in rural areas. Greater stress on preventive health care, medicine and health
education should be laid. Health literacy efforts should be made integral to preventive,
Economic Reforms and Social Policy
| 162
promotive, curative, and rehabilitative health care. A meaningful involvement of the
private sector and NGOs is critical in all these endeavours for promoting a people
oriented and a sustainable health care system.
Still, many major diseases which were believed to have been brought under control
are resurging with deadly consequences. Thus, there is a resurgence of epidemics,
some old and others New. Malaria was thought to have been eradicated but is back
again. tuberculosis and leprosy were said to be under control but are as common today
as ever.
Plague was struck in Surat in claiming a heavy toll of lives perennially. Apart
from the traditional diseases of poverty, newer life-style related problems are posing
serious threats to public health. For example, ICMR estimates that there are 1.5
million: new cancer cases every year in India, 4.5 to 5.0 million cases at any given
time and 35 per cent of all cancer cases in the country are due to bad lifestyles. The
threats from drug addition, AIDS, Hepatitis B; Dengue etc. are becoming too real
(VHAI Health Status of India Document, 1995).
Poor Quality of Service
A vast network of rural health institutions has been developed. Rapid expansion has,
however, resulted in a considerable drop in the quality of functioning of health
institutions. For several reasons, the quality of services and work done by various
health institutions and by different categories of health personnel are poor, resulting in
low credibility among the rural community. Although slow and not necessarily
deliberate, the process of decentralization of rural health care started since
independence with the establishment of Sub-Centres and dispensaries in villages. The
current pattern of government of India norm provides one Sub-Centre for 3,000 to
5,000 population, one Primary Health Centre for 20,000 to 30,000 population and one
community Health Centre with 30 beds per one lakh population.
Unfortunately, the state governments have failed to decentralize authority and
resources. In most states, this decentralized infrastructure is directly managed by the
State Health Directorates. Despite a tremendous expansion of rural health
infrastructure, we are yet to reach all the 'have-nots' and the under-privileged. The
facilities and quality of service are poor. Supervision and support to the field staff are
missing. Hence, even the poorest of the people are not satisfied with state health care
and that is why they go to private practitioners. The rural health care facilities remain
Economic Reforms and Social Policy
| 163
underutilized and the credibility of the state health services and hospitals is low.
Policy Promises
The National Health policy announced recently-aims at reviving the ailing health
system and increasing the primary health sector outlay to ensure a more equitable
access to health services across the social and geographical expanse of the country.
The government plans to increase its contribution to the health sector from 0.9 per
cent of the 'GDP at present to 2 per cent over the next eight years. By 2010, the policy
envisages an increase in aggregate expenditure on the health sector from 5.2 per cent
to 6 per cent. It has also been recommended to the states to increase expenditure
from 5.5 per cent to 7 per cent of their budget by 2005 and further to 8 per cent by
2010.
According to NHP, 55 per cent of the outlay would be for the primary sector and
35 per cent and 10 per cent for the. secondary and tertiary sectors, respectively. For
improvement of the public health infrastructure, it suggests revival of the primary
health system by providing essential drugs; levying of user charges for certain
secondary and tertiary public health care services for those who can afford to pay,
expanding the pool of medical practitioners and simplification of the recruitment
procedures for contract employment.
For funding and upgrading existing government medical and dental colleges, it
has suggested setting up of a Medical Grants Commission. Even the curriculum
should be modified to make it more need-based, the policy has stressed. It has also
suggested specialization in public health, which has been a neglected area, both for
medical doctors and non-medical graduates from allied fields.
Organization of health services has become complex, centralized, and
insensitive to the varying health felt needs. of the rural community. It is suggested that
Organizational set-up of health services needs reorganization. While the health
organization has grown tremendously in the past five decades, functionally the
structure has not changed with the dynamic and divergent demands of effective health
management, The middle-level management is weak because of the low and health
management and inadequate decentralization of authority and resources allocation.
The most important problem is the maldistribution of the health manpower/health
human resources, both geographically and category-wise. Both technical knowledge
Economic Reforms and Social Policy
| 164
and skills and motivation to serve the rural people fall short of requirements and
expectations.
Conclusions
Communicable diseases such as malaria, tuberculosis, leprosy are likely to continue
to pose challenges to the country in the coming years. Non communicable diseases
will become a major public health problem in the country due to changes in lifestyle,
Increasing stress and tensions due to changes in social and cultural systems in the
society. With increase in the number of aged people, there will be higher incidence
and prevalence of diseases like hypertension, diabetes, cancer, and the whole range
of geriatrics problems. Equitable distribution of rural health care services for ensuring
verity for health care should be ensured by the government. Location of health
services and facilities should be such that these are easily accessible and available to
the rural community.
Greater importance is laid to the introduction of Multipurpose Workers (MPWS)
Scheme, the Integrated Child Development Services (ICDS) and Reproductive and
Child Health (RCH) Programme which have brought a new ray of hope to the rural
community and the expectations of the rural people have increased leading to more
demands for, institutionalized health care services.
In view of the experiences and difficulties faced in the provision of rural health
services, it has been realized that acceleration of the pace of implementation of rural
health programs is an urgent imperative and concerted efforts need to be made by the
State and Central Governments. Further, substantially large financial investments
need to be made for rapidly improving the health profile of the country. For making
rural health care services more meaningful to the rural community, it is needed to bring
about fundamental changes in the focus and approach to the entire health care
delivery system in general and rural health care, in particular. .
As regards the impact of globalization on the health sector, the policy admits
that there are some apprehensions about the possible adverse impact of economic
globalization on the health sector. Pharmaceutical drugs and other health services
have always been available in the country at extremely: inexpensive prices. India has
established a reputation around the globe for the innovative development of original
process patents for the manufacture of wide range of drugs and vaccines within the
Economic Reforms and Social Policy
| 165
ambit of the existing patent laws. As a result of the process economic reforms
privatization of health services is recommended but privatization bound to affect
adversely the maintaining cost of health services of the poor. The cost of medicines
has been rising under the new economic reforms.
In this context, the policy merely states that it will address itself to the future
imperatives of health security in the country, in the post-TRIPS era. However, it does
not articulate any mechanism to regulate the exorbitant drug prices and ever-
increasing cost of health services to provide relief to the poor and vulnerable. Already,
prices of various essential drugs and formulations have gone up. This is the biggest
challenge for the successful implementation of the new health policy .
References:
1. Deodhar, N. S. (1999) : Rural Health Policy and Management Perspectives. In
Basic Rural Infrastructure and Services for Improved Quality of Life (ed.) R. C.
Choudhury & P. Durga prasad, NIRD, Hyderabad, pp. 296
2. Government of India ( 2001), National Health Policy.
3. Sushma Chandra(2002), New Health Policy focuses on Primary Sector,
Yojana July, P.25
Economic Reforms and Social Policy
| 166
SOCIAL POLICY AND RETREATING STATE IN THE ERA OF DEREGULATION
Dr. B. Sarangapani
Reader and Head, Post Graduate Department of Economics, The Hindu College,
Machilipatnam.
Indian Constitution envisaged a pro-active role for the state. The Indian state is
supposed to transform the existing order and bring about a qualitative change in the
caste, gender, and other social relationships besides economic and industrial
development. The Directive Principles are a ready reference for formulating and
implementing social policy. The Directive Policies largely guided the contours of social
Policy up to 1991. With the introduction of economic reforms, the state began
retreating from the economic as well as the social sectors.
The target group approach taking the vulnerability of socio- economic groups
as the defining factor for public policy formulation during the early 70s is a significant
development in the evolution of social policy. However, all this changed with
globalization. The Neo- Liberal model adapted excluded the groups included in the
target group approach and offered ideological justification for the exclusion. The
transition of the India state from a pro-active interventionist state to that of a retreating
state with a minimal role in socio economic progress has hit the entire terrain of social
policy.
Social policy incorporates explicit value judgments of the society. The efficiency
of the State must also be measured in terms of achievement of both social and
economic objectives. The role of state will be crucial in providing necessary nationalist
backing during the process of globalization. The regulative tasks of the government
include not only keeping the market in its place but also increasing the domain of rights
of the people both implicitly and explicitly. This must be the guiding force behind any
social policy formulation.
Experience with Economic Reforms in Andhra Pradesh
Four important methods have been identified for studying the impact of reforms. These
are - a) Comparison before and after the implementation of reforms. b) Comparing the
group under treatment with controlled group which is like the treatment group. c)
Comparison of differences observed between before the situation and after the
situation in the treatment group with changes that are observed in the controlled group
Economic Reforms and Social Policy
| 167
during the same period and d) SWOT Analysis with simulation exercises.
Experience and evidence presented suggested that AP Economic
Restructuring project undertaken with the help of the World Bank was poorly
formulated. While the major goal was to enhance the GDP, the results achieved are
negative in effect. All the sectors except the tertiary sector experienced steep
deceleration in the post reform period. Major Fiscal indicators such as Fiscal deficit,
Revenue deficit, Public Debt, debt servicing charges etc., increased steeply in the post
reform period. The capital expenditures fell sharply and budgetary allocations to the
social sectors declined significantly in the post reform period. Employment
opportunities dwindled and reforms put enormous strain on the state economy.
The Agricultural sector of AP turned around from an accelerated growth in the
80s to the deceleration in the 90s. The yields of major agricultural crops are below the
levels attained in other states in the country. The decline in surface irrigation and steep
increase in ground water irrigation resulted in unsustainable agriculture. The growth
of public investment declined significantly between 80s and 90s. Various factors have
been identified for the growing number of suicides of farmers in the state – high
investment in bore wells with a high failure rate, use of spurious pesticides and seeds,
high cost of cultivation, exploitation through interlinked markets, failure of the
organized credit markets to meet the credit requirements of the farmers, failure of the
regulatory authorities etc.
Though there are repeated lofty policy announcements like ‘health for all' and
'education for all’, the budgetary allocations and performance are not commensurate
with the goals. On the Human Development front, the state has slipped down between
1991 and 2001. It has been pointed out that about 14 districts in the state are found
below the state average pertaining to the Doctor-Population ratio. Beds-Population
ratio is also below the state average in about 16 districts. Hospital-Population ratio is
below the state average in 9 districts. Several districts in the state are found in a
pathetic situation in terms of medical facilities offered by the public sector. The
expenditure on public health services is on the decline. It was pointed out that the
corporate sector almost exclusively concentrated on heart diseases rather than on
infectious diseases.
Literacy rate in A.P. has been much below the All India average during the last
four decades. In Rural A.P. there are 731 households for every 1000 households
Economic Reforms and Social Policy
| 168
without female literate and 465 households without any literate in the family. As per
2001 census, A.P. occupies the 28th position among the 35 states and union
territories. Its growth in literacy rate was slightly better than that of Bihar, U.P, and
Rajasthan but lower than that of Arunachal Pradesh and Madhya Pradesh among the
low literacy states.
Macro Reforms affecting Heath and Education.
Some of reforms introduced at the national level are affecting social sectors such as
heath, and education. It is feared that the recent amendment to the Indian Patent Act,
1970 introducing product patenting in the place of process patenting may likely to
increase the prices of drugs and the domination of multinational corporations in the
pharma sector. Prior to 1970, when India had product patent regime for drug industry,
the domestic pharma market was dominated by the foreign companies. After 1970,
during the process patenting regime, the Indian companies could increase their share
to 65 percent. Again with product patent regime, the domination of foreign companies
may increase and the prices of drugs used for diseases like diabetes, asthma,
hypertension, coronary heart diseases, depression, cancer, HIV/AIDS, arthritis, and
respiratory and urinary tract infections will raise abnormally. This will have adverse
consequences for the poor.
India is likely to be a net looser because of internationalization of education.
Domestic and equity considerations so far guided the Indian higher education. Quality
and efficiency considerations received scant attention. Five levels of education -
primary, secondary, higher, adult, and other education have been identified for GATS.
The first two are still restricted to domestic providers. WTO has identified four modes
of trade in the other three levels of education - (1) Cross border supply (distance mode)
(2) Consumption abroad (3) Commercial presence and (4) Presence of natural
persons. Each of these modes have different implications for India. Internationally
education is a trillion-dollar industry and India are losing considerably because of
excess demand for quality education which is mostly satisfied by excess capacity in
USA.
Food Security to the poor
Basically, food security implies that the entire population in a community has “Access
to enough food at all times for leading an active and healthy life” (World Bank: 1986).
Food security according to FAO, also implies “Ensuring that all people at all times have
Economic Reforms and Social Policy
| 169
both physical and economic access to basic food they need”. India is often cited as a
land of paradoxes. This is certainly true when it comes to food security. Despite a
decline in poverty, close to 30 percent of its people are food insecure and one-half of
its children malnourished in one-way or another. And yet the country has a stock of
more than 60 million tons of food grains stored through Government's procurement
increased food prices, shrinkage of area under food grains and escalating food
subsidy are now the major concerns with regard to food security, rather than freedom
from hunger. Food security has several dimensions that go beyond supply and
demand. Ultimately, the key question is that of the ability to access and effectively
utilize food by all people, always to lead a health life .However, the physical and
economical access to basic food decreased during the post reform period. Providing
food security is important in India where more than one fourth of the population is
estimated to be poor and one half of all children are malnourished in one way or
another.
Social Sector Expenditure
When we look at the social sector expenditure as a percentage of GSDP in Andhra
Pradesh, it has fallen from 7.5 to 6.9 during 1980-81 to 2000-01. Again, within social
sector the social services expenditure also declined from 6.4 to 6 in the post-reform
period. While looking at the social sector expenditure as percentage of total public
expenditure, it has come down from 43.8 to 35.7. Further, social services expenditure
as percentage of total public expenditure has also shown a decline from 37.4 to 32 per
cent. Similarly, the expenditure on rural development has fallen from 6.4 to 3.6 per
cent during the period consideration. The aggregate government expenditures
allocated to poverty-oriented programmes during the years 2000 01and 2001-02 has
shown a constant percentage (around 23 per cent) whereas in the latter years (2002-
03 and 2003-04) it has risen a little though the actual figures may well be lower.
All this explains that the importance accorded to social services in the budget
allocations over a period has come down drastically. In fact, non-income poverty
aspects like health, education and drinking water and other services are essential in
our country as the expenditure on these items. is increasing to the households in rural
areas and pushing them into poverty is revealed in many studies. Hence, it is
appropriate not to neglect these sectors while budget allocations are made in the state.
Another important point is that though other sectors are given high priority based on
Economic Reforms and Social Policy
| 170
their need, the relative shares of social services in the overall budget should go up
from year to year as it has a positive impact on the future generations.
Improving Quality of Expenditure on Social Sector
The quality of expenditure on social sector is as important as quantity of expenditure.
The Comptroller and Auditor General in its report for 2000 has critically examined the
working of the four major schemes -- PDS, Employment Guarantee Program,
Integrated Child Development Services, Nutritional Support to Primary Education.
According to that report, in the six years ending March 1999, the Union Treasury spent
Rs.830 billion on these four schemes - A daily average spending of 30 127 crores. Yet
the effect was zero - GILCH (nothing). According to the CAG, the money leaks entirely
to those it is not meant for.
Traditional Government with its vertical framework and large bureaucracies is
unable to adapt to fast changing economic social and cultural contexts. Hence,
institutional reforms towards enhancing policy capacity and policy implementation are
needed. Creating a Government that works better and costs less is the need of the
hour. Effective government is a prerequisite of social and economic growth. The
cardinal difference between government and business or non-profit organizations is
democratic accountability. Government is the only institution which is answerable to
the people at large. A strong, effective, truly performing government is needed in the
present times of 'Darwinian Capitalism'.
The state has a key role in accelerating human development and in providing
social security to the vulnerable. The Government at the state level are closer to the
people and reforms at that level can have greater effect on the people. The
responsibility of social services lies with the state and local governments. The quality
of delivery of social services depends upon the quality of Governance at the state and
local levels. Hence governance reforms at the state and local levels for better delivery
of public services with greater accountability to the people becomes is important from
the social policy perspective.
A public debate must precede whenever Government contemplates major
changes in social policy effecting millions of people. In this context it is felt that the
election manifestos of political parties must be given a legal status to avoid the “stealth
character of any major changes”. Liberalization before safety nets were put in place,
privatization without adequate regulation and down- sizing public enterprises before
Economic Reforms and Social Policy
| 171
employment opportunities were created in the private sector have adverse
consequences for the poor and the unorganized. The uneducated, semiskilled and
unskilled workers and those dependent on public services, small firms, producers of
primary products, firms without much market access and no branding, producers and
sellers who operate in the local market are severely hurt because of the reforms.
Economic Reforms and Social Policy
| 172
REFORMS AND EXPENDITURE ON SOCIAL SECTOR IN ANDHRA PRADESH
Prof. M. L. Kantha Rao,
Former Professor of Economics, SKD University, Anantapur
States in India play a key role in devising and implementing policies to reduce poverty,
promote human development, and stimulate growth. Under India's Constitution, they
are assigned significant responsibilities in major sectors such as agriculture, industry,
infrastructure, education, health, social welfare, and tax and expenditure policy at the
state-level. The budgets are also used for eliminating the regional imbalances and
improving the overall human development index, which is the weighted average index
of more than 70 parameters that define the well- being of the people.
Fifty years after independence, India remains home to about a third of the
world's poorest people. India has eliminated famines which were common earlier;
economic growth has substantially exceeded the rate of population growth and since
the 1970s there has been significant reduction in the proportion of people whose
incomes are below the poverty line.
There has also been progress towards human development objectives (such
as increasing literacy and reducing infant mortality). Yet India is far from where it could
have been. The absolute number of poor has not decreased. One of every three
persons in India was poor, and two of every three were undernourished or mal
nourished. The large sums invested in public anti -poverty programmes tend to focus
on poorly targeted subsidies and safety nets rather than long term investments in
education and health.
President A PJ Abdul Kalam said that to meet the challenge of uplifting 260
million. people living below the poverty line, there is need for the economy to grow at
the rate of 10 per cent per annum consistently for over a decade. Delivering the first
Professor Manohar Lal Sundhi lecture in New Delhi, he said, "Our nation is going
through a major challenge of uplifting 260 million who are below the poverty line. They
need habitat, they need food, health care and they need education and employment,
finally resulting in better life." In this context let us examine the trends in social sector
expenditure and its impact thereof. Social sector expenditure includes social services,
rural development and food storage and warehousing.
The states' increasingly large deficits mean their fiscal policy is an important
Economic Reforms and Social Policy
| 173
factor not only in their own performance but in India's overall fiscal sustainability.
Deteriorating finances have caused state spending on critical sectors such as health,
education, irrigation, and infrastructure to decline below the levels required to make
further headway against poverty. Concurrently, there has been an increase in
spending on loss-making state enterprises and massive subsidies for power, water,
irrigation, and transport. For example, in Uttar Pradesh the State Electricity Board has
been a substantial financial burden: losses and subsidies in the power sector
amounted to about 2.7 percent of total state spending roughly the same as the amount
invested in the state's primary education and health combined.
The weaknesses in Slate Government finances have, persisted and are
manifest mainly in the sluggish non-tax revenues, downwardly rigid non
developmental committed expenditures, and inadequate allocations for education,
health, and infrastructure.
Let us examine the position in Andhra Pradesh (Tables -I, II, III, &IV).
Revenue Expenditure of Andhra Pradesh
Social Services: The allocation of budget to the Social Services is proposed to be
increased from Rs. 12079 crores (BE 2004-05) to Rs. 12927 crores (BE 2005-06). The
allocations for Social Services from 2003-04 are specified in TABLE II.
I. General Education: The allocation to General Education is proposed to be
increased from Rs.5169 crores (B.E.2004-05) to Rs. 5560 crores (BE 2005-06).
II. Medical and Health: The proposed allocation under Medical and Health sector
arc Rs. 1753 crores during 2005-06 as against Rs. 1659 crores in B.1. 2004-05 implies
the increase of Rs.94 crores.
III. Urban Development: There is steep increase in the proposed allocation to
Urban Development Sector as against the allocation of Rs. 1198 Crores during BE
2004-05. It is proposed to allocate Rs. 1355 crores during 2005-06.
IV. Welfare of SCs/STs/BCs and Minorities: The proposed allocation for Welfare
Sector is Rs. 1868 crores during 2005-06 as against the allocation of Rs. 1712 Crores
BE 2004-05.
State-wise Social Sector Expenditure
In 2003-04, social sector expenditure as a proportion of total expenditure was
estimated to be highest for Chhattisgarh at 48.2 per cent, followed by Jharkhand (44.2
per cent), and Assam (43.3 per cent) (The share of social sector expenditure in total
Economic Reforms and Social Policy
| 174
expenditure of the States viz., Arunachal Pradesh, Bihar, Himachal Pradesh, Jammu
& Kashmir, Jharkhand, Madhya Pradesh, Manipur, Mizoran., Tripura, Uttar Pradesh,
and West Bengal was budgeted to decline in 2003-04 compared to the previous year.
Andhra Pradesh Vision
The Government of AP is perhaps the firs state government to develop a
comprehensive vision for poverty eradication. Vision 2020 aims to build human
resources, focus on high potential sectors as the engines of growth, and transform
governance. The Government has already shown some willingness to address fiscal
priorities and overhaul delivery of public services. However, the developmental
expenditure as part of revenue expenditure, was 69.5% in 1990- 91 and it declined to
63.7%. in 1997-98, to 57.4% in 2001-02 and to 55.1% in 2003 04(BE). On the other
hand, Non-developmental expenditure increased from 24.8% in 1990-91 to 36.4%in
2003-04. Of this, expenditure on social services takes away34%, Economic
services21%, Interest payments and Servicing of Debt around 20%, Administrative
services around 9 % and Pension payments about 9%.
Quality of expenditure is as important as the quantum of expenditure.
Amounts allocated should not be spent in full as specified. There should not be
leakages of any type. Over the years, a wide variety of anti-poverty programmes have
been attempted in India. While producing some benefits, these have suffered from
ineffective implementation and there is widespread public concern about the impact of
corruption on governance. The large sums invested in public anti- poverty
programmes lend to focus on poorly targeted subsidies and safety nets rather than
long term investments in education and health.
The proportion of the population of Andhra Pradesh in poverty has reduced
substantially over the last f fifty years. Approximately one in three of the population
lives below the Government of India official poverty line. The percentage is slightly
lower in rural areas and slightly higher in urban areas. Andhra Pradesh is ranked 10
out of 16 in the Human Development Index in India and is there therefore regarded as
a medium performing state. In the case of Rural Water Supply in AP, there are still
(2005)1,651 not covered habitations and 2,682 quality affected habitations in the
State. During the year 2005 06, it is programmed to tackle the above habitations under
various programmes such as ARWS, MNP, PMGY and NABARD.
Madhab (1999). however, observed, "The states have not been able to deliver
Economic Reforms and Social Policy
| 175
the basic goods to the people. There is a growing discontentment-over-the-level of
corruption. The regional disparity between the other states of India and the north east
has widened as also the disparity between the rich and the poor within the region."
It is perhaps safe to conclude to that the rapid economic growth observed in some of
the states in the region is more superficial than real. With the states facing increasing
fiscal hardship, even this growth process may not be sustainable for long unless some
more genuine economic initiatives come up in the meantime.
However, the person on the street is condemned to grapple hopelessly with
corruption in almost every aspect of daily work and living. Most government offices
typically present a picture of a client public bewildered and harassed by opaque rules
and procedures and inordinate delays, constantly vulnerable to exploitation by
employees and touts.
In the quest for systemic answers to this chronic malaise, the sources of
corruption inherent within the character of the state machine include a determined
denial of transparency, accessibility and accountability, cumbersome and confusing
procedures, proliferation of mindless controls, and poor commitment at all levels to
real results of public welfare. Demystification of rules and procedures, complete
transparency, and pro-active dissemination of this relevant information amongst the
public is potentially a very strong safeguard against corruption. Ultimately the most
effective systemic check on corruption would be where the citizen herself or himself
has the right to take the initiative to seek information from the state and thereby to
enforce transparency and accountability.
It is in this context that the movement for right to information is so important,
Statutory right to information would be in many ways the most significant reform in
public administration in India in the last 50 years.
The term economy does not mean miserliness but wise spending. In terms of
benefits Governmental money should be made to go the farthest. However Let us
check the Dec. 2000, Report of the Comptroller and Auditor General (CAG) on the
working or four of the schemes on food security and nutritional support- the Pub
Distribution Scheme, Rural Employment Generation Programmes, Integrated Child
Development Services and Nutritional Support to Primary Education. In the six years
ending March '99, the Union treasury spent Rs 830 billion on these 4 schemes. That
is a daily average spending of Rs 30 crore. What is the return? What did we get for
Economic Reforms and Social Policy
| 176
this torrent of money? The answer may appeal you. The CAG's answer: zero, in effect-
ZILCH (Zilch=nothing). The money leaks almost entirely, to those it is not meant for.
The plans have no relationship to the reality. CAG notes it has repeated this story
again and again; it is all known reports not of a slothful administrative system.
According to the PM of India, “The challenge before all of us is to collectively
rise to task ahead of us in terms of increasing rural incomes, getting rid of chronic
mass poverty and giving control to the local levels to plan for themselves, thereby
strengthening the democratic process. The challenge of rural employment is the most
obvious one. "We will be able to combine the short-term need of people for
employment with a medium-term objective of improving their land and water ·
resources to make our agriculture more productive. Social safety nets should not be
mere transfer payments, instead seen as productive job creation."
The availability of fund is only a part of the problem. These funds may not be
sufficient to transform rural India. One may also argue that more funds should be made
available for rural development out of the annual expenditure budget of Rs 4.5 lakh
crore. Bulk of India still resides in six lakh villages in miserable condition.
However, what is important is that how Rs 17,000 crore being spent annually
is: utilized. The PM, who is an economist himself, knows the importance of tax. payers'
money and the alternative use to which this huge fund can be put. If only used for
constructing houses, Rs 17,000 crores is enough to build more than 34 lakh rural
houses in a year and provide roof lo about 2 crore individuals.
In the broader enabling environment, the World Bank document flags certain issues.
Encouraging citizen demand for better services.
Increasing transparency.
Cracking down on civil service transfers and leaving reform champions. in place.
Establishing strong and independent anti-corruption commissions.
Realistic budgeting and implementation of budgets as passed.
Enhancing departmental accountability and flexibility in the budget process.
Tightened budgetary controls and curbing of open-ended and capital projects.
Tightened accounting and auditing arrangements.
Capacity building, Unfortunately, such initiatives seem to happen in the more
reform-minded states and not in the others. And there is no easy way to
incentivize.
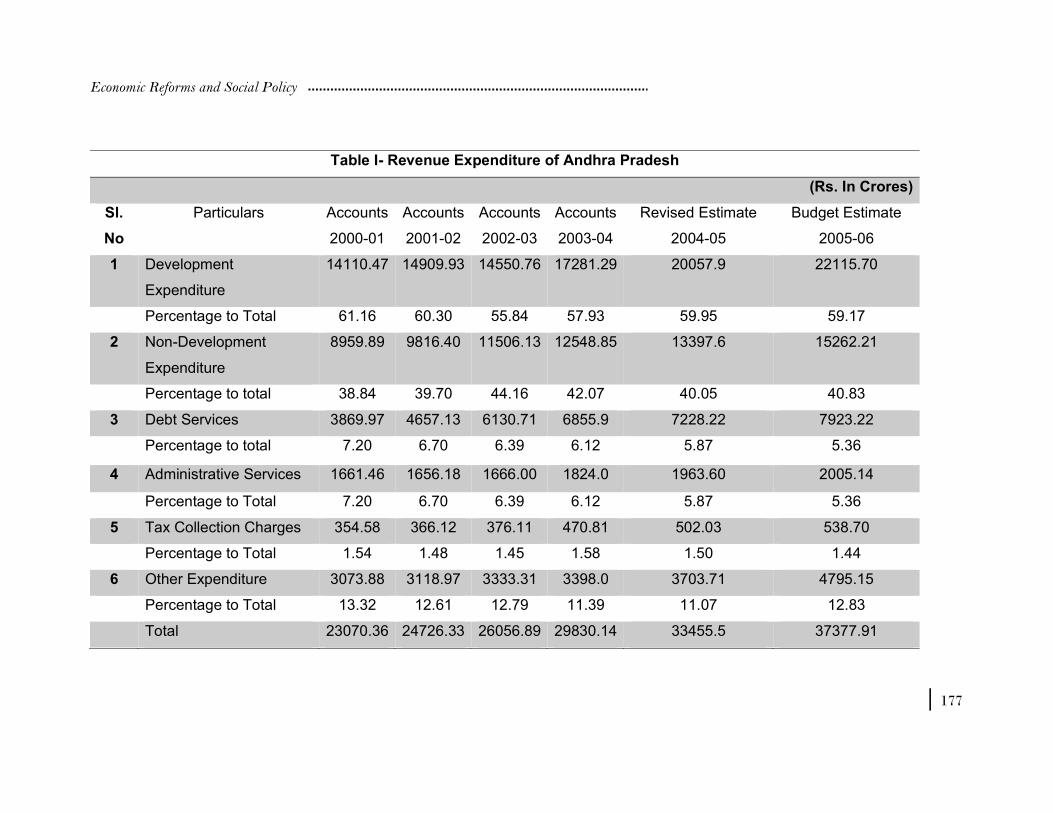
Economic Reforms and Social Policy
| 177
Table I- Revenue Expenditure of Andhra Pradesh
(Rs. In Crores)
Sl.
No
Particulars Accounts
2000-01
Accounts
2001-02
Accounts
2002-03
Accounts
2003-04
Revised Estimate
2004-05
Budget Estimate
2005-06
1 Development
Expenditure
14110.47 14909.93 14550.76 17281.29 20057.9 22115.70
Percentage to Total 61.16 60.30 55.84 57.93 59.95 59.17
2 Non-Development
Expenditure
8959.89 9816.40 11506.13 12548.85 13397.6 15262.21
Percentage to total 38.84 39.70 44.16 42.07 40.05 40.83
3 Debt Services 3869.97 4657.13 6130.71 6855.9 7228.22 7923.22
Percentage to total 7.20 6.70 6.39 6.12 5.87 5.36
4 Administrative Services 1661.46 1656.18 1666.00 1824.0 1963.60 2005.14
Percentage to Total 7.20 6.70 6.39 6.12 5.87 5.36
5 Tax Collection Charges 354.58 366.12 376.11 470.81 502.03 538.70
Percentage to Total 1.54 1.48 1.45 1.58 1.50 1.44
6 Other Expenditure 3073.88 3118.97 3333.31 3398.0 3703.71 4795.15
Percentage to Total 13.32 12.61 12.79 11.39 11.07 12.83
Total 23070.36 24726.33 26056.89 29830.14 33455.5 37377.91
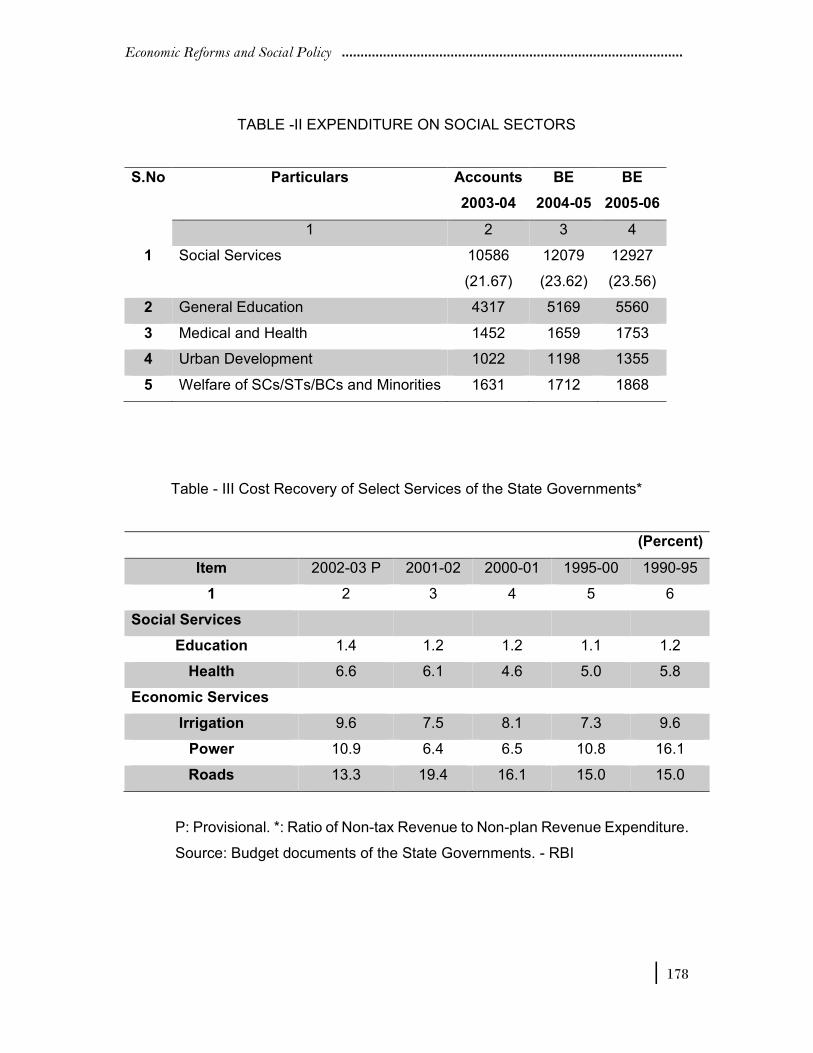
Economic Reforms and Social Policy
| 178
TABLE -II EXPENDITURE ON SOCIAL SECTORS
S.No Particulars Accounts
2003-04
BE
2004-05
BE
2005-06
1 2 3 4
1 Social Services 10586
(21.67)
12079
(23.62)
12927
(23.56)
2 General Education 4317 5169 5560
3 Medical and Health 1452 1659 1753
4 Urban Development 1022 1198 1355
5 Welfare of SCs/STs/BCs and Minorities 1631 1712 1868
Table - III Cost Recovery of Select Services of the State Governments*
(Percent)
Item 2002-03 P 2001-02 2000-01 1995-00 1990-95
1 2 3 4 5 6
Social Services
Education 1.4 1.2 1.2 1.1 1.2
Health 6.6 6.1 4.6 5.0 5.8
Economic Services
Irrigation 9.6 7.5 8.1 7.3 9.6
Power 10.9 6.4 6.5 10.8 16.1
Roads 13.3 19.4 16.1 15.0 15.0
P: Provisional. *: Ratio of Non-tax Revenue to Non-plan Revenue Expenditure.
Source: Budget documents of the State Governments. - RBI
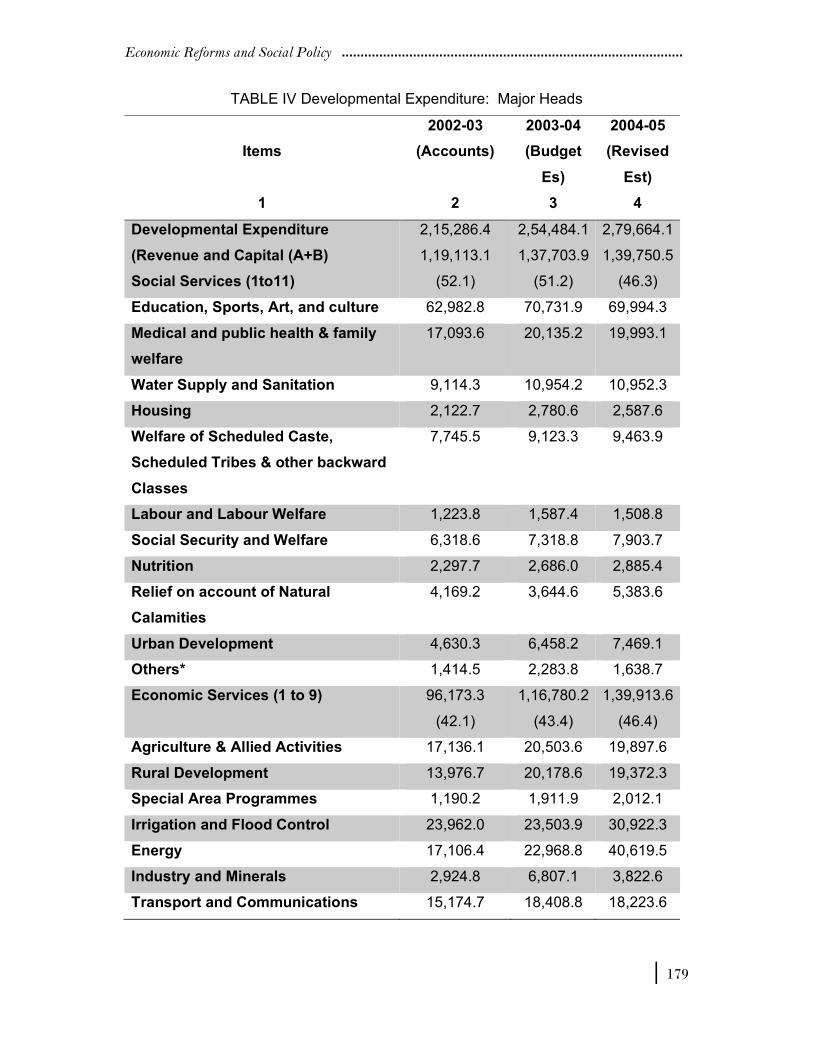
Economic Reforms and Social Policy
| 179
TABLE IV Developmental Expenditure: Major Heads
2002-03 2003-04 2004-05
Items (Accounts) (Budget
Es)
(Revised
Est)
1 2 3 4
Developmental Expenditure
(Revenue and Capital (A+B)
Social Services (1to11)
2,15,286.4
1,19,113.1
(52.1)
2,54,484.1
1,37,703.9
(51.2)
2,79,664.1
1,39,750.5
(46.3)
Education, Sports, Art, and culture 62,982.8 70,731.9 69,994.3
Medical and public health & family
welfare
17,093.6 20,135.2 19,993.1
Water Supply and Sanitation 9,114.3 10,954.2 10,952.3
Housing 2,122.7 2,780.6 2,587.6
Welfare of Scheduled Caste,
Scheduled Tribes & other backward
Classes
7,745.5 9,123.3 9,463.9
Labour and Labour Welfare 1,223.8 1,587.4 1,508.8
Social Security and Welfare 6,318.6 7,318.8 7,903.7
Nutrition 2,297.7 2,686.0 2,885.4
Relief on account of Natural
Calamities
4,169.2 3,644.6 5,383.6
Urban Development 4,630.3 6,458.2 7,469.1
Others* 1,414.5 2,283.8 1,638.7
Economic Services (1 to 9) 96,173.3
(42.1)
1,16,780.2
(43.4)
1,39,913.6
(46.4)
Agriculture & Allied Activities 17,136.1 20,503.6 19,897.6
Rural Development 13,976.7 20,178.6 19,372.3
Special Area Programmes 1,190.2 1,911.9 2,012.1
Irrigation and Flood Control 23,962.0 23,503.9 30,922.3
Energy 17,106.4 22,968.8 40,619.5
Industry and Minerals 2,924.8 6,807.1 3,822.6
Transport and Communications 15,174.7 18,408.8 18,223.6
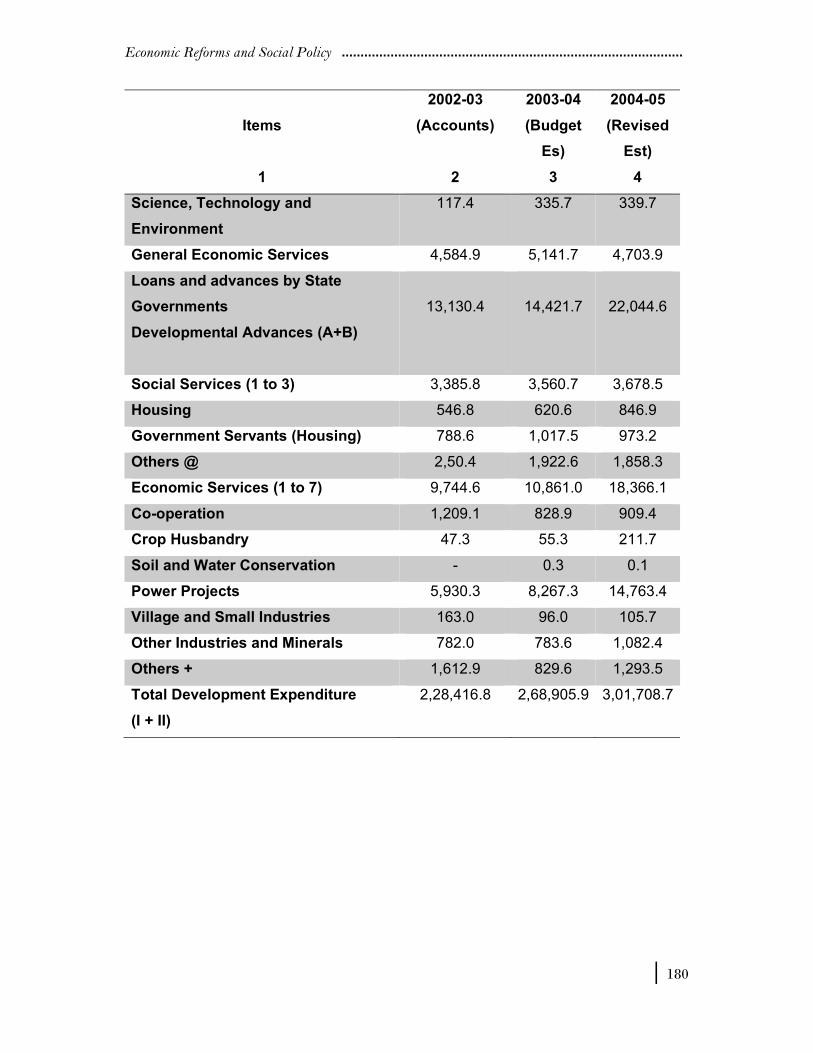
Economic Reforms and Social Policy
| 180
2002-03 2003-04 2004-05
Items (Accounts) (Budget
Es)
(Revised
Est)
1 2 3 4
Science, Technology and
Environment
117.4 335.7 339.7
General Economic Services 4,584.9 5,141.7 4,703.9
Loans and advances by State
Governments
Developmental Advances (A+B)
13,130.4
14,421.7
22,044.6
Social Services (1 to 3) 3,385.8 3,560.7 3,678.5
Housing 546.8 620.6 846.9
Government Servants (Housing) 788.6 1,017.5 973.2
Others @ 2,50.4 1,922.6 1,858.3
Economic Services (1 to 7) 9,744.6 10,861.0 18,366.1
Co-operation 1,209.1 828.9 909.4
Crop Husbandry 47.3 55.3 211.7
Soil and Water Conservation - 0.3 0.1
Power Projects 5,930.3 8,267.3 14,763.4
Village and Small Industries 163.0 96.0 105.7
Other Industries and Minerals 782.0 783.6 1,082.4
Others + 1,612.9 829.6 1,293.5
Total Development Expenditure
(I + II)
2,28,416.8 2,68,905.9 3,01,708.7
ABOUT THIS BOOK
This book offers valuable insights for understanding the impact of
economic reforms on the changed role of state and how a
retreating state can slow down programmes meant for social
development. It also brings out the importance of having a
coherent and consistent social policy. Academicians,
researchers, policy makers, and administrators have debated
several issues regarding the nature of fiscal crisis in Andhra
Pradesh and implementation of subsequent World Bank lent
Andhra Pradesh Economic Restructuring Project (APERP). This
volume contains several research papers on various aspects of
social policy in the context of on -going economic reforms.
ABOUT THE EDITOR
Dr. Bommaraju Sarangapani is Reader and Head, Post-Graduate
Department of Economics, The Hindu College, Machilipatnam.
He has vast experience both as a teacher and researcher. He is a
regular contributor to academic journals. Besides, he is also a
social activist, having associated with a good number of social
causes.


