Embed Size (px)
Citation preview
ECONOMIC SCIENCE FOR RURAL DEVELOPMENT
Proceedings of the International Scientific Conference
No 41 Rural Development and Entrepreneurship Bioeconomy Home Economics
No 41
Jelgava
2016
ISSN 1691-3078
ISSN 2255-9930 on line
ISBN 978-9984-48-223-1
Abstracted / Indexed: ISI Web of Science, AGRIS, CAB Abstracts and EBSCOHost
Academic Search Complete databases
http://www.esaf.llu.lv/journals-and-proceedings
https://apps.webofknowledge.com/
www.fao.org/agris/
http://search.ebscohost.com/login.aspx?direct=true&db=lbh&bquery=SO+%26quot%3bEconomic
+Science+for+Rural+Development%26quot%3b&type=1&site=ehost-live&scope=site
http://search.ebscohost.com/login.aspx?direct=true&db=a9h&jid=25AP&site=ehost-live
Programme Committee of International Scientific Conference
Professor Baiba Rivza Latvia University of Agriculture, Latvia
Professor Andra Zvirbule Latvia University of Agriculture, Latvia
Professor Irina Pilvere Latvia University of Agriculture, Latvia
Professor Barbara Freytag - Leyer Fulda University of Applied Sciences,
Germany
Professor Bo Öhlmer Swedish University of Agricultural Sciences,
Sweden
Professor Wim J.M. Heijman Wageningen University, the Netherlands
Professor Bartosz Mickiewicz West Pomeranian University of Technology,
Poland
Professor Maria Parlinska Warsaw University of Life Sciences, Poland
Professor Alina Danilowska Warsaw University of Life Sciences, Poland
Professor Janina Sawicka Warsaw University of Life Sciences, Poland
Professor Joanna Szwacka-Mokrzycka Warsaw University of Life Sciences, Poland
Professor Jacques Viaene University of Gent, Belgium
Professor Arild Sæther University of Agder, Norway
Professor Vilija Alekneviciene Aleksandras Stulginskis University,
Lithuania
Professor Rogier Schulte Teagasc-The Agriculture and Food
Development Authority of Ireland, Ireland
Professor Csaba Forgacs Budapest Corvinus University, Hungary
Professor Elena Horska Slovak University of Agriculture, Slovakia
Senior researcher Magnar Forbord Centre for Rural Research, Norway
Professor Ingrīda Jakušonoka Latvia University of Agriculture, Latvia
Professor Inguna Leibus Latvia University of Agriculture, Latvia
Professor Aina Dobele Latvia University of Agriculture, Latvia
Professor Modrīte Pelše Latvia University of Agriculture, Latvia
Associate professor Gunita Mazūre Latvia University of Agriculture, Latvia
Associate professor Jānis Ķusis Latvia University of Agriculture, Latvia
Associate professor Anita Auziņa Latvia University of Agriculture, Latvia
Assistant professor Dina Popluga Latvia University of Agriculture, Latvia
Time schedule of the conference
Preparation of the proceedings and organization: October 2015 – April 2016
Conference: 21-22 April 2016
Researchers from the following higher education institutions, research institutions, and professional organizations presented their scientific papers at the conference:
Aleksandras Stulginskis University Lithuania
BA School of Business and Finance Latvia
Belgorod National Research University Russia
College of Agriculture at Križevci Croatia
Corvinus University of Budapest Hungary
Cyprus International University Cyprus
Czech University of Life Sciences Prague Czech
Dubnica Institute of Technlogy Slovakia
Ege University Turkey
Estonian University of Life Sciences Estonia
General Jonas Žemaitis Military Academy of Lithuania Lithuania
Institut Polytechnique LaSalle Beauvais-Esitpa France
Institute for National Economy Research Latvia
Institute of Agricultural Resources and Economics Latvia
Izhevsk State Agricultural Academy Russia
J.Vitols Latvian Academy of Music Latvia
Kaunas University of Applied Sciences Lithuania
Kaunas University of Technology Lithuania
Latvia University Latvia
Latvia University of Agriculture Latvia
Latvian Academy of Sport Education Latvia
Latvian Maritime Academy Latvia
Lithuanian Institute of Agrarian Economics Lithuania
Latvian State Institute of Agrarian Economics Latvia
Ministry of Education and Science Latvia
Ministry of Finance Latvia
Nicolaus Copernicus University Poland
Pennsylvania State University, State College USA
Pope John Paul II State School of Higher Education in Biala Podlaska Poland
Rezekne Academy of Technologies Latvia
Riga Teacher Training and Educational Management Academy Latvia
Riga International School of Economics and Business Administration Latvia
Riga Technical University Latvia
Russian State Agrarian University - Moscow Timiryazev Agricultural Academy Russia
School of Business Administration Turiba Latvia
Slovak University of Agriculture Slovakia
Slovak University of Technology Slovakia
State Priekuli Plant Breeding Institute Latvia
Süleyman Demirel University Turkey
Šiauliai University Lithuania
Transport and Telecommunication Institute Latvia
University of Economics and Culture Latvia
University of Agriculture in Krakow Poland
University of Applied Sciences Ludwigshafen on the Rhine Germany
University of Osijek Croatia
University of Catania Italy
University of Economics Czech
University of Computer Sciences and Economics Poland
University of Latvia Latvia
University of Technology and Life Sciences Poland
University of Warmia and Mazury Poland
UTP University of Science and Technology Poland
Vidzeme University of Applied Sciences Latvia
Vilnius Gediminas Technical University Lithuania
Vytautas Magnus University Lithuania
Warsaw University of Life Sciences Poland
West Pomeranian University of Technology Szczecin Poland
Editorial Board
The Editorial Board of the edition of the International Scientific Conference Proceedings:
Professor Baiba Rivža Latvia University of Agriculture, Latvia
Professor Andra Zvirbule Latvia University of Agriculture, Latvia
Professor Irina Pilvere Latvia University of Agriculture, Latvia
Professor Barbara Freytag - Leyer Fulda University of Applied Sciences, Germany
Professor Bo Öhlmer Swedish University of Agricultural Sciences,Sweden
Professor Wim J.M. Heijman Wageningen University, the Netherlands
Professor Bartosz Mickiewicz West Pomeranian University of Technology, Poland
Professor Maria Parlinska Warsaw University of Life Sciences, Poland
Professor Alina Danilowska Warsaw University of Life Sciences, Poland
Professor Jacques Viaene University of Gent, Belgium
Professor Arild Sæther University of Agder, Norway
Professor Vilija Alekneviciene Aleksandras Stulginskis University, Lithuania
Professor Rogier Schulte Teagasc-The Agriculture and Food Development Authority of Ireland, Ireland
Professor Csaba Forgacs Budapest Corvinus University, Hungary
Professor Elena Horska Slovak University of Agriculture, Slovakia
Editor – in-chief Anita Auzina, Associate professor
Responsible compilers of the proceedings: Gunita Mazure, Associate professor
Simona Zvirgzdina, Lecturer
Assistants to the responsible compilers: Dzesija Zeiferte
The authors are responsible for the content and language of their papers.
Reviewers
Every article included into the Proceedings was subjected to a scientific, including international review.
All reviewers were anonymous for the authors of the articles. The following 128 reviewers from scientific and academic institutions of 15 countries
(Croatia, Cyprus, Czech, Estonia, Hungary, Italy, Latvia, Lithuania, Montenegro, Poland, Russia, Slovakia, Turkey, Ukraine, USA) have written 128 reviews.
Vilma Kriaučiūnaitė- Neklejonovienė Dr., assist.prof.; Aleksandras Stulginskis University, Lithuania Astrida Miceikiene Dr., prof.; Aleksandras Stulginskis University, Lithuania Dzintra Atstāja Dr.oec., prof.; BA School of Business and Finance, Latvia Tamas Mizik Dr.; Corvinus University of Budapest, Hungary Haydar Şengül Dr., prof.; Cukorova University, Turkey Shiva Ilkhanizadeh Lecturer; Cyprus International University, Cyprus Oksana Ruža Dr.oec.; Daugavpils University, Latvia Žofia Hacherova PhD, prof.; Dubnica Institute of Technlogy, Slovakia Alberts Auziņš Dr.oec., Financial Analyst; Edo Consult, Ltd, Latvia Heldur Peterson PhD, lect.; Estonian Agricultural University, Estonia Kalev Sepp PhD, prof.; Estonian University of Life Sciences Reet Pōldaru Dr.rer.oec., assoc.prof.; Estonian University of Life Sciences , Estonia Villu Mikita PhD, assoc.prof.; Estonian University of Life Sciences, Estonia Ants-Hannes Viira PhD, researcher; Estonian University of Life Sciences, Estonia Jūratė Guščinskienė PhD, prof.; General Jonas Žemaitis Military Academy of Lithuania, Lithuania Mezera Josef Senior researcher; Institute of Agricultural Economics and Information, Czech Agnese Krieviņa Dr.oec., Senior Researcher; Institute of Agricultural Resources and Economics, Latvia Rolan Alborov Dr.sc., prof.; Izhevsk State Agricultural Academy, Russia Ilze Buligina Dr.admin., lect.; Jazeps Vitols Latvian Academy of Music, Latvia Laima Jeseviciute-Ufartiene PhD, prof.; Kaunas University of Applied Sciences, Lithuania Maria Ewa Szatlach Dr.hab., prof.; Kazimierz Wielki University, Poland Anna Cellmer Dr.inz.; Koszalin University of Technology, Poland Anita Auziņa Dr.oec., assoc.prof.; Latvia University of Agriculture, Latvia Voldemārs Bariss Dr.phil., assoc.prof.; Latvia University of Agriculture, Latvia Dina Bite Dr.sc.soc., assist.prof.; Latvia University of Agriculture, Latvia Larisa Brokāne Dr.psych., assoc.prof.; Latvia University of Agriculture, Latvia Zane Bulderberga Dr.oec., assist.prof.; Latvia University of Agriculture, Latvia Aina Dobele Dr.oec., prof.; Latvia University of Agriculture, Latvia Lāsma Dobele Dr.oec., assist.prof.; Latvia University of Agriculture, Latvia Signe Dobelniece Dr.phil.soc.d., assoc.prof.; Latvia University of Agriculture, Latvia Aija Eglīte Dr.oec., assoc.prof.; Latvia University of Agriculture, Latvia Zanete Garanti Dr.oec., assist.prof.; Latvia University of Agriculture, Latvia Gunta Grīnberga-Zālīte Dr.oec., assoc.prof.; Latvia University of Agriculture, Latvia Anda Grīnfelde Dr.oec., assist.prof.; Latvia University of Agriculture, Latvia Ingrīda Jakušonoka Dr.oec., prof.; Latvia University of Agriculture, Latvia Ināra Jurgena Dr.oec., assoc.prof.; Latvia University of Agriculture, Latvia Dace Kaufmane Dr.oec., assist.prof.; Latvia University of Agriculture, Latvia Kitija Kirila Dr.oec., assist.prof.; Latvia University of Agriculture, Latvia Viola Korpa Dr.sc.soc., assit.prof.; Latvia University of Agriculture, Latvia Ginta Kronberga Dr.sc.soc., assit.prof.; Latvia University of Agriculture, Latvia Ženija Krūzmētra Dr.geogr., assist.prof.; Latvia University of Agriculture, Latvia Jānis Ķusis Dr.hist., assoc.prof.; Latvia University of Agriculture, Latvia Ingūna Leibus Dr.oec., prof.; Latvia University of Agriculture, Latvia Gunita Mazūre Dr.oec., assoc.prof.; Latvia University of Agriculture, Latvia Ingrīda Millere Dr.oec., assist.prof.; Latvia University of Agriculture, Latvia Jolanta Millere Dr.sc.soc., assit.prof.; Latvia University of Agriculture, Latvia Aina Muška Dr.oec., assoc.prof.; Latvia University of Agriculture, Latvia Kaspars Naglis-Liepa Dr.oec., assist.prof.; Latvia University of Agriculture, Latvia Modrīte Pelše Dr.oec., prof.; Latvia University of Agriculture, Latvia Irina Pilvere Dr.oec., prof.; Latvia University of Agriculture, Latvia
Dina Popluga Dr.oec., assist.prof.; Latvia University of Agriculture, Latvia Līga Proškina Dr.oec., assist.prof.; Latvia University of Agriculture, Latvia Baiba Rivža Dr.hab.oec, prof.; Latvia University of Agriculture, Latvia Evelina Špakoviča Dr.oec., assist.prof.; Latvia University of Agriculture, Latvia Anastasija Vilciņa Dr.oec., prof.; Latvia University of Agriculture, Latvia Īrija Vītola Dr.oec., prof.emeritus; Latvia University of Agriculture, Latvia Sandija Zēverte-Rivža Dr.oec., assist.prof.; Latvia University of Agriculture, Latvia Andra Zvirbule Dr.oec., prof.; Latvia University of Agriculture, Latvia Astrīda Rijkure Dr.oec., assoc.prof.; Latvian Maritime Academy, Latvia Andris Kursītis Mg.sc.soc.; Latvian Rural Advisory and Training Center, Latvia Jurgita Baltušienė Dr., Sciettific Worker; Lithuanian Institute of Agrarian Economics, Lithuania Anna Vanova PhD, assist.prof.; Matej Bel University, Slovakia Francesco S. Nesci Dr., prof.; Mediterranea University of Reggio Calabria, Italy Julia Galchynska Dr.; National University of Life and Environmental Sciences, Ukraine Aleksandra Jezierska-Thole Dr.; Nicolaus Copernicus University in Toruń, Poland James Beierlein PhD, prof.; Pennsylvania State University, USA Karolina Pawlak Dr.hab. , assist.prof.; Poznan University of Life Sciences, Poland Anda Zvaigzne Dr.oec., assoc.prof.; Rezekne Academy of Technologies, Latvia Alksandrs Fedotovs Dr.oec., prof.; Riga International School of Economics and Business Administration, Latvia Inna Dovladbekova Dr.oec., prof.; Riga Stradins University, Latvia Ritma Rungule Dr.sc.soc., assoc.prof.; Riga Stradins University, Latvia Ivars Muzis Dr.paed., prof.; Riga Teacher Training and Educational Management Academy, Latvia Gita Actiņa Dr.oec.; Riga Technical University, Latvia Konstantins Didenko Dr.oec., prof.; Riga Technical University, Latvia Ineta Geipele Dr.oec., prof.; Riga Technical University, Latvia Ingūna Jurgelāne Dr.oec., assoc.prof.; Riga Technical University, Latvia Juris Saulītis Dr.oec., prof.; Riga Technical University, Latvia Gints Turlajs PhD; Riga Technical University, Latvia Valentina Urbane Dr.chem., prof.; Riga Technical University, Latvia Raisa Kostina PhD, prof.; Russian Timiryazev State Agrarian University, Russia Iluta Bērziņa Dr.oec.; School of Business Administration Turiba, Latvia Sergejs Volvenkins Dr. oec., prof.; School of Business Administration Turiba, Latvia Vita Zariņa Dr.oec., prof.; School of Business Administration Turiba, Latvia Rosita Zvirgzdiņa Dr.oec., assoc.prof.; School of Business Administration Turiba, Latvia Rasa Balvočiūte Dr.; Šiauliai University, Lithuania Henrikas Karpavičius PhD, assoc.prof.; Šiauliai University, Lithuania Bogdan Wawrzyniak PhD, prof.; Technical-Environmental University, Poland Ilze Sproģe Dr.sc.administr., assoc.prof.; Transport and Telecommunication Institute, Latvia Helma Jirgena Dr.oec., assoc.prof.; University of Economics and Culture, Latvia Staņislavs Keišs Dr.oec., prof.; University of Economics and Culture, Latvia Jan Hybel Dr.hab., prof.; University of Computer Sciences and Economics, Poland Dzineta Dimante Dr.oec., assist.prof.; University of Latvia, Latvia Ināra Kantāne Kantāne Dr.sc.administr.; University of Latvia, Latvia Janis Kleperis Dr.phys.; University of Latvia, Latvia Zaiga Krišjāne Dr.geogr., prof.; University of Latvia, Latvia Tatjana Muravska Dr.oec., prof.; University of Latvia, Latvia Liga Rasnaca Dr.sc.soc. , assist.prof.; University of Latvia, Latvia Biruta Sloka Dr.oec., prof.; University of Latvia, Latvia Daina Šķiltere Dr.oec., prof.; University of Latvia, Latvia Ilmārs Šņucins Msc.; University of Latvia, Latvia Aleksandra Despotović Dr., assoc.prof.; University of Montenegro, Montenegro Marija Ham PhD, assist.prof.; University of Osijek, Croatia Mariana Dubravska PhD; University of Prešov, Slovakia Agnieszka Dawidowicz PhD, assist.prof.; University of Warmia and Mazur in Olsztyn, Poland Radosław Cellmer Dr.hab.ing., assoc.prof.; University of Warmia and Mazury in Olsztyn, Poland Marta Gwiaździńska-Goraj PhD; University of Warmia and Mazury in Olsztyn, Poland Piotr Borawski Dr.hab., prof.; University of Warmia and Mazury in Olsztyn, Poland
Andrzej Piotr Wiatrak Dr.hab., prof.; University of Warsaw, Poland Karlis Kreslins PhD; Ventspils University College, Latvia Aušra Liučvaitiene Dr., assoc.prof.; Vilnius Gediminas Technical University, Lithuania Migle Sarvutyte-Gailiuniene PhD; Vilnius University, Lithuania Dalia Streimikiene Dr., prof.; Vilnius University, Lithuania Mariola Chrzanowska PhD, assist.prof.; Warsaw University of Life Sciences, Poland Alina Danilowska Dr.hab., prof.; Warsaw University of Life Sciences, Poland Nina Drejerska PhD, assist.prof.; Warsaw University of Life Sciences, Poland Tadeusz Filipiak PhD, prof.; Warsaw University of Life Sciences, Poland Justyna Franc-Dabrowska Dr.hab., prof.; Warsaw University of Life Sciences, Poland Jaroslaw Golebiewski Dr.hab., prof.; Warsaw University of Life Sciences, Poland Bogdan Klepacki Dr.hab., prof.; Warsaw University of Life Sciences, Poland Grzegorz Koszela PhD, assoc.prof.; Warsaw University of Life Sciences, Poland Krystyna Krzyżanowska Dr., prof.; Warsaw University of Life Sciences, Poland Halina Poweska PhD, assist.prof.; Warsaw University of Life Sciences, Poland Maciej Stawicki PhD, assist.prof.; Warsaw University of Life Sciences, Poland Joanna Szwacka-Mokrzucka Dr.hab., prof.; Warsaw University of Life Sciences, Poland Ewa Wasilewska PhD, assist.prof.; Warsaw University of Life Sciences, Poland Mieczysław Adamowicz Dr.hab., prof.; West Pomeranian University of Technology Szczecin, Poland Agnieszka Brelik PhD; West Pomeranian University of Technology Szczecin, Poland Bartosz Mickiewicz Dr.hab., prof.; West Pomeranian University of Technology Szczecin, Poland
Publication Ethics and Malpractice Statement for the International Scientific Conference “Economic Science for Rural Development”
The Editorial Board is responsible for, among other, preventing publication malpractice. Unethical behaviour is unacceptable and the authors who submit articles to the Conference Proceedings affirm that the content of a manuscript is original. Furthermore, the authors’ submission also implies that the material of the article was not published in any other publication; it is not and will not be presented for publication to any other publication; it does not contain statements which do not correspond to reality, or material which may infringe upon the intellectual property rights of another person or legal entity, and upon the conditions and requirements of sponsors or providers of financial support; all references used in the article are indicated and, to the extent the article incorporates text passages, figures, data or other material from the works of others, the undersigned has obtained any necessary permits as well as the authors undertake to indemnify and hold harmless the publisher of the proceedings and third parties from any damage or expense that may arise in the event of a breach of any of the guarantees.
Editors, authors, and reviewers, within the International Scientific Conference “Economic Science for Rural Development” are to be fully committed to good publication practice and accept the responsibility for fulfilling the following duties and responsibilities, as set by the COPE Code of Conduct and Best Practice Guidelines for Journal Editors of the Committee on Publication Ethics (COPE).
It is necessary to agree upon standards of expected ethical behaviour for all parties involved in the act of publishing: the author, the editor, the peer reviewer, and the publisher.
DUTIES OF EDITORS
Publication decisions The Editorial Board is responsible for deciding which of the articles submitted to the Conference Proceedings should be published. The Editorial Board may be guided by the policies of ethics and constrained by such legal requirements as shall then be in force regarding libel, copyright infringement and plagiarism. The editor may confer with other editors or reviewers in making this decision.
Fair play An editor at any time evaluate manuscripts for their intellectual content without regard to the nature of the authors or the host institution including race, gender, sexual orientation, religious belief, ethnic origin, citizenship, or political philosophy of the authors.
Confidentiality The editor and any editorial staff must not disclose any information about a submitted manuscript to anyone other than the corresponding author, reviewers, potential reviewers, other editorial advisers, and the publisher, as appropriate.
Disclosure and conflicts of interest Unpublished materials disclosed in a submitted manuscript must not be used in an editor’s own research without the express written consent of the author.
DUTIES OF REVIEWERS
Every submitted manuscript has been reviewed by one reviewer from the author’s native country or university, while the other reviewer came from another country or university. The third reviewer was chosen in the case of conflicting reviews. All reviewers were anonymous for 9 the authors of the articles, and the reviewers presented blind reviews. Every author received the reviewers’ objections or recommendations. After receiving the improved (final) version of the manuscript and the author’s comments, the Editorial Board of the conference evaluated each article.
Contribution to editorial decisions Peer review assists the editor in making editorial decisions and through the editorial communications with the author may also assist the author in improving the paper.
Promptness
Any selected referee who feels unqualified to review the research reported in a manuscript or knows that its prompt review will be impossible should notify the editor and excuse himself from the review process.
Confidentiality Any manuscripts received for review must be treated as confidential documents. They must not be shown to or discussed with others except as authorised by the editor.
Standards of objectivity Reviews should be conducted objectively. Personal criticism of the author is inappropriate. Referees should express their views clearly with supporting arguments.
Acknowledgement of sources Reviewers should identify relevant published work that has not been cited by the authors. Any statement that an observation, derivation, or argument had been previously reported should be accompanied by the relevant citation. A reviewer should also call to the editor's attention any substantial similarity or overlap between the manuscript under consideration and any other published paper of which they have personal knowledge.
Disclosure and conflict of interest Privileged information or ideas obtained through peer review must be kept confidential and not used for personal advantage. Reviewers should not consider manuscripts in which they have conflicts of interest resulting from competitive, collaborative, or other relationships or connections with any of the authors, companies, or institutions connected to the papers.
DUTIES OF AUTHORS
Reporting standards The authors of reports of original research should present an accurate account of the work performed as well as an objective discussion of its significance. Underlying data should be represented accurately in the paper. A paper should contain sufficient detail and references to permit others to replicate the work. Fraudulent or knowingly inaccurate statements constitute unethical behaviour and are unacceptable.
Data access and retention The authors are asked to provide the raw data in connection with a paper for editorial review, and should be prepared to provide public access to such data (consistent with the ALPSP-STM Statement on Data and Databases), if practicable, and should in any event be prepared to retain such data for a reasonable time after publication.
Originality and plagiarism The authors should ensure that they have written entirely original works, and if the authors have used the work and/or words of others that this has been appropriately cited or quoted.
Multiple, redundant or concurrent publication An author should not in general publish manuscripts describing essentially the same research in more than one journal or primary publication. Submitting the same manuscript to more than one journal concurrently constitutes unethical publishing behaviour and is unacceptable.
Acknowledgement of sources Proper acknowledgment of the work of others must always be given. The authors should cite publications that have been influential in determining the nature of the reported work.
Authorship of the paper Authorship should be limited to those who have made a significant contribution to the conception, design, execution, or interpretation of the reported study. All those who have made significant contributions should be listed as co-authors. Where there are others who have participated in certain substantive aspects of the research project, they should be acknowledged or listed as contributors.
The corresponding author should ensure that all appropriate co-authors and no inappropriate co-authors are included on the paper, and that all co-authors have seen and approved the final version of the paper and have agreed to its submission for publication.
Hazards and human or animal subjects If the work involves chemicals, procedures or equipment that have any unusual hazards inherent in their use, the author must clearly identify these in the manuscript.
Disclosure and conflicts of interest
All authors should disclose in their manuscript any financial or other substantive conflict of interest that might be construed to influence the results or interpretation of their manuscript. All sources of financial support for the project should be disclosed.
Fundamental errors in published works When an author discovers a significant error or inaccuracy in his/her own published work, it is the author’s obligation to promptly notify the editor or publisher and cooperate with the editor to retract or correct the paper.
Editorial Board
Foreword
The international scientific conference “Economic Science for Rural Development” is organized annually by the Faculty of Economics and Social Development of Latvia University of Agriculture.
The proceedings of the conference are published since 2000. The scientific papers presented in the conference held on 21-22 April 2016 are published in 3
thematic volumes: No 41 Rural Development and Entrepreneurship Bioeconomy Home Economics
No 42 Integrated and Sustainable Regional Development Production and Co-operation in Agriculture
No 43 New Dimensions in the Development of Society Marketing and Sustainable Consumption Finance and Taxes
The proceedings contain scientific papers representing not only the science of economics in the diversity of its sub-branches, but also other social sciences (sociology, political science), thus confirming inter-disciplinary development of the contemporary social science.
This year for the first time the conference includes the section on a new emerging kind of economy-bioeconomy. The aim of bioeconomy is to use renewable biological resources in amore sustainable manner. Bioeconomy can also sustain a wide range of public goods, including biodiversity. It can increase competitiveness, enhance Europe's self-reliance and provide jobs and business opportunities.
The Conference Committee and Editorial Board are open to comments and recommendations concerning the preparation of future conference proceedings and organisation of the conference.
Acknowledgements
The Conference Committee and editorial Board are open to comments and recommendations for the development of future conference proceedings and organisation of international scientific conferences.
We would like to thank all the authors, reviewers, members of the Programme Committee and the Editorial Board as well as supporting staff for their contribution organising the conference.
On behalf of the conference organisers Anita Auzina
Associate professor of Faculty of Economics and Social Development Latvia University of Agriculture
Contents
RURAL DEVELOPMENT AND ENTREPRENEURSHIP..................................................... 14
STABILITY EVALUATION OF THE NUMBER OF FARMERS FARMS AND DECLARED AGRICULTURAL LAND IN LITHUANIA.................................................................................15
Virginija Atkoceviciene1, lecturer; Jolanta Valciukiene2, Dr., lecturer, Daiva Jukneliene3, lecturer .............................................................................................. 15
NETWORKING AS A FORM OF COLLABORATION OF LOCAL ENTREPRENEURS IN POLAND .....24 Wioletta Bienkowska-Golasa1, PhD.................................................................................. 24
RURAL COOPERATIVE MOVEMENT – PROSPECTS OF CHANGES............................................31 Zbigniew Brodzinski1, PhD with “habilitation”; Adam Pawlewicz2, PhD.................................. 31
SUPPORT MEASURES TO EMPLOYERS FOR WORK–BASED LEARNING...................................38 Ilze Buligina1, Dr.admin.; Biruta Sloka2, Dr.oec. professor; Inara Kantane3, Dr.admin. researcher, assistant prof., Anastasija Vilcina4, Dr.oec., professor .......................................... 38
LOGISTICS IMPROVEMENT POSSIBILITIES IN ENTREPRENEURSHIP...................................45 Lasma Dobele1, Dr.oec., Kristine Gricmane2, Bc.oec., Anita Auzina3, Dr.oec. ........................ 45
ARE POLISH RURAL AREAS DESTINATIONS FOR COMMUTING?...........................................53 Nina Drejerska1, PhD ...................................................................................................... 53
DEVELOPMENT OF ENTREPRENEURSHIP IN RURAL AREAS OF NORTH-EASTERN POLAND.....61 Sebastian Goraj, PhD, Eng.1; Marta Gwiazdzinska-Goraj, PhD2;.......................................... 61
AGRICULTURAL EDUCATION OF MANAGERS OF AGRICULTURAL HOLDINGS IN POLAND IN 2002-2010 .................................................................................................69
Marta Gwiazdzinska-Goraj1, PhD; Roman Rudnicki2, Associate Professor.............................. 69
INTRODUCING OF SMART WORK – OPPORTUNITY TO INCREASE ECONOMIC DEVELOPMENT OF MUNICIPALITIES IN LATVIA.........................................................................................77
Ilze Judrupa1, Dr.oec; Maija Senfelde1, Dr.oec................................................................... 77
YOUNG FARMER SUPPORT POLICY IN LATVIA: THE EXAMPLE OF LATGALE REGION.............85 Ilze Krisane1, Mg.oec.; Irina Pilvere2, Dr.oec. .................................................................... 85
ROLE OF MUNICIPALITIES IN LOCAL FOOD DISTRIBUTION IN LATVIA ...............................96 Inita Krivasonoka1, Mg.oec.; Andra Zvirbule1, Dr.oec......................................................... 96
DIRECTIONS OF DEVELOPMENT OF REGIONAL POLICY WITHIN THE FRAMEWORK OF THE LOCAL DEVELOPMENT STRATEGY FOR RURAL AREAS........................................................ 104
Antoni Mickiewicz1, PhD, professor; Bartosz Mickiewicz1 PhD, professor ..............................104
THE NEW PHENOMENA IN THE ORGANIC FARMING IN THE CONTEXT OF ACTIONS INCLUDED IN THE 2014-2020 RURAL DEVELOPMENT PROGRAMME (RDP) ......................................... 114
Anthony Mickiewicz1, PhD, Professor; Bartosz Mickiewicz1, PhD, Professor; Robert Jurczak1, PhD...............................................................................................................................114
ASSESSMENT OF SOCIAL SECURITY IN LATVIA ................................................................ 123 Baiba Mistre1, Mg.oec., Aina Muska1, Dr.oec. ....................................................................123
EVALUATION OF THE IMPLEMENTATION OF SUSTAINABLE DEVELOPMENT IN RURAL COMMUNES IN EASTERN POLAND.................................................................................... 132
Katarzyna Pawlewicz1, PhD; Adam Pawlewicz2, PhD; Iwona Cieslak3, PhD ........................132
LOCAL GOVERNMENT AS A PUBLIC INSTITUTION SUPPORTING ORGANIC PRODUCTION IN THE OPINION OF THE PRODUCERS FROM NATURAL VALUABLE AREAS OF THE LUBLIN VOIVODESHIP (POLAND) ................................................................................................ 140
Agnieszka Siedlecka1, PhD .............................................................................................140
DEVELOPMENT OF ORGANIC AGRICULTURE IN LATVIA..................................................... 147 Tatjana Tambovceva1, Dr.oec., professor ..........................................................................147
SOCIO – RESPONSIBLE BEHAVIOR OF SMALL AND MEDIUM SIZED COMPANIES ................ 156 Iveta Ubreziova1, prof. ing. PhD.; Elena Horska1, prof. Dr. ing.; Kamila Moravcikova1, ing., Kovacsova Barbora1, ing. ...............................................................................................156
PERSPECTIVE DEVELOPMENT OF NEW SPECIES IN LATVIAN AQUACULTURE ..................... 164 Armands Veveris1, Dr.oec.; Juris Hazners1, Mgr.oec.; and Elita Benga1, Mgr.sc.ing. ..............164
BEHAVIOURAL DIMENSION OF SOCIAL CAPITAL OF RURAL AREAS IN POLAND................. 173 Agnieszka Wojewodzka-Wiewiorska1, PhD .....................................................................173
FACTORS DETERMINING DEVELOPMENT OF BUSINESSES IN KUJAWSKO-POMORSKIE PROVINCE AS A PART OF THE POMERANIAN SPECIAL ECONOMIC ZONE - STUDY RESULTS 180
Malgorzata Zajdel1, PhD; Malgorzata Michalcewicz-Kaniowska1, PhD ...............................180
ECONOMIC ASPECTS OF BRAND IMPORTANCE AFFECTING THE OPERATIONS AND GROWTH OF ENTERPRISES – RESEARCH RESULTS .......................................................................... 186
Dagmara K. Zuzek1, PhD ................................................................................................186
UNEMPLOYMENT PROBLEMS IN THE REGIONS OF LATVIA ................................................ 195 Rosita Zvirgzdina1, Dr.oec.; Ina Jekabsone1, Mg. oec........................................................195
BIOECONOMY ......................................................................................................... 203
ENVIRONMENTAL ECONOMICS VERSUS THE EMISSION OF GREENHOUSE GASES IN THE EU MEMBER STATES’ AGRICULTUR........................................................................................ 204
Piotr Golasa1, PhD..........................................................................................................204
COMPARISON OF THE CONSUMPTION OF WOOD PELLETS BETWEEN LATVIA AND OTHER EU COUNTRIES..................................................................................................................... 210
Agnese Krievina1, Dr.oec.; Ligita Melece1, Dr.oec. ............................................................210
BIO-ECONOMY SECTOR IN POLAND AND ITS IMPORTANCE IN THE ECONOMY ................... 219 Wicki Ludwik1, DSc.; Aleksandra Wicka1 PhD...................................................................219
BIOECONOMY AS A COMPLEX ADAPTIVE SYSTEM ............................................................. 229 Mariusz Maciejczak1, PhD...............................................................................................229
ANALYSIS OF THE FACTORS AFFECTING COST EFFICIENCY IN BEEF PRODUCTION IN LATVIA...................................................................................................................................... 234
Aleksejs Nipers1, Dr.oec.; Irina Pilvere1, Dr.oec.; Agnese Krievina2, Dr.oec. .......................234
ENVIRONMENTAL CHANGES IN THE POLISH AGRICULTURE - TOWARD THE BIO-ECONOMY 243 Tomasz Pajewski1, MA ...................................................................................................243
ANALYSIS OF THE FACTORS AFFECTING COST EFFICIENCY IN THE DAIRY INDUSTRY IN LATVIA ............................................................................... 252
Irina Pilvere1, Dr.oec.; Aleksejs Nipers1, Dr.oec.; Agnese Krievina2, Dr.oec. .......................252
DEVELOPMENT OF SUSTAINABLE LIVING ENVIRONMENT IN THE CITIES THROUGH THE BIOECONOMY ................................................................................................................. 260
Dina Popluga1, Dr.oec., assistant professor, Liga Feldmane2, PhD student, Mg.geogr. .............260
FABA BEANS AS AN ALTERNATIVE PROTEIN SOURCE FOR BROILER CHICKEN FEED........... 266 Liga Proskina1, Dr.oec.; Sallija Ceriņa2, Dr.oec.; Sandija Zeverte-Rivza1 Dr.oec. .................266
BIOECONOMICS AS AN INTERDISCIPLINARY SCIENCE..................................................... 274 Aldona Zawojska1, Dr.hab.oec., assistant professor; Tomasz Siudek1, Dr.hab.oec., associate professor........................................................................................................................274
BIOECONOMY AS A DIRECTION OF THE DEVELOPMENT OF NATURAL VALUABLE AREAS IN LUBLIN VOIVODESHIP (POLAND).................................................................................... 282
Magdalena Zwolinska-Ligaj1, PhD...................................................................................282
HOME ECONOMICS ................................................................................................. 292
INTERNATIONAL REAL ESTATE TRANSACTION IN LATVIA 2011-2015: THEORETICAL AND PRACTICAL ASPECTS ......................................................................... 293
Janis Viesturs1, Mg.oec.; Armands Auzins1, Dr.oec., assoc.prof...........................................293
VALUE AND STRUCTURE OF HOUSEHOLDS’ FINANCIAL ASSETS IN POLAND ...................... 302 Monika Utzig1, PhD ........................................................................................................302
14
RURAL DEVELOPMENT AND ENTREPRENEURSHIP
Proceedings of the 2016 International Conference “ECONOMIC SCIENCE FOR RURAL DEVELOPMENT” No 41
Jelgava, LLU ESAF, 21-22 April 2016, pp. 15-23
1Corresponding author. Tel.: + 37061860164; fax: + -. E-mail address: [email protected]. 15
STABILITY EVALUATION OF THE NUMBER OF FARMERS FARMS AND DECLARED AGRICULTURAL LAND IN LITHUANIA
Virginija Atkoceviciene1, lecturer; Jolanta Valciukiene2, Dr., lecturer,
Daiva Jukneliene3, lecturer
1,2,3Institute of Land Management and Geomatics, Aleksandras Stulginskis University, Lithuania
Abstract. The beginning of the restitutional land reallocation reform in 1991 brought a rapid change in agricultural
land utilisation and user groups resulting in the decrease of state land users’ categories and the growth of private
agricultural land areas used by farmers and other natural and legal entities. The aim of the article is to analyse the
stability of farmers farms and their agricultural areas in Lithuania during the period between 2009 and 2014. The
research estimates the stability of the number of farms and the utilised agricultural area in separate Lithuanian
administrative units, i.e. municipalities. The survey results revealed that the most stable farmers' land holdings group
was farms that utilised more than 10 ha of agricultural land. The number of farms stability coefficient in Lithuania is
1.08 on average. The complex index of the stability of the utilised agricultural area in Lithuania is 1.13 on average.
The value of index is the lowest only in 8 of the 51 municipalities in Lithuania, i.e. from 1.00 to 1.09. This means that
the farm land use in those districts is the most stable since the municipality has no possibilities to increase it
significantly by ploughing up or otherwise using the abandoned and fallow land.
Key words: land used for agricultural purposes, farmers farms, used and declared agricultural land, farm size,
stability.
JEL code:
Introduction
The agricultural sector in Lithuania has very
important economic, social, environmental and
ethno-cultural value and is considered to be a
priority branch of the national economy.
Lithuania should implement agricultural economic
policies in order to create favourable conditions
for farming and compete effectively on the EU
single market. Successful activity of farms is
heavily dependent on primary factors of
production – rational utilisation of land, labour
and capital. Larger areas of owned land do not
necessarily show an increase in the production of
income as higher income can be expected if
additional land areas enable efficient use of
agricultural machinery and labour. Higher income
can also be received due to specialisation.
However, the EU's main agricultural development
trend is still holding pieces of consolidation of
agricultural units. As demonstrated by the
experience of other countries, this is happening
at the expense of small farms since the number
of small farms is declining and the number of
medium-sized farms is growing.
Since the beginning of land reform in
independent Lithuania in 1997, the existing
practice has been to design only land plots rather
than farms as the latter were required by law to
be registered as land territorial units. This
resulted in the decline of land plot size and the
scatter of these plots. Since the formation of the
farm land holdings was left to chance, the
restructuring of the layout of the plots faced the
repeated land management works during the
preparation of land consolidation projects.
At present, indicators characterising
agricultural land management and use in
Lithuania are still associated with the ongoing
land reform – the restoration of the ownership of
land and public land sales as well as with the
development of farm land holdings, when
acquiring and leasing of the land owned by other
landowners. Land reform process especially had
impact on the changes of agricultural land
structure according to users. The number of
farmers is increasing, while the number of
agricultural companies and other agricultural
enterprises and their controlled land is decreasing
(Valciukiene, 2015).
A number of Lithuanian and foreign scientists
(Aleknavicius, 2007; Makuteniene, 2004;
Abalikstiene, Stravinskiene 2011; Marsden et al.,
Proceedings of the 2016 International Conference “ECONOMIC SCIENCE FOR RURAL DEVELOPMENT” No 41
Jelgava, LLU ESAF, 21-22 April 2016, pp. 15-23
1Corresponding author. Tel.: + 37061860164; fax: + -. E-mail address: [email protected]. 16
2008; Hazell et al., 2010; Davidova et al., 2013;
Silva et al ., 2014; Graeub et al., 2015 and
others) analysed the change of agricultural land
and agricultural land areas as well as the change
in the size of farms, land use peculiarities.
When analysing the use of land resources in
Lithuanian farmers farms, Z. Kazakevicius (2011)
states that despite the fact that the variable cost
productivity and profitability has declined, the
use of agricultural lands in farmers farms is
improving.
P. Aleknavicius et al. (2012) also analysed
agricultural land conversion works carried out in
the independent Lithuania. In order to create
favourable conditions for agricultural land users,
it is recommended to improve agricultural
policies and laws, providing for support for
farmers to purchase the land within the
boundaries of their prospective land use and to
start using the abandoned land.
The research aim – to analyse the stability
of farmers farms and their agricultural areas in
Lithuania during the period between 2009
and 2014.
The following tasks were raised for the
achievement of the aim:
1) to analyse the variation trends of farmers
farms as well as used and declared
agricultural land in Lithuania;
2) to perform the stability assessment of the
number of farms, their use and declared
agricultural land in individual Lithuanian
administrative units – the municipalities of the
districts.
The scientific literature and legal documents,
analysis and synthesis, statistical indicators and
analysis of mathematical processing as well as
comparative analysis were used for the
implementation of the above mentioned aim and
tasks. The obtained results were processed by
GIS technologies. The study was conducted using
the data from the Department of Statistics, the
National Land Service under the Ministry of
Agriculture and Lithuanian Agricultural
Information and Rural Business Centre within the
period of 2009-2014. In assessing variation
trends of agricultural land area used by
agricultural entities the authors took into
consideration the fact that the available
information of both the Department of Statistics
as well as information obtained from the analysis
of the areas declared, did not fully reflect the real
situation.
The stability assessment of the number of
farmers farms and the utilised and declared
agricultural area of the country’s territory were
analysed assuming that only the constantly used
territory and territorially related farming land
areas (hereinafter - agricultural land areas) of
sufficient size ensured the economic stability of
the farm. To achieve this, the authors carried out
the statistical analysis of the indicators of all
municipalities of the Republic of Lithuania. The
studies used indicators reflecting the stability of
farm land use (utilised agricultural land area
change, farm size changes). Land use stability
was expressed as indices - coefficients indicating
the degree of deviation. The coefficient value of
the most stable studied phenomena is 1.
Research results and discussion
Indicators characterising agricultural land
management and utilisation are related to an
ongoing land reform – the restoration of the
ownership of the land and public land sales as
well as the development of farm land holdings,
acquiring and leasing of the property of other
landowners. In 2014, Lithuania had about 500
thousand hectares of state-owned agricultural
land that could be privatized or used for farming
(excluding land used by state-owned enterprises,
scientific and educational institutions as well as
state-owned land used by land and gardeners‘
communities as well as about
25 thousand hectares of forests situated in the
state-owned agricultural lands).
The increase of private land area results in the
increase of land owners number. However, land
area per one owner - physical person remains
Proceedings of the 2016 International Conference “ECONOMIC SCIENCE FOR RURAL DEVELOPMENT” No 41
Jelgava, LLU ESAF, 21-22 April 2016, pp. 15-23
1Corresponding author. Tel.: + 37061860164; fax: + -. E-mail address: [email protected]. 17
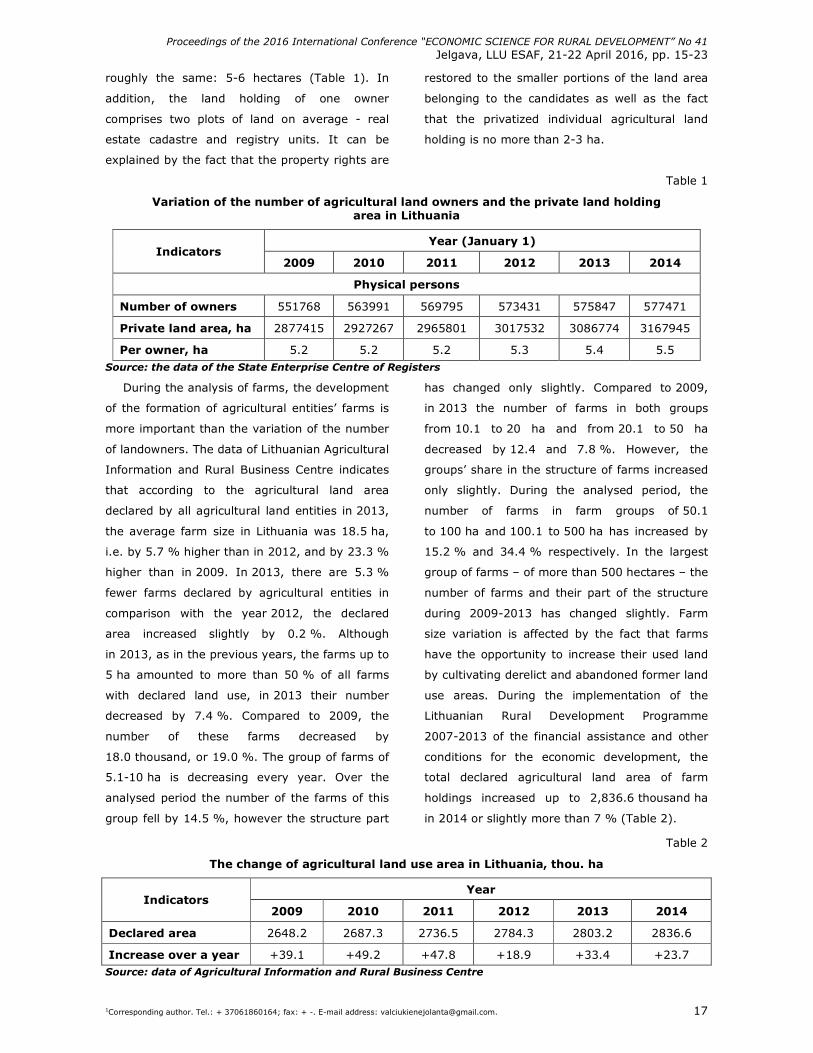
roughly the same: 5-6 hectares (Table 1). In
addition, the land holding of one owner
comprises two plots of land on average - real
estate cadastre and registry units. It can be
explained by the fact that the property rights are
restored to the smaller portions of the land area
belonging to the candidates as well as the fact
that the privatized individual agricultural land
holding is no more than 2-3 ha.
Table 1
Variation of the number of agricultural land owners and the private land holding area in Lithuania
Year (January 1) Indicators
2009 2010 2011 2012 2013 2014
Physical persons
Number of owners 551768 563991 569795 573431 575847 577471
Private land area, ha 2877415 2927267 2965801 3017532 3086774 3167945
Per owner, ha 5.2 5.2 5.2 5.3 5.4 5.5 Source: the data of the State Enterprise Centre of Registers
During the analysis of farms, the development
of the formation of agricultural entities’ farms is
more important than the variation of the number
of landowners. The data of Lithuanian Agricultural
Information and Rural Business Centre indicates
that according to the agricultural land area
declared by all agricultural land entities in 2013,
the average farm size in Lithuania was 18.5 ha,
i.e. by 5.7 % higher than in 2012, and by 23.3 %
higher than in 2009. In 2013, there are 5.3 %
fewer farms declared by agricultural entities in
comparison with the year 2012, the declared
area increased slightly by 0.2 %. Although
in 2013, as in the previous years, the farms up to
5 ha amounted to more than 50 % of all farms
with declared land use, in 2013 their number
decreased by 7.4 %. Compared to 2009, the
number of these farms decreased by
18.0 thousand, or 19.0 %. The group of farms of
5.1-10 ha is decreasing every year. Over the
analysed period the number of the farms of this
group fell by 14.5 %, however the structure part
has changed only slightly. Compared to 2009,
in 2013 the number of farms in both groups
from 10.1 to 20 ha and from 20.1 to 50 ha
decreased by 12.4 and 7.8 %. However, the
groups’ share in the structure of farms increased
only slightly. During the analysed period, the
number of farms in farm groups of 50.1
to 100 ha and 100.1 to 500 ha has increased by
15.2 % and 34.4 % respectively. In the largest
group of farms – of more than 500 hectares – the
number of farms and their part of the structure
during 2009-2013 has changed slightly. Farm
size variation is affected by the fact that farms
have the opportunity to increase their used land
by cultivating derelict and abandoned former land
use areas. During the implementation of the
Lithuanian Rural Development Programme
2007-2013 of the financial assistance and other
conditions for the economic development, the
total declared agricultural land area of farm
holdings increased up to 2,836.6 thousand ha
in 2014 or slightly more than 7 % (Table 2).
Table 2
The change of agricultural land use area in Lithuania, thou. ha
Year Indicators
2009 2010 2011 2012 2013 2014
Declared area 2648.2 2687.3 2736.5 2784.3 2803.2 2836.6
Increase over a year +39.1 +49.2 +47.8 +18.9 +33.4 +23.7 Source: data of Agricultural Information and Rural Business Centre
Proceedings of the 2016 International Conference “ECONOMIC SCIENCE FOR RURAL DEVELOPMENT” No 41
Jelgava, LLU ESAF, 21-22 April 2016, pp. 15-23
1Corresponding author. Tel.: + 37061860164; fax: + -. E-mail address: [email protected]. 18
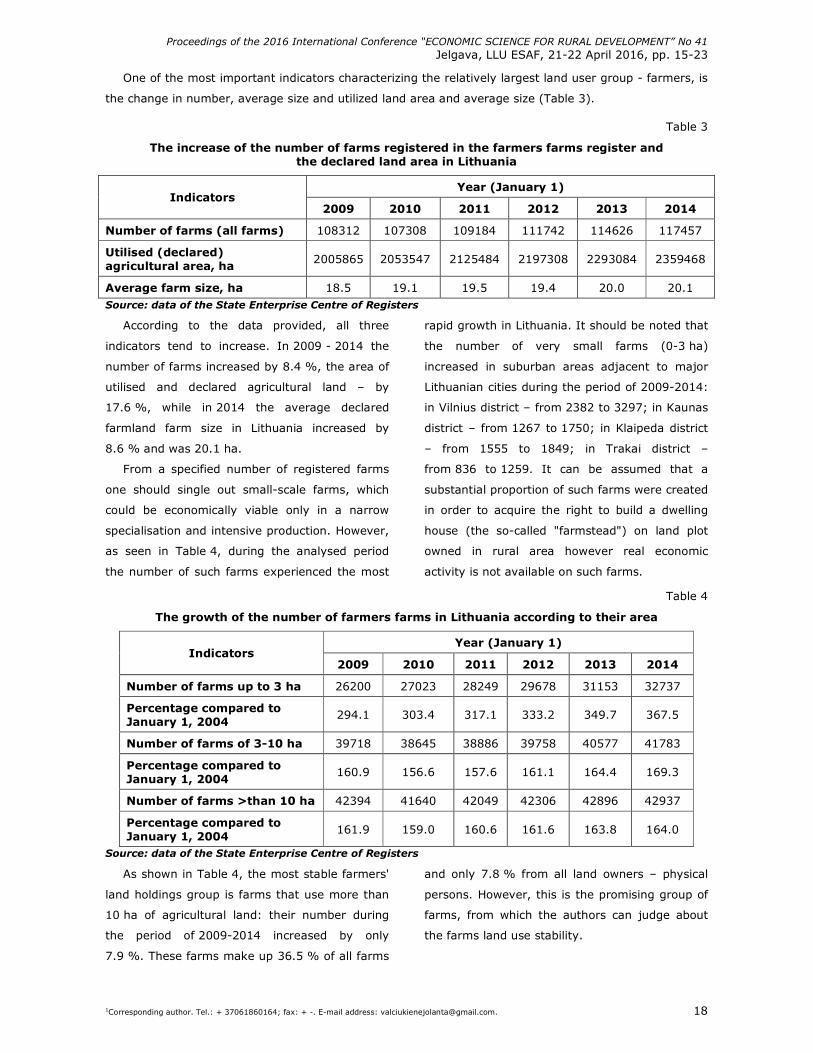
One of the most important indicators characterizing the relatively largest land user group - farmers, is
the change in number, average size and utilized land area and average size (Table 3).
Table 3
The increase of the number of farms registered in the farmers farms register and the declared land area in Lithuania
Year (January 1) Indicators
2009 2010 2011 2012 2013 2014
Number of farms (all farms) 108312 107308 109184 111742 114626 117457
Utilised (declared) agricultural area, ha
2005865 2053547 2125484 2197308 2293084 2359468
Average farm size, ha 18.5 19.1 19.5 19.4 20.0 20.1 Source: data of the State Enterprise Centre of Registers
According to the data provided, all three
indicators tend to increase. In 2009 - 2014 the
number of farms increased by 8.4 %, the area of
utilised and declared agricultural land – by
17.6 %, while in 2014 the average declared
farmland farm size in Lithuania increased by
8.6 % and was 20.1 ha.
From a specified number of registered farms
one should single out small-scale farms, which
could be economically viable only in a narrow
specialisation and intensive production. However,
as seen in Table 4, during the analysed period
the number of such farms experienced the most
rapid growth in Lithuania. It should be noted that
the number of very small farms (0-3 ha)
increased in suburban areas adjacent to major
Lithuanian cities during the period of 2009-2014:
in Vilnius district – from 2382 to 3297; in Kaunas
district – from 1267 to 1750; in Klaipeda district
– from 1555 to 1849; in Trakai district –
from 836 to 1259. It can be assumed that a
substantial proportion of such farms were created
in order to acquire the right to build a dwelling
house (the so-called "farmstead") on land plot
owned in rural area however real economic
activity is not available on such farms.
Table 4
The growth of the number of farmers farms in Lithuania according to their area
Year (January 1) Indicators
2009 2010 2011 2012 2013 2014
Number of farms up to 3 ha 26200 27023 28249 29678 31153 32737
Percentage compared to January 1, 2004
294.1 303.4 317.1 333.2 349.7 367.5
Number of farms of 3-10 ha 39718 38645 38886 39758 40577 41783
Percentage compared to January 1, 2004
160.9 156.6 157.6 161.1 164.4 169.3
Number of farms >than 10 ha 42394 41640 42049 42306 42896 42937
Percentage compared to January 1, 2004
161.9 159.0 160.6 161.6 163.8 164.0
Source: data of the State Enterprise Centre of Registers
As shown in Table 4, the most stable farmers'
land holdings group is farms that use more than
10 ha of agricultural land: their number during
the period of 2009-2014 increased by only
7.9 %. These farms make up 36.5 % of all farms
and only 7.8 % from all land owners – physical
persons. However, this is the promising group of
farms, from which the authors can judge about
the farms land use stability.
Proceedings of the 2016 International Conference “ECONOMIC SCIENCE FOR RURAL DEVELOPMENT” No 41
Jelgava, LLU ESAF, 21-22 April 2016, pp. 15-23
1Corresponding author. Tel.: + 37061860164; fax: + -. E-mail address: [email protected]. 19
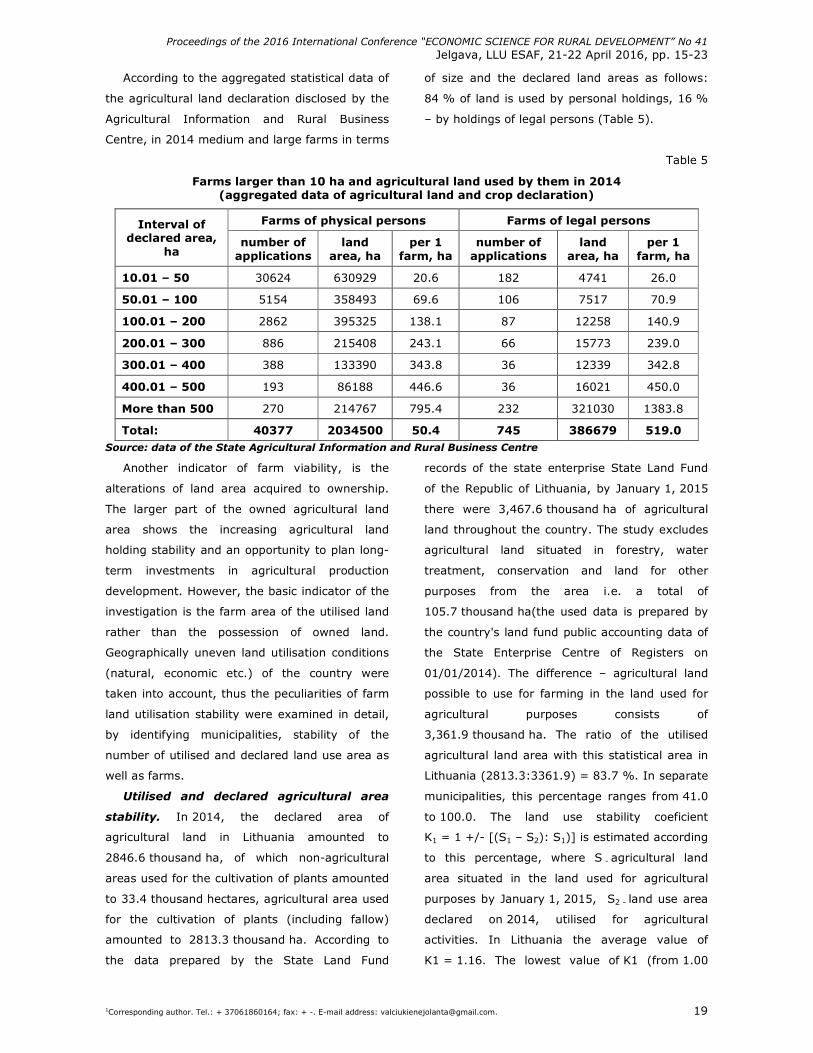
According to the aggregated statistical data of
the agricultural land declaration disclosed by the
Agricultural Information and Rural Business
Centre, in 2014 medium and large farms in terms
of size and the declared land areas as follows:
84 % of land is used by personal holdings, 16 %
– by holdings of legal persons (Table 5).
Table 5
Farms larger than 10 ha and agricultural land used by them in 2014 (aggregated data of agricultural land and crop declaration)
Farms of physical persons Farms of legal persons Interval of declared area,
ha number of
applications land
area, ha per 1
farm, ha number of
applications land
area, ha per 1
farm, ha
10.01 – 50 30624 630929 20.6 182 4741 26.0
50.01 – 100 5154 358493 69.6 106 7517 70.9
100.01 – 200 2862 395325 138.1 87 12258 140.9
200.01 – 300 886 215408 243.1 66 15773 239.0
300.01 – 400 388 133390 343.8 36 12339 342.8
400.01 – 500 193 86188 446.6 36 16021 450.0
More than 500 270 214767 795.4 232 321030 1383.8
Total: 40377 2034500 50.4 745 386679 519.0 Source: data of the State Agricultural Information and Rural Business Centre
Another indicator of farm viability, is the
alterations of land area acquired to ownership.
The larger part of the owned agricultural land
area shows the increasing agricultural land
holding stability and an opportunity to plan long-
term investments in agricultural production
development. However, the basic indicator of the
investigation is the farm area of the utilised land
rather than the possession of owned land.
Geographically uneven land utilisation conditions
(natural, economic etc.) of the country were
taken into account, thus the peculiarities of farm
land utilisation stability were examined in detail,
by identifying municipalities, stability of the
number of utilised and declared land use area as
well as farms.
Utilised and declared agricultural area
stability. In 2014, the declared area of
agricultural land in Lithuania amounted to
2846.6 thousand ha, of which non-agricultural
areas used for the cultivation of plants amounted
to 33.4 thousand hectares, agricultural area used
for the cultivation of plants (including fallow)
amounted to 2813.3 thousand ha. According to
the data prepared by the State Land Fund
records of the state enterprise State Land Fund
of the Republic of Lithuania, by January 1, 2015
there were 3,467.6 thousand ha of agricultural
land throughout the country. The study excludes
agricultural land situated in forestry, water
treatment, conservation and land for other
purposes from the area i.e. a total of
105.7 thousand ha(the used data is prepared by
the country's land fund public accounting data of
the State Enterprise Centre of Registers on
01/01/2014). The difference – agricultural land
possible to use for farming in the land used for
agricultural purposes consists of
3,361.9 thousand ha. The ratio of the utilised
agricultural land area with this statistical area in
Lithuania (2813.3:3361.9) = 83.7 %. In separate
municipalities, this percentage ranges from 41.0
to 100.0. The land use stability coeficient
K1 = 1 +/- [(S1 – S2): S1)] is estimated according
to this percentage, where S - agricultural land
area situated in the land used for agricultural
purposes by January 1, 2015, S2 - land use area
declared on 2014, utilised for agricultural
activities. In Lithuania the average value of
K1 = 1.16. The lowest value of K1 (from 1.00
Proceedings of the 2016 International Conference “ECONOMIC SCIENCE FOR RURAL DEVELOPMENT” No 41
Jelgava, LLU ESAF, 21-22 April 2016, pp. 15-23
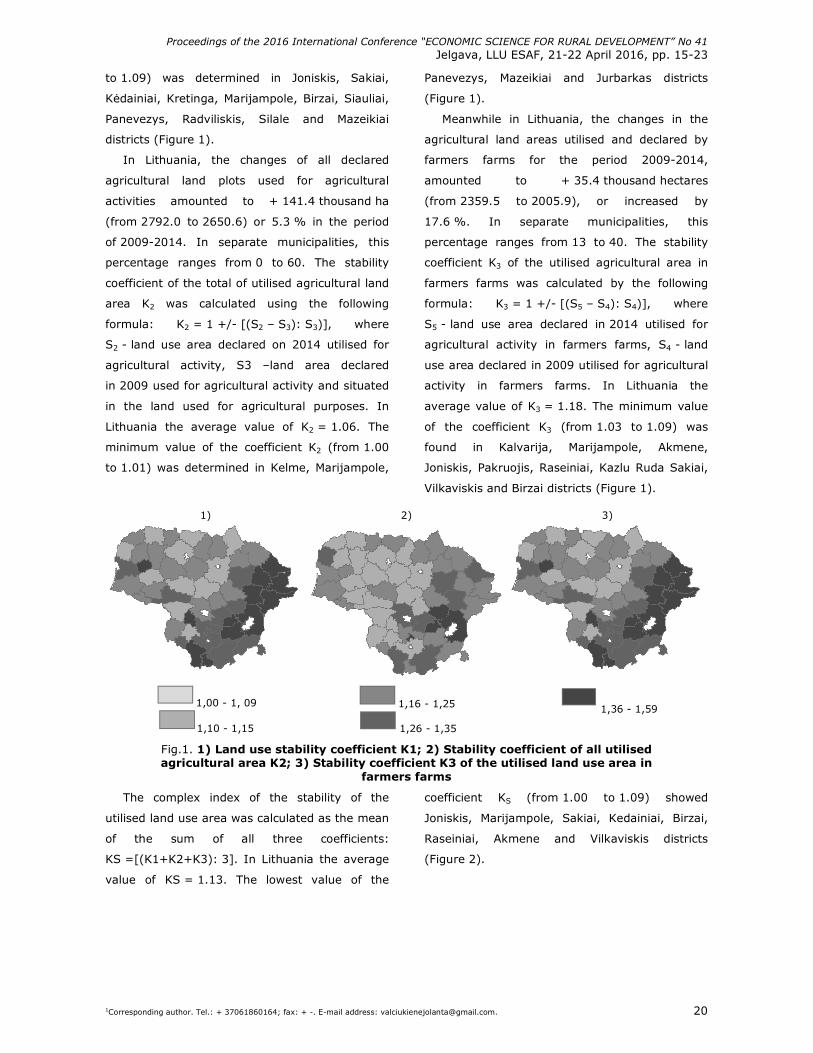
1Corresponding author. Tel.: + 37061860164; fax: + -. E-mail address: [email protected]. 20
to 1.09) was determined in Joniskis, Sakiai,
Kėdainiai, Kretinga, Marijampole, Birzai, Siauliai,
Panevezys, Radviliskis, Silale and Mazeikiai
districts (Figure 1).
In Lithuania, the changes of all declared
agricultural land plots used for agricultural
activities amounted to + 141.4 thousand ha
(from 2792.0 to 2650.6) or 5.3 % in the period
of 2009-2014. In separate municipalities, this
percentage ranges from 0 to 60. The stability
coefficient of the total of utilised agricultural land
area K2 was calculated using the following
formula: K2 = 1 +/- [(S2 – S3): S3)], where
S2 - land use area declared on 2014 utilised for
agricultural activity, S3 –land area declared
in 2009 used for agricultural activity and situated
in the land used for agricultural purposes. In
Lithuania the average value of K2 = 1.06. The
minimum value of the coefficient K2 (from 1.00
to 1.01) was determined in Kelme, Marijampole,
Panevezys, Mazeikiai and Jurbarkas districts
(Figure 1).
Meanwhile in Lithuania, the changes in the
agricultural land areas utilised and declared by
farmers farms for the period 2009-2014,
amounted to + 35.4 thousand hectares
(from 2359.5 to 2005.9), or increased by
17.6 %. In separate municipalities, this
percentage ranges from 13 to 40. The stability
coefficient K3 of the utilised agricultural area in
farmers farms was calculated by the following
formula: K3 = 1 +/- [(S5 – S4): S4)], where
S5 - land use area declared in 2014 utilised for
agricultural activity in farmers farms, S4 - land
use area declared in 2009 utilised for agricultural
activity in farmers farms. In Lithuania the
average value of K3 = 1.18. The minimum value
of the coefficient K3 (from 1.03 to 1.09) was
found in Kalvarija, Marijampole, Akmene,
Joniskis, Pakruojis, Raseiniai, Kazlu Ruda Sakiai,
Vilkaviskis and Birzai districts (Figure 1).
1)
1,00 - 1, 09
1,10 - 1,15
2)
1,16 - 1,25
1,26 - 1,35
3)
1,36 - 1,59
Fig.1. 1) Land use stability coefficient K1; 2) Stability coefficient of all utilised agricultural area K2; 3) Stability coefficient K3 of the utilised land use area in
farmers farms
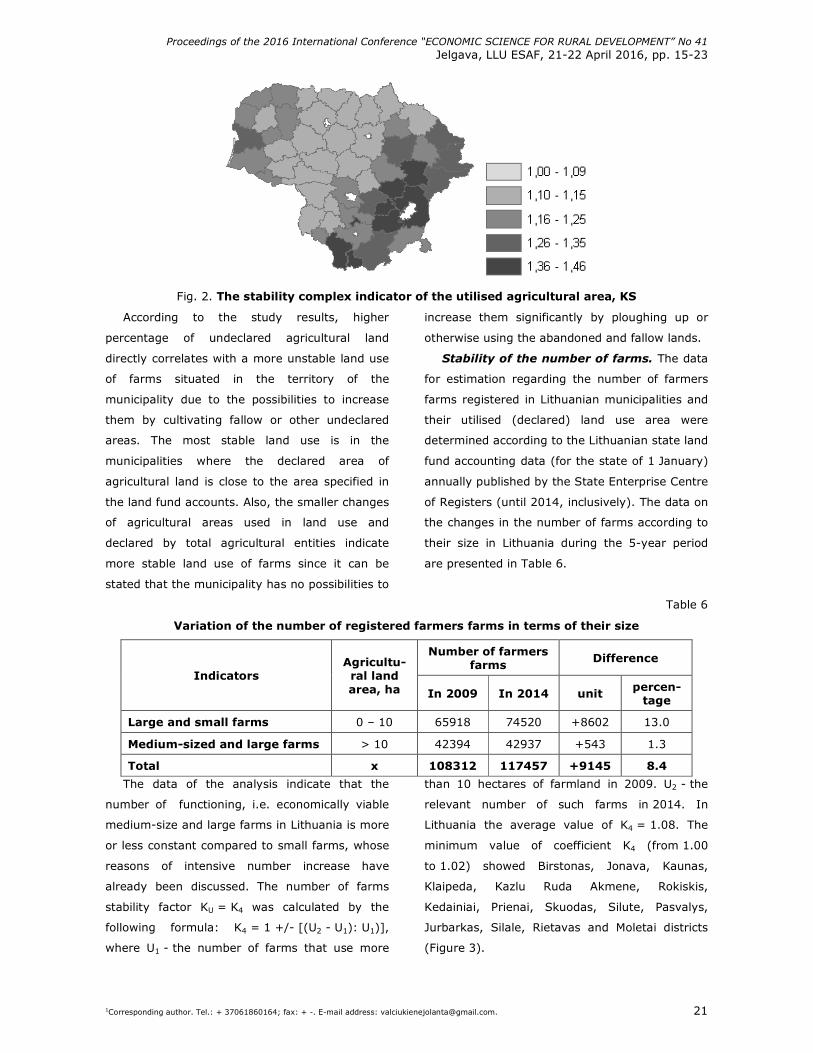
The complex index of the stability of the
utilised land use area was calculated as the mean
of the sum of all three coefficients:
KS =[(K1+K2+K3): 3]. In Lithuania the average
value of KS = 1.13. The lowest value of the
coefficient KS (from 1.00 to 1.09) showed
Joniskis, Marijampole, Sakiai, Kedainiai, Birzai,
Raseiniai, Akmene and Vilkaviskis districts
(Figure 2).
Proceedings of the 2016 International Conference “ECONOMIC SCIENCE FOR RURAL DEVELOPMENT” No 41
Jelgava, LLU ESAF, 21-22 April 2016, pp. 15-23
1Corresponding author. Tel.: + 37061860164; fax: + -. E-mail address: [email protected]. 21
Fig. 2. The stability complex indicator of the utilised agricultural area, KS
According to the study results, higher
percentage of undeclared agricultural land
directly correlates with a more unstable land use
of farms situated in the territory of the
municipality due to the possibilities to increase
them by cultivating fallow or other undeclared
areas. The most stable land use is in the
municipalities where the declared area of
agricultural land is close to the area specified in
the land fund accounts. Also, the smaller changes
of agricultural areas used in land use and
declared by total agricultural entities indicate
more stable land use of farms since it can be
stated that the municipality has no possibilities to
increase them significantly by ploughing up or
otherwise using the abandoned and fallow lands.
Stability of the number of farms. The data
for estimation regarding the number of farmers
farms registered in Lithuanian municipalities and
their utilised (declared) land use area were
determined according to the Lithuanian state land
fund accounting data (for the state of 1 January)
annually published by the State Enterprise Centre
of Registers (until 2014, inclusively). The data on
the changes in the number of farms according to
their size in Lithuania during the 5-year period
are presented in Table 6.
Table 6
Variation of the number of registered farmers farms in terms of their size
Number of farmers farms
Difference
Indicators Agricultu-ral land area, ha In 2009 In 2014 unit percen-
tage
Large and small farms 0 – 10 65918 74520 +8602 13.0
Medium-sized and large farms > 10 42394 42937 +543 1.3
Total x 108312 117457 +9145 8.4
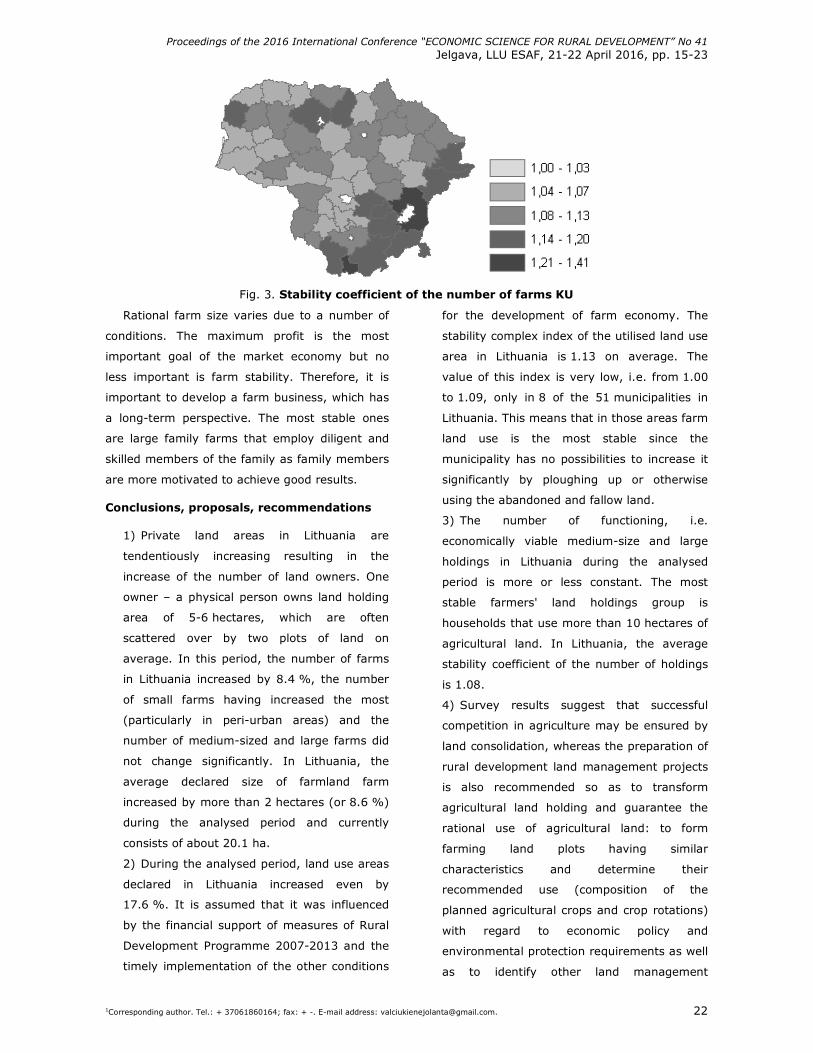
The data of the analysis indicate that the
number of functioning, i.e. economically viable
medium-size and large farms in Lithuania is more
or less constant compared to small farms, whose
reasons of intensive number increase have
already been discussed. The number of farms
stability factor KU = K4 was calculated by the
following formula: K4 = 1 +/- [(U2 - U1): U1)],
where U1 - the number of farms that use more
than 10 hectares of farmland in 2009. U2 - the
relevant number of such farms in 2014. In
Lithuania the average value of K4 = 1.08. The
minimum value of coefficient K4 (from 1.00
to 1.02) showed Birstonas, Jonava, Kaunas,
Klaipeda, Kazlu Ruda Akmene, Rokiskis,
Kedainiai, Prienai, Skuodas, Silute, Pasvalys,
Jurbarkas, Silale, Rietavas and Moletai districts
(Figure 3).
Proceedings of the 2016 International Conference “ECONOMIC SCIENCE FOR RURAL DEVELOPMENT” No 41
Jelgava, LLU ESAF, 21-22 April 2016, pp. 15-23
1Corresponding author. Tel.: + 37061860164; fax: + -. E-mail address: [email protected]. 22
Fig. 3. Stability coefficient of the number of farms KU
Rational farm size varies due to a number of
conditions. The maximum profit is the most
important goal of the market economy but no
less important is farm stability. Therefore, it is
important to develop a farm business, which has
a long-term perspective. The most stable ones
are large family farms that employ diligent and
skilled members of the family as family members
are more motivated to achieve good results.
Conclusions, proposals, recommendations
1) Private land areas in Lithuania are
tendentiously increasing resulting in the
increase of the number of land owners. One
owner – a physical person owns land holding
area of 5-6 hectares, which are often
scattered over by two plots of land on
average. In this period, the number of farms
in Lithuania increased by 8.4 %, the number
of small farms having increased the most
(particularly in peri-urban areas) and the
number of medium-sized and large farms did
not change significantly. In Lithuania, the
average declared size of farmland farm
increased by more than 2 hectares (or 8.6 %)
during the analysed period and currently
consists of about 20.1 ha.
2) During the analysed period, land use areas
declared in Lithuania increased even by
17.6 %. It is assumed that it was influenced
by the financial support of measures of Rural
Development Programme 2007-2013 and the
timely implementation of the other conditions
for the development of farm economy. The
stability complex index of the utilised land use
area in Lithuania is 1.13 on average. The
value of this index is very low, i.e. from 1.00
to 1.09, only in 8 of the 51 municipalities in
Lithuania. This means that in those areas farm
land use is the most stable since the
municipality has no possibilities to increase it
significantly by ploughing up or otherwise
using the abandoned and fallow land.
3) The number of functioning, i.e.
economically viable medium-size and large
holdings in Lithuania during the analysed
period is more or less constant. The most
stable farmers' land holdings group is
households that use more than 10 hectares of
agricultural land. In Lithuania, the average
stability coefficient of the number of holdings
is 1.08.
4) Survey results suggest that successful
competition in agriculture may be ensured by
land consolidation, whereas the preparation of
rural development land management projects
is also recommended so as to transform
agricultural land holding and guarantee the
rational use of agricultural land: to form
farming land plots having similar
characteristics and determine their
recommended use (composition of the
planned agricultural crops and crop rotations)
with regard to economic policy and
environmental protection requirements as well
as to identify other land management
Proceedings of the 2016 International Conference “ECONOMIC SCIENCE FOR RURAL DEVELOPMENT” No 41
Jelgava, LLU ESAF, 21-22 April 2016, pp. 15-23
1Corresponding author. Tel.: + 37061860164; fax: + -. E-mail address: [email protected]. 23
measures required for the functioning of the
farm. The competitiveness of the farm largely
depends on state subsidies and the EU
support as well.
Bibliography
1. Abalikstiene, E., Stravinskiene, V. (2011). Land Use Analysis in Southeastern Lithuania. Rural Development: Proceedings of the International Scientific Conference, pp. 372-377.
2. Aleknavicius, P. (2007). Kaimiskuju teritoriju zemes naudojimo problemos: Zemes ukio mokslai (Problems of Rural Land Usage: Agricultural sciences). Lietuvos mokslu akademija (Lithuanian Academy of Sciences), Volume 1, pp. 84-90.
3. Aleknavicius, P., Aleknavicius, A., Jukneliene, D. (2012) Lietuvos žemės ūkio paskirties žemės naudojimo perspektyvos (Prospective of Agricultural Land Utilisation in Lithuania). Kaimo raidos kryptys žinių visuomenėje (Rural Development Trends in Knowledge Society) Volume 4, Issue 2, pp. 15-26.
4. Benjamin, E., Graeub, M., Chappell, J., Wittman, H., Bezner, R., Samuel, L., Gemmill-Herren, B., (2015). The State of Family Farms in the World. World Development. Food and Agriculture Organization of the United Nations. Retrieved: http://ac.els-cdn.com/S0305750X15001217/1-s2.0-S0305750X15001217main.pdf?_tid=b7300a34-b466-11e5-b437. Access: 20.12.2015.
5. Davidova, S., Thomson, K. (2013). Family Farming: A Europe and Central Asia Perspective. Retrieved: www.fao.org/fileadmin/user_upload/Europe/documents/Events_2013/FF_EU. Access: 19.12.2015
6. Hazell, P., Poulton, C., Wiggins, S., & Dorward, A. (2010). The Future of Small Farms: Trajectories and Policy Priorities. World Development, Volume 10, Issue 38, pp. 1349–1361.
7. Kazakevicius, Z. (2011). Zemes istekliu naudojimo Lietuvos ukininku ukiuose vertinimas (Assessment of Utilisation of Land Resources in Lithuanian Farmers Farms). Management Theory and Studies for Rural business and Infrastructure Development, Volume 27, Issue 3.
8. Land Fund of the Republic of Lithuania, January 1 of 2009-2014. National Land Service under the Ministry of Agriculture of the Republic of Lithuania, State Institution Centre of Registers – Vilnius.
9. Makuteniene, D. (2004). Zemes naudojimo intensyvumo priklausomybe nuo ukininku ukiu dydzio Lietuvoje (Land Use Intensity Dependence on the Size of Farmers Farms in Lithuania) . Vagos: LZUU mokslo darbai, Volume 18, Issue 65, pp.60-69.
10. Marsden, T., Sonnino R., (2008). Rural Development and There Regional State: Denying Multifunctional Agriculture in the UK. Journal of Rural Studies, Volume 24, pp. 422-431, Retrieved: http://www.swslim.org.uk/documents/themes/LT17-rural-development-regional-state.pdf. Access: 19.12.2015.
11. Silva, Jose Graziano da (2014). The Family Farming Revolution. Retrieved: http://www.fao.org/about/whoweare/directorgen/faodgopinionarticles/detail/en/c/212364/. Access: 19.12.2015.
12. Valciukiene, J., Atkoceviciene, V. (2015). The Change of Land Users in Lithuania during the Period between 1920 and 2014. Rural Development: Proceedings of the international Scientific Conference.
Proceedings of the 2016 International Conference “ECONOMIC SCIENCE FOR RURAL DEVELOPMENT” No 41
Jelgava, LLU ESAF, 21-22 April 2016, pp. 24-30
1Corresponding author. Tel.: +48 22 593 41 61 fax: + 48 225934202 E-mail address: [email protected] 24
NETWORKING AS A FORM OF COLLABORATION OF LOCAL ENTREPRENEURS IN POLAND
Wioletta Bienkowska-Golasa1, PhD
1Faculty of Economics Sciences, Warsaw University of Life Sciences (SGGW)
Abstract. The theoretical part of this thesis presents the essence and term of networking in a contemporary economy.
The empirical part is based on data from the Polish Agency for Enterprise Development. The data analysis led to the
conclusion that Polish entrepreneurs are deeply aware of the need to keep long-lasting relationships with customers as
well as suppliers and business partners. What is more, respondents were eager to share the information on networking
meetings with other entrepreneurs, which can later result in collaboration. Entrepreneurs were willing to tackle the
topics connected with both direct financial benefits and an indirect influence on their companies’ profits (soft skills).
Key words: networking, collaboration, entrepreneurship, local, Poland.
JEL code: R11
Introduction
In a contemporary economy, one can notice
increasingly sophisticated connections and
relations between various economic entities
(Rokicki T., 2013). Considering a given area as a
business one, it can be assumed that they are
self-sufficient organizations. Therefore, gaining
the factors that contribute to their development
should result from an internal power (potential)
of a given region or town (Makiela Z., 2013). Yet,
it seems that the reality is slightly different. It is
necessary to realize that in the structure of the
world system, regions competitiveness is not
based on the traditional allocation effectiveness
any longer but on the adaptation effectiveness,
which consists in taking various forms of activity
coordination, generally called networking
(Miszczak K., 2012).
Innovative and entrepreneurial regions have
modern organization management methods, they
are distinguished by huge self-dependence and
speed in taking decisions, and they enter into
alliances to carry out various projects. Such
regions are perceived as modern elements of the
European networking structure, and their
essential role is to establish contacts with new
partners. This mainly results from the fast
changes and increasing sophistication of the
environment, which considerably limits the
autonomy of single companies, towns, regions,
and countries. It is more and more often
connected to searching for sources of competitive
advantage outside internal borders, which the
literature refers to as a networking approach.
Taking into account the extent of reasons and
consequences of the latest changes in company
management, it is necessary to narrow the
discussion on this issue.
That is why the article was to assess
networking meetings of entrepreneurs whose
companies were located in the capital of Poland –
Warsaw. This survey was conducted by the Polish
Agency for Enterprise Development in two stages
from September 2012 to October 2014 and it
covered 6 quarters of Warsaw (Ochota, Wola,
Praga-Poludnie, Targowek, Ursynow, and
Wilanow). The research task was identifying
entrepreneurs’ approach to establishing business
relations, in other words, what benefits and
barriers connected to networking they saw. It
was done by means of the method of diagnostic
survey with the use of the technique of a
standardized questionnaire. Three hundred sixty
businessmen were surveyed, including those who
had not participated in networking meetings.
The essence and term of networking in a
contemporary economy
The development of a networking model of an
economy is considerably influenced by more and
more sophisticated and inter-related processes
and phenomena which affect entrepreneurs. This
form of collaboration between various entities
resulted from progressing globalization, growth of
different transactions, and increasing diversity of
Proceedings of the 2016 International Conference “ECONOMIC SCIENCE FOR RURAL DEVELOPMENT” No 41
Jelgava, LLU ESAF, 21-22 April 2016, pp. 24-30
1Corresponding author. Tel.: +48 22 593 41 61 fax: + 48 225934202 E-mail address: [email protected] 25
products and services (Golasa P., 2013). If an
enterprise is to participate in such a sophisticated
economic reality, where variety and complexity
are growing at the same time, elasticity is
necessary. It is the elasticity of entrepreneurs’
behaviour that contributed to the development of
new collaboration forms, which, consequently,
enabled access to information, skills, and
technology that a particular entity had not
possessed and that had been costly to gain. In
result, networks appeared, including company
networks (Korenik S., 2011). It is a network
advantage that responsibility for activities is
divided between numerous partners that are part
of it, particular entities avoid overlapping
expenses, have higher elasticity, and faster
access to information and technology
(Domanski R., Marciniak M., 2003).
The source literature defines networks in
various ways. In its primary meaning, a network
was a group of enterprises related to each other
by diverse trade links to meet a specific market
demand (Miszczak K., 2012). The most generally,
however, networks can be defined as an
organizational structure which does not possess
hierarchy, formal management and
subordination, and where information and
collaboration relationships are prevalent
(Kozusznik B., 2011). Therefore, it can be
claimed that it is a system of links between
people or organizational entities that belong to a
given network which consists in sharing
information, ideas, resource etc. In other words,
a network is a set of selected links to chosen
partners being part of market relations of
enterprises (Jewtuchowicz A., 1997). The general
term of companies’ network is understood as
their involvement in various long-lasting
relationships with external business and social
partners, including public administration (central
and self-government one) representatives
(Cieslik J., Dabrowski J., Koladkiewicz I., 2014).
The most important aim of a network
company is to gain synergy through an
engagement in a collaboration of many economic
partners, and the synergy is possible to achieve
thanks to the adjustment of one’s operational
activity to the strategy of the whole network.
Therefore, a coordination mechanism in a given
network organization plays a significant role. It is
responsible for activities taken in a particular
network and it organizes the transfer of tangible
and intangible assets in this system
(Lachiewicz S., Zakrzewska-Bielawska A., 2012).
The source literature provides various
classifications of network organization (of
enterprises which belong to a network). Among
other things, authors distinguish a classification
as regards the permanence and strength of
relations between entities that belong to a
network (integrated networks, contract networks,
direct relationships networks). Considering the
extensiveness of the issue, the discussion was
narrowed and the article presents the
classification describing relationships between
partners that includes:
• supplier networks – which cover
subcontracting alliance between a customer
and suppliers of indirect elements of
production;
• producer networks – which enable competing
producers to combine their production
capability, financial and human resources to
extend their product offer and geographical
range;
• customer networks – which are fixed-term
relationships of production companies with
their distributors, marketing channels, trade
middlemen that complete a product with
various elements, and end users in domestic
or international markets;
• technological collaboration networks – which
enable acquisition of product projects and
production technology, joined production, and
development of technology as well as sharing
scientific knowledge and research and
development work results (Lachiewicz S.,
Zakrzewska-Bielawska A., 2012).
Proceedings of the 2016 International Conference “ECONOMIC SCIENCE FOR RURAL DEVELOPMENT” No 41
Jelgava, LLU ESAF, 21-22 April 2016, pp. 24-30
1Corresponding author. Tel.: +48 22 593 41 61 fax: + 48 225934202 E-mail address: [email protected] 26
Networking can also be moved into regional
and local policy. It was called a factor of external
partner relations of self-government entities.
Partnerships are registered as regards both
towns and regions of a territory
(Przybyla Z., 2008). Building intra- and inter-
regional networks contributes to strengthening
competitiveness. Extending collaboration with
external partners from other regions or even
countries enables to build direct contacts
between interested parties, which makes gaining
synergy possible. A network in a region consists
of cooperatively related self-government entities
(districts, poviats, voivodeships) and those
concentrated on processes (enterprises,
universities, research institutions, business-
related service companies etc.) (Makiela
Z., 2013). Establishing such a form of inter-
regional collaboration which covers various
market institutions aims at boosting economic
growth. Creating an appropriate corporate culture
and the best development conditions in a
particular region should be the purpose of this
collaboration (Grosse T. G., 2004).
Research results and discussion
The interest in local enterprise dimension has
appeared in Poland relatively recently. On the
one hand, it results from the growing influence of
local communities on citizens’ quality of life, on
the other hand, it is also a group of definitely
different interests but of large capability to
influence the local community situation (e.g. as
regards employment). The source literature
mentions three characteristics describing “an
entrepreneurial local community”. They are: local
companies interested in development; internal
integration of local businessmen’s environment (a
network which generates added value);
entrepreneurs’ integration with other members of
local collaboration, keeping a group’s identity. On
the Polish conditions, one more characteristic
should be added to the abovementioned. It is an
efficient system of communication channels
between businessmen and local self-government
(Cieslik J., Dabrowski J., Koladkiewicz I., 2014).
As the significance of businessmen’s
networking is starting to be noticed in Poland as
well, activities were initiated to research this
issue among entrepreneurs in the agglomeration
of Warsaw as part of the project Spoleczne
Forum Przedsiebiorczosci (Social Forum of
Enterprise). This survey was conducted by the
Polish Agency for Enterprise Development in two
stages from September 2012 to October 2014
and it covered 6 quarters of Warsaw (Ochota,
Wola, Praga-Poludnie, Targowek, Ursynow, and
Wilanow). The first stage of the project consisted
in running diagnostic studies which aimed at
identifying entrepreneurs’ approach to
establishing business relations, in other words,
what benefits and barriers connected to
networking they saw. It was done by means of
the method of diagnostic survey with the use of
the technique of a standardized questionnaire.
Three hundred sixty businessmen were surveyed
(including those who had not participated in
networking meetings), and the structure of this
sample reflected the structure of Warsaw
entrepreneurs’ population because the vast
majority of them are micro entrepreneurs
(90 %).The results of the first stage of the
survey are presented in Table 1.

Proceedings of the 2016 International Conference “ECONOMIC SCIENCE FOR RURAL DEVELOPMENT” No 41
Jelgava, LLU ESAF, 21-22 April 2016, pp. 24-30
1Corresponding author. Tel.: +48 22 593 41 61 fax: + 48 225934202 E-mail address: [email protected] 27
Table 1
Benefits and barriers in entrepreneurs’ networking (in %)
Benefits* Percentage of replies
Improvement of product and service quality 33
Greater number of customers 27
Collaboration with a greater number of suppliers and contractors 18
Lower costs 16
No technical problems 12
Developing employees’ qualifications and skills 7
Opportunity to gain financial support 4
Barriers* Percentage of replies
Too little time 47
Too few occasions to establish business contacts 34
Too long period before benefits from contacts appear 31
No confidence in business partners 30
No benefits from sharing experience 23
Other 2 *A respondent was allowed to indicate more than one answer
Source: the author’s own work based on: J. Cieslik, J. Dabrowski, I. Koladkiewicz (2014). Lokalne sieci przedsiebiorcow (Local networks of entrepreneurs). In Raport o stanie sektora malych i srednich przedsiebiorstw w Polsce w latach 2012 – 2013 (Report on the condition of small and medium-sized enterprises in Poland in 2012-2013). Warsaw: the Polish Agency for Enterprise Development, p. 119 - 120.
The second stage of the survey covered only
those businessmen who actively participated in
networking meetings (214 people). Figure 1
presents data concerning recommendations of
people met as part of networking meetings
(broken by industries) to other entrepreneurs
who did not take part in those meetings.
*A respondent was allowed to indicate only one reply
Source: the author’s own work based on: J. Cieslik, J. Dabrowski, I. Koladkiewicz (2014). Lokalne sieci przedsiebiorcow (Local networks of entrepreneurs). In Raport o stanie sektora malych i srednich przedsiebiorstw w Polsce w latach 2012 - 2013 (Report on the condition of small and medium-sized enterprises in Poland in 2012-2013). Warsaw: the Polish Agency for Enterprise Development, p. 122.
Fig. 1. Recommending people met at networking meetings to other entrepreneurs – by industries, %
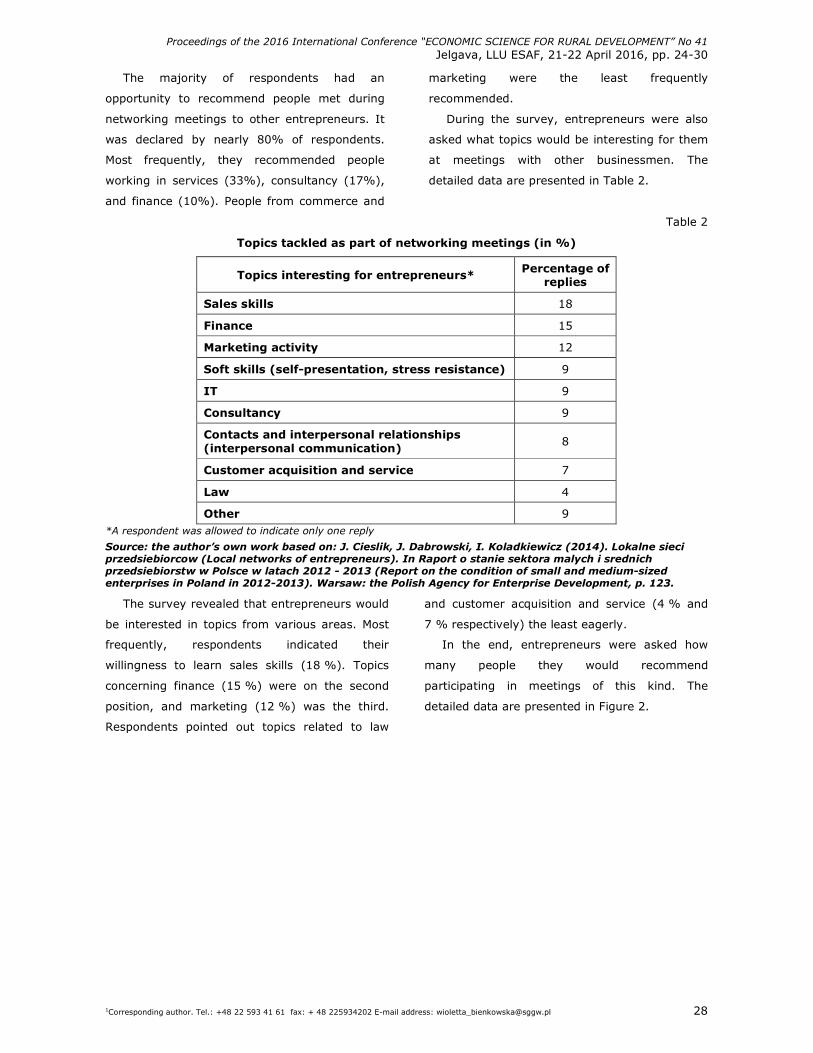
Proceedings of the 2016 International Conference “ECONOMIC SCIENCE FOR RURAL DEVELOPMENT” No 41
Jelgava, LLU ESAF, 21-22 April 2016, pp. 24-30
1Corresponding author. Tel.: +48 22 593 41 61 fax: + 48 225934202 E-mail address: [email protected] 28
The majority of respondents had an
opportunity to recommend people met during
networking meetings to other entrepreneurs. It
was declared by nearly 80% of respondents.
Most frequently, they recommended people
working in services (33%), consultancy (17%),
and finance (10%). People from commerce and
marketing were the least frequently
recommended.
During the survey, entrepreneurs were also
asked what topics would be interesting for them
at meetings with other businessmen. The
detailed data are presented in Table 2.
Table 2
Topics tackled as part of networking meetings (in %)
Topics interesting for entrepreneurs* Percentage of replies
Sales skills 18
Finance 15
Marketing activity 12
Soft skills (self-presentation, stress resistance) 9
IT 9
Consultancy 9
Contacts and interpersonal relationships (interpersonal communication)
8
Customer acquisition and service 7
Law 4
Other 9 *A respondent was allowed to indicate only one reply
Source: the author’s own work based on: J. Cieslik, J. Dabrowski, I. Koladkiewicz (2014). Lokalne sieci przedsiebiorcow (Local networks of entrepreneurs). In Raport o stanie sektora malych i srednich przedsiebiorstw w Polsce w latach 2012 - 2013 (Report on the condition of small and medium-sized enterprises in Poland in 2012-2013). Warsaw: the Polish Agency for Enterprise Development, p. 123.
The survey revealed that entrepreneurs would
be interested in topics from various areas. Most
frequently, respondents indicated their
willingness to learn sales skills (18 %). Topics
concerning finance (15 %) were on the second
position, and marketing (12 %) was the third.
Respondents pointed out topics related to law
and customer acquisition and service (4 % and
7 % respectively) the least eagerly.
In the end, entrepreneurs were asked how
many people they would recommend
participating in meetings of this kind. The
detailed data are presented in Figure 2.
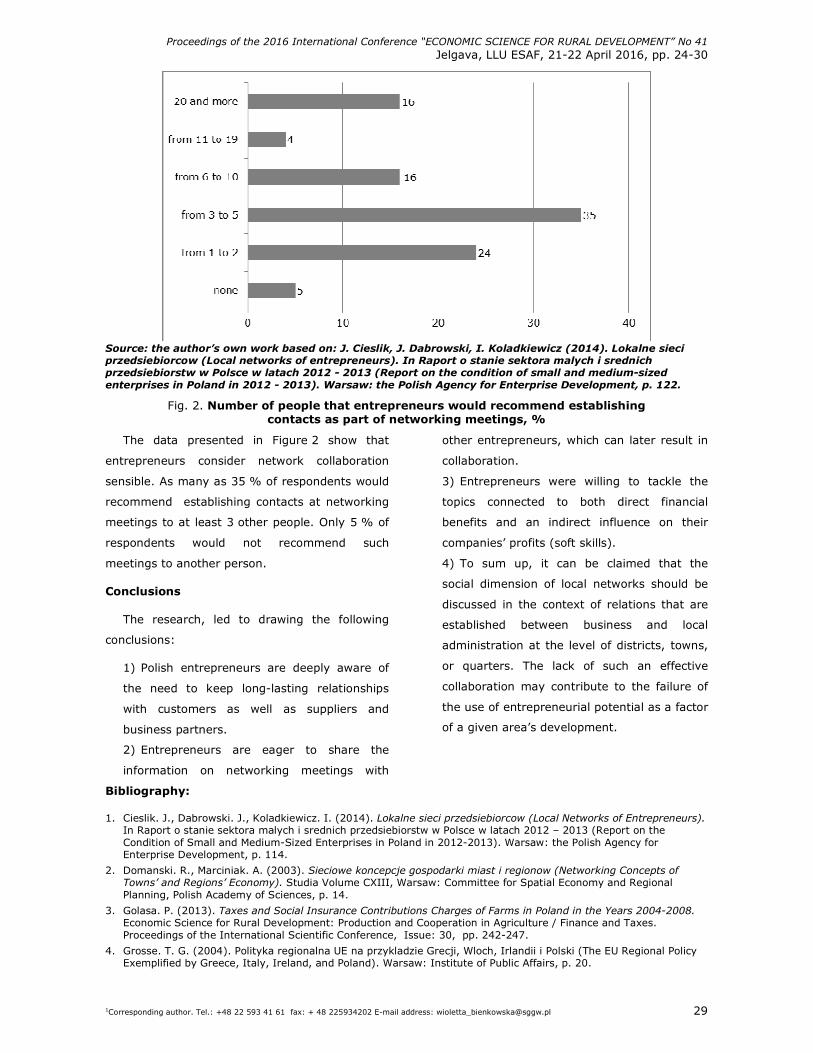
Proceedings of the 2016 International Conference “ECONOMIC SCIENCE FOR RURAL DEVELOPMENT” No 41
Jelgava, LLU ESAF, 21-22 April 2016, pp. 24-30
1Corresponding author. Tel.: +48 22 593 41 61 fax: + 48 225934202 E-mail address: [email protected] 29
Source: the author’s own work based on: J. Cieslik, J. Dabrowski, I. Koladkiewicz (2014). Lokalne sieci przedsiebiorcow (Local networks of entrepreneurs). In Raport o stanie sektora malych i srednich przedsiebiorstw w Polsce w latach 2012 - 2013 (Report on the condition of small and medium-sized enterprises in Poland in 2012 - 2013). Warsaw: the Polish Agency for Enterprise Development, p. 122.
Fig. 2. Number of people that entrepreneurs would recommend establishing contacts as part of networking meetings, %
The data presented in Figure 2 show that
entrepreneurs consider network collaboration
sensible. As many as 35 % of respondents would
recommend establishing contacts at networking
meetings to at least 3 other people. Only 5 % of
respondents would not recommend such
meetings to another person.
Conclusions
The research, led to drawing the following
conclusions:
1) Polish entrepreneurs are deeply aware of
the need to keep long-lasting relationships
with customers as well as suppliers and
business partners.
2) Entrepreneurs are eager to share the
information on networking meetings with
other entrepreneurs, which can later result in
collaboration.
3) Entrepreneurs were willing to tackle the
topics connected to both direct financial
benefits and an indirect influence on their
companies’ profits (soft skills).
4) To sum up, it can be claimed that the
social dimension of local networks should be
discussed in the context of relations that are
established between business and local
administration at the level of districts, towns,
or quarters. The lack of such an effective
collaboration may contribute to the failure of
the use of entrepreneurial potential as a factor
of a given area’s development.
Bibliography:
1. Cieslik. J., Dabrowski. J., Koladkiewicz. I. (2014). Lokalne sieci przedsiebiorcow (Local Networks of Entrepreneurs). In Raport o stanie sektora malych i srednich przedsiebiorstw w Polsce w latach 2012 – 2013 (Report on the Condition of Small and Medium-Sized Enterprises in Poland in 2012-2013). Warsaw: the Polish Agency for Enterprise Development, p. 114.
2. Domanski. R., Marciniak. A. (2003). Sieciowe koncepcje gospodarki miast i regionow (Networking Concepts of Towns’ and Regions’ Economy). Studia Volume CXIII, Warsaw: Committee for Spatial Economy and Regional Planning, Polish Academy of Sciences, p. 14.
3. Golasa. P. (2013). Taxes and Social Insurance Contributions Charges of Farms in Poland in the Years 2004-2008. Economic Science for Rural Development: Production and Cooperation in Agriculture / Finance and Taxes. Proceedings of the International Scientific Conference, Issue: 30, pp. 242-247.
4. Grosse. T. G. (2004). Polityka regionalna UE na przykladzie Grecji, Wloch, Irlandii i Polski (The EU Regional Policy Exemplified by Greece, Italy, Ireland, and Poland). Warsaw: Institute of Public Affairs, p. 20.
Proceedings of the 2016 International Conference “ECONOMIC SCIENCE FOR RURAL DEVELOPMENT” No 41
Jelgava, LLU ESAF, 21-22 April 2016, pp. 24-30
1Corresponding author. Tel.: +48 22 593 41 61 fax: + 48 225934202 E-mail address: [email protected] 30
5. Jewtuchowicz. A. (1997). Przedsiebiorczosc, innowacje i konkurencyjnosc regionow (podstawowe pojecia i identyfikacja problemow) (Enterprise, Innovations, and Competitiveness of Regions (Basic Terms and Problem Identification). In Jewtuchowicz. A. (Ed.), Srodowisko przedsiebiorczosci – innowacje a rozwoj terytorialny (Enterprise Environment – Innovations and Territorial Development). Lodz: Wydawnictwo Uniwersytetu Lodzkiego, p. 13.
6. Korenik. S. (2011). Region ekonomiczny w nowych realiach społeczno-gospodarczych (An Economic Region in New Social and Economic Reality). Warsaw: Wydawnictwo CeDeWu Sp. Z o.o., p. 56.
7. Kozusznik. B. (2011). Zachowania człowieka w organizacji (Human Behaviour in an Organization). Warsaw: Polskie Wydawnictwo Ekonomiczne, p. 272.
8. Lachiewicz. S., Zakrzewska-Bielawska. A. (2012). Siec przedsiebiorstw jako skuteczna forma organizacyjna w warunkach kryzysu gospodarczego (Enterprise Networking as an Effective Organization form During an Economic Crisis). In Management and Business Administration. Central Europe, 4/2012 (117), Warsaw: Wydawnictwo Akademia Leona Kozminskiego, p. 37.
9. Makiela. Z. (2013). Przedsiebiorczosc i innowacyjnosc terytorialna. Region w warunkach konkurencji (Territorial Entrepreneurship and Innovativeness. A Region in Competitive Conditions). Warsaw: Wydawnictwo C.H. Beck, p. 219.
10. Miszczak. K. (2012). Dylematy rozwoju regionu ekonomicznego w swietle wyzwan XXI wieku (Dilemmas of an Economic Region Development Against the 21st Century Challenges). Wrocław: Wydawnictwo Uniwersytetu Ekonomicznego we Wroclawiu, p. 87.
11. Przybyla. Z. (2008). Terytorialne wiezi sieciowe (Territorial Networking). In Klamut. M. (Ed.), Ekonomia i miedzynarodowe stosunki gospodarcze (Economics and International Economic Relations). Wroclaw: Wydawnictwo Uniwersytetu Ekonomicznego we Wroclawiu, p. 105.
12. Rokicki. T. (2013). The Importance of Logistics in Agribusiness Sector Companies in Poland. Economic Science for Rural Development: Production and Cooperation in Agriculture / Finance and Taxes. Proceedings of the International Scientific Conference, Issue 30, pp. 116-120.
Proceedings of the 2016 International Conference “ECONOMIC SCIENCE FOR RURAL DEVELOPMENT” No 41
Jelgava, LLU ESAF, 21-22 April 2016, pp. 31-37
1Corresponding author. Tel.: + 48895233822; E-mail address: [email protected] 31
RURAL COOPERATIVE MOVEMENT – PROSPECTS OF CHANGES Zbigniew Brodzinski1, PhD with “habilitation”; Adam Pawlewicz2, PhD
1 Department of Spatial and Environmental Economics, University of Warmia and Mazury in Olsztyn, Poland
2 Department of Agrotechnology, Agricultural Production Management and Agribusiness, University of Warmia and Mazury in Olsztyn, Poland
Abstract. The paper draws attention to the fact that the development of cooperative forms of administration in rural
areas fosters job creation, integration of dispersed resources, and an increase in the activity of people with lower
incomes. Despite the collapse of the cooperative movement, cooperatives begin to restore their potential; however, in
addition to the few traditional cooperatives which have adapted to the market economy conditions, the so-called new
cooperatives keep emerging. Particularly important areas of the activity of those cooperatives include: well-being
services, renewable energy generation based on the use of substrates from agricultural sources, small-scale
production, provision of services to the elderly, and support of tourism. The aim of the study was to indicate the
possibilities for the development of rural cooperative movement based on opinions of the cooperative sector
representatives. The study was carried out in 2015, using an interviewer questionnaire, on a purposely selected group
of 88 managers representing a variety of forms and types of cooperatives operating in rural areas in the north-eastern
Poland.
Key words: cooperatives, rural areas,
JEL code: D7, Q13
Introduction
Opinions on the role and significance of
cooperative forms of conducting economic
activities by rural inhabitants, expressed in the
literature on the subject, are diametrically
opposed. On the one hand, the status of the
development of rural cooperative movement is
being paid little attention to, and each
enhancement of this status with new entities or
spheres of activity is considered a secondary
effect being an element of the general interest in
the idea of cooperatives. On the other hand, it is
commonly believed that the level of market
competitiveness of cooperative entities is low.
The views belittling the role and significance of
the cooperative movement as a manner of
administration are, however, being replaced by
opinions recognising cooperatives as an
important area of social and economic activities
of the rural population (Chaddad F. R.,
Cook M. L., 2004; Kawa M., Kuzniar W., 2009;
Brodzinski M. G., 2011). A cooperative is,
primarily, an instrument allowing more effective
operation, since in this way it is possible to
reduce costs and, at the same time, increase the
value of a product as well as the opportunities to
compete (Bite L. et al., 2013). However, it needs
to be borne in mind that a cooperative is an
autonomous association of people who act on a
voluntary basis to satisfy common economic,
social and cultural needs, and strive to fulfil
aspirations through common ownership and
democratic control of the enterprise
(Gupta C., 2014).
The experience indicates that in the Western
European countries, the participation of
cooperatives in economic activities is greater
than that in post-socialist countries. In the
economically developed EU countries, farmers
sell more than 60 % of their produce through
cooperatives. Such a strong position of
agricultural cooperatives has been requiring an
improvement in the economic effectiveness and
organisational efficiency of a cooperative
enterprise, and, at the same time, care for the
maintenance of the cooperative identity.
As regards Poland, despite the downward
trend prevailing since the beginning of the 1990s,
Polish cooperatives still have a large economic
base and an approx. 3 % share in the national
labour market and in production of the entire
national economy. They play an important role in
local communities by supplying products and
services to local markets, and have, in 40%
Proceedings of the 2016 International Conference “ECONOMIC SCIENCE FOR RURAL DEVELOPMENT” No 41
Jelgava, LLU ESAF, 21-22 April 2016, pp. 31-37
1Corresponding author. Tel.: + 48895233822; E-mail address: [email protected] 32
cases, a dominant position in these markets
(Nalecz S., Konieczna-Salamatin J., 2008).
It is estimated that out of approx.
17.15 thousand cooperatives operating in Poland,
17.6 % of them are cooperatives engaged in
agriculture and hunting as well as services
related to these areas, while another 11.6 % of
them are cooperatives conducting economic
activities in the processing sector
(Krysiak I., 2006; Zmija J., 2013). Despite the
negative experiences of the past period, the
cooperatives which have gone through the
restructuring process are coping much better in
the present reality. After losing the protective
umbrella of the state, they reorganised their
structures and adjusted their objectives to both
the market economy conditions and cooperative
members’ expectations
(Mickiewicz A. et al., 2014).
When observing the ongoing debate on the
European Union forum, one may notice that the
cooperative forms of administration and social
activity fit into the social economy attracting
more and more interest from the public.
However, a major problem that remains is that
the value of cooperation is most often measured
as monetary compensation, while other, non-
financial benefits of cooperation are rarely
appreciated (Ryhänen M. et al., 2013).
Cooperatives, similarly to other forms of social
enterprises, are characterised by:
• a welfare or social objective of common
interest, which is an important element in
conducting commercial activities;
• reinvestment of a significant portion of profits
in the accomplishment of social objectives;
• the way of organising or a system of
ownership reflecting the mission, based on
democratic or participatory principles, and
aimed at social justice (Inicjatywa …, 2011).
However, these advantages, beneficial from
the social point of view, give rise to concern as to
whether a cooperative, as a form of conducting
economic activities, may be of interest to
entrepreneurial people. On the one hand, given
the experience gained from the previous political
system, the vast majority of rural population
either place no trust in cooperatives or consider
such entities as rather uncompetitive. On the
other hand, there are few cooperatives which
could serve as an example to people and groups
searching for opportunities to run a business
jointly. Entrepreneurial people, while deciding to
conduct economic activities in a cooperative
form, take responsibility for a group at the same
time, and are virtually obliged to stimulate the
local community.
When observing the process of setting up and
development of new cooperatives, one can notice
that the decisions on the manners of production
of goods and provision of services are mainly
targeted at objectives of social nature1 as well as
the supply of goods intended for vulnerable
population groups (in rural areas, this primarily
includes assistance to the elderly or the disabled,
child care, access to the employment and training
etc.).
The advantages of the cooperative form of
administration, as indicated in the literature, are
associated with the following aspects thereof:
• joint ownership, joint decision making, and
joint responsibility;
• stability and safety of the employment, and
egalitarianism, in particular in terms of pay;
• a sense of being a part of the community,
which inter alia contributes to an increase in
motivation and productivity, and to greater
attention to the joint property;
• distribution of profit which remains with
workers – members of the cooperative;
• lower capital required for setting up of a
cooperative, as compared to that required for
companies;
1 i.e. social or occupational inclusion through the access to employment for people being disadvantaged, in particular due to their low qualifications or social/occupational problems leading to the exclusion and marginalisation.
Proceedings of the 2016 International Conference “ECONOMIC SCIENCE FOR RURAL DEVELOPMENT” No 41
Jelgava, LLU ESAF, 21-22 April 2016, pp. 31-37
1Corresponding author. Tel.: + 48895233822; E-mail address: [email protected] 33
• financial liability being smaller than in sole
proprietorships and companies;
• tradition of the cooperative movement;
• social and educational functions
(Kodeks dobrych praktyk …, 2008).
The opinion according to which the
cooperative sector stimulates the dispersed
capital as well as labour resources in local
environments arouses no controversy
(Brzozowski B., 2014). However, despite the
numerous, above-mentioned advantages of
cooperatives, they are going through a crisis,
even in the countries in which they have been
developing very rapidly. This is observed at three
levels associated with defining the following:
• own identity (cooperatives which have
achieved success become similar to
conventional enterprises);
• measures aimed at an improvement in
efficiency (given their social objectives and a
democratic style of management, the
economic efficiency of cooperatives may be
lower);
• the way the environment perceives the
cooperative forms of administration (the lack
of understanding among policy makers, other
entrepreneurs, and the general public).
The aim of the study was to indicate the
possibilities for the development of rural
cooperative movement based on opinions of the
cooperative sector representatives. The study
was carried out in 2015, using an interviewer
questionnaire, on a purposely selected group of
88 managers representing a variety of forms and
types of cooperatives operating in rural areas in
the north-eastern Poland. Participants of the
study represented cooperatives which employ
their members and conduct activities in the areas
of (agricultural) production, trade, agri-food
processing, services etc.
Research results and discussion
A cooperative as a suggested form of
conducting economic activities
The cooperative movement in Poland begins
to be perceived again as an attractive form of
collective entrepreneurship of rural inhabitants2.
In the Western European countries, as noted by
Mering T. (2013), in certain sectors cooperatives
play an important role, and their emergence
results from searching for a form of conducting
economic activities, which is an alternative to
privately owned enterprises. The view that
cooperatives as a form of collective
resourcefulness provide actual opportunities for
economic and social activity of people with low
and medium incomes, prevent their social
exclusion, and alleviate the economic and social
inequalities, is expressed more and more
emphatically (Krasuska B., 2009;
Pawlewicz A., 2014). Importance of horizontal
integration in organic farming. Economic Science
for Rural Development.Jelgava, Latvia University
of Agriculture, No. 34. 2014. pp. 112-120.).
Due to the specificity of cooperative forms of
administration, they are an offer of business
organisation particularly in the regions, the
development of which is lagging behind, in which
other forms of conducting economic activities are
less profitable. In addition to satisfying economic
needs, cooperatives serve functions of self-help,
social, and welfare nature. The functioning of
cooperatives may create an opportunity for
economic and social activity of various
occupational or social groups, in particular those
with lowest incomes (Dyka S.,
Grzegorzewski P., 2000).
While searching for opportunities for
supporting the development of projects of
cooperative nature, one should take account of
2 Tradition of the cooperative movement in Poland dates back to the second half of the 19th century. A cooperative form of administration has proven successful in various periods, particularly in the areas inhabited by a poorer population. Experience gained from the past indicates that this form of management plays a significant economic and social role.
Proceedings of the 2016 International Conference “ECONOMIC SCIENCE FOR RURAL DEVELOPMENT” No 41
Jelgava, LLU ESAF, 21-22 April 2016, pp. 31-37
1Corresponding author. Tel.: + 48895233822; E-mail address: [email protected] 34
the numerous barriers associated with the
operation of cooperatives. The authors’ research
reveals that those most often indicated by
members of cooperatives are as follows (each of
the presented barriers was identified by at least
30 % respondents):
• the market situation which promotes private
entities;
• unfair competition;
• difficulties in raising funds for development;
• democratic form of management, due to
which, in many cases, pressure is exerted by
members of the cooperative who demand that
the profits be realised quickly in a form of a
dividend;
• hostile environment, primarily the institutional
one;
• rural inhabitants’ sceptical approach to this
form of administration.
The above list of limitations to the operation
of cooperatives is not exhaustive, and many of
the presented barriers are mentioned in
discussions on the support for rural inhabitants’
entrepreneurship in general.
When the participants of the study were asked
to justify the need for developing the activities of
the already existing cooperatives and setting up
new ones, more than every third respondent
indicated the following reasons (each participant
of the study could provide a few answers):
• possibilities for solving problems of local
unemployment which increases with the
consolidation of market economy;
• a low financial risk associated with conducting
economic activities in a form of a cooperative;
• the necessity to satisfy diverse local needs
articulated by certain social groups, and, at
the same time, from the growing awareness
that the cooperative form is appropriate for
satisfying those particular needs;
• the need for developing social activity which,
for many people, determines their functioning
in the local environment.
From the study participants’ perspective, it is
difficult to assess the preferences with regard to
cooperatives in terms of the development of
productive activities and services. Everybody
awaits the stabilisation of the operation instead
of the development of activities, particularly by
undertaking new activities. On the one hand,
however, it should be noted that members of
cooperatives search for innovations. On the other
hand, they point out that decisions concerning
setting up of a cooperative or the implementation
of a project are determined by the availability of
support from the EU funds. Cooperatives have
made use of these funds, and it was observed
that their members awaited further possibilities
for using this aid. According to more than 3/4 of
the interviewed participants, the economic
effectiveness of cooperatives operating on the
free market economy conditions is not lower in
comparison to other legal forms of enterprises
operating in Poland, and the existing differences
may arise not so much from lower
competitiveness of cooperatives as from the
differences in the manner of taking decisions and
conducting activities (orientation towards social
objectives).
Representatives of cooperatives participating
in the study were able to indicate numerous
examples of non-economic functions being
performed by the cooperatives they were
representing. As examples of their own activities
of this type, they most often indicated the
material and organisational assistance to public
institutions, and the participation in organisation
of local events supporting the integration of
inhabitants.
As regards barriers to the development of
cooperatives in rural areas, and those standing in
the way of the development of cooperative
movement in Poland, the study participants
particularly indicated the low level of awareness,
particularly in rural inhabitants, of the operation
of a cooperative. Cooperatives are often
perceived by the public as a “relic of the past”.
Proceedings of the 2016 International Conference “ECONOMIC SCIENCE FOR RURAL DEVELOPMENT” No 41
Jelgava, LLU ESAF, 21-22 April 2016, pp. 31-37
1Corresponding author. Tel.: + 48895233822; E-mail address: [email protected] 35
Another identified barrier is the problem of
unfavourable legislative solutions, in the light of
which cooperatives are treated as companies,
which, given the relatively low starting capital,
inhibits the emergence of cooperatives
(especially social ones).
Representatives of rural cooperative
movement are aware of their participation in the
promotion of cooperative movement in rural
areas in Poland; moreover, they notice specific
manners of removing barriers to this emergence.
They are convinced that this is the activity of
cooperatives that is conducive to the promotion
of various forms of cooperation, principally
among the mass of dispersed, numerous
agricultural producers as well as the socially
excluded.
New cooperative forms of entrepreneurship
Experience shows that cooperatives appear to
be particularly effective in those areas of socio-
economic life in which failures of the market of
the state policy are observed, e.g. in the social
services sector. Observation of changes in the
economic scene of Polish rural areas allows one
to notice that in addition to the traditional forms
of cooperatives, new ones emerge, including
cooperatives functioning as groups of agricultural
producers, social, machinery, and energy
cooperatives as well as other forms of
cooperatives, the so-called “new wave” ones.
In Poland, cooperative groups of agricultural
producers (GAPs) amount to approx. 30 % of the
total of functioning groups, and have 2.5-times
more members – agricultural producers than
groups organised as limited liability companies
(Spoldzielcze …, 2015). The authors’ own
research lead to the conclusion that GAP
members consider the cooperative form of
administration to be convenient and safe, and
requiring no particularly increased activity and
commitment on their part. However, in the
market economy conditions, there is no
possibility for conducting rational and effective
activities without the involvement of cooperative
members.
In the West European countries, well-
organised agricultural producers in agricultural
cooperatives combine the market offer of many
farms, which multiplies their economic power and
market opportunities (Gorka M., Ruda M., 2012;
Altman M., 2015). One of the main objectives of
setting up a group of agricultural producers is the
sale, by the group members, of all products or
the entire range of products manufactured in
farms through the group.
As regards social cooperatives, their area of
economic activities is linked to the skills of both
founders and workers. Social cooperatives are
distinct from commercial entities due to the
orientation of their activities towards the
accomplishment of social objectives, and their
functioning is not subject to the criteria of
profitability, economic effectiveness and
competitiveness (Thomas A., 2004). Organisation
of economic activities in a form of a social
cooperative is, as noted by Krasuska B. (2009), a
proposal addressed mainly to the unemployed,
homeless, addicted, mentally ill, migrants, or
disabled people who, for a variety of reasons, are
not able to independently undertake economic
activities. They are, however, interested in
undertaking cooperative economic activities in a
group, and thus in dissipating and reducing the
risk of running own business. Respondents who
represented this particular type of a cooperative
in the study emphasised that the nature of a
social cooperative was mainly determined by the
type of people who have set up the cooperative
and individual work of the members. The
observed, numerous projects involving setting up
social cooperatives in Poland in the years
2010-2014 are mainly an effect of supporting
such projects with external funding.
Machinery cooperatives are an organisational
form which is little known in Poland. High prices
of machinery and the dwindling purchasing power
of farms may, given the current situation of
Proceedings of the 2016 International Conference “ECONOMIC SCIENCE FOR RURAL DEVELOPMENT” No 41
Jelgava, LLU ESAF, 21-22 April 2016, pp. 31-37
1Corresponding author. Tel.: + 48895233822; E-mail address: [email protected] 36
Polish rural areas, and agriculture in particular,
be conducive to the organisation of farmers into
various systems of the collective use of
machinery. As indicated by the experience of
other European countries, cooperation and
benefits are always bilateral there – a farmer
provides services with their machines while being
provided with services offered by other farmers
(Maszynowa …, 2002). This form of organisation
of the system seems to be optimal to numerous
groups of farmers organising cooperation within a
relatively large area (a few villages), who have
limited investment opportunities. The experience
shows that the most frequently employed
methods for the use of machinery is informal
neighbourly help, often provided to each other
with no financial settlement (Harris A.,
Fulton M., 2000).
An energy cooperative is an offer of
cooperation involving joint investment of many
people in a prosumer installation. An interest in
cooperation will depend on the profitability of the
investment which, in the case of cooperatives, is
based to a large extent on the savings which may
be obtained by prosumers. An important
argument for the development of this type of
group activity is the prospect of the actual profit
on the energy resold to the grid
(Wilson E. J. et al., 2008; Yadoo A.,
Cruickshank H., 2010). A precursor of energy
cooperatives in Poland is Spoldzielnia Nasza
Energia (Cooperative “Nasza Energia”). Within
the area of partner communes, construction is
planned of a complex of biogas power plants
including a distribution system (low-voltage
power lines). In view of the alternative of an
increase in energy prices, it can be assumed that
energy cooperatives may be perceived by local
communities as an alternative way of gaining
access to renewable energy sources and
relatively cheap energy.
Conclusions, proposals, recommendations
Cooperatives should, by their nature, unite
people, since what is often successfully achieved
in interpersonal relationships is immeasurable,
and can bring about tangible effects in the longer
term. Operating in a group means assistance and
support in the development of new projects and
initiatives. Experience of many European
countries shows that rapid development of
certain branches of cooperatives, both the
traditional and the “new wave” ones, depends on
stable legislation as well as functioning
mechanisms of financial and advisory support.
These factors induce farmers and other rural
inhabitants to integrate within a cooperative, and
carry out joint projects in many areas of the
economy (trade, power generation, services).
The syndrome of an ineffectual, post-
communist cooperative is overcome by examples
of thriving, sometimes in close vicinity, dairy
cooperatives, cooperative groups of agricultural
producers, or social cooperatives. It is difficult to
predict the direction of changes; however, it is
worth to indicate cooperatives as an alternative
option of cooperation, particularly of persons and
entities that have no resources allowing the
implementation of economic initiatives requiring
substantial financial resources, undertaken in
niche areas.
To sum up, it can be concluded that the
promotion of cooperative forms of economic and
social activities in rural areas will always be
accompanied by ambivalence. Some people will
be convinced that promoting cooperatives means
a failure, and that the social system of running a
business is an anachronism. Others will argue
that cooperative forms of administration provide
the opportunity to find a manner of changing the
organisation of economic processes, and genuine
integration of rural inhabitants around social
values, and that the cooperative forms of
administration may significantly improve the
dynamics of multifunctional rural development. A
decision on this matter will never be
unambiguous. It seems that this form of
conducting economic activities fosters job
creation, integration of dispersed resources, and
Proceedings of the 2016 International Conference “ECONOMIC SCIENCE FOR RURAL DEVELOPMENT” No 41
Jelgava, LLU ESAF, 21-22 April 2016, pp. 31-37
1Corresponding author. Tel.: + 48895233822; E-mail address: [email protected] 37
an increase in the activity of people with lower
incomes. It was noted during the study that the
particularly important areas of activity of the
currently operating rural cooperatives are:
agricultural production and agri-food processing,
renewable energy generation based on the use of
substrates from agricultural sources, well-being
services, and services related to support of
tourism.
Bibliography
1. Altman, M. (2015). Cooperative Organizations as an Engine of Equitable Rural Economic Development. Journal of Co-operative Organization and Management, Volume 3(1), pp. 14-23.
2. Bite, L., Muska, A., Glusaka, D. (2013). Gains of Grain Producers from Horizontal Mergers in Zemgale Region. Economic Science for Rural Development. Volume 30, pp. 147-152.
3. Brodzinski M.G. (2011). Oblicza polskiej spoldzielczosci wiejskiej, poczatki - rozwoj – przyszlosc (The Face of Polish Rural Cooperatives, the Begining - Development - Future.). Krajowa Rada Spoldzielcza, Warszawa. p. 195.
4. Brzozowski B. (2014). Spoldzielczosc wiejska w aktywizacji srodowisk lokalnych (Rural Co-operatives Activating Local Environments). Zagadnienia Doradztwa Rolniczego, Volume 4. pp. 98-109.
5. Chaddad, F. R., Cook, M. L. (2004). Understanding New Cooperative Models: an Ownership–control Rights Typology. Applied Economic Perspectives and Policy, No. 26(3), pp. 348-360.
6. Dyka S., Grzegorzewski P. (2000). Zarzadzanie spoldzielnią (Management of the Co-operative). Wyd. Difin, Warszawa. p. 194.
7. Gorka, M., Ruda, M. (2012). Spoldzielcze formy gospodarowania na przykladzie rolniczych spoldzielni produkcyjnych (Cooperative Forms of Management – Agricultural Cooperatives). Nierownosci spoleczne a wzrost gospodarczy. UR. Volume 27, pp. 234-240.
8. Gupta, C. (2014). The Co-operative Model as a ‘Living Experiment in Democracy’. Journal of Co-operative Organization and Management, Volume 2(2), pp. 98-107.
9. Harris, A., Fulton, M. (2000). Farm Machinery Co-operatives: an Idea Worth Sharing. University Saskatchewan, Centre for the Study of Co-operatives. pp. viii.
10. Inicjatywa na rzecz przedsiebiorczosci spolecznej (Initiative on Social Entrepreneurship). Budowanie ekosystemu sprzyjającego przedsiebiorstwom spolecznym w centrum spolecznej gospodarki i spolecznych innowacji. (2011). KOMISJA EUROPEJSKA, Bruksela, dnia 25.10.2011, p. 15.
11. Kawa, M., Kuzniar, W. (2009). Rola spoldzielczosci jako instytucji w przeciwdzialaniu nierownosciom ekonomicznym i społecznym (The Role of Co-operative Movement in Counteracting Economic and Social Inequalities). Nierownosci spoleczne a wzrost gospodarczy. UR, Volume 15, pp. 310-317.
12. Kodeks dobrych praktyk spoldzielczych (Code of Good Practice Cooperative). (2008). Krajowa Rada Spoldzielcza, Warszawa, p. 1.
13. Krasuska, B. (2009). Spoldzielnia socjalna jako forma dzialalnosci gospodarczej (Social Cooperatives as a Form of Economic Activity). WUP w Warszawie. Wydział Regionalnej Polityki Rynku Pracy. Warszawa. p.19.
14. Krysiak, I. (2006). Informacja o sektorze spoldzielczym w Polsce (Information about the Cooperative Sector in Poland). Ekonomia Spoleczna teksty, p. 22.
15. Maszynowa Wspolnota w Unii Europejskiej (Machinery Community in the European Union). (2002). Retrieved: http://www.ppr.pl/artykul-maszynowa-wspolnota-w-unii-europejskiej-20152-dzial-9.php Access: 10.12.2015
16. Mering, T. (2013). Spoldzielczosc a polityka Unii Europejskiej w okresie kryzysu finansowego i gospodarczego (Cooperatives and the EU Policy During the Financial and Economic Crisis). Problemy Polityki Społecznej. Studia i Dyskusje, Volume 20, pp 67-87.
17. Mickiewicz, A., Mickiewicz, B., Wawrzyniak, B.M. (2014). Charakterystyczne cechy rolniczych spoldzielni produkcyjnych funkcjonujących w latach 1949-2010 (Characteristics of Agricultural Production Cooperatives Operating in the Years 1949-2010). Zagadnienia Doradztwa Rolniczego, Volume 3, pp. 51-71.
18. Nalecz, S., Konieczna-Salamatin, J. (2008). Polska spoldzielczosc na początku XXI w.: zasoby oraz wybrane funkcje społeczno-ekonomiczne (Polish Cooperative at the Beginning of the XXI Century: Resources and Selected Socio-economic Functions). Spoldzielczy Kwartalnik Naukowy, Volume 1, pp. 5-14.
19. Pawlewicz, A. (2014). Importance of horizontal integration in organic farming. Economic Science for Rural Development.Jelgava, Latvia University of Agriculture, No. 34. 2014. pp. 112-120.
20. Spoldzielcze Grupy Producentow Rolnych (Cooperative Groups of Agricultural Producers). Retrieved: http://www.krs.org.pl/index.php?option=com_content&view=article&id=162&Itemid=351 Access: 27.11.2015
21. Thomas, A. (2004). The Rise of Social Cooperatives in Italy. Voluntas: International Journal of Voluntary and Nonprofit Organizations, Volume 15(3), pp. 243-263.
22. Wilson, E. J., Plummer, J., Fischlein, M., Smith, T. M. (2008). Implementing Energy Efficiency: Challenges and Opportunities for Rural Electric Co-operatives and Small Municipal Utilities. Energy Policy, Volume 36(9), pp. 3383-3397.
23. Yadoo, A., Cruickshank, H. (2010). The Value of Cooperatives in Rural Electrification. Energy Policy, Volume 38(6), pp. 2941-2947.
24. Zmija, J. (2013). Wstep (Introduction). in: Spoldzielczosc w swiadomosci rolnikow i doradcow oraz praktyczne wykorzystanie idei spoldzielczej do rozwoju przedsiebiorczosci na obszarach wiejskich. CDR w Brwinowie, Krakow, pp. 3-4.
Proceedings of the 2016 International Conference “ECONOMIC SCIENCE FOR RURAL DEVELOPMENT” No 41
Jelgava, LLU ESAF, 21-22 April 2016, pp. 38-44
1Corresponding author. Tel.: + (371 29478176); fax: + (371 - 670343835). E-mail address: [email protected]. 38
SUPPORT MEASURES TO EMPLOYERS FOR WORK–BASED LEARNING Ilze Buligina1, Dr.admin.; Biruta Sloka2, Dr.oec. professor; Inara Kantane3, Dr.admin.
researcher, assistant prof., Anastasija Vilcina4, Dr.oec., professor
1 University of Latvia; J.Vitols Latvian Academy of Music , 2 University of Latvia, 3 University of Latvia; University College of Economics and Culture, 4 Latvia University of Agriculture
Abstract. The aim of the paper is to investigate the significance of support measures for employers in the
implementation of work–based learning - from the perspective of employers and sector experts as well as from the
perspective of public administrators responsible for the implementation of work-based learning in the vocational
education and training system in Latvia. The opinions of both target groups were identified and compared. Methods
applied in the current paper: analysis of scientific publications, survey of entrepreneurs, sectors experts and public
administrators. For the analysis of the surveys data - descriptive statistical analysis, cross tabulations, Mann-Whitney
U test as well as multivariate statistical analysis method – factor analysis were applied. In the survey, questionnaire
for most of the questions the evaluation the scale 1 – 10 was applied to evaluate the attitude of the respondents,
where 1 – not significant, 10 – very significant.
The obtained results indicate that all the proposed support measures received relatively equal and high evaluation
from the employers/ experts testifying the topicality of the issue and the high level of needs and support expectations
from the employers. The evaluations by public administrators and entrepreneurs/experts were fairly similar, and they
fall into two major groups - practical/ material support and pedagogical/ information support. Contrary to the
researchers’ expectations – the least scores were attributed to the significance of the information measures and
campaigns. The conclusion is that a broad spectrum of equally important support measures are needed in
implementing work-based learning, however, underestimating the role of information measures on both parts –
employers and public administrators - may hinder a successful implementation of the introduction of work-based
learning at system level in Latvia.
Key words: employers, support measures, work–based learning.
JEL code: J24; J44; M53; I28.
Introduction
In Latvia, work-based learning is a high level
priority in the development of vocational
education and training (VET). Preparing
respective legal framework is a major challenge
for the involved parties, especially given the
various interests of the key stakeholders. The
public administrators responsible for effective
running of the VET system are concerned with
ensuring optimal education and training
conditions in the training of competitive labour
force for the national economy. The employers
are interested to obtain a well trained labour
force at a reasonable cost and with minimal
administrative burdens. It is a challenge to make
the interests of these two involved parties meet
and to develop optimal legal framework that
satisfies these two involved parties. The present
paper is based on the results of a study
performed in 2014 and 2015 among public
administrators and employers/sector experts
concerning the feasibility of introducing work-
based learning approaches in the VET system of
Latvia. The aim of the study was to identify the
similarities and differences in opinions of public
administrators on the one hand, and the
employers and sector experts on the other hand
– in relation to various aspects of implementing
work-based learning. The focus in the present
paper is on the role of particular centralised
measures for implementing this innovative
approach in the VET system of Latvia.
Methods applied in the current paper: analysis
of scientific publications, survey of
entrepreneurs/ sectors experts and public
administrators. For the analysis of the surveys
data - descriptive statistical analysis, cross
tabulations, Mann-Whitney U test as well as
multivariate statistical analysis method – factor
analysis. In the survey questionnaire in order to
evaluate the attitude of the respondents, the
Proceedings of the 2016 International Conference “ECONOMIC SCIENCE FOR RURAL DEVELOPMENT” No 41
Jelgava, LLU ESAF, 21-22 April 2016, pp. 38-44
1Corresponding author. Tel.: + (371 29478176); fax: + (371 - 670343835). E-mail address: [email protected]. 39
scale 1 - 10 was applied where 1 - not
significant, 10 - very significant.
It was being anticipated that the opinion of
these two major target groups will be basically
different, given their inherently different
perspectives and interests. However, the
research showed that both, the public
administrators and the employers/ sector experts
are of fairly similar opinion concerning the
needed support measures to the entrepreneurs.
These similar levels of awareness, among other
things, may testify to the existing good co-
operation among social partners in Latvia
concerning the implementation of VET as well as
to the capacity of the public administration to
anticipate the actual needs of the entrepreneurs
when initiating new policy approaches in VET.
Being aware that work-based learning in the
VET system of Latvia should be introduced in
compliance with the specific socio-economic
situation and the education and training tradition
in Latvia, it is important to take into
consideration the research results on this issue in
relation to the acquired experience in other
countries. Academic research on this problem
presents a wealth of material and conclusions. At
the same time, also policy discussion at European
level indicates that work-based learning is being
seen as a potential solution in the training of a
competitive labour force in Europe. The EU
prepared policy document Riga Conclusions (Riga
Conclusions, 2015) as a mid-term policy
document for the development of VET in Europe
Union States work-based learning as one of the
five key priorities – to be implemented in each
EU Member State in compliance with the national
VET system (tradition) and policy priorities. The
EU Member States are being encouraged to
promote work-based learning in all its forms, by
involving social partners, companies, chambers
and VET providers as well as by stimulating
innovation and entrepreneurship. Therefore,
studying the feasibility for introducing the work-
based learning from the perspective of various
stakeholders is of particular importance and
value for better policy making and sound
decisions by the public administration.
Results of academic discussion
In recent academic research, an increasing
amount of studies is being dedicated to the
analysis of work – based learning – an approach
in vocational education and training having
produced good results in such countries as
Germany, Austria, the Netherlands and others.
Issues on the potential transfer of this model to
other countries are being discussed in academic
research as well (Wieland, 2015). However, there
are several types of vocational education systems
(Greinert, W. D., 2004) and it is not possible to
transfer directly one country system to another
country. Learning as apprentices has different
approaches and traditions depending on the
country (Fuller and Unwin, 2003). Learning on
profession and developing skills in vocational
education during the practical placements are
also being addressed by academic research
(Pang, 2015), including also informal learning in
workplace (Eraut, 2004). Many arrangements
have to be addressed by legislators, public
administrators, educators and employers to
develop successful collaborative teaching and
learning in the workplace (Tanggaard, 2005).
Pedagogical beliefs and experience in work-based
learning and analysis as well as implications for
teachers’ belief orientations are taken into
account and stressed by British scientists
(Abukari, 2014). In work–based learning
provision, it is important to take into account
employee perceptions of their workplaces as
learning environments (Coetzer, 2007). Issues on
organization of practical placements, including
requirements for teachers in different countries
vary (Bathmaker and Avis, 2005), also the
organization and guidance of learning at work
differs (Billett, 1999) as well as organizational
approaches and the conditions for apprentices’
learning activities at work
(Messmann and Mulder, 2015). Analysis of
Proceedings of the 2016 International Conference “ECONOMIC SCIENCE FOR RURAL DEVELOPMENT” No 41
Jelgava, LLU ESAF, 21-22 April 2016, pp. 38-44
1Corresponding author. Tel.: + (371 29478176); fax: + (371 - 670343835). E-mail address: [email protected]. 40
practical placement problems are in the focus
(Billett, 2000), stressing the most complicated
problem of workplace arrangement issues for
practical placement (Billett, 2001). Organisation
aspects and discipline in work–based learning are
important aspects analysed by several
researchers (Gibbs and Costley, 2006). In
academic publications the need to take into
account socio – economic conditions and cultural
background for successful arrangement of work–
based learning are stressed (Blåka and Filstad,
2007). Personal identity and organisational
culture influences real realisation of work-based
learning (Ahlgren, et al., 2010). Supervision of
work–based learning has also a great importance
for successful arrangements of work–based
learning (Collin and Valleala, 2005) as well as the
issue for finding the right balance and crossing
boundaries between school and work during
apprenticeships (Akkerman and Bakker, 2012).
Issues of pedagogy of work‐based learning and
perceptions of work‐based learning in
foundation degrees are in the scope of academic
research interest (Burke, et al 2009) and the
major and fundamental questions: learning to
work and learning to learn
(McCormack, et al., 2010).
The analysis of the academic research on
work-based learning allows conclude that the
chosen approaches should be considered in a
systemic way – in compliance with the overall
conditions in the country in question.
Empirical research results
In the present paper the analysis has been
performed on the following questions:
1) entrepreneurs’ and sector experts
evaluations on centralised activities for a
successful introduction of work based learning
(WBL) in Latvia;
2) public administrators’ evaluations on
centralised activities for a successful
introduction of WBL in Latvia.
Furthermore, the authors have compared the
arithmetic means of the obtained results as well
as have analysed the entrepreneurs’ and sector
experts answers from the gender perspective. In
addition the authors applied factor analysis to
obtain a more thorough analysis.
Concerning the entrepreneurs’ and sector
experts evaluations on centralised activities for a
successful introduction of WBL in Latvia - the
entrepreneurs and sectors experts evaluated
activities for a successful introduction of WBL in
Latvia fairly high – average evaluations (mean,
mode and median) were around 9 points (in
evaluation scale 1 - 10), the evaluations were
quite homogeneous (standard deviation). The
entrepreneurs and sectors experts evaluated with
the highest scores the following activities:
“support to the enterprise during the organisation
of the work placement” and “tax reduction for
enterprises involved in work-based learning”. The
main statistical indicators of entrepreneur and
sectors expert evaluations on activities for a
successful introduction of work-based learning in
Latvia are reflected in Table 1.
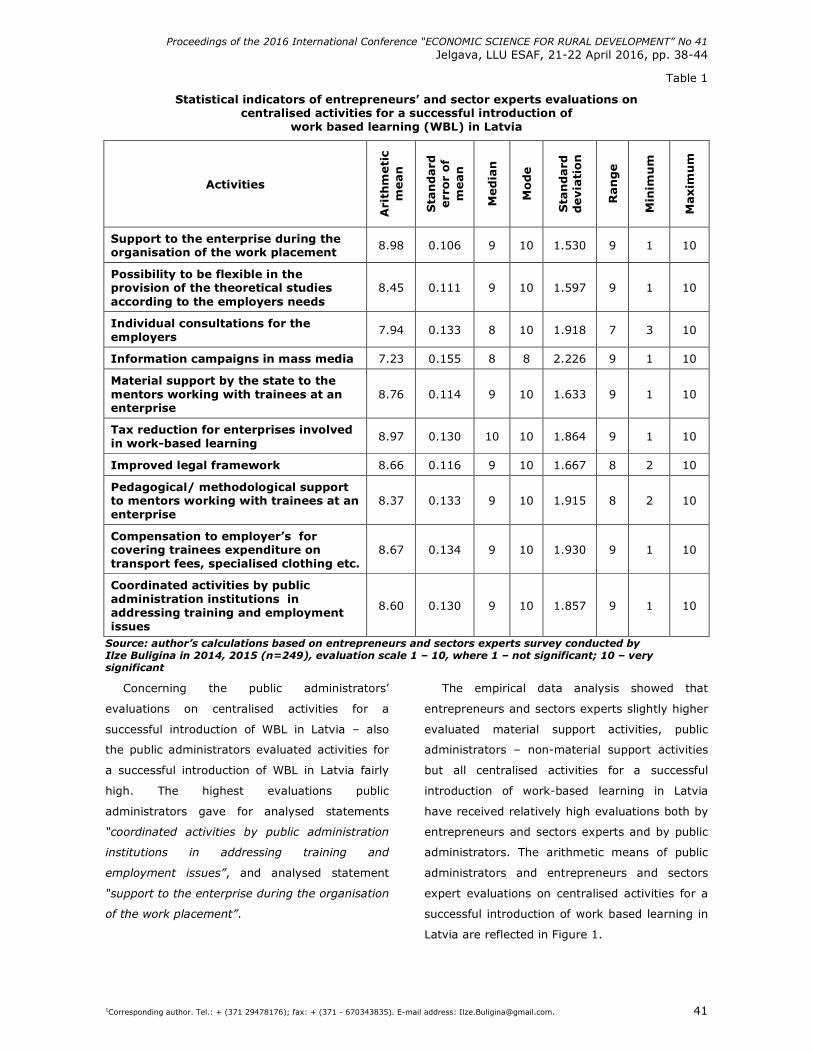
Proceedings of the 2016 International Conference “ECONOMIC SCIENCE FOR RURAL DEVELOPMENT” No 41
Jelgava, LLU ESAF, 21-22 April 2016, pp. 38-44
1Corresponding author. Tel.: + (371 29478176); fax: + (371 - 670343835). E-mail address: [email protected]. 41
Table 1
Statistical indicators of entrepreneurs’ and sector experts evaluations on centralised activities for a successful introduction of
work based learning (WBL) in Latvia
Activities
Ari
thm
eti
c m
ean
Sta
nd
ard
err
or
of
mean
Med
ian
Mod
e
Sta
nd
ard
d
evia
tion
Ran
ge
Min
imu
m
Maxim
um
Support to the enterprise during the organisation of the work placement
8.98 0.106 9 10 1.530 9 1 10
Possibility to be flexible in the provision of the theoretical studies according to the employers needs
8.45 0.111 9 10 1.597 9 1 10
Individual consultations for the employers
7.94 0.133 8 10 1.918 7 3 10
Information campaigns in mass media 7.23 0.155 8 8 2.226 9 1 10
Material support by the state to the mentors working with trainees at an enterprise
8.76 0.114 9 10 1.633 9 1 10
Tax reduction for enterprises involved in work-based learning
8.97 0.130 10 10 1.864 9 1 10
Improved legal framework 8.66 0.116 9 10 1.667 8 2 10
Pedagogical/ methodological support to mentors working with trainees at an enterprise
8.37 0.133 9 10 1.915 8 2 10
Compensation to employer’s for covering trainees expenditure on transport fees, specialised clothing etc.
8.67 0.134 9 10 1.930 9 1 10
Coordinated activities by public administration institutions in addressing training and employment issues
8.60 0.130 9 10 1.857 9 1 10
Source: author’s calculations based on entrepreneurs and sectors experts survey conducted by Ilze Buligina in 2014, 2015 (n=249), evaluation scale 1 – 10, where 1 – not significant; 10 – very significant
Concerning the public administrators’
evaluations on centralised activities for a
successful introduction of WBL in Latvia – also
the public administrators evaluated activities for
a successful introduction of WBL in Latvia fairly
high. The highest evaluations public
administrators gave for analysed statements
“coordinated activities by public administration
institutions in addressing training and
employment issues”, and analysed statement
“support to the enterprise during the organisation
of the work placement”.
The empirical data analysis showed that
entrepreneurs and sectors experts slightly higher
evaluated material support activities, public
administrators – non-material support activities
but all centralised activities for a successful
introduction of work-based learning in Latvia
have received relatively high evaluations both by
entrepreneurs and sectors experts and by public
administrators. The arithmetic means of public
administrators and entrepreneurs and sectors
expert evaluations on centralised activities for a
successful introduction of work based learning in
Latvia are reflected in Figure 1.
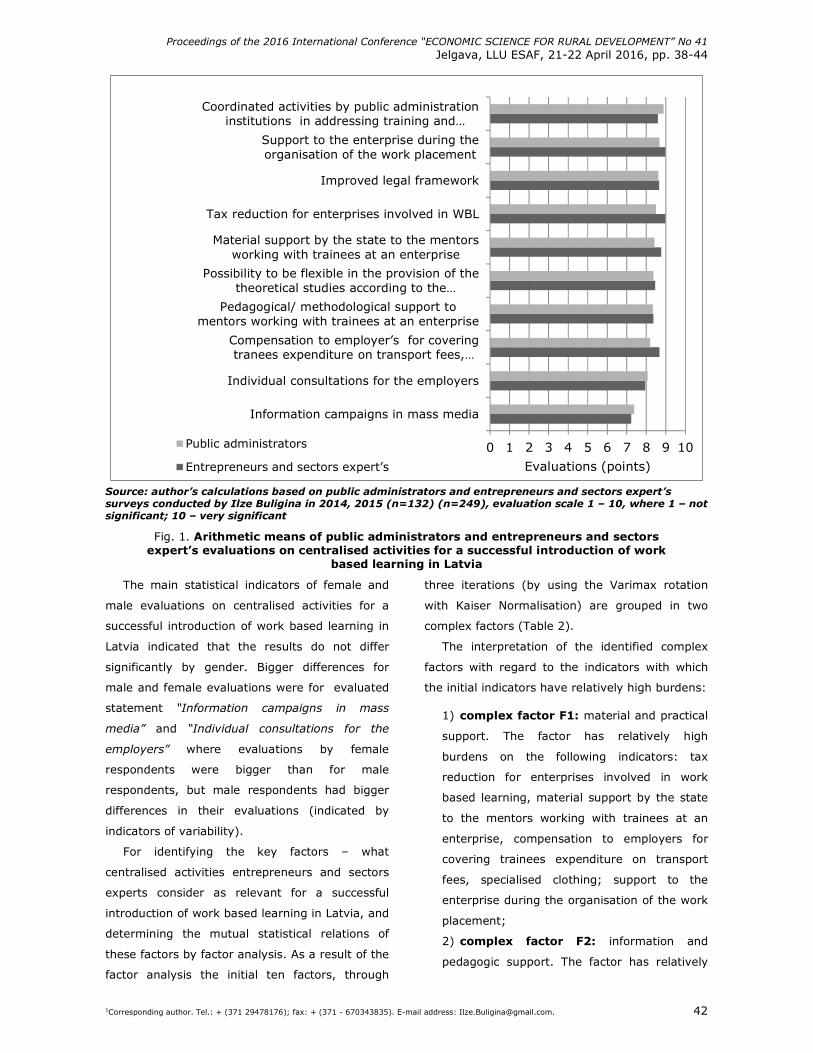
Proceedings of the 2016 International Conference “ECONOMIC SCIENCE FOR RURAL DEVELOPMENT” No 41
Jelgava, LLU ESAF, 21-22 April 2016, pp. 38-44
1Corresponding author. Tel.: + (371 29478176); fax: + (371 - 670343835). E-mail address: [email protected]. 42
0 1 2 3 4 5 6 7 8 9 10
Information campaigns in mass media
Individual consultations for the employers
Compensation to employer’s for covering tranees expenditure on transport fees, …
Pedagogical/ methodological support tomentors working with trainees at an enterprise
Possibility to be flexible in the provision of thetheoretical studies according to the…
Material support by the state to the mentorsworking with trainees at an enterprise
Tax reduction for enterprises involved in WBL
Improved legal framework
Support to the enterprise during theorganisation of the work placement
Coordinated activities by public administrationinstitutions in addressing training and…
Evaluations (points)
Public administrators
Entrepreneurs and sectors expert’s
Source: author’s calculations based on public administrators and entrepreneurs and sectors expert’s surveys conducted by Ilze Buligina in 2014, 2015 (n=132) (n=249), evaluation scale 1 – 10, where 1 – not significant; 10 – very significant
Fig. 1. Arithmetic means of public administrators and entrepreneurs and sectors expert’s evaluations on centralised activities for a successful introduction of work
based learning in Latvia
The main statistical indicators of female and
male evaluations on centralised activities for a
successful introduction of work based learning in
Latvia indicated that the results do not differ
significantly by gender. Bigger differences for
male and female evaluations were for evaluated
statement “Information campaigns in mass
media” and “Individual consultations for the
employers” where evaluations by female
respondents were bigger than for male
respondents, but male respondents had bigger
differences in their evaluations (indicated by
indicators of variability).
For identifying the key factors – what
centralised activities entrepreneurs and sectors
experts consider as relevant for a successful
introduction of work based learning in Latvia, and
determining the mutual statistical relations of
these factors by factor analysis. As a result of the
factor analysis the initial ten factors, through
three iterations (by using the Varimax rotation
with Kaiser Normalisation) are grouped in two
complex factors (Table 2).
The interpretation of the identified complex
factors with regard to the indicators with which
the initial indicators have relatively high burdens:
1) complex factor F1: material and practical
support. The factor has relatively high
burdens on the following indicators: tax
reduction for enterprises involved in work
based learning, material support by the state
to the mentors working with trainees at an
enterprise, compensation to employers for
covering trainees expenditure on transport
fees, specialised clothing; support to the
enterprise during the organisation of the work
placement;
2) complex factor F2: information and
pedagogic support. The factor has relatively
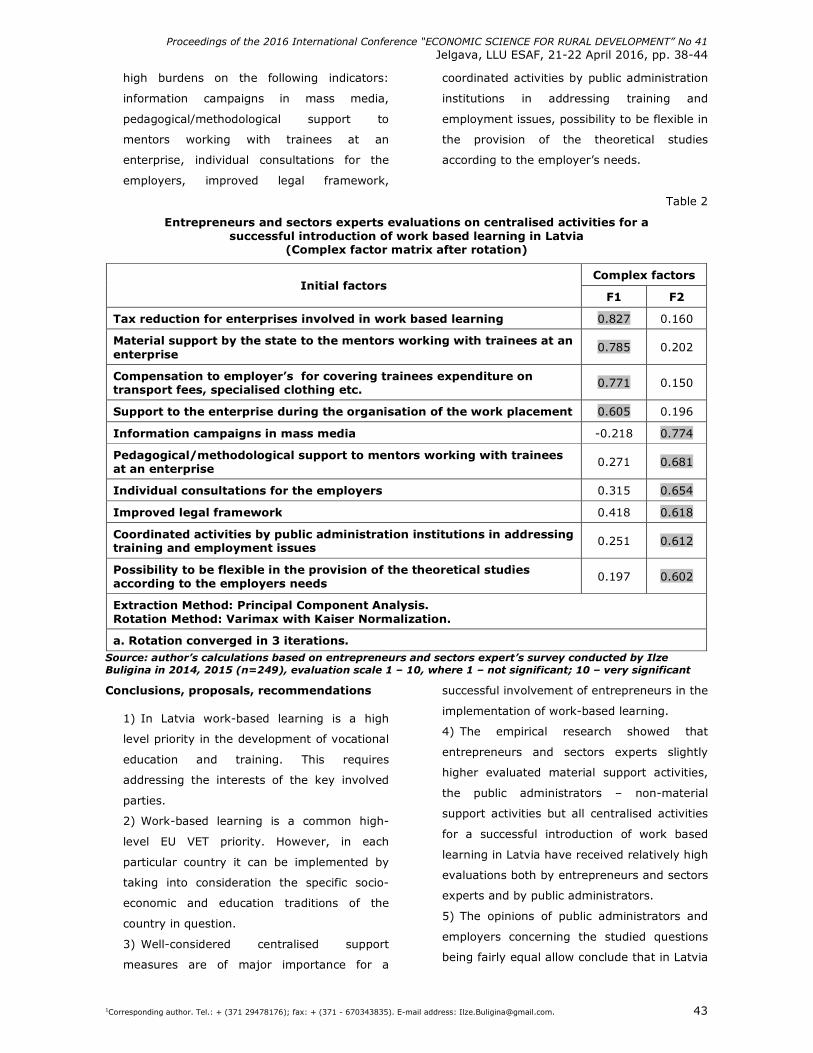
Proceedings of the 2016 International Conference “ECONOMIC SCIENCE FOR RURAL DEVELOPMENT” No 41
Jelgava, LLU ESAF, 21-22 April 2016, pp. 38-44
1Corresponding author. Tel.: + (371 29478176); fax: + (371 - 670343835). E-mail address: [email protected]. 43
high burdens on the following indicators:
information campaigns in mass media,
pedagogical/methodological support to
mentors working with trainees at an
enterprise, individual consultations for the
employers, improved legal framework,
coordinated activities by public administration
institutions in addressing training and
employment issues, possibility to be flexible in
the provision of the theoretical studies
according to the employer’s needs.
Table 2
Entrepreneurs and sectors experts evaluations on centralised activities for a successful introduction of work based learning in Latvia
(Complex factor matrix after rotation)
Complex factors Initial factors
F1 F2
Tax reduction for enterprises involved in work based learning 0.827 0.160
Material support by the state to the mentors working with trainees at an enterprise
0.785 0.202
Compensation to employer’s for covering trainees expenditure on transport fees, specialised clothing etc.
0.771 0.150
Support to the enterprise during the organisation of the work placement 0.605 0.196
Information campaigns in mass media -0.218 0.774
Pedagogical/methodological support to mentors working with trainees at an enterprise
0.271 0.681
Individual consultations for the employers 0.315 0.654
Improved legal framework 0.418 0.618
Coordinated activities by public administration institutions in addressing training and employment issues
0.251 0.612
Possibility to be flexible in the provision of the theoretical studies according to the employers needs
0.197 0.602
Extraction Method: Principal Component Analysis. Rotation Method: Varimax with Kaiser Normalization.
a. Rotation converged in 3 iterations. Source: author’s calculations based on entrepreneurs and sectors expert’s survey conducted by Ilze Buligina in 2014, 2015 (n=249), evaluation scale 1 – 10, where 1 – not significant; 10 – very significant
Conclusions, proposals, recommendations
1) In Latvia work-based learning is a high
level priority in the development of vocational
education and training. This requires
addressing the interests of the key involved
parties.
2) Work-based learning is a common high-
level EU VET priority. However, in each
particular country it can be implemented by
taking into consideration the specific socio-
economic and education traditions of the
country in question.
3) Well-considered centralised support
measures are of major importance for a
successful involvement of entrepreneurs in the
implementation of work-based learning.
4) The empirical research showed that
entrepreneurs and sectors experts slightly
higher evaluated material support activities,
the public administrators – non-material
support activities but all centralised activities
for a successful introduction of work based
learning in Latvia have received relatively high
evaluations both by entrepreneurs and sectors
experts and by public administrators.
5) The opinions of public administrators and
employers concerning the studied questions
being fairly equal allow conclude that in Latvia
Proceedings of the 2016 International Conference “ECONOMIC SCIENCE FOR RURAL DEVELOPMENT” No 41
Jelgava, LLU ESAF, 21-22 April 2016, pp. 38-44
1Corresponding author. Tel.: + (371 29478176); fax: + (371 - 670343835). E-mail address: [email protected]. 44
there is an equal level of awareness among
these key stakeholders in relation to the key
challenges and needed support measures to
entrepreneurs.
6) The results of the study also testify to the
capacity of the public administration to
anticipate the actual needs of the
entrepreneurs when initiating new policy
approaches in VET.
7) The similar levels of awareness of the key
stakeholders, among other things, may testify
to the existing good co-operation among
social partners in Latvia concerning the
implementation of VET as well as to the
capacity of the public administration to
anticipate the actual needs of the
entrepreneurs when initiating new policy
approaches in VET.
Bibliography
1. Abukari, A. (2014). Pedagogical Beliefs in Work-Based Learning: an Analysis and Implications of Teachers Belief Orientations, Research in Post-Compulsory Education, Volume 19, Issue 4, pp. 481- 497.
2. Ahlgren, L., Lyn Tett, L. (2010). Work-Based Learning, Identity and Organisational Culture. Studies in Continuing Education, Volume 32, Issue 1, pp. 17-27.
3. Akkerman, S.F., Bakker, A. (2012). Crossing Boundaries between School and Work during Apprenticeships. Vocations and Learning, Volume 5, Issue 2, pp. 153-173.
4. Bathmaker, A.-M., Avis, J. (2005). Becoming a Lecturer in Further Education in England: The Construction of Professional Identity and the Role of Communities of Practice. Journal of Education for Teaching, Volume 31, Issue 1, pp. 47-62.
5. Billett, S. (1999). Guided Learning at Work. Understanding Learning at Work, Boud D., Garrick J., (eds), London: Routledge. pp. 151-164.
6. Billett, S. (2000). Guided Learning at Work. Journal of Workplace Learning, Volume 12, Issue 7, pp. 272-285.
7. Billett, S. (2001). Learning through Work: Workplace Affordances and Individual Engagement. Journal of Workplace Learning, Volume 13, Issue 5, pp. 209-214.
8. Blåka, G., Filstad, C. (2007). How does a Newcomer Construct Identity? A Socio-Cultural Approach to Workplace Learning. International Journal of Lifelong Education, Volume 26, Issue 1, pp. 59-73.
9. Burke, L., Marks -Maran, D.J. Ooms, A., Webb, M., Cooper, D. (2009). Towards a Pedagogy of work based learning: perceptions of work based learning in foundation degrees. Journal of Vocational Education and Training, Volume 61, Issue 1, pp. 15-33.
10. Coetzer, A. (2007). Employee Perceptions of their Workplaces as Learning Environments. Journal of Workplace Learning, Volume 19, Issue 7, pp. 417-434.
11. Eraut, M. (2004). Informal Learning in the Workplace, Studies in Continuing Education, Volume 26, Issue 2, pp. 247-273.
12. Fuller, A., Unwin, L. (2003). Learning as Apprentices in the Contemporary UK Workplace: Creating and Managing Expansive and Restrictive Participation. Journal of Education and Work, Volume 16, Issue 4, pp. 407-426.
13. Gibbs, P., Costley, C. (2006). Work Based Learning; Discipline, Field or Discursive Space or What?, Research in Post-Compulsory Education, Volume 11, Issue 3, pp. 341-350.
14. Greinert, W.-D. (2004). European Vocational Training ‘Systems’ – The Theoretical Context of their Historical Development. European Journal of Vocational Training, Volume 32, pp. 18-25.
15. McCormack, R., Pancini, G., Tout, D. (2010). Learningful Work: Learning to Work and Learning to Learn. International Journal of Training Research, Volume 8, Issue 1, pp. 40-52.
16. Messmann, G., Mulder, R.H. (2015). Conditions for Apprentices’ Learning Activities at Work. Journal of Vocational Education and Training, Volume 67, Issue 4, pp. 578-596.
17. Pang, P. (2015). Learning to Work during Work Placement: Negotiating Access to Work and Participation through ‘Origination’ and Establishing a ‘Legitimate Presence’. Journal of Vocational Education and Training, Volume 67, Issue 4, pp. 543-557.
18. Tanggaard, L. (2005). Collaborative Teaching and Learning in the Workplace. Journal of Vocational Education and Training, Volume 57, Issue 1, pp. 109-122.
19. The Riga Conclusions (2015) endorsed by ministers from the European Union (EU) Member States, candidate countries, Iceland, Norway and Liechtenstein as the new medium-term deliverables for vocational education and training 22.06.2015 in Riga, Latvia – during the Latvian Presidency in the Council of the European Union. Retrieved: http://ec.europa.eu/education/policy/vocational-policy/doc/2015-riga-conclusions_en.pdf Access: 14.12.2015
20. Wieland, C. (2015). Germany’s Dual Vocational-Training System: Possibilities for and Limitations to Transferability. Local Economy, Volume 30, Issue 5, pp. 577-583.
Proceedings of the 2016 International Conference “ECONOMIC SCIENCE FOR RURAL DEVELOPMENT” No 41
Jelgava, LLU ESAF, 21-22 April 2016, pp. 45-52
1Corresponding author. Tel.: + 371 26400991 E-mail address: [email protected] 45
LOGISTICS IMPROVEMENT POSSIBILITIES IN ENTREPRENEURSHIP Lasma Dobele1, Dr.oec., Kristine Gricmane2, Bc.oec., Anita Auzina3, Dr.oec.
1 Faculty of Economics and Social Development, Latvia University of Agriculture
Abstract. Nowadays, the harmonised and rational performance of logistics in a competitive environment is essential
for entrepreneurship to reduce costs and accordingly gain advantages on the market. Besides, it is necessary to
achieve a maximum level of service for customers – to make deliveries within the specified time and at high quality.
The research aim is to examine logistics management for freight deliveries by DSG Karjeri LLC and to identify
possibilities to improve its logistics operations. Three logistics management scenarios for freight deliveries were
designed to achieve the aim. The scenarios envisage that the company outsources transport services, rents vehicles or
purchases vehicles. The research found that the purchase of lorries used for freight deliveries would result in savings
within a range EUR 4000-25000 a year as well as the company would provide timely and quality freight deliveries.
Key words: logistics, scenarios, logistics management.
JEL code: L91, R40.
Introduction
Nowadays, under a market economy, the role
of logistics increases and problems related to it
emerge as well. It is necessary, on the one hand,
to achieve a maximum level of service for
customers (to make deliveries within the
specified time and at high quality), while, on the
other hand, to minimise service-related costs.
Timely deliveries and precision factors are
particularly essential for cpmpanies whose basic
activity relates to the transport of products
(Patlins P., 2011). The problem is urgent due to
the role an efficient transport system plays in
entrepreneurship as well as the fact that the
market economy raises standards for timely
deliveries and cost reductions in transport.
Furthermore, in a competitive environment
companies have to seek to achieve cost
reductions and hence advantages on the market;
that is why harmonised and rational operation
assists in achieving not only advantages in terms
of cost but also in the flexible functioning of the
entire logistics system (Ozolins D.
and Kruzs K., 2005).
Any company has to plan its economic
activities and a great deal of its activities relates
particularly to logistics processes. A number of
scientists have focused on logistics; thus, this
term is analysed from different perspectives.
From the scientific perspective, logistics is a
science focusing on the management of the flow
of material valuables and the related flow of
information in certain micro- and macroeconomic
systems to achieve the objective set (Praude V.
& Belcikovs J., 2003). However, from the
management perspective, logistics involves the
planning, management and control of economic
activities. It provides the purposeful maintenance
of material valuables and their delivery from the
production site to consumers as well as other
related activities regarding their flow and the
related flow of information, aiming to raise
performance efficiency and meet consumer needs
(Krumina A., 2005). According to findings in
scientific literature, effective logistics
management allows customers of an company to
be served at high quality by timely delivering
their products as well as efficiently exploiting the
company’s resources and minimising their
maintenance costs even in cases of change in
customer demand (Patlins P., 2011). The
research sets the following hypothesis: effective
logistics management is a basis for company cost
reductions. The research object is company DSG
Karjeiri LLC, which deals with dolomite quarrying
and the production of crushed stone; the
company’s daily operation is associated with
logistics management.
The research aim is to examine logistics
management for freight deliveries by DSG Karjeri
LLC and to identify possibilities to improve its
logistics operations. To achieve the aim, the
following specific research tasks were set:
Proceedings of the 2016 International Conference “ECONOMIC SCIENCE FOR RURAL DEVELOPMENT” No 41
Jelgava, LLU ESAF, 21-22 April 2016, pp. 45-52
1Corresponding author. Tel.: + 371 26400991 E-mail address: [email protected] 46
1) to describe the theoretical aspects of
logistics;
2) to analyse the logistics management of
DSG Karjeri LLC for freight deliveries and to
identify possibilities to improve its logistics
operations.
The following research methods were
employed: the monographic and descriptive
methods were applied to describe the role of
logistics nowadays as well as to examine the
logistics management process in DSG Karjeri
LLC; the scenario method was used to identify
the most economically efficient way of transport
of freight for DSG Karjeri LLC: contracting an
outsourcing provider (purchase of outsourcing
services), renting vehicles or purchasing vehicles.
The scenario method is appropriate in cases
where a company has to prepare for some risks
and opportunities in the future, given the effects
of various factors on different scenarios
(Zurek M. B. and Henrichs T., 2007). This
method is useful in the present research to
choose the most economically efficient logistics
management solution based on each scenario’s
advantages and disadvantages.
The research used unpublished and
informative materials of DSG Karjeri LLC as well
as scientific literature on the theoretical aspects
of logistics.
Development and role of logistics in
entrepreneurship
Logistics has a long history, and its practical
application originated in Ancient Greece
(776 BC - 323 AD) when the term logistics
referred to supplies for the army and
displacement (Radzele-Sulce A., 2011). However,
the scientific literature refers to J.Crowell as the
first author who defined logistics and its key
principles in his 1901 report on the flow of goods,
costs and efficiency (Stock J. and
Douglas L., 2000). The modern scientific
literature provides a number of definitions of the
term logistics, which involve a narrow or a broad
range of issues researched. Most often, logistics
is understood and described as deliveries of
goods to customers; yet, logistics is also
necessary to produce the goods to be delivered.
Logistics is also defined as a science focusing on
the management of the flow of material valuables
and the related flow of information in certain
micro- and macroeconomic systems to achieve
the objective set (Praude V.
& Belcikovs J., 2003). However, D. J. Bowersox
and D. J. Closs (1996) believe that the object of
logistics may be defined as flows of materials
that are in place both within a company and
among companies, intermediaries and financial
institutions. A. Radzele-Sulce (2011),
summarising a number of definitions given by
scientists, points that logistics involves efficient
uses of resources, flows of material valuables and
information, a process of planning consumption
sites, sales and control aimed at meeting
customer needs and increasing an company’s
profit. As noted by I. Slavinska (2007), most
companies associate the term logistics only with
the most obvious part of it – the provision of
transport services.
Efficient logistics plays a significant role in
entrepreneurship, as it reduces the total cost of
transport and logistics services by up to 30%,
managing the operation of a company’s units as
rationally and coordinately as possible (Urbahs A.
and Cerkovnuks A., 2003). Logistics is also
important in serving clients and buyers
(Sergeyev V.I., 2005). It is important for buyers
that the seller is continuously searching for the
best solutions in communication, deliveries of
materials and the process on the whole
(Bowersox D. J. and Closs D. J., 1996;
Heskett J. L. et al., 1990). All this may be
provided through effective logistics in an
company. An analysis of findings on the role of
logistics by a number of authors allows
concluding that logistics is important not only in
reducing costs and serving customers but also in
time planning – both for production and for
Proceedings of the 2016 International Conference “ECONOMIC SCIENCE FOR RURAL DEVELOPMENT” No 41
Jelgava, LLU ESAF, 21-22 April 2016, pp. 45-52
1Corresponding author. Tel.: + 371 26400991 E-mail address: [email protected] 47
deliveries of goods. Globalisation created a need
to perform deliveries as fast as possible, thus,
not freezing assets during the delivery process
(Sprancmanis N., 2011). As pointed by
I. Slavinska (2007), in globalised economies
companies can successfully develop and compete
particularly through effective logistics
management. To identify the possibilities to
improve logistics management, the present
research analysed company DSG Karjeri LLC,
focusing particularly on the management of
transport services in the company.
Characteristics of the logistics process in
DSG Karjeri LLC
DSG Karjeri LLC was founded on 2 June 2005;
its key activity involves dolomite quarrying and
the production of crushed stone but it also sells
other mineral materials, as the company buys
sand, gravel and clay from other quarrying
companies. DSG Karjeri LLC has opened four
dolomite fields – at Iecava, Saikava, Birzi and
Ape –; yet, it plans to open 11 more dolomite
fields until 2020 in the entire territory of Latvia,
thereby increasing its sales by 5 % until 2020.
An essential role in selling the dolomite
produced and the materials bought is played by
effective logistics management in DSG Karjeri
LLC, as most of its customers prefer the
materials they have bought to be delivered to
their construction object. Also, the company uses
logistics services for its own needs – for the
transport of materials quarried, machinery,
employees and materials bought.
The head of the Production Department and
sales employees are involved in managing the
logistics process in DSG Karjeri LLC. The head of
the Production Department arranges the
relocation of machinery and mobile teams among
quarries, planning the necessary production
intensity at every quarry and for every period.
Sales employees work on delivering the
company’s products to customers; they also plan
product purchases for customers, i.e. the loading
of products at other quarries and their delivery to
the customer’s object at a specified time.
Since DSG Karjeri LLC does not have its own
vehicles to deliver its products, it contracts other
companies that provide transport services. This
means that the most reliable provider of
transport services has to be selected for every
delivery site, which is ready to do it for the price
agreed with the customer. In addition, a sales
employee has to correctly calculate the distance
from a quarry, from which products are
delivered, to the customer’s site, so that when
agreeing on the price with the customer, there
are no doubts the company is able to sell the
material and contract a provider of transport
services for the revenue earned. During the
active season, mistakes are often made in
calculations of prices for customers;
consequently, if an incorrect calculation are
performed, customers have to often pay for
transport. However, no price change is allowed
for deliveries of products in large quantities – the
lowest price set by the company is often the
reason why customers decide to buy the products
particularly from DSG Karjeri LLC.
In 2015, DSG Karjeri LLC cooperated with
15 providers of transport services, and the
cooperation with most of them continues in 2016.
Important criteria in the choice of a transport
company are the price for kilometrage set by the
company, the distance from the company’s site
to the production site of DSG Karjeri LLC, the
reliability of the company based on previous
cooperation with it and the company’s accuracy
and timelines in making an invoice for the service
it provides.
On the whole, logistics management is
effective in DSG Karjeri LLC; yet, the company
has to examine its possibilities to improve its
logistics processes (transport) in order to reduce
its costs.
Proceedings of the 2016 International Conference “ECONOMIC SCIENCE FOR RURAL DEVELOPMENT” No 41
Jelgava, LLU ESAF, 21-22 April 2016, pp. 45-52
1Corresponding author. Tel.: + 371 26400991 E-mail address: [email protected] 48
Logistics improvement possibilities in DSG
Karjeri LLC
Transport in business may be performed in
three ways: contracting an outsourcing provider
(purchase of outsourcing services), renting
vehicles or purchasing vehicles. Three scenarios
were analysed to identify the most optimum one
for the situation of DSG Karjeri LLC.
Scenario A: purchase of outsourcing
services. At present, DSG Karjeri LLC outsources
transport services; yet, contracting an
outsourcing provider involves several advantages
and disadvantages.
Transport companies are not sufficiently
flexible in time; in the result, the company may
lose revenue, as any customer can find another
seller that can also deliver the product. An
opposite situation is also likely, i.e. idling. Idling
is possible if a contracted transport company
waits for the freight to be loaded or for unloading
it at the site. In 2014, the company’s expenses
due to idling totalled EUR 300.00.
One of the greatest disadvantages if
outsourcing transport services is the motivation
of employees to do a good job, i.e. to deliver the
freight to the customer’s site and collect all
signatures of the construction manager on
transport waybills. DSG Karjeri LLC has
experienced situations where a customer did not
accept the delivery of the freight just because
he/she had not put a signature on the transport
waybill. In such cases problems emerge with
providers of transport services – if the customer
refuses to accept the freight, DSG Karjeri LLC
reserves its right not to accept a transport
invoice if the transport company has not done its
job properly. One can conclude that there are
problems with employee motivation, which
cannot be controlled by the buyer of transport
services.
A significant disadvantage regarding buying
transport services relates to the time factor.
Delivering the product from distant quarries, the
provider of transport services is not always
located close to the site, which does not make
deliveries as fast as possible. However, if the
company has its own vehicles, it can timely plan
trips, making kilometrage more rational. In
addition, the company pays for transport services
during idling – the time the transport company
spent to load or unload the freight at the site.
One of the largest advantages relates to
maintenance and repair costs for vehicles. In
case the company chooses to buy transport
services, it is responsible for annual vehicle
roadworthiness tests and has to pay road taxes.
If some transport company refuses to do a trip
because its vehicle has to be repaired, the buyer
of transport services can contact another
transport company and deliver its products in any
case. Also, the use of funds of another company
is also an important advantage. The company,
buying transport services, uses the funds of the
other company to fulfil its obligations to clients.
Any provider of transport services invests its
funds at the moment when providing the services
and receives its funds earned in a month or even
later. An advantage is also the control of
employees if buying transport services, i.e. hours
worked, rest periods and kilometrage do not have
to be controlled.
Scenario B: renting vehicles. The research
analyses annual maintenance costs for a lorry if
the lorry is rented. A provider of transport
services whose fleet consists of four leased used
lorries SCANIA R420 (a tractor-trailer) is
analysed as the research object. The lorries have
trailers for transporting loose bulk freight. The
company transports the mentioned kind of freight
and is one the most frequently contracted
partners by DSG Karjeri LLC.
An examination of the financial performance
of the company allows finding that the greatest
per unit cost concerning the maintenance of
rented lorries relates to rental costs, namely,
EUR 24900.25 a year (Table 1).
Proceedings of the 2016 International Conference “ECONOMIC SCIENCE FOR RURAL DEVELOPMENT” No 41
Jelgava, LLU ESAF, 21-22 April 2016, pp. 45-52
1Corresponding author. Tel.: + 371 26400991 E-mail address: [email protected] 49
Table 1
Maintenance costs for a lorry SCANIA R420 a year, EUR
Costs Indicators
EUR Proportion, %
Wages 5000.00 7.47
Fuel 24036.50 35.92
Repairs 7714.25 11.53
Road Traffic Safety Directorate roadworthiness tests 510.75 0.76
Rental costs 24900.25 37.21
Tyres 4763.00 7.11
Total cost 66924.75 100 Source: authors’ calculations
In case of need, a renter covers such costs as
overhauls and insurance. No overhauls have been
performed for the SCANIA lorries during the last
three years. In contrast, the cost of daily repairs
is covered by the lessee. In 2014, the repair cost
per lorry totalled EUR 7714.25, which accounted
for 11.53% of the total cost per lorry a year. The
total maintenance cost per lorry amounted to
EUR 66924.75 in 2014.
The authors calculated an approximate
kilometrage, given the average diesel fuel price
(value added tax excluded) per litre in 2014 and
the fuel cost per lorry purchased and used in
freight deliveries by the following formula:
LPD =*1 (1)
where
D1 – fuel cost per lorry used in freight
deliveries (value added tax excluded) (EUR);
P – diesel fuel cost (value added tax excluded)
(EUR/l);
L – amount of fuel used in freight deliveries
(l).
The amount of diesel fuel consumed is
calculated by dividing the cost of fuel by the
average diesel fuel price in 2014, which was 0.90
EUR/litre; it totalled 26707.22 litres. It means
that a lorry consumed about 26707.22 litres of
diesel fuel for freight deliveries. Further, the
authors calculate kilometrage for 2014 by the
formula:
RPD aa =/ (2)
where
Da – average fuel consumption (l/km);
Pa – average price set by providers of
transport services (EUR);
R – kilometrage (km).
It is assumed that the average fuel
consumption per lorry is 35 l per 100 km. One
can find that about EUR 66924.75 were required
to provide transport services and maintain a lorry
that travelled 76306.34 km in 2014. Accordingly,
if the kilometrage of the lorry is greater, the cost
of maintenance and repairs also rises. It has to
be noted that this cost includes a rental cost of
EUR 24900.25, which would not be paid if the
lorry were owned by the company.
In 2014, the lowest price per kilometre asked
by transport providers contracted by DSG Karjeri
LLC was EUR 0.93, while the highest price
reached EUR 1.20. In a situation where DSG
Karjeri LLC has to maintain a lorry whose total
cost is EUR 66927.75 a year and kilometrage is
76306.34 km, it is not efficient to outsource
transport services. If it sets its own price at
EUR 0.93 per kilometre, the cost of transport at a
kilometrage of 76306.34 km is EUR 70964.90.
Table 2 provides a comparison of data to
identify the gains from kilometrage if the
company has to pay for kilometrage at a rate of
0.93 EUR/km and at a rate of 1.20 EUR/km. In
the comparison, the rate of EUR 0.93 per
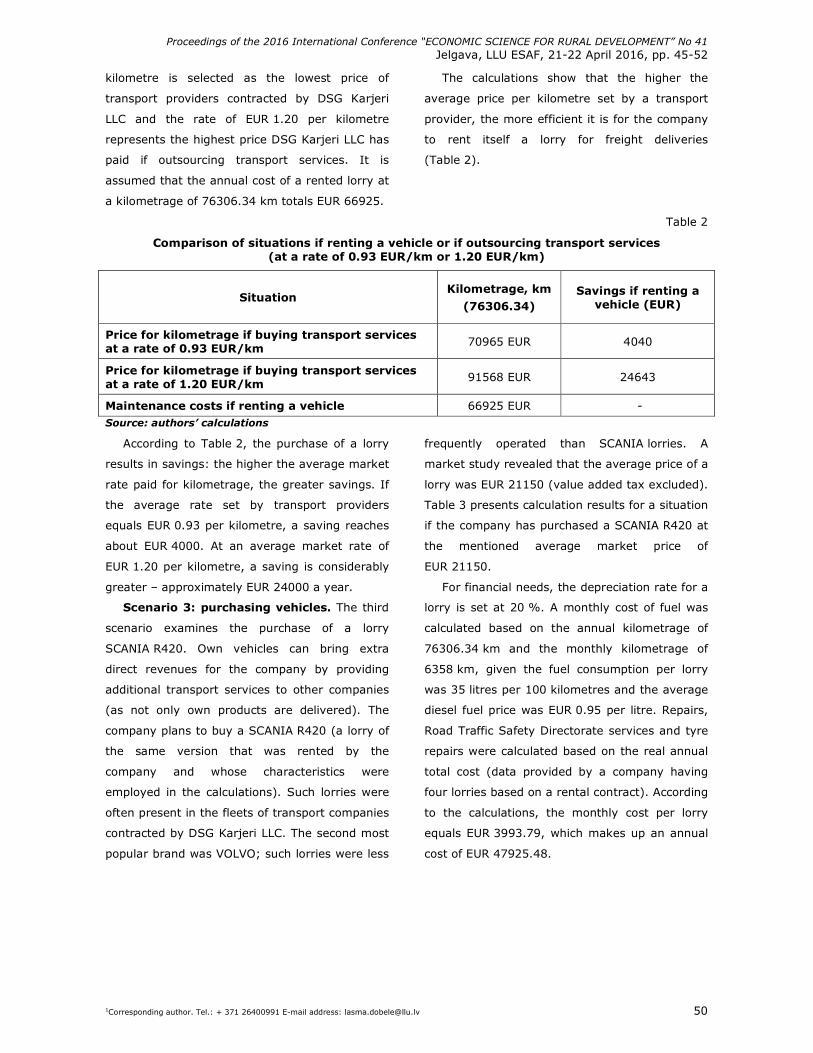
Proceedings of the 2016 International Conference “ECONOMIC SCIENCE FOR RURAL DEVELOPMENT” No 41
Jelgava, LLU ESAF, 21-22 April 2016, pp. 45-52
1Corresponding author. Tel.: + 371 26400991 E-mail address: [email protected] 50
kilometre is selected as the lowest price of
transport providers contracted by DSG Karjeri
LLC and the rate of EUR 1.20 per kilometre
represents the highest price DSG Karjeri LLC has
paid if outsourcing transport services. It is
assumed that the annual cost of a rented lorry at
a kilometrage of 76306.34 km totals EUR 66925.
The calculations show that the higher the
average price per kilometre set by a transport
provider, the more efficient it is for the company
to rent itself a lorry for freight deliveries
(Table 2).
Table 2
Comparison of situations if renting a vehicle or if outsourcing transport services (at a rate of 0.93 EUR/km or 1.20 EUR/km)
Situation Kilometrage, km
(76306.34) Savings if renting a
vehicle (EUR)
Price for kilometrage if buying transport services at a rate of 0.93 EUR/km
70965 EUR 4040
Price for kilometrage if buying transport services at a rate of 1.20 EUR/km
91568 EUR 24643
Maintenance costs if renting a vehicle 66925 EUR - Source: authors’ calculations
According to Table 2, the purchase of a lorry
results in savings: the higher the average market
rate paid for kilometrage, the greater savings. If
the average rate set by transport providers
equals EUR 0.93 per kilometre, a saving reaches
about EUR 4000. At an average market rate of
EUR 1.20 per kilometre, a saving is considerably
greater – approximately EUR 24000 a year.
Scenario 3: purchasing vehicles. The third
scenario examines the purchase of a lorry
SCANIA R420. Own vehicles can bring extra
direct revenues for the company by providing
additional transport services to other companies
(as not only own products are delivered). The
company plans to buy a SCANIA R420 (a lorry of
the same version that was rented by the
company and whose characteristics were
employed in the calculations). Such lorries were
often present in the fleets of transport companies
contracted by DSG Karjeri LLC. The second most
popular brand was VOLVO; such lorries were less
frequently operated than SCANIA lorries. A
market study revealed that the average price of a
lorry was EUR 21150 (value added tax excluded).
Table 3 presents calculation results for a situation
if the company has purchased a SCANIA R420 at
the mentioned average market price of
EUR 21150.
For financial needs, the depreciation rate for a
lorry is set at 20 %. A monthly cost of fuel was
calculated based on the annual kilometrage of
76306.34 km and the monthly kilometrage of
6358 km, given the fuel consumption per lorry
was 35 litres per 100 kilometres and the average
diesel fuel price was EUR 0.95 per litre. Repairs,
Road Traffic Safety Directorate services and tyre
repairs were calculated based on the real annual
total cost (data provided by a company having
four lorries based on a rental contract). According
to the calculations, the monthly cost per lorry
equals EUR 3993.79, which makes up an annual
cost of EUR 47925.48.
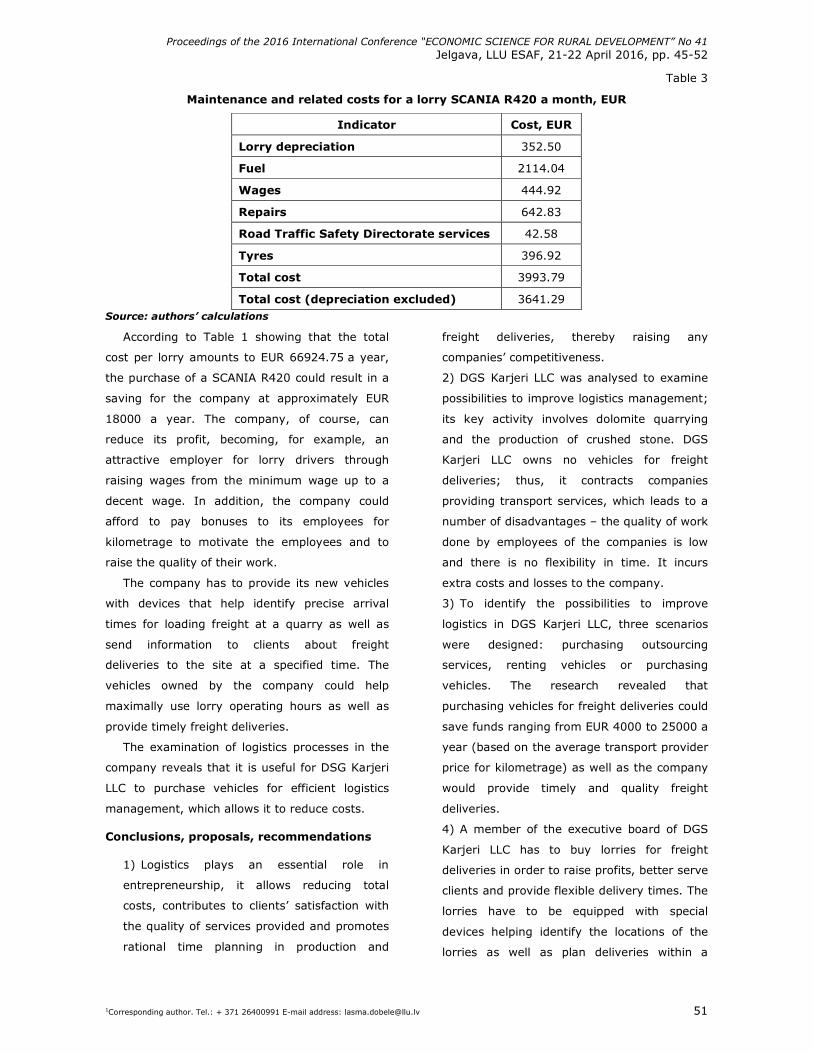
Proceedings of the 2016 International Conference “ECONOMIC SCIENCE FOR RURAL DEVELOPMENT” No 41
Jelgava, LLU ESAF, 21-22 April 2016, pp. 45-52
1Corresponding author. Tel.: + 371 26400991 E-mail address: [email protected] 51
Table 3
Maintenance and related costs for a lorry SCANIA R420 a month, EUR
Indicator Cost, EUR
Lorry depreciation 352.50
Fuel 2114.04
Wages 444.92
Repairs 642.83
Road Traffic Safety Directorate services 42.58
Tyres 396.92
Total cost 3993.79
Total cost (depreciation excluded) 3641.29 Source: authors’ calculations
According to Table 1 showing that the total
cost per lorry amounts to EUR 66924.75 a year,
the purchase of a SCANIA R420 could result in a
saving for the company at approximately EUR
18000 a year. The company, of course, can
reduce its profit, becoming, for example, an
attractive employer for lorry drivers through
raising wages from the minimum wage up to a
decent wage. In addition, the company could
afford to pay bonuses to its employees for
kilometrage to motivate the employees and to
raise the quality of their work.
The company has to provide its new vehicles
with devices that help identify precise arrival
times for loading freight at a quarry as well as
send information to clients about freight
deliveries to the site at a specified time. The
vehicles owned by the company could help
maximally use lorry operating hours as well as
provide timely freight deliveries.
The examination of logistics processes in the
company reveals that it is useful for DSG Karjeri
LLC to purchase vehicles for efficient logistics
management, which allows it to reduce costs.
Conclusions, proposals, recommendations
1) Logistics plays an essential role in
entrepreneurship, it allows reducing total
costs, contributes to clients’ satisfaction with
the quality of services provided and promotes
rational time planning in production and
freight deliveries, thereby raising any
companies’ competitiveness.
2) DGS Karjeri LLC was analysed to examine
possibilities to improve logistics management;
its key activity involves dolomite quarrying
and the production of crushed stone. DGS
Karjeri LLC owns no vehicles for freight
deliveries; thus, it contracts companies
providing transport services, which leads to a
number of disadvantages – the quality of work
done by employees of the companies is low
and there is no flexibility in time. It incurs
extra costs and losses to the company.
3) To identify the possibilities to improve
logistics in DGS Karjeri LLC, three scenarios
were designed: purchasing outsourcing
services, renting vehicles or purchasing
vehicles. The research revealed that
purchasing vehicles for freight deliveries could
save funds ranging from EUR 4000 to 25000 a
year (based on the average transport provider
price for kilometrage) as well as the company
would provide timely and quality freight
deliveries.
4) A member of the executive board of DGS
Karjeri LLC has to buy lorries for freight
deliveries in order to raise profits, better serve
clients and provide flexible delivery times. The
lorries have to be equipped with special
devices helping identify the locations of the
lorries as well as plan deliveries within a
Proceedings of the 2016 International Conference “ECONOMIC SCIENCE FOR RURAL DEVELOPMENT” No 41
Jelgava, LLU ESAF, 21-22 April 2016, pp. 45-52
1Corresponding author. Tel.: + 371 26400991 E-mail address: [email protected] 52
specified time, thereby efficiently exploiting
the lorries and their driver working hours.
5) The transport dispatcher of DSG Karjeri
LLC has to ensure that the purchased lorries
are operated to meet the needs of DSG Karjeri
LLC and to provide transport services to other
companies, thus, earning extra revenues.
Bibliography
1. Bowersox, D. J., Closs, D. J. (1996). Logistical Management. London: The McGraw-Hill Companies. p. 645.
2. Heskett, J. L., Sasser, W. E., Hart, C. W. L. (1990). Service Breakthroughs: Changing the Rules of the Game. New York: The Free Press. p. 389.
3. Krumina, A. (1997). Logistics Strategic Planning as an Element of the System of a Company’s Strategic Planning. In: Scientific papers University of Latvia, Economics IV, Volume 689. pp. 161-175.
4. Stock, J., Douglas, L. (2000). Strategic Logistics Management. New York: The Free Press. p. 312.
5. Ozolins, D., Kruzs, K. (2005). Perspectives of Transport Logistics Development in Latvia. In: Scientific papers University of Latvia, Economics IV, Volume 689, pp. 239-251.
6. Patlins, P. (2011). Road Transportation Planning Optimization within Logistic System. Summary of the Doctoral thesis. Riga: RTU Izdevnieciba. p. 37.
7. Praude, V., Belcikovs, J. (2003). Logistics (in Latvian). Riga: Vaidelote. p. 277.
8. Radzele-Sulce, A. (2011). Economic Benefits of Logistics Application in the Agriculture Sector. Summary of the Doctoral thesis. Jelgava. p. 72.
9. Slavinska, I. (2007). The Role of Logistics in Improving Performance of Local Governments. Proceedings of the Latvia University of Agriculture, Volume 19, Issue 314, Jelgava. pp. 62-75.
10. Sprancmanis, N. (2011). Basics of Business Logistics (in Latvian). Riga: Burtene. p. 219.
11. Urbahs, A. Cerkovnuks, A. (2003). Intermodal Container Transport (in Latvian). Riga: RTU izdevnieciba. p. 496.
12. Zurek, M. B., Henrichs, T. (2007). Linking Scenarios across Geographical Scales in International Environment Assessments. Technological Forecasting and Social Change, Volume 74, No. 8, pp. 1282–1295.
13. Sergeyev, V.I. (2005). Corporate Logistics: 300 Answers to Questions of Professionals (in Russian). Moscow: Infra-M, p. 976.
Proceedings of the 2016 International Conference “ECONOMIC SCIENCE FOR RURAL DEVELOPMENT” No 41
Jelgava, LLU ESAF, 21-22 April 2016, pp. 53-60
1Corresponding author. Tel.: + 48 22 5934023; fax: + 48 22 5934010. E-mail address: [email protected] 53
ARE POLISH RURAL AREAS DESTINATIONS FOR COMMUTING? Nina Drejerska1, PhD
1Warsaw University of Life Sciences
Abstract. Rural areas in Poland have faced significant changes recently. The primary sector has been decreasing its
contribution to local employment. The aim of the paper is to identify to what extent rural areas in Poland are
destinations for incoming commuters. The degree of urbanisation (DEGURBA) framework was used as a reference for
an urban-rural typology of local units. The National Census of Population and Housing 2011 provided the most recent
data on commuting in municipalities of Poland.
A statistical analysis with use of the V Cramer coefficient proves a strong relationship between a type of local unit and
a number of incoming commuters and a medium relationship between a type of local unit and density of incoming
commuters. Generally, urban local units tend to attract the highest number of commuters. Rural areas attract
relatively less commuters – the number of rural local units decreases as one considers a higher number of commuters.
However, there exist some exceptions of intermediate and rural local units where a significant number of commuters
work because of their localization close to big cities or some specific activities located there.
Key words: rural areas, commuting, DEGURBA.
JEL code: J61, R23
Introduction
Polish rural inhabitants have been facing
many challenges connected with the economy's
transformation, including a decrease of the
primary sector's role and the development of
other, non-agricultural functions of rural areas.
These processes contribute to changes in the
labour market (Drejerska N., 2010). There are
clear differences in the employment rate between
thinly-populated and densely-populated areas in
Poland (Drejerska N., 2014). The demographic
and financial situation of rural population is
largely determined by the distance between place
of residence and a large urban centre. Rural
areas located near large cities can be
characterized by higher population density, high
positive net migration and lower share of the
unemployed in comparison to remote rural areas
(Central Statistical Office of Poland, Statistical
Office in Olsztyn, 2013).
The aim of the paper is to identify to what
extent rural areas in Poland are destinations for
incoming commuters. The following specific
research tasks have been set: 1) to investigate a
relationship between a local unit’s type (urban-
rural) and a number and density of incoming
commuters; 2) to visualise data on commuting to
rural areas on maps and to interpret spatial
patterns. In such an approach, rural areas are
treated as a starting point of the research
process and an ability to attract incoming
commuters means a sign of development
potential. This relation results from perception of
labour market as an element of socio-economic
development of rural municipalities
(Wojewodzka-Wiewiorska A., 2014). This topic is
also especially important as urban and regional
development studies have tended to focus on
urban centres (Gorecka A., 2015) as the driving
forces in innovation and growth, with surrounding
rural areas cast in a passive and residual role
(Ward N., Brown D. L., 2009). Historically, cities
were treated as places playing a role of socio-
economic centre offering employment
(Rakowska J., 2014).
The first step, before the main analysis, is to
clearly define what types of territories are
considered as rural. There are many various
classifications used for different purposes. For
this study, the author applied the degree of
urbanisation (DEGURBA). DEGURBA methodology
distinguishes the following types of territories
(Eurostat, 2015):
• high-density clusters (or city centre):
contiguous grid cells of 1 km2 with a density
of at least 1 500 inhabitants per km2 and a
minimum population of 50 000;
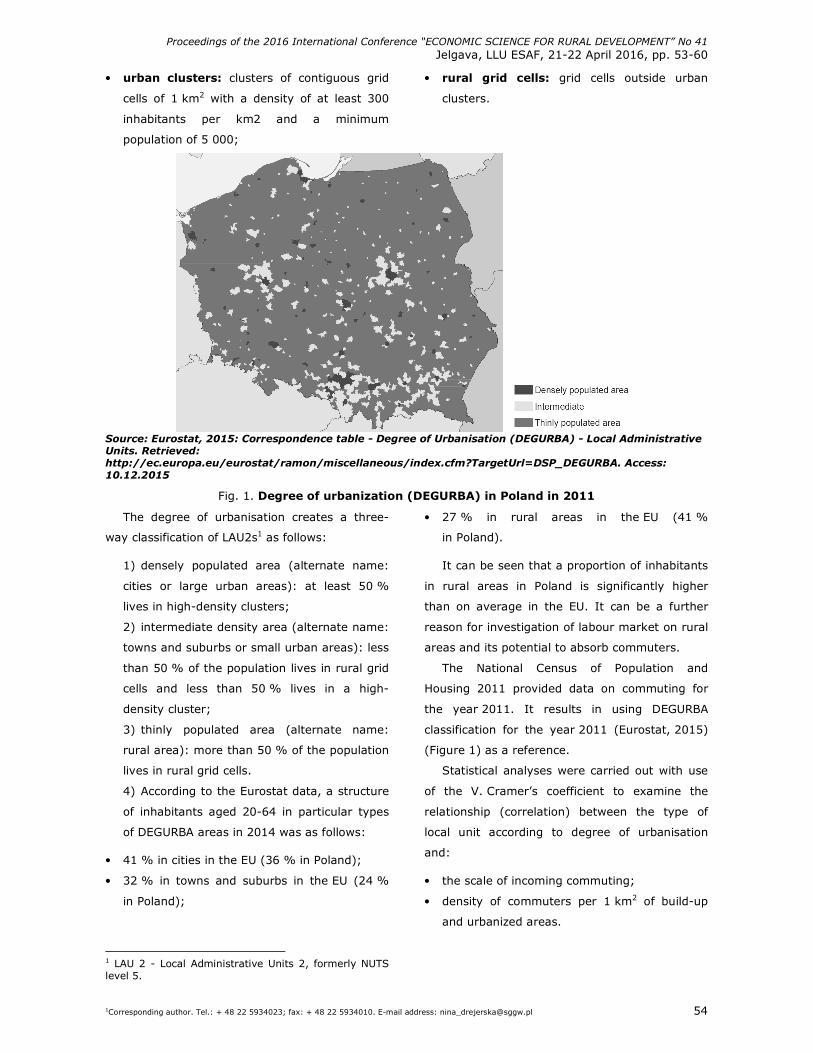
Proceedings of the 2016 International Conference “ECONOMIC SCIENCE FOR RURAL DEVELOPMENT” No 41
Jelgava, LLU ESAF, 21-22 April 2016, pp. 53-60
1Corresponding author. Tel.: + 48 22 5934023; fax: + 48 22 5934010. E-mail address: [email protected] 54
• urban clusters: clusters of contiguous grid
cells of 1 km2 with a density of at least 300
inhabitants per km2 and a minimum
population of 5 000;
• rural grid cells: grid cells outside urban
clusters.
Source: Eurostat, 2015: Correspondence table - Degree of Urbanisation (DEGURBA) - Local Administrative Units. Retrieved: http://ec.europa.eu/eurostat/ramon/miscellaneous/index.cfm?TargetUrl=DSP_DEGURBA. Access: 10.12.2015
Fig. 1. Degree of urbanization (DEGURBA) in Poland in 2011
The degree of urbanisation creates a three-
way classification of LAU2s1 as follows:
1) densely populated area (alternate name:
cities or large urban areas): at least 50 %
lives in high-density clusters;
2) intermediate density area (alternate name:
towns and suburbs or small urban areas): less
than 50 % of the population lives in rural grid
cells and less than 50 % lives in a high-
density cluster;
3) thinly populated area (alternate name:
rural area): more than 50 % of the population
lives in rural grid cells.
4) According to the Eurostat data, a structure
of inhabitants aged 20-64 in particular types
of DEGURBA areas in 2014 was as follows:
• 41 % in cities in the EU (36 % in Poland);
• 32 % in towns and suburbs in the EU (24 %
in Poland);
1 LAU 2 - Local Administrative Units 2, formerly NUTS level 5.
• 27 % in rural areas in the EU (41 %
in Poland).
It can be seen that a proportion of inhabitants
in rural areas in Poland is significantly higher
than on average in the EU. It can be a further
reason for investigation of labour market on rural
areas and its potential to absorb commuters.
The National Census of Population and
Housing 2011 provided data on commuting for
the year 2011. It results in using DEGURBA
classification for the year 2011 (Eurostat, 2015)
(Figure 1) as a reference.
Statistical analyses were carried out with use
of the V. Cramer’s coefficient to examine the
relationship (correlation) between the type of
local unit according to degree of urbanisation
and:
• the scale of incoming commuting;
• density of commuters per 1 km2 of build-up
and urbanized areas.
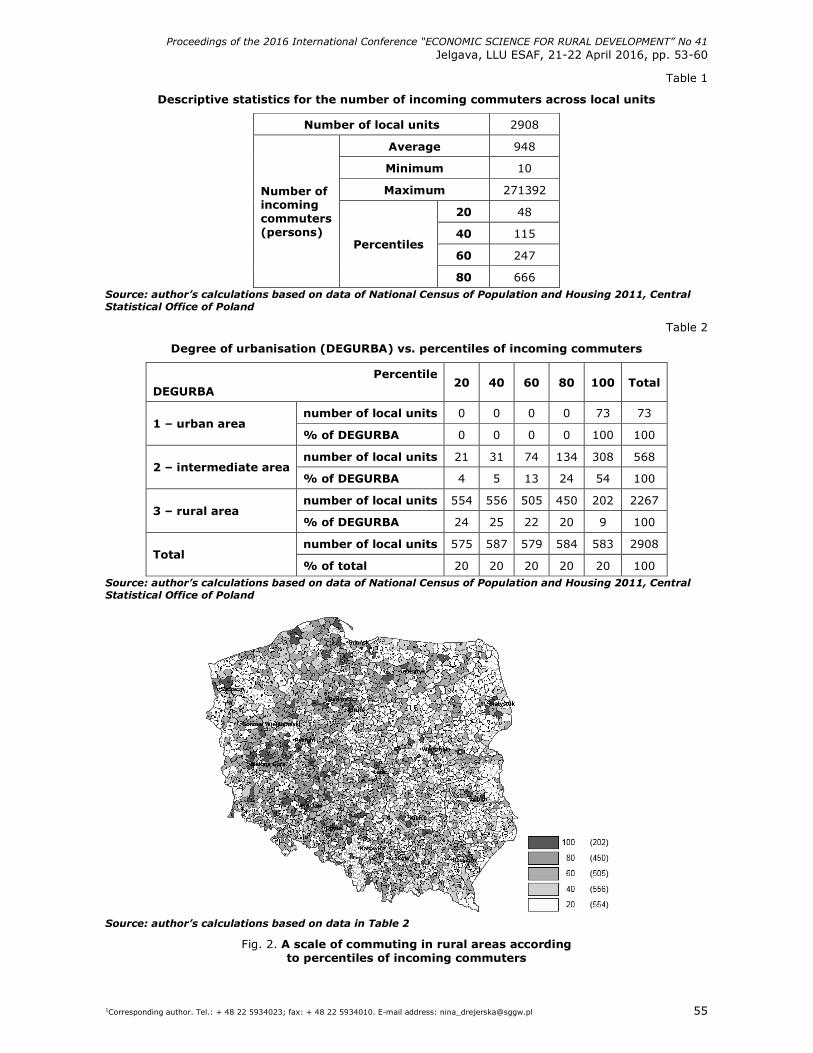
Proceedings of the 2016 International Conference “ECONOMIC SCIENCE FOR RURAL DEVELOPMENT” No 41
Jelgava, LLU ESAF, 21-22 April 2016, pp. 53-60
1Corresponding author. Tel.: + 48 22 5934023; fax: + 48 22 5934010. E-mail address: [email protected] 55
Table 1
Descriptive statistics for the number of incoming commuters across local units
Number of local units 2908
Average 948
Minimum 10
Maximum 271392
20 48
40 115
60 247
Number of incoming commuters (persons)
Percentiles
80 666 Source: author’s calculations based on data of National Census of Population and Housing 2011, Central Statistical Office of Poland
Table 2
Degree of urbanisation (DEGURBA) vs. percentiles of incoming commuters
Percentile
DEGURBA 20 40 60 80 100 Total
number of local units 0 0 0 0 73 73 1 – urban area
% of DEGURBA 0 0 0 0 100 100
number of local units 21 31 74 134 308 568 2 – intermediate area
% of DEGURBA 4 5 13 24 54 100
number of local units 554 556 505 450 202 2267 3 – rural area
% of DEGURBA 24 25 22 20 9 100
number of local units 575 587 579 584 583 2908 Total
% of total 20 20 20 20 20 100 Source: author’s calculations based on data of National Census of Population and Housing 2011, Central Statistical Office of Poland
Source: author’s calculations based on data in Table 2
Fig. 2. A scale of commuting in rural areas according to percentiles of incoming commuters
Proceedings of the 2016 International Conference “ECONOMIC SCIENCE FOR RURAL DEVELOPMENT” No 41
Jelgava, LLU ESAF, 21-22 April 2016, pp. 53-60
1Corresponding author. Tel.: + 48 22 5934023; fax: + 48 22 5934010. E-mail address: [email protected] 56
The choice of the coefficient was conditioned
by the kind of data – the V. Cramer’s coefficient
allows comparison of categorical variables and it
is the most useful one when variables have more
than two categories (Field A., 2009).
Research results and discussion
The National Census of Population and
Housing 2011 provided data for 2908 local units1
in Poland on a number of commuters working
there (incoming commuters). Available results
include units with flows more than 9 persons, so
the minimal number of commuters is 10. The
maximum is represented by the Polish capital, at
the same the largest Polish city, Warsaw
(Table 1).
Generally, it should be concluded that
majority (60 %) of local units attract not more
than 247 commuters. This scale of incoming
commuting in particular unit can be treated as an
equivalent of employment in a medium
enterprise2. A group of the first ten units with the
highest number of incoming commuters consists
of Warsaw, Katowice, Krakow. Poznan, Wroclaw,
Lodz, Rzeszow, Gdansk and Lublin (regional
capitals) as well as Bielsko-Biala.
Data on commuting (Table 2) proves that
urban areas attract commuters to a most
significant extent. All local units with 20% of the
highest number of incomings have urban
character according to DEGURBA. There are some
rural units attracting many incoming commuters;
they are located near regional capitals, for
example Wroclaw, Zielona Gora, Poznan, also
Warsaw (Figure 3).
In order to verify if there is a statistically
important relationship between a scale of
commuting (expressed according to percentiles of
number of incoming commuters) and a character
of a local unit, the author calculated the
1 LAU 2 (Local Administrative Units 2, formerly NUTS level 5) as well as their urban and rural parts in case of those which have an administrative urban-rural character. 2 As according to the EU recommendation, a medium-sized enterprise has 50-250 staff headcount.
V. Cramer coefficient. To calculate it, only
intermediate and rural areas were taken into
account as urban areas represented only a
largest scale of commuting. For 2835 local units,
the V. Cramer coefficient has the value of 0.503
with the level of significance p<0.001. The
V. Cramer’s coefficient lies in the interval <0;
1>, where 0 means no association and 1 perfect
association. Some references suggest the
following interpretation (Sheskin D. J., 2011):
• <0.1; 0.3) – small relationship;
• <0.3; 0.5) – moderate relationship;
• <0.5; 1> - strong relationship.
As a result it can be concluded that the
calculated value of the V. Cramer’s coefficient
indicates a strong relationship between a
character of a local unit and a scale of attracting
commuters. Local units characterized as
intermediate areas tend to attract more incoming
commuters – more such units represent higher
numbers of commuters. Rural areas attract
relatively less commuters – the number of rural
local units decreases as one considers a higher
number of commuters.
As local units are diversified across Poland in
terms of their area, so the next step of the
analysis is to check if the scale of incoming
commuters can be conditioned by a physical area
of particular local unit. In other words, to check if
simply larger local units attract a greater number
of incoming commuters. In such a situation, a
type (rural or urban) does not matter because
the primary relation lies between the area of a
local unit and the number of incoming
commuters. In order to verify it, a density of
incoming commuters was calculated as a number
of commuters per 1 km2 of build-up and
urbanized areas of particular local unit (Table 3).
Proceedings of the 2016 International Conference “ECONOMIC SCIENCE FOR RURAL DEVELOPMENT” No 41
Jelgava, LLU ESAF, 21-22 April 2016, pp. 53-60
1Corresponding author. Tel.: + 48 22 5934023; fax: + 48 22 5934010. E-mail address: [email protected] 57
Table 3
Descriptive statistics for the density of incoming commuters across local units
No of local units 2908
Average 120
Minimum 1
Maximum 2534
20 13
40 33
60 75
Density of incoming commuters (persons/km2)
Percentiles
80 191 Source: author’s calculations based on data of National Census of Population and Housing 2011, Central Statistical Office of Poland
Generally, it can be concluded that majority
(60 %) of local units attract not more than
75 commuters per 1 km2 of build-up and
urbanized areas. It should be noticed that in the
case of the density, there is not so straight
relationship that the largest cities can be
characterized by a higher density of commuters.
In the ranking of the highest density, a group of
first ten local units includes only two urban units
(one of them is Warsaw), four intermediate and
four rural local units. One reason which can lie
behind this result is a specific character of the
economy in some of these units. For example,
there are two units, where coal mines are
located. These types of large activities attract not
only local inhabitants but also commuters from
other local units. Moreover, providing analyses on
such a low level of territorial division, it is
necessary to stress that rural areas, even
distinguished basing on the LAU 2 level, are not
uniform. Intermediate rural areas, being more or
less connected to cities, often show a positive
development. At the same time, more peripheral
rural regions are in a worse position because of
some general characteristics that limit their
potential to gain from smart growth policies, such
as lack of scale in their population and industrial
base and limited access to markets
(Naldi L. et al., 2015).
Table 4
Degree of urbanisation (DEGURBA) vs. density of incoming commuters
Percentile
DEGURBA 20 40 60 80 100 Total
number of local units
0 0 0 18 55 73 1 – urban area
% of DEGURBA 0 0 0 25 75 100
number of local units
17 28 90 177 256 568 2 – intermediate area % of DEGURBA 3 5 16 31 45 100
number of local units
543 563 503 385 273 2267 3 – rural area
% of DEGURBA 24 25 22 17 12 100
number of local units
560 591 593 580 584 2908 Total
% of total 20 20 20 20 20 100 Source: author’s calculations based on data of National Census of Population and Housing 2011, Central Statistical Office of Poland
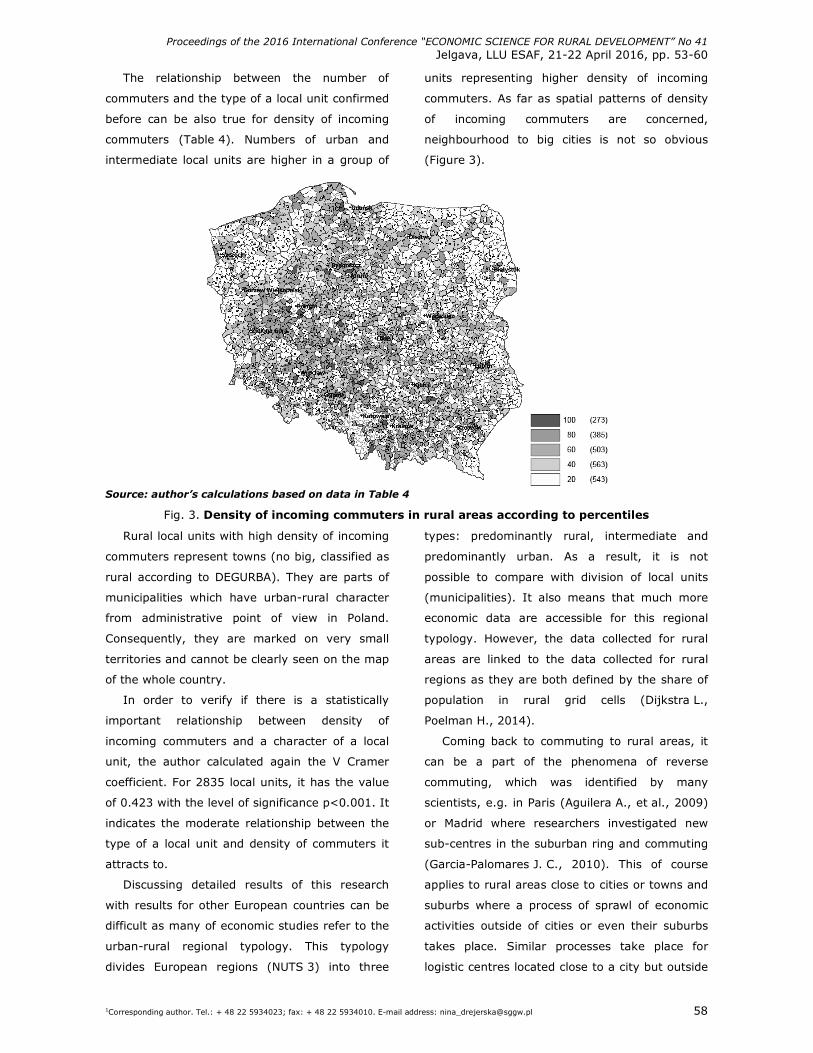
Proceedings of the 2016 International Conference “ECONOMIC SCIENCE FOR RURAL DEVELOPMENT” No 41
Jelgava, LLU ESAF, 21-22 April 2016, pp. 53-60
1Corresponding author. Tel.: + 48 22 5934023; fax: + 48 22 5934010. E-mail address: [email protected] 58
The relationship between the number of
commuters and the type of a local unit confirmed
before can be also true for density of incoming
commuters (Table 4). Numbers of urban and
intermediate local units are higher in a group of
units representing higher density of incoming
commuters. As far as spatial patterns of density
of incoming commuters are concerned,
neighbourhood to big cities is not so obvious
(Figure 3).
Source: author’s calculations based on data in Table 4
Fig. 3. Density of incoming commuters in rural areas according to percentiles
Rural local units with high density of incoming
commuters represent towns (no big, classified as
rural according to DEGURBA). They are parts of
municipalities which have urban-rural character
from administrative point of view in Poland.
Consequently, they are marked on very small
territories and cannot be clearly seen on the map
of the whole country.
In order to verify if there is a statistically
important relationship between density of
incoming commuters and a character of a local
unit, the author calculated again the V Cramer
coefficient. For 2835 local units, it has the value
of 0.423 with the level of significance p<0.001. It
indicates the moderate relationship between the
type of a local unit and density of commuters it
attracts to.
Discussing detailed results of this research
with results for other European countries can be
difficult as many of economic studies refer to the
urban-rural regional typology. This typology
divides European regions (NUTS 3) into three
types: predominantly rural, intermediate and
predominantly urban. As a result, it is not
possible to compare with division of local units
(municipalities). It also means that much more
economic data are accessible for this regional
typology. However, the data collected for rural
areas are linked to the data collected for rural
regions as they are both defined by the share of
population in rural grid cells (Dijkstra L.,
Poelman H., 2014).
Coming back to commuting to rural areas, it
can be a part of the phenomena of reverse
commuting, which was identified by many
scientists, e.g. in Paris (Aguilera A., et al., 2009)
or Madrid where researchers investigated new
sub-centres in the suburban ring and commuting
(Garcia-Palomares J. C., 2010). This of course
applies to rural areas close to cities or towns and
suburbs where a process of sprawl of economic
activities outside of cities or even their suburbs
takes place. Similar processes take place for
logistic centres located close to a city but outside
Proceedings of the 2016 International Conference “ECONOMIC SCIENCE FOR RURAL DEVELOPMENT” No 41
Jelgava, LLU ESAF, 21-22 April 2016, pp. 53-60
1Corresponding author. Tel.: + 48 22 5934023; fax: + 48 22 5934010. E-mail address: [email protected] 59
city’s borders because of lower land prices and
acceptable accessibility. This explanation has
limited application in this case as usually there
are intermediate density areas between cities and
rural areas according to the DEGURBA
classification. However, such a pattern can be
identified (Figure 3); rural local units with highest
numbers of incoming commuters are located near
regional capitals, as for example Bydgoszcz,
Wroclaw or Poznan.
The second clear reason for commuting to
rural areas was displayed in the qualitative
results of this research. There exist some local
units, classified as rural ones, where some
specific activities were located, as for example a
military unit in Powidz. It is estimated that its
liquidation can result in increase of unemployed
by 70% in the municipality (Sirko S., 2012).
However, also this situation should be treated as
exception, which rather confirms conclusions
drawn from cross-analysis between a
number/density of commuters and the type of a
local unit - rural areas generally do not attract
commuters to such extent as cities and
intermediate areas. A larger number of available
work places in urban municipalities, so as a result
a more significant potential to attract commuters,
was for example noticed in Latvia
(Bulderberga Z., 2015). A similar problem of lack
of working places in rural areas was detected in
the Czech Republic (Domeova L., Jindrova A.,
2014).
Conclusions
Rural areas in Poland have recently faced
significant changes. The primary sector has been
decreasing its contribution to local employment.
In such a situation, it is interesting to examine if
rural areas have potential to attract commuters
as workplaces’ creation can be treated as an
important development factor of particular
territory. Data on commuting to local territorial
units and types of local unites were cross-
analysed in order to investigate it. The statistical
analysis as well as visualization on maps proved
that local units characterized as urban areas tend
to attract the highest number of commuters.
Rural areas attract relatively less commuters –
the number of rural local units decreases as one
considers a higher number of commuters. The
same direction of the interpretation of the
relationship occurred in the analyses of the
absolute values of incoming commuters as well
as in the case of their density per 1 km2.
However, it does not mean that rural or
intermediate areas in Poland are not interested
for commuters at all. There are some units,
which thanks to their localization, relatively close
to a city, or some special activities running there,
attract a significant number of commuters.
Bibliography
1. Aguilera, A., Wenglenski, S., Proulhac, L. (2009). Employment Suburbanisation, Reverse Commuting and Travel Behaviour by Residents of the Central City in the Paris Metropolitan Area. Transportation Research Part A, Volume 43 (2009), pp. 685–691.
25. Bulderberga, Z. (2015). Rural and Urban Municipalities in the Regions of Latvia – Development Tendencies and Challenges. Economic Science for Rural Development. Integrated and Sustainable Regional Development, No 38, Jelgava, p. 158.
26. Central Statistical Office of Poland, Statistical Office in Olsztyn, (2013). Rural Areas in Poland - National Agricultural Census 2010, Warsaw, Olsztyn, p. 141.
27. Dijkstra, L., Poelman, H. (2014). A Harmonised Definition of Cities and Rural Areas: the New Degree of Urbanisation. Regional Working Paper, WP 01/2014, European Commission, p. 14.
28. Domeova, L., Jindrova, A. (2014). Quality of Life in the Rural Territories. Agrarian Perspectives XXIII. The Community-Led Rural Development Proceedings of the 23th International Scientific Conference, Prague, Czech University of Life Sciences Prague, p. 47.
29. Drejerska, N. (2010). Education as a Determinant of the Economic Activity of Rural Inhabitants on the Polish Labour Market. Studies on the Agricultural and Food Sector in Central and Eastern Europe, Volume 56, pp. 68-75.
30. Drejerska, N. (2014). Obszary przewazajaco wiejskie w Polsce - perspektywa rynku pracy (Predominantly Rural Areas in Poland – Labour Market Perspective). [in:] Rolnictwo, gospodarka zywnosciowa, obszary wiejskie - 10 lat w Unii Europejskiej (Agriculture, Food Industry, Rural Areas – 10 Years in the European Union). Warsaw, Warsaw University of Life Sciences, pp. 57-58.
Proceedings of the 2016 International Conference “ECONOMIC SCIENCE FOR RURAL DEVELOPMENT” No 41
Jelgava, LLU ESAF, 21-22 April 2016, pp. 53-60
1Corresponding author. Tel.: + 48 22 5934023; fax: + 48 22 5934010. E-mail address: [email protected] 60
31. Eurostat, (2015). Correspondence table - Degree of Urbanisation (DEGURBA) - Local Administrative Units. Retrieved: http://ec.europa.eu/eurostat/ramon/miscellaneous/index.cfm?TargetUrl=DSP_DEGURBA. Access: 10.12.2015.
32. Field, A. (2009). Discovering Statistics Using SPSS. Third Edition, Sage Publications Ltd, p. 698.
33. Garcia-Palomares, J. C. (2010). Urban Sprawl and Travel to Work: the Case of the Metropolitan Area of Madrid. Journal of Transport Geography 18 (2010) pp. 197–213.
34. Gorecka, A. (2015). Problems With Organising Agglomeration Passenger Transport Network – The Case of Warsaw Agglomeration. Logistics and Transport No 3(27)/2015 pp. 11-16.
35. Naldi, L., Nilsson, P., Westlund, H., Wixe, S. (2015). What is Smart Rural Development? Journal of Rural Studies 40 (2015), p. 99.
36. Rakowska, J. (2014). Codzienne dojazdy do pracy jako ekonomiczne kryterium rządowych klasyfikacji i delimitacji obszarów (na przykładzie USA i Kanady) (Commuting as an Economic Criterion of Categorization and Delimitation of Areas (Examples of US and Canadian Governmental Classifications)). Studia Regionalne i Lokalne no 3(57)2014, p. 49.
37. Sheskin, D. J. (2011). Handbook of Parametric and Nonparametric Statistical Procedures. Fifth Edition, Chapman and Hall/CRC, p. 535.
38. Sirko, S. (2012). Społeczne i ekonomiczne konsekwencje likwidacji jednostki wojskowej na przykładzie wybranych gmin (Socio-economic Consequences of Military Unit Liquidation on the Example of Selected Municipalities). Nierownosci Spoleczne a Wzrost Gospodarczy, Volume 29, Uniwersytet Rzeszowski, p. 309.
39. Ward, N., Brown, D.L. (2009). Placing the Rural in Regional Development. Regional Studies, Volume 43.10, p. 1238.
40. Wojewodzka-Wiewiorska A. (2014). Dynamika rozwoju spoleczno-ekonomicznego gmin wiejskich wojewodztwa mazowieckiego na tle innych typow gmin (Dynamics of the Socio-Economic Development of Rural Communes Relating to Other Types of Communes in the Masovian Voivodeship) Journal of Agribusiness and Rural Development 2014, no 2, pp. 213-223.
Proceedings of the 2016 International Conference “ECONOMIC SCIENCE FOR RURAL DEVELOPMENT” No 41
Jelgava, LLU ESAF, 21-22 April 2016, pp. 61-68
1Corresponding author. e-mail: [email protected] tel. +48 89 523 45 98 61 2Corresponding author. e-mail: [email protected] tel. +48 89 523 32 30
DEVELOPMENT OF ENTREPRENEURSHIP IN RURAL AREAS OF NORTH-EASTERN POLAND
Sebastian Goraj, PhD, Eng.1; Marta Gwiazdzinska-Goraj, PhD2;
1Department of Geoinformation Analysis and Cadastre, 2Department of Planning and Spatial Engineering Faculty of Geodesy, Geospatial and Civil Engineering
University of Warmia and Mazury in Olsztyn, Poland
Abstract. Rural areas are characterised by a considerable diversification of their natural, demographic, historical,
spatial and socio-economic conditions. These conditions caused disproportions in the density of entities of national
economy in the rural areas of North-eastern Poland. The main aim of article is the presentation of both the growth of
non-agricultural activity in the rural areas of the Warminsko-Mazurskie and Podlaskie Voivodships in 2014 and the
dynamics of changes in relation to 2004. Upon the analyses it was concluded that the density level of entities of
national economy and the dynamics of change in entities of national economy featured by large disproportions across
rural communes. The biggest changes characterised mainly the rural communes lying near the largest towns in the
region: Olsztyn, Elblag and Bialystok. The highest dynamics of increase among the rural communes of North-eastern
Poland were mainly recorded in the Warminsko-Mazurskie voivodship; whereas the most noteworthy decrease in the
number of entities of national economy was in the rural communes situated along the Eastern border of the Podlaskie
voivodship, which is the reflection of their poor economic activity. For a more profound analysis of the spatial
distribution of the growth of entrepreneurship, the study results were juxtaposed to the existing demographic potential
of the rural areas in North-eastern Poland. The results of the study revealed the following tendency: the higher the
demographic potential of rural communes was, the more favourable indicators of growth of entrepreneurship
appeared. It proves that demographic potential of workforce has a considerable impact on the development of the
rural areas of North-eastern Poland.
Key words: entrepreneurship, rural areas, North-eastern Poland.
JEL code: R11, R12, J10
Introduction
The area of North-eastern Poland comprises
the Warminsko-Mazurskie and Podlaskie
voivodships and covers 44,360 km2 and is
inhabited by 2,635,885 people. The investigated
area borders Kaliningrad Oblast, Lithuania and
Belarus, and it marks the easternmost boundary
of the European Union. North-Eastern Poland is
characterized by a high degree of naturalness,
diverse relief, an abundance of lakes, extensive
forests and rich flora and fauna (Bera. M, 2013;
Goraj .S, Nowak. M, Gwiazdzinska-Goraj. M,
2014). Unfortunately, the Warminsko-Mazurskie
and Podlaskie voivodships also feature a low level
of the Human Development Index and a poor
growth dynamics. In 2013, this region’s share in
the Gross National Product (GNP) – the
composite index illustrating an economic
development of a particular region – amounted to
as little as nearly 5.0 %. To a large extent, the
rural areas of North-eastern Poland comprise
agricultural land and are characterised by a high
ratio of agricultural production and food
production. However, the major development
trend which is gaining in significance there is
tourism. The rural areas which, not such a long
time ago – in the 1980s, were mono-functional
are now more and more conspicuously becoming
multi-functional, with the agricultural function
being accompanied by the growth in non-
agricultural activities (Goraj. S, Nowak. M,
Gwiazdzinska-Goraj. M, 2014). Sustainable
development of rural areas calls for reconciliation
of three dimensions of development, which take
into account the main objectives of rural area
development: economic, social and
environmental development (Dudzinska. M,
Kocur-Bera. K, 2015). One of the most important
solutions ensuring a sustainable development of
rural areas is the promotion and stimulation of
rural entrepreneurship. It has been common
knowledge that enterprises are the key to and a
driving force for both an economic growth and
diversification in Europe (Skubiak. B, 2015).
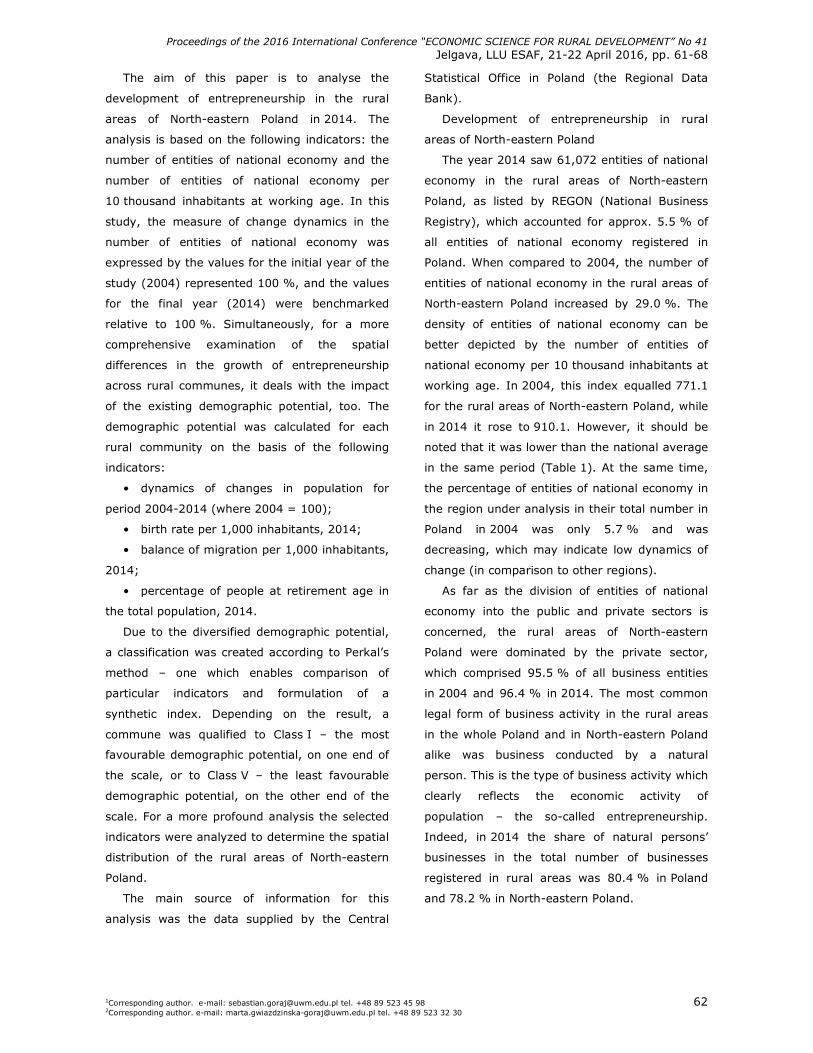
Proceedings of the 2016 International Conference “ECONOMIC SCIENCE FOR RURAL DEVELOPMENT” No 41
Jelgava, LLU ESAF, 21-22 April 2016, pp. 61-68
1Corresponding author. e-mail: [email protected] tel. +48 89 523 45 98 62 2Corresponding author. e-mail: [email protected] tel. +48 89 523 32 30
The aim of this paper is to analyse the
development of entrepreneurship in the rural
areas of North-eastern Poland in 2014. The
analysis is based on the following indicators: the
number of entities of national economy and the
number of entities of national economy per
10 thousand inhabitants at working age. In this
study, the measure of change dynamics in the
number of entities of national economy was
expressed by the values for the initial year of the
study (2004) represented 100 %, and the values
for the final year (2014) were benchmarked
relative to 100 %. Simultaneously, for a more
comprehensive examination of the spatial
differences in the growth of entrepreneurship
across rural communes, it deals with the impact
of the existing demographic potential, too. The
demographic potential was calculated for each
rural community on the basis of the following
indicators:
• dynamics of changes in population for
period 2004-2014 (where 2004 = 100);
• birth rate per 1,000 inhabitants, 2014;
• balance of migration per 1,000 inhabitants,
2014;
• percentage of people at retirement age in
the total population, 2014.
Due to the diversified demographic potential,
a classification was created according to Perkal’s
method – one which enables comparison of
particular indicators and formulation of a
synthetic index. Depending on the result, a
commune was qualified to Class I – the most
favourable demographic potential, on one end of
the scale, or to Class V – the least favourable
demographic potential, on the other end of the
scale. For a more profound analysis the selected
indicators were analyzed to determine the spatial
distribution of the rural areas of North-eastern
Poland.
The main source of information for this
analysis was the data supplied by the Central
Statistical Office in Poland (the Regional Data
Bank).
Development of entrepreneurship in rural
areas of North-eastern Poland
The year 2014 saw 61,072 entities of national
economy in the rural areas of North-eastern
Poland, as listed by REGON (National Business
Registry), which accounted for approx. 5.5 % of
all entities of national economy registered in
Poland. When compared to 2004, the number of
entities of national economy in the rural areas of
North-eastern Poland increased by 29.0 %. The
density of entities of national economy can be
better depicted by the number of entities of
national economy per 10 thousand inhabitants at
working age. In 2004, this index equalled 771.1
for the rural areas of North-eastern Poland, while
in 2014 it rose to 910.1. However, it should be
noted that it was lower than the national average
in the same period (Table 1). At the same time,
the percentage of entities of national economy in
the region under analysis in their total number in
Poland in 2004 was only 5.7 % and was
decreasing, which may indicate low dynamics of
change (in comparison to other regions).
As far as the division of entities of national
economy into the public and private sectors is
concerned, the rural areas of North-eastern
Poland were dominated by the private sector,
which comprised 95.5 % of all business entities
in 2004 and 96.4 % in 2014. The most common
legal form of business activity in the rural areas
in the whole Poland and in North-eastern Poland
alike was business conducted by a natural
person. This is the type of business activity which
clearly reflects the economic activity of
population – the so-called entrepreneurship.
Indeed, in 2014 the share of natural persons’
businesses in the total number of businesses
registered in rural areas was 80.4 % in Poland
and 78.2 % in North-eastern Poland.
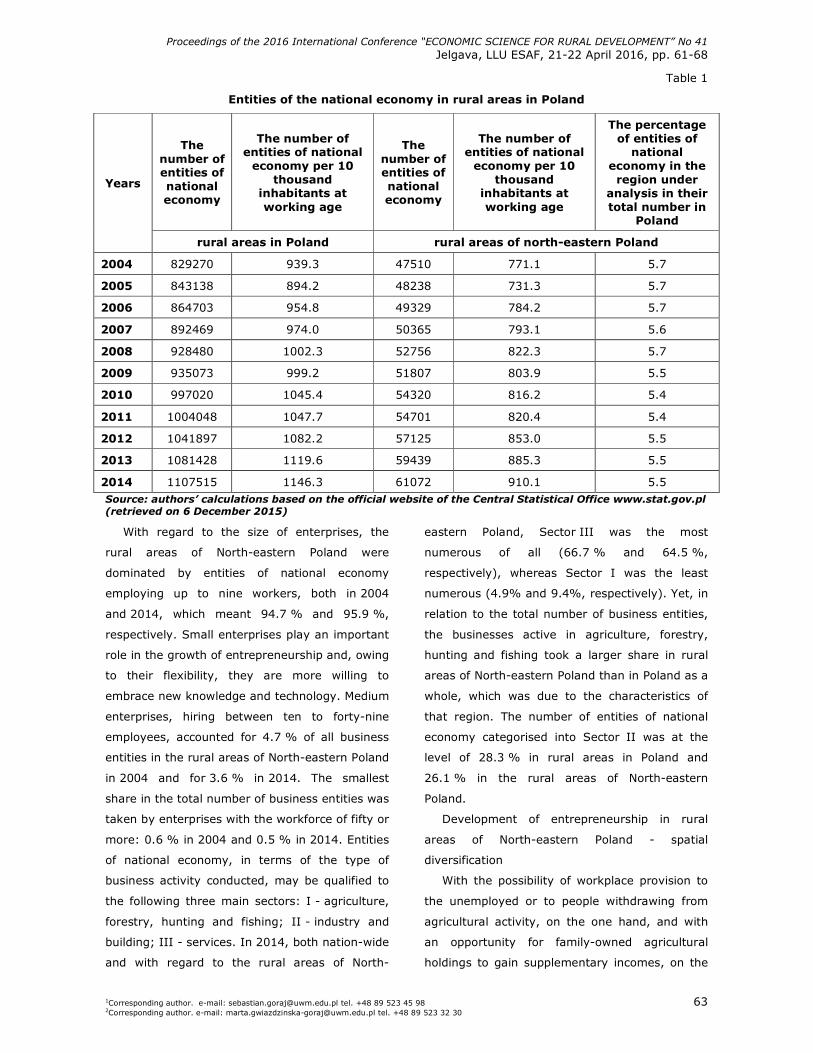
Proceedings of the 2016 International Conference “ECONOMIC SCIENCE FOR RURAL DEVELOPMENT” No 41
Jelgava, LLU ESAF, 21-22 April 2016, pp. 61-68
1Corresponding author. e-mail: [email protected] tel. +48 89 523 45 98 63 2Corresponding author. e-mail: [email protected] tel. +48 89 523 32 30
Table 1
Entities of the national economy in rural areas in Poland
The number of entities of national economy
The number of entities of national
economy per 10 thousand
inhabitants at working age
The number of entities of national economy
The number of entities of national
economy per 10 thousand
inhabitants at working age
The percentage of entities of
national economy in the
region under analysis in their total number in
Poland
Years
rural areas in Poland rural areas of north-eastern Poland
2004 829270 939.3 47510 771.1 5.7
2005 843138 894.2 48238 731.3 5.7
2006 864703 954.8 49329 784.2 5.7
2007 892469 974.0 50365 793.1 5.6
2008 928480 1002.3 52756 822.3 5.7
2009 935073 999.2 51807 803.9 5.5
2010 997020 1045.4 54320 816.2 5.4
2011 1004048 1047.7 54701 820.4 5.4
2012 1041897 1082.2 57125 853.0 5.5
2013 1081428 1119.6 59439 885.3 5.5
2014 1107515 1146.3 61072 910.1 5.5 Source: authors’ calculations based on the official website of the Central Statistical Office www.stat.gov.pl (retrieved on 6 December 2015)
With regard to the size of enterprises, the
rural areas of North-eastern Poland were
dominated by entities of national economy
employing up to nine workers, both in 2004
and 2014, which meant 94.7 % and 95.9 %,
respectively. Small enterprises play an important
role in the growth of entrepreneurship and, owing
to their flexibility, they are more willing to
embrace new knowledge and technology. Medium
enterprises, hiring between ten to forty-nine
employees, accounted for 4.7 % of all business
entities in the rural areas of North-eastern Poland
in 2004 and for 3.6 % in 2014. The smallest
share in the total number of business entities was
taken by enterprises with the workforce of fifty or
more: 0.6 % in 2004 and 0.5 % in 2014. Entities
of national economy, in terms of the type of
business activity conducted, may be qualified to
the following three main sectors: I - agriculture,
forestry, hunting and fishing; II - industry and
building; III - services. In 2014, both nation-wide
and with regard to the rural areas of North-
eastern Poland, Sector III was the most
numerous of all (66.7 % and 64.5 %,
respectively), whereas Sector I was the least
numerous (4.9% and 9.4%, respectively). Yet, in
relation to the total number of business entities,
the businesses active in agriculture, forestry,
hunting and fishing took a larger share in rural
areas of North-eastern Poland than in Poland as a
whole, which was due to the characteristics of
that region. The number of entities of national
economy categorised into Sector II was at the
level of 28.3 % in rural areas in Poland and
26.1 % in the rural areas of North-eastern
Poland.
Development of entrepreneurship in rural
areas of North-eastern Poland - spatial
diversification
With the possibility of workplace provision to
the unemployed or to people withdrawing from
agricultural activity, on the one hand, and with
an opportunity for family-owned agricultural
holdings to gain supplementary incomes, on the
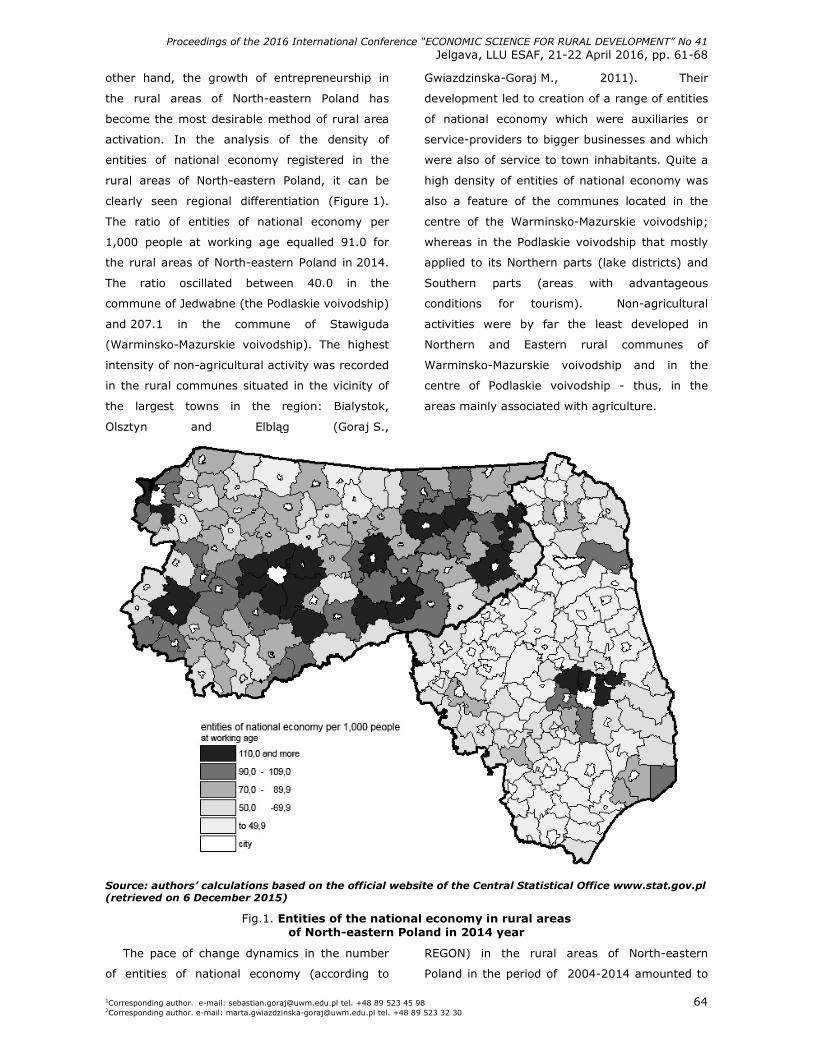
Proceedings of the 2016 International Conference “ECONOMIC SCIENCE FOR RURAL DEVELOPMENT” No 41
Jelgava, LLU ESAF, 21-22 April 2016, pp. 61-68
1Corresponding author. e-mail: [email protected] tel. +48 89 523 45 98 64 2Corresponding author. e-mail: [email protected] tel. +48 89 523 32 30
other hand, the growth of entrepreneurship in
the rural areas of North-eastern Poland has
become the most desirable method of rural area
activation. In the analysis of the density of
entities of national economy registered in the
rural areas of North-eastern Poland, it can be
clearly seen regional differentiation (Figure 1).
The ratio of entities of national economy per
1,000 people at working age equalled 91.0 for
the rural areas of North-eastern Poland in 2014.
The ratio oscillated between 40.0 in the
commune of Jedwabne (the Podlaskie voivodship)
and 207.1 in the commune of Stawiguda
(Warminsko-Mazurskie voivodship). The highest
intensity of non-agricultural activity was recorded
in the rural communes situated in the vicinity of
the largest towns in the region: Bialystok,
Olsztyn and Elbląg (Goraj S.,
Gwiazdzinska-Goraj M., 2011). Their
development led to creation of a range of entities
of national economy which were auxiliaries or
service-providers to bigger businesses and which
were also of service to town inhabitants. Quite a
high density of entities of national economy was
also a feature of the communes located in the
centre of the Warminsko-Mazurskie voivodship;
whereas in the Podlaskie voivodship that mostly
applied to its Northern parts (lake districts) and
Southern parts (areas with advantageous
conditions for tourism). Non-agricultural
activities were by far the least developed in
Northern and Eastern rural communes of
Warminsko-Mazurskie voivodship and in the
centre of Podlaskie voivodship - thus, in the
areas mainly associated with agriculture.
Source: authors’ calculations based on the official website of the Central Statistical Office www.stat.gov.pl (retrieved on 6 December 2015)
Fig.1. Entities of the national economy in rural areas of North-eastern Poland in 2014 year
The pace of change dynamics in the number
of entities of national economy (according to
REGON) in the rural areas of North-eastern
Poland in the period of 2004-2014 amounted to
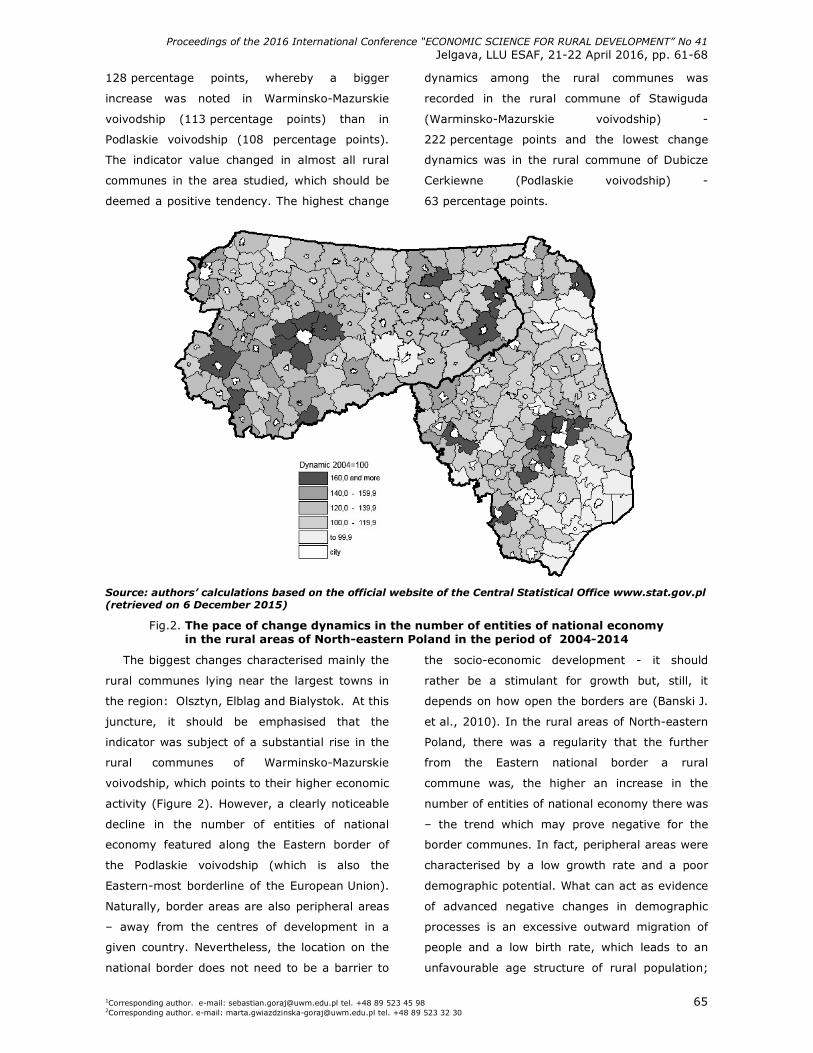
Proceedings of the 2016 International Conference “ECONOMIC SCIENCE FOR RURAL DEVELOPMENT” No 41
Jelgava, LLU ESAF, 21-22 April 2016, pp. 61-68
1Corresponding author. e-mail: [email protected] tel. +48 89 523 45 98 65 2Corresponding author. e-mail: [email protected] tel. +48 89 523 32 30
128 percentage points, whereby a bigger
increase was noted in Warminsko-Mazurskie
voivodship (113 percentage points) than in
Podlaskie voivodship (108 percentage points).
The indicator value changed in almost all rural
communes in the area studied, which should be
deemed a positive tendency. The highest change
dynamics among the rural communes was
recorded in the rural commune of Stawiguda
(Warminsko-Mazurskie voivodship) -
222 percentage points and the lowest change
dynamics was in the rural commune of Dubicze
Cerkiewne (Podlaskie voivodship) -
63 percentage points.
Source: authors’ calculations based on the official website of the Central Statistical Office www.stat.gov.pl (retrieved on 6 December 2015)
Fig.2. The pace of change dynamics in the number of entities of national economy in the rural areas of North-eastern Poland in the period of 2004-2014
The biggest changes characterised mainly the
rural communes lying near the largest towns in
the region: Olsztyn, Elblag and Bialystok. At this
juncture, it should be emphasised that the
indicator was subject of a substantial rise in the
rural communes of Warminsko-Mazurskie
voivodship, which points to their higher economic
activity (Figure 2). However, a clearly noticeable
decline in the number of entities of national
economy featured along the Eastern border of
the Podlaskie voivodship (which is also the
Eastern-most borderline of the European Union).
Naturally, border areas are also peripheral areas
– away from the centres of development in a
given country. Nevertheless, the location on the
national border does not need to be a barrier to
the socio-economic development - it should
rather be a stimulant for growth but, still, it
depends on how open the borders are (Banski J.
et al., 2010). In the rural areas of North-eastern
Poland, there was a regularity that the further
from the Eastern national border a rural
commune was, the higher an increase in the
number of entities of national economy there was
– the trend which may prove negative for the
border communes. In fact, peripheral areas were
characterised by a low growth rate and a poor
demographic potential. What can act as evidence
of advanced negative changes in demographic
processes is an excessive outward migration of
people and a low birth rate, which leads to an
unfavourable age structure of rural population;
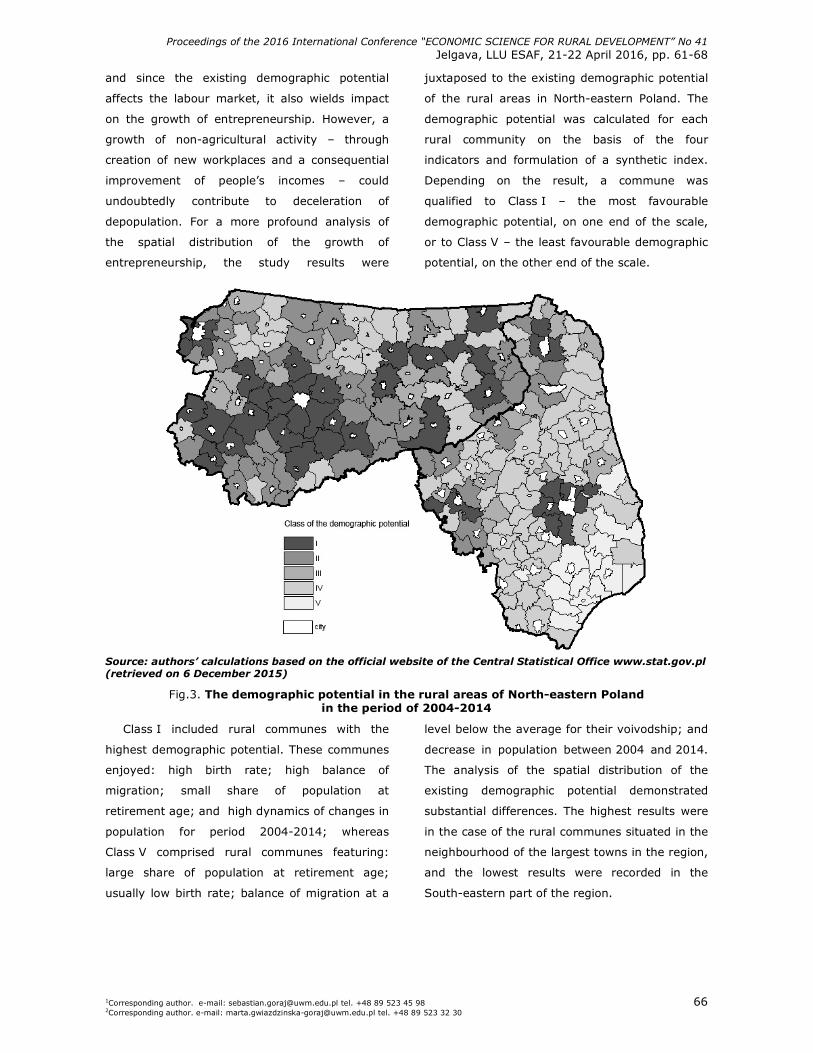
Proceedings of the 2016 International Conference “ECONOMIC SCIENCE FOR RURAL DEVELOPMENT” No 41
Jelgava, LLU ESAF, 21-22 April 2016, pp. 61-68
1Corresponding author. e-mail: [email protected] tel. +48 89 523 45 98 66 2Corresponding author. e-mail: [email protected] tel. +48 89 523 32 30
and since the existing demographic potential
affects the labour market, it also wields impact
on the growth of entrepreneurship. However, a
growth of non-agricultural activity – through
creation of new workplaces and a consequential
improvement of people’s incomes – could
undoubtedly contribute to deceleration of
depopulation. For a more profound analysis of
the spatial distribution of the growth of
entrepreneurship, the study results were
juxtaposed to the existing demographic potential
of the rural areas in North-eastern Poland. The
demographic potential was calculated for each
rural community on the basis of the four
indicators and formulation of a synthetic index.
Depending on the result, a commune was
qualified to Class I – the most favourable
demographic potential, on one end of the scale,
or to Class V – the least favourable demographic
potential, on the other end of the scale.
Source: authors’ calculations based on the official website of the Central Statistical Office www.stat.gov.pl (retrieved on 6 December 2015)
Fig.3. The demographic potential in the rural areas of North-eastern Poland in the period of 2004-2014
Class I included rural communes with the
highest demographic potential. These communes
enjoyed: high birth rate; high balance of
migration; small share of population at
retirement age; and high dynamics of changes in
population for period 2004-2014; whereas
Class V comprised rural communes featuring:
large share of population at retirement age;
usually low birth rate; balance of migration at a
level below the average for their voivodship; and
decrease in population between 2004 and 2014.
The analysis of the spatial distribution of the
existing demographic potential demonstrated
substantial differences. The highest results were
in the case of the rural communes situated in the
neighbourhood of the largest towns in the region,
and the lowest results were recorded in the
South-eastern part of the region.
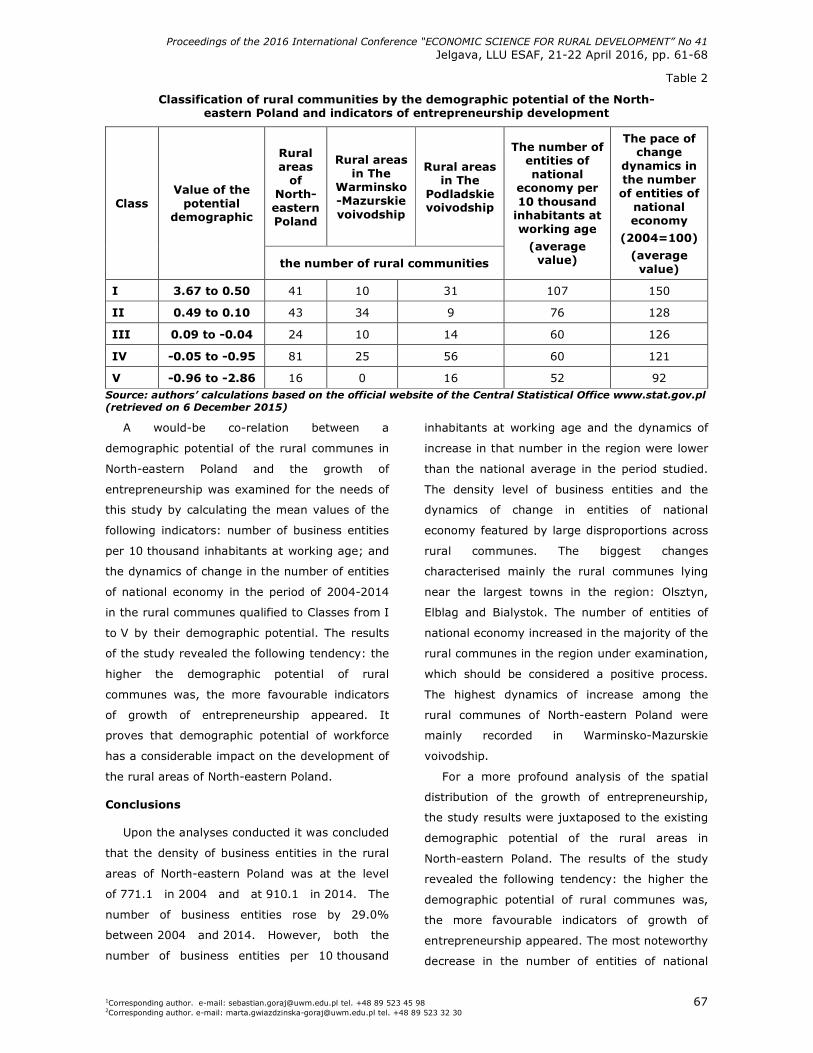
Proceedings of the 2016 International Conference “ECONOMIC SCIENCE FOR RURAL DEVELOPMENT” No 41
Jelgava, LLU ESAF, 21-22 April 2016, pp. 61-68
1Corresponding author. e-mail: [email protected] tel. +48 89 523 45 98 67 2Corresponding author. e-mail: [email protected] tel. +48 89 523 32 30
Table 2
Classification of rural communities by the demographic potential of the North-eastern Poland and indicators of entrepreneurship development
Rural areas
of North-eastern Poland
Rural areas in The
Warminsko-Mazurskie voivodship
Rural areas in The
Podladskie voivodship Class
Value of the potential
demographic
the number of rural communities
The number of entities of national
economy per 10 thousand
inhabitants at working age
(average value)
The pace of change
dynamics in the number of entities of
national economy
(2004=100)
(average value)
I 3.67 to 0.50 41 10 31 107 150
II 0.49 to 0.10 43 34 9 76 128
III 0.09 to -0.04 24 10 14 60 126
IV -0.05 to -0.95 81 25 56 60 121
V -0.96 to -2.86 16 0 16 52 92 Source: authors’ calculations based on the official website of the Central Statistical Office www.stat.gov.pl (retrieved on 6 December 2015)
A would-be co-relation between a
demographic potential of the rural communes in
North-eastern Poland and the growth of
entrepreneurship was examined for the needs of
this study by calculating the mean values of the
following indicators: number of business entities
per 10 thousand inhabitants at working age; and
the dynamics of change in the number of entities
of national economy in the period of 2004-2014
in the rural communes qualified to Classes from I
to V by their demographic potential. The results
of the study revealed the following tendency: the
higher the demographic potential of rural
communes was, the more favourable indicators
of growth of entrepreneurship appeared. It
proves that demographic potential of workforce
has a considerable impact on the development of
the rural areas of North-eastern Poland.
Conclusions
Upon the analyses conducted it was concluded
that the density of business entities in the rural
areas of North-eastern Poland was at the level
of 771.1 in 2004 and at 910.1 in 2014. The
number of business entities rose by 29.0%
between 2004 and 2014. However, both the
number of business entities per 10 thousand
inhabitants at working age and the dynamics of
increase in that number in the region were lower
than the national average in the period studied.
The density level of business entities and the
dynamics of change in entities of national
economy featured by large disproportions across
rural communes. The biggest changes
characterised mainly the rural communes lying
near the largest towns in the region: Olsztyn,
Elblag and Bialystok. The number of entities of
national economy increased in the majority of the
rural communes in the region under examination,
which should be considered a positive process.
The highest dynamics of increase among the
rural communes of North-eastern Poland were
mainly recorded in Warminsko-Mazurskie
voivodship.
For a more profound analysis of the spatial
distribution of the growth of entrepreneurship,
the study results were juxtaposed to the existing
demographic potential of the rural areas in
North-eastern Poland. The results of the study
revealed the following tendency: the higher the
demographic potential of rural communes was,
the more favourable indicators of growth of
entrepreneurship appeared. The most noteworthy
decrease in the number of entities of national
Proceedings of the 2016 International Conference “ECONOMIC SCIENCE FOR RURAL DEVELOPMENT” No 41
Jelgava, LLU ESAF, 21-22 April 2016, pp. 61-68
1Corresponding author. e-mail: [email protected] tel. +48 89 523 45 98 68 2Corresponding author. e-mail: [email protected] tel. +48 89 523 32 30
economy was noted in the rural communes
situated along the Eastern border of Podlaskie
voivodship, which is the reflection of their poor
economic activity. The distribution of the
analysed indicators illustrating the growth of
entrepreneurship depends on a great many
factors: natural, socio-economic, demographic,
historical, and institutional. However, an
unambiguous definition of their impact on and
significance for the growth of entrepreneurship is
a challenging task. The most difficult situation is
faced by the rural communes of North-eastern
Poland which are on the eastern border of
Podlaskie voivodship, where the low demographic
potential combined with the peripheral location
was responsible for a poor growth of
entrepreneurship. Moreover, a lack of stimulation
to non-agricultural activity in the rural areas of
this part of the region may result in further
accumulation of negative demographic processes.
Therefore, promotion and growth of rural
entrepreneurship are together one of the most
important solutions leading to a sustainable
development of rural areas of North-eastern
Poland.
Bibliography
1. Banski J., Dobrowolski J., Flaga M., Janicki W., Wesolowska M., 2010, Wplyw Granicy Panstwowej na Kierunki Rozwoju Spoleczno-Gospodarczego Wschodniej Czesci Wojewodztwa Lubelskiego (The Influence of the State Border on the Directions of Socio-Economic Development of the Eastern Part of Lublin Voivodeship), Studia Obszarow Wiejskich, 21, IGiPZ, PTG, Warszawa (in Polish)
2. Bera M. (2013). Atrakcyjnosc Turystyczna Gmin Wiejskich o Cennych Walorach Przyrodniczych Wojewodztwa Warminsko-Mazurskiego i Podlaskiego (Tourist Attractiveness of Rural Communes of Natural Values in Warminsko-Mazurskie and Podlaskie Voivodeships). Journal of Agribusiness and Rural Development, Volume 2 (28), pp. 5-12. (in Polish)
3. Dudzinska M. , Kocur-Bera K. (2015). The Identification of Homogeneous Groups (Subpopulations) in Studies of Rural Areas, Considering the Need of Rural Management Works. SGEM2015 Conference Proceedings, Book2 Vol. 2, pp 1147-1154.
4. Goraj S., Gwiazdzinska-Goraj M., 2011, Rozwoj Przedsiebiorczosci na Obszarach Wiejskich Wojewodztwa Warminsko-Mazurskiego (The Development of Entrepreneurship in Rural Areas of the Warmia and Mazury Voivodeship). Infrastruktura i Ekologia Terenow Wiejskich Number 2011/ 02, pp 171-181. (in Polish)
5. Goraj S., Nowak M., Gwiazdzinska-Goraj M. (2014). Functional Changes in Rural Areas in North-Eastern Poland. Research for Rural Development 2014, Volume 2, pp 140-146.
6. Skubiak B., (2015). Czynniki i Bariery Rozwoju Przedsiebiorczosci na Obszarach Wiejskich (Determinants of and Barriers to Entrepreneurship Development in Rural Areas). Studia i Prace Wydziału Nauk Ekonomicznych i Zarzadzania, NR 42, T. 2, pp 99-107. (in Polish)
7. www.stat.gov.pl
Proceedings of the 2016 International Conference “ECONOMIC SCIENCE FOR RURAL DEVELOPMENT” No 41
Jelgava, LLU ESAF, 21-22 April 2016, pp. 69-76
1Corresponding author e-mail: [email protected] tel. +48 89 523 32 30 69 2Corresponding author e-mail: [email protected] tel.+ +48 56 611 26 00
AGRICULTURAL EDUCATION OF MANAGERS OF AGRICULTURAL HOLDINGS IN POLAND IN 2002-2010
Marta Gwiazdzinska-Goraj1, PhD; Roman Rudnicki2, Associate Professor
1Department of Planning and Spatial Engineering Faculty of Geodesy, Geospatial and Civil Engineering University of Warmia and Mazury in Olsztyn, Poland
2Department of Spatial Management and Tourism Faculty of Earth Sciences Nicolaus Copernicus University, Poland
Abstract. The level of education completed by farm managers plays an important role in agricultural development.
The main aim of this article was to describe the structure of and changes in the educational status of farm managers in
Poland in 2002-2010. The analysed managers had completed the following levels of education: university degree in
agriculture, secondary school of agriculture or agricultural college, vocational school of agriculture, or a training course
in agriculture. The influence of environmental and non-environmental factors was taken into account in the analysis to
maximize the reliability of the spatial distribution of data. It was concluded that in both 2002 and 2010, less than 50%
of Polish farm managers had completed some form of formal training in agriculture The progress in agricultural
technology and production methods creates a demand for highly qualified farmers, thus, education plays an
increasingly important role in the modern agricultural sector. An analysis of the educational status of farm managers in
Poland in 2010 and the changes observed between 2002 and 2010 clearly point to regional differences. The
educational status of farm managers varied significantly across Polish regions, and the observed spatial distribution
patterns were determined mainly by historical events and agri-environmental conditions. The educational attainment
of farm managers was also positively correlated with the absorption rate of the EU funds, which implies that farm
managers with higher educational status are more successful in acquiring the EU funds for Polish agricultural
businesses.
Keywords: agricultural education, education, Poland.
JEL code: I21, I25
Introduction Agricultural performance is determined by
numerous factors. Human capital, defined as the
combination of skills, knowledge and professional
experience, began to play an increasingly
important role in the farming sector at the turn of
the 20 th and 21 st centuries (Janc, 2004;
Kaminska, 2014). Many rural communities are
characterized by low educational status due to
cultural, social, economic and organisational
reasons. At present, educational achievement in
rural areas continues to lag behind modern
requirements (Frenkel, 2003). Educational
attainment is one of the key elements in
qualitative assessments of workforce in the
farming sector, and it contributes to rural
development. Agricultural censuses are the most
comprehensive source of information about
educational attainment in rural areas. Due to the
availability of relevant data, this paper analyses
the educational status of managers of Polish
farms. According to the definition of the Central
Statistical Office, a farm manager is an individual
who has been authorised by the farm owner/user
to make decisions that are directly related to
production processes and work supervision.
This study analyses changes in the
educational status and the educational
attainment of Polish farm managers. The
analysed managers had completed the following
levels of education: university degree in
agriculture, secondary school of agriculture or
agricultural college, vocational school of
agriculture, or a training course in agriculture.
The aim of this study was to examine the spatial
distribution of and changes in the educational
status of farm managers in Poland in 2002
and 2010. The period analysed in the study was
chosen due to the availability of data collected in
agricultural censuses conducted in Poland in 2002
and 2010. The influence of selected
environmental and non-environmental factors
was taken into account in the analysis to describe
educational attainment in agriculture in Polish
counties-powiaty (without a division into rural
and municipal counties to match the
Proceedings of the 2016 International Conference “ECONOMIC SCIENCE FOR RURAL DEVELOPMENT” No 41
Jelgava, LLU ESAF, 21-22 April 2016, pp. 69-76
1Corresponding author e-mail: [email protected] tel. +48 89 523 32 30 70 2Corresponding author e-mail: [email protected] tel.+ +48 56 611 26 00
organisational structure of Local Offices of the
Agency of Restructuring and Modernisation of
Agriculture) (Rudnicki, 1997; Rudnicki, Kluba,
2014). The criteria for selecting factors that
influence the educational status of farm
managers are often interconnected and difficult
to define. The suitability of land for agricultural
production was evaluated based on the values of
the agri-environmental soil quality index (Witek,
Gorski, 1977). Based on the eligibility
requirements of the "Support for agricultural
production in less-favoured areas (LFAs)" Rural
Development Programme, the analysed areas
were classified into the following groups:
(N) - land with unfavourable conditions for
agricultural production (below 52 points in the
agri-environmental soil quality index, lowland),
(S) - land with average conditions for agricultural
production (52-72 points, lowland), and
(K) - land with favourable conditions for
agricultural production (more than 72 points,
excluding areas entitled to LFA payments).
Historical events were among the non-
environmental factors examined in the study. The
history and diversity of agricultural practices are
very important determinants of agricultural
performance and production structure (Rudnicki,
Kluba, 2014). During the partitions of Poland, the
country was annexed by three foreign empires:
Prussia, Austria-Hungary and Russia. Over time,
the territories occupied by the three invaders
developed different agrarian structures,
settlement patterns, demographic structures,
education systems and technical infrastructure
systems (Stanny, 2011, Rosner, 2012, Stanny,
2013). The average values of the analysed
indicators were calculated to evaluate the
influence of historical events on the educational
status of farm managers in the areas that
belonged to Poland in the interwar period
(between World War I and World War II),
including the areas that had been formerly
partitioned by Austria (ZA/P), Prussia (ZP/P) and
Russia (ZR/P), and the areas that had been
formerly occupied by Prussia and belonged to
Germany in the interwar period (ZP/N); the areas
that had been formerly partitioned by Prussia
(including the areas that belonged to Poland and
Germany in the interwar period), Russia and
Austria. The educational status of farm managers
and the changes observed in the analysed period
were also evaluated based on the spatial criterion
in areas with low urbanisation levels – rural
counties (z), and in areas with high urbanisation
levels – municipal counties (g).
The presence of correlations between the
educational achievement of farm managers and
the absorption of the EU funds for the
modernisation of Polish agriculture in 2002-2010
was also determined in the study. The Polish
agricultural sector underwent significant
transformation during that period, mainly due to
high absorption of the EU funds (Rudnicki 2013,
2014). The absorption of funds allocated as part
of the Common Agricultural Policy (CAP), totalling
PLN 90.5 billion in 2002-2010 (Rudnicki 2014;
Rudnicki, Kluba, Wisniewski, 2014), was
expressed per 1 ha of farmland and per 1 farm
actively involved in agricultural production. The
above values were normalised (Racine, Raymond,
1977) and expressed in the form of a compound
indicator denoting: (1) low absorption of the CAP
funds (below 0.50 δ), (2) moderate absorption of
the CAP funds (+/- 0.50 δ), and (3) high
absorption of the CAP funds (above 0.50 δ).The
dynamics of changes in the analysed counties in
Poland was presented graphically in a cartogram.
Educational status was represented with the use
of two cartograms, where the first cartogram
contained data for 2010 and the second
cartogram presented differences in data between
2002 and 2010 (2002 data = 100 points).
Results below 100 percentage points (pp.)
indicated that the value of a given factor
decreased in 2010 relative to 2002. Results equal
to 100 pp. suggested an absence of changes,
whereas results above 100 pp. pointed to an
Proceedings of the 2016 International Conference “ECONOMIC SCIENCE FOR RURAL DEVELOPMENT” No 41
Jelgava, LLU ESAF, 21-22 April 2016, pp. 69-76
1Corresponding author e-mail: [email protected] tel. +48 89 523 32 30 71 2Corresponding author e-mail: [email protected] tel.+ +48 56 611 26 00
increase in the value of the evaluated indicator
over the years.
A score-based assessment of the educational
status of farm managers was performed and a
synthetic indicator was calculated to
comprehensively analyse the correlation between
the level of agricultural education attained by
farm managers and the structure of education.
An additional category, “lack of agricultural
education” (x1), was introduced to present the
data relative to the total number of farms
included in the study, and the following weights
were assigned to the levels of agricultural
education: training course in agriculture (x2),
vocational school of agriculture (x3), secondary
school of agriculture or agricultural college (x4),
and university degree in agriculture (x5). It was
assumed that a higher value of the above
indicator was correlated with a higher level of
agricultural education among farm managers in
the analysed counties (Gwiazdzinska-Goraj,
Rudnicki, 2015).
The main aim of this study was to determine
changes in the educational status of farm
managers involved in agricultural activity in
Poland in 2002-2010, including the effects of
environmental and non-environmental factors on
the noted trends.
Research results and discussion
The educational status of farm managers
significantly influences agricultural production.
Educational status is a reliable predictor of
managers' propensity to pursue professional and
personal development. Managers with higher
education are more likely to recognise the
significance of modern technological and
organisational standards in agricultural
production in a rapidly globalizing world
(Rudnicki, Kluba, Wisniewski, 2014). This study
analysed the educational status of Polish farm
managers, including its structure and the
changes observed between 2002 and 2010.
In 2010, there were 2,277,600 registered farms
in Poland, where 83 % were actively involved in
agricultural production on average. The
percentage of active farms ranged from 38 %
in Skarzysko-Kamienna county (Swietokrzyskie
province) to 98.8% in Kazimierza Wielka county
(Swietokrzyskie province). The spatial
distribution of active farms varied significantly
across the evaluated regions. The highest values
were noted in counties situated in the provinces
of Lublin (90.6 %), Mazowsze-Masovia (89.7 %)
and Wielkopolska-Greater Poland (89.5 %). The
lowest values were observed in counties situated
in the provinces of Slask-Silesia (63.5 %) and
Lubusz (71.9 %).
In 2010, 41.0 % of managers of active farms
had some form of agricultural education or
training, marking a 1.3 % decrease from 2002
(Table 1). In both 2002 and 2010, the majority of
Polish farm managers had completed a training
course in agriculture. In comparison with other
types of agricultural education, a training course
seems to be the most accessible type of training
which is relatively short, inexpensive and
available to all age groups. However, the results
of the present study indicate that Polish farm
managers are characterised by relatively low
educational status.
In the analysed period, the percentage of
managers who had completed a training course
in agriculture decreased by 24 pp. in favour of
other types of education. On a more positive
note, the number of farms managed by university
graduates increased by approximately 50 %
between 2002 and 2010. Despite the above,
individuals with a university degree in agriculture
account for merely 2 % of Polish farm managers.
In the analysed period, the percentage of farm
managers who had graduated from an
agricultural college or a secondary school of
agriculture increased by 152 pp. However,
managers in this educational status category
accounted for only 8.6 % of the studied
population in 2010. The percentage of farm
managers who graduated from a vocational
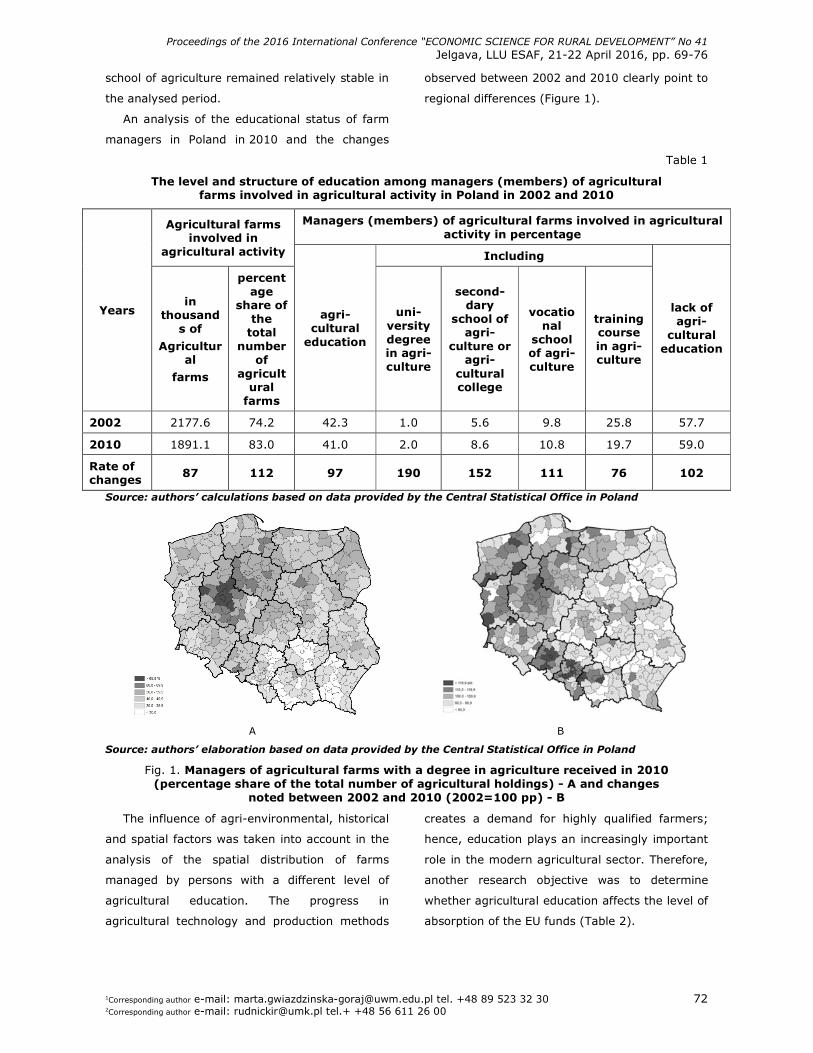
Proceedings of the 2016 International Conference “ECONOMIC SCIENCE FOR RURAL DEVELOPMENT” No 41
Jelgava, LLU ESAF, 21-22 April 2016, pp. 69-76
1Corresponding author e-mail: [email protected] tel. +48 89 523 32 30 72 2Corresponding author e-mail: [email protected] tel.+ +48 56 611 26 00
school of agriculture remained relatively stable in
the analysed period.
An analysis of the educational status of farm
managers in Poland in 2010 and the changes
observed between 2002 and 2010 clearly point to
regional differences (Figure 1).
Table 1
The level and structure of education among managers (members) of agricultural farms involved in agricultural activity in Poland in 2002 and 2010
Managers (members) of agricultural farms involved in agricultural activity in percentage
Agricultural farms involved in
agricultural activity Including
Years in
thousands of
Agricultural
farms
percentage
share of the
total number
of agricult
ural farms
agri-cultural
education
uni-versity degree in agri-culture
second-dary
school of agri-
culture or agri-
cultural college
vocational
school of agri-culture
training course in agri-culture
lack of agri-
cultural education
2002 2177.6 74.2 42.3 1.0 5.6 9.8 25.8 57.7
2010 1891.1 83.0 41.0 2.0 8.6 10.8 19.7 59.0
Rate of changes
87 112 97 190 152 111 76 102
Source: authors’ calculations based on data provided by the Central Statistical Office in Poland
A B
Source: authors’ elaboration based on data provided by the Central Statistical Office in Poland
Fig. 1. Managers of agricultural farms with a degree in agriculture received in 2010 (percentage share of the total number of agricultural holdings) - A and changes
noted between 2002 and 2010 (2002=100 pp) - B
The influence of agri-environmental, historical
and spatial factors was taken into account in the
analysis of the spatial distribution of farms
managed by persons with a different level of
agricultural education. The progress in
agricultural technology and production methods
creates a demand for highly qualified farmers;
hence, education plays an increasingly important
role in the modern agricultural sector. Therefore,
another research objective was to determine
whether agricultural education affects the level of
absorption of the EU funds (Table 2).
Proceedings of the 2016 International Conference “ECONOMIC SCIENCE FOR RURAL DEVELOPMENT” No 41
Jelgava, LLU ESAF, 21-22 April 2016, pp. 69-76
1Corresponding author e-mail: [email protected] tel. +48 89 523 32 30 73 2Corresponding author e-mail: [email protected] tel.+ +48 56 611 26 00
Table 2
Percentage share of farms managed by persons with a different level of agricultural education in the total number of farms involved in agricultural activity (2010) and
the rate of changes noted under the analysed conditions
Managers (members) of agricultural farms involved in agricultural activity
agricultural education lack of agricultural education Specification
2010 Rate of changes
2002=100 2010 Rate of changes
2002=100
Poland – total 41 97 59 102
established conditions
N 39.4 93 60.6 105
S 41.8 97 58.2 102 agri-environmental conditions
K 39.9 98 60.1 102
ZA/P 30.5 96 69,5 102
ZP/P 54.2 107 45,8 92
ZR/R 42.3 94 57.7 105 historical conditions
ZP/N 44.8 103 55.2 97
Z 41.2 97 58.8 102 spatial conditions
- areas with low urbanisation levels and areas with high urbanisation levels
G 33.5 113 66.5 95
1 32.4 98 67.6 101
2 41.6 95 58.4 104 absorption of the EU funds
3 50.3 99 49.7 101 Source: authors’ calculations based on data provided by the Central Statistical Office in Poland
In 2010, the percentage of farm managers
with agricultural education ranged from 21.8 %
in Skarzysko-Kamienna county (Swietokrzyskie
province) to 71.2 % in Oborniki county
(Wielkopolska province), and the national
average was 41.0 %. In 2010, the highest
percentage of farm managers who had some
form of agricultural education was noted in the
provinces of Wielkopolska and Kujawy-Pomorze
(Kujawy-Pomerania) which are characterised by
average values of the agri-environmental soil
quality index. Regional variations in the
percentage of farm managers with agricultural
education, relative to the total number of farm
managers, can be traced back to historical
events. The highest values of the above index
were noted in counties which had been
partitioned by Prussia. Those territories were the
first to introduce agrarian reforms, and they
operated the largest and most successful farms.
In comparison with the areas occupied by Russia
and Austria, the first peasant organisations and
the first schools for the farmers' children were
also set up on the territories under the Prussian
rule. The above explains the relatively high levels
of educational attainment in rural communities,
including among senior citizens, in the
Wielkopolska province. In this region, education
became an important part of peasant tradition,
and it significantly contributed to the quality of
human capital (Rosner, 2011, Stanny, 2013). The
lowest percentage of farm managers with
agricultural education was noted in regions with
the least favourable agricultural conditions,
including Podkarpacie (30.0 %), Slask (31.5 %),
Malopolska (32.2 %) and Swietokrzyskie
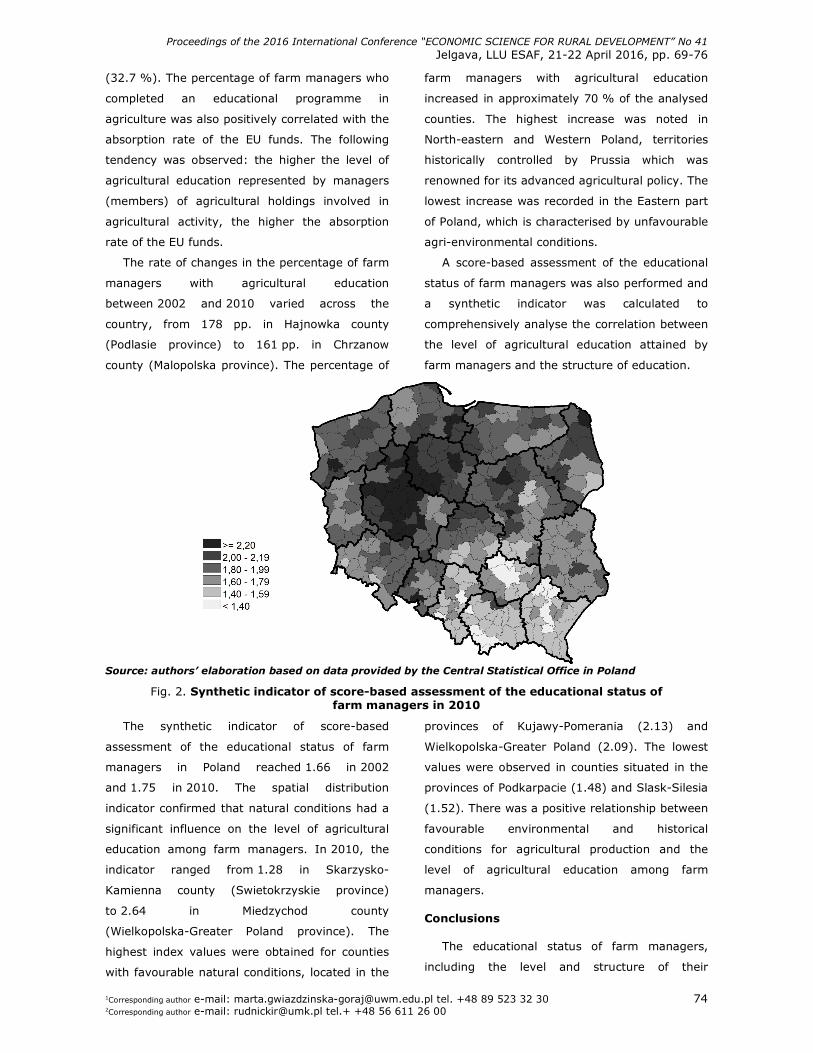
Proceedings of the 2016 International Conference “ECONOMIC SCIENCE FOR RURAL DEVELOPMENT” No 41
Jelgava, LLU ESAF, 21-22 April 2016, pp. 69-76
1Corresponding author e-mail: [email protected] tel. +48 89 523 32 30 74 2Corresponding author e-mail: [email protected] tel.+ +48 56 611 26 00
(32.7 %). The percentage of farm managers who
completed an educational programme in
agriculture was also positively correlated with the
absorption rate of the EU funds. The following
tendency was observed: the higher the level of
agricultural education represented by managers
(members) of agricultural holdings involved in
agricultural activity, the higher the absorption
rate of the EU funds.
The rate of changes in the percentage of farm
managers with agricultural education
between 2002 and 2010 varied across the
country, from 178 pp. in Hajnowka county
(Podlasie province) to 161 pp. in Chrzanow
county (Malopolska province). The percentage of
farm managers with agricultural education
increased in approximately 70 % of the analysed
counties. The highest increase was noted in
North-eastern and Western Poland, territories
historically controlled by Prussia which was
renowned for its advanced agricultural policy. The
lowest increase was recorded in the Eastern part
of Poland, which is characterised by unfavourable
agri-environmental conditions.
A score-based assessment of the educational
status of farm managers was also performed and
a synthetic indicator was calculated to
comprehensively analyse the correlation between
the level of agricultural education attained by
farm managers and the structure of education.
Source: authors’ elaboration based on data provided by the Central Statistical Office in Poland
Fig. 2. Synthetic indicator of score-based assessment of the educational status of farm managers in 2010
The synthetic indicator of score-based
assessment of the educational status of farm
managers in Poland reached 1.66 in 2002
and 1.75 in 2010. The spatial distribution
indicator confirmed that natural conditions had a
significant influence on the level of agricultural
education among farm managers. In 2010, the
indicator ranged from 1.28 in Skarzysko-
Kamienna county (Swietokrzyskie province)
to 2.64 in Miedzychod county
(Wielkopolska-Greater Poland province). The
highest index values were obtained for counties
with favourable natural conditions, located in the
provinces of Kujawy-Pomerania (2.13) and
Wielkopolska-Greater Poland (2.09). The lowest
values were observed in counties situated in the
provinces of Podkarpacie (1.48) and Slask-Silesia
(1.52). There was a positive relationship between
favourable environmental and historical
conditions for agricultural production and the
level of agricultural education among farm
managers.
Conclusions
The educational status of farm managers,
including the level and structure of their
Proceedings of the 2016 International Conference “ECONOMIC SCIENCE FOR RURAL DEVELOPMENT” No 41
Jelgava, LLU ESAF, 21-22 April 2016, pp. 69-76
1Corresponding author e-mail: [email protected] tel. +48 89 523 32 30 75 2Corresponding author e-mail: [email protected] tel.+ +48 56 611 26 00
education, is determined by both environmental
and non-environmental factors.
In 2002 and 2010, less than 50 % of Polish
farm managers had completed some form of
formal training in agriculture. The progress in
agricultural technology and production methods
creates a demand for highly qualified farmers. As
a result, education plays an increasingly
important role in the modern agricultural sector.
In both 2002 and 2010, the highest percentage
of farm managers had completed a training
course in agriculture, whereas university
graduates accounted for the lowest percentage of
agricultural managers.
The educational status of farm managers
varied significantly across Polish regions, and the
observed spatial distribution patterns were
determined mainly by historical events and agri-
environmental conditions. The percentage of
farm managers with a degree in agriculture was
higher in counties with more favourable
conditions for agricultural production. The highest
concentration of university-educated farm
managers was also observed in areas that had
been annexed by Prussia, the historical occupant
with advanced agricultural practices. The
educational attainment of farm managers was
also positively correlated with the absorption rate
of the EU funds, which implies that farm
managers with higher educational status are
more successful in acquiring the EU funds for
Polish agricultural businesses.
A score-based assessment of the educational
status of farm managers revealed that there was
a relationship between the level of agricultural
education attained by managers of farms
involved in agricultural activity and the structure
of education.
Acknowledgements
The article was prepared within the framework
of a research project funded by the National
Science Centre - Transformation of Spatial
Structure of Agriculture under the Influence of
the Instruments of the Common Agricultural
Policy (2011/03/B/HS4/04952).
Bibliography
1. Frenkel, I. (2003). Ludnosc Zatrudnienie i Bezrobocie na Wsi. (Population Employment and Unemployment in Rural Areas), Instytut Rozwoju Wsi i Rolnictwa, Polskiej Akademii Nauk, Warszawa, Poland, pp. 215.
2. Gwiazdzinska-Goraj, M., Rudnicki, R. (2015). Stan i Zmiany Wyksztalcenia Rolniczego Kierownikow Gospodarstw Rolnych w Latach 2002-2010 w Wojewodztwie Kujawsko-Pomorskim. (Quantitative Approach to and Trends in Agriculture-related Education among Managers of Agricultural Holdings between 2002 and 2010 in Kujawsko–Pomorskie Voivodship). Studia Obszarow Wiejskich, t. XXXX, pp. 35-47.
3. Janc, K. (2004). Znaczenie Kapitalu Ludzkiego w Procesach Globalizacji. (The Importance of Human Capital in the Processes of Globalization) [w:] Czlowiek, Region, Panstwo w Procesach Globalizacji, Regionalizacji oraz Integracji. (Man, Region, State in the Processes of Globalization, Regionalization and Integration). G. Rdzanek, E. Stadtmüller (red.), Uniwersytet Wroclawski, Wroclaw, Poland, pp. 71-82.
4. Kaminska, W. (2014). Przemiany Struktury i Poziomu Wyksztalcenia Ludnosci Wiejskiej w Polsce w Latach 2002-2011. (Transformation of the Structure by Education Level of Rural Population in Poland in 2002-2011 Years). [w:] Polityce Spojnosci UE a Rozwoj Obszarow Wiejskich. Stare Problemy i Nowe Wyzwania. (UE Cohesion Policy vs. Rural Development Old Problems and New Challenges) W. Kaminskiej i K. Heffnera (red.), Studia tom CLVI, Polska Akademia Nauk Komitet Zagospodarowania Przestrzennego Kraju, Warszawa, pp.133-169.
5. Pracujacy w Gospodarstwach Rolnych. (Employment on Agricultural Farms). (2012). Powszechny Spis Rolny 2010, GUS, Warszawa, pp. 188.
6. Racine, J.B. Reymond, H. (1977). Analiza Ilosciowa w Geografii. (Quantitative Analysis in Geography). PWN, Warszawa, pp. 254.
7. Rosner, A. (2011). Zroznicowanie Przestrzenne Obszarow Wiejskich a Pozadane Kierunki ich Rozwoju. (Territorial Differences Among Rural Areas and the Desirable Directions of Rural Development) [in:] Obszary Wiejskie: Wielofunkcyjnosc, Migracje, Nowe Wizje Rozwoju. (Rural Areas: Multifunctionality, Migration and New Visions of Development) W. Kaminska i K. Heffner (red.) KPZK PAN, Studia t. CXXXIII, Warszawa, pp. 27 - 42.
8. Rosner, A. (2012). Zmiany Rozkladu Przestrzennego Zaludnienia Obszarow Wiejskich. Wiejskie Obszary Zmniejszajace Zaludnienie i Koncentrujace Ludnosc Wiejska. (Variations in Spatial Distribution of Population in Rural Areas. Rural Areas Experiencing Depopulation and Concetration of Rural Population). Instytut Rozwoju Wsi i Rolnictwa PAN, Warszawa, pp. 158.
9. Rudnicki, R. (1997). Geograficzno-Ekonomiczne Czynniki Ksztaltujace Produkcje Rolnictwa Indywidulanego na Przykladzie Makroregionu Dolnej Wisly. (Geographic and Economic Factors Affecting the Production of Individual Farming on the Example of the Macro-region of the Lower Vistula) Uniwersytet Mikolaja Kopernika w Toruniu, Towarzystwo Naukowe w Toruniu, Torun, pp. 167.
Proceedings of the 2016 International Conference “ECONOMIC SCIENCE FOR RURAL DEVELOPMENT” No 41
Jelgava, LLU ESAF, 21-22 April 2016, pp. 69-76
1Corresponding author e-mail: [email protected] tel. +48 89 523 32 30 76 2Corresponding author e-mail: [email protected] tel.+ +48 56 611 26 00
10. Rudnicki, R. (2013). Spatial Differences in the Number of Applications for Payments under the UE Common Agricultural Policy Submitted by Agricultural Holdings in Poland over the Years 2002-2010, [in:] Development of Rural Areas in European Regions, A. Kolodziejczak (red.), Quaestiones Geographice, 32 (4), Poznan, pp. 15–31.
11. Rudnicki, R. (2014). Analiza Absorpcji Srodkow WPR i Ich Wplywu na Zmiany Strukturalne w Rolnictwie Polskim. (Analysis of the Absorption of CAP Measures and Their Impact on Structural Change in Polish Agriculture) [w:] Zroznicowanie Przestrzenne Rolnictwa. (The Spatial Differentiation of Agriculture). B. Glebocki (red.), GUS, Warszawa, pp. 441–463.
12. Rudnicki, R., Kluba, M. (1993). Przestrzenne Zroznicowanie oraz Zmiany Poziomu Wyksztalcenia Uzytkownikow Indywidualnych Gospodarstw Rolnych w Makroregionie Dolnej Wisly w Latach 1978-1988. (Spatial Diversity and Changes in the Level of Education of Individual Users Farms of the Region of the Lower Vistula in the Years 1978-1988). Acta Univ. Nic. Cop., Geografia XXV, Wyd. Uniwersytetu M. Kopernika, Torun, pp. 99–107.
13. Rudnicki, R., Kluba, M., Wisniewski, L. (2014). Zroznicowanie Regionalne Rolnictwa a Poziom Absorpcji Funduszy Wspolnej Polityki Rolnej. (Regional Variation of Agriculture and Technical Funds Absorption of the Common Agricultural Policy). [w:] Zintegrowany Rozwoj Obszarow Wiejskich w Swietle Polityki Unii Europejskiej. (Integrated Rural Development in the Light of European Union Policy). Rudnicki R., Kluba M. (red.), t. 1, Rolnictwo i Wspolna Polityka Rolna, Wyd. Naukowe UMK, Torun, pp. 9-36.
14. Stanny, M. (2011). Typologia Wiejskich Obszarow Peryferyjnych pod Wzgledem Anatomii Struktury Spoleczno-Gospodarczej. (A Typology of Rural Peripheral Areas in Poland - Anatomy of the Socio-Economic Structure). Wies i Rolnictwo nr 2 (151), Warszawa, pp. 59-75.
15. Stanny, M. (2013). Przestrzenne Zroznicowanie Rozwoju Obszarow Wiejskich w Polsce. (Spatial Diversification of Rural Area Development in Poland). Instytut Rozwoju Wsi i Rolnictwa Polskiej Akademii Nauk, Warszawa, pp. 329.
16. Waloryzacja Rolniczej Przestrzeni Produkcyjnej Polski. (Valorisation of Agricultural Production Area Polish). 2000. Biuletyn informacyjny IUNiG nr 12, Pulawy, pp. 4-17.
17. Witek, T., Gorski, T. (1977). Przyrodnicza Bonitacja Rolniczej Przestrzeni Produkcyjnej w Polsce. (Nature Valorisation of the Agricultural Production in Poland). IUNG, Pulawy. pp. 21.
Proceedings of the 2016 International Conference “ECONOMIC SCIENCE FOR RURAL DEVELOPMENT” No 41
Jelgava, LLU ESAF, 21-22 April 2016, pp. 77-84
1Corresponding author. Tel.: + 371 29355228; fax: + 371 67089467. E-mail address: [email protected] . 77
INTRODUCING OF SMART WORK – OPPORTUNITY TO INCREASE ECONOMIC DEVELOPMENT OF MUNICIPALITIES IN LATVIA
Ilze Judrupa1, Dr.oec; Maija Senfelde1, Dr.oec.
1 Faculty of Engineering Economics and Management, Riga Technical University
Abstract. The research focused on analysis of smart work, its advantages and disadvantages. The aim of the research
is to verify hypothesis that introducing of smart work will promote economic development of municipalities in Latvia
and that people in municipalities are ready to do smart work. Analysis of economic development of Balvi municipality
(Latvia) shows that there are economic problems that can be solved by introducing of smart work in the municipality.
Survey of Balvi population shows that people in this municipality are ready to work smart and to do distant work in
Smart Work Centres (SWC). Smart Work Centre will increase development of Balvi municipality, it will provide new
working places, decrease unemployment and will help maintain population in the municipality.
Key words: smart work, regional development, municipality.
JEL code: R 110
Introduction
Unequal regional development is one of the
main problems in Latvia. Therefore, it is
necessary to find solutions how to increase
economic growth in each region. It is possible to
find out advantages and disadvantages of every
region. It is also possible to find out benefits
from smart work and also disadvantages of smart
work for three main society groups – employers,
employees and government.
The aim of the research is to verify the
hypothesis that introducing of smart work will
promote economic development of municipalities
in Latvia and that people in municipalities are
ready to do smart work. The main tasks are to
study the concept of smart work, to define its
benefits and disadvantages, to evaluate economic
development of Balvi municipality and to find out
the opinion of Balvi municipality’s population
about possibility to work smart.
Research methods are analysis and synthesis,
quantitative data analysis, comparison, graphical
methods, survey.
Concept of smart work
The nature of economy has been changing
during last centuries – from the agriculture age in
18th century to the information era nowadays.
Nations and enterprises are increasingly aware of
the importance of being ahead of the next so
called 'wave' of innovation. If during the recent
wave of innovation ICT was driven by market
needs such as reducing transaction costs,
significant evidence exists to state that the next
waves of innovation will be driven by the need to
simultaneously improve productivity whilst
decreasing negative environmental impact on the
planet (The Natural Edge Projects, 2004).
The development of ICT gives advantages for
private and public sector. Electronic flows of
documents in the public administration can
increase efficiency and transparency. Business
climate is affected positively by e-development.
It improves general quality of services across
industries and sectors of the economy and
creates opportunities for cross-country and cross-
sectorial development (Carayannis E. G.,
Von Zedtwitz M., 2005). Development of ICT and
reaching of 5th and also future 6th wave of
innovations is the basis for smart work
development. For example, development of ICT
has encouraged the development of companies
that offer such services as customer catering
using ICT, as well as gathering, storing,
processing and selling of information in the North
of Sweden (Nuur C., Laestadius S., 2009).
Innovation is well at work when it reaches
strong, on-going and diversified community
support along with rigorous evaluations
(Bernard M.-M., Fruhwirth M.,
De Mareul Willete C., 2015). But ICT will not
automatically stimulate the regional or rural
economy. The technologies should be integrated
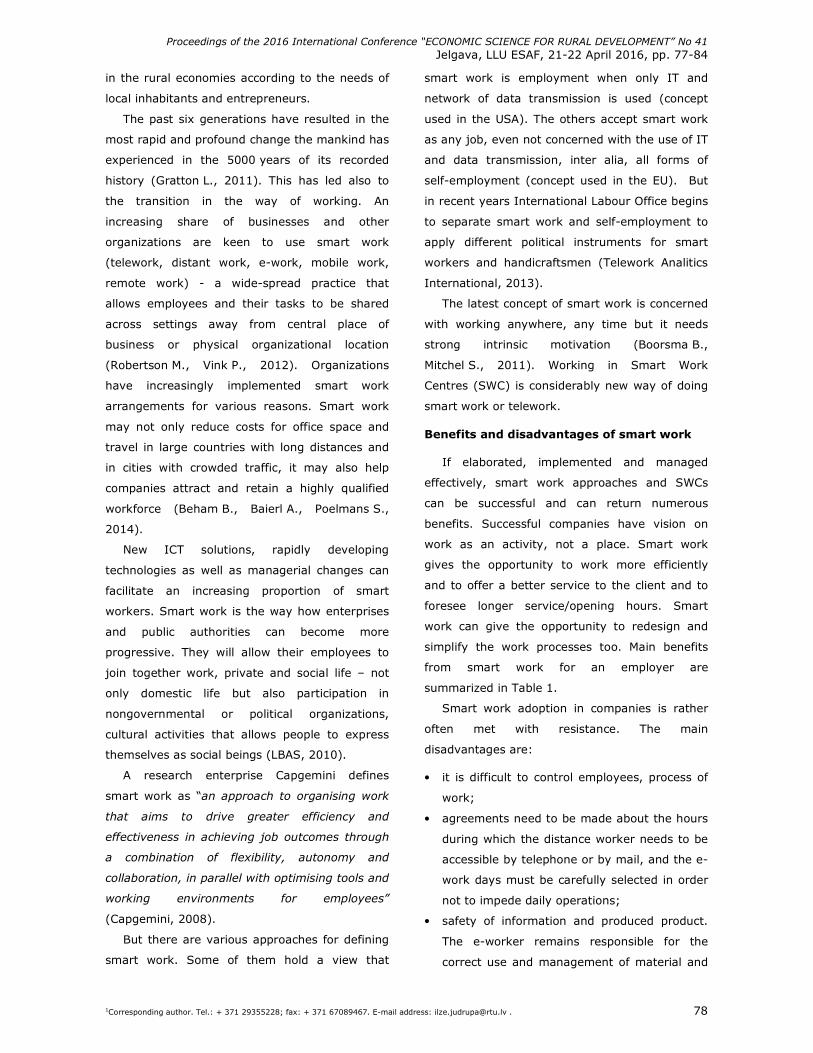
Proceedings of the 2016 International Conference “ECONOMIC SCIENCE FOR RURAL DEVELOPMENT” No 41
Jelgava, LLU ESAF, 21-22 April 2016, pp. 77-84
1Corresponding author. Tel.: + 371 29355228; fax: + 371 67089467. E-mail address: [email protected] . 78
in the rural economies according to the needs of
local inhabitants and entrepreneurs.
The past six generations have resulted in the
most rapid and profound change the mankind has
experienced in the 5000 years of its recorded
history (Gratton L., 2011). This has led also to
the transition in the way of working. An
increasing share of businesses and other
organizations are keen to use smart work
(telework, distant work, e-work, mobile work,
remote work) - a wide-spread practice that
allows employees and their tasks to be shared
across settings away from central place of
business or physical organizational location
(Robertson M., Vink P., 2012). Organizations
have increasingly implemented smart work
arrangements for various reasons. Smart work
may not only reduce costs for office space and
travel in large countries with long distances and
in cities with crowded traffic, it may also help
companies attract and retain a highly qualified
workforce (Beham B., Baierl A., Poelmans S.,
2014).
New ICT solutions, rapidly developing
technologies as well as managerial changes can
facilitate an increasing proportion of smart
workers. Smart work is the way how enterprises
and public authorities can become more
progressive. They will allow their employees to
join together work, private and social life – not
only domestic life but also participation in
nongovernmental or political organizations,
cultural activities that allows people to express
themselves as social beings (LBAS, 2010).
A research enterprise Capgemini defines
smart work as “an approach to organising work
that aims to drive greater efficiency and
effectiveness in achieving job outcomes through
a combination of flexibility, autonomy and
collaboration, in parallel with optimising tools and
working environments for employees”
(Capgemini, 2008).
But there are various approaches for defining
smart work. Some of them hold a view that
smart work is employment when only IT and
network of data transmission is used (concept
used in the USA). The others accept smart work
as any job, even not concerned with the use of IT
and data transmission, inter alia, all forms of
self-employment (concept used in the EU). But
in recent years International Labour Office begins
to separate smart work and self-employment to
apply different political instruments for smart
workers and handicraftsmen (Telework Analitics
International, 2013).
The latest concept of smart work is concerned
with working anywhere, any time but it needs
strong intrinsic motivation (Boorsma B.,
Mitchel S., 2011). Working in Smart Work
Centres (SWC) is considerably new way of doing
smart work or telework.
Benefits and disadvantages of smart work
If elaborated, implemented and managed
effectively, smart work approaches and SWCs
can be successful and can return numerous
benefits. Successful companies have vision on
work as an activity, not a place. Smart work
gives the opportunity to work more efficiently
and to offer a better service to the client and to
foresee longer service/opening hours. Smart
work can give the opportunity to redesign and
simplify the work processes too. Main benefits
from smart work for an employer are
summarized in Table 1.
Smart work adoption in companies is rather
often met with resistance. The main
disadvantages are:
• it is difficult to control employees, process of
work;
• agreements need to be made about the hours
during which the distance worker needs to be
accessible by telephone or by mail, and the e-
work days must be carefully selected in order
not to impede daily operations;
• safety of information and produced product.
The e-worker remains responsible for the
correct use and management of material and
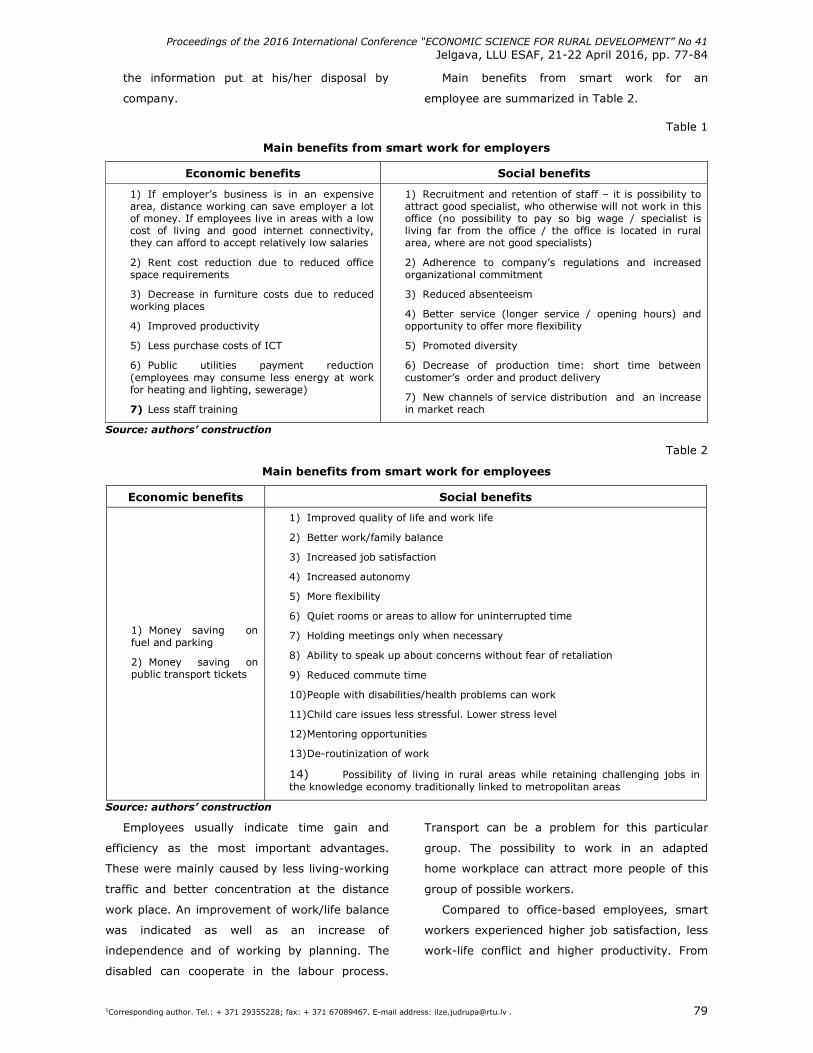
Proceedings of the 2016 International Conference “ECONOMIC SCIENCE FOR RURAL DEVELOPMENT” No 41
Jelgava, LLU ESAF, 21-22 April 2016, pp. 77-84
1Corresponding author. Tel.: + 371 29355228; fax: + 371 67089467. E-mail address: [email protected] . 79
the information put at his/her disposal by
company.
Main benefits from smart work for an
employee are summarized in Table 2.
Table 1
Main benefits from smart work for employers
Economic benefits Social benefits
1) If employer’s business is in an expensive area, distance working can save employer a lot of money. If employees live in areas with a low cost of living and good internet connectivity, they can afford to accept relatively low salaries
2) Rent cost reduction due to reduced office space requirements
3) Decrease in furniture costs due to reduced working places
4) Improved productivity
5) Less purchase costs of ICT
6) Public utilities payment reduction (employees may consume less energy at work for heating and lighting, sewerage)
7) Less staff training
1) Recruitment and retention of staff – it is possibility to attract good specialist, who otherwise will not work in this office (no possibility to pay so big wage / specialist is living far from the office / the office is located in rural area, where are not good specialists)
2) Adherence to company’s regulations and increased organizational commitment
3) Reduced absenteeism
4) Better service (longer service / opening hours) and opportunity to offer more flexibility
5) Promoted diversity
6) Decrease of production time: short time between customer’s order and product delivery
7) New channels of service distribution and an increase in market reach
Source: authors’ construction
Table 2
Main benefits from smart work for employees
Economic benefits Social benefits
1) Money saving on fuel and parking
2) Money saving on public transport tickets
1) Improved quality of life and work life
2) Better work/family balance
3) Increased job satisfaction
4) Increased autonomy
5) More flexibility
6) Quiet rooms or areas to allow for uninterrupted time
7) Holding meetings only when necessary
8) Ability to speak up about concerns without fear of retaliation
9) Reduced commute time
10) People with disabilities/health problems can work
11) Child care issues less stressful. Lower stress level
12) Mentoring opportunities
13) De-routinization of work
14) Possibility of living in rural areas while retaining challenging jobs in the knowledge economy traditionally linked to metropolitan areas
Source: authors’ construction
Employees usually indicate time gain and
efficiency as the most important advantages.
These were mainly caused by less living-working
traffic and better concentration at the distance
work place. An improvement of work/life balance
was indicated as well as an increase of
independence and of working by planning. The
disabled can cooperate in the labour process.
Transport can be a problem for this particular
group. The possibility to work in an adapted
home workplace can attract more people of this
group of possible workers.
Compared to office-based employees, smart
workers experienced higher job satisfaction, less
work-life conflict and higher productivity. From
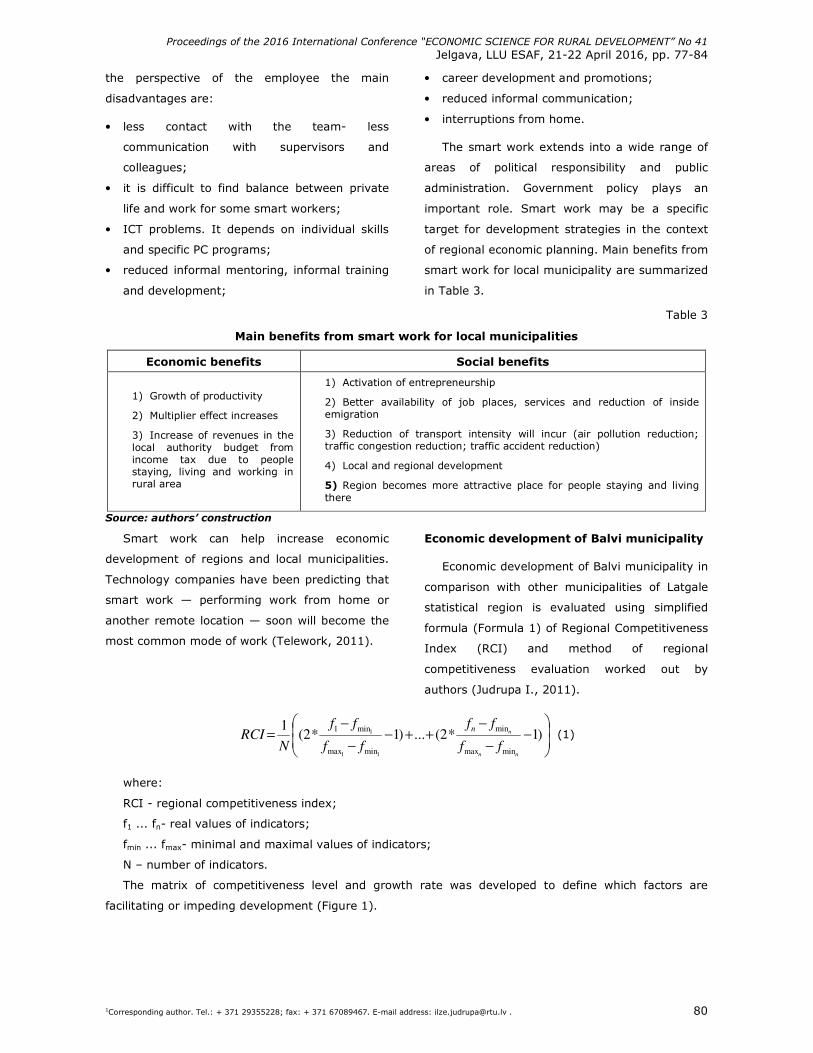
Proceedings of the 2016 International Conference “ECONOMIC SCIENCE FOR RURAL DEVELOPMENT” No 41
Jelgava, LLU ESAF, 21-22 April 2016, pp. 77-84
1Corresponding author. Tel.: + 371 29355228; fax: + 371 67089467. E-mail address: [email protected] . 80
the perspective of the employee the main
disadvantages are:
• less contact with the team- less
communication with supervisors and
colleagues;
• it is difficult to find balance between private
life and work for some smart workers;
• ICT problems. It depends on individual skills
and specific PC programs;
• reduced informal mentoring, informal training
and development;
• career development and promotions;
• reduced informal communication;
• interruptions from home.
The smart work extends into a wide range of
areas of political responsibility and public
administration. Government policy plays an
important role. Smart work may be a specific
target for development strategies in the context
of regional economic planning. Main benefits from
smart work for local municipality are summarized
in Table 3.
Table 3
Main benefits from smart work for local municipalities
Economic benefits Social benefits
1) Growth of productivity
2) Multiplier effect increases
3) Increase of revenues in the local authority budget from income tax due to people staying, living and working in rural area
1) Activation of entrepreneurship
2) Better availability of job places, services and reduction of inside emigration
3) Reduction of transport intensity will incur (air pollution reduction; traffic congestion reduction; traffic accident reduction)
4) Local and regional development
5) Region becomes more attractive place for people staying and living there
Source: authors’ construction
Smart work can help increase economic
development of regions and local municipalities.
Technology companies have been predicting that
smart work — performing work from home or
another remote location — soon will become the
most common mode of work (Telework, 2011).
Economic development of Balvi municipality
Economic development of Balvi municipality in
comparison with other municipalities of Latgale
statistical region is evaluated using simplified
formula (Formula 1) of Regional Competitiveness
Index (RCI) and method of regional
competitiveness evaluation worked out by
authors (Judrupa I., 2011).
−
−
−++−
−
−= )1*2(...)1*2(
1
minmax
min
minmax
min1
11
1
nn
n
ff
ff
ff
ff
NRCI
n (1)
where:
RCI - regional competitiveness index;
f1 ... fn- real values of indicators;
fmin ... fmax- minimal and maximal values of indicators;
N – number of indicators.
The matrix of competitiveness level and growth rate was developed to define which factors are
facilitating or impeding development (Figure 1).
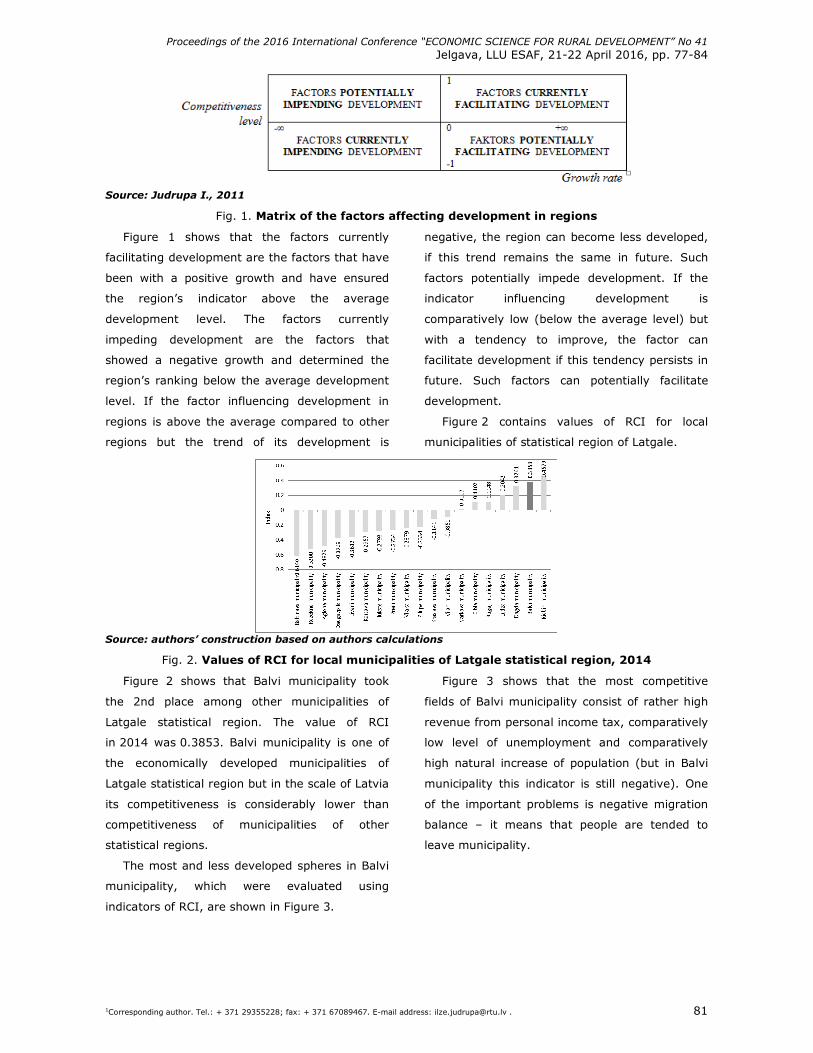
Proceedings of the 2016 International Conference “ECONOMIC SCIENCE FOR RURAL DEVELOPMENT” No 41
Jelgava, LLU ESAF, 21-22 April 2016, pp. 77-84
1Corresponding author. Tel.: + 371 29355228; fax: + 371 67089467. E-mail address: [email protected] . 81
Source: Judrupa I., 2011
Fig. 1. Matrix of the factors affecting development in regions
Figure 1 shows that the factors currently
facilitating development are the factors that have
been with a positive growth and have ensured
the region’s indicator above the average
development level. The factors currently
impeding development are the factors that
showed a negative growth and determined the
region’s ranking below the average development
level. If the factor influencing development in
regions is above the average compared to other
regions but the trend of its development is
negative, the region can become less developed,
if this trend remains the same in future. Such
factors potentially impede development. If the
indicator influencing development is
comparatively low (below the average level) but
with a tendency to improve, the factor can
facilitate development if this tendency persists in
future. Such factors can potentially facilitate
development.
Figure 2 contains values of RCI for local
municipalities of statistical region of Latgale.
Source: authors’ construction based on authors calculations
Fig. 2. Values of RCI for local municipalities of Latgale statistical region, 2014
Figure 2 shows that Balvi municipality took
the 2nd place among other municipalities of
Latgale statistical region. The value of RCI
in 2014 was 0.3853. Balvi municipality is one of
the economically developed municipalities of
Latgale statistical region but in the scale of Latvia
its competitiveness is considerably lower than
competitiveness of municipalities of other
statistical regions.
The most and less developed spheres in Balvi
municipality, which were evaluated using
indicators of RCI, are shown in Figure 3.
Figure 3 shows that the most competitive
fields of Balvi municipality consist of rather high
revenue from personal income tax, comparatively
low level of unemployment and comparatively
high natural increase of population (but in Balvi
municipality this indicator is still negative). One
of the important problems is negative migration
balance – it means that people are tended to
leave municipality.
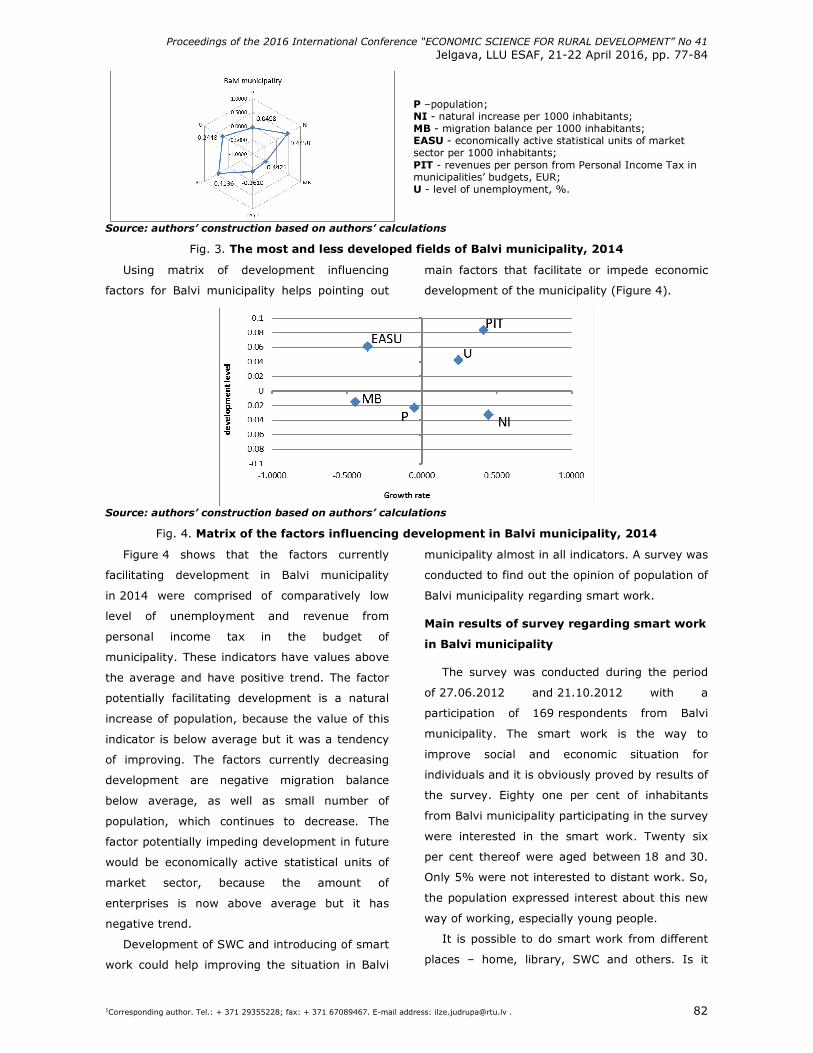
Proceedings of the 2016 International Conference “ECONOMIC SCIENCE FOR RURAL DEVELOPMENT” No 41
Jelgava, LLU ESAF, 21-22 April 2016, pp. 77-84
1Corresponding author. Tel.: + 371 29355228; fax: + 371 67089467. E-mail address: [email protected] . 82
P –population; NI - natural increase per 1000 inhabitants; MB - migration balance per 1000 inhabitants; EASU - economically active statistical units of market sector per 1000 inhabitants; PIT - revenues per person from Personal Income Tax in municipalities’ budgets, EUR; U - level of unemployment, %.
Source: authors’ construction based on authors’ calculations
Fig. 3. The most and less developed fields of Balvi municipality, 2014
Using matrix of development influencing
factors for Balvi municipality helps pointing out
main factors that facilitate or impede economic
development of the municipality (Figure 4).
Source: authors’ construction based on authors’ calculations
Fig. 4. Matrix of the factors influencing development in Balvi municipality, 2014
Figure 4 shows that the factors currently
facilitating development in Balvi municipality
in 2014 were comprised of comparatively low
level of unemployment and revenue from
personal income tax in the budget of
municipality. These indicators have values above
the average and have positive trend. The factor
potentially facilitating development is a natural
increase of population, because the value of this
indicator is below average but it was a tendency
of improving. The factors currently decreasing
development are negative migration balance
below average, as well as small number of
population, which continues to decrease. The
factor potentially impeding development in future
would be economically active statistical units of
market sector, because the amount of
enterprises is now above average but it has
negative trend.
Development of SWC and introducing of smart
work could help improving the situation in Balvi
municipality almost in all indicators. A survey was
conducted to find out the opinion of population of
Balvi municipality regarding smart work.
Main results of survey regarding smart work
in Balvi municipality
The survey was conducted during the period
of 27.06.2012 and 21.10.2012 with a
participation of 169 respondents from Balvi
municipality. The smart work is the way to
improve social and economic situation for
individuals and it is obviously proved by results of
the survey. Eighty one per cent of inhabitants
from Balvi municipality participating in the survey
were interested in the smart work. Twenty six
per cent thereof were aged between 18 and 30.
Only 5% were not interested to distant work. So,
the population expressed interest about this new
way of working, especially young people.
It is possible to do smart work from different
places – home, library, SWC and others. Is it
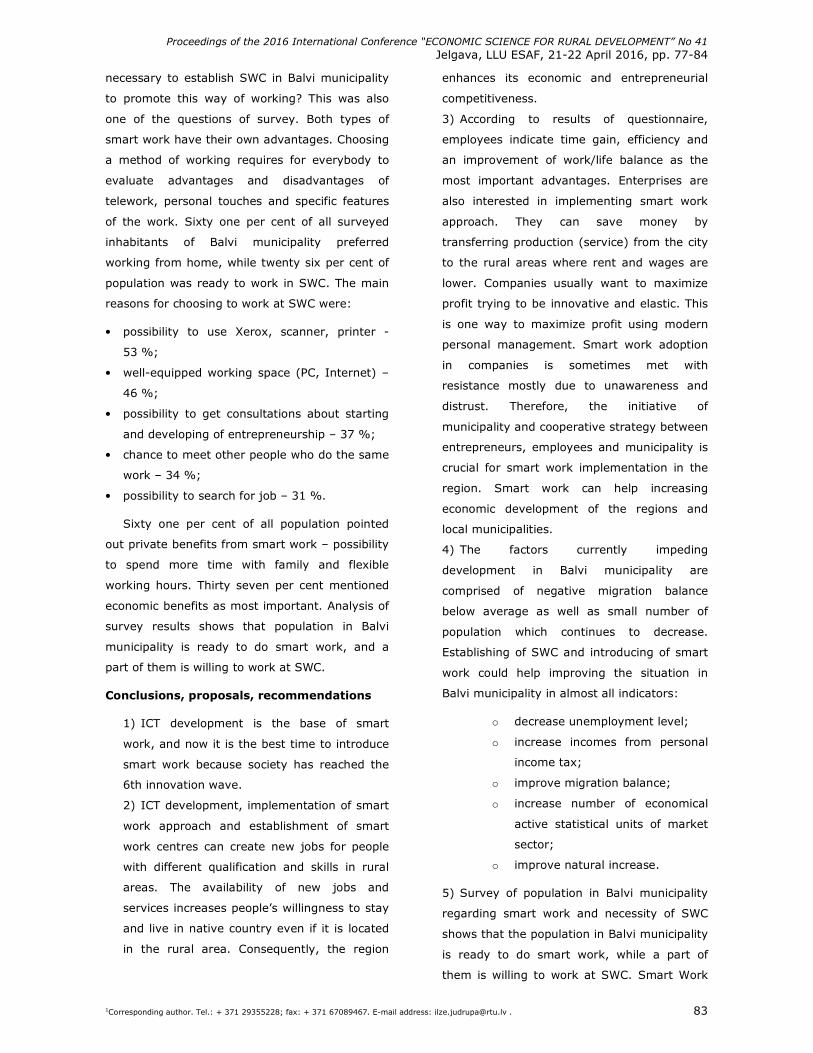
Proceedings of the 2016 International Conference “ECONOMIC SCIENCE FOR RURAL DEVELOPMENT” No 41
Jelgava, LLU ESAF, 21-22 April 2016, pp. 77-84
1Corresponding author. Tel.: + 371 29355228; fax: + 371 67089467. E-mail address: [email protected] . 83
necessary to establish SWC in Balvi municipality
to promote this way of working? This was also
one of the questions of survey. Both types of
smart work have their own advantages. Choosing
a method of working requires for everybody to
evaluate advantages and disadvantages of
telework, personal touches and specific features
of the work. Sixty one per cent of all surveyed
inhabitants of Balvi municipality preferred
working from home, while twenty six per cent of
population was ready to work in SWC. The main
reasons for choosing to work at SWC were:
• possibility to use Xerox, scanner, printer -
53 %;
• well-equipped working space (PC, Internet) –
46 %;
• possibility to get consultations about starting
and developing of entrepreneurship – 37 %;
• chance to meet other people who do the same
work – 34 %;
• possibility to search for job – 31 %.
Sixty one per cent of all population pointed
out private benefits from smart work – possibility
to spend more time with family and flexible
working hours. Thirty seven per cent mentioned
economic benefits as most important. Analysis of
survey results shows that population in Balvi
municipality is ready to do smart work, and a
part of them is willing to work at SWC.
Conclusions, proposals, recommendations
1) ICT development is the base of smart
work, and now it is the best time to introduce
smart work because society has reached the
6th innovation wave.
2) ICT development, implementation of smart
work approach and establishment of smart
work centres can create new jobs for people
with different qualification and skills in rural
areas. The availability of new jobs and
services increases people’s willingness to stay
and live in native country even if it is located
in the rural area. Consequently, the region
enhances its economic and entrepreneurial
competitiveness.
3) According to results of questionnaire,
employees indicate time gain, efficiency and
an improvement of work/life balance as the
most important advantages. Enterprises are
also interested in implementing smart work
approach. They can save money by
transferring production (service) from the city
to the rural areas where rent and wages are
lower. Companies usually want to maximize
profit trying to be innovative and elastic. This
is one way to maximize profit using modern
personal management. Smart work adoption
in companies is sometimes met with
resistance mostly due to unawareness and
distrust. Therefore, the initiative of
municipality and cooperative strategy between
entrepreneurs, employees and municipality is
crucial for smart work implementation in the
region. Smart work can help increasing
economic development of the regions and
local municipalities.
4) The factors currently impeding
development in Balvi municipality are
comprised of negative migration balance
below average as well as small number of
population which continues to decrease.
Establishing of SWC and introducing of smart
work could help improving the situation in
Balvi municipality in almost all indicators:
o decrease unemployment level;
o increase incomes from personal
income tax;
o improve migration balance;
o increase number of economical
active statistical units of market
sector;
o improve natural increase.
5) Survey of population in Balvi municipality
regarding smart work and necessity of SWC
shows that the population in Balvi municipality
is ready to do smart work, while a part of
them is willing to work at SWC. Smart Work
Proceedings of the 2016 International Conference “ECONOMIC SCIENCE FOR RURAL DEVELOPMENT” No 41
Jelgava, LLU ESAF, 21-22 April 2016, pp. 77-84
1Corresponding author. Tel.: + 371 29355228; fax: + 371 67089467. E-mail address: [email protected] . 84
Centre will increase development of Balvi
municipality, create new working places,
decrease unemployment and help maintaining
population in the municipality.
Bibliography
1. Beham B., Baierl A., Poelmans S. (2014). Managerial Telework Allowance Decisions – a Vignette Study Among German Managers. The International Journal of Human Resource Management, Volume 26, Issue 11, pp. 1385-1406. Retrieved: http://www.researchgate.net/publication/268077433_Managerial_telework_allowance_decisionsa_vignette_study_among_German_managers. Access: 08.01.2016
2. Bernard M.-M., Fruhwirth M., De Mareuil Willette C. (2015). Virtual Village: Innovation at Work. European research in Telemedicine, Volume 4, Issue 1, pp. 9-12. Retrieved: http://www.sciencedirect.com/science/article/pii/S2212764X14001137?np=y#. Access: 29.12.2015
3. Boorsma B., Mitchel S. (2011). Work Life Innovation. Smart Work – A Paradigm Shift Transforming How, Where, And When Work Gets Done. Cisco IBSG 2011. Retrieved: http://www.cisco.com/web/about/ac79/docs/ps/Work-Life_Innovation_Smart_Work.pdf. Access: 29.12.2015http://www.google.lv/search?hl=lv&biw=853&bih=470&q=related:assets.panda.org/downloads/wwfteleworking.pdf+FROM+WORKPLACE+TO+ANYPLACE+ASSESSING+THE+OPPORTUNITIES+TO+REDUCE+GREENHOUSE+GAS+EMISSIONS+WITH+VIRTUAL+MEETINGS+AND+TELECOMMUTING+Authors:+ECOFYS+Marco+Buttazzoni+(lead+author)+Andrea+Rossi+WWF+Sweden+Dennis+Pamlin+CONNECORE+Suzanne+Pahlman&tbo=1&sa=X&ei=d3JoUaaIGsiQ4gTdm4HgDA&ved=0CCsQHzAA
4. Capgemini. (2008). Smart Working. The Impact of Work Organization and Job Design. UK: London. Chartered Institute of Personnel and Development, p. 37 Retrieved: http://www.cipd.co.uk/NR/rdonlyres/64A02358-8993-4185-BEEB-9812A9175383/0/smartworking.pdf. Access: 29.12.2015
5. Carayannis E.C., Von Zedtwitz M. (2005). Architecting GloCal (Global–Local), Real-Virtual Incubator Networks (G-RVINs) as Catalysts and Accelerators of Entrepreneurship in Transitioning and Developing Economies: Lessons Learned and Best Practices from Current Development and Business Incubation Practices. Technovation, Volume 25, Issue 2, pp. 95-110.
6. Gratton L. (2011). The Shift The Future of Work is Already Here. Collins. p. 384.
7. Hargroves K., Smith M. (2005). The Natural Advantage of Nations: Business Opportunites, Innovation and Governance in the 21st Century. UK: The Natural Edge Project, Earthscan, London. p. 576.
8. Judrupa I. (2011). Latvijas regionu konkuretspejas novertesana (Evaluation of Regional Competitiveness in Latvia). Promocijas darbs. Riga, p. 172.
9. Lake A. (2011). The Smart Working Handbook. United Kingdom. Retrieved: http://www.flexibility.co.uk/SmartWorkHandbook/smartworkhandbook.pdf. Access: 07.01.2016
10. Latvian Central Statistical Bureau. Statistics. Retrieved: www.csb.gov.lv. Access: 29.12.2015
11. LBAS. (2010). Rokasgramata par Eiropas socialo partneru darba programmas 2009.–2010. gadam un Eiropas socialo partneru pamatnoligumu istenosanu un ieviesanu prakse (Guide on the European Social Partners Work Program 2009-2010 and Implementation of the European Social Partners' Framework Agreement and its Enforcement in Practice). Retrieved: http://www.lbas.lv/upload/stuff/201004/rokasgramata_es_programmas.pdf. Access: 07.01.2016
12. Nuur C., Laestadius S. (2009). Is the ‘Creative Class’ Necessarily Urban? Putting the Creativity Thesis in the Context of Non-urbanised Regions in Industrialised Nations. European Journal of Spatial Development. Debate June 2009. Retrieved: http://www.nordregio.se/Global/EJSD/Debate/debate200906.pdf. Access: 08.01.2016
13. Regionu attistiba Latvija 2010 (Development of Regions in Latvia 2010). (2010) – R: VRAA, p. 171.
14. Regionu attistiba Latvija 2011 (Development of Regions in Latvia 2011). (2011) – R: VRAA, p. 172.
15. Robertson M, Vink P. (2012). Examining New Ways of Office Work Between the Netherlands and the USA. Work, Volume 41, no. Supplement 1. Retrieved: http://iospress.metapress.com/index/F3861437N0151WV8.pdf. Access: 29.12.2015
16. Smart Work Centre Overview. (2008). Connected and Sustainable Work. Connected Urban Development. Retrieved: http://www.connectedurbandevelopment.org/connected_and_sustainable_work/smart_work_center/. Access: 29.12.2015
17. State Regional Development Agency. Statistics. Retrieved: http://www.vraa.gov.lv/lv/petnieciba/statistika/develop/. Access: 29.12.2015
18. Telework Analytics International, Inc. (2005). About TAI. Retrieved: http://www.teleworker.com/about.html. Access: 13.04.2015
19. The Natural Edge Projects. (2004). TNEP International Keynote Speaker Tours. Retrieved: http://www.naturaledgeproject.net/Keynote.aspx. Access: 07.01.2016
Proceedings of the 2016 International Conference “ECONOMIC SCIENCE FOR RURAL DEVELOPMENT” No 41
Jelgava, LLU ESAF, 21-22 April 2016, pp. 85-95
2Corresponding author. Tel.:+371 29217851 E-mail address: [email protected] 85
YOUNG FARMER SUPPORT POLICY IN LATVIA: THE EXAMPLE OF LATGALE REGION Ilze Krisane1, Mg.oec.; Irina Pilvere2, Dr.oec.
1 Ministry of Education and Science, 2 Faculty of Economics and Social Development, Latvia University of Agriculture
Abstract. The agricultural sector in the European Union (EU) is characterised by an ageing farming population. A
similar situation is present in Latvia too – in 2013 in agriculture only 8 294 farm managers or 10.1% were aged under
40; besides, the number of permanent agricultural employees aged under 34 tended to decline. It is particularly
critical in Latgale region, which is located in the eastern border area (the border with the CIS) where socio-economic
indicators are much lower than the national averages. It is important that increasingly greater focus in government
policies and research is placed not only on the agricultural industry’s development on the whole but also on the wish of
young people to return to rural areas and do business there, thereby contributing to the development of rural regions.
For this reason, the research aim is defined as follows: to examine support possibilities for young farmers in Latvia,
particularly in Latgale region. Young farmers were surveyed by questionnaire and expert opinions were identified to
achieve the research aim. The research found that support measures for young farmers provided by the Rural
Development Programme played an essential role in founding or inheriting farms. The knowledge and skills of young
farmers were important in operating and expanding their farms as well as numerous obstacles had to be overcome by
them.
Key words: young farmer, support, rural development.
JEL code: Q01, Q18
Introduction
Rural areas dominate the territory in most of
the 27 Member States of the EU and are home to
a significant share of the population, even if their
importance in terms of gross value added and
employment is less significant. Agriculture and
forestry play a key role in providing a wide range
of public goods in rural areas, many of which are
highly valued by society (European Commission,
2012). The Common Agricultural Policy (CAP)
reform 2014-2020 reinforced public support for
young farmers. This had become necessary
because the European agricultural industry is
ageing quickly, and thus, has become less
innovative (EurActiv, 2015). According to the
European Commission (2012) the agricultural
sector in the EU-27 is characterised by an ageing
farming population. For each farmer younger
than 35 years, there were 9 farmers older than
55 years in 2007. However, in 2010 this ratio
improved to 7 elderly farmers for each young
farmer. This is mostly due to developments in the
EU-N12, where the ratio increased from 0.12
to 0.17 between 2007 and 2010, while there was
a very little change in the EU-15 (from 0.10
to 0.11). Only six Member States showed a ratio
above 0.2 young farmers for each elderly farmer
in 2007 (the Czech Republic, Germany, France,
Austria, Poland and Finland). While Austria had
the youngest farming population, with
0.43 young farmers for each elderly farmer,
Portugal had the oldest farming population with
only 0.03 young farmers for each elderly farmer.
Therefore, this problem – the entry of young
farmers into the agricultural industry – is also
addressed by European scientists. For example,
Lukas Zagata and Lee-Ann Sutherland (2015)
point that “the statistical analysis also
demonstrates considerable differences in farm
structure between old and new member states,
and provides support for the contention that
young sole holders are more likely to operate
modernised, profitable farms”. Andrew Barnes,
Lee-Ann Sutherland, Luiza Toma,
Keith Matthews, Steven Thomson (2016)
emphasise that “the age of the farmer tend to
find that younger farmers will be more innovative
and seek a change in the farm business with
respect to agricultural expansion and associated
activities”. John Davis, Paul Caskie and Michael
Wallace (2013) are convinced that “younger
people have a longer planning horizon and tend
to invest more heavily in business growth than
comparable older age groups”. At the same time
Proceedings of the 2016 International Conference “ECONOMIC SCIENCE FOR RURAL DEVELOPMENT” No 41
Jelgava, LLU ESAF, 21-22 April 2016, pp. 85-95
2Corresponding author. Tel.:+371 29217851 E-mail address: [email protected] 86
in Europe a significant number of people are
moving ‘back-to-the-land’ in search of a fulfilling
lifestyle and self-defined economic success
(Mailfert, 2007). In Greece, it is believed that the
European Union is consequently faced with a dual
problem: the scarcity of new and consequently
young farmers and the rapid ageing of the farmer
population. Young farmers can bring new skills
and energy, and a more professional
management to the farming sector
(Kontogeorgos, Michailidis et al., 2014).
Ben White (2012) stresses that “to understand
better the reasons behind why young people turn
away from agriculture we need to take account of
a number of problems, including: 1) the
deskilling of rural youth, and the downgrading of
farming and rural life; 2) the chronic government
neglect of small-scale agriculture and rural
infrastructure; 3) and the problems that young
rural people increasingly have, even if they want
to become farmers, in getting access to land
while still young”.
The European Parliament (2008) emphasises
that European agriculture now has to perform
diverse functions: to produce quality food
products, ensuring the food is harmless; to
protect the environment (soil and water), to
maintain landscapes and to preserve and
popularise local cultural traditions. In this
context, new farms have to tackle the problems
caused by more open markets on a global scale
and to take responsibility for a struggle against
climate change, the effects of which on the
environment become increasingly obvious.
In Latvia, too, fragmented and unspecialised
farming prevents from reaching the EU
standards. One of the reasons is the fact that a
large share of agricultural employees represents
old individuals. In 2002, 56% of them were aged
45 and older. Individuals of this age sometimes
lack motivation to change anything in production
in line with modern trends (Ministry of Finance,
2004). The situation has not significantly
changed after more than ten years – in 2013 in
Latvia’s agriculture, only 8 294 farm managers or
10.1 % were aged under 40; besides, in the
period 2007-2010 the number of agricultural
employees aged under 34 considerably declined
(by 44 %) (Ministry of Agriculture, 2015). In the
period 2014-2020, the EU CAP focuses on the
development of rural regions. An increasing focus
is put not only on the agricultural industry’s
development on the whole but also on the wish of
young people to return to rural areas and do
business there, thereby contributing to the
development of rural regions. The Sustainable
Development Strategy of Latvia until 2030
(Parliament of the Republic of Latvia, 2010) also
emphasises that human capital is Latvia’s most
important resource and it is essential to retain
this resource in rural regions and to create
interest in youths to return to their native areas
and do business there. Unfortunately, in recent
years in Latvia the number of youths in rural
areas sharply decreased. Youths move to cities
or, at worst, go abroad in search of higher
income, whereas rural regions become less
populated. One of the solutions for youths is to
start agricultural activity (Association Latvian
Young…, 2012). It is of great importance for
Latvia’s regions where sharp disparities among
municipality centres, cities and rural parishes in
remote parts of the regions may be explicitly
observed (Vesperis, 2012).
The research object is the EU’s support to
young farmers in Latvia’s regions, while the
research subject is the use of support in
founding new farms and in their operation in the
territories of the North-east and East Latgale
Regional Agricultural Departments (RAD) of the
Rural Support Service (RSS).
The following hypothesis is formulated:
young individuals in Latvia are interested in doing
business in rural areas. The research aim is to
examine support possibilities for young farmers
in Latvia, particularly in Latgale region. To
achieve the aim, the following specific tasks
were defined: 1) to assess the rural
Proceedings of the 2016 International Conference “ECONOMIC SCIENCE FOR RURAL DEVELOPMENT” No 41
Jelgava, LLU ESAF, 21-22 April 2016, pp. 85-95
2Corresponding author. Tel.:+371 29217851 E-mail address: [email protected] 87
development support provided to young farmers
in Latvia in the period 2004-2013; 2) to evaluate
the support provided to young farmers and the
development of farms in Latgale region.
Why is the problem with young farmers
particularly important in Latgale region? This is
because the effect of “geographical remoteness”
is not so pronounced in the EU’s border territories
– the border areas of Estonia and Lithuania – as
in the eastern border area (the border with the
CIS), i.e. in Latgale region (Melluma, 2000).
Latgale is the second largest region in Latvia in
terms of territory; yet, in 2013 almost half of the
country’s population lived in Riga planning region
(49.5%), while the proportion of Latgale region’s
population in the total population of Latvia was
14.8%. In the beginning of 2013, the population
density in the country was 34.1 people/km2,
while in Latgale planning region it was
22.3 people/km2 or 65 % of the average. In the
period 2008-2013, the population declined in
Latvia by 75.1 thou. or 3.3 %, while in Latgale
planning region the decline was the fastest
(24.0 thou. or 6.9 %). In the beginning of 2013,
the lowest proportion of under working-age
population in the total population was in Latgale
planning region (12.7 %). The oldest average
population age in Latvia was reported in Latgale
region (43.5 years). In 2010, the average GDP
per capita in Latvia was EUR 8674, while the
lowest indicator was in Latgale planning region
with EUR 4593 or 47 % below the national
average. Personal income tax revenue per capita
in Latgale planning region in 2012 was almost
twofold lower than in Riga planning region and
reached only half of the national average. In
2011, the number of individual merchants and
commercial companies per 1000 capita was the
lowest in Latgale planning region, 17.0, which
was 47 % below the national average. In the
beginning of 2013, the unemployment rate in
Latvia stood at 7.3 %, while in Latgale planning
region this rate was two times higher than in the
country on average (State Regional Development
Agency, 2013). Therefore, it is of great
importance to examine the support possibilities
for young farmers in Latgale region, which is the
most problematic region among Latvia’s five
planning regions, as financial support accelerates
the development of farms, which is one of the
regional development preconditions.
Research methods applied
The RSS that administrates support payments
in Latvia has 9 regional agricultural departments
and the central office in Riga (Figure 1) (Rural
Support Service, 2015). The territory of the
present in-depth examination represents part of
Latgale planning region (Regional Development
Law, 2002): the RSS’s North-east RAD and East
Latgale RAD.
Analysis, synthesis and the logical
construction method were employed to execute
the research tasks. A quantitative research
method – a survey – and a qualitative research
method – a focus group interview – were
employed as well. A 16-question questionnaire
was developed for the survey and 9 questions
were prepared for focus group interviews. The
study was conducted from January to
March 2015. More than 100 young farmers from
the territories of the RSS’s North-east RAD and
East Latgale RAD were invited to take part in the
survey; 71 were responsive and filled in the
questionnaire on the website visidati.lv. The
interviews were carried out in person – six
experts from the RSS and Latvian Rural Advisory
and Training Centre Ltd (LLKC) who daily worked
with young farmers in Latgale region were
interviewed in the analysed territory. The term
young farmer refers to an individual who works in
the agricultural industry and is aged under 40
(Ministry of Agriculture, 2010).
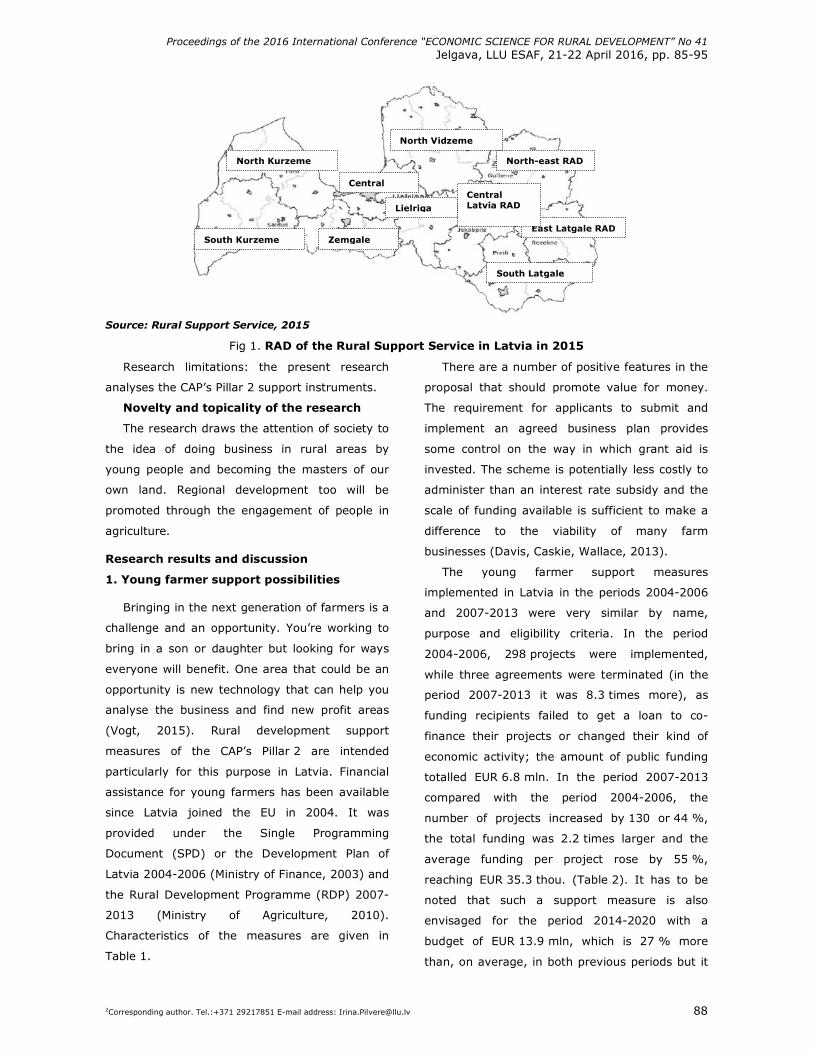
Proceedings of the 2016 International Conference “ECONOMIC SCIENCE FOR RURAL DEVELOPMENT” No 41
Jelgava, LLU ESAF, 21-22 April 2016, pp. 85-95
2Corresponding author. Tel.:+371 29217851 E-mail address: [email protected] 88
Source: Rural Support Service, 2015
Fig 1. RAD of the Rural Support Service in Latvia in 2015
Research limitations: the present research
analyses the CAP’s Pillar 2 support instruments.
Novelty and topicality of the research
The research draws the attention of society to
the idea of doing business in rural areas by
young people and becoming the masters of our
own land. Regional development too will be
promoted through the engagement of people in
agriculture.
Research results and discussion
1. Young farmer support possibilities
Bringing in the next generation of farmers is a
challenge and an opportunity. You’re working to
bring in a son or daughter but looking for ways
everyone will benefit. One area that could be an
opportunity is new technology that can help you
analyse the business and find new profit areas
(Vogt, 2015). Rural development support
measures of the CAP’s Pillar 2 are intended
particularly for this purpose in Latvia. Financial
assistance for young farmers has been available
since Latvia joined the EU in 2004. It was
provided under the Single Programming
Document (SPD) or the Development Plan of
Latvia 2004-2006 (Ministry of Finance, 2003) and
the Rural Development Programme (RDP) 2007-
2013 (Ministry of Agriculture, 2010).
Characteristics of the measures are given in
Table 1.
There are a number of positive features in the
proposal that should promote value for money.
The requirement for applicants to submit and
implement an agreed business plan provides
some control on the way in which grant aid is
invested. The scheme is potentially less costly to
administer than an interest rate subsidy and the
scale of funding available is sufficient to make a
difference to the viability of many farm
businesses (Davis, Caskie, Wallace, 2013).
The young farmer support measures
implemented in Latvia in the periods 2004-2006
and 2007-2013 were very similar by name,
purpose and eligibility criteria. In the period
2004-2006, 298 projects were implemented,
while three agreements were terminated (in the
period 2007-2013 it was 8.3 times more), as
funding recipients failed to get a loan to co-
finance their projects or changed their kind of
economic activity; the amount of public funding
totalled EUR 6.8 mln. In the period 2007-2013
compared with the period 2004-2006, the
number of projects increased by 130 or 44 %,
the total funding was 2.2 times larger and the
average funding per project rose by 55 %,
reaching EUR 35.3 thou. (Table 2). It has to be
noted that such a support measure is also
envisaged for the period 2014-2020 with a
budget of EUR 13.9 mln, which is 27 % more
than, on average, in both previous periods but it
East Latgale RAD
North-east RAD
North Vidzeme
Central Latvia RAD
South Latgale
Zemgale South Kurzeme
North Kurzeme
Lielriga
Central
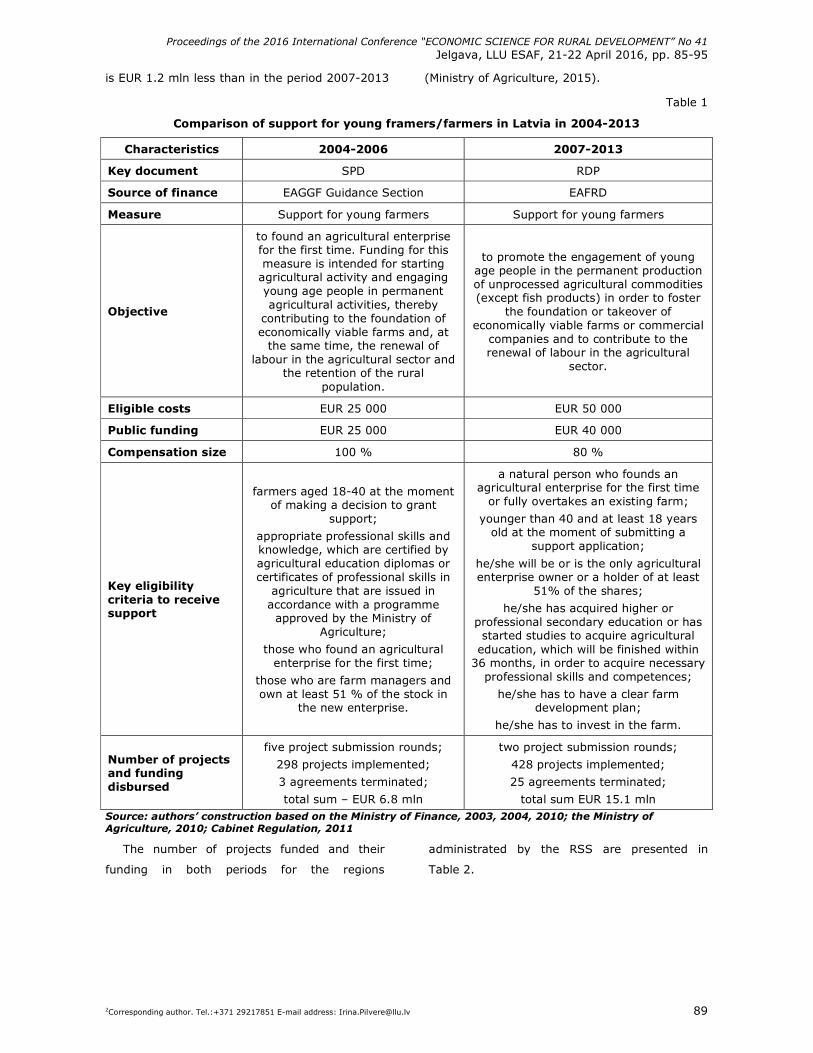
Proceedings of the 2016 International Conference “ECONOMIC SCIENCE FOR RURAL DEVELOPMENT” No 41
Jelgava, LLU ESAF, 21-22 April 2016, pp. 85-95
2Corresponding author. Tel.:+371 29217851 E-mail address: [email protected] 89
is EUR 1.2 mln less than in the period 2007-2013 (Ministry of Agriculture, 2015).
Table 1
Comparison of support for young framers/farmers in Latvia in 2004-2013
Characteristics 2004-2006 2007-2013
Key document SPD RDP
Source of finance EAGGF Guidance Section EAFRD
Measure Support for young farmers Support for young farmers
Objective
to found an agricultural enterprise for the first time. Funding for this measure is intended for starting agricultural activity and engaging young age people in permanent agricultural activities, thereby
contributing to the foundation of economically viable farms and, at the same time, the renewal of
labour in the agricultural sector and the retention of the rural
population.
to promote the engagement of young age people in the permanent production of unprocessed agricultural commodities (except fish products) in order to foster
the foundation or takeover of economically viable farms or commercial
companies and to contribute to the renewal of labour in the agricultural
sector.
Eligible costs EUR 25 000 EUR 50 000
Public funding EUR 25 000 EUR 40 000
Compensation size 100 % 80 %
Key eligibility criteria to receive support
farmers aged 18-40 at the moment of making a decision to grant
support;
appropriate professional skills and knowledge, which are certified by agricultural education diplomas or certificates of professional skills in
agriculture that are issued in accordance with a programme approved by the Ministry of
Agriculture;
those who found an agricultural enterprise for the first time;
those who are farm managers and own at least 51 % of the stock in
the new enterprise.
a natural person who founds an agricultural enterprise for the first time or fully overtakes an existing farm;
younger than 40 and at least 18 years old at the moment of submitting a
support application;
he/she will be or is the only agricultural enterprise owner or a holder of at least
51% of the shares;
he/she has acquired higher or professional secondary education or has started studies to acquire agricultural education, which will be finished within 36 months, in order to acquire necessary professional skills and competences;
he/she has to have a clear farm development plan;
he/she has to invest in the farm.
Number of projects and funding disbursed
five project submission rounds;
298 projects implemented;
3 agreements terminated;
total sum – EUR 6.8 mln
two project submission rounds;
428 projects implemented;
25 agreements terminated;
total sum EUR 15.1 mln Source: authors’ construction based on the Ministry of Finance, 2003, 2004, 2010; the Ministry of Agriculture, 2010; Cabinet Regulation, 2011
The number of projects funded and their
funding in both periods for the regions
administrated by the RSS are presented in
Table 2.
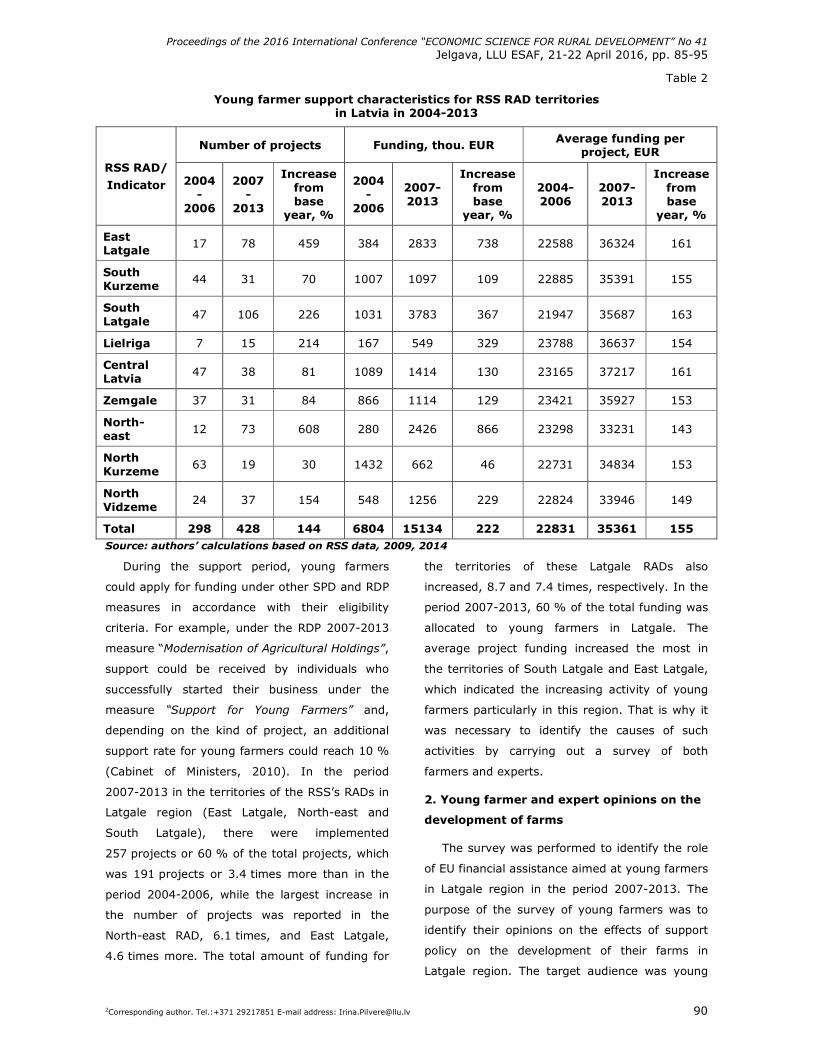
Proceedings of the 2016 International Conference “ECONOMIC SCIENCE FOR RURAL DEVELOPMENT” No 41
Jelgava, LLU ESAF, 21-22 April 2016, pp. 85-95
2Corresponding author. Tel.:+371 29217851 E-mail address: [email protected] 90
Table 2
Young farmer support characteristics for RSS RAD territories in Latvia in 2004-2013
Number of projects Funding, thou. EUR Average funding per project, EUR
RSS RAD/
Indicator 2004-
2006
2007-
2013
Increase from base
year, %
2004-
2006
2007-2013
Increase from base
year, %
2004-2006
2007-2013
Increase from base
year, %
East Latgale
17 78 459 384 2833 738 22588 36324 161
South Kurzeme
44 31 70 1007 1097 109 22885 35391 155
South Latgale
47 106 226 1031 3783 367 21947 35687 163
Lielriga 7 15 214 167 549 329 23788 36637 154
Central Latvia
47 38 81 1089 1414 130 23165 37217 161
Zemgale 37 31 84 866 1114 129 23421 35927 153
North-east
12 73 608 280 2426 866 23298 33231 143
North Kurzeme
63 19 30 1432 662 46 22731 34834 153
North Vidzeme
24 37 154 548 1256 229 22824 33946 149
Total 298 428 144 6804 15134 222 22831 35361 155 Source: authors’ calculations based on RSS data, 2009, 2014
During the support period, young farmers
could apply for funding under other SPD and RDP
measures in accordance with their eligibility
criteria. For example, under the RDP 2007-2013
measure “Modernisation of Agricultural Holdings”,
support could be received by individuals who
successfully started their business under the
measure “Support for Young Farmers” and,
depending on the kind of project, an additional
support rate for young farmers could reach 10 %
(Cabinet of Ministers, 2010). In the period
2007-2013 in the territories of the RSS’s RADs in
Latgale region (East Latgale, North-east and
South Latgale), there were implemented
257 projects or 60 % of the total projects, which
was 191 projects or 3.4 times more than in the
period 2004-2006, while the largest increase in
the number of projects was reported in the
North-east RAD, 6.1 times, and East Latgale,
4.6 times more. The total amount of funding for
the territories of these Latgale RADs also
increased, 8.7 and 7.4 times, respectively. In the
period 2007-2013, 60 % of the total funding was
allocated to young farmers in Latgale. The
average project funding increased the most in
the territories of South Latgale and East Latgale,
which indicated the increasing activity of young
farmers particularly in this region. That is why it
was necessary to identify the causes of such
activities by carrying out a survey of both
farmers and experts.
2. Young farmer and expert opinions on the
development of farms
The survey was performed to identify the role
of EU financial assistance aimed at young farmers
in Latgale region in the period 2007-2013. The
purpose of the survey of young farmers was to
identify their opinions on the effects of support
policy on the development of their farms in
Latgale region. The target audience was young
Proceedings of the 2016 International Conference “ECONOMIC SCIENCE FOR RURAL DEVELOPMENT” No 41
Jelgava, LLU ESAF, 21-22 April 2016, pp. 85-95
2Corresponding author. Tel.:+371 29217851 E-mail address: [email protected] 91
farmers aged under 40 at the moment of
applying for support who had an appropriate
agricultural education or started studies in order
to acquire it as well as individuals who found or
took over farms, becoming their owners, for the
first time and were legal or natural persons that
produced or planned to start producing
unprocessed agricultural commodities. In the
period 2007-2013 in the territories of the East
Latgale and North-east RADs, 151 projects were
implemented; thus, the survey covered 46% of
the total support recipients, as 70 respondents
(98.6% of the total respondents) had received
funding under the RDP measure “Support for
Young Farmers”, while one respondent as a
young farmer received support for the farm’s
development under the SPD 2004-2006 measure.
A socio-demographic profile of young farmers
revealed that 56 surveyed young farmers or 79%
were men and 15 were women (21%). The
respondents were aged 22-45; their average age
was 31.5. More than half of them or 52.1% had
families with children, while 18 young farmers or
25.4% or lived together with their spouses. Most
of the surveyed farmers specialised in grain
farming (40.4%), meat cattle farming (27.3%)
and dairy farming (16.2%). Only 5.1% were
engaged in bee-keeping and 3% in sheep
farming. Of the farmers, 8.1% specialised in flax,
pigs, vegetables (including the production of
potato starch), in processing timber and in fruits,
rabbits and poultry. Of the respondents, 56 or
78.9 % established a new farm, while 15
(21.1 %) took over or inherited existing farms.
The survey identified the reasons that
encouraged the respondents to become young
farmers. The respondents’ replies allowed
concluding that more than half or 52.9 % of the
surveyed individuals’ farms were founded owing
to the encouragement of their family members.
One in seven young farmers (or 10.3 %)
recognised that other young farmers and their
experience in farming helped to make a decision
to become a young farmer, while 12.6 % of them
were advised by their friends or acquaintances.
Besides, the respondents mentioned an
opportunity to return to their native location –
Latgale –, a wish to live in the countryside, the
continuation of family succession as well as an
opportunity to achieve their goals. It has to be
noted that one respondent admitted that he
decided to start a farming business based on
LLKC recommendations, while for another it was
a childhood dream and working in the agricultural
industry was his calling.
One of the criteria for applying for support
under the RDP 2007-2013 measure “Support for
Young Farmers” was an education in agriculture.
The survey revealed that 35 respondents or
48.6% already had the necessary agricultural
education, while 28 or 38.9 % started studies in
appropriate educational institutions before
applying for the measure. In the support period,
9 respondents or 12.5 % continued their
agricultural studies.
In 54 instances or 42.9 %, the purpose of
foundation of new farms or takeover of farms
(several replies were possible) was an
opportunity to modernise and develop the farm,
while 34 replies or 27 % referred to the purpose
of receiving the EU financial assistance, thereby
ensuring the farm’s development. Of the
respondents, 36 or 28.6 % acknowledged that
agriculture was their calling; therefore, they
decided to establish a farm with the aim to deal
with this industry. A few respondents revealed
that their purpose of founding a farm was to
return to their native location and to do business
in the countryside, providing for their family.
Answering the question whether they would
found a farm if no EU assistance were available,
36 young farmers or 50.7 % confirmed that they
would do it, while 25 respondents or 35.2 %
admitted that they would not do it. However, 10
young farmers or 14.1 % said they had not
thought about this question and it was difficult
for them to give a reply. So, one can conclude
that the EU financial support is an important
Proceedings of the 2016 International Conference “ECONOMIC SCIENCE FOR RURAL DEVELOPMENT” No 41
Jelgava, LLU ESAF, 21-22 April 2016, pp. 85-95
2Corresponding author. Tel.:+371 29217851 E-mail address: [email protected] 92
instrument for the viability and development of
Latvia’s agriculture.
The respondents could give several replies to
the question about skills young farmers need to
provide the efficiency of their farms and an
increase in the industry’s competitiveness. Of the
total replies, 18.5 % indicated that
entrepreneurial skills were the most important,
18.2 % referred to experience in farming, while
17.5 % replies indicated that high working
abilities were needed. Of the young farmers,
16.8 % regarded knowledge and experience in
the respective field as important, while 15.4 %
considered innovative and progressive thinking to
be an important ability of young farmers. The
survey of young farmers regarding the gains
from doing business in rural areas (several
replies were possible) showed that the most
important position was taken by development
opportunities for rural regions (land is farmed,
new families in rural areas), which was rated as
important in 26.9 % instances of the total
replies; 18.7 % stressed prospects for the
agricultural industry and the opportunity to
continue their family and native traditions. Of the
total replies, 19.7 % regarded environmental
improvements achieved by farmers through
farming in a particular region, municipality or
rural territory as an important gain.
The survey revealed that the greatest
problems that young farmers faced in rural areas
were: high financial risk (22.4 % of the total
replies) and the national tax system (21.9 %),
which limited the development of farms, causing
financial risks. A lack of human resources –
qualified labour – whom the farm’s modern
machinery and equipment may be entrusted to
(19.2 %) and no free land resources (18.7 %)
were mentioned as problems.
As obstacles, the respondents mentioned huge
financial liabilities that had to be assumed when
founding a farm, a poor infrastructure – the low
quality of municipal roads – and a lack of national
support. An unequal attitude of the Ministry of
Agriculture to “old” and young farmers was also
mentioned by them.
The young farmers were asked to give their
opinions about the sources and availability of
information (several replies were possible). The
data acquired showed that the key source of
information on business opportunities for young
farmers was the RSS, including the RSS website
(30 % of the total replies) and advisers from
LLKC offices (29.4 %). Of the total replies,
13.9 % indicated that information about news in
agriculture was obtained through informal
channels: relatives, friends and acquaintances.
However, one in six (12.8 %) young farmers
acquired information about business
opportunities from the press – municipal
newspapers and agricultural magazines. Quite a
few farmers gained information from TV, radio
and social networks (7.2 % and 4.4 % of the
total replies, respectively). Seminars and courses
were mentioned among the other information
sources.
The survey identified that 58 young farmers
(81 % of the total) daily cooperated with and
contacted other young farmers in their rural
territory, municipality and region in Latvia. Only
13 respondents or 18.3% admitted that they did
not use such an opportunity for the exchange of
information and experience. The survey showed
that the young farmers, mainly in Latgale region
(38 respondents or 28.8 % of the total replies)
met each other in seminars and conferences held
by their rural territory, municipality or regional
RSS office or by LLKC. Of the young farmers, 36
or 27.3 % contacted each other electronically,
while 29 shared their experience, meeting other
farmers on the spot on their farms. It has to be
noted that several replies were possible for this
question.
However, 27 farmers (20.5 % of the total
replies) admitted that they daily contacted other
young farmers (in person, by phone), as often
they were also friends.
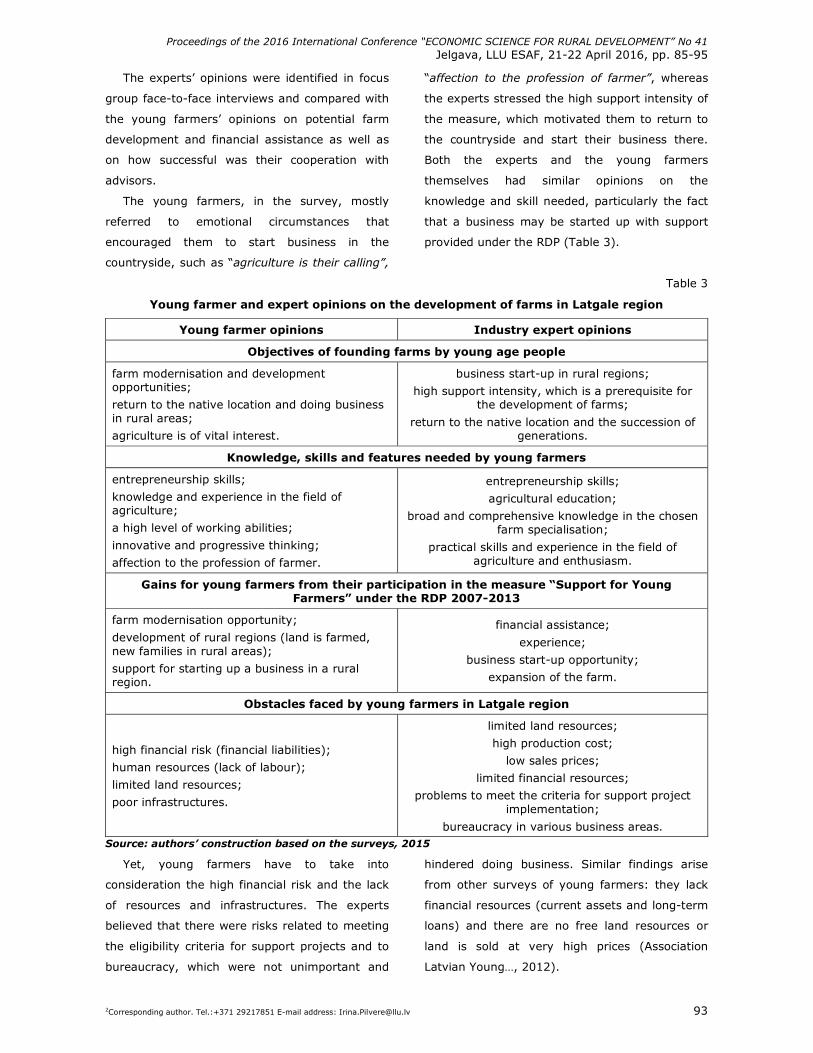
Proceedings of the 2016 International Conference “ECONOMIC SCIENCE FOR RURAL DEVELOPMENT” No 41
Jelgava, LLU ESAF, 21-22 April 2016, pp. 85-95
2Corresponding author. Tel.:+371 29217851 E-mail address: [email protected] 93
The experts’ opinions were identified in focus
group face-to-face interviews and compared with
the young farmers’ opinions on potential farm
development and financial assistance as well as
on how successful was their cooperation with
advisors.
The young farmers, in the survey, mostly
referred to emotional circumstances that
encouraged them to start business in the
countryside, such as “agriculture is their calling”,
“affection to the profession of farmer”, whereas
the experts stressed the high support intensity of
the measure, which motivated them to return to
the countryside and start their business there.
Both the experts and the young farmers
themselves had similar opinions on the
knowledge and skill needed, particularly the fact
that a business may be started up with support
provided under the RDP (Table 3).
Table 3
Young farmer and expert opinions on the development of farms in Latgale region
Young farmer opinions Industry expert opinions
Objectives of founding farms by young age people
farm modernisation and development opportunities;
return to the native location and doing business in rural areas;
agriculture is of vital interest.
business start-up in rural regions;
high support intensity, which is a prerequisite for the development of farms;
return to the native location and the succession of generations.
Knowledge, skills and features needed by young farmers
entrepreneurship skills;
knowledge and experience in the field of agriculture;
a high level of working abilities;
innovative and progressive thinking;
affection to the profession of farmer.
entrepreneurship skills;
agricultural education;
broad and comprehensive knowledge in the chosen farm specialisation;
practical skills and experience in the field of agriculture and enthusiasm.
Gains for young farmers from their participation in the measure “Support for Young Farmers” under the RDP 2007-2013
farm modernisation opportunity;
development of rural regions (land is farmed, new families in rural areas);
support for starting up a business in a rural region.
financial assistance;
experience;
business start-up opportunity;
expansion of the farm.
Obstacles faced by young farmers in Latgale region
high financial risk (financial liabilities);
human resources (lack of labour);
limited land resources;
poor infrastructures.
limited land resources;
high production cost;
low sales prices;
limited financial resources;
problems to meet the criteria for support project implementation;
bureaucracy in various business areas. Source: authors’ construction based on the surveys, 2015
Yet, young farmers have to take into
consideration the high financial risk and the lack
of resources and infrastructures. The experts
believed that there were risks related to meeting
the eligibility criteria for support projects and to
bureaucracy, which were not unimportant and
hindered doing business. Similar findings arise
from other surveys of young farmers: they lack
financial resources (current assets and long-term
loans) and there are no free land resources or
land is sold at very high prices (Association
Latvian Young…, 2012).
Proceedings of the 2016 International Conference “ECONOMIC SCIENCE FOR RURAL DEVELOPMENT” No 41
Jelgava, LLU ESAF, 21-22 April 2016, pp. 85-95
2Corresponding author. Tel.:+371 29217851 E-mail address: [email protected] 94
Foreign experience also indicates that the
entry of young farmers into the industry is a
complex process and a number of purposeful
activities have to be carried out to make it
successful: 1) to encourage and help newcomers
to the agricultural industry to ensure its long-
term health and vitality; 2) to encourage those
within the industry to plan ahead and explore
new opportunities and options; 3) and to provide
an opportunity for those wishing to leave the
industry to do so with dignity (Ingram, Kirwan,
2011).
Conclusions, proposals, recommendations
1) In Latvia and Europe, there is a trend of
ageing of agricultural employees, which
makes negative effects on agriculture and
rural development. The support measure
under the RDP has contributed to business
opportunities for young farmers and the
agricultural industry’s development, as 726
support projects have been implemented in
Latvia since 2004, acquiring public funding of
EUR 22 mln. Very significant increases in the
number of projects and funding in the period
2007-2013 were reported for the territories of
the North-east RAD and the East Latgale RAD,
which indicated that financial assistance
played an essential role in the foundation or
inheritance of farms as well as in the
performance and development of farms
belonging to young farmers.
2) The survey of young farmers and experts
indicated that young farmers had various
motivations to start up a business, while the
RDP support measure for young farmers had
contributed to starting up a business by them.
Young farmers need versatile knowledge and
skills. Yet, young farmers have to take into
consideration various risks and obstacles
because their business sustainability depends
on coping with the mentioned negative
factors.
Bibliography
1. Report of Agricultural Industry Experts on the Situation of Young Farmers in Agriculture in the Period 2007-2013 (in Latvian) (2012). Association Latvian Young Farmers Club. Jelgava, p.26.
2. Barnes, A., Sutherland, L.A., Toma, L., Matthews, K., Thomson, St. (2016). The Effect of the Common Agricultural Policy Reforms on Intentions Towards Food Production: Evidence from Livestock Farmers. Land Use Policy. Volume 50, January 2016, pp. 548-558.
3. Cabinet Regulation No.1026 of 1 November 2010 “Procedure of Granting National and European Union Support in Open Tenders for Submitted Projects under the Measure “Modernisation of Agricultural Holdings”” (in Latvian) (2010). Cabinet of Ministers of the Republic of Latvia. "Latvijas Vestnesis", 176 (4368), 05.11.2010.
4. Cabinet Regulation No.783 of 14 July 2009 “Procedure of Granting National and European Union Support for the Development of Rural Areas and Fisheries” with amendments (2011). Cabinet of Ministers of the Republic of Latvia. "Latvijas Vestnesis", 118 (4104), 28.07.2009.
5. Davis, J., Caskie, P., Wallace, M. (2013). Promoting Structural Adjustment in Agriculture: The Economics of New Entrant Schemes for Farmers. Food Policy. Volume 40, June 2013, pp. 90-96.
6. Results Achieved within the EAGGF. Progress of Physical Indicators for the Measures Funded by the European Agricultural Guidance and Guarantee Fund (EAGGF) or the Results Achieved within the EAGGF in the Period 2004-2006 (in Latvian) (2015). EU Funds. Retrieved: http://www.esfondi.lv/sasniegtie-rezultati-elvgf-ietvaros. Access: 28.11.2015
7. EurActiv (2015). Can the (New) CAP Deliver on Sustainability? Special Report 21 - 25 September 2015, p.26. Retrieved: http://www.euractiv.com/sites/default/files/ euractiv_special_report_-_can_the_new_cap_deliver_on_sustainability.pdf. Access: 29.11.2015
8. Rural Development in the EU (2012). European Commission. Statistical and Economic Information Report 2012, p.378.
9. Report on the Future of Young Farmers in Relation to the Current CAP Reform (2008). European Parliament, No. A6-0182/2008 on 13.5.2008 (2007/2194(INI)) Committee on Agricultural and Rural Development. Reporter: Donato Tomaso Veraldi. Retrieved: http://www.europarl.europa.eu/sides/getDoc.do?pubRef=-//EP//NONSGML+REPORT+A6-2008-0182+0+DOC+PDF+V0//LV Access: 04.12.2015
10. Ingram, J., Kirwan, J. (2011). Matching New Entrants and Retiring Farmers through Farm Joint Ventures: Insights from the Fresh Start Initiative in Cornwall, UK. Land Use Policy, Volume 4, October 2011, pp. 917-927.
11. Kontogeorgos, A., Michailidis, A., Chatzitheodoridis, F., Loizou, E. (2014). "New Farmers" a Crucial Parameter for the Greek Primary Sector: Assessments and Perceptions. International Conference on Applied Economics (ICOAE 2014). Procedia Economics and Finance. Volume: 14, pp. 333-341.
Proceedings of the 2016 International Conference “ECONOMIC SCIENCE FOR RURAL DEVELOPMENT” No 41
Jelgava, LLU ESAF, 21-22 April 2016, pp. 85-95
2Corresponding author. Tel.:+371 29217851 E-mail address: [email protected] 95
12. Mailfert, K. (2007). New Farmers and Networks: How Beginning Farmers Build Social Connections in France. Tijdschrift voor economische en sociale geografie, Volume 98, Issue 1, February 2007, pp.21-31.
13. Melluma, A. (2000). Border Areas of Latvia (in Latvian). Riga: Science. p.111.
14. Ministry of Agriculture of the Republic of Latvia (2010). Rural Development Programme of Latvia 2007-2013 (in Latvian). Riga, p. 459.
15. Latvia – Rural Development Programme (National) 2014-2020 (in Latvian) (2015). Ministry of Agriculture of the Republic of Latvia, 2014LV06RDNP001, 23 January 2015, p. 522.
16. Development Plan of Latvia (Single Programming Document) Draft as of 4 December 2003. Draft translation (in Latvian) (2003). Target 1 Programme 2004-2006. Ministry of Finance of the Republic of Latvia. Riga, p.328.
17. Single Programming Document LATVIA. Supplement for the Target 1 Programme 2004-2006 (in Latvian) (2004). Ministry of Finance of the Republic of Latvia. Riga, 23 February 2004, p.186.
18. Final Report on the EU Structural Funds under the Single Programming Document. Latvia. Single Programming Document for the Target 1 Programme 2004-2006 (in Latvian) (2010). Ministry of Finance of the Republic of Latvia Prepared in accordance with Article 37 of Council Regulation (EC) No. 1260/1999. CCI 2003LV161DO001, Riga, p. 252.
19. Latvia 2030. Sustainable Development Strategy of Latvia until 2030 (in Latvian) (2010). Parliament of the Republic of Latvia. R.Kilis (ed.), p.100.
20. Database on Programming Period 2004-2006 Structural Fund Projects and their Funding (in Latvian) (2009). Rural Support Service Riga. Unpublished resource.
21. Operational Information on Funded EAFRD Projects by RSS Department as of 31 October 2014, EUR (in Latvian) (2014). Rural Support Service. Riga, p.2.
22. Regional Agricultural Departments (2015). Rural Support Service. Retrieved: http://www.lad.gov.lv/lv/kontakti/klientu-apkalposanas-punkti/ Access: 04.12.2015
23. Identification and Analysis of the Areas of Influence of Development Centres. Characteristics of the Development of Planning Regions, Cities and Municipalities (in Latvian) (2013). State Regional Development Agency. Riga, p.151.
24. Survey of Young Farmers in the Territory of the North-east and East Latgale RAD (2015) (in Latvian). Unpublished resource.
25. Vesperis, V. (2012). Regional Development Assessment. Summary of doctoral dissertation. Jelgava: LLU EF. p. 114.
26. Vogt, W. (2015). One Entry Point for Next-generation Farmers Could Very Well be Technology. Technology Tech to Transition. Farm Industry News, Penton Media Inc, 12 November, 2015. Retrieved: http://web.a.ebscohost.com.ezproxy.llu.lv/bsi/ pdfviewer/pdfviewer?vid=3&sid=fed2482d-dd5a-44b1-800c-181cb23a6a5d%40sessionmgr4005&hid=4206. Access: 29.11.2015
27. White, B. (2012). Employment and the Future of Farming. IDS Bulletin, Volume 43, Number 6, November 2012. Institute of Development Studies. Published by Blackwell Publishing Ltd, USA, pp. 9-19.
28. Zagata, L., Sutherland, L.A. (2015). Deconstructing the “Young Farmer Problem in Europe”: Towards a Research Agenda. Journal of Rural Studies. Volume 38, April 2015, pp. 39-51.
Proceedings of the 2016 International Conference “ECONOMIC SCIENCE FOR RURAL DEVELOPMENT” No 41
Jelgava, LLU ESAF, 21-22 April 2016, pp. 96-103
96
ROLE OF MUNICIPALITIES IN LOCAL FOOD DISTRIBUTION IN LATVIA Inita Krivasonoka1, Mg.oec.; Andra Zvirbule1, Dr.oec.
1 Latvia University of Agriculture
Abstract. Local food supply chains become increasingly popular and provide a significant positive effect on the local
economy, creating new jobs in the agricultural and food processing sectors and in related industries, for example,
tourism, public catering etc. as well as contributing to the related multiplier effect at local level. Therefore, the local
governments have a direct interest in the local product sales promotion. The research aim is to identify types
influencing local food consumption by local municipalities. An analysis of municipal development planning documents
and research studies on development opportunities for municipalities leads to a conclusion that municipalities have a
lot of possibilities to contribute to sales of local products in a direct way by holding fairs and other events and through
public food procurement and also in an indirect way by fostering economic activity, perfecting the business
environment, supporting the formation of cooperation networks, educating entrepreneurs and residents etc. Municipal
authorities can contribute to local food sales the most through their public food procurement for education and care
institutions by setting regulations that give preference to local producers, namely, by carrying out “green” food
procurement. In Latvia, green procurement operations are done rarely; thus, such operations have to be encouraged
nationwide.
Key words: municipality, short supply chain, local products.
JEL code: H76
Introduction
In recent years both in the world and in
Latvia, focus has been placed on consuming food
as close to its production site as possible, i.e.
local food. According to a number of authors, the
demand for local products rises, and expressing
belonging to a local area is one of the latest
trends on the global food market (Knight A. J.,
2011).
Local food systems, in which the production,
processing, sales and consumption of products
take place within relatively small distances, make
a significant positive effect on the local economy
(Kneafsey M. et al., 2013; Martinez S. et al.,
2010). For instance, farmers’ markets positively
affect local businesses, while at the same time
generating considerable revenues for local
farmers, thus making viable many small local
farms (Brown C., Miller S., 2008). Unlike large
industrial farms, small family farms spend more
their money on local products; besides, food
grown, processed and supplied locally (for
example, to local restaurants) creates jobs, thus
stimulating the local economy (Halweil B., 2002).
Increased local economic activity and jobs lead to
greater tax revenue and a stronger economic
base to support other businesses and anchor
institutions (Pringle A., 2013).
Studies show that state and local government
procurement has a very significant impact on the
local economy. Purchasing by private and public
sector institutions is a major force in the
economy. Institutional procurement presents a
large opportunity for local economic
development. By purchasing goods and services
from local suppliers, public and private
institutions could increase local jobs and
economic wealth (Jackson M., 2010; Pringle A.,
2013).
For this reason, the consumption of local food
has to be encouraged in municipalities in order to
promote economic growth and development in
the local area.
The present research puts forward the
following hypothesis: municipalities have a wide
range of tools to promote local food sales. The
research aim is to identify types of influencing
local food consumption by local municipalities.
The specific research tasks are as follows: to
examine the municipal planning documents and
research studies on development opportunities
for municipalities as well as to systemise the
current and planned activities of municipalities
Proceedings of the 2016 International Conference “ECONOMIC SCIENCE FOR RURAL DEVELOPMENT” No 41
Jelgava, LLU ESAF, 21-22 April 2016, pp. 96-103
97
regarding promoting the consumption of local
products.
The present research employed the following
qualitative and quantitative methods: document
analysis, induction and deduction, analysis and
synthesis, the monographic and graphic methods
and statistical analysis.
The research analysed development strategies
of 22 municipalities of Latvia and research
studies on business opportunities in
municipalities as well as related regional planning
documents to summarise initiatives and activities
the municipalities can implement in order to
contribute to increasing local product sales and,
at the same time, to their sustainable
development. The research also used theoretical
findings of scientists, legislation of the Republic
of Latvia and data on municipal food
procurement.
Research results and discussion
According to the Sustainable Development
Guidelines, Latvia has to form a stable economy
that meets social needs and, at the same time,
ensure that its economic growth rate does not
exceed environmental pollution and resource
consumption rates as well as market economy
mechanisms serve for the purpose of sustainable
development.
To achieve it, the following activities are
envisaged:
• to promote the development of human
resources involved in the production and
processing of agricultural commodities and in
food production in order to enhance the
process and management of agricultural
production and processing and to seek new
sales markets;
• to form a favourable business environment
(Latvian Sustainable…, 2002).
In Latvia, development planning is performed
at four levels. Municipal development planning
documents are local-level documents that are
hierarchically subordinated to regional and
national development planning documents
(Development Planning …, 2008).
Using policy and planning tools to encourage
economic growth is one of a local government’s
primary functions (Kwon M. et al., 2009). To
maintain and improve the health and vitality of
their communities, local governments pursue
various strategies for economic development.
A local government is a local administration
which ensures the performance of the functions
prescribed by law and local government
voluntary initiatives, observing the interests of
the state and of the residents of the relevant
administrative territory. One of the functions of a
local government is to promote economic activity
in its administrative territory (Law on Local
Governments, 1994).
As regards sustainable consumption,
municipal institutions act more like the executors
of the power of state institutions, and only in a
few cases municipal institutions implement some
voluntary initiatives, contributing to local
sustainability (Brizga J. et al., 2011). National-
and local-level public administrations play an
essential role in supporting local food supply
chains. Their support can bring extra gains to
local communities and the economy.
A local food support system is a public
agreement mutually beneficial to local food
producers and local residents, as residents
acquire the quality food they want, which is
produced in their area, and businessmen get
financial/nonfinancial investments that help them
maintain and develop their businesses, while the
local public becomes less dependent on external
processes it cannot influence, thereby
contributing to the sustainable development of
the community (Latvian Rural Forum…, 2012).
An increasing interest in local food provides a
springboard opportunity for the local economy.
According to research studies conducted in the
USA, local food supply chains create 13 full-time
jobs in the agricultural sector per USD 1 million
in revenue earned. For comparison, large-scale
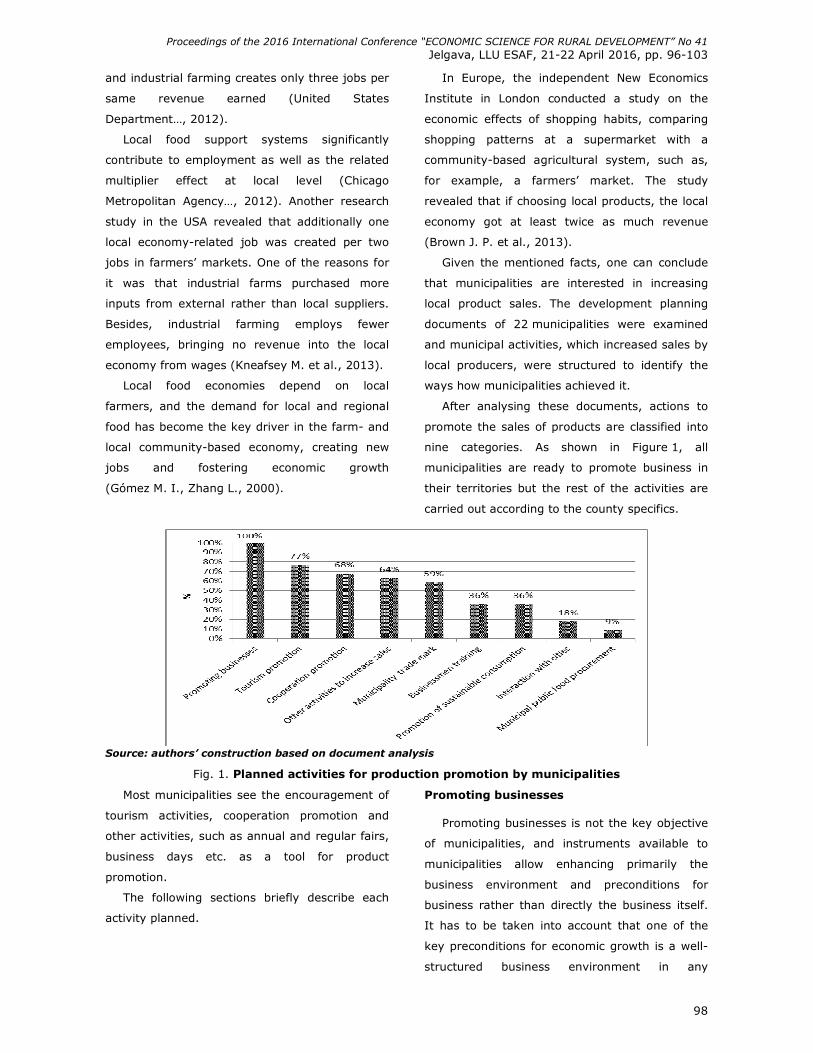
Proceedings of the 2016 International Conference “ECONOMIC SCIENCE FOR RURAL DEVELOPMENT” No 41
Jelgava, LLU ESAF, 21-22 April 2016, pp. 96-103
98
and industrial farming creates only three jobs per
same revenue earned (United States
Department…, 2012).
Local food support systems significantly
contribute to employment as well as the related
multiplier effect at local level (Chicago
Metropolitan Agency…, 2012). Another research
study in the USA revealed that additionally one
local economy-related job was created per two
jobs in farmers’ markets. One of the reasons for
it was that industrial farms purchased more
inputs from external rather than local suppliers.
Besides, industrial farming employs fewer
employees, bringing no revenue into the local
economy from wages (Kneafsey M. et al., 2013).
Local food economies depend on local
farmers, and the demand for local and regional
food has become the key driver in the farm- and
local community-based economy, creating new
jobs and fostering economic growth
(Gómez M. I., Zhang L., 2000).
In Europe, the independent New Economics
Institute in London conducted a study on the
economic effects of shopping habits, comparing
shopping patterns at a supermarket with a
community-based agricultural system, such as,
for example, a farmers’ market. The study
revealed that if choosing local products, the local
economy got at least twice as much revenue
(Brown J. P. et al., 2013).
Given the mentioned facts, one can conclude
that municipalities are interested in increasing
local product sales. The development planning
documents of 22 municipalities were examined
and municipal activities, which increased sales by
local producers, were structured to identify the
ways how municipalities achieved it.
After analysing these documents, actions to
promote the sales of products are classified into
nine categories. As shown in Figure 1, all
municipalities are ready to promote business in
their territories but the rest of the activities are
carried out according to the county specifics.
Source: authors’ construction based on document analysis
Fig. 1. Planned activities for production promotion by municipalities
Most municipalities see the encouragement of
tourism activities, cooperation promotion and
other activities, such as annual and regular fairs,
business days etc. as a tool for product
promotion.
The following sections briefly describe each
activity planned.
Promoting businesses
Promoting businesses is not the key objective
of municipalities, and instruments available to
municipalities allow enhancing primarily the
business environment and preconditions for
business rather than directly the business itself.
It has to be taken into account that one of the
key preconditions for economic growth is a well-
structured business environment in any
Proceedings of the 2016 International Conference “ECONOMIC SCIENCE FOR RURAL DEVELOPMENT” No 41
Jelgava, LLU ESAF, 21-22 April 2016, pp. 96-103
99
municipality (Lescevica M., 2005). To date,
Latvia’s municipalities have sought to promote
businesses mainly unsystematically and, for the
most part, based on the European Union’s funds.
Besides, many municipalities design their
development plans “on paper”, and in reality
municipalities lack knowledge on how to draw up
a “revenue-generating” strategy rather than a
“spending” strategy (State Regional
Development…, 2012).
According to the development programmes of
municipalities that were designed based on
territorial examinations and population surveys,
to enhance the business environment and
promote business, the municipalities perform or
plan to do the following activities:
• to develop a competitive and modern
standards-based business support
infrastructure based on the territorial business
specialisation defined by the municipality;
• to identify premises where businessmen can
do their business, to restructure depressed
industrial territories, to develop new industrial
territories in the region, to attract private
capital for maintaining and reconstructing
municipal buildings and to adapt municipal
buildings to business needs;
• to attract investments that could create new
jobs in the municipality and produce a
catalogue of free territories or an “investment
guide”;
• to establish business advisory centres or “one-
stop” agencies (all national and local
government services in relation to business
are available at one place);
• to develop a network of business incubators;
• to play an important role in innovation, as
they have information and some support
instruments. In Latvia, 18% of municipalities
see their role and importance in contributing
to innovation in enterprises (Development
Potential…, 2012);
• to support the acquisition of financial
assistance. Municipalities can support the
expansion of financial cooperatives, promote
cooperation with banks and allocate funding
for implementing good business ideas
(through contests);
• to reduce taxes and fees for enterprises that
distribute environment-friendly and organic
products: immovable property tax relief for
organic food producers, free of charge
commerce permits for home producers at
events held by the municipality, a reduced
municipal fee for placing advertisements in
public places. The Ministry of Environmental
Protection and Regional Development
suggests applying a lower VAT rate on organic
food products and differentiated VAT rates
depending on the place of origin of food
(Ministry of Environmental…, 2013);
• to promote the distribution of information on
local businesses, local enterprises and their
services provided and goods produced,
thereby contributing to the recognition of local
products in the municipality and in other
regions;
• to function, on the whole, as a motivator and
supporter of entrepreneurs.
Tourism promotion
Municipalities should hold support activities for
businessmen doing business in their territories,
so that local businessmen or other businessmen
from the vicinity employ agricultural production
as a catalyst for other economic activities, for
example, sales of product on the spot,
agritourism, food production, public catering etc.
in order to integrate local food producers in the
single tourism and recreation scheme of the
municipality.
To foster tourism, municipalities have to focus
on developing their tourism infrastructure, to
expand the diversity of tourism services and raise
their quality as well as to identify the ways how
to associate local products with tourism, cultural
heritage and new traditions and services. To
promote tourism, municipalities have to actively
popularise/advertise leisure time opportunities in
Proceedings of the 2016 International Conference “ECONOMIC SCIENCE FOR RURAL DEVELOPMENT” No 41
Jelgava, LLU ESAF, 21-22 April 2016, pp. 96-103
100
their territory and to design municipality
marketing strategies that involve, for example, a
created “story of the municipality”. It may serve
as a factor contributing to the attractiveness of
the place, in particular, to arise the interest of
urban residents in rural products and places,
which would promote one-day recreation in
countryside and rural tourism.
Cooperation promotion
It is important to strengthen cooperation
among social partners and to engage them in
shaping a favourable rural environment. Creating
business cooperation networks involves activities
for local-level and inter-municipal cooperation
among the private and public sectors as well as
businessmen. The role of cooperation with
neighbouring municipalities as well as foreign
partners has to increase. It is necessary to create
new international cooperation networks to take
advantage of economic growth in other countries.
Establishing contacts, integration into
international economic processes and
opportunities to represent oneself also contribute
to the business environment as well as it directly
generates revenue for local enterprises and
increases employment.
It is also important for municipalities to
actively engage and assist in organisational
activities, e.g. in establishing and developing
cooperatives. Municipalities have to also
popularise business clusters as an opportunity for
development and growth and contribute to their
establishment.
Other activities to increase sales
The other activities may involve:
• establishing permanent sales places for local
food producers (with symbolic fees on sales
places, equipment and devices; advertising
activities to increase the recognition of
products);
• setting up local food stands at regional
supermarkets; establishing sales places at the
Riga Central Market;
• holding annual and regular fairs, various
festivals (the Bread Festival, local harvest
festivals, etc.) and municipality festivals;
• creating a gift basket of local products. It is
important that residents feel that their local
authority supports and appreciates small
enterprises operating in the municipality;
• establishing a “food bag” system; a food bag
is composed of various products and delivered
to consumers on demand;
• participating in trade missions, which would
assist local producers to sell their products
outside their municipality (in Latvia and
abroad);
• holding exhibitions and international events in
the municipality and outside it. Practice shows
that if the municipality takes responsibility to
hold an event, local businesses are more
interested in foreign visits and exhibitions;
• holding business days in the municipality,
thereby contributing to cooperation among
businessmen and the exchange of experience
and information on urgent problems.
Development of a trade mark for a
municipality
One of the best ways how a municipality can
promote the recognition of a local product and as
a result the sales of it involves being aware of the
values of its territory and creating a single image
of the municipality’s territory and designing and
implementing the municipality’s strategy.
Municipalities have to work on the creation of
single municipal symbols/brands, which might be
used by all small businesses to contribute to the
recognition of their products, advertisements and
sales. In addition, marketing and advertising
activities are necessary to develop the support
system for local identity products.
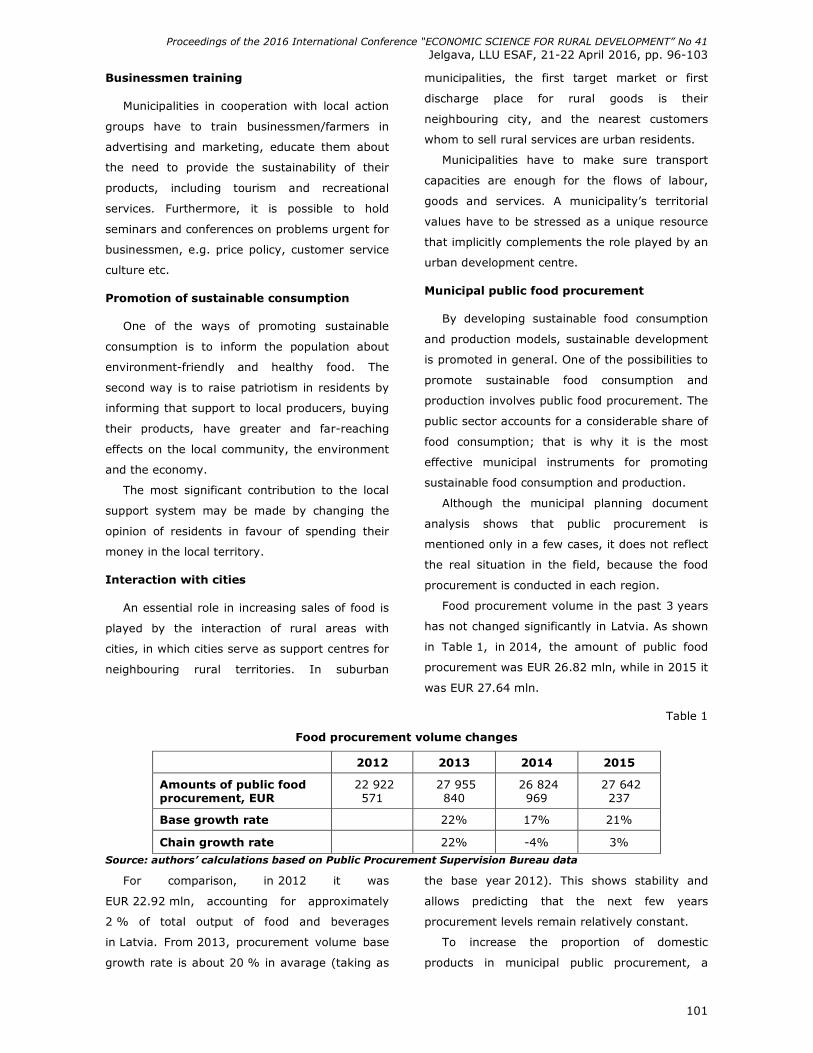
Proceedings of the 2016 International Conference “ECONOMIC SCIENCE FOR RURAL DEVELOPMENT” No 41
Jelgava, LLU ESAF, 21-22 April 2016, pp. 96-103
101
Businessmen training
Municipalities in cooperation with local action
groups have to train businessmen/farmers in
advertising and marketing, educate them about
the need to provide the sustainability of their
products, including tourism and recreational
services. Furthermore, it is possible to hold
seminars and conferences on problems urgent for
businessmen, e.g. price policy, customer service
culture etc.
Promotion of sustainable consumption
One of the ways of promoting sustainable
consumption is to inform the population about
environment-friendly and healthy food. The
second way is to raise patriotism in residents by
informing that support to local producers, buying
their products, have greater and far-reaching
effects on the local community, the environment
and the economy.
The most significant contribution to the local
support system may be made by changing the
opinion of residents in favour of spending their
money in the local territory.
Interaction with cities
An essential role in increasing sales of food is
played by the interaction of rural areas with
cities, in which cities serve as support centres for
neighbouring rural territories. In suburban
municipalities, the first target market or first
discharge place for rural goods is their
neighbouring city, and the nearest customers
whom to sell rural services are urban residents.
Municipalities have to make sure transport
capacities are enough for the flows of labour,
goods and services. A municipality’s territorial
values have to be stressed as a unique resource
that implicitly complements the role played by an
urban development centre.
Municipal public food procurement
By developing sustainable food consumption
and production models, sustainable development
is promoted in general. One of the possibilities to
promote sustainable food consumption and
production involves public food procurement. The
public sector accounts for a considerable share of
food consumption; that is why it is the most
effective municipal instruments for promoting
sustainable food consumption and production.
Although the municipal planning document
analysis shows that public procurement is
mentioned only in a few cases, it does not reflect
the real situation in the field, because the food
procurement is conducted in each region.
Food procurement volume in the past 3 years
has not changed significantly in Latvia. As shown
in Table 1, in 2014, the amount of public food
procurement was EUR 26.82 mln, while in 2015 it
was EUR 27.64 mln.
Table 1
Food procurement volume changes
2012 2013 2014 2015
Amounts of public food procurement, EUR
22 922 571
27 955 840
26 824 969
27 642 237
Base growth rate 22% 17% 21%
Chain growth rate 22% -4% 3%
Source: authors’ calculations based on Public Procurement Supervision Bureau data
For comparison, in 2012 it was
EUR 22.92 mln, accounting for approximately
2 % of total output of food and beverages
in Latvia. From 2013, procurement volume base
growth rate is about 20 % in avarage (taking as
the base year 2012). This shows stability and
allows predicting that the next few years
procurement levels remain relatively constant.
To increase the proportion of domestic
products in municipal public procurement, a
Proceedings of the 2016 International Conference “ECONOMIC SCIENCE FOR RURAL DEVELOPMENT” No 41
Jelgava, LLU ESAF, 21-22 April 2016, pp. 96-103
102
regulation regarding food and public catering
procurement has been adopted in Latvia, which
specifies that local governments have to support
local producers (Cabinet of Ministers…, 2014).
It is not possible to precisely identify the
proportion of local food in the mentioned
amounts of public procurement, as the majority
of contractors are wholesale companies that offer
both local and non-local food products. However,
having regard to the adoption of the above-
mentioned Cabinet Regulations, some
components of green public procurement are
increasingly introduced. As a result, the share of
domestic production in procurements increased in
2015. According to the Public Procurement
Supervision Bureau, approximately 15 % of total
amount of public procurement was “green”
in 2015. The average in the European Union
nears 30 %.
Conclusions
1) Short food supply chains and increases in
the demand for local products significantly
contribute to local economic growth, the
creation of new jobs in the sector and the
related multiplier effect at local level.
Therefore, the local governments have a
direct interest in the local product sales
promotion.
2) Municipalities have a lot of opportunities to
promote sales of local food directly – by
holding food fairs and other events and
through public food procurement – and
indirectly – by fostering economic activity,
perfecting the business environment,
supporting the formation of cooperation
networks, educating entrepreneurs and
residents etc.
3) The most considerable way how municipal
authorities can contribute to local food sales is
to set public food procurement regulations
that give preference to local producers. In
Latvia, a greater focus on local food was
placed only in 2015; thereby this opportunity
is little used and this activity has to be
encouraged nationwide.
Bibliography
1. Brizga, J., Lice, E., Abolina, K., Murins, S., Dimante, Dz., Atstaja, Dz., Austers, I. (2011). Sustainable Consumption Assessment: Latvian project report. Retrieved: http://www.zalabriviba.lv/wp-content/uploads/ipr%20gala_zinojums.pdf. Access: 13.12.2015.
2. Brown J.P., Goetz S.J., Ahearn M.C., Liang, C., (2013). Linkages between Community-Focused Agriculture, Farm Sales, and Regional Growth. Economic Development Quarterly, Volume 28, Issue 1, pp. 5–16.
3. Brown, C., Miller, S. (2008). The Impacts of Local Markets: A Review of Research on Farmers Markets and Community Supported Agriculture (CSA). American Journal of Agricultural Economics, Volume 90, Issue 5, 1298-1302.
4. Cabinet of Ministers of the Republic of Latvia (2014). Cabinet Regulation No 673 “Regulations Regarding the Application of Environmental Criteria and the Definition of Choice Criteria for Food Offers”. Retrieved: http://likumi.lv/doc.php?id=269980. Access: 12.12.2015.
5. Chicago Metropolitan Agency for Planning (2012). Municipal Strategies to Support Local Food Systems, p.64. http://www.cmap.illinois.gov/documents/10180/10927/FY13-0029+LOCAL+FOOD+TOOLKIT_lowres.pdf/ac034661-e7a9-43b7-b375-6e98578f9e89. Access: 02.01.2016.
6. Development Planning System Law (2008). Retrieved: http://likumi.lv/doc.php?id=175748. Access: 04.01.2016.
7. Development Potential and Challenges of Innovation Economic in Vidzeme Region (2012). Retrieved: http://www.vidzeme.lv/lv/regionalie_petijumi/50/128247/. Access: 14.12.2015.
8. Gómez, M.I., Zhang, L. (2000). Impacts of Concentration in Hog Production on Economic Growth in Rural Illinois: An Econometric Analysis, p.30. Retrieved: http://ageconsearch.umn.edu/bitstream/21846/1/sp00go03.pdf. Access: 04.01.2016.
9. GRACE Communications Foundation (2015). Local & Regional Food Systems. Retrieved: http://www.sustainabletable.org/254/local-regional-food-systems, February 21, 2015.
10. Halweil,B. (2002). Home Grown: The Case For Local Food In A Global Market. Worldwatch Paper #163, p.83. Retrieved: http://www.worldwatch.org/node/827. Access: 27.12.2015.
11. Jackson, M. (2010). Making the Most of Public Sector Spend: Procurement as Local Economic Activism. Briefing of Centre for Local Economic Strategies. Retrieved: http://www.cles.org.uk/wp-content/uploads/2011/01/Procurement-as-local-economic-activism.pdf. Access: 12.12.2015.
12. Kneafsey, M., Venn, L., Schmutz, U., Balázs, B., Trenchard, L., Eyden-Wood, T., Bos, E., Sutton, G., Blackett, M. (2013). Short Food Supply Chains and Local Food Systems in the EU. A State of Play of their Socio-Economic
Proceedings of the 2016 International Conference “ECONOMIC SCIENCE FOR RURAL DEVELOPMENT” No 41
Jelgava, LLU ESAF, 21-22 April 2016, pp. 96-103
103
Characteristics. JRC Scientific and Policy Reports. Retrieved: http://ftp.jrc.es/EURdoc/JRC80420.pdf. Access: 27.12.2015.
13. Knight A.J. (2011) Evaluating Local Food Programs: The Case of Select Nova Scotia. Evaluation and Program Planning, Volume 36, Issue 1, pp. 29–39.
14. Kwon, M., Berry, F.S., Feiock, R.C. (2009). Understanding the Adoption and Timing of Economic Development Strategies in U.S. Cities Using Innovation and Institutional Analysis. Journal of Public Administration Research and Theory, Volume 19, Issue 4, pp. 967-988.
15. Latvian Rural Forum Competence Center, (2012). Study on Development Opportunities for the Local Food Industry and Support Opportunities for Local Food Producers in Aizkraukle District Partnership Territory. Retrieved: http://www.aizkrauklespartneriba.lv/2015/images/stories/Petijums_ARP_Final_1.pdf. Access: 28.12.2015.
16. Latvian Sustainable Development Guidelines (2002). Retrieved: varam.gov.lv/files/text/Darb_jomas//pamatnostadnes.doc. Access: 03.01.201
17. Law on Local Governments, (1994). Retrieved: http://likumi.lv/doc.php?id=57255. Access: 13.12.2015.
18. Lescevica, M. (2005). Opportunities for Developing the Rural Entrepreneurship Environment in Latvia. PhD paper. Retrieved: http://llufb.llu.lv/dissertation-summary/enterprises/Maira_Lescevica_a-l.pdf. Access: 04.01.2016.
19. Martinez, S., Hand, M., Da Par, M., Pollack, S., Ralston, K, Smith, T., Vogel, S., Clark, S., Lohr, L., Low, S., Newman, C. (2010). Local Food Systems. Concepts, Impacts, and Issues. United States Department of Agriculture, Economic Research Service. Economic Research Report, Number 97, May 2010, p.87.
20. Pringle, A. (2013). The Power of Purchasing: The Economic Impacts of Local Procurement. Columbia Institute. LOCO BC. ISIS Research Centre. May 2013. p.18. Retrieved: http://locobc.com/wp-content/uploads/Local_Procurement_FinalforWeb.pdf. Access: 27.12.2015.
21. State Regional Development Agency (2012). Handbook for Municipalities for Work with the EU Funds. p. 25. Retrieved: http://www.vraa.gov.lv/uploads/Par%20mums/rokasgramata_pasv-es-fondu-projekti-03-02-2012.pdf. Access: 12.12.2015.
22. The Ministry of Environmental Protection and Regional Development (2013). Informative material on the municipal facilities to promote business, p.187 Retrieved: http://www.varam.gov.lv/lat/publ/met/pasv/. Access: 12.12.2015.
23. United States Department of Agriculture (2012). Know Your Farmer, Know Your Food. Compass, p.80. Retrieved: http://www.usda.gov/documents/KYFCompass.pdf. Access: 02.01.2016.
Proceedings of the 2016 International Conference “ECONOMIC SCIENCE FOR RURAL DEVELOPMENT” No 41
Jelgava, LLU ESAF, 21-22 April 2016, pp. 104-113
1Corresponding author. Tel.: +48 9144 96980; fax: +48 9144 96980. e-mail address: [email protected] 104 2Corresponding author. Tel.: +48 9144 96980; fax: +48 9144 96980. E-mail address: [email protected]
DIRECTIONS OF DEVELOPMENT OF REGIONAL POLICY WITHIN THE FRAMEWORK OF THE LOCAL DEVELOPMENT STRATEGY FOR RURAL AREAS
Antoni Mickiewicz1, PhD, professor; Bartosz Mickiewicz1 PhD, professor
1Faculty of Economics, West Pomeranian University of Technology in Szczecin
Abstract. The article discusses the issue of regional policy in the context of the Leader approach, which adopted the
form of a Community-Led Local Development measure. A measure is a new territorial instrument introduced by the
European Commission aiming at the integration of previously dispersed financial instruments connected with the
Cohesion Policy. The new Cohesion Policy aims at reducing disparities in the level of development of various regions as
well as at increasing competitiveness and employment. The Leader approach within the framework of the fourth
priority axis of the RDP 2007-2013 was realized by means of three measures. The evaluation shows that the strategies
prepared by LAGs covered over 50 % of rural areas. The management boards and members of LAGs demonstrated
great involvement in the activities for taking advantage of local resources and the potential of rural areas. LAGs were
primarily involved in the cultivation of traditions, development of tourist services as well as promotion of a healthy
lifestyle. Community-Led Local Development is a new territorial instrument introduced by the European Commission to
be implemented in the financial perspective for the years 2014-2020. It was assumed that this instrument should be
based on the Leader approach applied in the years 2007-2013 under the Common Agricultural Policy and it should
preserve its fundamental provisions. CLLD is an instrument aiming at performing the partnership agreement and
introducing programmes for the effective implementation of the Cohesion Policy provisions. New measures include
preparatory support constituting a bridge between the realization of the LDS from the period of 2007-2013 and a new
2014-2020 programming period.
Key words: local development strategy, local action group, community-led local development.
JEL code: Q18
Introduction
Regional policy constitutes an investment
strategy involving all regions whose aim is to
increase economic growth, develop
competitiveness as well as to enhance
inhabitants’ quality of life. The main objective of
regional policy is to provide support for less
developed regions. Therefore, the programme
constitutes an expression of solidarity between
the EU Member States as most resources
available within its framework are allocated for
regions being at the lowest level of development.
It helps the abovementioned regions to unleash
the hidden economic potential, which is of
particular importance in the context of
inequalities between regions as well as between
individual areas of Member States (Haugh,
2007). Therefore, the essence of the EU regional
policy relates to the regional integrating
approach. The aim of the regional policy is to
reconstruct the socio-economic structure in the
poorest regions of the EU countries leading to the
increase in the socio-economic cohesion of the
Community and, hence, to optimization of
resources utilisation as well as to enhancement of
competitiveness and economic modernization
with the aim to improve the effectiveness of
integration processes. An integral part of the EU
regional policy is its cohesive mechanism of
influencing social and economic development of
both regions and member states (Herbert-
Cheshirea, Higgins, 2004). The development
policy of regional policy in Western countries is
primarily based on strategies developed by the
society which aim to manage the risk and
facilitate the change at the local level with the
minimal direct state intervention. It is commonly
assumed that such development strategies give
local population more influence on transforming
their community and are, thus, a good way to
enhance the position of the region. The role of
knowledge is of considerable importance in
determining directions of changes, management
and specification of the limits of financial support
by the community in a given region (European
Structural, 2014).
Proceedings of the 2016 International Conference “ECONOMIC SCIENCE FOR RURAL DEVELOPMENT” No 41
Jelgava, LLU ESAF, 21-22 April 2016, pp. 104-113
1Corresponding author. Tel.: +48 9144 96980; fax: +48 9144 96980. e-mail address: [email protected] 105 2Corresponding author. Tel.: +48 9144 96980; fax: +48 9144 96980. E-mail address: [email protected]
Various directions of taking bottom-up
initiatives have been pointed out within the
framework of regional policy implementation.
Apart from entrepreneurship and employment,
they involve more and more frequently rural
tourism perceived as the way to enhance
profitability of marginalized areas, stimulate
community renewal and to improve living
conditions of rural communities. The current
trends of tourism flows intend to explore
traditional objects untouched by the renovation
and reflecting the former way of life and
existence of rural communities (Briedenhann,
Wickens, 2004).
Research results and discussion
Regional policy is defined as support provided
for less developed areas. It originated as a result
of different historical occurrences. The aim of
regional policy is to support problematic regions
by reducing spatial disparities. On the conditions
of dispersed rural areas, steps have been
undertaken to increase competitiveness of the
regions on the basis of a bottom-up initiative.
Therefore, the Leader approach has been a
significant element of a rural development policy
in the EU for over 20 years leading to the
convergence of regions and territorial cooperation
and, apart from the Cohesion Funds, it has been
also financed by the European Agricultural Fund
for Rural Development (EAFRD) since 2007. The
initiative undertaken by the Community in the
scope of shaping rural areas contributed to the
development of new methods of action with the
participation of local partners. Among a number
of objectives specified in the programme, Leader
focuses mainly on supporting employment and
improving the quality of life in rural areas. More
broadly, the aims of the programme reflect the
new EU strategy, in the context of the
Multiannual Financial Framework, which specifies
the vision of the European social market
economy in connection with the enhancement of
regional competitiveness and increase of
employment.
The main aim of the article is to outline the
implementation of a new - for Polish conditions -
measure related to building local partnership.
Polish rural areas had no previous experience in
building supragmina communities, which
undertake initiatives addressed not only to
immediate surroundings but also to a broader
local community. Moreover, the article aims to
present a new approach, Community-Led Local
Development (CLLD), which is based not only on
financial instruments of the EAFRD and Common
Fisheries Policy (CFP) but also on the Cohesion
Funds. The experience gained so far indicates
that the Leader approach for local development
has proved to be effective in supporting rural
development by taking into account the needs of
numerous socially diverse environments.
The research in its scope was related to the
Leader approach that was implemented both in
the first period of membership in the EU
(2004-2006), being a pilot study then, and in the
full rural development programme in the years
2007-2013 within the framework of the fourth
priority axis of the RDP. In the studies, the
attention has been drawn to the new approach to
the Leader programme, which adopted the form
of Community-Led Local Development
(2014-2020), being the consequence of support
given by four European funds. The results of the
studies were based primarily on rural
development programmes, the Management
Information System of the Agency for
Restructuring and Modernisation of Agriculture
(ARMA) as well as legislation in this scope.
1. Previous experience in building local
action strategies
In the years 1991-1994, the Leader
programme was initiated in the European Union
that was a community initiative aiming at
providing assistance to non-governmental
organisations, which sought cooperation at
regional level. The aim of the Leader approach
was to help implementing modern rural
development strategies. Funds from the Leader
Proceedings of the 2016 International Conference “ECONOMIC SCIENCE FOR RURAL DEVELOPMENT” No 41
Jelgava, LLU ESAF, 21-22 April 2016, pp. 104-113
1Corresponding author. Tel.: +48 9144 96980; fax: +48 9144 96980. e-mail address: [email protected] 106 2Corresponding author. Tel.: +48 9144 96980; fax: +48 9144 96980. E-mail address: [email protected]
programme were earmarked for creating rural
networks and, above all, for the Local Action
Groups (LAGs), forming associations of public or
private partners that jointly undertook innovative
actions connected with rural development.
The Leader project was a programme that
assumed sustainable rural development and took
into consideration innovative actions aiming not
only at altering rural areas but also at respecting
traditional agricultural values and rural cultural
heritage. The project was directed at the issues
of natural environment as well as enhancement
and development of activities of rural local
communities. It was developed as a result of
observations of former numerous negative
phenomena, which occurred after strong rural
industrialization, excessive concentration of
production and a range of other unfavourable
processes taking place in rural areas and
agriculture. The project allowed for solving
problems through coordinated cooperation of
various sectors, including local authorities and
entrepreneurs, non-governmental organisations
as well as active individuals from rural areas.
Local Action Groups originated as forms of
public–private partnerships with the aim to
launch initiatives in the area of social activity that
are not reflected in other EU programmes. They
were classified as groups of non-governmental
organisations of specific character and function
that preserve the form of local partnership and
take care of sustainable rural development at the
same time.
In Poland, the pilot study Leader+ was
introduced in the years 2004-2006 that was
financed from the Sectoral Operational
Programme. Participation in the programme was
allowed for local governments of rural and rural-
urban gminas or their unions and legal persons
such as foundations, associations and their
unions as well as non-governmental
organisations. Experience connected with the
realization of the LEADER+ programme was rated
highly in most countries and commonly
introduced to the new rural development policy
for the years 2007-2013. In Poland this
programme was included in the fourth priority
axis Leader involving three detailed measures.
Assistance in this scope has been granted
pursuant to Council Regulation (EC) No
1698/2005 as amended. The level of financial
support was determined at EUR 1190.6 million,
including EUR 1023.6 million (86.0 %) for the
project “Implementation of local development
strategies”, EUR 15.0 million (1.2 %) for
“Implementation of cooperation projects” as well
as EUR 152.0 million (12.8 %) for the project
“Running the local action group, acquisition of
skills and activations”. The LAG action plan
embraced 50 % of rural areas meeting the
requirements of the LEADER approach, whereas
the number of new LAGs was increased to 50 %
in relation to the previous plan from the years
2004-2006. The aim of the fourth axis was to
activate the inhabitants of rural areas through
building social potential there, increasing the
volume of obtained financial resources as well as
improving the management of local human
resources.
Council Regulation (EC) No 1698/2005
determined that the approach to LEADER
programme should comprise the following
elements: 1) area-based local development
strategies intended for well-identified subregional
rural territories; 2) local public-private
partnerships, 3) bottom-up approach with a
decision-making power for local action groups,
4) multi-sectoral design and implementation of
the strategies based on the interaction between
participants and projects from different sectors of
the local economy (Council Regulation, 2005).
The regulation of the Minister for Agriculture
and Rural Development from 2008 on the
detailed criteria and the way of choosing a local
action group to implement a local development
strategy within the framework of the RDP
2007-2013 provides that in order to implement
the local development strategy, hereinafter
Proceedings of the 2016 International Conference “ECONOMIC SCIENCE FOR RURAL DEVELOPMENT” No 41
Jelgava, LLU ESAF, 21-22 April 2016, pp. 104-113
1Corresponding author. Tel.: +48 9144 96980; fax: +48 9144 96980. e-mail address: [email protected] 107 2Corresponding author. Tel.: +48 9144 96980; fax: +48 9144 96980. E-mail address: [email protected]
referred to as ‘LDS’, LAG can be chosen if all
gminas, whose area is covered by LDS, are its
members and partners. Members of LAG can be
public, social and economic sector entities. In
turn, the area embraced by the local
development strategy needs to be spatially
coherent as well as involve a sufficiently large
number of gminas and inhabitants, that is over
10 thousand and no more than 150 thousand
inhabitants (Regulation of the Ministry of
Agriculture and Rural Development (MRiRW),
2008).
Implementation of the action plan within the
framework of the fourth priority axis of the RDP
2007-2013
In view of the fact that rural inhabitants in the
area of LAG could apply for financing in the scope
of such actions as: 1) village renewal and
development, 2) creation and development of
micro-enterprises, 3) diversification into non-
agricultural activities as well as within the
framework of the so called small projects, there
was a necessity to appoint a competent decision-
making body, which was responsible for the
selection of these projects and it was also
necessary to separate decision-making function
from the management function. Another relevant
issue was the composition of the decision-making
body, in which the representatives of social and
economic sectors should constitute at least 50%
in total. Otherwise, the partnership could not
meet the eligibility criteria. Local development
strategy (LDS) also embraced the provisions
specifying the procedures assessing conformity of
the projects with these documents as well as the
procedures and criteria of projects selection. It
was also necessary to specify the rules of
excluding a member of a decision-making body
from the participation in making choices
concerning the projects in case of any doubts as
to their impartiality, particularly in the case when
such a member applied for co-financing of the
project. If LAGs met all these criteria and
obtained a required number of points, they were
chosen by the implementing authority – Local
Government of the province – to implement the
local development strategy they had developed.
The beneficiaries involved local action groups that
were chosen to implement local development
strategies. Assistance was granted for the
operations consisting in the preparation or
realization of cooperation projects that envisaged
implementation of joint ventures within
interregional and inter-territorial cooperation. The
maximum assistance for LAGs constituted the
product of the number of inhabitants having a
permanent place of residence in the area
embraced by the local development strategy.
In accordance with the principles applied in
the RDP 2007-2013, each Local Action Group had
to prepare a document called Local Development
Strategy (LDS), which included a description of
different aspects of the planned measures.
Contrary to the Leader+ Pilot Programme,
implemented within the Sectoral Operational
Programme (SOP), Local Action Groups had the
possibility to decide about the choice of projects
aimed at financing other measures included in
the RDP 2007-3013. The Group was obliged to
develop a programme of joint measures in the
form of the Local Development Strategy
document. The document included such thematic
areas as improving the quality of life in rural
areas, creation of non-agricultural jobs,
activating people, building social capital as well
as the use of natural and cultural resources in
local development (RDP, 2007).
The first measure related to the
implementation of local development strategies
shall be considered in the light of participation in
the realisation of projects specified in the third
priority axis. Moreover, LAGs could participate in
the so called ‘small projects’, which were related,
among others, to agro-tourism development,
promotion and development of local cultural and
artistic creativity, initiating the processing of
natural resources and agricultural products,
organisation of recreational and sports events as
Proceedings of the 2016 International Conference “ECONOMIC SCIENCE FOR RURAL DEVELOPMENT” No 41
Jelgava, LLU ESAF, 21-22 April 2016, pp. 104-113
1Corresponding author. Tel.: +48 9144 96980; fax: +48 9144 96980. e-mail address: [email protected] 108 2Corresponding author. Tel.: +48 9144 96980; fax: +48 9144 96980. E-mail address: [email protected]
well as other events directed at rural areas. In
order to implement the above measure
28.8 thousand applications were filed for the
amount of PLN 636.4 million.
The second measure was devoted to the
implementation of cooperation projects, which
served as a tool to prepare the concept of a
project or to implement it. The measure was
intended to help LAGs establish interregional and
even international cooperation and in this way it
fulfilled the auxiliary role to other projects
included in the fourth thematic axis. A large
number of tasks that LAGs were supposed to
realize in Poland in this period of the programme
required administrative support that would allow
for serving the beneficiaries efficiently and to
realise the measures related to the
implementation of the RDP 2007-2013. On
account of the limited possibilities of financing,
LAGs had the possibility to apply for additional
financial assistance under this measure. The
refund was granted to the running costs of LAG
administration, costs related to the
implementation of studies concerning the areas
covered by the LDS as well as training of LAGs’
staff, members of the Management Board and
members of the decision-making body. Within
the framework of this refund, LAGs could cover
the costs connected with both the preparation
and implementation of cooperation projects. In
the period under consideration, contracts were
concluded with 459 beneficiaries for the total
amount of PLN 50.1 million.
The third measure, defined as a functioning of
the local action group, acquiring skills and
activation, aimed at providing professional
training for people participating in the
implementation of the local development strategy
as well as at building social capital, which is
equally important. Project providers noticed that
despite huge progress the unwillingness to
cooperate is still visible in rural areas and there is
also a low level of activity. Beneficiaries of this
measure were local action groups, who signed
1170 contracts, and it absorbed
PLN 472.0 million.
It is estimated that the strategies prepared by
LAGs embraced over 50 % of rural areas, which
indicates a large potential of rural inhabitants,
who noticed the value of resources available on
their areas and set some objectives they wanted
to achieve as a result of using them. From the
beginning of LAGs functioning, great involvement
has been observed in activities promoting the use
of local resources and potential of the areas
covered by the strategies. LAGs were particularly
involved in the cultivation of tradition,
development of tourism services as well as
promotion of healthy lifestyle. Measures at the
level of local partnership increased the sense of
belonging to a local community among the
inhabitants of rural areas and fostered realisation
of projects for the development of their regions.
The new regional development strategy in the
financial perspective 2014-2020
The new regional development strategy aims
at reducing disparities between the levels of
development of various regions. Among other
objectives, it envisages the adjustment of the
least favoured regions whose development is
lagging behind as well as the areas undergoing
industrial changes or regions of unfavourable
environmental conditions. The fundamental
assumption states that in the enlarged EU
economic, social and territorial disparities have
increased at both regional and a national level.
For this purpose, objective criteria have been
specified for designating eligible regions and
areas (NUTS2). The regions, whose gross
domestic product GDP per capita, measured in
purchasing power parities, is less than 75 % of
the community average is subject to convergence
objectives. In this way, the objectives of regional
development aim to facilitate diversification and
create new small enterprises and jobs. The
objectives of regional development directions
involve promoting local development in rural
areas, improving access to use tourist values as
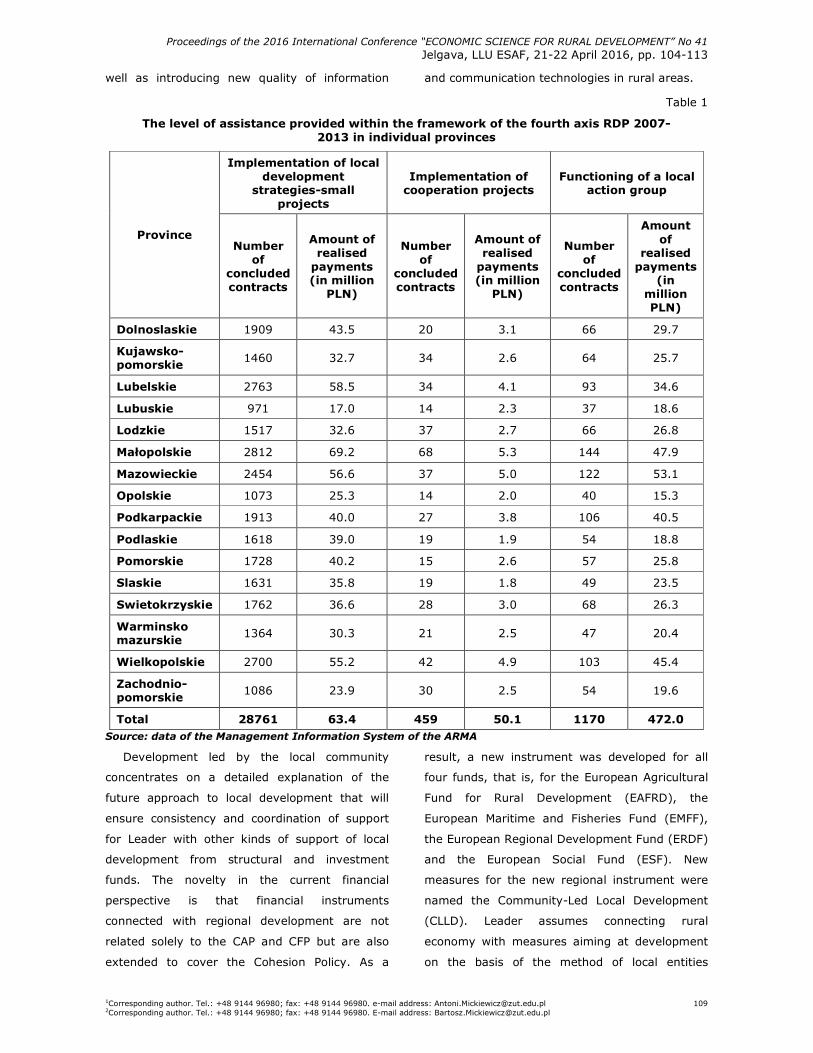
Proceedings of the 2016 International Conference “ECONOMIC SCIENCE FOR RURAL DEVELOPMENT” No 41
Jelgava, LLU ESAF, 21-22 April 2016, pp. 104-113
1Corresponding author. Tel.: +48 9144 96980; fax: +48 9144 96980. e-mail address: [email protected] 109 2Corresponding author. Tel.: +48 9144 96980; fax: +48 9144 96980. E-mail address: [email protected]
well as introducing new quality of information and communication technologies in rural areas.
Table 1
The level of assistance provided within the framework of the fourth axis RDP 2007-2013 in individual provinces
Implementation of local development
strategies-small projects
Implementation of cooperation projects
Functioning of a local action group
Province Number
of concluded contracts
Amount of realised
payments (in million
PLN)
Number of
concluded contracts
Amount of realised
payments (in million
PLN)
Number of
concluded contracts
Amount of
realised payments
(in million PLN)
Dolnoslaskie 1909 43.5 20 3.1 66 29.7
Kujawsko-pomorskie
1460 32.7 34 2.6 64 25.7
Lubelskie 2763 58.5 34 4.1 93 34.6
Lubuskie 971 17.0 14 2.3 37 18.6
Lodzkie 1517 32.6 37 2.7 66 26.8
Małopolskie 2812 69.2 68 5.3 144 47.9
Mazowieckie 2454 56.6 37 5.0 122 53.1
Opolskie 1073 25.3 14 2.0 40 15.3
Podkarpackie 1913 40.0 27 3.8 106 40.5
Podlaskie 1618 39.0 19 1.9 54 18.8
Pomorskie 1728 40.2 15 2.6 57 25.8
Slaskie 1631 35.8 19 1.8 49 23.5
Swietokrzyskie 1762 36.6 28 3.0 68 26.3
Warminsko mazurskie
1364 30.3 21 2.5 47 20.4
Wielkopolskie 2700 55.2 42 4.9 103 45.4
Zachodnio-pomorskie
1086 23.9 30 2.5 54 19.6
Total 28761 63.4 459 50.1 1170 472.0 Source: data of the Management Information System of the ARMA
Development led by the local community
concentrates on a detailed explanation of the
future approach to local development that will
ensure consistency and coordination of support
for Leader with other kinds of support of local
development from structural and investment
funds. The novelty in the current financial
perspective is that financial instruments
connected with regional development are not
related solely to the CAP and CFP but are also
extended to cover the Cohesion Policy. As a
result, a new instrument was developed for all
four funds, that is, for the European Agricultural
Fund for Rural Development (EAFRD), the
European Maritime and Fisheries Fund (EMFF),
the European Regional Development Fund (ERDF)
and the European Social Fund (ESF). New
measures for the new regional instrument were
named the Community-Led Local Development
(CLLD). Leader assumes connecting rural
economy with measures aiming at development
on the basis of the method of local entities
Proceedings of the 2016 International Conference “ECONOMIC SCIENCE FOR RURAL DEVELOPMENT” No 41
Jelgava, LLU ESAF, 21-22 April 2016, pp. 104-113
1Corresponding author. Tel.: +48 9144 96980; fax: +48 9144 96980. e-mail address: [email protected] 110 2Corresponding author. Tel.: +48 9144 96980; fax: +48 9144 96980. E-mail address: [email protected]
development that allow for developing the area
utilising the internal development potential. This
measure is based on the Leader method, applied
in the previous financial perspective 2007-2013
under the second pillar of the Common
Agricultural Policy. It should be noted that
applying the CLLD is obligatory only for the CAP
(minimum 5 % of the EAFRD funds), whereas it
is optional for the remaining funds and depends
on the decision of every EU Member State.
In this sense, the Community-Led Local
Development (CLLD) approach should be
considered the instrument which, under the
financial perspective for the years 2014-2020,
allows for applying the Leader method also in the
broader context of the Cohesion Policy.
Therefore, the CLLD approach embraces the
fundamental principles of the Leader method,
that is, the bottom-up strategy through the broad
involvement of the local community in creation
and implementation of the strategy; territoriality,
which is a local development strategy prepared
for a given, coherent area; integration, consisting
in combining different areas of economy;
cooperation of various groups of interest;
partnership, with the involvement of different
entities from the public, social and economic
sector; innovation as well as decentralisation of
management and financing.
In accordance with the regulation adopted in
2013 by the EP and the Council, the Community-
Led Local Development shall be focused on
specific sub-regional areas and must be led by
local action groups composed of representatives
of public authorities, local social and economic
partners as well as inhabitants and, at the
decision-making level, neither public authorities –
as defined in line with national rules – nor any
single interest group can hold more than 49% of
the voting rights. Local development shall be
carried out through integrated and multi-sectoral
area-based local development strategies
designed taking into consideration local needs
and potential and shall include innovative
features in the local context, networking and,
where appropriate, cooperation (Regulation of
the EP and the Council from 2013).
Furthermore, the regulation of the EP and the
Council from 2013 defines the local development
strategy, which contains the following elements:
specification of the area and population covered
by the strategy, an analysis of the development
needs and potential of the area, a description of
the strategy and its objectives as well as a
description of the community involvement in the
preparation of the strategy. Moreover, the scope
of a local development strategy involves also an
action plan demonstrating how objectives are
translated into actions, a description of the
management and monitoring arrangements of
the strategy as well as the financial plan for the
strategy, including the planned allocation from
each of the funds concerned (Regulation of the
EP and the Council from 2013).
Regulatory issues of the Regulation of the
Minister for Agriculture and Rural Development
from 2015
The MARD regulation from 2015 is connected
with the act on the local development with the
participation of a local community (2015), which
provides the legal basis for the implementation of
the community-led local development. The act
defines the measures specified in the programme
for the years 2014-2020 as well as the general
provisions, procedure of granting and
disbursement of financial assistance. In
accordance with the act, the area covered by LDS
shall be spatially coherent and inhabited by no
more than 150 thousand people. Beneficiaries of
the assistance can be natural persons, legal
persons, including, among others, machinery
rings, local government units, excluding
provinces, their partnerships or organisational
units, non-governmental organisations,
cooperatives as well as non-incorporated
organisational units having legal capacity under
the acts (Act, 2015).
Proceedings of the 2016 International Conference “ECONOMIC SCIENCE FOR RURAL DEVELOPMENT” No 41
Jelgava, LLU ESAF, 21-22 April 2016, pp. 104-113
1Corresponding author. Tel.: +48 9144 96980; fax: +48 9144 96980. e-mail address: [email protected] 111 2Corresponding author. Tel.: +48 9144 96980; fax: +48 9144 96980. E-mail address: [email protected]
One of the conditions of granting assistance
for natural persons is the confirmation of the
place of residence on the area of local
development strategy implementation.
Confirmation of this fact constitutes a kind of
assurance that the assistance will be granted for
people who permanently stay connected with the
given community and a rural area. For the same
purpose the requirement was introduced to prove
that the head office of the legal person is situated
on the LDS area. LAGs may obtain financial
assistance for their own projects and grant
projects. Under the grant projects the support is
also foreseen for non-incorporated organisational
units, in particular for farmer’s wives’
associations, being the separate organisational
units of machinery rings (MARD Regulation,
2015).
Instruments of financial support are provided
for specific operations aiming mainly at
strengthening social capital, including expanding
the knowledge of a local community in the scope
of environmental protection and climate change.
An important objective is the development of
entrepreneurship, incubators of local processing
or enhancing the cooperation between the
entities conducting business activities on the
rural area embraced by LDS. A new issue relates
to promoting the so called short supply chains,
development of markets and local services,
provision of tourist services or building publicly
available and non-commercial recreational or
cultural infrastructure. The amount of granted
assistance depends on the aim, whereas one
grant project cannot exceed PLN 300 000, LAG
cannot exceed PLN 50 000 for its one operation
and PLN 500 000 cannot be exceeded for creating
a local processing incubator.
An important measure related to the
community led local development strategy
requires appropriate support. The fundamental
form of support is the refund of eligible costs that
will be granted in the form of a lump sum
payment in two tranches. The first tranche will be
provided in the amount of 70 % of the assistance
granted, whereas the second tranche will be paid
after the implementation of a business plan. Such
a solution aims at living up to the expectations of
a local community that had to take out a loan in
the previous perspective in order to implement
the obligation. The amount of support is adjusted
to local market conditions and cannot exceed PLN
100 000 for a local action group. An important
issue concerning fixing and calculating the aid
amount is determination of eligible costs. They
comprise the value of the contribution in kind,
including the value of services, construction
works, goods, land, properties and even the
value of the contributed work.
The scope of the support foresees the
possibility to grant the assistance for the
development of entrepreneurship by creating
food businesses, whose infrastructure could be
used by agricultural producers or small producers
called incubators of local processing. A definition
of a food processing incubator provides that they
are created for small producers, whose business
activity is too small to invest in their own
technological lines. Moreover, the idea of an
incubator should be based on establishing a legal
personality in the form of an association or a
cooperative.
Building a partnership such as LAGs and
creating strategies consists usually in a
progressive inclusion of new groups of interest,
social and professional environments as well as in
expanding the representation of a partnership to
include these groups and environments. This
process should not finish upon the submission of
an application for the selection of the LDS. A LAG
partnership should be rather perceived as a
dynamic entity, which adjusts itself to specific
local features. Therefore, the structure of a
partnership should indicate how it reflects the
character and direction of the strategy.
In the period of 2014-2020, the legal form of
a partnership, which is a local action group, is a
‘special’ association with legal personality. This
Proceedings of the 2016 International Conference “ECONOMIC SCIENCE FOR RURAL DEVELOPMENT” No 41
Jelgava, LLU ESAF, 21-22 April 2016, pp. 104-113
1Corresponding author. Tel.: +48 9144 96980; fax: +48 9144 96980. e-mail address: [email protected] 112 2Corresponding author. Tel.: +48 9144 96980; fax: +48 9144 96980. E-mail address: [email protected]
organisational and legal form, universal for all
LAGs, was introduced to the national legal
system with the act from 2007 on support for
rural development co-financed by the EAFRD. In
such an association, apart from natural persons,
ordinary members can be legal persons, including
local government units but excluding provinces.
It is supervised by the Marshall of the province
and can conduct a business activity aiming at the
implementation of the LDS. In addition, in such
an association, apart from the General Meeting of
the members, the Management Board and the
internal control body, there is a Council being an
additional body, which makes decisions
concerning the selection of operations under the
LDS.
Taking the provisions of the programme into
consideration, the level of assistance for public
sector units from the Fund was determined at the
level of 63.63 % of eligible costs. The required
national public contribution amounts to 36.37 %
and should come from the beneficiary’s own
means. In the case of the operations connected
with developing entrepreneurship, the level of
financial assistance was determined at the level
of 50 % of eligible costs. For other operations,
realised mainly by non-governmental
organisations, the assistance level is higher and
is assumed to constitute 80 % of eligible costs.
In total, the expenditures from the Fund will
amount to EUR 735.0 million (80.9 %) for the
implementation of operations under the LDS,
EUR 15.0 million (2.0 %) for the preparation and
realisation of measures in the scope of local
action groups’ cooperation as well as
EUR 117.2 million (15.9 %) for current
expenditures and activation.
Conclusions, proposals, recommendations
1) Community-Led Local Development is a
new territorial instrument introduced by the
European Commission aiming at the
integration of dispersed financial instruments
related to the Cohesion Policy. CLLD was
introduced to implement various measures
included in the multiannual financial
perspective for the years 2014-2020. It is
assumed that this instrument is based on the
Leader approach implemented in the years
2007-2013 under the Common Agricultural
Policy and it follows its fundamental
provisions. CLLD is an instrument aiming at
performing the partnership agreement and
introducing programmes for the effective
implementation of the Cohesion Policy
provisions. Decisions to implement the Leader
approach resulted from the assessment of
effectiveness, efficiency and adequacy of this
instrument to realise the objectives adopted in
the documents developed at a local level. New
measures include the preparatory support
constituting a bridge between the realisation
of the LDS from the period of 2007-2013 and
a new 2014-2020 programming period.
2) Previous experience from the realization of
the Leader approach helped for creation of
strategies for a local community and led to
village renewal. Communities gained the
access to new knowledge, competence and
skills that enabled them to realise the bottom-
up ideas, previously unnoticed by top-down
management bodies. LAGs helped
communities and local government units
develop communication skills, the ability to
express opinions as well as the sense of
shared responsibility for their own
development. The Leader programme resulted
in the increase in the participation of local
communities in implementing programmes
and managing the given area. It is expected
that the realization of CLLD will lead to the
social capital increase enabling greater social
participation. When programming the Leader
approach it was assumed that social capital
constitutes the basis for the development of
civil society. CLLD was designed taking local
needs into consideration, bearing in mind
innovative context that leads to developing
contact networks and close cooperation.
Proceedings of the 2016 International Conference “ECONOMIC SCIENCE FOR RURAL DEVELOPMENT” No 41
Jelgava, LLU ESAF, 21-22 April 2016, pp. 104-113
1Corresponding author. Tel.: +48 9144 96980; fax: +48 9144 96980. e-mail address: [email protected] 113 2Corresponding author. Tel.: +48 9144 96980; fax: +48 9144 96980. E-mail address: [email protected]
Bibliography
1. Briedenhann J., Wickens E. (2004). Tourism Routes as a tool for the Economic Development of Rural Areas - Vibrant Hope or Impossible Dream? Tourism Management, Volume 25, Issue 1. Buckinghamshire Chilterns University College, Wellesbourne Campus, HP13 5BB, High Wycombe, UK, pp. 71-79.
2. Council Regulation (EC) No 1698/2005 of 20 September 2005 on Support for Rural Development by the European Agricultural Fund for Rural Development (EAFRD). (2005). European Committee, Brussels, p. 40.
3. European Structural and Investment Funds Guidance for Member States and Programmer Authorities. (2014). Guidance on Community-led Local Development in European Structural and Investment Funds. Version 3. European Committee, Brussels, p. 37.
4. Haugh H. (2007). Community-Led Social Venture Creation. Entrepreneurship Theory and Practice, Volume 31, Issue 2, pp. 161-82
5. Herbert-Cheshirea L., Higgins V. (2004). From Risky to Responsible: Expert Knowledge and the Governing of Community-led Rural Development. Journal of Rural Studies, Volume 20, Issue 2, pp. 289-302.
6. Regulation (EU) No 1303/2013 of the European Parliament and of the Council of 17 December 2013 Laying Down Common Provisions on the European Regional Development Fund, the European Social Fund, the Cohesion Fund, the European Agricultural Fund for Rural Development and the European Maritime and Fisheries Fund and Laying Down General Provisions on the European Regional Development Fund, the European Social Fund, the Cohesion Fund and the European Maritime and Fisheries Fund and repealing Council Regulation (EC) No 1083/2006. (2006). Official Journal of the European Union L347/320, Brussels, p. 382.
7. Regulation of the Minister of Agriculture and Rural Development of 23 May 2008 on Detailed Criteria and Selection of a Local Action Group to Implement the Local Development Strategy under the RDP 2007-2013. (2008). Ministry of Agriculture and Rural Development, Warsaw, p. 111.
8. Regulation of the Minister of Agriculture and Rural Development of 24 September 2015 on Detailed Conditions and Procedures of Granting Financial Assistance under the Sub-measure “Support for Implementing Operations under the Community-led Local Development Strategy” Covered by the Rural Development Programme for the Years 2014-2020. (2015). Ministry of Agriculture and Rural Development, Warsaw, p. 153.
9. The Rural Development Programme 2007-2013. (2007). Ministry of Agriculture and Rural Development, Warsaw, p. 288.
Proceedings of the 2016 International Conference “ECONOMIC SCIENCE FOR RURAL DEVELOPMENT” No 41
Jelgava, LLU ESAF, 21-22 April 2016, pp. 114-122
1Corresponding author. Tel.: +48 9144 96980; fax: +48 9144 96980. E-mail address: [email protected] 114 3Corresponding author. Tel.: +48 9144 96980; fax: +48 9144 96980. E-mail address: [email protected] 3Corresponding author. Tel.: +48 601 072143; fax: +48 9144 96980. E-mail address: [email protected]
THE NEW PHENOMENA IN THE ORGANIC FARMING IN THE CONTEXT OF ACTIONS INCLUDED IN THE 2014-2020 RURAL DEVELOPMENT PROGRAMME (RDP)
Anthony Mickiewicz1, PhD, Professor; Bartosz Mickiewicz1, PhD, Professor;
Robert Jurczak1, PhD
1Faculty of Economics, West Pomeranian University of Technology in Szczecin
Abstract. The study describes the effects of the organic farming in the current 2014-2020 financial perspective, which
were chosen from the agri-environmental action. The action is addressed to farmers who want to put their production
onto organic tracks. In this respect they receive an advisory support from agri-environmental services and a financial
support as a compensation for the lost income. There are two stages in the process of becoming an organic farmer. In
the first stage, which involves changing (conversion) of the production, a farmer must give up agrochemicals and
adopt practices and methods prevailing in this field. In the second stage, he/she enjoys the status of an organic
farmer to the full extent. A farm is subjected to the guidelines from the Council Regulation (EC) No 834 of 2007 and to
the control by certification bodies. The amount of financial support instruments depends on the farm size, type of
production and stage of conversion.
Key words: organic farming, financial support, adjustment of production.
JEL code: Q18
Introduction
In recent years, the West Pomeranian
University of Technology in Szczecin is moving
decisively toward the organic farming. The
documents on changes, expressed pointedly in
the positions of the EP and EU Council of 2010 on
"the Common Agricultural Policy (CAP) of the
European Union towards 2020 - meeting the
food, natural resources and territorial challenges"
indicate this direction. Green growth in the
agricultural sector and rural economy means
striving for economic growth without
environmental degradation based on the
innovative production methods. Ecology is also a
way to improve the quality of life in rural areas.
According to these documents the green growth
should be promoted through innovation, which
requires the use of new technologies, creation of
new products, change of production processes,
and support of new patterns of demand. The
ecological production should contribute to
mitigating the effects of climate and adapting of
agriculture to climate change (Meredith, Willer,
2014).
The organic farming has relatively quickly
become a subject of interest to many in the
scientific community. According to Lampkin, the
aim of the organic farming is to create the
integrated, humane environment and
economically sustainable production systems that
rely mainly on the use of renewable agricultural
resources (Lampkin, 1999). As part of the
ecological processes the agriculture should aim to
ensure an acceptable level of plants and animals,
provide a natural protection against pests and
diseases, and the appropriate methods of
production. The basic objectives of sustainable
development of agriculture are assessed as part
of the mainstream aimed at getting rid the
environment of agrochemicals (Jespersen, 2011).
The International Federation of the Organic
Agriculture Movements (IFOAM) (2000) has
defined the organic farming as a process that is
permanently developing a sustainable ecosystem,
in which the climate positively changes and the
natural environment improves. The organic
farming is a form of agriculture that avoids
synthetic ingredients, such as pesticides and
fertilizers, because of their negative effects on
the ecological balance (Lockeretz, 2007).
According to many researchers, the objective of
the environmental policy is to inform consumers
and producers about the benefits of the organic
production (Facts and figures, 2013). The authors
pointed out the importance of supporting the
commercialization of the organic agricultural
products, the ways of allocating the entitlements
and the preferential treatment of the producers
Proceedings of the 2016 International Conference “ECONOMIC SCIENCE FOR RURAL DEVELOPMENT” No 41
Jelgava, LLU ESAF, 21-22 April 2016, pp. 114-122
1Corresponding author. Tel.: +48 9144 96980; fax: +48 9144 96980. E-mail address: [email protected] 115 3Corresponding author. Tel.: +48 9144 96980; fax: +48 9144 96980. E-mail address: [email protected] 3Corresponding author. Tel.: +48 601 072143; fax: +48 9144 96980. E-mail address: [email protected]
who entered the market through the properly
certified products (Bruckner, 2013). It was
pointed out that the authorities, associations,
producer groups and the distribution network
should build credibility among consumers for the
organic farming. The researchers found that the
consumers expected high standards for the
organic production and transparent standards for
its inspection. According to the authors, another
worrying factor is a large demand pressure,
which also increases the risk of an unfair
behaviour or other violations of law. Such actions
harm the interests of the consumers and cause
the economic damage distorting the competition
and adversely affecting the reputation of entities
operating in the organic sector (Bartels,
Neuendorff, 2014; Moschitz, Stolze, Michelsen,
2004).
The problems, objectives and scope of the
study
Since 1991, the EU regulations on the organic
farming accounted for the protection of the
identities of the value-added products bearing
the terms related to the ecology. The organic
farming has been defined in the EU legislation as
an overall system of the farm management and
food production that combines the best
environmental and climate practices, ensuring a
high level of biodiversity, preservation of natural
resources and applied standards of production.
The organic production is an element of the EU
agricultural product quality schemes. In this
perspective, the organic production pursues the
same objectives under the Common Agricultural
Policy, which are an integral part of all the EU
quality schemes for agricultural products
(Regulation of the European Parliament and
Council, 2014). A key reason for interest in the
organic farming policy lies in the increasing
convergence of the ecological agricultural
purposes with the policy objectives regarding the
use of natural resources and sustainable
development. This interest took the form of legal
acts and financial decisions that allowed not only
a verbal promotion of ecology but a specific
support of farmers who have decided to resign
from the intensive production methods and adopt
the rules of the organic farming.
In Poland, the interest in the organic farming
has emerged spontaneously as striving to
achieve the standards of "clean" agricultural
production, mainly defined by the agricultural
associations. By joining the European Union,
Poland has adapted the national legislation to the
EU requirements, issuing in 2004 the Law on the
organic farming. At the same time from the
beginning of the implementation of programmes
(plans) on rural development, the agri-
environment measures were accepted, in which
there appeared the clear definitions of the
organic farming.
The primary aim of the study is to present the
organic farming action included in the Rural
Development Programme for 2014-2020. It is the
first independent action, which appeared in the
Programme with the aim of directing a part of the
farmers onto the tracks of the organic farming.
The farmers, passing onto these tracks, will have
to adapt to the requirements of the Regulation
(EC) No 834 of 2007 for the first time. This action
took its forms on the basis of the EU legislation
and other actions, which operate under the First
Pillar (area payment), and the Second Pillar
(rural development) of the CAP. So the study was
based primarily on the EU and national
documents which are in force in this field.
Besides, the research employed the use of data
from Polish Main Statistical Office and own
research of authors. The main method was
scientific comparison among the analyzed years
and methods of deduction and induction.
Research results and discussion
1. The organic farming in the light of the
European legislation
In the 1980s, in Western Europe the
unconventional production methods began to
gain more and more followers. The consumer
demand for the organically produced agricultural
Proceedings of the 2016 International Conference “ECONOMIC SCIENCE FOR RURAL DEVELOPMENT” No 41
Jelgava, LLU ESAF, 21-22 April 2016, pp. 114-122
1Corresponding author. Tel.: +48 9144 96980; fax: +48 9144 96980. E-mail address: [email protected] 116 3Corresponding author. Tel.: +48 9144 96980; fax: +48 9144 96980. E-mail address: [email protected] 3Corresponding author. Tel.: +48 601 072143; fax: +48 9144 96980. E-mail address: [email protected]
products and foodstuffs favoured the change of
the relationship to production, generating a new
market for agricultural products. It was found at
the moment that the market prices for such
products were higher, with the less intensive use
of land. They started to seek the ways to
distinguish this specific production, which took
the forms of approvals, labelling, certificates and
markings. In 1991, in the Council Regulation
(EEC) the Community rules on production,
labelling and control were developed enabling the
protection of the organic production, ensuring a
fair competition among manufacturers of these
foods. Aspiration to ensure transparency at each
stage of production and processing would lead to
improving the reliability of such production in the
eyes of consumers. It is pointed out that the
organic production entails the significant
restrictions on the use of fertilizers and pesticides
which may have detrimental effects on the
environment (Council Regulation, 1991).
The Council Regulation (EC) No 834 of 2007,
which introduced the new regulations on the
organic farming, and which with some
modifications is in force to this day, was
essential. According to the Council, the organic
farming should function primarily based on the
renewable resources within the framework of the
organized agricultural systems at the local level.
In order to reduce the consumption of the non-
renewable resources, wastes and by-products of
plant and animal origin should be recycled. The
definition saying that the organic production
means the use of the production methods
compatible with the principles laid down in this
Regulation at all stages of production,
preparation and distribution was introduced. The
aim of the new regulations was to determine the
course for the further development of the organic
farming, involving the balanced system of crops
and the high-quality agricultural production
(Council Regulation (EC), 2007).
To achieve the overall objectives of the
organic production you should strive to create a
sustainable management system for agriculture
that takes into account the natural systems and
cycles, also sustains and enhances the health of
soil, water, plants and animals and their balance.
In addition, the organic farming helps in
maintaining of a high level of biodiversity, aimed
at producing a wide variety of foods and other
agricultural products that satisfy the consumer
demands for goods produced by using the
processes that do not pose a threat to the
environment, human health, plant health or
animal health and animal welfare (Council
Regulation (EC), 2007).
The share of the organic farming sector in
recent years showed a dynamic growth, which
accounted for the appearance of factors
conducive to the return of manufacturers to the
natural production methods and the exploration
the qualities of these foods by consumers. In
addition, the reform of the Common Agricultural
Policy sought to adapt the production to market
needs by supplying the high quality products,
which meet the expectations of customers. As
part of the CAP budget the financial support for
the organic farming was provided as well as
indirectly through the actions related to the agri-
environment schemes. This included conversions
which meant the transition from the non organic
to organic farming, labelling of goods,
certification and other actions associated with it
(Regulation of the European Parliament and
Council, 2014).
2. The organic farming in the 2007-2013
agri-environmental Rural Development
Programme (RDP)
In the 2007-2013 RDP, there was no separate
action on the organic farming but it was one of
the 9 packages within the framework of the agri-
environment payments. The aim of the operation
was to improve the environment and rural areas,
particularly to rehabilitate and maintain the
valuable habitats used for agriculture and to
conserve the biodiversity. Within the package on
the organic farming 11 options could be fulfilled,
Proceedings of the 2016 International Conference “ECONOMIC SCIENCE FOR RURAL DEVELOPMENT” No 41
Jelgava, LLU ESAF, 21-22 April 2016, pp. 114-122
1Corresponding author. Tel.: +48 9144 96980; fax: +48 9144 96980. E-mail address: [email protected] 117 3Corresponding author. Tel.: +48 9144 96980; fax: +48 9144 96980. E-mail address: [email protected] 3Corresponding author. Tel.: +48 601 072143; fax: +48 9144 96980. E-mail address: [email protected]
ranging from agricultural crops by cultivation of
herbals, fruits and ending on permanent
grassland. The agri-environmental payment was
paid out in a lump sum and represented the
compensation for the lost income, additional
costs incurred and transaction costs. The agri-
environment payments were granted to farmers
who voluntarily took on the agri-environmental
obligations. An agri-environmental payment was
a multi-year help, paid out annually after
performing a specific set of tasks within a given
variant. The agri-environment payments were
defined per hectare, per livestock unit or per
metre of a linear element. The upper payment
limits are valid with regard to the surface,
depending on the crop, what means that the
support does not exceed the maximum amount
specified in the regulations (the rule of
digressivity). In the case of the organic farming
the package, the agri-environment payments
were granted to the agricultural land used as an
arable land, or meadows, pastures and orchards.
The amount of payments ranged from
PLN 260/ha (permanent grassland) to
PLN 1800/ha (fruit and berry crops) during the
conversion period.
A beneficiary implementing a package of the
organic farming was not required for certification
of products or submission to supervision and
control by the certification bodies. In total, in the
discussed RDP EUR 2.3 billion for the funding was
foreseen, without isolating sums into individual
packages. The estimated number of beneficiaries
is 200.000 without details of the packages as
well. According to the management information
system of the Agency for Restructuring and
Modernisation of Agriculture (ARMA) the expense
of implementation of all packages amounted to
PLN 6.7 billion.
3. The concept of greening in the direct
payments system in the years 2015-2020
Legal regulations related to the area payment
scheme were established by the European
Parliament and Council Regulation (EU) No
1307/2013 from 2015. The EU legislation
introduces the two types of payments, i.e. the
mandatory, which is to be implemented and the
voluntary that depends on the decision of the
state. The single area payments, payments on
greening and payments for young farmers refer
to the mandatory actions. In turn, the payments
for small farms, payments related to the
production and the transitional national support
as well as the additional payments refer to the
voluntary payments (Council Regulation,
2007/2013).
A new phenomenon in the area payments
scheme is granting of payments for agricultural
practices beneficial for the climate and
environment or greening. Greening will be
implemented by using three factors: crop
diversification, maintenance of permanent
grassland (MPG) and maintenance of the
ecological focus areas (EFA). The general rule will
be applied to various derogations. Firstly,
households participating in the small farms
programme will be exempted from the
compliance of greening. In the context of the
application of the diversification crops, they will
use different criteria depending on the size of a
farm. Farms with an area of 10 hectares will be
exempted from the diversification of crops, most
probably with the belief that their function is the
diversity of agricultural activities. Another
approach will be applied to farms with 10 - 30
hectares, which should grow at least two
different crops on agricultural land. Secondly,
farms greater than 30 ha will be required to have
at least three crops on agricultural land. The
policy of MGP and EFA (Ecological Focus Area)
will be used throughout the country, in the
context of occurrence of Natura 2000 sites.
4. Environmental actions in the 2014-2020
Rural Development Programme
The financial support instruments for rural
development were set out by the European
Parliament and the Council Regulation No.
1305/2013. They stressed the need to maintain a
Proceedings of the 2016 International Conference “ECONOMIC SCIENCE FOR RURAL DEVELOPMENT” No 41
Jelgava, LLU ESAF, 21-22 April 2016, pp. 114-122
1Corresponding author. Tel.: +48 9144 96980; fax: +48 9144 96980. E-mail address: [email protected] 118 3Corresponding author. Tel.: +48 9144 96980; fax: +48 9144 96980. E-mail address: [email protected] 3Corresponding author. Tel.: +48 601 072143; fax: +48 9144 96980. E-mail address: [email protected]
synergy between the direct payments (Pillar I of
the CAP) and the rural development policy
(Pillar II of the CAP). The RDP should ensure a
sustainable development, taking into account the
priorities related to the knowledge transfer and
innovation, economic viability, competitiveness
and proper management. There are some
fundamental differences in the process of the
rural development programming. The 2007-2013
RDP was divided into four thematic axes and 22
actions. However, in the 2014-2020 RDP the six
priorities were distinguished and they were
divided into 14 actions, including 30 sub-actions.
Currently, the following six priorities are
determined: 1) facilitation of the knowledge
transfer and innovation in agriculture, forestry
and rural areas, 2) improvement of the
competitiveness of all types of farming and
increase of the viability of farms, 3) improvement
of the food chain organization and promotion of
the risk management in agriculture, 4) creation,
preservation and enhancement of the ecosystems
dependent on agriculture and forestry, 5) support
of the resource efficiency and transition to a low-
carbon economy and climate resilient sectors:
agriculture, food and forestry, 6) promotion of
the social inclusion, poverty reduction and
economic development in the rural areas (RDP,
2014).
Among the pro-ecological actions included in
the 2014-2020 RDP there may be mentioned at
least three ones: 1) agri-environmental and
climate payments, 2) payments to areas facing
natural or other specific constraints, 3) organic
farming. All the actions are focused on the similar
environmental issues but each is characterized by
certain separateness. And so the agri-
environment and climate actions are aimed at
promoting practices that contribute to a
sustainable management of land, protection of
the valuable natural habitats, diversity of the
landscape and protection of the endangered
genetic resources. The agri- environmental and
climate actions in the 2014-2020 RDP in a sense
differ from the similar actions implemented in the
previous financial perspective. The scope of the
requirements was significantly modified and
expanded, and the requirements arising from the
"greening" of the direct payments were
formulated in another way (RDP, 2014).
The second-like activity of the ecological
nature was included in payments to the areas
facing the natural or other specific constraints.
According to the 2014-2020 RDP, this action is
treated as an instrument of the financial support
to farmers who are engaged in farming in the
mountainous areas and other areas facing the
natural or other specific constraints
(unfavourable farming conditions (UFC) areas).
The implementation of this action is intended to
facilitate the farmers to continue the agricultural
use of land and shall also enable the preservation
of a rural landscape and the maintenance and
promotion of the sustainable systems of
agricultural activities in these areas. The support
should affect the maintenance of the viability of
the rural areas and the preservation of the
biodiversity (RDP, 2014).
The performance characteristics of "Organic
farming" in the 2014-2020 Rural Development
Programme
According to the general principles that are
contained in the Act on support for rural
development by the EAFRD of 2015 for all
implementing regulations, the aid is granted to
an individual, a legal person or an organizational
unit without legal personality. The second
important statement therein that the aid is
granted up to a limit of means constituting the
zloty equivalent of the amount specified in the
EAFRD funds earmarked for the specific actions
(sub-actions) plus the amount of the national
public funds. In addition, the minister responsible
for the rural development may determine by
regulation the limits of the resources available in
particular provinces or years through the specific
actions (sub-actions), taking into account the
amount of limits of the resources resulting from
Proceedings of the 2016 International Conference “ECONOMIC SCIENCE FOR RURAL DEVELOPMENT” No 41
Jelgava, LLU ESAF, 21-22 April 2016, pp. 114-122
1Corresponding author. Tel.: +48 9144 96980; fax: +48 9144 96980. E-mail address: [email protected] 119 3Corresponding author. Tel.: +48 9144 96980; fax: +48 9144 96980. E-mail address: [email protected] 3Corresponding author. Tel.: +48 601 072143; fax: +48 9144 96980. E-mail address: [email protected]
the programme, ensuring the sustainable rural
development in particular provinces (Act, 2015).
According to the 2014-2020 RDP data, the
objective of the organic farming is to promote the
voluntary commitments of farmers who
undertake to maintain or move to practices and
methods of the organic farming as defined in the
Council Regulation (EC) No 834/2007. This action
relates to the existing organic farming system in
force in the EU and Poland. A farmer acceding to
this action must be aware that he/she subscribes
to the new way of farming which is characterized
by the transition to more sustainable production
methods, based on the product of biological and
mineral nature, unmanufactured technologically.
The basic principle of the organic farming is
abandonment of use in food production the
means of agricultural, veterinary and food
chemistry. This applies to all types and stages of
production, crops, farming and animal husbandry
and processing (the RDP, 2014). Joining the
group of organic farms is a two-phase process.
Organic production means the application of the
production method compatible with the principles
set out in the regulations at all stages of
production, preparation and distribution. At first a
farm passes to the pre-production otherwise
called the conversion, which means the transition
from the non-organic agriculture to the organic
farming is within a certain period of time. This
period is determined depending on the
environmental situation of a farm.
The second phase indicates a total acceptance
of the organic production methods, which
involves the mandatory annual control, during
which the authorized inspectors of the
certification bodies verify that farmers are in full
compliance with the principles of the organic
farming. The organic payment is granted only if a
farmer produces the agricultural production in
accordance with the rules on the organic farming
and the provisions of the Council Regulation (EC)
No 834 of 2007 on the organic production and
labelling of the organic products.
So obtaining a certificate of compliance to the
organic production methods is associated with
the period of the adjustment (conversion), which
means for a farmer fundamental changes on a
farm. The transition from the conventional
farming to the organic one relies on the
incremental changes, during which the
appropriate succession of plants, thorough
agronomical practices, a rational use of organic
fertilizers, an introduction of catch crops, and in
the case of the animal production - their own
feed and natural additives - are applied.
Organic farms are subject to control by the
inspectors of the organic farming, who represent
a specific certification body. It is adopted as a
standard that a certification body carries out a
physical inspection of all the operators at least
once a year. In order to know the level of the
preparedness of a farm to serve as a producer of
the organic food a certification body may take
samples to test the presence of products not
authorized for the organic production or check
the conformity of the production techniques with
the principles of the organic production. In case
of doubt as to the reliability of the production,
the samples can also be taken and analyzed in
order to detect a possible contamination by
products unauthorized for organic production.
Therefore, such analysis must be carried out also
in case of suspicion in the use of products not
authorized for organic production. After each
visit, a report on the inspection is prepared,
countersigned by the person responsible for the
unit or their representative. In turn, an operator
or a farmer provides an access for a certification
body for control purposes, to all parts of a unit
and all the premises as well as to the accounts
and the relevant supporting documents. In
addition, a farmer is obliged to provide a
certification body with any information
considered essential for all the purposes of
control, in order to determine the extent of
compliance with the standards of the organic
farming. Furthermore, he/she should provide on
Proceedings of the 2016 International Conference “ECONOMIC SCIENCE FOR RURAL DEVELOPMENT” No 41
Jelgava, LLU ESAF, 21-22 April 2016, pp. 114-122
1Corresponding author. Tel.: +48 9144 96980; fax: +48 9144 96980. E-mail address: [email protected] 120 3Corresponding author. Tel.: +48 9144 96980; fax: +48 9144 96980. E-mail address: [email protected] 3Corresponding author. Tel.: +48 601 072143; fax: +48 9144 96980. E-mail address: [email protected]
request the results of their own quality assurance
programmes of the organic products (Council
Regulation, 2007).
The conditions and procedure for granting the
financial assistance under the organic farming
action
The detailed rules for accession to the organic
farming activities are governed by the Regulation
of the Ministry of Agriculture and Rural
Development (MARD) of 2015. A farmer
implementing the environmental commitments
must have a plan for the environmental activities,
which shall be drawn with the participation of an
agri-environmental advisor. A farmer in their plan
has to present the agricultural characteristics of
the farm, to demonstrate the selected packages
(variants) for the implementation and to commit
to keeping the register of the environmental
activities in relation to the agronomic and grazing
actions if one of these is conducted. The
beneficiary must observe the minimum
requirements for fertilizing and plant protection
of the environment (Regulation of MARD, 2015).
The organic farming is in some way a
continuation of the package contained in the
Action on the 2007-2013 agri-environment
payments but with the supervision and control by
the certification bodies. Payments are authorized
only to beneficiaries with a valid certificate issued
by a certification body, which must be renewed
annually. The implementation of the organic
farming is carried out in two stages. The first
stage is a conversion period, which may take up
to 3 years. A farmer is to undertake 5-year
environmental commitments within the available
packages and options.
The level of rates of the environmental
payments
The payments are regarded as a
compensation for the loss of income (loss of the
yield value), and the additional costs incurred
due to a shift to practices and methods of the
organic farming. The costs arise due to more
labour, a higher fuel consumption associated with
the necessity of the mechanical control of weeds
or costs of the manure spreading. The costs will
be increased by the compensation of the
transactional costs, including the cost of an
annual inspection by the certification bodies but
at no more than 20 % of the annual payment
rate. Certification bodies are commercial
companies and for this reason they invoice for
the certification process. The transaction costs
shall be equivalent of the amount ranging from
PLN 900 (up to 5 hectares) to PLN 1500 (over
100 hectares).
The actions in the scope of the organic
farming will be carried out within 12 packages
and 3 options, with 6 packages that cover the
period during the conversion and 6 packages
covering the period after the conversion.
Payments under the packages are granted
annually for a period of five years to farmers who
voluntarily assume the commitment to the
package. An organic payment is granted only if a
farmer produces the agricultural production in
accordance with the rules on the organic farming,
contained in the Council Regulation (EC) No
834/2007 and the Polish regulations on the
organic farming of 2009. The confirmation of the
production takes place in accordance with the
requirements of the legislator issued by the
certification body. The amount of ecological
payments shall be determined by multiplying the
payment rate per hectare of land and the area of
land to which the organic payment is entitled to,
taking into account the reductions or exclusions
arising from the irregularities or discrepancies.
Under the action of the organic farming the
payments are subject to annual reductions
depending on the area declared for the payment.
The following degrees for the reduction are used:
the basic rate of 100 % - for the area of
0.10 hectares to 50 hectares; 75 % of the basic
rate - for the area of over 50 hectares to
100 hectares; 60 % of the basic rate - for the
area of over 100 hectares.
Proceedings of the 2016 International Conference “ECONOMIC SCIENCE FOR RURAL DEVELOPMENT” No 41
Jelgava, LLU ESAF, 21-22 April 2016, pp. 114-122
1Corresponding author. Tel.: +48 9144 96980; fax: +48 9144 96980. E-mail address: [email protected] 121 3Corresponding author. Tel.: +48 9144 96980; fax: +48 9144 96980. E-mail address: [email protected] 3Corresponding author. Tel.: +48 601 072143; fax: +48 9144 96980. E-mail address: [email protected]
Table 1
Rates of environmental payments (PLN/ha)
Types of organic farming During conversion period After conversion period
Agriculture Crops 966 792
Vegetable cultivation 1557 1310
Herbs cultivation 1325 1325
Fruit growing
a. Main fruit growing 1882 1501
b. Berry crops 1882 1501
c. Extensive fruit growing 790 660
Fodder crops on arable land 787 559
Permanent grassland 428 428 Source: Regulation of Ministry of Agriculture and Rural Development of 2015
The rates of the ecological payments vary
depending on the package or option, which are
generally higher in the first difficult period of the
conversion, to thereafter be somewhat narrowed.
Only in two cases the payment rates are not
changed, namely, when it comes to the herbs
cultivation or grassland. According to the EP and
the Council data, the maximum sums and levels
of funding on the organic farming can amount to
EUR 600 per hectare per year for the annual
crops, EUR 900/ha per year for the special multi-
year crops and EUR 450/ha per year for the other
land use (Regulation of the EP and the Council,
2014). The EU funds are implemented in
accordance with the principle of the shared
management between the Member States and
the Union. In the 2014-2020 RDP the amounts of
payments to the organic farming are specified at
EUR 699.9 million, including 445.4 million
(63.63 %) that will come from the EAFRD and
EUR 254.5 million (36.37%) to be allocated from
the budgets of the states. Out of the total
amount of the financial support instruments the
lesser amounts are expected to be spent on
payments to the conversion to the organic
farming (EUR 48.8 million or 7.0 %) but the
higher for the maintenance of the ecological
practices and methods in agriculture
(EUR 651.1 million, or 93.0 %). Alongside with
the payments the areas provided for the organic
farming are specified, including the conversion
period on 138.6 thousand ha and the
maintenance of the ecological production on
543.0 thousand ha.
Conclusion
The organic farming is a specific form of
farming and food production. This food is
produced by natural methods in a clean and safe
environment, without chemical fertilizers and
synthetic pesticides, antibiotics, growth
hormones and genetically modified organisms.
Thanks to the exclusion of pesticides and
fertilizers, there is no pollution of soil and
groundwater. Still leaching of nutrients from soil,
which favours the biodiversity, should be limited.
The organic farming is a system of farming based
on the balanced plant and animal production. It is
based on the natural measures (biological and
mineral) and the technologically unprocessed
products.
In the new 2014-2020 financial perspective,
an independent action under the name of the
organic farming (formerly the package) was
isolated from the agri-environmental action. The
analyzed action introduces a new quality to the
organic farming, through the directional financial
support and building a strategy based on the
opinions of the agri-environmental advisors. The
upgrading of the action is a signal that this form
of the agricultural activity was developing in
Poland at an insufficient pace. At the same time
Proceedings of the 2016 International Conference “ECONOMIC SCIENCE FOR RURAL DEVELOPMENT” No 41
Jelgava, LLU ESAF, 21-22 April 2016, pp. 114-122
1Corresponding author. Tel.: +48 9144 96980; fax: +48 9144 96980. E-mail address: [email protected] 122 3Corresponding author. Tel.: +48 9144 96980; fax: +48 9144 96980. E-mail address: [email protected] 3Corresponding author. Tel.: +48 601 072143; fax: +48 9144 96980. E-mail address: [email protected]
one should be aware that since the 1990s the
now existing organic farms in Poland were
created on their own, using only a partial refund
of the Agency for Restructuring and
Modernisation of Agriculture for invoices issued
by the certification bodies. According to the
Central Statistical Office data (2014), the number
of the certified organic farms in Poland amounted
to 19.9 thou. They occupied a total
of 492.9 thousands ha of arable land, which
accounted for 3.4 % of all arable land in the
country. In addition to that in the transition
period (conversion) there remained 6.7
thousands farms covering 176.9 thousands ha.
This places us at a low level as compared to
other EU countries, including Austria, for
example, in which the organic farming occupies
18.6 % of the agricultural land, in Sweden -
15.8 %, in the Czech Republic -13.1 % and in
Greece – 11 % (Facts and Figures, 2013).
The emergence of the organic farming
activities puts a new light on the previously
functioning organic farms. It raises competition
on the market of the organic products. Probably
only the farmers, who have signed a new
commitment related to the organic farming under
penalty of law in then Council Regulation (EC)
No 834 of 2007, will benefit from a support
scheme. Farmers should meet all the criteria in
the practices and methods of the organic
farming, and at the same time, submit to the
supervision and control by the certification
bodies. From the Regulation of the Ministry of
Agriculture and Rural Development it can be
concluded that the purpose of the action is to
seek out the new supporters of the ecology as
well as the organic farming producers and to bind
them permanently with that type of production.
Bibliography
1. Bartels U., Neuendorff J. (2014). Training on Improved Risk Management Tools for Organic Inspectors. Report: IFOAM Organic World Congress, Istanbul, Turkey, pp. 289-290.
2. Bruckner S. (2013). Analysis of Training Approaches and Concepts in Food and Feed Control and Certification. IRM-Organic Report, Agrizert, pp. 233-234.
3. Council Regulation (EC) No 834/2007 of 28 June 2007 on organic production and labelling of organic products and repealing of Regulation (EEC) No 2092/91. (2007). European Committee, Brussels, p. 153.
4. Council Regulation No 2092/91 of 24 June 1991 on Organic Production of Agricultural Products and Labelling of Agricultural Products and Foodstuffs. (1991). European Economic Community, Brussels, p. 198.
5. European Parliament and Council Regulation (EU) No 1307/2013 of 17 December 2013 in Establishing Rules for Direct Payments to Farmers under Support Schemes under Common Agricultural Policy. (2013). European Committee, Brussels, p. 243.
6. Facts and Figures on Organic Agriculture in the European Union. (2013). DG Agriculture and Rural Development, Unit Economic Analysis of EU Agriculture. Brussels, pp. 108-110.
7. Jespersen L.M. 2011, Organic certification in selected European Countries, Control fees and size of the sector. Report: CERTCOST, Hohenheim, pp. 411-413
8. Lampkin N. (1999). The Organic Farming in the European Union – Overview, Policies and Perspectives. The Organic Farming in the European Union – Perspectives for the 21st Century. Vienna, pp. 1-8.
9. Law of 20 February 2015 on Support for Rural Development with Participation of European Agricultural Fund for Rural Development under Rural Development Programme 2014-2020. (2015). European Committee, Brussels, p. 169.
10. Lockeretz W. (2007) The Organic Farming: an International History. The Development of the Organic Farming in the EU. CABI, Oxfordshire, UK, pp. 1-8.
11. Meredith S., Willer H. (2014). Organic in Europe. Prospects and Developments. IFOAM EU Group, Brussels, p. 212
12. Moschitz H., Stolze M., Michelsen J. (2004). Further Development of the Organic Farming Policy in Europe with Particular Emphasis on EU Enlargement. The European Organic Farming Policy, University of Southern Denmark, p.92
13. Regulation of Minister of Agriculture and Rural Development of March 13, 2015 on Detailed Conditions and Procedures for Granting Financial Assistance under Action "Organic Farming" Included in Rural Development Programme for 2014-2020. (2015). Ministry of Agriculture and Rural Development, Warsaw, p. 68
14. Rural Development Programme for 2007-2013. (2007). Ministry of Agriculture and Rural Development, Warsaw, p. 433.
15. Rural Development Programme for 2014-2020. (2014). Ministry of Agriculture and Rural Development, Warsaw, p. 501.
Proceedings of the 2016 International Conference “ECONOMIC SCIENCE FOR RURAL DEVELOPMENT” No 41
Jelgava, LLU ESAF, 21-22 April 2016, pp. 123-131
1Corresponding author. Tel.:+37163024214 E-mail address: [email protected] 123
ASSESSMENT OF SOCIAL SECURITY IN LATVIA Baiba Mistre1, Mg.oec., Aina Muska1, Dr.oec.
1, 2 Faculty of Economics and Social Development, Latvia University of Agriculture
Abstract. In avoiding social tension and contributing to the wellbeing of society, an essential role is played by the
social security system that protects individuals in the event of social risks and provides individuals incapable of work
with means of existence. The research hypothesis is as follows: there are significant disparities in social security
among municipalities in Latvia. The research aim is to identify social security clusters in Latvia and to determine the
overall development level of each cluster. The term social security is interpreted differently; thus, a classification of
social security elements is not strictly defined. For having a single understanding, the authors suggest using the term
social security in a broader sense, which involves social protection, health care and the promotion of education and
employment, and in a narrow sense, which entails only social protection. The present research revealed that the
indicators of poverty and social exclusion were low for the clusters with low levels of income security, health care and
social protection. However, the same indicators were high for the clusters with high levels of income security, health
care and social protection. The research found that there were no significant differences in the proportions of
budgetary expenditures on social protection in Latvia’s municipalities, while Riga city (Cluster 2) and small
municipalities (in terms of area) with a low social security level (Cluster 5) spent on social protection a greater
proportion of their budgets compared with the other municipalities. There were also no significant differences in social
security between the municipalities belonging to Clusters 1-4 and Clusters 5 and 6.
Key words: social security, social protection, cluster.
JEL code: F5, R5, G00
Introduction
The priority “human resilience” set in the
National Development Plan of Latvia for
2014-2020 (Cross-Sectoral Coordination Centre,
2012) states that “historical experience, social
stratification and crises have negatively
influenced the resilience of many individuals; for
this reason, the government’s objective is to
create conditions for strengthening their
resilience”. The government, taking care about
the resilience of individuals, envisages
contributing to the middle class and the
demographic situation (CSCC, 2012).
In avoiding social tension and contributing to
the wellbeing of society, an essential role is
played by the social security system that protects
individuals in case of social risks and provides
individuals incapable of work with means of
existence.
A number of researchers and organisations
have focused on social security and social
protection problems in Latvia, e.g. A.Grinfelde
(2010), I.Latviete (2012), E.Volskis (2008), the
Free Trade Union Confederation of Latvia (2011)
etc. Social insurance problems were a focus in a
number of studies by the Ministry of Welfare
(Ministry of Welfare, 2015a).
The research object is 119 municipalities in
Latvia (nine republican cities: Riga, Daugavpils,
Jekabpils, Jelgava, Jurmala, Liepaja, Rezekne,
Valmiera and Ventspils and 110 amalgamated
municipalities). The research subject is social
security. In their previous research studies
(Mistre B., Muska A., 2013), the authors have
found that, according to the Central Statistical
Bureau (2015), 110 municipalities of Latvia very
diverse in terms of area, population, population
density, economic profile and economic
development level. The mentioned facts put
forward a hypothesis: there are significant
disparities in social security among municipalities
in Latvia. The research aim is to identify social
security clusters in Latvia and to determine the
overall development level of each cluster.
To achieve the aim, the following specific
research tasks were set:
1) to examine the nature and content of the
term social security;
Proceedings of the 2016 International Conference “ECONOMIC SCIENCE FOR RURAL DEVELOPMENT” No 41
Jelgava, LLU ESAF, 21-22 April 2016, pp. 123-131
1Corresponding author. Tel.:+37163024214 E-mail address: [email protected] 124
2) to identify the social security development
level in the municipalities and republican cities
of Latvia by applying clustering and ranking.
The present research also employed the
monographic method, analysis and synthesis,
deduction and induction as well as multifactor
statistical analysis.
The research used data of the Central
Statistical Bureau (CSB), the State Social
Insurance Agency (SSIA), the Ministry of Welfare
(MoW) and the State Employment Agency (SEA)
as well as findings and deductions of research
studies conducted in Latvia that related to the
problem researched by the authors.
The research novelty involves the
identification of social security clusters in Latvia
and the examination of their overall development
levels.
Research results and discussion
1. Nature and content of social security
Based on the research studies by A. Grinfelde
(2010), I. Latviete (2012), E. Volskis (2008) and
other researchers, the authors find that there is
no single understanding of the terms social
security, social protection and social provision.
Examining the quality of life of pensioners at
national and regional levels in her doctoral thesis
entitled Quality of Life of Pensioners in the
Regions of Latvia, A. Grinfelde (2010) uses the
term social security system, which involves social
protection, health care and social assistance.
However, I. Latviete (2012) finds in her
research on policies made by the Ministry of
Welfare of the Republic of Latvia that one of the
government policy areas is social protection that
involves social insurance, social benefits, social
services and social assistance, while at the same
time ascertaining that the Ministry of Welfare
works on a social policy involving social security,
health care, employment and labour problems.
Her research does not clearly state whether the
terms social protection and social security are
identical.
The Free Trade Union Confederation of Latvia
(2011), examining the term social security and
the nature of social security, finds that social
security usually includes three key systems: the
social insurance system, the system providing
other incomes (usually benefits funded by the
national and local governments and private
organisations) and the system of social services.
After examining the Summary of Court
Practices in Legal Cases on Social Security
Disputes in 2007-2013 by the Supreme Court of
the Republic of Latvia (2014) as well as a
summary of the PhD paper Pension System’s
Development Problems in Latvia by E.Volskis
(2008), the authors find that the term social
provision is used as well. The Summary of Court
Practices in Legal Cases on Social Security
Disputes in 2007-2013 (Supreme Court of the
Republic of Latvia, 2014) states that social
security and social provision are identical terms
and that the key components of the social
provision system are: state social insurance,
social assistance and services and social support.
E. Volskis (2008) believes that complete social
provision should also involve social rights that
include the right to employment, the right to
choose the type and place of an occupation, the
right to fair and favourable working conditions,
the right to social protection in case of
unemployment etc.
The Free Trade Union Confederation of Latvia
(2011) has also identified that in Latvia the term
social security is sometimes replaced with the
term social provision. According to the
researchers, such a replacement is the narrowing
of the term social security. The authors of the
paper also agree with this conclusion. The Free
Trade Union Confederation of Latvia (2011) has
also stated that sometimes the term social
security is used in a general sense of the term
security, integrating the basic needs in the term:
food, clothing, housing, education, income,
availability of health care and at times even
public security.
Proceedings of the 2016 International Conference “ECONOMIC SCIENCE FOR RURAL DEVELOPMENT” No 41
Jelgava, LLU ESAF, 21-22 April 2016, pp. 123-131
1Corresponding author. Tel.:+37163024214 E-mail address: [email protected] 125
The term social protection is used in the
European Union. Social protection is the key
instrument of social assistance, a security net
based on redistribution policies through which
individuals are protected from the financial forms
of social risks and poverty and social exclusion.
According to the European statistical
methodology, social protection involves all
appropriations provided by national and local
government institutions and private organisations
to help individuals in the event of problems of the
following predefined categories: sickness,
disability, old age, survivors, family and children,
unemployment and homelessness. Social
protection also entails the promotion of
employment, pensions and health care. According
to the EU definition, the term social protection is
a synonym for the term social security used in
Latvia’s legal acts (Free Trade Union
Confederation of Latvia, 2011).
In Latvia, the Law On Social Security (1995)
stipulates the principles of formation and
functioning of a social security system, the key
social rights and obligations of persons and the
basic prerequisites for their implementation as
well as the type of social services. However, the
law does not define the term social security but it
specifies the following social rights: promotion of
education and employment, social insurance, the
right to health care, social guarantees associated
with particular circumstances in the case of loss
of health, reimbursement of family expenses,
benefits for the ensuring of a suitable apartment,
assistance for children and youths, social
assistance and involvement of disabled persons
in social life.
The Free Trade Union Confederation of Latvia
(2011) has also declared that social security
elements take different forms in international
practices; thus, the classification of social
security elements may not be strict. The authors
also agree with this opinion.
For having a single understanding, the authors
suggest using the term social security in a
broader and a narrow sense. In a broader sense,
the term social security should involve social
protection, health care and the promotion of
education and employment. In a narrow sense,
social security means social protection that
entails state social insurance, government social
benefits, social assistance and social services that
are funded from the central government basic
budget and the central government special
budget as well as local government budgets.
2. Assessment of social security in the
municipalities of Latvia
A cluster analysis was performed to assess the
social security situation in the municipalities and
republican cities of Latvia. Fifty-seven statistical
indicators, which characterised social security in
the broader sense, i.e. social protection, health
care and the promotion of education and
employment, in 110 municipalities of Latvia and
9 cities in 2014 were selected for the cluster
analysis.
A dispersion analysis (ANOVA), which is part
of the statistical data processing module Cluster
Analysis in SPSS for Windows, showed that
only 22 of the selected 57 indicators were
statistically significant for grouping the
amalgamated municipalities and republican cities
into clusters. The significance level did not
exceed 0.05. The authors did not use the
statistically insignificant indicators in their further
analysis.
Inter-cluster distances indicate associations
between clusters. Clusters with low inter-cluster
distances, if redistributed, can move to the next
level and create new clusters or cluster groups.
Several clustering options were considered
when performing the statistical data analysis. The
most appropriate possibility is to divide Latvia
into six clusters consistent with the social
security level, as then the number of
municipalities and cities of clusters is more even.
In addition to clustering, the clusters were
ranked based on all the statistically significant
Proceedings of the 2016 International Conference “ECONOMIC SCIENCE FOR RURAL DEVELOPMENT” No 41
Jelgava, LLU ESAF, 21-22 April 2016, pp. 123-131
1Corresponding author. Tel.:+37163024214 E-mail address: [email protected] 126
indicators to identify each cluster’s overall
development level relative to that of the other
ones. Furthermore, the authors classified the
statistically significant indicators of social security
into three groups for the purpose of
interpretation of the results:
1) indicators of poverty and social exclusion:
o number of poor individuals (MoW data);
o number of recipients of housing benefits
(MoW data);
o number of recipients of the guaranteed
minimum income level (hereinafter GMI)
(MoW data);
o number of income-tested recipients of
municipal social assistance benefits
(hereinafter social assistance benefits)
(MoW data);
o number of recipients of unemployment
benefits (SSIA data);
o number of long-term unemployed (SEA
data);
o number of unemployed youths aged 15-24
(SEA data);
o number of preretirement age unemployed
(SEA data);
o emigration of individuals, as internal
regional disparities encourage residents
move either to the capital city or abroad
(CSB data);
2) indicators of income security:
o average number of employees in cities and
municipalities (CSB data);
o number of self-employed individuals in cities
and municipalities (CSB data);
o number of recipients of old-age pensions
(SSIA data);
o number of recipients of parents’ benefits
(SSIA data);
o average old-age pension, EUR (SSIA data);
3) indicators of health care and social
protection:
o number of doctors per 10 000 capita
(Health Inspectorate data);
o child mortality (CSB data);
o number of children having received social
rehabilitation services (MoW data);
o number of children (aged under 15) (CSB
data);
o number of employees of municipal
institutions providing social services and
social assistance (MoW data);
o local government budgetary expenditures
on social assistance measures, EUR (MoW
data);
o local government budgetary expenditures
on social protection, EUR (State Regional
Development Agency (hereinafter SRDA)
data);
o personal income tax (hereinafter PIT)
revenues in municipal budgets, EUR (SRDA
data) (Table 1).
The ranking showed that the best situation in
terms of social security was specific to Cluster 1
that included the republican city of Ventspils as
well as Ogre municipality. The only indicator to
be ranked in first position was “average old-age
pension”. Cluster 1 featured small numbers of
long-term unemployed –138 unemployed people
– and unemployed youths – 105 young
individuals, on average.
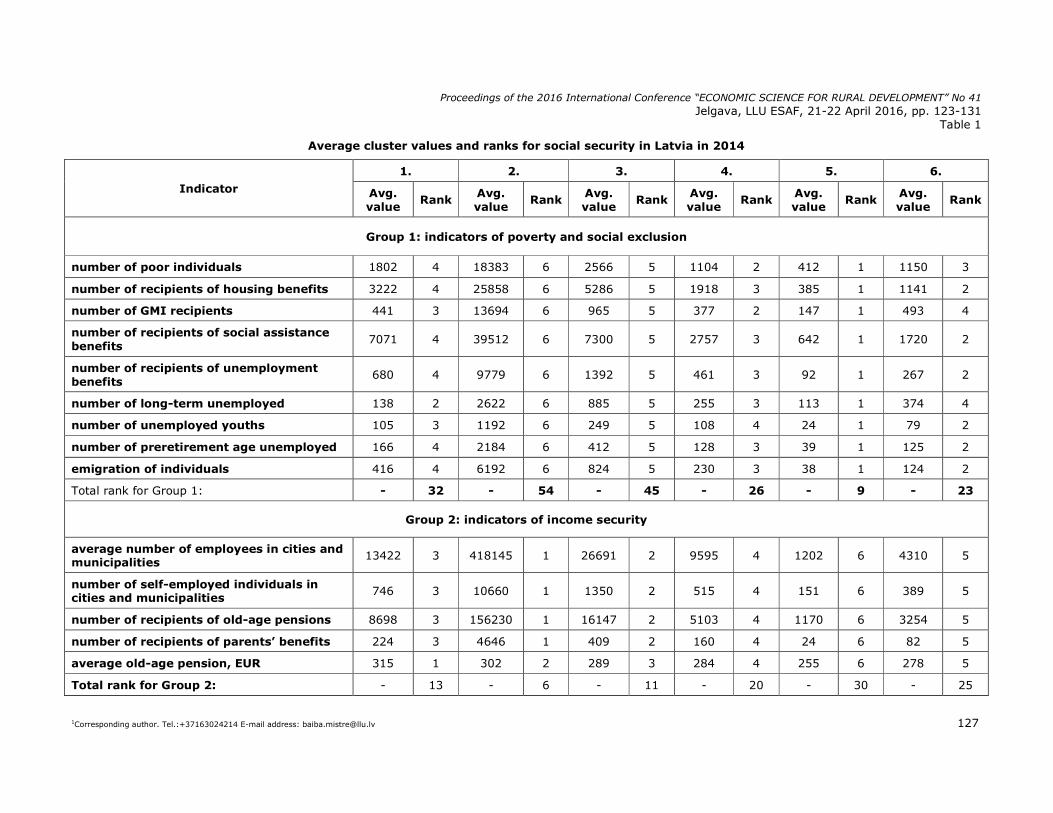
Proceedings of the 2016 International Conference “ECONOMIC SCIENCE FOR RURAL DEVELOPMENT” No 41
Jelgava, LLU ESAF, 21-22 April 2016, pp. 123-131
1Corresponding author. Tel.:+37163024214 E-mail address: [email protected] 127
Table 1
Average cluster values and ranks for social security in Latvia in 2014
1. 2. 3. 4. 5. 6.
Indicator Avg. value
Rank Avg. value
Rank Avg. value
Rank Avg. value
Rank Avg. value
Rank Avg. value
Rank
Group 1: indicators of poverty and social exclusion
number of poor individuals 1802 4 18383 6 2566 5 1104 2 412 1 1150 3
number of recipients of housing benefits 3222 4 25858 6 5286 5 1918 3 385 1 1141 2
number of GMI recipients 441 3 13694 6 965 5 377 2 147 1 493 4
number of recipients of social assistance benefits
7071 4 39512 6 7300 5 2757 3 642 1 1720 2
number of recipients of unemployment benefits
680 4 9779 6 1392 5 461 3 92 1 267 2
number of long-term unemployed 138 2 2622 6 885 5 255 3 113 1 374 4
number of unemployed youths 105 3 1192 6 249 5 108 4 24 1 79 2
number of preretirement age unemployed 166 4 2184 6 412 5 128 3 39 1 125 2
emigration of individuals 416 4 6192 6 824 5 230 3 38 1 124 2
Total rank for Group 1: - 32 - 54 - 45 - 26 - 9 - 23
Group 2: indicators of income security
average number of employees in cities and municipalities
13422 3 418145 1 26691 2 9595 4 1202 6 4310 5
number of self-employed individuals in cities and municipalities
746 3 10660 1 1350 2 515 4 151 6 389 5
number of recipients of old-age pensions 8698 3 156230 1 16147 2 5103 4 1170 6 3254 5
number of recipients of parents’ benefits 224 3 4646 1 409 2 160 4 24 6 82 5
average old-age pension, EUR 315 1 302 2 289 3 284 4 255 6 278 5
Total rank for Group 2: - 13 - 6 - 11 - 20 - 30 - 25
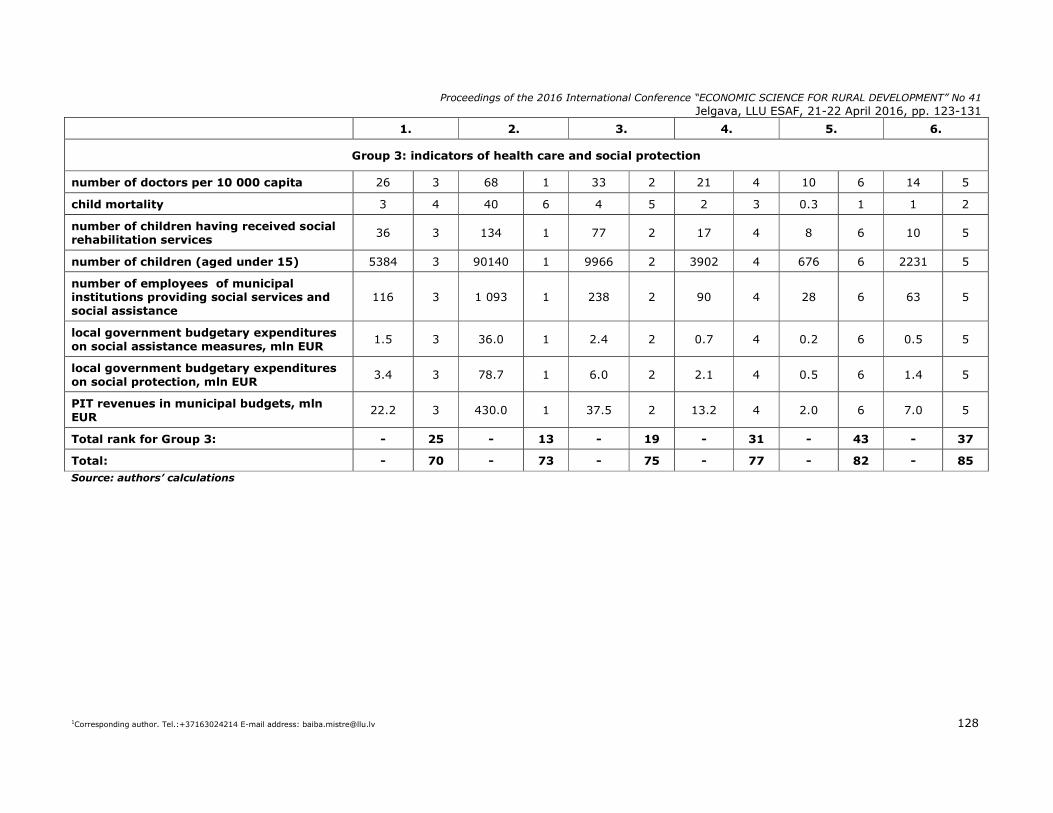
Proceedings of the 2016 International Conference “ECONOMIC SCIENCE FOR RURAL DEVELOPMENT” No 41
Jelgava, LLU ESAF, 21-22 April 2016, pp. 123-131
1Corresponding author. Tel.:+37163024214 E-mail address: [email protected] 128
1. 2. 3. 4. 5. 6.
Group 3: indicators of health care and social protection
number of doctors per 10 000 capita 26 3 68 1 33 2 21 4 10 6 14 5
child mortality 3 4 40 6 4 5 2 3 0.3 1 1 2
number of children having received social rehabilitation services
36 3 134 1 77 2 17 4 8 6 10 5
number of children (aged under 15) 5384 3 90140 1 9966 2 3902 4 676 6 2231 5
number of employees of municipal institutions providing social services and social assistance
116 3 1 093 1 238 2 90 4 28 6 63 5
local government budgetary expenditures on social assistance measures, mln EUR
1.5 3 36.0 1 2.4 2 0.7 4 0.2 6 0.5 5
local government budgetary expenditures on social protection, mln EUR
3.4 3 78.7 1 6.0 2 2.1 4 0.5 6 1.4 5
PIT revenues in municipal budgets, mln EUR
22.2 3 430.0 1 37.5 2 13.2 4 2.0 6 7.0 5
Total rank for Group 3: - 25 - 13 - 19 - 31 - 43 - 37
Total: - 70 - 73 - 75 - 77 - 82 - 85 Source: authors’ calculations
Proceedings of the 2016 International Conference “ECONOMIC SCIENCE FOR RURAL DEVELOPMENT” No 41
Jelgava, LLU ESAF, 21-22 April 2016, pp. 123-131
1Corresponding author. Tel.:+37163024214 E-mail address: [email protected] 129
Cluster 2 included the capital city of Riga. The
indicators of poverty and social exclusion as well
as the indicator “child mortality” were ranked
6th, while the indicators of income security
(except the indicator “average old-age pension”)
and health care and social protection (except the
mentioned indicator “child mortality”) were
ranked in the highest position (1st). The authors
explain it by the large number of people residing
in the capital city. According to the CSB (2015),
643 368 people lived in Riga in 2014, which
accounted for a third of Latvia’s population. The
high concentration of people results in a larger
number of employees and self-employed
individuals, which, in its turn, leads to greater tax
revenues in the local government’s budget. This,
in its turn, influences decisions concerning social
policies – the local authority can afford to spend
more on social protection and social support
measures. In 2015, Riga’s local government
spent on social protection 10.6 % of its basic
budget, while the local governments included in
Clusters 1 and 3 spent, on average, almost
7.7 %, and those belonging to Cluster 4 – on
average, 8.7 %. However, the large number of
people also means that the local government has
to spend more on social protection and social
support measures in absolute terms. It is likely
that a great deal of the region’s population is
subject to the risk of poverty and social
exclusion. An analysis of the following indicators:
proportion of poor persons, proportion of
recipients of housing benefits and proportion of
recipients of social assistance benefits in the total
number of city/municipality population leads to a
conclusion that the proportions of such people in
the capital city of Riga were the lowest (3 %,
4 % and 6 %, respectively). The authors explain
the facts by the high economic activity level in
the capital city compared with the other
republican cities (Mistre B., Muska A., 2013),
which negatively affected the capital city’s
population’s social protection.
Cluster 3 included four Latvia’s cities:
Jurmala, Liepaja, Daugavpils and Jelgava. Like in
Cluster 2, all the indicators of poverty and social
exclusion as well as the indicator “child mortality”
were ranked in the low 5th position, while the
indicators of income security (except the
indicator “average old-age pension”) and health
care and social protection (except the mentioned
indicator “child mortality”) were ranked in the
high 2nd position. Daugavpils, Liepaja, Jelgava
and Jurmala were Latvia’s largest cities behind
Riga where 4.4 %, 3.6 %, 2.9 % and 2.5 % of
the total population lived. Approximately 5% of
the population of Daugavpils and Jelgava and
2.5 % of those living in Jurmala and Liepaja were
poor persons. Of the total population in
Daugavpils and Jelgava, 14 % were recipients of
social assistance benefits. The proportion of such
people in Liepaja comprised 10 % of the total
population of the city, while in Jurmala it was
only 4 %. Of the total population in Jelgava and
Jurmala, 2 % received housing benefits, while in
Liepaja this indicator was slightly higher at 10 %
and in Daugavpils it was 14 %.
Previous research studies by the authors
(Mistre B., Muska A., 2013) showed that Jurmala
and Jelgava featured a higher economic activity
level and, unlike Daugavpils, the cities are
located close to the capital city; therefore, their
local governments have to spend less funding on
housing benefits to meet this basic need of the
population. The economic activity level in Liepaja
was higher than in Jurmala and Jelgava, even
though Liepaja is located 217 km from the capital
city.
The situation in Clusters 4, 5 and 6 was
opposite. All the indicators of poverty and social
exclusion as well the indicator “child mortality”
were ranked in high positions (from 1 st to 3 rd),
while the indicators of income security (except
the indicator “average old-age pension”) and
health care and social protection (except the
mentioned indicator “child mortality”) were
ranked in the lowest positions (from 4 th to 6 th).
Proceedings of the 2016 International Conference “ECONOMIC SCIENCE FOR RURAL DEVELOPMENT” No 41
Jelgava, LLU ESAF, 21-22 April 2016, pp. 123-131
1Corresponding author. Tel.:+37163024214 E-mail address: [email protected] 130
Cluster 4 comprised three republican cities –
Jekabpils, Rezekne and Valmiera – and
municipalities located next to the capital city –
Kekava, Olaine and Salaspils – as well as the
nearby municipalities of Bauska and Dobele. An
analysis of the indicators: proportion of poor
persons, proportion of recipients of housing
benefits and proportion of recipients of social
assistance benefits in the total number of
city/municipality population leads to a conclusion
that the proportions of the mentioned individuals
rise with the distance increasing from the
municipality, included in the cluster, to the
capital city. The reason, as found by the previous
research studies by the authors (Mistre B.,
Muska A., 2013), is a lower economic activity
level in the remote regions.
Cluster 6 consisted of 24 municipalities
(Aizkraukle, Aluksne, Balvi, Iecava, Cesis,
Daugavpils, Gulbene, Jelgava, Ozolnieki,
Kraslava, Kuldiga, Limbazi, Ludza, Madona,
Ikskile, Lielvarde, Rezekne, Adazi, Babite,
Carnikava, Garkalne, Stopini, Smiltene and
Ventspils), while Cluster 5 consisted of 76
municipalities (Jaunjelgava, Plavinas, Koknese,
Nereta, Skriveri, Ape, Vilaka, Baltinava, Rugaji,
Rundale, Vecumnieki, Ligatne, Amata,
Jaunpiebalga, Priekuli, Pargauja, Rauna,
Vecpiebalga, Ilukste, Auce, Tervete, Jekabpils,
Akniste, Viesite, Krustpils, Sala, Dagda, Aglona,
Skrunda, Alsunga, Aizpute, Durbe, Grobina,
Pavilosta, Priekule, Nica, Rucava, Vainode, Aloja,
Salacgriva, Karsava, Zilupe, Cibla, Cesvaine,
Lubana, Varaklani, Ergli, Kegums, Preili, Livani,
Riebini, Varkava, Vilani, Baldone, Saulkrasti,
Sigulda, Incukalns, Krimulda, Malpils, Ropazi,
Seja, Broceni, Dundaga, Mersrags, Roja,
Kandava, Engure, Jaunpils, Valka, Strenci,
Koceni, Mazsalaca, Rujiena, Beverina, Burtnieki
and Naukseni), which are mostly small
municipalities (in terms of area). In 2014, the
mentioned municipalities spent on social
protection 7.7 % (Cluster 6) and 9.6 %
(Cluster 5) of their basic budgets.
If the indicator averages of Cluster 5 are
compared with those of the other clusters, one
can find that the averages of Cluster 5 are
considerably lower, as the municipalities of this
cluster are small (in terms of area) with low
population densities and small numbers of
employed and self-employed individuals. There
are significant differences in indicators between
Cluster 2, which consists of only the country’s
capital city and the other clusters. The present
research also proves one of the findings made by
the authors in their previous research studies
(Mistre B., Muska A., 2013) that a monocentric
trend in development prevails in Latvia. Due to
the trend, there are significant disparities
between Riga, capital city of Latvia and the other
amalgamated municipalities and republican cities.
The authors classify the territory of Latvia by
economic activity into three categories: (1) the
capital city of Riga, (2) republican cities, except
Riga, and large amalgamated municipalities (in
terms of area), (3) small municipalities (in terms
of area) (Mistre B., Muska A., 2013).
After comparing the ranks showing social
security, one can conclude that there were no
considerable differences in social security
between the municipalities of Latvia included in
Clusters 1-4 and those belonging to Clusters 5
and 6.
Conclusions, proposals, recommendations
The term social security is interpreted
differently; thus, a classification of social security
elements is not strictly defined. For having a
single understanding, the authors suggest for
scientists to use the term social security in a
broader and a narrow sense. In a broader sense,
the term social security, according to the
authors, should involve social protection, health
care and the promotion of education and
employment. In a narrow sense, the term social
security should entail only social protection.
The indicators of poverty and social exclusion
were low for the clusters with low levels of
income security, health care and social
Proceedings of the 2016 International Conference “ECONOMIC SCIENCE FOR RURAL DEVELOPMENT” No 41
Jelgava, LLU ESAF, 21-22 April 2016, pp. 123-131
1Corresponding author. Tel.:+37163024214 E-mail address: [email protected] 131
protection. However, the same indicators were
high for the clusters with high levels of income
security, health care and social protection.
There were no significant differences in the
proportions of budgetary expenditures on social
protection in the municipalities of Latvia, while
Riga city (Cluster 2) and small municipalities (in
terms of area) with a low social security level
(Cluster 5) spent on social protection a greater
proportion of their budgets compared with the
other municipalities.
There were no considerable differences in
social security between the municipalities of
Latvia included in Clusters 1-4 and those
belonging to Clusters 5 and 6.
Bibliography
1. Central Statistical Bureau of Latvia (2015). Statistics Database (Tables IBG11, JVSG091, IMG041, IMG010, ISG042, ISG18). Retrieved: http://www.csb.gov.lv/en/dati/statistics-database-30501.html. Access: 30.12.2015
2. Centre for Disease Prevention and Control (CDPC) (2015). Health Care Statistics 2014. Retrieved: http://www.spkc.gov.lv/veselibas-aprupes-statistika/. Access: 30.12.2015
3. Cross-Sectoral Coordination Centre (CSCC) (2012). National Development Plan of Latvia for 2014–2020.Retrieved:http://www.pkc.gov.lv/images/NAP2020%20dokumenti/NDP2020_ English_Final.pdf. Access: 30.12.2015
4. Free Trade Union Confederation of Latvia (2011). Social Security Policy in Latvia in Times of Crisis. Methodological material. Riga. p. 55.
5. Grinfelde, A. (2010). Life Quality of Pensioners in Latvian Regions. Summary of the Doctoral thesis. Jelgava. pp.113.
6. Latviete, I. (2012). European Social Fund Financing in the Welfare Sector in the Regions of Latvia. Summary of the Doctoral thesis. Jelgava. pp.128.
7. Ministry of Welfare of the Republic of Latvia (2015a). Reports and Statistics. Studies. Retrieved: http://www.lm.gov.lv/text/151. Access: 30.12.2015
8. Ministry of Welfare of the Republic of Latvia (2015b). Reports on Social Services and Assistance in Amalgamated Municipalities/Cities in 2014. Reports on the Provision of Social Rehabilitation Services and to Children being Victims of Illegal Actions in 2014. Retrieved: http://www.lm.gov.lv/text/3060. Access: 30.12.2015
9. Mistre, B., Muska, A. (2013). Synergy of Old Age Pensions, Benefits and Economic Activity in Latvia. Economics Science for Rural Development. Proceedings of the International Scientific Conference, № 30 (Production and Cooperation in Agriculture, Finance and Taxes). Jelgava: LUA, pp. 221 – 228.
10. The Saeima (1995). Law On Social Security. Retrieved: http://likumi.lv/doc.php?id=36850. Access: 20.12.2015.
11. State Employment Agency (2015). Number of Unemployed Individuals by City and Municipality in December of 2014. Retrieved: http://www.nva.gov.lv/index.php?cid=6&mid =470&txt=483&t=stat. Access: 30.12.2015
12. State Regional Development Agency (2014a). Local Government Budgetary Expenditures on Health, Education and Social Protection in 2014. Report annexes. Retrieved: http://www.vraa.gov.lv/lv/petnieciba/statistika/develop/. Access: 28.12.2015.
13. State Regional Development Agency (2014b). Local Government Budgetary Revenues in 2014. Report annexes. Retrieved: http://www.vraa.gov.lv/lv/petnieciba/statistika/develop/. Access: 28.12.2015.
14. State Social Insurance Agency (s.a.). Unpublished data.
15. Supreme Court of the Republic of Latvia (2014). Summary of Court Practices in Legal Cases on Social Security Disputes in 2007-2013. Riga. p. 101. Retrieved: http://at.gov.lv/lv/ judikatura/tiesu-prakses-apkopojumi/administrativajas-tiesibas/. Access: 30.12.2015
16. Volskis, E. (2008). Pension System’s Development Problems in Latvia. Summary of the PhD Paper. Riga. p. 31.
Proceedings of the 2016 International Conference “ECONOMIC SCIENCE FOR RURAL DEVELOPMENT” No 41
Jelgava, LLU ESAF, 21-22 April 2016, pp. 132-139
1Corresponding author. Tel.: +4889 523 49 42; e-mail address: [email protected] 132
EVALUATION OF THE IMPLEMENTATION OF SUSTAINABLE DEVELOPMENT IN RURAL COMMUNES IN EASTERN POLAND
Katarzyna Pawlewicz1, PhD; Adam Pawlewicz2, PhD; Iwona Cieslak3, PhD
1 Department of Planning and Spatial Engineering, University of Warmia and Mazury in Olsztyn, Poland
2 Department of Agrotechnology, Agricultural Production Management and Agribusiness, University of Warmia and Mazury in Olsztyn, Poland
3 Department of Geoinformation Analysis and Cadastre, University of Warmia and Mazury in Olsztyn, Poland
Abstract. The paper attempts to evaluate the durability and sustainability of both socio-economic development and
environmental order in rural communes in Eastern Poland. The authors analysed indicators selected on the basis of
literature studies, which demonstrated the level of socio-economic development and environmental order for two
years: 2007 and 2013. The developed analysis is based on two methods. Firstly, based on the collected indicators, a
synthetic indicator was determined using the Hellwig’s method, which was employed to classify the area under study
by distinguishing three classes representing the levels of socio-economic development and environmental order.
Secondly, a relationship was determined between the levels of socio-economic development and environmental order.
An interrelation between socio-economic phenomena and environmental order is present in each of the communes
under study. However, the method and effects of the implementation of sustainable development vary. The study
showed that units characterised by average development in terms of socio-economic aspects and environmental order
predominate in rural communes in Eastern Poland. Most communes under study showed the balance between the class
of socio-economic development and the class of environmental order. This indicates the durability and sustainability of
development, which is a welcome trend from the perspective of the concept of sustainable development.
Key words: socio-economic development, environmental order, sustainable development, Eastern Poland.
JEL code: Q01, O12, O18, R12,
Introduction
The basis of the concept of development
sustainability is the interaction between
anthropogenic and natural elements in the
economic, environmental, social and institutional
aspects of functioning, which link with one
another, and thus contribute, through complex
processes, to the durability of development
(Valentin A., Spangerberg J. H., 2000;
Gobattoni F. et al., 2015). Therefore, at present,
the protection of landscape and tradition,
appropriately linked with the current social,
political and economic situation, cultural and
technological achievements, and environmental
changes, should be one of the main issues to be
taken into account in the policy and territorial
management. In order to cope with the need for
the durability of development, multi-faceted
integration is therefore required (Zurlini G. et al.,
2013). Particular attention should be paid to the
natural environment, since the nature is an
essential prerequisite for sustainable economic
development of a particular area as it attracts
people to that place, and is, at the same time, a
source of economic development in sectors such
as organic farming, forestry, fisheries, tourism as
well as efficient and smart production based on
natural resources (Livina A., Rozentale S., 2015).
This contributes to the strengthening of social
capital, while improving economic development
at the same time (Borawski P., Dunn J. W.,
2014).
In Poland, numerous development-supporting
programmes based on the principles of
sustainable development are under
implementation. The Operational Programme
entitled “Development of Eastern Poland” is
among those worth indicating. The main
objective of the Programme is “to accelerate the
pace of socio-economic development of
communes in Eastern Poland, at the same time
respecting the sustainable development policy”.
The Programme is implemented within the time
frameworks of 2007–2013 and 2014–2020, and
is aimed at equalising the development
Proceedings of the 2016 International Conference “ECONOMIC SCIENCE FOR RURAL DEVELOPMENT” No 41
Jelgava, LLU ESAF, 21-22 April 2016, pp. 132-139
1Corresponding author. Tel.: +4889 523 49 42; e-mail address: [email protected] 133
opportunities for five poorest regions of the EU
(Lubelskie, Podkarpackie, Podlaskie,
Swietokrzyskie and Warminsko-Mazurskie
provinces) (Pawlewicz A. et al., 2015).
For the research into the level of sustainable
development, it is extremely important to
determine the degree of balance achieved
between development factors and the condition
of the environment. Information on the
proportions of the main components may
determine the lines of measures for both the
achievement of durability and the stimulation of
development in the future. Therefore, the basis
for considerations and analyses in the paper is a
thesis stating that sustainable development
occurs when an increase in the socio-economic
level is accompanied by a proportional increase in
the environmental order. Therefore, the objective
of sustainable development is the durable
maintenance of proportions between socio-
economic development and environmental
protection. This is evidenced by the fact that for
two decades in Poland, economic growth and
improvement in the quality of life have been
noted, along with an increase in legally protected
areas and general improvement in the
environment of rural areas, which has no adverse
effect on local economies (Cieslak I. et al.,
2015). It should be borne in mind that the
directions of these phenomena are opposing, and
since they concern the same entity or territorial
unit, they should balance out, which, by
assumption, results in the durability of
development and not stagnation. The discussed
literature indicates that a positive relationship
exists between socio-economic processes and
environmental order. This relationship occurs
with varying intensity in relation to
heterogeneous spheres of the development and,
contrary to the common belief, is a directly
proportional relationship.
Materials and methods
In order to support the proposed thesis, the
authors evaluated the durability and
sustainability of development by comparing the
quotients of values showing the level of socio-
economic development with adequate values
indicating the level of environmental order in
horizontal layout in the years 2007 and 2013. A
set of economic, social, and environmental
indicators of sustainable development was
adopted as the values describing those two
phenomena. During the analysis, indicators were
selected based on a review of literature, which,
for the specified area of research, due to its
political and economic determinants, represented
the level of discussed phenomena most
accurately. The area under study included
provinces of Eastern Poland, which are still
perceived as problem areas and are actually
struggling with development problems, primarily
in the socio-economic sphere. The basic subject
of the study was a rural commune. The study
focused on 496 such communes.
Since, as already mentioned, both socio-
economic development and environmental order
are multi-faceted concepts, they are
characterised using synthetic variables which
allow a set of many coefficients to be replaced
with one variable (Bossel H., 1999; Caschili S.
et al., 2014). In the course of the study, two
measures were distinguished using the
Z. Hellwig’s method (1968). One of them
characterised the level of socio-economic
development, while the other characterised
environmental order of rural communes in
Eastern Poland. The synthetic measures were
determined using the following procedure:
1) analysis of literature on the subject for the
selection of characteristics – indicators of
socio-economic development and
environmental order (Spangenberg J. H.
eta al., 1999, Bossel H., 1999, Borys T., 2005,
Korol J., 2007, Pawlewicz K., 2015);
2) elimination of excessively correlated
characteristics through an analysis of diagonal
elements of the inverse correlation matrix,
which resulted in the exclusion of variables
Proceedings of the 2016 International Conference “ECONOMIC SCIENCE FOR RURAL DEVELOPMENT” No 41
Jelgava, LLU ESAF, 21-22 April 2016, pp. 132-139
1Corresponding author. Tel.: +4889 523 49 42; e-mail address: [email protected] 134
being too strongly correlated, i.e. those for
which the values on the main diagonal
exceeded the number 10, from further
considerations. Eventually, the following
characteristics (indicators) were selected for
further research:
• socio-economic development: x1 – birth rate
per 1,000 population; x2 – population density;
x3 – gross enrolment ratio for primary
schools; x4 – gross enrolment ratio for lower-
secondary schools; x5 – outpatient clinics per
10,000 population; x6 – participation of
women in the Commune Council; x7 – average
usable floor area of a flat per 1 person; x8 –
commune’s income from personal income tax
per capita; x9 – total commune’s own income
per capita; x10 – received specific grants to
the budget’s income, total; x11 – expenditure
on culture and national heritage protection per
capita; x12 – expenditure on social welfare per
capita; x13 – investment asset expenditure per
capita; x14 – entities entered into the REGON
register per 10,000 inhabitants; x15 – income
from agricultural tax per capita; x16 – length
(in km) of the active water-pipe network per
km2 of the area; x17 – length of the active
sewerage system (in km) per km2 of the area;
x18 – percentage of the registered unemployed
in the population in productive age; x19 –
population in post-productive age per
100 persons in productive age; x20 –
migration balance per 1,000 persons;
• environmental order: y1 – area of legally
protected areas as a percentage of the
commune area; y2 – number of natural
monuments per 100 km2; y3 – area of parks,
green squares and community green spaces
per 100,000 inhabitants; y4 – forestation rate
in a commune; y5 – share of regeneration and
afforestation in the commune area; y6 –
expenditure on waste management per
capita; y7 – expenditure on wastewater
management and water conservation per
capita; y8 – percentage of population using
water-pipe network; y9 – percentage of
population using sewerage system; y10 – asset
expenditure on municipal services
management and environmental protection
per capita; y11 – expenditure on greenery
maintenance per capita; y12 – mixed waste
collected in a year per capita; y13 – water
consumption per capita; y14 – percentage of
population served by sewage treatment plants
in total population; y15 – total wastewater
treated per 1,000 inhabitants; y16 –
percentage of treated wastewater in industrial
and municipal wastewater requiring
treatment.
The indicators were selected based on data
originating from the GUS (Central Statistical
Office) Bank of Local Data.
A list of analysed characteristics in a form of
an observation matrix:
(1)
where: xij (i = 1,2, …, n; j = 1,2, …, m) –
denotes the value of the j-th characteristic (in
this case, an indicator of socio-economic
development and environmental order) for the i-
th object (rural commune).
Normalisation1 of the values of characteristics
(indicators) through the standardisation thereof
according to the formula:
1 Most frequently, diagnostic variables bear different names, which results in the lack of possibility for the direct comparison thereof. Therefore, in order to give characteristics a name of comparability, it is necessary to perform normalisation, i.e. elimination of the influence of measurement units.
Proceedings of the 2016 International Conference “ECONOMIC SCIENCE FOR RURAL DEVELOPMENT” No 41
Jelgava, LLU ESAF, 21-22 April 2016, pp. 132-139
1Corresponding author. Tel.: +4889 523 49 42; e-mail address: [email protected] 135
(2)
where:
(3) A result of the performed transformations is a matrix of standardised values of characteristics – Z.
(4)
Based on the obtained matrix, determination
of the so-called “development pattern”, i.e. an
abstract object P0 (rural commune) with the
coordinates: , where: z0j =
max{zij}, when Zj is a stimulant, and z0j =
min{zij}, when Zj is a destimulant. According to
considerations, it should be noted that the
“development pattern” is a hypothetic rural
commune with the most favourable values of
variables.
(4)
The next step was the determination of
Euclidean distances for each object Pi under
evaluation (rural commune) from the determined
“development pattern”.
Based on the determined values qi, a value of
Hellwig’s synthetic measure of development was
calculated, which was used to evaluate the rural
communes under study. The indicator value may
be presented according to the following formula:
(5)
where: Hellwig’s synthetic measure of development Si
typically takes values from the range of (0.1).
The closer the values thereof are to 1, the higher
is the level of maintenance of particular
componential orders (social, environmental-and-
spatial, and economic) of the object under study.
Performance of the linear ordering of objects
under study (rural communes) and the
determination of typological classes for socio-
economic development and environmental order
using an arithmetic mean and standard deviation
in according with the following procedure:
– Class I – a higher level of
socio-economic development, environmental
order;
– Class II – an
average level of socio-economic development,
environmental order;
, – Class III – a lower level of
socio-economic development, environmental
order;
where:
Si – value of the synthetic measure calculated
using the Hellwig’s method for: socio-economic
development; environmental order,
– arithmetic mean of synthetic measure Si,
– standard deviation of synthetic measure
Si.
Then, based on specific classes, sustainability
coefficients (indicator of sustainable
development) were determined in accordance
with the following procedure:
(6)
where:
Proceedings of the 2016 International Conference “ECONOMIC SCIENCE FOR RURAL DEVELOPMENT” No 41
Jelgava, LLU ESAF, 21-22 April 2016, pp. 132-139
1Corresponding author. Tel.: +4889 523 49 42; e-mail address: [email protected] 136
indicator of sustainable development
(intensity indicator – a relative value expressing
the formation of the value of a phenomenon
against the background of another one being
logically linked with it);
– class of socio-economic
development;
– class of environmental order.
when:
= 1 – sustainable development – the
balance occurs between the class of socio-
economic development and the class of
environmental order;
< 1 – protective (passive) development –
focused on environmental protection, the class of
socio-economic development is lower than the
class of environmental order;
> 1 – expansive (aggressive)
development – focused on economic expansion,
the class of socio-economic development
surpasses the class of environmental order.
Research results and discussion
Analysis of the data showed that units
characterised by average development (Class II)
in terms of socio-economic aspects and
environmental order predominate in rural
communes in Eastern Poland (Table 1). In 2007,
there were 380 of analysed communes in the first
case and 394 in the second, out of the total 496.
In turn, in 2013 an increase by just under one
unit took place for socio-economic factors, and an
increase by nearly 7 % (31 communes) for
indicators for environmental order. This is
affected by the fact that, on the one hand, there
are many areas with favourable natural assets, a
relatively small area of degraded soils, and a
typical rural landscape (Pawlewicz A.,
Pawlewicz K., 2012). On the other hand, this is a
result of the adaptation to the standards in force
in the EU Member States, which is necessary for
the implementation of pro-environmental
projects (Mazur-Wierzbicka E., 2015).
In 2007, there were 66 units with a higher
level (Class I) of socio-economic development,
and 42 units with a higher level of environmental
order. As regards this typological class, it may be
noted that units characterised by a high level of
socio-economic development failed to maintain
durability as in 2013, a decrease by nearly 1%
was noted. In turn, environmental order was
durable as there had been no change to the
number of communes characterised by a high
level of sustainable development.
In turn, in Class III, i.e. the class of units
characterised by a low level of development,
bilateral changes occurred during the analysis.
On the one hand, the number of communes
characterised by a low level of socio-economic
development increased from 50 in 2007 to 52
in 2013. On the other hand, the number of
territorial units characterised by a low level of
environmental order decreased very significantly:
in 2007, there were 60 of them, while in 2013,
only 29. Therefore, one can notice a positive
trend indicating an improvement to the quality of
life but mainly in terms of environmental
protection. Unfortunately, having analysed
economic and social aspects, an increase may be
observed in the number of communes in which
economic downturn occurs, which results in their
transfer to a lower class of development (details
provided in Table 1).
Another studied phenomenon was the
formation of the balance of socio-economic
factors and environmental order, which are
logically linked. According to results of the
analysis conducted in 2007, 341 of 496
communes showed the balance between the class
of socio-economic development and the class of
environmental order, which indicates strong
durability and stability of both factors. However,
in 2013 there were 10 more of those communes.
In turn, as regards economic expansion
(ISD > 1), in 2007 there were 94 communes,
while in 2013, a decrease to 72 territorial units
(nearly 5% of the entire population under study)
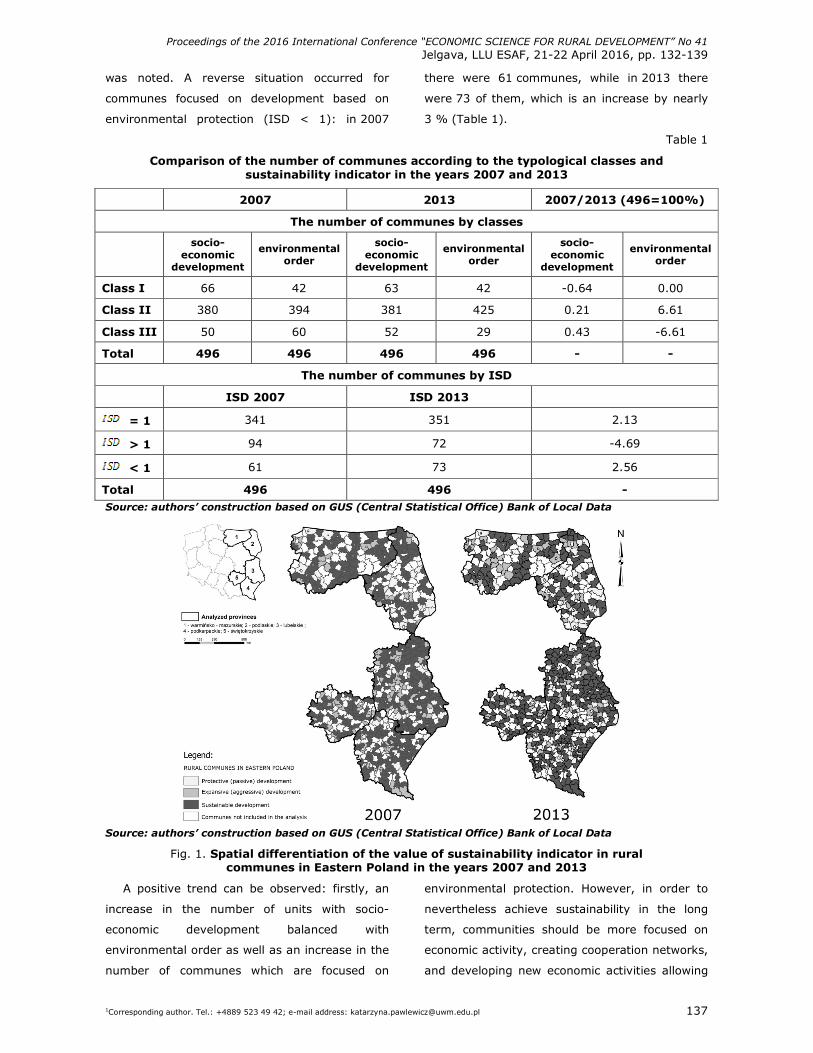
Proceedings of the 2016 International Conference “ECONOMIC SCIENCE FOR RURAL DEVELOPMENT” No 41
Jelgava, LLU ESAF, 21-22 April 2016, pp. 132-139
1Corresponding author. Tel.: +4889 523 49 42; e-mail address: [email protected] 137
was noted. A reverse situation occurred for
communes focused on development based on
environmental protection (ISD < 1): in 2007
there were 61 communes, while in 2013 there
were 73 of them, which is an increase by nearly
3 % (Table 1).
Table 1
Comparison of the number of communes according to the typological classes and sustainability indicator in the years 2007 and 2013
2007 2013 2007/2013 (496=100%)
The number of communes by classes
socio-
economic development
environmental order
socio-economic
development
environmental order
socio-economic
development
environmental order
Class I 66 42 63 42 -0.64 0.00
Class II 380 394 381 425 0.21 6.61
Class III 50 60 52 29 0.43 -6.61
Total 496 496 496 496 - -
The number of communes by ISD
ISD 2007 ISD 2013
= 1 341 351 2.13
> 1 94 72 -4.69
< 1 61 73 2.56
Total 496 496 - Source: authors’ construction based on GUS (Central Statistical Office) Bank of Local Data
Source: authors’ construction based on GUS (Central Statistical Office) Bank of Local Data
Fig. 1. Spatial differentiation of the value of sustainability indicator in rural communes in Eastern Poland in the years 2007 and 2013
A positive trend can be observed: firstly, an
increase in the number of units with socio-
economic development balanced with
environmental order as well as an increase in the
number of communes which are focused on
environmental protection. However, in order to
nevertheless achieve sustainability in the long
term, communities should be more focused on
economic activity, creating cooperation networks,
and developing new economic activities allowing
Proceedings of the 2016 International Conference “ECONOMIC SCIENCE FOR RURAL DEVELOPMENT” No 41
Jelgava, LLU ESAF, 21-22 April 2016, pp. 132-139
1Corresponding author. Tel.: +4889 523 49 42; e-mail address: [email protected] 138
the society to be entrepreneurial (Paula L.,
2015). Secondly – a decrease in the number of
units which are only focused on an economic
expansion. It should be borne in mind that only
integrated measures may contribute to the
combination of socio-economic development with
environmental protection (Lanfranchi M. et al.,
2015).
Changes between the year 2007 and 2013 as
regards spatial differentiation of the value of
sustainability indicator are presented in Figure 1.
Conclusions, proposals, recommendations
The determination of the level of balance
between economic-and-social factors and the
condition of the environment is very important in
analysing the degree of sustainable development.
This is of significance because of the question:
“Is it possible to combine economic growth with
the objective of sustainable development?”
Theoretically, a model of “sustainable
development” (self-sustaining and durable, in
which all three dimensions are maintained at a
permanent equilibrium) is an ideal model, the
implementation of which should be pursued
through following a long-term policy of
development. Knowledge of the relationships
between the main components of the process
under study may help implement lines of
measures aimed at achieving the durability, and
stimulate development in the future.
The proposed thesis was considered to be
true, and its validity was demonstrated in the
course of the study on the balance between the
status of socio-economic development and
environmental order as illustrated by the
example of 496 communes in Eastern Poland. It
was demonstrated that sustainable development,
owing to its particular determinants, is an
extremely sensitive process due to the fluctuation
of indicators being representative for both
phenomena. The following conclusions were
drawn in the course of the study:
1) In rural communes in Eastern Poland, the
predominant units are those characterised by
average development in terms of socio-
economic aspects and environmental order.
2) Most communes under study showed the
balance between the class of socio-economic
development and the class of environmental
order. This indicates the durability and
sustainability of development, which is a
welcome trend from the perspective of the
concept of sustainable development.
3) A relationship between socio-economic
phenomena and environmental order is
present in each of the communes under study.
However, the method and effects of the
implementation of sustainable development
vary.
4) The studies being carried out provide a
possibility for monitoring the status of and
changes in the process of implementation of
the concept of sustainable development.
5) Horizontal analysis of synthetic values
constructed on the basis of representative
indicators for the phenomena under study
provides a clear answer to the question about
the level of sustainable development, with
account taken of particular determinants of
the area under study. Such research allows
targeting self-government’s measures as well
as following the policy of both the state and
the UE towards the strengthening of specific
components of sustainable development. This
may lead to the optimisation of living
conditions while maintaining the
intergenerational justice, which is the primary
objective of the concept of sustainable
development. This is of exceptional
importance, particularly to the poorer regions
where the pursuit of rapid economic
development may frequently threaten the
maintenance of a proper level and the
protection of natural environment, leading to
irreversible changes and permanently
Proceedings of the 2016 International Conference “ECONOMIC SCIENCE FOR RURAL DEVELOPMENT” No 41
Jelgava, LLU ESAF, 21-22 April 2016, pp. 132-139
1Corresponding author. Tel.: +4889 523 49 42; e-mail address: [email protected] 139
threatening the idea of sustainable development.
Bibliography
1. Borys, T., (ed). (2005). Wskazniki zrownowazonego rozwoju (Sustainable Development Indicators). Warszawa-Bialystok. Ekonomia i Srodowisko. p. 247.
2. Bossel, H. (1999). Indicators for Sustainable Development: Theory, Method, Applications. Winnipeg: International Institute for Sustainable Development. p. 138.
3. Borawski P., Dunn J.W. (2014). Evaluation of Human Capital in Dairy Farm Owners According to the Level of Education. in: Rural Development in Poland: the Role of Policy, Tourism and Human Capital. Edited by: Borawski, P; Brelik, A; Czyzewski, B., WSES Ostroleka, pp 115-123.
4. Caschili, S., De Montis, A., Trogu, D. (2014). Accessibility and Rurality Indicators for Regional Development. Computers, Environment and Urban Systems. Volume 49. pp. 98-114.
5. Cieslak, I., Pawlewicz, K., Pawlewicz, A., Szuniewicz, K. 2015. Impact of The Natura 2000 Network on Social-economic Development of Rural Communes in Poland. Research for Rural Development 2015. Volume 2, pp. 169-175.
6. Gobattoni, F., Pelorosso, R., Leone, A., Ripa, M. N. (2015). Sustainable Rural Development: The Role of Traditional Activities in Central Italy. Land Use Policy, 48, pp. 412-427.
7. Hellwig, Z. (1968). Zastosowanie metody taksonomicznej do typologicznego podzialu krajow ze wzgledu na poziom ich rozwoju oraz zasoby i strukture wykwalifikowanych kadr (Procedure of EvaluatingHigh Level ManpowerData and Typology of Countries by Means of the TaxonomicMethod). Przeglad statystyczny, Vol. 15, I. 4, Warszawa: PWN, pp. 307-327.
8. Korol, J. (2007). Wskazniki zrownowazonego rozwoju w modelowaniu procesow regionalnych. (Sustainable Development Indicators in Modelling Regional Processes). Wyd. Adam Marszałek. p. 211.
9. Lanfranchi, M., Giannetto, C., De Pascale, A. (2015). The Link between Economic Growth and Environmental Quality in the Case of Coastal Tourism in the Rural Areas. Applied Mathematical Sciences, Volume 9 (35), pp. 1745-1755.
10. Livina, A., Rozentale, S. (2015). Nature as Indicator of Place Economic Sustainability. Integrated and Sustainable Regional Development. Economic Science for Rural Development, 38. pp. 92-102.
11. Mazur-Wierzbicka, E. (2015). Nakłady inwestycyjne w ochronie srodowiska w Polsce (Investment Expenditures on Environmental Protection in Poland). Prace Naukowe Uniwersytetu Ekonomicznego we Wrocławiu. Volume 395. pp. 252-262.
12. Paula, L. (2015). Capability of Communities as Precondition for Sustainability of Rural Areas. Integrated and Sustainable Regional Development. Economic Science for Rural Development, 38. pp. 103-112.
13. Pawlewicz, A., Cieslak, I., Pawlewicz, K., Szuniewicz, K., (2015). Natura 2000 Sites and Socio-economic Development of Rural Communes in Eastern Poland. Integrated and Sustainable Regional Development. Economic Science for Rural Development, 38. pp 14-23.
14. Pawlewicz, A., Pawlewicz, K. (2012). Naklady inwestycyjne na ochrone srodowiska obszarow wiejskich na przykladzie wojewodztwa warminsko-mazurskiego (Investment Expenditures on Environmental Protection of Rural Areas Based on the Example of Warmia and Mazury). Acta Scientiarum Polonorum. Administratio Locorum, No 2(11), pp. 165-175.
15. Pawlewicz, K., (2015). Differences in Development Levels of Urban Gminas in the Warminsko-Mazurskie Voivodship in View of the Main Components of Sustainable Development. Bulletin of Geography. Socioeconomic Series, No. 29, pp. 93–102.
16. Spangenberg, J. H., Pfahl, S., Deller, K. (1999). Indicators for Institutional Sustainability. In: Malkina-Pykh I. (Ed.) Indices and Indicators of Sustainable Development: A System Approach. Proceedings of the Second Biannual INDEX Conference, St. Petersburg, Oxford.
17. Valentin, A., Spangenberg, J. H. (2000). A Guide to Community Sustainability Indicators. Environmental Impact Assessment Review, 20(3), pp. 381-392.
18. Zurlini, G., Petrosillo, I., Jones, K. B., Zaccarelli, N. (2013). Highlighting Order and Disorder in Social–ecological Landscapes to Foster Adaptive Capacity and Sustainability. Landscape Ecology. 28 (6), pp. 1161–1173.
Proceedings of the 2016 International Conference “ECONOMIC SCIENCE FOR RURAL DEVELOPMENT” No 41
Jelgava, LLU ESAF, 21-22 April 2016, pp. 140-146
1Corresponding author: Tel.: + 48 667-935-314; fax: +48 83 3449950. E-mail address: [email protected] 140
LOCAL GOVERNMENT AS A PUBLIC INSTITUTION SUPPORTING ORGANIC PRODUCTION IN THE OPINION OF THE PRODUCERS FROM NATURAL VALUABLE
AREAS OF THE LUBLIN VOIVODESHIP (POLAND) Agnieszka Siedlecka1, PhD
1Pope John Paul II State School of Higher Education in Biala Podlaska
Abstract. Undertaking organic farming is conditioned by carrying out a series of tasks related to, inter alia, the
implementation of the new procedures, technologies. This means that for the proper functioning, building regional
capacity in this aspect, it is necessary to have support of institutions and organizations. Agricultural production
(including organic food production) in this regard needs support not only from the corporate market but state
institutions as well, including local government units.
The aim of this paper is to estimate support for organic food production provided by local government units compared
to other institutions and organizations. It has been verified whether the local government unit indicated by producers
as the most crucial with reference to the support provided for organic producers would be Marshall’s Office. Research
material for the purpose of the following paper was collected from 43 households producing organic food in 30
communes out of the most valuable areas according to the rate formulated by D. Guzal-Dec as part of studying the
ecological value of rural and urban-rural communes of Lublin voivodeship. The research was conducted by means of a
diagnostic survey with the use of a questionnaire.
Key words: organic production, valuable natural areas, local government.
JEL code: Q12, Q57, H79
Introduction
Lublin region is a region with a typically
agricultural character. Located in the Eastern part
of Poland, bordered in the South with Carpathian
voivodeship, in the North with Podlaskie
voivodeship and, in the West, with Mazovia as
well as Swietokrzyskie voivodeships. The Eastern
border of Lublin voivodeship is also one of Polish
borders and the border of the European Union –
a border with Belarus and Ukraine. Lublin
voivodeship is the third largest area, just
following Mazovia and Greater Poland
voivodeships in the country (area 25122 km2).
Lublin voivodeship is one of the least
developed voivodships. It is also a region
characterized by fragmented agricultural
structure. According to the 2010 General
Agricultural Census, in Lublin voivodeship, there
were 233559 farms engaged in agricultural
activities, 233372 of which were private farms,
and 66 public sector entities. Agricultural
production area amounting to 1359882 ha in
2010 was used by 233372 individual farms
engaged in agricultural activities. This area
covers 54.1 % of the total area of Lublin
voivodeship in 2010. Due to environmental
benefits Lublin voivodeship is an area where
ecological agriculture should develop. It is the
farming that creates conditions for the
exploitation of natural resources providing
permanent soil fertility and animal and plant
healthiness, such production is based on using
natural means of production (Wojcik G., 2012).
Number of organic producers operating in the
field of ecological agricultural production Poland,
as of 31 December 2013, amounted to 26598. In
Lublin voivodeship, there were 2129,
representing 8% of those carrying out this type
of activity in the country. Another group of
entities in the organic sector are enterprises
engaged in the processing of organic products
and the production of feed and / or yeast.
Overall, the number in Poland, as of
31 December 2013, amounted to 407 (in Lublin
voivodeship 45) (Agricultural and Food Quality
Inspection, 2014).
First changes in the system of public
administration in Poland took place in 1990,
when the system of public services management
changed at the commune level. This was the year
of the start of independent local government (Act
of 8 March 1990). Another important step in
carrying out the reform of local government took
place in 1999, when, under the Act on Local
Proceedings of the 2016 International Conference “ECONOMIC SCIENCE FOR RURAL DEVELOPMENT” No 41
Jelgava, LLU ESAF, 21-22 April 2016, pp. 140-146
1Corresponding author: Tel.: + 48 667-935-314; fax: +48 83 3449950. E-mail address: [email protected] 141
government, full decentralization and the
creation of two new types of local government
(district and provincial government) took place
(Act, 2014). The implementation of the reform
was associated with conducting basic territorial
division of the state.
Currently, in Poland, there is a three-tier
territorial division. As of January 1, 2014, Poland
was divided into 16 voivodeships, 314 poviats,
66 towns with poviat rights, 2479 communes
(including 305 urban, 1566 rural, 608 urban-
rural), 913 cities (including 608 cities in urban-
rural communes). The local government reform,
since the beginning of its operation, has aroused
a number of emotions and discussions. Especially
changes introduced on January 1, 1999, mainly
related to decreasing the number of voivodeships
(from 49 to 16 units at present) sparked a
debate on a large scale. So far adjustments have
been associated with local government. They
relate particularly to the commune level.
Proper functioning of the public administration
is associated with the execution of tasks by
various local government units. The range of
tasks performed by communes in accordance
with the Local Government Act includes activities
in the area of public affairs of local importance
(not defined for other entities). Referring to
commune activities associated with farming and
organic food production, one should pay special
attention to the following tasks involving: "spatial
management, real estate, environmental and
nature conservation and water management;
promotion of the commune; cooperation and
activities of non-governmental organizations and
entities mentioned in Art. 3 paragraphs 3 of the
Act of 24 April 2003 on Public Benefit and
Volunteer Work (Journal of Laws of 2010,
No 234, item 1536, as amended)" ( Act, 2013a).
In the case of another unit of local
government, activities include public tasks of the
supra-commune level "water management,
environmental protection and nature
conservation, agriculture, forestry and inland
fisheries, promotion of poviats, cooperation and
activities of non-governmental organizations and
entities mentioned in Art. 3 paragraph 3 of the
Act of 24 April 2003 on Public Benefit and
Volunteer Work (Journal of Laws of 2010,
No 234, item 1536, as amended)" (Act, 2013b ).
Poviat is yet another unit constituting part of
the system of local government. According to the
Law on Local Governments, it is an entity that
defines the strategy of development of the region
taking into account the number of objectives,
among others: "stimulating economic activity,
raising the level of competitiveness and
innovation of the region; preserving the cultural
and natural environment values, taking into
account the needs of future generations; rational
use of natural resources and shaping the
environment, in accordance with the principle of
sustainable development; promotion of values
and opportunities for regional development"
(Act, 2013c). Other tasks performed by the
regional government include modernization of the
countryside and the environment (Act, 2013c).
Analyzing individual tasks of all of the
elements of local government in relation to the
promotion of organic production, it can be
observed that there is no such a clear reflection
in legislation. In the case of the unit being near
farms – commune – the tasks are very vague,
cannot concentrate mainly on issues of promotion
and possible co-operation with NGOs, which are
important in the case of organic producers.
Paying attention to the problems of agricultural
production is much wider in the case of the tasks
assigned to poviats and voivodeship
governments. Environmental protection is equally
important in all of the case it has been
highlighted in the mentioned tasks. Tasks
imposed by legislation on voivodeship
government indicate the need for modernization
of rural areas, and the rational use of natural
resources. Organic production carried out on
farms is included in the implementation of these
tasks by voivodeship governments.
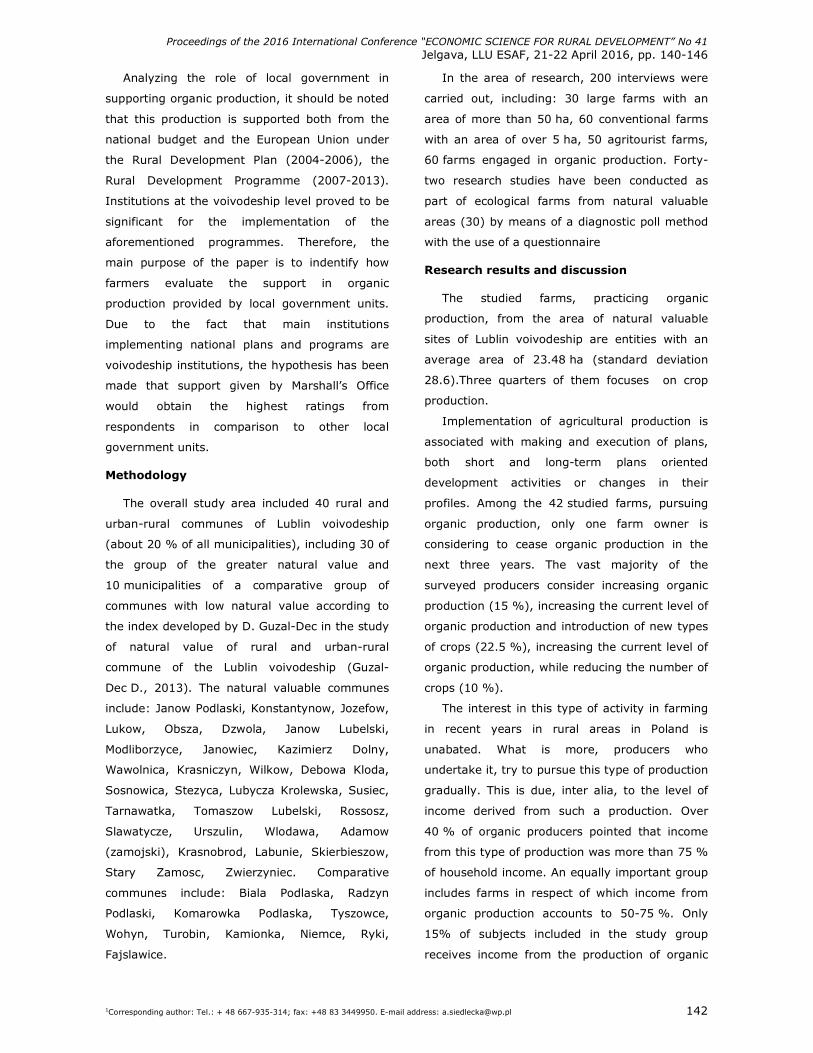
Proceedings of the 2016 International Conference “ECONOMIC SCIENCE FOR RURAL DEVELOPMENT” No 41
Jelgava, LLU ESAF, 21-22 April 2016, pp. 140-146
1Corresponding author: Tel.: + 48 667-935-314; fax: +48 83 3449950. E-mail address: [email protected] 142
Analyzing the role of local government in
supporting organic production, it should be noted
that this production is supported both from the
national budget and the European Union under
the Rural Development Plan (2004-2006), the
Rural Development Programme (2007-2013).
Institutions at the voivodeship level proved to be
significant for the implementation of the
aforementioned programmes. Therefore, the
main purpose of the paper is to indentify how
farmers evaluate the support in organic
production provided by local government units.
Due to the fact that main institutions
implementing national plans and programs are
voivodeship institutions, the hypothesis has been
made that support given by Marshall’s Office
would obtain the highest ratings from
respondents in comparison to other local
government units.
Methodology
The overall study area included 40 rural and
urban-rural communes of Lublin voivodeship
(about 20 % of all municipalities), including 30 of
the group of the greater natural value and
10 municipalities of a comparative group of
communes with low natural value according to
the index developed by D. Guzal-Dec in the study
of natural value of rural and urban-rural
commune of the Lublin voivodeship (Guzal-
Dec D., 2013). The natural valuable communes
include: Janow Podlaski, Konstantynow, Jozefow,
Lukow, Obsza, Dzwola, Janow Lubelski,
Modliborzyce, Janowiec, Kazimierz Dolny,
Wawolnica, Krasniczyn, Wilkow, Debowa Kloda,
Sosnowica, Stezyca, Lubycza Krolewska, Susiec,
Tarnawatka, Tomaszow Lubelski, Rossosz,
Slawatycze, Urszulin, Wlodawa, Adamow
(zamojski), Krasnobrod, Labunie, Skierbieszow,
Stary Zamosc, Zwierzyniec. Comparative
communes include: Biala Podlaska, Radzyn
Podlaski, Komarowka Podlaska, Tyszowce,
Wohyn, Turobin, Kamionka, Niemce, Ryki,
Fajslawice.
In the area of research, 200 interviews were
carried out, including: 30 large farms with an
area of more than 50 ha, 60 conventional farms
with an area of over 5 ha, 50 agritourist farms,
60 farms engaged in organic production. Forty-
two research studies have been conducted as
part of ecological farms from natural valuable
areas (30) by means of a diagnostic poll method
with the use of a questionnaire
Research results and discussion
The studied farms, practicing organic
production, from the area of natural valuable
sites of Lublin voivodeship are entities with an
average area of 23.48 ha (standard deviation
28.6).Three quarters of them focuses on crop
production.
Implementation of agricultural production is
associated with making and execution of plans,
both short and long-term plans oriented
development activities or changes in their
profiles. Among the 42 studied farms, pursuing
organic production, only one farm owner is
considering to cease organic production in the
next three years. The vast majority of the
surveyed producers consider increasing organic
production (15 %), increasing the current level of
organic production and introduction of new types
of crops (22.5 %), increasing the current level of
organic production, while reducing the number of
crops (10 %).
The interest in this type of activity in farming
in recent years in rural areas in Poland is
unabated. What is more, producers who
undertake it, try to pursue this type of production
gradually. This is due, inter alia, to the level of
income derived from such a production. Over
40 % of organic producers pointed that income
from this type of production was more than 75 %
of household income. An equally important group
includes farms in respect of which income from
organic production accounts to 50-75 %. Only
15% of subjects included in the study group
receives income from the production of organic
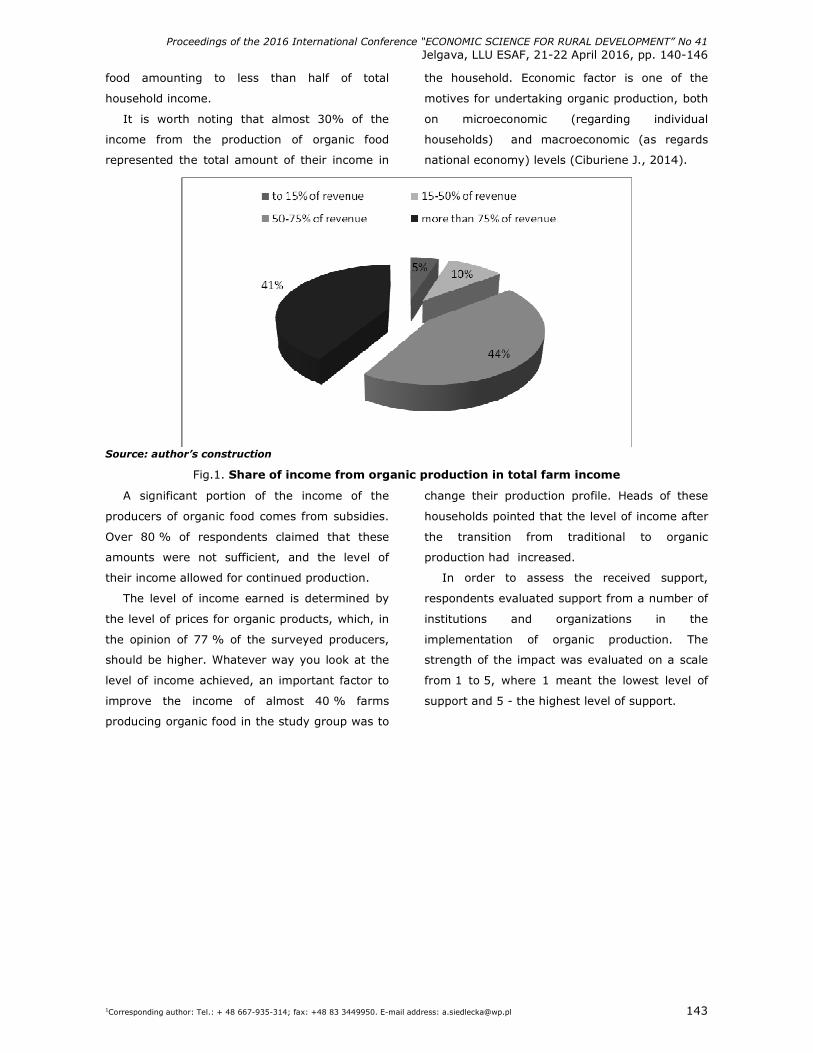
Proceedings of the 2016 International Conference “ECONOMIC SCIENCE FOR RURAL DEVELOPMENT” No 41
Jelgava, LLU ESAF, 21-22 April 2016, pp. 140-146
1Corresponding author: Tel.: + 48 667-935-314; fax: +48 83 3449950. E-mail address: [email protected] 143
food amounting to less than half of total
household income.
It is worth noting that almost 30% of the
income from the production of organic food
represented the total amount of their income in
the household. Economic factor is one of the
motives for undertaking organic production, both
on microeconomic (regarding individual
households) and macroeconomic (as regards
national economy) levels (Ciburiene J., 2014).
Source: author’s construction
Fig.1. Share of income from organic production in total farm income
A significant portion of the income of the
producers of organic food comes from subsidies.
Over 80 % of respondents claimed that these
amounts were not sufficient, and the level of
their income allowed for continued production.
The level of income earned is determined by
the level of prices for organic products, which, in
the opinion of 77 % of the surveyed producers,
should be higher. Whatever way you look at the
level of income achieved, an important factor to
improve the income of almost 40 % farms
producing organic food in the study group was to
change their production profile. Heads of these
households pointed that the level of income after
the transition from traditional to organic
production had increased.
In order to assess the received support,
respondents evaluated support from a number of
institutions and organizations in the
implementation of organic production. The
strength of the impact was evaluated on a scale
from 1 to 5, where 1 meant the lowest level of
support and 5 - the highest level of support.
Proceedings of the 2016 International Conference “ECONOMIC SCIENCE FOR RURAL DEVELOPMENT” No 41
Jelgava, LLU ESAF, 21-22 April 2016, pp. 140-146
1Corresponding author: Tel.: + 48 667-935-314; fax: +48 83 3449950. E-mail address: [email protected] 144
* rating scale of 1 to 5, wherein the lowest level of support is 1 and 5 is the highest level
Source: author’s construction
Fig.2. Average for the evaluation of support of selected institutions and organizations in the implementation of organic production*
Among all of the tested institutions,
respondents rated support by Agricultural
Advisory Centres the highest (mean 3.97,
standard deviation 1.25), followed by certifying
bodies (mean 3.74, SD 1.26) and the Agency for
Restructuring and Modernization of Agriculture
(mean 3.56; standard deviation 1.42).
Agricultural Advisory Centres are part of the
Farm Advisory System (FAS - Farm Advisory
System). They are institutions of self-
government, they run broadly understood
advisory services for both farmers and
agricultural entrepreneurs. In Poland, there are
16 AACs, they are subject to Local Government
Provincial. Agricultural Advisory Centres
implement a number of measures to support both
organic production as well as the activities of all
agricultural producers (Firlej K., Rydz A., 2012).
Producers participating in the study indicated
mainly: consulting, training, workshops,
assistance in filling in documentation,
organization of fairs, festivals and information
activities as forms of support to be implemented
by entities.
Certification bodies are one of the components
of a system of certification and control of "C"
organic products. This system is applicable in
four EU countries. In Poland, it consists of the
following entities (Ministry of Agriculture and
Rural Development, 2011):
• certifying bodies
• the Minister of Agriculture and Rural
Development
• the Quality Inspection of Agricultural and Food
(IJHARS)
• certification bodies.
Based on the decision of the Minister for
Agriculture and Rural Development, ten bodies
are authorized to carry out inspections and issue
and revoke certificates of compliance for organic
farming (Ministry of Agriculture and Rural
Development, 2014). Majority of respondents
(94 %) indicated a certificate obtained at
Ekogwarancja PTRE Ltd., Warsaw. Among the
actions that certification bodies implemented the
respondents indicated mainly organization of
training courses, seminars, advisory control and
information activities.
The third unit highly rated by the test group of
agricultural producers was the Agency for
Restructuring and Modernization of Agriculture.
Proceedings of the 2016 International Conference “ECONOMIC SCIENCE FOR RURAL DEVELOPMENT” No 41
Jelgava, LLU ESAF, 21-22 April 2016, pp. 140-146
1Corresponding author: Tel.: + 48 667-935-314; fax: +48 83 3449950. E-mail address: [email protected] 145
The Agency was created in 1994. In order to
promote the development of agriculture and rural
areas. It is the entity responsible for the
implementation of direct payments, among other
things, the Rural Development Programme
2007-2013. The ARMA also continues the
implementation of the assistance from national
funds in the form of subsidies to the interest on
investment loans.
Assessing the support of local government
units in the opinion of the respondents, it should
be noted that out of the four respondents
(Municipal Office, Office of the Poviat, the
Marshall's Office, Provincial Office) support by the
municipal office was rated the highest. Average
rating of the Municipal Office support in the
implementation of organic production among the
surveyed producers was at 2.63 (standard
deviation 1.18). Support of the Regional Office
and the Marshall's Office was rated much lower.
Average rating ranged respectively at the level of
1.85 and 1.65 (standard deviation: 1.02, 0.95).
Among the activities undertaken by Municipal
Offices, respondents mentioned mainly:
organization of festivals, fairs and promotional
activities. In the case of actions taken by District
Offices, educational activities related to the
organization of seminars, training and
information meetings had been highlighted.
Related activities were perceived by respondents
in relation to the activity of support granted by
the Regional Office and the Marshall’s Office.
However, it should be noted that only a single
respondent drew attention to the role of these
institutions in terms of financial support in the
form of subsidies and grants. Nevertheless, as
indicated by the research conducted by Polish
Academy of Sciences Institute of Rural and
Agricultural Development, active local
government units are an undeniable development
potential for both organic production and rural
areas in a broader context (Polish Academy of
Sciences Institute of Rural and Agricultural
Development, 2013). In the context of organic
production development, it is crucial to support
producer groups and other forms of farmers’
organized activity. The problematic aspects of
organic production development should constitute
the subject of analysis in many communes and
include their developmental strategies. In this
way, it might constitute the subject of a lot
greater interest as regards implementing various
actions undertaken on different levels of
government.
Conclusions
Implementation of new solutions, even related
to the modernization of agriculture and rural
areas is a challenge for both farmers as well as
the institutions that support these activities.
Particularly large role is to be played by public
institutions, which are, among others,
representatives of local governments.
The results indicate low assessment of support
from local government units in the
implementation of organic production, which may
be due to lack of action on this issue from their
side. However, one should also consider this bad
score regarding lack of knowledge on the actions
taken by local governments. The latter aspect is
especially pointed out by low awareness of
respondents in the organization of the process
associated with the payment of subsidies,
financial assistance. The hypothesis made in the
article has not been confirmed. Organic food
producers evaluated the support of both
Marshall’s Office and Governor’s Office as much
worse than that provided by Communal Office
and Poviat Office.
Respondents perceived a significant role of
local government units in terms of marketing
activities, especially promotion of the
organization of various events which allow
promoting organic production.
Any action taken by the local government as
reflected in the opinions of respondents can be
found in the tasks entrusted to them under the
legislation. The farmers have not indicated other
actions that would be the subject of local
Proceedings of the 2016 International Conference “ECONOMIC SCIENCE FOR RURAL DEVELOPMENT” No 41
Jelgava, LLU ESAF, 21-22 April 2016, pp. 140-146
1Corresponding author: Tel.: + 48 667-935-314; fax: +48 83 3449950. E-mail address: [email protected] 146
government units activity going beyond the
operations imposed on them. It does not mean
that such operations are not being implemented
but it may signalize the lack of communication
and flow of information between farmers and
public institutions.
Bibiography
1. Act (2013a). Ustawa z 8 marca 1990 r. o samorzadzie terytorialnym, Dz.U z 2013 r., nr 16, poz. 95 (Act of 8 March 1990 on the Local Government, Polish Journal of Laws Dz. U. of 2013, No. 16, item 95).
2. Act (2013b). Ustawa z dnia 5 czerwca 1998 r. o samorzadzie powiatowym, Dz. U. z 2013r. poz. 595, 645 ( Act of 5 June 1998 on the Poviat Government, Polish Journal of Laws Dz. U. of 2013, item 595, 645).
3. Act (2013c). Ustawa z dnia 11 marca 2013 r. o samorzadzie wojewodztwa, Dz. U. z 2013 r. poz. 596 ( Act of 11 March 2013 on the Voivodeship Government, Polish Journal of Laws Dz. U. of 2013, item 596).
4. Act (2014), Ustawa z dnia 8 marca 1990 r. o samorzadzie gminnym, Dz. U. z 2014 r., poz. 379, 1072 (Act of Act of 8 March 1990 on the Local Government, Polish Journal of Laws Dz. U. of 2014, item 379, 1072).
5. Agricultural and Food Quality Inspection (2014), Statistical Information of Organic Food Producers (Informacja statystyczna o producentach zywnosci ekologicznej), Inspekcja Jakosci Handlowej Artykułow Rolno-Spozywczych, Warszawa.
6. Ciburiene, J. (2014). Organic Agriculture for Sustainable Rural Development: Lithuanian Case. Economic Science for Rural Development No. 36, p. 56. Retrieved: http://www.esaf.llu.lv/getfile.php?id=821. Access: 10.12.2015.
7. Firlej, K., Rydz, A.(2012). The System of Agricultural Advisory Services in Poland and its Exploitation in the Context of 114 PROW 2007–2013 Operation. The volumes of Kujawy and Pomorze University in Bydgoszcz, No 2, p. 217.
8. Guzal-Dec, D. (2013). Operationalization of the Model Pressure-state-response Study of Ecological Valuables Rural Communities on the Example of the Province of Lublin: Annual Set the Environment Protection / Yearbook of Environmental Protection, Vol 15, No. 3, p. 2925-2941. Retrieved: http://www.ijhar-s.gov.pl/pliki/A-pliki-z-glownego-katalogu/ethernet/2014/czerwiec/Tabela%201%20liczba%20producentow%202013.pdf Access: 3.10.2014.
9. Ministry of Agriculture and Rural Development (2011), Action Plan for Food and Organic Farming in Poland in 2011-2014, Warsaw.
10. Ministry of Agriculture and Rural Development (2014). Information about the Institutions of Certification (Informacja o konstytucjach certyfikujacych), Ministerstwa Rolnictwa i Rozwoju Wsi, Warszawa. Retrieved: https://bip.minrol.gov.pl/Informacje-Branzowe/Produkcja-Roslinna/Rolnictwo-Ekologiczne/Jednostki-Certyfikujace. Access: 12.06.2014.
11. Polish Academy of Sciences Institute of Rural and Agricultural Development (2013). Ecological Farming as a Factor of Local Development– the Analysis of Selected Cases, Warsaw. Retrieved: http://irwirpan.waw.pl/polski/IRWiR_PAN_raport_Rolnictwo_ekologiczne_czynnikiem_rozwoju_lokalnego.pdf. Access: 10.12.2015.
12. Wojcik, G. (2012). The Importance of Organic Farming In Poland in the Context of Changes Planned for 2011-2014. Zootechnical News, No. 4, p. 109.
Research project no. 2011/01/D/HS4/ 03927 entitled "Environmental conditions and factors of
development of the economic functions of valuable natural areas of Lublin Voivodeship" funded by the
National Science Centre.
Proceedings of the 2016 International Conference “ECONOMIC SCIENCE FOR RURAL DEVELOPMENT” No 41
Jelgava, LLU ESAF, 21-22 April 2016, pp. 147-155
1Corresponding author. Tel.: +371-67089454 fax: +371-67089034. E-mail address: [email protected] 147
DEVELOPMENT OF ORGANIC AGRICULTURE IN LATVIA Tatjana Tambovceva1, Dr.oec., professor
1 Riga Technical University, Latvia
Abstract. In recent years, "green" lifestyle is becoming more typical. Agriculture is one of the most important sectors
which must be sustainable, because it provides basic human needs and can influence all society. Therefore, such
concepts as green products, organic food etc. are becoming relevant. Organic agriculture is being practiced in many
countries around the world. It is rapidly developed also in Europe in the past years. The aim of the research is to
estimate the development of organic agriculture in Latvia. The research is based on literature review as well as
secondary statistical data and comparative analysis. The author also compares the development of organic agriculture
in Latvia with her own previous research. The results show that Latvia is in the top five countries for organic farming in
Europe, the number of organic farms is very high: at the beginning of 2016 there are 3340 farms registered as organic
in Latvia. Latvia’s organic farms mostly have multi-branch production, and, it depends on the type of farming. It is
necessary to develop production systems, which are more environment-friendly and use local resources more
efficiently as well as are less dependent on artificial, industrial inputs.
Key words: organic, green, agriculture, farming, Latvia.
JEL code: Q1, Q01, Q13
Introduction
In today’s globalised world, every sector of
the economy needs to re-orient itself to meet the
changing demand. The concept of sustainability,
which originally referred to environmental
consequences of human activities, has been
widely discussed at the global and national levels
in any economic sector. The rural sectors are not
exceptions. Agriculture is one of the main sectors
which should be sustainable, that is, economically
profitable, socially responsible and
environmentally oriented. Agriculture is a multi-
functional sector which is closely related to the
environment. It also provides basic human
needs, and in many countries is an important
source of national income, foreign trade and
employment.
The aim of the research is to estimate the
development of organic agriculture in Latvia.
In order to achieve the aim, the author has
set up the following tasks: 1) to estimate
historical development of organic agriculture in
Latvia and its structure; 2) to analyse the current
situation of organic agriculture in Latvia.
Research methodology is based on literature
review as well as secondary statistical data and
comparative analysis. The general logical
methods of deduction and induction are used.
The analysis is also based on summary of the
results of earlier studies held by author in 2009
and 2013 (Tambovceva, Geipele, 2009;
Tambovceva, Tambovcevs, 2013).
The main sources are the official records and
reports of EUROSTAT (Statistical Office of the
European Commission), IFOAM (International
Federation of Organic Agriculture Movements),
the Ministry of Agriculture of Latvia (MA),
Agriculture Data Service (ADS), Food and
Veterinary Service (FVS) and Farm Accountancy
Data Network (FADN).
Research results and discussion
1. Sustainability and sustainable agriculture
Sustainability concept has been popular
worldwide over recent years and nowadays it's
used for almost every activity in human life. A
comprehensive definition of sustainability as the
attempt to balance economic, social, and
environmental goals may be as follows:
“improving the quality of human life while living
within the carrying capacity of the supporting
ecosystem”.
The concept of sustainability, which originally
referred to environmental consequences of
human activities, has been widely discussed not
only at the national but at the global level as well
as in particular economic sectors. Agriculture is
one of the main sectors which many believe
should be sustainable, that is, ecologically sound,
Proceedings of the 2016 International Conference “ECONOMIC SCIENCE FOR RURAL DEVELOPMENT” No 41
Jelgava, LLU ESAF, 21-22 April 2016, pp. 147-155
1Corresponding author. Tel.: +371-67089454 fax: +371-67089034. E-mail address: [email protected] 148
economically viable, and socially responsible. This
is so because agriculture provides basic human
needs, and in most developing countries it is an
important source of national income, foreign
trade and employment. Agriculture is also a
multi-functional sector which is closely related to
the environment. Agriculture is one of the biggest
environmental polluters and destroyers.
Agricultural production systems pollute soil and
water with agro-chemicals, reduce biodiversity,
lead to degradation, desertification, erosion of
soils and, in many cases result in poorly
structured, monotonic agricultural landscapes.
According to the Sustainable Development
Strategy of Latvia until 2030: “Sustainable use of
the natural capital may promote the forming of
the image of Latvia as green country. It is the
possibility to promote the development of export
and many sectors of economy and creative
activity, for example, in the service industry –
environmentally-friendly tourism, leisure,
recreation and medical treatment, health
oriented catering services; in agriculture –
biological agriculture and aquaculture…”
(Sustainable Development Strategy of Latvia until
2030, 2010).
Based on European Commission1 “Organic
agriculture is an agricultural system that seeks to
provide consumers with fresh, tasty and
authentic food while respecting natural life-cycle
systems”. It means that organic agriculture is a
production system that sustains the health of
soils, ecosystems and people.
Organic farming is a method of production
which places the highest emphasis on
environmental protection and, with regard to
livestock production, on animal welfare
considerations. It avoids or largely reduces the
use of synthetic chemical inputs such as
fertilisers, pesticides, additives and medicinal
products. The production of genetically modified
organisms (GMOs) and their use in animal feed is
1 http://ec.europa.eu/agriculture/organic/organic-farming/what-is-organic-farming/index_en.htm
forbidden. Based on the Eurostat2: “organic
farming differs from other agricultural production
methods in the application of regulated standards
(production rule), compulsory control schemes
and a specific labelling scheme”.
The International Federation of Organic
Agriculture Movements (IFOAM)3 presents its own
definition of organic agriculture: "Organic
agriculture is a production system that sustains
the health of soils, ecosystems and people. It
relies on ecological processes, biodiversity and
cycles adapted to local conditions, rather than
the use of inputs with adverse effects. Organic
Agriculture combines tradition, innovation and
science to benefit the shared environment and
promote fair relationships and a good quality of
life for all involved".
The objectives of organic farming are the
following:
• to ensure sustainable production of high-
quality healthy food (instead of concentrating
on maximizing yield), while maintaining crop
and livestock diversity and preserving the
environment (including plants, animals, soil,
water and air);
• to ensure the fulfilment of requirements for
livestock welfare (providing the animals with
access to daylight, air, clean water, natural
pastures and sufficient space etc.);
• to use direct solar energy more efficiently and,
as much as possible, to reduce the use of
fossil energy.
To achieve this, organic agriculture relies on a
number of objectives and principles as well as
common practices designed to minimise the
human impact on the environment, while
ensuring the agricultural system operates as
naturally as possible. Sustainable development in
agriculture is based on 4 principles IFOAM
(http://www.ifoam.bio/sites/default/files/poa_en
2 http://ec.europa.eu/eurostat/web/agriculture/ organic-farming 3 http://www.ifoam.bio/en/organic-landmarks/definition-organic-agriculture
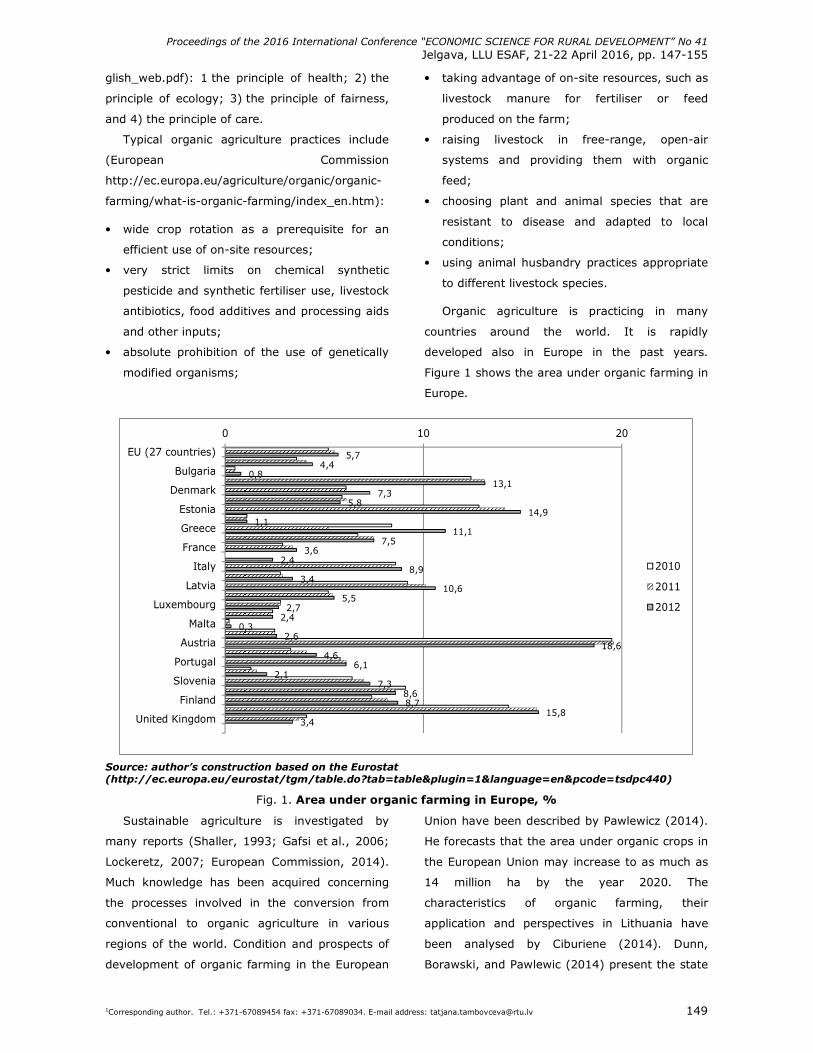
Proceedings of the 2016 International Conference “ECONOMIC SCIENCE FOR RURAL DEVELOPMENT” No 41
Jelgava, LLU ESAF, 21-22 April 2016, pp. 147-155
1Corresponding author. Tel.: +371-67089454 fax: +371-67089034. E-mail address: [email protected] 149
glish_web.pdf): 1 the principle of health; 2) the
principle of ecology; 3) the principle of fairness,
and 4) the principle of care.
Typical organic agriculture practices include
(European Commission
http://ec.europa.eu/agriculture/organic/organic-
farming/what-is-organic-farming/index_en.htm):
• wide crop rotation as a prerequisite for an
efficient use of on-site resources;
• very strict limits on chemical synthetic
pesticide and synthetic fertiliser use, livestock
antibiotics, food additives and processing aids
and other inputs;
• absolute prohibition of the use of genetically
modified organisms;
• taking advantage of on-site resources, such as
livestock manure for fertiliser or feed
produced on the farm;
• raising livestock in free-range, open-air
systems and providing them with organic
feed;
• choosing plant and animal species that are
resistant to disease and adapted to local
conditions;
• using animal husbandry practices appropriate
to different livestock species.
Organic agriculture is practicing in many
countries around the world. It is rapidly
developed also in Europe in the past years.
Figure 1 shows the area under organic farming in
Europe.
5,74,4
0,813,1
7,35,8
14,91,1
11,17,5
3,62,4
8,93,4
10,65,5
2,72,4
0,32,6
18,64,6
6,12,1
7,38,68,7
15,83,4
0 10 20
EU (27 countries)
Bulgaria
Denmark
Estonia
Greece
France
Italy
Latvia
Luxembourg
Malta
Austria
Portugal
Slovenia
Finland
United Kingdom
2010
2011
2012
Source: author’s construction based on the Eurostat (http://ec.europa.eu/eurostat/tgm/table.do?tab=table&plugin=1&language=en&pcode=tsdpc440)
Fig. 1. Area under organic farming in Europe, %
Sustainable agriculture is investigated by
many reports (Shaller, 1993; Gafsi et al., 2006;
Lockeretz, 2007; European Commission, 2014).
Much knowledge has been acquired concerning
the processes involved in the conversion from
conventional to organic agriculture in various
regions of the world. Condition and prospects of
development of organic farming in the European
Union have been described by Pawlewicz (2014).
He forecasts that the area under organic crops in
the European Union may increase to as much as
14 million ha by the year 2020. The
characteristics of organic farming, their
application and perspectives in Lithuania have
been analysed by Ciburiene (2014). Dunn,
Borawski, and Pawlewic (2014) present the state
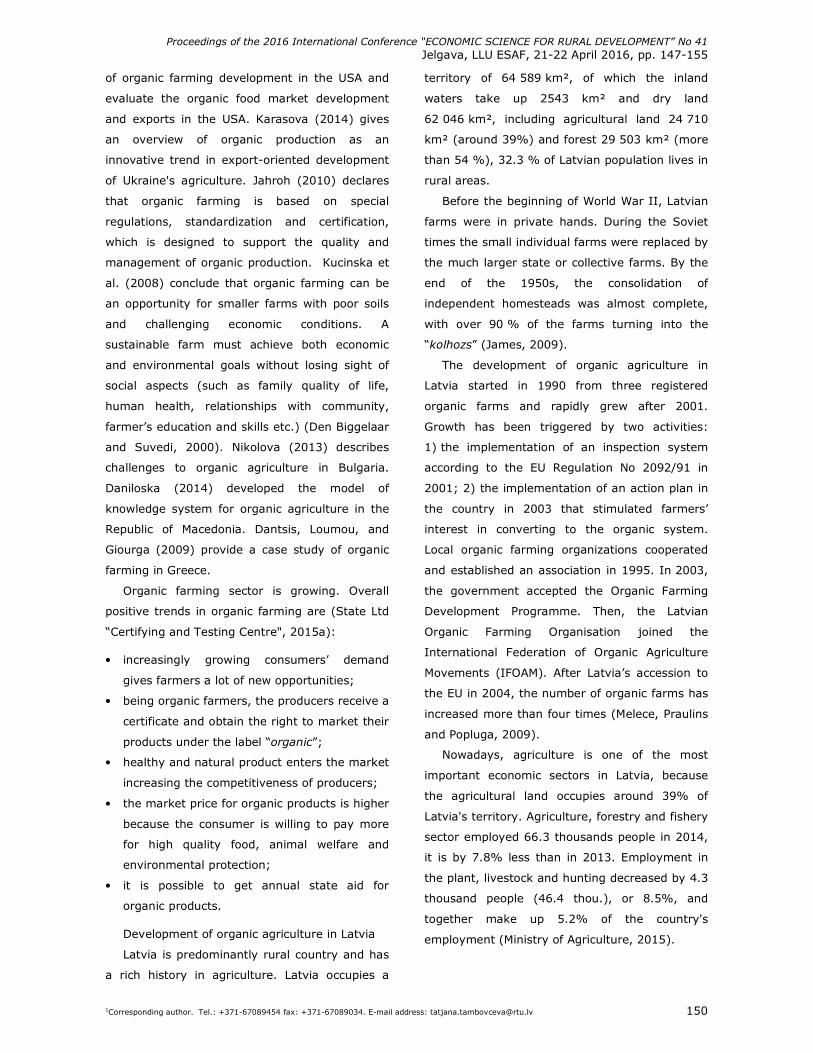
Proceedings of the 2016 International Conference “ECONOMIC SCIENCE FOR RURAL DEVELOPMENT” No 41
Jelgava, LLU ESAF, 21-22 April 2016, pp. 147-155
1Corresponding author. Tel.: +371-67089454 fax: +371-67089034. E-mail address: [email protected] 150
of organic farming development in the USA and
evaluate the organic food market development
and exports in the USA. Karasova (2014) gives
an overview of organic production as an
innovative trend in export-oriented development
of Ukraine's agriculture. Jahroh (2010) declares
that organic farming is based on special
regulations, standardization and certification,
which is designed to support the quality and
management of organic production. Kucinska et
al. (2008) conclude that organic farming can be
an opportunity for smaller farms with poor soils
and challenging economic conditions. A
sustainable farm must achieve both economic
and environmental goals without losing sight of
social aspects (such as family quality of life,
human health, relationships with community,
farmer’s education and skills etc.) (Den Biggelaar
and Suvedi, 2000). Nikolova (2013) describes
challenges to organic agriculture in Bulgaria.
Daniloska (2014) developed the model of
knowledge system for organic agriculture in the
Republic of Macedonia. Dantsis, Loumou, and
Giourga (2009) provide a case study of organic
farming in Greece.
Organic farming sector is growing. Overall
positive trends in organic farming are (State Ltd
“Certifying and Testing Centre", 2015a):
• increasingly growing consumers’ demand
gives farmers a lot of new opportunities;
• being organic farmers, the producers receive a
certificate and obtain the right to market their
products under the label “organic”;
• healthy and natural product enters the market
increasing the competitiveness of producers;
• the market price for organic products is higher
because the consumer is willing to pay more
for high quality food, animal welfare and
environmental protection;
• it is possible to get annual state aid for
organic products.
Development of organic agriculture in Latvia
Latvia is predominantly rural country and has
a rich history in agriculture. Latvia occupies a
territory of 64 589 km², of which the inland
waters take up 2543 km² and dry land
62 046 km², including agricultural land 24 710
km² (around 39%) and forest 29 503 km² (more
than 54 %), 32.3 % of Latvian population lives in
rural areas.
Before the beginning of World War II, Latvian
farms were in private hands. During the Soviet
times the small individual farms were replaced by
the much larger state or collective farms. By the
end of the 1950s, the consolidation of
independent homesteads was almost complete,
with over 90 % of the farms turning into the
“kolhozs” (James, 2009).
The development of organic agriculture in
Latvia started in 1990 from three registered
organic farms and rapidly grew after 2001.
Growth has been triggered by two activities:
1) the implementation of an inspection system
according to the EU Regulation No 2092/91 in
2001; 2) the implementation of an action plan in
the country in 2003 that stimulated farmers’
interest in converting to the organic system.
Local organic farming organizations cooperated
and established an association in 1995. In 2003,
the government accepted the Organic Farming
Development Programme. Then, the Latvian
Organic Farming Organisation joined the
International Federation of Organic Agriculture
Movements (IFOAM). After Latvia’s accession to
the EU in 2004, the number of organic farms has
increased more than four times (Melece, Praulins
and Popluga, 2009).
Nowadays, agriculture is one of the most
important economic sectors in Latvia, because
the agricultural land occupies around 39% of
Latvia's territory. Agriculture, forestry and fishery
sector employed 66.3 thousands people in 2014,
it is by 7.8% less than in 2013. Employment in
the plant, livestock and hunting decreased by 4.3
thousand people (46.4 thou.), or 8.5%, and
together make up 5.2% of the country's
employment (Ministry of Agriculture, 2015).
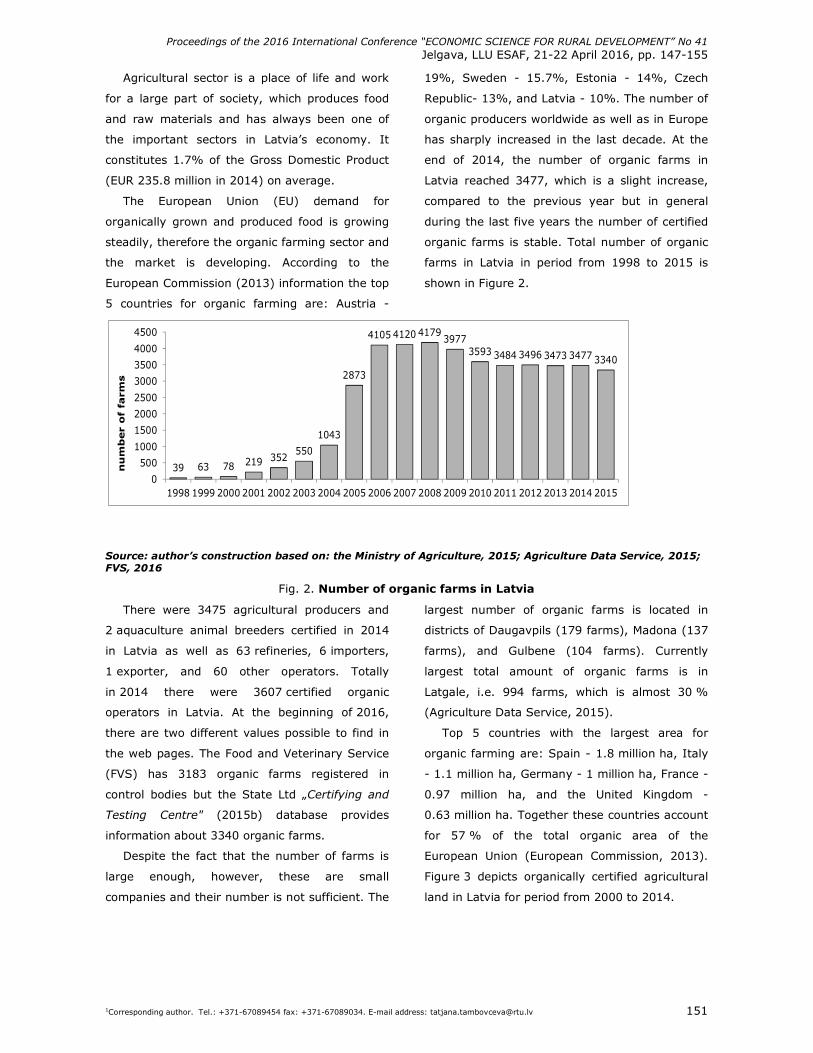
Proceedings of the 2016 International Conference “ECONOMIC SCIENCE FOR RURAL DEVELOPMENT” No 41
Jelgava, LLU ESAF, 21-22 April 2016, pp. 147-155
1Corresponding author. Tel.: +371-67089454 fax: +371-67089034. E-mail address: [email protected] 151
Agricultural sector is a place of life and work
for a large part of society, which produces food
and raw materials and has always been one of
the important sectors in Latvia’s economy. It
constitutes 1.7% of the Gross Domestic Product
(EUR 235.8 million in 2014) on average.
The European Union (EU) demand for
organically grown and produced food is growing
steadily, therefore the organic farming sector and
the market is developing. According to the
European Commission (2013) information the top
5 countries for organic farming are: Austria -
19%, Sweden - 15.7%, Estonia - 14%, Czech
Republic- 13%, and Latvia - 10%. The number of
organic producers worldwide as well as in Europe
has sharply increased in the last decade. At the
end of 2014, the number of organic farms in
Latvia reached 3477, which is a slight increase,
compared to the previous year but in general
during the last five years the number of certified
organic farms is stable. Total number of organic
farms in Latvia in period from 1998 to 2015 is
shown in Figure 2.
39 63 78 219 352550
1043
2873
4105 4120 4179 39773593 3484 3496 3473 3477 3340
0
500
1000
1500
2000
2500
3000
3500
4000
4500
1998 1999 2000 2001 2002 2003 2004 2005 2006 2007 2008 2009 2010 2011 2012 2013 2014 2015
nu
mb
er
of
farm
s
Source: author’s construction based on: the Ministry of Agriculture, 2015; Agriculture Data Service, 2015; FVS, 2016
Fig. 2. Number of organic farms in Latvia
There were 3475 agricultural producers and
2 aquaculture animal breeders certified in 2014
in Latvia as well as 63 refineries, 6 importers,
1 exporter, and 60 other operators. Totally
in 2014 there were 3607 certified organic
operators in Latvia. At the beginning of 2016,
there are two different values possible to find in
the web pages. The Food and Veterinary Service
(FVS) has 3183 organic farms registered in
control bodies but the State Ltd „Certifying and
Testing Centre" (2015b) database provides
information about 3340 organic farms.
Despite the fact that the number of farms is
large enough, however, these are small
companies and their number is not sufficient. The
largest number of organic farms is located in
districts of Daugavpils (179 farms), Madona (137
farms), and Gulbene (104 farms). Currently
largest total amount of organic farms is in
Latgale, i.e. 994 farms, which is almost 30 %
(Agriculture Data Service, 2015).
Top 5 countries with the largest area for
organic farming are: Spain - 1.8 million ha, Italy
- 1.1 million ha, Germany - 1 million ha, France -
0.97 million ha, and the United Kingdom -
0.63 million ha. Together these countries account
for 57 % of the total organic area of the
European Union (European Commission, 2013).
Figure 3 depicts organically certified agricultural
land in Latvia for period from 2000 to 2014.
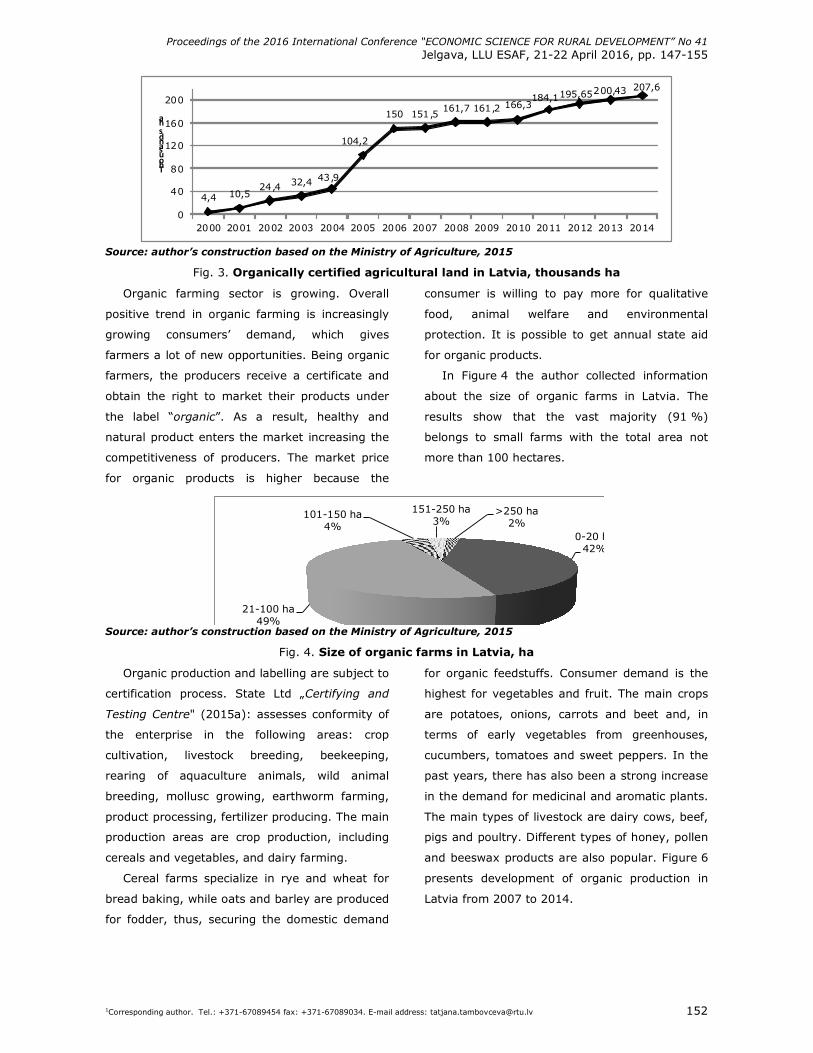
Proceedings of the 2016 International Conference “ECONOMIC SCIENCE FOR RURAL DEVELOPMENT” No 41
Jelgava, LLU ESAF, 21-22 April 2016, pp. 147-155
1Corresponding author. Tel.: +371-67089454 fax: +371-67089034. E-mail address: [email protected] 152
4,4 10,524,4 32,4 43,9
104,2
150 151,5161,7 161,2 166,3
184,1195,65200,43 207,6
0
40
80
120
160
200
2000 2001 2002 2003 2004 2005 2006 2007 2008 2009 2010 2011 2012 2013 2014
Thousandsha
Source: author’s construction based on the Ministry of Agriculture, 2015
Fig. 3. Organically certified agricultural land in Latvia, thousands ha
Organic farming sector is growing. Overall
positive trend in organic farming is increasingly
growing consumers’ demand, which gives
farmers a lot of new opportunities. Being organic
farmers, the producers receive a certificate and
obtain the right to market their products under
the label “organic”. As a result, healthy and
natural product enters the market increasing the
competitiveness of producers. The market price
for organic products is higher because the
consumer is willing to pay more for qualitative
food, animal welfare and environmental
protection. It is possible to get annual state aid
for organic products.
In Figure 4 the author collected information
about the size of organic farms in Latvia. The
results show that the vast majority (91 %)
belongs to small farms with the total area not
more than 100 hectares.
0-20 ha42%
21-100 ha49%
101-150 ha4%
151-250 ha3%
>250 ha2%
Source: author’s construction based on the Ministry of Agriculture, 2015
Fig. 4. Size of organic farms in Latvia, ha
Organic production and labelling are subject to
certification process. State Ltd „Certifying and
Testing Centre" (2015a): assesses conformity of
the enterprise in the following areas: crop
cultivation, livestock breeding, beekeeping,
rearing of aquaculture animals, wild animal
breeding, mollusc growing, earthworm farming,
product processing, fertilizer producing. The main
production areas are crop production, including
cereals and vegetables, and dairy farming.
Cereal farms specialize in rye and wheat for
bread baking, while oats and barley are produced
for fodder, thus, securing the domestic demand
for organic feedstuffs. Consumer demand is the
highest for vegetables and fruit. The main crops
are potatoes, onions, carrots and beet and, in
terms of early vegetables from greenhouses,
cucumbers, tomatoes and sweet peppers. In the
past years, there has also been a strong increase
in the demand for medicinal and aromatic plants.
The main types of livestock are dairy cows, beef,
pigs and poultry. Different types of honey, pollen
and beeswax products are also popular. Figure 6
presents development of organic production in
Latvia from 2007 to 2014.
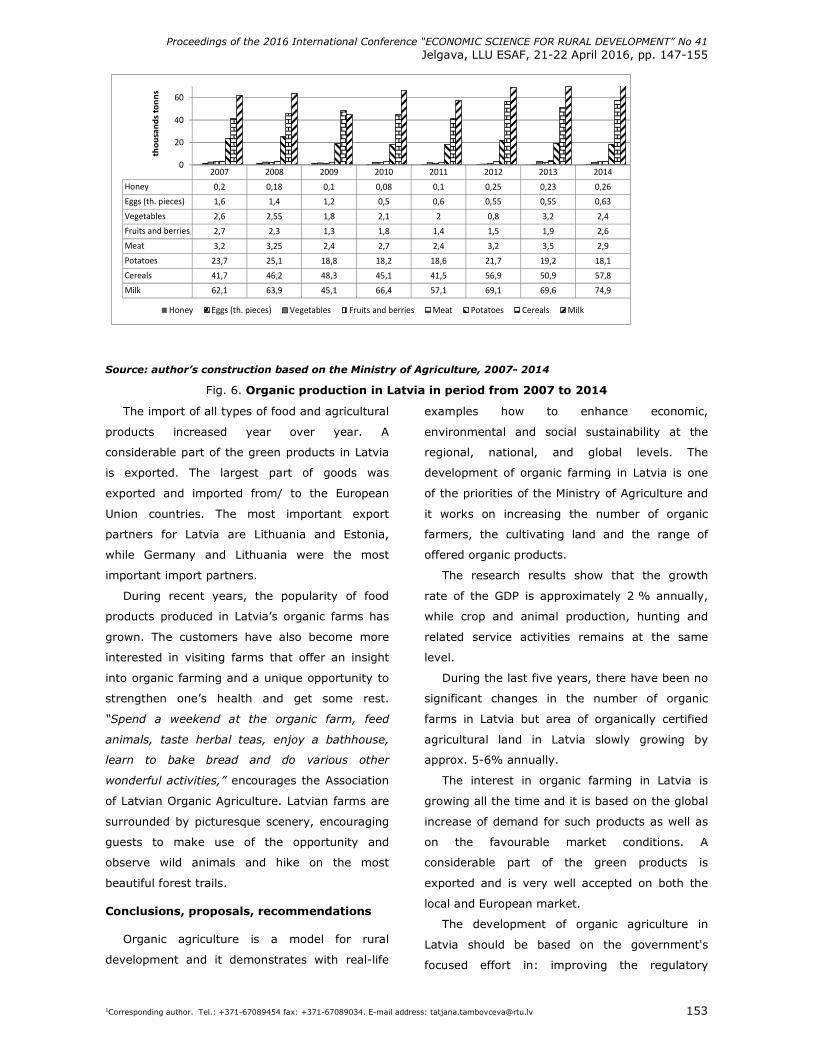
Proceedings of the 2016 International Conference “ECONOMIC SCIENCE FOR RURAL DEVELOPMENT” No 41
Jelgava, LLU ESAF, 21-22 April 2016, pp. 147-155
1Corresponding author. Tel.: +371-67089454 fax: +371-67089034. E-mail address: [email protected] 153
2007 2008 2009 2010 2011 2012 2013 2014
Honey 0,2 0,18 0,1 0,08 0,1 0,25 0,23 0,26
Eggs (th. pieces) 1,6 1,4 1,2 0,5 0,6 0,55 0,55 0,63
Vegetables 2,6 2,55 1,8 2,1 2 0,8 3,2 2,4
Fruits and berries 2,7 2,3 1,3 1,8 1,4 1,5 1,9 2,6
Meat 3,2 3,25 2,4 2,7 2,4 3,2 3,5 2,9
Potatoes 23,7 25,1 18,8 18,2 18,6 21,7 19,2 18,1
Cereals 41,7 46,2 48,3 45,1 41,5 56,9 50,9 57,8
Milk 62,1 63,9 45,1 66,4 57,1 69,1 69,6 74,9
0
20
40
60
tho
usa
nd
s to
nn
s
Honey Eggs (th. pieces) Vegetables Fruits and berries Meat Potatoes Cereals Milk
Source: author’s construction based on the Ministry of Agriculture, 2007- 2014
Fig. 6. Organic production in Latvia in period from 2007 to 2014
The import of all types of food and agricultural
products increased year over year. A
considerable part of the green products in Latvia
is exported. The largest part of goods was
exported and imported from/ to the European
Union countries. The most important export
partners for Latvia are Lithuania and Estonia,
while Germany and Lithuania were the most
important import partners.
During recent years, the popularity of food
products produced in Latvia’s organic farms has
grown. The customers have also become more
interested in visiting farms that offer an insight
into organic farming and a unique opportunity to
strengthen one’s health and get some rest.
“Spend a weekend at the organic farm, feed
animals, taste herbal teas, enjoy a bathhouse,
learn to bake bread and do various other
wonderful activities,” encourages the Association
of Latvian Organic Agriculture. Latvian farms are
surrounded by picturesque scenery, encouraging
guests to make use of the opportunity and
observe wild animals and hike on the most
beautiful forest trails.
Conclusions, proposals, recommendations
Organic agriculture is a model for rural
development and it demonstrates with real-life
examples how to enhance economic,
environmental and social sustainability at the
regional, national, and global levels. The
development of organic farming in Latvia is one
of the priorities of the Ministry of Agriculture and
it works on increasing the number of organic
farmers, the cultivating land and the range of
offered organic products.
The research results show that the growth
rate of the GDP is approximately 2 % annually,
while crop and animal production, hunting and
related service activities remains at the same
level.
During the last five years, there have been no
significant changes in the number of organic
farms in Latvia but area of organically certified
agricultural land in Latvia slowly growing by
approx. 5-6% annually.
The interest in organic farming in Latvia is
growing all the time and it is based on the global
increase of demand for such products as well as
on the favourable market conditions. A
considerable part of the green products is
exported and is very well accepted on both the
local and European market.
The development of organic agriculture in
Latvia should be based on the government's
focused effort in: improving the regulatory
Proceedings of the 2016 International Conference “ECONOMIC SCIENCE FOR RURAL DEVELOPMENT” No 41
Jelgava, LLU ESAF, 21-22 April 2016, pp. 147-155
1Corresponding author. Tel.: +371-67089454 fax: +371-67089034. E-mail address: [email protected] 154
framework and harmonizing it with international
standards, subsidies for organic farmers,
promoting the development of production and
sales infrastructure for organic agriculture’s
products, shortening of food chains, any other
support for organic farming market participants.
Changes for the whole farming system are
necessary which show the multifunctional role of
agriculture.
Bibliography
1. Agriculture Data Service. (2015). [Lauksaimniecibas datu serviss]. Retrieved: http://pub.ldc.gov.lv/pub_bio.php. Access: 03.01.2016.
2. Area under Organic Farming. Eurostat. Retrieved: http://ec.europa.eu/eurostat/tgm/table.do?tab=table&plugin=1&language=en&pcode=tsdpc440. Access: 06.01.2016
3. Ciburiene, J. (2014). Organic Agriculture for Sustainable Rural Development: Lithuanian Case. Economic Science for Rural Development. Jelgava, Latvia University of Agriculture, No. 36. pp. 51-57.
4. Daniloska, N. (2014). Model of Knowledge System for Organic Agriculture in the Republic of Macedonia. Economic Development, Volume 1, issue 2, pp. 49-65.
5. Dantsis, T., Loumou, A., Giourga, C. (2009). Organic Agriculture’s Approach Towards Sustainability; Its Relationship with the Agro-Industrial Complex, A Case Study in Central Macedonia, Greece. Journal of Agriculture Environmental Ethics, Volume 22, pp. 197–216.
6. Definition of Organic Agriculture. IFOAM Organics International. Retrieved: http://www.ifoam.bio/en/organic-landmarks/definition-organic-agriculture Access: 26.12.2015
7. Den Biggelaar, C., Suvedi, M. (2000.) Farmers' Definitions, Goals, and Bottlenecks of Sustainable Agriculture in the North-Ventral Region. Agriculture and Human Values, Volume 17, issue 4, pp. 347-358.
8. Dunn, J.W., Bórawski, P., Pawlewic, A. (2014). Development of Organic Farming in the USA. Oeconomia, Volume 13, issue 3, pp. 55–68.
9. Food and Veterinary Service (FVS). (2016). Kontroles institucijas registretie biologiskas lauksaimniecibas uznemumi. Retrieved: http://www.pvd.gov.lv/lat/lab_izvlne/registri/atzto_un_reistrto_uzmumu_sarak/kontroles_institcijas_reistrti Access: 07.01.2016
10. Gafsi, M., Legagneux, B., Nguyen, G., Robin, P. (2006). Toward Sustainable Farming Systems: Effectiveness and Deficiency of the French Procedure of Sustainable Agriculture. Agriculture Systems, Volume 90, pp.226–242.
11. Jahroh, S. (2010). Organic Farming Development in Indonesia: Lessons Learned from Organic Farming in West Java and North Sumatra. ISDA (Innovation and Sustainable Development in Agriculture and Food), Montpellier-France, June 28-30. Retrieved: www.isda2010.net Access: 13.11.2015.
12. James, O. (2009). Latvian Farming's from Traditional Methods to Organic Incentives. Retrieved: http://www.baltictimes.com/news/articles/23574/. Access: 05.01.2016
13. Karasova, N. (2014). Organic Production as an Innovative Trend in Export-Oriented Development of Ukraine's Agriculture. Management Theory and Studies for Rural Business and Infrastructure Development. Scientific Journal. Volume 36, issue 2. pp. 308-315.
14. Kucinska K., Pelc J., Golba J., Popławska A. (2008). The Prospects of Organic Agriculture Development in the Chosen Regions of Poland Podkarpacie and Kurpie. 16th IFOAM Organic World Congress, Modena, Italy, 16-20 June. Retrieved: http://orgprints.org/11916/1/11916. pdf Access 14.11.2015.
15. Lockeretz, W. (2007). Organic Farming: an International History. Wallingford: CABI. p.282
16. Ministry of Agriculture. (2015). [Zemkopibas ministrija]. Latvijas lauksaimnieciba 2015. Retrieved: https://www.zm.gov.lv/public/files/CMS_Static_Page_Doc/00/00/00/63/66/LS_gadazinojums_2015.pdf Access: 27.12.2015
17. Melece, L., Praulins, A., Popluga, D. (2009). Organic Farming in Latvia: Development and Economics. Zemes Ukio Mokslai. Volume 16, issue 3–4, pp. 145–153
18. Nikolova, M. (2013.) Challenges to Organic Agriculture in Bulgaria. Ekonomske Teme. Volume 51, issue 1, pp. 191-208.
19. Organic Farming. Eurostat. Retrieved: http://ec.europa.eu/eurostat/web/agriculture/organic-farming. Access: 16.12.2015
20. Pawlewicz, A. (2014). Importance of Horizontal Integration in Organic Farming. Economic Science for Rural Development. Jelgava, Latvia University of Agriculture, No. 34. 2014. pp. 112-120.
21. Principles of Organic Agriculture. IFOAM Organics International. Retrieved: http://www.ifoam.bio/sites/default/files/poa_english_web.pdf. Access: 26.12.2015
22. Shaller, N. (1993). The Concept of Agricultural Sustainability. Agriculture, Ecosystems and Environment. Volume, 46, pp. 89–97.
23. State Ltd „Certifying and Testing Centre". (2015a). Certification of organic agricultural enterprises. Retrieved: http://www.stc.lv/en/services/certification-of-organic-agricultural-enterprises/ Access: 16.12.2015
24. State Ltd „Certifying and Testing Centre". (2015b). Issued certificates. Retrieved: http://www.stc.lv/lv/pakalpojumi/biologiskas-lauksaimniecibas-uznemumu-sertifikacija/izsniegtie-sertifikati/ Access: 16.12.2015
Proceedings of the 2016 International Conference “ECONOMIC SCIENCE FOR RURAL DEVELOPMENT” No 41
Jelgava, LLU ESAF, 21-22 April 2016, pp. 147-155
1Corresponding author. Tel.: +371-67089454 fax: +371-67089034. E-mail address: [email protected] 155
25. Sustainable Development Strategy of Latvia until 2030, (2010). Retrieved: http://www.cbs.nl/NR/rdonlyres/B7A5865F-0D1B-42AE-A838-FBA4CA31674D/0/Latvia_2010.pdf. Access: 16.12.2015
26. Tambovceva, T., Geipele, I. (2009). Sustainable Agriculture in Latvia. Ekonomika ir vadyba: aktualijos ir perspektyvos, Volume 2, issue 15, pp. 286–294.
27. Tambovceva T., Tambovcevs A. (2013). Development of Organic Agriculture: Case of Latvia // Recent Advances in Energy, Environment, Ecosystems and Development, Volume 12. Proceeding of the International Conference on Environment, Energy, Ecosystems and Development, EEED 2013, Greece, Rhodes, pp. 108-115.
28. The EU Organic Farming (R)evolution. (2013). European Commission. Retrieved: http://ec.europa.eu/agriculture/organic/images/infographics/organic-farming_en.pdf Access: 10.12.2015.
29. What is Organic Farming. (2014). European Commission. Retrieved: http://ec.europa.eu/agriculture/organic/organic-farming/what-is-organic-farming/index_en.htm Access: 03.01.2016.
Proceedings of the 2016 International Conference “ECONOMIC SCIENCE FOR RURAL DEVELOPMENT” No 41
Jelgava, LLU ESAF, 21-22 April 2016, pp. 156-163
1Corresponding author. Tel.: + 421 37 641 4126, 4134; fax: + 421 37 6415 150.E-mail address: [email protected], [email protected] 156
SOCIO – RESPONSIBLE BEHAVIOR OF SMALL AND MEDIUM SIZED COMPANIES Iveta Ubreziova1, prof. ing. PhD.; Elena Horska1, prof. Dr. ing.;
Kamila Moravcikova1, ing., Kovacsova Barbora1, ing.
1Slovak University of Agriculture in Nitra, Slovak Republic
Abstract. Small and medium-sized enterprises (SMEs) have a strong impact on the economy of each country but their
development depends on the general state of the national economy and also on the economic conjuncture in other
European countries. But the entrepreneurial success depends also on the position of SMEs mainly in external
environment, where the SMEs companies have dealt with own activities as well as how the SMEs have taken into
account the CSR. The main goal of the submitted paper is to evaluate the socio – responsible behaviour of small and
medium sized companies by using of selected information and methods of evaluation. This article contributes primary
information from literature sources and secondary information from questionnaire research, which were processed by
the statistical method called χ2 test of square contingency and other methods.
The research also studied the customer understanding of CSR and revealed that people expect companies to act
beyond their legal responsibilities and commonly imagine ethical behaviour, environmental protection and high quality
of products and services among three most common characteristics of responsible behaviour of enterprises. The tasks
of research have been confirmed on the main goal of the article.
In conclusion, we evaluated the results from the questionnaire in total and suggested recommendations for the
oncoming small and medium sized enterpris´s business activity.
Key words: small and medium sized enterprises (SMEs), Corporate Social Responsibility, rural development
JEL code: M4, Q56, R58
Introduction
Small and medium-sized enterprises play a
significant and essential role in all countries with
a market economy. They also have extraordinary
significance in the development of the Slovak
economy, for creating new jobs and in regional
development. However, small and medium-sized
enterprises are to an increased extent sensitive
to the quality of the business environment. The
government’s task is to continue improving the
business environment and thereby generating the
conditions for increasing their competitiveness in
the domestic and international markets. The
categorization of enterprises by size used in this
chapter is in accordance with the European
Commission Recommendation No 2003/361 EC,
in force from 1 January 2005. The SME category
is composed of businesses employing less than
250 employees, while enterprises with 250
employees or more are considered large. Among
SMEs, a differentiation is made between micro-
enterprises (0-9 employees), small enterprises
(10-49 employees) and medium-sized
enterprises (50-249 employees). In cases where
micro-enterprises are not separately broken out,
all enterprises with 0-49 employees are classified
as small enterprises. From this point of view, it is
possible to state that the SMEs have played very
important role in application Corporate Social
Responsibility (CSR) in their activities and have
the impact on their development in rural
environment (Palkechova L. et al., 2014). It
means that the Corporate Social Responsibility
(CSR) is not new but nowadays it seems
everyone is talking about it and organizations
and businesses are being urged to protect the
environment, save energy, and use ethical
trading methods. The current concern that all
businesses and the general public have for ethical
behaviour and social responsibility is not
restricted to the domestic situation. There are
many authors who deal with the CSR in the
expert´s or scientific articles. Although there was
a huge debate about CSR during the 1950s, there
was not a lot of action. Following Carroll (2008),
business leaders were just learning how to get
comfortable with this concept. Besides this,
Carroll emphasizes the fact that in this period
society could notice just few corporate actions
other than philanthropy. What is most important
for the period between the 1950s and the 1960s
Proceedings of the 2016 International Conference “ECONOMIC SCIENCE FOR RURAL DEVELOPMENT” No 41
Jelgava, LLU ESAF, 21-22 April 2016, pp. 156-163
1Corresponding author. Tel.: + 421 37 641 4126, 4134; fax: + 421 37 6415 150.E-mail address: [email protected], [email protected] 157
is the fact, the social responsibility has moved
from practice to academic field and became a
theoretical concept (Gond, Moon, 2011).
Especially in Europe, where 99% of business
companies are SMEs, the focus is devoted to
more structured implementation of CSR concept
into SMEs business strategies (Ubreziova, A. and
Horska, 2011). The same opinion is shared Mura
and Buleca (2011) and Ubreziova et al. (2013) or
Gurska and Valova (2014). Concept of CSR plays
an important role in this environment and
presents a great opportunity for companies to
become successful while also making world a
better place. The corporate social responsibility of
companies trying to enter new markets in
relation to rural development and internationalize
their production is a hot topic, nowadays.
Decision makers are solving issues connected
with the profit maximization, quality
improvement, lowering costs, outsourcing,
resources recovery, and satisfaction of
stakeholders. Companies, operating on more
than one markets, have to adapt their production
processes and management to the requirements
of the several markets. The European
Commission's definition highlights the voluntary
nature of this particular concept and the impact
on the functioning of the company´s
stakeholders (European Commission, 2011).
According Skypalova and Kucerova (2014), many
small and medium sized enterprises in the Czech
Republic have taken part in development of CSR
concept and resulted in recommendations for the
government in the form of concrete proposals on
how the government could be involved in
supporting the CSR concept with focus on SMEs.
The basic recommendation is to formulate
national documents (National Strategy and
National Action Plan for CSR) as
recommendations that will clearly identify the
objectives and strategy of the Czech government
in the CSR area. The state should primarily fulfil
the informational role (dissemination of
information among companies and other
stakeholders in the region via chambers of
commerce and information sites), supportive role
(individual assistance of the employees of the
Ministry of Trade and Industry towards SMEs
representatives) and educational role (to educate
SMEs managers on CSR via e-learning and
individual coaching).
This paper was created within the research
project VEGA supported by the Ministry of
Education, Science, Research and Sport of the
Slovak Republic VEGA Corporate Social
Responsibility (CSR) of the Slovak Enterprises in
the context of Internationalization in Business.
Project registration number 1/0044/13. The time
of research was April 2014 till April 2015.
Since the thesis is focused on SMEs, the main
stage of research will be based on a random
sample of 100 companies in the Slovak Republic
with respect to proportionate representation of
every size – micro, small and medium sized
companies. The data acquired from the
questionnaire were statistically processed in
Microsoft Excel and displayed by using both
graphical and numerical means.
As a part of research, the following
hypotheses in relation to the research in selected
company were formulated:
• It is assumed that there is a relation between
the knowledge of CSR concept and education
level achieved.
• It is assumed that there is a relation between
the preference of particular CSR aspect and
gender of the respondent.
• It is assumed that there is a relation between
the familiarity of selected company and age of
the respondent.
As mentioned above, the primary data
obtained from questionnaire survey and
documents from the companies were processed
by the use of mathematical and statistical
methods. To graphically display research results,
the authors used MS Excel and statistical
processing SAS. The following methods and tests
were applied:
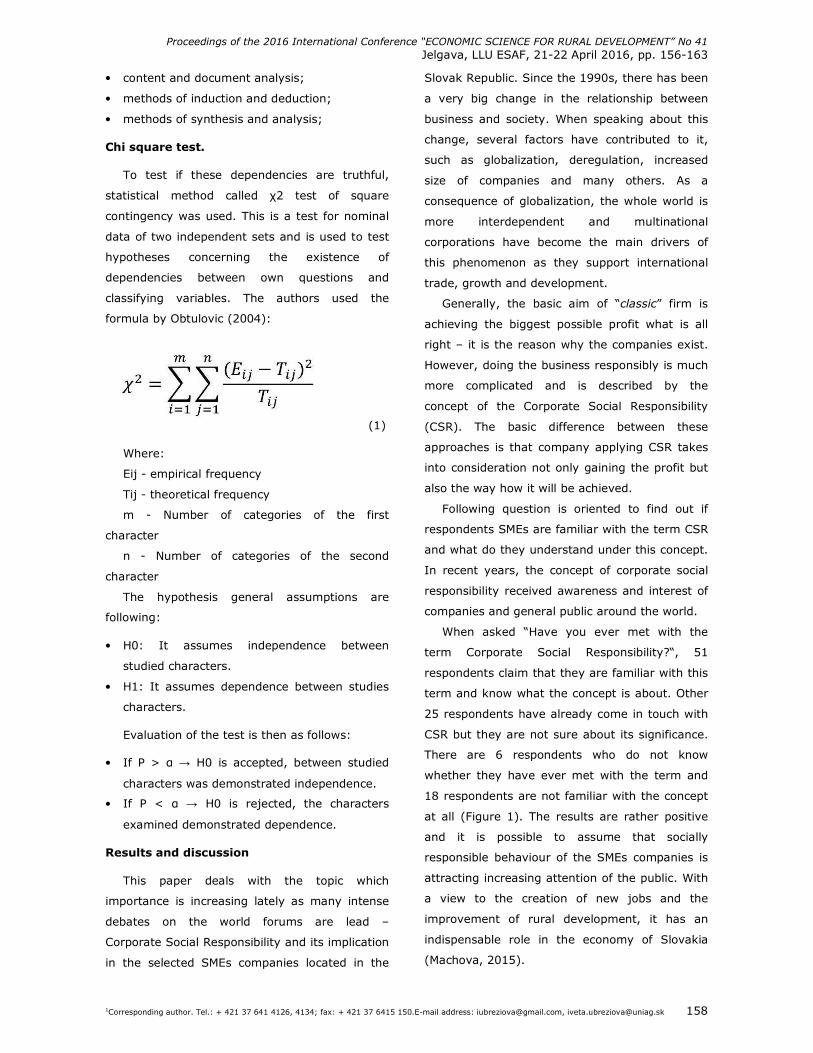
Proceedings of the 2016 International Conference “ECONOMIC SCIENCE FOR RURAL DEVELOPMENT” No 41
Jelgava, LLU ESAF, 21-22 April 2016, pp. 156-163
1Corresponding author. Tel.: + 421 37 641 4126, 4134; fax: + 421 37 6415 150.E-mail address: [email protected], [email protected] 158
• content and document analysis;
• methods of induction and deduction;
• methods of synthesis and analysis;
Chi square test.
To test if these dependencies are truthful,
statistical method called χ2 test of square
contingency was used. This is a test for nominal
data of two independent sets and is used to test
hypotheses concerning the existence of
dependencies between own questions and
classifying variables. The authors used the
formula by Obtulovic (2004):
(1)
Where:
Eij - empirical frequency
Tij - theoretical frequency
m - Number of categories of the first
character
n - Number of categories of the second
character
The hypothesis general assumptions are
following:
• H0: It assumes independence between
studied characters.
• H1: It assumes dependence between studies
characters.
Evaluation of the test is then as follows:
• If P > α → H0 is accepted, between studied
characters was demonstrated independence.
• If P < α → H0 is rejected, the characters
examined demonstrated dependence.
Results and discussion
This paper deals with the topic which
importance is increasing lately as many intense
debates on the world forums are lead –
Corporate Social Responsibility and its implication
in the selected SMEs companies located in the
Slovak Republic. Since the 1990s, there has been
a very big change in the relationship between
business and society. When speaking about this
change, several factors have contributed to it,
such as globalization, deregulation, increased
size of companies and many others. As a
consequence of globalization, the whole world is
more interdependent and multinational
corporations have become the main drivers of
this phenomenon as they support international
trade, growth and development.
Generally, the basic aim of “classic” firm is
achieving the biggest possible profit what is all
right – it is the reason why the companies exist.
However, doing the business responsibly is much
more complicated and is described by the
concept of the Corporate Social Responsibility
(CSR). The basic difference between these
approaches is that company applying CSR takes
into consideration not only gaining the profit but
also the way how it will be achieved.
Following question is oriented to find out if
respondents SMEs are familiar with the term CSR
and what do they understand under this concept.
In recent years, the concept of corporate social
responsibility received awareness and interest of
companies and general public around the world.
When asked “Have you ever met with the
term Corporate Social Responsibility?“, 51
respondents claim that they are familiar with this
term and know what the concept is about. Other
25 respondents have already come in touch with
CSR but they are not sure about its significance.
There are 6 respondents who do not know
whether they have ever met with the term and
18 respondents are not familiar with the concept
at all (Figure 1). The results are rather positive
and it is possible to assume that socially
responsible behaviour of the SMEs companies is
attracting increasing attention of the public. With
a view to the creation of new jobs and the
improvement of rural development, it has an
indispensable role in the economy of Slovakia
(Machova, 2015).
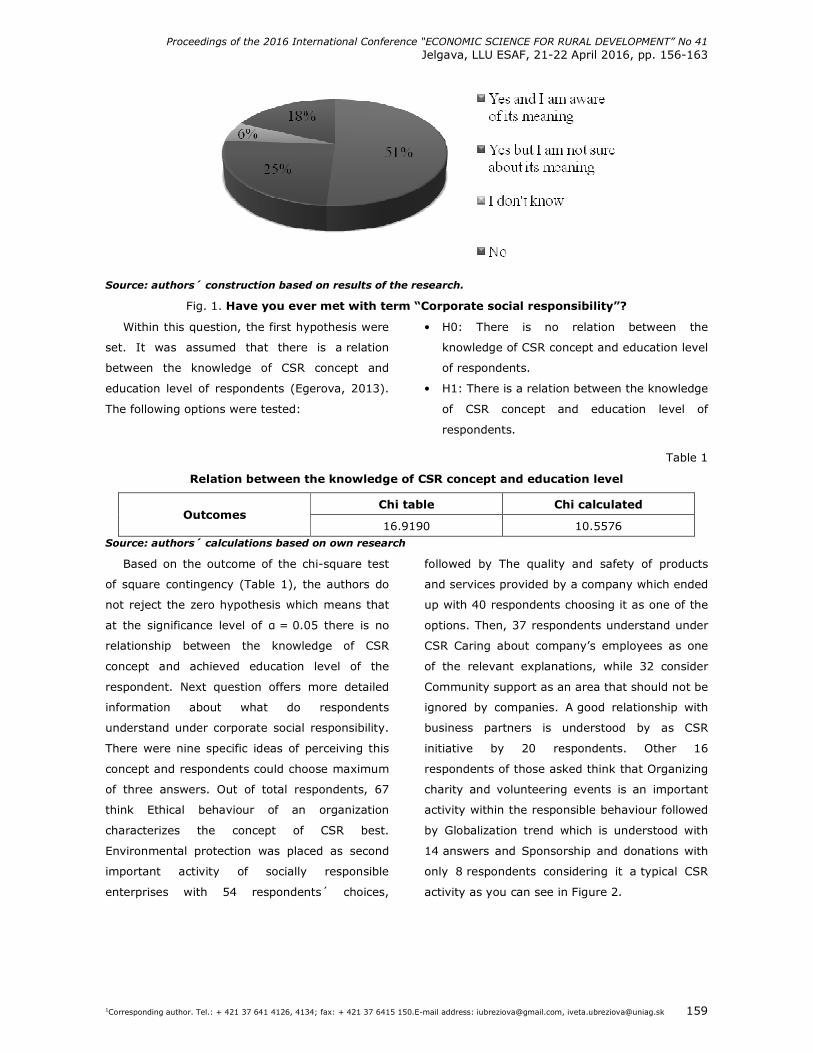
Proceedings of the 2016 International Conference “ECONOMIC SCIENCE FOR RURAL DEVELOPMENT” No 41
Jelgava, LLU ESAF, 21-22 April 2016, pp. 156-163
1Corresponding author. Tel.: + 421 37 641 4126, 4134; fax: + 421 37 6415 150.E-mail address: [email protected], [email protected] 159
Source: authors´ construction based on results of the research.
Fig. 1. Have you ever met with term “Corporate social responsibility”?
Within this question, the first hypothesis were
set. It was assumed that there is a relation
between the knowledge of CSR concept and
education level of respondents (Egerova, 2013).
The following options were tested:
• H0: There is no relation between the
knowledge of CSR concept and education level
of respondents.
• H1: There is a relation between the knowledge
of CSR concept and education level of
respondents.
Table 1
Relation between the knowledge of CSR concept and education level
Chi table Chi calculated Outcomes
16.9190 10.5576 Source: authors´ calculations based on own research
Based on the outcome of the chi-square test
of square contingency (Table 1), the authors do
not reject the zero hypothesis which means that
at the significance level of α = 0.05 there is no
relationship between the knowledge of CSR
concept and achieved education level of the
respondent. Next question offers more detailed
information about what do respondents
understand under corporate social responsibility.
There were nine specific ideas of perceiving this
concept and respondents could choose maximum
of three answers. Out of total respondents, 67
think Ethical behaviour of an organization
characterizes the concept of CSR best.
Environmental protection was placed as second
important activity of socially responsible
enterprises with 54 respondents´ choices,
followed by The quality and safety of products
and services provided by a company which ended
up with 40 respondents choosing it as one of the
options. Then, 37 respondents understand under
CSR Caring about company’s employees as one
of the relevant explanations, while 32 consider
Community support as an area that should not be
ignored by companies. A good relationship with
business partners is understood by as CSR
initiative by 20 respondents. Other 16
respondents of those asked think that Organizing
charity and volunteering events is an important
activity within the responsible behaviour followed
by Globalization trend which is understood with
14 answers and Sponsorship and donations with
only 8 respondents considering it a typical CSR
activity as you can see in Figure 2.
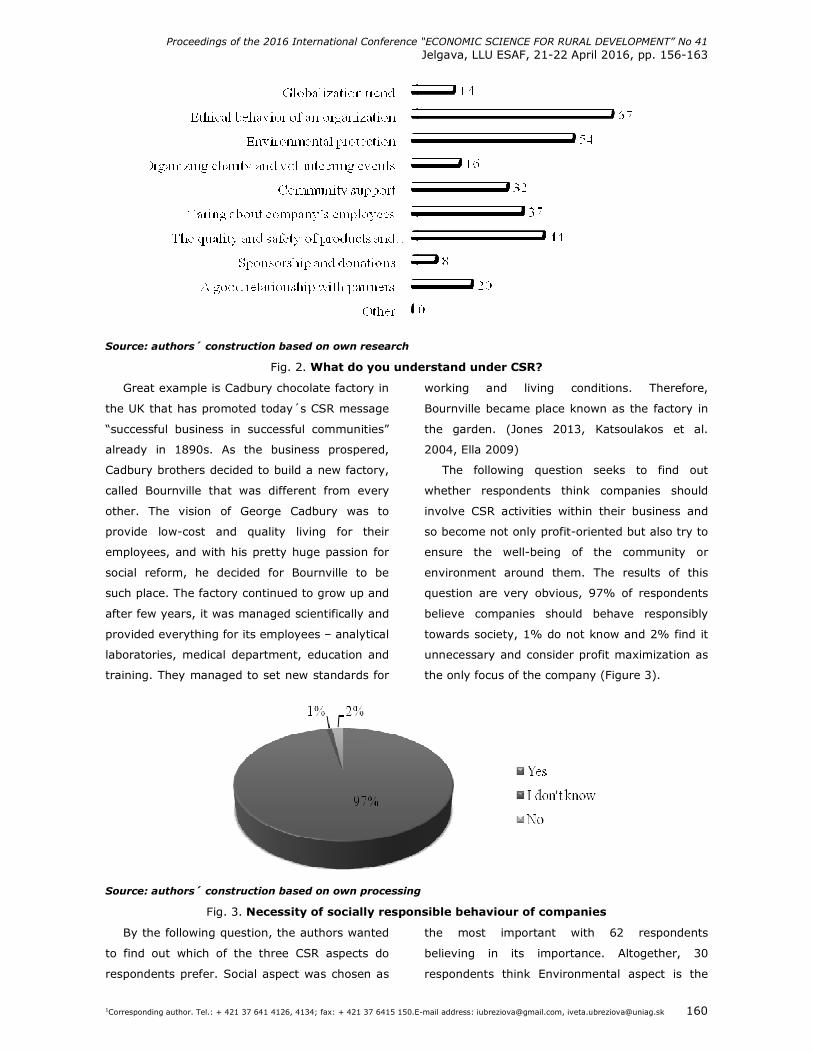
Proceedings of the 2016 International Conference “ECONOMIC SCIENCE FOR RURAL DEVELOPMENT” No 41
Jelgava, LLU ESAF, 21-22 April 2016, pp. 156-163
1Corresponding author. Tel.: + 421 37 641 4126, 4134; fax: + 421 37 6415 150.E-mail address: [email protected], [email protected] 160
Source: authors´ construction based on own research
Fig. 2. What do you understand under CSR?
Great example is Cadbury chocolate factory in
the UK that has promoted today´s CSR message
“successful business in successful communities”
already in 1890s. As the business prospered,
Cadbury brothers decided to build a new factory,
called Bournville that was different from every
other. The vision of George Cadbury was to
provide low-cost and quality living for their
employees, and with his pretty huge passion for
social reform, he decided for Bournville to be
such place. The factory continued to grow up and
after few years, it was managed scientifically and
provided everything for its employees – analytical
laboratories, medical department, education and
training. They managed to set new standards for
working and living conditions. Therefore,
Bournville became place known as the factory in
the garden. (Jones 2013, Katsoulakos et al.
2004, Ella 2009)
The following question seeks to find out
whether respondents think companies should
involve CSR activities within their business and
so become not only profit-oriented but also try to
ensure the well-being of the community or
environment around them. The results of this
question are very obvious, 97% of respondents
believe companies should behave responsibly
towards society, 1% do not know and 2% find it
unnecessary and consider profit maximization as
the only focus of the company (Figure 3).
Source: authors´ construction based on own processing
Fig. 3. Necessity of socially responsible behaviour of companies
By the following question, the authors wanted
to find out which of the three CSR aspects do
respondents prefer. Social aspect was chosen as
the most important with 62 respondents
believing in its importance. Altogether, 30
respondents think Environmental aspect is the
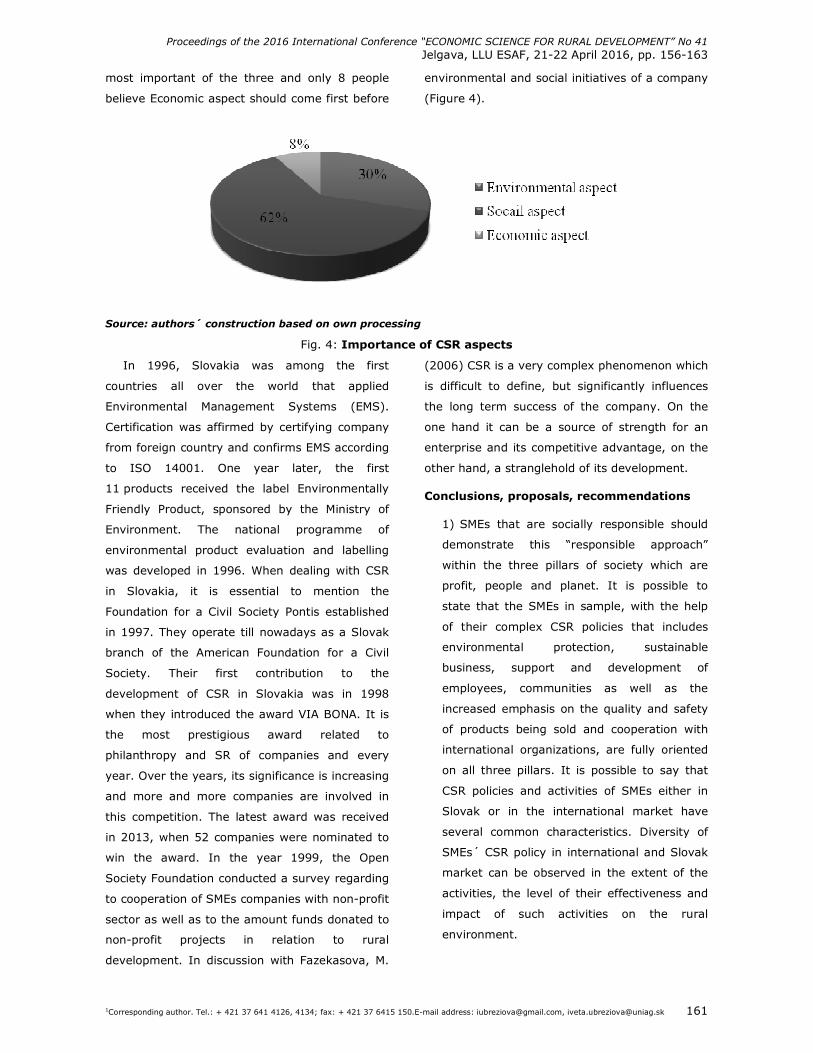
Proceedings of the 2016 International Conference “ECONOMIC SCIENCE FOR RURAL DEVELOPMENT” No 41
Jelgava, LLU ESAF, 21-22 April 2016, pp. 156-163
1Corresponding author. Tel.: + 421 37 641 4126, 4134; fax: + 421 37 6415 150.E-mail address: [email protected], [email protected] 161
most important of the three and only 8 people
believe Economic aspect should come first before
environmental and social initiatives of a company
(Figure 4).
Source: authors´ construction based on own processing
Fig. 4: Importance of CSR aspects
In 1996, Slovakia was among the first
countries all over the world that applied
Environmental Management Systems (EMS).
Certification was affirmed by certifying company
from foreign country and confirms EMS according
to ISO 14001. One year later, the first
11 products received the label Environmentally
Friendly Product, sponsored by the Ministry of
Environment. The national programme of
environmental product evaluation and labelling
was developed in 1996. When dealing with CSR
in Slovakia, it is essential to mention the
Foundation for a Civil Society Pontis established
in 1997. They operate till nowadays as a Slovak
branch of the American Foundation for a Civil
Society. Their first contribution to the
development of CSR in Slovakia was in 1998
when they introduced the award VIA BONA. It is
the most prestigious award related to
philanthropy and SR of companies and every
year. Over the years, its significance is increasing
and more and more companies are involved in
this competition. The latest award was received
in 2013, when 52 companies were nominated to
win the award. In the year 1999, the Open
Society Foundation conducted a survey regarding
to cooperation of SMEs companies with non-profit
sector as well as to the amount funds donated to
non-profit projects in relation to rural
development. In discussion with Fazekasova, M.
(2006) CSR is a very complex phenomenon which
is difficult to define, but significantly influences
the long term success of the company. On the
one hand it can be a source of strength for an
enterprise and its competitive advantage, on the
other hand, a stranglehold of its development.
Conclusions, proposals, recommendations
1) SMEs that are socially responsible should
demonstrate this “responsible approach”
within the three pillars of society which are
profit, people and planet. It is possible to
state that the SMEs in sample, with the help
of their complex CSR policies that includes
environmental protection, sustainable
business, support and development of
employees, communities as well as the
increased emphasis on the quality and safety
of products being sold and cooperation with
international organizations, are fully oriented
on all three pillars. It is possible to say that
CSR policies and activities of SMEs either in
Slovak or in the international market have
several common characteristics. Diversity of
SMEs´ CSR policy in international and Slovak
market can be observed in the extent of the
activities, the level of their effectiveness and
impact of such activities on the rural
environment.
Proceedings of the 2016 International Conference “ECONOMIC SCIENCE FOR RURAL DEVELOPMENT” No 41
Jelgava, LLU ESAF, 21-22 April 2016, pp. 156-163
1Corresponding author. Tel.: + 421 37 641 4126, 4134; fax: + 421 37 6415 150.E-mail address: [email protected], [email protected] 162
2) It is possible to conclude that not only
selected companies but every company that
applies the corporate social behaviour to the
rural development brings benefits in the end
not only for society but definitely presents
itself better in front of the customers and
positively influence its corporate image. Based
on the findings, the authors conclude that
concept of CSR is becoming still more
important and both people and companies are
aware of this importance which opens the
door for even greater application in the future.
One can hope that companies worldwide will
understand the advantages of responsible
behaviour and will use this sustainable
advantage in the long run. There is a strong
connection between the responsible attitude
and increasing profit and improving image and
we hope this fact will assure us brighter and
more sustainable rural development in the
future.
3) When talking about connection between
socio - responsible behaviour of SMEs and
entrepreneurship, we can propose the
following recommendations:
4) to follow further entrepreneurial activities
of small and medium sized enterprises in
relation to the three main pillars of corporate
social responsibility in their entrepreneurial
activities,
5) continuous innovation and implementation
of new environmentally friendly production
methods and cooperation with environmental
organisations for the knowledge transfer can
contribute to the raise of an awareness about
the good practises of the SMEs companies,
6) very important is to keep good
relationships with regular customers and also
attracting the new possible ones by
implementation of innovative customer care
and production in the selected set of SMEs,
7) to understand the reasons why to be
socially responsible SMEs company and to
apply the Corporate Social Responsibility and
Behaviour in practice not only in the SMEs.
Bibliography
1. Carroll, A. (2008). A History of Corporate Social Responsibility: Concepts and Practices. In Crane, A., McWilliams, A., Matten, D., Moon, J. and Siegel, D. (eds), The Oxford Handbook of Corporate Social Responsibility. Oxford: Oxford University Press, pp. 19–46.
2. Egerova, D., Jirincova, M., Lancaric, D., Savov, R. (2013). Applying the Concept of Diversity Management in Organisations in the Czech Republic and the Slovak Republic: A Research Survey. Journal of Technological and Economic Development of Economy. Volume 19, Issue 2, (2013), pp. 350 - 366.
3. Ella, J. 2009. Cadbury: The legacy in Birmingham. [online] BBC. Retrieved: <http://news.bbc.co.uk/local/birmingham/hi/people_and_places/history/newsid_8412000/8412655.stm>. Access: 18.01.2016
4. European Commission. (2011). A Renewed EU Strategy 2011-14 for Corporate Social Responsibility. [online] COM (2011) 681 final, Brussels, pp. 15. Retrieved: <http://ec.europa.eu/enterprise/policies/sustainable-business/files/csr/new-csr/act_en.pdf>. Access: 29.12.2015
5. Fazekasova, M. (2006). Manažment teórii a praxi. [online]. Retrieved: <http://casopisy.euke.sk/mtp/clanky/3-4-2006/fazekasova.pdf>. Access: 18.01.2016
6. Gond, J. P., Moon, J. (2011). Corporate Social Corporate Social Responsibility in Retrospect and Prospect: Exploring the Life-Cycle of an Essentially Contested Concept. Nottingham University Business School, pp. 40.
7. Gurska, S., Valova, A. (2013). Corporate Social Responsibility in Mining Industry. Acta Universitatis Agriculturae et Silviculturae Mendelianae Brunensis. Volume 61, Issue 7, pp. 2163-2170.
8. Jones, T. M. 1980. Corporate Social Responsibility Revisited, Redefined. In California Management Review, pp. 59–67.
9. Katsoulakos, P. – Koudsodimou, M. – Matraga, A. and Williams, L. 2004. A Historic perspective of the CSR movement. White paper, INLECOM, Ltd.
10. Machova, R., Mura, L., Korcsmaros, E., Huszarik, S. E., Buleca, J., Haviernikova, K. (2015). Innovation Business and Evaluation of Innovation Potential of Business Nets (Inovačné podnikanie a hodnotenie inovačného potenciálu podnikateľských sietí) Brno TRIBUN EU, pp. 182.
11. Mura, L., Buleca, J. 2013. Trends in International Business of the Slovak Small and Medium Food Enterprises. In Procedia-Social and Behavioral Sciences, Volume 110, pp. 905-912.
12. Obtulovic, P. (2004). Biostatistics (Biostatistika). Volume 3. Nitra: SPU, pp. 132.
Proceedings of the 2016 International Conference “ECONOMIC SCIENCE FOR RURAL DEVELOPMENT” No 41
Jelgava, LLU ESAF, 21-22 April 2016, pp. 156-163
1Corresponding author. Tel.: + 421 37 641 4126, 4134; fax: + 421 37 6415 150.E-mail address: [email protected], [email protected] 163
13. Palkechova, L., Svoradova L., Viragh R. (2014). Analysis of Vacation Behaviour in Rural Tourism and Agrotourism in the Slovak Republic Conditions. In Proceedings from IX International Conference on Applied Business Research ICABR 2014, 782. Retrieved: http://ww.icabr.com/fullpapers/icabr2014.pdf. Access: 04.01.2016
14. Skypalova, R., Kučerova, R. (2014). The Role of the State in Launching Social Responsibility in Small and Medium Enterprises. In Acta Universitatis Agriculturae et Silviculturae Mendelianae Brunensis, Volume 62, Issue 6, pp. 1407-1415.
15. Ubreziova, A., Horska, E. (2011). Perception and Approach towards Corporate Social Responsibility in SMEs: Case Study of Slovak and Czech Republic. In: PEFnet 2011 "European Scientific Conference of Ph.D. Students, Brno: Mendelu, pp. 1-7.
16. Ubreziova, I., Stankovic, L., Mihalcova, B., Ubreziova, A. (2013). Perception of Corporate Social Responsibility in Companies of Eastern Slovakia Region in 2009 and 2010. In Acta Universitatis Agriculturae et Silviculturae Mendelianae Brunensis. Volume 61, Issue 7, pp. 2903-2910.
Proceedings of the 2016 International Conference “ECONOMIC SCIENCE FOR RURAL DEVELOPMENT” No 41
Jelgava, LLU ESAF, 21-22 April 2016, pp. 164-172
164
PERSPECTIVE DEVELOPMENT OF NEW SPECIES IN LATVIAN AQUACULTURE Armands Veveris1, Dr.oec.; Juris Hazners1, Mgr.oec.; and Elita Benga1, Mgr.sc.ing.
1 Institute of Agricultural Resources and Economics, Latvia
Abstract. The present paper studies the economic feasibility of certain new species in aquaculture and the market
potential for their breeding in Latvia. Aquaculture is a rapidly developing industry in the world. Its volumes are
increasing also in Latvia; however, there are few species that are bred in large volumes. Therefore, there exists an
essential need for research on the species suitable for breeding. Aiming at studying the economic and market potential
of particular less bred species, tilapias, chars, sturgeons and shrimps were selected for this research.
The research involves methods of economic analysis. The balance method was applied to analyse the markets for the
researched species. A semi-quantitative method – McKinsey matrix – was applied to determine the potential export
markets. McKinsey matrix was developed for particular species of fish on regional markets identified in advance.
The performed analysis provides a basis for concluding that breeding of sturgeons (Siberian and Russian sturgeons,
sterlets and bester fish), chars as well as shrimps (L.Vannamei) has a potential in Latvia and that these fish should be
included in the list of supported aquaculture products.
At the same time, taking into consideration that most of the consumers do not recognize these products, there is a
need for promotional activities. Collaboration with foreign companies to acquire the export markets has a perspective
regarding this.
The potential for breeding tilapias has not been justified due to the market situation in Europe (availability of cheap
mass product) and the comparatively high production costs in Latvia.
Key words: aquaculture, species, production data, competition.
JEL code: D2, D4, Q22.
Introduction
The research aim is to study the economic
substantiation and the market opportunities for
less popular fish and shellfish bred in Latvian
aquaculture.
Aquaculture is one of the most rapidly growing
industries in the world. Its role in Latvia is rather
small at present but it exhibits a growing
tendency. According to statistical data, 680 tons
of aquaculture production (fish and shellfish)
were sold in Latvia in 2014. Over three years,
25% increase in production volumes has been
reached. However, for the present, it does not
reach even 1% of the fishery volume. At the
same time, the trend both in the world and in
Latvia is that the proportion of aquaculture
products in the consumption of fish and other
aqua products is increasing, thus the industry
presents the growth potential. Aquaculture is a
rather capital-intensive and high investment-risk
industry. Therefore, information about the costs
of breeding various potential species, about the
sales prices and the market potential is of utmost
importance in order to start a successful business
activity.
The hypothesis set for the research is that it is
possible to develop a feasible production of new,
previously less known aquaculture products in
Latvia.
The following objectives have been set to
attain the aim:
• to assess the breeding costs (feed, energy
etc.) of the selected species in particular
enterprises for various species and to assess
the main factors affecting them as well as the
potential production price taking into account
the costs;
• to develop the economic justification for
selected species, taking into account the type
of production technology and the production
volume;
• to study the demand and supply of the
aquaculture production for the selected
species;
• to analyse the export opportunities for the
selected species.
To perform the research, Latvian and foreign
research and publications, materials of
international conferences in aquaculture industry,
Proceedings of the 2016 International Conference “ECONOMIC SCIENCE FOR RURAL DEVELOPMENT” No 41
Jelgava, LLU ESAF, 21-22 April 2016, pp. 164-172
165
laws and regulations, database information of the
Rural Support Service (RSS), data of the Central
Statistical Bureau (CSB), EUROSTAT database
information as well as consultations with leading
experts of Latvian aquaculture, industry
specialists and fish breeders, including the
information gathering from the fishery farms.
Within the research framework, the data
available on the approximate costs of the
respective species when bred in recirculation
systems (WRS) with different volumes are
collected, the factors affecting the costs are
analysed and the potential sales price are
calculated, taking into account the production
volume and the sales price. The Latvian and
international markets for the particular species
are analysed, the market potential and the
opportunities for Latvian farmers are assessed.
Both aspects - production costs and the market
potential are taken into consideration for
developing the conclusions and
recommendations.
The research applied methods of economic
analysis. The desk research method, interviews,
calculation, comparative analysis used to
calculate the economic substantiation and to
obtain information. The potential export markets
were determined by applying a semi-quantitative
method – developing McKinsey matrix for
particular types and products of fish in regional
markets identified in advance.
The numerical information collected in the
research is indicative, taking into consideration
the small number of enterprises that deal with
producing the researched products and the little
experience in breeding the fish and promoting
them. It has to be taken into consideration that
the Latvian market is small; so a rapid increase
in the supply can significantly affect the price.
Hence it is understandable that attaining a
significant aquaculture volume is closely linked
with export opportunities.
Research results and discussion
1. Brief characteristics of the species
included in the research
Fish of the sturgeon family
In the world, sturgeons are mainly bred for
obtaining caviar. Due to the reduced stock,
fishing sturgeons has been almost completely
stopped in the world. Therefore, they are mainly
bred in aquaculture. The main producing
countries in Europe are Italy and France.
Breeding sturgeons to obtain fish meat is less
popular worldwide albeit flesh constitutes 67% of
the sturgeon. Its meat is of very good quality and
it does not contain bones (European Commission,
2012).
Latvia also belongs to the sturgeon breeding
countries. In recent years, the volumes of
breeding sturgeons have increased rapidly in
Latvia, and it has become the second most
popular species of fish, right after carps. Siberian
sturgeon, sterlet, Russian sturgeon as well as
belugas and sterlet hybrids – bester fish are the
most popular species of the sturgeon family.
Tilapia
Tilapia is one of the most popular aquaculture
fish in the world. The total aquaculture
production volume of tilapia reaches 4.7 Mt. The
total volume of tilapia fishery constitutes about
0.75 Mt. In Europe, the production volumes are
insignificant due to the too high production costs.
All significant production countries of the world
are located in the tropical climate zone. One third
of the total volume is produced in China; large
volumes are produced in other Asian and Latin
American countries (FAO, 2013).
In 2011-2014, tilapia was cultivated in Latvia
but the production volume was small: 1 – 2 tons
per year. Several industry specialists have
expressed their opinion that competitive breeding
of tilapia is burdened because the fish loves
warmth, so the power consumption would be
much higher than in the countries that are
located more to the south.
Proceedings of the 2016 International Conference “ECONOMIC SCIENCE FOR RURAL DEVELOPMENT” No 41
Jelgava, LLU ESAF, 21-22 April 2016, pp. 164-172
166
The fish is not demanding regarding the purity
of water, hence it is suitable for mass production
in the countries that have warm climate all year
round. According to the information provided by
the producers, other neighbouring countries
(Poland, Estonia) that had started production of
tilapias have also stopped it.
Char
In difference from all the other species
included in the research, char is cold-water fish.
Due to this reason, their breeding volumes are
limited and more than 90% of the European char
production comes from the region of Nordic
countries (Island and Scandinavia). Char has
high tolerance to fish density, so they are well
suited for inland aquaculture. The global
production volumes of char are comparatively
small - about 6000 t in 2013. The char is bred in
Iceland, Canada, Sweden, Norway, Finland,
Estonia, Ireland and in West Virginia in the USA.
Iceland with its 3300 t is the largest producer.
The char is a high-quality salmonid fish with high
fillet output (55-57%). In the north of Europe,
breeding of char in aquaculture is increasing
(Thorarinsdottir R.I., 2013).
In the recent 3-5 years, breeding of char has
also started to develop in Latvia. Chars are
feeding most actively at the temperature
+4…+16 °C. In Latvia, cold-water fish can feed
significantly longer and gain weight faster than in
the arctic regions of Scandinavia (which are the
natural areas inhabited by char), where winters
are longer and colder.
The most widespread species of the char are
the Arctic char and the brook trout. Interbreeding
of the species is popular, resulting into the
Sparctic char.
Shrimps
Searching new objects appropriate for
breeding in aquaculture, especially in water
recirculation systems (WRS), shrimp is a product
of interest because it is the most significant
fishery product in international trade regarding
the value. Global production volumes of shrimp
reach approximately 7 million tons (2011), with
the proportion of shrimp produced in aquaculture
of about 55% (FAO, 2013).
The most significant countries producing
shrimp are China, Thailand, Vietnam and
Indonesia, which in total produce 80% of the
global output.
Although shrimp, like tilapia, are bred in
aquaculture almost only in the countries with a
warm climate, the breeding technology in these
countries has caused sharp protests of several
international environmental protection
organizations (Greenpeace a.o.). The quality of
shrimps produced this way is also doubtful
because in many developing countries the food
standards are often incomplete or are not
sufficiently followed.
As a consequence, the demand for live (fresh)
shrimps is becoming more stable in the rich
countries’ markets even though these shrimps
are more expensive than the frozen products of
the tropical countries. Fresh shrimps are
conquering the market niches of many countries
as a Premium class product.
There are several commercial shrimp species.
Previous studies (Nipers etc., 2015; Mitans A.,
2013) allow conclude that the most suitable
specie for breeding in Nordic environment is the
white shrimp (L.Vannamei).
2. Assessment of the market potential
Based on the research of the demand and
supply of the aquaculture fish and shellfish
market, it become possible to identify the
potential domestic and export markets and
factors influencing competitiveness (Table 1) for
them.
The potential markets for sturgeon meat are
Latvia, Europe, Russia and other countries of the
CIS, the USA. However, the attractiveness of
Russian and the CIS markets is reduced by the
low purchasing power of their population. Hence
the market opportunities for surgeon meat are
assessed only in Latvian, European and USA
markets.
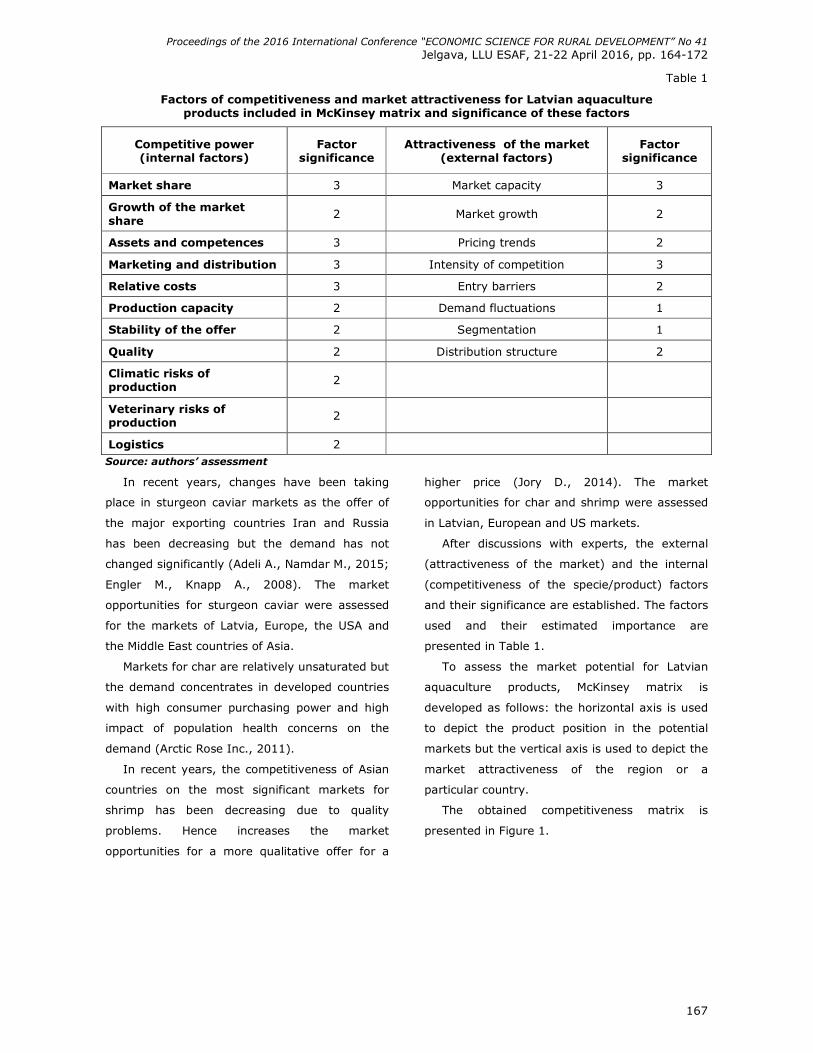
Proceedings of the 2016 International Conference “ECONOMIC SCIENCE FOR RURAL DEVELOPMENT” No 41
Jelgava, LLU ESAF, 21-22 April 2016, pp. 164-172
167
Table 1
Factors of competitiveness and market attractiveness for Latvian aquaculture products included in McKinsey matrix and significance of these factors
Competitive power (internal factors)
Factor significance
Attractiveness of the market (external factors)
Factor significance
Market share 3 Market capacity 3
Growth of the market share
2 Market growth 2
Assets and competences 3 Pricing trends 2
Marketing and distribution 3 Intensity of competition 3
Relative costs 3 Entry barriers 2
Production capacity 2 Demand fluctuations 1
Stability of the offer 2 Segmentation 1
Quality 2 Distribution structure 2
Climatic risks of production
2
Veterinary risks of production
2
Logistics 2 Source: authors’ assessment
In recent years, changes have been taking
place in sturgeon caviar markets as the offer of
the major exporting countries Iran and Russia
has been decreasing but the demand has not
changed significantly (Adeli A., Namdar M., 2015;
Engler M., Knapp A., 2008). The market
opportunities for sturgeon caviar were assessed
for the markets of Latvia, Europe, the USA and
the Middle East countries of Asia.
Markets for char are relatively unsaturated but
the demand concentrates in developed countries
with high consumer purchasing power and high
impact of population health concerns on the
demand (Arctic Rose Inc., 2011).
In recent years, the competitiveness of Asian
countries on the most significant markets for
shrimp has been decreasing due to quality
problems. Hence increases the market
opportunities for a more qualitative offer for a
higher price (Jory D., 2014). The market
opportunities for char and shrimp were assessed
in Latvian, European and US markets.
After discussions with experts, the external
(attractiveness of the market) and the internal
(competitiveness of the specie/product) factors
and their significance are established. The factors
used and their estimated importance are
presented in Table 1.
To assess the market potential for Latvian
aquaculture products, McKinsey matrix is
developed as follows: the horizontal axis is used
to depict the product position in the potential
markets but the vertical axis is used to depict the
market attractiveness of the region or a
particular country.
The obtained competitiveness matrix is
presented in Figure 1.
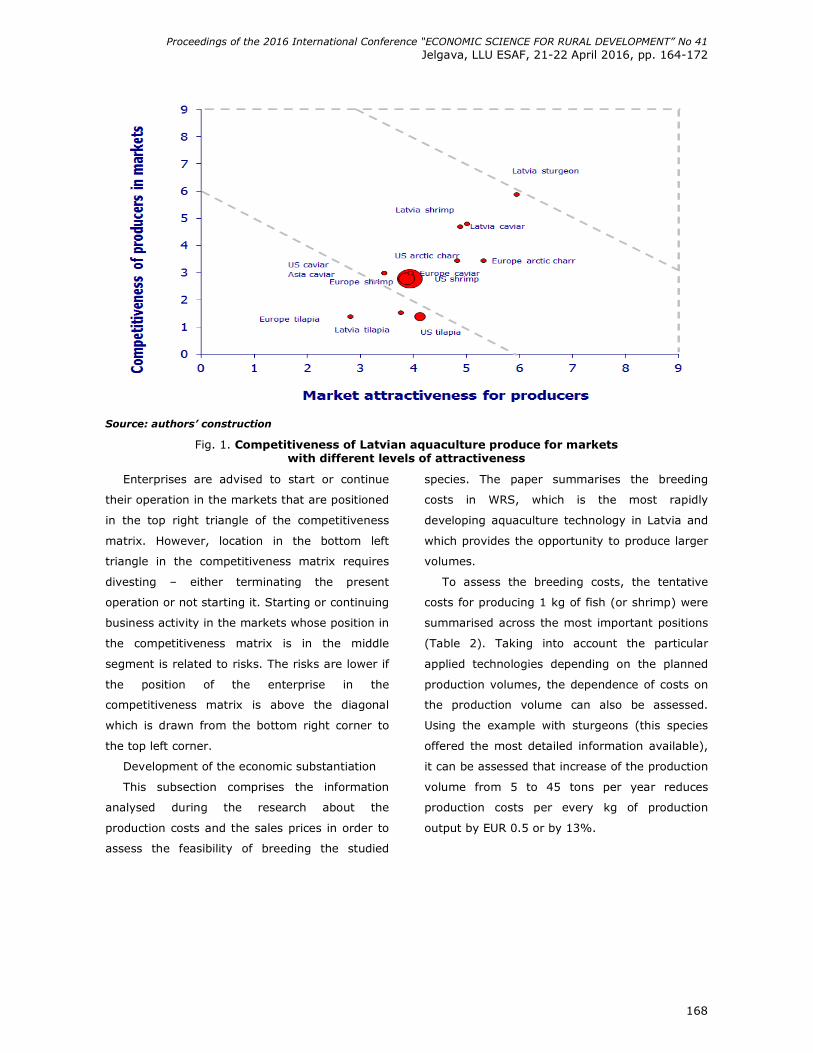
Proceedings of the 2016 International Conference “ECONOMIC SCIENCE FOR RURAL DEVELOPMENT” No 41
Jelgava, LLU ESAF, 21-22 April 2016, pp. 164-172
168
Source: authors’ construction
Fig. 1. Competitiveness of Latvian aquaculture produce for markets with different levels of attractiveness
Enterprises are advised to start or continue
their operation in the markets that are positioned
in the top right triangle of the competitiveness
matrix. However, location in the bottom left
triangle in the competitiveness matrix requires
divesting – either terminating the present
operation or not starting it. Starting or continuing
business activity in the markets whose position in
the competitiveness matrix is in the middle
segment is related to risks. The risks are lower if
the position of the enterprise in the
competitiveness matrix is above the diagonal
which is drawn from the bottom right corner to
the top left corner.
Development of the economic substantiation
This subsection comprises the information
analysed during the research about the
production costs and the sales prices in order to
assess the feasibility of breeding the studied
species. The paper summarises the breeding
costs in WRS, which is the most rapidly
developing aquaculture technology in Latvia and
which provides the opportunity to produce larger
volumes.
To assess the breeding costs, the tentative
costs for producing 1 kg of fish (or shrimp) were
summarised across the most important positions
(Table 2). Taking into account the particular
applied technologies depending on the planned
production volumes, the dependence of costs on
the production volume can also be assessed.
Using the example with sturgeons (this species
offered the most detailed information available),
it can be assessed that increase of the production
volume from 5 to 45 tons per year reduces
production costs per every kg of production
output by EUR 0.5 or by 13%.
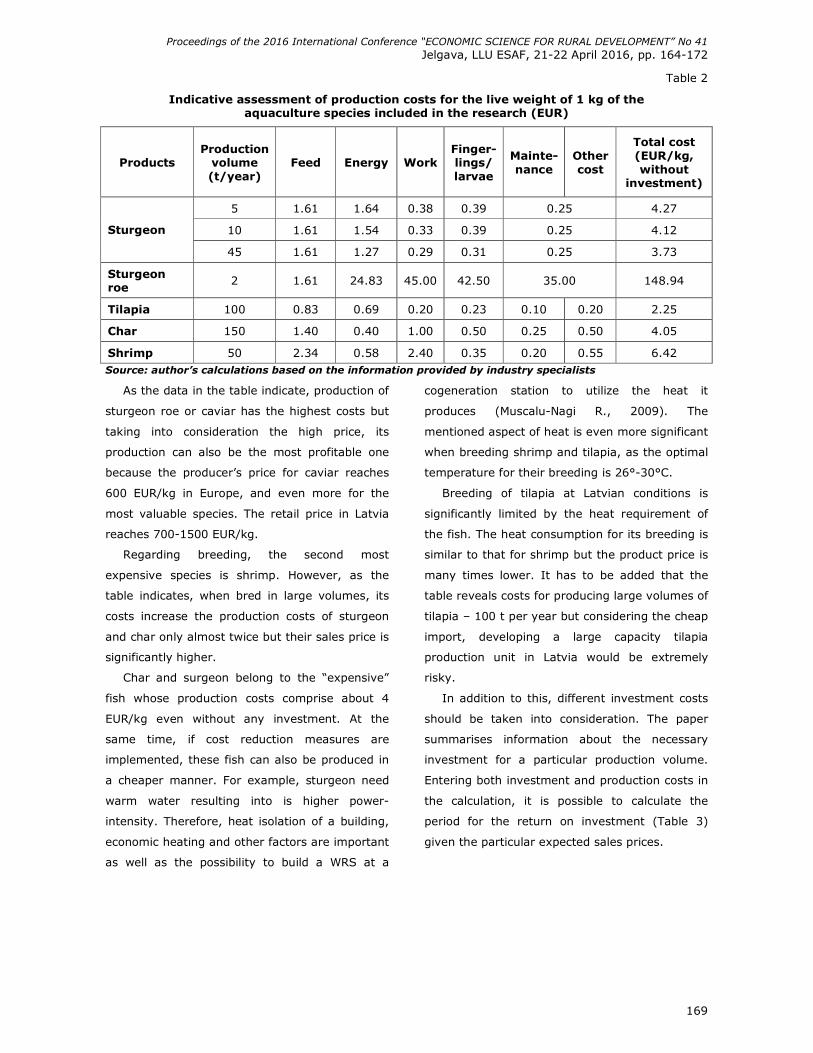
Proceedings of the 2016 International Conference “ECONOMIC SCIENCE FOR RURAL DEVELOPMENT” No 41
Jelgava, LLU ESAF, 21-22 April 2016, pp. 164-172
169
Table 2
Indicative assessment of production costs for the live weight of 1 kg of the aquaculture species included in the research (EUR)
Products Production
volume (t/year)
Feed Energy Work Finger- lings/ larvae
Mainte- nance
Other cost
Total cost (EUR/kg, without
investment)
5 1.61 1.64 0.38 0.39 0.25 4.27
10 1.61 1.54 0.33 0.39 0.25 4.12 Sturgeon
45 1.61 1.27 0.29 0.31 0.25 3.73
Sturgeon roe
2 1.61 24.83 45.00 42.50 35.00 148.94
Tilapia 100 0.83 0.69 0.20 0.23 0.10 0.20 2.25
Char 150 1.40 0.40 1.00 0.50 0.25 0.50 4.05
Shrimp 50 2.34 0.58 2.40 0.35 0.20 0.55 6.42 Source: author’s calculations based on the information provided by industry specialists
As the data in the table indicate, production of
sturgeon roe or caviar has the highest costs but
taking into consideration the high price, its
production can also be the most profitable one
because the producer’s price for caviar reaches
600 EUR/kg in Europe, and even more for the
most valuable species. The retail price in Latvia
reaches 700-1500 EUR/kg.
Regarding breeding, the second most
expensive species is shrimp. However, as the
table indicates, when bred in large volumes, its
costs increase the production costs of sturgeon
and char only almost twice but their sales price is
significantly higher.
Char and surgeon belong to the “expensive”
fish whose production costs comprise about 4
EUR/kg even without any investment. At the
same time, if cost reduction measures are
implemented, these fish can also be produced in
a cheaper manner. For example, sturgeon need
warm water resulting into is higher power-
intensity. Therefore, heat isolation of a building,
economic heating and other factors are important
as well as the possibility to build a WRS at a
cogeneration station to utilize the heat it
produces (Muscalu-Nagi R., 2009). The
mentioned aspect of heat is even more significant
when breeding shrimp and tilapia, as the optimal
temperature for their breeding is 26°-30°C.
Breeding of tilapia at Latvian conditions is
significantly limited by the heat requirement of
the fish. The heat consumption for its breeding is
similar to that for shrimp but the product price is
many times lower. It has to be added that the
table reveals costs for producing large volumes of
tilapia – 100 t per year but considering the cheap
import, developing a large capacity tilapia
production unit in Latvia would be extremely
risky.
In addition to this, different investment costs
should be taken into consideration. The paper
summarises information about the necessary
investment for a particular production volume.
Entering both investment and production costs in
the calculation, it is possible to calculate the
period for the return on investment (Table 3)
given the particular expected sales prices.
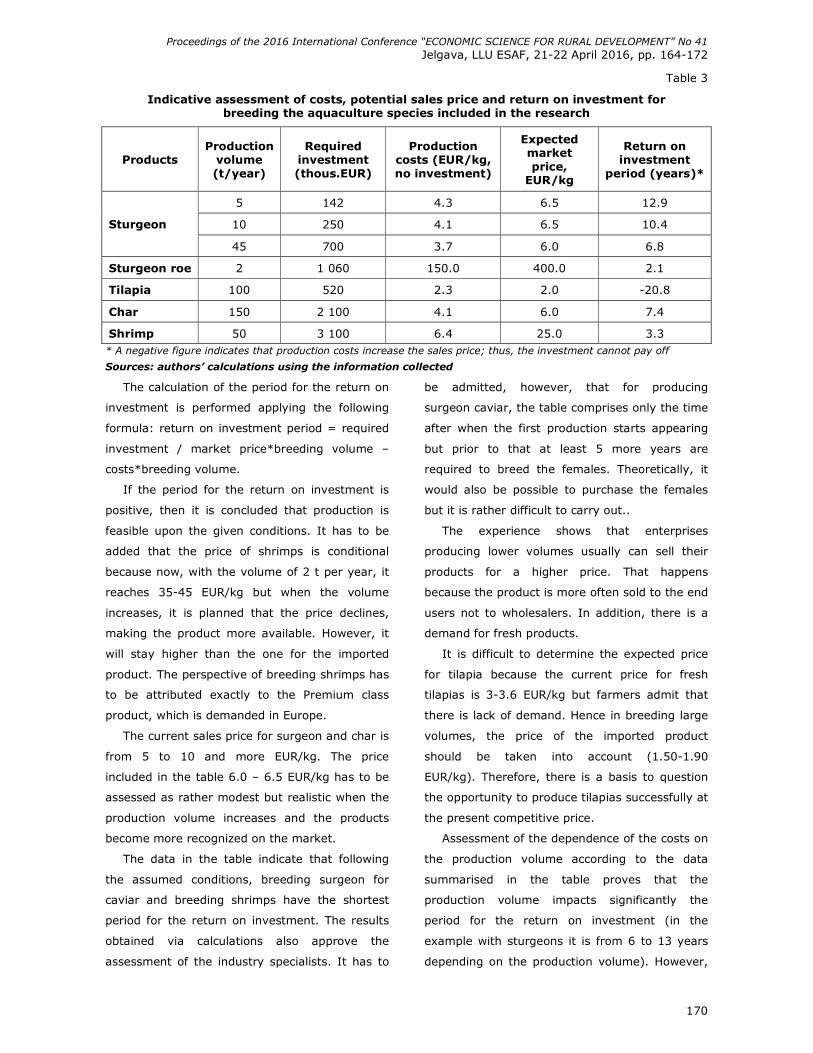
Proceedings of the 2016 International Conference “ECONOMIC SCIENCE FOR RURAL DEVELOPMENT” No 41
Jelgava, LLU ESAF, 21-22 April 2016, pp. 164-172
170
Table 3
Indicative assessment of costs, potential sales price and return on investment for breeding the aquaculture species included in the research
Products Production
volume (t/year)
Required investment (thous.EUR)
Production costs (EUR/kg, no investment)
Expected market price,
EUR/kg
Return on investment
period (years)*
5 142 4.3 6.5 12.9
10 250 4.1 6.5 10.4 Sturgeon
45 700 3.7 6.0 6.8
Sturgeon roe 2 1 060 150.0 400.0 2.1
Tilapia 100 520 2.3 2.0 -20.8
Char 150 2 100 4.1 6.0 7.4
Shrimp 50 3 100 6.4 25.0 3.3 * A negative figure indicates that production costs increase the sales price; thus, the investment cannot pay off
Sources: authors’ calculations using the information collected
The calculation of the period for the return on
investment is performed applying the following
formula: return on investment period = required
investment / market price*breeding volume –
costs*breeding volume.
If the period for the return on investment is
positive, then it is concluded that production is
feasible upon the given conditions. It has to be
added that the price of shrimps is conditional
because now, with the volume of 2 t per year, it
reaches 35-45 EUR/kg but when the volume
increases, it is planned that the price declines,
making the product more available. However, it
will stay higher than the one for the imported
product. The perspective of breeding shrimps has
to be attributed exactly to the Premium class
product, which is demanded in Europe.
The current sales price for surgeon and char is
from 5 to 10 and more EUR/kg. The price
included in the table 6.0 – 6.5 EUR/kg has to be
assessed as rather modest but realistic when the
production volume increases and the products
become more recognized on the market.
The data in the table indicate that following
the assumed conditions, breeding surgeon for
caviar and breeding shrimps have the shortest
period for the return on investment. The results
obtained via calculations also approve the
assessment of the industry specialists. It has to
be admitted, however, that for producing
surgeon caviar, the table comprises only the time
after when the first production starts appearing
but prior to that at least 5 more years are
required to breed the females. Theoretically, it
would also be possible to purchase the females
but it is rather difficult to carry out..
The experience shows that enterprises
producing lower volumes usually can sell their
products for a higher price. That happens
because the product is more often sold to the end
users not to wholesalers. In addition, there is a
demand for fresh products.
It is difficult to determine the expected price
for tilapia because the current price for fresh
tilapias is 3-3.6 EUR/kg but farmers admit that
there is lack of demand. Hence in breeding large
volumes, the price of the imported product
should be taken into account (1.50-1.90
EUR/kg). Therefore, there is a basis to question
the opportunity to produce tilapias successfully at
the present competitive price.
Assessment of the dependence of the costs on
the production volume according to the data
summarised in the table proves that the
production volume impacts significantly the
period for the return on investment (in the
example with sturgeons it is from 6 to 13 years
depending on the production volume). However,
Proceedings of the 2016 International Conference “ECONOMIC SCIENCE FOR RURAL DEVELOPMENT” No 41
Jelgava, LLU ESAF, 21-22 April 2016, pp. 164-172
171
such calculation is true only with the indicated
sales prices. When the price increases to 7
EUR/kg, with the production volume 5 t per year,
the return on investment period will reduce to
10.5 years. Farmers’ experience (including the
data about the beneficiaries of the RSS support)
approve that feasible aquaculture is possible only
with relatively small production volumes. Of
course, in this case it will be a supplementary
business for the enterprise or the rural farm that
also operates in other businesses.
Fish-farming specialists indicate that the cost
level can significantly differ for every producer,
and it depends on several individual factors.
Hence the figures offered in the present paper
should not be perceived as a standard but rather
as an example for comparing the species
considered for breeding. Potential farmers have
the opportunity to enter their particular
parameters in the calculation and thus obtain an
idea about the expected costs and the required
sales price.
Conclusions
1) The performed analysis provides the basis
to conclude that there is a perspective for
breeding sturgeon (Siberian and Russian
sturgeon, sterlet and bester fish), char as well
as shrimp (L.Vannamei) as Premium product
in Latvia.
2) Taking into consideration that most of the
consumers have little recognition of these
products, there is a need for promotional
activities. Collaboration with foreign
companies in acquiring export markets has a
perspective.
3) The perspective of tilapia breeding has not
been justified taking into account the market
situation in Europe (availability of cheap mass
product) and the comparatively high
production costs in Latvia.
4) It is possible to make the production by
25-30% cheaper by increasing the production
volume from 5 t to 45 t per year. Further
increase of the production volume (above 50 t
per year) provides a relatively lower reduction
of costs. At the same time, profitable
production is possible also with small volumes
but in this case, it will be just a
supplementary business for the enterprise or
the farm.
Bibliography
1. Adeli, A., Namdar, M. (2015). The Iranian Caviar and its Substitutes in the World Market, Ecopersia, 2015, 3 (1), pp. 933-944.
2. Arctic Rose Inc. (2011). Arctic Char Aquaculture 2011: Assessing Status - Identifying Opportunity. Final Report. p. 147. Retrieved: http://www.irzc.umcs.ca/flash_content/Dossier%20PDF/Publications/ACRDP_Final_Report.pdf Access: 11.01.2016.
3. Engler, M., Knapp, A. (2008). Briefing on the Evolution of the Caviar Trade and Range State Implementation of CITES Resolution Conf. 12.7 (REV. COP 14), Report prepared for the European Commission, Contract 070307/2007/479422/MAR/E2
4. Ercan, E. (2011). A Glance on Sturgeon Farming Potential of Turkey, International Aquatic Research, 2011, No. 3, pp. 117-124.
5. European Commission (2012). Sturgeon (Acipenser baerii). Fisheries and Aquaculture in Europe. No. 56, June 2012.
6. FAO (2013). Fishery and Aquaculture statistics. FAO Yearbook 2011, Rome. Retrieved: http://www.fao.org/docrep/019/i3507t/i3507t.pdf. Access: 07.01.2016.
7. Jory, D. (2014). Indiana Indoor Shrimp Production Brainstorming Session, Indiana Soybean Alliance, Indianapolis, IN, April 23, 2014
8. LVAEI (2013). 2.prioritara virziena ekonomiska analize saistiba ar akvakulturu un potencialo tirgus izpeti (Economic Analysis of 2nd Prioriy Axis in connection with Aquaculture and Research of Potential Markets). p. 103. Retrieved: http://www.lvaei.lv/images/LANN/Akvakulturas_%20tirgus%20petijums_2013.pdf Access: 11.01.2016.
9. Mitans, A. (2013). Garnelu akvakulturas iespejas Latvija un pasaule (Possibilities of Shrimp Aquaculture in Latvia and World). / Latvijas zivsaimniecibas gadagramata (Latvian Fisheries Yearbook) 2013, LLKC. pp. 115-121.
10. Muscalu-Nagi, R. (2009). Sturgeon Farming with Minimum Resources. IV International conference “Fishery”, Belgrade. Conference proceedings, pp. 66-69.

Proceedings of the 2016 International Conference “ECONOMIC SCIENCE FOR RURAL DEVELOPMENT” No 41
Jelgava, LLU ESAF, 21-22 April 2016, pp. 164-172
172
11. Nipers, A. et al. (2015). Garnelu produkcijas ilgtspeja Latvijas akvakultura un perspektivas Baltijas un Skandinavijas valstu noieta tirgos (Sustainability of Shrimp Production in Latvian Aquaculture and Perspectives in Baltic and Scandinavian Markets). Jelgava, LLU. p. 25. Retrieved: http://www.llu.lv/getfile.php?hash=5771c56768b54cdd776f8792f23e5aa2 Access: 11.01.2016.
12. Thorarinsdottir, R. I. (2013). Prospects of Farming Arctic Char (Salvelinus Alpinus L.) Aquaculture Europe 2013 - Trondheim, Norway. Retrieved: https://www.was.org/easonline/AbstractDetail.aspx?i=2079. Access: 07.01.2016.
Proceedings of the 2016 International Conference “ECONOMIC SCIENCE FOR RURAL DEVELOPMENT” No 41
Jelgava, LLU ESAF, 21-22 April 2016, pp. 173-179
173
BEHAVIOURAL DIMENSION OF SOCIAL CAPITAL OF RURAL AREAS IN POLAND Agnieszka Wojewodzka-Wiewiorska1, PhD
1 Warsaw University of Life Sciences-SGGW
Abstract. In economics there has been a growing interest in non-material values, and the concept of social capital is
regarded as an important endogenous factor of socio-economic development at regional and local level. This paper
discusses the topic of a behavioural dimension of social capital in Poland. The aim of the study is to determine the
activity of inhabitants in the formulation of development strategy of the commune by analyzing the case of rural and
urban-rural communes. The participation of local citizens in strategy formulation is not obligatory but it guarantees the
creation of a document to meet their real needs and it is very desirable from the perspective of the development of
rural areas. The empirical section of the paper includes the findings of questionnaire surveys conducted in 2015 in the
commune offices, relating to the way of the organization of the work on strategy, forms of inhabitants' participation
and their involvement as well as conditioning factors of the inhabitants' activity. The survey conducted in the
communes shows that there is a relatively low level of social capital in terms of its behavioural dimension.
Respondents pointed to the following main causes of a low level of inhabitants' activity: lack of the knowledge of the
importance of strategy and the opportunity to participate in its formulation, passivity, which is typical of rural areas,
mentality, low level of trust in the authorities, lack of time and the lack of a sense that one can influence one's
surroundings.
Key words: social capital, inhabitants' activity, rural areas, local development strategy, commune.
JEL code: D71, D85, O15, O18
Introduction
The concept of social capital is discussed in
many fields and contexts (Sarracino F., 2009;
Klimowicz M., Bokajlo W., 2010; Skawinska E.,
2012). Social capital is considered to be a
development factor, both on a nationwide level,
and on regional or local level (Klodzinski M.,
2003; Antoci A., Sabatini F., Sodini M., 2009;
Strzelecki Z., 2011; Wojewodzka-Wiewiorska A.,
2011a, 2011b). In literature, among many issues
linked up with social capital, there are the issues
of a multitude of definitions (Czapinski J., 2013),
problems with the measurement of social capital
(Theiss M., 2005; Westlund H., 2006; Lopaciuk-
Gonczaryk B., 2012), which often result from the
limited availability of statistical data, spatial
differentiation in the level of social capital and
the causes and consequences of a low level of
social capital in a given area.
The concept of social capital should be
understood as network ties between local
entities, cultural traditions, norms and standards
of social behaviour and common attitudes which
are conducive to long-term cooperation,
deepening of economic relations and trust
formation. Social capital is a set of informal
values and ethical norms shared among members
of a certain group of people, which enables them
to effectively cooperate towards achieving the
intended goals (Fukuyama F., 2003). In
literature, one may come across various
dimensions of social capital, such as: structural,
regulatory and behavioural (Krishna A., Uphoff
N., 2002; Grootaert Ch., Bastelaer Th. van.,
2002; Theiss M., 2005; Kaasa A., Parts E., 2007;
Skawinska E., 2012). This paper discusses the
issue of participation of the inhabitants in the
work on formulating a development strategy of
the commune, which is associated with a
behavioural component of social capital,
encompassing, inter alia, cooperation and
collective action. At the same time, reference is
made to the work of Putnam, who defined social
capital as the cooperation of individuals and their
involvement in various initiatives, primarily on a
local level.
The development strategy of the commune1 is
a long-term planning process which determines
1 Nowadays in Poland exists a three-level administrative division, introduced on 1 January 1999. The largest units are voivodeships (there are 16 voivodeships), the second-level units are counties (380), and the smallest units are communes (2479). There are three types of
Proceedings of the 2016 International Conference “ECONOMIC SCIENCE FOR RURAL DEVELOPMENT” No 41
Jelgava, LLU ESAF, 21-22 April 2016, pp. 173-179
174
strategic objectives of its development, describes
the way of their realization, and envisages the
allocation of various resources, in particular
financial means (Kozminski A. K., Piotrowski W.,
1997). In Poland, the development strategy of
the commune is not an obligatory document;
however, in practice most communes have such
a document, since it fulfils a number of important
functions. It is a basis for writing grant
applications for external funding, including the
European Union funding. During discussions on
the various methods of strategy formulation it is
always emphasized that inhabitants or their
representatives need to participate in the
process. Participation of a local community in the
project preparation phase is of utmost
importance, since its members may communicate
their real needs relating to the development of
the region in which they live, which, in turn,
guarantees more success in strategy
implementation. Participation of the inhabitants is
a necessary condition for building a good
strategy.
Studies show that in Poland the level of social
capital is relatively low, which may also concern
the preparation of a document such as local
development strategy. In addition, there are
clear-cut differences in the level and forms of
social capital in the countryside and in towns, the
level of social capital being lower in rural areas
(Wojewodzka-Wiewiorska A., 2015). In literature,
however, there are opinions that the activity in
rural areas is great but it is difficult to measure
due to its non-formalized character (Herbst J.,
2008).
The aim of the paper is to determine the
activity of inhabitants in the formulation of
development strategy of the commune in the
case of rural and urban-rural communes in
Poland. It is important to emphasize that in
practice the inhabitants are not obliged to
participate and cooperate with the local
communes: urban, rural and mixed (urban-rural).
authorities, and that their involvement and
attitudes during the process of preparation of a
strategic document on a local level point to the
level of social capital. Surveys were conducted in
2015 using a questionnaire in randomly selected
communes which have a current development
strategy and where the inhabitants participated
in the preparation of the document2. Closed and
open questions were addressed to the employees
of the commune offices who were responsible for
the implementation of the development strategy
of the commune and who were acquainted with
the course of the process of strategy creation and
implementation. A comparative analysis was
made of the activity of the inhabitants of rural
and urban-rural communes.
The issue of inhabitants' participation
discussed in the paper being a manifestation of
behavioural social capital in the given area makes
a contribution to the discussion on social capital
in Poland on the micro level using the author's
own surveys. It is particularly important in view
of the problem of lack or limited availability of
public statistical data, especially at a local level
and with reference to rural areas, which makes it
necessary to conduct more in-depth interviews to
describe in a detailed way the conditioning
factors and the manner of undertaking collective
activities.
Research results and discussion
During the survey data collection it turned out
that in many communes there was no person (or
post) in the commune office who would know the
document in the context of its realisation. Often
there is no documentation concerning the
organization of work on the strategy. This may
indicate that there is a lack of knowledge of the
significance of the document as an instrument of 2 Findings were presented for 123 communes, including 85 rural communes and 38 urban-rural communes. Due to the facultative character of the document of development strategy of the commune, it is not known how many communes in Poland have such a document and how many units engage their inhabitants in the process of preparation of this document.
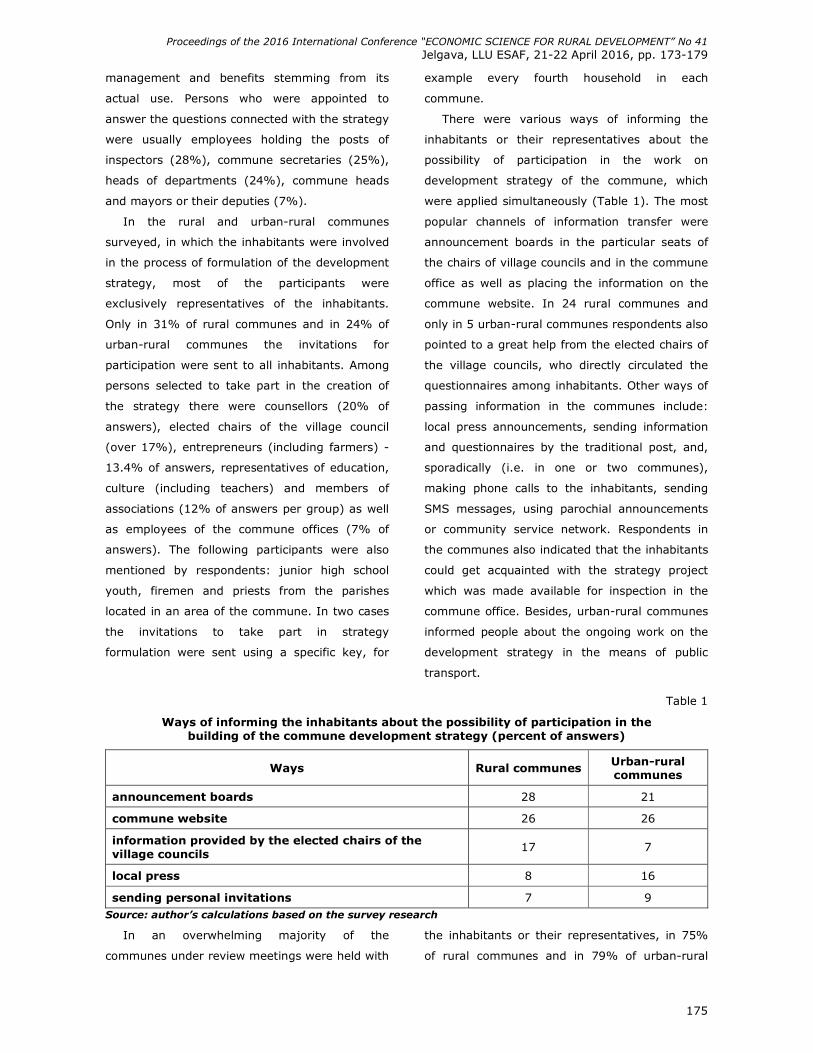
Proceedings of the 2016 International Conference “ECONOMIC SCIENCE FOR RURAL DEVELOPMENT” No 41
Jelgava, LLU ESAF, 21-22 April 2016, pp. 173-179
175
management and benefits stemming from its
actual use. Persons who were appointed to
answer the questions connected with the strategy
were usually employees holding the posts of
inspectors (28%), commune secretaries (25%),
heads of departments (24%), commune heads
and mayors or their deputies (7%).
In the rural and urban-rural communes
surveyed, in which the inhabitants were involved
in the process of formulation of the development
strategy, most of the participants were
exclusively representatives of the inhabitants.
Only in 31% of rural communes and in 24% of
urban-rural communes the invitations for
participation were sent to all inhabitants. Among
persons selected to take part in the creation of
the strategy there were counsellors (20% of
answers), elected chairs of the village council
(over 17%), entrepreneurs (including farmers) -
13.4% of answers, representatives of education,
culture (including teachers) and members of
associations (12% of answers per group) as well
as employees of the commune offices (7% of
answers). The following participants were also
mentioned by respondents: junior high school
youth, firemen and priests from the parishes
located in an area of the commune. In two cases
the invitations to take part in strategy
formulation were sent using a specific key, for
example every fourth household in each
commune.
There were various ways of informing the
inhabitants or their representatives about the
possibility of participation in the work on
development strategy of the commune, which
were applied simultaneously (Table 1). The most
popular channels of information transfer were
announcement boards in the particular seats of
the chairs of village councils and in the commune
office as well as placing the information on the
commune website. In 24 rural communes and
only in 5 urban-rural communes respondents also
pointed to a great help from the elected chairs of
the village councils, who directly circulated the
questionnaires among inhabitants. Other ways of
passing information in the communes include:
local press announcements, sending information
and questionnaires by the traditional post, and,
sporadically (i.e. in one or two communes),
making phone calls to the inhabitants, sending
SMS messages, using parochial announcements
or community service network. Respondents in
the communes also indicated that the inhabitants
could get acquainted with the strategy project
which was made available for inspection in the
commune office. Besides, urban-rural communes
informed people about the ongoing work on the
development strategy in the means of public
transport.
Table 1
Ways of informing the inhabitants about the possibility of participation in the building of the commune development strategy (percent of answers)
Ways Rural communes Urban-rural communes
announcement boards 28 21
commune website 26 26
information provided by the elected chairs of the village councils
17 7
local press 8 16
sending personal invitations 7 9 Source: author’s calculations based on the survey research
In an overwhelming majority of the
communes under review meetings were held with
the inhabitants or their representatives, in 75%
of rural communes and in 79% of urban-rural
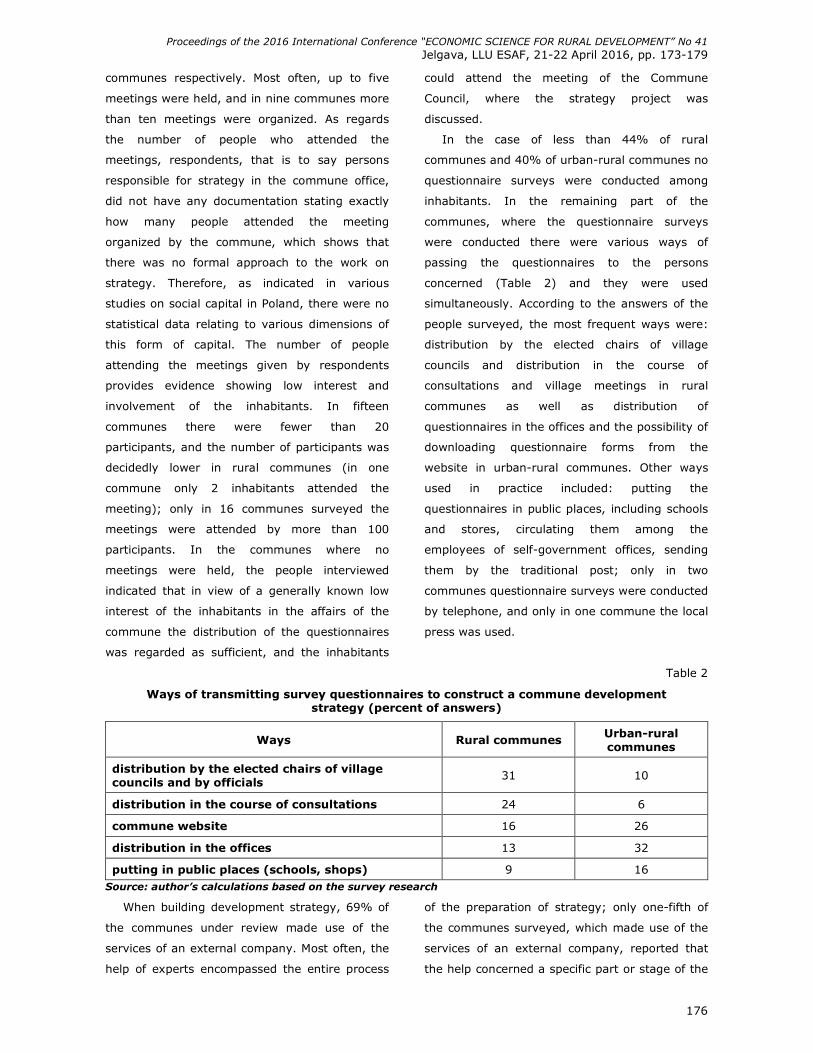
Proceedings of the 2016 International Conference “ECONOMIC SCIENCE FOR RURAL DEVELOPMENT” No 41
Jelgava, LLU ESAF, 21-22 April 2016, pp. 173-179
176
communes respectively. Most often, up to five
meetings were held, and in nine communes more
than ten meetings were organized. As regards
the number of people who attended the
meetings, respondents, that is to say persons
responsible for strategy in the commune office,
did not have any documentation stating exactly
how many people attended the meeting
organized by the commune, which shows that
there was no formal approach to the work on
strategy. Therefore, as indicated in various
studies on social capital in Poland, there were no
statistical data relating to various dimensions of
this form of capital. The number of people
attending the meetings given by respondents
provides evidence showing low interest and
involvement of the inhabitants. In fifteen
communes there were fewer than 20
participants, and the number of participants was
decidedly lower in rural communes (in one
commune only 2 inhabitants attended the
meeting); only in 16 communes surveyed the
meetings were attended by more than 100
participants. In the communes where no
meetings were held, the people interviewed
indicated that in view of a generally known low
interest of the inhabitants in the affairs of the
commune the distribution of the questionnaires
was regarded as sufficient, and the inhabitants
could attend the meeting of the Commune
Council, where the strategy project was
discussed.
In the case of less than 44% of rural
communes and 40% of urban-rural communes no
questionnaire surveys were conducted among
inhabitants. In the remaining part of the
communes, where the questionnaire surveys
were conducted there were various ways of
passing the questionnaires to the persons
concerned (Table 2) and they were used
simultaneously. According to the answers of the
people surveyed, the most frequent ways were:
distribution by the elected chairs of village
councils and distribution in the course of
consultations and village meetings in rural
communes as well as distribution of
questionnaires in the offices and the possibility of
downloading questionnaire forms from the
website in urban-rural communes. Other ways
used in practice included: putting the
questionnaires in public places, including schools
and stores, circulating them among the
employees of self-government offices, sending
them by the traditional post; only in two
communes questionnaire surveys were conducted
by telephone, and only in one commune the local
press was used.
Table 2
Ways of transmitting survey questionnaires to construct a commune development strategy (percent of answers)
Ways Rural communes Urban-rural communes
distribution by the elected chairs of village councils and by officials
31 10
distribution in the course of consultations 24 6
commune website 16 26
distribution in the offices 13 32
putting in public places (schools, shops) 9 16 Source: author’s calculations based on the survey research
When building development strategy, 69% of
the communes under review made use of the
services of an external company. Most often, the
help of experts encompassed the entire process
of the preparation of strategy; only one-fifth of
the communes surveyed, which made use of the
services of an external company, reported that
the help concerned a specific part or stage of the
Proceedings of the 2016 International Conference “ECONOMIC SCIENCE FOR RURAL DEVELOPMENT” No 41
Jelgava, LLU ESAF, 21-22 April 2016, pp. 173-179
177
entire process - evaluation, counselling,
methodical consultation, help in the field of
determination of the consistency of the strategy
content with the EU requirements or coordination
and summing up of the work on the document.
Respondents were asked whether the
inhabitants readily participated in the process of
creating development strategy of the commune.
The survey showed the highest percentage of the
communes in which inhabitants were rather
involved (45%); however, the share of the
communes in which inhabitants were rather
reluctant to participate in strategy formation was
high (36%). In many communes (11% of those
surveyed) people were decidedly reluctant to
take part in strategy formation, while only in 4%
of the communes there were answers saying that
the inhabitants were very actively engaged in the
work on document creation. The analysis of the
results according to the type of the commune,
shows that in rural communes the inhabitants are
decidedly less involved in the process of strategy
formulation (the number of answers 'decidedly'
and 'rather yes' amounts to 45%, while in urban-
rural communes it totals 58%). In the case of as
many as 41% of rural communes and 26% of
urban-rural communes the results demonstrate
that the inhabitants would rather not show
interest in participation in the work on the
strategy.
Very interesting conclusions were drawn on
the basis of opinions of the respondents
concerning the attitudes of the inhabitants and
the causes of those attitudes. Among many
answers explaining a high activity of the
inhabitants, the people surveyed indicated that
the inhabitants wanted to influence the
development (19% of answers). In rural
communes the low level of inhabitants' activity
was explained by the fact that the inhabitants did
not know what the strategy was and what it
served (15% of answers). Respondents also
indicated that the inhabitants did not become
engaged in the process of strategy formulation
since they always remained passive and inactive
in the face of similar situations or initiatives
(16% of answers), which, according to
respondents, was typical in precisely rural
communes. In urban-rural communes
respondents said that the inhabitants'
passiveness was the effect of their mentality
stemming from the previous political system and
a low level of trust (as many as 17.2% of
answers). Respondents also pointed to the lack of
time and the lack of feeling that through
participation in strategy formulation one can
affect their surroundings due to the fact that the
effects of strategy implementation would occur in
the long run. This was evidenced, for example,
by a small number of displays of the document
placed on the website of the Commune Office (e.
g. several displays) or by the fact that the
Commune Office did not receive any applications
or only one application concerning the content of
the strategy. Inhabitants would rather show
interest in personal affairs (or in the affairs of
their street or housing estate) and not in general
(common) affairs, unless there occurs the
problem with which they are directly concerned;
then the inhabitants' involvement greatly
increases. At the same time, in the case of four
(rural) communes the inhabitants' engagement
was always high, which could also be seen during
the process of strategy formulation; and recently,
the inhabitants' interest in common affairs has
been clearly increasing. In addition, some other
issues are indicated in the commentaries:
inhabitants do not feel that development is
influenced through preparation of strategic
documents (these are only ”records on paper”),
they have low trust in authorities and they are
hardly interested in the documents of the
commune; their involvement depends on the
topic of the activities, on the age structure of the
inhabitants (high activity if there are many young
persons in the community and the reverse
situation when there are more older people who
are less interested in the affairs of the
Proceedings of the 2016 International Conference “ECONOMIC SCIENCE FOR RURAL DEVELOPMENT” No 41
Jelgava, LLU ESAF, 21-22 April 2016, pp. 173-179
178
commune); it also depends on the size of the
village council area; local entrepreneurs show
great interest in the affairs of the commune.
Respondents also pointed out that there were
some people in the commune who were always
engaged in the commune affairs, for example
elected chairs of village councils or professionals
related to the functioning of the self-government.
The people interviewed were also asked
whether the inhabitants took interest in the
contents and realisation of the document in
question. In 52% of the communes surveyed the
residents were not interested in the document
encompassing the development strategy of the
commune, while in rural communes this interest
was much more frequent. Respondents pointed
out that the document could be found on the
website; hence the inhabitants or other people
who were interested in it did not come directly to
the commune office. Among persons who asked
about the strategy, students were mentioned
most often, next came persons who directly
participated in the process of strategy
formulation, and they were followed by investors
and other persons from the outside. Most often,
residents ask the clerks about the stage of
strategy realization, and thereby the strategy
fulfils solely a control function. In addition, the
inhabitants are interested in the document when
they carry out construction or repair work, when
they want to start business activity or when they
prepare projects co-financed by the European
Union.
Conclusions, proposals, recommendations
1) In the rural communes surveyed, local
authorities, during the stage of preparation of
the development strategy of the commune,
decidedly more often engaged solely
representatives of the various local milieus. Of
the various forms of passing the information
to the inhabitants, the most popular were
announcement boards and placing the
information on the website of the commune.
The interest in those forms of activity was
low, which is indicated by a small number of
the participants in the meetings and of the
questionnaires they filled in. According to the
persons responsible for strategy
implementation communes inhabitants
reluctantly engaged in strategy creation,
which could be seen especially in rural
communes. The low level of social capital
identified in its behavioural dimension may
constitute a barrier to the development of
rural areas.
2) The low level of the inhabitants' activity in
rural areas may not result from the low level
of social capital but it may be an effect of the
inappropriate information flow between the
commune office and the inhabitants, and of
the lack of knowledge of the significance of
the document in the development of the
commune and of its impact on the inhabitants'
lives. Hence, in order to encourage the
inhabitants to become involved in various
activities at a local level and to draw the
benefits for the development of rural areas
and for the entire community it is important to
effectively communicate among various
entities. The authorities that are the initiators
of strategy formulation must pay special
attention to informing the individuals
concerned about the development strategy
and about its role as well as about the
opportunity to participate in the process of its
creation by adjusting, at the same time, the
form of the message to the specified groups of
receivers. Otherwise, inhabitants' participation
will be insignificant.
3) When conducting effective activities aimed
at the formation of social capital in Poland, it
must be taken into account that there are
various conditioning factors which affect the
inhabitants' ability to cooperate and to
undertake collective actions and which are
often specific to the given country or even to
its particular regions. In the analysis of the
case of Poland, one must take into
Proceedings of the 2016 International Conference “ECONOMIC SCIENCE FOR RURAL DEVELOPMENT” No 41
Jelgava, LLU ESAF, 21-22 April 2016, pp. 173-179
179
consideration very complicated historical
conditioning factors, which largely affected
today's social attitudes of the inhabitants in
rural areas, that is to say partitions of Poland,
changes of its frontiers, the communist
system as well as the processes associated
with the systemic transformation or migration.
Surprisingly, the survey demonstrates that the
attitude of the authorities of the communes
surveyed, which, knowing that the inhabitants'
interest in the affairs of the commune has
always been low, did not try to undertake any
activities to encourage the local citizens to
become involved in the development of the
area in which they live. One must identify the
causes of the low activity of the citizens and
undertake appropriate activities to shape
active attitudes of the inhabitants.
Bibliography
1. Antoci, A. Sabatini, F., Sodini, M. (2009). Fragility of Social Capital. University of Siena. p. 1-8.
2. Czapinski, J. (2013). The State of Civil Society. Social Capital. Social Diagnosis 2013. Conditions and Quality of Life of Poles. Report. Czapinski J., Panek, T. (ed.). The Council for Social Monitoring. Warsaw. pp. 285-297.
3. Fukuyama, F. (2003). Social Capital. Harrisom, L.E. Huntington, S.P. (ed.). Culture is important. Zysk i S-ka. Poznan. p. 20. (in Polish).
4. Grootaert, Ch. Bastelaer, Th. van. (2002). Conclusion: Measuring Impact and Drawing Policy Implications. Grootaert, Ch. Bastelaer, Th. Van. The Role of Social Capital in Development. An Empirical Assessment. Cambridge University Press. pp. 343-345.
5. Herbst, J. (2008) Another Third Sector. Non-governmental Organizations in Rural Areas. Halamska, M. (ed.). Country NGOs. IRWiR PAN, Warsaw, pp. 33-75. (in Polish).
6. Kaasa, A. Parts, E. (2007). Individual- Level Determinants of Social Capital in Europe: Differences Between Country Groups. Tartu University Press. Tartu. pp. 6-7.
7. Klimowicz, M. Bokajlo, W. (2010). Social Capital- Interpretations, Impressions, Operationalization, Wydawnictwo Fachowe CeDeWu.pl. Warsaw. pp. 43-50. (in Polish)
8. Klodzinski, M. (2003). Social Capital as the Main Factor Differentiating the Degree of Economic and Social Development of Rural Communities. Adamowicz M. (ed.). The Local Development Strategies. Institutional Aspects, Vol. I, Wydawnictwo SGGW. Warszawa. pp. 161-169. (in Polish).
9. Kozminski, A. K. Piotrowski W. (1997). Management - Theory and Practice, Wydawnictwo Naukowe PWN, Warsaw. p. 123. (in Polish).
10. Krishna, A. Uphoff, N. (2002). Mapping and Measuring Social Capital Trough Assessment of Collective Action to Conserve and Develop Watersheds in Rajasthan, India. Grootaert, Ch. Bastelaer, Th. Van. The Role of Social Capital in Development. An Empirical Assessment. Cambridge University Pressp. pp. 86-87.
11. Lopaciuk – Gonczaryk, B. (2012). Measuring Social Capital. The National Economy. No. 1-2. pp. 1-23. (in Polish).
12. Sarracino, F. (2009). Social Capital and Subjective Well-Being Trends: Evidence from 11 European Countries. University of Siena. pp. 5-6.
13. Skawinska, E. (2012). Social Capital in the Region's Development. Wydawnictwo Naukowe PWN. Warsaw. pp. 14-40. (in Polish).
14. Strzelecki, Z. (2011). Regional and Local Economy in Poland. Factors and barriers. Oficyna Wydawnicza SGH w Warsaw. Warsaw. pp. 113-125. (in Polish).
15. Theiss, M. (2005). Operationalization of Social Capital in Empirical Research. Januszek H. (ed.). Social capital in communities. Wyd. AE in Poznaniu. Poznan. pp. 59-69. (in Polish).
16. Westlund, H. (2006). Social Capital in the Knowledge Economy: Theory and Empirics. Springer Berlin. p. 38.
17. Wojewodzka-Wiewiorska, A. (2011a). Determinants of Rural Areas Development in the Theory. Development Prospects of Rural Areas Lagging Behind in the CEE Region. Conference Proceeding. L. Villanyi. Godollo. Hungary. pp. 186-192.
18. Wojewodzka-Wiewiorska, A. (2011b). Social Capital as an Endogenous Factor of Local Development. Roczniki Naukowe SERiA. Vol XIII. Issue 6. Warsaw-Poznan- Wroclaw. pp. 255-259.
19. Wojewodzka-Wiewiorska, A. (2015). Structural Dimension of Social Capital in Poland. Urban Versus Rural Areas. Proceedings of the 7th International Scientific Conference: Rural Development. Raupeliene A. (ed.). Aleksandras Stulginskis University. Kaunas, p. 6.
Proceedings of the 2016 International Conference “ECONOMIC SCIENCE FOR RURAL DEVELOPMENT” No 41
Jelgava, LLU ESAF, 21-22 April 2016, pp. 180-185
1Corresponding author. Tel.: (0048) 52 340 81 76; e-mail: [email protected] 180l 2Corresponding author. Tel.: (0048) 52 340 81 76; e-mail: [email protected]
FACTORS DETERMINING DEVELOPMENT OF BUSINESSES IN KUJAWSKO-POMORSKIE PROVINCE AS A PART OF THE POMERANIAN SPECIAL ECONOMIC ZONE - STUDY RESULTS
Malgorzata Zajdel1, PhD; Malgorzata Michalcewicz-Kaniowska1, PhD
1University of Technology and Life Sciences in Bydgoszcz, Poland, Faculty of Management
Abstract: Production companies which operate in Special Economic Zones (SEZs) are the key element in leading the
economic growth of Poland. They are responsible for new investment initiatives, which boost socio-economical
situation of different regions in Poland. The aim of the research was to identify the factors which either facilitate or
hinder business development in the newly-created SEZs. In order to perform the study, researchers used
questionnaires among all companies operating in the Pomeranian Special Economic Zone (PSEZ). Researchers adopted
the following hypothesis: operating in the PSEZ offers new opportunities for faster development of a business. The
study proves beyond doubt that locating business in the PSEZ indeed offers producers a chance to speed up business
development, and, what is more, significantly improves competitiveness. The study also shows that favourable
conditions created in the zone may also moderately improve the general functioning of the whole company.
Keywords: Special Economic Zones (SEZs), entrepreneurship, business development, regional development.
JEL code: R11
Introduction
The creation of SEZs was an important step
forward, not only for the businesses operating in
the zone but also for the whole region and its
overall development (Zajdel M., Michalcewicz-
Kaniowska M., 2015). The main beneficiaries are
micro- and small businesses, as they may take
advantage of tax exemption. One of the main
goals for SEZs was to facilitate and assist
innovation in business, by helping those
enterprises, which invent new production
technologies and implement modern solutions in
the process, aimed at increasing competitiveness
of their products and services. Allocating special
purpose areas in a country is hardly a new idea.
The concept dates back as far as the ancient
times. The first SEZs were established worldwide
several decades ago, and they have been
operating in Poland for a dozen or so years
(Kolczynski M., Wojtasik W. 2010). SEZs are
becoming an increasingly popular way of
facilitating regional development and
competitiveness of local businesses
(Michalcewicz-Kaniowska M., Zajdel M., 2015).
The notion of "Special Economic Zone" has
been defined by the National Ministry of Economy
as "an administratively separate part of Polish
territory, allocated for the running of businesses
on preferential terms." These "preferential terms"
are numerous incentives offered to entrepreneurs
doing business in the zones. This is a similar
mechanism to that of social cooperatives, which
also offer financial help and assistance aimed at
supporting regional development (Zajdel M.,
Michalcewicz-Kaniowska M., 2015).
In the case of SEZs, this help can take the
form of profits generated by investors being
exempt from income tax, new investments
receiving financial support at different stages of
their development, and entrepreneurs purchasing
complete development areas, tax-free, at
competitive rates etc. (Polish Investment
Promotion Agency, 2015).
The research concentrated on production
companies that operate in the Special Economic
Zone in Kujawsko-Pomorskie (part of the
Pomeranian SEZ). The primary aim of the
research was to identify the factors responsible
for development of production companies in the
zone. A detailed approach allowed to identify the
following two groups: factors promoting company
development, and those which obstruct it. The
results should provide a satisfactory answer to
the following dilemma: do production companies
operating in the zone develop faster than their
equivalents from outside? Researchers made the
following assumption: production companies
which operate in the Special Economic Zone are
more likely to develop faster, and the co-
Proceedings of the 2016 International Conference “ECONOMIC SCIENCE FOR RURAL DEVELOPMENT” No 41
Jelgava, LLU ESAF, 21-22 April 2016, pp. 180-185
1Corresponding author. Tel.: (0048) 52 340 81 76; e-mail: [email protected] 181l 2Corresponding author. Tel.: (0048) 52 340 81 76; e-mail: [email protected]
operation with the Investment Project
Management Bureau results in increasing their
competitiveness. In order to support the above
claim, the research was carried out between April
and May 2015 among all production companies
belonging to the Special Pomeranian Economic
Zone in Kujawsko-pomorskie province. The
questionnaire was made up of three parts, each
of them including fourteen questions: one open,
eight closed (single choice type), and five closed
(multiple choice type). The first part of the
questionnaire concerned factors determining
development of production companies operating
in the SEZ. The second part focused on analyzing
competition between production companies in the
zone. The third - and final - part of the stud
concerned the current situation of the companies
as determined by belonging to the zone. The
research used reports on Special Economic Zones
published by the Ministry of Economics, decrees
of the Cabinet about Designated Business Areas,
and other legal acts, which regulate the
functioning of the Special Pomeranian Economic
Zone.
Results and discussion
1. Functioning of the SEZs as the driving
force of entrepreneurship - theoretical
background
The success of a company, and keeping in
pace with its changing surroundings depend on
effective support of entrepreneurship (Zuzek D.,
2006). The above statement also applies to SEZs,
which offer entrepreneurs exceptional conditions
for doing business.
Creating and managing SEZs in Poland is
regulated by the Special Economic Zone Act
passed by the Polish Parliament on 20 October
1994 (Official Journal of Laws, 2015, ch. 282).
The free market economy was established in
Poland as the result of significant political
changes which took place in 1989. They have had
a considerable impact on the creation of SEZs.
The first SEZ was called "Euro-Park", and it was
established in Mielec (Podkarpackie province) in
1995. Initially, it was treated as a preliminary
project but soon more SEZs appeared: the
Katowice and Suwalki SEZs (Trojak A.,
Wiedermann K., 2010). Currently, there are 14
SEZs, serving Poland's sixteen provinces. A
special law was passed by the Cabinet in 2013,
which secures the existence of every SEZ until
2026. Interestingly, the areas occupied by SEZs
are continually expanded, currently occupying of
18 354 118 ha (Ministry of Economy, 2015).
Generally, businessmen may choose an area and
apply for it to be turned into SEZ. Successful
applicants have to meet certain criteria, the size
and the innovative character of the project being
the most important ones (Baranski P., Krzyzak
R., Mankowski M., Modzelewska A., 2014). What
is more, it is imperative that the newly-created
SEZs help in a region's development by creating
new work places, increasing export, creating new
technologies which can be used to help in
developing the country's economy, increasing
competitiveness of products and services, and
developing the region's industry and its unused
land (Siudak P., Wątorek W., 2011).
2. Development opportunities of production
companies operating in the Pomeranian
Special Economic Zone - research results
The subject of the study was the Pomeranian
Special Economic Zone (PSEZ). It was
established in 1994, its total area equals 1
859.24 ha, and it covers separated industrial
areas in four regions: Pomorze (Pomerania),
Zachodniopomorskie (West Pomerania),
Kujawsko-Pomorskie province and Wielkopolskie
(Greater Poland). Between 2005 and 2014 the
PSEZ area was expanded by 1480.45 ha. While
the smallest increase in the zone's area occurred
in 2012, a mere 8.60 ha, the biggest increase of
482.64 ha was recorded in 2014.
Researchers carried out a detailed study,
including all companies operating in the PSEZ in
Kujawsko-pomorskie province. The feedback of
the poll was 66%. At first, poll participants were
asked which factors were critical for a company's
Proceedings of the 2016 International Conference “ECONOMIC SCIENCE FOR RURAL DEVELOPMENT” No 41
Jelgava, LLU ESAF, 21-22 April 2016, pp. 180-185
1Corresponding author. Tel.: (0048) 52 340 81 76; e-mail: [email protected] 182l 2Corresponding author. Tel.: (0048) 52 340 81 76; e-mail: [email protected]
success, to which they replied "internal" (53%),
and "external" (29%). The remaining 18% failed
to provide a satisfactory answer. Then they were
asked if they had taken a loan from a bank, to
which the majority (92%) replied in the
affirmative. Next, the respondents were asked to
list factors which would be necessary for the
successful development of companies in PSEZ.
The questionnaires provided the following
answers:
• business location and proximity of the road
network (32%);
• quality of goods and services on offer (12%);
• qualified staff (28%);
• opportunity to obtain funds and get a loan
(18%);
• dealing with public offices in a convenient and
efficient way (0%);
• available technical infrastructure (12%);
• export (6%);
• new investments (22%);
• environmental policies (2%);
• information and promotion.
Not surprisingly, most respondents agreed
that location of a business, with particular
regards to proximity of the road network, was a
decisive factor in its development. Employing
qualified staff is also significant (28%). The third
most important factor playing a key role in a
company development is planned investment
(22%). While offering quality products and
services, and the availability of technical
infrastructure were also recognized as fairly
important, company's exports and its policy
towards the environment were perceived as
irrelevant by the respondents. So was "successful
dealing with public offices" - perceived as not at
all important for development of a company. The
following factors were recognized as company
development inhibitors: competition (26%),
shortage of qualified staff (19%), high building
rent and maintenance costs (13%), unstable
markets (0%), complicated and vague laws and
tax regulations (10%), insufficient capital (8%),
local administration (3%), low demand for
products or services (14%), red tape (30%),
transport infrastructure (0%). The study clearly
shows that bureaucracy (30%) and competition
(26%) are the two major factors responsible for
hindering development of most companies. While
the lack of trained and highly qualified staff
(19%) or meagre demand for products and
services (13%) may also be worrying, limited
space to do business or contacts with local
administration are perceived as a minor concern,
recognized only by 3% of the polled. Neither did
the respondents see high rent and maintenance
costs, the existing transport infrastructure or
unstable market as potential obstacles.
Competitiveness is an integral part of the free
market economy, and it is an indicator of a
company's economic potential.
The majority of respondents took advantage
of a bank loan to facilitate dynamic development
of their companies. Interestingly, the
respondents suggested that the PSEZ authorities
should allow a three-month "trial period" for new
businesses as a possible measure aimed at
tackling excessive bureaucracy in the zone. With
regards to customers, production companies
operating in the PSEZ sell their products and
services mainly to small and medium companies
(51%), large businesses (36%), shops and
wholesalers (18%). Small retailers or individual
customers constitute only a fraction of the
exchange (5%). When asked about the factors
responsible for increasing the competitiveness of
the PSEZ production companies, the respondents
claimed that price was of primary importance
(33%), followed by the quality of products or
services (20%), the company's production
potential (20%), and efficient distribution of
products and services (16%). Market share and
product characteristics are of secondary
importance (6%).
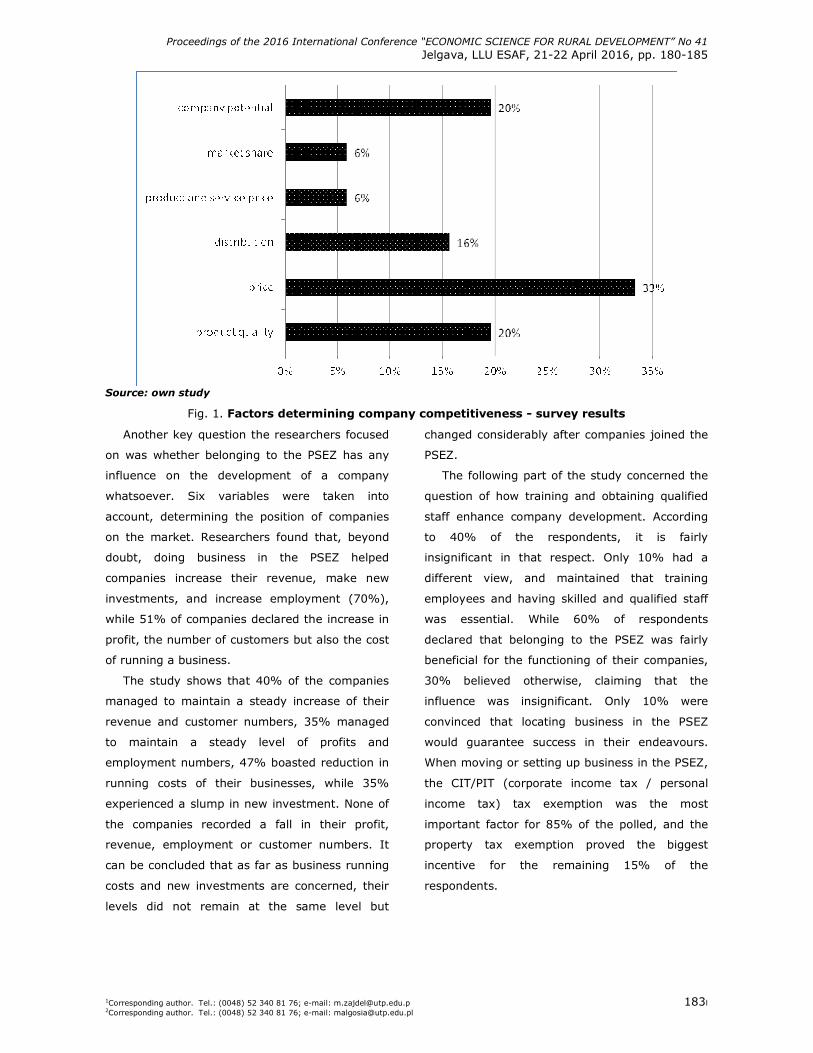
Proceedings of the 2016 International Conference “ECONOMIC SCIENCE FOR RURAL DEVELOPMENT” No 41
Jelgava, LLU ESAF, 21-22 April 2016, pp. 180-185
1Corresponding author. Tel.: (0048) 52 340 81 76; e-mail: [email protected] 183l 2Corresponding author. Tel.: (0048) 52 340 81 76; e-mail: [email protected]
Source: own study
Fig. 1. Factors determining company competitiveness - survey results
Another key question the researchers focused
on was whether belonging to the PSEZ has any
influence on the development of a company
whatsoever. Six variables were taken into
account, determining the position of companies
on the market. Researchers found that, beyond
doubt, doing business in the PSEZ helped
companies increase their revenue, make new
investments, and increase employment (70%),
while 51% of companies declared the increase in
profit, the number of customers but also the cost
of running a business.
The study shows that 40% of the companies
managed to maintain a steady increase of their
revenue and customer numbers, 35% managed
to maintain a steady level of profits and
employment numbers, 47% boasted reduction in
running costs of their businesses, while 35%
experienced a slump in new investment. None of
the companies recorded a fall in their profit,
revenue, employment or customer numbers. It
can be concluded that as far as business running
costs and new investments are concerned, their
levels did not remain at the same level but
changed considerably after companies joined the
PSEZ.
The following part of the study concerned the
question of how training and obtaining qualified
staff enhance company development. According
to 40% of the respondents, it is fairly
insignificant in that respect. Only 10% had a
different view, and maintained that training
employees and having skilled and qualified staff
was essential. While 60% of respondents
declared that belonging to the PSEZ was fairly
beneficial for the functioning of their companies,
30% believed otherwise, claiming that the
influence was insignificant. Only 10% were
convinced that locating business in the PSEZ
would guarantee success in their endeavours.
When moving or setting up business in the PSEZ,
the CIT/PIT (corporate income tax / personal
income tax) tax exemption was the most
important factor for 85% of the polled, and the
property tax exemption proved the biggest
incentive for the remaining 15% of the
respondents.
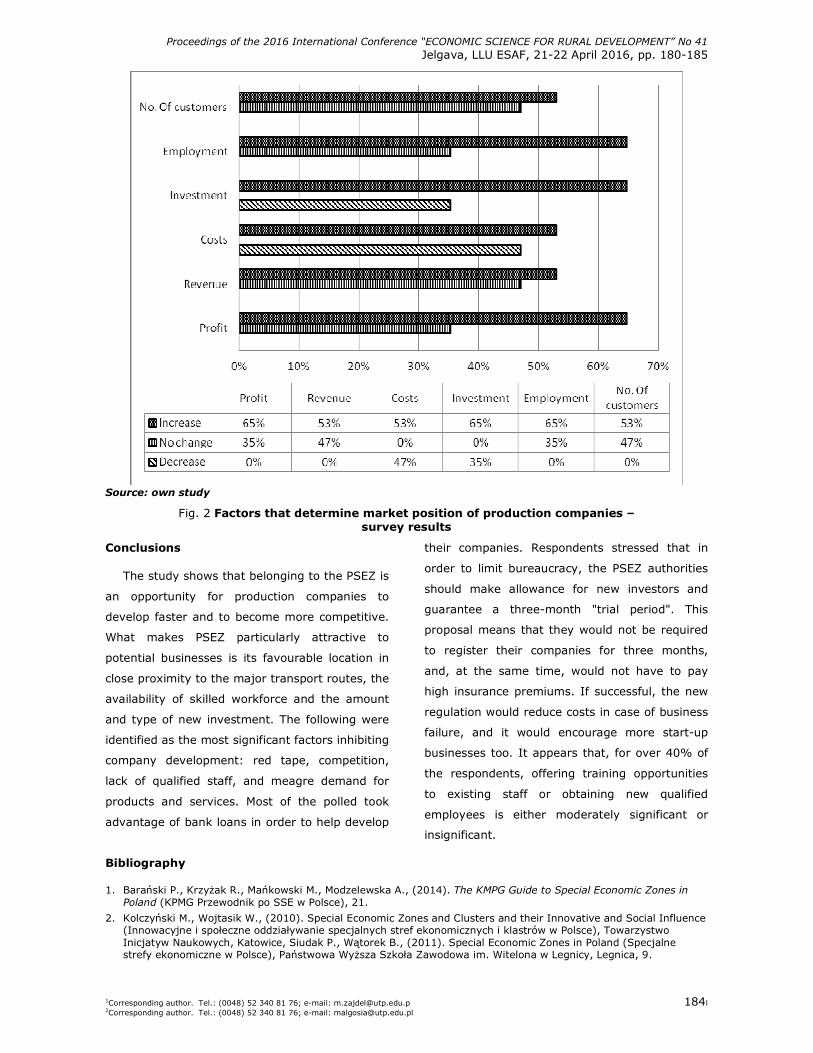
Proceedings of the 2016 International Conference “ECONOMIC SCIENCE FOR RURAL DEVELOPMENT” No 41
Jelgava, LLU ESAF, 21-22 April 2016, pp. 180-185
1Corresponding author. Tel.: (0048) 52 340 81 76; e-mail: [email protected] 184l 2Corresponding author. Tel.: (0048) 52 340 81 76; e-mail: [email protected]
Source: own study
Fig. 2 Factors that determine market position of production companies – survey results
Conclusions
The study shows that belonging to the PSEZ is
an opportunity for production companies to
develop faster and to become more competitive.
What makes PSEZ particularly attractive to
potential businesses is its favourable location in
close proximity to the major transport routes, the
availability of skilled workforce and the amount
and type of new investment. The following were
identified as the most significant factors inhibiting
company development: red tape, competition,
lack of qualified staff, and meagre demand for
products and services. Most of the polled took
advantage of bank loans in order to help develop
their companies. Respondents stressed that in
order to limit bureaucracy, the PSEZ authorities
should make allowance for new investors and
guarantee a three-month "trial period". This
proposal means that they would not be required
to register their companies for three months,
and, at the same time, would not have to pay
high insurance premiums. If successful, the new
regulation would reduce costs in case of business
failure, and it would encourage more start-up
businesses too. It appears that, for over 40% of
the respondents, offering training opportunities
to existing staff or obtaining new qualified
employees is either moderately significant or
insignificant.
Bibliography
1. Barański P., Krzyżak R., Mańkowski M., Modzelewska A., (2014). The KMPG Guide to Special Economic Zones in Poland (KPMG Przewodnik po SSE w Polsce), 21.
2. Kolczyński M., Wojtasik W., (2010). Special Economic Zones and Clusters and their Innovative and Social Influence (Innowacyjne i społeczne oddziaływanie specjalnych stref ekonomicznych i klastrów w Polsce), Towarzystwo Inicjatyw Naukowych, Katowice, Siudak P., Wątorek B., (2011). Special Economic Zones in Poland (Specjalne strefy ekonomiczne w Polsce), Państwowa Wyższa Szkoła Zawodowa im. Witelona w Legnicy, Legnica, 9.
Proceedings of the 2016 International Conference “ECONOMIC SCIENCE FOR RURAL DEVELOPMENT” No 41
Jelgava, LLU ESAF, 21-22 April 2016, pp. 180-185
1Corresponding author. Tel.: (0048) 52 340 81 76; e-mail: [email protected] 185l 2Corresponding author. Tel.: (0048) 52 340 81 76; e-mail: [email protected]
3. Michalcewicz-Kaniowska, M., Zajdel M. (2015). Development of the Kujawsko-Pomorskie Voivodeship in the light of Functioning of Economic Zones (Rozwój regionu kujawsko-pomorskiego w aspekcie funkcjonowania stref ekonomicznych), Europa Regionum, vol. 21, pp.151-162)
4. Michalcewicz-Kaniowska, M., Zajdel M. (2015). Development of the Kujawsko-Pomorskie Voivodeship in the light of functioning of Social Economy Entities - Study Results (Rozwój regionu kujawsko-pomorskiego w aspekcie funkcjonowania podmiotow Ekonomii Spolecznej – wyniki z badań), Europa Regionum, vol.22, 87-95.
5. Michalcewicz-Kaniowska, M., Zajdel M. (2015). Social Cooperatives as Social Economy Actors in the Development of Entrepreneurship - Based on the Example of the Kujawsko-Pomorskie Voivodeship, Yelgawa, Economic Science for Rural Development, no 39, 227-235.
6. Ministry of Economy, (2015). Retrieved from http://www.mg.gov.pl/Wspieranie+przedsiebiorczosci/Wsparcie+finansowe+i+inwestycje/Specjalne+strefy+ekonomiczne/Obszar+SSE, valid on 04.12.2015). The Polish Information and Foreign Investment Agency, (2015). Retrieved from http://www.paiz.gov.pl/strefa_inwestora/zachety_inwestycyjne_w_sse.
7. Official Journal of Laws, (2015). The Law on Special Economic Zones, item 282 (Ustawa o Specjalnych Strefach Ekonomicznych, Dziennik Ustaw; 2015 r. ustęp 282).
8. Trojak A, Wiedermann K, (2010). Shaping Economic Development of Regions in Poland and the Czech Republic (Special Economic and Industrial Zones Specjalne strefy ekonomiczne i strefy przemysłowe w kształtowaniu rozwoju gospodarczego regionów na przykładzie Polski i Czech), Kraków–Warszawa, 133.
9. Zuzek D., (2006), Small and Medium Companies as Being of Regional Entrepreneurship, (Male i srednie przedsiebiorstwa jako istota przedsiebiorczosci regionalnej) In: ActaAgrariaetSilvestri, Vol. XLVI / 1 (EconomicSection), Pub. Polish Academy of Sciences, Krakow, 254 – 262.
Proceedings of the 2016 International Conference “ECONOMIC SCIENCE FOR RURAL DEVELOPMENT” No 41
Jelgava, LLU ESAF, 21-22 April 2016, pp. 186-194
1Corresponding author. Tel.: +48 126623452; fax: +48 126623452, E-mail address: [email protected] 186
ECONOMIC ASPECTS OF BRAND IMPORTANCE AFFECTING THE OPERATIONS AND GROWTH OF ENTERPRISES – RESEARCH RESULTS
Dagmara K. Zuzek1, PhD
1Faculty of Economics, Agricultural University in Cracow
Abstract. The primary objective of the paper was to research consumer preferences and factors affecting brand choice
and to determine its impact on the operations and growth of an enterprise. Economic aspects of brand importance can
be analysed both from the perspective of benefits reaped by both customers and enterprises. Customer satisfaction
plays an important role in boosting the sales of goods, hence, in increasing a given enterprise’s profits. Basing on the
conducted survey, it was ascertained that brand loyalty significantly affected sales volumes. A branded product helps
increase customer value – customers become the embodiment of the brand’s promise. The brand is the source of
information about the product, its qualities and calls up associations related to the branded product’s benefits and
attributes. The research also proved that the product’s brand attracted customers. Consumers perceive branded
products as those characterised by a higher quality and as a result choose them more frequently.
Key words: brand, consumer preferences, fizzy drinks, Malopolska province.
JEL code: M31 Introduction
In the contemporary world where the majority
of goods and services are characterized by supply
exceeding demand, a consumer can make a
choice from product varieties and in consequence
become more demanding. Hence, it is a skill for
enterprises not only to produce but also to sell
their products.
Given such fierce market competition, in order
to maintain their market position enterprises
must look for new competitive advantages. One
of the most effective ways to obtain a
competitive advantage is a strong brand. A brand
is commonly perceived as a showcase of a
product or enterprise, a recognizable mark that
frequently evokes feelings and emotions. Those
emotions and feelings can be positive if a
branded product has delivered on its brand
promise or quite the opposite – negative if the
consumer is disappointed with the product and
has no good associations with it.
The basic aim behind the research is the
analysis of consumer preferences and factors
affecting the brand choice and to determine its
impact on the enterprises’ operations and
growth.
The following tasks were set in order to attain
the main objectives:
examining determinants of the demand for
fizzy drinks by analysing the price, ads,
consumers’ financial situation and their
education;
1) determining the most important factors
affecting the selection of a given brand;
2) determining brand importance to
consumers.
Both secondary and original sources of
information were used in the paper. Its
theoretical part was based on reference literature
and data obtained from sources of mass
information, statistical yearbooks and market
reports.
In the empirical part, a survey was used as a
research tool comprising 36 close-ended or semi-
open ended single or multiple-choice questions
and rating scale questions. The survey was
divided into two basic parts: the first one
comprised 32 questions and referred strictly to
the topic of the research, while the other
comprised four socio-demographic questions that
allowed to characterise the research sample in
regard of sex, education background and family
financial standing. A group of 214 respondents
were interviewed. The research sample was
selected randomly. The survey was conducted in
2015. As regards the age of the respondents, the
selection was purposeful in order to check which
age group consumes the greatest quantity of
fizzy drinks and to learn their preferences. The
respondents were divided into three categories;
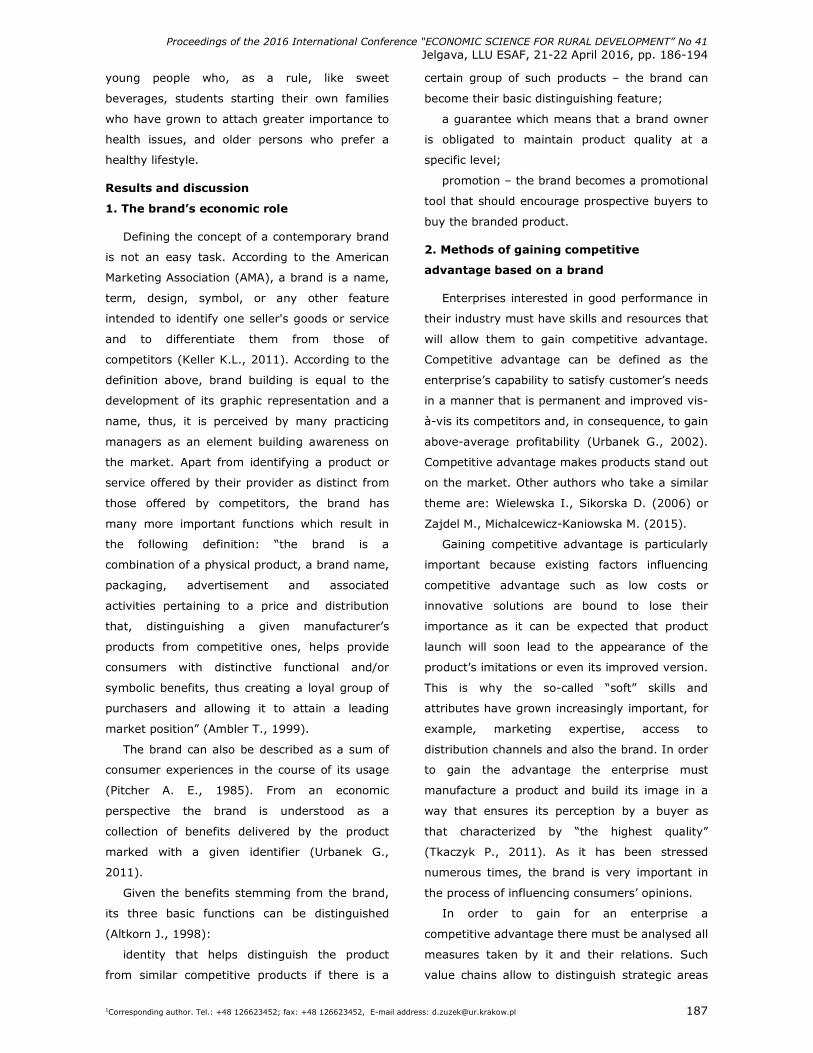
Proceedings of the 2016 International Conference “ECONOMIC SCIENCE FOR RURAL DEVELOPMENT” No 41
Jelgava, LLU ESAF, 21-22 April 2016, pp. 186-194
1Corresponding author. Tel.: +48 126623452; fax: +48 126623452, E-mail address: [email protected] 187
young people who, as a rule, like sweet
beverages, students starting their own families
who have grown to attach greater importance to
health issues, and older persons who prefer a
healthy lifestyle.
Results and discussion
1. The brand’s economic role
Defining the concept of a contemporary brand
is not an easy task. According to the American
Marketing Association (AMA), a brand is a name,
term, design, symbol, or any other feature
intended to identify one seller's goods or service
and to differentiate them from those of
competitors (Keller K.L., 2011). According to the
definition above, brand building is equal to the
development of its graphic representation and a
name, thus, it is perceived by many practicing
managers as an element building awareness on
the market. Apart from identifying a product or
service offered by their provider as distinct from
those offered by competitors, the brand has
many more important functions which result in
the following definition: “the brand is a
combination of a physical product, a brand name,
packaging, advertisement and associated
activities pertaining to a price and distribution
that, distinguishing a given manufacturer’s
products from competitive ones, helps provide
consumers with distinctive functional and/or
symbolic benefits, thus creating a loyal group of
purchasers and allowing it to attain a leading
market position” (Ambler T., 1999).
The brand can also be described as a sum of
consumer experiences in the course of its usage
(Pitcher A. E., 1985). From an economic
perspective the brand is understood as a
collection of benefits delivered by the product
marked with a given identifier (Urbanek G.,
2011).
Given the benefits stemming from the brand,
its three basic functions can be distinguished
(Altkorn J., 1998):
identity that helps distinguish the product
from similar competitive products if there is a
certain group of such products – the brand can
become their basic distinguishing feature;
a guarantee which means that a brand owner
is obligated to maintain product quality at a
specific level;
promotion – the brand becomes a promotional
tool that should encourage prospective buyers to
buy the branded product.
2. Methods of gaining competitive
advantage based on a brand
Enterprises interested in good performance in
their industry must have skills and resources that
will allow them to gain competitive advantage.
Competitive advantage can be defined as the
enterprise’s capability to satisfy customer’s needs
in a manner that is permanent and improved vis-
à-vis its competitors and, in consequence, to gain
above-average profitability (Urbanek G., 2002).
Competitive advantage makes products stand out
on the market. Other authors who take a similar
theme are: Wielewska I., Sikorska D. (2006) or
Zajdel M., Michalcewicz-Kaniowska M. (2015).
Gaining competitive advantage is particularly
important because existing factors influencing
competitive advantage such as low costs or
innovative solutions are bound to lose their
importance as it can be expected that product
launch will soon lead to the appearance of the
product’s imitations or even its improved version.
This is why the so-called “soft” skills and
attributes have grown increasingly important, for
example, marketing expertise, access to
distribution channels and also the brand. In order
to gain the advantage the enterprise must
manufacture a product and build its image in a
way that ensures its perception by a buyer as
that characterized by “the highest quality”
(Tkaczyk P., 2011). As it has been stressed
numerous times, the brand is very important in
the process of influencing consumers’ opinions.
In order to gain for an enterprise a
competitive advantage there must be analysed all
measures taken by it and their relations. Such
value chains allow to distinguish strategic areas
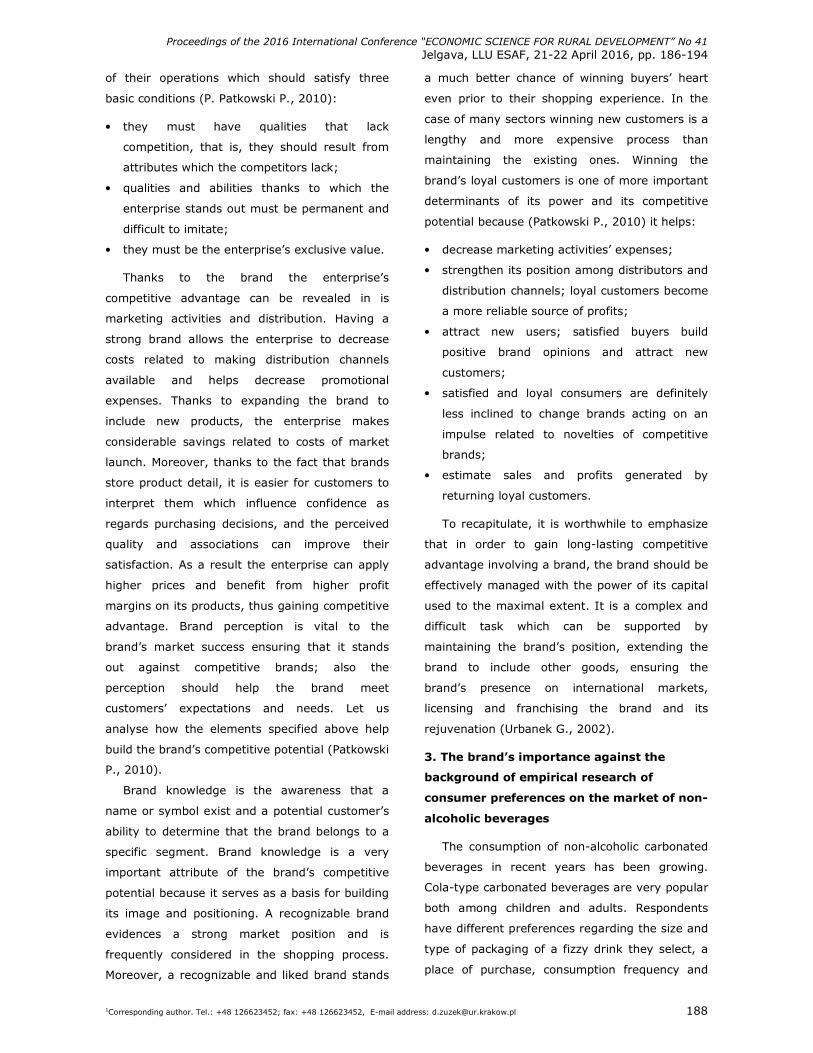
Proceedings of the 2016 International Conference “ECONOMIC SCIENCE FOR RURAL DEVELOPMENT” No 41
Jelgava, LLU ESAF, 21-22 April 2016, pp. 186-194
1Corresponding author. Tel.: +48 126623452; fax: +48 126623452, E-mail address: [email protected] 188
of their operations which should satisfy three
basic conditions (P. Patkowski P., 2010):
• they must have qualities that lack
competition, that is, they should result from
attributes which the competitors lack;
• qualities and abilities thanks to which the
enterprise stands out must be permanent and
difficult to imitate;
• they must be the enterprise’s exclusive value.
Thanks to the brand the enterprise’s
competitive advantage can be revealed in is
marketing activities and distribution. Having a
strong brand allows the enterprise to decrease
costs related to making distribution channels
available and helps decrease promotional
expenses. Thanks to expanding the brand to
include new products, the enterprise makes
considerable savings related to costs of market
launch. Moreover, thanks to the fact that brands
store product detail, it is easier for customers to
interpret them which influence confidence as
regards purchasing decisions, and the perceived
quality and associations can improve their
satisfaction. As a result the enterprise can apply
higher prices and benefit from higher profit
margins on its products, thus gaining competitive
advantage. Brand perception is vital to the
brand’s market success ensuring that it stands
out against competitive brands; also the
perception should help the brand meet
customers’ expectations and needs. Let us
analyse how the elements specified above help
build the brand’s competitive potential (Patkowski
P., 2010).
Brand knowledge is the awareness that a
name or symbol exist and a potential customer’s
ability to determine that the brand belongs to a
specific segment. Brand knowledge is a very
important attribute of the brand’s competitive
potential because it serves as a basis for building
its image and positioning. A recognizable brand
evidences a strong market position and is
frequently considered in the shopping process.
Moreover, a recognizable and liked brand stands
a much better chance of winning buyers’ heart
even prior to their shopping experience. In the
case of many sectors winning new customers is a
lengthy and more expensive process than
maintaining the existing ones. Winning the
brand’s loyal customers is one of more important
determinants of its power and its competitive
potential because (Patkowski P., 2010) it helps:
• decrease marketing activities’ expenses;
• strengthen its position among distributors and
distribution channels; loyal customers become
a more reliable source of profits;
• attract new users; satisfied buyers build
positive brand opinions and attract new
customers;
• satisfied and loyal consumers are definitely
less inclined to change brands acting on an
impulse related to novelties of competitive
brands;
• estimate sales and profits generated by
returning loyal customers.
To recapitulate, it is worthwhile to emphasize
that in order to gain long-lasting competitive
advantage involving a brand, the brand should be
effectively managed with the power of its capital
used to the maximal extent. It is a complex and
difficult task which can be supported by
maintaining the brand’s position, extending the
brand to include other goods, ensuring the
brand’s presence on international markets,
licensing and franchising the brand and its
rejuvenation (Urbanek G., 2002).
3. The brand’s importance against the
background of empirical research of
consumer preferences on the market of non-
alcoholic beverages
The consumption of non-alcoholic carbonated
beverages in recent years has been growing.
Cola-type carbonated beverages are very popular
both among children and adults. Respondents
have different preferences regarding the size and
type of packaging of a fizzy drink they select, a
place of purchase, consumption frequency and
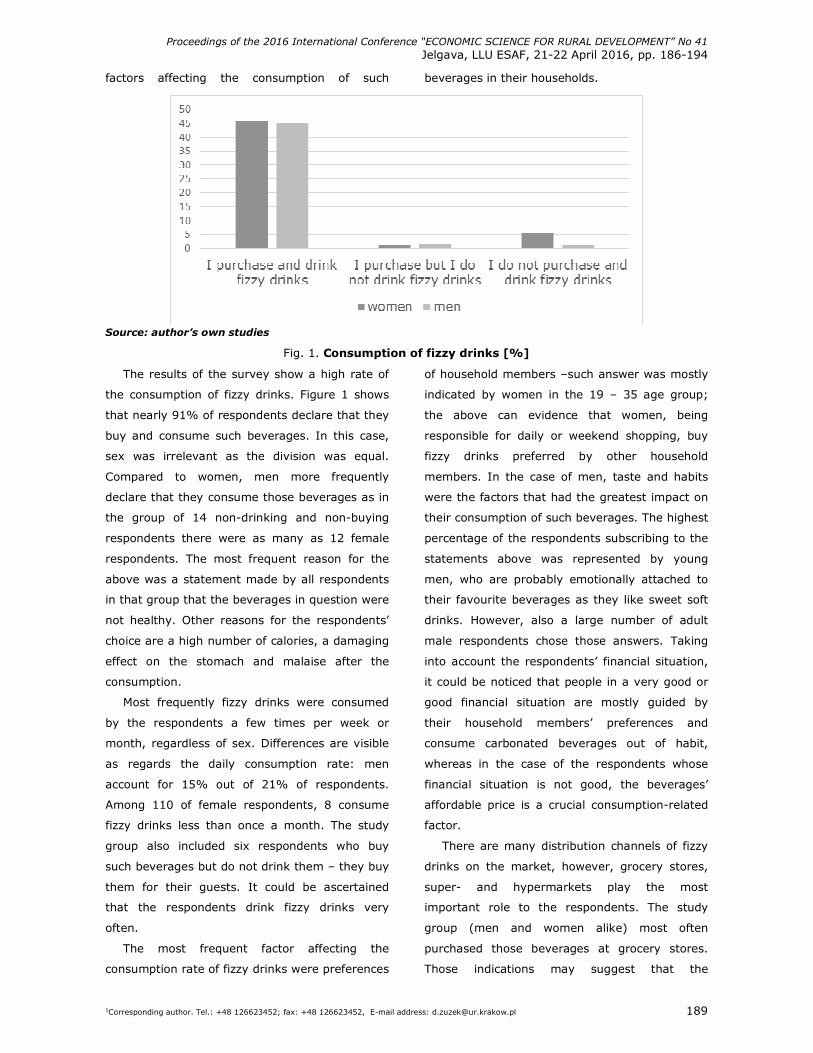
Proceedings of the 2016 International Conference “ECONOMIC SCIENCE FOR RURAL DEVELOPMENT” No 41
Jelgava, LLU ESAF, 21-22 April 2016, pp. 186-194
1Corresponding author. Tel.: +48 126623452; fax: +48 126623452, E-mail address: [email protected] 189
factors affecting the consumption of such beverages in their households.
Source: author’s own studies
Fig. 1. Consumption of fizzy drinks [%]
The results of the survey show a high rate of
the consumption of fizzy drinks. Figure 1 shows
that nearly 91% of respondents declare that they
buy and consume such beverages. In this case,
sex was irrelevant as the division was equal.
Compared to women, men more frequently
declare that they consume those beverages as in
the group of 14 non-drinking and non-buying
respondents there were as many as 12 female
respondents. The most frequent reason for the
above was a statement made by all respondents
in that group that the beverages in question were
not healthy. Other reasons for the respondents’
choice are a high number of calories, a damaging
effect on the stomach and malaise after the
consumption.
Most frequently fizzy drinks were consumed
by the respondents a few times per week or
month, regardless of sex. Differences are visible
as regards the daily consumption rate: men
account for 15% out of 21% of respondents.
Among 110 of female respondents, 8 consume
fizzy drinks less than once a month. The study
group also included six respondents who buy
such beverages but do not drink them – they buy
them for their guests. It could be ascertained
that the respondents drink fizzy drinks very
often.
The most frequent factor affecting the
consumption rate of fizzy drinks were preferences
of household members –such answer was mostly
indicated by women in the 19 – 35 age group;
the above can evidence that women, being
responsible for daily or weekend shopping, buy
fizzy drinks preferred by other household
members. In the case of men, taste and habits
were the factors that had the greatest impact on
their consumption of such beverages. The highest
percentage of the respondents subscribing to the
statements above was represented by young
men, who are probably emotionally attached to
their favourite beverages as they like sweet soft
drinks. However, also a large number of adult
male respondents chose those answers. Taking
into account the respondents’ financial situation,
it could be noticed that people in a very good or
good financial situation are mostly guided by
their household members’ preferences and
consume carbonated beverages out of habit,
whereas in the case of the respondents whose
financial situation is not good, the beverages’
affordable price is a crucial consumption-related
factor.
There are many distribution channels of fizzy
drinks on the market, however, grocery stores,
super- and hypermarkets play the most
important role to the respondents. The study
group (men and women alike) most often
purchased those beverages at grocery stores.
Those indications may suggest that the
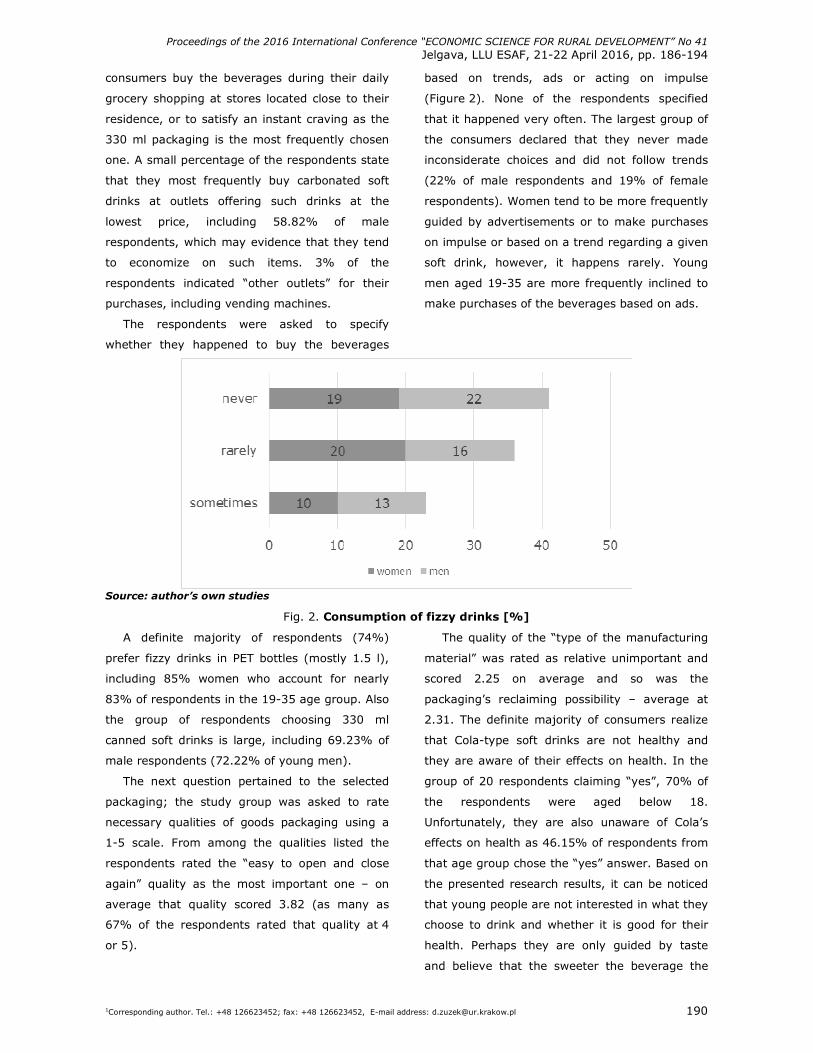
Proceedings of the 2016 International Conference “ECONOMIC SCIENCE FOR RURAL DEVELOPMENT” No 41
Jelgava, LLU ESAF, 21-22 April 2016, pp. 186-194
1Corresponding author. Tel.: +48 126623452; fax: +48 126623452, E-mail address: [email protected] 190
consumers buy the beverages during their daily
grocery shopping at stores located close to their
residence, or to satisfy an instant craving as the
330 ml packaging is the most frequently chosen
one. A small percentage of the respondents state
that they most frequently buy carbonated soft
drinks at outlets offering such drinks at the
lowest price, including 58.82% of male
respondents, which may evidence that they tend
to economize on such items. 3% of the
respondents indicated “other outlets” for their
purchases, including vending machines.
The respondents were asked to specify
whether they happened to buy the beverages
based on trends, ads or acting on impulse
(Figure 2). None of the respondents specified
that it happened very often. The largest group of
the consumers declared that they never made
inconsiderate choices and did not follow trends
(22% of male respondents and 19% of female
respondents). Women tend to be more frequently
guided by advertisements or to make purchases
on impulse or based on a trend regarding a given
soft drink, however, it happens rarely. Young
men aged 19-35 are more frequently inclined to
make purchases of the beverages based on ads.
Source: author’s own studies
Fig. 2. Consumption of fizzy drinks [%]
A definite majority of respondents (74%)
prefer fizzy drinks in PET bottles (mostly 1.5 l),
including 85% women who account for nearly
83% of respondents in the 19-35 age group. Also
the group of respondents choosing 330 ml
canned soft drinks is large, including 69.23% of
male respondents (72.22% of young men).
The next question pertained to the selected
packaging; the study group was asked to rate
necessary qualities of goods packaging using a
1-5 scale. From among the qualities listed the
respondents rated the “easy to open and close
again” quality as the most important one – on
average that quality scored 3.82 (as many as
67% of the respondents rated that quality at 4
or 5).
The quality of the “type of the manufacturing
material” was rated as relative unimportant and
scored 2.25 on average and so was the
packaging’s reclaiming possibility – average at
2.31. The definite majority of consumers realize
that Cola-type soft drinks are not healthy and
they are aware of their effects on health. In the
group of 20 respondents claiming “yes”, 70% of
the respondents were aged below 18.
Unfortunately, they are also unaware of Cola’s
effects on health as 46.15% of respondents from
that age group chose the “yes” answer. Based on
the presented research results, it can be noticed
that young people are not interested in what they
choose to drink and whether it is good for their
health. Perhaps they are only guided by taste
and believe that the sweeter the beverage the
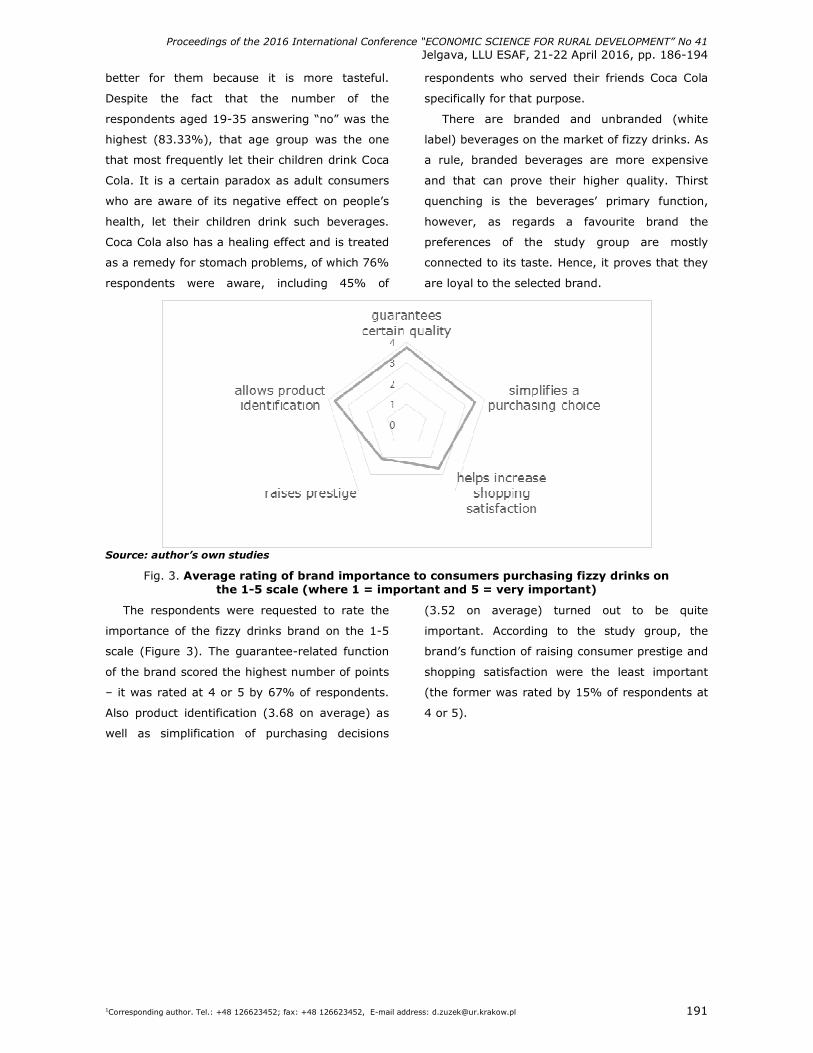
Proceedings of the 2016 International Conference “ECONOMIC SCIENCE FOR RURAL DEVELOPMENT” No 41
Jelgava, LLU ESAF, 21-22 April 2016, pp. 186-194
1Corresponding author. Tel.: +48 126623452; fax: +48 126623452, E-mail address: [email protected] 191
better for them because it is more tasteful.
Despite the fact that the number of the
respondents aged 19-35 answering “no” was the
highest (83.33%), that age group was the one
that most frequently let their children drink Coca
Cola. It is a certain paradox as adult consumers
who are aware of its negative effect on people’s
health, let their children drink such beverages.
Coca Cola also has a healing effect and is treated
as a remedy for stomach problems, of which 76%
respondents were aware, including 45% of
respondents who served their friends Coca Cola
specifically for that purpose.
There are branded and unbranded (white
label) beverages on the market of fizzy drinks. As
a rule, branded beverages are more expensive
and that can prove their higher quality. Thirst
quenching is the beverages’ primary function,
however, as regards a favourite brand the
preferences of the study group are mostly
connected to its taste. Hence, it proves that they
are loyal to the selected brand.
Source: author’s own studies
Fig. 3. Average rating of brand importance to consumers purchasing fizzy drinks on the 1-5 scale (where 1 = important and 5 = very important)
The respondents were requested to rate the
importance of the fizzy drinks brand on the 1-5
scale (Figure 3). The guarantee-related function
of the brand scored the highest number of points
– it was rated at 4 or 5 by 67% of respondents.
Also product identification (3.68 on average) as
well as simplification of purchasing decisions
(3.52 on average) turned out to be quite
important. According to the study group, the
brand’s function of raising consumer prestige and
shopping satisfaction were the least important
(the former was rated by 15% of respondents at
4 or 5).
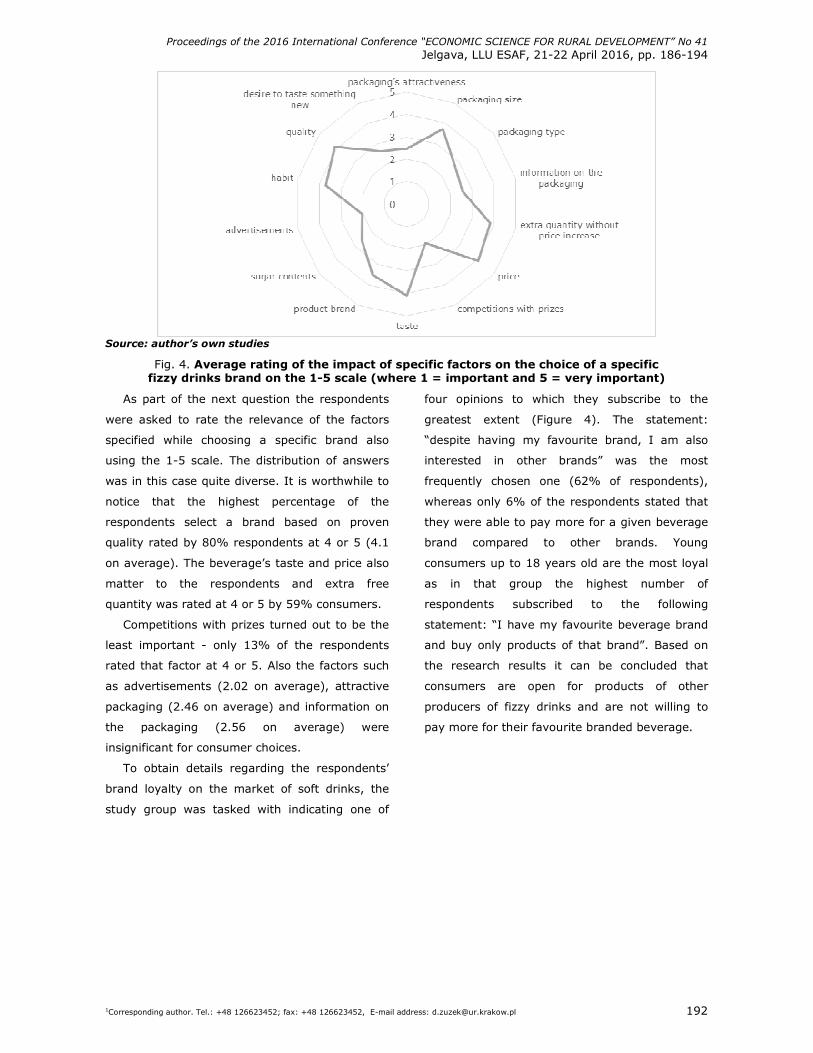
Proceedings of the 2016 International Conference “ECONOMIC SCIENCE FOR RURAL DEVELOPMENT” No 41
Jelgava, LLU ESAF, 21-22 April 2016, pp. 186-194
1Corresponding author. Tel.: +48 126623452; fax: +48 126623452, E-mail address: [email protected] 192
Source: author’s own studies
Fig. 4. Average rating of the impact of specific factors on the choice of a specific fizzy drinks brand on the 1-5 scale (where 1 = important and 5 = very important)
As part of the next question the respondents
were asked to rate the relevance of the factors
specified while choosing a specific brand also
using the 1-5 scale. The distribution of answers
was in this case quite diverse. It is worthwhile to
notice that the highest percentage of the
respondents select a brand based on proven
quality rated by 80% respondents at 4 or 5 (4.1
on average). The beverage’s taste and price also
matter to the respondents and extra free
quantity was rated at 4 or 5 by 59% consumers.
Competitions with prizes turned out to be the
least important - only 13% of the respondents
rated that factor at 4 or 5. Also the factors such
as advertisements (2.02 on average), attractive
packaging (2.46 on average) and information on
the packaging (2.56 on average) were
insignificant for consumer choices.
To obtain details regarding the respondents’
brand loyalty on the market of soft drinks, the
study group was tasked with indicating one of
four opinions to which they subscribe to the
greatest extent (Figure 4). The statement:
“despite having my favourite brand, I am also
interested in other brands” was the most
frequently chosen one (62% of respondents),
whereas only 6% of the respondents stated that
they were able to pay more for a given beverage
brand compared to other brands. Young
consumers up to 18 years old are the most loyal
as in that group the highest number of
respondents subscribed to the following
statement: “I have my favourite beverage brand
and buy only products of that brand”. Based on
the research results it can be concluded that
consumers are open for products of other
producers of fizzy drinks and are not willing to
pay more for their favourite branded beverage.
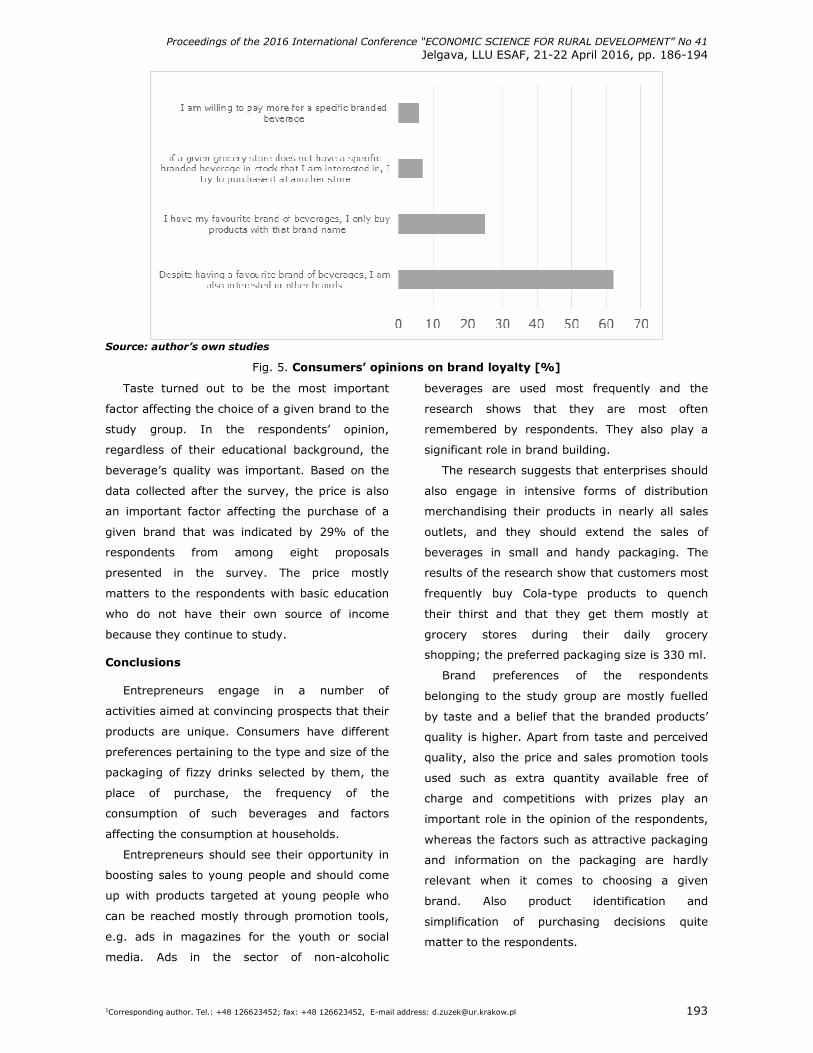
Proceedings of the 2016 International Conference “ECONOMIC SCIENCE FOR RURAL DEVELOPMENT” No 41
Jelgava, LLU ESAF, 21-22 April 2016, pp. 186-194
1Corresponding author. Tel.: +48 126623452; fax: +48 126623452, E-mail address: [email protected] 193
Source: author’s own studies
Fig. 5. Consumers’ opinions on brand loyalty [%]
Taste turned out to be the most important
factor affecting the choice of a given brand to the
study group. In the respondents’ opinion,
regardless of their educational background, the
beverage’s quality was important. Based on the
data collected after the survey, the price is also
an important factor affecting the purchase of a
given brand that was indicated by 29% of the
respondents from among eight proposals
presented in the survey. The price mostly
matters to the respondents with basic education
who do not have their own source of income
because they continue to study.
Conclusions
Entrepreneurs engage in a number of
activities aimed at convincing prospects that their
products are unique. Consumers have different
preferences pertaining to the type and size of the
packaging of fizzy drinks selected by them, the
place of purchase, the frequency of the
consumption of such beverages and factors
affecting the consumption at households.
Entrepreneurs should see their opportunity in
boosting sales to young people and should come
up with products targeted at young people who
can be reached mostly through promotion tools,
e.g. ads in magazines for the youth or social
media. Ads in the sector of non-alcoholic
beverages are used most frequently and the
research shows that they are most often
remembered by respondents. They also play a
significant role in brand building.
The research suggests that enterprises should
also engage in intensive forms of distribution
merchandising their products in nearly all sales
outlets, and they should extend the sales of
beverages in small and handy packaging. The
results of the research show that customers most
frequently buy Cola-type products to quench
their thirst and that they get them mostly at
grocery stores during their daily grocery
shopping; the preferred packaging size is 330 ml.
Brand preferences of the respondents
belonging to the study group are mostly fuelled
by taste and a belief that the branded products’
quality is higher. Apart from taste and perceived
quality, also the price and sales promotion tools
used such as extra quantity available free of
charge and competitions with prizes play an
important role in the opinion of the respondents,
whereas the factors such as attractive packaging
and information on the packaging are hardly
relevant when it comes to choosing a given
brand. Also product identification and
simplification of purchasing decisions quite
matter to the respondents.
Proceedings of the 2016 International Conference “ECONOMIC SCIENCE FOR RURAL DEVELOPMENT” No 41
Jelgava, LLU ESAF, 21-22 April 2016, pp. 186-194
1Corresponding author. Tel.: +48 126623452; fax: +48 126623452, E-mail address: [email protected] 194
The brand helps identify product qualities and
indicates benefits stemming from the purchase.
Considering brand importance from the
marketing perspective, attention must be paid to
the buyers. Customers respond to marketing
activities very differently. It is possible to
succeed if “opinion leaders” are reached who
actually influence the development of beliefs
among specific social groups. Thanks to brand
loyalty of those who can influence others and
thanks to skilfully chosen forms of promotion,
consumers’ engagement can be increased. It is
very important from the perspective of customer
loyalty, because the brand makes the customer
attached to a given product and enterprise.
Apart from boosting sales through the brand,
enterprises also reap other fundamental benefits.
The brand ensures that the enterprise can make
regular profits and is a protection against
competition. It helps gain competitive advantage.
Branding enables the enterprise to influence
customer’s confidence as regards purchasing
decisions, become familiar with and remember
more product details, whereas the perceived
quality helps increase satisfaction with product
usage. That, in turn, allows to stabilise existing
and future profits and secures future incomes.
However, it should be emphasized that in order
to stabilize profits, the enterprise branded
product must meet customers’ expectations and
be tailored to a specific customer segment. To
that end, one should foster customer brand
loyalty and implement brand loyalty
programmes.
Bibliography
1. Ambler, T. (1999). Marketing Od A do Z (Marketing from A to Z), Wydawnictwo Profesjonalnej Szkoły Biznesu, Krakow, pp. 337-338
2. Altkorn, J. (red.) (1998). Podstawy marketingu (The Basics of Marketing), Instytut Marketingu (The Marketing Institute), Krakow, pp. 153-154
3. Keller, K.L. (2011). Strategiczne zarządzanie marką (Strategic brand management) Oficyna Wolters Kluwer Polska, Warsaw, p. 20
4. Patkowski, P. (2010). Potencjal konkurencyjny marki. Jak zdobywac przewagę na rynku (Brand’s Competitive Potential. How to Gain a Competitive Edge on the Market?), Poltext, Warsaw, p. 71
5. Pitcher, A.E. (1985). The Role of Branding In International Advertising, International Journal of Advertising, 4, pp. 241-246
6. Urbanek, G. (2002). Zarzadzanie marką (Brand Management), Wyd. PWE, Warsaw, pp. 15-17
7. Urbanek, G. (2011). Wplyw marki na wartosc dla akcjonariuszy na przykladzie wybranych spólek notowanych na WGPW (Brand Impact on Shareholder Value Based on the Example of Selected Enterprises Quoted at the Warsaw Stock Exchange), Marketing i Rynek, 8, p. 29
8. Tkaczyk, P. (2011). Zakamarki marki. Rzeczy, o ktorych moglbys nie wiedziec, zapomniec lub pominac podczas budowania swojej marki (Brand Secrets. Things that Can Be Potentially Ignored, Forgotten or Skipped in Brand Building), Helion, Gliwice, p. 32
9. Wielewska, I., Sikorska, D. (2006). Determinants of Development of Competitiveness in Agricultural Enterprises (Uwarunkowania rozwoju konkurencyjnosci w przedsiebiorstwach agrobiznesu) (w:) Agrobiznes 2006. Konkurencja w agrobiznesie – jej uwarunkowania i nastepstwa, S. Urban (red.), Wydawnictwo Akademii Ekonomicznej we Wroclawiu, Wrocław, vol. 2, pp. 476-480
10. Zajdel, M., Michalcewicz-Kaniowska, M. (2015). Social Cooperatives as Social Economy Actors in the Development of Entrepreneurship - Based on the Example of the Kujawsko-Pomorskie Voivodeship, Yelgawa, Economic Science for Rural Development, No 39, p 227-235
The publication was financed from subsidies for maintenance of research potential granted by
Ministry of Science and Higher Education
Proceedings of the 2016 International Conference “ECONOMIC SCIENCE FOR RURAL DEVELOPMENT” No 41
Jelgava, LLU ESAF, 21-22 April 2016, pp. 195-202
1Corresponding author. Tel.:+371 26408253. E-mail address: [email protected] 195 2Corresponding author. Tel.:+371 29922707. E-mail address: [email protected]
UNEMPLOYMENT PROBLEMS IN THE REGIONS OF LATVIA Rosita Zvirgzdina1, Dr.oec.; Ina Jekabsone1, Mg. oec.
TURIBA
Abstract. In the regions of Latvia, there are vacancies, but at the same time there is unemployment and employers
have problems in finding employees for their companies.
The main aim of this research is to evaluate unemployment situation in the regions of Latvia. In the research, there
will be characterised unemployment specifics in the regions of Latvia, inhabitant economic activity level and
distribution by economic activity, as well as education level of unemployed people. During research there will be drawn
conclusions and developed proposals for objective evaluation of unemployment situation and for improvement of
remuneration in the regions of Latvia.
Keywords: regions, unemployment, inhabitants, job seekers, labour market.
JEL code: E24
Introduction
The decrease in population and society
ageing, regarding the fact that inhabitants retire
later, is a substantial problem in the field of
employment and unemployment not only in the
European Union, but also in Latvia. The number
of inhabitants of Latvia continues to decrease –
from 2044813 on January 1, 2012, to 1986096
on January 1, 2015, which means a decrease by
58717 people or approximately 2.87% in four
years. Meanwhile, the number of unemployed
people in Latvia was 155.1 thousand on January
1, 2012 and 107.6 thousand on January 1, 2014,
which constituted a decrease of 30.63%. It
significantly impacted labour market. The
minimum salary in Latvia was increased from
EUR 320 to EUR 360, but since January 1, 2016 it
is EUR 370. This salary increase is felt by only
those who have minimum salary. Therefore, for
Latvian companies, it becomes more and more
problematic to retain qualified labour force if their
salary is not increased and when their
requirements keep increasing. Larger salaries are
paid to middle and higher level managers. In
general, the state lacks qualified specialists.
Labour costs in Latvia are among the lowest in
the EU Member States. In 2014, the labour costs
per one employed in Latvian economy in total
were 38% of the EU average, incl. manufacturing
industry – 31.4% of the EU average.
Nevertheless, there were some small
improvements – in the period from 2011 to 2014,
the labour costs decreased by nearly 6
percentage points. By the productivity indicator,
the overall retardation of Latvia from the EU
average decreased by 4 percentage points, while
the manufacturing retardation decreased by 3
percentage points.
There were also larger improvements. Since
the end of 2010, the remuneration increase
renewed, though the unemployment level
maintained at a relatively high level. With the
increase in demand for labour force, the average
gross remuneration has steadily been rising. In
2012 and 2013, it rose by 3.8% and 4.5%
correspondingly, but in 2014 – by 6.8%, reaching
EUR 765. A sharp remuneration increase took
place also in 2015 – during the second quarter
the average gross salary increased by 6.9%,
compared to the corresponding period in 2014,
reaching EUR 815. The highest remuneration
remained in Riga region (EUR 921), while the
lowest was in Latgale region (EUR 560). In the
second quarter, 2015, the remuneration in the
private sector increased by 7.8% and in the
public sector – by 5.3%. Meanwhile, it should be
noted that, in the second quarter of 2015, the
average gross salary in the public sector was only
by 6.2% higher than in 2008, while in the private
sector it exceeded the level of 2008 by nearly
28%. The most significant remuneration increase
has been in the real estate sector, trade and
state administration. The most significant
remuneration increase, if compared with the
second quarter of 2014, was in the information
and communication service sector (by 9.7%),
Proceedings of the 2016 International Conference “ECONOMIC SCIENCE FOR RURAL DEVELOPMENT” No 41
Jelgava, LLU ESAF, 21-22 April 2016, pp. 195-202
1Corresponding author. Tel.:+371 26408253. E-mail address: [email protected] 196 2Corresponding author. Tel.:+371 29922707. E-mail address: [email protected]
real estate sector (by 9.4%) and hospitality and
catering sector (by 9%). With the increase in the
nominal remuneration, the real wages also kept
gradually increasing. In the period 2011–2012,
with the growth in consumer prices, the real
wage increase was moderate – 0.1% and 1.6%,
correspondingly. More dynamic increase in real
wages was observed from 2013 to 2014. In
2013, the real wages increased by 5.6% and in
2014 – by 8%. In the second quarter of 2015,
the real wage level was by 6.6% higher than a
year before. The real wage growth during the
recent years was mostly due to the sharp
increase in nominal salary, and to less extent –
the changes in consumer prices. (Informativais
ziņojums par makroekonomisko situaciju valsti,
2015). The Ministry of Finance forecasted that
the average gross salary in Latvia could be EUR
840.8 in 2016.
The remuneration levelling-out is an objective
process to be taken into account in future. With
the increase in minimum salary, there may be a
sharper rise in wages. Therefore the
entrepreneurs may have an increasing wish to
retain highly-qualified employees, which would
lead to decrease in unemployment. The increase
in remuneration can serve as a stimulus for
innovation and investment, acquisition of new
technologies to increase productivity of
production resources, to raise work productivity
and to cut expenses. It may also create negative
impact on competitiveness.
Based on the labour market-related research
carried out at the end of 2014, there can be
distinguished the main challenges regarding the
lack of qualified specialists and labour force in
general in the country. The research data show
that currently the main labour force-related
challenges are the lack of qualified specialists
(37%) and the lack of labour force in general due
to the impact of the EU free market and
emigration for labour purposes (10%), which
correlates with the previously described economic
and demographic situation in the country.
Further, according to the times mentioned,
follows the lack of employee motivation (6%) and
the increase in employee requirements, e.g.
remuneration, additional benefits (5%).
Analysing data in smaller socio-demographic
groups, it can be seen that the lack of qualified
specialists as the main challenge has most often
been mentioned by managers of manufacturing
companies, as well as those of medium and large
companies (50+ employees). The general lack of
employees has been mentioned as the main
challenge by managers of manufacturing
companies. The managers of manufacturing
companies state also the specifics of the sector
(hard, stressful and hardly predictable work) as a
significant challenge (Kanejeva, 2014).
According to the report of the Ministry of
Economics on the macroeconomic situation in the
country it can be concluded that, with the
improvement of economic situation in the
country, there may be observed positive trends
in the labour market – decrease in
unemployment and increase in employment. At
the same time, the dynamics of improvement
become slower, influenced by the decrease in
economic growth rate which is linked to the
trends in the external environment. In 2014, the
situation in the labour market continued to
improve, though slower than before. The
unemployment level decreased to 10.8%, which
was by 1.1% less than in 2013, but the
employment level increased by 9% - to 59.1%.
In 2014, there were employed 884.6 th. people,
while the number of jobseekers was 107.6
thousand, which was by 12.7 thousand less than
in 2013. In 2014, the number of economically
active inhabitants also continued to decrease –
by nearly 22 thousand people or 2.2% if
compared with 2013. It should be mentioned that
the trend of decrease in the number of
economically active inhabitants has maintained
since the beginning of 2013. Nevertheless, the
level of economic activity of the inhabitants
increased in 2014 by 0.3% and reached 66.3% in
Proceedings of the 2016 International Conference “ECONOMIC SCIENCE FOR RURAL DEVELOPMENT” No 41
Jelgava, LLU ESAF, 21-22 April 2016, pp. 195-202
1Corresponding author. Tel.:+371 26408253. E-mail address: [email protected] 197 2Corresponding author. Tel.:+371 29922707. E-mail address: [email protected]
the age group from 15 to 74. In the second
quarter of 2015 the employment level increased
by 1% if compared with the corresponding period
of the previous year. Though the employment
increase has been the sharpest within the recent
year and a half, it still significantly lags behind
the employment increase dynamics of 2012 and
2013. In total in second quarter of 2015, there
were employed 898.2 thousand people or 60.9%
of the inhabitants in the age group from 15 to
74. If compared with the second quarter of 2014,
the employment level increased by 1.5%. The
unemployment level in the second quarter of
2015, if compared with the corresponding period
in 2014, decreased by 0.9% - to 9.8%. At the
same time, if compared with the previous period,
the unemployment level decreased by 0.5%. The
level of registered unemployment also continues
to decrease. At the end of August, 2015, it
decreased to 8.5%. There were registered 79.8
thousand unemployed people, which was by 1.1
thousand less than in August, 2014. The highest
registered unemployment level maintained in
Latgale region (18.4%) and the lowest – in Riga
(5.1%). Nearly one third of the total number of
registered unemployed were long-term
unemployed (jobless for more than a year).
Comparatively high unemployment level is mainly
connected to other cyclical factors, though the
structural unemployment risk also maintains
high. Part of current unemployed people may
have lengthy problems in finding a job as the
new workplaces are not the same as lost during
the economic crisis. At the same time a
substantial problem is regional disproportionality
of the labour market – jobs and labour resources
are not distributed evenly among the regions.
The number of employed continues to grow
slowly. The number of employed people in 2012
was 875.6 thousand, in 2013 – 883.9 thousand
and in 2014 – 884.6 thousand.
The situation in the labour market is
improving. According to the research carried out
by the Ministry of Economics, the employment
was forecasted to increase to 889 thousand in
2015. In 2016, the number of employed people
could increase to about 894 thousand or by
0.6%, if compared to 2015. The employment
level could surpass 61%, while the
unemployment level would decrease to 8.7%.
In general, both in 2015 and 2016, the largest
growth in employment was expected in the
sectors targeted at the domestic demand –
commercial services sector, construction and
trade. The increase in the demand for labour
force would also maintain in manufacturing, but it
would be slower than previously.
According to the forecast of the State
Employment Agency, the unemployment level
was expected to be 10.1% in 2015 and 9.5% in
2016.
According the research of the Central Bureau
of Statistics, the data evidence the decrease in
unemployment level, yet there is a misbalance in
labour force supply and demand – companies
lack employees, but the unemployed people lack
the necessary qualifications. On the labour
market, currently, there is demand in those
professions where employees need a higher
education level than the secondary education. At
the same time, most of the unemployed people
previously were employed in the basic jobs
(handymen, sellers, cleaners, street-sweepers,
etc.), where the education level does not have
constitutive significance. Therefore, qualification
development promotion is needed, as well as
acquisition of new skills, within these
unemployment groups. Additionally, it should be
noted that there are new requirements even for
basic jobs, determined by the development of
technological processes.
The research includes the period 2012-2014
and also looks at the highlights of 2015.
The aim of the paper is to evaluate the
unemployment situation in the regions of Latvia.
Therefore, the tasks are:
1) to characterise unemployment specifics in
the regions of Latvia;
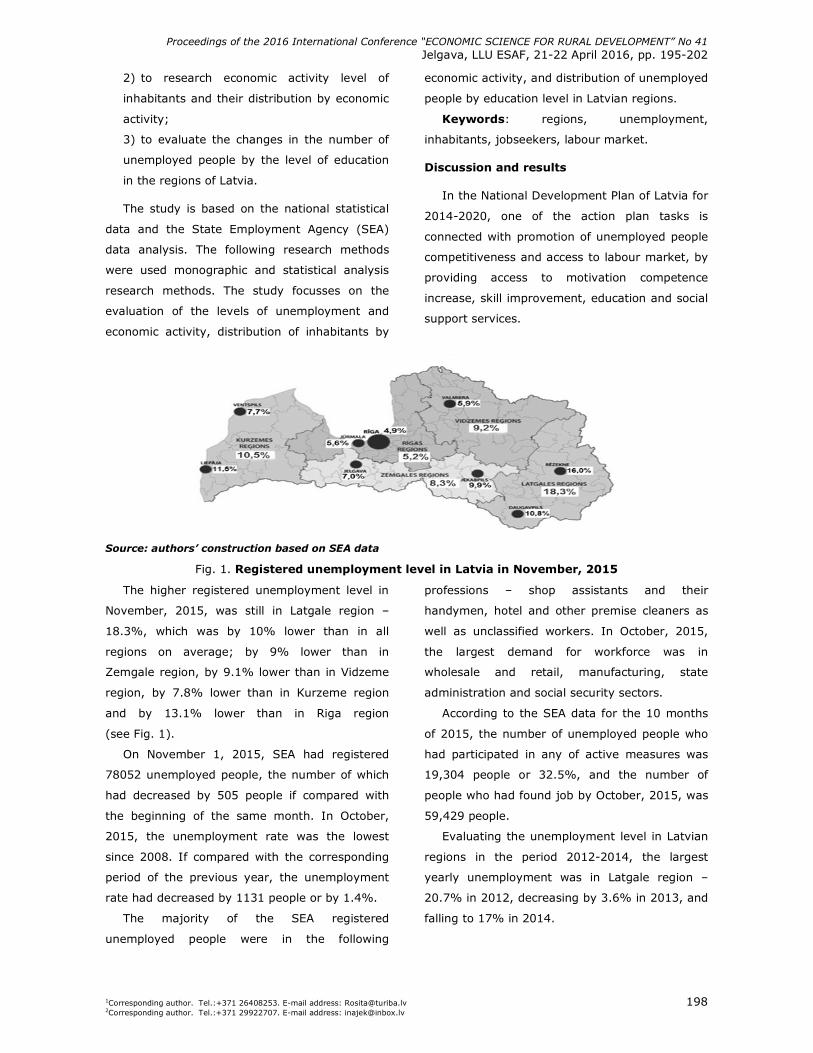
Proceedings of the 2016 International Conference “ECONOMIC SCIENCE FOR RURAL DEVELOPMENT” No 41
Jelgava, LLU ESAF, 21-22 April 2016, pp. 195-202
1Corresponding author. Tel.:+371 26408253. E-mail address: [email protected] 198 2Corresponding author. Tel.:+371 29922707. E-mail address: [email protected]
2) to research economic activity level of
inhabitants and their distribution by economic
activity;
3) to evaluate the changes in the number of
unemployed people by the level of education
in the regions of Latvia.
The study is based on the national statistical
data and the State Employment Agency (SEA)
data analysis. The following research methods
were used monographic and statistical analysis
research methods. The study focusses on the
evaluation of the levels of unemployment and
economic activity, distribution of inhabitants by
economic activity, and distribution of unemployed
people by education level in Latvian regions.
Keywords: regions, unemployment,
inhabitants, jobseekers, labour market.
Discussion and results
In the National Development Plan of Latvia for
2014-2020, one of the action plan tasks is
connected with promotion of unemployed people
competitiveness and access to labour market, by
providing access to motivation competence
increase, skill improvement, education and social
support services.
Source: authors’ construction based on SEA data
Fig. 1. Registered unemployment level in Latvia in November, 2015
The higher registered unemployment level in
November, 2015, was still in Latgale region –
18.3%, which was by 10% lower than in all
regions on average; by 9% lower than in
Zemgale region, by 9.1% lower than in Vidzeme
region, by 7.8% lower than in Kurzeme region
and by 13.1% lower than in Riga region
(see Fig. 1).
On November 1, 2015, SEA had registered
78052 unemployed people, the number of which
had decreased by 505 people if compared with
the beginning of the same month. In October,
2015, the unemployment rate was the lowest
since 2008. If compared with the corresponding
period of the previous year, the unemployment
rate had decreased by 1131 people or by 1.4%.
The majority of the SEA registered
unemployed people were in the following
professions – shop assistants and their
handymen, hotel and other premise cleaners as
well as unclassified workers. In October, 2015,
the largest demand for workforce was in
wholesale and retail, manufacturing, state
administration and social security sectors.
According to the SEA data for the 10 months
of 2015, the number of unemployed people who
had participated in any of active measures was
19,304 people or 32.5%, and the number of
people who had found job by October, 2015, was
59,429 people.
Evaluating the unemployment level in Latvian
regions in the period 2012-2014, the largest
yearly unemployment was in Latgale region –
20.7% in 2012, decreasing by 3.6% in 2013, and
falling to 17% in 2014.
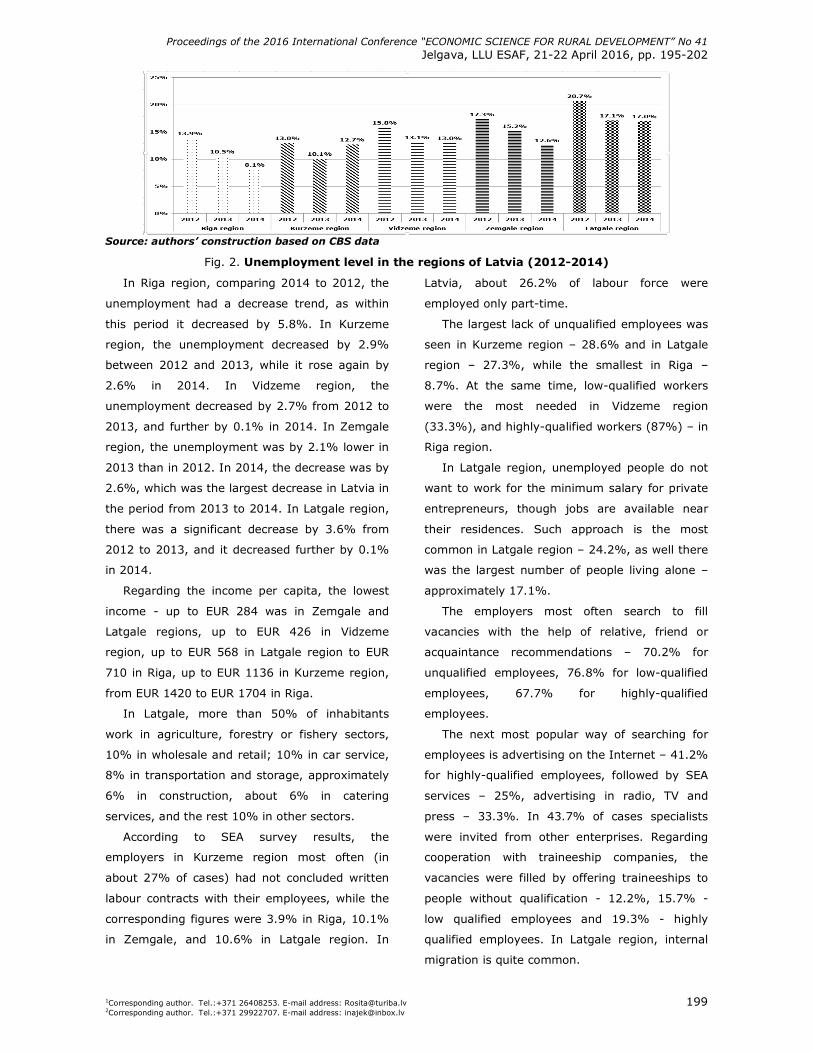
Proceedings of the 2016 International Conference “ECONOMIC SCIENCE FOR RURAL DEVELOPMENT” No 41
Jelgava, LLU ESAF, 21-22 April 2016, pp. 195-202
1Corresponding author. Tel.:+371 26408253. E-mail address: [email protected] 199 2Corresponding author. Tel.:+371 29922707. E-mail address: [email protected]
Source: authors’ construction based on CBS data
Fig. 2. Unemployment level in the regions of Latvia (2012-2014)
In Riga region, comparing 2014 to 2012, the
unemployment had a decrease trend, as within
this period it decreased by 5.8%. In Kurzeme
region, the unemployment decreased by 2.9%
between 2012 and 2013, while it rose again by
2.6% in 2014. In Vidzeme region, the
unemployment decreased by 2.7% from 2012 to
2013, and further by 0.1% in 2014. In Zemgale
region, the unemployment was by 2.1% lower in
2013 than in 2012. In 2014, the decrease was by
2.6%, which was the largest decrease in Latvia in
the period from 2013 to 2014. In Latgale region,
there was a significant decrease by 3.6% from
2012 to 2013, and it decreased further by 0.1%
in 2014.
Regarding the income per capita, the lowest
income - up to EUR 284 was in Zemgale and
Latgale regions, up to EUR 426 in Vidzeme
region, up to EUR 568 in Latgale region to EUR
710 in Riga, up to EUR 1136 in Kurzeme region,
from EUR 1420 to EUR 1704 in Riga.
In Latgale, more than 50% of inhabitants
work in agriculture, forestry or fishery sectors,
10% in wholesale and retail; 10% in car service,
8% in transportation and storage, approximately
6% in construction, about 6% in catering
services, and the rest 10% in other sectors.
According to SEA survey results, the
employers in Kurzeme region most often (in
about 27% of cases) had not concluded written
labour contracts with their employees, while the
corresponding figures were 3.9% in Riga, 10.1%
in Zemgale, and 10.6% in Latgale region. In
Latvia, about 26.2% of labour force were
employed only part-time.
The largest lack of unqualified employees was
seen in Kurzeme region – 28.6% and in Latgale
region – 27.3%, while the smallest in Riga –
8.7%. At the same time, low-qualified workers
were the most needed in Vidzeme region
(33.3%), and highly-qualified workers (87%) – in
Riga region.
In Latgale region, unemployed people do not
want to work for the minimum salary for private
entrepreneurs, though jobs are available near
their residences. Such approach is the most
common in Latgale region – 24.2%, as well there
was the largest number of people living alone –
approximately 17.1%.
The employers most often search to fill
vacancies with the help of relative, friend or
acquaintance recommendations – 70.2% for
unqualified employees, 76.8% for low-qualified
employees, 67.7% for highly-qualified
employees.
The next most popular way of searching for
employees is advertising on the Internet – 41.2%
for highly-qualified employees, followed by SEA
services – 25%, advertising in radio, TV and
press – 33.3%. In 43.7% of cases specialists
were invited from other enterprises. Regarding
cooperation with traineeship companies, the
vacancies were filled by offering traineeships to
people without qualification - 12.2%, 15.7% -
low qualified employees and 19.3% - highly
qualified employees. In Latgale region, internal
migration is quite common.
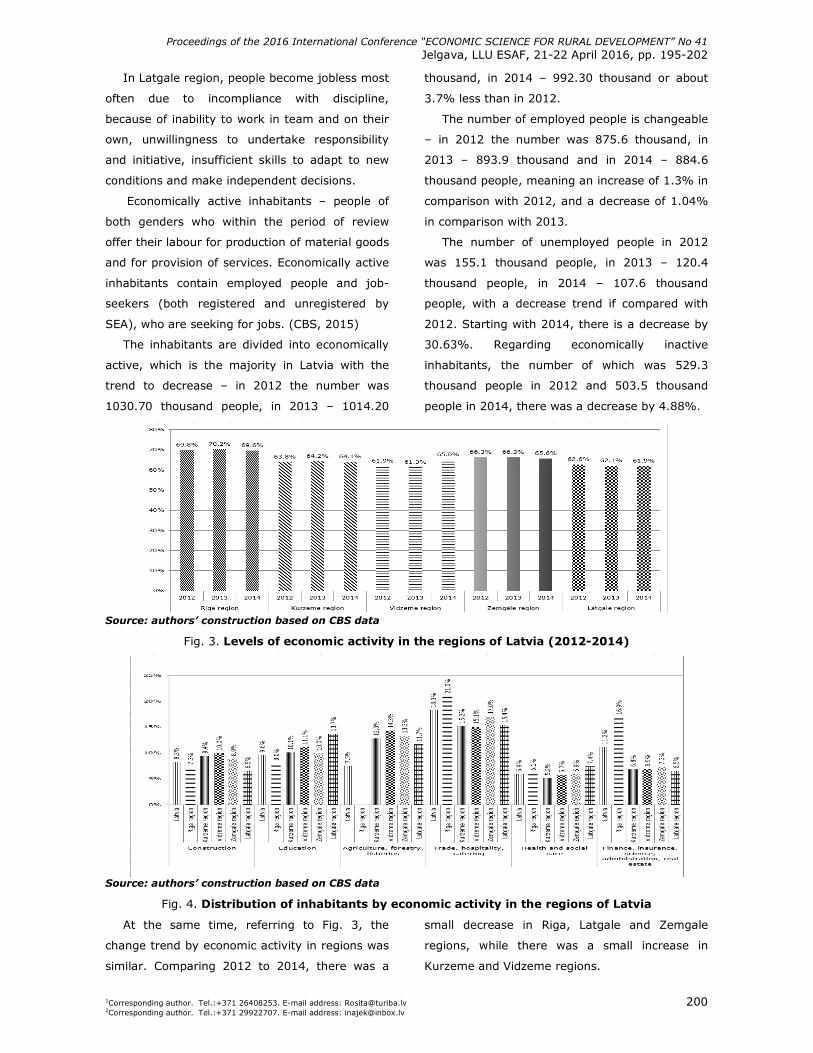
Proceedings of the 2016 International Conference “ECONOMIC SCIENCE FOR RURAL DEVELOPMENT” No 41
Jelgava, LLU ESAF, 21-22 April 2016, pp. 195-202
1Corresponding author. Tel.:+371 26408253. E-mail address: [email protected] 200 2Corresponding author. Tel.:+371 29922707. E-mail address: [email protected]
In Latgale region, people become jobless most
often due to incompliance with discipline,
because of inability to work in team and on their
own, unwillingness to undertake responsibility
and initiative, insufficient skills to adapt to new
conditions and make independent decisions.
Economically active inhabitants – people of
both genders who within the period of review
offer their labour for production of material goods
and for provision of services. Economically active
inhabitants contain employed people and job-
seekers (both registered and unregistered by
SEA), who are seeking for jobs. (CBS, 2015)
The inhabitants are divided into economically
active, which is the majority in Latvia with the
trend to decrease – in 2012 the number was
1030.70 thousand people, in 2013 – 1014.20
thousand, in 2014 – 992.30 thousand or about
3.7% less than in 2012.
The number of employed people is changeable
– in 2012 the number was 875.6 thousand, in
2013 – 893.9 thousand and in 2014 – 884.6
thousand people, meaning an increase of 1.3% in
comparison with 2012, and a decrease of 1.04%
in comparison with 2013.
The number of unemployed people in 2012
was 155.1 thousand people, in 2013 – 120.4
thousand people, in 2014 – 107.6 thousand
people, with a decrease trend if compared with
2012. Starting with 2014, there is a decrease by
30.63%. Regarding economically inactive
inhabitants, the number of which was 529.3
thousand people in 2012 and 503.5 thousand
people in 2014, there was a decrease by 4.88%.
Source: authors’ construction based on CBS data
Fig. 3. Levels of economic activity in the regions of Latvia (2012-2014)
Source: authors’ construction based on CBS data
Fig. 4. Distribution of inhabitants by economic activity in the regions of Latvia
At the same time, referring to Fig. 3, the
change trend by economic activity in regions was
similar. Comparing 2012 to 2014, there was a
small decrease in Riga, Latgale and Zemgale
regions, while there was a small increase in
Kurzeme and Vidzeme regions.
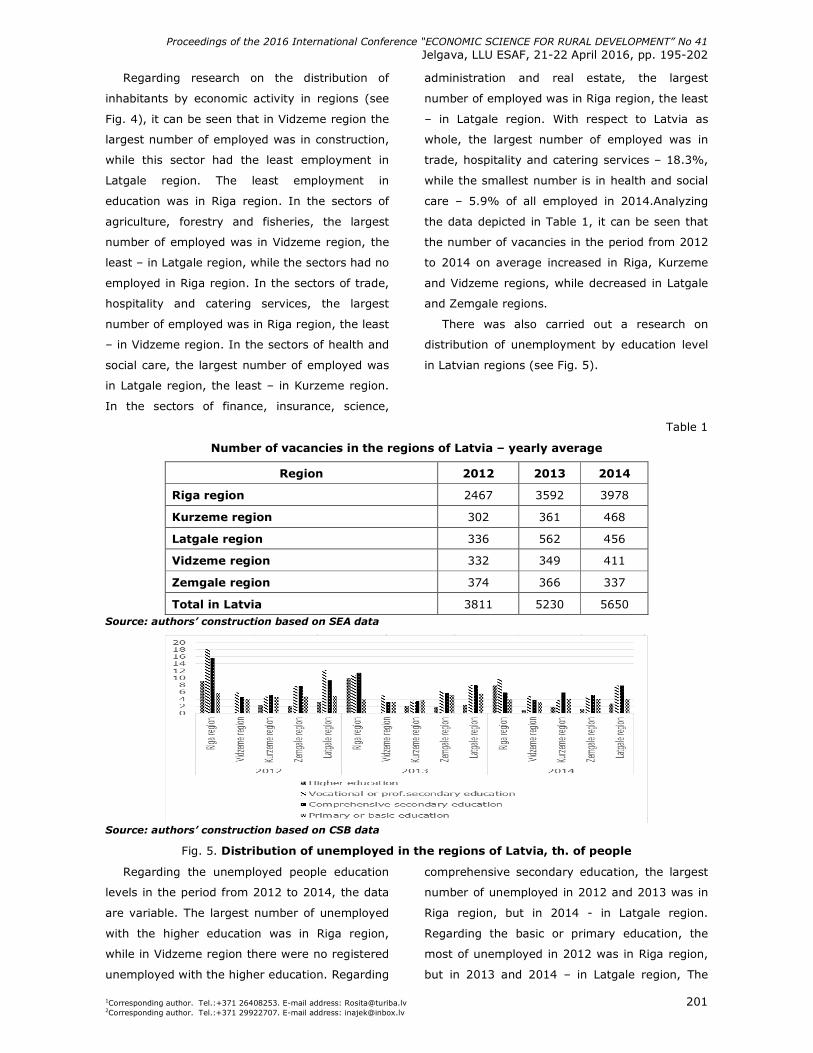
Proceedings of the 2016 International Conference “ECONOMIC SCIENCE FOR RURAL DEVELOPMENT” No 41
Jelgava, LLU ESAF, 21-22 April 2016, pp. 195-202
1Corresponding author. Tel.:+371 26408253. E-mail address: [email protected] 201 2Corresponding author. Tel.:+371 29922707. E-mail address: [email protected]
Regarding research on the distribution of
inhabitants by economic activity in regions (see
Fig. 4), it can be seen that in Vidzeme region the
largest number of employed was in construction,
while this sector had the least employment in
Latgale region. The least employment in
education was in Riga region. In the sectors of
agriculture, forestry and fisheries, the largest
number of employed was in Vidzeme region, the
least – in Latgale region, while the sectors had no
employed in Riga region. In the sectors of trade,
hospitality and catering services, the largest
number of employed was in Riga region, the least
– in Vidzeme region. In the sectors of health and
social care, the largest number of employed was
in Latgale region, the least – in Kurzeme region.
In the sectors of finance, insurance, science,
administration and real estate, the largest
number of employed was in Riga region, the least
– in Latgale region. With respect to Latvia as
whole, the largest number of employed was in
trade, hospitality and catering services – 18.3%,
while the smallest number is in health and social
care – 5.9% of all employed in 2014.Analyzing
the data depicted in Table 1, it can be seen that
the number of vacancies in the period from 2012
to 2014 on average increased in Riga, Kurzeme
and Vidzeme regions, while decreased in Latgale
and Zemgale regions.
There was also carried out a research on
distribution of unemployment by education level
in Latvian regions (see Fig. 5).
Table 1
Number of vacancies in the regions of Latvia – yearly average
Region 2012 2013 2014
Riga region 2467 3592 3978
Kurzeme region 302 361 468
Latgale region 336 562 456
Vidzeme region 332 349 411
Zemgale region 374 366 337
Total in Latvia 3811 5230 5650 Source: authors’ construction based on SEA data
Source: authors’ construction based on CSB data
Fig. 5. Distribution of unemployed in the regions of Latvia, th. of people
Regarding the unemployed people education
levels in the period from 2012 to 2014, the data
are variable. The largest number of unemployed
with the higher education was in Riga region,
while in Vidzeme region there were no registered
unemployed with the higher education. Regarding
comprehensive secondary education, the largest
number of unemployed in 2012 and 2013 was in
Riga region, but in 2014 - in Latgale region.
Regarding the basic or primary education, the
most of unemployed in 2012 was in Riga region,
but in 2013 and 2014 – in Latgale region, The
Proceedings of the 2016 International Conference “ECONOMIC SCIENCE FOR RURAL DEVELOPMENT” No 41
Jelgava, LLU ESAF, 21-22 April 2016, pp. 195-202
1Corresponding author. Tel.:+371 26408253. E-mail address: [email protected] 202 2Corresponding author. Tel.:+371 29922707. E-mail address: [email protected]
number of unemployed with the higher education
decreased by 13.18% in Riga region in 2014,
compared to 2012, it increased by 0.9% in
Vidzeme region, decreased by 18.18% in
Kurzeme region, decreased by 35% in Zemgale
region, decreased by 15.15% in Latgale region.
The number of unemployed with vocational or
secondary professional education decreased by
46.96% in Riga region, decreased by 18.64% in
Vidzeme region, decreased by 21.28% in
Kurzeme region, decreased by 40.26% in
Zemgale region, decreased by 35.25% in Latgale
region. The number of unemployed with the
comprehensive secondary education decreased
by 62.18% in Riga region, by 19.57% in Vidzeme
region, by 32.89% in Zemgale region, by 16.12%
in Latgale region, but increased by 11.32% in
Kurzeme region. The number of unemployed with
the primary or basic education decreased by
31.58% in Riga region, by 8.89% in Kurzeme
region, by 14.89% in Zemgale region, by 16.33%
in Latgale region.
Conclusions and recommendations
1) The number of unemployed people
decreased significantly in the period from
2012 to 2014.
2) The increase in the minimum salary affects
only those who receive the minimum salary.
3) There exists a misbalance in labour force
supply and demand.
4) Employers have problems in finding
disciplined, qualified and creative permanent
employees despite the unemployment rate in
Latvia.
5) Within the period from 2012 to 2014, the
number of economically active people
decreased by 38.4 thousand.
6) The number of vacancies in the regions of
Latvia in the period from 2012 to 2014
increased on average by 1839 vacant jobs.
7) The largest employment in Latvia is in
trade, hospitality and catering sectors –
18.3%, the smallest in healthcare and social
care – 5.9%.
8) The regional municipalities should carry out
research on the reasons for unemployment
decrease – whether it is due to increasing
number of jobs or the emigration of
inhabitants.
9) Job remuneration should be linked with the
minimum salary on the basis of coefficient.
Bibliography
1. Central Bureau of Statistics (2015) Viewed on: 05.01.2016. Available: http://www.csb.gov.lv/.
2. Eglite, E., Kruze M., Osis, J. (2014) Darba tirgus specifisko regionalo problemu identificesana un pasakumu izstradasana regionala darba tirgus konkuretspejas stiprinasanai. (Labour Market Specific Regional Problem Identification and Measure Design for Strengthening Regional Labour Market Competitiveness) Riga, Projektu un kvalitates vadiba, pp. 146.
3. Eglite, E., Kruze M., Osis, J., Brants, M. (2014) Pirmspensijas vecuma iedzivotaju ekonomiska potenciala izvertejums. (Economic Potential Evaluation of the Pre-Retirement Inhabitants) Riga, Projektu un kvalitates vadiba, pp. 72.
4. Grebenko, M. (2015) Darba likums un gramatvediba. (Labour Law and Accounting) Riga, LID, pp. 155.
5. Informativais zinojums par darba tirgus videja un ilgtermina prognozem (Informational Report on the Labour Market Short-Term and Long-Term Forecasts) (2015). Viewed on: 24.12.2015. Available: https://www.em.gov.lv/.
6. Informativais zinojums par makroekonomisko situaciju valsti. (Informational Report on the Macroeconomic Situation in the Country) 2015, October. Viewed on 30.12.2015. Available: https://www.em.gov.lv.
7. Kanejeva, S., (2014) Aktualas darba tirgus tendences 2015. gada. (Topical Labour Market Trends) Viewed on: 25.12.2015. Available: http://www.tns.lv/.
8. Latvijas Nacionalais attistibas plans 2014. – 2020. gadam. Viewed on: 24.12.2015. Available: http://www.varam.gov.lv/.
9. Latvijas tautsaimniecibas makroekonomiskais apskats. (Macroeconomic Review of the National Economy of Latvia) 2015-3. Viewed on: 28.12.2015. Available: https://www.em.gov.lv.
10. Parskats par bezdarba situaciju valsti (Review of the Unemployment in Latvia) (2015). Viewed on: 20.12.2015. Available: http://nva.gov.lv/.
11. Zinojums par Latvijas tautsaimniecibas attistibu. (Report on the Development of the National Economy of Latvia) 2015, June. Viewed on: 03.01.2016. Available: https://www.em.gov.lv.

BIOECONOMY
Proceedings of the 2016 International Conference “ECONOMIC SCIENCE FOR RURAL DEVELOPMENT” No 41
Jelgava, LLU ESAF, 21-22 April 2016, pp. 204-209
1Corresponding author. Tel.: +48 225934083 fax: + 48 225934083 E-mail address: [email protected] 204
ENVIRONMENTAL ECONOMICS VERSUS THE EMISSION OF GREENHOUSE GASES IN THE EU MEMBER STATES’ AGRICULTUR
Piotr Golasa1, PhD
1 Faculty of Economics Sciences, Warsaw University of Life Sciences (SGGW)
Abstract. The first part of the article presents the issues of state intervention to limit the emission of greenhouse
gases (GHG) on the background of environmental economics. This thesis presents R. H. Coase’s approach and the so-
called Pigouvian tax. The empirical part draws on data from the European Environmental Agency for 1990-2013. It
was concluded that agriculture share in GHG emission in the European Union (EU) is small and it amounted to 12% in
2013. The greatest emitters of agricultural GHG emissions are: France - 17%, Germany -13%, the United Kingdom -
10% of emissions from agriculture. It was noticed that agriculture was a huge emitter of methane because 50% of
methane emission in the EU comes from this economic sector. Enteric Fermentation – Cattle should be considered the
main reason for methane emission as it accounts for 65% of methane emission in agriculture. The steps limiting GHG
emission in agriculture should be focused on lowering the level of methane emission, especially in case of cattle
production.
Key words: European Environment Agency, greenhouse gases emission, agriculture
JEL code: Q5
Introduction
On 12 December 2015 during a climate conference in Paris, nearly 200 countries adopted an
agreement aiming to stop the global warming. The most significant provisions of the agreement were
included in Article 2 of the Convention (United Nations, 2015). It envisages keeping temperature growth
below the level of 2 degrees centigrade as compared to pre-industrial period and making an effort to limit
the growth to 1.5 degrees centigrade. In Article 4 of the Convention, to fulfil these assumptions, the
countries undertook to limit the current greenhouse gases emission (GHG) emission as soon as possible
until a balance between anthropogenic emissions by sources and removals by sinks of greenhouse gases
is achieved. The balance is to be achieved in the second half of the 21st century.
According to numerous climate researchers, it
is the last moment to take steps aiming at
preventing sudden changes which would result
in irreversible changes in the Earth’s biosphere.
The newest observation results of the World
Meteorological Organization (WMO) reveal that
2014 has been the warmest year in the history
of officially conducted measurements, and even
since 1500, and the ending of 2015 will appear
to be even warmer (WMO, 2015). Scientists
point out that these changes are caused by a
huge anthropogenic emission of GHG. It has
brought the level of greenhouse gases, CO2,
methane, and nitrogen oxide, which has not
been recorded for 800,000 years (IPCC, 2013).
The European Union had already been leading
the limitations of GHG emission. During the
summit of the EU heads of state in October
2014, an agreement on climate protection was
successfully worked out. First, it envisages that
the EU as a whole will limit CO2 emissions until
2030 by at least 40% as compared to 1990.
Second, the share of renewable sources of
energy in the overall consumption of electricity
is to be at the minimum of 27% by 2030. The
steps aiming at fulfilling these goals must
concern the whole economy of the EU. What
seems to be new is the fact that agriculture was
also covered by environmental objectives
concerning the reduction of GHG emissions. It is
widely accepted that agriculture is not a huge
emitter of GHG and due to economic and social
reasons it has been excluded from climate policy
so far. The recent events, however, will bring
changes in this area.
Taking the above into consideration, the aim
of article is to specify significance of GHG
emission in the EU agriculture. Research task: to
investigate the structures of this emission as
well as comparing them to emissions from other
Proceedings of the 2016 International Conference “ECONOMIC SCIENCE FOR RURAL DEVELOPMENT” No 41
Jelgava, LLU ESAF, 21-22 April 2016, pp. 204-209
1Corresponding author. Tel.: +48 225934083 fax: + 48 225934083 E-mail address: [email protected] 205
economic sectors. The discussion will be taken
based on environmental economics. Data from
the European Environmental Agency for 1990-
2013 were used to achieve the research
objective.
Research results and discussion
Economic grounds for the reduction of GHG
emission
Theoretical grounds for state intervention in
GHG emissions come from environmental
economics ideas and the related concept of
external effects. One of the free market
downsides results in suboptimal allocation of
resources in terms of Pareto (Acocella N., 2002).
The phenomenon of external effects can take a
form of positive or negative effects. In case of
negative external effects, the entities that cause
them not to bear the full costs of their doings,
which results in the scale of their activity being
too large. A reverse situation takes place when
there are positive external effects: entities do
not receive an appropriate remuneration for
their activity and they will run their activity at a
lower level than it is desired. In case of
agriculture, one can observe both situations. On
the one hand, creating a pleasant landscape,
providing biodiversity, and maintaining the right
properties of soil are the side effects of
agriculture. On the other hand, farms cause soil
and surface water pollution with nitrogen
compounds and they emit considerable amounts
of GHG. A question arises if a state should
interfere in such a situation and how to define
the scope of such intervention. Economic theory
provides two alternative approaches to this
problem. The first one is referred to as Coase
theorem and the other – Pigouvian tax.
Pigouvian tax is related to the assumption
that the full social costs of a business activity
are not always incurred by the entity which runs
it. Pigou shows an example of a lease, where
practically always, a suitable penalty is specified
for returning land in an inappropriate state to a
lessor, and a lessor has the right to a
compensation for introducing improvements
which higher the value of a leased estate. Such
compensation is, however, something unusual.
In many cases, e.g. private parks in towns,
private lighting of houses, emission of pollution
from smokestacks, the consequences of an
activity considerably exceed the borders of the
given activity. To solve this issue, Pigou
suggests that one should apply taxes and
bonuses (Pigou A.C., 1932). They can reduce
the gap between individual and social marginal
costs and internalize external effects. The level
of these burdens should be determined
individually for each emitter and it should be
equal to external costs per one unit of product.
In result of applying them, in case of negative
external effects (e.g. pollution), perpetrators can
act in two ways. First, they can take technical
steps to reduce them, which will lower the tax
imposed on them. So far they have not been
interested to do this because it meant cost
increase without any direct benefits. Second,
they can higher product price to compensate the
imposed tax (Fiedor B., 2002). Yet, the idea of
introducing a tax of this kind is difficult to
execute. The most important problem concerns
defining the level of external costs of a given
entity’s activity because in the market, there are
usually numerous entities polluting the
environment. Therefore, it is impossible to fulfil
Pigou’s assumption and determine the costs of
external effects for each emitter. In practice,
one uses solutions that connect the level of tax
with the kind of emitted pollution and the
amount of emissions.
A slightly different approach to the possibility
of state intervention in external effects is
presented by a Noble prizewinner, R. Coase
(Coase R. H., 1960). In his opinion, the role of a
state should be significantly limited here
because the problem of external effects can be
solved by free market. Each party, either an
aggrieved one or the one which takes advantage
of them, can run negotiations regarding
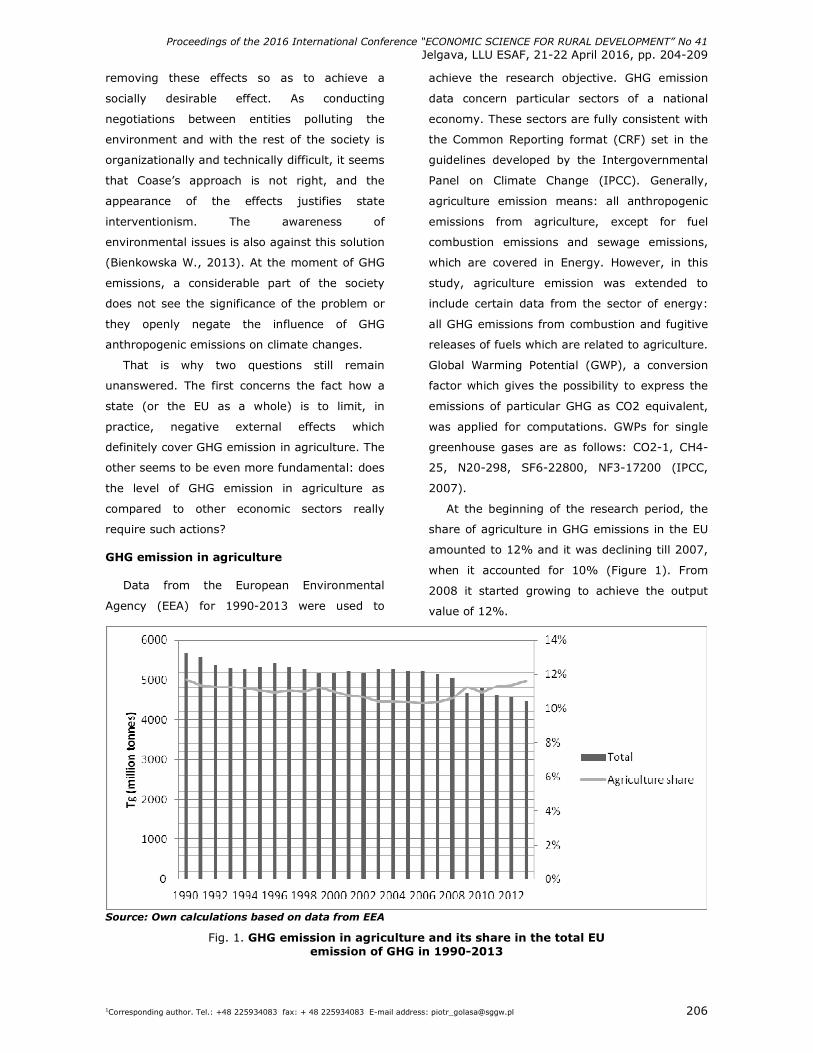
Proceedings of the 2016 International Conference “ECONOMIC SCIENCE FOR RURAL DEVELOPMENT” No 41
Jelgava, LLU ESAF, 21-22 April 2016, pp. 204-209
1Corresponding author. Tel.: +48 225934083 fax: + 48 225934083 E-mail address: [email protected] 206
removing these effects so as to achieve a
socially desirable effect. As conducting
negotiations between entities polluting the
environment and with the rest of the society is
organizationally and technically difficult, it seems
that Coase’s approach is not right, and the
appearance of the effects justifies state
interventionism. The awareness of
environmental issues is also against this solution
(Bienkowska W., 2013). At the moment of GHG
emissions, a considerable part of the society
does not see the significance of the problem or
they openly negate the influence of GHG
anthropogenic emissions on climate changes.
That is why two questions still remain
unanswered. The first concerns the fact how a
state (or the EU as a whole) is to limit, in
practice, negative external effects which
definitely cover GHG emission in agriculture. The
other seems to be even more fundamental: does
the level of GHG emission in agriculture as
compared to other economic sectors really
require such actions?
GHG emission in agriculture
Data from the European Environmental
Agency (EEA) for 1990-2013 were used to
achieve the research objective. GHG emission
data concern particular sectors of a national
economy. These sectors are fully consistent with
the Common Reporting format (CRF) set in the
guidelines developed by the Intergovernmental
Panel on Climate Change (IPCC). Generally,
agriculture emission means: all anthropogenic
emissions from agriculture, except for fuel
combustion emissions and sewage emissions,
which are covered in Energy. However, in this
study, agriculture emission was extended to
include certain data from the sector of energy:
all GHG emissions from combustion and fugitive
releases of fuels which are related to agriculture.
Global Warming Potential (GWP), a conversion
factor which gives the possibility to express the
emissions of particular GHG as CO2 equivalent,
was applied for computations. GWPs for single
greenhouse gases are as follows: CO2-1, CH4-
25, N20-298, SF6-22800, NF3-17200 (IPCC,
2007).
At the beginning of the research period, the
share of agriculture in GHG emissions in the EU
amounted to 12% and it was declining till 2007,
when it accounted for 10% (Figure 1). From
2008 it started growing to achieve the output
value of 12%.
Source: Own calculations based on data from EEA
Fig. 1. GHG emission in agriculture and its share in the total EU emission of GHG in 1990-2013
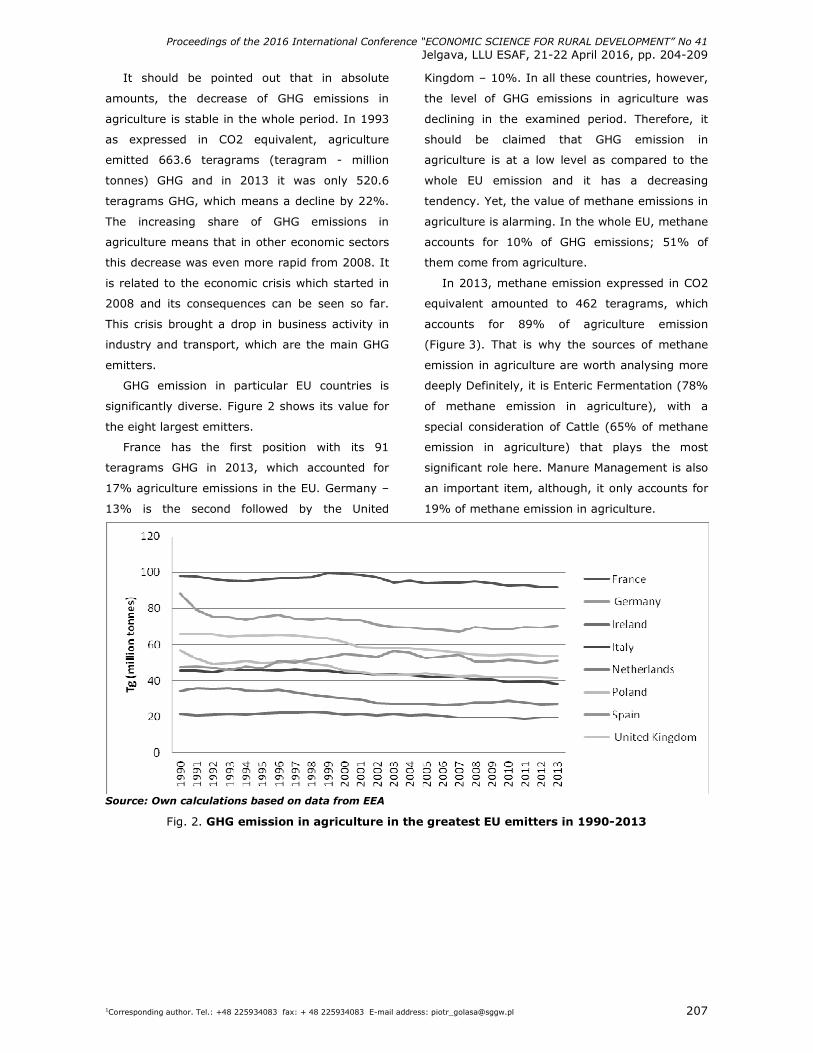
Proceedings of the 2016 International Conference “ECONOMIC SCIENCE FOR RURAL DEVELOPMENT” No 41
Jelgava, LLU ESAF, 21-22 April 2016, pp. 204-209
1Corresponding author. Tel.: +48 225934083 fax: + 48 225934083 E-mail address: [email protected] 207
It should be pointed out that in absolute
amounts, the decrease of GHG emissions in
agriculture is stable in the whole period. In 1993
as expressed in CO2 equivalent, agriculture
emitted 663.6 teragrams (teragram - million
tonnes) GHG and in 2013 it was only 520.6
teragrams GHG, which means a decline by 22%.
The increasing share of GHG emissions in
agriculture means that in other economic sectors
this decrease was even more rapid from 2008. It
is related to the economic crisis which started in
2008 and its consequences can be seen so far.
This crisis brought a drop in business activity in
industry and transport, which are the main GHG
emitters.
GHG emission in particular EU countries is
significantly diverse. Figure 2 shows its value for
the eight largest emitters.
France has the first position with its 91
teragrams GHG in 2013, which accounted for
17% agriculture emissions in the EU. Germany –
13% is the second followed by the United
Kingdom – 10%. In all these countries, however,
the level of GHG emissions in agriculture was
declining in the examined period. Therefore, it
should be claimed that GHG emission in
agriculture is at a low level as compared to the
whole EU emission and it has a decreasing
tendency. Yet, the value of methane emissions in
agriculture is alarming. In the whole EU, methane
accounts for 10% of GHG emissions; 51% of
them come from agriculture.
In 2013, methane emission expressed in CO2
equivalent amounted to 462 teragrams, which
accounts for 89% of agriculture emission
(Figure 3). That is why the sources of methane
emission in agriculture are worth analysing more
deeply Definitely, it is Enteric Fermentation (78%
of methane emission in agriculture), with a
special consideration of Cattle (65% of methane
emission in agriculture) that plays the most
significant role here. Manure Management is also
an important item, although, it only accounts for
19% of methane emission in agriculture.
Source: Own calculations based on data from EEA
Fig. 2. GHG emission in agriculture in the greatest EU emitters in 1990-2013
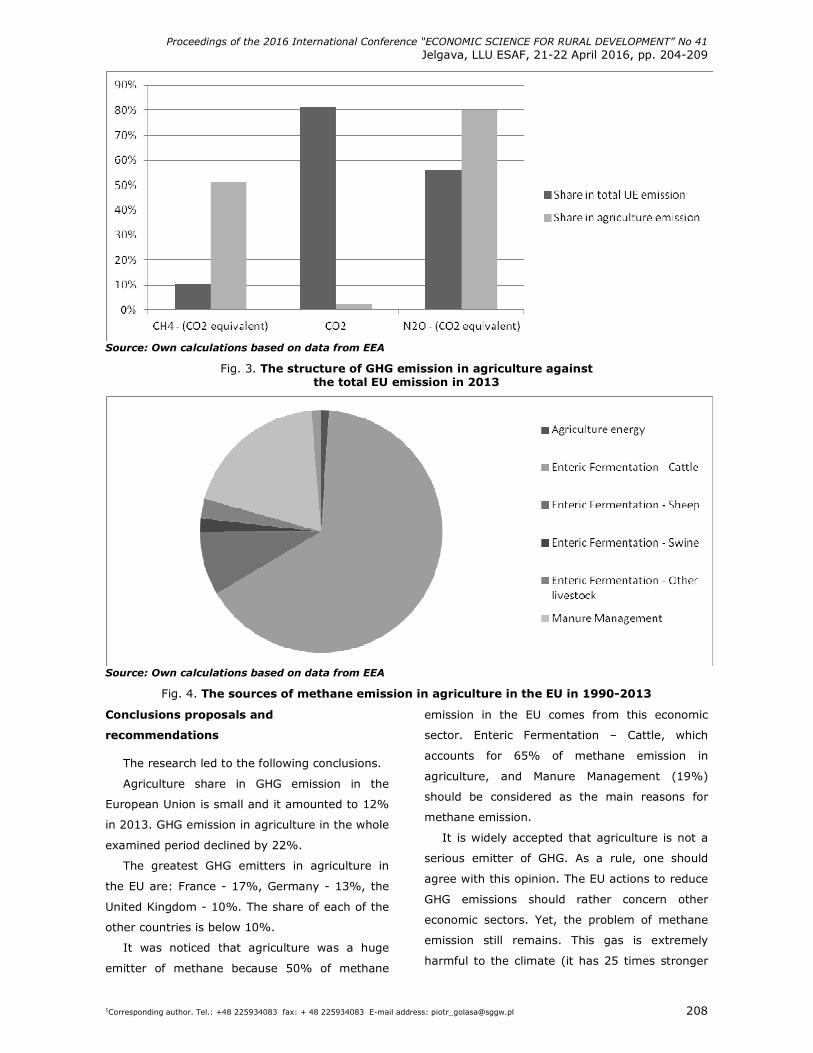
Proceedings of the 2016 International Conference “ECONOMIC SCIENCE FOR RURAL DEVELOPMENT” No 41
Jelgava, LLU ESAF, 21-22 April 2016, pp. 204-209
1Corresponding author. Tel.: +48 225934083 fax: + 48 225934083 E-mail address: [email protected] 208
Source: Own calculations based on data from EEA
Fig. 3. The structure of GHG emission in agriculture against the total EU emission in 2013
Source: Own calculations based on data from EEA
Fig. 4. The sources of methane emission in agriculture in the EU in 1990-2013
Conclusions proposals and
recommendations
The research led to the following conclusions.
Agriculture share in GHG emission in the
European Union is small and it amounted to 12%
in 2013. GHG emission in agriculture in the whole
examined period declined by 22%.
The greatest GHG emitters in agriculture in
the EU are: France - 17%, Germany - 13%, the
United Kingdom - 10%. The share of each of the
other countries is below 10%.
It was noticed that agriculture was a huge
emitter of methane because 50% of methane
emission in the EU comes from this economic
sector. Enteric Fermentation – Cattle, which
accounts for 65% of methane emission in
agriculture, and Manure Management (19%)
should be considered as the main reasons for
methane emission.
It is widely accepted that agriculture is not a
serious emitter of GHG. As a rule, one should
agree with this opinion. The EU actions to reduce
GHG emissions should rather concern other
economic sectors. Yet, the problem of methane
emission still remains. This gas is extremely
harmful to the climate (it has 25 times stronger
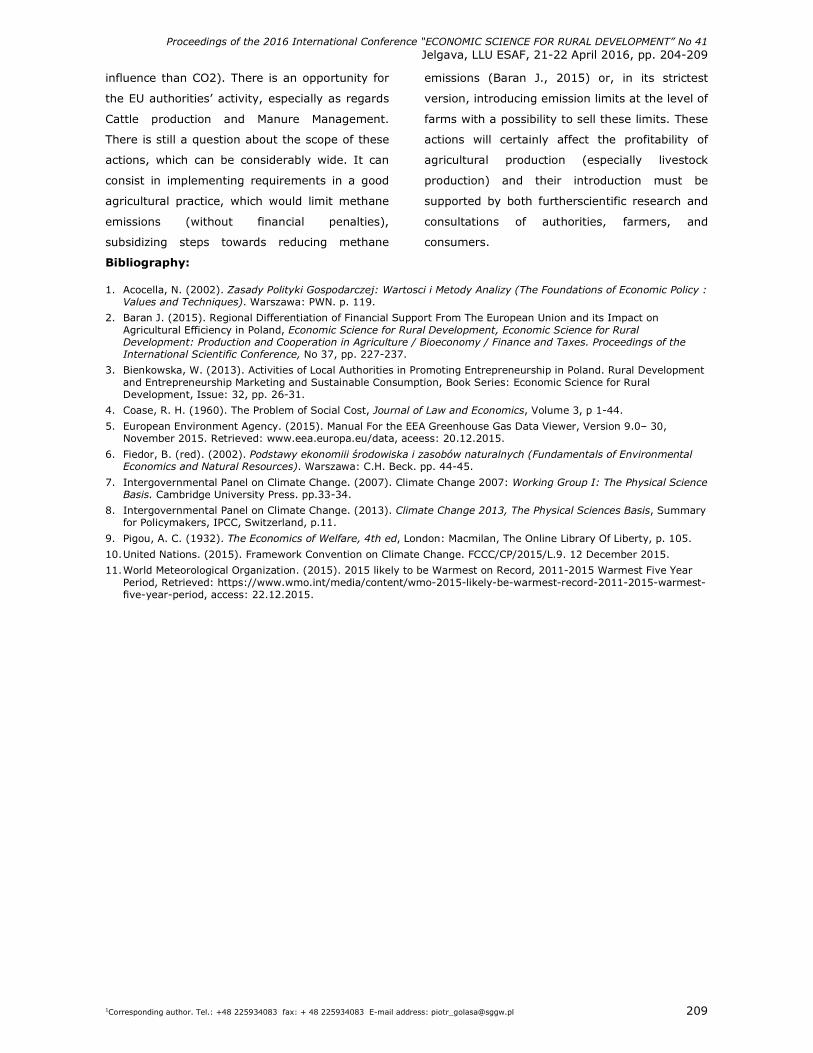
Proceedings of the 2016 International Conference “ECONOMIC SCIENCE FOR RURAL DEVELOPMENT” No 41
Jelgava, LLU ESAF, 21-22 April 2016, pp. 204-209
1Corresponding author. Tel.: +48 225934083 fax: + 48 225934083 E-mail address: [email protected] 209
influence than CO2). There is an opportunity for
the EU authorities’ activity, especially as regards
Cattle production and Manure Management.
There is still a question about the scope of these
actions, which can be considerably wide. It can
consist in implementing requirements in a good
agricultural practice, which would limit methane
emissions (without financial penalties),
subsidizing steps towards reducing methane
emissions (Baran J., 2015) or, in its strictest
version, introducing emission limits at the level of
farms with a possibility to sell these limits. These
actions will certainly affect the profitability of
agricultural production (especially livestock
production) and their introduction must be
supported by both furtherscientific research and
consultations of authorities, farmers, and
consumers.
Bibliography:
1. Acocella, N. (2002). Zasady Polityki Gospodarczej: Wartosci i Metody Analizy (The Foundations of Economic Policy : Values and Techniques). Warszawa: PWN. p. 119.
2. Baran J. (2015). Regional Differentiation of Financial Support From The European Union and its Impact on Agricultural Efficiency in Poland, Economic Science for Rural Development, Economic Science for Rural Development: Production and Cooperation in Agriculture / Bioeconomy / Finance and Taxes. Proceedings of the International Scientific Conference, No 37, pp. 227-237.
3. Bienkowska, W. (2013). Activities of Local Authorities in Promoting Entrepreneurship in Poland. Rural Development and Entrepreneurship Marketing and Sustainable Consumption, Book Series: Economic Science for Rural Development, Issue: 32, pp. 26-31.
4. Coase, R. H. (1960). The Problem of Social Cost, Journal of Law and Economics, Volume 3, p 1-44.
5. European Environment Agency. (2015). Manual For the EEA Greenhouse Gas Data Viewer, Version 9.0– 30, November 2015. Retrieved: www.eea.europa.eu/data, aceess: 20.12.2015.
6. Fiedor, B. (red). (2002). Podstawy ekonomiii środowiska i zasobów naturalnych (Fundamentals of Environmental Economics and Natural Resources). Warszawa: C.H. Beck. pp. 44-45.
7. Intergovernmental Panel on Climate Change. (2007). Climate Change 2007: Working Group I: The Physical Science Basis. Cambridge University Press. pp.33-34.
8. Intergovernmental Panel on Climate Change. (2013). Climate Change 2013, The Physical Sciences Basis, Summary for Policymakers, IPCC, Switzerland, p.11.
9. Pigou, A. C. (1932). The Economics of Welfare, 4th ed, London: Macmilan, The Online Library Of Liberty, p. 105.
10. United Nations. (2015). Framework Convention on Climate Change. FCCC/CP/2015/L.9. 12 December 2015.
11. World Meteorological Organization. (2015). 2015 likely to be Warmest on Record, 2011-2015 Warmest Five Year Period, Retrieved: https://www.wmo.int/media/content/wmo-2015-likely-be-warmest-record-2011-2015-warmest-five-year-period, access: 22.12.2015.
Proceedings of the 2016 International Conference “ECONOMIC SCIENCE FOR RURAL DEVELOPMENT” No 41
Jelgava, LLU ESAF, 21-22 April 2016, pp. 210-218
1Corresponding author. Tel.: + 371 67167913; fax: + 371 67541789. E-mail address: [email protected]. 210
COMPARISON OF THE CONSUMPTION OF WOOD PELLETS BETWEEN LATVIA AND OTHER EU COUNTRIES
Agnese Krievina1, Dr.oec.; Ligita Melece1, Dr.oec.
1 Institute of Agricultural Resources and Economics
Abstract. The paper explores the consumption of food pellets in Latvia by analyzing their production and consumption
in comparison with other EU countries, exploring the role of wood pellets in heating, and studying the main support
mechanisms. Suitable qualitative and quantitative research methods have been applied to the studies. The production
of wood pellets is very developed in Latvia, though only 10% is consumed on the local market, mostly by households;
the present use of wood pellets in the energy transformation sector is insignificant. The notable price advantage of
wood pellets against natural gas and the current high share of natural gas in the transformation sector imply on great
replacement opportunities for fuelwood in Latvia. The production and consumption of fuelwood in Latvia is mainly
promoted by the investment support, which has contributed to the development of the consumption of food chips by
heat and CHP plants. Despite the higher price of wood pellets compared to other wood fuels, technical properties make
them generally a comfort and efficient wood fuel, which is confirmed by the broad use of wood pellets in Denmark and
Sweden. Although wood pellets might not be the immediate substitute for fossil fuels in Latvia, in the light of the
increased movement towards low-carbon economy, wood pellets allow replacing a great deal of currently used natural
gas in the transformation sector.
Key words: wood pellets, RES, consumption, Latvia.
JEL code: Q42
Introduction
The Baltic States are among the leaders in the
export of food pellets in the European Union
(EU), accounting for almost 30% of the total EU
export value in 2014. Moreover, Latvia is the
single largest exporter of wood pellets in the EU,
leaving behind such an important suppliers as
Germany and Austria. The total EU’s import
demand of wood pellets, concentrated by the
United Kingdom, Italy and Denmark, is met with
the Baltic pellets to a considerable extent. The
total export value of Latvian wood pellets was
EUR 168.1 million in 2014, which is a notable
contribution to the foreign trade balance of the
country (Eurostat, 2015a).
Despite the availability and competitiveness
on foreign markets, Latvian food pellets are
currently scarcely used in the energy
transformation sector on the local market. At the
same time, Latvia is one of the few countries,
whose possibilities (based on its current and
planned policies) to reach the binding targets for
renewable energy of 2020 have been questioned
by the European Commission in its latest
renewable energy sources (RES) progress report
(European Commission, 2015). In its turn, the
neighbouring Estonia is the first EU country to
already fulfil its 2020 RES targets (Potisepp,
2015). Moreover, at the end of 2014, the
European Council agreed on the 2030 climate
and energy policy framework, setting the EU
target of at least 27% for the share of RE
consumed in the EU by 2030. Contrary to the
targets of 2020, no binding national targets have
been set, so as not to, inter alia, prevent Member
States from setting more ambitious targets and
supporting them in an appropriate way
(European Council, 2014). For example, the
Danish energy policy goals already envisage that
the share of green fuels in electricity and heat
consumption in Denmark is 100% by 2035
(Danish Energy Association, 2014).
Considering the availability, wood pellets could
be more widely used on Latvian market, thus,
facilitating to the transition towards low-carbon
economy, inter alia, greater energy security.
Therefore, the objective of the paper is to explore
the consumption of food pellets in Latvia, inter
alia, the role of the support in its development.
Several tasks were set to reach the objective:
1) to analyze the production and consumption of
wood pellets in Latvia in comparison with other
EU countries; 2) to explore the role of wood
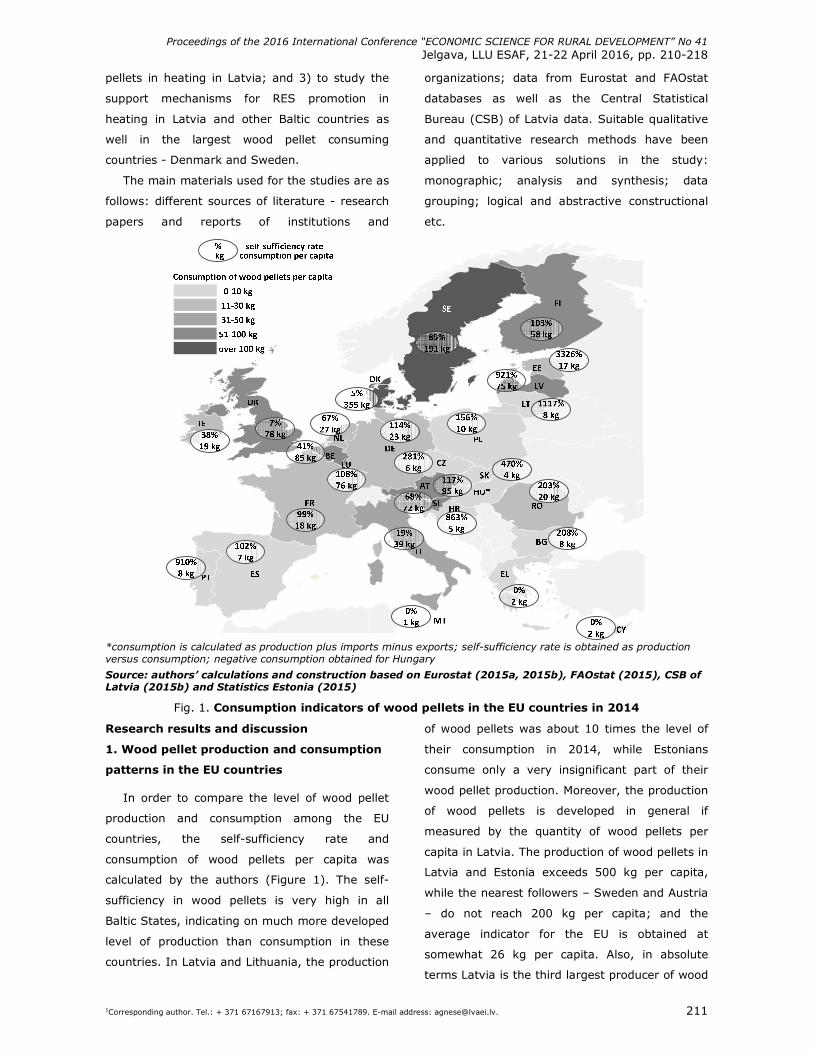
Proceedings of the 2016 International Conference “ECONOMIC SCIENCE FOR RURAL DEVELOPMENT” No 41
Jelgava, LLU ESAF, 21-22 April 2016, pp. 210-218
1Corresponding author. Tel.: + 371 67167913; fax: + 371 67541789. E-mail address: [email protected]. 211
pellets in heating in Latvia; and 3) to study the
support mechanisms for RES promotion in
heating in Latvia and other Baltic countries as
well in the largest wood pellet consuming
countries - Denmark and Sweden.
The main materials used for the studies are as
follows: different sources of literature - research
papers and reports of institutions and
organizations; data from Eurostat and FAOstat
databases as well as the Central Statistical
Bureau (CSB) of Latvia data. Suitable qualitative
and quantitative research methods have been
applied to various solutions in the study:
monographic; analysis and synthesis; data
grouping; logical and abstractive constructional
etc.
*consumption is calculated as production plus imports minus exports; self-sufficiency rate is obtained as production versus consumption; negative consumption obtained for Hungary
Source: authors’ calculations and construction based on Eurostat (2015a, 2015b), FAOstat (2015), CSB of Latvia (2015b) and Statistics Estonia (2015)
Fig. 1. Consumption indicators of wood pellets in the EU countries in 2014
Research results and discussion
1. Wood pellet production and consumption
patterns in the EU countries
In order to compare the level of wood pellet
production and consumption among the EU
countries, the self-sufficiency rate and
consumption of wood pellets per capita was
calculated by the authors (Figure 1). The self-
sufficiency in wood pellets is very high in all
Baltic States, indicating on much more developed
level of production than consumption in these
countries. In Latvia and Lithuania, the production
of wood pellets was about 10 times the level of
their consumption in 2014, while Estonians
consume only a very insignificant part of their
wood pellet production. Moreover, the production
of wood pellets is developed in general if
measured by the quantity of wood pellets per
capita in Latvia. The production of wood pellets in
Latvia and Estonia exceeds 500 kg per capita,
while the nearest followers – Sweden and Austria
– do not reach 200 kg per capita; and the
average indicator for the EU is obtained at
somewhat 26 kg per capita. Also, in absolute
terms Latvia is the third largest producer of wood
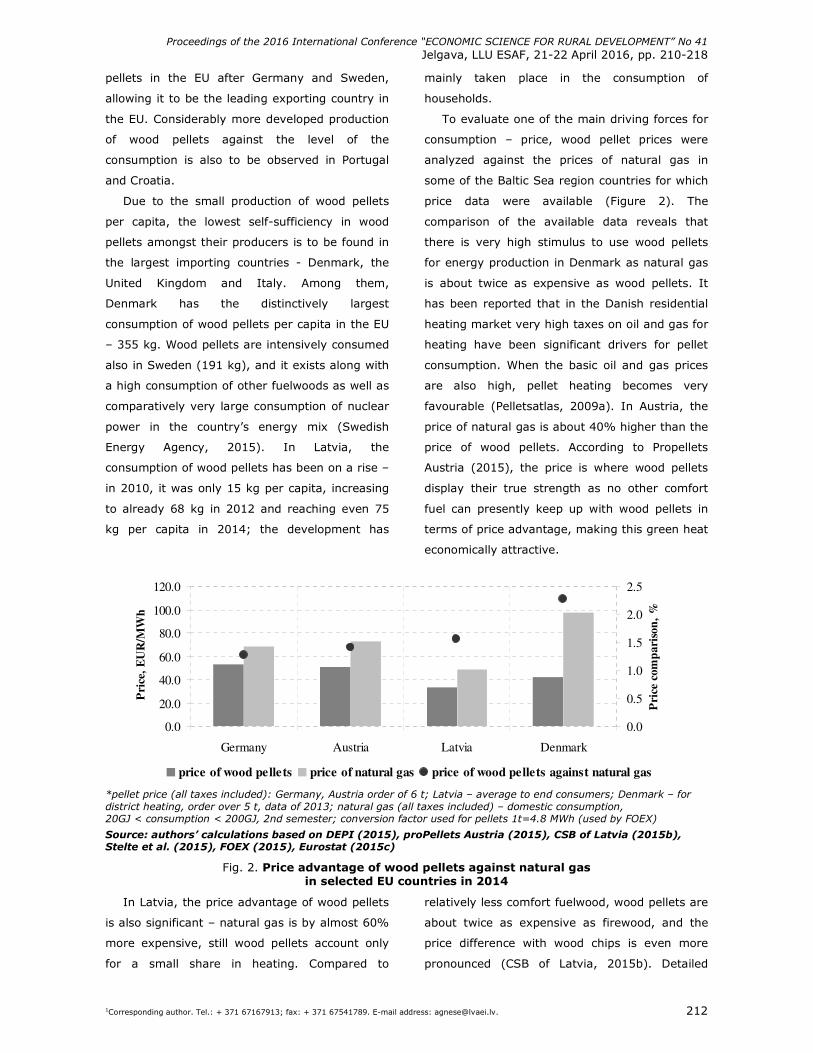
Proceedings of the 2016 International Conference “ECONOMIC SCIENCE FOR RURAL DEVELOPMENT” No 41
Jelgava, LLU ESAF, 21-22 April 2016, pp. 210-218
1Corresponding author. Tel.: + 371 67167913; fax: + 371 67541789. E-mail address: [email protected]. 212
pellets in the EU after Germany and Sweden,
allowing it to be the leading exporting country in
the EU. Considerably more developed production
of wood pellets against the level of the
consumption is also to be observed in Portugal
and Croatia.
Due to the small production of wood pellets
per capita, the lowest self-sufficiency in wood
pellets amongst their producers is to be found in
the largest importing countries - Denmark, the
United Kingdom and Italy. Among them,
Denmark has the distinctively largest
consumption of wood pellets per capita in the EU
– 355 kg. Wood pellets are intensively consumed
also in Sweden (191 kg), and it exists along with
a high consumption of other fuelwoods as well as
comparatively very large consumption of nuclear
power in the country’s energy mix (Swedish
Energy Agency, 2015). In Latvia, the
consumption of wood pellets has been on a rise –
in 2010, it was only 15 kg per capita, increasing
to already 68 kg in 2012 and reaching even 75
kg per capita in 2014; the development has
mainly taken place in the consumption of
households.
To evaluate one of the main driving forces for
consumption – price, wood pellet prices were
analyzed against the prices of natural gas in
some of the Baltic Sea region countries for which
price data were available (Figure 2). The
comparison of the available data reveals that
there is very high stimulus to use wood pellets
for energy production in Denmark as natural gas
is about twice as expensive as wood pellets. It
has been reported that in the Danish residential
heating market very high taxes on oil and gas for
heating have been significant drivers for pellet
consumption. When the basic oil and gas prices
are also high, pellet heating becomes very
favourable (Pelletsatlas, 2009a). In Austria, the
price of natural gas is about 40% higher than the
price of wood pellets. According to Propellets
Austria (2015), the price is where wood pellets
display their true strength as no other comfort
fuel can presently keep up with wood pellets in
terms of price advantage, making this green heat
economically attractive.
0.0
20.0
40.0
60.0
80.0
100.0
120.0
Germany Austria Latvia Denmark
Pri
ce,
EU
R/M
Wh
0.0
0.5
1.0
1.5
2.0
2.5
Pri
ce c
om
pari
son
, %
price of wood pellets price of natural gas price of wood pellets against natural gas
*pellet price (all taxes included): Germany, Austria order of 6 t; Latvia – average to end consumers; Denmark – for district heating, order over 5 t, data of 2013; natural gas (all taxes included) – domestic consumption, 20GJ < consumption < 200GJ, 2nd semester; conversion factor used for pellets 1t=4.8 MWh (used by FOEX)
Source: authors’ calculations based on DEPI (2015), proPellets Austria (2015), CSB of Latvia (2015b), Stelte et al. (2015), FOEX (2015), Eurostat (2015c)
Fig. 2. Price advantage of wood pellets against natural gas in selected EU countries in 2014
In Latvia, the price advantage of wood pellets
is also significant – natural gas is by almost 60%
more expensive, still wood pellets account only
for a small share in heating. Compared to
relatively less comfort fuelwood, wood pellets are
about twice as expensive as firewood, and the
price difference with wood chips is even more
pronounced (CSB of Latvia, 2015b). Detailed
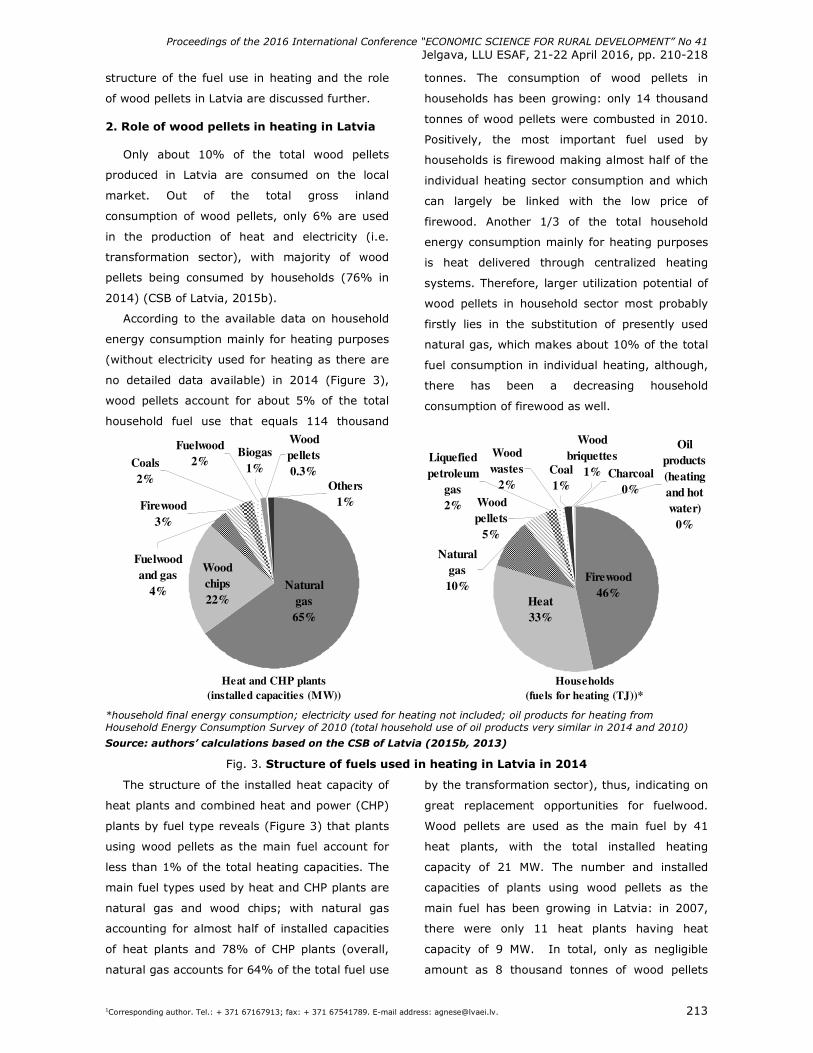
Proceedings of the 2016 International Conference “ECONOMIC SCIENCE FOR RURAL DEVELOPMENT” No 41
Jelgava, LLU ESAF, 21-22 April 2016, pp. 210-218
1Corresponding author. Tel.: + 371 67167913; fax: + 371 67541789. E-mail address: [email protected]. 213
structure of the fuel use in heating and the role
of wood pellets in Latvia are discussed further.
2. Role of wood pellets in heating in Latvia
Only about 10% of the total wood pellets
produced in Latvia are consumed on the local
market. Out of the total gross inland
consumption of wood pellets, only 6% are used
in the production of heat and electricity (i.e.
transformation sector), with majority of wood
pellets being consumed by households (76% in
2014) (CSB of Latvia, 2015b).
According to the available data on household
energy consumption mainly for heating purposes
(without electricity used for heating as there are
no detailed data available) in 2014 (Figure 3),
wood pellets account for about 5% of the total
household fuel use that equals 114 thousand
tonnes. The consumption of wood pellets in
households has been growing: only 14 thousand
tonnes of wood pellets were combusted in 2010.
Positively, the most important fuel used by
households is firewood making almost half of the
individual heating sector consumption and which
can largely be linked with the low price of
firewood. Another 1/3 of the total household
energy consumption mainly for heating purposes
is heat delivered through centralized heating
systems. Therefore, larger utilization potential of
wood pellets in household sector most probably
firstly lies in the substitution of presently used
natural gas, which makes about 10% of the total
fuel consumption in individual heating, although,
there has been a decreasing household
consumption of firewood as well.
Heat and CHP plants
(installed capacities (MW))
Natural
gas
65%
Wood
chips
22%
Fuelwood
and gas
4%
Firewood
3%
Others
1%
Coals
2%
Wood
pellets
0.3%
Fuelwood
2%Biogas
1%
Households
(fuels for heating (TJ))*
Oil
products
(heating
and hot
water)
0%
Coal
1%
Wood
wastes
2%
Wood
briquettes
1%
Liquefied
petroleum
gas
2%
Charcoal
0%Wood
pellets
5%
Natural
gas
10%
Heat
33%
Firewood
46%
*household final energy consumption; electricity used for heating not included; oil products for heating from Household Energy Consumption Survey of 2010 (total household use of oil products very similar in 2014 and 2010)
Source: authors’ calculations based on the CSB of Latvia (2015b, 2013)
Fig. 3. Structure of fuels used in heating in Latvia in 2014
The structure of the installed heat capacity of
heat plants and combined heat and power (CHP)
plants by fuel type reveals (Figure 3) that plants
using wood pellets as the main fuel account for
less than 1% of the total heating capacities. The
main fuel types used by heat and CHP plants are
natural gas and wood chips; with natural gas
accounting for almost half of installed capacities
of heat plants and 78% of CHP plants (overall,
natural gas accounts for 64% of the total fuel use
by the transformation sector), thus, indicating on
great replacement opportunities for fuelwood.
Wood pellets are used as the main fuel by 41
heat plants, with the total installed heating
capacity of 21 MW. The number and installed
capacities of plants using wood pellets as the
main fuel has been growing in Latvia: in 2007,
there were only 11 heat plants having heat
capacity of 9 MW. In total, only as negligible
amount as 8 thousand tonnes of wood pellets
Proceedings of the 2016 International Conference “ECONOMIC SCIENCE FOR RURAL DEVELOPMENT” No 41
Jelgava, LLU ESAF, 21-22 April 2016, pp. 210-218
1Corresponding author. Tel.: + 371 67167913; fax: + 371 67541789. E-mail address: [email protected]. 214
were used in the transformation sector in Latvia
in 2014.
There has been an increasing consumption
tendency of fuelwood (mostly wood chips) in
Latvia since 2012 (CSB of Latvia, 2015b). It has
been due to a couple of fuelwood projects, the
most important of which include transition of the
centralized heating systems of three large
Latvian cities to wood chips, introduction of new
wood chip CHP plants as well as due to the start
of new wood pellet production projects and
modernization of energy sector of wood
processing enterprises (CSB of Latvia, 2015a;
Bumanis et al., 2014). Apart from other
potential sources, Latvia still has large reserves
of fuelwood export to be used in the local energy
sector. Up to now, wood chips have been more
preferred by heat and CHP plants than wood
pellets, some researchers also do not consider
wood pellets as the immediate substitution option
for fossil fuel because their production includes
additional costs and pellets is a product of high
value added, the export of which has positive
impact on the country’s economy (Bumanis et al.,
2014). Nevertheless, in the light of the increased
movement towards low-carbon economy, wood
pellet export offers the most substitution
possibility – wood pellets accounted for 77% of
the total Latvian fuelwood exports in 2014 and
they could replace a great deal of currently used
natural gas in the transformation sector, contrary
to wood chips whose exports could replace only a
small part of this fossil fuel (CSB of Latvia,
2015b).
Despite the higher price of wood pellets
compared to other wood fuels, technical
properties make them generally a comfort and
efficient wood fuel preferred both by households
as well as by large heating systems (Nunes et al.,
2016; Trømborg et al., 2013). Wood pellets are
the most highly refined form of solid wood fuel,
whose high energy density translates into lower
handling, transportation and storage costs, which
is especially appealing in cases when cost
efficient supply is a challenge due to storing
limitations and long transportation distances;
ability to be stored and economic transportation
of wood pellets adds to the security of supply
(Billington Bioenergy, 2015; Wood chips and…,
2015; García-Maroto et al., 2015; Mola-Yudego
et al., 2014; Harrison, 2014; Trømborg et al.,
2013). Being compact fuel, wood pellets are also
easy to be stored and transported, making them
a comfortable wood fuel for households
(Thomson et al., 2015; Mola-Yudego et al.,
2014). It has also been noted that wood pellets
can be more affordable on a limited budget
because they can be purchased in small
quantities (Thomson et al., 2015). Due to their
homogeneity and standardization wood pellets
are suited to be used in combustion systems that
are becoming fully automated, thus, requiring
less man input (García-Maroto et al., 2015;
Nunes et al., 2016; Wood chips and…, 2015).
Wood pellet boilers are generally cheaper than
wood chip systems, moreover, wood pellets can
be used in most wood chip systems, however
wood chips generally can't be used in pellet only
systems (Wood chips and…, 2015; Billington
Bioenergy, 2015). In addition, wood pellets have
a clear burning and present the reduction of
ashes (Mola-Yudego et al., 2014).
The broad use of wood pellets in Denmark and
Sweden also confirms their advantages and
preference. In Denmark, contrary to the situation
in Latvia, wood pellets are used in all sizes of
combustion plants - more than 60% of the total
wood pellet consumption in Denmark refers to
district heating and mainly CHP plants, and about
30% is consumed by households (Stelte, 2012).
Considering that Denmark is an importer of
fuelwood (Danish Energy Agency, 2015), it is
rather rational that wood pellets as the fuelwood
with low transportation costs is preferred to
reach their RES targets. At the same time,
Sweden, which is one of largest wood pellet
producers, is also a large wood pellet consumer -
wood pellets are used in all sizes of combustion
Proceedings of the 2016 International Conference “ECONOMIC SCIENCE FOR RURAL DEVELOPMENT” No 41
Jelgava, LLU ESAF, 21-22 April 2016, pp. 210-218
1Corresponding author. Tel.: + 371 67167913; fax: + 371 67541789. E-mail address: [email protected]. 215
plants, about 40% of which are consumed by
large district heating plants and CHP plants
(Pelletsatlas, 2009b; Nunes et al. 2016).
Denmark and Sweden both are early adopters of
wood fuels (Olsson and Hillring, 2013), the
utilization of wood pellets in the district heating
sector started already the 1980s (Pelletsatlas,
2009a, 2009b). Moreover, it is considered that
biomass in CHP plants replacing coal and gas is a
key measure and an inexpensive way to achieve
Denmark’s CO2 reduction goals; and, therefore,
it is planned that in the future wood pellets will
represent most biomass used in the CHP plants,
while wood chips will primarily be used in small
and medium-sized CHP plants (Danish Energy
Association, 2014). This implies that already
large consumption of wood pellets in Denmark is
going to become even larger.
3. Support to RES in heating
The use of RES in heating in Latvia is mainly
stimulated in the context of energy-efficiency,
which, inter alia, includes the transition from
fossil fuels to RES and the efficient use of them
and the produced heat. The main support
instrument used is investment support. Cohesion
Fund 2007-2013 provided investment support for
the increase of the efficiency of heat supply
systems, covering also displacement of fossil
fuel. In 2014-2020, it is planned to continue to
support the increase in the energy efficiency of
centralized heat supply systems, including the
promotion of the transition to RES as well as
increase the efficiency of buildings, inter alia,
supporting the use of RES in public and
residential buildings. There have also been
project calls within Climate Change Financial
Instrument (CCFI) (state budget programme,
started in 2009) targeted at transition from fossil
fuel to RES in heat supply systems as well as the
use of RES by households. As regards the
production of bioenergy, investment support to
production of fuel of agricultural and forestry
origin has been granted within RDP 2007-2013 as
part of rural diversification measures to new and
existing rural enterprises. There have also been
support measures in Latvia promoting the use of
RES in CHP plants, with the emphasis on
bioelectricity generation (Melece and Krievina,
2015). The consumption of fuelwood in
households for the household needs is also
stimulated by lower VAT tax rate (RES LEGAL,
2014).
The available data do not allow making a
thorough analysis of all supported medium and
large investment projects in heating by fuel type,
however, the overall tendency has been that
wood chips have been the most popular type of
fuelwood among heating and CHP plants using
fuelwood, which is confirmed by the analyzed fuel
use structure. At the same time, there is quite
detailed data available on the approved RES
projects for households within CCFI. The use of
wood pellets can be indentified in about 70%
biomass projects (without mixed technologies)
planned by households. Though, biomass
projects account only for about 20% of all
household projects, with solar and heat pumps
being the most preferred RES technologies by
households applying for the support (LEIF, 2012).
As regards the situation in other Baltic States,
in Lithuania, there are three main instruments
used to promote RES in heating: guaranteed
purchase of heat from independent RES
producers (meeting lower price, quality, supply
security, environmental and consumers demand
criteria); subsidies from the Lithuanian
Environmental Investment Fund; and
environmental pollution tax relief for solid and
liquid biomass. Similarly like in Latvia, in Estonia,
RES in heating are promoted mainly by
investment support. The investment support is
round-based and can be granted for the
construction of RES CHP plants, reconstruction of
boiler-houses to make them operational for RES
and for the reconstruction of the district heating
network to improve energy efficiency.
Additionally, RES investment supports are made
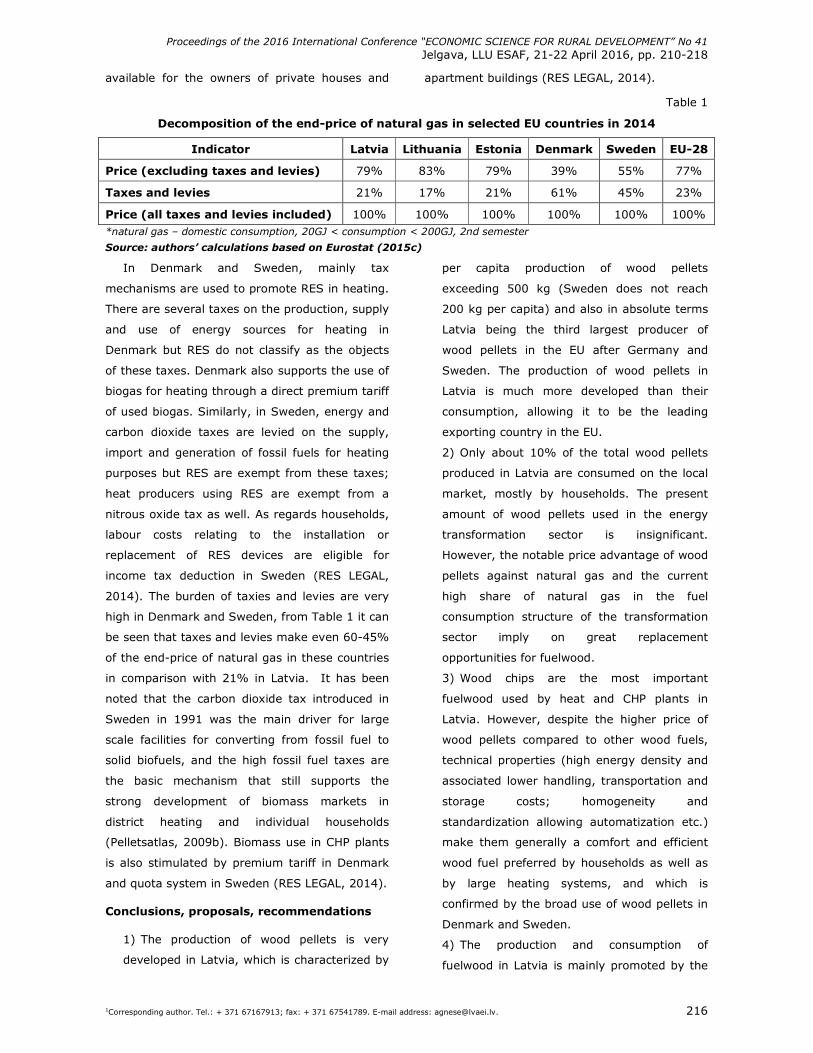
Proceedings of the 2016 International Conference “ECONOMIC SCIENCE FOR RURAL DEVELOPMENT” No 41
Jelgava, LLU ESAF, 21-22 April 2016, pp. 210-218
1Corresponding author. Tel.: + 371 67167913; fax: + 371 67541789. E-mail address: [email protected]. 216
available for the owners of private houses and apartment buildings (RES LEGAL, 2014).
Table 1
Decomposition of the end-price of natural gas in selected EU countries in 2014
Indicator Latvia Lithuania Estonia Denmark Sweden EU-28
Price (excluding taxes and levies) 79% 83% 79% 39% 55% 77%
Taxes and levies 21% 17% 21% 61% 45% 23%
Price (all taxes and levies included) 100% 100% 100% 100% 100% 100% *natural gas – domestic consumption, 20GJ < consumption < 200GJ, 2nd semester
Source: authors’ calculations based on Eurostat (2015c)
In Denmark and Sweden, mainly tax
mechanisms are used to promote RES in heating.
There are several taxes on the production, supply
and use of energy sources for heating in
Denmark but RES do not classify as the objects
of these taxes. Denmark also supports the use of
biogas for heating through a direct premium tariff
of used biogas. Similarly, in Sweden, energy and
carbon dioxide taxes are levied on the supply,
import and generation of fossil fuels for heating
purposes but RES are exempt from these taxes;
heat producers using RES are exempt from a
nitrous oxide tax as well. As regards households,
labour costs relating to the installation or
replacement of RES devices are eligible for
income tax deduction in Sweden (RES LEGAL,
2014). The burden of taxies and levies are very
high in Denmark and Sweden, from Table 1 it can
be seen that taxes and levies make even 60-45%
of the end-price of natural gas in these countries
in comparison with 21% in Latvia. It has been
noted that the carbon dioxide tax introduced in
Sweden in 1991 was the main driver for large
scale facilities for converting from fossil fuel to
solid biofuels, and the high fossil fuel taxes are
the basic mechanism that still supports the
strong development of biomass markets in
district heating and individual households
(Pelletsatlas, 2009b). Biomass use in CHP plants
is also stimulated by premium tariff in Denmark
and quota system in Sweden (RES LEGAL, 2014).
Conclusions, proposals, recommendations
1) The production of wood pellets is very
developed in Latvia, which is characterized by
per capita production of wood pellets
exceeding 500 kg (Sweden does not reach
200 kg per capita) and also in absolute terms
Latvia being the third largest producer of
wood pellets in the EU after Germany and
Sweden. The production of wood pellets in
Latvia is much more developed than their
consumption, allowing it to be the leading
exporting country in the EU.
2) Only about 10% of the total wood pellets
produced in Latvia are consumed on the local
market, mostly by households. The present
amount of wood pellets used in the energy
transformation sector is insignificant.
However, the notable price advantage of wood
pellets against natural gas and the current
high share of natural gas in the fuel
consumption structure of the transformation
sector imply on great replacement
opportunities for fuelwood.
3) Wood chips are the most important
fuelwood used by heat and CHP plants in
Latvia. However, despite the higher price of
wood pellets compared to other wood fuels,
technical properties (high energy density and
associated lower handling, transportation and
storage costs; homogeneity and
standardization allowing automatization etc.)
make them generally a comfort and efficient
wood fuel preferred by households as well as
by large heating systems, and which is
confirmed by the broad use of wood pellets in
Denmark and Sweden.
4) The production and consumption of
fuelwood in Latvia is mainly promoted by the
Proceedings of the 2016 International Conference “ECONOMIC SCIENCE FOR RURAL DEVELOPMENT” No 41
Jelgava, LLU ESAF, 21-22 April 2016, pp. 210-218
1Corresponding author. Tel.: + 371 67167913; fax: + 371 67541789. E-mail address: [email protected]. 217
investment support, which has contributed to
the development of the consumption of food
chips by heat plants and CHP plants. The
similar support mechanism is also applied in
other Baltic countries. In its turn in Denmark
and Sweden, fossil fuels are highly taxed in
contrast to fuelwood and it has been a strong
driver for the transition to solid biomass.
5) Although wood pellets might not be the
immediate substitute for fossil fuels in Latvia,
in the light of the increased movement
towards low-carbon economy, wood pellet
export allows replacing a great deal of
currently used natural gas in the
transformation sector, contrary to wood chips
whose exports could replace only a small part
of this fossil fuel.
Bibliography
1. Billington Bioenergy (2015). Why Wood Pellets. Retrieved: http://www.billingtonbioenergy.co.uk/index.php/why-biomass. Access: 06.11.2015
2. Bumanis K., Krasavcevs I., Lise S., Stepina A. (2014). Monitoring of Wood Biomass Use in Energy (in Latvian). Retrieved: https://www.zm.gov.lv/public/ck/files/ZM/mezhi/MAF/Koksnes%20biomasas%20izmantosana%20energija%20ieguve%20monitorings_MEKA.pdf. Access: 16.11.2015
3. CSB of Latvia (2015a). Consumption of RES Grown by 12% over Last Ten Years (in Latvian). Retrieved: http://www.csb.gov.lv/notikumi/atjaunigo-energoresursu-paterins-pedejos-desmit-gados-pieauga-par-12-41874.html. Access: 07.11.2015
4. CSB of Latvia (2015b). Energy Statistics Database. Retrieved: http://data.csb.gov.lv/pxweb/en/vide/vide__ikgad__energetika/?tablelist=true&rxid=a79839fe-11ba-4ecd-8cc3-4035692c5fc8. Access: 03.11.2015
5. CSB of Latvia (2013). Energy Consumption in Households (TJ). Retrieved: http://data.csb.gov.lv/pxweb/en/vide/vide__energ_pat/0303.px/?rxid=cdcb978c-22b0-416a-aacc-aa650d3e2ce0. Access: 06.11.2015
6. Danish Energy Agency (2015). Annual Energy Statistics. Retrieved: http://www.ens.dk/en/info/facts-figures/energy-statistics-indicators-energy-efficiency/annual-energy-statistics. Access: 06.11.2015
7. Danish Energy Association, Danish District Heating Association (2014). Biomass for Energy: Why Coal and Gas should be Replaced by Wood Pellets and Wood Chips. Retrieved: http://www.danishenergyassociation.com/Theme/BiomassForEnergy.aspx. Access: 05.11.2015
8. DEPI (2015). Annual Average Prices of Wood Pellets 2006-2014 (in German). Retrieved: http://depi.de/media/filebase/files/infothek/images/DEPI_Jahresdurchschnittspreise_Pellet.jpg. Access: 03.11.2015
9. Eurostat (2015a). Comext Database: EU Trade since 1988 by CN8. Retrieved: http://epp.eurostat.ec.europa.eu/newxtweb/setupdimselection.do. Access: 08.10.2015
10. Eurostat (2015b). Population on 1 January by Age and Sex. Retrieved: http://ec.europa.eu/eurostat/data/database. Access: 08.10.2015
11. Eurostat (2015c). Gas Prices for Domestic Consumers. Retrieved: http://ec.europa.eu/eurostat/data/database. Access: 03.10.2015
12. European Commission (2015). Renewable Energy Progress Report. Retrieved: https://ec.europa.eu/energy/en/topics/renewable-energy/progress-reports. Access: 10.11.2015
13. European Council (2014). Conclusions on 2030 Climate and Energy Policy Framework. Retrieved: http://www.consilium.europa.eu/uedocs/cms_data/docs/pressdata/en/ec/145356.pdf. Access: 19.11.2015
14. FAOstat (2015). Forestry Production and Trade Database. Retrieved: http://faostat3.fao.org/download/F/FO/E. Access. 12.10.2015
15. FOEX (2015). PIX Pellet Nordic Industrial Index Specification. Retrieved: http://www.foex.fi/index.php?page=pix-rcp. Access: 03.11.2015
16. García-Maroto I., García-Maraver A., Muñoz-Leiva F., Zamorano M. (2015). Consumer Knowledge, Inf. Sources used and Predisposition towards the Adoption of Wood Pellets in Domestic Heating Systems. Renewable and Sustainable Energy Reviews, Vol. 43, pp 207–215.
17. Harrison N. (2014). The Big Biomass Debate, Woodchip or Pellets. Retrieved: http://www.thescottishfarmer.co.uk/mobile/renewables/biomass/the-big-biomass-debate-woodchip-or-pellets.24723855. Access: 07.11.2015
18. Latvian Environmental Investment Fund (LEIF) (2012). Utilization of RES in Household Sector. List on Concluded Project Agreements (in Latvian). Retrieved: http://www.lvif.gov.lv/?object_id=30241. Access: 11.10.2015
19. Melece L., Krievina A. (2015) Development of Bioenergy: State and Issues in Latvia. Management Horizons in Changing Economic Environment Visions and Challenges: Proceedings of the International Scientific Conference, Kaunas: Vytautas Magnus University, pp.309-326.
20. Mola-Yudego B., Selkimäki M., González-Olabarria JR. (2014). Spatial Analysis of the Wood Pellet Production for Energy in Europe. Renewable Energy, Vol. 63, pp 76–83.
Proceedings of the 2016 International Conference “ECONOMIC SCIENCE FOR RURAL DEVELOPMENT” No 41
Jelgava, LLU ESAF, 21-22 April 2016, pp. 210-218
1Corresponding author. Tel.: + 371 67167913; fax: + 371 67541789. E-mail address: [email protected]. 218
21. Nunes L.J.R., Matias J.C.O, Catalão J.P.S. (2016). Wood Pellets as a Sustainable Energy Alternative in Portugal. Renewable Energy, Vol. 85, pp. 1011–1016.
22. Ollson O., Hillring B. (2013). Pellet Markets in Northern Europe: Price Formation and Market Integration. Retrieved: http://nobio.no/upload_dir/pics/Olle-Olsson.pdf. Access: 04.11.2015
23. Pelletsatlas (2009a). Pellet Market Country Report: Denmark. Retrieved: http://piirb1q7sc948r4632ws3mf9.wpengine.netdna-cdn.com/wp-content/uploads/2015/09/Denmark_CR.pdf. Access. 25.10.2015
24. Pelletsatlas (2009b). Pellet Market Country Report: Sweden. Retrieved: http://piirb1q7sc948r4632ws3mf9.wpengine.netdna-cdn.com/wp-content/uploads/2015/09/Sweden_CR.pdf. Access. 25.10.2015
25. Potisepp R. (2015). Renewable Energy, Energy Independence and Climate Goals in Estonia. Retrieved: http://www.atjaunojam.lv/attachments/article/114/AE_EE_Riga_1806_2015.pdf. Access: 10.11.2015
26. Propellets Austria (2015). Wood Pellets Prices. Price Details and Charts. Retrieved: http://www.propellets.at/en/pellet-price/details/. Access. 03.11.2015
27. RES LEGAL Europe (2014). Support Schemes Country Overview. Retrieved: http://www.res-legal.eu/home/. Access: 09.12.2015
28. Statistics Estonia (2015). Energy Balance Sheet. Retrieved: http://pub.stat.ee/px-web.2001/I_Databas/Economy/07Energy/02Energy_consumption_and_production/01Annual_statistics/01Annual_statistics.asp. Access: 04.11.2015
29. Stelte W., Hinge J., Dahl J. (2015). Sustainable Int. Bioenergy Trade – Securing Supply and Demand. Country Report 2014 for Denmark. Retrieved: http://www.bioenergytrade.org/downloads/iea-task-40-country-report-2014-denmark.pdf. Access: 25.10.2015
30. Stelte W. (2012). Global Market for Wood Pellets and Price Development. Retrieved: http://www.ens.dk/sites/ens.dk/files/undergrund-forsyning/vedvarende-energi/bioenergi/analyse-bioenergi-danmark/temamoeder/Market%20and%20Price%20Projection%20for%20Wood%20Pellets_Wolfgang_Stelte_DTI.pdf. Access: 21.11.2015
31. Swedish Energy Agency (2015). Energy Balance. Retrieved: http://epi6.energimyndigheten.se/Statistik/Energibalans/Energibalans/. Access: 08.11.2015
32. Thomson H., Liddell C. (2015). The Suitability of Wood Pellet Heating for Domestic Households: A Review of Literature. Renewable and Sustainable Energy Reviews, Vol. 42, pp 1362–1369.
33. Trømborg E., Ranta T., Schweinle J., Solberg B., Skjevrak G., Tiffany D.C. (2013). Economic Sustainability for Wood Pellets Production - A Comparative Study between Finland, Germany, Norway, Sweden and the US. Biomass Bioenergy, Vol. 57, pp 68–77.
34. Wood Chip and Pellet Boilers inc. Automated Systems (2015). Retrieved: http://www.usewoodfuel.co.uk/using-woodfuel/wood-fuel-equipment-and-systems/boilers-and-stoves/wood-chip-and-pellet-boiler-systems-inc-automated-systems.aspx. Access: 10.11.2015
Proceedings of the 2016 International Conference “ECONOMIC SCIENCE FOR RURAL DEVELOPMENT” No 41
Jelgava, LLU ESAF, 21-22 April 2016, pp. 219-228
2Corresponding author. Tel.: +48225934003; fax: + 48225934230. E-mail address: [email protected]. 219
BIO-ECONOMY SECTOR IN POLAND AND ITS IMPORTANCE IN THE ECONOMY Wicki Ludwik1, DSc.; Aleksandra Wicka1 PhD
1Faculty of Economics, Warsaw University of Life Sciences–SGGW
Abstract. The aim of the study is to identify the importance of bio-economy in Poland, both in the traditional and the
innovative sectors. The analysis covered the years 2000-2014. In this study were used statistical data from the
Central Statistical Office and data from Agricultural Market Agency. The importance of the discussed sector was
evaluated mainly based on its share in the entire economy. It was found that bio-economy sector generates 6.5% of
gross value added, nearly 20% of employment and 15% of the Polish export. Energy production from biomass is
almost 10% of overall production of energy. Modern, innovation-based sectors of bio-economy are still not developed
and the related technologies are in the phase of laboratory tests. The structure of bio-economy in Poland is dominated
by traditional sectors: agriculture and agri-food industry. Energy production from biomass is carried out using not very
innovative technologies. A precondition for development and dissemination of new technologies is the support of public
funds.
Key words: bio-economy, bio-energy, agriculture, food processing, forestry.
JEL code: Q16, Q23, Q42
Introduction
Bio-economy is a part of the national
economy, which uses biomass – renewable
biological material from agriculture, forestry and
seas. It is a broad term, which (as defined by the
Organisation for Economic Cooperation and
Development (OECD)) encompasses any activity
associated with use of biotechnology, bio-
processes and bio-based products, aimed at
production of goods and services. The emergence
of the concept of bio-economy was linked with a
noticeable continuing deterioration of the natural
environment and the related decreasing
availability of natural resources. This requires a
change in public attitudes to the issue of
production, consumption, storage and recycling
of biological resources. As pointed out by
Christian Patermann, it is a new concept, which is
still difficult to understand for a wider audience
(EC, 2012).
Development of bio-economy is a topic
increasingly discussed in the sphere of policy-
making and economics. Both in the European
Union (European Commission, 2012) and in the
United States of America (The White House,
2012), bio-economy is mentioned as an
important area of development. However, a
relatively new concept of bio-economy is still not
precisely defined. There are two groups of
definitions (Maciejczak, 2015). From a broad
perspective, bio-economy is a system combining
natural resources, technologies, markets, people
and policies. This includes both industry based on
the old, well-known technologies and the new
sectors, which use innovative technologies and,
at the same time, are linked by symbiotic
relationship, where one sector uses the products,
which are by-products of another sector. In a
narrow meaning, bio-economy is the use of
biotechnology in the industry, environmental
protection and in challenges posed by climate
change. Most definitions associate bio-economy
with sectors, which use raw materials and
biological processes: from food production,
through production of chemicals and
pharmaceuticals, up to production of energy
(Maciejczak and Hofreiter, 2013). The importance
of broadly defined bio-economy in the EU is very
high. In this sector around 22 million people are
working, and its market size is approximately
EUR 1.5 trillion (Patermann, 2008).
The growing interest of the scientists,
governments and societies in bio-economy is a
result of new challenges in the modern world.
Growing population and demand for food,
scarcity of energy resources as well as climate
change and environmental pollution are just a
few of them. It is postulated to act globally and
to develop new, innovative processes, products
and services (Tapscott and Williams, 2011;
Proceedings of the 2016 International Conference “ECONOMIC SCIENCE FOR RURAL DEVELOPMENT” No 41
Jelgava, LLU ESAF, 21-22 April 2016, pp. 219-228
2Corresponding author. Tel.: +48225934003; fax: + 48225934230. E-mail address: [email protected]. 220
Bukowski, Szpor and Sniegocki, 2012). Eco-
innovation proposed by bio-economy allows us to
minimise the negative phenomena (Chylek and
Rzepecka, 2011). Significant limitations in
development are often a result of poor relations
between the bio-economy research and business.
In Poland, traditional bio-economy sector is
well developed and produces about 8% of
domestic value added (Wicki and Grontkowska,
2015) but modern and innovative areas of bio-
economy are still in the early stages of
development. Only energy from biomass is
produced on an industrial scale but just as in the
entire European Union, biomass is mainly used
for heat energy production for home heating
(SeeNews, 2015).
Likewise, the world production of bio-based
products with high value added is low. Polymer
production from biomass is just a fraction of
world production. For example, production of bio-
polypropylene is only 0.02% of its global
production (TechNavio, 2015b). In 2014, value of
the global market for bio-refining was USD 425
billion (TechNavio, 2015), including green
chemicals market totalling about USD 55 billion.
The most significant was production of bio-
alcohols and bio-polymers (TechNavio, 2014).
In line with the EU strategy for the
development of bio-economy, it is a strategic,
integrating, cross-sectoral form of activity, which
is consistent with interdisciplinary approach to
the principles of planning and funding for
research. Bio-economy also covers the issues of
energy obtained from renewable sources and
manufacturing processes of industries such as
textile and paper industries as well as, partially,
chemical, cosmetic and pharmaceutical
industries. These integrating features of bio-
economy will be crucial for the future of the EU
as a centre of business and technology (European
Commission, 2012). These issues are similarly
defined in the United States White Paper on
Bioeconomy (The White House, 2012). The use of
plant, animal and micro-organism resources, with
the support offered by biotechnology, genetics,
chemistry and economics, may bring the
expected results to the consumers and the EU
economy but also to other regions of the world
but so far the importance of this sector in the
economies of various countries is small.
In Poland, the most important directions of
research in the field of bio-economy are as
follows (Kolesinska, 2015):
• developing processes for obtaining energy and
chemicals with high value added from biomass
derived from waste and vegetation using
industrial biotechnology methods;
• obtaining new biomaterials and polymer
composites of controllable biodegradability
based on cellulose nanofibers and bio-nano-
cellulose;
• developing technologies for obtaining new
biocatalysts and biocatalyst mimetics for the
production of fuel and organic chemical
compounds of substantial industrial
significance (platform molecules) from
biomass;
• developing biotechnological processes for
producing functional foods useful in
preventing and treating diet-related diseases;
• developing new ways of integrating
fermentation and bioconversion processes
with product separation, purification and
batching;
• developing biorefinery processes based on
waste and renewable resources.
In short-term perspective, R&D activity in
Poland in the area of bio-economy shall be
mainly focused on 1) strengthening
innovativeness and increasing competitiveness of
food industry; 2) developing technologies for
conversion of second generation biomass
(residues from food industry, household and
municipal wastes) into biofuels and raw industrial
materials (Bielecki, 2014).
Latvia is among the countries, which, like
Poland, put an emphasis on knowledge-intensive
bio-economy, biomedicine and biotechnology,
Proceedings of the 2016 International Conference “ECONOMIC SCIENCE FOR RURAL DEVELOPMENT” No 41
Jelgava, LLU ESAF, 21-22 April 2016, pp. 219-228
2Corresponding author. Tel.: +48225934003; fax: + 48225934230. E-mail address: [email protected]. 221
within the intelligent specialisations (OREANDA-
NEWS, 2015). Development of bio-economy may
also give an impulse for development of local
links between cities and their surrounding rural
regions (Bulderberga, 2015) and for reducing
greenhouse gas emissions, e.g. by producing
energy from manure and waste (Popluga, Naglis-
Liepa, Kaspars and Lenerts, 2015). So not only
an economic evaluation of biogas production is
important but also its assessment from the
ecological perspective (Morken, Fjorttoft and
Briseid, 2015). Production of bio-energy is
currently unprofitable without public support
related to environmental objectives pursued in
the production of bio-energy.
Total growth in demand for food is anticipated
on a global scale. Over 58% of the agricultural
crop production is intended for food, 37% for
animal feed and 5% for bio-fuels. Increasing
production of biofuels is an activity in competition
with food production. It is recommended that
energy is produced from second- and third-
generation raw materials such as waste and non-
food products, bacteriophages, microalgae, and,
finally, fourth-generation raw materials, i.e.
genetically modified plants.
Production of energy from biomass is
currently the only sphere of innovative bio-
economy, which has developed on an industrial
scale. It is also characterised by the lowest value
added. This concerns the use of solid biomass
and production of bio-ethanol, bio-diesel and
biogas. Production of first-generation biofuels
from products, which can be processed into food,
and special agricultural production competing
with food production is less and less supported. It
is emphasized the need for production of biofuels
from waste, by-products and special production,
like algae that is second- and third-generation
raw materials. The technological progress of
production of bio-diesel from algae is significant
and there are already industrial technologies
available (Yu et al., 2009; Schenk et al., 2008).
As of energy production from solid biomass, still
a big limitation is the organisation and costs of
transportation and storage (Rentizelas, Tolis and
Tatsiopoulos, 2009). Large power plants require
oil to be transported over long distances
(Gostomczyk, 2012), while with the transport
over a distance of more than 50 km, production
of biomass from willow (Salix spp.) is
unprofitable (Krzyzaniak, Stolarski, Szczukowski
and Tworkowski, 2013). Eco-friendly production
of energy from both the municipal and the
industrial biological waste becomes more and
more important (Parker, Fan and Ogden, 2010).
As indicated above, in addition to agriculture,
food processing and forestry, bio-economy
sectors, in which the production on an industrial
scale is carried out, include primarily bio-energy
sector.
Bio-economy has two pillars. The traditional
one encompassing forestry, agriculture and food
processing, and the modern one, associated with
production of bio-energy and bio-materials, for
example. The data concerning the entire sector
based on biomass are not available. Therefore,
for the purpose of this study, the importance of
bio-economy in the national economy was
defined as the sum of the sectors of economy, for
which statistical records exist. Production of
energy from biomass was described separately,
pointing to its importance in the energy sector
and the prospects for its development.
Goal and methods
The aim of the study is to determine the
importance of bio-economy and its structure in
Poland. The research tasks are as follows: 1) to
determine volume of the bio-economy sector in
Poland; 2) to determine the share of bio-
economy in the overall economy; 3) to determine
the importance of new sectors of bio-economy
and the dynamics of their development.
The analysis covered the years 2000-2014. In
this paper were used statistical data provided by
the Central Statistical Office (GUS) and data
provided by the Agricultural Market Agency,
which supervises the biogas market. In terms of
Proceedings of the 2016 International Conference “ECONOMIC SCIENCE FOR RURAL DEVELOPMENT” No 41
Jelgava, LLU ESAF, 21-22 April 2016, pp. 219-228
2Corresponding author. Tel.: +48225934003; fax: + 48225934230. E-mail address: [email protected]. 222
the values, data are presented in nominal values,
and the importance of the sector was assessed
on the basis of its share in the economy.
In the assessment of bio-economy in the
Polish economy, the following criteria were taken
into account: share in global production, share in
gross value added in the economy, share in fixed
assets in the economy, share in employment and
share in foreign trade. With regard to bio-energy
market, in article is presented information about
the volume of bio-energy production by source,
the dynamics of growth of bio-energy production
and its share in the energy supply in Poland.
Research results
In Poland, agriculture still plays an important
role in the national economy, although year after
year its importance decreases. It is a major
branch of bio-economy, which provides raw
materials of biological origin for further
processing. Another important sector is agri-food
processing industry and the following one is
forestry. Table 1 shows the volume and share of
the bio-economy sector in Poland. Global
production volume, gross value added, gross
fixed assets used in the sector as well as foreign
trade turnover have increased in both nominal
and real terms. In the analysed period, real
increase in the global production volume and
gross value added in agriculture was more than
25% and more than 60% in agri-food processing
industry. In the same period, the gross value
added in the Polish economy increased by 65%,
so the relative share of bio-economy decreased.
Global production volume in bio-economy in
2014 amounted to more than PLN 340 billion
(approx. USD 92 billion) that is 10% of global
production volume in the Polish economy. Even
greater was the importance of the sector for the
employment, near 20%. This is so mainly due to
fragmented agriculture, which employs more
than 80% of the workers in the bio-economy
sector. Another important area is foreign trade.
Export generated by the sector was as much as
9.5% of the total Polish export. There was
observed a positive balance of trade in products
of the sector, which in 2014 amounted to about
USD 12 billion. Polish foreign trade recorded a
negative balance: USD -3.6 billion.
In 2014, the share of bio-economy sector in
creating the gross value added was 6.2%. Its
importance decreased steadily from 2000 to 2014
on an annual average of 2.3%. Its importance in
fixed assets and employment was decreasing at
similar pace. Only for foreign trade there was
recorded a growing trend. On an annual average
export grew by 1.7% and import by 2.1%.
Figure 1 shows changes in the bio-economy
structure in the years 2000-2014. The structure
of the bio-economy has become more modern. In
2000, the share of agriculture in generating gross
value added was 57% and in 2014 as little as
41%. The role of food processing increased
during this period from 39% to 53%. Forestry
share remained at a similar level. Structure of
the employment in bio-economy was quite
different. As many as 83% of the employees
worked in agriculture. Work efficiency in
agriculture amounted to only 18% of the average
productivity in the economy and in the
processing sector and forestry it was close to the
average. Law work efficiency will remain as long
as there is no closer relationship between the
agricultural enterprises and the market
(Golebiewska, 2011). A limitation for rapid
changes in agriculture is also low production
profitability (Wicka et al., 2013).
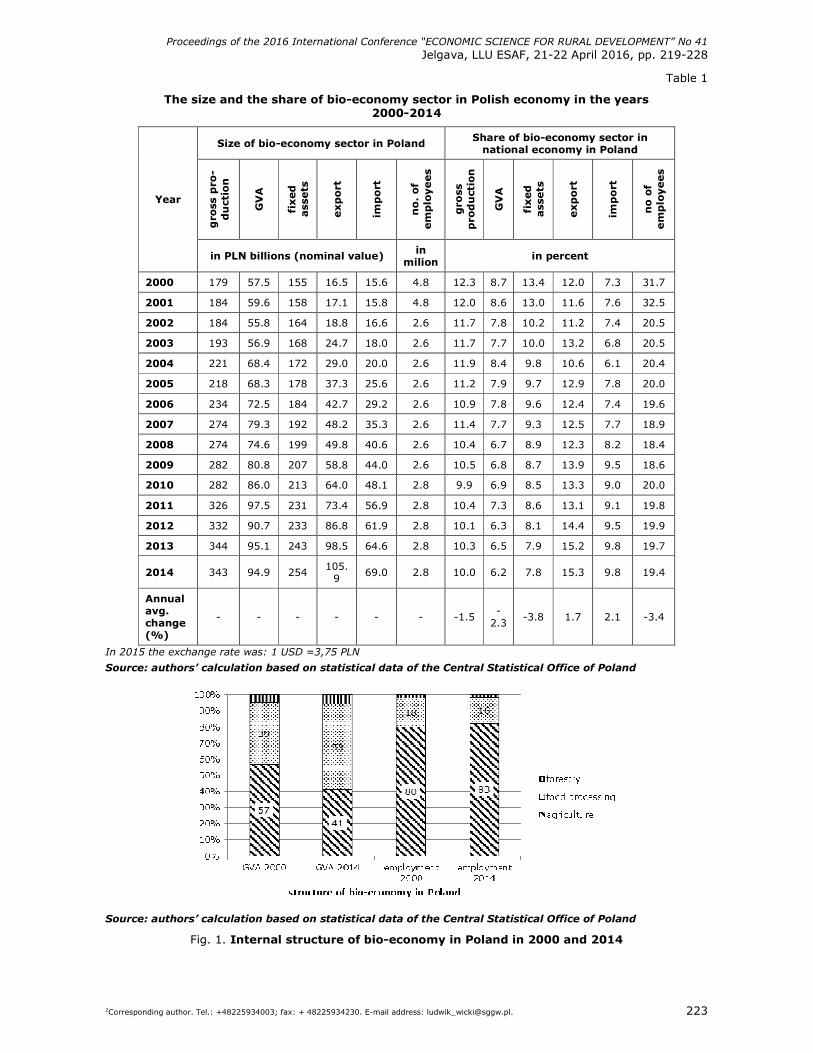
Proceedings of the 2016 International Conference “ECONOMIC SCIENCE FOR RURAL DEVELOPMENT” No 41
Jelgava, LLU ESAF, 21-22 April 2016, pp. 219-228
2Corresponding author. Tel.: +48225934003; fax: + 48225934230. E-mail address: [email protected]. 223
Table 1
The size and the share of bio-economy sector in Polish economy in the years 2000-2014
Size of bio-economy sector in Poland Share of bio-economy sector in national economy in Poland
gro
ss p
ro-
du
ctio
n
GV
A
fixed
ass
ets
exp
ort
imp
ort
no
. of
em
plo
yees
gro
ss
pro
du
ctio
n
GV
A
fixed
ass
ets
exp
ort
imp
ort
no
of
em
plo
yees
Year
in PLN billions (nominal value) in milion
in percent
2000 179 57.5 155 16.5 15.6 4.8 12.3 8.7 13.4 12.0 7.3 31.7
2001 184 59.6 158 17.1 15.8 4.8 12.0 8.6 13.0 11.6 7.6 32.5
2002 184 55.8 164 18.8 16.6 2.6 11.7 7.8 10.2 11.2 7.4 20.5
2003 193 56.9 168 24.7 18.0 2.6 11.7 7.7 10.0 13.2 6.8 20.5
2004 221 68.4 172 29.0 20.0 2.6 11.9 8.4 9.8 10.6 6.1 20.4
2005 218 68.3 178 37.3 25.6 2.6 11.2 7.9 9.7 12.9 7.8 20.0
2006 234 72.5 184 42.7 29.2 2.6 10.9 7.8 9.6 12.4 7.4 19.6
2007 274 79.3 192 48.2 35.3 2.6 11.4 7.7 9.3 12.5 7.7 18.9
2008 274 74.6 199 49.8 40.6 2.6 10.4 6.7 8.9 12.3 8.2 18.4
2009 282 80.8 207 58.8 44.0 2.6 10.5 6.8 8.7 13.9 9.5 18.6
2010 282 86.0 213 64.0 48.1 2.8 9.9 6.9 8.5 13.3 9.0 20.0
2011 326 97.5 231 73.4 56.9 2.8 10.4 7.3 8.6 13.1 9.1 19.8
2012 332 90.7 233 86.8 61.9 2.8 10.1 6.3 8.1 14.4 9.5 19.9
2013 344 95.1 243 98.5 64.6 2.8 10.3 6.5 7.9 15.2 9.8 19.7
2014 343 94.9 254 105.9
69.0 2.8 10.0 6.2 7.8 15.3 9.8 19.4
Annual avg. change (%)
- - - - - - -1.5 -2.3
-3.8 1.7 2.1 -3.4
In 2015 the exchange rate was: 1 USD =3,75 PLN
Source: authors’ calculation based on statistical data of the Central Statistical Office of Poland
Source: authors’ calculation based on statistical data of the Central Statistical Office of Poland
Fig. 1. Internal structure of bio-economy in Poland in 2000 and 2014
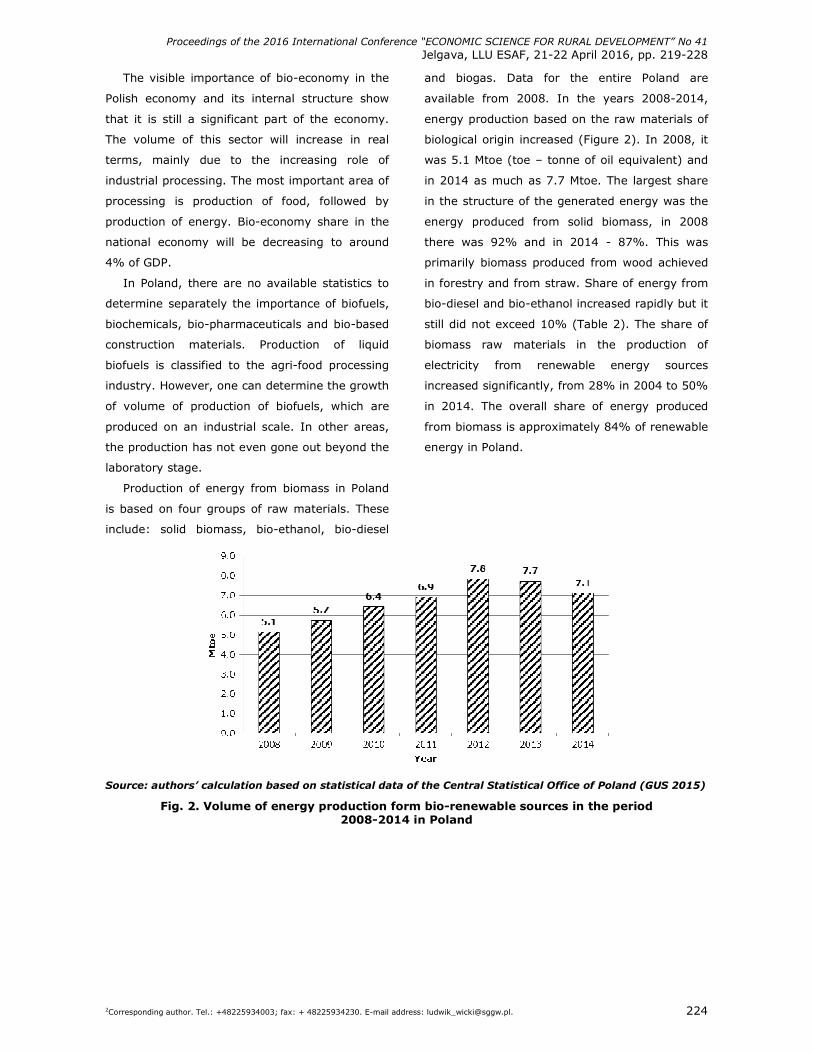
Proceedings of the 2016 International Conference “ECONOMIC SCIENCE FOR RURAL DEVELOPMENT” No 41
Jelgava, LLU ESAF, 21-22 April 2016, pp. 219-228
2Corresponding author. Tel.: +48225934003; fax: + 48225934230. E-mail address: [email protected]. 224
The visible importance of bio-economy in the
Polish economy and its internal structure show
that it is still a significant part of the economy.
The volume of this sector will increase in real
terms, mainly due to the increasing role of
industrial processing. The most important area of
processing is production of food, followed by
production of energy. Bio-economy share in the
national economy will be decreasing to around
4% of GDP.
In Poland, there are no available statistics to
determine separately the importance of biofuels,
biochemicals, bio-pharmaceuticals and bio-based
construction materials. Production of liquid
biofuels is classified to the agri-food processing
industry. However, one can determine the growth
of volume of production of biofuels, which are
produced on an industrial scale. In other areas,
the production has not even gone out beyond the
laboratory stage.
Production of energy from biomass in Poland
is based on four groups of raw materials. These
include: solid biomass, bio-ethanol, bio-diesel
and biogas. Data for the entire Poland are
available from 2008. In the years 2008-2014,
energy production based on the raw materials of
biological origin increased (Figure 2). In 2008, it
was 5.1 Mtoe (toe – tonne of oil equivalent) and
in 2014 as much as 7.7 Mtoe. The largest share
in the structure of the generated energy was the
energy produced from solid biomass, in 2008
there was 92% and in 2014 - 87%. This was
primarily biomass produced from wood achieved
in forestry and from straw. Share of energy from
bio-diesel and bio-ethanol increased rapidly but it
still did not exceed 10% (Table 2). The share of
biomass raw materials in the production of
electricity from renewable energy sources
increased significantly, from 28% in 2004 to 50%
in 2014. The overall share of energy produced
from biomass is approximately 84% of renewable
energy in Poland.
Source: authors’ calculation based on statistical data of the Central Statistical Office of Poland (GUS 2015)
Fig. 2. Volume of energy production form bio-renewable sources in the period 2008-2014 in Poland
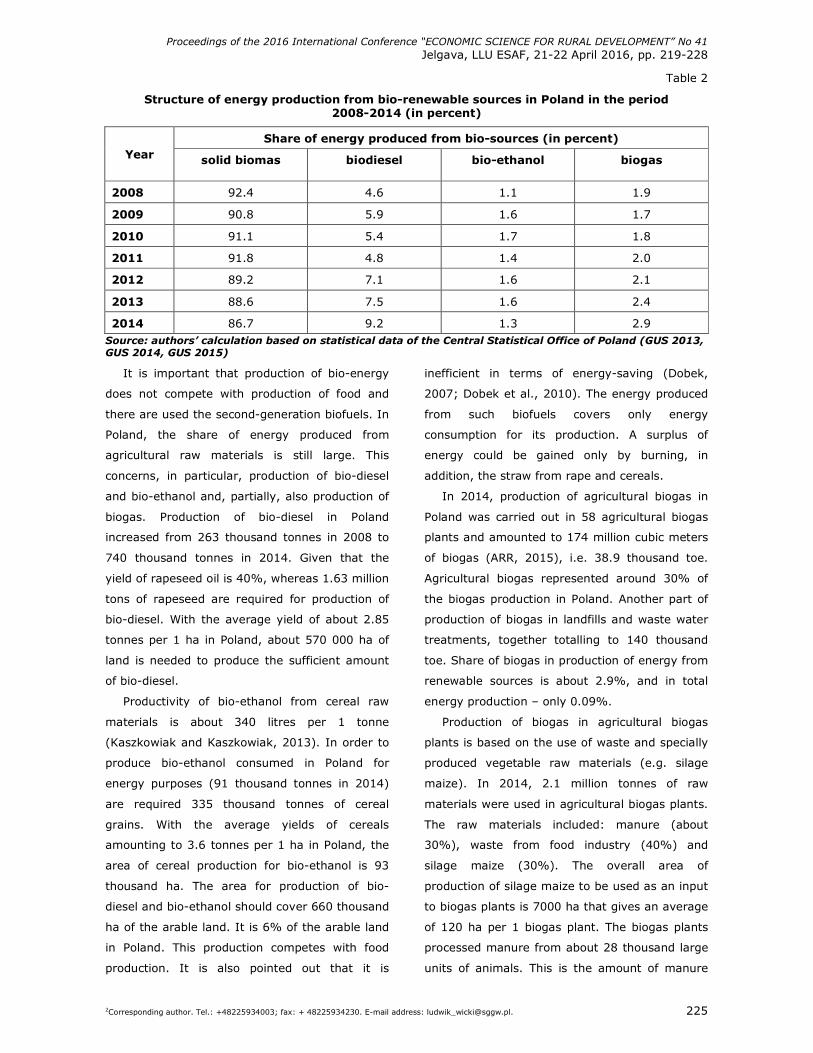
Proceedings of the 2016 International Conference “ECONOMIC SCIENCE FOR RURAL DEVELOPMENT” No 41
Jelgava, LLU ESAF, 21-22 April 2016, pp. 219-228
2Corresponding author. Tel.: +48225934003; fax: + 48225934230. E-mail address: [email protected]. 225
Table 2
Structure of energy production from bio-renewable sources in Poland in the period 2008-2014 (in percent)
Share of energy produced from bio-sources (in percent) Year solid biomas biodiesel bio-ethanol biogas
2008 92.4 4.6 1.1 1.9
2009 90.8 5.9 1.6 1.7
2010 91.1 5.4 1.7 1.8
2011 91.8 4.8 1.4 2.0
2012 89.2 7.1 1.6 2.1
2013 88.6 7.5 1.6 2.4
2014 86.7 9.2 1.3 2.9 Source: authors’ calculation based on statistical data of the Central Statistical Office of Poland (GUS 2013, GUS 2014, GUS 2015)
It is important that production of bio-energy
does not compete with production of food and
there are used the second-generation biofuels. In
Poland, the share of energy produced from
agricultural raw materials is still large. This
concerns, in particular, production of bio-diesel
and bio-ethanol and, partially, also production of
biogas. Production of bio-diesel in Poland
increased from 263 thousand tonnes in 2008 to
740 thousand tonnes in 2014. Given that the
yield of rapeseed oil is 40%, whereas 1.63 million
tons of rapeseed are required for production of
bio-diesel. With the average yield of about 2.85
tonnes per 1 ha in Poland, about 570 000 ha of
land is needed to produce the sufficient amount
of bio-diesel.
Productivity of bio-ethanol from cereal raw
materials is about 340 litres per 1 tonne
(Kaszkowiak and Kaszkowiak, 2013). In order to
produce bio-ethanol consumed in Poland for
energy purposes (91 thousand tonnes in 2014)
are required 335 thousand tonnes of cereal
grains. With the average yields of cereals
amounting to 3.6 tonnes per 1 ha in Poland, the
area of cereal production for bio-ethanol is 93
thousand ha. The area for production of bio-
diesel and bio-ethanol should cover 660 thousand
ha of the arable land. It is 6% of the arable land
in Poland. This production competes with food
production. It is also pointed out that it is
inefficient in terms of energy-saving (Dobek,
2007; Dobek et al., 2010). The energy produced
from such biofuels covers only energy
consumption for its production. A surplus of
energy could be gained only by burning, in
addition, the straw from rape and cereals.
In 2014, production of agricultural biogas in
Poland was carried out in 58 agricultural biogas
plants and amounted to 174 million cubic meters
of biogas (ARR, 2015), i.e. 38.9 thousand toe.
Agricultural biogas represented around 30% of
the biogas production in Poland. Another part of
production of biogas in landfills and waste water
treatments, together totalling to 140 thousand
toe. Share of biogas in production of energy from
renewable sources is about 2.9%, and in total
energy production – only 0.09%.
Production of biogas in agricultural biogas
plants is based on the use of waste and specially
produced vegetable raw materials (e.g. silage
maize). In 2014, 2.1 million tonnes of raw
materials were used in agricultural biogas plants.
The raw materials included: manure (about
30%), waste from food industry (40%) and
silage maize (30%). The overall area of
production of silage maize to be used as an input
to biogas plants is 7000 ha that gives an average
of 120 ha per 1 biogas plant. The biogas plants
processed manure from about 28 thousand large
units of animals. This is the amount of manure
Proceedings of the 2016 International Conference “ECONOMIC SCIENCE FOR RURAL DEVELOPMENT” No 41
Jelgava, LLU ESAF, 21-22 April 2016, pp. 219-228
2Corresponding author. Tel.: +48225934003; fax: + 48225934230. E-mail address: [email protected]. 226
that can be produced by 170 thousand pigs for
fattening (1.8% of the pig population in Poland).
Both the area for production of raw materials and
the share of the manure processed show that
importance of agricultural biogas production in
Poland is small. Considering the current prices of
energy and green certificates in Poland it is not a
profitable production, with zero profitability
(Ciurzynski, 2014) and the prospects of price
changes are not satisfactory (Biomasa Magazine,
2016).
Conclusions
Bio-economy sector in Poland has a traditional
structure and is still quite important in the overall
economy. Its share in generating gross value
added is about 6.5%, in employment as much as
19% and in foreign trade: 15% in export and
10% in import. The importance of the sector in
the years 2000-2014 decreased by about 2% on
an annual average. Global annual production
volume of the sector is about USD 90 billion. The
structure of bio-economy is dominated by
traditional sectors: agriculture, food processing
industry and forestry. The importance of
agriculture decreases and in 2014 it fell to a 41%
share in the sector. The importance of food
processing increased – from 39 to 53% GVA of
the sector.
Production in the innovative areas of bio-
economy is still small and relates primarily to
production of energy from biomass. There is
currently no plant for processing biomass into
products with higher value added. These
technologies are still in the experimental stage.
Production of energy from biomass in Poland
increases. In 2014, energy from biomass was
9.9% of total energy production. Its primary
source was the solid biomass, mainly from
forestry, which represents as much as 87% of
the total volume. Production of bio-ethanol and
bio-diesel (9.2% and 1.3%) and production of
biogas (2.9%) are of less importance. In Poland,
agricultural raw materials for production of
biofuels are produced in about 6% of the arable
land. The main direction of development of bio-
energy production should be production from
waste, including waste from agriculture.
Production of agricultural biogas in Poland is
small. Only 0.9% of energy is produced from
biomass. Development of this production is not
profitable without public support, which should be
compensated by the environmental effects,
including reduction of GHG emissions. In Poland,
biogas plants process only 2% of manure.
Development of bio-economy in Poland should
be based on production of bio-energy from
second- and third-generation biomass and
production of products with high value added,
e.g. bio-polymers. Innovative areas of bio-
economy in Poland are still in the initial stage of
development. Production on an industrial scale
does not exist. A major limitation may be low
competitiveness of these technologies in terms of
cost.
Bibliography
1. ARR. (2015). Sprawozdanie z dzialalnosci Agencji Rynku Rolnego w 2014 r. (The report on the activities of Agricultural Market Agency in 2014.) Warszawa: Agencja Rynku Rolnego.
2. Bielecki, S. (2014). Bioeconomy in Poland - Open Opportunities. 3rd Bioeconomy Stakeholder Conference, Turin October 8-9, 2014. Turin.
3. Biomasa Magazine. (2016). Bedzie rezerwa zielonych certyfikatow dla biogazowni (There Will Be the Reserve of Green Certificates for Biogas). Magazyn Biomasa (Biomasa Magazine). Retrieved: http://magazynbiomasa.pl/bedzie-rezerwa-zielonych-certyfikatow-dla-biogazowni/. Access: 1.20.2016.
4. Bukowski, M., Szpor, A., Sniegocki, A. (2012). Drzemiacy tygrys, spetany orzel. Dylematy polskiej debaty o polityce innowacyjnej (Napping Tiger, Eagle Hindered. Dilemmas of Polish Debate on Innovation Policy). Warszawa: Instytut Badan Strukturalnych (Institute for Structural Research).
5. Bulderberga, Z. (2015). Forecasted Outcomes of Latvian Regional Policy’s Implementation in Municipalities. In: In Proceedings of the 25th NJF Congress. Nordic View To Sustainable Rural Development. Riga: NJF Latvia, pp. 472-480.
6. Chylek, E., Rzepecka, M. (2011). Biogospodarka – konkurencyjnosc i zrownowazone wykorzystanie zasobow (Bio-economy - Competitiveness and the Sustainable Use of Resources). Polish Journal of Agronomy(7), pp. 7-13.
Proceedings of the 2016 International Conference “ECONOMIC SCIENCE FOR RURAL DEVELOPMENT” No 41
Jelgava, LLU ESAF, 21-22 April 2016, pp. 219-228
2Corresponding author. Tel.: +48225934003; fax: + 48225934230. E-mail address: [email protected]. 227
7. Ciurzynski, L. (2014, 10 9). Ile mozna zarobic na biogazie, czyli oplacalnosc biogazowni (How Much You Can Earn on Biogas, or the Profitability of Biogas Plants). Magazyn Biomasa (Biomasa Magazine). Retrieved: http://magazynbiomasa.pl/ile-mozna-zarobic-na-biogazie-czyli-oplacalnosc-biogazowi/. Access: 3.01.2016.
8. Dobek, T. (2007). Ocena efektywnosci ekonomicznej i energetycznej produkcji pszenicy ozimej i rzepaku ozimego wykorzystanych do produkcji biopaliw (Evaluation of Economic Effectiveness and Power Consumption for Farming of Winter Rapeseed and Winter Wheat Utilized for Biofuel Production). Inzynieria rolnicza (Agricultural Engineering), (6 (94)), pp. 41-48.
9. Dobek, T., Dobek, M., Sarec, O., (2010). Ocena efektywnosci ekonomicznej i energetycznej produkcji pszenicy ozimej i rzepaku ozimego wykorzystanych do produkcji biopaliw (Assessment of Economic and Energy Efficiency for the Production of Winter Wheat and Winter Rape Used to Manufacture Biofuels). Inzynieria rolnicza (Agricultural Engineering), (1(119)), pp. 161-168.
10. European Commission. (2012, 2 7). Why the Bioeconomy Matters. European Commission workshop outlines the Bioeconomy’s impact in our lives. Retrieved: http://ec.europa.eu/research/bioeconomy/pdf/ 120207_european_commission-bioeconomy-workshop_en.pdf. Access: 4.01.2016.
11. European Commission. (2012, 2 13). Innowacje w sluzbie zrownowaznego wzrostu: biogospodarka dla Europy (Innovating for Sustainable Grow: A Bioeconomy for Europe). (COM2012(60)). Brussel: European Commission.
12. Golebiewska, B. (2011). Significance of Connections with the Environment of Agricultural Farms in Poland for their Production and Economic Situation. Economic Science for Rural Development - Production and Taxes, (24), pp. 40-49.
13. Golebiewski, J. (2013). Value Chains Within Bioeconomy. International Scientific Electronic Journal “Earth Bioresources and Life Quality”, (4), pp. 1-15. Retrieved: http://gchera-ejournal.nubip.edu.ua/index.php/ebql/issue/current. Access: 16.01.2016.
14. Golebiewski, J. (2014). Biogospodarka jako inteligentna specjalizacja regionow w Polsce (Bioeconomy as a Smart Specialization of Regions in Poland). Przedsiebiorczosc i Zarzadzanie (Entrepreneurship and Management), Vol. 15, z. 8, part 1, pp. 55-69. Retrieved: http://piz.san.edu.pl/docs/e-XV-8-1.pdf. Access: 18.01.2016.
15. Golebiewski, J. (2015). Zrownowazona biogospodarka – potencjal i czynniki rozwoju (Sustainable Bio-economy - the Potential and Development Factors). In: (Czyzewski, A., Klepacki, B. eds.) Problemy rozwoju rolnictwa i gospodarki zywnosciowej w pierwszej dekadzie czlonkostwa Polski w Unii Europejskiej: IX Kongres Ekonomistow Polskich (Problems of Development of Agriculture and Food Economy in the First Decade of Polish Membership in the European Union: IX Congress of Polish Economists). Warsaw: Polskie Towarzystwo Ekonomiczne, pp. 344-362.
16. Gostomczyk, W. (2012). Organizacja systemu logistycznego w produkcji i wykorzystaniu biomasy energetycznej (The Organization of the Logistic System in the Production and Use of Biomass Energy). Logistyka (Logistics), (4), pp. 939-946.
17. GUS. (2014). Energia ze zrodel odnawialnych w 2013 r. (Energy from Renewable Sources in 2013). Warsaw, Polska: Glowny Urzad Statystyczny (Central Statistical Office of Poland), p. 69.
18. GUS. (2015). Energia ze zrodel odnawialnych w 2014 r. (Energy from Renewable Sources in 2014). Warszawa, Polska: Glowny Urzad Statystyczny (Central Statistical Office of Poland), p.68.
19. Kaszkowiak, E. i Kaszkowiak, J. (2013). Plon i wydajnosc bioetanolu z kukurydzy w warunkach gleb lekkich (The Yield and Efficiency of Bio-ethanol From Corn in the Conditions of Light Soils). Inz. i Ap. Chem. (Chemical Engineering And Equipment), 52(2), pp. 56-57.
20. Kolesińska, B. (2015, 5 7). University for the Bio-Economy. Retrieved: The Warsaw Voice online: http://www.warsawvoice.pl/WVpage/pages/articlePrint.php/28053/article. Access: 4.01.2016.
21. Krzyzaniak, M., Stolarski, M., Szczukowski, S., Tworkowski, J. (2013). Ekonomiczne aspekty produkcji biomasy wierzby w jednorocznym i trzyletnim cyklu zbioru (Economic Aspects of Willow Biomass Production in Annual and Triennial Harvest Cycle). Rocz. Ekon. Rol. i Rozw. Obsz. Wiejskich (Annals of Agricultural Economics and Rural Development), 100(1), pp. 211-119.
22. Maciejczak, M. (2015). How To Analyze Bioeconomy? Roczniki Naukowe, Stowarzyszenie Ekonomistow Rolnictwa i Agrobiznesu (Annales of Polish Association of Agricultural and Agribusiness Economists), vol. XVI(6), pp. 165-171.
23. Maciejczak, M., Hofreiter, K. (2013). How To Define Bioeconomy? Roczniki Naukowe Stowarzyszenia Ekonomistow Rolnictwa i Agrobiznesu (Annales of Polish Association of Agricultural and Agribusiness Economists), vol. XV(4), pp. 243-248.
24. Morken, J., Fjorttoft, C., Briseid, T. (2015). Agricultural Biogas Plants - Energy Balance. In Proceedings of the 25th NJF Congress. Nordic View To Sustainable Rural Development. Riga: NJF Latvia, pp.370-374.
25. OREANDA-NEWS. (2015, 5 29). Latvia to Become European Centre for Innovation and Research for One Week. Международные экономические новости (International Economic News).
26. Parker, N., Fan, Y., Ogden, J. (2010). From Waste to Hydrogen: An Optimal Design of Energy Production and Distribution Network. Transportation Research Part E, Logistics and Transportation Review, 46(4), pp. 534-545.
27. Patermann, C. (2008, 10 1). The Knowledge-Based Bio-Economy - from Concept to Practice: Experiences in Germany - Particularly in North-Rhine Westphalia - and Europe. Retrieved: Webpage of Kassel University - Ost-West-Wissenschaftszentrum, documents from V International Symposium "EU-Russia": http://www.owwz.de/fileadmin/Biotechnologie/BioVeranst/Pushchino_2008/Patermann.pdf. Access: 14.01.2016.
28. Popluga, D., Naglis-Liepa, K, Lenerts, A. (2015). Latvia's Progress Towards Agricultural GHG Mitigation. In Proceedings of the 25th NJF Congress. Nordic View To Sustainable Rural Development. Riga: NJF Latvia, pp. 265-269.
29. Rentizelas, A., Tolis, A., Tatsiopoulos, I. (2009). Logistics Issues of Biomass: the Storage Problem and the Multi-biomass Supply Chain. Renewable and Sustainable Energy Reviews(13), pp. 887-894.
Proceedings of the 2016 International Conference “ECONOMIC SCIENCE FOR RURAL DEVELOPMENT” No 41
Jelgava, LLU ESAF, 21-22 April 2016, pp. 219-228
2Corresponding author. Tel.: +48225934003; fax: + 48225934230. E-mail address: [email protected]. 228
30. Schenk, P., Thomas-Hall, S., Stephens, E., Marx, U., Mussgnug, J., Posten, C., Hankamer, B. (2008). Second Generation Biofuels: High-efficiency Microalgae for Biodiesel Production. Bioenergy Research, 1(1), pp. 20-43.
31. SeeNews. (2015, 10 22). AEBIOM Sees Bioenergy Growing by 33 Mtoe by 2020. SeeNews Renewables.
32. Tapscott, D., Williams, A. (2011). Makrowikinomia. Reset swiata i biznesu (Macrowikinomics: Rebooting Business and the World). Warszawa: Studio Emka, p. 432.
33. TechNavio. (2014). Global Green Chemicals Market 2014-2018. Infiniti Research Limited, p. 71.
34. TechNavio. (2015). Global Biorefinery Market 2015-2019. Infiniti Research Limited, p. 117.
35. TechNavio. (2015b). Global Bio-Polypropylene Market 2015-2019. Infiniti Research Limited, p. 70.
36. The White House. (2012). National Bioeconomy Blueprint. Washington DC: The White House.
37. Wicka, A., Golebiewska, B., Golebiewski, J., Jedrzejczyk, I., Kobus, P., Wicki, L., Wojciechowska-Lipka, E. (2013). Czynniki i mozliwosci ograniczania ryzyka w produkcji roslinnej poprzez ubezpieczenia (Factors and Possibilities of Reducing the Risk of Crop Production Using Insurance). Warszawa: Wydawnictwo SGGW, p. 271.
38. Wicki, L., Grontkowska, A. (2015). Zmiany znaczenia agrobiznesu w gospodarce i w jego wewnetrznej strukturze (Changes of the Importance of Agribusiness in the Economy and in Its Internal Structure). Rocz. Nauk Ekonomii Rolnictwa i Rozwoju Obszarow Wiejskich (Annals of Agricultural Economics and Rural Development), 102(3), pp. 20-32.
39. Yu, G., Zhang, Y., Schideman, L., Funk, T., Wang, Z. (2009, October 11-14). Bio-crude Oil Production From Microalgae Through Hydrothermal Process. Bioenergy Engineering(11-14).
Proceedings of the 2016 International Conference “ECONOMIC SCIENCE FOR RURAL DEVELOPMENT” No 41
Jelgava, LLU ESAF, 21-22 April 2016, pp. 229-233
1Corresponding author: tel. +48 22 34235, fax: +48 22 59 34 213, e-mail: [email protected] 229
BIOECONOMY AS A COMPLEX ADAPTIVE SYSTEM Mariusz Maciejczak1, PhD
1 Warsaw University of Life Sciences-SGGW, Poland
Abstract. The bioeconomy is recognized as a large system that binds together natural resources, technologies,
markets, people and policies. It actively and continuously establishes links between industries, both old, that for a long
time form a chain of added values and new, that previously had no connections, forming a symbiotic relationship
where one industry utilizes the by-products of another. The paper describes this system in a dynamic approach, as a
complex adaptive system. Complexity results from the inter-relationship, inter-action and inter-connectivity of
elements within a system and between a system and its environment. Based on the empirical evidences from the
European Union it is argued that bioeconomy as a platform networking several branches of economy could adapt to
the changes that take place in the environment.
Key words: bioeconomy, complex adaptive systems, renewable resources, efficiency.
JEL code: L11, L50, Q01
Introduction
The concept of bioeconomy is recognized as
not only a promise but also a solid and realistic
foundation of achieving the sustainability needs
worldwide. The idea is to cluster by different
socio-economic processes both traditional and
innovative sectors of economies that focus on the
use of renewable resources, and by applying
knowledge and innovative technologies, deliver
products and services, through achieving
objectives important from private and public
point of view. The bioeconomy is also recognized
as a large system that binds together natural
resources, technologies, markets, people and
policies. It actively establishes links between
industries, both old, that for a long time form a
chain of added values and new, that previously
had no connections, within a new, symbiotic
relationship where one industry utilizes the by-
products of another. As such bioeconomy is
perceived very holistically in a wide systemic
approach.
However, it is necessary to see this system
not in a static way but apply more dynamic
approach (Maciejczak M. and Hofreiter K., 2013).
This is due to the dynamic and turbulent internal
and external changes that practically prevent the
achievement of Pareto optimum. Therefore,
bioeconomy can be considered as a complex
adaptive system. Complexity results from the
inter-relationship, inter-action and inter-
connectivity of elements within a system and
between a system and its environment.
Complexity economics is considered as a mirror
inversion of neoclassical theory (Levin R., 2000).
Complex adaptive systems from economic
perspective are characterized by Miller and Page
(2007) by three main factors. Firstly, the
complex economy is never in equilibrium but is
constantly subjected to shocks, both exogenous
and endogenous, that affect its short-term
movements. Secondly, the classical law of one
price fails, and there are observed short term
price deviations. Finally, complex adaptive
systems rarely, if ever, achieve the sort of
optimality. It seems necessary to approach
economic analysis of bioeconomy from a
network, rather than a production and utility
function perspective, when one deals with
complex systems. It is argued that dynamic
systems are able to adapt in and evolve with a
changing environment (Golebiewska B., 2014).
The paper aims to analyze bioeconomy as a
complex adaptive system. Based on the empirical
evidences from the European Union countries it is
argued that bioeconomy as a platform
networking several branches of economy could
adapt to the changes that take place in the
environment. So far, the economic literature on
bioeconomy issues in majority is applying the
orthodox approaches from classical and
neoclassical theories. The heterodox points of
view are rarely undertaken. However, such
approaches give the chances to analyse
Proceedings of the 2016 International Conference “ECONOMIC SCIENCE FOR RURAL DEVELOPMENT” No 41
Jelgava, LLU ESAF, 21-22 April 2016, pp. 229-233
1Corresponding author: tel. +48 22 34235, fax: +48 22 59 34 213, e-mail: [email protected] 230
bioeconomy in a holistic way, assuming not only
the dynamics of the concept but also its
complexity, i.e. resulting not only from current
state of the art but also from its path
dependency. As several authors emphasize
(Stack M. and Gartland M., 2013; Wolfre D.A.
and Lucas M., 2005; Garrouste P. and Ioannides
S., 2001), such approach enables to see the
complex picture and observe the adaptation of
economic systems, including the bioeconomy.
The presented research are based on the
heterodox assumptions of deductive and
descriptive reasoning, and the secondary data
coming from the Bioeconomy Observatory of the
European Commission, using the data
management tool DataM2, which is capturing
statistics related to bioeconomy.
Research results and discussion
In the social sciences, it is agreed that the
complexity results from the inter-relationship,
inter-action and inter-connectivity of elements
within a system and between a system and its
environment (Levin R., 2000; Mitchel M., 2011).
As such, systems are able to adopt and become
known as Complex Adaptive Systems (CAS).
According to Miller and Page (2007) CAS are
dynamic systems able to adapt in and evolve
with a changing environment. As argued by
Cham (2001), it is important to realize that there
is no separation between a system and its
environment in the idea that a system always
adapts to a changing environment. Rather, the
system is closely linked with all other related
systems making up an ecosystem. Within such a
context, change needs to be seen in terms of co-
evolution with all other related systems, rather
than as adaptation to a separate and distinct
environment (Vanberg V.J., 2004). Axelrod
(1997) argues that what distinguish a CAS from a
pure multi-agent system (MAS) are: the focus on
top-level properties and features like self-
similarity, complexity, emergence and self-
organization. A MAS is defined as a system
composed of multiple interacting agents; where
the agents as well as the system are adaptive
and the system is self-similar. CAS is recognized
as a complex, self-similar collectivity of
interacting adaptive agents. Complex Adaptive
Systems are characterised by a high degree of
adaptive capacity, giving them resilience in the
face of perturbation. Communication and
cooperation take place on all levels, from the
agent to the system level. Levin (2000) defines
CAS systems in terms of three properties:
diversity and individuality of components,
localized interactions among these components
and an autonomous process that uses outcomes
of those interactions to select a subset of those
components for replication or enhancement.
Day (1994) argues that when thinking of the
economy as a complex system of elements the
appropriate construct to understand it is the
network. It is because the generated added value
does not just come from the elements contained
in the firm but from the connections that are
forged between them. As networks evolve and
produce more and better ranges of products
using more productive processes, there is
observed increasing value added. As shown by
Vanberg (2004) firms are bundles of network
connections, as are economies. Such networks
cannot be fully connected or be maximally
efficient, because an economic system is not a
machine. Networks are constantly being created
and destroyed, along with products and
organizations (Jackson M. and Watts A., 2002;
Rosser J., 1999).
From the point of view of economic theory, as
stressed out by Metcalfe et al. (2006), complex
systems theory is, essentially, a body of theory
about connections, distinguishing it from
conventional economic theory which is concerned
with elements, supplemented by very strong
assumptions about connections. Component
structures in such systems evolve through a
process of specialization and integration as well
as the process of innovation diffusion. Foster
(2004) distinguished four general properties of
Proceedings of the 2016 International Conference “ECONOMIC SCIENCE FOR RURAL DEVELOPMENT” No 41
Jelgava, LLU ESAF, 21-22 April 2016, pp. 229-233
1Corresponding author: tel. +48 22 34235, fax: +48 22 59 34 213, e-mail: [email protected] 231
an economic complex adaptive system, which
includes structure, its components, connections
and evolution in the historical time domain.
Having in mind the above discriminants of the
bioeconomy (Maciejczak M., 2015), and agreeing
that as an economic system it has a network and
complex structure as well as is influenced by the
path dependency, one could distinguish its
following properties:
1) agents – as every system the bioeconomy
should be recognized as a set of economic
agents performing different functions, not only
devoted to supply and demand but also aimed
to deliver knowledge or institutional
framework;
2) connections – every agent in the
bioeconomy system performs the role that
results are transmitted by the links, also with
feedback loops, established in the networks,
which are subject to constant changes;
3) transformations – this characteristic is
crucial for bioeconomy as much as crucial are
renewable resources and knowledge, which
both are used as basic sources for any bio-
processes which create private and public
value added;
4) openness – this approach enables to
obliterate the boundaries between the agent –
a firm and its environment, making them
more permeable, and thanks to that, transfer
innovations inward and outward; firms could
become more innovative cooperating with
partners by sharing risk and sharing reward;
5) evolution – the network of bioeconomy is
subject to constant changes, which not only
influence its development but are influenced
by all historical changes.
Figure 1 presents the conceptual model of
bioeconomy as a complex system. Such system
is built of agents, which are connected. In such
system products and services are generated from
application of knowledge and innovative
technologies into production processes which
base on renewable sources of biomass. By
application of non-linear models of progress
development and innovation diffusion as well as
being pulled by the market, the bioeconomy
system can generate products and services
important from private and public point of view.
Both, private and public institutions finance and
govern its functioning and growth.
Is, however, the bioeconomy not only
complex but also adaptive? To answer this
question two synergetic arguments can be used.
First is describing the evolution of the
bioeconomy concept. The second is showing how
path dependency resulted in the primary
production of energy from renewable sources.
In one of the first policy agendas of the
bioeconomy, namely the Cologne Paper
(European Commission, 2007) bioeconomy is
recognized as the production of renewable
biological resources and their conversion into
food, feed, bio - based products and bioenergy.
Here, is provided very narrow approach which is
encompassing the classical production function.
In 2012, the European Commission stressed out
that production paradigms of bioeconomy should
rely on biological processes and, as with natural
ecosystems, use natural inputs, expend minimum
amounts of energy and do not produce waste as
all materials discarded by one process are inputs
for another process and are re-used in the
ecosystem (European Commission, 2012). In the
evolution of bioeconomy concept in Europe could
be observed the focus not only on production but
also on energy savings and circularity of
renewable resources, i.e. wastes. In 2015 the
Council of Nordic States – Norden, pointed out
that bioeconomy is a sustainable production and
use of natural resources, with a cross-sectorial
and systematic approach, with a basis in circular
economy (The Council of Nordic States, 2015). In
this definition, being an example of the broadest
approach, are emphasized the elements of
governance of production and circularity of the
system.
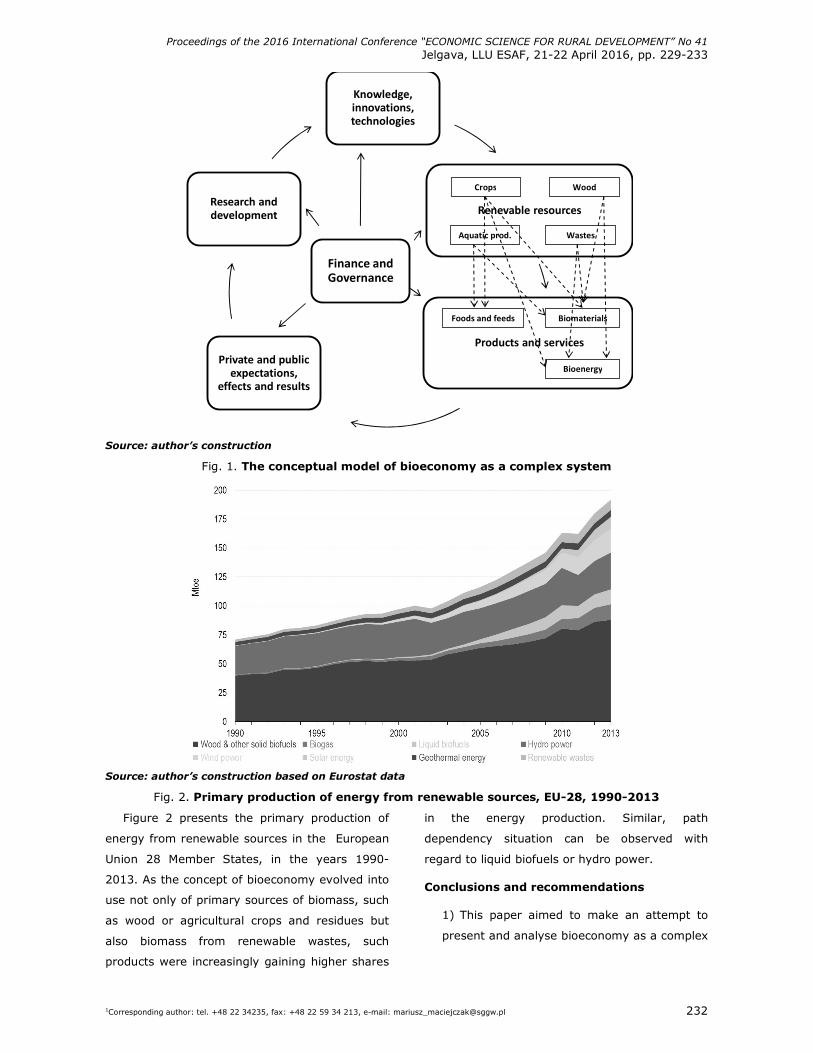
Proceedings of the 2016 International Conference “ECONOMIC SCIENCE FOR RURAL DEVELOPMENT” No 41
Jelgava, LLU ESAF, 21-22 April 2016, pp. 229-233
1Corresponding author: tel. +48 22 34235, fax: +48 22 59 34 213, e-mail: [email protected] 232
Knowledge,
innovations,
technologies
Renevable resources
Products and services
Private and public
expectations,
effects and results
Research and
development
Finance and
Governance
Crops Wood
Aquatic prod. Wastes
Foods and feeds
Bioenergy
Biomaterials
Source: author’s construction
Fig. 1. The conceptual model of bioeconomy as a complex system
Source: author’s construction based on Eurostat data
Fig. 2. Primary production of energy from renewable sources, EU-28, 1990-2013
Figure 2 presents the primary production of
energy from renewable sources in the European
Union 28 Member States, in the years 1990-
2013. As the concept of bioeconomy evolved into
use not only of primary sources of biomass, such
as wood or agricultural crops and residues but
also biomass from renewable wastes, such
products were increasingly gaining higher shares
in the energy production. Similar, path
dependency situation can be observed with
regard to liquid biofuels or hydro power.
Conclusions and recommendations
1) This paper aimed to make an attempt to
present and analyse bioeconomy as a complex
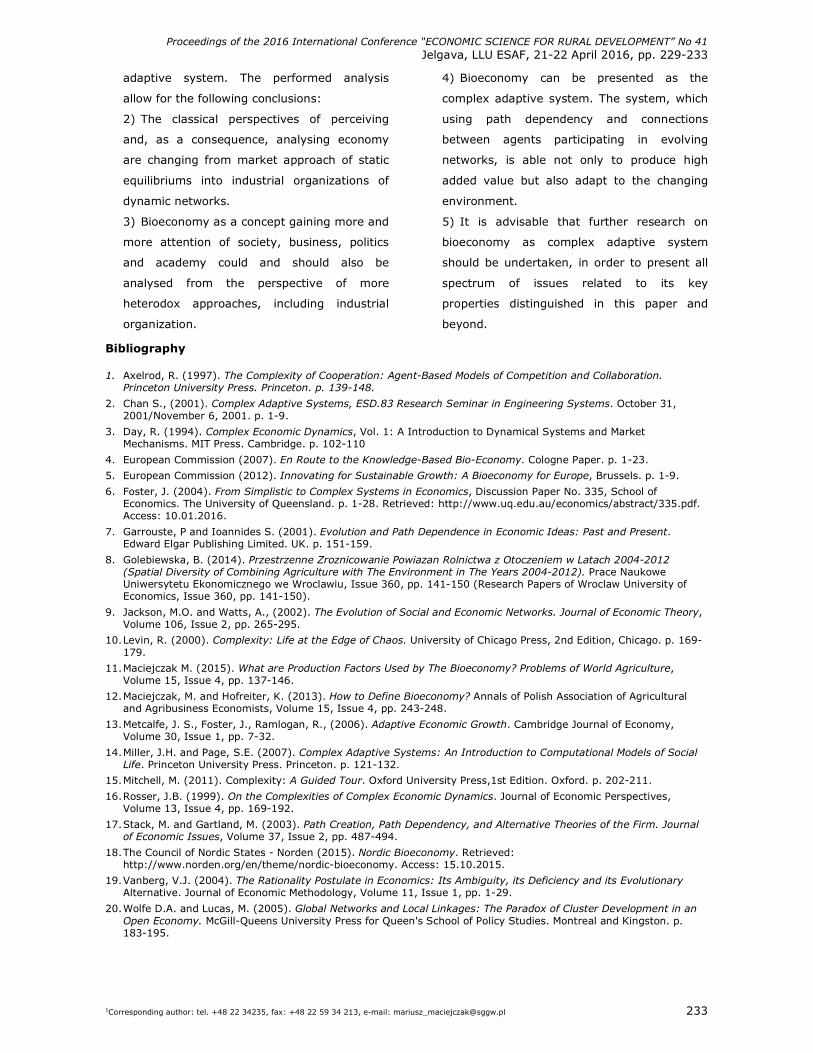
Proceedings of the 2016 International Conference “ECONOMIC SCIENCE FOR RURAL DEVELOPMENT” No 41
Jelgava, LLU ESAF, 21-22 April 2016, pp. 229-233
1Corresponding author: tel. +48 22 34235, fax: +48 22 59 34 213, e-mail: [email protected] 233
adaptive system. The performed analysis
allow for the following conclusions:
2) The classical perspectives of perceiving
and, as a consequence, analysing economy
are changing from market approach of static
equilibriums into industrial organizations of
dynamic networks.
3) Bioeconomy as a concept gaining more and
more attention of society, business, politics
and academy could and should also be
analysed from the perspective of more
heterodox approaches, including industrial
organization.
4) Bioeconomy can be presented as the
complex adaptive system. The system, which
using path dependency and connections
between agents participating in evolving
networks, is able not only to produce high
added value but also adapt to the changing
environment.
5) It is advisable that further research on
bioeconomy as complex adaptive system
should be undertaken, in order to present all
spectrum of issues related to its key
properties distinguished in this paper and
beyond.
Bibliography
1. Axelrod, R. (1997). The Complexity of Cooperation: Agent-Based Models of Competition and Collaboration. Princeton University Press. Princeton. p. 139-148.
2. Chan S., (2001). Complex Adaptive Systems, ESD.83 Research Seminar in Engineering Systems. October 31, 2001/November 6, 2001. p. 1-9.
3. Day, R. (1994). Complex Economic Dynamics, Vol. 1: A Introduction to Dynamical Systems and Market Mechanisms. MIT Press. Cambridge. p. 102-110
4. European Commission (2007). En Route to the Knowledge-Based Bio-Economy. Cologne Paper. p. 1-23.
5. European Commission (2012). Innovating for Sustainable Growth: A Bioeconomy for Europe, Brussels. p. 1-9.
6. Foster, J. (2004). From Simplistic to Complex Systems in Economics, Discussion Paper No. 335, School of Economics. The University of Queensland. p. 1-28. Retrieved: http://www.uq.edu.au/economics/abstract/335.pdf. Access: 10.01.2016.
7. Garrouste, P and Ioannides S. (2001). Evolution and Path Dependence in Economic Ideas: Past and Present. Edward Elgar Publishing Limited. UK. p. 151-159.
8. Golebiewska, B. (2014). Przestrzenne Zroznicowanie Powiazan Rolnictwa z Otoczeniem w Latach 2004-2012 (Spatial Diversity of Combining Agriculture with The Environment in The Years 2004-2012). Prace Naukowe Uniwersytetu Ekonomicznego we Wroclawiu, Issue 360, pp. 141-150 (Research Papers of Wroclaw University of Economics, Issue 360, pp. 141-150).
9. Jackson, M.O. and Watts, A., (2002). The Evolution of Social and Economic Networks. Journal of Economic Theory, Volume 106, Issue 2, pp. 265-295.
10. Levin, R. (2000). Complexity: Life at the Edge of Chaos. University of Chicago Press, 2nd Edition, Chicago. p. 169-179.
11. Maciejczak M. (2015). What are Production Factors Used by The Bioeconomy? Problems of World Agriculture, Volume 15, Issue 4, pp. 137-146.
12. Maciejczak, M. and Hofreiter, K. (2013). How to Define Bioeconomy? Annals of Polish Association of Agricultural and Agribusiness Economists, Volume 15, Issue 4, pp. 243-248.
13. Metcalfe, J. S., Foster, J., Ramlogan, R., (2006). Adaptive Economic Growth. Cambridge Journal of Economy, Volume 30, Issue 1, pp. 7-32.
14. Miller, J.H. and Page, S.E. (2007). Complex Adaptive Systems: An Introduction to Computational Models of Social Life. Princeton University Press. Princeton. p. 121-132.
15. Mitchell, M. (2011). Complexity: A Guided Tour. Oxford University Press,1st Edition. Oxford. p. 202-211.
16. Rosser, J.B. (1999). On the Complexities of Complex Economic Dynamics. Journal of Economic Perspectives, Volume 13, Issue 4, pp. 169-192.
17. Stack, M. and Gartland, M. (2003). Path Creation, Path Dependency, and Alternative Theories of the Firm. Journal of Economic Issues, Volume 37, Issue 2, pp. 487-494.
18. The Council of Nordic States - Norden (2015). Nordic Bioeconomy. Retrieved: http://www.norden.org/en/theme/nordic-bioeconomy. Access: 15.10.2015.
19. Vanberg, V.J. (2004). The Rationality Postulate in Economics: Its Ambiguity, its Deficiency and its Evolutionary Alternative. Journal of Economic Methodology, Volume 11, Issue 1, pp. 1-29.
20. Wolfe D.A. and Lucas, M. (2005). Global Networks and Local Linkages: The Paradox of Cluster Development in an Open Economy. McGill-Queens University Press for Queen's School of Policy Studies. Montreal and Kingston. p. 183-195.
Proceedings of the 2016 International Conference “ECONOMIC SCIENCE FOR RURAL DEVELOPMENT” No 41
Jelgava, LLU ESAF, 21-22 April 2016, pp. 234-242
21Corresponding authorTel.:+371 29217851 E-mail address: [email protected].
ANALYSIS OF THE FACTORS AFFECTING COST EFFICIENCY IN BEEF PRODUCTION IN LATVIA
Aleksejs Nipers1, Dr.oec.; Irina Pilvere1, Dr.oec.; Agnese Krievina2, Dr.oec.
1 Faculty of Economics and Social Development, Latvia University of Agriculture 2Institute of Agricultural Resources and Economics
Abstract. The overall trends indicate that with increases in the world population and its incomes, the demand for
meat rises. Growth is forecasted in the cattle industry in the countries with large grassland areas and suitable weather
conditions. The European Union (EU) beef and veal sectors are significant: 10 % of the total value of the EU
agricultural production and 13 % of the world beef and veal production. Meat cattle is one of the prospective
agricultural industries in Latvia, as there are appropriate land areas, climatic conditions and experience accumulated
by farms. However, meat production has to be efficient and as cheap as possible. The research aim is to analyse the
beef industry and the factors affecting farm cost efficiency in Latvia. To achieve the aim, the “cost parameter equation
method” was employed to identify beef production efficiency for 50 farms based on the key cost items: labour, land,
capital and intermediate consumption. The research found that beef production costs significantly differed for the
farms in Latvia. The reason was different labour consumption and different capital costs if measured per standard
cattle unit. The farms with low labour consumption and minimum investments in fixed assets were the most efficient
ones.
Key words: beef production, costs, labour, efficiency
JEL code: Q10, Q12
Introduction
From analysis of the Food and Agricultural
Organisation of the United Nations data, it is
clear that there has been a significant increase in
global meat consumption over time driven in part
by a growing world population and income
increases in particular (Henchiona M. et al.,
2014). Francesca Allievi, Markus Vinnari and Jyrki
Luukkanenc (2015) point that “Income per capita
is likely to continue to rise globally, and
traditionally this has led to a shift towards the
consumption of foods with higher content in
animal protein, fats and sugars”. It is agreed by
A.Auzina (2004) who finds that “with household
disposable incomes rising, the demand for meat
and its products increases”.
L.Kristensen, S.Støier, J.Würtz and
L.Hinrichsen (2014) stress that “efficiency all the
way from breeding and farming to processing and
dispatch is crucial for success. Systems for
optimal animal welfare will be even more
important…”.
Growth is forecasted in the cattle industry in
the countries with large grassland areas and
suitable weather conditions, for example, “the
expanding New Zealand dairy cattle industry
represents a huge opportunity to produce surplus
calves for the beef industry both male and
female. Surplus capacity in the dairy industry
could be increasingly utilised to produce more
efficient beef suckler cows” (Morris S. T.,
Kenyon P. R., 2014). “Brazilian beef production is
estimated at 10,935 million tonnes of meat in
2023, representing an increase of almost 29 %
relative to 2013, and 20% of the global market
share” (Lobato J. F. P. et al., 2014). In Uruguay,
there is a great potential to improve the
productivity of grazing livestock systems, by
improving grazing management, and at the same
time reducing GHG emissions, and other
environmental impacts, while conserving
biodiversity (Picasso V. D. et al., 2014).
Milan Zjalic, Antigoni Dimitriadou and
Andrea Rosati (s. a.) from the European
Association for Animal Production emphasise that
the importance of the EU beef and veal sector
goes beyond the economic figures, which alone
are significant: 10 % of the total value of the EU
agricultural production and 13 % of the world
beef and veal production. The social and
environmental role of the sector is equally
important: sustaining rural populations and
Proceedings of the 2016 International Conference “ECONOMIC SCIENCE FOR RURAL DEVELOPMENT” No 41
Jelgava, LLU ESAF, 21-22 April 2016, pp. 234-242
21Corresponding authorTel.:+371 29217851 E-mail address: [email protected].
countryside. Today’s EU Common Agricultural
Policy (CAP) has evolved substantially since these
early efforts and is striving to tackle new
challenges in search of a fairer and greener more
competitive agriculture. The main aims of the
CAP are to improve agricultural productivity, so
that consumers can benefit from a stable supply
of affordable food, while making sure that EU
farmers can make a reasonable living. Since the
early 1980s, there has been a steady downward
trend in the number of livestock on agricultural
holdings across the EU. In 2014, looking at the
EU Member States, Germany, Spain, France and
the United Kingdom held the largest number of
livestock and there have been considerable
structural changes in EU livestock farming since
the 1980s. Smallholders on mixed farms have
gradually given way to larger-scale, specialised
livestock holdings (Eurostat, 2015). In 2003, the
reform of European CAP turned the focus from
quantity to better quality production. The new
aim included an increased attention to
sustainable agriculture and citizens' concerns, in
particular towards “animal welfare” (Serviere J.,
2014). Hanne Marie Nielsen, Ab Groen,
Jorn Pedersen and Peer (2004) point that “also in
a situation with non-profitable bull calf
production, dairy farmers will stop producing beef
from bull calves. In such situations the bull calves
will typically be sold to specialised beef producers
shortly after birth”.
There is potential to increase land use
efficiency both by integrating the unutilised
agricultural area into production and by
exploiting the currently used area more
efficiently. In 2012 in Latvia, permanent
meadows and pastures and grasses sown in
arable land occupied slightly more than 800 thou.
ha or 49 % of the area declared for single area
payments (Pilvere I., Nipers A., 2015), which
created good preconditions for meat cattle
farming. It is particularly important because in
the autumn of 2014 milk purchase prices sharply
fell in Latvia owing to Russia’s embargo on dairy
products, which made farmers search for
alternatives for milk production. Anna Jamieson
(2013) points that meat cattle farming is one of
the most prospective agricultural industries in
Latvia. There are all the necessary preconditions
for it here: an appropriate climate, vast and still
unutilised areas useful for meat cattle farming,
experience in farming and great opportunities to
increase sales both in the domestic and in the
foreign markets. The Ministry of Agriculture of
the Republic of Latvia (2015) emphasises that
the key objective of Latvia’s meat cattle industry
is to produce beef of high value and quality, to
provide domestic consumers with beef produced
in Latvia as well as to increase its
competitiveness and exports.
Juris Plesums, Uldis Ositis, Astrida Runce,
Ilma Ramane, Zinta Gaile and Santa Skuja
(2008) believe that in farm management the
allocation of resources – the practical exploitation
of land and other resources needed in production
– is important, as it is associated with the
principle of use of the better alternative – how to
use inputs, labour, finances and products in the
most efficient way. The task of an
owner/entrepreneur is to identify a combination
of the resources which results in the highest
profit at the current moment or in a short-term.
Therefore, an essential aspect in raising farm
efficiency is cost reduction, as revenues, to a
great extent, depend on exogenous factors.
The research object is beef production in
Latvia, while the research subject is farm cost
indicators in beef production.
The research aim is to analyse the beef
industry and the factors affecting farm cost
efficiency in Latvia. To achieve the aim, the
following specific research tasks were set: 1) to
describe the meat cattle industry in Latvia; 2) to
analyse the key factors affecting farm costs in
beef production.
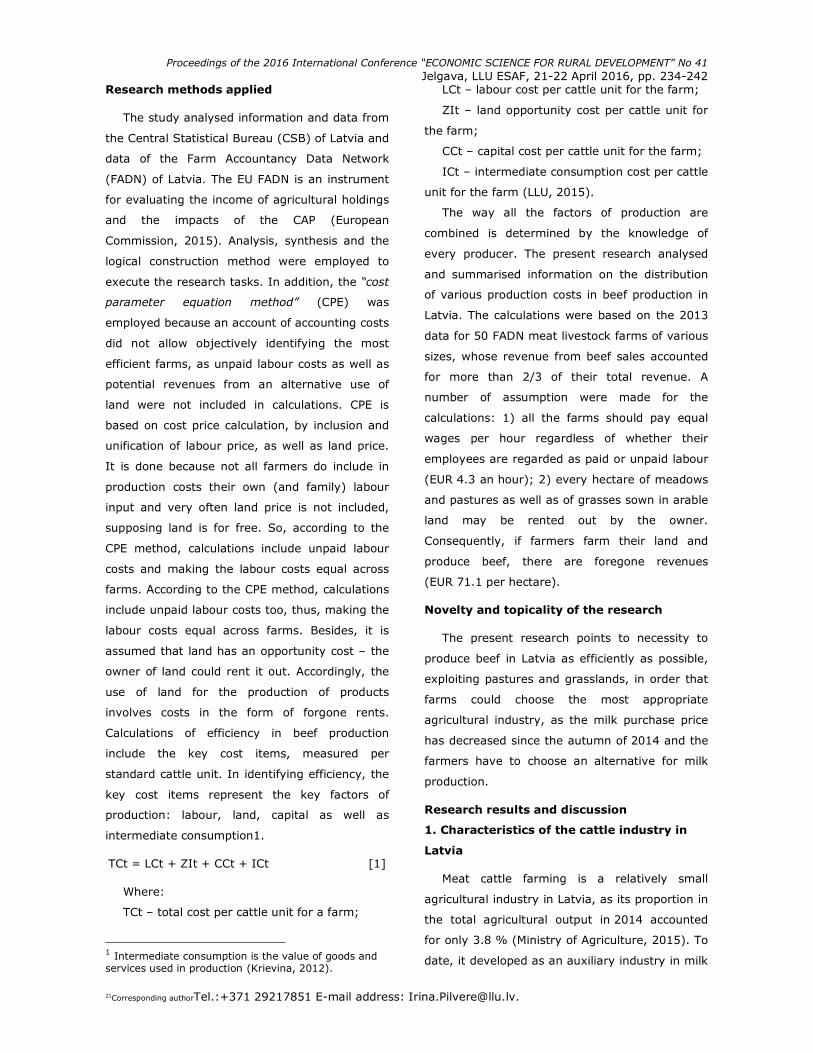
Proceedings of the 2016 International Conference “ECONOMIC SCIENCE FOR RURAL DEVELOPMENT” No 41
Jelgava, LLU ESAF, 21-22 April 2016, pp. 234-242
21Corresponding authorTel.:+371 29217851 E-mail address: [email protected].
Research methods applied
The study analysed information and data from
the Central Statistical Bureau (CSB) of Latvia and
data of the Farm Accountancy Data Network
(FADN) of Latvia. The EU FADN is an instrument
for evaluating the income of agricultural holdings
and the impacts of the CAP (European
Commission, 2015). Analysis, synthesis and the
logical construction method were employed to
execute the research tasks. In addition, the “cost
parameter equation method” (CPE) was
employed because an account of accounting costs
did not allow objectively identifying the most
efficient farms, as unpaid labour costs as well as
potential revenues from an alternative use of
land were not included in calculations. CPE is
based on cost price calculation, by inclusion and
unification of labour price, as well as land price.
It is done because not all farmers do include in
production costs their own (and family) labour
input and very often land price is not included,
supposing land is for free. So, according to the
CPE method, calculations include unpaid labour
costs and making the labour costs equal across
farms. According to the CPE method, calculations
include unpaid labour costs too, thus, making the
labour costs equal across farms. Besides, it is
assumed that land has an opportunity cost – the
owner of land could rent it out. Accordingly, the
use of land for the production of products
involves costs in the form of forgone rents.
Calculations of efficiency in beef production
include the key cost items, measured per
standard cattle unit. In identifying efficiency, the
key cost items represent the key factors of
production: labour, land, capital as well as
intermediate consumption1.
TCt = LCt + ZIt + CCt + ICt [1]
Where:
TCt – total cost per cattle unit for a farm;
1 Intermediate consumption is the value of goods and services used in production (Krievina, 2012).
LCt – labour cost per cattle unit for the farm;
ZIt – land opportunity cost per cattle unit for
the farm;
CCt – capital cost per cattle unit for the farm;
ICt – intermediate consumption cost per cattle
unit for the farm (LLU, 2015).
The way all the factors of production are
combined is determined by the knowledge of
every producer. The present research analysed
and summarised information on the distribution
of various production costs in beef production in
Latvia. The calculations were based on the 2013
data for 50 FADN meat livestock farms of various
sizes, whose revenue from beef sales accounted
for more than 2/3 of their total revenue. A
number of assumption were made for the
calculations: 1) all the farms should pay equal
wages per hour regardless of whether their
employees are regarded as paid or unpaid labour
(EUR 4.3 an hour); 2) every hectare of meadows
and pastures as well as of grasses sown in arable
land may be rented out by the owner.
Consequently, if farmers farm their land and
produce beef, there are foregone revenues
(EUR 71.1 per hectare).
Novelty and topicality of the research
The present research points to necessity to
produce beef in Latvia as efficiently as possible,
exploiting pastures and grasslands, in order that
farms could choose the most appropriate
agricultural industry, as the milk purchase price
has decreased since the autumn of 2014 and the
farmers have to choose an alternative for milk
production.
Research results and discussion
1. Characteristics of the cattle industry in
Latvia
Meat cattle farming is a relatively small
agricultural industry in Latvia, as its proportion in
the total agricultural output in 2014 accounted
for only 3.8 % (Ministry of Agriculture, 2015). To
date, it developed as an auxiliary industry in milk
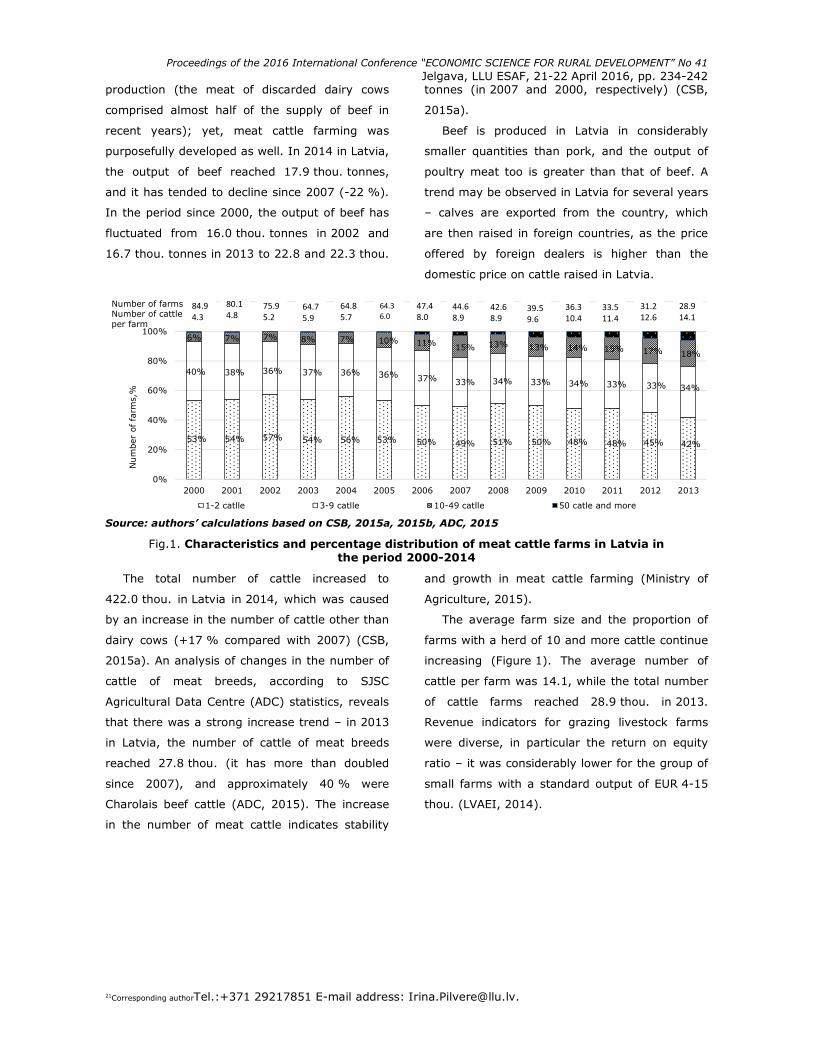
Proceedings of the 2016 International Conference “ECONOMIC SCIENCE FOR RURAL DEVELOPMENT” No 41
Jelgava, LLU ESAF, 21-22 April 2016, pp. 234-242
21Corresponding authorTel.:+371 29217851 E-mail address: [email protected].
production (the meat of discarded dairy cows
comprised almost half of the supply of beef in
recent years); yet, meat cattle farming was
purposefully developed as well. In 2014 in Latvia,
the output of beef reached 17.9 thou. tonnes,
and it has tended to decline since 2007 (-22 %).
In the period since 2000, the output of beef has
fluctuated from 16.0 thou. tonnes in 2002 and
16.7 thou. tonnes in 2013 to 22.8 and 22.3 thou.
tonnes (in 2007 and 2000, respectively) (CSB,
2015a).
Beef is produced in Latvia in considerably
smaller quantities than pork, and the output of
poultry meat too is greater than that of beef. A
trend may be observed in Latvia for several years
– calves are exported from the country, which
are then raised in foreign countries, as the price
offered by foreign dealers is higher than the
domestic price on cattle raised in Latvia.
53% 54% 57% 54% 56% 53% 50% 49% 51% 50% 48% 48% 45% 42%
40% 38% 36% 37% 36% 36% 37% 33% 34% 33% 34% 33% 33% 34%
6% 7% 7% 8% 7% 10% 11% 15% 13% 13% 14% 15% 17% 18%
0%
20%
40%
60%
80%
100%
120%
2000 2001 2002 2003 2004 2005 2006 2007 2008 2009 2010 2011 2012 2013
1-2 catlle 3-9 catlle 10-49 catlle 50 catle and more
Number of farmsNumber of cattle per farm
Number of farm
s,%
84.9
4.3
64.8
5.7
64.7
5.9
80.1
4.875.9
5.2
64.3
6.0
47.4
8.0
44.6
8.9
42.6
8.939.5
9.6
36.3
10.4
33.5
11.4
31.2
12.6
28.9
14.1
Source: authors’ calculations based on CSB, 2015a, 2015b, ADC, 2015
Fig.1. Characteristics and percentage distribution of meat cattle farms in Latvia in the period 2000-2014
The total number of cattle increased to
422.0 thou. in Latvia in 2014, which was caused
by an increase in the number of cattle other than
dairy cows (+17 % compared with 2007) (CSB,
2015a). An analysis of changes in the number of
cattle of meat breeds, according to SJSC
Agricultural Data Centre (ADC) statistics, reveals
that there was a strong increase trend – in 2013
in Latvia, the number of cattle of meat breeds
reached 27.8 thou. (it has more than doubled
since 2007), and approximately 40 % were
Charolais beef cattle (ADC, 2015). The increase
in the number of meat cattle indicates stability
and growth in meat cattle farming (Ministry of
Agriculture, 2015).
The average farm size and the proportion of
farms with a herd of 10 and more cattle continue
increasing (Figure 1). The average number of
cattle per farm was 14.1, while the total number
of cattle farms reached 28.9 thou. in 2013.
Revenue indicators for grazing livestock farms
were diverse, in particular the return on equity
ratio – it was considerably lower for the group of
small farms with a standard output of EUR 4-15
thou. (LVAEI, 2014).
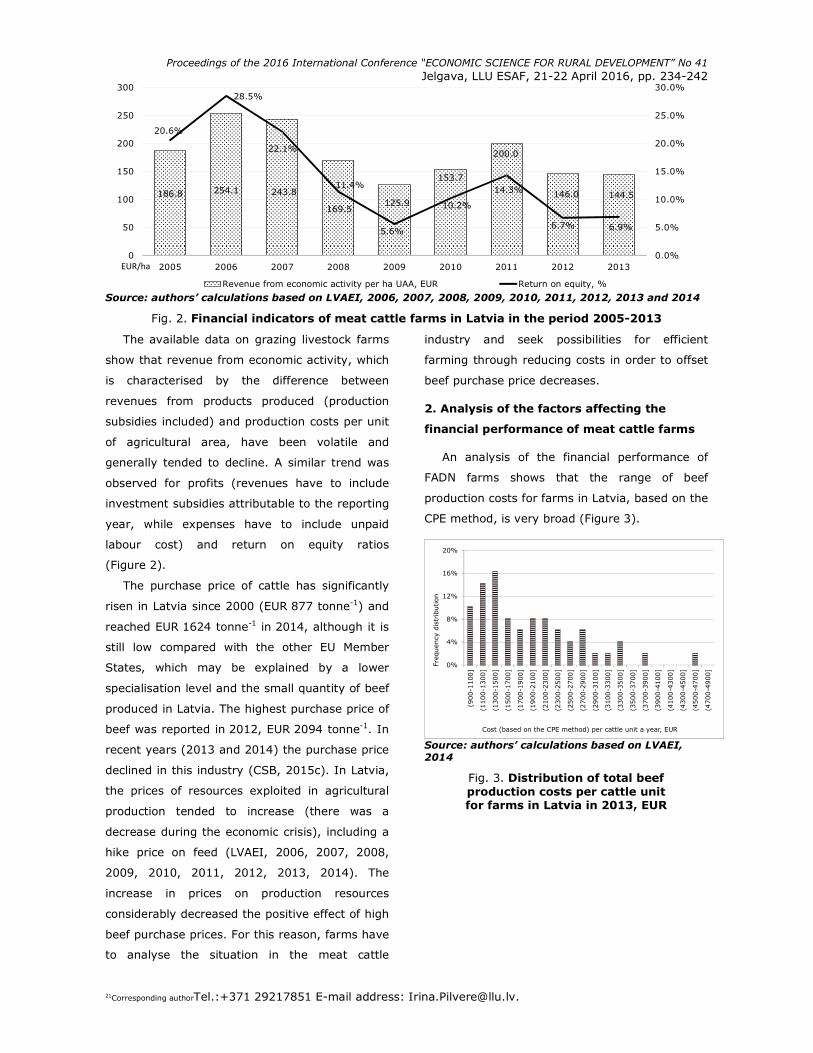
Proceedings of the 2016 International Conference “ECONOMIC SCIENCE FOR RURAL DEVELOPMENT” No 41
Jelgava, LLU ESAF, 21-22 April 2016, pp. 234-242
21Corresponding authorTel.:+371 29217851 E-mail address: [email protected].
186.8 254.1 243.8
169.5125.9
153.7
200.0
146.0 144.5
20.6%
28.5%
22.1%
11.4%
5.6%
10.2%
14.3%
6.7% 6.9%
0.0%
5.0%
10.0%
15.0%
20.0%
25.0%
30.0%
0
50
100
150
200
250
300
2005 2006 2007 2008 2009 2010 2011 2012 2013
Revenue from economic activity per ha UAA, EUR Return on equity, %
EUR/ha
Source: authors’ calculations based on LVAEI, 2006, 2007, 2008, 2009, 2010, 2011, 2012, 2013 and 2014
Fig. 2. Financial indicators of meat cattle farms in Latvia in the period 2005-2013
The available data on grazing livestock farms
show that revenue from economic activity, which
is characterised by the difference between
revenues from products produced (production
subsidies included) and production costs per unit
of agricultural area, have been volatile and
generally tended to decline. A similar trend was
observed for profits (revenues have to include
investment subsidies attributable to the reporting
year, while expenses have to include unpaid
labour cost) and return on equity ratios
(Figure 2).
The purchase price of cattle has significantly
risen in Latvia since 2000 (EUR 877 tonne-1) and
reached EUR 1624 tonne-1 in 2014, although it is
still low compared with the other EU Member
States, which may be explained by a lower
specialisation level and the small quantity of beef
produced in Latvia. The highest purchase price of
beef was reported in 2012, EUR 2094 tonne-1. In
recent years (2013 and 2014) the purchase price
declined in this industry (CSB, 2015c). In Latvia,
the prices of resources exploited in agricultural
production tended to increase (there was a
decrease during the economic crisis), including a
hike price on feed (LVAEI, 2006, 2007, 2008,
2009, 2010, 2011, 2012, 2013, 2014). The
increase in prices on production resources
considerably decreased the positive effect of high
beef purchase prices. For this reason, farms have
to analyse the situation in the meat cattle
industry and seek possibilities for efficient
farming through reducing costs in order to offset
beef purchase price decreases.
2. Analysis of the factors affecting the
financial performance of meat cattle farms
An analysis of the financial performance of
FADN farms shows that the range of beef
production costs for farms in Latvia, based on the
CPE method, is very broad (Figure 3).
0%
4%
8%
12%
16%
20%
(900-1100]
(1100-1300]
(1300-1500]
(1500-1700]
(1700-1900]
(1900-2100]
(2100-2300]
(2300-2500]
(2500-2700]
(2700-2900]
(2900-3100]
(3100-3300]
(3300-3500]
(3500-3700]
(3700-3900]
(3900-4100]
(4100-4300]
(4300-4500]
(4500-4700]
(4700-4900]
Frequency distribution
Cost (based on the CPE method) per cattle unit a year, EUR
Source: authors’ calculations based on LVAEI, 2014
Fig. 3. Distribution of total beef production costs per cattle unit for farms in Latvia in 2013, EUR
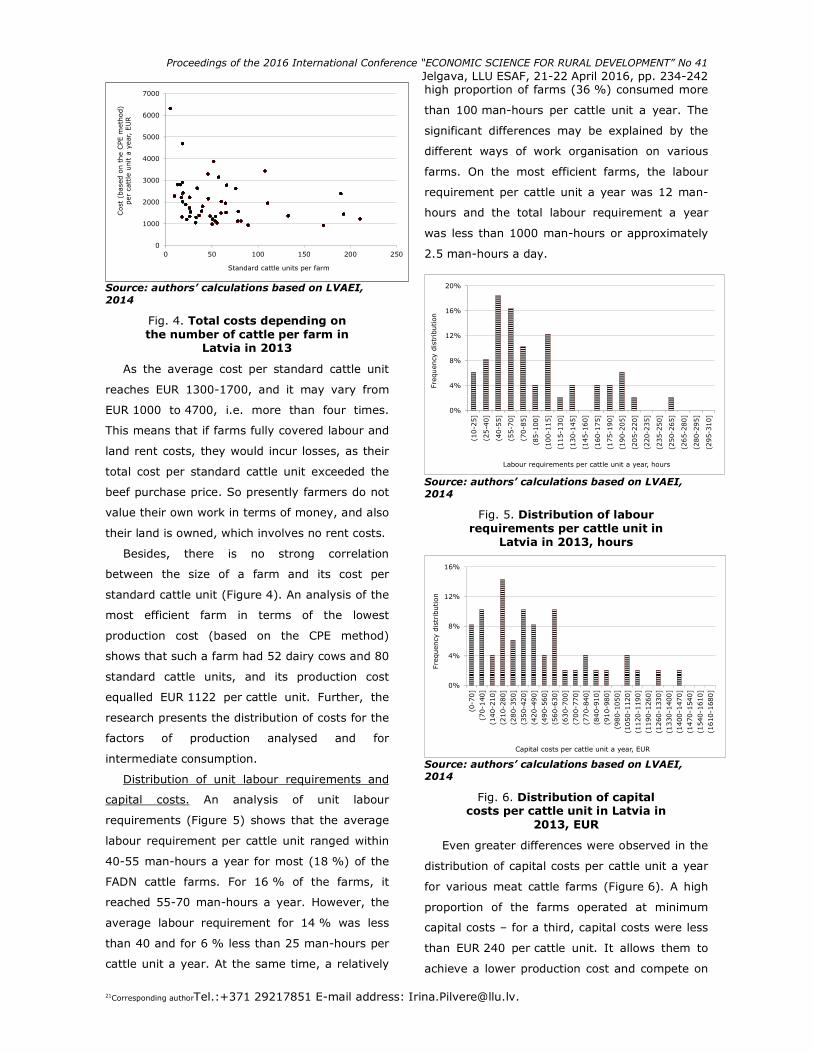
Proceedings of the 2016 International Conference “ECONOMIC SCIENCE FOR RURAL DEVELOPMENT” No 41
Jelgava, LLU ESAF, 21-22 April 2016, pp. 234-242
21Corresponding authorTel.:+371 29217851 E-mail address: [email protected].
0
1000
2000
3000
4000
5000
6000
7000
0 50 100 150 200 250
Cost (based on the CPE m
ethod)
per cattle unit a year, EUR
Standard cattle units per farm
Source: authors’ calculations based on LVAEI, 2014
Fig. 4. Total costs depending on the number of cattle per farm in
Latvia in 2013
As the average cost per standard cattle unit
reaches EUR 1300-1700, and it may vary from
EUR 1000 to 4700, i.e. more than four times.
This means that if farms fully covered labour and
land rent costs, they would incur losses, as their
total cost per standard cattle unit exceeded the
beef purchase price. So presently farmers do not
value their own work in terms of money, and also
their land is owned, which involves no rent costs.
Besides, there is no strong correlation
between the size of a farm and its cost per
standard cattle unit (Figure 4). An analysis of the
most efficient farm in terms of the lowest
production cost (based on the CPE method)
shows that such a farm had 52 dairy cows and 80
standard cattle units, and its production cost
equalled EUR 1122 per cattle unit. Further, the
research presents the distribution of costs for the
factors of production analysed and for
intermediate consumption.
Distribution of unit labour requirements and
capital costs. An analysis of unit labour
requirements (Figure 5) shows that the average
labour requirement per cattle unit ranged within
40-55 man-hours a year for most (18 %) of the
FADN cattle farms. For 16 % of the farms, it
reached 55-70 man-hours a year. However, the
average labour requirement for 14 % was less
than 40 and for 6 % less than 25 man-hours per
cattle unit a year. At the same time, a relatively
high proportion of farms (36 %) consumed more
than 100 man-hours per cattle unit a year. The
significant differences may be explained by the
different ways of work organisation on various
farms. On the most efficient farms, the labour
requirement per cattle unit a year was 12 man-
hours and the total labour requirement a year
was less than 1000 man-hours or approximately
2.5 man-hours a day.
0%
4%
8%
12%
16%
20%
(10-25]
(25-40]
(40-55]
(55-70]
(70-85]
(85-100]
(100-115]
(115-130]
(130-145]
(145-160]
(160-175]
(175-190]
(190-205]
(205-220]
(220-235]
(235-250]
(250-265]
(265-280]
(280-295]
(295-310]
Frequency distribution
Labour requirements per cattle unit a year, hours
Source: authors’ calculations based on LVAEI, 2014
Fig. 5. Distribution of labour requirements per cattle unit in
Latvia in 2013, hours
0%
4%
8%
12%
16%
(0-70]
(70-140]
(140-210]
(210-280]
(280-350]
(350-420]
(420-490]
(490-560]
(560-630]
(630-700]
(700-770]
(770-840]
(840-910]
(910-980]
(980-1050]
(1050-1120]
(1120-1190]
(1190-1260]
(1260-1330]
(1330-1400]
(1400-1470]
(1470-1540]
(1540-1610]
(1610-1680]
Frequency distribution
Capital costs per cattle unit a year, EUR
Source: authors’ calculations based on LVAEI, 2014
Fig. 6. Distribution of capital costs per cattle unit in Latvia in
2013, EUR
Even greater differences were observed in the
distribution of capital costs per cattle unit a year
for various meat cattle farms (Figure 6). A high
proportion of the farms operated at minimum
capital costs – for a third, capital costs were less
than EUR 240 per cattle unit. It allows them to
achieve a lower production cost and compete on
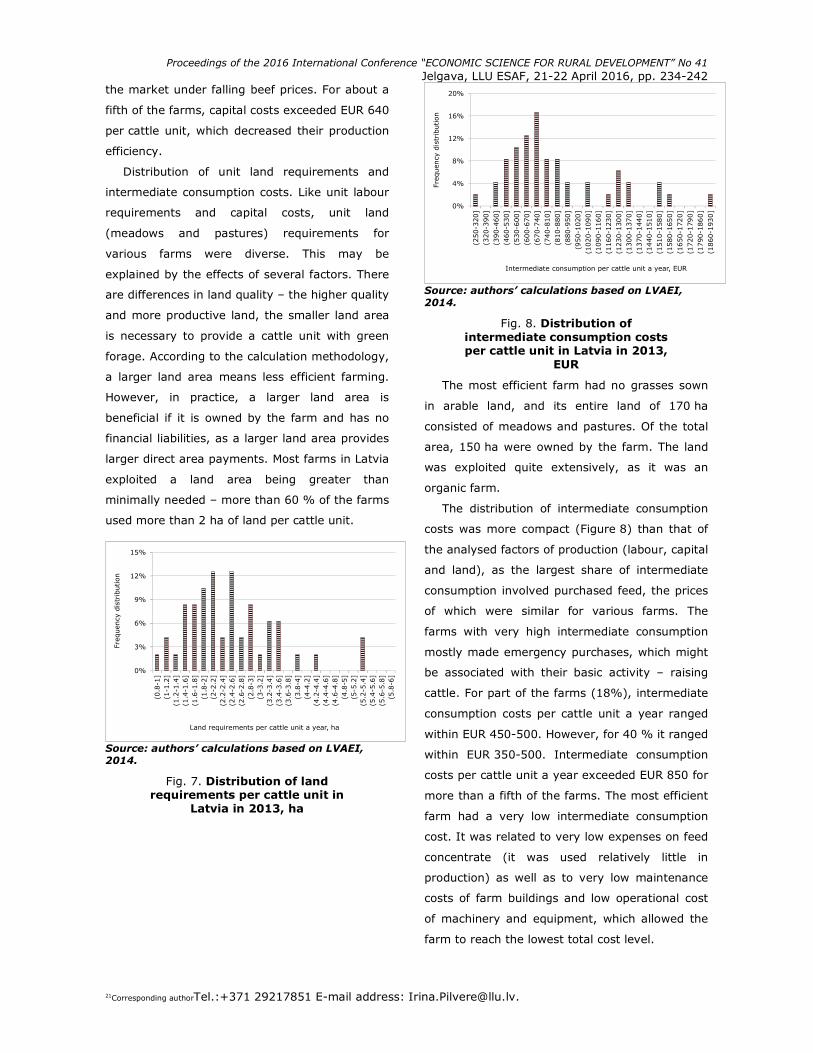
Proceedings of the 2016 International Conference “ECONOMIC SCIENCE FOR RURAL DEVELOPMENT” No 41
Jelgava, LLU ESAF, 21-22 April 2016, pp. 234-242
21Corresponding authorTel.:+371 29217851 E-mail address: [email protected].
the market under falling beef prices. For about a
fifth of the farms, capital costs exceeded EUR 640
per cattle unit, which decreased their production
efficiency.
Distribution of unit land requirements and
intermediate consumption costs. Like unit labour
requirements and capital costs, unit land
(meadows and pastures) requirements for
various farms were diverse. This may be
explained by the effects of several factors. There
are differences in land quality – the higher quality
and more productive land, the smaller land area
is necessary to provide a cattle unit with green
forage. According to the calculation methodology,
a larger land area means less efficient farming.
However, in practice, a larger land area is
beneficial if it is owned by the farm and has no
financial liabilities, as a larger land area provides
larger direct area payments. Most farms in Latvia
exploited a land area being greater than
minimally needed – more than 60 % of the farms
used more than 2 ha of land per cattle unit.
0%
3%
6%
9%
12%
15%
(0.8-1]
(1-1.2]
(1.2-1.4]
(1.4-1.6]
(1.6-1.8]
(1.8-2]
(2-2.2]
(2.2-2.4]
(2.4-2.6]
(2.6-2.8]
(2.8-3]
(3-3.2]
(3.2-3.4]
(3.4-3.6]
(3.6-3.8]
(3.8-4]
(4-4.2]
(4.2-4.4]
(4.4-4.6]
(4.6-4.8]
(4.8-5]
(5-5.2]
(5.2-5.4]
(5.4-5.6]
(5.6-5.8]
(5.8-6]
Frequency distribution
Land requirements per cattle unit a year, ha
Source: authors’ calculations based on LVAEI, 2014.
Fig. 7. Distribution of land requirements per cattle unit in
Latvia in 2013, ha
0%
4%
8%
12%
16%
20%
(250-320]
(320-390]
(390-460]
(460-530]
(530-600]
(600-670]
(670-740]
(740-810]
(810-880]
(880-950]
(950-1020]
(1020-1090]
(1090-1160]
(1160-1230]
(1230-1300]
(1300-1370]
(1370-1440]
(1440-1510]
(1510-1580]
(1580-1650]
(1650-1720]
(1720-1790]
(1790-1860]
(1860-1930]
Frequency distribution
Intermediate consumption per cattle unit a year, EUR
Source: authors’ calculations based on LVAEI, 2014.
Fig. 8. Distribution of intermediate consumption costs per cattle unit in Latvia in 2013,
EUR
The most efficient farm had no grasses sown
in arable land, and its entire land of 170 ha
consisted of meadows and pastures. Of the total
area, 150 ha were owned by the farm. The land
was exploited quite extensively, as it was an
organic farm.
The distribution of intermediate consumption
costs was more compact (Figure 8) than that of
the analysed factors of production (labour, capital
and land), as the largest share of intermediate
consumption involved purchased feed, the prices
of which were similar for various farms. The
farms with very high intermediate consumption
mostly made emergency purchases, which might
be associated with their basic activity – raising
cattle. For part of the farms (18%), intermediate
consumption costs per cattle unit a year ranged
within EUR 450-500. However, for 40 % it ranged
within EUR 350-500. Intermediate consumption
costs per cattle unit a year exceeded EUR 850 for
more than a fifth of the farms. The most efficient
farm had a very low intermediate consumption
cost. It was related to very low expenses on feed
concentrate (it was used relatively little in
production) as well as to very low maintenance
costs of farm buildings and low operational cost
of machinery and equipment, which allowed the
farm to reach the lowest total cost level.
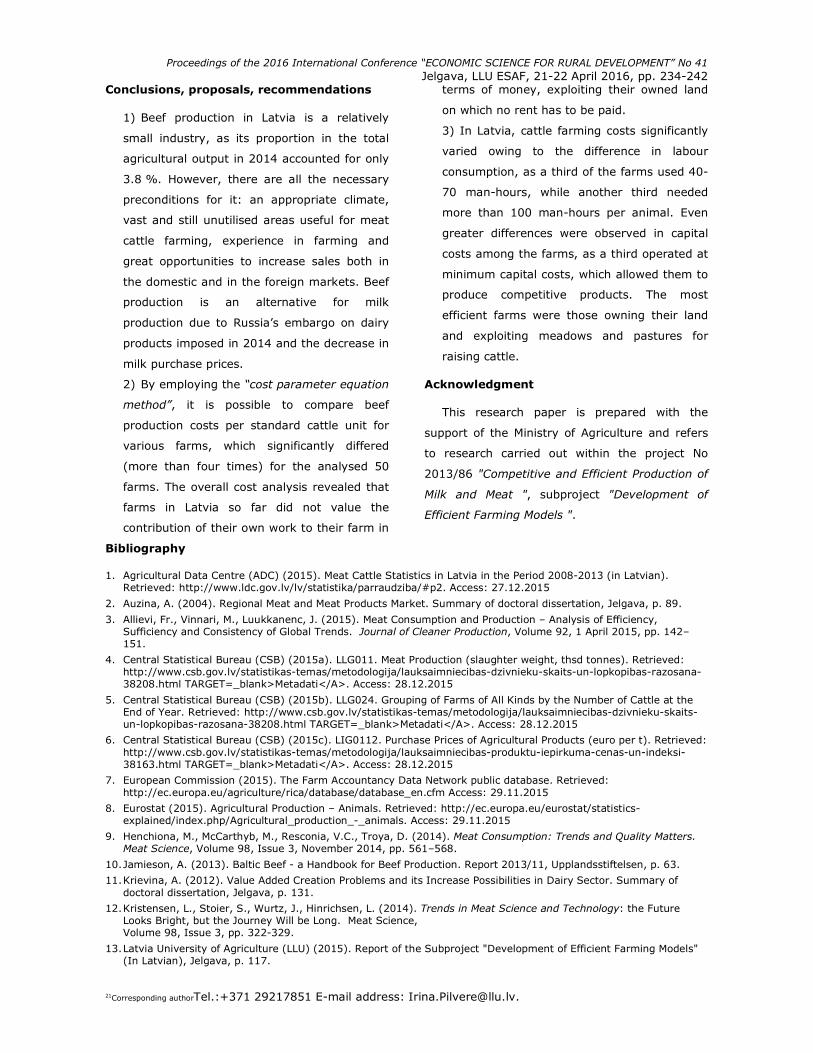
Proceedings of the 2016 International Conference “ECONOMIC SCIENCE FOR RURAL DEVELOPMENT” No 41
Jelgava, LLU ESAF, 21-22 April 2016, pp. 234-242
21Corresponding authorTel.:+371 29217851 E-mail address: [email protected].
Conclusions, proposals, recommendations
1) Beef production in Latvia is a relatively
small industry, as its proportion in the total
agricultural output in 2014 accounted for only
3.8 %. However, there are all the necessary
preconditions for it: an appropriate climate,
vast and still unutilised areas useful for meat
cattle farming, experience in farming and
great opportunities to increase sales both in
the domestic and in the foreign markets. Beef
production is an alternative for milk
production due to Russia’s embargo on dairy
products imposed in 2014 and the decrease in
milk purchase prices.
2) By employing the “cost parameter equation
method”, it is possible to compare beef
production costs per standard cattle unit for
various farms, which significantly differed
(more than four times) for the analysed 50
farms. The overall cost analysis revealed that
farms in Latvia so far did not value the
contribution of their own work to their farm in
terms of money, exploiting their owned land
on which no rent has to be paid.
3) In Latvia, cattle farming costs significantly
varied owing to the difference in labour
consumption, as a third of the farms used 40-
70 man-hours, while another third needed
more than 100 man-hours per animal. Even
greater differences were observed in capital
costs among the farms, as a third operated at
minimum capital costs, which allowed them to
produce competitive products. The most
efficient farms were those owning their land
and exploiting meadows and pastures for
raising cattle.
Acknowledgment
This research paper is prepared with the
support of the Ministry of Agriculture and refers
to research carried out within the project No
2013/86 "Competitive and Efficient Production of
Milk and Meat ", subproject "Development of
Efficient Farming Models ".
Bibliography
1. Agricultural Data Centre (ADC) (2015). Meat Cattle Statistics in Latvia in the Period 2008-2013 (in Latvian). Retrieved: http://www.ldc.gov.lv/lv/statistika/parraudziba/#p2. Access: 27.12.2015
2. Auzina, A. (2004). Regional Meat and Meat Products Market. Summary of doctoral dissertation, Jelgava, p. 89.
3. Allievi, Fr., Vinnari, M., Luukkanenc, J. (2015). Meat Consumption and Production – Analysis of Efficiency, Sufficiency and Consistency of Global Trends. Journal of Cleaner Production, Volume 92, 1 April 2015, pp. 142–151.
4. Central Statistical Bureau (CSB) (2015a). LLG011. Meat Production (slaughter weight, thsd tonnes). Retrieved: http://www.csb.gov.lv/statistikas-temas/metodologija/lauksaimniecibas-dzivnieku-skaits-un-lopkopibas-razosana-38208.html TARGET=_blank>Metadati</A>. Access: 28.12.2015
5. Central Statistical Bureau (CSB) (2015b). LLG024. Grouping of Farms of All Kinds by the Number of Cattle at the End of Year. Retrieved: http://www.csb.gov.lv/statistikas-temas/metodologija/lauksaimniecibas-dzivnieku-skaits-un-lopkopibas-razosana-38208.html TARGET=_blank>Metadati</A>. Access: 28.12.2015
6. Central Statistical Bureau (CSB) (2015c). LIG0112. Purchase Prices of Agricultural Products (euro per t). Retrieved: http://www.csb.gov.lv/statistikas-temas/metodologija/lauksaimniecibas-produktu-iepirkuma-cenas-un-indeksi-38163.html TARGET=_blank>Metadati</A>. Access: 28.12.2015
7. European Commission (2015). The Farm Accountancy Data Network public database. Retrieved: http://ec.europa.eu/agriculture/rica/database/database_en.cfm Access: 29.11.2015
8. Eurostat (2015). Agricultural Production – Animals. Retrieved: http://ec.europa.eu/eurostat/statistics-explained/index.php/Agricultural_production_-_animals. Access: 29.11.2015
9. Henchiona, M., McCarthyb, M., Resconia, V.C., Troya, D. (2014). Meat Consumption: Trends and Quality Matters. Meat Science, Volume 98, Issue 3, November 2014, pp. 561–568.
10. Jamieson, A. (2013). Baltic Beef - a Handbook for Beef Production. Report 2013/11, Upplandsstiftelsen, p. 63.
11. Krievina, A. (2012). Value Added Creation Problems and its Increase Possibilities in Dairy Sector. Summary of doctoral dissertation, Jelgava, p. 131.
12. Kristensen, L., Stoier, S., Wurtz, J., Hinrichsen, L. (2014). Trends in Meat Science and Technology: the Future Looks Bright, but the Journey Will be Long. Meat Science, Volume 98, Issue 3, pp. 322-329.
13. Latvia University of Agriculture (LLU) (2015). Report of the Subproject "Development of Efficient Farming Models" (In Latvian), Jelgava, p. 117.
Proceedings of the 2016 International Conference “ECONOMIC SCIENCE FOR RURAL DEVELOPMENT” No 41
Jelgava, LLU ESAF, 21-22 April 2016, pp. 234-242
21Corresponding authorTel.:+371 29217851 E-mail address: [email protected].
14. Latvian State Institute of Agrarian Economics (LVAEI) (2006). Agricultural Holdings. Results of Economic Analysis 2005 (FADN) (in Latvian), Riga, pp.144-209.
15. Latvian State Institute of Agrarian Economics (LVAEI) (2007). Agricultural Holdings. Results of Economic Analysis 2006 (FADN) (in Latvian), Riga, pp. 136-201.
16. Latvian State Institute of Agrarian Economics (LVAEI) (2008). Agricultural Holdings. Results of Economic Analysis 2007 (FADN) (in Latvian), Riga, Retrieved: https://sudat.lvaei.lv/Login.aspx?ReturnUrl=%2fDefault.aspx. Access: 14.12.2015
17. Latvian State Institute of Agrarian Economics (LVAEI) (2009). Agricultural Holdings. Results of Economic Analysis 2008 (FADN) (in Latvian), Riga, Retrieved: https://sudat.lvaei.lv/Login.aspx?ReturnUrl=%2fDefault.aspx. Access: 14.12.2015
18. Latvian State Institute of Agrarian Economics (LVAEI) (2010). Agricultural Holdings. Results of Economic Analysis 2009 (FADN) (in Latvian), Riga, Retrieved: https://sudat.lvaei.lv/Login.aspx?ReturnUrl=%2fDefault.aspx. Access: 14.12.2015
19. Latvian State Institute of Agrarian Economics (LVAEI) (2011). Agricultural Holdings. Results of Economic Analysis 2010 (FADN) (in Latvian), Riga, Retrieved: https://sudat.lvaei.lv/Login.aspx?ReturnUrl=%2fDefault.aspx. Access: 14.12.2015
20. Latvian State Institute of Agrarian Economics (LVAEI) (2012). Agricultural Holdings. Results of Economic Analysis 2011 (FADN) (in Latvian), Riga, Retrieved: https://sudat.lvaei.lv/Login.aspx?ReturnUrl=%2fDefault.aspx. Access: 14.12.2015
21. Latvian State Institute of Agrarian Economics (LVAEI) (2013). Agricultural Holdings. Results of Economic Analysis 2012 (FADN) (in Latvian), Riga, Retrieved: https://sudat.lvaei.lv/Login.aspx?ReturnUrl=%2fDefault.aspx. Access: 14.12.2015
22. Latvian State Institute of Agrarian Economics (LVAEI) (2014). Agricultural Holdings. Results of Economic Analysis 2013 (FADN) (in Latvian), Riga, Retrieved: https://sudat.lvaei.lv/Login.aspx?ReturnUrl=%2fDefault.aspx. Access: 14.12.2015
23. Lobato, J.F.P., Freitas, A.K., Devincenzi, T., Cardoso, L.L., Tarouco, J.U., Vieira, R.M., Dillenburg, D.R., Castro, I. (2014). Brazilian Beef Produced on Pastures: Sustainable and Healthy. Meat Science, Volume 98, Issue 3, pp. 336–345.
24. Ministry of Agriculture (2015). Agriculture of Latvia 2015. Riga, p. 156.
25. Morris, S.T., Kenyon, P.R. (2014). Intensive Sheep and Beef Production from Pasture — A New Zealand Perspective of Concerns, Opportunities and Challenges. Meat Science, Volume 98, Issue 3, pp. 330–335.
26. Nielsen, H. M., Grocn, A., Pedersen, J., Berg, P. (2004). Stochastic Simulation of Economic Values and their Standard Deviations for Production and Functional Traits in Dairy Cattle under Current and Future Danish Production Circumstances. Acta Agriculturae Scandinavica: Section A, Animal Science 54, No. 3, pp. 113-126.
27. Picasso, V.D., Modernel, P.D., Becona, G., Salvo, L., Gutierrez, L., Astigarraga, L. (2014). Sustainability of Meat Production beyond Carbon Footprint: a Synthesis of Case Studies from Grazing Systems in Uruguay. Meat Science, Volume 98, Issue 3, pp. 346–354.
28. Pilvere, I., Nipers, A. (2015) Agricultural and Forest Lands in Latvia: an Analytic Assessment of their Use Potential (in Latvian). Latvia University of Agriculture, Jelgava, Drukatava LLC, p. 245.
29. Plesums, J., Ositis, U., Runce, A., Ramane, I., Gaile, Z., Skuja, S. (2008). Meat Cattle in Latvia (in Latvian). p. 143.
30. Serviere J. (2014). Science and Animal Welfare in France and the European Union: Rules, Constraints, Achievements. Meat Science, Volume 98, Issue 3, pp. 484–489.
31. Zjalic, M., Dimitriadou, A., Rosati, A (s.a.). Beef Production in the European Union and the CAP Reform. An Overview of Situation and Trends. Retrieved: http://www.cattlenetwork.net/docs/eu/EU_Beef_sum_web.pdf Access: 29.12.2015
Proceedings of the 2016 International Conference “ECONOMIC SCIENCE FOR RURAL DEVELOPMENT” No 41
Jelgava, LLU ESAF, 21-22 April 2016, pp. 243-251
1Corresponding author. E-mail address: [email protected] 243
ENVIRONMENTAL CHANGES IN THE POLISH AGRICULTURE - TOWARD THE BIO-ECONOMY Tomasz Pajewski1, MA
1Department of Economics and Organisation of Enterprises, Faculty of Economic Sciences, Warsaw University of Live Sciences
Abstract. This paper attempts to provide an interdisciplinary concept of the bio-economy in the context of
environmental changes in the Polish agriculture. Various definitions of bio-economy have been presented and its place
in the sustainable development theory have been described. The aim of this paper is to present the environmental
changes in Polish agriculture in the context of the bio-economy. For this purpose uses the information published by the
Central Statistical Office and Eurostat. To showcase and presentation methods were used descriptive and tabular. The
empirical part presents changes of the essential elements characterising the agricultural sector, in particular, in terms
of its impact on the natural environment. An attempt has been made to discuss the changes in the context of the
implementation of the principles of sustainable development as well as development of bio-economy in the agricultural
sector.
Keywords: bio-economy, sustainable development of agriculture, environment.
JEL code: Q56, Q57
Introduction
The assumptions of the concept of sustainable
development have become nowadays essential to
every area of the national economy. There is no
question of taking any action related to the
functioning of the state and development of any
individual sector without taking into account
these principles. But it is not easy to take
measures, which would bring simultaneously the
benefits in three different aspects considered in
sustainable development, i.e. its economic, social
and environmental aspect. Particular emphasis in
the assumptions of sustainable development is
put on activities in the agricultural sector, mainly
because of its specific nature associated with
production of food. Increasing1 production of
high-quality agricultural raw materials, while
ensuring the economic viability of farms,
preserving natural environment from the
negative effects of farming and ensuring decent
social conditions to the rural population, are big
challenges. An agreement between the economic,
social and environmental dimensions is possible
through interdisciplinary concept of bio-economy,
1 Increasing agricultural production on the global scale is inevitable due to the growing population, and, as a consequence, higher and higher demand for food.
which with its assumptions is in line with the
theory of sustainable development.
The aim of this article is to present of
environmental changes in Polish agriculture,
through the analysis of the data contained in
public databases like the Central Statistical Office
and Eurostat. Discussion on the values discussed
was directed towards a new and popular theory
bioeconomy. An attempt was made to discuss the
changes in Polish agriculture on the example of
the specific data in the context of the theory of
bio-economy. Research tasks in the article are to
show changes in the main areas of agricultural
activities which have the greatest impact on the
environment. This is to show the changes taking
place in agriculture in the context of
environmental
Research materials and research method
The article presents the changes in Polish
agriculture in terms of the impact on the
environment. Considered the data presented in
the context of a developing trend bio-economy.
Different approaches to defining the problem
being the subject of the paper based on literature
on the subject have been discussed.
The empirical part focuses on various aspects
of activity of the Polish agricultural sector in
terms of impact on the natural environment.
Proceedings of the 2016 International Conference “ECONOMIC SCIENCE FOR RURAL DEVELOPMENT” No 41
Jelgava, LLU ESAF, 21-22 April 2016, pp. 243-251
1Corresponding author. E-mail address: [email protected] 244
Research objects were Polish farms characterized
by national statistics. Farm is defined as a unit
separate from the technical and economical,
having a separate management (user or
manager) and an agricultural activity
(Charakterystyka gospodarstw…2014). The
information related to changes in the structure of
agricultural land in Poland, pollutants emitted
into the atmosphere and use of mineral and lime
fertilisers as well as plant protection products by
agricultural sector has been used. The data
published by the Central Statistical Office (GUS)
and Eurostat have been used as the research
materials. In the analysis, a descriptive method
has been applied and the results have been
shown in tabular and graphical form.
Bio-economy in agriculture
There are many definitions of the essence of
bio-economy. It should be noted, however, that
despite the differences in the approach to this
issue, all the authors emphasise that the primary
differentiator is the use of natural resources in
the production process while preserving the
original environment (Pajewski T., 2014). Indeed,
this concept is in line with the assumptions of
development of sustainable agriculture, which
according to Krasowicz, are characterised by
"rational use of agricultural production
environment and maintenance of production
potential of soil, which ensures food self-
sufficiency of the country and safe food. In
addition, they are characterised by production of
raw materials with desired quality parameters
expected by the consumers and the industry, at
the same time reducing or eliminating the threats
to the environment. In the effect carrying out
sustainable agricultural production would make it
possible for agriculture to bring profitability
comparable to other sectors of the economy and
provide funds for modernisation and
development” (Krasowicz S., 2005).
Golebiewski describes bio-economy as set of
sectors of the national economy, which deal with
production, processing and use of resources of
the biological origin. In defining this term, he
highlights the issue of sustainable use of
resources. According to Golebiewski, the term
"bio-economy” means sustainable production and
conversion of biomass in relation to food, health,
fibres, industrial products and energy, where the
renewable resources of biomass include any
biological resource, which can be used as a raw
material. Bio-economy sector includes
agriculture, forestry, food industry, fishing and
fisheries, chemical, pharmaceutical, cosmetic and
textile industries and energy production based on
use of biomass as the main raw material
(Golebiewski, 2013). The holistic nature of bio-
economy in the context of the national economy
is also described by Chylek. The author
underlines that bio-economy covers virtually all
sectors of the economy and the related services,
which produce, process or make use of biological
resources in any form. For the author, in addition
to business and production aspects, also a
theoretical aspect is important, because it makes
it possible to define and implement innovative
solutions. According to Chylek, bio-economy
combines intensive research in many fields of
science with innovative and comprehensive use
of renewable raw materials, which come from the
world of plants, animals and micro-organisms. In
addition, bio-economy constitutes a strategic,
trans-sectoral, integrating activity having an
influence on economic development, which is in
line with multidisciplinary approach to the rules
of research funding (Chylek E. K., 2012).
A synthetic definition of bio-economy can be
found in the report " The Knowledge Based Bio-
Economy (KBBE) in Europe: Achievements and
Challenges. Full report. 2010). The concept of
bio-economy is described there as sustainable
production and use of renewable biomass for
food production, health, production of dietary
fibre, industrial products and energy. Renewable
biomass is defined here as any biological
Proceedings of the 2016 International Conference “ECONOMIC SCIENCE FOR RURAL DEVELOPMENT” No 41
Jelgava, LLU ESAF, 21-22 April 2016, pp. 243-251
1Corresponding author. E-mail address: [email protected] 245
resource that can be used as a raw material
(The Knowledge…2010).
It can be noted that in the presented
definitions the concept of bio-economy is based
on the interdisciplinary approach of the
representatives of the academic, business and
administration environment2 used in creating
solutions, which, if developed, allow for the
implementation of the objectives of sustainable
development of the economy. A foundation of
bio-economy is efficient use of natural resources
to meet the needs of the population without
affecting the environment. Therefore, we can see
how important the agricultural sector and the
conservation of resources should be in discussion
of implementation of the bio-economy concept.
Agriculture is a key sector of the economy due to
the produced raw materials and the use of
natural resources, thus, their more efficient use
in terms of environment protection is currently
the subject of lively debate both in the European
Union and globally.
The specifics of the agricultural sector are
emphasised by Walenia who highlights direct and
strong ties of the agriculture with natural
environment due to the use of living organisms of
plants and animals in the production process and
due to shaping the natural environment. He sees
its uniqueness also in constant evolution
consisting in systematic search of such a farming
model, which fills its basic function, which is the
production of agricultural products intended
directly for consumption or for processing within
the agri-food industry, and is well harmonised
with the whole economy, at the same time
following the principles of environmental
protection, the principles of sustainable
development. This phenomenon can also be seen
in the emerging new functions of this sector. It is
worth mentioning here production of biomass for
production of renewable energy, protecting the
environment and biodiversity as well as
2 Cooperation in the area of science, business, administration is called the triple helix model
increasing landscape values (Walenia A., 2009).
New functions of the agriculture stem from many
factors; nonetheless it seems that a primary one
is growing awareness of the public as to the
value of the natural environment and as to the
related phenomena, which are characterised by
the society-environment relationship.
Environmental protection depends to a large
extent on the policy of the State. The policy
specifies the framework, which agricultural
producers should move within, when it comes to
introducing agents mainly of chemical origin into
the ecosystem. The importance of creating a
policy promoting transition into low carbon
economy is underlined by Bienkowski, Jankowiak,
Holka. According to the authors, the most
important role in the actions related to
environmental protection both in Poland and
globally is played by economic policies, which are
intended for development of the low-carbon
economy. Understanding the threats of
degradation of ecosystems causes gradual
changes in production systems, combining
production, economic and social objectives.
Currently, a primary research issue is to
determine the future development of the society
and economic conditions in order to reduce the
pressure exerted on ecosystems by development
of civilisation (Bienkowski J. F., Jankowiak J.,
Holka M., Dabrowicz R., 2014).
Environmental changes in the Polish
agriculture
Agricultural production activities affect the
natural environment. The classic division of
agriculture into extensive and intensive suggests
how the resources, particularly of natural origin
(the environment), are used in production.
However, analysing the impact of every activity
on the environment is very difficult and perhaps
even impossible, simply due to the fact that some
effects of agricultural activity are hardly
measurable or even completely immeasurable.
Economic theory of externalities is applied here,
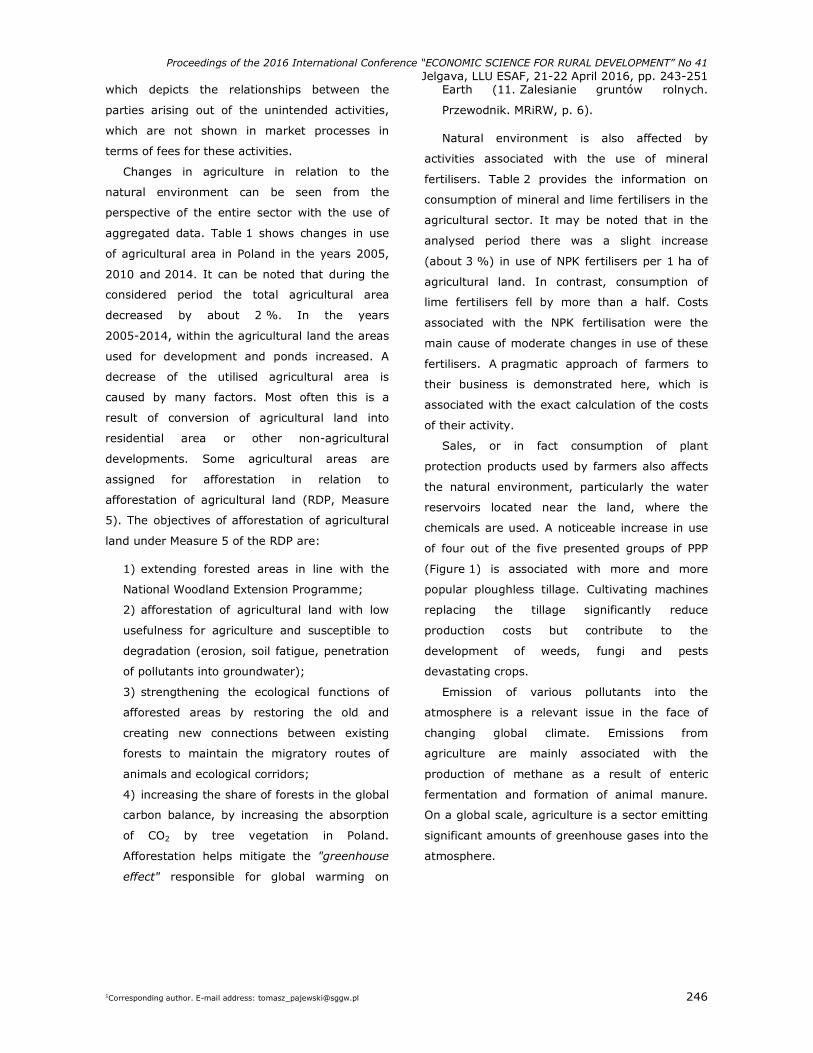
Proceedings of the 2016 International Conference “ECONOMIC SCIENCE FOR RURAL DEVELOPMENT” No 41
Jelgava, LLU ESAF, 21-22 April 2016, pp. 243-251
1Corresponding author. E-mail address: [email protected] 246
which depicts the relationships between the
parties arising out of the unintended activities,
which are not shown in market processes in
terms of fees for these activities.
Changes in agriculture in relation to the
natural environment can be seen from the
perspective of the entire sector with the use of
aggregated data. Table 1 shows changes in use
of agricultural area in Poland in the years 2005,
2010 and 2014. It can be noted that during the
considered period the total agricultural area
decreased by about 2 %. In the years
2005-2014, within the agricultural land the areas
used for development and ponds increased. A
decrease of the utilised agricultural area is
caused by many factors. Most often this is a
result of conversion of agricultural land into
residential area or other non-agricultural
developments. Some agricultural areas are
assigned for afforestation in relation to
afforestation of agricultural land (RDP, Measure
5). The objectives of afforestation of agricultural
land under Measure 5 of the RDP are:
1) extending forested areas in line with the
National Woodland Extension Programme;
2) afforestation of agricultural land with low
usefulness for agriculture and susceptible to
degradation (erosion, soil fatigue, penetration
of pollutants into groundwater);
3) strengthening the ecological functions of
afforested areas by restoring the old and
creating new connections between existing
forests to maintain the migratory routes of
animals and ecological corridors;
4) increasing the share of forests in the global
carbon balance, by increasing the absorption
of CO2 by tree vegetation in Poland.
Afforestation helps mitigate the "greenhouse
effect" responsible for global warming on
Earth (11. Zalesianie gruntów rolnych.
Przewodnik. MRiRW, p. 6).
Natural environment is also affected by
activities associated with the use of mineral
fertilisers. Table 2 provides the information on
consumption of mineral and lime fertilisers in the
agricultural sector. It may be noted that in the
analysed period there was a slight increase
(about 3 %) in use of NPK fertilisers per 1 ha of
agricultural land. In contrast, consumption of
lime fertilisers fell by more than a half. Costs
associated with the NPK fertilisation were the
main cause of moderate changes in use of these
fertilisers. A pragmatic approach of farmers to
their business is demonstrated here, which is
associated with the exact calculation of the costs
of their activity.
Sales, or in fact consumption of plant
protection products used by farmers also affects
the natural environment, particularly the water
reservoirs located near the land, where the
chemicals are used. A noticeable increase in use
of four out of the five presented groups of PPP
(Figure 1) is associated with more and more
popular ploughless tillage. Cultivating machines
replacing the tillage significantly reduce
production costs but contribute to the
development of weeds, fungi and pests
devastating crops.
Emission of various pollutants into the
atmosphere is a relevant issue in the face of
changing global climate. Emissions from
agriculture are mainly associated with the
production of methane as a result of enteric
fermentation and formation of animal manure.
On a global scale, agriculture is a sector emitting
significant amounts of greenhouse gases into the
atmosphere.
Proceedings of the 2016 International Conference “ECONOMIC SCIENCE FOR RURAL DEVELOPMENT” No 41
Jelgava, LLU ESAF, 21-22 April 2016, pp. 243-251
1Corresponding author. E-mail address: [email protected] 247
Table 1.
Changes in use of agricultural area in Poland
2005 2010 2014 Item
in thousand ha in thousand ha in thousand ha
Changes from 2014 to 2005, %
Arable land 14074 13969 13818 98
Orchards 296 292 285 96
Permanent meadows 2353 2293 2260 96
Permanent pastures 1695 1638 1613 95
Built-up agricultural land 527 530 529 100*
Land for ponds 51 70 79 155
Land for ditches 152 138 132 87
Total agricultural land 19148 18930 18716 98 * Non-visible percentage change is a result of rounding method
Source: author’s calculations based on data provided by the Central Statistical Office (GUS), "Ochrona srodowiska 2014”
Table 2.
Consumption of mineral and lime fertilisers in Poland
Consumption of mineral and lime fertilisers in pure component in the years
Item
2004/ 2005 2010/ 2011 2012/ 2013 Change from 2004/2005 to 2010/2013, %
Total amount of NPK fertilisers in thousand tonnes
1628.4 1954.4 1943.4 119
NPK mineral fertilisers per 1 ha of agricultural land in kg
129.1 129.1 133.0 103
Total amount of lime fertilisers in thousand tonnes
1455.6 568.3 634.7 44
Lime fertilisers per 1 ha of agricultural land in kg 91.5 37.6 43.4 47
Source: author’s calculations based on data provided by the Central Statistical Office (GUS), "Ochrona srodowiska 2014”
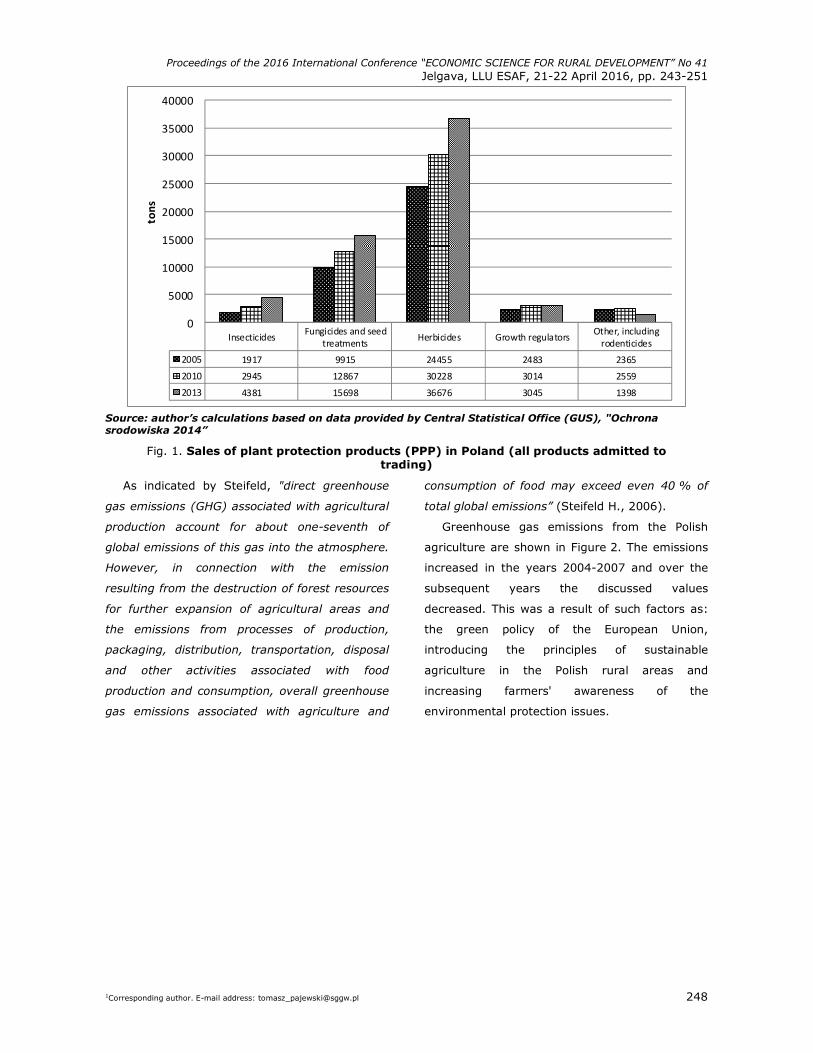
Proceedings of the 2016 International Conference “ECONOMIC SCIENCE FOR RURAL DEVELOPMENT” No 41
Jelgava, LLU ESAF, 21-22 April 2016, pp. 243-251
1Corresponding author. E-mail address: [email protected] 248
InsecticidesFungicides and seed
treatmentsHerbicides Growth regulators
Other, including
rodenticides
2005 1917 9915 24455 2483 2365
2010 2945 12867 30228 3014 2559
2013 4381 15698 36676 3045 1398
0
5000
10000
15000
20000
25000
30000
35000
40000
ton
s
Source: author’s calculations based on data provided by Central Statistical Office (GUS), "Ochrona srodowiska 2014”
Fig. 1. Sales of plant protection products (PPP) in Poland (all products admitted to trading)
As indicated by Steifeld, "direct greenhouse
gas emissions (GHG) associated with agricultural
production account for about one-seventh of
global emissions of this gas into the atmosphere.
However, in connection with the emission
resulting from the destruction of forest resources
for further expansion of agricultural areas and
the emissions from processes of production,
packaging, distribution, transportation, disposal
and other activities associated with food
production and consumption, overall greenhouse
gas emissions associated with agriculture and
consumption of food may exceed even 40 % of
total global emissions” (Steifeld H., 2006).
Greenhouse gas emissions from the Polish
agriculture are shown in Figure 2. The emissions
increased in the years 2004-2007 and over the
subsequent years the discussed values
decreased. This was a result of such factors as:
the green policy of the European Union,
introducing the principles of sustainable
agriculture in the Polish rural areas and
increasing farmers' awareness of the
environmental protection issues.
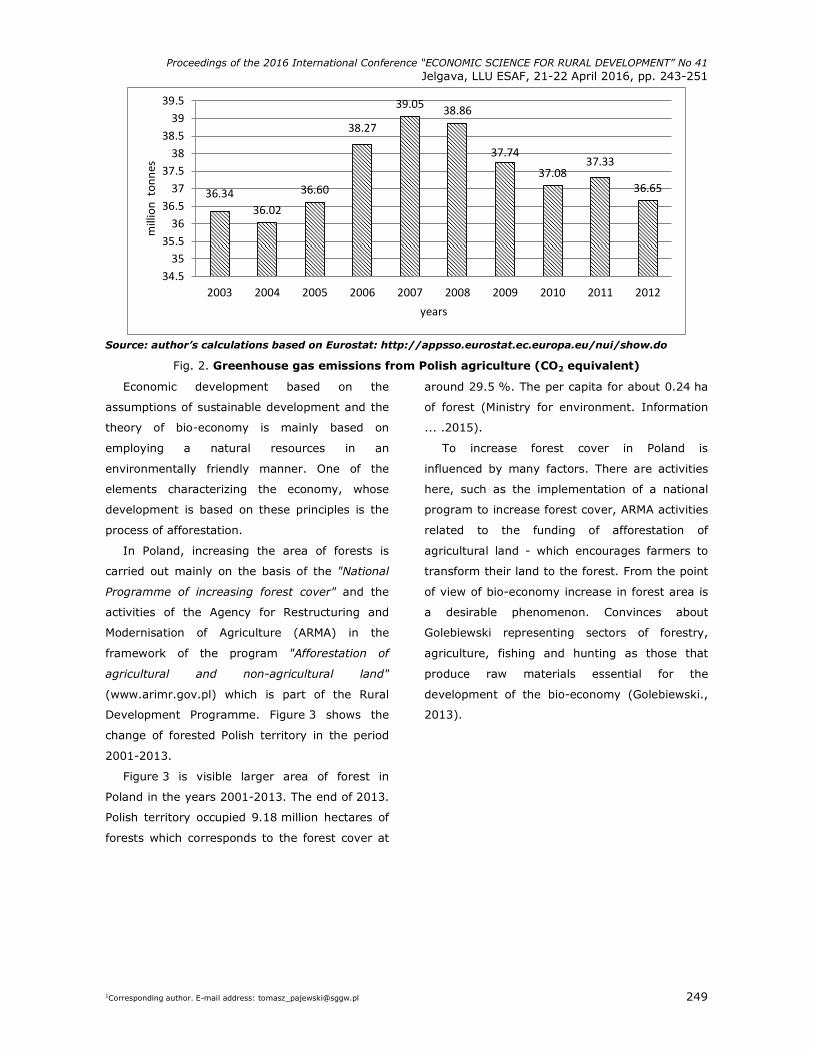
Proceedings of the 2016 International Conference “ECONOMIC SCIENCE FOR RURAL DEVELOPMENT” No 41
Jelgava, LLU ESAF, 21-22 April 2016, pp. 243-251
1Corresponding author. E-mail address: [email protected] 249
36.34
36.02
36.60
38.27
39.0538.86
37.74
37.0837.33
36.65
34.5
35
35.5
36
36.5
37
37.5
38
38.5
39
39.5
2003 2004 2005 2006 2007 2008 2009 2010 2011 2012
mil
lio
n to
nn
es
years
Source: author’s calculations based on Eurostat: http://appsso.eurostat.ec.europa.eu/nui/show.do
Fig. 2. Greenhouse gas emissions from Polish agriculture (CO2 equivalent)
Economic development based on the
assumptions of sustainable development and the
theory of bio-economy is mainly based on
employing a natural resources in an
environmentally friendly manner. One of the
elements characterizing the economy, whose
development is based on these principles is the
process of afforestation.
In Poland, increasing the area of forests is
carried out mainly on the basis of the "National
Programme of increasing forest cover" and the
activities of the Agency for Restructuring and
Modernisation of Agriculture (ARMA) in the
framework of the program "Afforestation of
agricultural and non-agricultural land"
(www.arimr.gov.pl) which is part of the Rural
Development Programme. Figure 3 shows the
change of forested Polish territory in the period
2001-2013.
Figure 3 is visible larger area of forest in
Poland in the years 2001-2013. The end of 2013.
Polish territory occupied 9.18 million hectares of
forests which corresponds to the forest cover at
around 29.5 %. The per capita for about 0.24 ha
of forest (Ministry for environment. Information
... .2015).
To increase forest cover in Poland is
influenced by many factors. There are activities
here, such as the implementation of a national
program to increase forest cover, ARMA activities
related to the funding of afforestation of
agricultural land - which encourages farmers to
transform their land to the forest. From the point
of view of bio-economy increase in forest area is
a desirable phenomenon. Convinces about
Golebiewski representing sectors of forestry,
agriculture, fishing and hunting as those that
produce raw materials essential for the
development of the bio-economy (Golebiewski.,
2013).
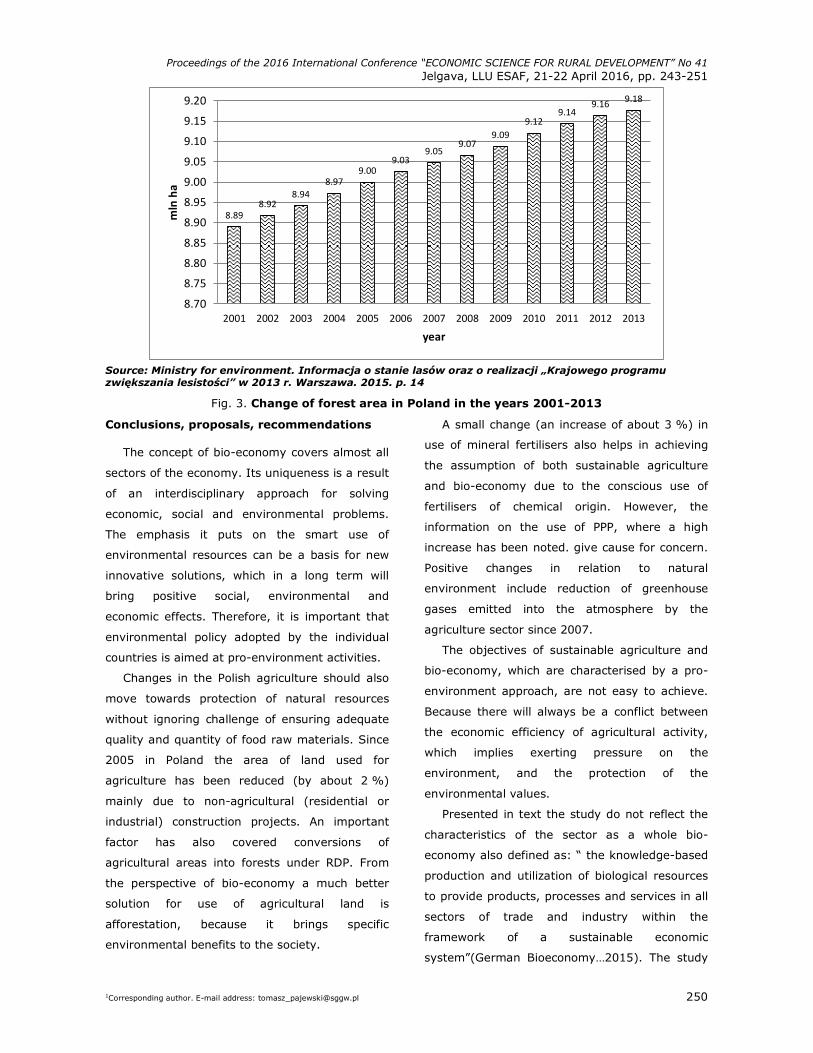
Proceedings of the 2016 International Conference “ECONOMIC SCIENCE FOR RURAL DEVELOPMENT” No 41
Jelgava, LLU ESAF, 21-22 April 2016, pp. 243-251
1Corresponding author. E-mail address: [email protected] 250
8.89
8.928.94
8.979.00
9.039.05
9.079.09
9.129.14
9.169.18
8.70
8.75
8.80
8.85
8.90
8.95
9.00
9.05
9.10
9.15
9.20
2001 2002 2003 2004 2005 2006 2007 2008 2009 2010 2011 2012 2013
mln
ha
year
Source: Ministry for environment. Informacja o stanie lasów oraz o realizacji „Krajowego programu zwiększania lesistości” w 2013 r. Warszawa. 2015. p. 14
Fig. 3. Change of forest area in Poland in the years 2001-2013
Conclusions, proposals, recommendations
The concept of bio-economy covers almost all
sectors of the economy. Its uniqueness is a result
of an interdisciplinary approach for solving
economic, social and environmental problems.
The emphasis it puts on the smart use of
environmental resources can be a basis for new
innovative solutions, which in a long term will
bring positive social, environmental and
economic effects. Therefore, it is important that
environmental policy adopted by the individual
countries is aimed at pro-environment activities.
Changes in the Polish agriculture should also
move towards protection of natural resources
without ignoring challenge of ensuring adequate
quality and quantity of food raw materials. Since
2005 in Poland the area of land used for
agriculture has been reduced (by about 2 %)
mainly due to non-agricultural (residential or
industrial) construction projects. An important
factor has also covered conversions of
agricultural areas into forests under RDP. From
the perspective of bio-economy a much better
solution for use of agricultural land is
afforestation, because it brings specific
environmental benefits to the society.
A small change (an increase of about 3 %) in
use of mineral fertilisers also helps in achieving
the assumption of both sustainable agriculture
and bio-economy due to the conscious use of
fertilisers of chemical origin. However, the
information on the use of PPP, where a high
increase has been noted. give cause for concern.
Positive changes in relation to natural
environment include reduction of greenhouse
gases emitted into the atmosphere by the
agriculture sector since 2007.
The objectives of sustainable agriculture and
bio-economy, which are characterised by a pro-
environment approach, are not easy to achieve.
Because there will always be a conflict between
the economic efficiency of agricultural activity,
which implies exerting pressure on the
environment, and the protection of the
environmental values.
Presented in text the study do not reflect the
characteristics of the sector as a whole bio-
economy also defined as: “ the knowledge-based
production and utilization of biological resources
to provide products, processes and services in all
sectors of trade and industry within the
framework of a sustainable economic
system”(German Bioeconomy…2015). The study
Proceedings of the 2016 International Conference “ECONOMIC SCIENCE FOR RURAL DEVELOPMENT” No 41
Jelgava, LLU ESAF, 21-22 April 2016, pp. 243-251
1Corresponding author. E-mail address: [email protected] 251
does not reflect the definition of bio-economy
comprised many aspects, but pay attention to
some environmental trends in one of the main
sectors of the bio-economy - agriculture, which
significantly affects the development of this new
discipline. Satisfactory from the point of view of
trends can be associated with reducing the
negative environmental effects of agricultural
activities especially in terms of GHG emissions,
the insertion into the soil fertilizers or
afforestation of land, including agricultural land.
Bibliography
1. Bieńkowski, J.F., Jankowiak, J., Holka, M., Dąbrowicz R., (2014). Srodowiskowa ocena rolnictwa w ujeciu regionalnym. RN SERiA. Volume XVI. Issue 1. p.14.
2. Charakterystyka gospodarstw rolnych w 2013 roku. GUS. Warszawa 2014. P.18.
3. Chylek, E.K. (2012). Biogospodarka w sektorze rolno-spozywczym. Przemysl Spozywczy Volume.66. p.32.
4. Eurostat: http://appsso.eurostat.ec.europa.eu/nui/show.do. Retrieved: 20.11.2015
5. German Bioeconomy Council. (2015). What is Bioeconomy? Source: http://biooekonomierat.de/en/bioeconomy/ Access: 01.03.2016
6. Golebiewski, J. (2013). Zrownowazona biogospodarka – potencjal i czynniki rozwoju. IX Kongres Ekonomistów Polskich. p. 10.
7. Krasowicz, S. (2005). Cechy rolnictwa zrownowazonego, Koncepcja badan nad rolnictwem spolecznie zrownowazonym. IERiGŻ. p. 25.
8. Ochrona środowiska 2014. GUS
9. Pajewski, T. (2014). Biogospodarka jako strategiczny element zrownowazonego rolnictwa. ZN SERiA. Volume XVI. Issue 5. p.183.
10. Steinfeld, H. a. al. (2006). Livestock’s Long Shadow: Environmental issues and options. Food and Agriculture Organization of the United Nations. Rome. Retrieved: http://www.fao.org/3/a-a0701e.pdf. Access: 25.11.2015
11. Szczegółowa instrukcja wypełniania wniosku o przyznanie płatności w ramach systemów wsparcia bezpośredniego, płatności dla obszarów z ograniczeniami naturalnymi lub innymi szczególnymi ograniczeniami (ONW), płatności rolno-środowiskowo-klimatycznej (PROW 2014-2020), płatności ekologicznej (prow 2014-2020), płatności rolnośrodowiskowej (PROW 2007-2013), o wypłatę pomocy na zalesianie (PROW 2007-2013) na rok 2015. (2015) http://www.arimr.gov.pl/dla-beneficjenta/wnioski/2015-zalesianie-gruntow-rolnych-oraz-gruntow-innych-niz-rolne-prow-2007-2013.html. Access: 01.03.2016
12. The Knowledge Based Bio-Economy (KBBE) in Europe: Achievements and Challenges. Full report. 2010. p.13.
13. Walenia, A. (2009). Wybrane zagadnienia rozwoju rolnictwa na obszarach Polski Wschodniej. PRS. Volume9. Issue (24). pp. 176-177.
14. Zalesianie gruntów rolnych. Przewodnik. MRiRW. p. 6. Retrieved: file:///C:/Users/Tomek%20P/Downloads/zalesianie_27-02.pdf Access: 01.12.2015
Proceedings of the 2016 International Conference “ECONOMIC SCIENCE FOR RURAL DEVELOPMENT” No 41
Jelgava, LLU ESAF, 21-22 April 2016, pp. 252-259
ANALYSIS OF THE FACTORS AFFECTING COST EFFICIENCY IN THE DAIRY INDUSTRY IN LATVIA
Irina Pilvere1, Dr.oec.; Aleksejs Nipers1, Dr.oec.; Agnese Krievina2, Dr.oec.
1 Faculty of Economics and Social Development, Latvia University of Agriculture 2Latvian State Institute of Agrarian Economics
Abstract. The dairy industry is one of the most important industrial sectors for healthy development of Europe. There
is not a single country being part of the EU that does not produce milk. In Latvia, the dairy industry is of great
importance, as it ranked second behind grain in the percentage distribution of agricultural final products. Regardless of
changes in the dairy industry since 2000, it is fragmented in Latvia. The year 2014 was quite difficult for the dairy
industry in Latvia due to the embargo on dairy products imposed by Russia, low milk purchase prices and concerns
regarding exceeding the milk quota. For these reasons, an urgent problem is efficiency increase possibilities in the
dairy industry in order not to let it stagnate and dairy farms go bankrupt. The research aim is to analyse the dairy
industry and the factors affecting farm cost efficiency in Latvia. To achieve the aim, the “cost parameter equation
method” was employed to identify milk production efficiency for 113 farms based on the key cost items: labour, land,
capital and intermediate consumption. The research found that milk production costs on farms in Latvia significantly
differed. The reason was different labour consumption and different capital costs if measured per tonne of milk
produced and sold. The farms were not interested in doing business efficiently from the perspective of land use, as
direct area payments of the EU provided additional revenue.
Key words: milk production, costs, labour, efficiency
JEL code: Q10, Q12
Introduction
Compared with other sectors of the economy,
agriculture is known for its specific features. First
of all, production processes in agriculture are
complemented by a factor of influence of natural
conditions, weather, the length of production
processes and the associated length of current
assets turnover (Lososova J., Zdenek R., 2014).
The dairy industry is one of the most
important industrial sectors for healthy
development of Europe. There are many reasons
why the diary sector is so important for the
European Union (EU). There is not even one
country that is part of the EU that does not
produce milk (Prisenk J. et al., 2015). But the
quota system has been limiting the EU milk
production. Between 2004 and 2013, the EU milk
production barely changed from 148.7 to 152.4
Mt (+2.5 %). During the same period, milk
production in the United States increased
from 77.5 to 91.3 Mt (+17.7 %), and the
production in New Zealand rose from 15 to 18.9
Mt (+25.6 %) (Sobczynski T. et al., 2015).
Nowadays, dairy farmers are facing new
challenges and opportunities arising from the EU
Common Agricultural Policy (CAP) reform for the
removal of milk quotas by 2015. This will allow
expansion unlimited by quota for the first time
since milk quotas were introduced in 1984
(Kelly E. et al., 2012). And it means that
competition in milk production will increase and
farms have to consider the ways how to achieve
better performance results through raising their
milk production efficiency. Several factors of
productivity management that could affect
company’s profitability are considered: labour
cost efficiency, labour cost competitiveness,
capital intensity and capital productivity
(Muminovic S., Aljinovic Barac Z., 2015).
According to S. Muminovic & Z. Aljinovic Barac
(2015), productivity management components,
labour cost competitiveness and capital
productivity have positive impacts on a
company’s profitability. But “higher milk
productivity does not necessarily improve
profitability” (Machado Filho L. P. et al., 2014).
Maximising production levels and profit are goals
cherished by most smallholder dairy farms. It is
thus important to understand the levels of
performance that farmers achieve in the current
Proceedings of the 2016 International Conference “ECONOMIC SCIENCE FOR RURAL DEVELOPMENT” No 41
Jelgava, LLU ESAF, 21-22 April 2016, pp. 252-259
milk production systems, and what the viability of
milk production and the farming system is in
general (Somda J. et al., 2005). But no two
farms are the same and CAP reforms will affect
all producers differently. Everyone should look at
where their business is now and where they want
it to be in future before making decisions. …there
were four strategies for milk producers to
examine. They could increase business turnover,
they could improve efficiency, they could find
alternative income sources or in some cases they
may want to cease milk production (Long J.,
Buss J., 2004). There has to be also taken into
consideration that the “importance of dairy sector
for local communities reflects in the creation of
employment opportunities, primarily low-skilled
workers, women and the young. This contributes
to rural development and poverty reduction in
national economies” (Jandric M. et al., 2015).
In Latvia, the dairy industry is of great
importance, as it ranked second with 24.1 % in
the percentage distribution of agricultural final
products behind grain (27.6 %) in 2014, and it
was the greatest increase in value compared with
2009 (+82 %). However, the year 2014 was
quite difficult for the dairy industry in Latvia due
to the embargo on dairy products imposed by
Russia, low milk purchase prices and concerns
regarding exceeding the milk quota (Ministry of
Agriculture, 2015). Therefore, an urgent problem
is efficiency increase possibilities in the dairy
industry in order not to let it stagnate and dairy
farms go bankrupt, as “dairy farming in Latvia is
still fragmented and totally 1944 farms stopped
their dairy business in 2014” (Ministry of
Agriculture, 2015).
Accordingly, the research object is milk
production in Latvia, while the research subject
is farm cost indicators in milk production.
The research aim is to analyse the dairy
industry and the factors affecting farm cost
efficiency in Latvia. To achieve the aim, the
following specific tasks were set: 1) to describe
the dairy industry in Latvia; 2) to analyse the key
factors affecting farm costs in milk production.
Research methods applied
The study analysed information and data from
the Central Statistical Bureau (CSB) of Latvia and
data of the Farm Accountancy Data Network
(FADN) of Latvia. The EU FADN is an instrument
for evaluating the income of agricultural holdings
and the impacts of the CAP (European
Commission, 2015). Analysis, synthesis and the
logical construction method were employed to
execute the research tasks. In addition, the “cost
parameter equation method” (CPE) was
employed because an account of accounting costs
did not allow objectively identifying the most
efficient farms, as unpaid labour costs as well as
potential revenues from an alternative use of
land were not included in calculations. CPE is
based on cost price calculation, by inclusion and
unification of labour price, as well as land price.
It is done because not all farmers do include in
production costs their own (and family) labour
input and very often land price is not included,
supposing land is for free. So, according to the
CPE method, calculations include unpaid labour
costs and making the labour costs equal across
farms.Besides, it is assumed that land has an
opportunity cost – the owner of land could rent it
out. Accordingly, the use of land for the
production of products involves costs in the form
of forgone rents. Calculations of efficiency in milk
production have to include the key cost items,
measured per tonne of milk sold. In identifying
efficiency, the key cost items represent the key
factors of production: labour, land, capital as well
as intermediate consumption1.
TCt = LCt + ZIt + CCt + ICt [1]
where:
TCt – total cost per tonne of sold milk for a
farm;
1 Intermediate consumption is the value of goods and services used in production (Krievina, 2012).
Proceedings of the 2016 International Conference “ECONOMIC SCIENCE FOR RURAL DEVELOPMENT” No 41
Jelgava, LLU ESAF, 21-22 April 2016, pp. 252-259
LCt – labour cost per tonne of sold milk for the
farm;
ZIt – land opportunity cost per tonne of sold
milk for the farm;
CCt – capital cost per tonne of sold milk for
the farm;
ICt – intermediate consumption cost per tonne
of sold milk for the farm (LLU, 2015).
The way all the factors of production are
combined is determined by the knowledge of
every producer. The present research analysed
and summarised information on the distribution
of various production costs in milk production in
Latvia. The calculations were based on the 2013
data for 113 FADN dairy farms of various sizes,
whose revenue from milk production accounted
for more than 2/3 of their total revenue. A
number of assumption were made for the
calculations: 1) all the farms should pay equal
wages per hour regardless of whether their
employees are regarded as paid or unpaid labour
(EUR 4.3 an hour); 2) every hectare of meadows
and pastures as well as of grasses sown in arable
land may be rented out by the owner.
Consequently, if farmers farm their land and
produce milk, there are foregone revenues (EUR
71.1 per hectare).
Novelty and topicality of the research
The present research points to necessity to
produce milk in Latvia as efficiently as possible
and, in order to compare the factors affecting the
financial performance of various dairy farms, the
CPE method was employed to compute not only
total cost, capital and intermediate consumption
costs but also labour costs, including unpaid
labour and land opportunity costs.
Research results and discussion
1. Characteristics of the dairy industry in
Latvia
The output of milk in Latvia rose to more than
900 000 tonnes in 2013 for the first time since
2000; it also continued to increase in 2014,
reaching 972 000 tonnes, which was 16 % more
than in 2007. A stable increase in milk output in
Latvia has been reported since 2004, which was
interrupted by a crisis in the milk market for
three years, the beginning of which was observed
already in 2008 (CSB, 2015a).
The average milk yield per cow increased in
Latvia from year to year – it was 4 tonnes in
2000, while in 2014 it reached 5.8 tonnes
(+45 %) (CSB, 2015b). Given the fact that cow
productivity in other North European countries is
higher and could reached, for example, on
average, 8.7 tonnes in Finland in 2011 (European
Commission, 2014), one can predict that the
average milk yield in Latvia will continue
increasing. At the same time, it has to be noted
that according to the SJSC Agricultural Data
Centre (ADC), some farms in Latvia have already
reached high milk yields.
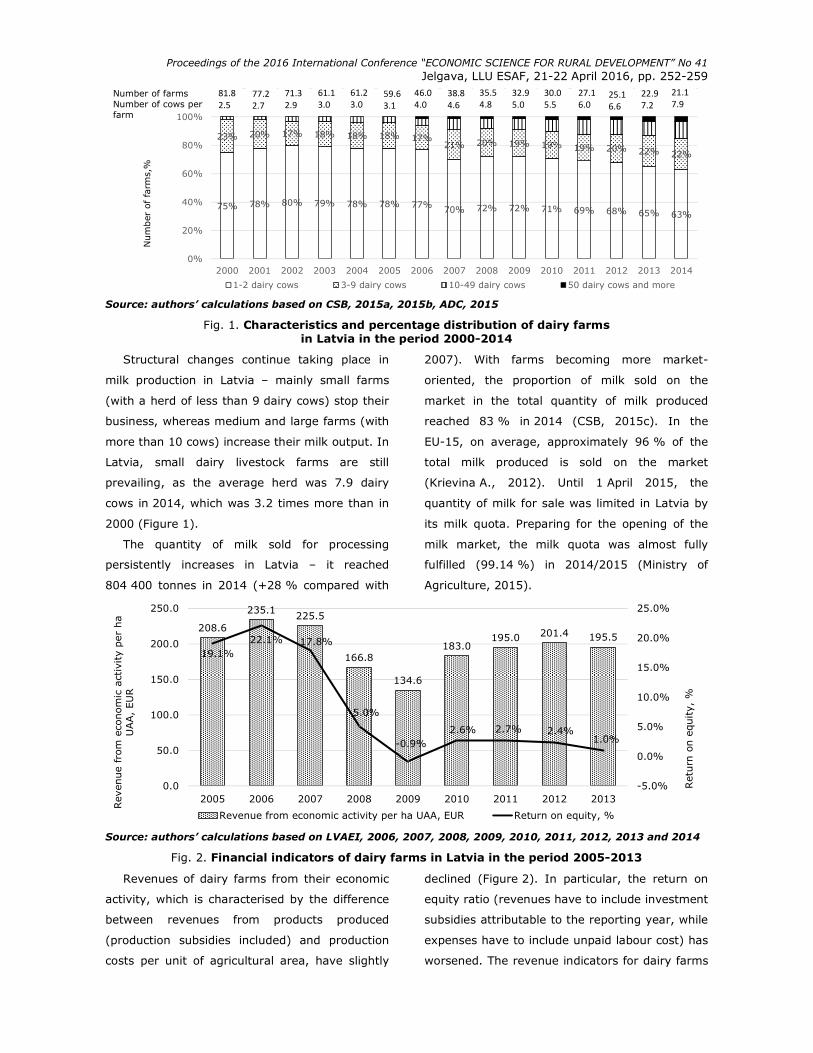
Proceedings of the 2016 International Conference “ECONOMIC SCIENCE FOR RURAL DEVELOPMENT” No 41
Jelgava, LLU ESAF, 21-22 April 2016, pp. 252-259
75% 78% 80% 79% 78% 78% 77% 70% 72% 72% 71% 69% 68% 65% 63%
23% 20% 17% 18% 18% 18% 17%21% 20% 19% 19% 19% 20% 22% 22%
0%
20%
40%
60%
80%
100%
120%
2000 2001 2002 2003 2004 2005 2006 2007 2008 2009 2010 2011 2012 2013 2014
1-2 dairy cows 3-9 dairy cows 10-49 dairy cows 50 dairy cows and more
Number of farm
s,%
Number of farmsNumber of cows per farm
81.8
2.5
61.2
3.077.2
2.7
71.3
2.9
59.6
3.1
46.0
4.0
38.8
4.6
35.5
4.8
32.9
5.0
30.0
5.5
27.1
6.025.1
6.6
22.9
7.2
21.1
7.9
61.1
3.0
Source: authors’ calculations based on CSB, 2015a, 2015b, ADC, 2015
Fig. 1. Characteristics and percentage distribution of dairy farms in Latvia in the period 2000-2014
Structural changes continue taking place in
milk production in Latvia – mainly small farms
(with a herd of less than 9 dairy cows) stop their
business, whereas medium and large farms (with
more than 10 cows) increase their milk output. In
Latvia, small dairy livestock farms are still
prevailing, as the average herd was 7.9 dairy
cows in 2014, which was 3.2 times more than in
2000 (Figure 1).
The quantity of milk sold for processing
persistently increases in Latvia – it reached
804 400 tonnes in 2014 (+28 % compared with
2007). With farms becoming more market-
oriented, the proportion of milk sold on the
market in the total quantity of milk produced
reached 83 % in 2014 (CSB, 2015c). In the
EU-15, on average, approximately 96 % of the
total milk produced is sold on the market
(Krievina A., 2012). Until 1 April 2015, the
quantity of milk for sale was limited in Latvia by
its milk quota. Preparing for the opening of the
milk market, the milk quota was almost fully
fulfilled (99.14 %) in 2014/2015 (Ministry of
Agriculture, 2015).
208.6
235.1225.5
166.8
134.6
183.0195.0 201.4 195.5
19.1%22.1% 17.8%
5.0%
-0.9%2.6% 2.7% 2.4%
1.0%
-5.0%
0.0%
5.0%
10.0%
15.0%
20.0%
25.0%
0.0
50.0
100.0
150.0
200.0
250.0
2005 2006 2007 2008 2009 2010 2011 2012 2013
Revenue from economic activity per ha UAA, EUR Return on equity, %
Revenue from economic activity per ha
UAA, EUR
Return on equity, %
Source: authors’ calculations based on LVAEI, 2006, 2007, 2008, 2009, 2010, 2011, 2012, 2013 and 2014
Fig. 2. Financial indicators of dairy farms in Latvia in the period 2005-2013
Revenues of dairy farms from their economic
activity, which is characterised by the difference
between revenues from products produced
(production subsidies included) and production
costs per unit of agricultural area, have slightly
declined (Figure 2). In particular, the return on
equity ratio (revenues have to include investment
subsidies attributable to the reporting year, while
expenses have to include unpaid labour cost) has
worsened. The revenue indicators for dairy farms
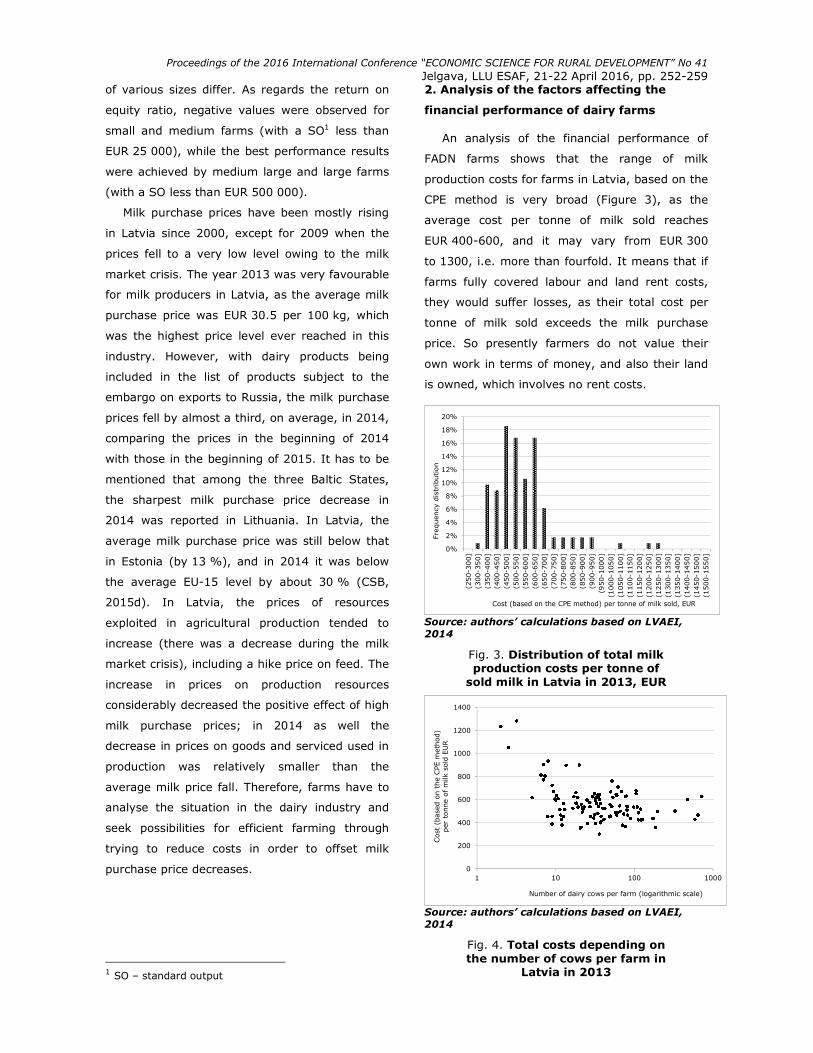
Proceedings of the 2016 International Conference “ECONOMIC SCIENCE FOR RURAL DEVELOPMENT” No 41
Jelgava, LLU ESAF, 21-22 April 2016, pp. 252-259
of various sizes differ. As regards the return on
equity ratio, negative values were observed for
small and medium farms (with a SO1 less than
EUR 25 000), while the best performance results
were achieved by medium large and large farms
(with a SO less than EUR 500 000).
Milk purchase prices have been mostly rising
in Latvia since 2000, except for 2009 when the
prices fell to a very low level owing to the milk
market crisis. The year 2013 was very favourable
for milk producers in Latvia, as the average milk
purchase price was EUR 30.5 per 100 kg, which
was the highest price level ever reached in this
industry. However, with dairy products being
included in the list of products subject to the
embargo on exports to Russia, the milk purchase
prices fell by almost a third, on average, in 2014,
comparing the prices in the beginning of 2014
with those in the beginning of 2015. It has to be
mentioned that among the three Baltic States,
the sharpest milk purchase price decrease in
2014 was reported in Lithuania. In Latvia, the
average milk purchase price was still below that
in Estonia (by 13 %), and in 2014 it was below
the average EU-15 level by about 30 % (CSB,
2015d). In Latvia, the prices of resources
exploited in agricultural production tended to
increase (there was a decrease during the milk
market crisis), including a hike price on feed. The
increase in prices on production resources
considerably decreased the positive effect of high
milk purchase prices; in 2014 as well the
decrease in prices on goods and serviced used in
production was relatively smaller than the
average milk price fall. Therefore, farms have to
analyse the situation in the dairy industry and
seek possibilities for efficient farming through
trying to reduce costs in order to offset milk
purchase price decreases.
1 SO – standard output
2. Analysis of the factors affecting the
financial performance of dairy farms
An analysis of the financial performance of
FADN farms shows that the range of milk
production costs for farms in Latvia, based on the
CPE method is very broad (Figure 3), as the
average cost per tonne of milk sold reaches
EUR 400-600, and it may vary from EUR 300
to 1300, i.e. more than fourfold. It means that if
farms fully covered labour and land rent costs,
they would suffer losses, as their total cost per
tonne of milk sold exceeds the milk purchase
price. So presently farmers do not value their
own work in terms of money, and also their land
is owned, which involves no rent costs.
Source: authors’ calculations based on LVAEI, 2014
Fig. 3. Distribution of total milk production costs per tonne of
sold milk in Latvia in 2013, EUR
0
200
400
600
800
1000
1200
1400
1 10 100 1000
Cost (based on the CPE m
ethod)
per tonne of milk sold EUR
Number of dairy cows per farm (logarithmic scale)
Source: authors’ calculations based on LVAEI, 2014
Fig. 4. Total costs depending on the number of cows per farm in
Latvia in 2013
0%
2%
4%
6%
8%
10%
12%
14%
16%
18%
20%
(250-300]
(300-350]
(350-400]
(400-450]
(450-500]
(500-550]
(550-600]
(600-650]
(650-700]
(700-750]
(750-800]
(800-850]
(850-900]
(900-950]
(950-1000]
(1000-1050]
(1050-1100]
(1100-1150]
(1150-1200]
(1200-1250]
(1250-1300]
(1300-1350]
(1350-1400]
(1400-1450]
(1450-1500]
(1500-1550]
Frequency distribution
Cost (based on the CPE method) per tonne of milk sold, EUR
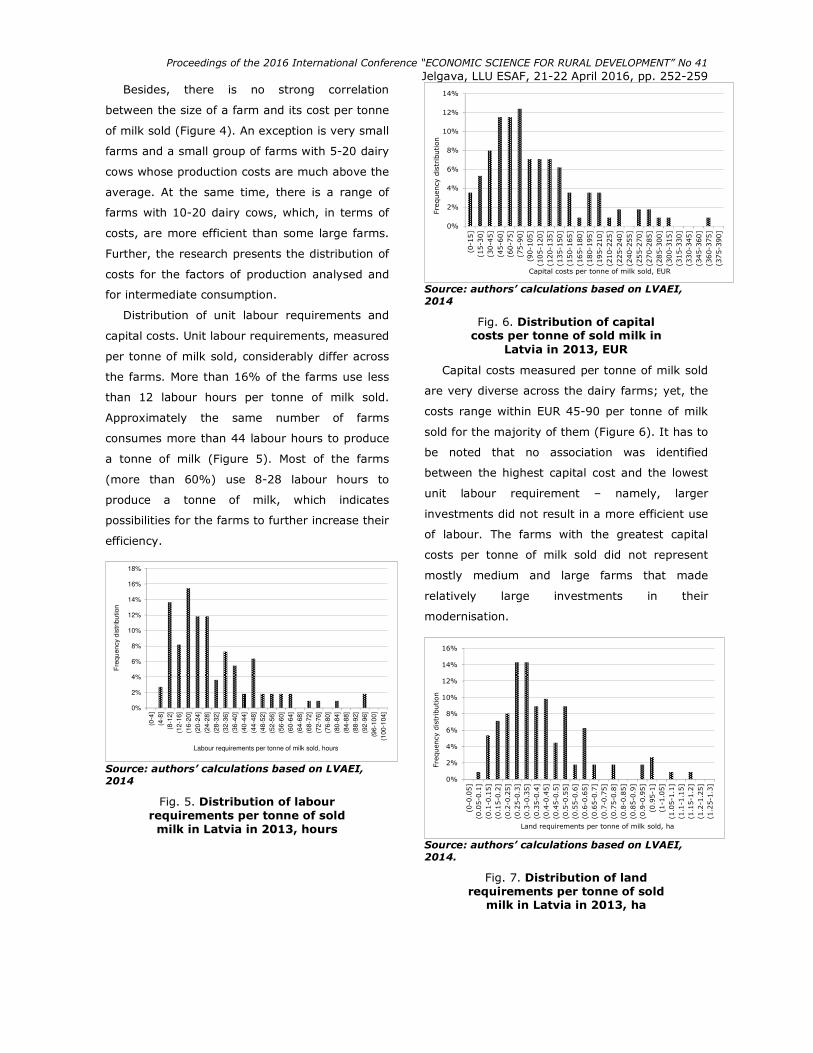
Proceedings of the 2016 International Conference “ECONOMIC SCIENCE FOR RURAL DEVELOPMENT” No 41
Jelgava, LLU ESAF, 21-22 April 2016, pp. 252-259
Besides, there is no strong correlation
between the size of a farm and its cost per tonne
of milk sold (Figure 4). An exception is very small
farms and a small group of farms with 5-20 dairy
cows whose production costs are much above the
average. At the same time, there is a range of
farms with 10-20 dairy cows, which, in terms of
costs, are more efficient than some large farms.
Further, the research presents the distribution of
costs for the factors of production analysed and
for intermediate consumption.
Distribution of unit labour requirements and
capital costs. Unit labour requirements, measured
per tonne of milk sold, considerably differ across
the farms. More than 16% of the farms use less
than 12 labour hours per tonne of milk sold.
Approximately the same number of farms
consumes more than 44 labour hours to produce
a tonne of milk (Figure 5). Most of the farms
(more than 60%) use 8-28 labour hours to
produce a tonne of milk, which indicates
possibilities for the farms to further increase their
efficiency.
0%
2%
4%
6%
8%
10%
12%
14%
16%
18%
(0-4
]
(4-8
]
(8-1
2]
(12
-16]
(16
-20]
(20
-24]
(24
-28]
(28
-32]
(32
-36]
(36
-40]
(40
-44]
(44
-48]
(48
-52]
(52
-56]
(56
-60]
(60
-64]
(64
-68]
(68
-72]
(72
-76]
(76
-80]
(80
-84]
(84
-88]
(88
-92]
(92
-96]
(96
-10
0]
(100-1
04]
Fre
qu
en
cy d
istr
ibu
tion
Labour requirements per tonne of milk sold, hours
Source: authors’ calculations based on LVAEI, 2014
Fig. 5. Distribution of labour requirements per tonne of sold
milk in Latvia in 2013, hours
0%
2%
4%
6%
8%
10%
12%
14%
(0-15]
(15-30]
(30-45]
(45-60]
(60-75]
(75-90]
(90-105]
(105-120]
(120-135]
(135-150]
(150-165]
(165-180]
(180-195]
(195-210]
(210-225]
(225-240]
(240-255]
(255-270]
(270-285]
(285-300]
(300-315]
(315-330]
(330-345]
(345-360]
(360-375]
(375-390]
Frequency distribution
Capital costs per tonne of milk sold, EUR
Source: authors’ calculations based on LVAEI, 2014
Fig. 6. Distribution of capital costs per tonne of sold milk in
Latvia in 2013, EUR
Capital costs measured per tonne of milk sold
are very diverse across the dairy farms; yet, the
costs range within EUR 45-90 per tonne of milk
sold for the majority of them (Figure 6). It has to
be noted that no association was identified
between the highest capital cost and the lowest
unit labour requirement – namely, larger
investments did not result in a more efficient use
of labour. The farms with the greatest capital
costs per tonne of milk sold did not represent
mostly medium and large farms that made
relatively large investments in their
modernisation.
0%
2%
4%
6%
8%
10%
12%
14%
16%
(0-0.05]
(0.05-0.1]
(0.1-0.15]
(0.15-0.2]
(0.2-0.25]
(0.25-0.3]
(0.3-0.35]
(0.35-0.4]
(0.4-0.45]
(0.45-0.5]
(0.5-0.55]
(0.55-0.6]
(0.6-0.65]
(0.65-0.7]
(0.7-0.75]
(0.75-0.8]
(0.8-0.85]
(0.85-0.9]
(0.9-0.95]
(0.95-1]
(1-1.05]
(1.05-1.1]
(1.1-1.15]
(1.15-1.2]
(1.2-1.25]
(1.25-1.3]
Frequency distribution
Land requirements per tonne of milk sold, ha
Source: authors’ calculations based on LVAEI, 2014.
Fig. 7. Distribution of land requirements per tonne of sold
milk in Latvia in 2013, ha
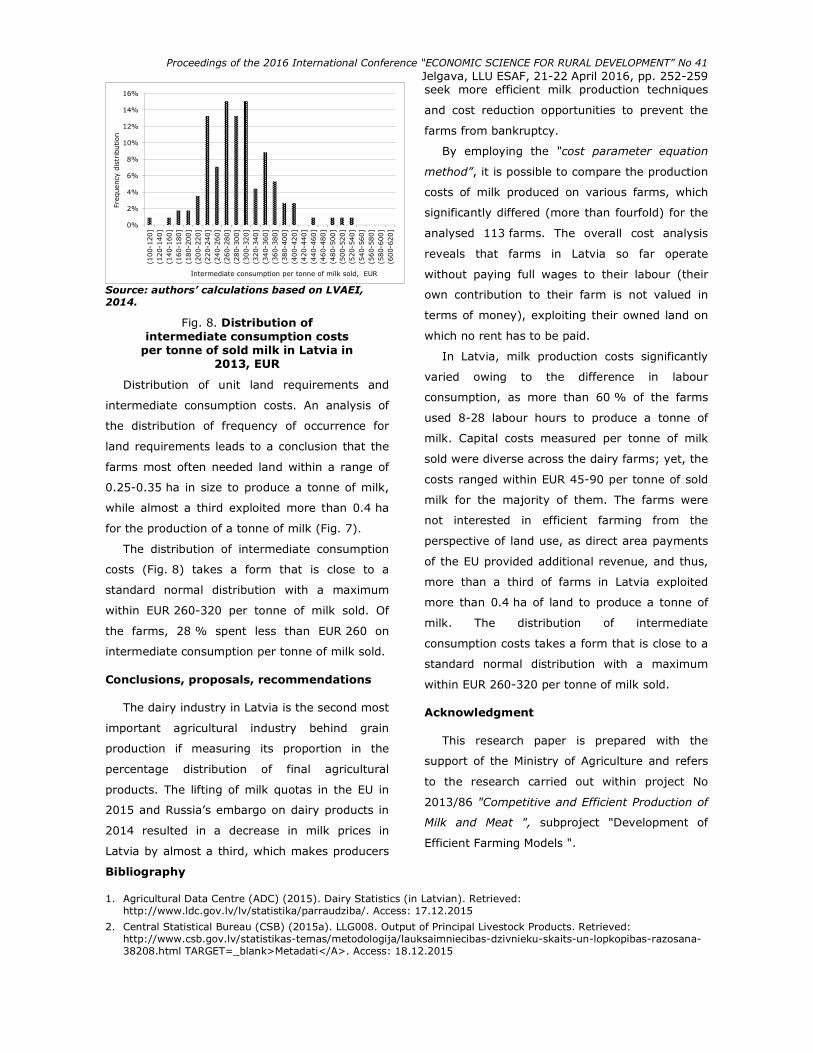
Proceedings of the 2016 International Conference “ECONOMIC SCIENCE FOR RURAL DEVELOPMENT” No 41
Jelgava, LLU ESAF, 21-22 April 2016, pp. 252-259
0%
2%
4%
6%
8%
10%
12%
14%
16%
(100-120]
(120-140]
(140-160]
(160-180]
(180-200]
(200-220]
(220-240]
(240-260]
(260-280]
(280-300]
(300-320]
(320-340]
(340-360]
(360-380]
(380-400]
(400-420]
(420-440]
(440-460]
(460-480]
(480-500]
(500-520]
(520-540]
(540-560]
(560-580]
(580-600]
(600-620]
Frequency distribution
Intermediate consumption per tonne of milk sold, EUR
Source: authors’ calculations based on LVAEI, 2014.
Fig. 8. Distribution of intermediate consumption costs
per tonne of sold milk in Latvia in 2013, EUR
Distribution of unit land requirements and
intermediate consumption costs. An analysis of
the distribution of frequency of occurrence for
land requirements leads to a conclusion that the
farms most often needed land within a range of
0.25-0.35 ha in size to produce a tonne of milk,
while almost a third exploited more than 0.4 ha
for the production of a tonne of milk (Fig. 7).
The distribution of intermediate consumption
costs (Fig. 8) takes a form that is close to a
standard normal distribution with a maximum
within EUR 260-320 per tonne of milk sold. Of
the farms, 28 % spent less than EUR 260 on
intermediate consumption per tonne of milk sold.
Conclusions, proposals, recommendations
The dairy industry in Latvia is the second most
important agricultural industry behind grain
production if measuring its proportion in the
percentage distribution of final agricultural
products. The lifting of milk quotas in the EU in
2015 and Russia’s embargo on dairy products in
2014 resulted in a decrease in milk prices in
Latvia by almost a third, which makes producers
seek more efficient milk production techniques
and cost reduction opportunities to prevent the
farms from bankruptcy.
By employing the “cost parameter equation
method”, it is possible to compare the production
costs of milk produced on various farms, which
significantly differed (more than fourfold) for the
analysed 113 farms. The overall cost analysis
reveals that farms in Latvia so far operate
without paying full wages to their labour (their
own contribution to their farm is not valued in
terms of money), exploiting their owned land on
which no rent has to be paid.
In Latvia, milk production costs significantly
varied owing to the difference in labour
consumption, as more than 60 % of the farms
used 8-28 labour hours to produce a tonne of
milk. Capital costs measured per tonne of milk
sold were diverse across the dairy farms; yet, the
costs ranged within EUR 45-90 per tonne of sold
milk for the majority of them. The farms were
not interested in efficient farming from the
perspective of land use, as direct area payments
of the EU provided additional revenue, and thus,
more than a third of farms in Latvia exploited
more than 0.4 ha of land to produce a tonne of
milk. The distribution of intermediate
consumption costs takes a form that is close to a
standard normal distribution with a maximum
within EUR 260-320 per tonne of milk sold.
Acknowledgment
This research paper is prepared with the
support of the Ministry of Agriculture and refers
to the research carried out within project No
2013/86 "Competitive and Efficient Production of
Milk and Meat ", subproject "Development of
Efficient Farming Models ".
Bibliography
1. Agricultural Data Centre (ADC) (2015). Dairy Statistics (in Latvian). Retrieved: http://www.ldc.gov.lv/lv/statistika/parraudziba/. Access: 17.12.2015
2. Central Statistical Bureau (CSB) (2015a). LLG008. Output of Principal Livestock Products. Retrieved: http://www.csb.gov.lv/statistikas-temas/metodologija/lauksaimniecibas-dzivnieku-skaits-un-lopkopibas-razosana-38208.html TARGET=_blank>Metadati</A>. Access: 18.12.2015
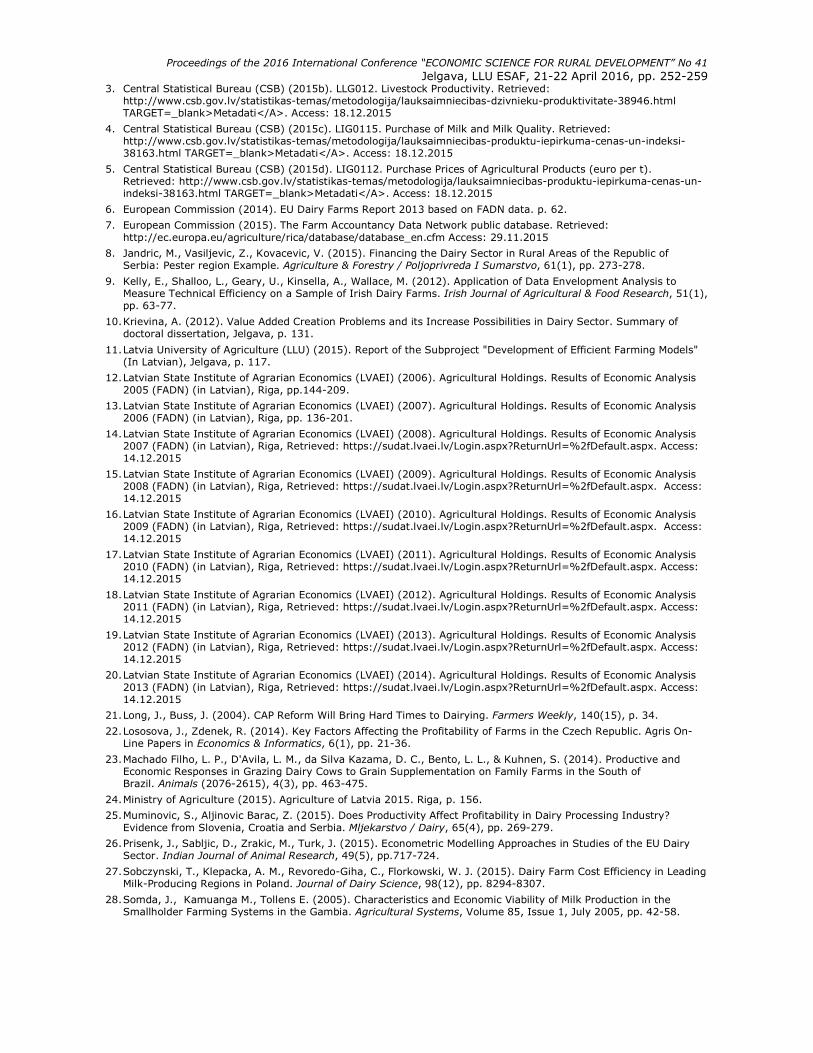
Proceedings of the 2016 International Conference “ECONOMIC SCIENCE FOR RURAL DEVELOPMENT” No 41
Jelgava, LLU ESAF, 21-22 April 2016, pp. 252-259
3. Central Statistical Bureau (CSB) (2015b). LLG012. Livestock Productivity. Retrieved: http://www.csb.gov.lv/statistikas-temas/metodologija/lauksaimniecibas-dzivnieku-produktivitate-38946.html TARGET=_blank>Metadati</A>. Access: 18.12.2015
4. Central Statistical Bureau (CSB) (2015c). LIG0115. Purchase of Milk and Milk Quality. Retrieved: http://www.csb.gov.lv/statistikas-temas/metodologija/lauksaimniecibas-produktu-iepirkuma-cenas-un-indeksi-38163.html TARGET=_blank>Metadati</A>. Access: 18.12.2015
5. Central Statistical Bureau (CSB) (2015d). LIG0112. Purchase Prices of Agricultural Products (euro per t). Retrieved: http://www.csb.gov.lv/statistikas-temas/metodologija/lauksaimniecibas-produktu-iepirkuma-cenas-un-indeksi-38163.html TARGET=_blank>Metadati</A>. Access: 18.12.2015
6. European Commission (2014). EU Dairy Farms Report 2013 based on FADN data. p. 62.
7. European Commission (2015). The Farm Accountancy Data Network public database. Retrieved: http://ec.europa.eu/agriculture/rica/database/database_en.cfm Access: 29.11.2015
8. Jandric, M., Vasiljevic, Z., Kovacevic, V. (2015). Financing the Dairy Sector in Rural Areas of the Republic of Serbia: Pester region Example. Agriculture & Forestry / Poljoprivreda I Sumarstvo, 61(1), pp. 273-278.
9. Kelly, E., Shalloo, L., Geary, U., Kinsella, A., Wallace, M. (2012). Application of Data Envelopment Analysis to Measure Technical Efficiency on a Sample of Irish Dairy Farms. Irish Journal of Agricultural & Food Research, 51(1), pp. 63-77.
10. Krievina, A. (2012). Value Added Creation Problems and its Increase Possibilities in Dairy Sector. Summary of doctoral dissertation, Jelgava, p. 131.
11. Latvia University of Agriculture (LLU) (2015). Report of the Subproject "Development of Efficient Farming Models" (In Latvian), Jelgava, p. 117.
12. Latvian State Institute of Agrarian Economics (LVAEI) (2006). Agricultural Holdings. Results of Economic Analysis 2005 (FADN) (in Latvian), Riga, pp.144-209.
13. Latvian State Institute of Agrarian Economics (LVAEI) (2007). Agricultural Holdings. Results of Economic Analysis 2006 (FADN) (in Latvian), Riga, pp. 136-201.
14. Latvian State Institute of Agrarian Economics (LVAEI) (2008). Agricultural Holdings. Results of Economic Analysis 2007 (FADN) (in Latvian), Riga, Retrieved: https://sudat.lvaei.lv/Login.aspx?ReturnUrl=%2fDefault.aspx. Access: 14.12.2015
15. Latvian State Institute of Agrarian Economics (LVAEI) (2009). Agricultural Holdings. Results of Economic Analysis 2008 (FADN) (in Latvian), Riga, Retrieved: https://sudat.lvaei.lv/Login.aspx?ReturnUrl=%2fDefault.aspx. Access: 14.12.2015
16. Latvian State Institute of Agrarian Economics (LVAEI) (2010). Agricultural Holdings. Results of Economic Analysis 2009 (FADN) (in Latvian), Riga, Retrieved: https://sudat.lvaei.lv/Login.aspx?ReturnUrl=%2fDefault.aspx. Access: 14.12.2015
17. Latvian State Institute of Agrarian Economics (LVAEI) (2011). Agricultural Holdings. Results of Economic Analysis 2010 (FADN) (in Latvian), Riga, Retrieved: https://sudat.lvaei.lv/Login.aspx?ReturnUrl=%2fDefault.aspx. Access: 14.12.2015
18. Latvian State Institute of Agrarian Economics (LVAEI) (2012). Agricultural Holdings. Results of Economic Analysis 2011 (FADN) (in Latvian), Riga, Retrieved: https://sudat.lvaei.lv/Login.aspx?ReturnUrl=%2fDefault.aspx. Access: 14.12.2015
19. Latvian State Institute of Agrarian Economics (LVAEI) (2013). Agricultural Holdings. Results of Economic Analysis 2012 (FADN) (in Latvian), Riga, Retrieved: https://sudat.lvaei.lv/Login.aspx?ReturnUrl=%2fDefault.aspx. Access: 14.12.2015
20. Latvian State Institute of Agrarian Economics (LVAEI) (2014). Agricultural Holdings. Results of Economic Analysis 2013 (FADN) (in Latvian), Riga, Retrieved: https://sudat.lvaei.lv/Login.aspx?ReturnUrl=%2fDefault.aspx. Access: 14.12.2015
21. Long, J., Buss, J. (2004). CAP Reform Will Bring Hard Times to Dairying. Farmers Weekly, 140(15), p. 34.
22. Lososova, J., Zdenek, R. (2014). Key Factors Affecting the Profitability of Farms in the Czech Republic. Agris On-Line Papers in Economics & Informatics, 6(1), pp. 21-36.
23. Machado Filho, L. P., D'Avila, L. M., da Silva Kazama, D. C., Bento, L. L., & Kuhnen, S. (2014). Productive and Economic Responses in Grazing Dairy Cows to Grain Supplementation on Family Farms in the South of Brazil. Animals (2076-2615), 4(3), pp. 463-475.
24. Ministry of Agriculture (2015). Agriculture of Latvia 2015. Riga, p. 156.
25. Muminovic, S., Aljinovic Barac, Z. (2015). Does Productivity Affect Profitability in Dairy Processing Industry? Evidence from Slovenia, Croatia and Serbia. Mljekarstvo / Dairy, 65(4), pp. 269-279.
26. Prisenk, J., Sabljic, D., Zrakic, M., Turk, J. (2015). Econometric Modelling Approaches in Studies of the EU Dairy Sector. Indian Journal of Animal Research, 49(5), pp.717-724.
27. Sobczynski, T., Klepacka, A. M., Revoredo-Giha, C., Florkowski, W. J. (2015). Dairy Farm Cost Efficiency in Leading Milk-Producing Regions in Poland. Journal of Dairy Science, 98(12), pp. 8294-8307.
28. Somda, J., Kamuanga M., Tollens E. (2005). Characteristics and Economic Viability of Milk Production in the Smallholder Farming Systems in the Gambia. Agricultural Systems, Volume 85, Issue 1, July 2005, pp. 42-58.
Proceedings of the 2016 International Conference “ECONOMIC SCIENCE FOR RURAL DEVELOPMENT” No 41
Jelgava, LLU ESAF, 21-22 April 2016, pp. 260-265
260
DEVELOPMENT OF SUSTAINABLE LIVING ENVIRONMENT IN THE CITIES THROUGH THE BIOECONOMY
Dina Popluga1, Dr.oec., assistant professor, Liga Feldmane2, PhD student, Mg.geogr.
1 Latvia University of Agriculture 2 Latvia University
Abstract. Around three quarter or 72.4 % of the European Union’s population live in urban areas, and this share
continues to grow; thus, towns and cities are the centres of economic activity and social life. At the same time, the
constant increase of population, a lack of strategic planning and poor environment management cause a lot of
problems for the living environment and life quality. Such situation analysis initiated this study which is of theoretical
nature and aims to provide the knowledge base for development of sustainable living environment in the cities through
the bioeconomy. The aim of the study was to explore the living environment from the sustainability perspective and to
describe the key areas of life where bioeconomy can facilitate development of sustainable living environment in the
cities. In this research, suitable qualitative and quantitative research methods were applied. The research finds out
that most of the European cities have common environmental problems, with most worrying issues being air pollution
and water pollution. Therefore, providing qualitative and sustainable living environment in urban areas has become an
important issue. In this study, the authors have explained concept of sustainable living environment, which focuses on
the following: good state of environment, biodiversity and well functioning ecosystem services, housing conditions that
promote wellbeing, low carbon and energy efficient solutions, sustainable use of natural resources. It were concluded
that this concept could be met through the development of bioeconomy.
Key words: bioeconomy, sustainable living environment, Latvia.
JEL code: Q5, Q57.
Introduction
According to statistical information (Eurostat,
2015a), around three quarter or 72.4 % of the
European Union’s population live in urban areas,
and this share continues to grow, thus towns and
cities are the centres of economic activity and
social life. At the same time, the constant
increase of population, a lack of strategic
planning and poor environment management
cause a lot of problems for the living environment
and life quality. These problems can be
considered as main drivers of societal challenges
of the 21st century such as climate change,
natural resource scarcity and environmental
pollution that demand transformative change
(McCormick K., Kautto N., 2013). Many examples
can already be observed when the mentioned
problems associated with living environment
have become the main reason why people choose
to leave urban areas and try to search residence
with better living conditions.
Over the past two decades, biotechnology has
provided a motor for environmentally sustainable
production and for the development of a diverse
range of innovative products. The potential
economic and environmental benefits of
biotechnology have created a growing strategic
interest in the bioeconomy (OECD, 2009). An
early definition of bioeconomy offered by the
OECD (2006) supposes that “bioeconomy is the
aggregate set of economic operations in a society
that use the latent value incumbent in biological
products and processes to capture new growth
and welfare benefits for citizens and nations”. In
more recent communication, the OECD (2009)
has changed the concept defining bioeconomy as
“transforming life science knowledge into new,
sustainable, eco-efficient and competitive
products”. The United States of America (The
White House, 2012) suggest that “bioeconomy is
based on the use of research and innovation in
the biological sciences to create economic activity
and public benefit”. In Europe, the concept of
bio-based economy offered by the European
Commission (2012) is very broadly used. This
concept of the bio-based economy is also used in
Finland and Sweden and states that “a bio-based
economy integrates the full range of natural and
Proceedings of the 2016 International Conference “ECONOMIC SCIENCE FOR RURAL DEVELOPMENT” No 41
Jelgava, LLU ESAF, 21-22 April 2016, pp. 260-265
261
renewable biological resources – land and sea
resources, biodiversity and biological materials
(plant, animal and microbial), through the
processing and the consumption of these
bioresources”. From such definitions, it can be
concluded that concept of bioeconomy focuses on
an economy which is based on the use of
biomass resources rather than fossil-based
products and systems. It can be also understood
that bioeconomy is an economy where the basic
materials, chemicals and energy are derived from
renewable biological resources, such as plant and
animal origin resources.
Such situation analysis served as the basis for
the research hypothesis: bioeconomy can foster
development of sustainable living environment in
the cities. The defined hypothesis initiated the
aim of this research: to provide the knowledge
base for development of sustainable living
environment in the cities through the
bioeconomy. The following research tasks are
advanced to achieve the set aim:
1) to explore living environment from the
sustainability perspective;
2) to describe the key areas of life where
bioeconomy can facilitate development of
sustainable living environment in the cities.
To achieve the set aim and tasks of the
research, the authors have used the publications
and studies of foreign scientists and statistical
data from Eurostat. The research authors widely
have applied generally accepted research
methods in economics, i.e. monographic
descriptive method as well as analysis and
synthesis methods to study the problem
elements.
Research results and discussion
1. Exploration of living environment from
the sustainability perspective
According to Muslim M.H. and co-authors
(2012), living environment can be examined from
various standpoints, such as an architectural,
economic, social and cultural perspective. It has
been also pointed out that in recent decades, the
interest in research on living environment has
risen, and various approaches, concepts and
viewpoints have been applied by housing
researchers from an extensive range of
disciplines (Muslim M.H. et al., 2012). In this
research authors’ have focused on exploring
living environment from the ecological and
environmental perspective as urban
environmental problems are threats to present or
future human well-being, resulting from human-
induced damage to the physical environment,
originating in or borne in urban areas (DANIDA,
2000).
Most of the European cities have common
environmental problems such as poor air quality,
high levels of traffic and congestion, poor-quality
built environment, high levels of ambient noise,
derelict land, greenhouse gas emissions, urban
sprawl, generation of waste and wastewater.
Danish International Development Agency
(DANIDA, 2000) has ranged all of these problems
by type of hazard in five groups:
• biological pathogens (pathogens in the open
water bodies, at municipal dumps;
contaminated water in piped systems);
• chemical pollutants (ambient air pollution
from industry and motor vehicles; water
pollution; hazardous wastes);
• physical hazards (traffic hazards; violence;
natural disasters and impact because of
inadequate attention to prevention and
mitigation);
• citizens’ access to land for housing (important
influence on housing quality directly and
indirectly);
• heat island effect and thermal inversions
(raised temperatures a health risk).
There is a strong consensus among the
European Union (EU) residents about the
importance of environmental protection, the most
worrying issues being air pollution and water
Proceedings of the 2016 International Conference “ECONOMIC SCIENCE FOR RURAL DEVELOPMENT” No 41
Jelgava, LLU ESAF, 21-22 April 2016, pp. 260-265
262
pollution (Eurostat, 2015b). Air pollution is both
an environmental and a social problem, as it
leads to a multitude of adverse effects on human
health, ecosystems, the built environment and
the climate. Air pollution poses the single largest
environmental health risk in Europe today (EEA,
2015). Air pollution is, thereby, a complex
problem that poses multiple challenges in terms
of management and mitigation (EEA, 2015).
Since providing qualitative and sustainable
living environment in urban areas has become an
important issue, governments in national and
international level have made policies and
strategic planning documents with the aim to
improve current conditions of living environment
in cities and to make it sustainable for next
generations.
Sustainable urban development - economic,
social and environmental - is central also in the
European Union's Regional Policy. Principle of
sustainable development is included in the
European Union's Lisbon Strategy (European
Council, 2000), which defines that a competitive,
knowledge-based economic growth must be in
harmony with nature and culture as well as in the
European Union’s Sustainable Development
Strategy (European Commission, 2009). In 2005,
the European Commission approved the EU
“Thematic Strategy on the Urban Environment”
which sets goals and objectives for improving the
urban environment and promotes sustainable
development in the large cities. As a continuation
of the Lisbon Strategy in 2010, the Europe 2020
(European Commission, 2010) strategy was
created which aim is “smart, sustainable and
inclusive growth”, and urban areas are
considered as being central to achieving its
targets. Sustainable growth in this strategy
means: to promote a more competitive economy
in which resources are used efficiently and
sustainably, while carbon dioxide emissions
should be as low as possible; to protect the
environment and to prevent the loss of
biodiversity; to strengthen European leadership
in developing new green technologies and
production methods. Furthermore, urban
development issues have been integrated, to a
large extent, into regional and national
programmes supported by structural and
cohesion funds, principally the European Regional
Development Fund (ERDF) and the European
Social Fund (ESF). For example, during the
period 2014–2020, each EU Member State should
invest at least 5 % of the ERDF in sustainable
urban development.
Such situation analysis let the authors to
conclude that sustainable living environment in
the cities should be developed on the conceptual
basis (Figure 1).
According to information summarized in
Figure 1, the concept of sustainable living
environment should focus on the following: good
state of environment, biodiversity and well
functioning ecosystem services, hosing conditions
that promote wellbeing, low carbon and energy
efficient solutions, sustainable use of natural
resources. In the second part of this research,
the authors have explored how this concept can
be met through the development of bioeconomy.
2. Key areas of life where bioeconomy can
facilitate development of sustainable living
environment in the cities
In the frame of this study more recent
definition of bioeconomy were used (European
Commission, 2012). In this definition bioeconomy
encompasses the sustainable production of
renewable resources from land, fisheries and
aquaculture and their conversion into food, feed,
fibre, bio-based products and bio-energy as well
as the related public goods. Such definition
indicates that according to concept of
bioeconomy biomass resources are transformed
into competitive bioeconomy products. The total
bioeconomy includes:
• the traditional biobased sectors such as
agriculture, horticulture, forestry, fisheries,
food and feed, pulp and paper;
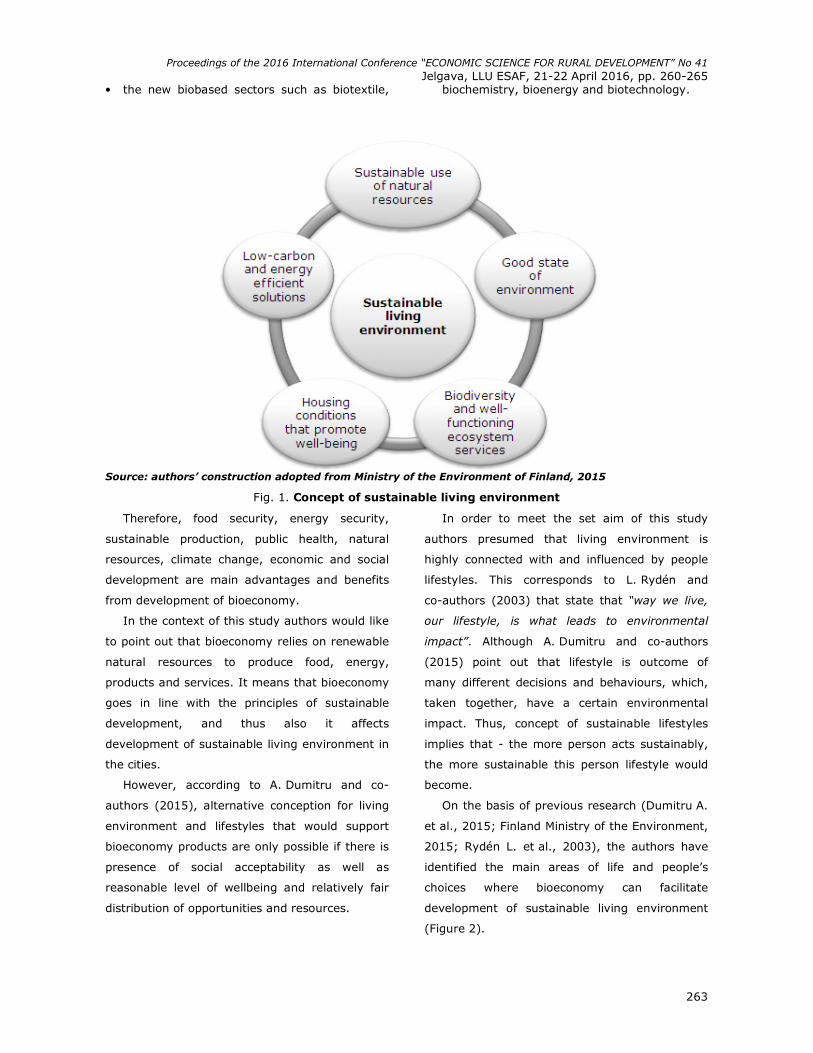
Proceedings of the 2016 International Conference “ECONOMIC SCIENCE FOR RURAL DEVELOPMENT” No 41
Jelgava, LLU ESAF, 21-22 April 2016, pp. 260-265
263
• the new biobased sectors such as biotextile, biochemistry, bioenergy and biotechnology.
Source: authors’ construction adopted from Ministry of the Environment of Finland, 2015
Fig. 1. Concept of sustainable living environment
Therefore, food security, energy security,
sustainable production, public health, natural
resources, climate change, economic and social
development are main advantages and benefits
from development of bioeconomy.
In the context of this study authors would like
to point out that bioeconomy relies on renewable
natural resources to produce food, energy,
products and services. It means that bioeconomy
goes in line with the principles of sustainable
development, and thus also it affects
development of sustainable living environment in
the cities.
However, according to A. Dumitru and co-
authors (2015), alternative conception for living
environment and lifestyles that would support
bioeconomy products are only possible if there is
presence of social acceptability as well as
reasonable level of wellbeing and relatively fair
distribution of opportunities and resources.
In order to meet the set aim of this study
authors presumed that living environment is
highly connected with and influenced by people
lifestyles. This corresponds to L. Rydén and
co-authors (2003) that state that “way we live,
our lifestyle, is what leads to environmental
impact”. Although A. Dumitru and co-authors
(2015) point out that lifestyle is outcome of
many different decisions and behaviours, which,
taken together, have a certain environmental
impact. Thus, concept of sustainable lifestyles
implies that - the more person acts sustainably,
the more sustainable this person lifestyle would
become.
On the basis of previous research (Dumitru A.
et al., 2015; Finland Ministry of the Environment,
2015; Rydén L. et al., 2003), the authors have
identified the main areas of life and people’s
choices where bioeconomy can facilitate
development of sustainable living environment
(Figure 2).
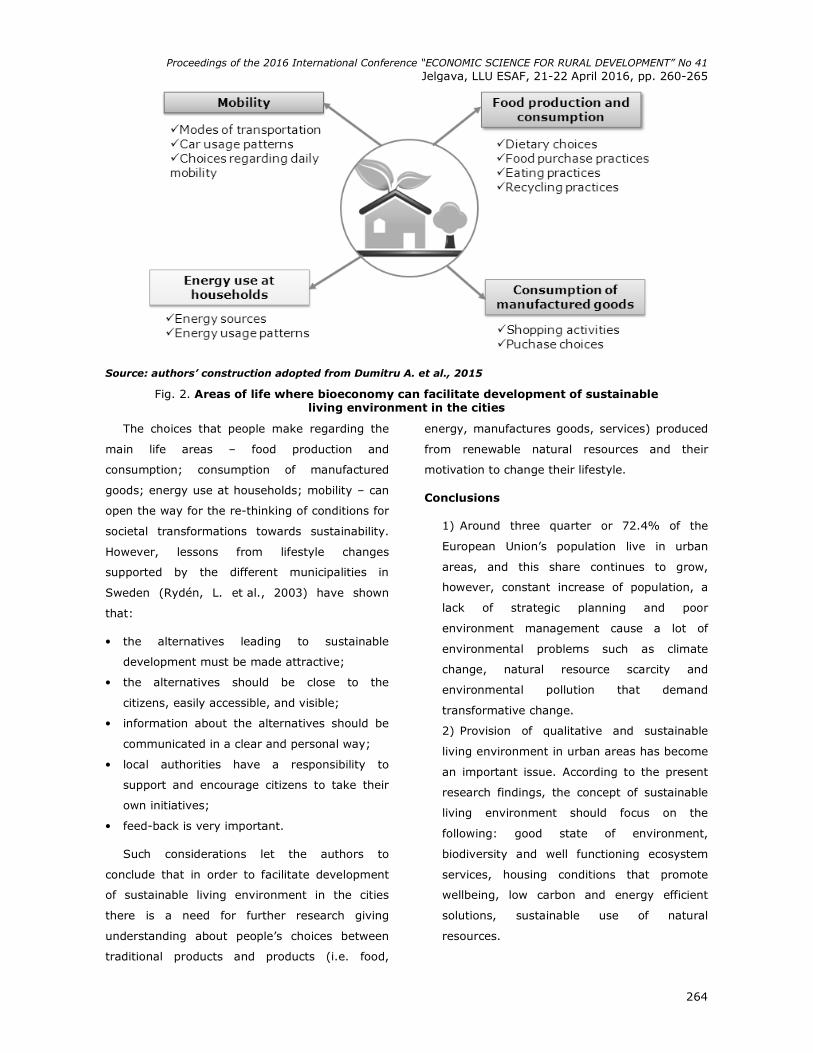
Proceedings of the 2016 International Conference “ECONOMIC SCIENCE FOR RURAL DEVELOPMENT” No 41
Jelgava, LLU ESAF, 21-22 April 2016, pp. 260-265
264
Source: authors’ construction adopted from Dumitru A. et al., 2015
Fig. 2. Areas of life where bioeconomy can facilitate development of sustainable living environment in the cities
The choices that people make regarding the
main life areas – food production and
consumption; consumption of manufactured
goods; energy use at households; mobility – can
open the way for the re-thinking of conditions for
societal transformations towards sustainability.
However, lessons from lifestyle changes
supported by the different municipalities in
Sweden (Rydén, L. et al., 2003) have shown
that:
• the alternatives leading to sustainable
development must be made attractive;
• the alternatives should be close to the
citizens, easily accessible, and visible;
• information about the alternatives should be
communicated in a clear and personal way;
• local authorities have a responsibility to
support and encourage citizens to take their
own initiatives;
• feed-back is very important.
Such considerations let the authors to
conclude that in order to facilitate development
of sustainable living environment in the cities
there is a need for further research giving
understanding about people’s choices between
traditional products and products (i.e. food,
energy, manufactures goods, services) produced
from renewable natural resources and their
motivation to change their lifestyle.
Conclusions
1) Around three quarter or 72.4% of the
European Union’s population live in urban
areas, and this share continues to grow,
however, constant increase of population, a
lack of strategic planning and poor
environment management cause a lot of
environmental problems such as climate
change, natural resource scarcity and
environmental pollution that demand
transformative change.
2) Provision of qualitative and sustainable
living environment in urban areas has become
an important issue. According to the present
research findings, the concept of sustainable
living environment should focus on the
following: good state of environment,
biodiversity and well functioning ecosystem
services, housing conditions that promote
wellbeing, low carbon and energy efficient
solutions, sustainable use of natural
resources.
Proceedings of the 2016 International Conference “ECONOMIC SCIENCE FOR RURAL DEVELOPMENT” No 41
Jelgava, LLU ESAF, 21-22 April 2016, pp. 260-265
265
3) Main areas of life where bioeconomy can
facilitate development of sustainable living
environment are food production and
consumption; consumption of manufactured
goods; energy use at households; mobility.
The choices that people make regarding these
life areas can open the way for the re-thinking
of conditions for societal transformations
towards sustainability. However, there is a
need for deeper understanding about people’s
choices between traditional products and
products (i.e. food, energy, manufactures
goods, services) produced from renewable
natural resources and people’s motivation to
change their lifestyle.
Bibliography
1. DANIDA (2000). Improving the Urban Environment and Reducing Poverty. Workshop paper. Retrieved: http://web.mit.edu/urbanupgrading/urbanenvironment/issues/introduction.html. Access: 12.12.2000.
2. Dumitru, A., Garcia-Mira, R., Mascsinga, I., Diaz-Ayude, A., Pandur, V., Dumitru, I., Sava, A. (2015). Green Lifestyles Alternative Models and Up-scaling Regional Sustainability/ GLAMURS. Retrieved: http://www.glamurs.eu/wp-content/uploads/2015/10/WP4_Deliverable-D4.1.pdf. Access: 11.12.2015.
3. EEA (2015) Air Quality in Europe — 2015 report. Luxembourg: Publications Office of the European Union, p. 64.
4. European Commission (2009). Review of the European Union Strategy for Sustainable Development, COM(2009) 400 final. Retrieved: http://eur-lex.europa.eu/legal-content/EN/TXT/?uri=CELEX:52009DC0400. Access: 06.01.2016.
5. European Commission (2010). EUROPE 2020. A Strategy for Smart, Sustainable and Inclusive Growth. European Commission: Brussels, Belgium, 37 p. Retrieved: http://ec.europa.eu/eu2020/pdf/COMPLET%20EN%20BARROSO%20%20%20007%20-%20Europe%202020%20-%20EN%20version.pdf. Access: 06.01.2016.
6. European Commission (2012). Innovating for Sustainable Growth: A Bioeconomy for Europe; COM (2012) 60 final. European Commission: Brussels, Belgium, 9 p. Retrieved: http://ec.europa.eu/research/bioeconomy/pdf/201202_innovating_sustainable_growth_en.pdf. Access: 12.12.2015.
7. European Council (2000). Presidency Conclusions. Lisbon European Council. Retrieved: http://www.consilium.europa.eu/lv/uedocs/cms_data/docs/pressdata/en/ec/00100-r1.en0.htm. Access: 06.01.2016.
8. Eurostat (2015a). Statistics on European Cities. Retrieved: http://ec.europa.eu/eurostat/statistics-explaine.d/index.php/Statistics_on_European_cities. Access: 20.12.2015.
9. Eurostat (2015b). Quality of Life in Europe - Facts and Views - Overall Life Satisfaction. Retrieved: http://ec.europa.eu/eurostat/statistics-explained/index.php/Quality_of_life_in_Europe_-_facts_and_views_-_overall_life_satisfaction. Access: 13.12.2015.
10. Ministry of the Environment of Finland (2015). Strategy 2022 - A Better Environment for Future Generations. Retrieved: http://www.ym.fi/en-US/The_Ministry/Goals_and_results/Strategy_2022. Access: 11.12.2015.
11. McCormick, K., Kautto, N. (2013). The Bioeconomy in Europe: An Overview. In: Sustainability, 5, pp. 2589-2608.
12. Muslim, M.H., Karim, H.A., Abdullah I.C. (2012). Satisfaction of Students’ Living Environment between On-Campus and Off-Campus Settings: A Conceptual Overview. In: Procedia - Social and Behavioural Sciences, Volume 68, pp. 601-614.
13. OECD (2006). The Bioeconomy to 2030: Designing a Policy Agenda. Retrieved: http://www.oecd.org/sti/biotech/34823102.pdf. Access: 12.12.2015.
14. OECD (2009). The Bioeconomy to 2030: Designing a Policy Agenda, Main Findings. Organisation for Economic Cooperation and Development: Paris, France,18 p.
15. Rydén, L., Filho, W.L., Skubala, P. Kronlid, D. (2003). Behaviour and the Environment. Ethics, Education and Lifestyles. In: Rydén, L. (ed.) (2003). Environmental Science: Understanding, Protecting and Managing the Environment in the Baltic Sea Region. Uppsala: The Baltic University Press, 800 p.
16. The White House (2012). National Bioeconomy Blueprint. Retrieved: https://www.whitehouse.gov/sites/default/files/microsites/ostp/national_bioeconomy_blueprint_april_2012.pdf. Access: 20.12.2015.
Proceedings of the 2016 International Conference “ECONOMIC SCIENCE FOR RURAL DEVELOPMENT” No 41
Jelgava, LLU ESAF, 21-22 April 2016, pp. 266-273
1Corresponding author. Tel.:+371 28206624. E-mail address: [email protected] 266
FABA BEANS AS AN ALTERNATIVE PROTEIN SOURCE FOR BROILER CHICKEN FEED Liga Proskina1, Dr.oec.; Sallija Ceriņa2, Dr.oec.; Sandija Zeverte-Rivza1 Dr.oec.
1 Faculty of Economics and Social Development, Latvia University of Agriculture 2State Priekuli Plant Breeding Institute
Abstract. A lower price on poultry meat, compared with other meats (beef, pork etc.), affects the increasing demand
for poultry meat. The productivity and production cost of broiler chickens are directly related to the amount of feed
fed, the proportion of crude protein in the feed, and the biological value and price of the feed. The EU produces only
30% of the protein crops used for feed; thus, the large import of protein feed crops contribute to agricultural
instability and production cost increases. To reduce the consumption of imported protein feeds and the production cost
of poultry meat, it is necessary to assess opportunities to use a domestic protein crop as faba beans. The research aim
is to identify economic gains from the production of broiler chicken meat if using domestic faba beans in broiler
chicken diets. Specific research tasks are as follows: 1) to identify the effect of the use of faba beans on the cost of
broiler chicken feed; 2) to assess changes in broiler chicken productivity due to faba bean diets. It is economically
efficient to replace soybean protein with domestically produced faba beans in the feed ration for broiler chickens; it
provides an adequate amount of crude protein and reduces the feed conversion ratio and production costs. A faba
bean ration in the broiler chicken diet provides the broilers with necessary nutrients, thereby contributing to their
growth and increases in their live weight, reducing feed costs and resulting in increases in economic return.
Key words: poultry production, production efficiency, legumes, faba beans in broiler diets.
JEL code: O 13
Introduction
The consumption of poultry meat tended to
increase in many countries in the world in the
last decades (Martinez et al., 2011; Poulta et al.,
2010). A lower price on poultry meat, compared
with other meats (beef, pork etc.), affects the
increasing demand for poultry meat. The
productivity and production cost of broiler
chickens are directly related to the amount of
feed fed, the proportion of crude protein in the
feed, and the biological value and price of the
feed. Although approximately 70 % of total
production cost in poultry farming relates to feed
(Marcu et al., 2013), increases in production
efficiency and low production costs of poultry
meat are achieved by means of a short
production cycle, fast-growing broiler chicken
crosses and complete, protein-rich diets.
Poultry diets mostly consist of maize, wheat
and soya flour; for this reason, increases in the
price of grains and protein feeds on the global
market undoubtedly affect the production cost of
poultry meat. As stated by the European
Parliament, a considerable proportion of imported
maize and soya used in animal diets is genetically
modified. At the same time, producers of
livestock products in the EU cannot do without
plant protein imports from third countries, as
there is a lack of crude protein-rich feedstuffs
produced in the EU. The EU produces only 30 %
of the total quantity of protein feed crops (Protein
Crops…, 2014). Large imports of protein crops
contribute to agricultural instability and
negatively influence agricultural producers as well
cause price volatility. The dependence of EU food
producers on feed market price fluctuations
affects the production cost of their products as
well. According to the forecasts of Food and
Agriculture Organisation of the United Nations,
the price on grain (maize) is going to rise by
20 % in the period 2011-2020, which will hike
the price of meat (poultry) by 30 % (AVEC
Annual Report, 2012).
In Latvia, too, poultry enterprises provide the
necessary protein level in poultry diets, including
broiler chicken diets, with imported crude
protein-rich feedstuffs. They are: feed yeast,
soya, sunflower oil meal, maize flour etc.
According to analyses of data on production costs
in livestock farming, the greatest expenditures
relate to feed costs; yet, a detailed analysis of
costs shows that the greatest costs may be
attributed to imported feed, its components,
Proceedings of the 2016 International Conference “ECONOMIC SCIENCE FOR RURAL DEVELOPMENT” No 41
Jelgava, LLU ESAF, 21-22 April 2016, pp. 266-273
1Corresponding author. Tel.:+371 28206624. E-mail address: [email protected] 267
whereas the proportion of costs of domestic and
own-produced feed is insignificant. So, to reduce
the consumption of imported protein-rich
feedstuffs in agricultural animal and poultry diets
and to lower the production cost of meat, it is
necessary to use protein crops produced
domestically.
In recent years, the area sown with legumes
(faba beans, peas), which is an important source
of feed protein, considerably increased in Latvia.
The total area under faba beans increased 19
times from 2010 to 2015 – from 1.3 thou ha in
2010 to 25.9 thou ha in 2015 –, while the area
cropped with peas rose 3.2 times during the
same period – from 1.2 thou ha in 2010 to 3.8
thou ha in 2015 (RSS, 2015).
Such a sharp increase in the area sown with
faba beans has been promoted by the EU policy
aimed at protecting and enhancing biological
diversity on agricultural holdings. Legumes
considerably reduce CO2 emissions, thus,
reducing the imports and consumption of mineral
nitrogen. According to the EU Regulation No
1307/2013, a new payment scheme aimed at
climate- and environment-friendly agricultural
practices or the green payment scheme, which is
closely associated with the single area payment
scheme, is available within the direct payments
scheme. The area sown with nitrogen-absorbing
crops, including the area under faba beans, is
eligible for the green payment scheme (RSS,
2015).
Faba beans are a high-yield crop whose
economic role is very significant. Faba beans are
an excellent feed concentrate for domestic
poultry and agricultural animals, as they contain
22-35% protein, according to some research
studies, even 26-38% protein (Zute, 2014). This
means that a mixture of faba beans and peas,
which contain 20-23% protein, can provide the
necessary amount of protein for poultry as well
as increase the proportion of domestic protein-
rich feedstuffs and lower the production cost of
products in farming, i.e. to reach higher
efficiency.
Although faba beans are a significant source
of protein, a few research studies on the use of
domestically grown faba beans in agricultural
animal and poultry diets in the economic aspect
have been conducted to date. That is why, the
research aim is to identify economic gains from
the production of broiler chicken meat if using
domestic faba beans in broiler chicken diets. To
achieve the aim, the following specific research
tasks were set: 1) to identify the effect of use of
faba beans on the cost of broiler chicken feed; 2)
to assess changes in broiler chicken productivity
due to faba bean diets.
Materials and methods
The economic efficiency of use of protein-rich
crops grown in Latvia for broiler chicken diets
was assessed employing the experimental
method, i.e. faba beans and their mixture with
peas were added to the diets, so that the dietary
component examined represents the key factor
affecting the productivity of broiler chickens. The
analytical research employed the monographic
method, analysis and synthesis, data grouping
etc. The research used research papers by
national and foreign scientists, data provided by
the Rural Support Service (RSS) and the Central
Statistical Bureau as well as findings of the
research project “Enhancing of Legumes Growing
in Europe through Sustainable Cropping for
Protein Supply for Food and Feed”
(EUROLEGUME).
The feeding experiment was conducted on
broiler chickens of the cross Ross 308, which
were split into four analogous groups (n=30).
The chickens were reared in an intensive system
on the permanent litter, with a density of 12
chicks on 1 m2 under adequate animal welfare
conditions. Feed and drinking water were
persistently available to all group chickens.
In accordance with the recommendations for
rearing the cross Ross 308, the chickens are sold
at the age of 38-42 days (Broilers ROSS
Proceedings of the 2016 International Conference “ECONOMIC SCIENCE FOR RURAL DEVELOPMENT” No 41
Jelgava, LLU ESAF, 21-22 April 2016, pp. 266-273
1Corresponding author. Tel.:+371 28206624. E-mail address: [email protected] 268
Management Handbook, 2014). The bodyweight
at slaughter increased progressively with the age.
The net gain, which takes into account both the
feed and rearing costs, reached a maximum
between 42 and 49 days of age, and then
decreased (Baeza et al., 2011). Poultry
enterprises traditionally use a 42-day broiler
production cycle (Kleyn, 2002).
Based on the intensity of growth of broilers
and their organism requirements, diets for
broilers are divided into three stages: pre-start
(0-10 days), grower (11-26 days) and finisher
(27 days to the selling age). All group broilers
were fed diets of equal energy content that were
balanced in accordance with the nutrition
specifications for the cross ROSS 308 (Broilers
ROSS Management Handbook, 2014).
To provide the necessary amount of crude
protein in the diet, the broiler ration was
supplemented with wheat grains and soybean oil
meal in accordance with the standards adopted in
the country. Starting from the 11th day, the
experimental groups’ diets were supplemented
with faba beans and their mixture with peas in
different amounts, proportionally reducing the
amount of soybean oil meal (3-8%) in the ration
of each experimental group according to the
experimental scheme (Table 1).
The economic efficiency of consumption of
feed by broilers was identified using the feed
conversion ratio that may be calculated by
formula 1:
(1)
where:
FCR - feed conversion ratio (ROSS-308
Broilers Management Handbook, 2014).
However, the economic indicators of broiler
productivity and growth were calculated using
the production efficiency factor. It takes into
account the live weight, age and survival of
broilers and their feed conversion and may be
calculated by the formula 2:
(2)
Where:
PEF - production efficiency factor;
FCR - feed conversion ratio (Broilers ROSS
Management Handbook, 2014).
Data on broiler chicken live weight were
analysed by the analysis of variance (ANOVA) at
the significance level α=0.05.
Research results and discussion
Effect of faba bean diets on broiler chicken
feed costs
In raising the production efficiency of broiler
chicken meat, it is important to achieve increases
in the live weight of broilers as well as to reduce
the cost of feed consumption in order to increase
the productivity efficiency index. In this aspect,
an important factor is the cost of feed and the
cost of crude protein available in feed.
The soybean oil meal added to the
experimental feed mixture contained, on
average, 50.61 % crude protein in the dry matter
sample and 44.24 % in the natural one.
However, the amount of crude protein in the dry
matter of faba beans ranged from 26.86 % to
31.68 %, while for peas it ranged within
18.57-26.38 %. The soybean oil meal contained
1.72-1.96 times more crude protein than it was
in peas and faba beans; it indicated that peas
and beans could not fully replace soybean oil
meal in standard poultry feed mixtures because
of a lower crude protein content – the crude
protein was substituted only partially.
To provide the amount of crude protein
needed for broilers at the growth stage
(10-26 days), they were fed a diet containing 28-
30 % soybean oil meal, while at the finishing
stage (from 27 days) they were fed a diet with
18-24 % soybean oil meal (Ross 308 Broiler:
Nutrition Specifications, 2014).
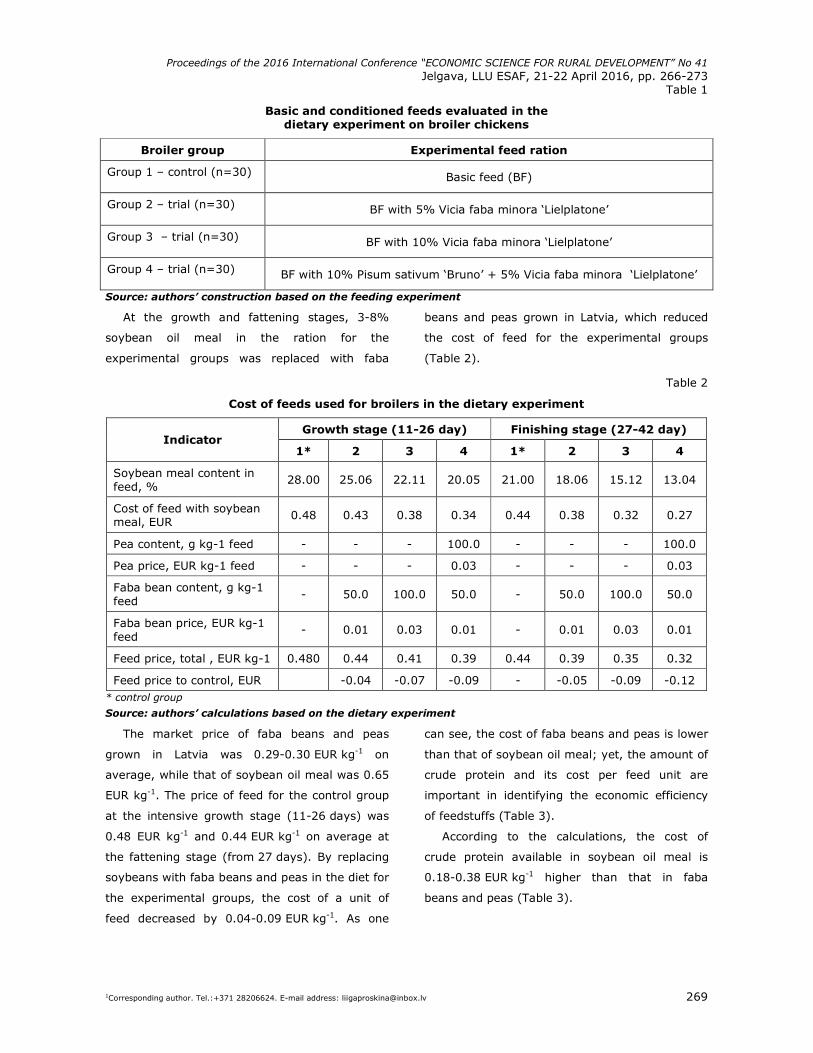
Proceedings of the 2016 International Conference “ECONOMIC SCIENCE FOR RURAL DEVELOPMENT” No 41
Jelgava, LLU ESAF, 21-22 April 2016, pp. 266-273
1Corresponding author. Tel.:+371 28206624. E-mail address: [email protected] 269
Table 1
Basic and conditioned feeds evaluated in the dietary experiment on broiler chickens
Broiler group Experimental feed ration
Group 1 – control (n=30) Basic feed (BF)
Group 2 – trial (n=30) BF with 5% Vicia faba minora ‘Lielplatone’
Group 3 – trial (n=30) BF with 10% Vicia faba minora ‘Lielplatone’
Group 4 – trial (n=30) BF with 10% Pisum sativum ‘Bruno’ + 5% Vicia faba minora ‘Lielplatone’
Source: authors’ construction based on the feeding experiment
At the growth and fattening stages, 3-8%
soybean oil meal in the ration for the
experimental groups was replaced with faba
beans and peas grown in Latvia, which reduced
the cost of feed for the experimental groups
(Table 2).
Table 2
Cost of feeds used for broilers in the dietary experiment
Growth stage (11-26 day) Finishing stage (27-42 day) Indicator
1* 2 3 4 1* 2 3 4
Soybean meal content in feed, %
28.00 25.06 22.11 20.05 21.00 18.06 15.12 13.04
Cost of feed with soybean meal, EUR
0.48 0.43 0.38 0.34 0.44 0.38 0.32 0.27
Pea content, g kg-1 feed - - - 100.0 - - - 100.0
Pea price, EUR kg-1 feed - - - 0.03 - - - 0.03
Faba bean content, g kg-1 feed
- 50.0 100.0 50.0 - 50.0 100.0 50.0
Faba bean price, EUR kg-1 feed
- 0.01 0.03 0.01 - 0.01 0.03 0.01
Feed price, total , EUR kg-1 0.480 0.44 0.41 0.39 0.44 0.39 0.35 0.32
Feed price to control, EUR -0.04 -0.07 -0.09 - -0.05 -0.09 -0.12 * control group
Source: authors’ calculations based on the dietary experiment
The market price of faba beans and peas
grown in Latvia was 0.29-0.30 EUR kg-1 on
average, while that of soybean oil meal was 0.65
EUR kg-1. The price of feed for the control group
at the intensive growth stage (11-26 days) was
0.48 EUR kg-1 and 0.44 EUR kg-1 on average at
the fattening stage (from 27 days). By replacing
soybeans with faba beans and peas in the diet for
the experimental groups, the cost of a unit of
feed decreased by 0.04-0.09 EUR kg-1. As one
can see, the cost of faba beans and peas is lower
than that of soybean oil meal; yet, the amount of
crude protein and its cost per feed unit are
important in identifying the economic efficiency
of feedstuffs (Table 3).
According to the calculations, the cost of
crude protein available in soybean oil meal is
0.18-0.38 EUR kg-1 higher than that in faba
beans and peas (Table 3).
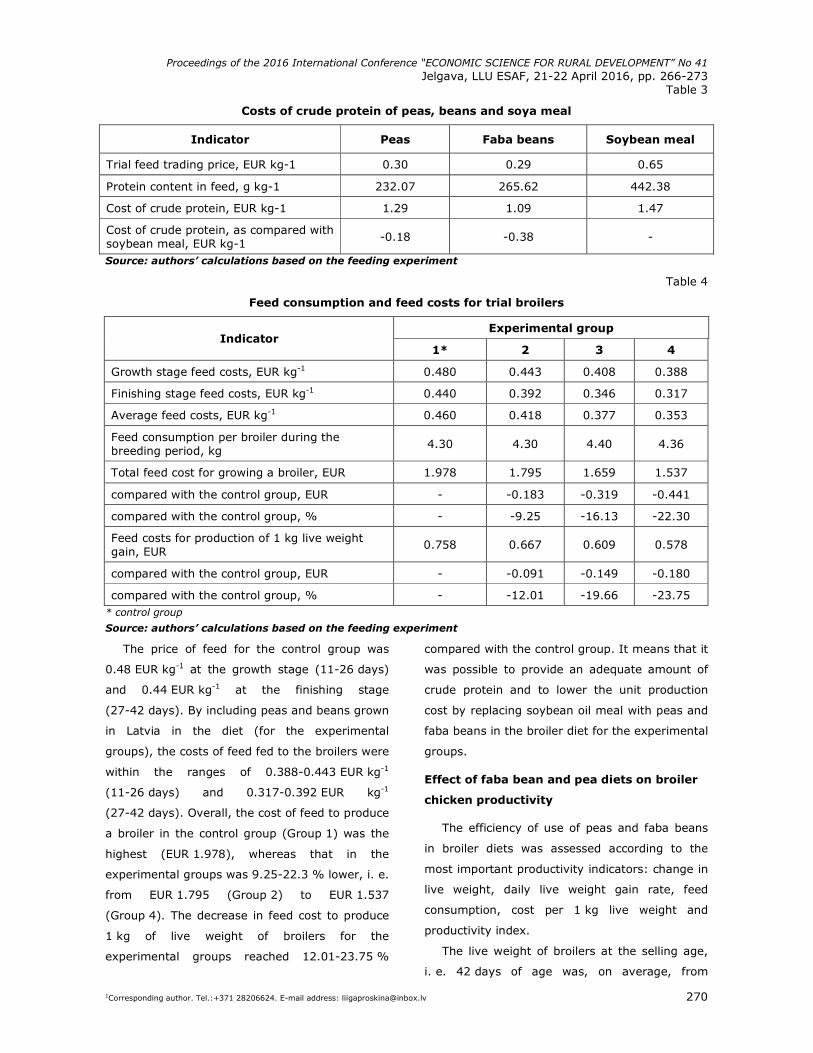
Proceedings of the 2016 International Conference “ECONOMIC SCIENCE FOR RURAL DEVELOPMENT” No 41
Jelgava, LLU ESAF, 21-22 April 2016, pp. 266-273
1Corresponding author. Tel.:+371 28206624. E-mail address: [email protected] 270
Table 3
Costs of crude protein of peas, beans and soya meal
Indicator Peas Faba beans Soybean meal
Trial feed trading price, EUR kg-1 0.30 0.29 0.65
Protein content in feed, g kg-1 232.07 265.62 442.38
Cost of crude protein, EUR kg-1 1.29 1.09 1.47
Cost of crude protein, as compared with soybean meal, EUR kg-1
-0.18 -0.38 -
Source: authors’ calculations based on the feeding experiment
Table 4
Feed consumption and feed costs for trial broilers
Experimental group Indicator
1* 2 3 4
Growth stage feed costs, EUR kg-1 0.480 0.443 0.408 0.388
Finishing stage feed costs, EUR kg-1 0.440 0.392 0.346 0.317
Average feed costs, EUR kg-1 0.460 0.418 0.377 0.353
Feed consumption per broiler during the breeding period, kg
4.30 4.30 4.40 4.36
Total feed cost for growing a broiler, EUR 1.978 1.795 1.659 1.537
compared with the control group, EUR - -0.183 -0.319 -0.441
compared with the control group, % - -9.25 -16.13 -22.30
Feed costs for production of 1 kg live weight gain, EUR
0.758 0.667 0.609 0.578
compared with the control group, EUR - -0.091 -0.149 -0.180
compared with the control group, % - -12.01 -19.66 -23.75 * control group
Source: authors’ calculations based on the feeding experiment
The price of feed for the control group was
0.48 EUR kg-1 at the growth stage (11-26 days)
and 0.44 EUR kg-1 at the finishing stage
(27-42 days). By including peas and beans grown
in Latvia in the diet (for the experimental
groups), the costs of feed fed to the broilers were
within the ranges of 0.388-0.443 EUR kg-1
(11-26 days) and 0.317-0.392 EUR kg-1
(27-42 days). Overall, the cost of feed to produce
a broiler in the control group (Group 1) was the
highest (EUR 1.978), whereas that in the
experimental groups was 9.25-22.3 % lower, i. e.
from EUR 1.795 (Group 2) to EUR 1.537
(Group 4). The decrease in feed cost to produce
1 kg of live weight of broilers for the
experimental groups reached 12.01-23.75 %
compared with the control group. It means that it
was possible to provide an adequate amount of
crude protein and to lower the unit production
cost by replacing soybean oil meal with peas and
faba beans in the broiler diet for the experimental
groups.
Effect of faba bean and pea diets on broiler
chicken productivity
The efficiency of use of peas and faba beans
in broiler diets was assessed according to the
most important productivity indicators: change in
live weight, daily live weight gain rate, feed
consumption, cost per 1 kg live weight and
productivity index.
The live weight of broilers at the selling age,
i. e. 42 days of age was, on average, from
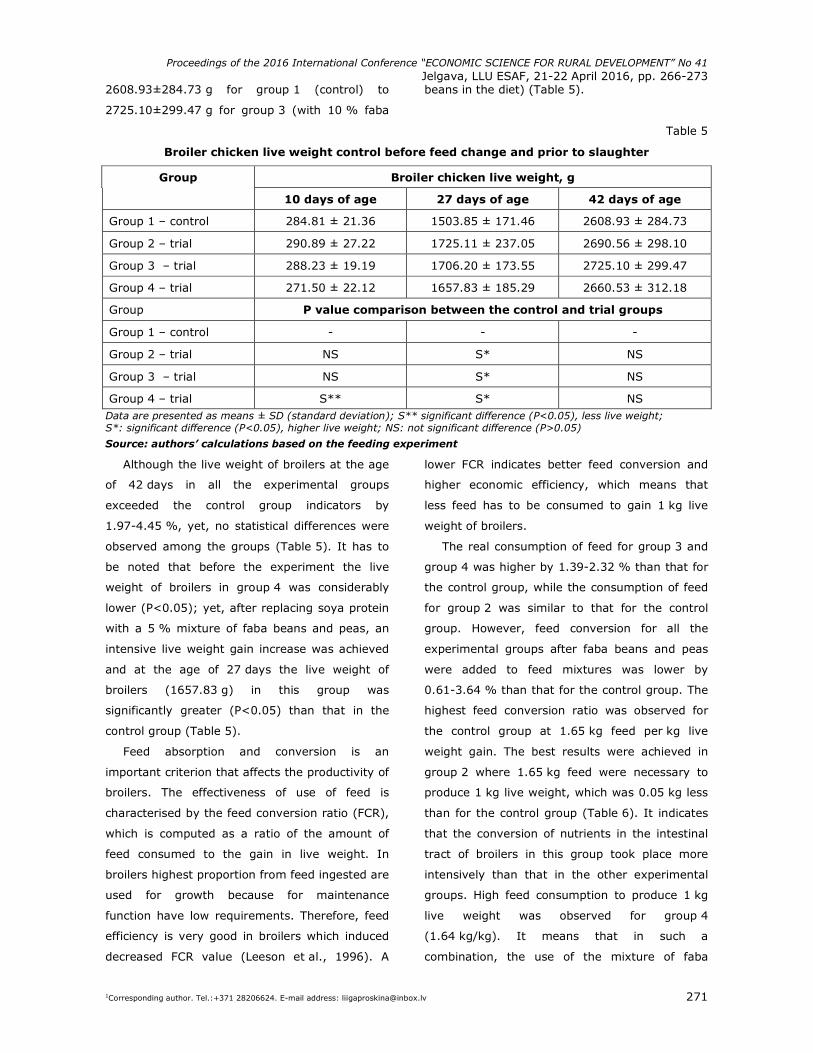
Proceedings of the 2016 International Conference “ECONOMIC SCIENCE FOR RURAL DEVELOPMENT” No 41
Jelgava, LLU ESAF, 21-22 April 2016, pp. 266-273
1Corresponding author. Tel.:+371 28206624. E-mail address: [email protected] 271
2608.93±284.73 g for group 1 (control) to
2725.10±299.47 g for group 3 (with 10 % faba
beans in the diet) (Table 5).
Table 5
Broiler chicken live weight control before feed change and prior to slaughter
Group Broiler chicken live weight, g
10 days of age 27 days of age 42 days of age
Group 1 – control 284.81 ± 21.36 1503.85 ± 171.46 2608.93 ± 284.73
Group 2 – trial 290.89 ± 27.22 1725.11 ± 237.05 2690.56 ± 298.10
Group 3 – trial 288.23 ± 19.19 1706.20 ± 173.55 2725.10 ± 299.47
Group 4 – trial 271.50 ± 22.12 1657.83 ± 185.29 2660.53 ± 312.18
Group P value comparison between the control and trial groups
Group 1 – control - - -
Group 2 – trial NS S* NS
Group 3 – trial NS S* NS
Group 4 – trial S** S* NS Data are presented as means ± SD (standard deviation); S** significant difference (P<0.05), less live weight; S*: significant difference (P<0.05), higher live weight; NS: not significant difference (P>0.05)
Source: authors’ calculations based on the feeding experiment
Although the live weight of broilers at the age
of 42 days in all the experimental groups
exceeded the control group indicators by
1.97-4.45 %, yet, no statistical differences were
observed among the groups (Table 5). It has to
be noted that before the experiment the live
weight of broilers in group 4 was considerably
lower (P<0.05); yet, after replacing soya protein
with a 5 % mixture of faba beans and peas, an
intensive live weight gain increase was achieved
and at the age of 27 days the live weight of
broilers (1657.83 g) in this group was
significantly greater (P<0.05) than that in the
control group (Table 5).
Feed absorption and conversion is an
important criterion that affects the productivity of
broilers. The effectiveness of use of feed is
characterised by the feed conversion ratio (FCR),
which is computed as a ratio of the amount of
feed consumed to the gain in live weight. In
broilers highest proportion from feed ingested are
used for growth because for maintenance
function have low requirements. Therefore, feed
efficiency is very good in broilers which induced
decreased FCR value (Leeson et al., 1996). A
lower FCR indicates better feed conversion and
higher economic efficiency, which means that
less feed has to be consumed to gain 1 kg live
weight of broilers.
The real consumption of feed for group 3 and
group 4 was higher by 1.39-2.32 % than that for
the control group, while the consumption of feed
for group 2 was similar to that for the control
group. However, feed conversion for all the
experimental groups after faba beans and peas
were added to feed mixtures was lower by
0.61-3.64 % than that for the control group. The
highest feed conversion ratio was observed for
the control group at 1.65 kg feed per kg live
weight gain. The best results were achieved in
group 2 where 1.65 kg feed were necessary to
produce 1 kg live weight, which was 0.05 kg less
than for the control group (Table 6). It indicates
that the conversion of nutrients in the intestinal
tract of broilers in this group took place more
intensively than that in the other experimental
groups. High feed consumption to produce 1 kg
live weight was observed for group 4
(1.64 kg/kg). It means that in such a
combination, the use of the mixture of faba
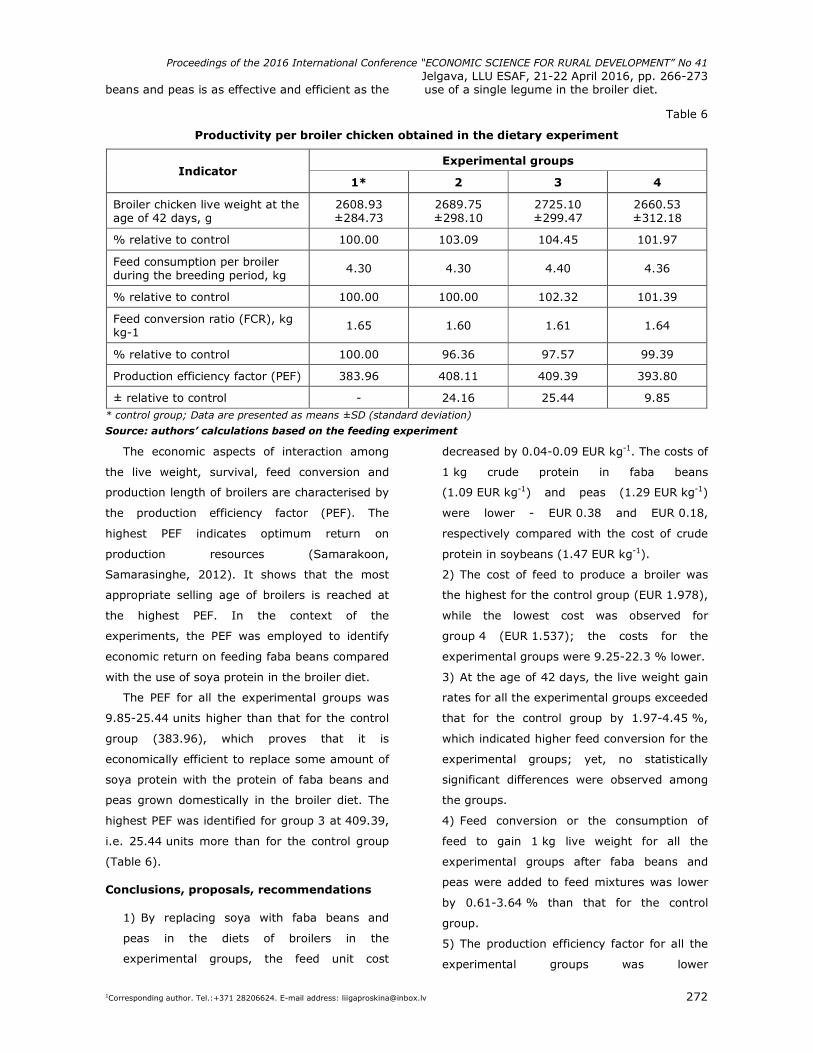
Proceedings of the 2016 International Conference “ECONOMIC SCIENCE FOR RURAL DEVELOPMENT” No 41
Jelgava, LLU ESAF, 21-22 April 2016, pp. 266-273
1Corresponding author. Tel.:+371 28206624. E-mail address: [email protected] 272
beans and peas is as effective and efficient as the use of a single legume in the broiler diet.
Table 6
Productivity per broiler chicken obtained in the dietary experiment
Experimental groups Indicator
1* 2 3 4
Broiler chicken live weight at the age of 42 days, g
2608.93 ±284.73
2689.75 ±298.10
2725.10 ±299.47
2660.53 ±312.18
% relative to control 100.00 103.09 104.45 101.97
Feed consumption per broiler during the breeding period, kg
4.30 4.30 4.40 4.36
% relative to control 100.00 100.00 102.32 101.39
Feed conversion ratio (FCR), kg kg-1
1.65 1.60 1.61 1.64
% relative to control 100.00 96.36 97.57 99.39
Production efficiency factor (PEF) 383.96 408.11 409.39 393.80
± relative to control - 24.16 25.44 9.85 * control group; Data are presented as means ±SD (standard deviation)
Source: authors’ calculations based on the feeding experiment
The economic aspects of interaction among
the live weight, survival, feed conversion and
production length of broilers are characterised by
the production efficiency factor (PEF). The
highest PEF indicates optimum return on
production resources (Samarakoon,
Samarasinghe, 2012). It shows that the most
appropriate selling age of broilers is reached at
the highest PEF. In the context of the
experiments, the PEF was employed to identify
economic return on feeding faba beans compared
with the use of soya protein in the broiler diet.
The PEF for all the experimental groups was
9.85-25.44 units higher than that for the control
group (383.96), which proves that it is
economically efficient to replace some amount of
soya protein with the protein of faba beans and
peas grown domestically in the broiler diet. The
highest PEF was identified for group 3 at 409.39,
i.e. 25.44 units more than for the control group
(Table 6).
Conclusions, proposals, recommendations
1) By replacing soya with faba beans and
peas in the diets of broilers in the
experimental groups, the feed unit cost
decreased by 0.04-0.09 EUR kg-1. The costs of
1 kg crude protein in faba beans
(1.09 EUR kg-1) and peas (1.29 EUR kg-1)
were lower - EUR 0.38 and EUR 0.18,
respectively compared with the cost of crude
protein in soybeans (1.47 EUR kg-1).
2) The cost of feed to produce a broiler was
the highest for the control group (EUR 1.978),
while the lowest cost was observed for
group 4 (EUR 1.537); the costs for the
experimental groups were 9.25-22.3 % lower.
3) At the age of 42 days, the live weight gain
rates for all the experimental groups exceeded
that for the control group by 1.97-4.45 %,
which indicated higher feed conversion for the
experimental groups; yet, no statistically
significant differences were observed among
the groups.
4) Feed conversion or the consumption of
feed to gain 1 kg live weight for all the
experimental groups after faba beans and
peas were added to feed mixtures was lower
by 0.61-3.64 % than that for the control
group.
5) The production efficiency factor for all the
experimental groups was lower
Proceedings of the 2016 International Conference “ECONOMIC SCIENCE FOR RURAL DEVELOPMENT” No 41
Jelgava, LLU ESAF, 21-22 April 2016, pp. 266-273
1Corresponding author. Tel.:+371 28206624. E-mail address: [email protected] 273
(by 9.85-25.44 units) compared with the
control group; it indicates it is economically
efficient to replace some amount of soya
protein with the protein of faba beans and
peas grown domestically in the broiler diet.
6) The experimental results showed that the
rations of faba beans in the broiler diet, which
replace soybean oil meal, meet the
physiological requirements of the organism of
broilers and provides the broilers with
necessary nutrients, thereby contributing to
their growth and increases in their live weight,
reducing feed costs and resulting in increases
in economic return.
Acknowledgements
Authors acknowledge scientific research
project “Enhancing of Legumes Growing in
Europe through Sustainable Cropping for Protein
Supply for Food and Feed” (EUROLEGUME)
Agreement No 613781, which provided financial
support for this study.
Bibliography
1. AVEC Annual Report 2012 (2012). Belgium: Association of Poultry Processors and Poultry Trade in the EU Countries - ASBL, p. 52.
2. Baeza, E., Arnould, C., Jlali, M., Chartrin, P., Gigaud, V., Mercerand, F., Durand, C., Meteau, K., Le Bihan-Duval, E., Berri, C. (2011). Influence of Increasing Slaughter Age of Chickens on Meat Quality, Welfare, and Technical and Economic Results. Journal of Animal Science, Volume 90, pp. 2003-2013. American Society of Animal Science, Champaign. Retrieved: http://www.journalofanimalscience.org/content/90/6/2003.full.pdf+html. Access: 5.01.2016.
3. Broiler Ross Management Handbook (2014). Ross an Aviagen Brand. Retrieved: http://en.aviagen.com/assets/Tech_Center/Ross_Broiler/Ross-Broiler-Handbook-2014i-EN.pdf. Access: 15.12.2015.
4. EU REGULATION No 1307/2013 OF THE EUROPEAN PARLIAMENT AND OF THE COUNCIL (2013) Establishing rules for direct payments to farmers under support schemes within the framework of the common agricultural policy and repealing Council Regulation (EC) No 637/2008 and Council Regulation (EC) No 73/2009 Retrieved: http://eur-lex.europa.eu/legal-content/EN/TXT/HTML/?uri=CELEX:32013R1307&from=LV Access: 15.12.2015.
5. Kleyn, R. (2002). Strategies for Managing Expensive Feed on Farm. Retrieved: http://spesfeed.com/?wpdmact=process&did=NDQuaG90bGluaw== Access: 08.09.2015.
6. Leeson, S., Caston, L.J., Summers, J.D. (1996). Broiler Response to Diet Energy, Poultry Science, Volume 75, pp. 529-535.
7. Marcu, A., Vacaru-Opriş, I., Dumitrescu, G., Petculescu Ciochină, L., Marcu, A., Nicula, M., Peţ, I., Dronca, D., Kelciov, B., Mariş, C. (2013). The Influence of Genetics on Economic Efficiency of Broiler Chickens Growth. Scientific Papers: Animal Science and Biotechnologies, Volume 46, Issue 2, pp. 339-346.
8. Martinez Michel, L., Anders, S., Wismer, W.V. (2011). Consumer Preferences and Willingness to Pay for Value-Added Chicken Product Attributes. Journal of Food Science. Volume 76, Issue 8, pp. 469-477.
9. Poulta, E., Heikkila, J., Forsman-Hugg, S., Isoniemi, M., Makela, J. (2010). Consumer Choice of Broiler Meat: the Effects of Country Origin and Production Methods. Food Quality and Preference, Volume 21, Issue 5, pp. 539–546.
10. Protein Crops: final report (2014) EIP-AGRI Focus Group. Retrieved: https://ec.europa.eu/eip/agriculture/sites/agri-eip/files/fg2_protein_crops_final_report_2014_en.pdf. Access: 16.12.2015.
11. Rural Support Service (RSS) (2015). Area Payments. Retrieved: http://lad.gov.lv/lv/statistika/platibu-maksajumi/. Access: 05.01.2016.
12. Samarakoon, S.M.R., Samarasinghe, K. (2012). Strategies to Improve the Cost Effectiveness of Broiler Production. Tropical Agricultural Research, Volume 23, Issue 4, pp. 338–346.
13. Zute, S. (2014) Legumes – an Alternative for Soybeans in the Production of Protein-rich Feed Concentrate: Agrotechnological and Economic Justification for the Conditions in Latvia. 2014 data (in Latvian). Retrieved: http://www.stendeselekcija.lv/jaunumi/data/augsuplades/files/Paksaugi_VSGSI_11022015.pdf. Access: 05.01.2016.
Proceedings of the 2016 International Conference “ECONOMIC SCIENCE FOR RURAL DEVELOPMENT” No 41
Jelgava, LLU ESAF, 21-22 April 2016, pp. 274-281
1Corresponding author. Tel.: + 48 22 5934036; fax: + 48 22 5934031. E-mail address: [email protected]. 274
BIOECONOMICS AS AN INTERDISCIPLINARY SCIENCE Aldona Zawojska1, Dr.hab.oec., assistant professor; Tomasz Siudek1, Dr.hab.oec.,
associate professor
1 Warsaw University of Life Sciences – SGGW, Poland
Abstract. The aim of this paper is to identify and elucidate the bioeconomics, which traces the links among biology
and economy, as a relatively new field of economics and political economy. To make a clear distinction between
bioeconomics and bioeconomy, the paper presents a set of definitions of both categories and explains the reasoning
behind them. This research is of theoretical nature and is based on extensive review of the scientific literature dealing
with the relationship of biology with social sciences, including theories of leading contributors to economic thought.
Such phenomena as evolution, cooperation, competition over scarce resources, selection, work division, signalling,
territorialism and migration are the common to the economy of nature and the human economy. The study finds out
that the conceptual and methodological trade between economic discourse and biological discourse goes back, at least,
to the 18th century but many parallels between economic and social behaviour of humans and biology were observed
and studied much earlier. Contemporary bioeconomists argue that economics and biology can mutually enrich each
other, emphasize on what biology can be taught from economics and how economics can accommodate insights from
biology.
Key words: bioeconomics, bioeconomy, economics, history of economic thought.
JEL code: Q57, A12, B52
Introduction
Many problems and challenges in today’s
world require economic sciences to work
effectively with other disciplines. As Popper puts
it, “We are not students of some subject matter
but students of problems. And problems may cut
right across the borders of any subject matter or
discipline” (Popper, 1963).
Economics is a social science, born out of
philosophy and history but drawing of the
insights of sociology, geography, psychology, the
study of law, government and politics, and, to a
rising extent, the natural sciences, including
biological and environmental sciences that offer
very much to economic scientists. Obviously, any
well-educated economist knows that the
beginning of economics (political economy) as a
modern academic discipline has been marked by
the publishing of Adam Smith’s “An Inquiry into
the Nature and Causes of the Wealth of Nations”
in 1776. Smith and other classics, however, did
not build their theories in a vacuum but were
influenced by the precursors of economics and
the natural scientists as well.
The focus in this paper is, generally, on the
interactions between economics and biology. Its
purpose is to present a relatively new branch of
economics and political economy called
bioeconomics. As terms bioeconomics and
bioeconomy are often used interchangeably, the
paper task is to provide precise definitions and
interpretations of both in order to demonstrate
the distinction between them. The research is
theoretically descriptive in nature and is rooted in
extensive examination of literature on the
relationship of biology sciences with social
sciences, including theories of leading
contributors of economic thought. As it will be
shown in the next section of the paper, biology
and economics have interacted for centuries, and
many scholars studying economic phenomena
and processes were referring to biology.
The term “bioeconomics” (bionomics,
economic biology, biological economy and
environmental economics as antecedents), which
comprises two words: biology and economics,
suggests that bioeconomics can be viewed as
interdisciplinary discipline or research which
closely ties economics to natural sciences (e.g.
evolutionary biology). Robert Axelrod (2008)
describes interdisciplinary research as a mode of
research that integrates information, techniques,
perspectives, concepts and/or theory from two or
more disciplines or bodies of organized or
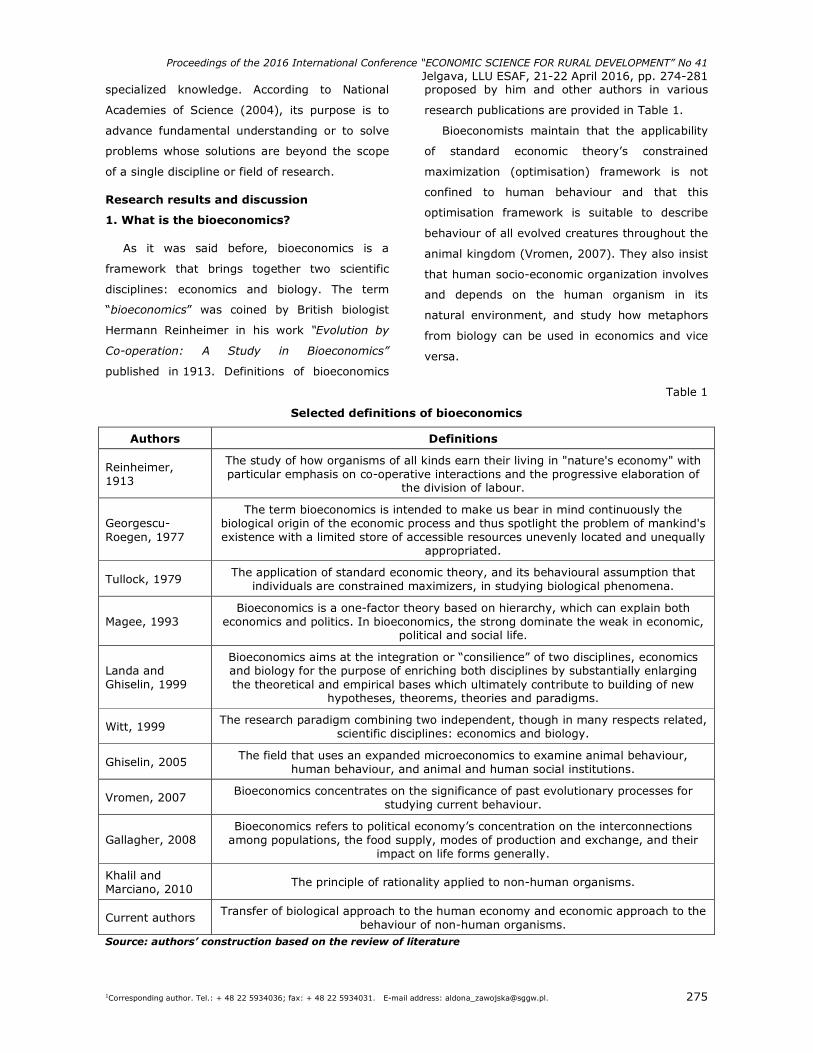
Proceedings of the 2016 International Conference “ECONOMIC SCIENCE FOR RURAL DEVELOPMENT” No 41
Jelgava, LLU ESAF, 21-22 April 2016, pp. 274-281
1Corresponding author. Tel.: + 48 22 5934036; fax: + 48 22 5934031. E-mail address: [email protected]. 275
specialized knowledge. According to National
Academies of Science (2004), its purpose is to
advance fundamental understanding or to solve
problems whose solutions are beyond the scope
of a single discipline or field of research.
Research results and discussion
1. What is the bioeconomics?
As it was said before, bioeconomics is a
framework that brings together two scientific
disciplines: economics and biology. The term
“bioeconomics” was coined by British biologist
Hermann Reinheimer in his work “Evolution by
Co-operation: A Study in Bioeconomics”
published in 1913. Definitions of bioeconomics
proposed by him and other authors in various
research publications are provided in Table 1.
Bioeconomists maintain that the applicability
of standard economic theory’s constrained
maximization (optimisation) framework is not
confined to human behaviour and that this
optimisation framework is suitable to describe
behaviour of all evolved creatures throughout the
animal kingdom (Vromen, 2007). They also insist
that human socio-economic organization involves
and depends on the human organism in its
natural environment, and study how metaphors
from biology can be used in economics and vice
versa.
Table 1
Selected definitions of bioeconomics
Authors Definitions
Reinheimer, 1913
The study of how organisms of all kinds earn their living in "nature's economy" with particular emphasis on co-operative interactions and the progressive elaboration of
the division of labour.
Georgescu-Roegen, 1977
The term bioeconomics is intended to make us bear in mind continuously the biological origin of the economic process and thus spotlight the problem of mankind's existence with a limited store of accessible resources unevenly located and unequally
appropriated.
Tullock, 1979 The application of standard economic theory, and its behavioural assumption that
individuals are constrained maximizers, in studying biological phenomena.
Magee, 1993 Bioeconomics is a one-factor theory based on hierarchy, which can explain both
economics and politics. In bioeconomics, the strong dominate the weak in economic, political and social life.
Landa and Ghiselin, 1999
Bioeconomics aims at the integration or “consilience” of two disciplines, economics and biology for the purpose of enriching both disciplines by substantially enlarging the theoretical and empirical bases which ultimately contribute to building of new
hypotheses, theorems, theories and paradigms.
Witt, 1999 The research paradigm combining two independent, though in many respects related,
scientific disciplines: economics and biology.
Ghiselin, 2005 The field that uses an expanded microeconomics to examine animal behaviour, human behaviour, and animal and human social institutions.
Vromen, 2007 Bioeconomics concentrates on the significance of past evolutionary processes for studying current behaviour.
Gallagher, 2008 Bioeconomics refers to political economy’s concentration on the interconnections among populations, the food supply, modes of production and exchange, and their
impact on life forms generally.
Khalil and Marciano, 2010
The principle of rationality applied to non-human organisms.
Current authors Transfer of biological approach to the human economy and economic approach to the behaviour of non-human organisms.
Source: authors’ construction based on the review of literature
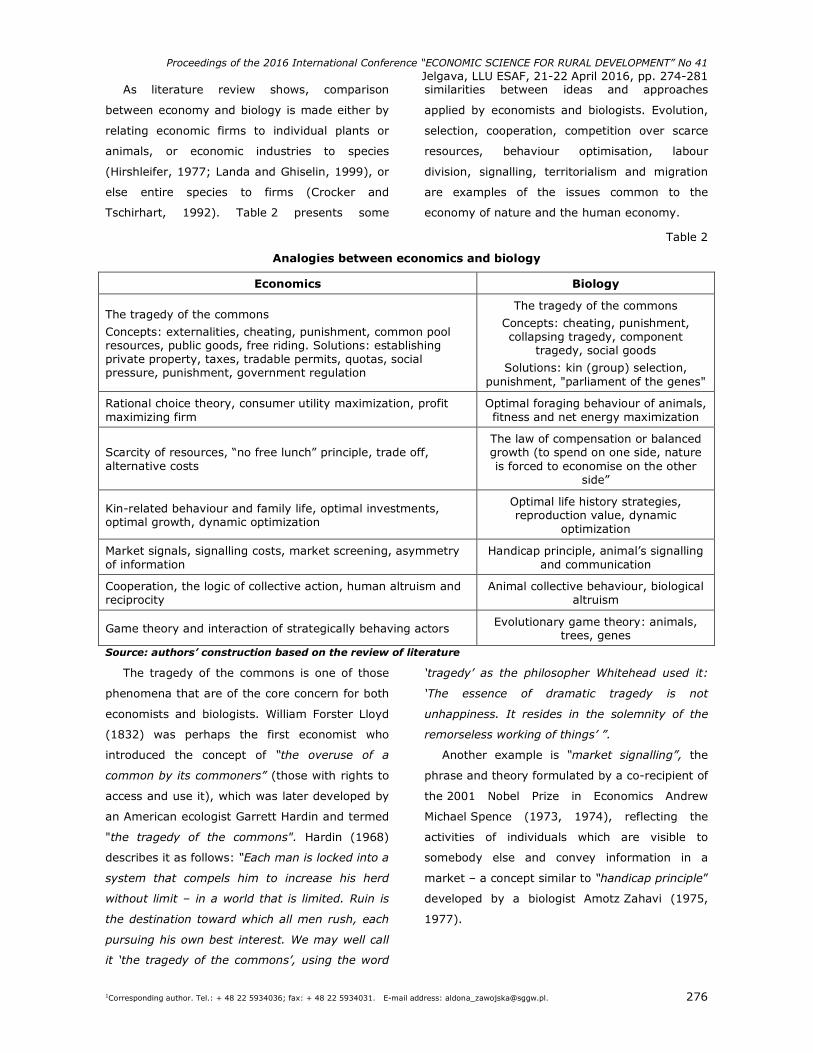
Proceedings of the 2016 International Conference “ECONOMIC SCIENCE FOR RURAL DEVELOPMENT” No 41
Jelgava, LLU ESAF, 21-22 April 2016, pp. 274-281
1Corresponding author. Tel.: + 48 22 5934036; fax: + 48 22 5934031. E-mail address: [email protected]. 276
As literature review shows, comparison
between economy and biology is made either by
relating economic firms to individual plants or
animals, or economic industries to species
(Hirshleifer, 1977; Landa and Ghiselin, 1999), or
else entire species to firms (Crocker and
Tschirhart, 1992). Table 2 presents some
similarities between ideas and approaches
applied by economists and biologists. Evolution,
selection, cooperation, competition over scarce
resources, behaviour optimisation, labour
division, signalling, territorialism and migration
are examples of the issues common to the
economy of nature and the human economy.
Table 2
Analogies between economics and biology
Economics Biology
The tragedy of the commons
Concepts: externalities, cheating, punishment, common pool resources, public goods, free riding. Solutions: establishing private property, taxes, tradable permits, quotas, social pressure, punishment, government regulation
The tragedy of the commons
Concepts: cheating, punishment, collapsing tragedy, component
tragedy, social goods
Solutions: kin (group) selection, punishment, "parliament of the genes"
Rational choice theory, consumer utility maximization, profit maximizing firm
Optimal foraging behaviour of animals, fitness and net energy maximization
Scarcity of resources, “no free lunch” principle, trade off, alternative costs
The law of compensation or balanced growth (to spend on one side, nature is forced to economise on the other
side”
Kin-related behaviour and family life, optimal investments, optimal growth, dynamic optimization
Optimal life history strategies, reproduction value, dynamic
optimization
Market signals, signalling costs, market screening, asymmetry of information
Handicap principle, animal’s signalling and communication
Cooperation, the logic of collective action, human altruism and reciprocity
Animal collective behaviour, biological altruism
Game theory and interaction of strategically behaving actors Evolutionary game theory: animals, trees, genes
Source: authors’ construction based on the review of literature
The tragedy of the commons is one of those
phenomena that are of the core concern for both
economists and biologists. William Forster Lloyd
(1832) was perhaps the first economist who
introduced the concept of “the overuse of a
common by its commoners” (those with rights to
access and use it), which was later developed by
an American ecologist Garrett Hardin and termed
"the tragedy of the commons". Hardin (1968)
describes it as follows: “Each man is locked into a
system that compels him to increase his herd
without limit – in a world that is limited. Ruin is
the destination toward which all men rush, each
pursuing his own best interest. We may well call
it ‘the tragedy of the commons’, using the word
‘tragedy’ as the philosopher Whitehead used it:
‘The essence of dramatic tragedy is not
unhappiness. It resides in the solemnity of the
remorseless working of things’ ”.
Another example is “market signalling”, the
phrase and theory formulated by a co-recipient of
the 2001 Nobel Prize in Economics Andrew
Michael Spence (1973, 1974), reflecting the
activities of individuals which are visible to
somebody else and convey information in a
market – a concept similar to “handicap principle”
developed by a biologist Amotz Zahavi (1975,
1977).
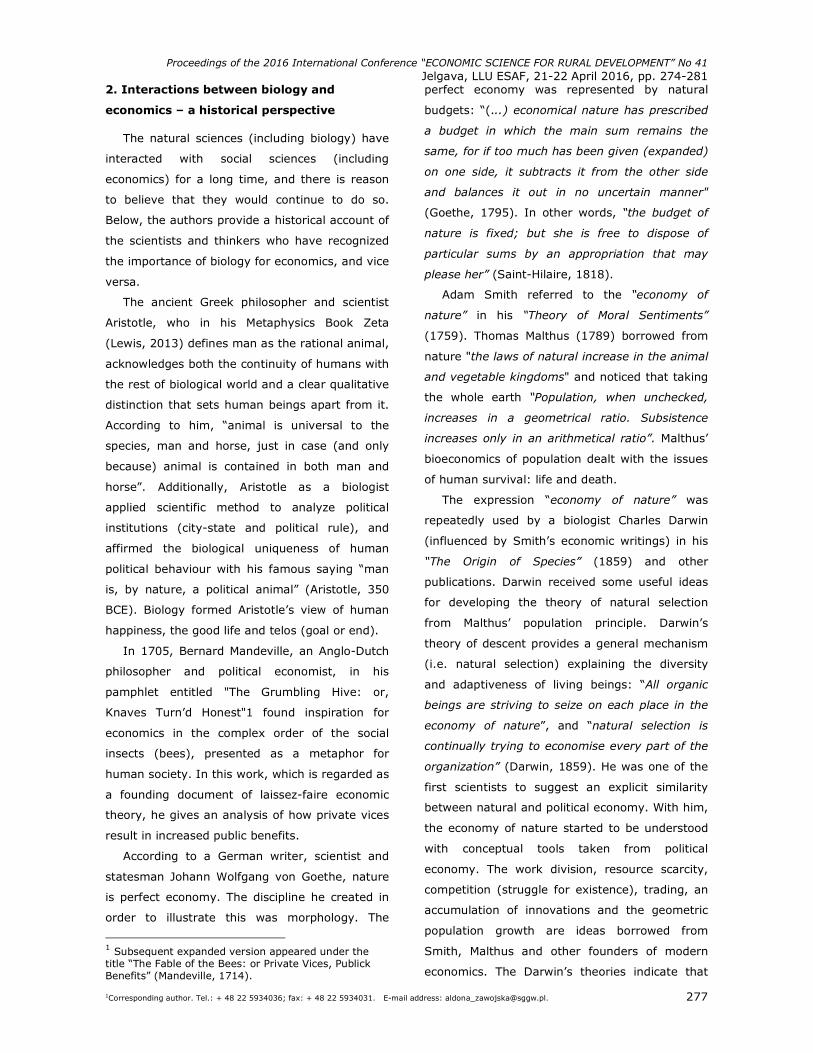
Proceedings of the 2016 International Conference “ECONOMIC SCIENCE FOR RURAL DEVELOPMENT” No 41
Jelgava, LLU ESAF, 21-22 April 2016, pp. 274-281
1Corresponding author. Tel.: + 48 22 5934036; fax: + 48 22 5934031. E-mail address: [email protected]. 277
2. Interactions between biology and
economics – a historical perspective
The natural sciences (including biology) have
interacted with social sciences (including
economics) for a long time, and there is reason
to believe that they would continue to do so.
Below, the authors provide a historical account of
the scientists and thinkers who have recognized
the importance of biology for economics, and vice
versa.
The ancient Greek philosopher and scientist
Aristotle, who in his Metaphysics Book Zeta
(Lewis, 2013) defines man as the rational animal,
acknowledges both the continuity of humans with
the rest of biological world and a clear qualitative
distinction that sets human beings apart from it.
According to him, “animal is universal to the
species, man and horse, just in case (and only
because) animal is contained in both man and
horse”. Additionally, Aristotle as a biologist
applied scientific method to analyze political
institutions (city-state and political rule), and
affirmed the biological uniqueness of human
political behaviour with his famous saying “man
is, by nature, a political animal” (Aristotle, 350
BCE). Biology formed Aristotle’s view of human
happiness, the good life and telos (goal or end).
In 1705, Bernard Mandeville, an Anglo-Dutch
philosopher and political economist, in his
pamphlet entitled "The Grumbling Hive: or,
Knaves Turn’d Honest"1 found inspiration for
economics in the complex order of the social
insects (bees), presented as a metaphor for
human society. In this work, which is regarded as
a founding document of laissez-faire economic
theory, he gives an analysis of how private vices
result in increased public benefits.
According to a German writer, scientist and
statesman Johann Wolfgang von Goethe, nature
is perfect economy. The discipline he created in
order to illustrate this was morphology. The
1 Subsequent expanded version appeared under the title “The Fable of the Bees: or Private Vices, Publick Benefits” (Mandeville, 1714).
perfect economy was represented by natural
budgets: “(...) economical nature has prescribed
a budget in which the main sum remains the
same, for if too much has been given (expanded)
on one side, it subtracts it from the other side
and balances it out in no uncertain manner"
(Goethe, 1795). In other words, “the budget of
nature is fixed; but she is free to dispose of
particular sums by an appropriation that may
please her” (Saint-Hilaire, 1818).
Adam Smith referred to the “economy of
nature” in his “Theory of Moral Sentiments”
(1759). Thomas Malthus (1789) borrowed from
nature "the laws of natural increase in the animal
and vegetable kingdoms" and noticed that taking
the whole earth “Population, when unchecked,
increases in a geometrical ratio. Subsistence
increases only in an arithmetical ratio”. Malthus’
bioeconomics of population dealt with the issues
of human survival: life and death.
The expression “economy of nature” was
repeatedly used by a biologist Charles Darwin
(influenced by Smith’s economic writings) in his
“The Origin of Species” (1859) and other
publications. Darwin received some useful ideas
for developing the theory of natural selection
from Malthus’ population principle. Darwin’s
theory of descent provides a general mechanism
(i.e. natural selection) explaining the diversity
and adaptiveness of living beings: “All organic
beings are striving to seize on each place in the
economy of nature”, and “natural selection is
continually trying to economise every part of the
organization” (Darwin, 1859). He was one of the
first scientists to suggest an explicit similarity
between natural and political economy. With him,
the economy of nature started to be understood
with conceptual tools taken from political
economy. The work division, resource scarcity,
competition (struggle for existence), trading, an
accumulation of innovations and the geometric
population growth are ideas borrowed from
Smith, Malthus and other founders of modern
economics. The Darwin’s theories indicate that
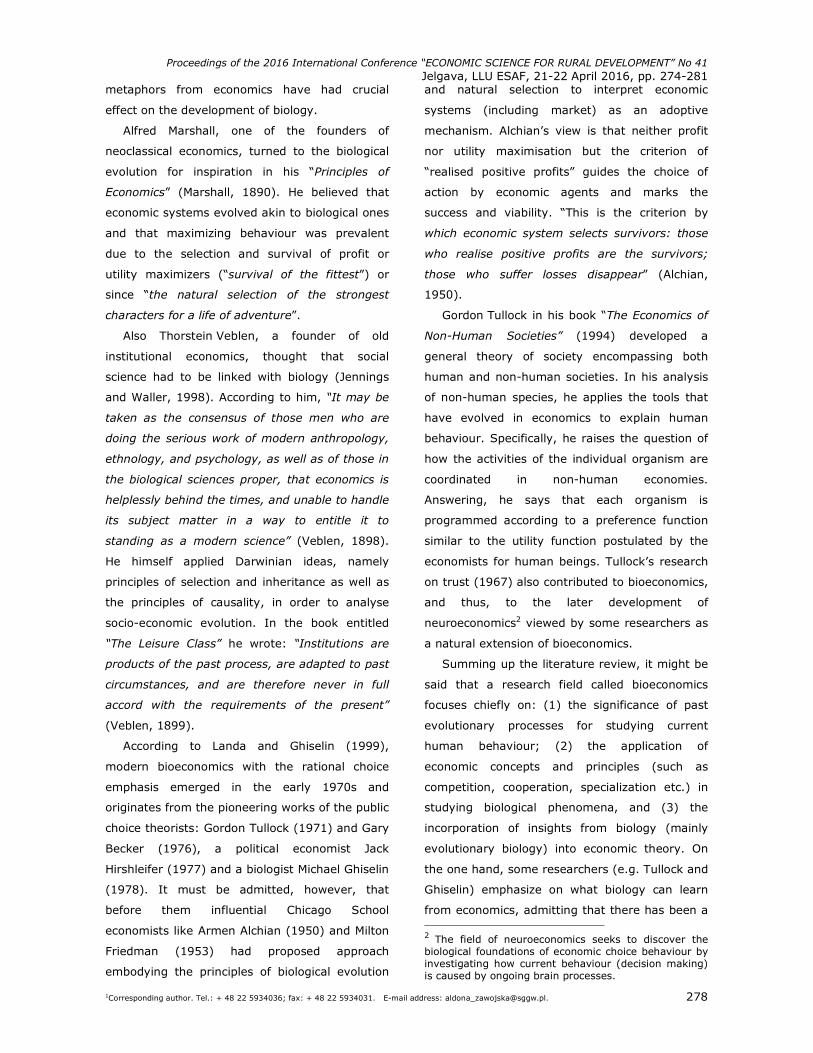
Proceedings of the 2016 International Conference “ECONOMIC SCIENCE FOR RURAL DEVELOPMENT” No 41
Jelgava, LLU ESAF, 21-22 April 2016, pp. 274-281
1Corresponding author. Tel.: + 48 22 5934036; fax: + 48 22 5934031. E-mail address: [email protected]. 278
metaphors from economics have had crucial
effect on the development of biology.
Alfred Marshall, one of the founders of
neoclassical economics, turned to the biological
evolution for inspiration in his “Principles of
Economics” (Marshall, 1890). He believed that
economic systems evolved akin to biological ones
and that maximizing behaviour was prevalent
due to the selection and survival of profit or
utility maximizers (“survival of the fittest”) or
since “the natural selection of the strongest
characters for a life of adventure”.
Also Thorstein Veblen, a founder of old
institutional economics, thought that social
science had to be linked with biology (Jennings
and Waller, 1998). According to him, “It may be
taken as the consensus of those men who are
doing the serious work of modern anthropology,
ethnology, and psychology, as well as of those in
the biological sciences proper, that economics is
helplessly behind the times, and unable to handle
its subject matter in a way to entitle it to
standing as a modern science” (Veblen, 1898).
He himself applied Darwinian ideas, namely
principles of selection and inheritance as well as
the principles of causality, in order to analyse
socio-economic evolution. In the book entitled
“The Leisure Class” he wrote: “Institutions are
products of the past process, are adapted to past
circumstances, and are therefore never in full
accord with the requirements of the present”
(Veblen, 1899).
According to Landa and Ghiselin (1999),
modern bioeconomics with the rational choice
emphasis emerged in the early 1970s and
originates from the pioneering works of the public
choice theorists: Gordon Tullock (1971) and Gary
Becker (1976), a political economist Jack
Hirshleifer (1977) and a biologist Michael Ghiselin
(1978). It must be admitted, however, that
before them influential Chicago School
economists like Armen Alchian (1950) and Milton
Friedman (1953) had proposed approach
embodying the principles of biological evolution
and natural selection to interpret economic
systems (including market) as an adoptive
mechanism. Alchian’s view is that neither profit
nor utility maximisation but the criterion of
“realised positive profits” guides the choice of
action by economic agents and marks the
success and viability. “This is the criterion by
which economic system selects survivors: those
who realise positive profits are the survivors;
those who suffer losses disappear” (Alchian,
1950).
Gordon Tullock in his book “The Economics of
Non-Human Societies” (1994) developed a
general theory of society encompassing both
human and non-human societies. In his analysis
of non-human species, he applies the tools that
have evolved in economics to explain human
behaviour. Specifically, he raises the question of
how the activities of the individual organism are
coordinated in non-human economies.
Answering, he says that each organism is
programmed according to a preference function
similar to the utility function postulated by the
economists for human beings. Tullock’s research
on trust (1967) also contributed to bioeconomics,
and thus, to the later development of
neuroeconomics2 viewed by some researchers as
a natural extension of bioeconomics.
Summing up the literature review, it might be
said that a research field called bioeconomics
focuses chiefly on: (1) the significance of past
evolutionary processes for studying current
human behaviour; (2) the application of
economic concepts and principles (such as
competition, cooperation, specialization etc.) in
studying biological phenomena, and (3) the
incorporation of insights from biology (mainly
evolutionary biology) into economic theory. On
the one hand, some researchers (e.g. Tullock and
Ghiselin) emphasize on what biology can learn
from economics, admitting that there has been a 2 The field of neuroeconomics seeks to discover the biological foundations of economic choice behaviour by investigating how current behaviour (decision making) is caused by ongoing brain processes.
Proceedings of the 2016 International Conference “ECONOMIC SCIENCE FOR RURAL DEVELOPMENT” No 41
Jelgava, LLU ESAF, 21-22 April 2016, pp. 274-281
1Corresponding author. Tel.: + 48 22 5934036; fax: + 48 22 5934031. E-mail address: [email protected]. 279
persistent transfer of ideas and techniques from
economics to biology but not believing (specially
Tullock) that it is possible to learn much about
human society from animal society. On the other
hand, the others (e.g. Becker and Hirshleifer)
argue that economics and biology can be
mutually valuable; economics can accommodate
insights from biology (mainly from evolutionary
biology).
3. What is the bioeconomy?
Bioeconomy is an emerging concept which
probably goes back to the OECD report (2001)
describing economy based on the use of
renewable biological resources. In some
literature, however, it is conflated with the notion
of bioeconomics. In the opinion of the present
authors, the bioeconomics should be seen from
the theoretical perspective of economic science,
while the bioeconomy either as some kind of
political project (supported mainly by the
European Union and the Organisation for
Economic Cooperation and Development) or as
specific sector of national economy.
Table 3
Selected definitions of bioeconomics
Authors Definitions
OECD, 2009 The set of economic activities relating to the invention, development, production and use of biological products and processes.
The White House, 2012
Economic activity that is fuelled by research and innovation in the biological sciences.
European Commission, 2012
Encompassed production of renewable biological resources and their conversion into food, feed, bio-based products and bioenergy.
McCormick and Kautto, 2013
An economy where the basic building blocks for materials, chemicals and energy are derived from renewable biological resources.
Source: authors’ construction based on literature review
Source: authors’ construction based on Guy (2012)
Fig. 1. Sectors of bioeconomy
The study finds out that the definitions of the
bioeconomy (more or less precise) differ
depending on the source but display similarities
such as an emphasis on economic activities (e.g.
production), a broad cross-sectoral and
institutional focus as well as admitting the impact
or role of technologies and knowledge derived
from the biological sciences (Table 3).
Proceedings of the 2016 International Conference “ECONOMIC SCIENCE FOR RURAL DEVELOPMENT” No 41
Jelgava, LLU ESAF, 21-22 April 2016, pp. 274-281
1Corresponding author. Tel.: + 48 22 5934036; fax: + 48 22 5934031. E-mail address: [email protected]. 280
The bioeconomy generally relies on life
sciences, agronomy, ecology, food science, social
sciences, biotechnology, nanotechnology,
information and communication technologies, and
engineering (EC, 2012). It includes primary
production (of which the agriculture has a major
role to play), industrial sector as well as health
sector (Figure 1).
Conclusions and recommendations
1) Overall, the conclusions of this study are as
follows.
2) Bioeconomics as a research and academic
discipline can be interpreted at least in two
ways: (1) as a vehicle for the adoption by the
biological research community of ideas,
approaches, concepts and tools (such as
rational choice behaviour,
maximization/minimisation under constraints,
etc.) developed by the economists of different
schools; (2) transporting analytical tools and
concepts developed in the biological sciences
(particularly in the Darwinian evolutionary
theory) into economic theory and practical
research.
3) The terms bioeconomics and bioeconomy
are not synonymous. The bioeconomy, as a
set of specific economic activities and political
project, can, however, borrow some insights
from bioeconomics.
4) The perspectives and frameworks offered
by bioeconomics give the opportunities for
creative and novel interdisciplinary discourse
between economic sciences and life sciences
but also imply establishing closer,
collaborative relations between them. In order
to advance this field of research and academic
discipline, economists and biologists need to
work better together, while universities should
offer students curriculum that incorporates
economic subjects and biological subjects.
Bibliography
1. Alchian, A.A. (1950). Uncertainty, Evolution, and Economic Theory. The Journal of Political Economy, Volume 58, Issue 3, pp. 211-221.
2. Aristotle (BC 350). The Politics, Book I, Chapter 2. p. 1253. (translated by Sinclair T.A., London: Penguin Classic, 1981, p. 512).
3. Axelrod, R. (2008). Political Science and Beyond: Presidential Address to the American Political Science Association. Perspectives on Politics, Volume 6, Issue 1, pp. 3-9.
4. Becker, G.S. (1976). Altruism, Egoism, and Genetic Fitness: Economics and Sociobiology. Journal of Economic Literature, Volume 14, Issue 3, pp. 817-826.
5. Crocker, T.D., Tschirhart, J. (1992). Ecosystems, Externalities, and Economies. Environmental and Resource Economics, Volume 2, Issue 6, pp. 551-567.
6. Darwin, C.R. (1859). On the Origin of Species by Means of Natural Selection, or the Preservation of Favoured Races in the Struggle for Life. London: John Murray. p.502.
7. European Commission (2012). Innovating for Sustainable Growth: A Bioeconomy for Europe, Luxembourg: Publications Office of the European Union. p. 60.
8. Friedman, M. (1953). The Methodology of Positive Economics. In: Friedman, M.: Essays in Positive Economics, Chicago: University of Chicago Press. p. 334.
9. Gallagher, K. (2008). The Body Economic. Life, Death, and Sensation in Political Economy and the Victorian Novel. Princeton and Oxford: Princeton University Press. p. 209.
10. Georgescu-Roegen, N. (1977). Inequality, Limits and Growth from a Bioeconomic Viewpoint. Review of Social Economy, Volume XXXV, Issue 3, pp. 361-375.
11. Ghiselin, M. (1978). The Economy of the Body. American Economic Review, Volume 68, Issue 2, pp. 233-237.
12. Ghiselin, M. (2005). Comment on Robert Yarbrough’s ‘Teaching Bioeconomics’. Journal of Bioeconomics, Volume 7, Issue 1, pp. 39-40.
13. Goethe, J.W. von (1795). Erster Entwurf einer allgemeinen Einleitung in die vergleichende Anatomie, ausgehend von der Osteologie (First Outline of a General Introduction to Comparative Anatomy Starting from Osteology). In: Johann Wolfgang von Goethe (1977). Schriften zur Naturwissenschaft (Auswahl). Stuttgard: Reclam. p. 309.
14. Guy, K. (2012). Skills and the Bioeconomy. Presentation at Conference “New Skills for a European Bioeconomy”. European Commission, Brussels, 20-21 November, 2012. Retrieved: http://www.powershow.com/view2a/402f8b-MzM4M/Skills_and_the_bioeconomy_powerpoint_ppt_presentation. Access: 16.10.2015.
15. Hardin, G. (1968). The Tragedy of the Commons. Science, Volume 162, Issue 3859, pp. 1243-1248.
16. Hirshleifer J. (1977). Economics from a Biological Viewpoint. Journal of Law and Economics, Volume 20, Issue 1, pp. 1-52.
Proceedings of the 2016 International Conference “ECONOMIC SCIENCE FOR RURAL DEVELOPMENT” No 41
Jelgava, LLU ESAF, 21-22 April 2016, pp. 274-281
1Corresponding author. Tel.: + 48 22 5934036; fax: + 48 22 5934031. E-mail address: [email protected]. 281
17. Jennings, A., Waller, W. (1998). The Place of Biological Science in Veblen's Economics. History of Political Economy, Volume 30, Issue 2, pp. 189-217.
18. Khalil, E.L., Marciano, A. (2010). The Equivalence of Neo-Darwinism and Walrasian Equilibrium: in Defense of Organismus Economicus. Biology and Philosophy, Volume 25, Issue 2, pp. 229-248.
19. Landa, J.T., Ghiselin, M.H. (1999). The Emerging Discipline of Bioeconomics: Aims and Scope of the Journal of Bioeconomics. Journal of Bioeconomics, Volume 1, Issue 1, pp. 5-12.
20. Lewis, F.A. (2013). How Aristotle Gets by in Metaphysics Zeta. Oxford Aristotle Studies Series, Oxford: Oxford University Press. p. 352.
21. Lloyd, W.F. (1832). Two Lectures on the Checks to Population: Delivered before the University of Oxford, in Michaelmas Term1832). London: Oxford. p. 75.
22. Magee, S.P. (1993). Bioeconomics and the Survival Model: The Economic Lessons of Evolutionary Biology. Public Choice, Volume 77, Issue 1, pp. 117-132.
23. Malthus, T. (1798). An Essay on the Principle of Population. London: J. Johnson, in St. Paul's church-yard.
24. Mandeville, B. (1705). The Grumbling Hive: or, Knaves Turn’d Honest. London: Sam. Ballard and A. Baldwin.
25. Mandeville, B. (1714). The Fable of the Bees: or, Private Vices, Publick Benefits. London: J. Roberts.
26. Marshall, A. (1890). Principles of Economics. London: Macmillan and Co. p. 627.
27. McCormick, Kautto, N. (2013). The Bioeconomy in Europe: An Overview. Sustainability, Volume 5, Issue 6, pp. 2589-2608.
28. National Academies of Science (2004). Committee on Facilitating Interdisciplinary Research. Washington, DC: National Academies Press.
29. OECD (2001). The Application of Biotechnology to Industrial sustainability; A Primer. Retrieved: http://www.oecd.org/dataoecd/61/13/1947629.pdf. Access: 6.12.2016.
30. OECD (2009). The Bioeconomy to 2030: Designing a Policy Agenda. International Futures Programme. p. 322.
31. Popper, K.R. (1963). Conjectures and Refutations: The Growth of Scientific Knowledge. New York: Routledge and Kegan Paul. p. 412.
32. Reinheimer, H. (1913). Evolution by Co-operation: A Study in Bio-economics. London: Kegan Paul, Trench, Trubner and Co., p. 200.
33. Saint-Hilaire, E.G. (1818). Philosophie Anatomique, Vol. 2. Paris: J.B. Bailliere. p. 566.
34. Smith, A. (1759/2011). Theory of Moral Sentiments. New York: Gutenberg Publishers, p. 358.
35. Smith, A. (1776/1904). An Inquiry into the Nature and Causes of the Wealth of Nations. Edwin Cannan Edition, London: Methuen & Co., Ltd.
36. Spence, A.M. (1973). Job Market Signaling. The Quarterly Journal of Economics, Volume 87, Issue 3, pp. 355-374.
37. Spence, A.M. (1974). Market Signaling. Informational Transfer in Hiring and Related Screening Processes. Cambridge, MA: Harvard University Press. p. 224.
38. Spence, M. (1973). Job Market Signaling. The Quarterly Journal of Economics, Volume 87, Issue 3, pp. 355-374.
39. The White House (2012). National Bioeconomy Blueprint,Washington.
40. Tullock, G. (1967). The Prisoner’s Dilemma and Mutual Trust. Ethics, Volume 77, Issue 3, pp. 229-230.
41. Tullock, G. (1971). The Coal Tit as a Careful Shopper. The American Naturalist, Volume 105, Issue 941, pp. 77-80.
42. Tullock, G. (1979). Sociobiology and Economics. Atlantic Economic Journal, Volume VIII, Issue 3, pp. 1-10.
43. Tullock, G. (1994). The Economics of Non-Human Societies. Tucson: Pallas Press. p. 87.
44. Veblen, T.B. (1898). Why is Economics Not an Evolutionary Science? Quarterly Journal of Economics, Volume 12, Issue 4, pp. 373-397.
45. Veblen, T.B. (1899). The Theory of the Leisure Class: An Economic Study in the Evolution of Institutions. New York: Macmillan.
46. Vromen, J.J. (2007). Neuroeconomics as a Natural Extension of Bioeconomics: The Shifting Scope of Standard Economic Theory. Journal of Bioeconomics, Volume 9, Issue 2, pp. 145-167.
47. Witt, U. (1999). Bioeconomics as Economics from a Darwinian Perspective. Journal of Bioeconomics. Volume 1, Issue 1, pp. 19-34.
48. Zahavi A. (1977). The Cost of Honesty (Further Remarks on the Handicap Principle). Journal of Theoretical Biology, Volume 67, Issue 3, pp. 603-605.
49. Zahavi, A. (1975). Mate Selection – A Selection for a Handicap. Journal of Theoretical Biology, Volume 53, Issue 1, pp. 205-214.
Proceedings of the 2016 International Conference “ECONOMIC SCIENCE FOR RURAL DEVELOPMENT” No 41
Jelgava, LLU ESAF, 21-22 April 2016, pp. 282-291
1Corresponding author. Tel.: +48 83 344 99 05; fax: + 48 83 344 99 50. E-mail address: [email protected]. 282
BIOECONOMY AS A DIRECTION OF THE DEVELOPMENT OF NATURAL VALUABLE AREAS IN LUBLIN VOIVODESHIP (POLAND)
Magdalena Zwolinska-Ligaj1, PhD
1Pope John Paul II State School of Higher Education in Biala Podlaska
Abstract.The aim of the study is to indicate the main factors and barriers to the development of the enterprises which
represent the bioeconomy sector and operate in valuable natural areas. Taking into consideration that the bioeconomy
is a key and a potential sector, which should be developed in the environmentally valuable areas, the study identifies
the most important factors for the development of the studied sector and desirable forms of supporting that activity.
The paper presents the results of the research on a sample of 48 enterprises representing the bioeconomy sector
located in 30 municipalities with the highest environmental valuables in Lublin voivodeship (Poland). The study shows
that entrepreneurs who represent the bioeconomy sector perceived local ecological conditions as a key and a positive
factor of company’s development. The results are presented in a form of selected elements of descriptive statistics.
The paper was prepared within the research project No 2011/01/D/HS4/03927 entitled "Environmental Conditions and
Factors of Development of the Economic Functions of Valuable Natural Areas of Lublin Voivodeship" funded by the
National Science Centre.
Keywords: bioeconomy, natural resources, regional policy
JEL code: Q01, Q56, R11
Introduction Lublin Voivodeship is a peripheral region. It
results, among others, from such reasons as
geographical location or economic and socio-
demographic criteria (Miszczuk A., 2013). Due to
its peripherality, this region demonstrates the
existence of many development barriers,
including economic, social, demographic and
infrastructural ones. Generally, unfavourable
situation in terms of development conditions
makes local and regional authorities look for
innovative directions of the regional
development. These directions should stimulate
development processes of the region on the basis
of more comprehensive use of internal resources
of the region as well as external factors of the
development. Such approach to regional
development policy is compatible with the
concept of neo-endogenous development.
An important element of the concept of neo-
endogenous development is the assertion that
the socio-economic welfare can be achieved by
restructuring public intervention. It is important
to move away from policies focused on sectors
and to develop policies oriented territorially
(Ray Ch., 2006). The essence of neo-endogenous
approach is the simultaneous involvement of
various local entities that fulfil key functions to
stimulate and coordinate local development
processes. There is also a necessity of
involvement of external institutions supporting
bottom-up development processes (Michalewska-
Pawlak M., 2013).
The studied region is located in the Central-
Eastern part of Poland, bordering with Ukraine
and Belarus. In the region, there are important
communication routes linking Western Europe
with those countries. Lublin Voivodeship is one of
the least developed, peripheral regions of Poland
and the European Union. This condition is
affected by a set of many interrelated negative
development conditions. It is an agricultural
region. It is evidenced by a significant share of
the primary sector of economy in the structure of
regional gross value added (6.16 % in 2013) and
its important role in creating jobs (38.5 %
of employees in 2013). Disadvantageous
situation of the regional economy in comparison
with the country is determined structurally,
primarily because of the two phenomena. First of
them is a significant share of agriculture in the
regional economy, and the second one is low
labour productivity in this sector. At the same
time, the region is one of the least populated and
urbanized regions in Poland. The demographic
Proceedings of the 2016 International Conference “ECONOMIC SCIENCE FOR RURAL DEVELOPMENT” No 41
Jelgava, LLU ESAF, 21-22 April 2016, pp. 282-291
1Corresponding author. Tel.: +48 83 344 99 05; fax: + 48 83 344 99 50. E-mail address: [email protected]. 283
situation is unfavourable and is steadily declining
as a result of a low number of births and
migration outflow (Strategia rozwoju…, 2014,
Rocznik Statystyczny…, 2015). The region is
attractive in terms of natural and landscape
values. In Lublin Voivodeship, resources and
values of natural environment could play an
important role in the development processes of
the region. In Lublin Voivodeship, like in other
peripheral regions, natural resources are an
important but not fully exploited source of socio-
economic development.
The concept of smart specialization gives new
insights into the development processes, which
can be used in the case of regions with a lower
level and dynamics of development processes.
Smart specialisation is an industrial and
innovation framework for regional economies that
aims to illustrate how public policies, framework
conditions but especially R&D and innovation
investment policies can influence economic,
scientific and technological specialisation of a
region and consequently its productivity,
competitiveness and economic growth path
(Innovation-driven growth…, 2013). The
instruments of the concept of smart specialization
are Regional Research and Innovation Strategies
for Smart Specialisation (RIS3 strategies). RIS3
strategies focus policy support and investments
on key regional priorities, challenges and needs
for knowledge-based development and are built
on each region’s strengths, competitive
advantages and potential for excellence. Their
priority is to get the stakeholders fully involved
and to encourage innovation and
experimentation. RIS3 are the elements of the
EU Cohesion Policy investment for 2014-2020
and a tool of Europe 2020 growth strategy
(National/regional innovation strategies…, 2014).
The basic assumption of the concept of smart
specialization is to increase innovativeness and
competitiveness of the regions on the basis of
their endogenous potential and sectors already
operating in them. Specific resources of the
region determine the uniqueness of the regional
space and should be seen as the basis for
endogenous development. Smart specialization
also fits in with the concept of economic
development associated with the promotion of
natural products or nature handicrafts
(Slodowa-Helpa M., 2013).
The bioeconomy sector creates large capacity
to implement smart specialization in the
peripheral regions. These regions usually have a
significant natural potential, not deeply
transformed by the anthropogenic pressure. This
potential can be used for the development of
both traditional and highly innovative industries
utilizing natural resources.
The bioeconomy sector is an essential part of
natural valuable areas economies. Its
development can become an important factor for
sustainable development of these areas.
However, it is imperative to provide sustainable
management of natural valuable areas’
resources. It should also be indicated that the
process of creating economic value based on the
use of environmental resources must incorporate
knowledge and innovation (Pessoa A.,
Rui Silva M., 2009). It must be stressed also that
valuable natural areas can create favourable
conditions for the development of this sector
offering the availability of valuable natural
resources. Their use depends on the activity and
innovativeness of enterprises and support
provided by local authorities. Local natural
heritage may constitute the basis for the
formation of the cooperation of local entities in
the planning and implementation of local
strategies for sustainable development. Proposals
of innovative directions for using local natural
resources and values in the processes of local
development should constitute the core of these
strategies.
The bioeconomy encompasses the production
of renewable biological resources and the
conversion of these resources and waste streams
into value added products, such as food, feed,
Proceedings of the 2016 International Conference “ECONOMIC SCIENCE FOR RURAL DEVELOPMENT” No 41
Jelgava, LLU ESAF, 21-22 April 2016, pp. 282-291
1Corresponding author. Tel.: +48 83 344 99 05; fax: + 48 83 344 99 50. E-mail address: [email protected]. 284
bio-based products and bioenergy. The
bioeconomy includes the sectors of agriculture,
forestry, fishery, food and pulp and paper
production as well as parts of chemical,
biotechnological and energy industries. Its
sectors and industries have strong innovation
potential due to their use of a wide range of
sciences (Communication from the Commission…,
2012). In a broader sense, the concept of the
bio-economy includes practically all sectors and
related services that produce, process or use
biological resources in any form. Their rational
use can be a significant source of value creation
in activities of enterprises, especially micro and
small ones (Chylek E., Rzepecka M., 2011).
It should be noticed that the bioeconomy in
“Lubelskie Regional Innovation Strategy till 2020”
was chosen as the key, smart specialization of
the region (Janczarek P., 2013). Due to that it is
justified to conduct studies on the developmental
determinants of the bioeconomy sector in Lublin
Voivodeship. It is particularly important to
recognize conditions for the development of the
bioeconomy sector offered by valuable natural
areas.
The aim of the study is thus to indicate the
main factors and barriers to the development of
the enterprises which represent the bioeconomy
sector operating in valuable natural areas. Taking
into consideration that the bioeconomy is a key
and a potential sector, which should be
developed in the environmentally valuable areas,
the study identifies the most important factors
for the development of the studied sector and
desirable forms of supporting that activity.
The study verifies the hypothesis that in the
case of enterprises located in natural valuable
areas and representing the bioeconomy sector
local environmental determinants create a key
and a positive factor of their development. The
surveyed enterprises, which are located in a
peripheral region, recognise many external
barriers created by the environment of their
activity but the ecological sphere is perceived
positively – as a factor in enterprises’
development. Barriers perceived by the
entrepreneurs generate the need to support the
enterprises. The need to support this sector by
local authorities as well as the need for wider
inclusion of these entities into local processes of
sustainable development can be observed in the
surveyed areas.
The study area consisted of 30 municipalities
with the highest environmental valuables in
Lublin voivodeship, designated under the
synthetic index developed by D. Guzal-Dec
(2013) in the study of ecologically valuable rural
and semi-urban areas of Lublin voivodeship. In
each of the communes, on the basis of the
REGON number, 5 enterprises located in rural
areas were selected for testing, and the sample
reflected the sectoral structure of business
entities in the commune and the highest level of
employment. Diagnostic survey was applied using
a questionnaire interview. Interviews with owners
(or managers) of enterprises were carried out in
the period of November-December, 2013. The
research material consisted of 150 questionnaire
interviews. From the group of 150 enterprises, 48
were selected to represent entities of the
bioeconomy sector on the basis of the resource
criterion which included all entities of production
area that use biological resources. The results are
presented in a form of selected elements of
descriptive statistics and graphic form using
tables and graphs. The report was prepared as
part of the research project No
2011/01/D/HS4/03927 entitled: "Environmental
Conditions and Factors of Development of the
Economic Functions of Valuable Natural Areas of
Lublin Voivodeship" funded by the National
Science Centre.
Research results and discussion
1. Characteristics of the enterprises in the
bioeconomy sector
Enterprises in the bioeconomy sector are
characterized by a relatively long market
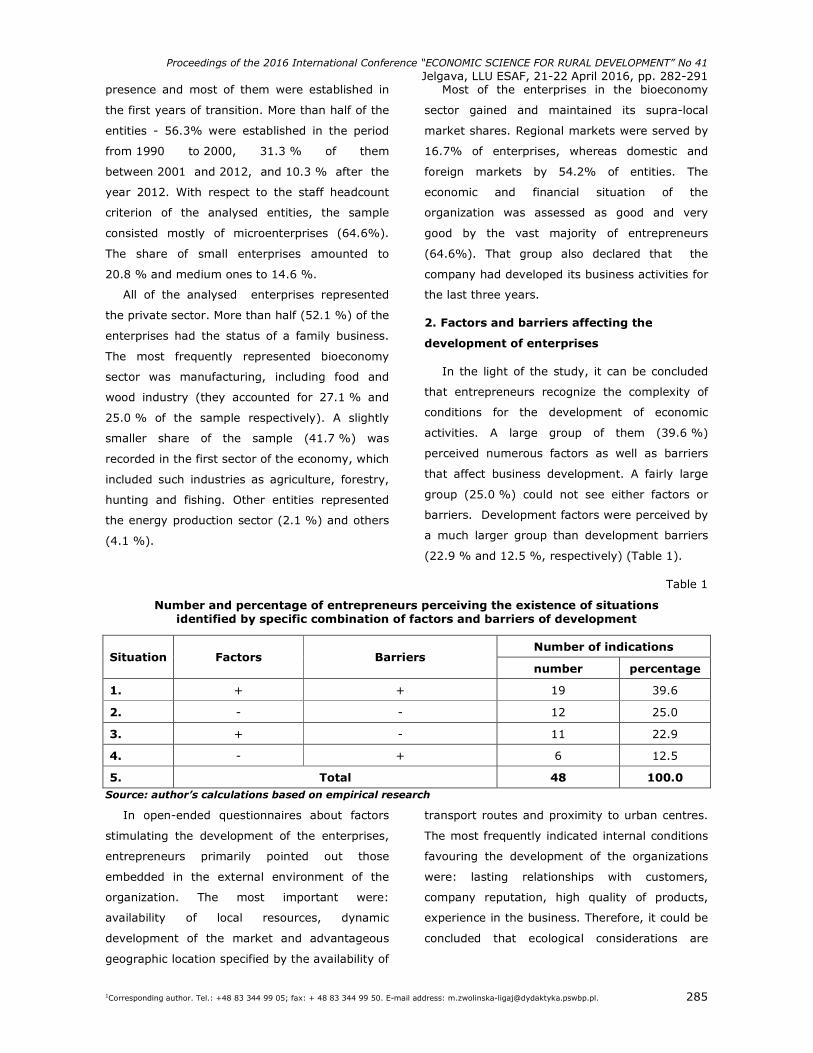
Proceedings of the 2016 International Conference “ECONOMIC SCIENCE FOR RURAL DEVELOPMENT” No 41
Jelgava, LLU ESAF, 21-22 April 2016, pp. 282-291
1Corresponding author. Tel.: +48 83 344 99 05; fax: + 48 83 344 99 50. E-mail address: [email protected]. 285
presence and most of them were established in
the first years of transition. More than half of the
entities - 56.3% were established in the period
from 1990 to 2000, 31.3 % of them
between 2001 and 2012, and 10.3 % after the
year 2012. With respect to the staff headcount
criterion of the analysed entities, the sample
consisted mostly of microenterprises (64.6%).
The share of small enterprises amounted to
20.8 % and medium ones to 14.6 %.
All of the analysed enterprises represented
the private sector. More than half (52.1 %) of the
enterprises had the status of a family business.
The most frequently represented bioeconomy
sector was manufacturing, including food and
wood industry (they accounted for 27.1 % and
25.0 % of the sample respectively). A slightly
smaller share of the sample (41.7 %) was
recorded in the first sector of the economy, which
included such industries as agriculture, forestry,
hunting and fishing. Other entities represented
the energy production sector (2.1 %) and others
(4.1 %).
Most of the enterprises in the bioeconomy
sector gained and maintained its supra-local
market shares. Regional markets were served by
16.7% of enterprises, whereas domestic and
foreign markets by 54.2% of entities. The
economic and financial situation of the
organization was assessed as good and very
good by the vast majority of entrepreneurs
(64.6%). That group also declared that the
company had developed its business activities for
the last three years.
2. Factors and barriers affecting the
development of enterprises
In the light of the study, it can be concluded
that entrepreneurs recognize the complexity of
conditions for the development of economic
activities. A large group of them (39.6 %)
perceived numerous factors as well as barriers
that affect business development. A fairly large
group (25.0 %) could not see either factors or
barriers. Development factors were perceived by
a much larger group than development barriers
(22.9 % and 12.5 %, respectively) (Table 1).
Table 1
Number and percentage of entrepreneurs perceiving the existence of situations identified by specific combination of factors and barriers of development
Source: author’s calculations based on empirical research
In open-ended questionnaires about factors
stimulating the development of the enterprises,
entrepreneurs primarily pointed out those
embedded in the external environment of the
organization. The most important were:
availability of local resources, dynamic
development of the market and advantageous
geographic location specified by the availability of
transport routes and proximity to urban centres.
The most frequently indicated internal conditions
favouring the development of the organizations
were: lasting relationships with customers,
company reputation, high quality of products,
experience in the business. Therefore, it could be
concluded that ecological considerations are
Number of indications Situation Factors Barriers
number percentage
1. + + 19 39.6
2. - - 12 25.0
3. + - 11 22.9
4. - + 6 12.5
5. Total 48 100.0
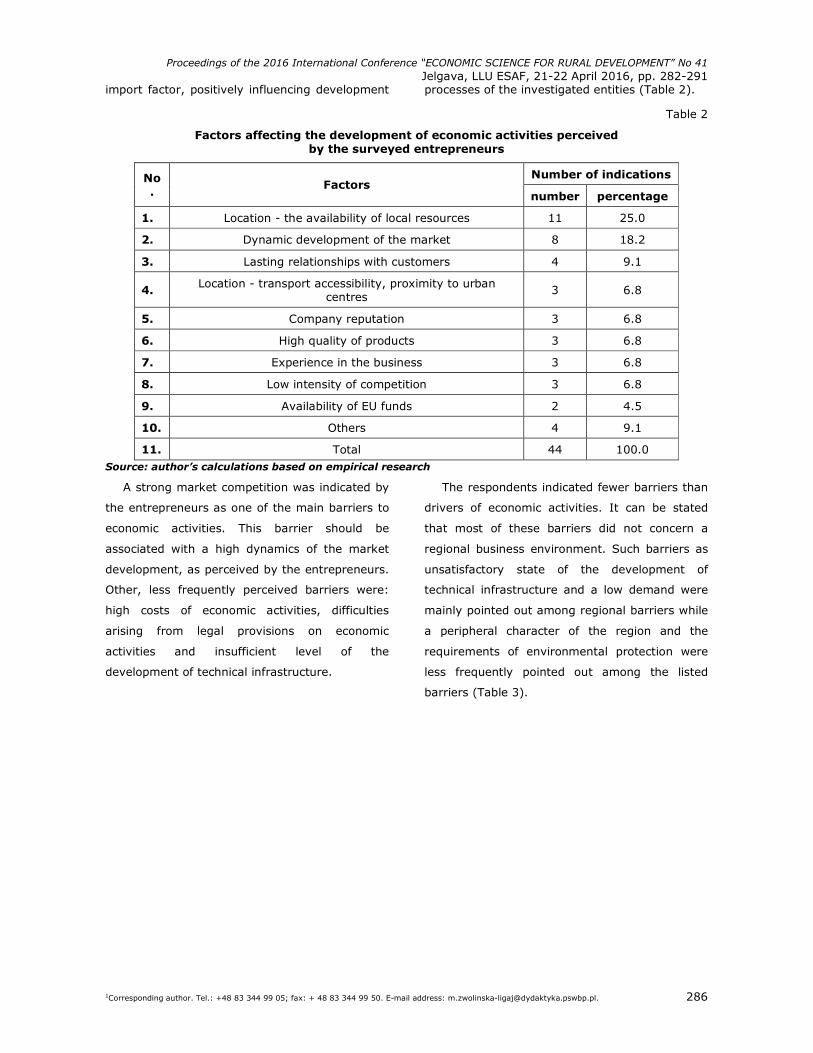
Proceedings of the 2016 International Conference “ECONOMIC SCIENCE FOR RURAL DEVELOPMENT” No 41
Jelgava, LLU ESAF, 21-22 April 2016, pp. 282-291
1Corresponding author. Tel.: +48 83 344 99 05; fax: + 48 83 344 99 50. E-mail address: [email protected]. 286
import factor, positively influencing development processes of the investigated entities (Table 2).
Table 2
Factors affecting the development of economic activities perceived by the surveyed entrepreneurs
Number of indications No.
Factors number percentage
1. Location - the availability of local resources 11 25.0
2. Dynamic development of the market 8 18.2
3. Lasting relationships with customers 4 9.1
4. Location - transport accessibility, proximity to urban centres
3 6.8
5. Company reputation 3 6.8
6. High quality of products 3 6.8
7. Experience in the business 3 6.8
8. Low intensity of competition 3 6.8
9. Availability of EU funds 2 4.5
10. Others 4 9.1
11. Total 44 100.0 Source: author’s calculations based on empirical research
A strong market competition was indicated by
the entrepreneurs as one of the main barriers to
economic activities. This barrier should be
associated with a high dynamics of the market
development, as perceived by the entrepreneurs.
Other, less frequently perceived barriers were:
high costs of economic activities, difficulties
arising from legal provisions on economic
activities and insufficient level of the
development of technical infrastructure.
The respondents indicated fewer barriers than
drivers of economic activities. It can be stated
that most of these barriers did not concern a
regional business environment. Such barriers as
unsatisfactory state of the development of
technical infrastructure and a low demand were
mainly pointed out among regional barriers while
a peripheral character of the region and the
requirements of environmental protection were
less frequently pointed out among the listed
barriers (Table 3).
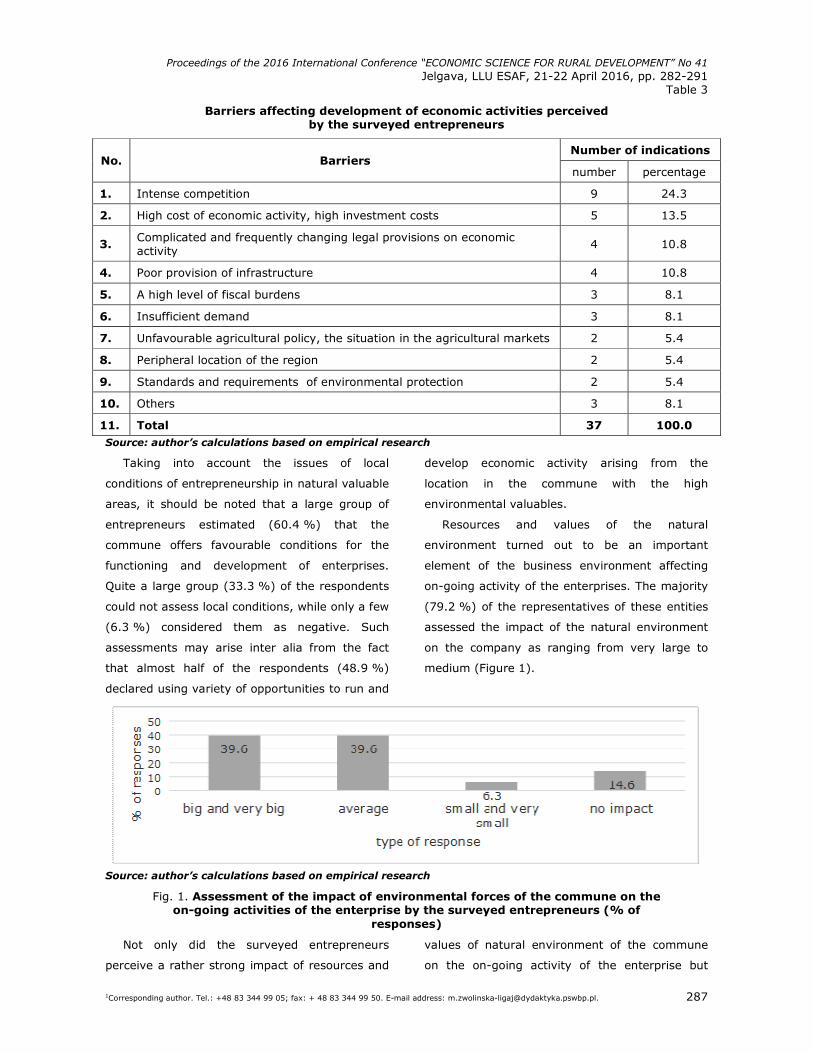
Proceedings of the 2016 International Conference “ECONOMIC SCIENCE FOR RURAL DEVELOPMENT” No 41
Jelgava, LLU ESAF, 21-22 April 2016, pp. 282-291
1Corresponding author. Tel.: +48 83 344 99 05; fax: + 48 83 344 99 50. E-mail address: [email protected]. 287
Table 3
Barriers affecting development of economic activities perceived by the surveyed entrepreneurs
Number of indications No. Barriers
number percentage
1. Intense competition 9 24.3
2. High cost of economic activity, high investment costs 5 13.5
3. Complicated and frequently changing legal provisions on economic activity
4 10.8
4. Poor provision of infrastructure 4 10.8
5. A high level of fiscal burdens 3 8.1
6. Insufficient demand 3 8.1
7. Unfavourable agricultural policy, the situation in the agricultural markets 2 5.4
8. Peripheral location of the region 2 5.4
9. Standards and requirements of environmental protection 2 5.4
10. Others 3 8.1
11. Total 37 100.0 Source: author’s calculations based on empirical research
Taking into account the issues of local
conditions of entrepreneurship in natural valuable
areas, it should be noted that a large group of
entrepreneurs estimated (60.4 %) that the
commune offers favourable conditions for the
functioning and development of enterprises.
Quite a large group (33.3 %) of the respondents
could not assess local conditions, while only a few
(6.3 %) considered them as negative. Such
assessments may arise inter alia from the fact
that almost half of the respondents (48.9 %)
declared using variety of opportunities to run and
develop economic activity arising from the
location in the commune with the high
environmental valuables.
Resources and values of the natural
environment turned out to be an important
element of the business environment affecting
on-going activity of the enterprises. The majority
(79.2 %) of the representatives of these entities
assessed the impact of the natural environment
on the company as ranging from very large to
medium (Figure 1).
Source: author’s calculations based on empirical research
Fig. 1. Assessment of the impact of environmental forces of the commune on the on-going activities of the enterprise by the surveyed entrepreneurs (% of
responses)
Not only did the surveyed entrepreneurs
perceive a rather strong impact of resources and
values of natural environment of the commune
on the on-going activity of the enterprise but

Proceedings of the 2016 International Conference “ECONOMIC SCIENCE FOR RURAL DEVELOPMENT” No 41
Jelgava, LLU ESAF, 21-22 April 2016, pp. 282-291
1Corresponding author. Tel.: +48 83 344 99 05; fax: + 48 83 344 99 50. E-mail address: [email protected]. 288
they also assessed it as positive. More than half
(54.2 %) of the surveyed entrepreneurs stated
that the natural environment of the commune
has a positive impact on the current activity of
the enterprise (Figure 2).
Source: author’s calculations based on empirical research
Fig. 2. Assessment of the environmental impact of municipalities on the on-going activities of the enterprise according to the surveyed enterprises
(% of responses)
Factors of the development of enterprises
and desirable forms of support
Entrepreneurs saw the biggest opportunities
for strengthening their competitive position in the
characteristics of enterprise’s products and
services. In the respondents’ opinion, particularly
important elements of product characteristics
with the competing potential were:
innovativeness, meeting customers’
requirements, high quality and competitive price.
The possibility of strengthening the competitive
position in the field of good knowledge of the
market, specialized knowledge and skills, and
lasting relationships with customers were
assessed by the respondents as above average.
Opportunities to strengthen the competitive
position of enterprises in the dimension of
ecological conditions were assessed by the
surveyed entrepreneurs at an average level (but
at a lower level than the above-mentioned
factors). These factors included enterprises’
location in natural valuable areas and pro-
ecological activities. Slightly more important, in
the opinion of entrepreneurs, was their
knowledge of how to seize opportunities and
adapt to the limitations resulting from the
operation in environmentally valuable areas
(Table 4).
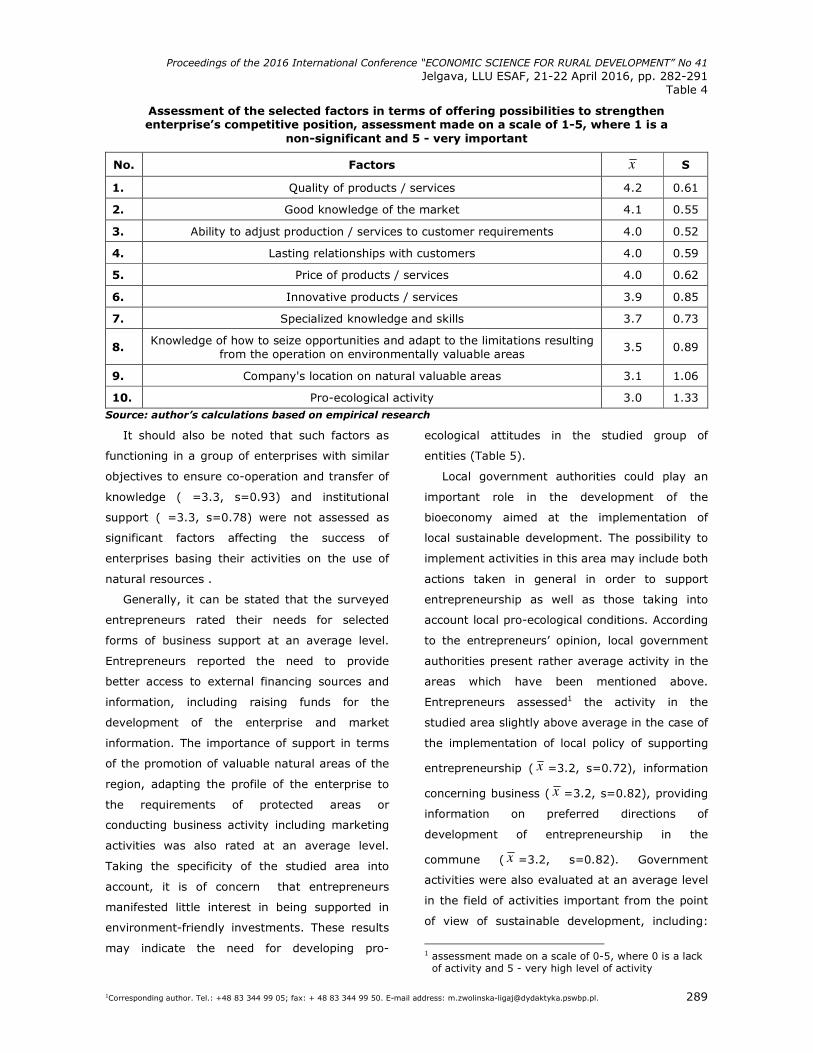
Proceedings of the 2016 International Conference “ECONOMIC SCIENCE FOR RURAL DEVELOPMENT” No 41
Jelgava, LLU ESAF, 21-22 April 2016, pp. 282-291
1Corresponding author. Tel.: +48 83 344 99 05; fax: + 48 83 344 99 50. E-mail address: [email protected]. 289
Table 4
Assessment of the selected factors in terms of offering possibilities to strengthen enterprise’s competitive position, assessment made on a scale of 1-5, where 1 is a
non-significant and 5 - very important
No. Factors x S
1. Quality of products / services 4.2 0.61
2. Good knowledge of the market 4.1 0.55
3. Ability to adjust production / services to customer requirements 4.0 0.52
4. Lasting relationships with customers 4.0 0.59
5. Price of products / services 4.0 0.62
6. Innovative products / services 3.9 0.85
7. Specialized knowledge and skills 3.7 0.73
8. Knowledge of how to seize opportunities and adapt to the limitations resulting from the operation on environmentally valuable areas
3.5 0.89
9. Company's location on natural valuable areas 3.1 1.06
10. Pro-ecological activity 3.0 1.33 Source: author’s calculations based on empirical research
It should also be noted that such factors as
functioning in a group of enterprises with similar
objectives to ensure co-operation and transfer of
knowledge ( =3.3, s=0.93) and institutional
support ( =3.3, s=0.78) were not assessed as
significant factors affecting the success of
enterprises basing their activities on the use of
natural resources .
Generally, it can be stated that the surveyed
entrepreneurs rated their needs for selected
forms of business support at an average level.
Entrepreneurs reported the need to provide
better access to external financing sources and
information, including raising funds for the
development of the enterprise and market
information. The importance of support in terms
of the promotion of valuable natural areas of the
region, adapting the profile of the enterprise to
the requirements of protected areas or
conducting business activity including marketing
activities was also rated at an average level.
Taking the specificity of the studied area into
account, it is of concern that entrepreneurs
manifested little interest in being supported in
environment-friendly investments. These results
may indicate the need for developing pro-
ecological attitudes in the studied group of
entities (Table 5).
Local government authorities could play an
important role in the development of the
bioeconomy aimed at the implementation of
local sustainable development. The possibility to
implement activities in this area may include both
actions taken in general in order to support
entrepreneurship as well as those taking into
account local pro-ecological conditions. According
to the entrepreneurs’ opinion, local government
authorities present rather average activity in the
areas which have been mentioned above.
Entrepreneurs assessed1 the activity in the
studied area slightly above average in the case of
the implementation of local policy of supporting
entrepreneurship ( x =3.2, s=0.72), information
concerning business ( x =3.2, s=0.82), providing
information on preferred directions of
development of entrepreneurship in the
commune ( x =3.2, s=0.82). Government
activities were also evaluated at an average level
in the field of activities important from the point
of view of sustainable development, including:
1 assessment made on a scale of 0-5, where 0 is a lack of activity and 5 - very high level of activity
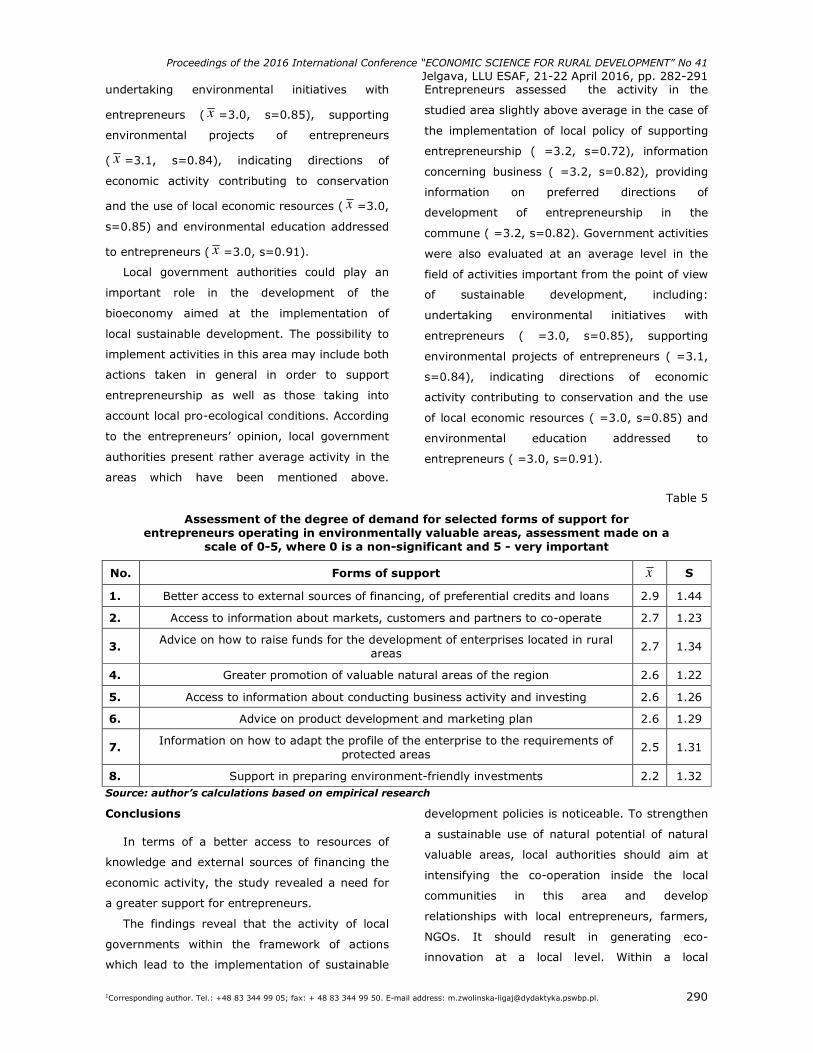
Proceedings of the 2016 International Conference “ECONOMIC SCIENCE FOR RURAL DEVELOPMENT” No 41
Jelgava, LLU ESAF, 21-22 April 2016, pp. 282-291
1Corresponding author. Tel.: +48 83 344 99 05; fax: + 48 83 344 99 50. E-mail address: [email protected]. 290
undertaking environmental initiatives with
entrepreneurs ( x =3.0, s=0.85), supporting
environmental projects of entrepreneurs
( x =3.1, s=0.84), indicating directions of
economic activity contributing to conservation
and the use of local economic resources ( x =3.0,
s=0.85) and environmental education addressed
to entrepreneurs ( x =3.0, s=0.91).
Local government authorities could play an
important role in the development of the
bioeconomy aimed at the implementation of
local sustainable development. The possibility to
implement activities in this area may include both
actions taken in general in order to support
entrepreneurship as well as those taking into
account local pro-ecological conditions. According
to the entrepreneurs’ opinion, local government
authorities present rather average activity in the
areas which have been mentioned above.
Entrepreneurs assessed the activity in the
studied area slightly above average in the case of
the implementation of local policy of supporting
entrepreneurship ( =3.2, s=0.72), information
concerning business ( =3.2, s=0.82), providing
information on preferred directions of
development of entrepreneurship in the
commune ( =3.2, s=0.82). Government activities
were also evaluated at an average level in the
field of activities important from the point of view
of sustainable development, including:
undertaking environmental initiatives with
entrepreneurs ( =3.0, s=0.85), supporting
environmental projects of entrepreneurs ( =3.1,
s=0.84), indicating directions of economic
activity contributing to conservation and the use
of local economic resources ( =3.0, s=0.85) and
environmental education addressed to
entrepreneurs ( =3.0, s=0.91).
Table 5
Assessment of the degree of demand for selected forms of support for entrepreneurs operating in environmentally valuable areas, assessment made on a
scale of 0-5, where 0 is a non-significant and 5 - very important
No. Forms of support x S
1. Better access to external sources of financing, of preferential credits and loans 2.9 1.44
2. Access to information about markets, customers and partners to co-operate 2.7 1.23
3. Advice on how to raise funds for the development of enterprises located in rural
areas 2.7 1.34
4. Greater promotion of valuable natural areas of the region 2.6 1.22
5. Access to information about conducting business activity and investing 2.6 1.26
6. Advice on product development and marketing plan 2.6 1.29
7. Information on how to adapt the profile of the enterprise to the requirements of protected areas
2.5 1.31
8. Support in preparing environment-friendly investments 2.2 1.32 Source: author’s calculations based on empirical research
Conclusions
In terms of a better access to resources of
knowledge and external sources of financing the
economic activity, the study revealed a need for
a greater support for entrepreneurs.
The findings reveal that the activity of local
governments within the framework of actions
which lead to the implementation of sustainable
development policies is noticeable. To strengthen
a sustainable use of natural potential of natural
valuable areas, local authorities should aim at
intensifying the co-operation inside the local
communities in this area and develop
relationships with local entrepreneurs, farmers,
NGOs. It should result in generating eco-
innovation at a local level. Within a local
Proceedings of the 2016 International Conference “ECONOMIC SCIENCE FOR RURAL DEVELOPMENT” No 41
Jelgava, LLU ESAF, 21-22 April 2016, pp. 282-291
1Corresponding author. Tel.: +48 83 344 99 05; fax: + 48 83 344 99 50. E-mail address: [email protected]. 291
environmental policy actions aimed at a wider
engagement of local enterprises in environmental
initiatives should get a particular consideration.
That direction of local development is in line with
the concept of neo-endogenous development and
the RIS3 strategies.
The opportunities to strengthen the
competitive position of enterprises in using such
factors as enterprise’s location in natural valuable
areas and pro-ecological activities were not seen
as significant by the entrepreneurs. These
findings prompt to look for opportunities to
pursue eco-innovation that will contribute to
strengthening the competitive position of the
enterprises as well as the local economy.
The results of the study entitle to state that
the bioeconomy sector is a direction of economic
development which corresponds to the specifics
of the study area. However, its development
requires taking a number of efforts at a local
level seeking for an innovative and sustainable
use of local environmental resources.
Bibliography
1. Chylek, E., Rzepecka, M. (2011). Biogospodarka – Konkurencyjnosc i Zrownowazone Wykorzystanie Zasobow (Bioeconomy – Competitiveness and the Sustainable Use of Resources), Polish Journal of Agronomy, 7, 2011, p. 9.
2. Communication from the Commission to the European Parliament, the Council, the European Economic and Social Committee and the Committee of the Regions. Innovating for Sustainable Growth: A Bioeconomy for Europe, European Commission, Brussels, 13.2.2012, pp. 3-4. Retrieved: http://ec.europa.eu/research/bioeconomy/pdf/201202_innovating_sustainable_growth_en.pdf. Access: 20.12.2015.
3. Guzal-Dec D. (2013). Operacjonalizacja Modelu Presja-Stan-Reakcja w Badaniu Cennosci Ekologicznej Gmin Wiejskich na Przykladzie Wojewodztwa Lubelskiego (Operationalization of the Model Pressure-State-Response in the Study of Ecological Preciousness of Rural Communes on the Example of the Lublin Voivodeship). Rocznik Ochrony Srodowiska/Annual Set the Environment Protection, Volume 15, Issue 3, pp. 2925-2941.
4. Innovation-driven Growth in Regions. The Role of Smart Specialisation, Preliminary Version. (2013). Paris: OECD, p. 17.
5. Janczarek, P. (2013). Projekt Regionalnej Strategii Innowacji Wojewodztwa Lubelskiego do 2020 r. Inteligentne Specjalizacje (The Project of Regional Innovation Strategy of Lublin Voivodeship until 2020. Intelligent Specializations). Lublin: Departament Gospodarki i Innowacji Urzedu Marszalkowskiego w Lublinie (Department of Economy and Innovation of Marshal's Office in Lublin).
6. Michalewska-Pawlak, M. (2013). Priorytety i Wyzwania Polityki Rozwoju Obszarow Wiejskich Unii Europejskiej (Priorities and Challenges of Rural Areas Development Policy in the European Union). Wrocław: Uniwersytet Wrocławski (University of Wroclaw). pp. 54-55, 57.
7. Miszczuk, A. (2013). Uwarunkowania Peryferyjnosci Regionu Przygranicznego (Determinants of Peripherality of Border Region). Lublin: Norbertinum. pp. 11-16.
8. National/Regional Innovation Strategies For Smart Specialisation (RIS3). Cohesion Policy 2014-2020. The New Rules and Legislation Governing the Next Round of EU Cohesion Policy Investment For 2014-2020. (2014). European Commission.
9. Pessoa, A., Silva Rui, M. (2009). Environment Based Innovation. Policy Questions. Finisterra, XLIV, 88. p. 71.
10. Ray, Ch. (2006). Neo-endogenous Rural Development in the EU in: Cloke P., Marsden T., Mooney P. (ed.), Handbook of Rural Studies. London: Thousand Oaks, Calif., SAGE. p. 278.
11. Rocznik Statystyczny Wojewodztwa Lubelskiego 2015 (Statistical Yearbook of the Lublin Voivodeship in 2015). (2015). Lublin: Urzad Statystyczny w Lublinie (Statistical Office in Lublin). pp. 138, 381.
12. Slodowa-Helpa, M. (2013). Inteligentne Specjalizacje Polskich Regionów – Nadzieje, Dylematy i Obawy (Smart Specialization Polish Regions - the Hopes, Fears and Dilemmas), Europa Regionum, t. 17. Szczecin: Wydawnictwo Naukowe Uniwersytetu Szczecinskiego (Publishing House of the University of Szczecin). pp. 57-59.
13. Strategia rozwoju wojewodztwa lubelskiego na lata 2014-2020 (z perspektywa do 2030 r.) (The Development Strategy of the Lublin Voivodeship for the period 2014-2020 (with the prospect of 2030). (2014). Lublin: Urzad Marszalkowski Wojewodztwa Lubelskiego w Lublinie (Marshal's Office in Lublin Voivodeship). pp. 5-51.
292
HOME ECONOMICS
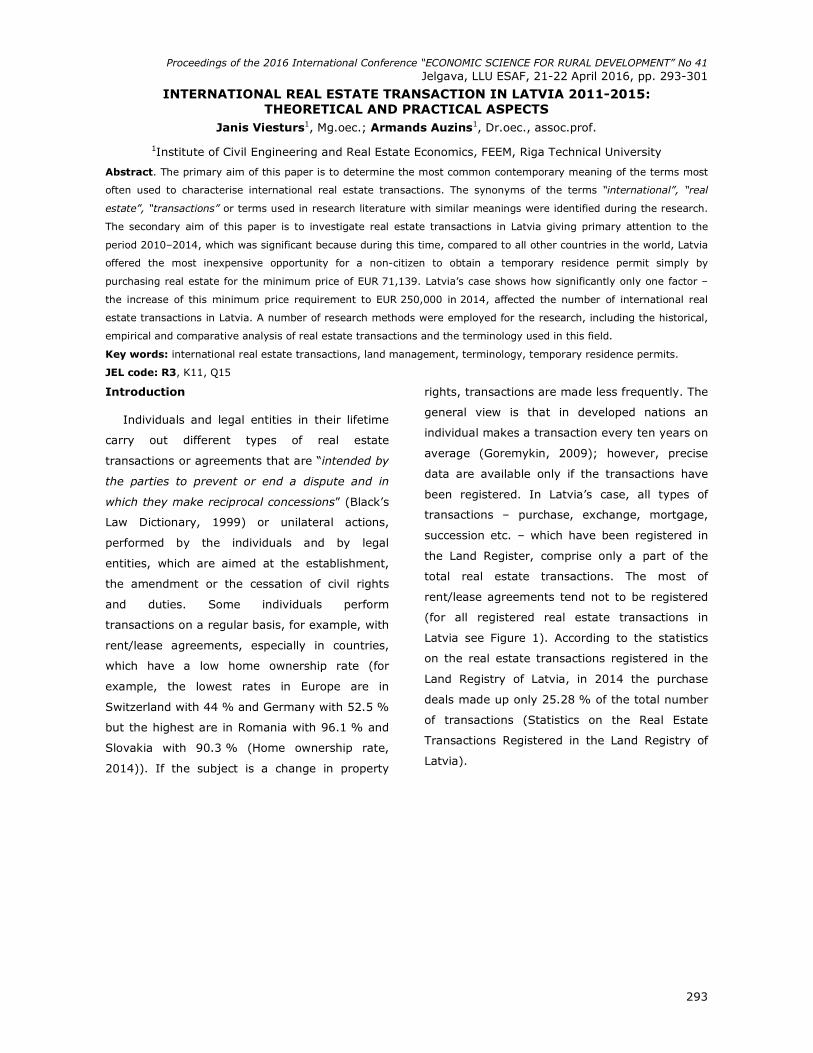
Proceedings of the 2016 International Conference “ECONOMIC SCIENCE FOR RURAL DEVELOPMENT” No 41
Jelgava, LLU ESAF, 21-22 April 2016, pp. 293-301
293
INTERNATIONAL REAL ESTATE TRANSACTION IN LATVIA 2011-2015: THEORETICAL AND PRACTICAL ASPECTS
Janis Viesturs1, Mg.oec.; Armands Auzins1, Dr.oec., assoc.prof.
1Institute of Civil Engineering and Real Estate Economics, FEEM, Riga Technical University
Abstract. The primary aim of this paper is to determine the most common contemporary meaning of the terms most
often used to characterise international real estate transactions. The synonyms of the terms “international”, “real
estate”, “transactions” or terms used in research literature with similar meanings were identified during the research.
The secondary aim of this paper is to investigate real estate transactions in Latvia giving primary attention to the
period 2010–2014, which was significant because during this time, compared to all other countries in the world, Latvia
offered the most inexpensive opportunity for a non-citizen to obtain a temporary residence permit simply by
purchasing real estate for the minimum price of EUR 71,139. Latvia’s case shows how significantly only one factor –
the increase of this minimum price requirement to EUR 250,000 in 2014, affected the number of international real
estate transactions in Latvia. A number of research methods were employed for the research, including the historical,
empirical and comparative analysis of real estate transactions and the terminology used in this field.
Key words: international real estate transactions, land management, terminology, temporary residence permits.
JEL code: R3, K11, Q15
Introduction
Individuals and legal entities in their lifetime
carry out different types of real estate
transactions or agreements that are “intended by
the parties to prevent or end a dispute and in
which they make reciprocal concessions” (Black’s
Law Dictionary, 1999) or unilateral actions,
performed by the individuals and by legal
entities, which are aimed at the establishment,
the amendment or the cessation of civil rights
and duties. Some individuals perform
transactions on a regular basis, for example, with
rent/lease agreements, especially in countries,
which have a low home ownership rate (for
example, the lowest rates in Europe are in
Switzerland with 44 % and Germany with 52.5 %
but the highest are in Romania with 96.1 % and
Slovakia with 90.3 % (Home ownership rate,
2014)). If the subject is a change in property
rights, transactions are made less frequently. The
general view is that in developed nations an
individual makes a transaction every ten years on
average (Goremykin, 2009); however, precise
data are available only if the transactions have
been registered. In Latvia’s case, all types of
transactions – purchase, exchange, mortgage,
succession etc. – which have been registered in
the Land Register, comprise only a part of the
total real estate transactions. The most of
rent/lease agreements tend not to be registered
(for all registered real estate transactions in
Latvia see Figure 1). According to the statistics
on the real estate transactions registered in the
Land Registry of Latvia, in 2014 the purchase
deals made up only 25.28 % of the total number
of transactions (Statistics on the Real Estate
Transactions Registered in the Land Registry of
Latvia).
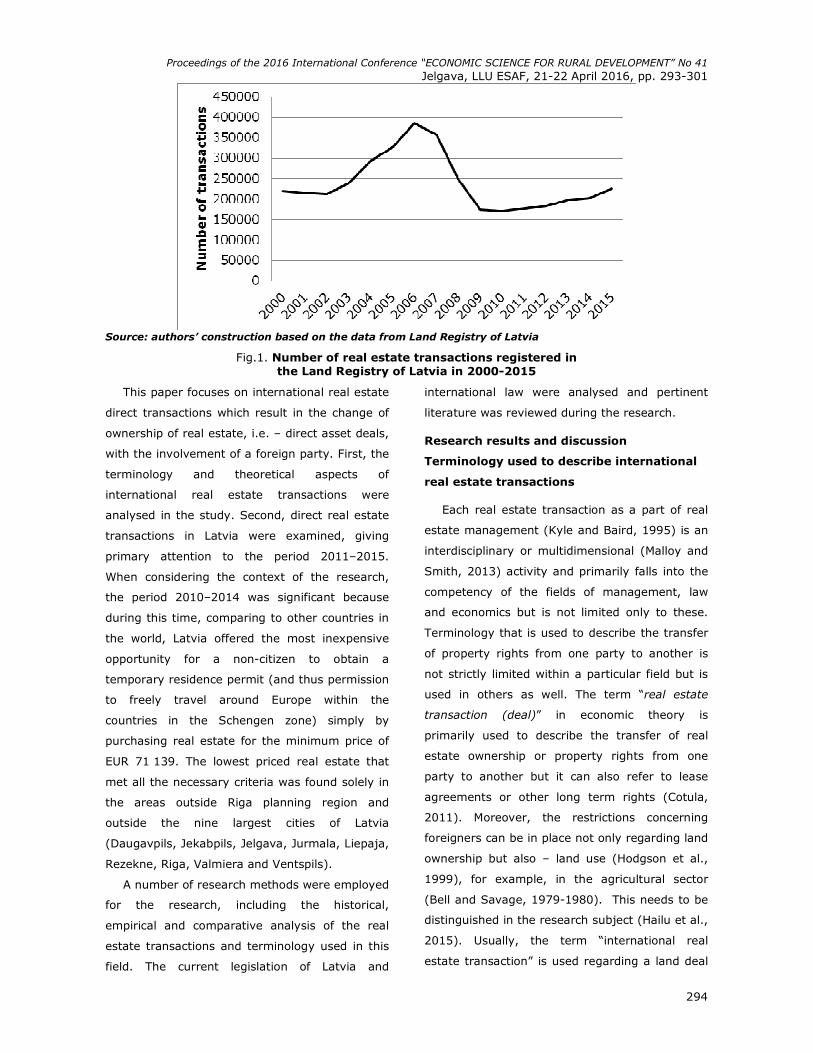
Proceedings of the 2016 International Conference “ECONOMIC SCIENCE FOR RURAL DEVELOPMENT” No 41
Jelgava, LLU ESAF, 21-22 April 2016, pp. 293-301
294
Source: authors’ construction based on the data from Land Registry of Latvia
Fig.1. Number of real estate transactions registered in the Land Registry of Latvia in 2000-2015
This paper focuses on international real estate
direct transactions which result in the change of
ownership of real estate, i.e. – direct asset deals,
with the involvement of a foreign party. First, the
terminology and theoretical aspects of
international real estate transactions were
analysed in the study. Second, direct real estate
transactions in Latvia were examined, giving
primary attention to the period 2011–2015.
When considering the context of the research,
the period 2010–2014 was significant because
during this time, comparing to other countries in
the world, Latvia offered the most inexpensive
opportunity for a non-citizen to obtain a
temporary residence permit (and thus permission
to freely travel around Europe within the
countries in the Schengen zone) simply by
purchasing real estate for the minimum price of
EUR 71 139. The lowest priced real estate that
met all the necessary criteria was found solely in
the areas outside Riga planning region and
outside the nine largest cities of Latvia
(Daugavpils, Jekabpils, Jelgava, Jurmala, Liepaja,
Rezekne, Riga, Valmiera and Ventspils).
A number of research methods were employed
for the research, including the historical,
empirical and comparative analysis of the real
estate transactions and terminology used in this
field. The current legislation of Latvia and
international law were analysed and pertinent
literature was reviewed during the research.
Research results and discussion
Terminology used to describe international
real estate transactions
Each real estate transaction as a part of real
estate management (Kyle and Baird, 1995) is an
interdisciplinary or multidimensional (Malloy and
Smith, 2013) activity and primarily falls into the
competency of the fields of management, law
and economics but is not limited only to these.
Terminology that is used to describe the transfer
of property rights from one party to another is
not strictly limited within a particular field but is
used in others as well. The term “real estate
transaction (deal)” in economic theory is
primarily used to describe the transfer of real
estate ownership or property rights from one
party to another but it can also refer to lease
agreements or other long term rights (Cotula,
2011). Moreover, the restrictions concerning
foreigners can be in place not only regarding land
ownership but also – land use (Hodgson et al.,
1999), for example, in the agricultural sector
(Bell and Savage, 1979-1980). This needs to be
distinguished in the research subject (Hailu et al.,
2015). Usually, the term “international real
estate transaction” is used regarding a land deal
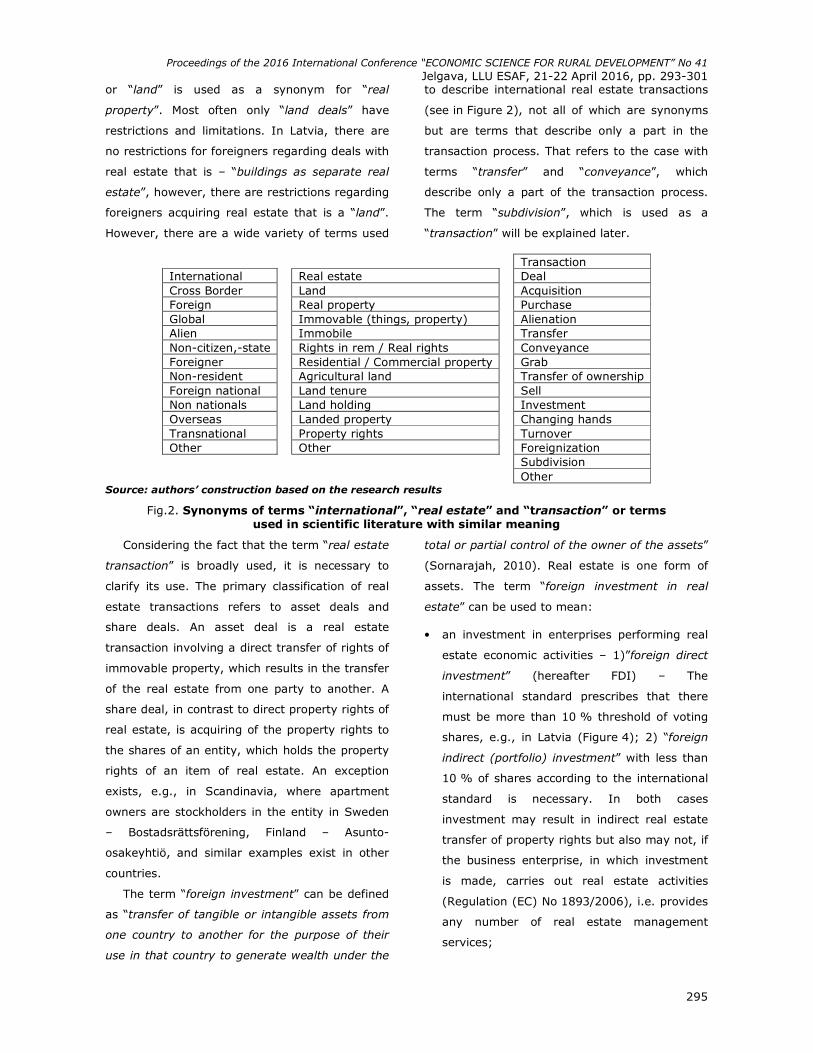
Proceedings of the 2016 International Conference “ECONOMIC SCIENCE FOR RURAL DEVELOPMENT” No 41
Jelgava, LLU ESAF, 21-22 April 2016, pp. 293-301
295
or “land” is used as a synonym for “real
property”. Most often only “land deals” have
restrictions and limitations. In Latvia, there are
no restrictions for foreigners regarding deals with
real estate that is – “buildings as separate real
estate”, however, there are restrictions regarding
foreigners acquiring real estate that is a “land”.
However, there are a wide variety of terms used
to describe international real estate transactions
(see in Figure 2), not all of which are synonyms
but are terms that describe only a part in the
transaction process. That refers to the case with
terms “transfer” and “conveyance”, which
describe only a part of the transaction process.
The term “subdivision”, which is used as a
“transaction” will be explained later.
Transaction International Real estate Deal Cross Border Land Acquisition Foreign Real property Purchase Global Immovable (things, property) Alienation Alien Immobile Transfer Non-citizen,-state Rights in rem / Real rights Conveyance Foreigner Residential / Commercial property Grab Non-resident Agricultural land Transfer of ownership Foreign national Land tenure Sell Non nationals Land holding Investment Overseas Landed property Changing hands Transnational Property rights Turnover Other Other Foreignization Subdivision Other
Source: authors’ construction based on the research results
Fig.2. Synonyms of terms “international”, “real estate” and “transaction” or terms used in scientific literature with similar meaning
Considering the fact that the term “real estate
transaction” is broadly used, it is necessary to
clarify its use. The primary classification of real
estate transactions refers to asset deals and
share deals. An asset deal is a real estate
transaction involving a direct transfer of rights of
immovable property, which results in the transfer
of the real estate from one party to another. A
share deal, in contrast to direct property rights of
real estate, is acquiring of the property rights to
the shares of an entity, which holds the property
rights of an item of real estate. An exception
exists, e.g., in Scandinavia, where apartment
owners are stockholders in the entity in Sweden
– Bostadsrättsförening, Finland – Asunto-
osakeyhtiö, and similar examples exist in other
countries.
The term “foreign investment” can be defined
as “transfer of tangible or intangible assets from
one country to another for the purpose of their
use in that country to generate wealth under the
total or partial control of the owner of the assets”
(Sornarajah, 2010). Real estate is one form of
assets. The term “foreign investment in real
estate” can be used to mean:
• an investment in enterprises performing real
estate economic activities – 1)”foreign direct
investment” (hereafter FDI) – The
international standard prescribes that there
must be more than 10 % threshold of voting
shares, e.g., in Latvia (Figure 4); 2) “foreign
indirect (portfolio) investment” with less than
10 % of shares according to the international
standard is necessary. In both cases
investment may result in indirect real estate
transfer of property rights but also may not, if
the business enterprise, in which investment
is made, carries out real estate activities
(Regulation (EC) No 1893/2006), i.e. provides
any number of real estate management
services;
Proceedings of the 2016 International Conference “ECONOMIC SCIENCE FOR RURAL DEVELOPMENT” No 41
Jelgava, LLU ESAF, 21-22 April 2016, pp. 293-301
296
• the term “foreign investment in real estate”
can also describe direct real estate
transactions, according to international
bilateral agreements for the promotion and
reciprocal protection of investment. The term
“investment” “shall comprise every kind of
asset invested in connection with economic
activities by an investor of one Contracting
Party in the territory of the other Contracting
Party in accordance with the laws of the latter
and shall include, in particular, though not
exclusively: /a/ movable and immovable
property as well as any other property rights
in rem such as mortgages, liens, pledges, and
similar rights...” (Agreement, 1996).
The term “subdivision” is also used as a term
for real estate transactions (Stubkjær et al.,
2007), which should apply only to a part of the
process of the real estate transactions or, more
precisely, would be described as “property
formation”. In order to use the term
“subdivision”, it is necessary in the countries with
Civil Law system to define it in the context of the
Roman titulus–modus theory. This theory states
that requirements for the transfer of ownership
are titulus or iusta causa (e.g., purchase
agreement but not exclusively) and modus,
which in ancient Rome initially was mancipatio,
i.e. a ceremonial act, and later – traditio i.e.
transfer. During the Middle Ages in some
countries it was replaced by registration. In some
countries the act of registration is modus, i.e. the
prescribed manner to obtain real property rights,
thus there the real estate registration has a
constitutive effect on property rights. In
conjunction with this theory a “subdivision” is
neither titulus nor modus, because there is no
change of property rights.
Each country and its legal system use the
term “real estate” differently. Land (except cases
where private ownership of land is not permitted
for ideological reasons (Hodgson et al., 1999),
e.g., China, Vietnam and the former USSR) and
buildings are real estate prototypical (Stubkjær
et al., 2007) or paradigmatic (Zaibert and Smith,
2004) or real estate by nature in the case of
France, where Civil Code prescribes that a
property is immovable, either by its nature or by
its destination or by the object to which it applies
(Civil Code of France, Art. 517). However, not all
buildings in every law system are considered as
real estate or land fixtures. They can also be
considered as a chattel, e.g. a building, which in
one country is deemed a fixture, in another can
be deemed chattel. Not every object considered
by a layperson as real estate is real property in
legal terms and, of course, not everything
described as real property in legal terminology is
seen as real estate by the public (Stubkjær et al.,
2007). The determining factors in defining a
building as a land fixture or chattel is the degree
of annexation, the purpose of annexation and the
prevailing custom in that particular part of the
world (Friedman and Lindeman, 2013). Buildings
can be temporary and be separate property from
the land on which they are located, not a land
fixture, as in the case of Superädifikat in Austria.
Buildings and the land, upon which they are
located, can be real estate belonging to separate
owners with the property rights of each
registered in separate sections of Land Registry
(in Latvia). Moreover, as in the traditional
concept of superficie buildings can belong to an
owner who is not the landowner (e.g. in Germany
– das Erbbaurecht and in Spain – derecho de
superficie, Niederlanden – opstal). In many
countries, for example, in Germany “immovable
property” is not defined as a legal term but as
property rights to objects are divided into
movable things and plots of land (das
Grundstück), buildings are component parts of
the plot of land.
The main differences in national law
determining the definition of the term “real
estate” are time limited interests in land, which
as a whole can be described as ius in re aliena
(e.g. emphyteusis, superficies, usufruct,
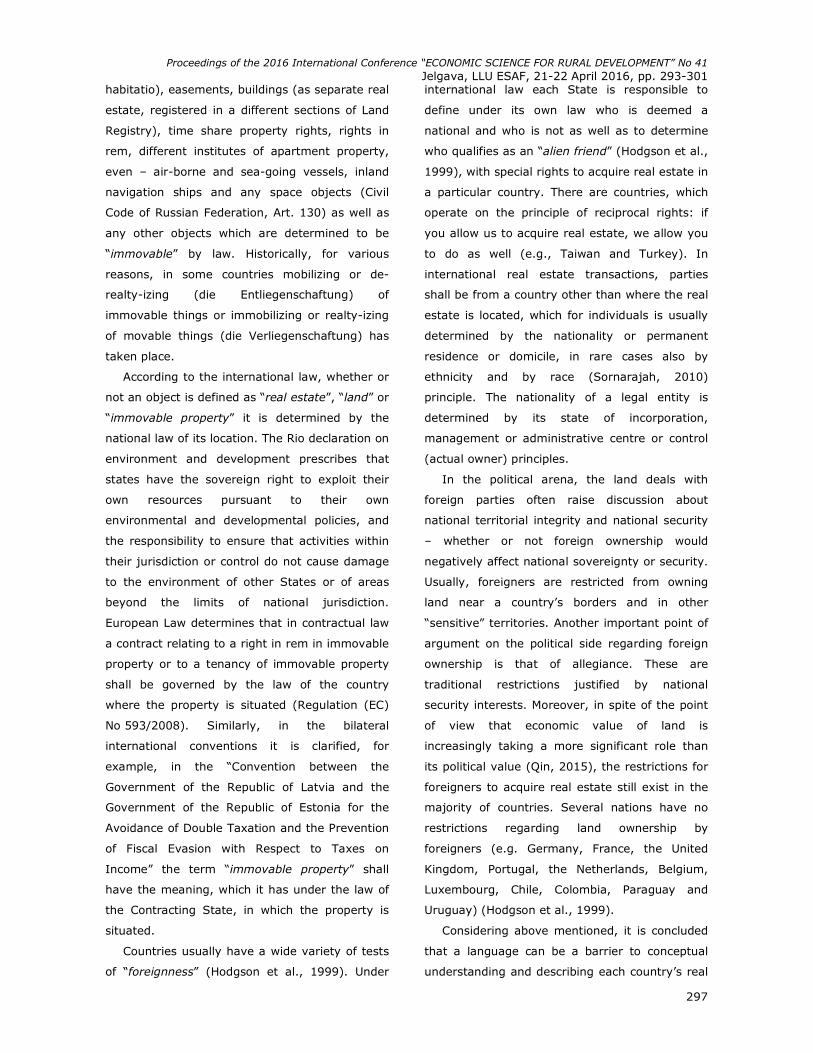
Proceedings of the 2016 International Conference “ECONOMIC SCIENCE FOR RURAL DEVELOPMENT” No 41
Jelgava, LLU ESAF, 21-22 April 2016, pp. 293-301
297
habitatio), easements, buildings (as separate real
estate, registered in a different sections of Land
Registry), time share property rights, rights in
rem, different institutes of apartment property,
even – air-borne and sea-going vessels, inland
navigation ships and any space objects (Civil
Code of Russian Federation, Art. 130) as well as
any other objects which are determined to be
“immovable” by law. Historically, for various
reasons, in some countries mobilizing or de-
realty-izing (die Entliegenschaftung) of
immovable things or immobilizing or realty-izing
of movable things (die Verliegenschaftung) has
taken place.
According to the international law, whether or
not an object is defined as “real estate”, “land” or
“immovable property” it is determined by the
national law of its location. The Rio declaration on
environment and development prescribes that
states have the sovereign right to exploit their
own resources pursuant to their own
environmental and developmental policies, and
the responsibility to ensure that activities within
their jurisdiction or control do not cause damage
to the environment of other States or of areas
beyond the limits of national jurisdiction.
European Law determines that in contractual law
a contract relating to a right in rem in immovable
property or to a tenancy of immovable property
shall be governed by the law of the country
where the property is situated (Regulation (EC)
No 593/2008). Similarly, in the bilateral
international conventions it is clarified, for
example, in the “Convention between the
Government of the Republic of Latvia and the
Government of the Republic of Estonia for the
Avoidance of Double Taxation and the Prevention
of Fiscal Evasion with Respect to Taxes on
Income” the term “immovable property” shall
have the meaning, which it has under the law of
the Contracting State, in which the property is
situated.
Countries usually have a wide variety of tests
of “foreignness” (Hodgson et al., 1999). Under
international law each State is responsible to
define under its own law who is deemed a
national and who is not as well as to determine
who qualifies as an “alien friend” (Hodgson et al.,
1999), with special rights to acquire real estate in
a particular country. There are countries, which
operate on the principle of reciprocal rights: if
you allow us to acquire real estate, we allow you
to do as well (e.g., Taiwan and Turkey). In
international real estate transactions, parties
shall be from a country other than where the real
estate is located, which for individuals is usually
determined by the nationality or permanent
residence or domicile, in rare cases also by
ethnicity and by race (Sornarajah, 2010)
principle. The nationality of a legal entity is
determined by its state of incorporation,
management or administrative centre or control
(actual owner) principles.
In the political arena, the land deals with
foreign parties often raise discussion about
national territorial integrity and national security
– whether or not foreign ownership would
negatively affect national sovereignty or security.
Usually, foreigners are restricted from owning
land near a country’s borders and in other
“sensitive” territories. Another important point of
argument on the political side regarding foreign
ownership is that of allegiance. These are
traditional restrictions justified by national
security interests. Moreover, in spite of the point
of view that economic value of land is
increasingly taking a more significant role than
its political value (Qin, 2015), the restrictions for
foreigners to acquire real estate still exist in the
majority of countries. Several nations have no
restrictions regarding land ownership by
foreigners (e.g. Germany, France, the United
Kingdom, Portugal, the Netherlands, Belgium,
Luxembourg, Chile, Colombia, Paraguay and
Uruguay) (Hodgson et al., 1999).
Considering above mentioned, it is concluded
that a language can be a barrier to conceptual
understanding and describing each country’s real
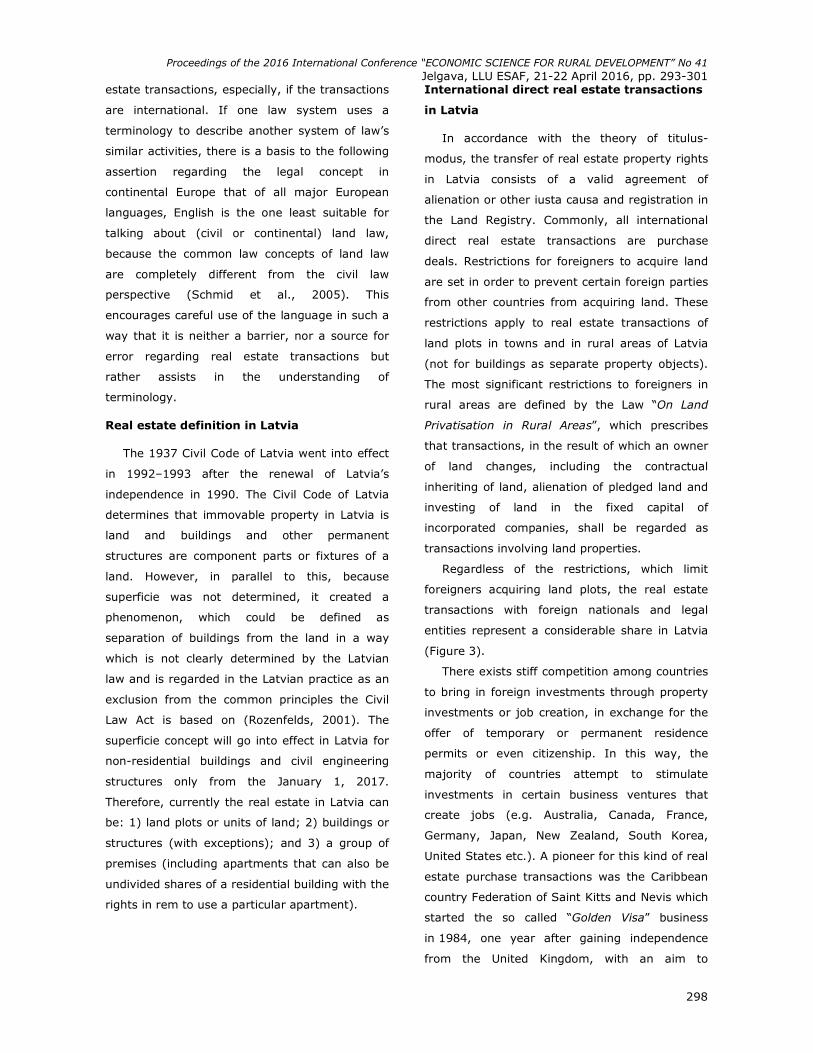
Proceedings of the 2016 International Conference “ECONOMIC SCIENCE FOR RURAL DEVELOPMENT” No 41
Jelgava, LLU ESAF, 21-22 April 2016, pp. 293-301
298
estate transactions, especially, if the transactions
are international. If one law system uses a
terminology to describe another system of law’s
similar activities, there is a basis to the following
assertion regarding the legal concept in
continental Europe that of all major European
languages, English is the one least suitable for
talking about (civil or continental) land law,
because the common law concepts of land law
are completely different from the civil law
perspective (Schmid et al., 2005). This
encourages careful use of the language in such a
way that it is neither a barrier, nor a source for
error regarding real estate transactions but
rather assists in the understanding of
terminology.
Real estate definition in Latvia
The 1937 Civil Code of Latvia went into effect
in 1992–1993 after the renewal of Latvia’s
independence in 1990. The Civil Code of Latvia
determines that immovable property in Latvia is
land and buildings and other permanent
structures are component parts or fixtures of a
land. However, in parallel to this, because
superficie was not determined, it created a
phenomenon, which could be defined as
separation of buildings from the land in a way
which is not clearly determined by the Latvian
law and is regarded in the Latvian practice as an
exclusion from the common principles the Civil
Law Act is based on (Rozenfelds, 2001). The
superficie concept will go into effect in Latvia for
non-residential buildings and civil engineering
structures only from the January 1, 2017.
Therefore, currently the real estate in Latvia can
be: 1) land plots or units of land; 2) buildings or
structures (with exceptions); and 3) a group of
premises (including apartments that can also be
undivided shares of a residential building with the
rights in rem to use a particular apartment).
International direct real estate transactions
in Latvia
In accordance with the theory of titulus-
modus, the transfer of real estate property rights
in Latvia consists of a valid agreement of
alienation or other iusta causa and registration in
the Land Registry. Commonly, all international
direct real estate transactions are purchase
deals. Restrictions for foreigners to acquire land
are set in order to prevent certain foreign parties
from other countries from acquiring land. These
restrictions apply to real estate transactions of
land plots in towns and in rural areas of Latvia
(not for buildings as separate property objects).
The most significant restrictions to foreigners in
rural areas are defined by the Law “On Land
Privatisation in Rural Areas”, which prescribes
that transactions, in the result of which an owner
of land changes, including the contractual
inheriting of land, alienation of pledged land and
investing of land in the fixed capital of
incorporated companies, shall be regarded as
transactions involving land properties.
Regardless of the restrictions, which limit
foreigners acquiring land plots, the real estate
transactions with foreign nationals and legal
entities represent a considerable share in Latvia
(Figure 3).
There exists stiff competition among countries
to bring in foreign investments through property
investments or job creation, in exchange for the
offer of temporary or permanent residence
permits or even citizenship. In this way, the
majority of countries attempt to stimulate
investments in certain business ventures that
create jobs (e.g. Australia, Canada, France,
Germany, Japan, New Zealand, South Korea,
United States etc.). A pioneer for this kind of real
estate purchase transactions was the Caribbean
country Federation of Saint Kitts and Nevis which
started the so called “Golden Visa” business
in 1984, one year after gaining independence
from the United Kingdom, with an aim to
Proceedings of the 2016 International Conference “ECONOMIC SCIENCE FOR RURAL DEVELOPMENT” No 41
Jelgava, LLU ESAF, 21-22 April 2016, pp. 293-301
299
stimulate national economy by granting
citizenship to foreign investors in exchange for a
donation of USD 250 000 to the Sugar Industry
Diversification Foundation or with the purchase of
real estate worth at least USD 400 000.
In Latvia, a most significant influence on real
estate transactions became the creation of the
opportunity for foreigners to obtain a temporary
residence permit upon making a real estate
purchase starting with 2010. Latvia, along with
many other countries, usually has stipulations
that go along with obtaining a temporary or
permanent residence or citizenship. Some of
these are: a required certificate of non-criminal
record, medical insurance, medical examination,
absence of any debts to the tax authorities,
legality of income etc.
Source: authors’ calculations and construction based on data of the State Land Service of Latvia
Fig.3. Percentage of all real estate purchase deals, in which foreigners were involved 2011.Q1-2015.Q3 (Registered in Land Registry of Latvia until 30.12.2015)
Source: authors’ construction based on data of the Bank of Latvia
Fig.4. FDI in enterprises performing economic activities of real estate in Latvia, 2010.Q1-2015.Q3, mln EUR
The temporary residence permits programme
affects also the FDI as seen in Figure 4, which
shows FDI in enterprises that perform economic
activities of real estate in Latvia. Since the
“Golden Visa” programme was launched in Latvia
in 2010, it can be observed that FDI rises
significantly and decreases after the minimum
price requirement of the real estate, acquired by
foreigners, increased to EUR 250 000 in 2014,
Q4.
Conclusions
The main purpose of this research was to
analyse terminology used to describe
international real estate transactions. The
synonyms of the terms “international”, “real
estate”, “transactions” or terms used in research
Proceedings of the 2016 International Conference “ECONOMIC SCIENCE FOR RURAL DEVELOPMENT” No 41
Jelgava, LLU ESAF, 21-22 April 2016, pp. 293-301
300
literature with similar meanings were identified
during the research (Figure 2). Because of the
large quantity of synonyms used, the introduction
section of any real estate transaction research
project needs to define the terms “international”,
“real estate” and “transaction” pertaining to how
they are used in particular country. This is of
utmost importance especially if the aim of the
research is to compare similar economic activities
in different countries.
Research shows how immediately and
significantly only one factor, i.e. the increase of
the minimum purchase price requirement of real
estate for the acquiring of foreign residency
permits from EUR 71,139 to EUR 250,000 (in
2014, Q4), can affect the number of international
real estate transactions in Latvia.
The research analysis of direct international
real estate transactions and FDI leads to a
conclusion that real estate direct transactions
affected by one factor decreased sharply
(in 2014, Q4) and in contrast FDI in enterprises
performing real estate economic activities merely
slowed down (2014, Q4-2015, Q3).
Bibliography
1. Agreement between the Government of the Republic of Latvia and the Government of the Republic of Estonia for the Promotion and Reciprocal Protection of Investment (1996). Retrieved: http://likumi.lv/doc.php?id=40178. Access: 19.09.2015
2. Bell, R.L., Savage, J.D. (1979-1980). Our Land is Your Land: Ineffective State Restriction of Alien Land Ownership and the Need for Federal Legislation. 13 J. Marshall L. Rev. Retrieved: http://heinonline.org/HOL/LandingPage?handle=hein.journals/jmlr13&div=32&id=&page=. Access: 20.09.2015
3. Black’s Law Dictionary (1999). Garner B.A. Editor in Chief. Seventh Edition. St.Paul: West Group. p.1503.
4. Civil Code of France (1804). Translated by Rouhette, G., Rouhette-Berton, A. Retrieved: https://www.legifrance.gouv.fr/content/download/1950/.../Code_22.pdf. Access: 12.09.2015
5. Civil Code of Russian Federation. Part One (1994). Retrieved: http://www.wipo.int/edocs/lexdocs/laws/en/ru/ru083en.pdf. Access: 20.12.2015
6. Convention between the Government of the Republic of Latvia and the Government of the Republic of Estonia for the Avoidance of Double Taxation and the Prevention of Fiscal Evasion with Respect to Taxes on Income (2002). Retrieved: http://likumi.lv/doc.php?id=64098. Access: 19.09.2015
7. Cotula, L. (2011). Land Deals in Africa: What is in the Contracts? London: International Institute for Environment and Development. p.49.
8. Foreign Direct Investments in Latvia. Bank of Latvia. Retrieved: http://statdb.bank.lv/lb/Data.aspx?id=131. Access: 30.12.2015
9. Friedman, J.P., Lindeman, J.B. (2013). Real Estate Licensing Exams. Salesperson, Broker, Appraiser. 9th Edition. New York: Barron’s Educational Series, Inc., 2013. p.50.
10. Goremykin, В.А. (2009). Sdelki s nedvizimostju: Prakticeskoje posobije (Real Estate Transactions: A Practical Guide), Моskva: Filin. p.472.
11. Hailu, Y., Akaeze, H., Adelaja, A., Hanson, S. (2015). Explaining International Land Transactions in Africa. Book Chapter in Econometric Methods for Analysing Economic Development. Banking, Finance, and Accounting: Concepts, Methodologies, Tools, and Applications. Volume 2-3, September 21, 2015, pp. 797-817. Retrieved: http://www-scopus-com.resursi.rtu.lv/record/display.uri?eid=2-s2.0. Access: 15.10.2015
12. Hodgson, S., Cullinan, C., Campbell, K. (1999). Land Ownership and Foreigners: A Comparative Analysis of Regulatory Approaches to the Acquisition and Use of Land by Foreigners. FAO Legal Papers Online. Retrieved: http://www.fao.org/Legal/default.htm. Access: 12.05.2015
13. Homeownership Rate in Selected European Countries in 2014. Retrieved: http://www.statista.com/statistics/246355/home-ownership-rate-in-europe/. Access: 14.12.2015
14. Kyle, R.C., Baird F.M. (1995). Property Management. 5th ed. Chicago: Real Estate Education Company. p.458.
15. Malloy, R.P., Smith J.C. (2013). Real Estate Transactions. Problems, Cases and Materials. New York: Wolters Kluwer. Law and Business. p.xxii.
16. Legislation of the Republic of Latvia (1937). The Civil Law of the Republic of Latvia. Retrieved: http://likumi.lv/doc.php?id=225418. Access: 2.10.2015
17. Legislation of the Republic of Latvia (1992). On Land Privatisation in Rural Areas. Retrieved: http://likumi.lv/doc.php?id=74241. Access: 15.09.2015
18. Qin, X. (2015). A Political Study on Foreign Ownership of Land: Theoretical Challenges and Justifications. Manchester Journal of International Economic Law, Volume 12, Issue 2, 2015, Pages 195-211. Retrieved: http://www-scopus-com.resursi.rtu.lv/record/display.uri?eid=2-s2.0-84944387097&origin=resultslist&sort=plf. Access: 25.10.2015
19. Regulation (EC) No 1893/2006 of the European Parliament and of the Council of 20 December 2006 establishing the statistical classification of economic activities NACE Revision 2 and amending Council Regulation (EEC)
Proceedings of the 2016 International Conference “ECONOMIC SCIENCE FOR RURAL DEVELOPMENT” No 41
Jelgava, LLU ESAF, 21-22 April 2016, pp. 293-301
301
No 3037/90 as well as certain EC Regulations on specific statistical domains. Retrieved: http://eur-lex.europa.eu/legal-content/EN/TXT/HTML/?uri=OJ:L:2006:393:FULL&from=CS. Access: 12.09.2015
20. Regulation (EC) No 593/2008 of the European Parliament and of the Council of 17 June 2008 on the law applicable to contractual obligations (Rome I). Retrieved: http://eur-lex.europa.eu/legal-content/EN/TXT/HTML/?uri=CELEX:32008R0593&from=LV. Access: 12.09.2015
21. Rio Declaration on Environment and Development. The United Nations Conference on Environment and Development. Rio de Janeiro from 3 to 14 June 1992. Retrieved: http://www.unep.org/documents.multilingual/default.asp?documentid=78&articleid=1163. Access: 12.11.2015
22. Rozenfelds, J. (2001). Latvian Property and Collateral Law and Protection of Foreign Investments. Juridica international. Law Review. University of Tartu. 2001.VI. dx.doi.org/10.12697/issn1406-1082. Retrieved: http://www.juridicainternational.eu/?id=12535. Access: 20.10.2015
23. Schmid, C.U., Hertel, C., Wicke, H. (2005). Real Property Law and Procedure in the European Union. General Report. Final Version./ European University Institute (EUI) Florence/European Private Law Forum Deutsches Notarinstitut (DNotI) Würzburg. Retrieved: http://www.eui.eu/Documents/DepartmentsCentres/Law/ResearchTeaching/ResearchThemes/EuropeanPrivateLaw/RealPropertyProject/GeneralReport.pdf. Access: 11.12.2014
24. Sornarajah, M. (2010). The International Law on Foreign Investment. Third Edition. Cambridge: Cambridge University Press, 2010. p.128.
25. Statistics on the Real Estate Transactions Registered in the Land Registry of Latvia. Retrieved: https://www.zemesgramata.lv/inc/stat/stat2.asp?lang=lv. Access: 30.12.2015
26. Stubkjær, E., Frank, A., Zevenbergen, J. (2007). Modelling Real Property Transactions. An Overview. In Real Property Transactions: Procedures, Transactions Costs and Models. European Cooperation in the Field of Scientific and Technical Research (Organization). Amsterdam: IOS Press. 2007. eBook., Database: eBook Academic Collection (EBSCOhost) Retrieved: http://web.b.ebscohost.com.resursi.rtu.lv/ehost/ebookviewer/ebook/ZTAwMHh3d19fMjgxNDA0X19BTg2?sid=9e17934a-fd24-4647-a627-ca7fd157a290@sessionmgr110&vid=3&format=EB&rid=1. Access: 2.10.2015
27. The Civil Code of the Russian Federation (1994). Retrieved: http://www.russian-civil-code.com/. Access: 2.10.2015
28. Zaibert, L., Smith, B. (2004). Real Estate: Foundations of the Ontology of Property in The Ontology and Modelling of Real Estate Transactions. Edited by Stuckenschmidt H., Stubkjær E., Schlied C. Hampshire: Ashgate Publishing Limited. p.38.
Proceedings of the 2016 International Conference “ECONOMIC SCIENCE FOR RURAL DEVELOPMENT” No 41
Jelgava, LLU ESAF, 21-22 April 2016, pp. 302-308
302
VALUE AND STRUCTURE OF HOUSEHOLDS’ FINANCIAL ASSETS IN POLAND Monika Utzig1, PhD
1 Warsaw University of Life Sciences - SGGW
Abstract. Households decide to spend a part of their income on goods and services and to save the rest of it.
Household’s assets can be cumulated as financial assets and as non-financial assets.
The aim of the article is to identify and evaluate changes of households’ financial assets value and structure in Poland
in 2003-2014. As a background of research, the author considered changes in economic environment. The analysis
was conducted with the use of statistical tools: index of the structure and growth rate. The paper also includes Pearson
correlation coefficient between real GDP growth rate and households’ financial assets real growth rate. The author
compared the value of households’ financial assets as a percentage of GDP in European countries in 2014.
The results of the research are as follows. Between 2003 and 2014, households’ financial assets in constant prices in
Poland increased by over 100%. However, households’ financial assets value as a percentage of GDP in Poland is still
relatively low among European countries. Transferable and other deposits dominate in the structure of households’
financial assets in Poland. Shares, equity and a currency have also the significant share in total assets. The value of
transferable deposits, listed shares, investment fund shares or units and currency increased at constant prices in
analysed period. Correlation analysis shows that there is almost no significant correlation between real annual GDP
growth rate and real annual growth rate of households’ financial assets.
Key words: financial assets, households.
JEL code: D10, D14, D31.
Introduction
Households decide on distributing of their
income between consumption and savings in
such a way as to maximize their individual utility
function. Households use credit and deposit
market and choose between present and future
consumption (Utzig, 2013). Lifetime resources,
the distribution of these resources, and the age
play a critical role in saving decisions. Households
who expect rich pensions may not need to
accumulate a lot of private savings to provide for
themselves when they stop working (Lusardi,
2008). Households’ savings are voluntary, when
decision about consumption decreasing is made
without external pressure, or involuntary, when
consumption decreasing results from legal
requirements or economical pressure (Bywalec,
2009).
The pattern of financial asset changes with the
decrease of household’s disposable income.
Macroeconomic conditions also affect the amount
of household’s savings, which can be
accumulated as financial assets as well as non-
financial assets. The propensity to saving goes up
with the increase of household’s income (Wojcik,
2007). Factors strongly affecting households’
saving are: public and corporate savings, growth
and demography. Households’ savings are also
determined by: inflation, unemployment, the real
interest rate and financial deregulation (Callen,
Thimann, 1997). Among socioeconomic factors
affecting saving patterns in Polish households the
income in the household and the householder's
level of education are of great importance.
(Aniola-Mikolajczak, Golas, 2014). The age is also
an important factor determining household’s
financial asset structure. Shares of high-risk
assets in total households’ financial assets are
lower in both the younger (under 35) and the
older (55-64 and 65+) age groups, compared to
the 35-54, and tend to rise with wealth (Bertaud
and Starr-McCluer, 2000). The allocation of
households’ financial assets is determined by the
risk level, amount of predicted profit, inflation
rate and asset liquidity (Rytelewska, Klopocka,
2010). Household propensity to risky investment
is lower within labour income uncertainty and
poor health (Cardak, Wilkins, 2009). After the
financial crisis in 2007-2009, household saving
rate increased (Walden, 2012).
It is also worth indicating that households’
financial assets are highly concentrated. The
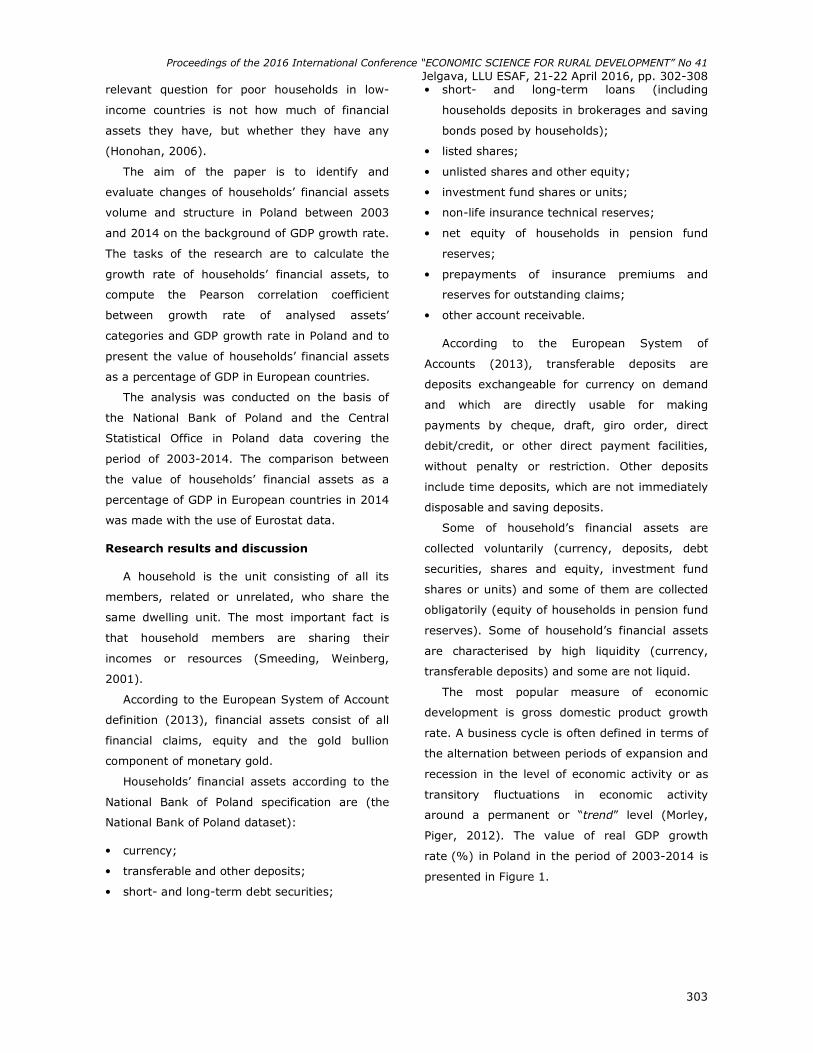
Proceedings of the 2016 International Conference “ECONOMIC SCIENCE FOR RURAL DEVELOPMENT” No 41
Jelgava, LLU ESAF, 21-22 April 2016, pp. 302-308
303
relevant question for poor households in low-
income countries is not how much of financial
assets they have, but whether they have any
(Honohan, 2006).
The aim of the paper is to identify and
evaluate changes of households’ financial assets
volume and structure in Poland between 2003
and 2014 on the background of GDP growth rate.
The tasks of the research are to calculate the
growth rate of households’ financial assets, to
compute the Pearson correlation coefficient
between growth rate of analysed assets’
categories and GDP growth rate in Poland and to
present the value of households’ financial assets
as a percentage of GDP in European countries.
The analysis was conducted on the basis of
the National Bank of Poland and the Central
Statistical Office in Poland data covering the
period of 2003-2014. The comparison between
the value of households’ financial assets as a
percentage of GDP in European countries in 2014
was made with the use of Eurostat data.
Research results and discussion
A household is the unit consisting of all its
members, related or unrelated, who share the
same dwelling unit. The most important fact is
that household members are sharing their
incomes or resources (Smeeding, Weinberg,
2001).
According to the European System of Account
definition (2013), financial assets consist of all
financial claims, equity and the gold bullion
component of monetary gold.
Households’ financial assets according to the
National Bank of Poland specification are (the
National Bank of Poland dataset):
• currency;
• transferable and other deposits;
• short- and long-term debt securities;
• short- and long-term loans (including
households deposits in brokerages and saving
bonds posed by households);
• listed shares;
• unlisted shares and other equity;
• investment fund shares or units;
• non-life insurance technical reserves;
• net equity of households in pension fund
reserves;
• prepayments of insurance premiums and
reserves for outstanding claims;
• other account receivable.
According to the European System of
Accounts (2013), transferable deposits are
deposits exchangeable for currency on demand
and which are directly usable for making
payments by cheque, draft, giro order, direct
debit/credit, or other direct payment facilities,
without penalty or restriction. Other deposits
include time deposits, which are not immediately
disposable and saving deposits.
Some of household’s financial assets are
collected voluntarily (currency, deposits, debt
securities, shares and equity, investment fund
shares or units) and some of them are collected
obligatorily (equity of households in pension fund
reserves). Some of household’s financial assets
are characterised by high liquidity (currency,
transferable deposits) and some are not liquid.
The most popular measure of economic
development is gross domestic product growth
rate. A business cycle is often defined in terms of
the alternation between periods of expansion and
recession in the level of economic activity or as
transitory fluctuations in economic activity
around a permanent or “trend” level (Morley,
Piger, 2012). The value of real GDP growth
rate (%) in Poland in the period of 2003-2014 is
presented in Figure 1.
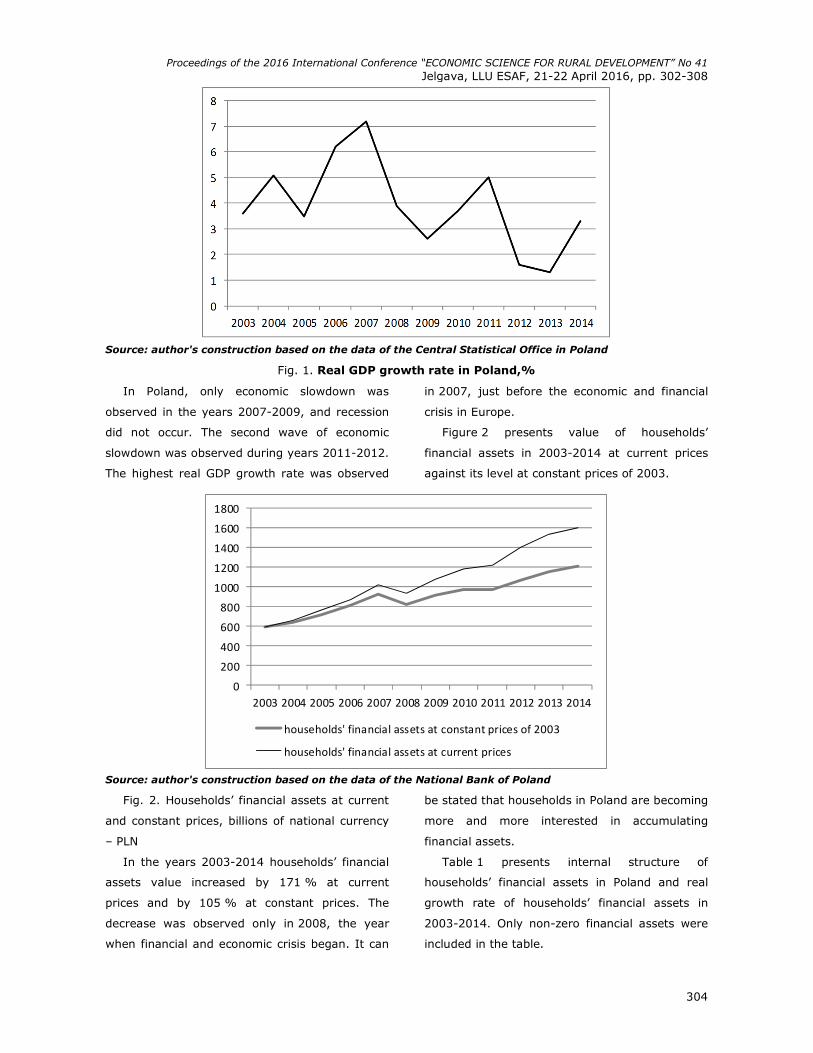
Proceedings of the 2016 International Conference “ECONOMIC SCIENCE FOR RURAL DEVELOPMENT” No 41
Jelgava, LLU ESAF, 21-22 April 2016, pp. 302-308
304
Source: author's construction based on the data of the Central Statistical Office in Poland
Fig. 1. Real GDP growth rate in Poland,%
In Poland, only economic slowdown was
observed in the years 2007-2009, and recession
did not occur. The second wave of economic
slowdown was observed during years 2011-2012.
The highest real GDP growth rate was observed
in 2007, just before the economic and financial
crisis in Europe.
Figure 2 presents value of households’
financial assets in 2003-2014 at current prices
against its level at constant prices of 2003.
0
200
400
600
800
1000
1200
1400
1600
1800
2003 2004 2005 2006 2007 2008 2009 2010 2011 2012 2013 2014
households' financial assets at constant prices of 2003
households' financial assets at current prices
Source: author's construction based on the data of the National Bank of Poland
Fig. 2. Households’ financial assets at current
and constant prices, billions of national currency
– PLN
In the years 2003-2014 households’ financial
assets value increased by 171 % at current
prices and by 105 % at constant prices. The
decrease was observed only in 2008, the year
when financial and economic crisis began. It can
be stated that households in Poland are becoming
more and more interested in accumulating
financial assets.
Table 1 presents internal structure of
households’ financial assets in Poland and real
growth rate of households’ financial assets in
2003-2014. Only non-zero financial assets were
included in the table.
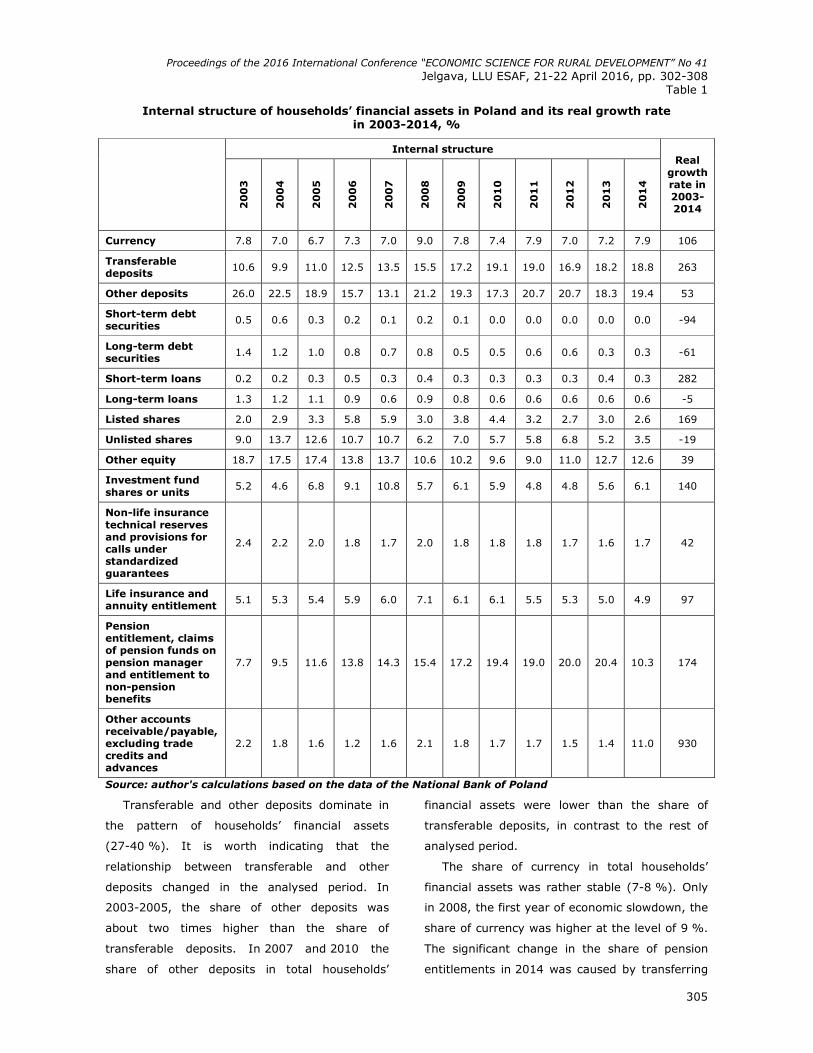
Proceedings of the 2016 International Conference “ECONOMIC SCIENCE FOR RURAL DEVELOPMENT” No 41
Jelgava, LLU ESAF, 21-22 April 2016, pp. 302-308
305
Table 1
Internal structure of households’ financial assets in Poland and its real growth rate in 2003-2014, %
Internal structure
20
03
20
04
20
05
20
06
20
07
20
08
20
09
20
10
20
11
20
12
20
13
20
14
Real growth rate in 2003-2014
Currency 7.8 7.0 6.7 7.3 7.0 9.0 7.8 7.4 7.9 7.0 7.2 7.9 106
Transferable deposits 10.6 9.9 11.0 12.5 13.5 15.5 17.2 19.1 19.0 16.9 18.2 18.8 263
Other deposits 26.0 22.5 18.9 15.7 13.1 21.2 19.3 17.3 20.7 20.7 18.3 19.4 53
Short-term debt securities 0.5 0.6 0.3 0.2 0.1 0.2 0.1 0.0 0.0 0.0 0.0 0.0 -94
Long-term debt securities 1.4 1.2 1.0 0.8 0.7 0.8 0.5 0.5 0.6 0.6 0.3 0.3 -61
Short-term loans 0.2 0.2 0.3 0.5 0.3 0.4 0.3 0.3 0.3 0.3 0.4 0.3 282
Long-term loans 1.3 1.2 1.1 0.9 0.6 0.9 0.8 0.6 0.6 0.6 0.6 0.6 -5
Listed shares 2.0 2.9 3.3 5.8 5.9 3.0 3.8 4.4 3.2 2.7 3.0 2.6 169
Unlisted shares 9.0 13.7 12.6 10.7 10.7 6.2 7.0 5.7 5.8 6.8 5.2 3.5 -19
Other equity 18.7 17.5 17.4 13.8 13.7 10.6 10.2 9.6 9.0 11.0 12.7 12.6 39
Investment fund shares or units
5.2 4.6 6.8 9.1 10.8 5.7 6.1 5.9 4.8 4.8 5.6 6.1 140
Non-life insurance technical reserves and provisions for calls under standardized guarantees
2.4 2.2 2.0 1.8 1.7 2.0 1.8 1.8 1.8 1.7 1.6 1.7 42
Life insurance and annuity entitlement 5.1 5.3 5.4 5.9 6.0 7.1 6.1 6.1 5.5 5.3 5.0 4.9 97
Pension entitlement, claims of pension funds on pension manager and entitlement to non-pension benefits
7.7 9.5 11.6 13.8 14.3 15.4 17.2 19.4 19.0 20.0 20.4 10.3 174
Other accounts receivable/payable, excluding trade credits and advances
2.2 1.8 1.6 1.2 1.6 2.1 1.8 1.7 1.7 1.5 1.4 11.0 930
Source: author's calculations based on the data of the National Bank of Poland
Transferable and other deposits dominate in
the pattern of households’ financial assets
(27-40 %). It is worth indicating that the
relationship between transferable and other
deposits changed in the analysed period. In
2003-2005, the share of other deposits was
about two times higher than the share of
transferable deposits. In 2007 and 2010 the
share of other deposits in total households’
financial assets were lower than the share of
transferable deposits, in contrast to the rest of
analysed period.
The share of currency in total households’
financial assets was rather stable (7-8 %). Only
in 2008, the first year of economic slowdown, the
share of currency was higher at the level of 9 %.
The significant change in the share of pension
entitlements in 2014 was caused by transferring
Proceedings of the 2016 International Conference “ECONOMIC SCIENCE FOR RURAL DEVELOPMENT” No 41
Jelgava, LLU ESAF, 21-22 April 2016, pp. 302-308
306
PLN 150 bln from open pension funds to the
Polish Social Insurance Institution (ZUS).
The decrease of the value of listed shares and
investment fund shares or units in 2008 was
caused by the downturn at the Warsaw Stock
Exchange, when WIG index decreased by 51 %
as the reflection of the financial crisis.
The highest increase was observed in the
category of assets: other accounts
receivable/payable but this increase results from
transferring assets from open pension funds to
the Polish Social Insurance Institution in 2014.
Among significant financial assets’ categories, the
values increased at constant prices in categories:
transferable deposits (by 263 %), listed shares
(by 169 %), investment fund shares or units
(by 140 %) and currency (by 106 %).
The Pearson correlation coefficient between
growth rate of analysed asset’s categories and
GDP growth rate in 2003 constant prices was
computed to examine if there is any correlation
between real value of households’ financial assets
categories and economic slowdown in Poland.
Pearson correlation coefficient was defined as:
(1)
When ( )YX ,cov is the covariance between X
and Y, σX and σY - standard deviations
of X and Y.
Correlation significance was examined by
comparing empirical value
(2)
to t statistic for n-2 degrees of freedom
(Starzynska, 2002). The results are presented in
Table 2.
At the significance level of 0.05 only the real
growth rate of long-term loans is significantly
correlated with real GDP growth rate. Previous
research using quarterly data shows that there is
significant correlation between real GDP growth
rate and households’ financial assets real growth
rate (Utzig, 2013) so it can be stated that annual
data are insufficient to evaluate if there is any
correlation between analysed variables.
To evaluate the value of households’ financial
assets in Poland it was compared to the value of
households’ financial assets in European
countries (Figure 3).
It was observed that in Poland, Lithuania,
Latvia, Slovenia, households’ financial assets as a
percentage of GDP are at the level of 90-100 %.
Households in those countries do not pose as
much of financial assets as in the Netherlands,
Cyprus, Belgium, Denmark, Malta and Sweden,
where households’ financial assets exceed 250%
of GDP.
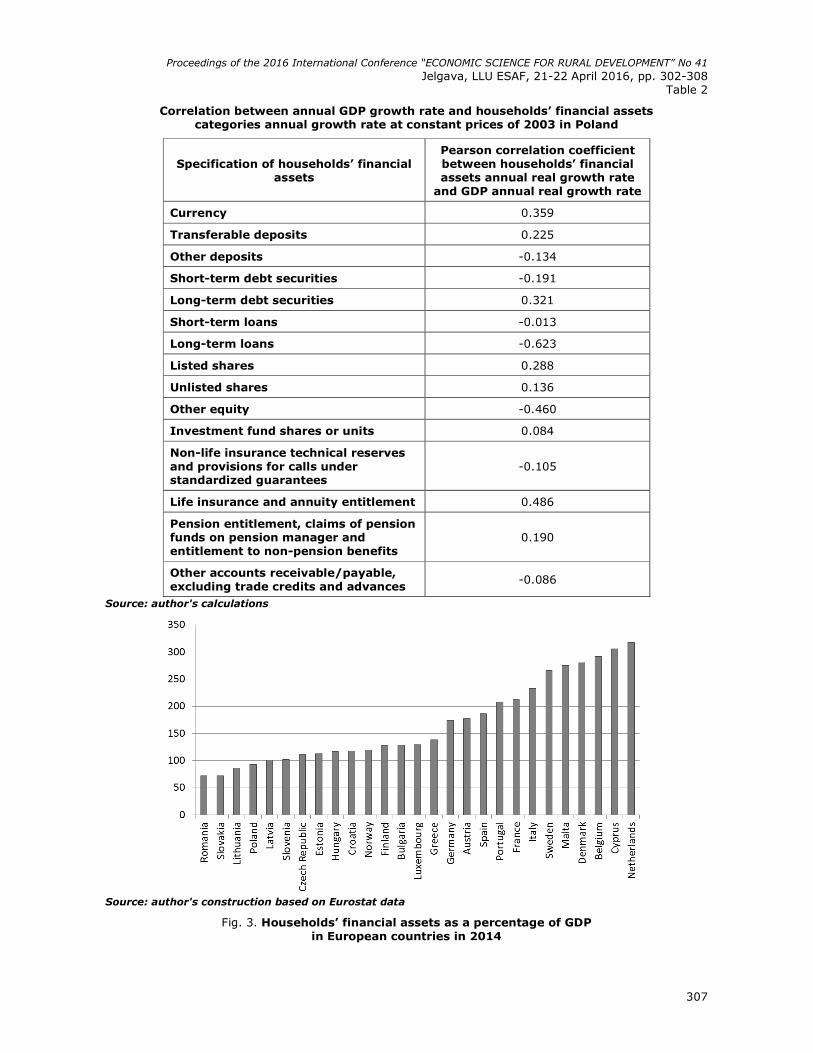
Proceedings of the 2016 International Conference “ECONOMIC SCIENCE FOR RURAL DEVELOPMENT” No 41
Jelgava, LLU ESAF, 21-22 April 2016, pp. 302-308
307
Table 2
Correlation between annual GDP growth rate and households’ financial assets categories annual growth rate at constant prices of 2003 in Poland
Specification of households’ financial assets
Pearson correlation coefficient between households’ financial assets annual real growth rate
and GDP annual real growth rate
Currency 0.359
Transferable deposits 0.225
Other deposits -0.134
Short-term debt securities -0.191
Long-term debt securities 0.321
Short-term loans -0.013
Long-term loans -0.623
Listed shares 0.288
Unlisted shares 0.136
Other equity -0.460
Investment fund shares or units 0.084
Non-life insurance technical reserves and provisions for calls under standardized guarantees
-0.105
Life insurance and annuity entitlement 0.486
Pension entitlement, claims of pension funds on pension manager and entitlement to non-pension benefits
0.190
Other accounts receivable/payable, excluding trade credits and advances
-0.086
Source: author's calculations
Source: author's construction based on Eurostat data
Fig. 3. Households’ financial assets as a percentage of GDP in European countries in 2014
Proceedings of the 2016 International Conference “ECONOMIC SCIENCE FOR RURAL DEVELOPMENT” No 41
Jelgava, LLU ESAF, 21-22 April 2016, pp. 302-308
308
Conclusions
The paper analyses households’ financial
assets value and structure in Poland in the years
2003-2014. The analysis shows that:
1) households’ financial assets in Poland
increased by over 100% in constant prices in
the period 2003-2014; this increase can be
evaluated as significant;
2) in Poland, households’ financial assets
value as a percentage of GDP is rather low
(about 100%) among European countries
(even 200-300%); relatively low level of
households’ financial assets is also observed
in Romania, Slovakia, Lithuania, Latvia and
Slovenia;
3) transferable and other deposits dominate
(30-40%) in the structure of households’
financial assets in Poland with the significant
role of shares and equity (20-30 %) and a
currency (7-9 %);
4) among significant households’ financial
assets the value increased in categories:
transferable deposits (by 263 %), listed
shares (by 169 %) and investment fund
shares or units (by 140 %);
5) correlation analysis shows that there is
almost no significant correlation between real
annual GDP growth rate and households’
financial assets categories real annual growth
rate; using quarterly data may lead to
different conclusion.
Bibliography
1. European System of Account. ESA 2010 (2013). Publications Office of the European Union.
2. Aniola-Mikolajczak, P., Golas, Z. (2014). The Socioeconomic Conditions of Saving Behaviours in Polish Households. Acta Scientiarum Polonorum. Oeconomia, 13(4), pp. 7-17.
3. Bertaut, C., Starr-McCluer, M. (2000). Household Portfolios in the United States. FEDS Working Paper, 2000-26.
4. Bywalec, Cz. (2009). Ekonomika i finanse gospodarstw domowych (Household Economics and Finance). PWN, Warszawa.
5. Callen, T., Thimann, Ch. (1997). Empirical Determinants of Household Saving: Evidence from OECD Countries. IMF Working Paper, 97/181, pp. 1-16.
6. Cardak, B., Wilkins, R. (2006). The Determinants of Household Risky Asset Holdings: Australian Evidence on Background Risk and Other Factors. Journal of Banking & Finance, 33, pp. 850-860.
7. Honohan, P. (2006). Household Financial Assets in the Process of Development. World Bank policy research Working Paper, 3965.
8. Lusardi, A. (2008). Household Saving Behavior: the Role of Financial Literacy, Information, and Financial Education Programs. NBER Working Paper Series, 13824.
9. Morley, J., Piger, J. (2012). The Asymmetric Business Cycle. Review of Economics and Statistics, 94(1), pp. 208-221.
10. Rytelewska, G., Klopocka, A. (2010). Wpływ czynników demograficznych na poziom i strukturę oszczędności gospodarstw domowych w Polsce (The Impact of Demographic Factors on the Level and Structure of Household Savings in Poland). Bank i Kredyt, 41 (1), pp. 57-80.
11. Starzynska, W. (2002). Statystyka praktyczna (Practical Statistics). PWN, Warszawa.
12. Smeeding, T., Weinberg, D. (2001). Toward a Uniform Definition of Household Income. Review of Income and Wealth, 47.1, pp. 1-24.
13. Utzig, M. (2013). Aktywa finansowe gospodarstw domowych a koniunktura gospodarcza (Households’ Financial Assets and Economic Prospect). Prace Naukowe Uniwersytetu Ekonomicznego we Wrocławiu, 305, pp. 744-753.
14. Walden, M. (2012). Will Households Change Their Saving Behaviour After the „Great Recession”? The Role of Human Capital. Journal of Consumer Policy, 35, pp. 237-254.
15. Wojcik, E. (2007). Polskie gospodarstwa domowe na rynku oszczędności (Polish Households on Savings Market). Bank i Kredyt, 38(7), pp. 55-66.


