Embed Size (px)
Citation preview
Journal of Regional Development and Planning, Vol. 2, No. 1, 2013 15
POVERTY AND CALORIE DEPRIVATION ACROSS SOCIO-ECONOMIC
GROUPS IN RURAL INDIA: A DISAGGREGATED ANALYSIS
Abha Gupta1 & Deepak K. Mishra2
This paper examines the linkages between calorie deprivation and poverty in rural India at a
disaggregated level. It aims to explore the trends and pattern in levels of nutrient intake across
social and economic groups. A spatial analysis at the state and NSS-region level unravels the
spatial distribution of calorie deprivation in rural India. The gap between incidence of poverty
and calorie deprivation has also been investigated. The paper also estimates the factors
influencing calorie deprivation in rural India. The study point out that nutritional deprivation is
high among marginalized social groups and regions. It is the poor, scheduled castes, scheduled
tribes, illiterate people, agricultural labourers and Muslims who are more likely to be calorie
deprived.
INTRODUCTION
Notwithstanding India’s relatively robust economic performance since the economic reforms in
early 1990’s, significant deficits in human development parameters, most notably in health and
nutrition standards, remain a cause of concern. India has the largest number of under-nourished
children in the world. Not only that prevalence of child under-nutrition in India (43 percent) much
higher than the world average (25 percent), its performance is worse than some of the poorest
economies of the world (World Food Programme 2009).This prevalence is even higher among
some socio-economic groups and regions. One of the WHO’s millennium development goal is to
reduce the number of stunted, wasted and underweight children by 2015. Only few years are left to
achieve this goal but in India still 38.4 percent children under the age of 3 are stunted, 19.1 percent
are wasted and 46 percent children are underweight (National Family Health Survey 2005-06).
There has been a sluggish decline in this percentage over a decade but this decline is unimpressive
when compared across states and different socio economic groups. Besides poor performance in
terms of some anthropometric measures, average per capita per day calorie and protein intake is
also showing a declining trend in the post economic reforms period. Consumption and expenditure
on cereal food items, which are a good source of energy has recorded a decline whereas other food
items (vegetables, fruits, meat/egg/fish, oil, milk) have shown a slightly increasing share in the
diet of the population. However, decline in calories is not seen as deterioration of health by some
researchers rather it is viewed as a sign of improvement resulted by an increase in income,
development of rural infrastructure, mechanization, urbanization, improvement in health and
change in taste and preferences (Deaton and Dreze 2009, 2010; Verma et al. 2008; Rao 2000).
Another group of scholars, however, links this with the increasing deterioration in health and
1 Research Scholar, Centre for the Study of Regional Development, School of Social Sciences, Jawaharlal
Nehru University, New Delhi-110067. E-mail: [email protected]
2 Associate Professor, Centre for the Study of Regional Development, School of Social Sciences, Jawaharlal
Nehru University, New Delhi-110067. E-mail: [email protected].
JOURNAL OF REGIONAL DEVELOPMENT AND PLANNING 16
nutrition standards of the population (Patnaik 2004, 2007, 2010; Nasurudeen et al. 2006; Ray
2005:10; Mehta and Venkatraman 2000; Shariff and Mallick 1999; Mehta 1982).
India’s growth ‘turn around’ has not resulted in remarkable improvements in health and nutrition
outcomes, and it has raised questions on the inclusiveness of the growth process (Radhakrishna et
al. 2004). The high level of undernourishment among children (46 percent, National Family
Health survey 2005), the relatively high infant mortality rate (47/000 live births, Sample
Registration System 2010) and signs of distress among marginalized sections of the society in a
country which has witnessed remarkable growth in recent decades has been a widely discussed
issue (Dubey and Thorat 2012; Reddy and Mishra 2010). However, India’s poverty measured in
terms of head count ratio, which is a measure based on minimum calorie norm, has seen consistent
decline during this period of growth. This evidence of declining poverty is not accepted by all and
it remains a contested question (Deaton and Dreze 2009, 2010; Patnaik 2007, 2010)1. The rising
gap between official head-count ratio and share of population having less than minimum calorie
intake that formed the basis of official poverty line has been a matter of wide public concern and
debate (Dev 2005; Sen 2005; Jones and Sen 2001). This debate surrounds over the method of
poverty measurement and the focus has been on whether the official poverty line is adequate to
account for rising expenditure on health and education, which, until recently, were being provided
by the state. Most of the studies on poverty deal with the level of rural and urban poverty at the all
India and state level. This paper attempts to unravel these issues at a more disaggregated level- at
the level of NSS (National Sample Survey) regions and also in terms of various socio-economic
groups.
The broad objectives of this paper are outlined as follows:
1) To examine changes in consumption of different food items in order to explain changes in
nutrition level.
2) To estimate changes in level of nutrients and deficiency of different nutrients from the
recommended dietary allowances (RDA) at disaggregated level and to show the gaps
between levels of poverty and levels of nutrition deficiency.
3) To estimate probability of being calorie deprived at disaggregated level using binary
logistic regression analysis.
From the policy perspective, the results of this paper have important implications for both the
methodology of poverty measurement and also for providing nutrition security to the vulnerable
sections of the population.
DATA AND METHODS
Data for this paper are obtained from National Sample Survey (NSS), 50th (1993-94), 61st (2004-
05) and 66th (2009-10) Consumer Expenditure Schedules. These rounds of the survey, by the NSS
are large scale sample surveys and provide information on consumer expenditure quinquennially
as part of its “rounds”. Consumer expenditure survey gives information on quantity and value of
different goods in a household with a reference period of last 30 days for each state/UT, all India
and separately for rural and urban areas. Among these goods, information on 142 items of food are
collected which can be converted into nutrition values2.
Journal of Regional Development and Planning, Vol. 2, No. 1, 2013 17
In this paper, average per capita per day 2400 kcal has been used to show calorie deprivation
which is also used by Planning Commission to indirectly estimate head-count ratio for rural areas3.
For converting monthly household food consumption into per capita monthly consumption,
monthly household consumption is divided by household size. To get the per capita per day
consumption, per capita monthly consumption is divided by number 30. In order to show
probability of being calorie deprived across socio-economic and demographic groups, a logit
model has been fitted which is
� =1
1 + ���
P = 1/1+e-z..……………. (1)
Where P is the estimated probability, z is the predictor variable and e is the base of natural
logarithm with a value of 2.7183. After simplification, we get
Log z = P/1-P…………… (2)
Where (P/1-P) is called odds and log (P/1-P) is called log odds or the logit of P. Thus, equation
(2) becomes
logit P = Z…………….. (3)
The multivariate logistic function involves ‘n’ predictor variables which is represented by
P = (1/1+e-b0 + b1
x1+
b2x2 +……… bn
xn) ………… (4)
Or, logit P = (bo + b1x1 + b2x2 +…… bnxn)…………. (5)
The coefficients b1 represents the additive effect of one unit change in the predictor variable x1 on
the log odds of the response variable. Whereas one unit increase in the x1, holding other predictor
variable constant, multiplies the odd by the factor eb1. For this reason the quantity eb
1 called the
odd ratio.
RESULTS AND DISCUSSION
Trends in Food Consumption in Rural India
Food is one of the basic needs for human survival. The variety of food that we consume
determines our nutrition behaviour in terms of calorie, protein, fat and other micronutrients. In
rural India, cereals have been the main constituents in people’s diet. Among cereals, rice recorded
an important share in total cereal consumption followed by wheat, coarse cereals, vegetables, milk
and fruits (Table 1).
During 1994-2005 the biggest decline was experienced by cereal consumption. This decline was
caused by fall particularly in coarse cereal consumption followed by rice and wheat consumption.
Pulse and milk consumption declined slightly. As far as change in consumption of ‘other food
items’ (vegetables, fruits, meat and edible oil) were concerned, highest increase was found in
vegetable consumption. Other food items recorded a slight increase in their consumption. A recent
round of NSS (66th Consumer Expenditure Survey, 2009-10) shows that cereals still hold the
highest place among all food items mainly because of higher rice consumption. However, cereal
consumption still continues to decline but the decline has been lesser during 2005-10 compared to
a decline during 1994-05. The consumption of wheat, rice and coarse cereals shows a marginal
decline. As far as consumption of ‘other food items’ (Vegetables, fruits, meat and edible oil) is
concerned, a marginal increase is seen in the consumption of these food items. From the analysis
JOURNAL OF REGIONAL DEVELOPMENT AND PLANNING 18
above, it can be argued that last 15 years, often referred to as the ‘post economic reform period’,
rural India experienced a sharp decline in cereal consumption particularly coarse cereals, although
the precise linkages between economic reforms and calories deprivation needs to be examined
further. However, in recent five years (2005-2010) this decline has been minimal. The
consumption of other food items has been slightly increasing over the years but this increase is not
compensated by decline in cereals, as a result of which calorie and protein intakes are falling.
Table 1 Food Consumption Pattern and its Change in Rural India: 1994-2010
(Monthly Per Capita in kg*)
Food Items Year
Kg Change (1994-2005)
Kg Change (2005-2010) 1993-94 2004-05 2009-10
Cereal 13.40 12.11 11.35 -1.29 -0.76
Wheat 4.32 4.19 4.34 -0.13 0.15
Rice 6.79 6.38 6.13 -0.41 -0.25
Coarse cereal 1.97 1.27 0.87 -0.70 -0.40
Pulses 0.76 0.71 0.66 -0.05 -0.05
Milk Liquid (litres) 3.94 3.87 4.08 -0.07 0.21
Vegetable 4.75 5.25 4.58 0.50 -0.67
Fruits 0.22 0.30 0.21 0.08 -0.09
Fruits (nos.) 2.71 2.84 2.66 0.13 -0.18
Meat 0.12 0.14 0.14 0.01 0.00
Egg (nos.) 0.64 1.01 0.95 0.37 -0.06
Fish 0.18 0.20 0.21 0.02 0.01
Edible Oil (litres) 0.37 0.48 0.56 0.11 0.08
Source: Authors' calculation from NSS 50th, 61st and 66th Consumer Expenditure Schedule.
Note: unit in kg unless otherwise specified in brackets after the food-item.
Change in Nutrient share of various Food Items and level of Poverty in Rural India
It is believed that food consumption in India has changed much which has caused overall decline
in calories. There are various factors which affect consumption of food items such as production,
availability and prices, lower level of unemployment, rise in per capita expenditure, change in
taste, climate, decline in physical activity, improvement in health status, urbanization, increased
awareness among consumers about food nutrients, access to safe drinking water, health care and
environmental hygiene for effective conversion of food into energy (Kumar et al. 2007; WHO
2003; Bansil 2003; Viswanathan 2001; Martorell and Ho 1984). A group of scholars considers this
decline in calories as a positive and anticipated development and for them this decline is not a
matter of serious concern (Radhakrishna 2005; Radhakrishna and Reddy 2004; Rao 2000). On the
other hand, Patnaik (2007) has argued that decline in calories leads to deterioration in health and
poverty and blames Planning Commission for using faulty prices to adjust poverty in India as the
reason for artificially lowering the estimates of poverty. The average per capita per day (PCPD)
calorie consumption declined from 2148 kcal to 2044 kcal between 1993/94 to 2004/05 in rural
India. On an average PCPD intake of protein also recorded a fall from 59.9 gm to 55.1 gm during
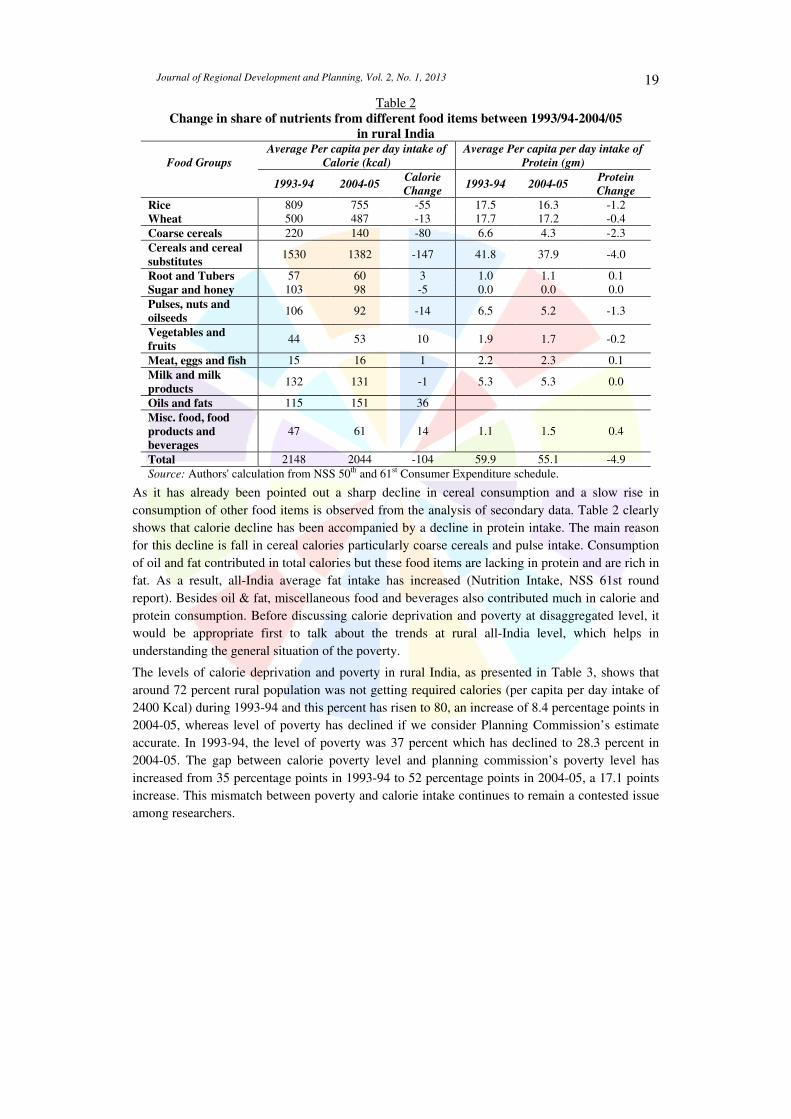
the same period (Table 2).
Journal of Regional Development and Planning, Vol. 2, No. 1, 2013 19
Table 2 Change in share of nutrients from different food items between 1993/94-2004/05
in rural India
Food Groups Average Per capita per day intake of
Calorie (kcal) Average Per capita per day intake of
Protein (gm)
1993-94 2004-05 Calorie Change
1993-94 2004-05 Protein Change
Rice 809 755 -55 17.5 16.3 -1.2 Wheat 500 487 -13 17.7 17.2 -0.4
Coarse cereals 220 140 -80 6.6 4.3 -2.3
Cereals and cereal
substitutes 1530 1382 -147 41.8 37.9 -4.0
Root and Tubers 57 60 3 1.0 1.1 0.1 Sugar and honey 103 98 -5 0.0 0.0 0.0
Pulses, nuts and
oilseeds 106 92 -14 6.5 5.2 -1.3
Vegetables and
fruits 44 53 10 1.9 1.7 -0.2
Meat, eggs and fish 15 16 1 2.2 2.3 0.1
Milk and milk
products 132 131 -1 5.3 5.3 0.0
Oils and fats 115 151 36
Misc. food, food
products and
beverages
47 61 14 1.1 1.5 0.4
Total 2148 2044 -104 59.9 55.1 -4.9
Source: Authors' calculation from NSS 50th and 61st Consumer Expenditure schedule.
As it has already been pointed out a sharp decline in cereal consumption and a slow rise in
consumption of other food items is observed from the analysis of secondary data. Table 2 clearly
shows that calorie decline has been accompanied by a decline in protein intake. The main reason
for this decline is fall in cereal calories particularly coarse cereals and pulse intake. Consumption
of oil and fat contributed in total calories but these food items are lacking in protein and are rich in
fat. As a result, all-India average fat intake has increased (Nutrition Intake, NSS 61st round
report). Besides oil & fat, miscellaneous food and beverages also contributed much in calorie and
protein consumption. Before discussing calorie deprivation and poverty at disaggregated level, it
would be appropriate first to talk about the trends at rural all-India level, which helps in
understanding the general situation of the poverty.
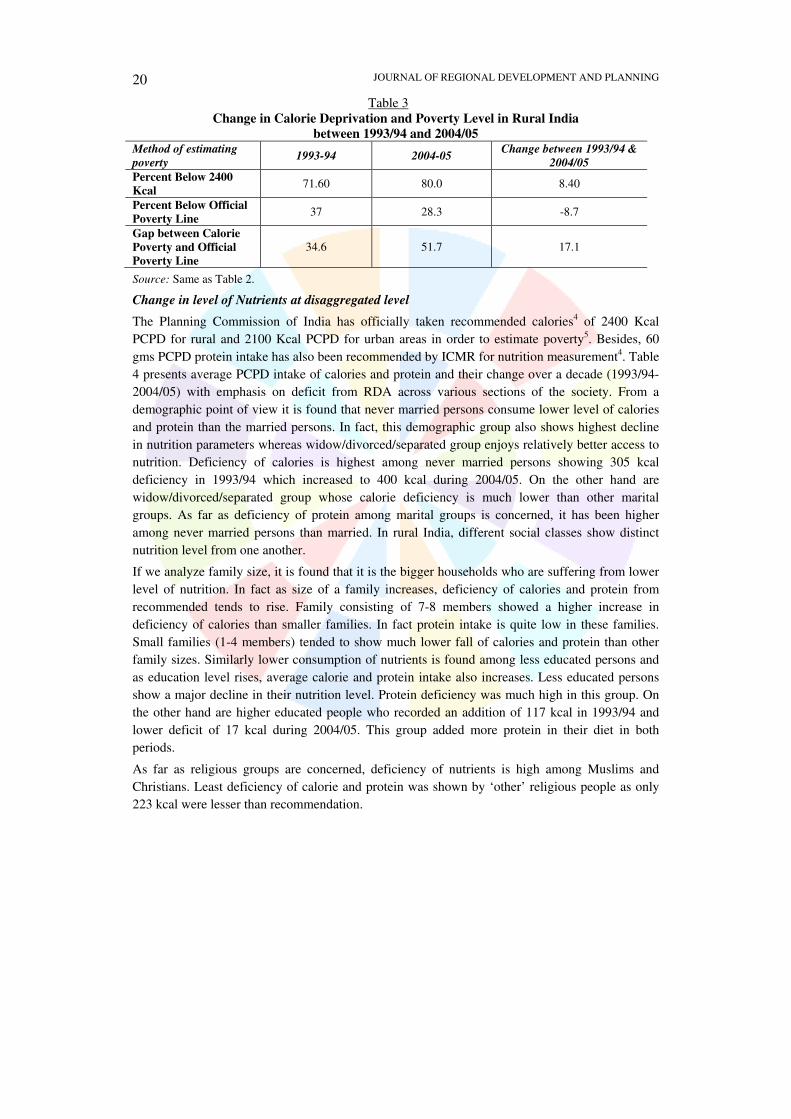
The levels of calorie deprivation and poverty in rural India, as presented in Table 3, shows that
around 72 percent rural population was not getting required calories (per capita per day intake of
2400 Kcal) during 1993-94 and this percent has risen to 80, an increase of 8.4 percentage points in
2004-05, whereas level of poverty has declined if we consider Planning Commission’s estimate
accurate. In 1993-94, the level of poverty was 37 percent which has declined to 28.3 percent in
2004-05. The gap between calorie poverty level and planning commission’s poverty level has
increased from 35 percentage points in 1993-94 to 52 percentage points in 2004-05, a 17.1 points
increase. This mismatch between poverty and calorie intake continues to remain a contested issue
among researchers.
JOURNAL OF REGIONAL DEVELOPMENT AND PLANNING 20
Table 3 Change in Calorie Deprivation and Poverty Level in Rural India
between 1993/94 and 2004/05 Method of estimating poverty
1993-94 2004-05 Change between 1993/94 &
2004/05
Percent Below 2400
Kcal 71.60 80.0 8.40
Percent Below Official
Poverty Line 37 28.3 -8.7
Gap between Calorie
Poverty and Official
Poverty Line
34.6 51.7 17.1
Source: Same as Table 2.
Change in level of Nutrients at disaggregated level
The Planning Commission of India has officially taken recommended calories4 of 2400 Kcal
PCPD for rural and 2100 Kcal PCPD for urban areas in order to estimate poverty5. Besides, 60
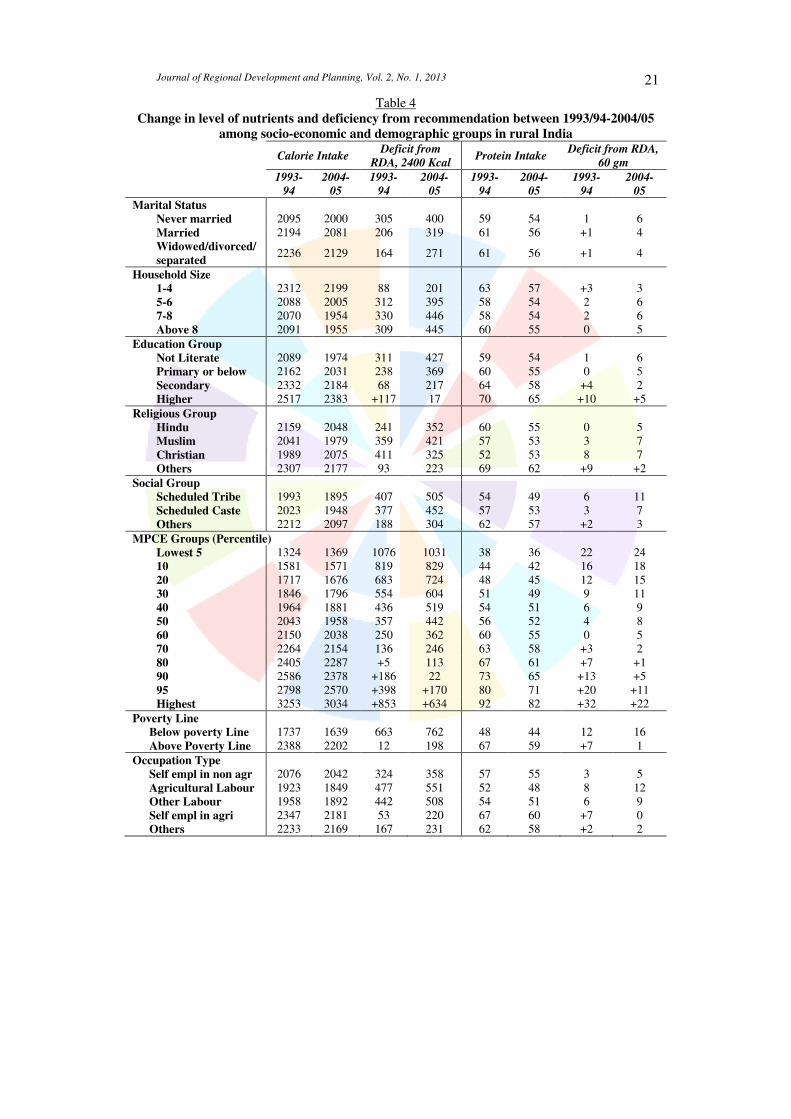
gms PCPD protein intake has also been recommended by ICMR for nutrition measurement4. Table
4 presents average PCPD intake of calories and protein and their change over a decade (1993/94-
2004/05) with emphasis on deficit from RDA across various sections of the society. From a
demographic point of view it is found that never married persons consume lower level of calories
and protein than the married persons. In fact, this demographic group also shows highest decline
in nutrition parameters whereas widow/divorced/separated group enjoys relatively better access to
nutrition. Deficiency of calories is highest among never married persons showing 305 kcal
deficiency in 1993/94 which increased to 400 kcal during 2004/05. On the other hand are
widow/divorced/separated group whose calorie deficiency is much lower than other marital
groups. As far as deficiency of protein among marital groups is concerned, it has been higher
among never married persons than married. In rural India, different social classes show distinct
nutrition level from one another.
If we analyze family size, it is found that it is the bigger households who are suffering from lower
level of nutrition. In fact as size of a family increases, deficiency of calories and protein from
recommended tends to rise. Family consisting of 7-8 members showed a higher increase in
deficiency of calories than smaller families. In fact protein intake is quite low in these families.
Small families (1-4 members) tended to show much lower fall of calories and protein than other
family sizes. Similarly lower consumption of nutrients is found among less educated persons and
as education level rises, average calorie and protein intake also increases. Less educated persons
show a major decline in their nutrition level. Protein deficiency was much high in this group. On
the other hand are higher educated people who recorded an addition of 117 kcal in 1993/94 and
lower deficit of 17 kcal during 2004/05. This group added more protein in their diet in both
periods.
As far as religious groups are concerned, deficiency of nutrients is high among Muslims and
Christians. Least deficiency of calorie and protein was shown by ‘other’ religious people as only
223 kcal were lesser than recommendation.
Journal of Regional Development and Planning, Vol. 2, No. 1, 2013 21
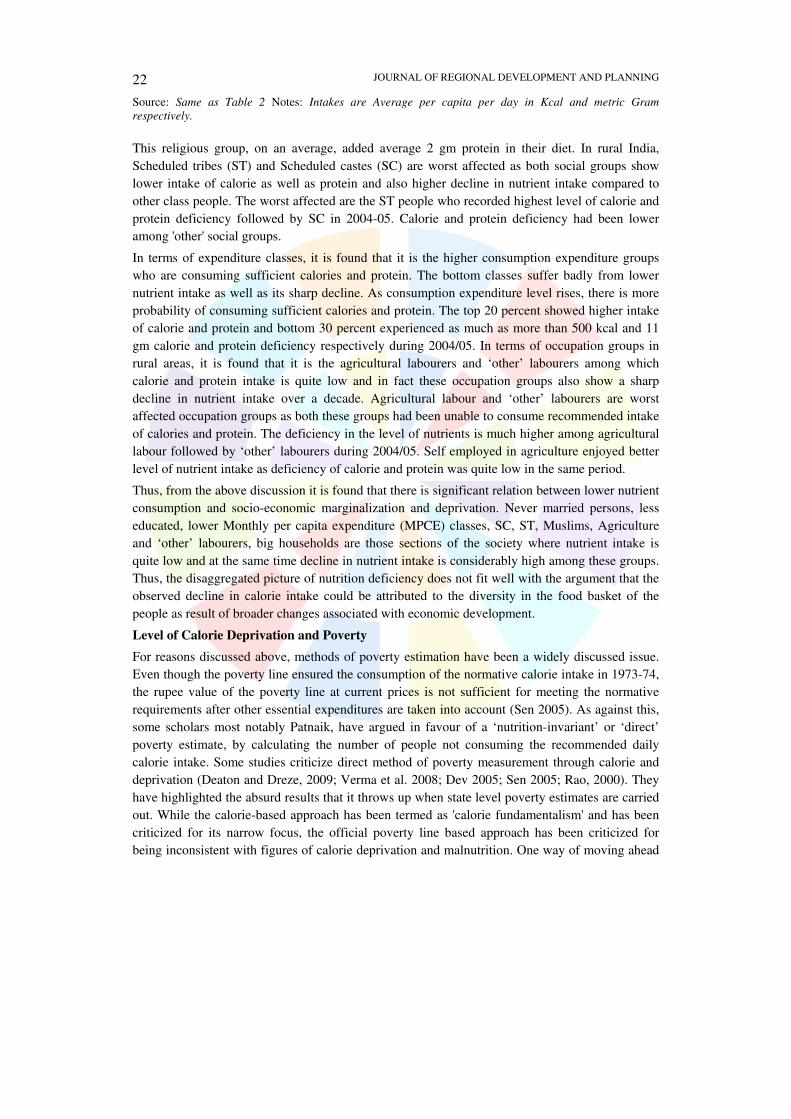
Table 4 Change in level of nutrients and deficiency from recommendation between 1993/94-2004/05
among socio-economic and demographic groups in rural India
Calorie Intake Deficit from
RDA, 2400 Kcal Protein Intake
Deficit from RDA, 60 gm
1993-94
2004-05
1993-94
2004-05
1993-94
2004-05
1993-94
2004-05
Marital Status Never married 2095 2000 305 400 59 54 1 6 Married 2194 2081 206 319 61 56 +1 4 Widowed/divorced/
separated 2236 2129 164 271 61 56 +1 4
Household Size 1-4 2312 2199 88 201 63 57 +3 3 5-6 2088 2005 312 395 58 54 2 6 7-8 2070 1954 330 446 58 54 2 6 Above 8 2091 1955 309 445 60 55 0 5
Education Group Not Literate 2089 1974 311 427 59 54 1 6 Primary or below 2162 2031 238 369 60 55 0 5 Secondary 2332 2184 68 217 64 58 +4 2 Higher 2517 2383 +117 17 70 65 +10 +5
Religious Group Hindu 2159 2048 241 352 60 55 0 5 Muslim 2041 1979 359 421 57 53 3 7 Christian 1989 2075 411 325 52 53 8 7 Others 2307 2177 93 223 69 62 +9 +2
Social Group Scheduled Tribe 1993 1895 407 505 54 49 6 11 Scheduled Caste 2023 1948 377 452 57 53 3 7 Others 2212 2097 188 304 62 57 +2 3
MPCE Groups (Percentile) Lowest 5 1324 1369 1076 1031 38 36 22 24 10 1581 1571 819 829 44 42 16 18 20 1717 1676 683 724 48 45 12 15 30 1846 1796 554 604 51 49 9 11 40 1964 1881 436 519 54 51 6 9 50 2043 1958 357 442 56 52 4 8 60 2150 2038 250 362 60 55 0 5 70 2264 2154 136 246 63 58 +3 2 80 2405 2287 +5 113 67 61 +7 +1 90 2586 2378 +186 22 73 65 +13 +5 95 2798 2570 +398 +170 80 71 +20 +11 Highest 3253 3034 +853 +634 92 82 +32 +22
Poverty Line Below poverty Line 1737 1639 663 762 48 44 12 16 Above Poverty Line 2388 2202 12 198 67 59 +7 1
Occupation Type Self empl in non agr 2076 2042 324 358 57 55 3 5 Agricultural Labour 1923 1849 477 551 52 48 8 12 Other Labour 1958 1892 442 508 54 51 6 9 Self empl in agri 2347 2181 53 220 67 60 +7 0 Others 2233 2169 167 231 62 58 +2 2
JOURNAL OF REGIONAL DEVELOPMENT AND PLANNING 22
Source: Same as Table 2 Notes: Intakes are Average per capita per day in Kcal and metric Gram
respectively.
This religious group, on an average, added average 2 gm protein in their diet. In rural India,
Scheduled tribes (ST) and Scheduled castes (SC) are worst affected as both social groups show
lower intake of calorie as well as protein and also higher decline in nutrient intake compared to
other class people. The worst affected are the ST people who recorded highest level of calorie and
protein deficiency followed by SC in 2004-05. Calorie and protein deficiency had been lower
among 'other' social groups.
In terms of expenditure classes, it is found that it is the higher consumption expenditure groups
who are consuming sufficient calories and protein. The bottom classes suffer badly from lower
nutrient intake as well as its sharp decline. As consumption expenditure level rises, there is more
probability of consuming sufficient calories and protein. The top 20 percent showed higher intake
of calorie and protein and bottom 30 percent experienced as much as more than 500 kcal and 11
gm calorie and protein deficiency respectively during 2004/05. In terms of occupation groups in
rural areas, it is found that it is the agricultural labourers and ‘other’ labourers among which
calorie and protein intake is quite low and in fact these occupation groups also show a sharp
decline in nutrient intake over a decade. Agricultural labour and ‘other’ labourers are worst
affected occupation groups as both these groups had been unable to consume recommended intake
of calories and protein. The deficiency in the level of nutrients is much higher among agricultural
labour followed by ‘other’ labourers during 2004/05. Self employed in agriculture enjoyed better
level of nutrient intake as deficiency of calorie and protein was quite low in the same period.
Thus, from the above discussion it is found that there is significant relation between lower nutrient
consumption and socio-economic marginalization and deprivation. Never married persons, less
educated, lower Monthly per capita expenditure (MPCE) classes, SC, ST, Muslims, Agriculture
and ‘other’ labourers, big households are those sections of the society where nutrient intake is
quite low and at the same time decline in nutrient intake is considerably high among these groups.
Thus, the disaggregated picture of nutrition deficiency does not fit well with the argument that the
observed decline in calorie intake could be attributed to the diversity in the food basket of the
people as result of broader changes associated with economic development.
Level of Calorie Deprivation and Poverty
For reasons discussed above, methods of poverty estimation have been a widely discussed issue.
Even though the poverty line ensured the consumption of the normative calorie intake in 1973-74,
the rupee value of the poverty line at current prices is not sufficient for meeting the normative
requirements after other essential expenditures are taken into account (Sen 2005). As against this,
some scholars most notably Patnaik, have argued in favour of a ‘nutrition-invariant’ or ‘direct’
poverty estimate, by calculating the number of people not consuming the recommended daily
calorie intake. Some studies criticize direct method of poverty measurement through calorie and
deprivation (Deaton and Dreze, 2009; Verma et al. 2008; Dev 2005; Sen 2005; Rao, 2000). They
have highlighted the absurd results that it throws up when state level poverty estimates are carried
out. While the calorie-based approach has been termed as 'calorie fundamentalism' and has been
criticized for its narrow focus, the official poverty line based approach has been criticized for
being inconsistent with figures of calorie deprivation and malnutrition. One way of moving ahead
Journal of Regional Development and Planning, Vol. 2, No. 1, 2013 23
is to carry forward this comparison between percentage of population not having minimum
calories (on which the poverty line was based) and the official poverty estimates to a more
disaggregated level. This is what we have attempted here.
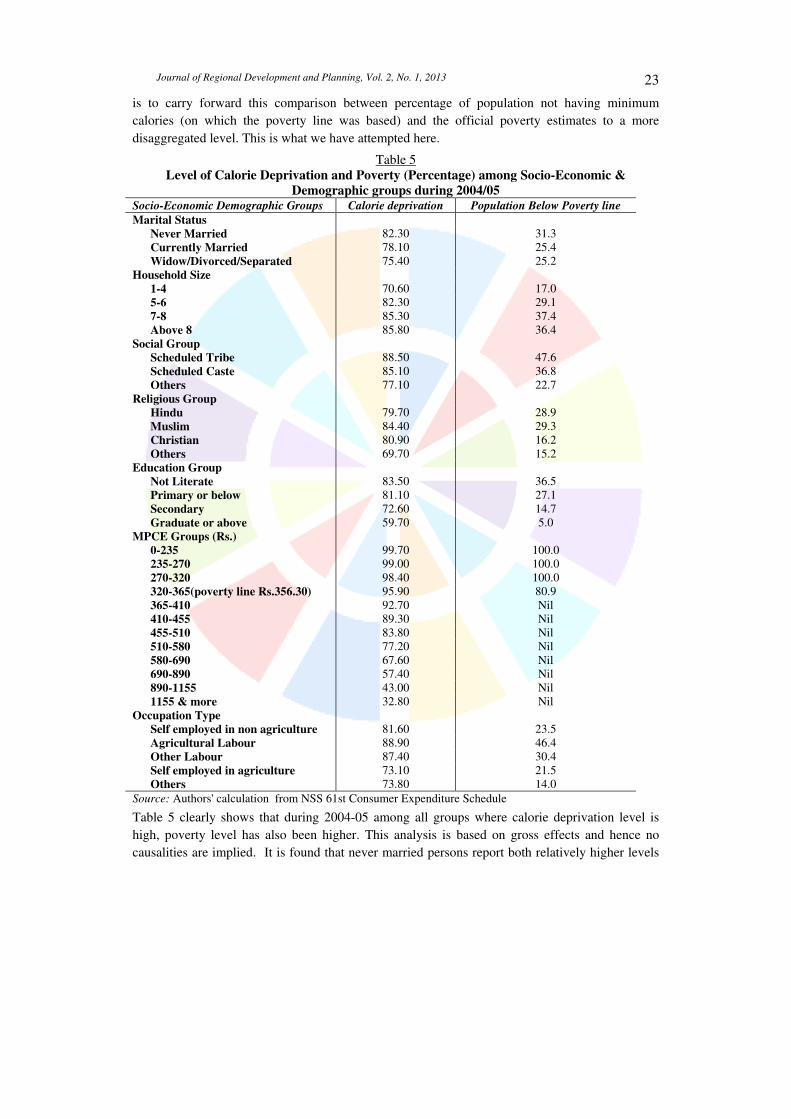
Table 5 Level of Calorie Deprivation and Poverty (Percentage) among Socio-Economic &
Demographic groups during 2004/05 Socio-Economic Demographic Groups Calorie deprivation Population Below Poverty line
Marital Status Never Married 82.30 31.3 Currently Married 78.10 25.4 Widow/Divorced/Separated 75.40 25.2
Household Size 1-4 70.60 17.0 5-6 82.30 29.1 7-8 85.30 37.4 Above 8 85.80 36.4
Social Group Scheduled Tribe 88.50 47.6 Scheduled Caste 85.10 36.8 Others 77.10 22.7
Religious Group Hindu 79.70 28.9 Muslim 84.40 29.3 Christian 80.90 16.2 Others 69.70 15.2
Education Group Not Literate 83.50 36.5 Primary or below 81.10 27.1 Secondary 72.60 14.7 Graduate or above 59.70 5.0
MPCE Groups (Rs.) 0-235 99.70 100.0 235-270 99.00 100.0 270-320 98.40 100.0 320-365(poverty line Rs.356.30) 95.90 80.9 365-410 92.70 Nil 410-455 89.30 Nil 455-510 83.80 Nil 510-580 77.20 Nil 580-690 67.60 Nil 690-890 57.40 Nil 890-1155 43.00 Nil 1155 & more 32.80 Nil
Occupation Type Self employed in non agriculture 81.60 23.5 Agricultural Labour 88.90 46.4 Other Labour 87.40 30.4 Self employed in agriculture 73.10 21.5 Others 73.80 14.0
Source: Authors' calculation from NSS 61st Consumer Expenditure Schedule
Table 5 clearly shows that during 2004-05 among all groups where calorie deprivation level is
high, poverty level has also been higher. This analysis is based on gross effects and hence no
causalities are implied. It is found that never married persons report both relatively higher levels
JOURNAL OF REGIONAL DEVELOPMENT AND PLANNING 24
of poverty and calorie deprivation compared to their group categories. In case of family size,
bigger the household higher is the level of calorie deprivation and poverty. Small households
covering 1-4 members experience lowest poverty and calorie deprivation level. Bigger households
(more than 7 members) perform worse on both counts. As far as social groups are concerned, it is
found that lower social groups such as ST and SC tend to have higher concentration of poverty
and calorie deprivation level, whereas the reverse is true for the 'other social group'. STs are worst
affected as poverty and calorie deprivation level is highest among them, followed by the SCs. If
we see deprivation and poverty level among the religious groups, we find that particularly
Muslims are in a worse condition as both calorie deprivation (84.4 percent) and poverty level (33
percent) are much higher among them in comparison to others. Education wise analysis shows that
it is the lower educated persons who are living in poverty and consuming lower calories than
standard norm. Higher is the education level lower is the levels of poverty and hunger. Illiterate
persons experience a highest level of poverty (36.5 percent) and calorie deprivation (83.5 percent)
level while educated people (with graduation and above) recorded lowest level of poverty (5
percent) and calorie deprivation (59.7 percent) level.
Similarly, lower the MPCE class, higher is the level of poverty and calorie deprivation. Thus,
bottom MPCE classes are unable to feed themselves even the standard calories and are living in
poverty. In terms of occupation groups, agricultural labourers perform worst on both counts
followed by ‘other’ labourer. Thus, while the official poverty measures and calorie deprivation
might show different levels of deprivation, there is a close correspondence among the two so far as
the pattern of deprivation across different groups are concerned.
INTERSTATE AND REGIONAL ANALYSIS
Inter-state variations in levels of deprivation has been one of the persistent themes in the poverty
debate in India (Deaton and Dreze 2010; Patnaik, 2007; Dev 2005). Specific to the divergence
between poverty estimates and calorie deprivation is the wide difference between the two
estimates in India's southern states. Many of the southern states have better human development,
demographic and social development indicators, and the records of state interventions in the areas
of food security, primary education and affirmative action in favour of the weaker sections are
generally considered to be better in most, if not all states of south India, particularly in comparison
with the densely populated north Indian states. In this backdrop, the fact that southern states
generally have a lower incidence of consumption poverty but a relatively higher degree of calorie-
deprivation has been an important issue in the discussion. Patnaik (2007) views poverty as being
underestimated in southern states, whereas Dev (2005) argues that poverty using calorie norm in
southern states give absurd results.
Deaton and Dreze (2009) criticizes calorie norm as poverty method as this norm places all
southern states at higher deprivation level despite a fact that these states perform better in some
anthropometric measures. The incompatibility of the poverty estimates and levels of calorie
deprivation is brought out sharply in Table 6.
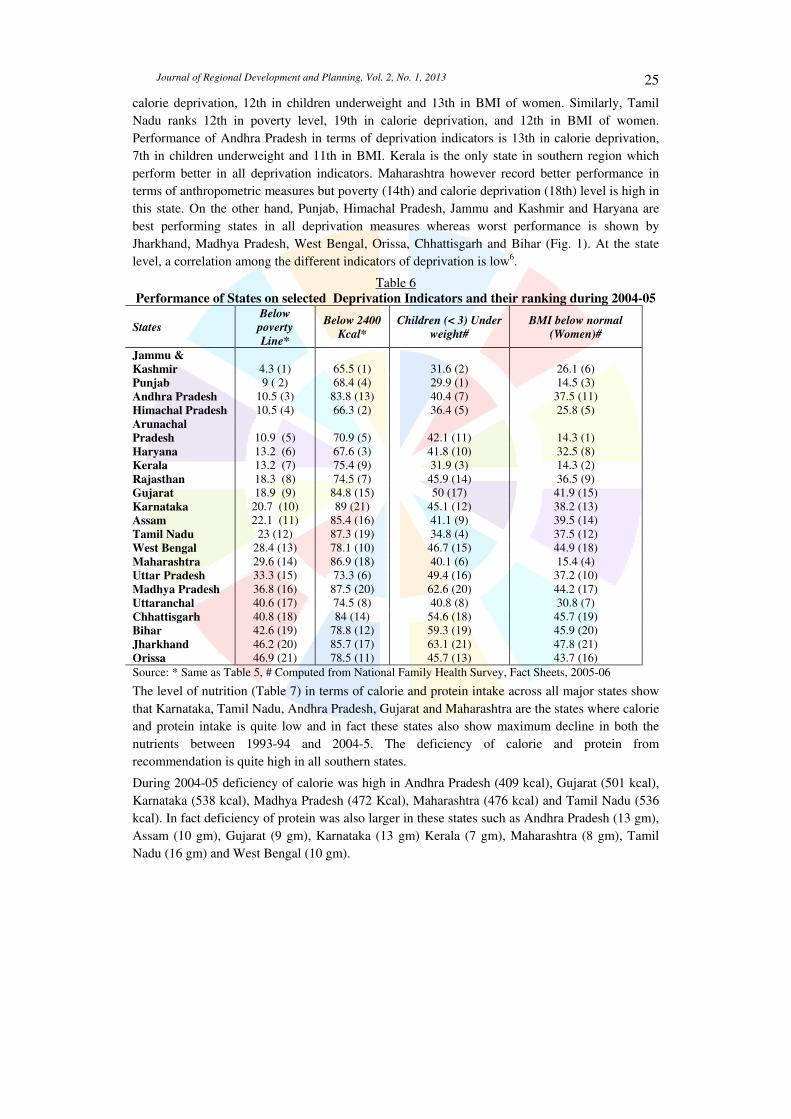
The discussion here has been widened by incorporating two additional indicators of deprivation
and it is important to note that southern states particularly Karnataka, Tamil Nadu, Andhra
Pradesh rank high on more than two deprivation indicators which confirm their poor performance
on selected deprivation indicators. For example, Karnataka ranks 10th in poverty level, 21st in
Journal of Regional Development and Planning, Vol. 2, No. 1, 2013 25
calorie deprivation, 12th in children underweight and 13th in BMI of women. Similarly, Tamil
Nadu ranks 12th in poverty level, 19th in calorie deprivation, and 12th in BMI of women.
Performance of Andhra Pradesh in terms of deprivation indicators is 13th in calorie deprivation,
7th in children underweight and 11th in BMI. Kerala is the only state in southern region which
perform better in all deprivation indicators. Maharashtra however record better performance in
terms of anthropometric measures but poverty (14th) and calorie deprivation (18th) level is high in
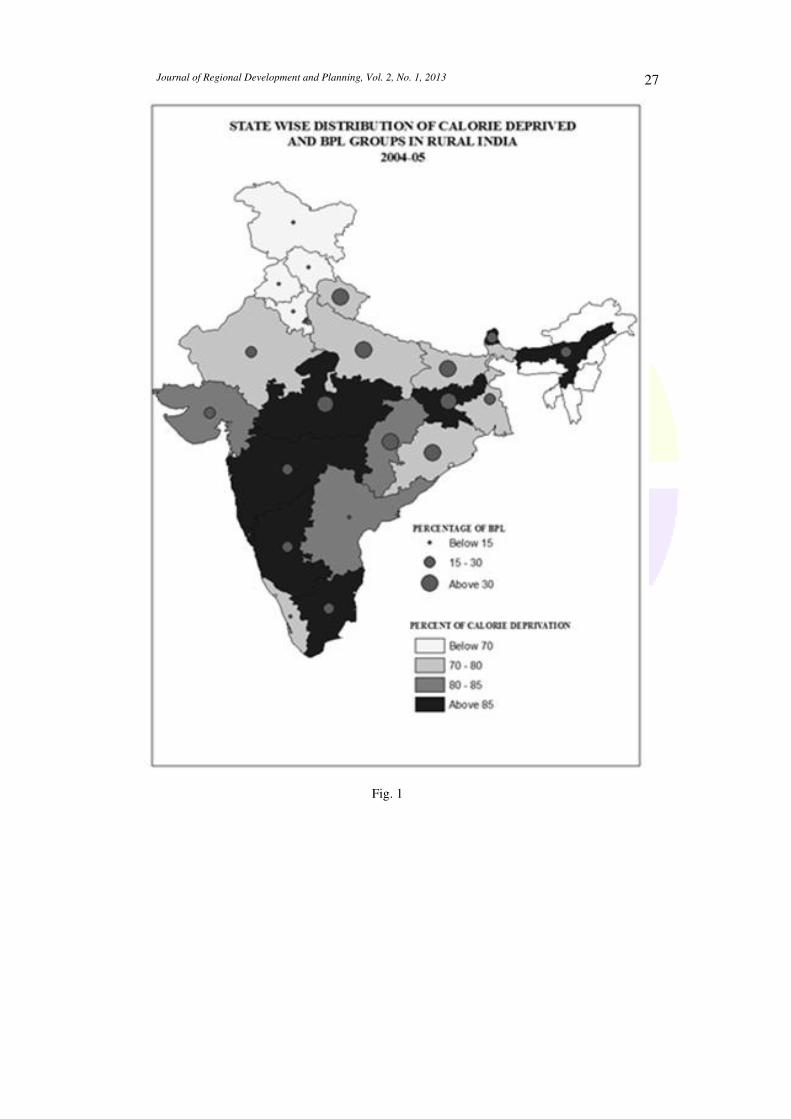
this state. On the other hand, Punjab, Himachal Pradesh, Jammu and Kashmir and Haryana are
best performing states in all deprivation measures whereas worst performance is shown by
Jharkhand, Madhya Pradesh, West Bengal, Orissa, Chhattisgarh and Bihar (Fig. 1). At the state
level, a correlation among the different indicators of deprivation is low6.
Table 6 Performance of States on selected Deprivation Indicators and their ranking during 2004-05
States Below poverty Line*
Below 2400 Kcal*
Children (< 3) Under weight#
BMI below normal (Women)#
Jammu &
Kashmir 4.3 (1) 65.5 (1) 31.6 (2) 26.1 (6) Punjab 9 ( 2) 68.4 (4) 29.9 (1) 14.5 (3) Andhra Pradesh 10.5 (3) 83.8 (13) 40.4 (7) 37.5 (11) Himachal Pradesh 10.5 (4) 66.3 (2) 36.4 (5) 25.8 (5) Arunachal
Pradesh 10.9 (5) 70.9 (5) 42.1 (11) 14.3 (1) Haryana 13.2 (6) 67.6 (3) 41.8 (10) 32.5 (8) Kerala 13.2 (7) 75.4 (9) 31.9 (3) 14.3 (2) Rajasthan 18.3 (8) 74.5 (7) 45.9 (14) 36.5 (9) Gujarat 18.9 (9) 84.8 (15) 50 (17) 41.9 (15) Karnataka 20.7 (10) 89 (21) 45.1 (12) 38.2 (13) Assam 22.1 (11) 85.4 (16) 41.1 (9) 39.5 (14) Tamil Nadu 23 (12) 87.3 (19) 34.8 (4) 37.5 (12) West Bengal 28.4 (13) 78.1 (10) 46.7 (15) 44.9 (18) Maharashtra 29.6 (14) 86.9 (18) 40.1 (6) 15.4 (4) Uttar Pradesh 33.3 (15) 73.3 (6) 49.4 (16) 37.2 (10) Madhya Pradesh 36.8 (16) 87.5 (20) 62.6 (20) 44.2 (17) Uttaranchal 40.6 (17) 74.5 (8) 40.8 (8) 30.8 (7) Chhattisgarh 40.8 (18) 84 (14) 54.6 (18) 45.7 (19) Bihar 42.6 (19) 78.8 (12) 59.3 (19) 45.9 (20) Jharkhand 46.2 (20) 85.7 (17) 63.1 (21) 47.8 (21) Orissa 46.9 (21) 78.5 (11) 45.7 (13) 43.7 (16)
Source: * Same as Table 5, # Computed from National Family Health Survey, Fact Sheets, 2005-06
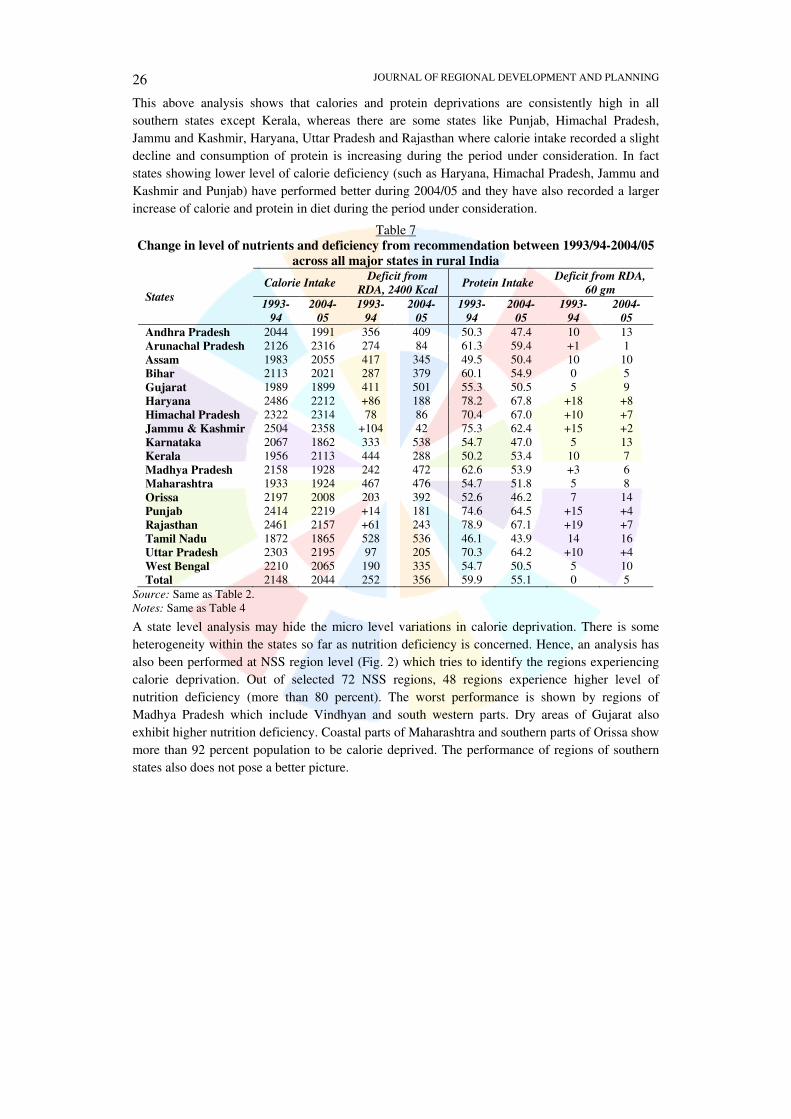
The level of nutrition (Table 7) in terms of calorie and protein intake across all major states show
that Karnataka, Tamil Nadu, Andhra Pradesh, Gujarat and Maharashtra are the states where calorie
and protein intake is quite low and in fact these states also show maximum decline in both the
nutrients between 1993-94 and 2004-5. The deficiency of calorie and protein from
recommendation is quite high in all southern states.
During 2004-05 deficiency of calorie was high in Andhra Pradesh (409 kcal), Gujarat (501 kcal),
Karnataka (538 kcal), Madhya Pradesh (472 Kcal), Maharashtra (476 kcal) and Tamil Nadu (536
kcal). In fact deficiency of protein was also larger in these states such as Andhra Pradesh (13 gm),
Assam (10 gm), Gujarat (9 gm), Karnataka (13 gm) Kerala (7 gm), Maharashtra (8 gm), Tamil
Nadu (16 gm) and West Bengal (10 gm).
JOURNAL OF REGIONAL DEVELOPMENT AND PLANNING 26
This above analysis shows that calories and protein deprivations are consistently high in all
southern states except Kerala, whereas there are some states like Punjab, Himachal Pradesh,
Jammu and Kashmir, Haryana, Uttar Pradesh and Rajasthan where calorie intake recorded a slight
decline and consumption of protein is increasing during the period under consideration. In fact
states showing lower level of calorie deficiency (such as Haryana, Himachal Pradesh, Jammu and
Kashmir and Punjab) have performed better during 2004/05 and they have also recorded a larger
increase of calorie and protein in diet during the period under consideration.
Table 7 Change in level of nutrients and deficiency from recommendation between 1993/94-2004/05
across all major states in rural India
States
Calorie Intake Deficit from
RDA, 2400 Kcal Protein Intake
Deficit from RDA, 60 gm
1993-94
2004-05
1993-94
2004-05
1993-94
2004-05
1993-94
2004-05
Andhra Pradesh 2044 1991 356 409 50.3 47.4 10 13 Arunachal Pradesh 2126 2316 274 84 61.3 59.4 +1 1 Assam 1983 2055 417 345 49.5 50.4 10 10 Bihar 2113 2021 287 379 60.1 54.9 0 5 Gujarat 1989 1899 411 501 55.3 50.5 5 9 Haryana 2486 2212 +86 188 78.2 67.8 +18 +8 Himachal Pradesh 2322 2314 78 86 70.4 67.0 +10 +7 Jammu & Kashmir 2504 2358 +104 42 75.3 62.4 +15 +2 Karnataka 2067 1862 333 538 54.7 47.0 5 13 Kerala 1956 2113 444 288 50.2 53.4 10 7 Madhya Pradesh 2158 1928 242 472 62.6 53.9 +3 6 Maharashtra 1933 1924 467 476 54.7 51.8 5 8 Orissa 2197 2008 203 392 52.6 46.2 7 14 Punjab 2414 2219 +14 181 74.6 64.5 +15 +4 Rajasthan 2461 2157 +61 243 78.9 67.1 +19 +7 Tamil Nadu 1872 1865 528 536 46.1 43.9 14 16 Uttar Pradesh 2303 2195 97 205 70.3 64.2 +10 +4 West Bengal 2210 2065 190 335 54.7 50.5 5 10 Total 2148 2044 252 356 59.9 55.1 0 5
Source: Same as Table 2. Notes: Same as Table 4
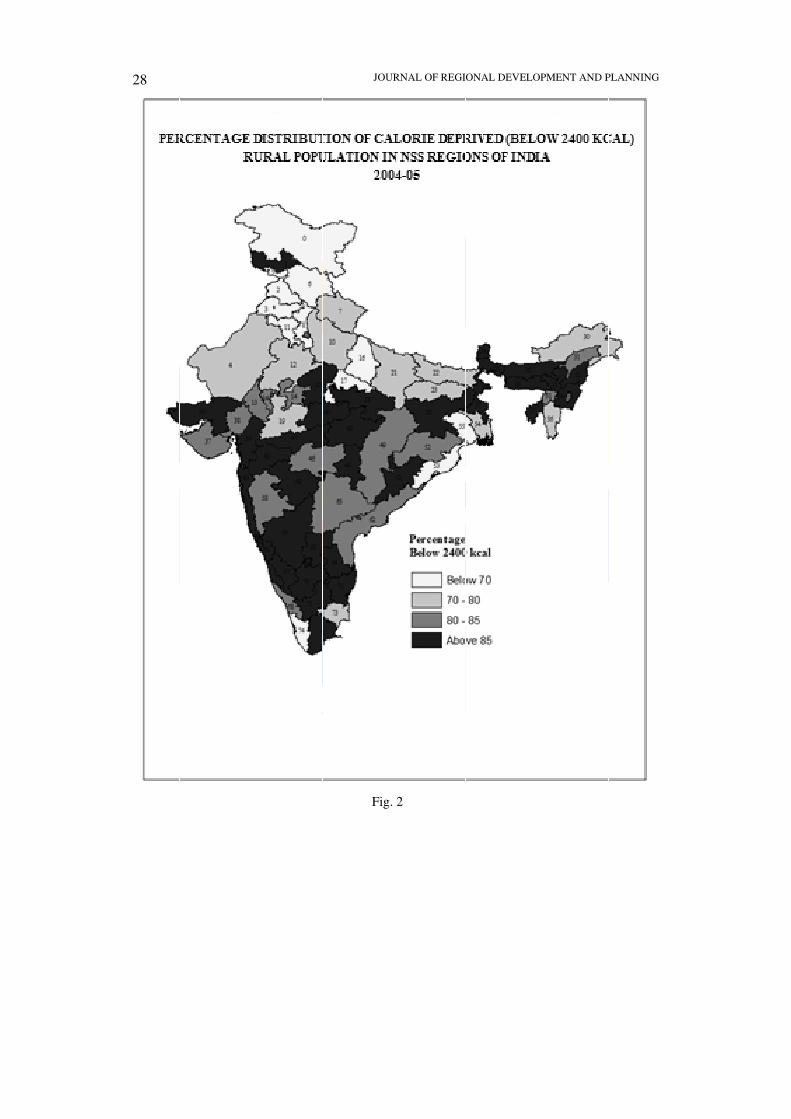
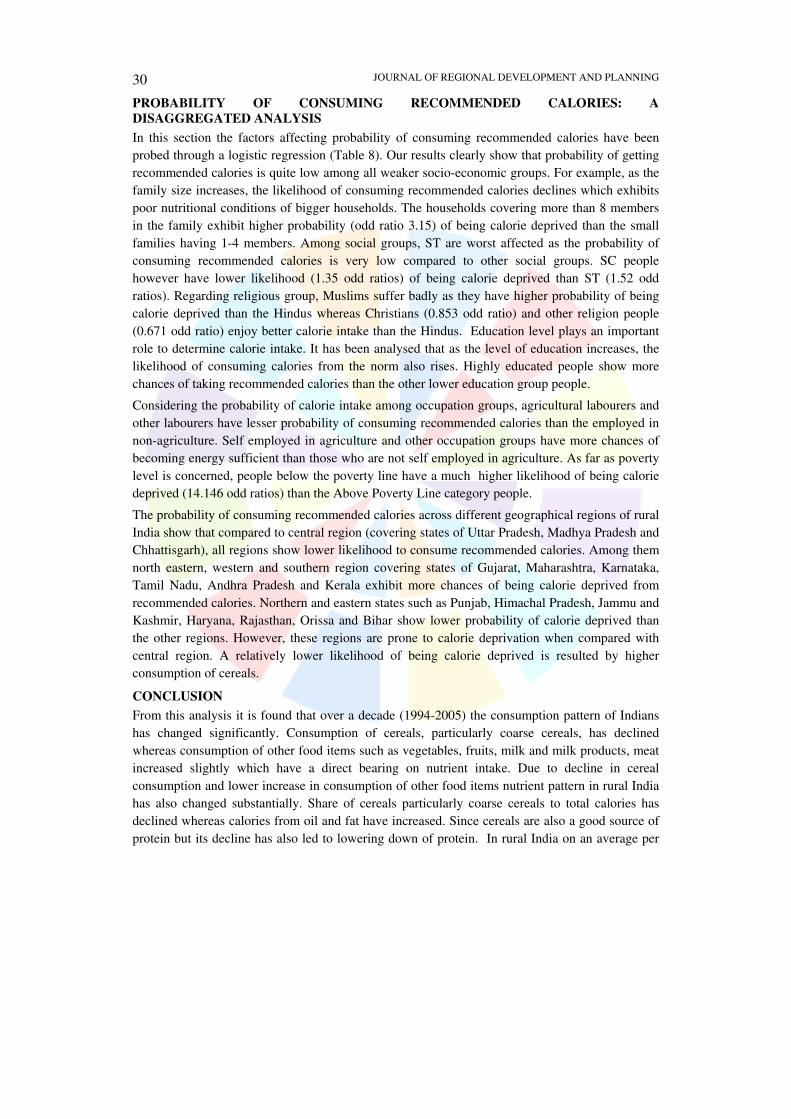
A state level analysis may hide the micro level variations in calorie deprivation. There is some
heterogeneity within the states so far as nutrition deficiency is concerned. Hence, an analysis has
also been performed at NSS region level (Fig. 2) which tries to identify the regions experiencing
calorie deprivation. Out of selected 72 NSS regions, 48 regions experience higher level of
nutrition deficiency (more than 80 percent). The worst performance is shown by regions of
Madhya Pradesh which include Vindhyan and south western parts. Dry areas of Gujarat also
exhibit higher nutrition deficiency. Coastal parts of Maharashtra and southern parts of Orissa show
more than 92 percent population to be calorie deprived. The performance of regions of southern
states also does not pose a better picture.
Journal of Regional Development and Planning, Vol. 2, No. 1, 2013 27
Fig. 1
28
JOURNAL OF REGIONAL DEVELOPMENT AND PLANNING
Fig. 2
JOURNAL OF REGIONAL DEVELOPMENT AND PLANNING
Fig. 2
JOURNAL OF REGIONAL DEVELOPMENT AND PLANNINGJOURNAL OF REGIONAL DEVELOPMENT AND PLANNINGJOURNAL OF REGIONAL DEVELOPMENT AND PLANNING
Journal of Regional Development and Planning, Vol. 2, No. 1, 2013 29
Inland northern parts of Karnataka, coastal northern Tamil Nadu and south-western Andhra
Pradesh experiencing much higher level of nutrition deficiency which may be one of the reasons
of poor performance of southern states on deprivation indicators. It is clear from the figure (Fig.
2) that the regions in south India where level of calorie deprivation is relatively high form a
contiguous belt. The regions which pose a picture of relatively better nutrition sufficiency include
northern and southern parts of Punjab, Himachal Pradesh, western plains of West Bengal, Jhelum
Valley and mountainous parts of Jammu and Kashmir, central and western Uttar Pradesh.
Table 8 Logistic Regression Analysis for Showing Probability of Getting Required Calories
Variables Variable Categories Beta Sig.@ Exponential Beta
Social Group
Others (Ref)^ 0.000 1 Scheduled Tribe 0.421 0.000 1.524 Scheduled Caste 0.318 0.000 1.375
Religious group
Hindu (Ref)^ 0.000 1 Muslim 0.296 0.000 1.344 Christian -0.159 0.000 0.853 Others -0.4 0.000 0.671
Education Level
Primary or below (Ref)^ 0.000 1 Not Literate 0.108 0.000 1.114 Secondary -0.32 0.000 0.726 Graduate or above -0.631 0.000 0.532
Marital Status
Currently Married (Ref)^ 0.000 1 Never Married 0.104 0.000 1.109 Widow/Divorced/Separated -0.28 0.000 0.756
Household Size
1-4 (Ref)^ 0.000 1 5-6 0.682 0.000 1.978 7-8 0.924 0.000 2.52 Above 8 1.147 0.000 3.15
Occupation
Type
Self employed in non agriculture (Ref)^
0.000 1
Agricultural Labour 0.154 0.000 1.166 Other Labour 0.282 0.000 1.326 Self employed in agriculture
-0.524 0.000 0.592
Others -0.186 0.000 0.83
Poverty Line
Group
Above Poverty Line (Ref)^ Below poverty Line 2.649 0.000 14.146
Regions
Central (Ref)^ 0.000 1 North 0.147 0.000 1.159 East 0.107 0.000 1.113 North East 1.094 0.000 2.987 West 1.033 0.000 2.809 South 0.969 0.000 2.636
Constant 0.204 0.000 1.226
Source: Same as Table 5. Note:@Significance level, ≥ 0.01= 1 percent, 0.02-0.05= 5 percent, 0.06-0.1= 10 percent; ^Reference Category Dependent Variable: Calorie Intake, 1 shows below 2400 Kcal and 0 shows 2400 & above Kcal
JOURNAL OF REGIONAL DEVELOPMENT AND PLANNING 30
PROBABILITY OF CONSUMING RECOMMENDED CALORIES: A
DISAGGREGATED ANALYSIS
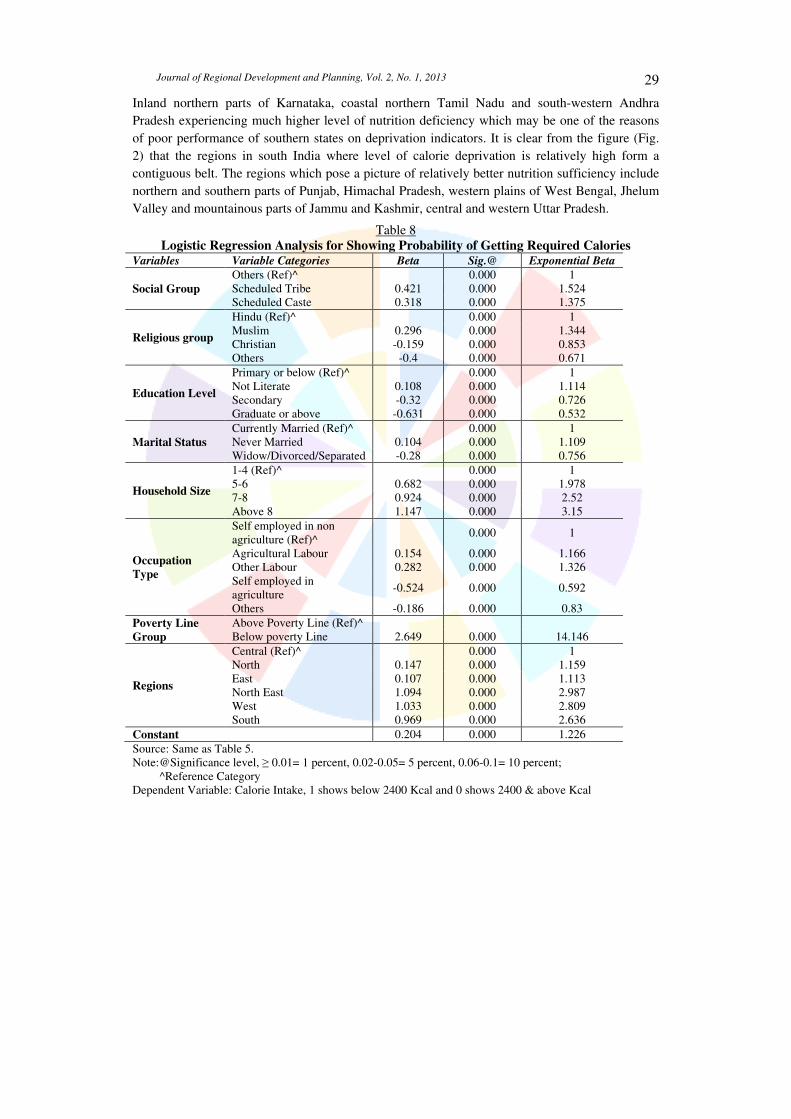
In this section the factors affecting probability of consuming recommended calories have been
probed through a logistic regression (Table 8). Our results clearly show that probability of getting
recommended calories is quite low among all weaker socio-economic groups. For example, as the
family size increases, the likelihood of consuming recommended calories declines which exhibits
poor nutritional conditions of bigger households. The households covering more than 8 members
in the family exhibit higher probability (odd ratio 3.15) of being calorie deprived than the small
families having 1-4 members. Among social groups, ST are worst affected as the probability of
consuming recommended calories is very low compared to other social groups. SC people
however have lower likelihood (1.35 odd ratios) of being calorie deprived than ST (1.52 odd
ratios). Regarding religious group, Muslims suffer badly as they have higher probability of being
calorie deprived than the Hindus whereas Christians (0.853 odd ratio) and other religion people
(0.671 odd ratio) enjoy better calorie intake than the Hindus. Education level plays an important
role to determine calorie intake. It has been analysed that as the level of education increases, the
likelihood of consuming calories from the norm also rises. Highly educated people show more
chances of taking recommended calories than the other lower education group people.
Considering the probability of calorie intake among occupation groups, agricultural labourers and
other labourers have lesser probability of consuming recommended calories than the employed in
non-agriculture. Self employed in agriculture and other occupation groups have more chances of
becoming energy sufficient than those who are not self employed in agriculture. As far as poverty
level is concerned, people below the poverty line have a much higher likelihood of being calorie
deprived (14.146 odd ratios) than the Above Poverty Line category people.
The probability of consuming recommended calories across different geographical regions of rural
India show that compared to central region (covering states of Uttar Pradesh, Madhya Pradesh and
Chhattisgarh), all regions show lower likelihood to consume recommended calories. Among them
north eastern, western and southern region covering states of Gujarat, Maharashtra, Karnataka,
Tamil Nadu, Andhra Pradesh and Kerala exhibit more chances of being calorie deprived from
recommended calories. Northern and eastern states such as Punjab, Himachal Pradesh, Jammu and
Kashmir, Haryana, Rajasthan, Orissa and Bihar show lower probability of calorie deprived than
the other regions. However, these regions are prone to calorie deprivation when compared with
central region. A relatively lower likelihood of being calorie deprived is resulted by higher
consumption of cereals.
CONCLUSION
From this analysis it is found that over a decade (1994-2005) the consumption pattern of Indians
has changed significantly. Consumption of cereals, particularly coarse cereals, has declined
whereas consumption of other food items such as vegetables, fruits, milk and milk products, meat
increased slightly which have a direct bearing on nutrient intake. Due to decline in cereal
consumption and lower increase in consumption of other food items nutrient pattern in rural India
has also changed substantially. Share of cereals particularly coarse cereals to total calories has
declined whereas calories from oil and fat have increased. Since cereals are also a good source of
protein but its decline has also led to lowering down of protein. In rural India on an average per
Journal of Regional Development and Planning, Vol. 2, No. 1, 2013 31
capita per day calorie and protein intake is falling and consumption of oil and fat is increasing.
This, to some extent, is as per the expenditure of dietary transition models. However, given the
relative underperformance of India in the nutrition front, this decline in cereal consumption has
often been viewed as deterioration in the living standard of the poor. The disaggregated analysis of
calorie and nutrition deficiency in rural India carried out in this study clearly points out that
deprivation is higher among marginalized social and economic groups. It is the poor, SC and ST
groups, agricultural labourers who suffer most in terms of calorie deprivation.
There is much gap in official poverty and calorie deprivation level. We have estimated both
poverty and calorie deprivation across social groups. Those having bigger families, less education,
lower MPCE and those belonging to ST, SC, agricultural labour and other labour class, Muslims
are found to have higher levels of poverty as well as calorie deprivation. Thus, in terms of
distribution of deprivation across social and economic groups, there is a consistency between
poverty and calorie deprivation although the levels are quite different in many cases. The interstate
variations, however, does not show much consistency. The southern states particularly Karnataka,
Tamil Nadu, Andhra Pradesh perform poor on more than two deprivation indicators. Gujarat and
Maharashtra, considered as relatively developed states perform worse on both methods of poverty
measurement. On the other hand, Punjab, Himachal Pradesh, Jammu and Kashmir and Haryana
are best performing states in all deprivation measures. From a regional point of view, it is found
that most of the NSS regions having majority of population being calorie deprived than
recommendation fall in the southern, western and central parts of India. All the southern states
except Kerala and including Gujarat and Maharashtra presents maximum decline in calorie and
protein intake from the recommendation whereas Punjab, Himachal Pradesh, Jammu and Kashmir
and Haryana, Uttar Pradesh and Rajasthan show lower decline in calories and in fact increase in
protein intake. These states also show lower level of calorie deprivation and poverty.
The exercise undertaken to show probability of being calorie deprived concludes that never
married, big families, less educated, lower MPCE class, ST, SC, agricultural labour and other
labour class, Muslims, people living below poverty line and southern, north-eastern and western
states are some weaker sections and regions which are comparatively more prone to be poor and
undernourished than their respective reference categories. The debate so far has concentrated on
the observed divergence between poverty estimates and calorie deprivation. Our analysis,
however, points out that it is the relatively marginalized social and economic groups who face
greater calorie deprivation. Thus, there is an urgent need to focus on such high levels of
deprivation among the marginalized groups and regions.
_________________________________
Notes 1. Calorie norm has officially been taken to measure poverty level in India. Per capita per day intake of
2400 kcal for rural and 2100 kcal for urban areas are the norms to estimate poverty. Planning Commission makes adjustment in Consumer Price Index for Agricultural Labourers (CPIAL) and Consumer Price Index for Industrial Workers (CPIIW) to the base year poverty line (1973-74) for estimating rural and urban poverty respectively. Planning Commission’s estimation of poverty using indirect method shows lower level of poverty whereas directly using calorie norm to measure poverty gives a much higher level of deprivation.
JOURNAL OF REGIONAL DEVELOPMENT AND PLANNING 32
2. Food items have been converted into nutritive values using the standard units given in report no. 513(61/1.0/6) Nutritional Intake In India (2004-2005), NSS 61st round National Sample Survey Organisation, Ministry Of Statistics & Programme Implementation Government of India.
3. For further details on measurement of official poverty line in India and changes in it, see Utsa Patnaik, 2007.
4. Standard Calories are given in the Report of the Export Group on Estimation of Proportion and Number of Poor. Perspective Planning Division. Planning Commission, 1993 - 2400 kcal per capita for rural area and 2100 kcal for urban area and standard protein intake is recommended in report on ‘Nutritional Status of Rural Population’ by National Institute of Nutrition (1996) Indian Council of Medical Research, Nutritional Status of rural population, Report of the NNMB surveys, National Nutritional Monitoring Bureau, Hyderabad.
5. Official poverty has been calculated using the report of ‘Poverty Estimates For 2004-05’ Government of India Press Information Bureau [Online at] planningcommission.nic.in/news/prmar07.pdf , Accessed on 12/03/2010 at Jawaharlal Nehru University.
6. The correlation between Below poverty line (BPL) and Below 2400 kcal is 0.472 (significant at 0.05 level) which is low as compared to correlation between BPL and Children underweight below 3 (0.733, significant at 0.01 level) and between BPL and Body Mass Index of Women (0.622, significant at 0.01 level).
References Bansil, P.C. (2003) – “Demand For Food Grains By 2020 Ad”, in S. Mahendra Dev et al. (eds.)
Towards A Food Secure India: Issues And Policies, Institute For Human Development, New Delhi.
Deaton, A. & Dreze, Jean (2009) – “Food and Nutrition in India: Facts and Interpretations”, Economic & Political Weekly, Vol. 44, No. 7, pp. 42-65.
Deaton, A. & Dreze, Jean (2010) – “Nutrition, Poverty and Calorie Fundamentalism: Response to Utsa”, Economic & Political Weekly, Vol. 45, No. 14, pp. 78-80.
Dev, S. M. (2005) – “Calorie Norms and Poverty”, Economic & Political Weekly, Vol. 40, No. 8, pp. 789-792.
Dubey, A. & Thorat, S. K. (2012) – “Has growth been socially inclusive during 1993/94-2009/10?” Economic & Political Weekly, Vol. 47, No. 10, pp. 43-54.
International Institute for Population Studies (2005-06) – National Family Health Survey 2005-06,
Fact Sheet, International Institute for Population Studies, Mumbai. Jones, R. Palmer & Sen, K. (2001) – “On India’s Poverty Puzzles and Statistics of Poverty”,
Economic & Political Weekly, Vol. 36, No. 3, pp. 211-217. Kumar, P., Mruthyunjaya & Dev, Madan M. (2007) – “Long Term Changes in Indian Food Basket
and Nutrition”, Economic & Political Weekly, Vol. 42, No. 35, pp. 3567-3572. Martorell, Reynaldo & Ho, Teresa J. (1984) – “Malnutrition, Morbidity, and Mortality”,
Population and Development Review, Vol. 10, pp. 49-68. Mehta, Jaya & Venkatraman, S. (2000) – “Poverty Statistics, Bermicide’s Feast”, Economic &
Political Weekly, Vol. 35, No. 27, pp. 2377-2382. Mehta, Jaya (1982) – “Nutritional Norms and Measurement of Malnourishment and Poverty”,
Economic & Political Weekly, Vol. 17, No. 33, pp. 1332-1340. Ministry of Home Affairs (2010) – Sample Registration System, Report No. 1 of 2012, Statistical
Report 2010, New Delhi. Nasurudeen, P., Kuruvila, A., Sendhil, R. & Chandresekar, V. (2006) – “The Dynamics and
Inequality of Nutrient Consumption in India”, Indian Journal of Agriculture Economics, Vol. 61, No. 3, pp. 362-373.
Patnaik, Utsa (2004) – “Republic of Hunger”, Social Scientist, Vol. 32, No. 9/10, pp. 9-35. Patnaik, Utsa (2007) – “Neoliberalism and Rural Poverty in India”, Economic & Political Weekly,
Vol. 42, No. 30, pp. 3132-3150.
Journal of Regional Development and Planning, Vol. 2, No. 1, 2013 33
Patnaik, Utsa (2010) – “A Critical Look at Some Propositions on Consumption and Poverty”, Economic & Political Weekly, Vol. 45, No. 6, pp. 74-80.
Radhakrishna, R. & Reddy V. (2004) – ‘Food Security and Nutrition: Vision 2020’, [planningcommission.nic.in/reports/.../bkpap2020/16_Bg2020.pdf; accessed on 9 August 2010].
Radhakrishna, R. (2005) – “Food And Nutrition Security of the Poor, Emerging Perspectives and Policy Issues”, Economic & Political Weekly, Vol. 40, No. 18, pp. 1817-1821.
Radhakrishna, R., Rao, K. Hanumantha, Ravi, C. & Reddy, B. Sambi (2004) – “Chronic Poverty and Malnutrition in 1990s”, Economic &Political Weekly, Vol. 39, No. 28, pp. 3121-3130.
Rao, H. C. H (2000) – “Declining Demand for Food-Grains in Rural India: Causes and Implications”, Economic & Political Weekly, Vol. 35, No. 4, pp. 201-206.
Ray, Ranjan (2005-10) – ‘Analysis of Changes in Food Consumption and their Implications for Food Security and Undernourishment: The Indian Experience in the 1990s’, Discussion
Paper, University of Tasmania. Reddy, D. N. & Mishra, Srijit (2010) – Agrarian Crisis in India, Delhi: Oxford University Press. Sen, Pronab (2005) – “Of Calories and Things Reflections on Nutritional Norms, Poverty Lines
and Consumption behaviour in India”, Economic & Political Weekly, Vol. 40, No. 43, pp. 4611-4618.
Shariff, Abusaleh & Mallick, A. C. (1999) – “Dynamics of Food Intake and Nutrition by Expenditure Class in India”, Economic & Political Weekly, Vol. 34, No. 27, pp. 1790-1800.
Verma, Med Ram, Datta, K. K., Mandal, Subhasis & Tripathi, A. K. (2008) – “Diversification of Food Production and Consumption Patterns in India”, Journal of Agricultural & Food
Information, Vol. 8, No. 3, pp. 87-100. Viswanathan, Brinda (2001) – “Structural Breaks in Consumption Patterns: India 1952-1991”,
Applied Economics, Vol. 33, No. 9, pp. 1187-1200. World Food Programme (2009) – ‘India Tops World Hunger Chart’,
[http://www.wfp.org/Countries/India/News/Hunger-In-The-News?Page=4; accessed on 23 July 2011]
World Health Organisation (2003) – ‘Diet, Nutrition and the Prevention of Chronic Diseases’, Technical Report Series 916, Geneva.


