Embed Size (px)
Citation preview
Goodness-of-fit-test for Exponential PowerDistribution.∗
A. A. Olosunde1 and A. M. Adegoke2
1Department of Mathematics, Obafemi Awolowo University, Ile-Ife,Nigeria, <[email protected]>
2Department of Physics, Obafemi Awolowo University, Ile-Ife, Nigeria,<[email protected]>
Abstract
Given a set of data, one of the statistical issues is to see how well the datafit into postulated model. This technique necessitates the corresponding table ofthe probability distribution for the proposed model. In this paper, we present thetable for exponential power distributions with different values of shape factorsp. The table presented makes it workable to examine whether exponential powerdistribution is an appropriate model for any data set. The conventional testingmethod are discussed, one is Pearson’s χ2 test and the other one is kolmogorov-Smirnov test. An example in poultry feeds data and a simulation example areincluded, comparison with the fitting of the normal distribution is also examinedto illustrate the use of the table.keywords:Shape parameter, Short tails, Cumulative distribution function, kolmogorov-Smirnov test, Pearson’s χ2 test, Poultry feeds data data.AMS Subject Classification: Primary 62F03; Secondary 62P10.
1 IntroductionFor p > 0, consider the random variable Z with density function
f(x) =1
2σpp1/p(1 + 1p )exp
{−|x− µ|
p
pσpp
}(1)
where −∞ < x < ∞, −∞ < µ < ∞, p > 0 and σp > 0. (1) is called exponentialpower distribution with shape parameter p which regulates the tail region. Severalproperties of this distribution have been studied by many authors both as univariateand its multivariate extension. Among them are Olosunde (2013), Agro (1992, 1999),
∗Mathematics Subject Classifications: 60E05, 62F05.
1

Mineo and Ruggieri (2005) and others. Many authors have also found this distributionuseful as substitute to normal distribution in applications; Lindsey (1999) have ap-plied it in repeated measurements, also Olosunde (2013) in fitting poultry feeds data,just to mention few. The defined random variable family exponential power distribu-tion retains many statistical properties of the normal and Laplace distribution, thatis, what differentiate exponential power (EP (p)) from the normal and Laplace is theshape factor, which makes the tail becomes thicker as p → ∞. The distribution canalso be regarded as generalized normal(or Laplace) because at p = 2(or1), we have thenormal(or Laplace) distribution with parameters µ and σ.The moment can be obtained from the maximization of the log-likelihood function(Mineo and Ruggieri, 2005)
`(x;µ, σp, p) = logL(x;µ, σp, p) = −nlog[2p1/pσpΓ(1 +
1
p)−
∑ni=1 |xi − µ|
p
pσpp
](2)
the derivative of (1.2) with respect to µ,σ and p and equating to zero gives the followingequations:
d`(x)
dµ=
1
σpp
n∑i=1
|xi − µ|p−1 sign(xi − µ) = 0 (3)
d`(x)
dσp= − n
σp+
1
σp+1p
∑|xi − µ|p = 0 (4)
d`(x)
dp= − n
p2[ln p+ ψ(1 + 1/p)− 1] +
∑ni=1 |xi − µ|
p
pσpp
[1
p+ lnσp − ln |xi − µ|
]= 0
(5)where ψ is the di−gamma function. The equation 1.3 and 1.5 can only be resolved
using numerical approach, while the explicit solution to 1.4 is:
σ̂p =
(∑ni=1 |xi − µ|
p
n
)1/p
(6)
Although statistical properties about exponential power and its generalization havebeen discussed extensively in the literature, but given a data set X1, ..., Xn, there is aproblem about how well the underlying distribution can be represented by a exponentialpower distribution. The Pearson χ2 and Kolmogorov-Smirnov’s test and so many othersare important tools commonly used in statistical practice. However, to carry this outthese test effectively, we require the associated probability distribution table. Justlike the normal distribution, the cumulative distribution table of exponential powerrandom variable, to the best of our knowledge are not available in any literature. Thisdeficiency may be one of the hindrances to wide use of exponential power distributionwhen compare to normal distribution as exponential power distribution generalizedthe normal distribution and it cdf is not in close form. In what follows, we establishdistribution table for the random variable having (1) with different values of p the shapeparameter. In section 2 we describe how the table was developed. Section 3 discussthe two procedures for the goodness-of-fit test (Pearson and Kolmogorov-Smirnov).
2
Section 4 presents a simulation data set of exponential power distribution, this is alsoincluded to illustrate the use of the table. Importantly, the normal distribution hasbeen well known to be the limiting distribution for many density functions. In thispaper, we examined, to what limit of p can normal approximate this sample withoutfalling into type I error (i.e. a random variable x having normal distribution whenindeed it has exponential power distribution with estimated parameter p) and finallyan example of potential application to poultry feeds data from Olosunde, (2013) is alsoexamined.
2 Exponential Power Distribution TableThe cumulative distribution function (cdf) for a standardized random variable having(1) with real p can be expressed has
P (X ≤ x) =
∫ t
−∞
1
2p1/p(1 + 1p )exp
{−|x|
p
p
}(7)
Thus, for each specified p, we can calculate the corresponding probability for each valueof t. In the table we present the corresponding probabilities for t ranging from 0.00 untilP (X ≤ x) ≈ 1 to 3 decimal places, with each increase in length by 0.01. We employedSimpson rule in Numerical Computation in conjunction with R program developed byIhaka and Gentleman (1996). We prefer Simpson’s method compare to other methodsbecause its guarantees the accuracy level of the table. The table is arranged as follows,if we wish to compute, say x = 0.15, the table in the appendix can used in the thisway:P (Y ≤ 0.15) = 0.5910, when p = 0.5P (Y ≤ 0.15) = 0.5695, when p = 1.0.P (Y ≤ 0.15) = 0.5583, when p = 3.6from the table we can see that the probability distribution of exponential power dis-tribution depends on the shape parameter, p, and as p increases the cdf changed. Forexample the, P (Y ≤ 3.0) = 0.9998 remain the same at the accuracy of 10−4 for pranging from 2.40 to 10.00. Therefore, the tables were truncated at some points, whenthe resulting values of P (X ≤ x) repeat the previous values for increase in shape pa-rameter p. To check the accuracy of the table in the appendix, from our programwe allowed p = 1 which of course gave the values for the cdf of Laplace distributionotherwise known as double exponential. Also, when p = 2 we have the values for thecdf of a random variable having a standard normal probability distribution function(not reproduce here, but available in many Statistical texts).
3 Goodness-of-Fit Tests for The Exponential PowerDistribution
In this section, we present two procedures for goodness-of-fit test for the exponentialpower distribution. One is Pearson′s χ2 test and the other one is Kolmogorov −
3

Smirnov test. These are two well known tests in the literature to examine how wella set of data fits into a postulated model provided that the probability distribution ofthe postulated random variable is available.
3.1 χ2 procedure for exponential power distributionGiven a set of data X1, ..., Xn. To carry out Pearson’s χ2 test to ascertain if the datais well fit into exponential power distribution EP (p0), we proceed as follows:
• Partition the sample space into K disjoint intervals;
• Find the probability pk that an outcome falls in the Kth interval under theassumption that the underlying population has an EP (p0) distribution. pk canbe found using the table in the appendix, then Ek = npk is the expected numberof outcomes that falls in the Kth interval in n repetitions of the experiment;
• The χ2 test statistic with degree of freedoms K − 1 is then defined as
χ2 =
K∑i=1
(Ni − Ei)2
Ei(8)
where Ni is the number of outcomes that fall in the ith interval and Ei is theexpected number in the ith interval. The selection of K follows the general rulein the application of Pearson’s χ2 test.If the χ2 value calculated from (8) is too large compared with the endpoint ofχ2k−1 at certain significance level, say 0.05 (commonly used) but on some occassion
0.01, it implies that the differences between the expected and the observed valuesare too large, then the assumption of exponential power with p0 must be rejected.Other value of p or even other models may need to be considered. If the calculatedχ2 value is small, it implies that the data set fits well into the model. Thereforethe model can be accepted at the significance level specified.From this test procedure, conspicuously it is convenient to have the tables forpractical purpose. For example, we can always compare the value of χ2 to seewhether normal distribution or exponential power is a better fit for the data.
3.2 Kolmogorov test procedure on the exponential power dis-tribution
If we have a random sample X1, ..., Xn from a population with distribution functionF (x), we desire to see if a postulated exponential power distribution (with specifiedp0) can be used to fit the underlying population of the data. The null hypothesis canbe stated as followsH0 : F (x) = G0(x) for all xagainst the alternativeH1 : F (x) 6= G0(x) for at least one x.
4

where G0(x) denotes the cdf of EP (p0)
D(Fn(x), Gp(x)) =supz |Fn(x)−Gp(x)| (9)
where
Fn(x) =
0, x < X(1)
in , X(i) ≤ x < X(i+1), k = 1, ..., n− 1;
1, x ≥ X(n).
whereX(1), ..., X(n) in the expression of Fn(x) are the ordered statistics ofX1, ..., Xn.Gp(x) at each sample points of Xi can be found from the exponential power distribu-tion table. In this case, the Kolmogorov-Smirnov test statistic D(.,.) is the maximumdistance between empirical distribution function and postulated distribution functionat the sample points. At significant level of α, the test endpoint dα for test statisticD can be found from Miller, (1956). The rule is that if the calculated D is larger thandα the postulated exponential power distribution function is too far away from theobserved distribution function. thus H0 is rejected at α level of significance, otherwise,H0 is accepted at the same significance level. To carry out this test, it is critical tofind the Fn(x)’s for the postulated exponential power distribution. The table providein this paper makes it possible for the implementation of this test.
4 ApplicationsExample 1:(Approximation of the Exponential Power Distribution by The NormalDistribution)Normal distribution has been well known to be the limiting distribution for so manydistribution in the literature. In this section with explore to what value of the param-eter p will normal give an acceptable approximation to data having exponential powerdistribution with parameter pi. This will also examine the closeness between exponen-tial power and normal distributions, using the Kolmogorov-Smirnov test of normalitydistance. Let X ∼ N(0, 1) and F (x) be the cdf, also let Y ∼ EP (p) and Gp(y) be thecdf. The Kolmogorov distance between F (x) and Gp(y) is defined as
D(F,Gp) =supz |F −Gp| (10)
The values of D(F,Gp) can be obtained from the Tables in the appendix. The valuesof D(F,Gp) from some selected p = 1.6− 4.4. These are shown in the table below
Table 4.1 Kolmogorov distance between F and Gpp 1.6 1.8 2.2 2.4 2.6 2.8 3.0D(F,Gp) 0.0146 0.0072 0.0065 0.0180 0.0197 0.0226 0.0268
5

Table 4.1(contd)p 3.2 3.4 3.6 3.8 4.0 4.2 4.4D(F,Gp) 0.0311 0.0348 0.0384 0.0415 0.0447 0.0478 0.0504
we observed from Table 4.1, that as p increases D(F,Gp) also increases, this impliesthat approximation by normal distribution becomes poorer with large estimated p fromexperimental samples. large D(F,Gp) is noticeable in all p′s when t = 1.3. Therefore,normal assumption in such case of large p value may lead to error in conclusion. Itshould be noted that the significance of D(F,Gp) also depends on the sample size.Example 2:(Simulation from exponential power distribution)Table 4.2. Pearson’s χ2 TestIntervals n pi EP (4.4) normal(−∞,-1.75] 3 0.0033 3.3 40.1(-1.75,-1.25] 55 0.0540 54.0 65.5(-1.25,-0.75] 149 0.1524 152.4 121.0(-0.75,-0.25] 193 0.1924 192.4 174.7(-0.25,0.25] 197 0.1958 195.8 197.4(0.25,0.75] 196 0.1924 192.4 174.7(0.75,1.25] 151 0.1524 152.4 121.0(1.25,1.75] 52 0.0540 54.0 65.5(1.75,∞] 4 0.0033 3.3 40.1
The Table 4.2 shows a simulation of 1000 samples from exponential power distribu-tion with p = 4.4, where n is the observed frequency in the ith interval, pi((a, b]) =P (EPD(4.4))) − P (EPD(4.4) ≤ a). and Npi and normal are the expected frequencyin the ith interval for EPD(4.4) and normal distribution respectively. We obtainedχ2 value of 0.4207 for EP (4.20) with degree of freedom 9, thus EP (4.20) is acceptedas expected. However, the goodness-of-fit for N(0, 1) gives an observed χ2 value of832.559, which results in the rejection of N(0, 1) model for the same data set. SeeTable 4.2 for detail report.
5 The Kullback-Leibler InformationThe kullback-Leibler (K-L)(1959) information function can be used to discriminatebetween two distributions Fθ(x) and F(x) of = Fθ(x); θ ∈ Θ. It is defined as
I(θ, φ) = Eθ
{lnf(X; θ)
f(X;φ)
}; θ, φ ∈ Θ (11)
The family of is assumed to be regular.Proposition: I(θ, φ) ≥ 0 if and only if, f(X; θ) = f(X;φ) with probability one.Proof : recall that lnx is the concave function of x and by Jensen’s inequality ln(E(Y )) ≥E(lnY ) for every non-negative random variable Y , having a finite expectation. Ac-cordingly, −I(θ, φ) = Eθ
{− ln f(X;θ)
f(X;φ)
}=∫
ln f(X;φ)f(X;θ) f(x; θ)dx≤ ln
∫f(x; θ)dx = 0
6

if both sides of the above equation is multiply by −1 we have that I(θ;φ) ≥ 0. Also, ifPθ [f(X; θ) = f(x;φ)] = 1 then I(θ;φ) = 0. Q.E.D.It is worth noting that if X1, ..., Xn are identical and independent random variablesthen the KL information function say I(θ;φ) is additive that isIn(θ;φ) = Eθ
{ln f(X;θ)
f(X;φ)
}= Eθ
{∑ni=1ln
f(Xi;θ)f(Xi;φ)
}= nI(θ;φ).
Example 1: let F be the class of all normal distribution{N(µ, σ2), µ ∈, σ > 0
}. let
θ1 = (µ1, σ1) and θ2 = (µ2, σ2)
The likelihood ratio is
f(x; θ1)
f(x; θ2)=σ1σ2exp
{−1
2
[(x− µ1
σ1
)2
−(x− µ2
σ2
)2]}
(12)
Example 3:(Applications to Poultry feeds data) The data is obtained from Olosunde(2013), where cholesterol level xi of 48 eggs of chicken fed with organic copper-saltare measured in mg/egg, where 5.20 is the estimated p value for exponential powerdistribution and 131.457 and 37.232 are the population mean and standard deviationrespectively. Also for Normal we have 59.10 and 1.822 as the estimated mean andstandard deviation respectively. The ordered data set xi are given in Table 4.3, ziand ti is the standardized values for xi for EP (5.20) and normal respectively. Zi =P (EP (5.20 ≤ zi))and Ti = P (N(0, 1) ≤ ti) is the normal counterpart. We define DEP
as the max(|Zi − i/n|, |Zi − (i− 1)/n|) for EP (5.20) and DN as max(|Ti − i/n|, |Ti −(i − 1)/n|) for normal distribution. From Table 4.3, using Kolmogorov-Smirnov test,we find the corresponding |D| = 0.061833 for EP (5.20) and |D| = 0.77742 for normaldistribution. One can easily see that the fit of exponential power cdf is uniformlybetter than that of the standard normal cdf in this example. All these have been madepossible using the Table in the appendix. Details are provided in Table 4.3.
Table 4.3 Kolomogorov Goodness-of-Fit Test
7

xi zi ti Zi |DEP | Ti |DN |60.73 -1.489196365 -1.899629351 0.0115 0.0115 0.5294 0.529466.03 -1.374792238 -1.757278685 0.0254 0.01627 0.5392 0.51836771.33 -1.260388111 -1.614928019 0.0452 0.0173 0.5537 0.51203376.63 -1.145983983 -1.472577353 0.0713 0.01203 0.5708 0.508381.86 -1.033090854 -1.33210679 0.1065 0.023167 0.5918 0.50846781.93 -1.031579856 -1.330226687 0.1065 0.0185 0.5918 0.48763381.93 -1.031579856 -1.330226687 0.1065 0.03933 0.5918 0.466887.16 -0.918686727 -1.189756124 0.1429 0.02377 0.617 0.47116792.46 -0.8042826 -1.047405458 0.1829 0.016233 0.6469 0.48023392.52 -0.802987459 -1.045793941 0.1864 0.02193 0.96492 0.7774297.76 -0.689878473 -0.905054792 0.2284 0.020067 0.6814 0.47306797.82 -0.688583332 -0.903443275 0.2284 0.0216 0.6841 0.454933103.06 -0.575474345 -0.762704125 0.2707 0.0207 0.7236 0.4736103.11 -0.574395061 -0.761361195 0.2747 0.01697 0.7236 0.452767108.36 -0.461070218 -0.620353459 0.3182 0.026533 0.7676 0.475933108.41 -0.459990934 -0.619010529 0.3182 0.01513 0.7709 0.4584113.66 -0.346666091 -0.478002793 0.3613 0.027967 0.8156 0.482267113.7 -0.345802664 -0.476928449 0.3613 0.0137 0.8156 0.461433118.96 -0.232261964 -0.335652127 0.4088 0.0338 0.8669 0.4919119 -0.231398536 -0.334577783 0.4088 0.012967 0.8707 0.474867124.26 -0.117857837 -0.193301461 0.4563 0.039633 0.9247 0.508033124.3 -0.116994409 -0.192227116 0.4524 0.0149 0.9247 0.4872129.56 -0.003453709 -0.050950795 0.4998 0.041467 0.9801 0.521767129.6 -0.002590282 -0.04987645 0.4996 0.020433 0.9801 0.500933134.86 0.110950418 0.091399871 0.5437 0.0437 0.0359 0.48493134.89 0.111597988 0.09220563 0.5437 0.022867 0.0359 0.50577140.16 0.225354545 0.233750537 0.5912 0.049533 0.091 0.4715140.19 0.226002115 0.234556296 0.5912 0.0287 0.091 0.49233145.46 0.339758672 0.376101203 0.6347 0.051367 0.148 0.45617145.48 0.340190386 0.376638376 0.6347 0.030533 0.148 0.477150.76 0.454162799 0.518451869 0.6778 0.0528 0.1985 0.44733150.78 0.454594513 0.518989042 0.6778 0.031967 0.1985 0.46817156.06 0.568566926 0.660802535 0.7253 0.058633 0.2454 0.4421156.08 0.56899864 0.661339708 0.7253 0.0378 0.2454 0.46293161.36 0.682971054 0.803153202 0.7681 0.059767 0.2881 0.44107161.37 0.68318691 0.803421788 0.7681 0.038933 0.2881 0.4619166.66 0.797375181 0.945503868 0.8136 0.0636 0.3289 0.44193166.67 0.797591038 0.945772454 0.8136 0.042767 0.3289 0.46277171.96 0.911779308 1.087854534 0.8535 0.061833 0.3621 0.4504171.97 0.911995165 1.08812312 0.8535 0.041 0.3621 0.47123177.26 1.026183435 1.2302052 0.8935 0.060167 0.3907 0.46347177.26 1.026183435 1.2302052 0.8935 0.039333 0.3907 0.4843
8

Table 4.3(contd.) Kolomogorov Goodness-of-Fit Testxi zi ti Zi |DEP | Ti |DN |182.56 1.140587562 1.372555866 0.9259 0.0509 0.4147 0.48113182.56 1.140587562 1.372555866 0.9259 0.030067 0.4147 0.50197182.56 1.140587562 1.372555866 0.9259 0.0116 0.4147 0.5228187.86 1.25499169 1.514906532 0.9528 0.0153 0.4345 0.52383187.86 1.25499169 1.514906532 0.9528 0.02637 0.4345 0.54467193.16 1.369395817 1.657257198 0.9746 0.0254 0.4515 0.5485
References
Agro, G.(1992): Maximum Likelihood and Lp−norm Estimators. StatisticaApplicata. 4(2), 171− 182.
Agro, G.(1995): Maximum Likelihood Estimation for the Exponential PowerDistribution. Communications in Statistics (Simulation and Computation),24(2), 523− 536.
Ihaka, R and Gentleman, R.(1996): R: A Language for Data Analysis and Graph-ics. Journal of Computational and Graphical Statistics. V ol.4(3), pp.299− 314.
Lindsey, J.K.(1999). Multivariate Elliptical Contoured Distributions for RepeatedMeasurements. Biometrics 55, 1277− 1280.
Miller, L.H. (1956): Table of Percentage Points of Kolmogorov Statistics. Journalof the American Statistical Association. V ol.51, 111− 121.
Mineo, A.M. and Ruggieri, M. (2005): A Software Tool for the ExponentialPower Distribution: The normalp package. Journal of Statistical Software.V ol.12(4)pp.1− 24.
Olosunde, A.A. (2013): On Exponential Power Distribution And Poultry FeedsData: A Case Study. Journal Iran Statistical Society. V ol.12(2), pp.253− 270.
9

Table 1: Cumulative Distribution Table for Exponential Power at p = 0.5t 0.0 .01 .02 .03 .04 .05 .06 .07 .08 .090. .5000 .5087 .5166 .5239 .5308 .5373 .5436 .5495 .5554 .5609.10 .5663 .5716 .5767 .5816 .5864 .5910 .5956 .6000 .6044 .6086.20 .6127 .6168 .6207 .6246 .6284 .6321 .6358 .6393 .6428 .6463.30 .6497 .6530 .6564 .6594 .6626 .6656 .6687 .6717 .6746 .6775.40 .6804 .6831 .6859 .6886 .6913 .6939 .6965 .6991 .7016 .7041.50 .7065 .7089 .7113 .7137 .7160 .7183 .7205 .7227 .7249 .7273.60 .7293 .7315 .7334 .7355 .7375 .7395 .7415 .7435 .7454 .7473.70 .7492 .7511 .7529 .7547 .7565 .7583 .7601 .7618 .7635 .7652.80 .7669 .7686 .7702 .7719 .7735 .7750 .7766 .7782 .7797 .7812.90 .7827 .7841 .7857 .7876 .7886 .7901 .7915 .7929 .7941 .79551. .7970 .7982 .7997 .8010 .8023 .8036 .8049 .8061 .8074 .80871.1 .8099 .8111 .8115 .8135 .8147 .8159 .8170 .8182 .8193 .82041.2 .8216 .8227 .8238 .8249 .8260 .8271 .8281 .8292 .8302 .83131.3 .8323 .8334 .8343 .8353 .8363 .8373 .8383 .8392 .8402 .84111.4 .8421 .8430 .8439 .8449 .8458 .8467 .8476 .8485 .8493 .85021.5 .8511 .8519 .8528 .8536 .8545 .8553 .8561 .8570 .8578 .85861.6 .8594 .8602 .8610 .8617 .8625 .8633 .8641 .8648 .8657 .86631.7 .8670 .8678 .8685 .8692 .8700 .8706 .8714 .8721 .8728 .87351.8 .8741 .8748 .8755 .8762 .8768 .8775 .8781 .8788 .8794 .88011.9 .8809 .8814 .8819 .8826 .8832 .8839 .8844 .8850 .8857 .88632. .8869 .8875 .8880 .8886 .8892 .8898 .8902 .8909 .8915 .89202.1 .8926 .8931 .8937 .8942 .8948 .8953 .8958 .8963 .8973 .89742.2 .8979 .8984 .8993 .8994 .8999 .9004 .9009 .9014 .9019 .90212.3 .9029 .9034 .9038 .9043 .9048 .9052 .9057 .9062 .9066 .90712.4 .9075 .9080 .9084 .9089 .9093 .9097 .9102 .9106 .9111 .91152.5 .9119 .9123 .9127 .9132 .9135 .9140 .9144 .9149 .9152 .91562.6 .9160 .9163 .9168 .9172 .9176 .9180 .9183 .9188 .9191 .91952.7 .9199 .9202 .9206 .9210 .9214 .9217 .9221 .9224 .9228 .92312.8 .9235 .9238 .9242 .9245 .9249 .9252 .9256 .9259 .9262 .92602.9 .9269 .9272 .9276 .9279 .9282 .9285 .9289 .9292 .9292 .92973. .9301 .9303 .9304 .9311 .9314 .9317 .9320 .9323 .9326 .93293.1 .9332 .9335 .9338 .9340 .9343 .9346 .9349 .9352 .9355 .93583.2 .9360 .9363 .9366 .9369 .9351 .9374 .9377 .9380 .9382 .93843.3 .9388 .9390 .9393 .9396 .9398 .9401 .9403 .9405 .9407 .94113.4 .9413 .9416 .9418 .9421 .9423 .9426 .9428 .9430 .9433 .94353.5 .9438 .9440 .9442 .9445 .9447 .9449 .9452 .9454 .9457 .94583.6 .9461 .9463 .9465 .9467 .9470 .9472 .9473 .9476 .9479 .94813.7 .9483 .9485 .9487 .9488 .9491 .9494 .9495 .9497 .9499 .95013.8 .9504 .9506 .9507 .9510 .9511 .9514 .9516 .9517 .9519 .95213.9 .9523 .9527 .9528 .9529 .9531 .9533 .9535 .9537 .9538 .95404. .9542 .9544 .9546 .9541 .9549 .9551 .9553 .9555 .9557 .95594.1 .9560 .9562 .9563 .9566 .9567 .9569 .9570 .9572 .9574 .95754.2 .9577 .9579 .9580 .9582 .9583 .9585 .9587 .9588 .9590 .95924.3 .9593 .9595 .9596 .9598 .9599 .9601 .9606 .9603 .9606 .96074.4 .9609 .9610 .9612 .9613 .9615 .9616 .9617 .9619 .9620 .96224.5 .9623 .9625 .9626 .9627 .9629 .9630 .9632 .9633 .9635 .96364.6 .9637 .9640 .9640 .9641 .9643 .9644 .9645 .9647 .9648 .96494.7 .9651 .9652 .9654 .9655 .9656 .9657 .9658 .9660 .9661 .96624.8 .9664 .9664 .9666 .9667 .9668 .9670 .9671 .9672 .9673 .96754.9 .9676 .9677 .9678 .9679 .9681 .9681 .9683 .9684 .9685 .96865. .9687 .9689 .9690 .9690 .9692 .9693 .9695 .9695 .9696 .96985.1 .9699 .9700 .9698 .9702 .9703 .9704 .9705 .9706 .9708 .9708
10

t 0.0 .01 .02 .03 .04 .05 .06 .07 .08 .095.2 .9709 .9709 .9711 .9710 .9713 .9714 .9716 .9716 .9718 .97195.3 .9719 .9721 .9721 .9721 .9723 .9724 .9725 .9726 .9727 .97285.4 .9729 .9730 .9731 .9732 .9743 .9734 .9735 .9736 .9737 .97385.5 .9739 .9740 .9741 .9741 .9743 .9743 .9744 .9746 .9746 .97475.6 .9748 .9749 .9749 .9750 .9751 .9740 .9753 .9754 .9755 .97555.7 .9756 .9757 .9758 .9759 .9760 .9760 .9761 .9762 .9763 .97645.8 .9765 .9765 .9766 .9767 .9768 .9767 .9769 .9770 .9770 .97725.9 .9773 .9773 .9774 .9774 .9776 .9776 .9777 .9778 .9779 .97786. .9780 .9780 .9782 .9782 .9783 .9783 .9785 .9785 .9786 .97876.1 .9787 .9788 .9789 .9790 .9792 .9791 .9792 .9792 .9793 .97946.2 .9794 .9795 .9792 .9797 .9797 .9798 .9799 .9799 .9800 .98006.3 .9801 .9802 .9802 .9803 .9804 .9804 .9805 .9806 .9806 .98076.4 .9808 .9809 .9809 .9810 .9810 .9811 .9812 .9812 .9813 .98136.5 .9814 .9815 .9815 .9816 .9816 .9817 .9817 .9777 .9818 .98186.6 .9820 .9820 .9821 .9822 .9822 .9823 .9823 .9824 .9825 .98256.7 .9826 .9826 .9827 .9827 .9828 .9830 .9829 .9830 .9814 .98306.8 .9831 .9832 .9832 .9833 .9833 .9834 .9835 .9835 .9836 .98306.9 .9837 .9837 .9837 .9838 .9839 .9839 .9831 .9840 .9838 .98407. .9842 .9841 .9839 .9820 .9835 .9848 .9844 .9845 .9846 .98467.1 .9847 .9847 .9848 .9848 .9849 .9849 .9849 .9850 .9850 .98517.2 .9851 .9852 .9852 .9853 .9853 .9854 .9854 .9855 .9855 .98557.3 .9856 .9856 .9857 .9857 .9858 .9858 .9859 .9859 .9859 .98607.4 .9860 .9861 .9861 .9862 .9862 .9862 .9863 .9863 .9863 .98647.5 .9865 .9865 .9865 .9866 .9866 .9866 .9867 .9868 .9868 .98687.6 .9869 .9869 .9869 .9868 .9870 .9871 .9871 .9872 .9872 .98727.7 .9873 .9873 .9873 .9874 .9873 .9875 .9871 .9875 .9876 .98737.8 .9876 .9877 .9877 .9878 .9878 .9878 .9879 .9878 .9879 .98807.9 .9880 .9881 .9881 .9881 .9882 .9882 .9883 .9883 .9883 .98848. .9884 .9884 .9884 .9885 .9885 .9885 .9886 .9884 .9887 .98878.1 .9887 .9887 .9888 .9887 .9888 .9888 .9889 .9889 .9888 .98928.2 .9890 .9891 .9891 .9891 .9892 .9892 .9892 .9892 .9893 .98938.3 .9895 .9894 .9894 .9895 .9895 .9895 .9896 .9896 .9896 .98968.4 .9897 .9897 .9897 .9898 .9898 .9898 .9899 .9900 .9899 .99008.5 .9900 .9899 .9900 .9901 .9901 .9901 .9901 .9902 .9902 .99028.6 .9903 .9903 .9903 .9903 .9904 .9904 .9904 .9905 .9905 .99058.7 .9905 .9906 .9906 .9906 .9906 .9907 .9907 .9907 .9908 .99088.8 .9908 .9908 .9909 .9909 .9910 .9909 .9910 .9910 .9912 .99108.9 .9911 .9911 .9911 .9911 .9912 .9909 .9912 .9912 .9913 .99139. .9913 .9914 .9914 .9914 .9914 .9914 .9915 .9915 .9915 .99159.1 .9916 .9916 .9916 .9916 .9917 .9917 .9917 .9911 .9918 .99189.2 .9918 .9918 .9918 .9919 .9919 .9920 .9919 .9921 .9920 .99209.3 .9920 .9920 .9921 .9921 .9922 .9921 .9922 .9922 .9922 .99229.4 .9922 .9924 .9923 .9923 .9923 .9924 .9924 .9924 .9924 .99249.5 .9925 .9925 .9925 .9925 .9925 .9926 .9926 .9926 .9926 .99269.6 .9927 .9927 .9927 .9922 .9908 .9931 .9928 .9928 .9928 .99289.7 .9929 .9929 .9929 .9929 .9930 .9930 .9930 .9930 .9930 .99309.8 .9930 .9931 .9931 .9931 .9931 .9931 .9932 .9932 .9932 .99329.9 .9932 .9933 .9933 .9933 .9933 .9934 .9934 .9934 .9934 .993411

Table 2: Cumulative Distribution Table for Exponential Power at p = 1.0t 0.0 .01 .02 .03 .04 .05 .06 .07 .08 .090. .5000 .5050 .5100 .5150 .5195 .5245 .5290 .5340 .5385 .5430.10 .5475 .5520 .5565 .5610 .5655 .5695 .5740 .5780 .5825 .5865.20 .5905 .5945 .5985 .6025 .6065 .6105 .6145 .6185 .6220 .6260.30 .6295 .6335 .6370 .6405 .6440 .6475 .6510 .6545 .6580 .6615.40 .6650 .6680 .6715 .6745 .6780 .6810 .6845 .6875 .6905 .6935.50 .6965 .7000 .7025 .7055 .7085 .7115 .7145 .7170 .7200 .7230.60 .7255 .7285 .7310 .7335 .7365 .7390 .7415 .7440 .7465 .7490.70 .7515 .7540 .7565 .7590 .7615 .7640 .7660 .7685 .7710 .7730.80 .7755 .7775 .7800 .7820 .7840 .7860 .7885 .7905 .7925 .7945.90 .7965 .7985 .8005 .8025 .8045 .8065 .8085 .8105 .8125 .81401. .8160 .8180 .8195 .8215 .8235 .8250 .8270 .8285 .8300 .83201.1 .8335 .8350 .8370 .8385 .8400 .8415 .8435 .8450 .8465 .84801.2 .8495 .8510 .8525 .8540 .8555 .8565 .8580 .8595 .8610 .86251.3 .8635 .8650 .8665 .8680 .8690 .8705 .8715 .8730 .8740 .87551.4 .8765 .8780 .8790 .8805 .8815 .8825 .8840 .8850 .8860 .88751.5 .8885 .8895 .8905 .8915 .8930 .8940 .8950 .8960 .8970 .89801.6 .8990 .9000 .9010 .9020 .9030 .9040 .9050 .9060 .9070 .90751.7 .9085 .9095 .9105 .9115 .9120 .9130 .9140 .9150 .9155 .91651.8 .9175 .9180 .9190 .9200 .9205 .9215 .9220 .9230 .9235 .92451.9 .9250 .9260 .9265 .9275 .9280 .9290 .9295 .9305 .9310 .93152. .9325 .9330 .9335 .9345 .9350 .9355 .9365 .9370 .9375 .93802.1 .9385 .9395 .9400 .9405 .9410 .9420 .9425 .9430 .9435 .94402.2 .9445 .9450 .9455 .9460 .9470 .9475 .9480 .9485 .9490 .94952.3 .9500 .9505 .9510 .9515 .9520 .9525 .9530 .9535 .9535 .95402.4 .9545 .9550 .9555 .9560 .9565 .9570 .9575 .9575 .9580 .95852.5 .9590 .9595 .9595 .9600 .9605 .9610 .9615 .9615 .9620 .96252.6 .9630 .9630 .9635 .9640 .9645 .9645 .9650 .9655 .9655 .96602.7 .9665 .9665 .9670 .9675 .9675 .9680 .9685 .9685 .9690 .96952.8 .9695 .9700 .9700 .9705 .9705 .9710 .9715 .9715 .9720 .97202.9 .9725 .9730 .9730 .9735 .9735 .9740 .9740 .9745 .9745 .97503. .9750 .9755 .9755 .9760 .9760 .9765 .9770 .9770 .9770 .97703.1 .9775 .9775 .9780 .9785 .9785 .9785 .9790 .9790 .9790 .97953.2 .9795 .9800 .9800 .9800 .9805 .9805 .9810 .9810 .9810 .98153.3 .9815 .9815 .9820 .9820 .9825 .9825 .9825 .9830 .9830 .98303.4 .9835 .9835 .9835 .9840 .9840 .9840 .9845 .9845 .9845 .98503.5 .9840 .9850 .9850 .9855 .9855 .9855 .9860 .9860 .9860 .98603.6 .9865 .9865 .9865 .9865 .9870 .9870 .9870 .9875 .9875 .98753.7 .9875 .9880 .9880 .9880 .9880 .9880 .9885 .9885 .9885 .98853.8 .9890 .9890 .9890 .9890 .9890 .9895 .9895 .9895 .9895 .99003.9 .9900 .9900 .9900 .9900 .9905 .9905 .9905 .9905 .9905 .99104. .9910 .9910 .9910 .9910 .9910 .9915 .9905 .9915 .9915 .99154.1 .9915 .9920 .9920 .9920 .9920 .9920 .9920 .9925 .9925 .99254.2 .9925 .9925 .9925 .9925 .9930 .9930 .9930 .9930 .9930 .99304.3 .9930 .9935 .9935 .9935 .9935 .9935 .9935 .9935 .9935 .99404.4 .9940 .9940 .9940 .9940 .9940 .9940 .9940 .9945 .9945 .99454.5 .9945 .9945 .9945 .9945 .9945 .9945 .9950 .9950 .9950 .99504.6 .9950 .9950 .9950 .9950 .9950 .9950 .9955 .9955 .9955 .99554.7 .9955 .9955 .9955 .9955 .9955 .9955 .9955 .9960 .9960 .99604.8 .9960 .9960 .9960 .9960 .9960 .9960 .9960 .9960 .9960 .99604.9 .9965 .9965 .9965 .9965 .9965 .9965 .9965 .9965 .9965 .99655. .9965 .9965 .9965 .9965 .9970 .9970 .9970 .9970 .9970 .99705.1 .9970 .9970 .9970 .9970 .9970 .9970 .9970 .9970 .9970 .9970
12

Table 3: Cumulative Distribution Table for Exponential Power at p = 1.2t 0.0 .01 .02 .03 .04 .05 .06 .07 .08 .090. .5001 .5047 .5092 .5138 .5184 .5229 .5270 .5316 .5362 .5403.10 .5448 .5490 .5535 .5576 .5617 .5659 .5700 .5745 .5786 .5827.20 .5864 .5905 .5946 .5987 .6024 .6065 .6102 .6143 .6179 .6220.30 .6257 .6293 .6330 .6366 .6403 .6439 .6476 .6513 .6549 .6581.40 .6618 .6650 .6686 .6718 .6755 .6787 .6819 .6850 .6882 .6914.50 .6946 .6978 .7010 .7042 .7074 .7102 .7134 .7166 .7193 .7225.60 .7252 .7280 .7312 .7339 .7367 .7394 .7421 .7449 .7476 .7504.70 .7531 .7558 .7581 .7609 .7636 .7659 .7686 .7709 .7736 .7759.80 .7782 .7810 .7832 .7855 .7878 .7901 .7924 .7947 .7969 .7992.90 .8015 .8038 .8056 .8079 .8102 .8120 .8143 .8161 .8184 .82021. .8221 .8243 .8262 .8280 .8298 .8321 .8339 .8358 .8376 .83941.1 .8412 .8431 .8449 .8463 .8481 .8499 .8517 .8531 .8549 .85681.2 .8577 .8600 .8613 .8632 .8645 .8659 .8677 .8691 .8705 .87231.3 .8737 .8750 .8764 .8778 .8791 .8805 .8819 .8833 .8846 .88601.4 .8874 .8887 .8901 .8915 .8924 .8938 .8951 .8960 .8974 .89881.5 .8997 .9011 .9020 .9034 .9043 .9056 .9065 .9079 .9088 .90971.6 .9111 .9120 .9129 .9143 .9152 .9161 .9171 .9180 .9189 .92031.7 .9212 .9221 .9230 .9239 .9248 .9257 .9266 .9276 .9280 .92891.8 .9298 .9308 .9317 .9326 .9330 .9340 .9349 .9358 .9362 .93711.9 .9381 .9385 .9394 .9403 .9408 .9417 .9422 .9431 .9435 .94452. .9449 .9458 .9463 .9472 .9477 .9481 .9490 .9495 .9504 .95082.1 .9513 .9522 .9527 .9531 .9536 .9545 .9550 .9554 .9559 .95632.2 .9572 .9577 .9582 .9586 .9591 .9595 .9600 .9609 .9614 .96182.3 .9623 .9627 .9632 .9636 .9641 .9646 .9650 .9655 .9659 .96642.4 .9664 .9668 .9673 .9677 .9682 .9687 .9691 .9696 .9700 .97002.5 .9705 .9709 .9714 .9719 .9719 .9723 .9728 .9732 .9732 .97372.6 .9741 .9746 .9746 .9751 .9755 .9755 .9760 .9764 .9764 .97692.7 .9769 .9773 .9778 .9783 .9783 .9787 .9787 .9792 .9796 .97962.8 .9801 .9801 .9805 .9805 .9810 .9814 .9814 .9819 .9819 .98242.9 .9824 .9828 .9828 .9833 .9833 .9837 .9837 .9842 .9842 .98423. .9846 .9846 .9851 .9851 .9856 .9856 .9856 .9860 .9860 .98653.1 .9865 .9865 .9869 .9874 .9874 .9874 .9874 .9878 .9878 .98783.2 .9883 .9883 .9883 .9888 .9888 .9888 .9888 .9892 .9892 .98973.3 .9897 .9897 .9901 .9901 .9901 .9901 .9906 .9906 .9906 .99103.4 .9910 .9910 .9910 .9915 .9915 .9915 .9915 .9920 .9920 .99203.5 .9920 .9924 .9924 .9924 .9924 .9920 .9929 .9929 .9929 .99293.6 .9933 .9933 .9933 .9933 .9933 .9938 .9938 .9938 .9938 .99383.7 .9942 .9942 .9942 .9942 .9942 .9942 .9947 .9947 .9947 .99473.8 .9947 .9947 .9951 .9951 .9951 .9951 .9951 .9951 .9951 .99563.9 .9956 .9956 .9956 .9956 .9956 .9956 .9961 .9961 .9961 .99614. .9961 .9961 .9961 .9961 .9965 .9965 .9965 .9965 .9965 .99654.1 .9965 .9965 .9965 .9947 .9970 .9970 .9970 .9970 .9970 .99704.2 .9970 .9970 .9970 .9970 .9974 .9974 .9974 .9974 .9974 .99744.3 .9974 .9974 .9974 .9974 .9974 .9974 .9979 .9979 .9979 .99794.4 .9979 .9979 .9979 .9979 .9979 .9979 .9979 .9979 .9979 .99794.5 .9983 .9983 .9983 .9983 .9983 .9983 .9983 .9983 .9983 .99834.6 .9983 .9983 .9983 .9983 .9983 .9983 .9983 .9983 .9988 .99884.7 .9988 .9988 .9988 .9988 .9988 .9988 .9988 .9988 .9988 .99884.8 .9988 .9988 .9988 .9988 .9988 .9988 .9988 .9988 .9988 .99884.9 .9988 .9993 .9993 .9993 .9993 .9993 .9993 .9993 .9993 .99935. .9993 .9993 .9993 .9993 .9993 .9993 .9993 .9993 .9993 .99935.1 .9993 .9993 .9993 .9993 .9993 .9993 .9993 .9993 .9993 .99935.2 .9993 .9993 .9993 .9993 .9997 .9993 .9993 .9997 .9997 .9997
13

Table 4: Cumulative Distribution Table for Exponential Power at p = 1.4t 0.0 .01 .02 .03 .04 .05 .06 .07 .08 .090. .4999 .5042 .5085 .5128 .5171 .5214 .5258 .5301 .5339 .5383.10 .5426 .5469 .5508 .5551 .5590 .5633 .5672 .5715 .5754 .5797.20 .5835 .5874 .5913 .5956 .5995 .6034 .6073 .6112 .6150 .6185.30 .6224 .6262 .6301 .6336 .6375 .6409 .6448 .6482 .6517 .6556.40 .6590 .6625 .6659 .6694 .6728 .6763 .6797 .6832 .6866 .6896.50 .6931 .6965 .6996 .7030 .7060 .7095 .7125 .7155 .7185 .7216.60 .7250 .7280 .7311 .7336 .7367 .7397 .7427 .7457 .7483 .7513.70 .7539 .7569 .7595 .7621 .7651 .7677 .7703 .7729 .7755 .7781.80 .7807 .7832 .7858 .7884 .7910 .7932 .7957 .7979 .8005 .8026.90 .8052 .8074 .8100 .8121 .8143 .8165 .8186 .8208 .8229 .82511. .8272 .8294 .8315 .8337 .8359 .8376 .8397 .8415 .8436 .84531.1 .8475 .8492 .8514 .8531 .8548 .8566 .8587 .8604 .8622 .86391.2 .8656 .8673 .8691 .8708 .8721 .8738 .8755 .8773 .8786 .88031.3 .8820 .8833 .8850 .8863 .8876 .8893 .8906 .8924 .8937 .89491.4 .8962 .8975 .8993 .9006 .9018 .9031 .9044 .9057 .9070 .90791.5 .9092 .9105 .9118 .9131 .9139 .9152 .9165 .9174 .9187 .92001.6 .9208 .9221 .9230 .9238 .9251 .9260 .9273 .9282 .9290 .93031.7 .9312 .9320 .9329 .9338 .9346 .9355 .9368 .9376 .9385 .93941.8 .9402 .9411 .9420 .9428 .9433 .9441 .9450 .9458 .9467 .94711.9 .9480 .9489 .9497 .9502 .9510 .9519 .9523 .9532 .9536 .95452. .9549 .9558 .9562 .9571 .9575 .9583 .9588 .9596 .9601 .96052.1 .9614 .9618 .9622 .9631 .9635 .9640 .9644 .9648 .9657 .96612.2 .9665 .9670 .9674 .9678 .9687 .9691 .9696 .9700 .9704 .97092.3 .9713 .9717 .9722 .9726 .9730 .9734 .9739 .9743 .9747 .97472.4 .9752 .9756 .9760 .9765 .9769 .9773 .9773 .9778 .9782 .97862.5 .9786 .9791 .9795 .9799 .9799 .9803 .9808 .9812 .9812 .98162.6 .9821 .9821 .9825 .9829 .9829 .9834 .9834 .9838 .9842 .98422.7 .9842 .9847 .9851 .9851 .9855 .9855 .9860 .9860 .9864 .98642.8 .9868 .9868 .9872 .9872 .9877 .9877 .9881 .9881 .9885 .98852.9 .9885 .9890 .9890 .9894 .9894 .9898 .9898 .9898 .9903 .99033. .9903 .9907 .9907 .9907 .9911 .9911 .9911 .9916 .9916 .99163.1 .9920 .9920 .9920 .9924 .9924 .9924 .9924 .9929 .9929 .99293.2 .9933 .9933 .9933 .9933 .9937 .9937 .9937 .9937 .9941 .99413.3 .9941 .9941 .9941 .9946 .9946 .9946 .9946 .9946 .9950 .99503.4 .9950 .9950 .9950 .9954 .9954 .9954 .9954 .9954 .9954 .99593.5 .9959 .9959 .9959 .9959 .9959 .9963 .9963 .9963 .9963 .99633.6 .9963 .9963 .9967 .9967 .9967 .9967 .9967 .9967 .9967 .99673.7 .9972 .9972 .9972 .9972 .9972 .9972 .9972 .9972 .9972 .99723.8 .9976 .9976 .9976 .9976 .9976 .9976 .9976 .9976 .9976 .99763.9 .9980 .9980 .9980 .9980 .9980 .9980 .9980 .9980 .9980 .99804. .9980 .9980 .9980 .9985 .9985 .9985 .9985 .9985 .9985 .99854.1 .9985 .9985 .9985 .9985 .9985 .9985 .9985 .9985 .9985 .99854.2 .9985 .9985 .9989 .9989 .9989 .9989 .9989 .9989 .9989 .99894.3 .9989 .9989 .9989 .9989 .9989 .9989 .9989 .9989 .9989 .99894.4 .9989 .9989 .9989 .9989 .9989 .9989 .9989 .9989 .9989 .99894.5 .9993 .9993 .9993 .9993 .9993 .9993 .9993 .9993 .9993 .99934.6 .9993 .9993 .9993 .9993 .9993 .9993 .9993 .9993 .9993 .99934.7 .9993 .9993 .9993 .9993 .9993 .9993 .9993 .9993 .9993 .99934.8 .9993 .9993 .9993 .9993 .9993 .9993 .9993 .9993 .9993 .99934.9 .9993 .9993 .9993 .9993 .9993 .9993 .9993 .9993 .9993 .99935. .9993 .9993 .9993 .9998 .9998 .9998 .9998 .9998 .9998 .9998
14

Table 5: Cumulative Distribution Table for Exponential Power at p = 1.6t 0.0 .01 .02 .03 .04 .05 .06 .07 .08 .090. .5002 .5044 .5085 .5127 .5168 .5210 .5252 .5289 .5331 .5372.10 .5414 .5455 .5497 .5538 .5576 .5617 .5659 .5696 .5738 .5780.20 .5817 .5859 .5896 .5938 .5975 .6012 .6054 .6091 .6129 .6166.30 .6204 .6245 .6283 .6320 .6358 .6395 .6428 .6466 .6503 .6541.40 .6574 .6611 .6649 .6682 .6719 .6753 .6786 .6823 .6857 .6890.50 .6923 .6960 .6994 .7027 .7060 .7089 .7123 .7156 .7189 .7218.60 .7252 .7285 .7314 .7347 .7376 .7405 .7439 .7468 .7497 .7526.70 .7555 .7584 .7613 .7642 .7672 .7701 .7726 .7755 .7784 .7809.80 .7838 .7863 .7888 .7917 .7942 .7967 .7992 .8017 .8042 .8067.90 .8091 .8116 .8141 .8166 .8191 .8212 .8237 .8258 .8283 .83041. .8328 .8349 .8370 .8391 .8416 .8437 .8457 .8478 .8499 .85201.1 .8536 .8557 .8578 .8599 .8615 .8636 .8657 .8674 .8690 .87111.2 .8728 .8748 .8765 .8782 .8798 .8815 .8832 .8848 .8865 .88811.3 .8898 .8915 .8931 .8948 .8960 .8977 .8994 .9006 .9023 .90351.4 .9052 .9064 .9077 .9094 .9106 .9118 .9131 .9148 .9160 .91731.5 .9185 .9197 .9210 .9222 .9235 .9247 .9256 .9268 .9281 .92931.6 .9301 .9314 .9322 .9335 .9347 .9356 .9368 .9376 .9385 .93971.7 .9405 .9414 .9426 .9435 .9443 .9451 .9459 .9472 .9480 .94891.8 .9497 .9505 .9514 .9522 .9530 .9534 .9543 .9551 .9559 .95681.9 .9576 .9580 .9588 .9597 .9601 .9609 .9613 .9622 .9630 .96342. .9642 .9647 .9655 .9659 .9667 .9672 .9676 .9684 .9688 .96922.1 .9701 .9705 .9709 .9713 .9721 .9726 .9730 .9734 .9738 .97462.2 .9751 .9755 .9759 .9763 .9767 .9771 .9775 .9780 .9784 .97882.3 .9792 .9796 .9800 .9805 .9805 .9809 .9813 .9817 .9821 .98252.4 .9825 .9830 .9834 .9838 .9842 .9842 .9846 .9850 .9850 .98542.5 .9859 .9859 .9863 .9867 .9867 .9871 .9871 .9875 .9879 .98792.6 .9884 .9884 .9888 .9888 .9892 .9892 .9896 .9896 .9900 .99002.7 .9904 .9904 .9909 .9909 .9913 .9913 .9917 .9917 .9917 .99212.8 .9921 .9925 .9925 .9925 .9929 .9929 .9929 .9933 .9933 .99332.9 .9938 .9938 .9938 .9942 .9942 .9942 .9946 .9946 .9946 .99463. .9950 .9950 .9950 .9950 .9954 .9954 .9954 .9954 .9958 .99583.1 .9958 .9958 .9963 .9963 .9963 .9963 .9963 .9967 .9967 .99673.2 .9967 .9967 .9967 .9971 .9971 .9971 .9971 .9971 .9971 .99753.3 .9975 .9975 .9975 .9975 .9975 .9975 .9979 .9979 .9979 .99793.4 .9979 .9979 .9979 .9979 .9983 .9983 .9983 .9983 .9983 .99833.5 .9983 .9983 .9983 .9983 .9988 .9988 .9988 .9988 .9988 .99883.6 .9988 .9988 .9988 .9988 .9988 .9988 .9988 .9992 .9992 .99923.7 .9992 .9992 .9992 .9992 .9992 .9992 .9992 .9992 .9992 .99923.8 .9992 .9992 .9992 .9992 .9992 .9996 .9996 .9996 .9996 .99963.9 .9996 .9996 .9996 .9996 .9996 .9996 .9996 .9996 .9996 .99964. .9996 .9996 .9996 .9996 .9996 .9996 .9996 .9996 .9996 .9996
15

Table 6: Cumulative Distribution Table for Exponential Power at p = 1.8t 0.0 .01 .02 .03 .04 .05 .06 .07 .08 .090. .5001 .5042 .5082 .5123 .5163 .5204 .5244 .5285 .5321 .5362.10 .5403 .5443 .5484 .5524 .5565 .5605 .5642 .5682 .5723 .5764.20 .5800 .5841 .5881 .5918 .5958 .5999 .6035 .6076 .6112 .6153.30 .6189 .6226 .6267 .6303 .6340 .6376 .6417 .6453 .6490 .6526.40 .6563 .6599 .6636 .6672 .6705 .6741 .6778 .6814 .6847 .6883.50 .6915 .6952 .6984 .7021 .7053 .7086 .7122 .7155 .7187 .7220.60 .7252 .7285 .7317 .7349 .7382 .7414 .7443 .7475 .7508 .7536.70 .7568 .7597 .7625 .7658 .7686 .7715 .7743 .7771 .7804 .7832.80 .7856 .7885 .7913 .7942 .7970 .7994 .8023 .8047 .8075 .8100.90 .8124 .8153 .8177 .8201 .8226 .8250 .8274 .8299 .8323 .83471. .8372 .8392 .8416 .8441 .8461 .8485 .8505 .8530 .8550 .85701.1 .8591 .8611 .8635 .8656 .8676 .8692 .8712 .8733 .8753 .87731.2 .8789 .8810 .8826 .8846 .8862 .8883 .8899 .8915 .8935 .89521.3 .8968 .8984 .9000 .9016 .9033 .9049 .9065 .9077 .9094 .91101.4 .9122 .9138 .9154 .9167 .9179 .9195 .9207 .9223 .9236 .92481.5 .9260 .9272 .9284 .9296 .9309 .9321 .9333 .9345 .9357 .93691.6 .9382 .9390 .9402 .9414 .9422 .9434 .9442 .9455 .9463 .94751.7 .9483 .9491 .9503 .9511 .9519 .9528 .9540 .9548 .9556 .95641.8 .9572 .9580 .9588 .9596 .9605 .9613 .9621 .9625 .9633 .96411.9 .9649 .9653 .9661 .9670 .9674 .9682 .9686 .9694 .9698 .97062. .9710 .9718 .9722 .9730 .9734 .9738 .9747 .9751 .9755 .97592.1 .9767 .9771 .9775 .9779 .9783 .9787 .9791 .9799 .9803 .98072.2 .9811 .9816 .9820 .9824 .9828 .9828 .9832 .9836 .9840 .98442.3 .9848 .9852 .9852 .9856 .9860 .9864 .9868 .9868 .9872 .98762.4 .9876 .9880 .9884 .9884 .9889 .9893 .9893 .9897 .9897 .99012.5 .9905 .9905 .9909 .9909 .9913 .9913 .9917 .9917 .9921 .99212.6 .9925 .9925 .9925 .9929 .9929 .9933 .9933 .9933 .9937 .99372.7 .9941 .9941 .9941 .9945 .9945 .9945 .9949 .9949 .9949 .99532.8 .9953 .9953 .9953 .9957 .9957 .9957 .9957 .9962 .9962 .99622.9 .9962 .9966 .9966 .9966 .9966 .9966 .9970 .9970 .9970 .99703. .9970 .9974 .9974 .9974 .9974 .9974 .9974 .9978 .9978 .99783.1 .9978 .9978 .9978 .9978 .9982 .9982 .9982 .9982 .9982 .99823.2 .9982 .9982 .9986 .9986 .9986 .9986 .9986 .9986 .9986 .99863.3 .9986 .9986 .9986 .9986 .9990 .9990 .9990 .9990 .9990 .99903.4 .9990 .9990 .9990 .9990 .9990 .9990 .9990 .9990 .9990 .99943.5 .9994 .9994 .9994 .9994 .9994 .9994 .9994 .9994 .9994 .99943.6 .9994 .9994 .9994 .9994 .9994 .9994 .9994 .9994 .9994 .99943.7 .9994 .9994 .9994 .9994 .9994 .9994 .9998 .9998 .9998 .9998
16

Table 7: Cumulative Distribution Table for Exponential Power at p = 2.2t 0.0 .01 .02 .03 .04 .05 .06 .07 .08 .090. .5000 .5039 .5079 .5118 .5157 .5197 .5236 .5276 .5315 .5355.10 .5394 .5434 .5473 .5513 .5552 .5591 .5631 .5670 .5710 .5749.20 .5789 .5824 .5864 .5903 .5943 .5982 .6022 .6057 .6097 .6136.30 .6172 .6211 .6250 .6286 .6325 .6365 .6400 .6440 .6475 .6515.40 .6550 .6586 .6625 .6661 .6696 .6736 .6771 .6807 .6842 .6878.50 .6913 .6949 .6984 .7020 .7055 .7091 .7126 .7162 .7198 .7229.60 .7265 .7296 .7332 .7367 .7399 .7430 .7466 .7497 .7529 .7564.70 .7596 .7628 .7659 .7691 .7722 .7754 .7782 .7813 .7845 .7876.80 .7904 .7935 .7963 .7995 .8022 .8050 .8081 .8109 .8137 .8164.90 .8192 .8220 .8247 .8275 .8298 .8326 .8354 .8377 .8405 .84291. .8456 .8480 .8504 .8527 .8551 .8579 .8602 .8622 .8646 .86691.1 .8693 .8717 .8736 .8760 .8780 .8804 .8823 .8843 .8867 .88861.2 .8906 .8926 .8946 .8965 .8985 .9001 .9021 .9040 .9056 .90761.3 .9092 .9111 .9127 .9143 .9163 .9178 .9194 .9210 .9226 .92421.4 .9257 .9273 .9289 .9301 .9317 .9328 .9344 .9360 .9372 .93841.5 .9399 .9411 .9423 .9435 .9447 .9459 .9474 .9482 .9494 .95061.6 .9518 .9530 .9541 .9549 .9561 .9569 .9581 .9589 .9601 .96091.7 .9620 .9628 .9636 .9644 .9652 .9664 .9672 .9680 .9687 .96951.8 .9703 .9711 .9715 .9723 .9731 .9739 .9743 .9751 .9758 .97621.9 .9770 .9774 .9782 .9786 .9794 .9798 .9806 .9810 .9814 .98222. .9826 .9829 .9833 .9837 .9841 .9849 .9853 .9857 .9861 .98652.1 .9869 .9873 .9877 .9881 .9885 .9885 .9889 .9893 .9897 .99012.2 .9901 .9904 .9908 .9912 .9912 .9916 .9920 .9920 .9924 .99282.3 .9928 .9932 .9932 .9936 .9936 .9940 .9940 .9944 .9944 .99482.4 .9948 .9952 .9952 .9956 .9956 .9956 .9960 .9960 .9960 .99642.5 .9964 .9964 .9968 .9968 .9968 .9972 .9972 .9972 .9972 .99752.6 .9975 .9975 .9975 .9979 .9979 .9979 .9979 .9979 .9983 .99832.7 .9983 .9983 .9983 .9987 .9987 .9987 .9987 .9987 .9987 .99872.8 .9991 .9991 .9991 .9991 .9991 .9991 .9991 .9991 .9991 .99912.9 .9995 .9995 .9995 .9995 .9995 .9995 .9995 .9995 .9995 .99953. .9995 .9995 .9995 .9995 .9999 .9999 .9999 .9999 .9999 .99993.1 .9999 .9999 .9999 .9999 .9999 .9999 .9999 .9999 .9999 .99993.2 .9999 .9999 .9999 .9999 .9999 .9999 .9999 .9999 .9999 .99993.3 .9999 .9999 .9999 .9999 .9999 .9999 1.000 1.000 1.000 1.0003.4 1.000 1.000 1.000 1.000 1.000 1.000 1.000 1.000 1.000 1.000
17

Table 8: Cumulative Distribution Table for Exponential Power at p = 2.4t 0.0 .01 .02 .03 .04 .05 .06 .07 .08 .090. .5001 .5040 .5079 .5118 .5157 .5197 .5236 .5275 .5314 .5353.10 .5392 .5431 .5471 .5510 .5549 .5584 .5623 .5663 .5702 .5741.20 .5780 .5819 .5858 .5897 .5937 .5976 .6011 .6050 .6089 .6129.30 .6168 .6203 .6242 .6281 .6320 .6356 .6395 .6434 .6469 .6508.40 .6544 .6583 .6618 .6657 .6692 .6732 .6767 .6802 .6841 .6876.50 .6912 .6951 .6986 .7021 .7057 .7092 .7127 .7162 .7198 .7233.60 .7268 .7303 .7335 .7370 .7405 .7440 .7472 .7507 .7538 .7574.70 .7605 .7636 .7671 .7703 .7734 .7765 .7797 .7828 .7859 .7891.80 .7922 .7953 .7985 .8012 .8043 .8075 .8102 .8134 .8161 .8188.90 .8220 .8247 .8275 .8302 .8329 .8357 .8384 .8412 .8435 .84621. .8490 .8513 .8541 .8564 .8592 .8615 .8639 .8662 .8686 .87091.1 .8733 .8756 .8780 .8803 .8823 .8846 .8870 .8889 .8913 .89321.2 .8952 .8972 .8991 .9015 .9034 .9054 .9069 .9089 .9109 .91281.3 .9144 .9163 .9179 .9199 .9214 .9230 .9246 .9265 .9281 .92971.4 .9312 .9328 .9340 .9355 .9371 .9387 .9398 .9414 .9426 .94411.5 .9453 .9465 .9477 .9492 .9504 .9516 .9528 .9539 .9551 .95591.6 .9571 .9582 .9594 .9602 .9614 .9622 .9633 .9641 .9653 .96611.7 .9669 .9680 .9688 .9696 .9704 .9712 .9720 .9727 .9735 .97431.8 .9751 .9755 .9763 .9770 .9778 .9782 .9790 .9794 .9802 .98061.9 .9813 .9817 .9825 .9829 .9833 .9837 .9845 .9849 .9853 .98572. .9860 .9864 .9872 .9876 .9880 .9884 .9888 .9888 .9892 .98962.1 .9900 .9904 .9907 .9911 .9911 .9915 .9919 .9919 .9923 .99272.2 .9927 .9931 .9935 .9935 .9939 .9939 .9943 .9943 .9947 .99472.3 .9951 .9951 .9954 .9954 .9958 .9958 .9958 .9962 .9962 .99622.4 .9966 .9966 .9966 .9970 .9970 .9970 .9974 .9974 .9974 .99742.5 .9978 .9978 .9978 .9978 .9978 .9982 .9982 .9982 .9982 .99822.6 .9986 .9986 .9986 .9986 .9986 .9986 .9986 .9990 .9990 .99902.7 .9990 .9990 .9990 .9990 .9990 .9990 .9990 .9994 .9994 .99942.8 .9994 .9994 .9994 .9994 .9994 .9994 .9994 .9994 .9994 .99942.9 .9994 .9994 .9994 .9994 .9998 .9998 .9998 .9998 .9998 .99983. .9998 .9998 .9998 .9998 .9998 .9998 .9998 .9998 .9998 .99983.1 .9998 .9998 .9998 .9998 .9998 .9998 .9998 .9998 .9998 .99983.2 .9998 .9998 .9998 .9998 .9998 .9998 .9998 .9998 .9998 .99983.3 .9998 .9998 .9998 .9998 .9998 .9998 .9998 .9998 .9998 .99983.4 .9998 .9998 .9998 .9998 .9998 .9998 .9998 .9998 .9998 .9998
18

Table 9: Cumulative Distribution Table for Exponential Power at p = 2.6t 0.0 .01 .02 .03 .04 .05 .06 .07 .08 .090. .5001 .5040 .5079 .5118 .5157 .5196 .5235 .5274 .5313 .5352.10 .5391 .5430 .5469 .5508 .5547 .5586 .5625 .5664 .5699 .5738.20 .5777 .5816 .5855 .5894 .5933 .5972 .6011 .6050 .6089 .6124.30 .6163 .6202 .6241 .6280 .6319 .6354 .6393 .6432 .6467 .6506.40 .6545 .6580 .6619 .6658 .6693 .6732 .6767 .6806 .6841 .6880.50 .6915 .6950 .6989 .7024 .7059 .7098 .7133 .7168 .7204 .7239.60 .7274 .7309 .7344 .7379 .7414 .7449 .7484 .7515 .7550 .7586.70 .7617 .7652 .7683 .7718 .7749 .7784 .7815 .7847 .7878 .7913.80 .7944 .7975 .8006 .8038 .8069 .8096 .8127 .8159 .8186 .8217.90 .8244 .8275 .8303 .8334 .8361 .8388 .8416 .8443 .8470 .84981. .8525 .8552 .8576 .8603 .8626 .8654 .8677 .8704 .8728 .87511.1 .8774 .8798 .8821 .8845 .8868 .8891 .8915 .8934 .8958 .89771.2 .9000 .9020 .9043 .9063 .9082 .9102 .9121 .9141 .9160 .91801.3 .9195 .9215 .9230 .9250 .9266 .9285 .9301 .9316 .9332 .93471.4 .9363 .9379 .9394 .9410 .9425 .9437 .9453 .9468 .9480 .94961.5 .9507 .9519 .9531 .9546 .9558 .9570 .9581 .9593 .9601 .96121.6 .9624 .9636 .9644 .9655 .9663 .9675 .9683 .9694 .9702 .97101.7 .9718 .9726 .9737 .9745 .9753 .9761 .9764 .9772 .9780 .97881.8 .9796 .9800 .9807 .9811 .9819 .9827 .9831 .9835 .9842 .98461.9 .9854 .9858 .9862 .9866 .9870 .9878 .9881 .9885 .9889 .98932. .9897 .9901 .9905 .9909 .9909 .9913 .9917 .9920 .9924 .99242.1 .9928 .9932 .9936 .9936 .9940 .9940 .9944 .9948 .9948 .99522.2 .9952 .9955 .9955 .9959 .9959 .9959 .9963 .9963 .9967 .99672.3 .9967 .9971 .9971 .9971 .9975 .9975 .9975 .9979 .9979 .99792.4 .9979 .9983 .9983 .9983 .9983 .9983 .9987 .9987 .9987 .99872.5 .9987 .9987 .9991 .9991 .9991 .9991 .9991 .9991 .9991 .99912.6 .9991 .9994 .9994 .9994 .9994 .9994 .9994 .9994 .9994 .99942.7 .9994 .9994 .9994 .9994 .9994 .9998 .9998 .9998 .9998 .99982.8 .9998 .9998 .9998 .9998 .9998 .9998 .9998 .9998 .9998 .99982.9 .9998 .9998 .9998 .9998 .9998 .9998 .9998 .9998 .9998 .99983. .9998 .9998 .9998 .9998 .9998 .9998 .9998 .9998 .9998 .99983.1 .9998 .9998 .9998 .9998 .9998 .9998 .9998 .9998 .9998 .99983.2 .9998 .9998 .9998 .9998 .9998 .9998 .9998 .9998 .9998 .99983.3 .9998 .9998 .9998 .9998 .9998 .9998 .9998 .9998 .9998 .99983.4 .9998 .9998 .9998 .9998 .9998 .9998 .9998 .9998 .9998 .9998
19

Table 10: Cumulative Distribution Table for Exponential Power at p = 2.8t 0.0 .01 .02 .03 .04 .05 .06 .07 .08 .090. .5000 .5039 .5078 .5117 .5155 .5194 .5233 .5272 .5311 .5350.10 .5389 .5428 .5467 .5505 .5544 .5583 .5622 .5661 .5700 .5739.20 .5778 .5816 .5855 .5894 .5933 .5972 .6011 .6050 .6089 .6124.30 .6162 .6201 .6240 .6279 .6318 .6357 .6392 .6431 .6470 .6509.40 .6544 .6582 .6621 .6656 .6695 .6734 .6769 .6808 .6847 .6882.50 .6921 .6956 .6995 .7030 .7064 .7103 .7138 .7173 .7212 .7247.60 .7282 .7317 .7352 .7387 .7426 .7461 .7492 .7527 .7562 .7597.70 .7632 .7667 .7698 .7733 .7768 .7799 .7834 .7865 .7897 .7932.80 .7963 .7994 .8029 .8060 .8091 .8122 .8153 .8184 .8211 .8243.90 .8274 .8301 .8332 .8363 .8390 .8418 .8449 .8476 .8503 .85301. .8557 .8585 .8612 .8639 .8666 .8690 .8717 .8740 .8767 .87911.1 .8818 .8841 .8865 .8888 .8911 .8935 .8958 .8981 .9001 .90241.2 .9047 .9067 .9086 .9110 .9129 .9148 .9168 .9187 .9207 .92261.3 .9246 .9265 .9281 .9300 .9316 .9335 .9351 .9366 .9390 .94011.4 .9417 .9432 .9444 .9460 .9475 .9491 .9502 .9518 .9529 .95451.5 .9557 .9568 .9580 .9596 .9607 .9619 .9631 .9638 .9650 .96621.6 .9673 .9681 .9693 .9701 .9712 .9720 .9728 .9739 .9747 .97551.7 .9763 .9771 .9778 .9786 .9794 .9802 .9809 .9813 .9821 .98291.8 .9833 .9841 .9844 .9852 .9856 .9860 .9868 .9872 .9876 .98831.9 .9887 .9891 .9895 .9899 .9903 .9907 .9911 .9914 .9918 .99222. .9926 .9926 .9930 .9934 .9938 .9938 .9942 .9946 .9946 .99492.1 .9953 .9953 .9957 .9957 .9961 .9961 .9965 .9965 .9969 .99692.2 .9969 .9973 .9973 .9977 .9977 .9977 .9977 .9980 .9980 .99802.3 .9984 .9984 .9984 .9984 .9988 .9988 .9988 .9988 .9988 .99882.4 .9992 .9992 .9992 .9992 .9992 .9992 .9992 .9996 .9996 .99962.5 .9996 .9996 .9996 .9996 .9996 .9996 .9996 .9996 .9996 1.0002.6 1.000 1.000 1.000 1.000 1.000 1.000 1.000 1.000 1.000 1.0002.7 1.000 1.000 1.000 1.000 1.000 1.000 1.000 1.000 1.000 1.000
20

Table 11: Cumulative Distribution Table for Exponential Power at p = 3.0t 0.0 .01 .02 .03 .04 .05 .06 .07 .08 .090. .5001 .5040 .5079 .5118 .5157 .5195 .5234 .5273 .5312 .5351.10 .5390 .5428 .5467 .5506 .5545 .5584 .5623 .5661 .5700 .5739.20 .5778 .5817 .5856 .5894 .5933 .5972 .6011 .6050 .6085 .6123.30 .6162 .6201 .6240 .6279 .6318 .6356 .6395 .6430 .6469 .6508.40 .6547 .6586 .6621 .6659 .6698 .6737 .6772 .6811 .6850 .6885.50 .6923 .6958 .6997 .7032 .7071 .7106 .7145 .7180 .7218 .7253.60 .7288 .7327 .7362 .7397 .7432 .7467 .7506 .7541 .7576 .7611.70 .7646 .7677 .7712 .7747 .7782 .7816 .7848 .7882 .7914 .7949.80 .7980 .8015 .8046 .8077 .8112 .8143 .8174 .8205 .8236 .8267.90 .8298 .8329 .8356 .8387 .8418 .8446 .8477 .8504 .8531 .85621. .8589 .8616 .8644 .8671 .8698 .8725 .8752 .8776 .8803 .88261.1 .8853 .8877 .8904 .8927 .8950 .8974 .8997 .9020 .9044 .90631.2 .9086 .9110 .9129 .9152 .9172 .9191 .9210 .9234 .9253 .92691.3 .9288 .9308 .9327 .9342 .9362 .9377 .9397 .9412 .9428 .94431.4 .9459 .9475 .9490 .9506 .9521 .9533 .9548 .9564 .9575 .95871.5 .9603 .9614 .9626 .9638 .9649 .9661 .9673 .9684 .9692 .97041.6 .9715 .9723 .9731 .9742 .9750 .9758 .9770 .9777 .9785 .97931.7 .9801 .9808 .9816 .9824 .9828 .9836 .9843 .9847 .9855 .98591.8 .9867 .9871 .9878 .9882 .9886 .9890 .9898 .9902 .9906 .99091.9 .9913 .9917 .9921 .9925 .9929 .9933 .9933 .9937 .9940 .99442. .9944 .9948 .9952 .9952 .9956 .9960 .9960 .9964 .9964 .99682.1 .9968 .9972 .9972 .9972 .9975 .9975 .9975 .9979 .9979 .99792.2 .9983 .9983 .9983 .9987 .9987 .9987 .9987 .9987 .9991 .99912.3 .9991 .9991 .9991 .9991 .9995 .9995 .9995 .9995 .9995 .99952.4 .9995 .9995 .9999 .9999 .9999 .9999 .9999 .9999 .9999 .99992.5 .9999 .9999 .9999 .9999 .9999 .9999 .9999 .9999 .9999 .99992.6 .9999 1.000 1.000 1.000 1.000 1.000 1.000 1.000 1.000 1.000
21

Table 12: Cumulative Distribution Table for Exponential Power at p = 3.2t 0.0 .01 .02 .03 .04 .05 .06 .07 .08 .090. .5000 .5039 .5078 .5116 .5155 .5194 .5233 .5272 .5311 .5349.10 .5388 .5427 .5466 .5505 .5543 .5582 .5621 .5660 .5699 .5738.20 .5776 .5815 .5854 .5893 .5932 .5971 .6009 .6048 .6087 .6126.30 .6165 .6203 .6242 .6281 .6316 .6355 .6394 .6432 .6471 .6510.40 .6549 .6584 .6623 .6662 .6700 .6739 .6774 .6813 .6852 .6891.50 .6925 .6964 .7003 .7038 .7077 .7112 .7151 .7186 .7224 .7259.60 .7298 .7333 .7368 .7407 .7442 .7477 .7516 .7550 .7585 .7620.70 .7655 .7690 .7725 .7760 .7795 .7830 .7865 .7896 .7931 .7966.80 .7997 .8032 .8063 .8098 .8129 .8164 .8195 .8226 .8257 .8288.90 .8319 .8350 .8381 .8412 .8443 .8474 .8502 .8533 .8560 .85911. .8618 .8645 .8672 .8703 .8731 .8758 .8785 .8808 .8835 .88631.1 .8886 .8913 .8936 .8964 .8987 .9010 .9033 .9057 .9080 .91031.2 .9127 .9146 .9169 .9189 .9212 .9231 .9251 .9274 .9294 .93131.3 .9328 .9348 .9367 .9387 .9402 .9422 .9437 .9453 .9472 .94881.4 .9503 .9519 .9534 .9546 .9561 .9577 .9589 .9604 .9616 .96271.5 .9643 .9655 .9666 .9678 .9689 .9701 .9709 .9721 .9732 .97401.6 .9752 .9759 .9767 .9779 .9787 .9794 .9802 .9810 .9818 .98251.7 .9833 .9841 .9845 .9853 .9860 .9864 .9872 .9876 .9884 .98871.8 .9891 .9899 .9903 .9907 .9911 .9915 .9919 .9922 .9926 .99301.9 .9934 .9938 .9942 .9946 .9946 .9950 .9953 .9953 .9957 .99612. .9961 .9965 .9965 .9969 .9969 .9973 .9973 .9977 .9977 .99772.1 .9981 .9981 .9981 .9985 .9985 .9985 .9985 .9988 .9988 .99882.2 .9988 .9992 .9992 .9992 .9992 .9992 .9992 .9996 .9996 .99962.3 .9996 .9996 .9996 .9996 .9996 .9996 .9996 1.000 1.000 1.0002.4 1.000 1.000 1.000 1.000 1.000 1.000 1.000 1.000 1.000 1.0002.5 1.000 1.000 1.000 1.000 1.000 1.000 1.000 1.000 1.000 1.000
22

Table 13: Cumulative Distribution Table for Exponential Power at p = 3.4t 0.0 .01 .02 .03 .04 .05 .06 .07 .08 .090. .5003 .5041 .5080 .5119 .5158 .5197 .5236 .5274 .5313 .5352.10 .5391 .5430 .5469 .5508 .5546 .5585 .5624 .5663 .5702 .5741.20 .5779 .5818 .5857 .5896 .5931 .5970 .6009 .6047 .6086 .6125.30 .6164 .6203 .6242 .6280 .6319 .6358 .6397 .6436 .6475 .6513.40 .6548 .6587 .6626 .6665 .6704 .6743 .6778 .6816 .6855 .6894.50 .6929 .6968 .7007 .7046 .7081 .7119 .7154 .7193 .7232 .7267.60 .7306 .7341 .7380 .7415 .7450 .7488 .7523 .7558 .7597 .7632.70 .7667 .7702 .7737 .7772 .7807 .7842 .7877 .7912 .7947 .7982.80 .8017 .8048 .8083 .8114 .8149 .8180 .8215 .8246 .8277 .8312.90 .8343 .8374 .8405 .8436 .8467 .8498 .8529 .8556 .8588 .86151. .8646 .8673 .8704 .8731 .8758 .8786 .8813 .8840 .8867 .88941.1 .8922 .8945 .8972 .8995 .9023 .9046 .9069 .9092 .9116 .91391.2 .9162 .9186 .9205 .9228 .9248 .9271 .9291 .9310 .9329 .93491.3 .9368 .9388 .9407 .9423 .9442 .9458 .9477 .9492 .9508 .95241.4 .9539 .9555 .9570 .9586 .9601 .9613 .9628 .9640 .9652 .96671.5 .9679 .9691 .9702 .9714 .9726 .9733 .9745 .9757 .9764 .97761.6 .9784 .9792 .9803 .9811 .9819 .9827 .9834 .9842 .9846 .98541.7 .9861 .9869 .9873 .9881 .9885 .9893 .9896 .9900 .9908 .99121.8 .9916 .9920 .9924 .9928 .9931 .9935 .9939 .9943 .9947 .99471.9 .9951 .9955 .9959 .9959 .9962 .9966 .9966 .9970 .9970 .99742. .9974 .9974 .9978 .9978 .9982 .9982 .9982 .9986 .9986 .99862.1 .9990 .9990 .9990 .9990 .9990 .9994 .9994 .9994 .9994 .99942.2 .9994 .9997 .9997 .9997 .9997 .9997 .9997 .9997 .9997 .99972.3 .9997 .9997 1.000 1.000 1.000 1.000 1.000 1.000 1.000 1.0002.4 1.000 1.000 1.000 1.000 1.000 1.000 1.000 1.000 1.000 1.0002.5 1.000 1.000 1.000 1.000 1.000 1.000 1.000 1.000 1.000 1.000
23

Table 14: Cumulative Distribution Table for Exponential Power at p = 3.6t 0.0 .01 .02 .03 .04 .05 .06 .07 .08 .090. .5000 .5039 .5078 .5117 .5155 .5194 .5233 .5272 .5311 .5350.10 .5389 .5428 .5467 .5505 .5544 .5583 .5622 .5661 .5700 .5739.20 .5778 .5816 .5855 .5894 .5933 .5972 .6011 .6050 .6089 .6127.30 .6166 .6205 .6244 .6283 .6322 .6361 .6400 .6439 .6474 .6512.40 .6551 .6590 .6629 .6668 .6707 .6746 .6781 .6820 .6858 .6897.50 .6936 .6971 .7010 .7049 .7088 .7123 .7162 .7201 .7236 .7274.60 .7309 .7348 .7387 .7422 .7461 .7496 .7531 .7570 .7605 .7640.70 .7679 .7714 .7749 .7784 .7819 .7858 .7893 .7928 .7959 .7994.80 .8029 .8064 .8099 .8134 .8165 .8200 .8231 .8266 .8297 .8332.90 .8363 .8394 .8425 .8456 .8488 .8519 .8550 .8581 .8612 .86431. .8670 .8701 .8729 .8760 .8787 .8814 .8841 .8869 .8896 .89231.1 .8950 .8977 .9001 .9028 .9051 .9078 .9102 .9125 .9148 .91721.2 .9195 .9218 .9242 .9261 .9285 .9304 .9323 .9347 .9366 .93861.3 .9405 .9425 .9440 .9460 .9479 .9494 .9510 .9529 .9545 .95611.4 .9576 .9592 .9607 .9619 .9634 .9646 .9662 .9673 .9685 .97011.5 .9712 .9724 .9736 .9743 .9755 .9767 .9774 .9786 .9794 .98061.6 .9813 .9821 .9829 .9837 .9844 .9852 .9860 .9868 .9872 .98791.7 .9883 .9891 .9895 .9903 .9907 .9911 .9918 .9922 .9926 .99301.8 .9934 .9938 .9942 .9946 .9949 .9949 .9953 .9957 .9961 .99611.9 .9965 .9965 .9969 .9973 .9973 .9973 .9977 .9977 .9980 .99802. .9980 .9984 .9984 .9984 .9988 .9988 .9988 .9988 .9992 .99922.1 .9992 .9992 .9992 .9996 .9996 .9996 .9996 .9996 .9996 .99962.2 .9996 .9996 .9996 1.000 1.000 1.000 1.000 1.000 1.000 1.0002.3 1.000 1.000 1.000 1.000 1.000 1.000 1.000 1.000 1.000 1.0002.4 1.000 1.000 1.000 1.000 1.000 1.000 1.000 1.000 1.000 1.000
24

Table 15: Cumulative Distribution Table for Exponential Power at p = 3.8t 0.0 .01 .02 .03 .04 .05 .06 .07 .08 .090. .4999 .5038 .5076 .5115 .5154 .5193 .5232 .5271 .5310 .5349.10 .5388 .5427 .5466 .5505 .5544 .5583 .5621 .5660 .5699 .5738.20 .5777 .5816 .5855 .5894 .5933 .5972 .6011 .6050 .6089 .6128.30 .6167 .6205 .6244 .6283 .6322 .6361 .6400 .6439 .6478 .6517.40 .6552 .6591 .6630 .6669 .6708 .6747 .6785 .6824 .6863 .6898.50 .6937 .6976 .7015 .7054 .7089 .7128 .7167 .7206 .7241 .7280.60 .7315 .7354 .7393 .7428 .7467 .7502 .7541 .7576 .7615 .7650.70 .7685 .7724 .7759 .7794 .7837 .7868 .7903 .7938 .7973 .8008.80 .8043 .8078 .8113 .8148 .8179 .8214 .8249 .8280 .8315 .8347.90 .8382 .8413 .8444 .8479 .8510 .8541 .8572 .8604 .8635 .86621. .8693 .8724 .8751 .8783 .8810 .8841 .8868 .8896 .8923 .89501.1 .8977 .9005 .9028 .9055 .9082 .9106 .9129 .9156 .9180 .92031.2 .9226 .9250 .9269 .9293 .9316 .9335 .9355 .9378 .9398 .94171.3 .9437 .9456 .9472 .9491 .9511 .9526 .9542 .9561 .9577 .95921.4 .9608 .9623 .9635 .9651 .9666 .9678 .9690 .9705 .9717 .97291.5 .9740 .9752 .9760 .9771 .9783 .9830 .9803 .9810 .9818 .98301.6 .9838 .9845 .9853 .9861 .9865 .9873 .9880 .9884 .9892 .98961.7 .9904 .9908 .9915 .9919 .9923 .9927 .9931 .9935 .9939 .99431.8 .9947 .9951 .9954 .9954 .9958 .9962 .9962 .9966 .9970 .99701.9 .9974 .9974 .9974 .9978 .9978 .9982 .9982 .9982 .9986 .99862. .9986 .9986 .9989 .9989 .9989 .9989 .9989 .9993 .9993 .99932.1 .9993 .9993 .9993 .9993 .9993 .9997 .9997 .9997 .9997 .99972.2 .9997 .9997 .9997 .9997 .9997 .9997 .9997 .9997 .9997 .99972.3 .9997 .9997 .9997 .9997 .9997 .9997 .9997 .9997 .9997 .9997
25

Table 16: Cumulative Distribution Table for Exponential Power at p = 4.0t 0.0 .01 .02 .03 .04 .05 .06 .07 .08 .090. .5001 .5040 .5079 .5118 .5157 .5196 .5235 .5274 .5313 .5352.10 .5391 .5430 .5469 .5508 .5547 .5586 .5625 .5664 .5703 .5742.20 .5781 .5820 .5859 .5898 .5937 .5976 .6015 .6054 .6093 .6132.30 .6171 .6210 .6249 .6288 .6327 .6366 .6405 .6444 .6480 .6519.40 .6558 .6597 .6636 .6675 .6714 .6753 .6792 .6831 .6870 .6905.50 .6944 .6983 .7022 .7061 .7100 .7135 .7174 .7213 .7252 .7287.60 .7326 .7365 .7400 .7439 .7478 .7513 .7552 .7587 .7626 .7662.70 .7701 .7736 .7771 .7810 .7845 .7880 .7915 .7954 .7989 .8024.80 .8059 .8095 .8130 .8165 .8200 .8231 .8266 .8301 .8336 .8368.90 .8403 .8434 .8465 .8500 .8531 .8563 .8594 .8625 .8656 .86881. .8719 .8750 .8781 .8808 .8840 .8867 .8894 .8925 .8953 .89801.1 .9007 .9035 .9062 .9085 .9113 .9136 .9163 .9187 .9210 .92341.2 .9257 .9280 .9304 .9327 .9347 .9370 .9390 .9413 .9433 .94521.3 .9472 .9491 .9507 .9526 .9542 .9561 .9577 .9593 .9608 .96241.4 .9639 .9655 .9671 .9682 .9698 .9710 .9721 .9737 .9749 .97601.5 .9768 .9780 .9792 .9799 .9811 .9819 .9831 .9838 .9846 .98541.6 .9862 .9870 .9877 .9885 .9889 .9897 .9901 .9909 .9912 .99201.7 .9924 .9928 .9932 .9936 .9940 .9944 .9948 .9951 .9955 .99591.8 .9963 .9963 .9967 .9971 .9971 .9975 .9975 .9979 .9979 .99831.9 .9983 .9983 .9987 .9987 .9987 .9990 .9990 .9990 .9990 .99942. .9994 .9994 .9994 .9994 .9994 .9994 .9998 .9998 .9998 .99982.1 .9998 .9998 .9998 .9998 .9998 .9998 .9998 .9998 .9998 .99982.2 .9998 .9998 1.000 1.000 1.000 1.000 1.000 1.000 1.000 1.0002.3 1.000 1.000 1.000 1.000 1.000 1.000 1.000 1.000 1.000 1.000
26

Table 17: Cumulative Distribution Table for Exponential Power at p = 4.2t 0.0 .01 .02 .03 .04 .05 .06 .07 .08 .090. .5000 .5039 .5078 .5117 .5156 .5195 .5234 .5273 .5312 .5351.10 .5391 .5430 .5469 .5508 .5547 .5586 .5625 .5664 .5703 .5742.20 .5781 .5821 .5860 .5899 .5938 .5977 .6016 .6055 .6094 .6133.30 .6172 .6211 .6250 .6290 .6329 .6368 .6407 .6446 .6485 .6524.40 .6563 .6602 .6641 .6680 .6720 .6755 .6794 .6833 .6872 .6911.50 .6950 .6989 .7028 .7064 .7103 .7142 .7181 .7220 .7255 .7294.60 .7333 .7372 .7408 .7447 .7486 .7521 .7560 .7599 .7634 .7673.70 .7709 .7748 .7783 .7818 .7857 .7892 .7927 .7967 .8002 .8037.80 .8072 .8107 .8142 .8178 .8213 .8248 .8283 .8318 .8350 .8385.90 .8420 .8451 .8486 .8518 .8553 .8584 .8615 .8647 .8678 .87091. .8741 .8772 .8803 .8834 .8862 .8893 .8920 .8948 .8979 .90061.1 .9034 .9061 .9088 .9112 .9139 .9167 .9190 .9214 .9241 .92641.2 .9288 .9311 .9335 .9354 .9378 .9401 .9421 .9440 .9460 .94791.3 .9499 .9518 .9538 .9558 .9573 .9589 .9608 .9624 .9640 .96551.4 .9671 .9683 .9698 .9710 .9726 .9737 .9749 .9761 .9772 .97841.5 .9796 .9804 .9815 .9823 .9835 .9843 .9851 .9858 .9866 .98741.6 .9882 .9890 .9898 .9901 .9909 .9913 .9921 .9925 .9929 .99331.7 .9937 .9944 .9948 .9952 .9952 .9956 .9960 .9964 .9968 .99681.8 .9972 .9972 .9976 .9976 .9980 .9980 .9984 .9984 .9984 .99871.9 .9987 .9987 .9991 .9991 .9991 .9991 .9995 .9995 .9995 .99952. .9995 .9995 .9995 .9995 .9999 .9999 .9999 .9999 .9999 .9999
27

Table 18: Cumulative Distribution Table for Exponential Power at p = 4.4t 0.0 .01 .02 .03 .04 .05 .06 .07 .08 .090. .4999 .5039 .5078 .5117 .5156 .5195 .5234 .5274 .5313 .5352.10 .5391 .5430 .5470 .5509 .5548 .5587 .5626 .5665 .5705 .5744.20 .5783 .5822 .5861 .5901 .5940 .5979 .6018 .6057 .6096 .6136.30 .6175 .6214 .6253 .6292 .6331 .6371 .6410 .6449 .6488 .6527.40 .6567 .6606 .6645 .6684 .6723 .6762 .6802 .6841 .6876 .6915.50 .6954 .6994 .7033 .7072 .7111 .7150 .7186 .7225 .7264 .7303.60 .7342 .7378 .7417 .7456 .7491 .7530 .7570 .7605 .7644 .7683.70 .7718 .7758 .7793 .7832 .7867 .7903 .7942 .7977 .8012 .8051.80 .8087 .8122 .8157 .8193 .8228 .8263 .8298 .8334 .8369 .8404.90 .8435 .8471 .8506 .8537 .8569 .8604 .8635 .8667 .8702 .87331. .8765 .8796 .8823 .8855 .8886 .8913 .8945 .8972 .9004 .90311.1 .9058 .9086 .9113 .9141 .9168 .9192 .9219 .9243 .9266 .92931.2 .9317 .9341 .9360 .9384 .9407 .9427 .9450 .9470 .9489 .95091.3 .9529 .9548 .9568 .9583 .9603 .9619 .9634 .9650 .9666 .96811.4 .9697 .9709 .9724 .9736 .9752 .9764 .9775 .9787 .9799 .98071.5 .9819 .9830 .9838 .9846 .9858 .9866 .9873 .9881 .9889 .98931.6 .9901 .9909 .9913 .9920 .9924 .9928 .9936 .9940 .9944 .99481.7 .9952 .9956 .9960 .9963 .9963 .9967 .9971 .9971 .9975 .99751.8 .9979 .9979 .9983 .9983 .9987 .9987 .9987 .9991 .9991 .99911.9 .9991 .9995 .9995 .9995 .9995 .9995 .9995 .9995 .9999 .99992. .9999 .9999 .9999 .9999 .9999 .9999 .9999 .9999 .9999 .99992.1 .9999 .9999 .9999 .9999 .9999 .9999 .9999 .9999 .9999 .9999
28

Table 19: Cumulative Distribution Table for Exponential Power at p = 4.6t 0.0 .01 .02 .03 .04 .05 .06 .07 .08 .090. .5000 .5040 .5079 .5118 .5157 .5197 .5236 .5275 .5315 .5354.10 .5393 .5432 .5472 .5511 .5550 .5590 .5629 .5668 .5707 .5747.20 .5786 .5825 .5865 .5904 .5943 .5982 .6022 .6061 .6100 .6139.30 .6179 .6218 .6257 .6297 .6336 .6375 .6414 .6454 .6493 .6532.40 .6572 .6611 .6650 .6689 .6729 .6768 .6807 .6847 .6886 .6921.50 .6960 .7000 .7039 .7078 .7118 .7157 .7196 .7235 .7271 .7310.60 .7349 .7389 .7428 .7463 .7502 .7542 .7577 .7616 .7656 .7691.70 .7730 .7770 .7805 .7844 .7880 .7919 .7954 .7990 .8029 .8064.80 .8100 .8139 .8174 .8210 .8245 .8280 .8316 .8351 .8386 .8422.90 .8453 .8488 .8524 .8555 .8591 .8622 .8657 .8689 .8720 .87521. .8787 .8818 .8850 .8877 .8909 .8940 .8968 .8999 .9027 .90541.1 .9085 .9113 .9140 .9168 .9192 .9219 .9247 .9270 .9294 .93211.2 .9345 .9368 .9392 .9411 .9435 .9455 .9478 .9498 .9518 .95371.3 .9557 .9576 .9596 .9612 .9631 .9647 .9663 .9679 .9694 .97101.4 .9722 .9738 .9749 .9765 .9777 .9789 .9800 .9812 .9820 .98321.5 .9844 .9851 .9859 .9867 .9879 .9887 .9891 .9899 .9906 .99141.6 .9918 .9926 .9930 .9934 .9942 .9946 .9950 .9954 .9957 .99611.7 .9965 .9965 .9969 .9973 .9973 .9977 .9981 .9981 .9985 .99851.8 .9985 .9989 .9989 .9993 .9993 .9993 .9993 .9997 .9997 .99971.9 .9997 .9997 .9997 .9997 1.000 1.000 1.000 1.000 1.000 1.0002. 1.000 1.000 1.000 1.000 1.000 1.000 1.000 1.000 1.000 1.000
29

Table 20: Cumulative Distribution Table for Exponential Power at p = 4.8t 0.0 .01 .02 .03 .04 .05 .06 .07 .08 .090. .5001 .5041 .5080 .5119 .5159 .5198 .5238 .5277 .5316 .5356.10 .5395 .5434 .5474 .5513 .5553 .5592 .5631 .5671 .5710 .5749.20 .5789 .5828 .5868 .5907 .5946 .5986 .6025 .6065 .6104 .6143.30 .6183 .6222 .6261 .6301 .6340 .6380 .6419 .6458 .6498 .6537.40 .6576 .6616 .6655 .6695 .6734 .6773 .6813 .6852 .6892 .6931.50 .6966 .7006 .7045 .7084 .7124 .7163 .7203 .7242 .7281 .7317.60 .7356 .7396 .7435 .7474 .7510 .7549 .7589 .7628 .7663 .7703.70 .7742 .7778 .7817 .7852 .7892 .7927 .7967 .8002 .8041 .8077.80 .8112 .8152 .8187 .8223 .8258 .8293 .8333 .8368 .8400 .8435.90 .8471 .8506 .8542 .8573 .8608 .8644 .8675 .8707 .8742 .87741. .8805 .8837 .8868 .8900 .8931 .8963 .8990 .9022 .9050 .90811.1 .9109 .9136 .9164 .9191 .9219 .9246 .9270 .9298 .9321 .93451.2 .9369 .9392 .9416 .9439 .9463 .9483 .9506 .9526 .9546 .95651.3 .9585 .9601 .9621 .9640 .9656 .9672 .9687 .9703 .9719 .97351.4 .9747 .9762 .9774 .9786 .9798 .9810 .9821 .9833 .9841 .98531.5 .9861 .9873 .9880 .9888 .9896 .9904 .9908 .9916 .9924 .99281.6 .9936 .9940 .9943 .9947 .9951 .9955 .9959 .9963 .9967 .99711.7 .9975 .9975 .9979 .9983 .9983 .9987 .9987 .9987 .9991 .99911.8 .9991 .9995 .9995 .9995 .9995 .9999 .9999 .9999 .9999 .99991.9 .9999 .9999 1.000 1.000 1.000 1.000 1.000 1.000 1.000 1.0002. 1.000 1.000 1.000 1.000 1.000 1.000 1.000 1.000 1.000 1.000
30
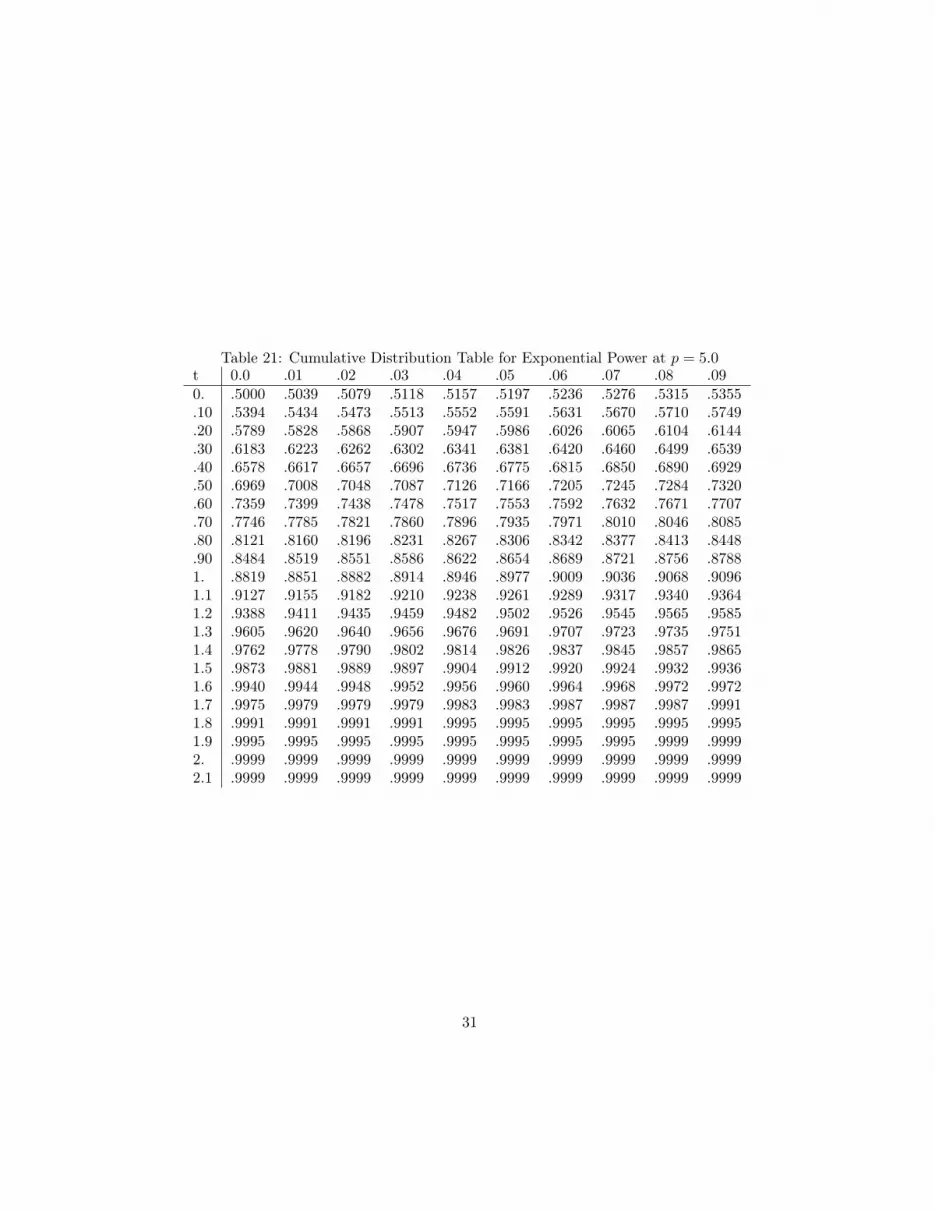
Table 21: Cumulative Distribution Table for Exponential Power at p = 5.0t 0.0 .01 .02 .03 .04 .05 .06 .07 .08 .090. .5000 .5039 .5079 .5118 .5157 .5197 .5236 .5276 .5315 .5355.10 .5394 .5434 .5473 .5513 .5552 .5591 .5631 .5670 .5710 .5749.20 .5789 .5828 .5868 .5907 .5947 .5986 .6026 .6065 .6104 .6144.30 .6183 .6223 .6262 .6302 .6341 .6381 .6420 .6460 .6499 .6539.40 .6578 .6617 .6657 .6696 .6736 .6775 .6815 .6850 .6890 .6929.50 .6969 .7008 .7048 .7087 .7126 .7166 .7205 .7245 .7284 .7320.60 .7359 .7399 .7438 .7478 .7517 .7553 .7592 .7632 .7671 .7707.70 .7746 .7785 .7821 .7860 .7896 .7935 .7971 .8010 .8046 .8085.80 .8121 .8160 .8196 .8231 .8267 .8306 .8342 .8377 .8413 .8448.90 .8484 .8519 .8551 .8586 .8622 .8654 .8689 .8721 .8756 .87881. .8819 .8851 .8882 .8914 .8946 .8977 .9009 .9036 .9068 .90961.1 .9127 .9155 .9182 .9210 .9238 .9261 .9289 .9317 .9340 .93641.2 .9388 .9411 .9435 .9459 .9482 .9502 .9526 .9545 .9565 .95851.3 .9605 .9620 .9640 .9656 .9676 .9691 .9707 .9723 .9735 .97511.4 .9762 .9778 .9790 .9802 .9814 .9826 .9837 .9845 .9857 .98651.5 .9873 .9881 .9889 .9897 .9904 .9912 .9920 .9924 .9932 .99361.6 .9940 .9944 .9948 .9952 .9956 .9960 .9964 .9968 .9972 .99721.7 .9975 .9979 .9979 .9979 .9983 .9983 .9987 .9987 .9987 .99911.8 .9991 .9991 .9991 .9991 .9995 .9995 .9995 .9995 .9995 .99951.9 .9995 .9995 .9995 .9995 .9995 .9995 .9995 .9995 .9999 .99992. .9999 .9999 .9999 .9999 .9999 .9999 .9999 .9999 .9999 .99992.1 .9999 .9999 .9999 .9999 .9999 .9999 .9999 .9999 .9999 .9999
31

Table 22: Cumulative Distribution Table for Exponential Power at p = 5.2t 0.0 .01 .02 .03 .04 .05 .06 .07 .08 .090. .5002 .5041 .5081 .5120 .5160 .5199 .5239 .5279 .5318 .5358.10 .5397 .5437 .5476 .5516 .5556 .5595 .5635 .5674 .5714 .5753.20 .5793 .5833 .5872 .5912 .5951 .5991 .6030 .6070 .6110 .6149.30 .6189 .6228 .6268 .6307 .6347 .6387 .6426 .6466 .6501 .6541.40 .6580 .6620 .6660 .6699 .6739 .6778 .6818 .6857 .6897 .6937.50 .6976 .7016 .7055 .7095 .7134 .7174 .7214 .7253 .7293 .7328.60 .7368 .7408 .7447 .7487 .7526 .7562 .7601 .7641 .7681 .7716.70 .7756 .7795 .7835 .7870 .7910 .7946 .7985 .8025 .8060 .8096.80 .8136 .8171 .8211 .8246 .8282 .8322 .8357 .8393 .8428 .8464.90 .8500 .8535 .8571 .8603 .8638 .8674 .8705 .8741 .8773 .88081. .8840 .8872 .8903 .8935 .8967 .8998 .9030 .9062 .9089 .91211.1 .9149 .9176 .9204 .9232 .9259 .9287 .9315 .9339 .9366 .93901.2 .9414 .9437 .9461 .9485 .9505 .9528 .9548 .9568 .9592 .96081.3 .9627 .9647 .9663 .9683 .9699 .9714 .9730 .9746 .9758 .97741.4 .9786 .9801 .9813 .9825 .9833 .9845 .9857 .9865 .9877 .98851.5 .9892 .9900 .9908 .9916 .9920 .9928 .9932 .9940 .9944 .99481.6 .9952 .9956 .9960 .9964 .9968 .9972 .9976 .9976 .9980 .99801.7 .9984 .9984 .9987 .9987 .9987 .9991 .9991 .9991 .9995 .99951.8 .9995 .9995 .9995 .9995 .9995 .9999 .9999 .9999 .9999 .99991.9 .9999 .9999 .9999 .9999 .9999 .9999 .9999 .9999 .9999 .9999
32

Table 23: Cumulative Distribution Table for Exponential Power at p = 5.4t 0.0 .01 .02 .03 .04 .05 .06 .07 .08 .090. .4997 .5037 .5076 .5116 .5156 .5195 .5235 .5275 .5314 .5354.10 .5394 .5433 .5473 .5513 .5552 .5592 .5632 .5671 .5711 .5751.20 .5790 .5830 .5870 .5909 .5949 .5989 .6028 .6068 .6108 .6147.30 .6187 .6227 .6266 .6306 .6346 .6385 .6425 .6465 .6504 .6544.40 .6584 .6623 .6663 .6703 .6742 .6782 .6822 .6861 .6901 .6940.50 .6980 .7020 .7059 .7099 .7139 .7178 .7218 .7254 .7293 .7333.60 .7373 .7412 .7452 .7492 .7531 .7567 .7607 .7646 .7686 .7726.70 .7761 .7801 .7841 .7876 .7916 .7956 .7991 .8031 .8067 .8107.80 .8142 .8182 .8218 .8257 .8293 .8329 .8364 .8404 .8440 .8475.90 .8511 .8547 .8582 .8618 .8650 .8686 .8721 .8753 .8789 .88201. .8856 .8888 .8920 .8951 .8983 .9015 .9046 .9078 .9106 .91381.1 .9165 .9193 .9225 .9253 .9280 .9304 .9332 .9360 .9384 .94071.2 .9435 .9459 .9479 .9503 .9526 .9546 .9570 .9590 .9610 .96291.3 .9645 .9665 .9681 .9701 .9717 .9733 .9748 .9760 .9776 .97881.4 .9804 .9816 .9828 .9840 .9848 .9859 .9867 .9879 .9887 .98951.5 .9903 .9911 .9919 .9923 .9931 .9935 .9943 .9947 .9951 .99551.6 .9959 .9963 .9967 .9971 .9971 .9974 .9978 .9978 .9982 .99821.7 .9982 .9986 .9986 .9986 .9990 .9990 .9990 .9990 .9990 .99941.8 .9994 .9994 .9994 .9994 .9994 .9994 .9994 .9994 .9994 .99941.9 .9994 .9994 .9994 .9994 .9994 .9994 .9998 .9998 .9998 .99982. .9998 .9998 .9998 .9998 .9998 .9998 .9998 .9998 .9998 .9998
33

Table 24: Cumulative Distribution Table for Exponential Power at p = 5.6t 0.0 .01 .02 .03 .04 .05 .06 .07 .08 .090. .5002 .5041 .5081 .5121 .5161 .5201 .5240 .5280 .5320 .5360.10 .5400 .5439 .5479 .5519 .5559 .5598 .5638 .5678 .5718 .5758.20 .5797 .5837 .5877 .5917 .5957 .5996 .6036 .6076 .6116 .6156.30 .6195 .6235 .6275 .6315 .6354 .6394 .6434 .6474 .6514 .6553.40 .6593 .6633 .6673 .6713 .6752 .6792 .6832 .6872 .6912 .6951.50 .6991 .7031 .7071 .7110 .7150 .7186 .7226 .7266 .7305 .7345.60 .7385 .7425 .7465 .7504 .7544 .7580 .7620 .7660 .7699 .7739.70 .7775 .7815 .7855 .7894 .7930 .7970 .8010 .8046 .8085 .8121.80 .8161 .8197 .8237 .8272 .8312 .8348 .8384 .8420 .8459 .8495.90 .8531 .8567 .8603 .8638 .8674 .8706 .8742 .8778 .8810 .88451. .8877 .8913 .8945 .8977 .9008 .9040 .9072 .9104 .9132 .91641.1 .9191 .9219 .9251 .9279 .9307 .9335 .9359 .9386 .9410 .94381.2 .9462 .9486 .9510 .9530 .9554 .9573 .9597 .9617 .9637 .96571.3 .9673 .9693 .9709 .9725 .9741 .9757 .9772 .9788 .9800 .98121.4 .9828 .9840 .9852 .9860 .9872 .9880 .9892 .9900 .9908 .99161.5 .9924 .9928 .9936 .9940 .9948 .9951 .9955 .9963 .9967 .99671.6 .9971 .9975 .9979 .9983 .9983 .9987 .9987 .9991 .9991 .99911.7 .9995 .9995 .9995 .9999 .9999 .9999 .9999 .9999 .9999 .99991.8 1.000 1.000 1.000 1.000 1.000 1.000 1.000 1.000 1.000 1.000
34

Table 25: Cumulative Distribution Table for Exponential Power at p = 6.0t 0.0 .01 .02 .03 .04 .05 .06 .07 .08 .090. .5001 .5041 .5081 .5121 .5161 .5201 .5241 .5281 .5321 .5361.10 .5401 .5441 .5481 .5521 .5561 .5601 .5641 .5681 .5721 .5761.20 .5801 .5841 .5881 .5921 .5961 .6001 .6041 .6081 .6121 .6161.30 .6201 .6241 .6281 .6321 .6361 .6401 .6441 .6481 .6521 .6557.40 .6597 .6637 .6677 .6717 .6757 .6797 .6837 .6877 .6917 .6957.50 .6996 .7036 .7076 .7116 .7156 .7196 .7236 .7276 .7316 .7356.60 .7396 .7436 .7476 .7516 .7552 .7592 .7632 .7672 .7712 .7752.70 .7792 .7828 .7868 .7908 .7948 .7984 .8024 .8064 .8100 .8140.80 .8180 .8216 .8256 .8292 .8332 .8368 .8404 .8444 .8480 .8516.90 .8552 .8592 .8628 .8664 .8700 .8732 .8768 .8804 .8840 .88721. .8908 .8940 .8976 .9007 .9039 .9071 .9103 .9135 .9163 .91951.1 .9227 .9255 .9283 .9311 .9339 .9367 .9395 .9423 .9447 .94711.2 .9495 .9519 .9543 .9567 .9591 .9611 .9631 .9651 .9671 .96911.3 .9707 .9727 .9743 .9759 .9775 .9791 .9803 .9819 .9831 .98431.4 .9855 .9867 .9875 .9887 .9895 .9903 .9911 .9919 .9927 .99351.5 .9939 .9947 .9951 .9955 .9959 .9963 .9967 .9971 .9975 .99791.6 .9979 .9983 .9983 .9987 .9987 .9991 .9991 .9991 .9995 .99951.7 .9995 .9995 .9995 .9995 .9999 .9999 .9999 .9999 .9999 .99991.8 .9999 .9999 .9999 .9999 .9999 .9999 .9999 .9999 .9999 .9999
35

Table 26: Cumulative Distribution Table for Exponential Power at p = 6.2t 0.0 .01 .02 .03 .04 .05 .06 .07 .08 .090. .4998 .5038 .5078 .5118 .5158 .5198 .5238 .5279 .5319 .5359.10 .5399 .5439 .5479 .5519 .5559 .5599 .5639 .5679 .5719 .5759.20 .5800 .5840 .5880 .5920 .5960 .6000 .6040 .6080 .6120 .6160.30 .6200 .6240 .6281 .6321 .6361 .6401 .6441 .6481 .6521 .6561.40 .6601 .6641 .6681 .6721 .6761 .6802 .6842 .6882 .6922 .6962.50 .7002 .7042 .7082 .7122 .7162 .7202 .7242 .7283 .7323 .7363.60 .7403 .7443 .7483 .7523 .7559 .7599 .7639 .7679 .7719 .7759.70 .7800 .7836 .7876 .7916 .7956 .7996 .8032 .8072 .8112 .8148.80 .8188 .8228 .8264 .8305 .8341 .8381 .8417 .8453 .8493 .8529.90 .8565 .8601 .8637 .8673 .8709 .8745 .8782 .8818 .8854 .88861. .8922 .8954 .8990 .9022 .9054 .9086 .9118 .9150 .9182 .92141.1 .9242 .9275 .9303 .9331 .9359 .9387 .9415 .9439 .9467 .94911.2 .9515 .9539 .9563 .9587 .9607 .9627 .9651 .9671 .9687 .97071.3 .9727 .9743 .9759 .9776 .9792 .9804 .9820 .9832 .9844 .98561.4 .9868 .9880 .9888 .9900 .9908 .9916 .9924 .9932 .9936 .99441.5 .9948 .9956 .9960 .9964 .9968 .9972 .9976 .9976 .9980 .99841.6 .9984 .9988 .9988 .9988 .9992 .9992 .9992 .9996 .9996 .99961.7 .9996 .9996 .9996 .9996 .9996 1.000 1.000 1.000 1.000 1.0001.8 1.000 1.000 1.000 1.000 1.000 1.000 1.000 1.000 1.000 1.000
36

Table 27: Cumulative Distribution Table for Exponential Power at p = 6.4t 0.0 .01 .02 .03 .04 .05 .06 .07 .08 .090. .5001 .5041 .5081 .5121 .5162 .5202 .5242 .5282 .5322 .5363.10 .5403 .5443 .5483 .5523 .5564 .5604 .5644 .5684 .5724 .5765.20 .5805 .5845 .5885 .5925 .5966 .6006 .6046 .6086 .6126 .6167.30 .6207 .6247 .6287 .6327 .6368 .6408 .6448 .6488 .6528 .6569.40 .6609 .6649 .6689 .6729 .6770 .6810 .6850 .6890 .6930 .6971.50 .7011 .7051 .7091 .7131 .7172 .7212 .7252 .7292 .7332 .7373.60 .7413 .7453 .7493 .7533 .7574 .7610 .7650 .7690 .7730 .7771.70 .7811 .7851 .7887 .7927 .7968 .8008 .8048 .8084 .8124 .8165.80 .8201 .8241 .8281 .8317 .8358 .8394 .8434 .8470 .8506 .8547.90 .8583 .8619 .8655 .8691 .8727 .8764 .8800 .8836 .8872 .89041. .8940 .8977 .9009 .9041 .9077 .9109 .9141 .9174 .9202 .92341.1 .9266 .9294 .9322 .9355 .9383 .9411 .9435 .9463 .9487 .95151.2 .9539 .9564 .9588 .9608 .9632 .9652 .9672 .9692 .9712 .97281.3 .9748 .9765 .9781 .9797 .9813 .9825 .9841 .9853 .9865 .98771.4 .9885 .9897 .9905 .9913 .9925 .9929 .9937 .9945 .9950 .99581.5 .9962 .9966 .9970 .9974 .9978 .9982 .9986 .9986 .9990 .99901.6 .9994 .9994 .9998 .9998 .9998 .9998 1.000 1.000 1.000 1.000
37

Table 28: Cumulative Distribution Table for Exponential Power at p = 6.6t 0.0 .01 .02 .03 .04 .05 .06 .07 .08 .090. .5000 .5040 .5081 .5121 .5161 .5201 .5242 .5282 .5322 .5367.10 .5403 .5443 .5483 .5524 .5564 .5604 .5645 .5685 .5725 .5765.20 .5806 .5846 .5886 .5927 .5967 .6007 .6048 .6088 .6128 .6168.30 .6209 .6249 .6289 .6330 .6370 .6410 .6450 .6491 .6531 .6571.40 .6612 .6652 .6692 .6732 .6773 .6813 .6853 .6894 .6934 .6974.50 .7014 .7055 .7095 .7135 .7176 .7216 .7256 .7297 .7337 .7377.60 .7417 .7458 .7498 .7538 .7579 .7615 .7655 .7695 .7736 .7776.70 .7816 .7857 .7897 .7933 .7973 .8014 .8054 .8094 .8131 .8171.80 .8211 .8247 .8288 .8324 .8364 .8404 .8441 .8477 .8517 .8554.90 .8590 .8630 .8666 .8703 .8739 .8775 .8811 .8848 .8884 .89161. .8952 .8989 .9021 .9053 .9089 .9122 .9154 .9186 .9218 .92471.1 .9279 .9307 .9339 .9367 .9396 .9424 .9452 .9476 .9504 .95291.2 .9553 .9577 .9601 .9625 .9645 .9666 .9686 .9706 .9726 .97421.3 .9762 .9778 .9794 .9811 .9823 .9839 .9851 .9863 .9875 .98871.4 .9895 .9907 .9915 .9923 .9931 .9940 .9944 .9952 .9956 .99601.5 .9968 .9972 .9976 .9976 .9980 .9984 .9988 .9988 .9992 .99921.6 .9992 .9996 .9996 .9996 .9996 1.000 1.000 1.000 1.000 1.000
38

Table 29: Cumulative Distribution Table for Exponential Power at p = 6.8t 0. 0.01 0.02 0.03 0.04 0.05 0.06 0.07 0.08 0.090. .4998 .5038 .5079 .5119 .5159 .5200 .5240 .5280 .5321 .5361.10 .5402 .5442 .5482 .5523 .5563 .5603 .5644 .5684 .5724 .5765.20 .5805 .5846 .5886 .5926 .5967 .6007 .6047 .6088 .6128 .6169.30 .6209 .6249 .6290 .6330 .6370 .6411 .6451 .6491 .6532 .6572.40 .6613 .6653 .6693 .6734 .6774 .6814 .6855 .6895 .6936 .6976.50 .7016 .7057 .7097 .7137 .7178 .7218 .7259 .7299 .7339 .7380.60 .7420 .7460 .7501 .7541 .7581 .7618 .7658 .7699 .7739 .7779.70 .7820 .7860 .7900 .7941 .7977 .8017 .8058 .8098 .8135 .8175.80 .8215 .8256 .8292 .8332 .8369 .8409 .8445 .8486 .8522 .8562.90 .8599 .8635 .8676 .8712 .8748 .8785 .8821 .8857 .8894 .89261. .8962 .8998 .9031 .9063 .9099 .9132 .9164 .9196 .9229 .92611.1 .9289 .9321 .9350 .9378 .9406 .9434 .9463 .9491 .9515 .95391.2 .9564 .9588 .9612 .9636 .9657 .9677 .9697 .9717 .9737 .97531.3 .9770 .9790 .9802 .9818 .9834 .9846 .9858 .9870 .9883 .98911.4 .9903 .9911 .9919 .9927 .9935 .9943 .9947 .9955 .9959 .99631.5 .9967 .9971 .9975 .9975 .9979 .9984 .9984 .9988 .9988 .99881.6 .9992 .9992 .9992 .9992 .9996 .9996 .9996 .9996 .9996 .9996
Table 30: Cumulative Distribution Table for Exponential Power at p = 7.0t 0. 0.01 0.02 0.03 0.04 0.05 0.06 0.07 0.08 0.090. .4997 .5037 .5078 .5118 .5159 .5199 .5240 .5280 .5320 .5361.10 .5401 .5442 .5482 .5523 .5563 .5604 .5644 .5685 .5725 .5766.20 .5806 .5846 .5887 .5927 .5968 .6008 .6049 .6089 .6130 .6170.30 .6211 .6251 .6292 .6332 .6372 .6413 .6453 .6494 .6534 .6575.40 .6615 .6656 .6696 .6737 .6777 .6818 .6858 .6898 .6939 .6979.50 .7020 .7060 .7101 .7141 .7182 .7222 .7263 .7303 .7343 .7384.60 .7424 .7465 .7505 .7546 .7586 .7627 .7667 .7704 .7744 .7785.70 .7825 .7865 .7906 .7946 .7987 .8023 .8064 .8104 .8145 .8181.80 .8221 .8262 .8302 .8339 .8379 .8416 .8456 .8493 .8533 .8569.90 .8610 .8646 .8683 .8719 .8760 .8796 .8832 .8869 .8901 .89381. .8974 .9010 .9043 .9079 .9112 .9144 .9176 .9209 .9241 .92731.1 .9306 .9334 .9362 .9395 .9423 .9451 .9476 .9504 .9528 .95571.2 .9581 .9605 .9625 .9650 .9670 .9690 .9710 .9731 .9751 .97671.3 .9783 .9799 .9816 .9832 .9844 .9856 .9868 .9880 .9892 .99011.4 .9909 .9921 .9929 .9933 .9941 .9949 .9953 .9957 .9961 .99651.5 .9969 .9973 .9977 .9981 .9981 .9986 .9986 .9986 .9990 .99901.6 .9990 .9990 .9994 .9994 .9994 .9994 .9994 .9994 .9994 .9994
39

Table 31: Cumulative Distribution Table for Exponential Power at p = 7.2t 0. 0.01 0.02 0.03 0.04 0.05 0.06 0.07 0.08 0.090. .5001 .5041 .5082 .5122 .5163 .5204 .5244 .5285 .5325 .5366.10 .5407 .5447 .5488 .5528 .5569 .5610 .5650 .5691 .5731 .5772.20 .5812 .5853 .5894 .5934 .5975 .6015 .6056 .6097 .6137 .6178.30 .6218 .6259 .6300 .6340 .6381 .6421 .6462 .6503 .6543 .6584.40 .6624 .6665 .6705 .6746 .6787 .6827 .6868 .6908 .6949 .6990.50 .7030 .7071 .7111 .7152 .7193 .7233 .7274 .7314 .7355 .7395.60 .7436 .7477 .7517 .7558 .7598 .7639 .7680 .7720 .7761 .7797.70 .7838 .7879 .7919 .7960 .8000 .8041 .8081 .8118 .8159 .8199.80 .8240 .8276 .8317 .8357 .8394 .8435 .8471 .8512 .8548 .8589.90 .8625 .8666 .8702 .8739 .8776 .8812 .8853 .8885 .8922 .89581. .8995 .9031 .9064 .9100 .9133 .9165 .9198 .9230 .9263 .92951.1 .9328 .9356 .9388 .9417 .9445 .9474 .9502 .9526 .9555 .95791.2 .9604 .9628 .9652 .9673 .9693 .9713 .9733 .9754 .9774 .97901.3 .9807 .9823 .9839 .9851 .9863 .9876 .9888 .9900 .9912 .99201.4 .9928 .9936 .9945 .9953 .9957 .9965 .9969 .9973 .9977 .99811.5 .9985 .9985 .9989 .9993 .9993 .9997 .9997 .9997 .9997 1.0001.6 1.000 1.000 1.000 1.000 1.000 1.000 1.000 1.000 1.000 1.001
Table 32: Cumulative Distribution Table for Exponential Power at p = 7.4t 0. 0.01 0.02 0.03 0.04 0.05 0.06 0.07 0.08 0.090. .5004 .5044 .5085 .5126 .5166 .5207 .5248 .5288 .5329 .5370.10 .5410 .5451 .5492 .5532 .5573 .5614 .5655 .5695 .5736 .5777.20 .5817 .5858 .5899 .5939 .5980 .6021 .6061 .6102 .6143 .6183.30 .6224 .6265 .6305 .6346 .6387 .6427 .6468 .6509 .6549 .6590.40 .6631 .6672 .6708 .6749 .6789 .6830 .6871 .6912 .6952 .6993.50 .7034 .7074 .7115 .7156 .7196 .7237 .7278 .7318 .7359 .7400.60 .7440 .7481 .7522 .7562 .7603 .7644 .7684 .7725 .7766 .7806.70 .7847 .7888 .7924 .7965 .8006 .8047 .8087 .8128 .8169 .8205.80 .8246 .8287 .8323 .8364 .8404 .8441 .8482 .8522 .8559 .8600.90 .8636 .8673 .8714 .8750 .8787 .8823 .8860 .8897 .8933 .89701. .9007 .9043 .9076 .9112 .9145 .9177 .9214 .9247 .9279 .93081.1 .9340 .9373 .9401 .9430 .9458 .9487 .9515 .9544 .9568 .95921.2 .9617 .9641 .9666 .9686 .9710 .9731 .9747 .9767 .9784 .98041.3 .9820 .9832 .9849 .9861 .9877 .9889 .9897 .9910 .9918 .99301.4 .9938 .9946 .9950 .9958 .9963 .9967 .9975 .9979 .9983 .99831.5 .9987 .9991 .9991 .9995 .9995 .9995 .9999 .9999 .9999 .99991.6 .9999 1.000 1.000 1.000 1.000 1.000 1.000 1.000 1.000 1.000
40

Table 33: Cumulative Distribution Table for Exponential Power at p = 7.6t 0. 0.01 0.02 0.03 0.04 0.05 0.06 0.07 0.08 0.090. .5001 .5042 .5083 .5124 .5164 .5205 .5246 .5287 .5327 .5368.10 .5409 .5450 .5490 .5531 .5572 .5613 .5653 .5694 .5735 .5776.20 .5816 .5857 .5898 .5939 .5979 .6020 .6061 .6102 .6143 .6183.30 .6224 .6265 .6306 .6346 .6387 .6428 .6469 .6509 .6550 .6591.40 .6632 .6672 .6713 .6754 .6795 .6835 .6876 .6917 .6958 .6998.50 .7039 .7080 .7121 .7162 .7202 .7243 .7284 .7325 .7365 .7402.60 .7443 .7484 .7524 .7565 .7606 .7647 .7687 .7728 .7769 .7810.70 .7850 .7891 .7932 .7973 .8013 .8050 .8091 .8132 .8172 .8213.80 .8250 .8291 .8331 .8372 .8409 .8450 .8490 .8527 .8568 .8604.90 .8645 .8682 .8719 .8759 .8796 .8833 .8869 .8906 .8943 .89791. .9016 .9053 .9085 .9122 .9155 .9191 .9224 .9257 .9289 .93221.1 .9350 .9383 .9411 .9440 .9473 .9497 .9526 .9554 .9579 .96031.2 .9628 .9652 .9676 .9697 .9717 .9738 .9758 .9778 .9795 .98111.3 .9827 .9844 .9856 .9872 .9884 .9892 .9905 .9917 .9925 .99331.4 .9941 .9950 .9954 .9962 .9966 .9970 .9974 .9978 .9982 .99861.5 .9986 .9990 .9990 .9994 .9994 .9994 .9994 .9998 .9998 .99981.6 .9998 .9998 .9998 .9998 .9998 .9998 .9998 .9998 .9998 .9998
Table 34: Cumulative Distribution Table for Exponential Power at p = 7.8t 0. 0.01 0.02 0.03 0.04 0.05 0.06 0.07 0.08 0.090. .5001 .5042 .5083 .5124 .5165 .5206 .5246 .5287 .5328 .5369.10 .5410 .5451 .5492 .5532 .5573 .5614 .5655 .5696 .5737 .5778.20 .5818 .5859 .5900 .5941 .5982 .6023 .6064 .6104 .6145 .6186.30 .6227 .6268 .6309 .6350 .6391 .6431 .6472 .6513 .6554 .6595.40 .6636 .6677 .6717 .6758 .6799 .6840 .6881 .6922 .6963 .7003.50 .7044 .7085 .7126 .7167 .7208 .7249 .7289 .7330 .7371 .7412.60 .7453 .7494 .7535 .7575 .7616 .7657 .7698 .7739 .7776 .7817.70 .7857 .7898 .7939 .7980 .8021 .8062 .8103 .8143 .8180 .8221.80 .8262 .8303 .8340 .8380 .8421 .8462 .8499 .8540 .8577 .8617.90 .8654 .8695 .8732 .8769 .8809 .8846 .8883 .8920 .8957 .89931. .9030 .9067 .9100 .9136 .9169 .9206 .9238 .9271 .9304 .93371.1 .9369 .9398 .9430 .9459 .9488 .9516 .9541 .9569 .9594 .96231.2 .9647 .9667 .9692 .9712 .9733 .9753 .9774 .9794 .9810 .98271.3 .9843 .9855 .9872 .9884 .9896 .9904 .9917 .9925 .9937 .99411.4 .9949 .9958 .9962 .9970 .9974 .9978 .9982 .9986 .9986 .99901.5 .9990 .9994 .9994 .9998 .9998 .9998 .9998 .9998 1.000 1.0001.6 1.000 1.000 1.000 1.000 1.000 1.000 1.000 1.000 1.000 1.000
41

Table 35: Cumulative Distribution Table for Exponential Power at p = 8.0t 0. 0.01 0.02 0.03 0.04 0.05 0.06 0.07 0.08 0.090. .4999 .5040 .5081 .5122 .5163 .5203 .5244 .5285 .5326 .5367.10 .5408 .5449 .5490 .5531 .5572 .5613 .5654 .5695 .5736 .5777.20 .5818 .5859 .5899 .5940 .5981 .6022 .6063 .6104 .6145 .6186.30 .6227 .6268 .6309 .6350 .6391 .6432 .6473 .6514 .6554 .6595.40 .6636 .6677 .6718 .6759 .6800 .6841 .6882 .6923 .6964 .7005.50 .7046 .7087 .7128 .7169 .7210 .7250 .7291 .7332 .7373 .7414.60 .7455 .7496 .7537 .7578 .7619 .7660 .7701 .7742 .7783 .7824.70 .7865 .7906 .7946 .7983 .8024 .8065 .8106 .8147 .8188 .8229.80 .8266 .8307 .8348 .8389 .8425 .8466 .8507 .8544 .8585 .8622.90 .8663 .8700 .8741 .8778 .8814 .8855 .8892 .8929 .8966 .90031. .9040 .9076 .9109 .9146 .9179 .9216 .9248 .9281 .9314 .93471.1 .9379 .9408 .9441 .9469 .9498 .9527 .9555 .9580 .9609 .96331.2 .9658 .9678 .9703 .9723 .9744 .9764 .9785 .9801 .9817 .98341.3 .9850 .9867 .9879 .9891 .9903 .9912 .9924 .9932 .9940 .99481.4 .9957 .9961 .9965 .9973 .9977 .9981 .9981 .9985 .9989 .99891.5 .9993 .9993 .9993 .9998 .9998 .9998 .9998 .9998 .9998 .99981.6 .9998 .9998 .9998 1.000 1.000 1.000 1.000 1.000 1.000 1.000
Table 36: Cumulative Distribution Table for Exponential Power at p = 8.2t 0. 0.01 0.02 0.03 0.04 0.05 0.06 0.07 0.08 0.090. .5000 .5041 .5082 .5123 .5164 .5205 .5246 .5287 .5328 .5370.10 .5411 .5452 .5493 .5534 .5575 .5616 .5657 .5698 .5739 .5780.20 .5821 .5862 .5903 .5944 .5985 .6026 .6067 .6108 .6149 .6190.30 .6231 .6272 .6313 .6354 .6395 .6436 .6477 .6518 .6559 .6600.40 .6641 .6682 .6723 .6764 .6805 .6846 .6887 .6928 .6969 .7010.50 .7051 .7092 .7133 .7174 .7215 .7256 .7297 .7338 .7379 .7421.60 .7462 .7498 .7539 .7580 .7622 .7663 .7704 .7745 .7786 .7827.70 .7868 .7909 .7950 .7991 .8032 .8073 .8114 .8151 .8192 .8233.80 .8274 .8315 .8352 .8393 .8434 .8475 .8512 .8553 .8594 .8631.90 .8672 .8709 .8750 .8786 .8823 .8864 .8901 .8938 .8975 .90121. .9049 .9086 .9119 .9156 .9188 .9225 .9258 .9291 .9324 .93571.1 .9389 .9418 .9451 .9480 .9508 .9537 .9566 .9590 .9619 .96441.2 .9668 .9689 .9714 .9734 .9755 .9775 .9796 .9812 .9828 .98451.3 .9857 .9874 .9886 .9898 .9910 .9919 .9927 .9935 .9943 .99511.4 .9960 .9964 .9968 .9972 .9976 .9980 .9984 .9984 .9988 .99881.5 .9992 .9992 .9992 .9997 .9997 .9997 .9997 .9997 .9997 .99971.6 .9997 .9997 .9997 .9997 .9997 .9997 .9997 .9997 .9997 .9997
42

Table 37: Cumulative Distribution Table for Exponential Power at p = 8.4t 0. 0.01 0.02 0.03 0.04 0.05 0.06 0.07 0.08 0.090. .5000 .5041 .5082 .5124 .5165 .5206 .5247 .5288 .5329 .5370.10 .5411 .5453 .5494 .5535 .5576 .5617 .5658 .5699 .5740 .5781.20 .5823 .5864 .5905 .5946 .5987 .6028 .6069 .6110 .6152 .6193.30 .6234 .6275 .6316 .6357 .6398 .6439 .6481 .6522 .6563 .6604.40 .6645 .6686 .6727 .6768 .6809 .6851 .6892 .6933 .6974 .7015.50 .7056 .7097 .7138 .7180 .7221 .7262 .7303 .7344 .7385 .7426.60 .7467 .7509 .7550 .7591 .7632 .7673 .7714 .7755 .7796 .7837.70 .7879 .7920 .7961 .8002 .8039 .8080 .8121 .8162 .8203 .8245.80 .8286 .8323 .8364 .8405 .8446 .8483 .8524 .8565 .8602 .8643.90 .8685 .8722 .8759 .8800 .8837 .8878 .8915 .8952 .8989 .90261. .9063 .9100 .9133 .9170 .9207 .9240 .9273 .9310 .9342 .93711.1 .9404 .9437 .9466 .9499 .9528 .9552 .9581 .9610 .9634 .96591.2 .9684 .9708 .9729 .9750 .9770 .9791 .9807 .9828 .9844 .98561.3 .9873 .9885 .9898 .9910 .9922 .9930 .9939 .9947 .9955 .99631.4 .9967 .9972 .9976 .9980 .9984 .9988 .9992 .9992 .9996 .99961.5 .9996 .9996 1.000 1.000 1.000 1.000 1.000 1.000 1.000 1.0001.6 1.000 1.000 1.000 1.000 1.000 1.000 1.000 1.000 1.000 1.000
Table 38: Cumulative Distribution Table for Exponential Power at p = 8.6t 0. 0.01 0.02 0.03 0.04 0.05 0.06 0.07 0.08 0.090. .5002 .5043 .5084 .5125 .5166 .5208 .5249 .5290 .5331 .5372.10 .5414 .5455 .5496 .5537 .5578 .5620 .5661 .5702 .5743 .5784.20 .5826 .5867 .5908 .5949 .5990 .6032 .6073 .6114 .6155 .6196.30 .6238 .6279 .6320 .6361 .6402 .6444 .6485 .6526 .6567 .6608.40 .6650 .6691 .6732 .6773 .6814 .6856 .6897 .6938 .6979 .7020.50 .7062 .7103 .7144 .7185 .7226 .7268 .7309 .7350 .7391 .7432.60 .7474 .7515 .7552 .7593 .7634 .7676 .7717 .7758 .7799 .7840.70 .7882 .7923 .7964 .8005 .8046 .8088 .8129 .8170 .8211 .8248.80 .8289 .8331 .8372 .8413 .8450 .8491 .8533 .8570 .8611 .8652.90 .8689 .8730 .8767 .8809 .8846 .8883 .8924 .8961 .8998 .90351. .9072 .9109 .9142 .9179 .9216 .9249 .9282 .9319 .9352 .93851.1 .9414 .9447 .9476 .9509 .9538 .9567 .9591 .9620 .9645 .96701.2 .9694 .9719 .9740 .9760 .9781 .9801 .9818 .9834 .9851 .98671.3 .9880 .9892 .9904 .9917 .9925 .9937 .9946 .9954 .9958 .99661.4 .9970 .9975 .9979 .9983 .9987 .9987 .9991 .9991 .9995 .99951.5 .9995 .9999 .9999 .9999 .9999 .9999 .9999 .9999 .9999 .9999
43

Table 39: Cumulative Distribution Table for Exponential Power at p = 8.8t 0. 0.01 0.02 0.03 0.04 0.05 0.06 0.07 0.08 0.090. .5001 .5043 .5084 .5125 .5167 .5208 .5249 .5291 .5332 .5373.10 .5414 .5456 .5497 .5538 .5580 .5621 .5662 .5704 .5745 .5786.20 .5827 .5869 .5910 .5951 .5993 .6034 .6075 .6117 .6158 .6199.30 .6240 .6282 .6323 .6364 .6406 .6447 .6488 .6530 .6571 .6612.40 .6653 .6695 .6736 .6777 .6819 .6860 .6901 .6943 .6984 .7025.50 .7066 .7108 .7149 .7190 .7232 .7273 .7314 .7356 .7397 .7438.60 .7479 .7521 .7562 .7603 .7645 .7686 .7727 .7769 .7810 .7851.70 .7892 .7934 .7975 .8016 .8058 .8099 .8136 .8177 .8219 .8260.80 .8301 .8343 .8384 .8421 .8462 .8504 .8545 .8582 .8623 .8665.90 .8702 .8743 .8780 .8822 .8859 .8896 .8937 .8974 .9012 .90491. .9086 .9123 .9160 .9193 .9231 .9264 .9301 .9334 .9367 .94001.1 .9433 .9462 .9495 .9524 .9553 .9582 .9611 .9635 .9660 .96851.2 .9710 .9734 .9755 .9776 .9796 .9817 .9834 .9850 .9867 .98791.3 .9895 .9908 .9920 .9929 .9937 .9949 .9957 .9962 .9970 .99741.4 .9978 .9982 .9986 .9990 .9995 .9995 .9999 .9999 .9999 1.0001.5 1.000 1.000 1.000 1.000 1.000 1.000 1.000 1.000 1.000 1.000
Table 40: Cumulative Distribution Table for Exponential Power at p = 9.0t 0. 0.01 0.02 0.03 0.04 0.05 0.06 0.07 0.08 0.090. .5003 .5044 .5086 .5127 .5168 .5210 .5251 .5293 .5334 .5375.10 .5417 .5458 .5499 .5541 .5582 .5624 .5665 .5706 .5748 .5789.20 .5830 .5872 .5913 .5955 .5996 .6037 .6079 .6120 .6161 .6203.30 .6244 .6286 .6327 .6368 .6410 .6451 .6493 .6534 .6575 .6617.40 .6658 .6699 .6741 .6782 .6824 .6865 .6906 .6948 .6989 .7030.50 .7072 .7113 .7155 .7196 .7237 .7279 .7320 .7362 .7403 .7444.60 .7486 .7527 .7568 .7610 .7651 .7693 .7734 .7775 .7817 .7858.70 .7899 .7937 .7978 .8019 .8061 .8102 .8144 .8185 .8226 .8268.80 .8309 .8346 .8388 .8429 .8470 .8512 .8549 .8590 .8632 .8669.90 .8710 .8752 .8789 .8830 .8868 .8905 .8946 .8984 .9021 .90581. .9095 .9133 .9170 .9203 .9240 .9277 .9310 .9344 .9377 .94101.1 .9443 .9476 .9505 .9534 .9563 .9592 .9621 .9646 .9671 .96951.2 .9720 .9745 .9766 .9786 .9807 .9824 .9844 .9857 .9873 .98901.3 .9902 .9915 .9927 .9935 .9944 .9952 .9960 .9968 .9973 .99771.4 .9981 .9985 .9989 .9993 .9993 .9997 .9997 1.000 1.000 1.000
44

Table 41: Cumulative Distribution Table for Exponential Power at p = 9.2t 0. 0.01 0.02 0.03 0.04 0.05 0.06 0.07 0.08 0.090. .4998 .5039 .5081 .5122 .5163 .5205 .5246 .5288 .5329 .5371.10 .5412 .5454 .5495 .5536 .5578 .5619 .5661 .5702 .5744 .5785.20 .5826 .5868 .5909 .5951 .5992 .6034 .6075 .6117 .6158 .6199.30 .6241 .6282 .6324 .6365 .6407 .6448 .6490 .6531 .6572 .6614.40 .6655 .6697 .6738 .6780 .6821 .6862 .6904 .6945 .6987 .7028.50 .7070 .7111 .7153 .7194 .7235 .7277 .7318 .7360 .7401 .7443.60 .7484 .7526 .7567 .7608 .7650 .7691 .7733 .7774 .7816 .7857.70 .7898 .7940 .7981 .8023 .8064 .8106 .8147 .8189 .8230 .8271.80 .8309 .8350 .8392 .8433 .8474 .8512 .8553 .8595 .8636 .8673.90 .8715 .8752 .8794 .8831 .8872 .8910 .8951 .8988 .9026 .90631. .9100 .9138 .9175 .9212 .9245 .9283 .9316 .9349 .9382 .94151.1 .9448 .9481 .9510 .9539 .9568 .9598 .9627 .9651 .9680 .97051.2 .9726 .9751 .9772 .9792 .9813 .9830 .9846 .9863 .9879 .98921.3 .9904 .9917 .9929 .9937 .9946 .9954 .9962 .9966 .9970 .99791.4 .9983 .9983 .9987 .9991 .9991 .9995 .9995 .9995 .9995 .99991.5 .9999 .9999 .9999 .9999 .9999 .9999 .9999 .9999 .9999 .99991.6 .9999 .9999 .9999 .9999 .9999 .9999 .9999 .9999 .9999 .9999
Table 42: Cumulative Distribution Table for Exponential Power at p = 9.4t 0. 0.01 0.02 0.03 0.04 0.05 0.06 0.07 0.08 0.090. .4999 .5041 .5082 .5124 .5165 .5207 .5248 .5290 .5331 .5373.10 .5414 .5456 .5497 .5539 .5580 .5622 .5663 .5705 .5746 .5788.20 .5829 .5871 .5912 .5954 .5995 .6037 .6079 .6120 .6162 .6203.30 .6245 .6286 .6328 .6369 .6411 .6452 .6494 .6535 .6577 .6618.40 .6660 .6701 .6743 .6784 .6826 .6867 .6909 .6950 .6992 .7033.50 .7075 .7117 .7158 .7200 .7241 .7283 .7324 .7366 .7407 .7449.60 .7490 .7532 .7573 .7615 .7656 .7698 .7739 .7781 .7822 .7864.70 .7905 .7947 .7988 .8030 .8071 .8113 .8155 .8196 .8233 .8275.80 .8316 .8358 .8399 .8441 .8483 .8520 .8561 .8603 .8644 .8682.90 .8723 .8761 .8802 .8840 .8881 .8918 .8960 .8997 .9035 .90721. .9109 .9147 .9184 .9222 .9255 .9292 .9325 .9363 .9396 .94291.1 .9458 .9491 .9521 .9554 .9583 .9612 .9637 .9666 .9691 .97161.2 .9736 .9761 .9782 .9803 .9819 .9840 .9857 .9873 .9886 .98981.3 .9911 .9923 .9936 .9944 .9952 .9961 .9965 .9973 .9977 .99811.4 .9986 .9986 .9990 .9994 .9994 .9994 .9998 .9998 .9998 .9998
45

Table 43: Cumulative Distribution Table for Exponential Power at p = 9.6t 0. 0.01 0.02 0.03 0.04 0.05 0.06 0.07 0.08 0.090. .4998 .5039 .5081 .5123 .5164 .5206 .5247 .5289 .5331 .5372.10 .5414 .5455 .5497 .5538 .5580 .5622 .5663 .5705 .5746 .5788.20 .5830 .5871 .5913 .5954 .5996 .6037 .6079 .6121 .6162 .6204.30 .6245 .6287 .6328 .6370 .6412 .6453 .6495 .6536 .6578 .6620.40 .6661 .6703 .6744 .6786 .6827 .6869 .6911 .6952 .6994 .7035.50 .7077 .7118 .7160 .7202 .7243 .7285 .7326 .7368 .7410 .7451.60 .7493 .7534 .7576 .7617 .7659 .7701 .7742 .7784 .7825 .7867.70 .7909 .7950 .7992 .8033 .8075 .8112 .8154 .8195 .8237 .8279.80 .8320 .8362 .8403 .8445 .8482 .8524 .8565 .8607 .8644 .8686.90 .8728 .8765 .8807 .8844 .8886 .8923 .8965 .9002 .9039 .90771. .9114 .9152 .9189 .9227 .9264 .9297 .9335 .9368 .9401 .94351.1 .9468 .9497 .9530 .9559 .9588 .9617 .9642 .9672 .9696 .97211.2 .9742 .9767 .9788 .9809 .9825 .9842 .9859 .9875 .9892 .99041.3 .9917 .9925 .9938 .9946 .9954 .9958 .9967 .9971 .9975 .99791.4 .9983 .9983 .9988 .9988 .9992 .9992 .9992 .9992 .9996 .99961.5 .9996 .9996 .9996 .9996 .9996 .9996 .9996 .9996 .9996 .9996
46

Table 44: Cumulative Distribution Table for Exponential Power at p = 9.8t 0. 0.01 0.02 0.03 0.04 0.05 0.06 0.07 0.08 0.090. .5002 .5043 .5085 .5127 .5168 .5210 .5252 .5293 .5335 .5377.10 .5418 .5460 .5502 .5543 .5585 .5627 .5668 .5710 .5752 .5794.20 .5835 .5877 .5919 .5960 .6019 .6044 .6085 .6127 .6169 .6210.30 .6252 .6294 .6335 .6377 .6419 .6460 .6502 .6544 .6585 .6627.40 .6669 .6710 .6752 .6794 .6836 .6877 .6919 .6961 .7002 .7044.50 .7086 .7127 .7169 .7211 .7252 .7294 .7336 .7377 .7419 .7461.60 .7502 .7544 .7586 .7627 .7669 .7711 .7752 .7794 .7836 .7878.70 .7919 .7961 .8003 .8044 .8082 .8123 .8165 .8207 .8248 .8290.80 .8332 .8374 .8415 .8457 .8494 .8536 .8578 .8619 .8661 .8699.90 .8740 .8778 .8819 .8861 .8899 .8940 .8978 .9015 .9053 .90951. .9132 .9170 .9207 .9240 .9278 .9315 .9349 .9382 .9416 .94491.1 .9482 .9516 .9545 .9574 .9603 .9632 .9661 .9686 .9711 .97361.2 .9761 .9782 .9803 .9824 .9841 .9857 .9874 .9891 .9903 .99161.3 .9928 .9937 .9949 .9957 .9966 .9970 .9974 .9982 .9987 .99871.4 .9991 .9995 .9995 .9999 .9999 .9999 .9999 .9999 .9999 1.000
Table 45: Cumulative Distribution Table for Exponential Power at p = 10.0t 0. 0.01 0.02 0.03 0.04 0.05 0.06 0.07 0.08 0.090. .5000 .5042 .5084 .5126 .5167 .5209 .5251 .5293 .5334 .5376.10 .5418 .5460 .5501 .5543 .5585 .5627 .5668 .5710 .5752 .5794.20 .5835 .5877 .5919 .5960 .6002 .6044 .6086 .6127 .6169 .6211.30 .6253 .6294 .6336 .6378 .6420 .6461 .6503 .6545 .6587 .6628.40 .6670 .6712 .6754 .6795 .6837 .6879 .6920 .6962 .7004 .7046.50 .7087 .7129 .7171 .7213 .7254 .7296 .7338 .7380 .7421 .7501.60 .7505 .7547 .7588 .7630 .7672 .7714 .7755 .7797 .7839 .7881.70 .7922 .7960 .8002 .8043 .8085 .8127 .8169 .8210 .8252 .8294.80 .8335 .8377 .8419 .8461 .8498 .8540 .8582 .8623 .8661 .8703.90 .8745 .8782 .8824 .8866 .8903 .8945 .8982 .9020 .9062 .90991. .9137 .9174 .9212 .9250 .9283 .9321 .9354 .9387 .9425 .94581.1 .9488 .9521 .9550 .9584 .9613 .9638 .9667 .9692 .9717 .97421.2 .9767 .9788 .9809 .9830 .9846 .9863 .9880 .9892 .9909 .99221.3 .9930 .9942 .9951 .9959 .9963 .9972 .9976 .9980 .9984 .99881.4 .9988 .9993 .9993 .9993 .9997 .9997 .9997 .9997 .9997 .99971.5 .9997 .9997 .9997 .9997 .9997 .9997 .9997 .9997 .9997 .9997
47


![KTDT [edited]](https://img.pdfslide.net/doc/110x75/6346a026a24e3c680f0cdf46/ktdt-edited.jpg)


