Embed Size (px)
Citation preview
Since 1994 Inter-University Consortium
Connecting Universities, the Labour Market and Professionals
S t b 2011
ALMALAUREA WORKING PAPERS no. 18
AlmaLaurea Working Papers – ISSN 2239-9453
September 2011
Education, Innovation and Labor: Obstacles to Egypt’s Competitiveness?
by
Reda MalakEgyptian Centre for Economic Studies
This paper can be downloaded at:
AlmaLaurea Working Papers seriesg phttp://www.almalaurea.it/universita/pubblicazioni/wp
REsearch Papers in Economics (RePEC)
Also available at:
The AlmaLaurea working paper series is designed to make available to a wide readership selectedworks by AlmaLaurea staff or by outside, generally available in English or Italian. The series focuses on thestudy of the relationship between educational systems, society and economy, the quality of educationalprocess, the demand and supply of education, the human capital accumulation, the structure and working ofthe labour markets, the assessment of educational policies.Comments on this series are welcome and should be sent to [email protected].
AlmaLaurea is a public consortium of Italian universities which, with the support of the Ministry ofEducation, meets the information needs of graduates, universities and the business community. AlmaLaureahas been set up in 1994 following an initiative of the Statistical Observatory of the University of Bologna. Itsupplies reliable and timely data on the effectiveness and efficiency of the higher education system tomember universities’ governing bodies, assessment units and committees responsible for teaching activitiesand career guidance.
AlmaLaurea:
facilitates and improves the hiring of young graduates in the labour markets both at the national andinternational level;
simplifies companies' search for personnel reducing the gap between the demand for and supply of simplifies companies search for personnel, reducing the gap between the demand for and supply of qualified labour (www.almalaurea.it/en/aziende/);
makes available online more than 1.5 million curricula (in Italian and English) of graduates, including those with a pluriannual work experience (www.almalaurea.it/en/);
ensures the optimization of human resources utilization through a steady updating of data on the careers of students holding a degree (www.almalaurea.it/en/lau/).
Each year AlmaLaurea plans two main conferences (www.almalaurea.it/en/informa/news) in which the results of the annual surveys on Graduates’ Employment Conditions and Graduates’ Profile are presented.
___________________________________________________________________________________________
AlmaLaurea Inter-University Consortium | viale Masini 36 | 40126 Bologna (Italy)Website: www.almalaurea.it | E-mail: [email protected]
___________________________________________________________________________________________
The opinions expressed in the papers issued in this series do not necessarily reflect the position of AlmaLaurea
© AlmaLaurea 2011Applications for permission to reproduce or translate all or part of this material should be made to:AlmaLaurea Inter-University Consortiumemail: [email protected] | fax +39 051 6088988 | phone +39 051 6088919
1
International Conference on
“Human Capital and Employment in the European and Mediterranean Area”
Bologna, 10-11 March 2011
Education, Innovation and Labor: Obstacles to Egypt’s Competitiveness?
by
Reda Malak
Abstract
Using panel data regressions for twenty-five countries, including Egypt, for the period 2005-2011, the current study
investigates how labor, education and innovation affect Egypt’s competitiveness and in turn affect real economic
growth. Results indicate that labor, education and innovation affect greatly competitiveness and real GDP growth
and that investing in those dimensions is key for greater economic growth. Further using Egypt’s specific time series
for the period 1980-1999, results indicate the importance of raising both the efficiency and level of expenditure on
education; highlight the necessity to raise the innovation capacity of the country and stress upon the importance of
youth employment and its positive impact on real GDP growth. Assuming that Egypt is able to improve its
education, innovation and labor indicators that underlie the global competitiveness score by five percent, this will in
turn lead to greater real GDP growth, estimated at 9.9 percent. The results emphasize the need to improve the quality
and efficiency of the educational system; to invest heavily in the creation of employment, especially for the youth,
and to invest in improving innovation capacity towards higher output growth and welfare.
1. Introduction
In today’s globalised world, a country’s success is often measured by its competitiveness.
Competitiveness, in turn, is closely related to the degree by which a country can simultaneously
increase the real incomes of its citizens and produce internationally demanded goods and
services in accordance with free and fair market conditions.
Over the last few years, it was repeatedly mentioned in Egypt’s national competitiveness reports
that Egypt performs poorly in terms of global competitiveness rank as per the World Economic
Forum in pillars such as macroeconomic stability and those related to human capital
Egyptian Centre for Economic Studies (ECES)
2
development, including education, innovation and labor. The current study has several
objectives. On one hand, it aims to investigate and quantify how “education, innovation and
labor” impact competitiveness and in turn real economic growth for a set of 25 countries
(including Egypt) in the same stage of development, namely factor driven economies in
transition to efficiency driven. On the other hand, the study investigates the relationship between
competitiveness and economic growth, specifically in the Egyptian case. Last but not least, it
projects the potential growth that can be attained if education, innovation and labor indicators are
to improve.
The study is organized as follows; in section 2 we present a brief on competitiveness and its
measurement as per the World Economic Forum; section 3 provides a snapshot on Egypt’s
competitiveness; section 4 presents Egypt’s key education, innovation and labor indicators;
section 5 presents the research design; section 6 discusses the data used and methodology;
section 7 provides key findings, while section 8 concludes with summary of findings and
recommendations.
2. Background note on Competitiveness
The World Economic Forum (WEF) defines competitiveness as the set of institutions, policies,
and factors that determine the level of productivity for a country. Generally speaking, greater
productivity levels result in higher levels of income, and higher rates of returns on investments.
Because the rates of return are the fundamental determinants of the growth rates of an economy,
a more competitive economy is one that is likely to grow faster over the medium to long run. As
stated in The Global Competitiveness Report 2007-2008, the concept of competitiveness thus
involves static and dynamic components: although the productivity of a country clearly
determines its ability to sustain a high level of income, it is also one of the central determinants
of the returns on investment, which is one of the key factors that explain an economy’s growth
potential.
The WEF has been studying competitiveness of nations since 1979. The methodology used to
assess national competitiveness evolved over time to take into account the latest thinking on
factors driving competitiveness and growth. Since year 2005/2006, the WEF introduced the
Global Competitiveness Index (GCI), a highly comprehensive index for measuring national
competitiveness that takes into account both microeconomic and macroeconomic foundations of
national competitiveness. For years 2005/06 and 2006/07, the GCI was composed of nine pillars
(institutions, infrastructure, macroeconomy, health and primary education, higher education and
training, market efficiency, technological readiness, and business sophistication and innovation).
Starting from the Global Competitiveness Report of 2007/2008, some refinements were
introduced to the GCI, of which is the number of pillars. It was increased to 12 by breaking down
the market efficiency pillar to its three sub-components (goods, labor, and financial markets),
providing demonstration of the various aspects of market efficiency, and also by adding market
size as one pillar as opposed to being a sub-component of the goods market pillar.
The GCI is composed of 113 variables, of which 79 come from the Executive Opinion Survey
(EOS) carried out annually by the WEF. Those form part of the 12 pillars that make up the GCI.
The pillars are grouped to calculate three sub-indexes as shown in figure (1) below:
3
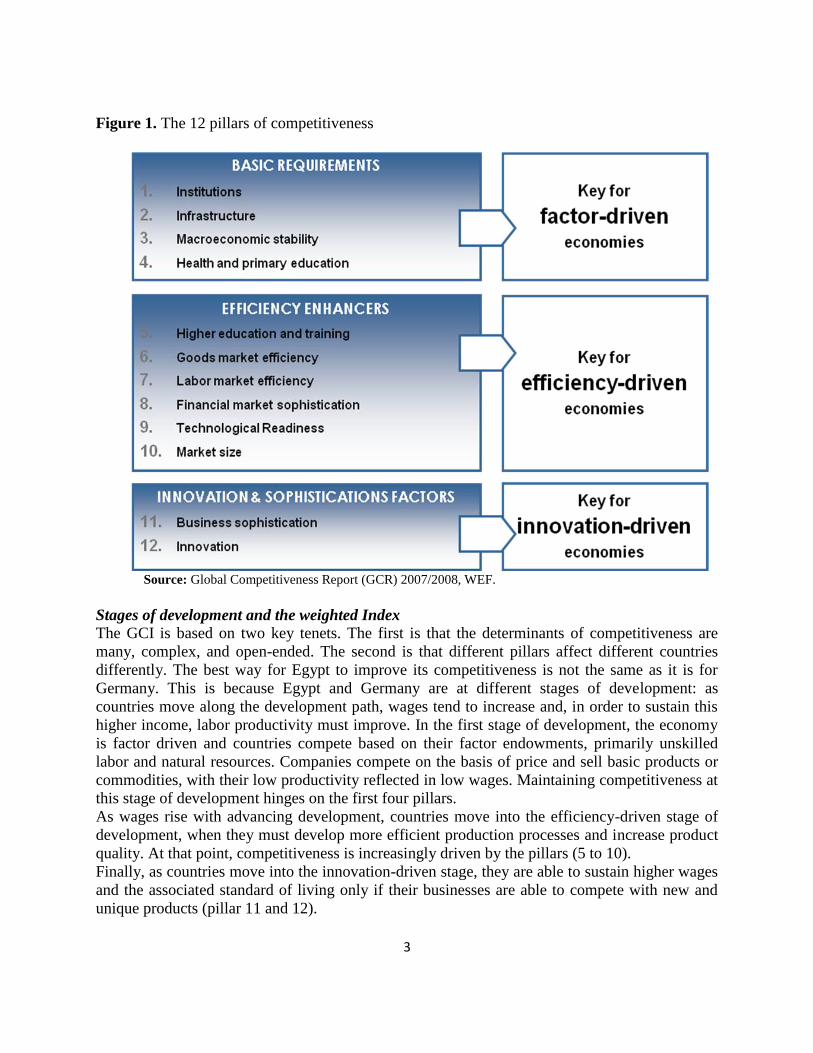
Figure 1. The 12 pillars of competitiveness
Source: Global Competitiveness Report (GCR) 2007/2008, WEF.
Stages of development and the weighted Index
The GCI is based on two key tenets. The first is that the determinants of competitiveness are
many, complex, and open-ended. The second is that different pillars affect different countries
differently. The best way for Egypt to improve its competitiveness is not the same as it is for
Germany. This is because Egypt and Germany are at different stages of development: as
countries move along the development path, wages tend to increase and, in order to sustain this
higher income, labor productivity must improve. In the first stage of development, the economy
is factor driven and countries compete based on their factor endowments, primarily unskilled
labor and natural resources. Companies compete on the basis of price and sell basic products or
commodities, with their low productivity reflected in low wages. Maintaining competitiveness at
this stage of development hinges on the first four pillars.
As wages rise with advancing development, countries move into the efficiency-driven stage of
development, when they must develop more efficient production processes and increase product
quality. At that point, competitiveness is increasingly driven by the pillars (5 to 10).
Finally, as countries move into the innovation-driven stage, they are able to sustain higher wages
and the associated standard of living only if their businesses are able to compete with new and
unique products (pillar 11 and 12).
4
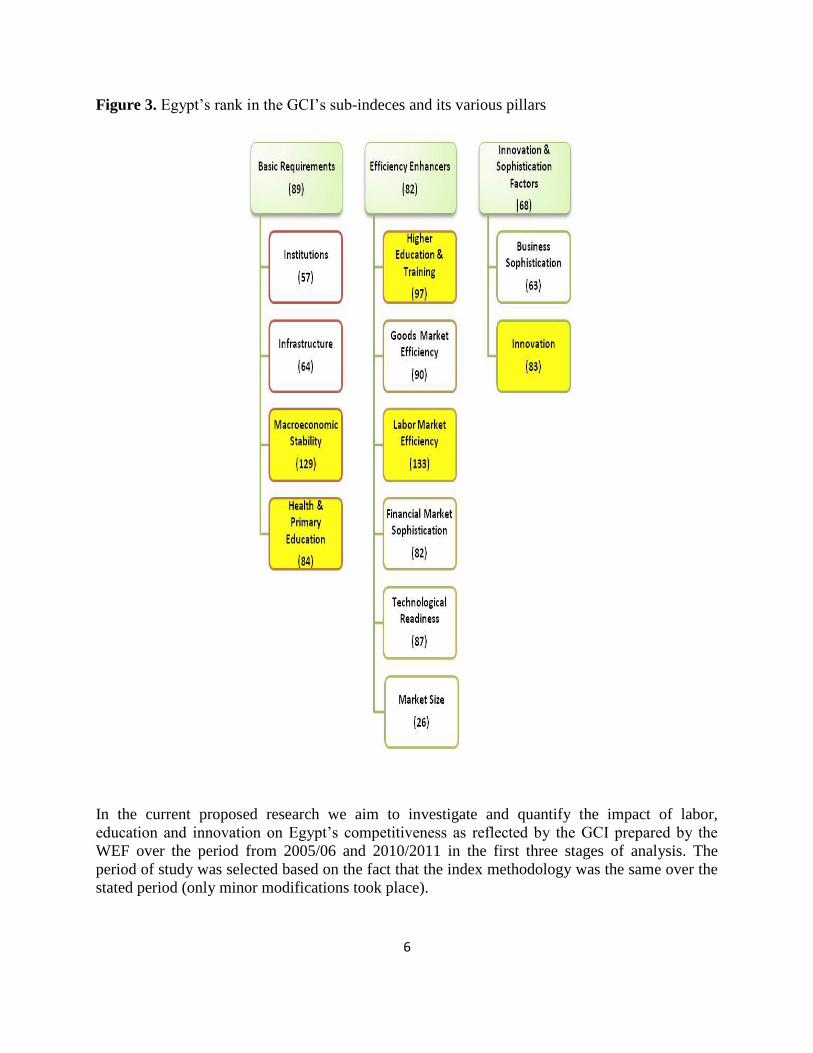
The process of economic development evolving in stages is captured by the GCI model by
attributing higher relative weights to those pillars that are relatively more important for a country
given its particular stage of development (Table 1 shows the weights over the years). Countries
are allocated to stages of development based on two criteria. The first criterion is the level of
GDP per capita at market exchange rates. The second criterion measures the extent by which
countries are factor driven. This is proxied by the share of exports of primary goods in total
exports (goods and services). The assumption made by WEF is that countries that export more
than 70 percent of primary products are, to a large extent, factor driven.
Table 1. Weights used for factor-driven stage over the years
Year
Basic
Requirements
Efficiency
Requirements
Innovation
and
sophistication
factors
Factor-driven
stage
2005/2006 50 40 10
2006/2007 50 40 10
2007/2008 60 40 20
2008/2009 60 40 20
2009/2010 60 40 20
2010/2011 60 40 20 Note: The weights were slightly modified as of GCR 2007/08 as the number of pillars expanded from 9 to
12.
The GCI Index calculation is as follows:
GCI=α1 x basic requirements + α2 x efficiency enhancers+ α3 x innovation factors
Where α1,α2, and α3 are the weights that each sub-index gets in the overall index. Weights are
shown in table (1).
Country coverage
From year to another the number of countries covered slightly fluctuates, depending on data
availability, if new countries are added upon adequate completion of the EOS of each country, as
shown in table (2).
3. Egypt in the GCI
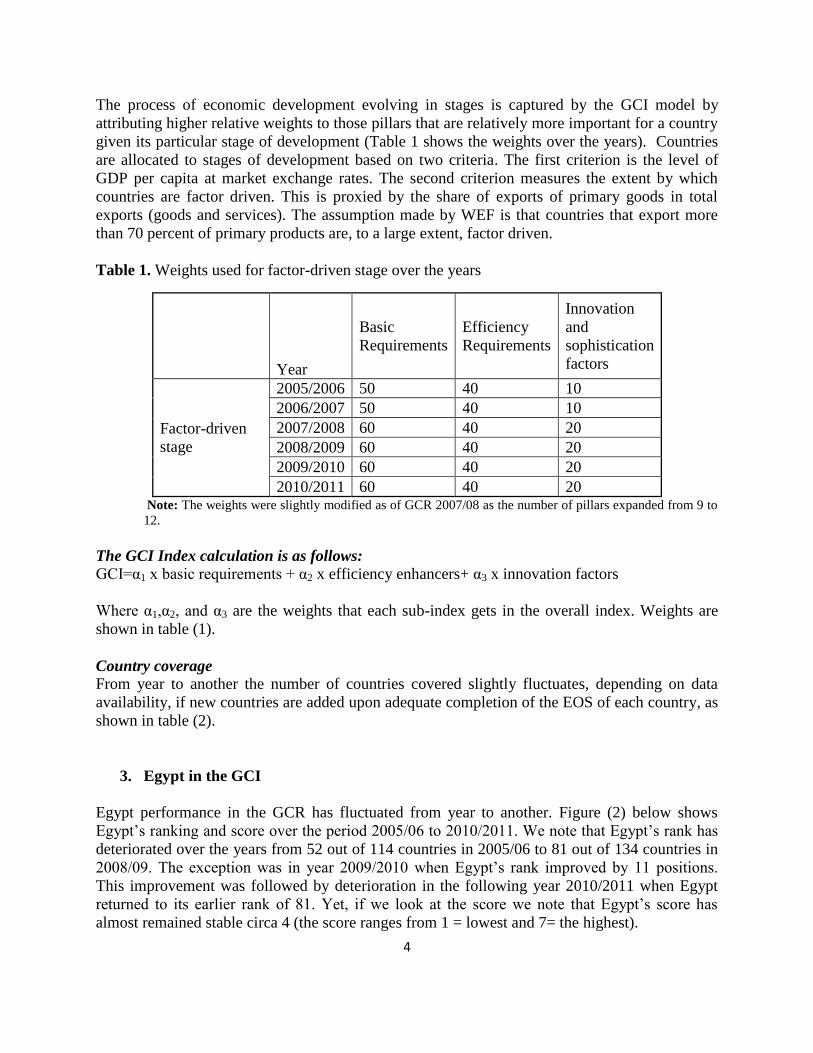
Egypt performance in the GCR has fluctuated from year to another. Figure (2) below shows
Egypt’s ranking and score over the period 2005/06 to 2010/2011. We note that Egypt’s rank has
deteriorated over the years from 52 out of 114 countries in 2005/06 to 81 out of 134 countries in
2008/09. The exception was in year 2009/2010 when Egypt’s rank improved by 11 positions.
This improvement was followed by deterioration in the following year 2010/2011 when Egypt
returned to its earlier rank of 81. Yet, if we look at the score we note that Egypt’s score has
almost remained stable circa 4 (the score ranges from 1 = lowest and 7= the highest).
5
Figure 2. Egypt’s ranking and score over the period 2005/06 to 2010/2011
Source: WEF reports.
Table 2. Egypt rank and score (2005/06 to 2010/2011)
2005/06 2006/07 2007/08 2008/09 2009/2010 2010/2011
Coverage
(N. of countries) 114 122 131 134 133 139
Egypt's rank 52 63 77 81 70 81
Egypt’s rank/ N.
of countries 46% 52% 59% 60% 53% 58%
Egypt's score 3.95 4.02 3.96 3.98 4.04 4.20
Source: WEF reports.
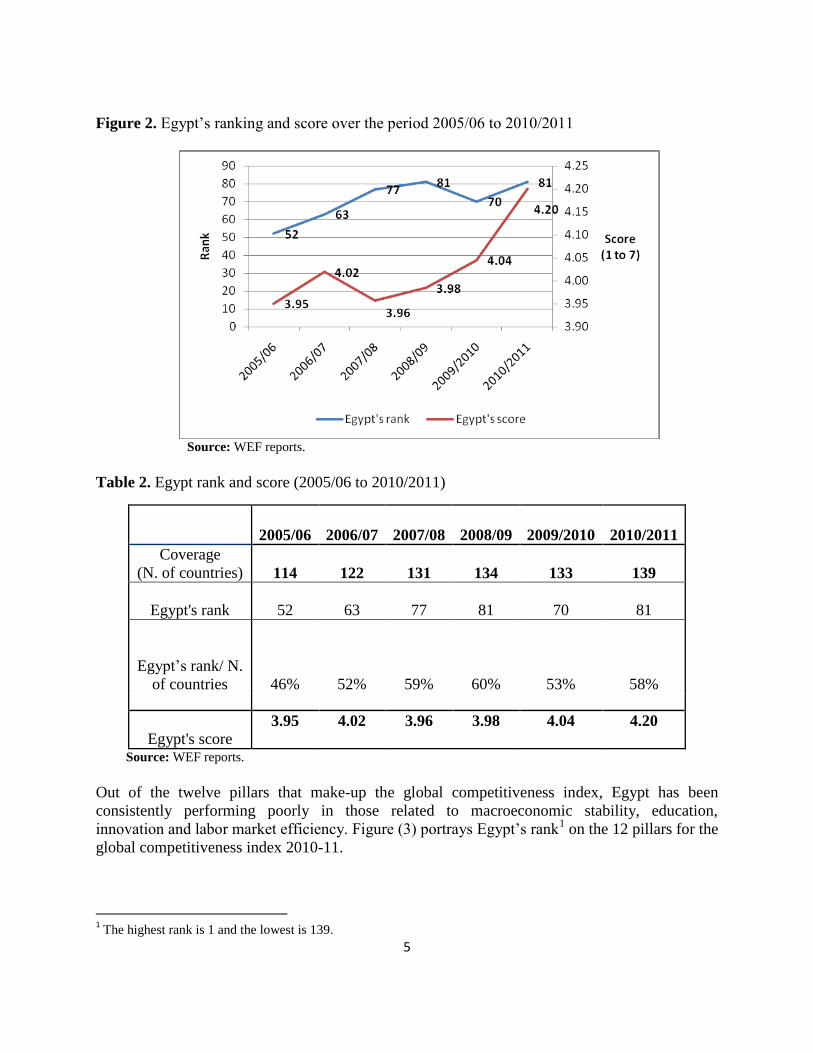
Out of the twelve pillars that make-up the global competitiveness index, Egypt has been
consistently performing poorly in those related to macroeconomic stability, education,
innovation and labor market efficiency. Figure (3) portrays Egypt’s rank1 on the 12 pillars for the
global competitiveness index 2010-11.
1 The highest rank is 1 and the lowest is 139.
6
Figure 3. Egypt’s rank in the GCI’s sub-indeces and its various pillars
In the current proposed research we aim to investigate and quantify the impact of labor,
education and innovation on Egypt’s competitiveness as reflected by the GCI prepared by the
WEF over the period from 2005/06 and 2010/2011 in the first three stages of analysis. The
period of study was selected based on the fact that the index methodology was the same over the
stated period (only minor modifications took place).
7
In a subsequent stage we investigate the relationship between real economic growth and other
education, innovation and labor proxies for a longer time period using national time series data.
Similarly, we investigate the status of Egypt’s competitiveness (where would Egypt be) if some
improvement took place in the underlying foundations of education, labor and innovation
indicators occurred (scenario), exploring the effects on Egypt’s competitiveness, and on real
economic growth.
4. Egypt’s key education, innovation and labor indicators
According to the World Bank2 , human Capital is defined as “ a broad range of knowledge, skills
and capabilities needed for life and work, including those related to capability in successful
living; engendered through quality education”. Inadequate human capital constrains productivity
and growth and compromises the overall well-being of citizens.
Human capital challenges in Egypt include high population exceeding 80 million3 as per CIA
fact book estimate July 2010, a growing workforce, high unemployment rate of 10 percent4 and
40 percent of the population is poor or near poor5, weak women participation in labor force
6; and
lack of sufficient supply of skilled and committed workers which is one of the key cited
obstacles for doing business in Egypt.
Egypt’s competitiveness is undermined by its poor capital development, as reflected in its poor
rank in the human development index where it ranked 101 out of 169 countries in 2011, as well
as, its poor rank in indicators for education, innovation and labor as per the Global
Competiveness Index reports. In the next sub-sections we will provide a brief on Egypt’s
education, labor and innovation indicators.
4.1 Education Indicators
The Global Competitiveness Index comprises two sub-pillars that deal with education. Those are
the primary education sub-pillar and the higher education and training pillar. In the next sub-
sections we will discuss Egypt’s stance in education as per the Global Competitiveness Index
while highlighting some key national education indicators.
4.1.1 Primary Education
Egypt’s competiveness rank in terms of primary education deteriorated from 100 out of 114
countries in the global competitiveness Report of 2005/06 to 108 out of 139 countries in GCI
2010/11. The deterioration is attributed primarily to the decline in the perceived quality of
primary education as well as the slight decrease in enrollment rate. Egypt’s primary enrollment
rate fell to 93.6 percent in 2010/11 as compared to an enrollment rate of 97.4 percent in 2005/06.
Compared to other select countries, namely India, Jordan, Tunisia, Turkey, Brazil and China, 2 The World Bank Egypt Education Sector Policy Note 2007. “Improving Quality, Equality, and Efficiency in the
Education Sector: Fostering a Competent Generation of Youth”. 3 As per CIA fact book
4 Ministry of Finance Monthly Reports.
5 The World Bank, Egypt Poverty Assessment Update 2007.
6 The ratio of female to male participation in the labor force is very low at 0.35 as of 2010 as per the WEF Global
Competitiveness Report 2010-11.
8
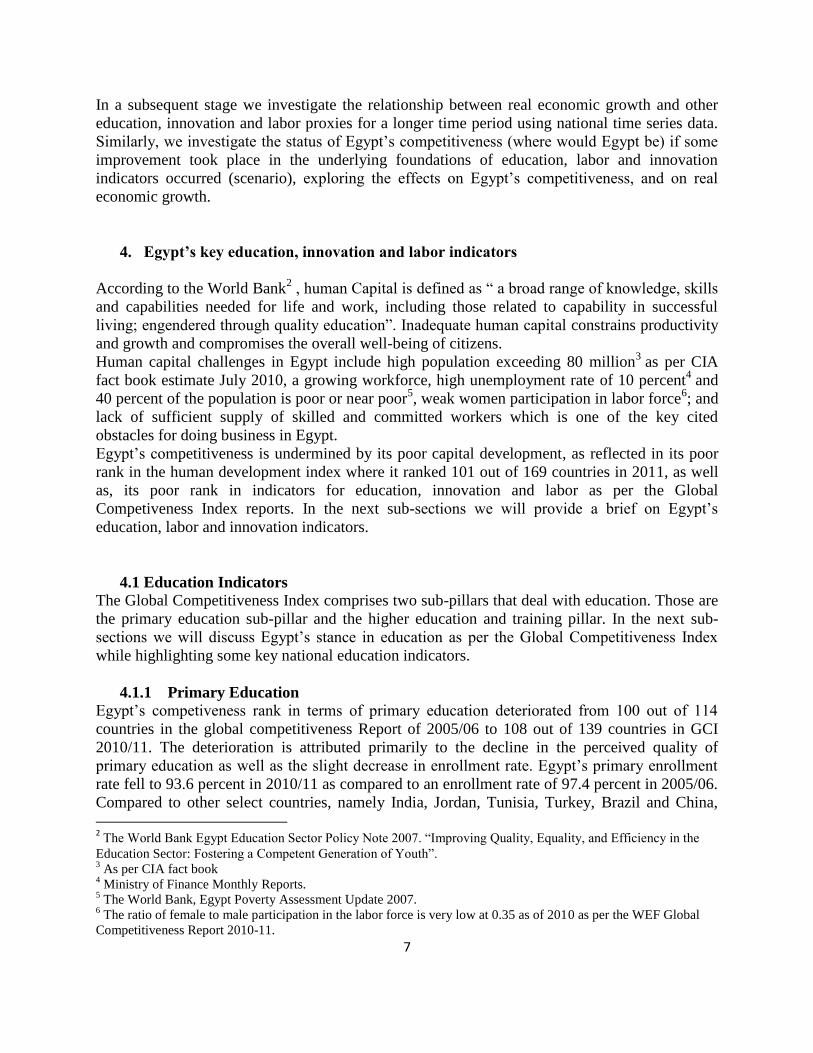
Egypt is the poorest performer in terms of quality of primary education. This in turn affects labor
productivity negatively and leads to unequal educational outcomes.
Figure 4. Quality of education score: Egypt compared to select countries (highest score
attainable =7 lowest= 1)
2.46
4.70
2.66
2.14 2.14
2.38
2.47
3.13
3.98
5.01
3.19
2.00
2.50
3.00
3.50
4.00
4.50
5.00
5.50
2005-2006 2007-2008 2008-2009 2009-2010 2010-2011
Quality of primary educationBrazil
China
Egpyt
India
Jordan
Tunisia
Turkey
The weaknesses in the educational system includes outdated curriculum and high stakes tests that
do not teach or measure the skills needed by the labor market; low incentive environment, low
pay for teachers coupled with poor accountability and prevalence of private tutoring; and the
serious need to monitor the quality of outcomes and develop monitoring and evaluation
frameworks. The reforms needed to improve the quality of education includes the formulation of
new curriculum using new technologies, improving teachers pay, and increasing accountability.
Moreover, despite the introduction of the internet to some schools, Egypt is ranked 122nd
out of
139 countries in terms of internet usage at schools, lower than all select comparator countries.
Hence, is the need to invest more in increasing both access and usage of internet in schools to
catch up with comparators.
4.1.2 Higher education and training
The youth is Egypt’s greatest asset. The number of students enrolled in basic education (prior to
university education) is 17.7 million, in addition 2.5 million who are enrolled in higher
education. Yet, Egypt’s rank in higher education and training has been deteriorating over time.
Both quantity and quality of higher education have been worsening over time. Egypt’s rank in
terms of higher education quality declined from 80th
out of 114 countries in 2005/06 to 128 out
of 139 in 2010/11, whereas the quantity of education declined from 57th
out of 114 in 2005/06 to
88th
out of 139 countries in 2010/11, as a result of the reduction in enrollment rates for both
secondary and tertiary education. Secondary enrollment rate declined from 85.3 percent in
2005/06 to 79.3 percent in 2010/11. As for tertiary enrollment rate it declined by 1 percentage
point to 28.4 percent in 2010/11 as compared to 2005/06.
9
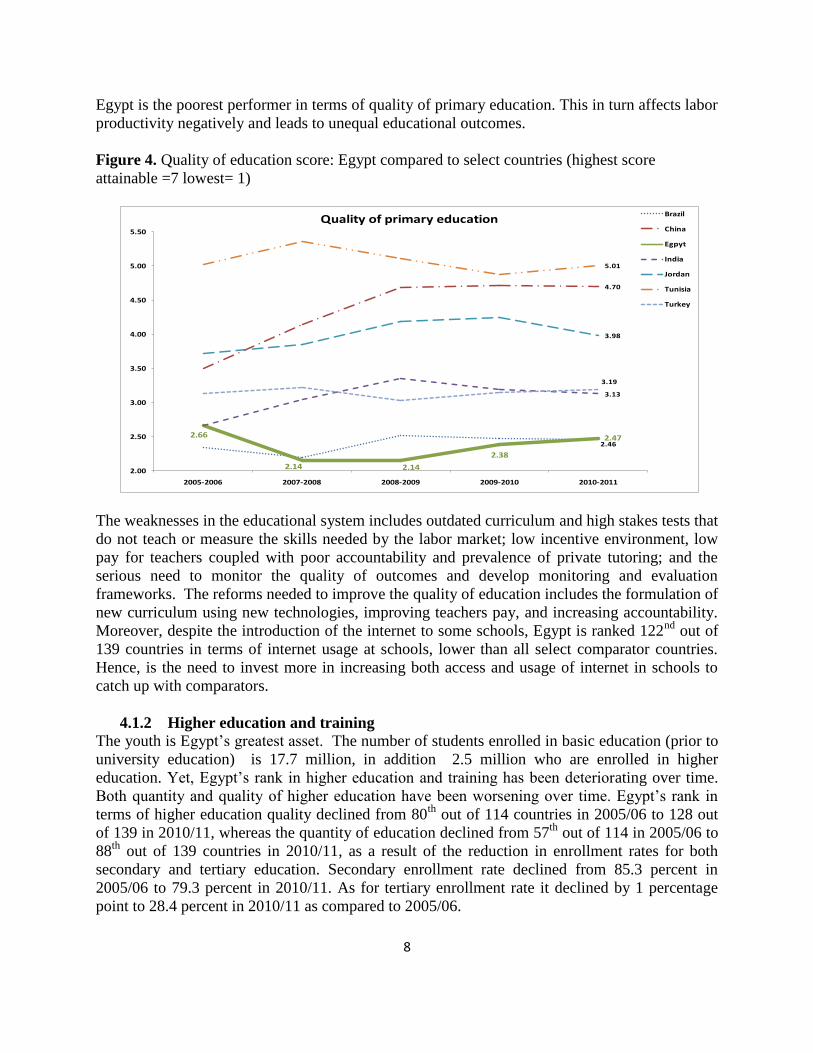
The critical factors that are essential for human capital development, such as quality of higher
education, secondary and tertiary enrollment rates and on the job training, continue to be a major
impediment towards greater competitiveness. Compared to select countries, Egypt is not only the
worst performer in this pillar but also its score is deteriorating over time, as demonstrated in
Figure (5).
Figure 5. Egypt compared to selected countries in higher education and training indicators
4.294.24
3.86
3.78
3.68
3.563.62 3.59
3.85
4.32
4.89
4.04
3.40
3.60
3.80
4.00
4.20
4.40
4.60
4.80
5.00
2005-2006 2006-2007 2007-2008 2008-2009 2009-2010 2010-2011
Higher Education and TrainingBrazil
China
Egypt
India
Jordan
Tunisia
Turkey
Source: WEF, several issues.
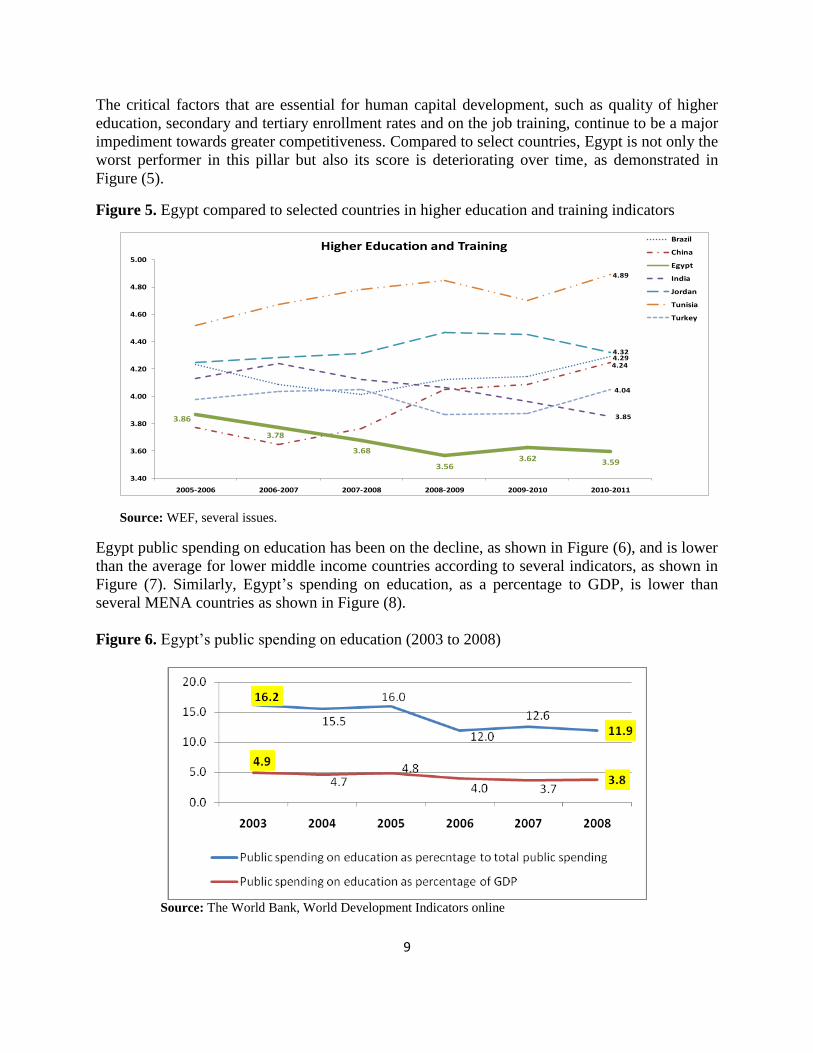
Egypt public spending on education has been on the decline, as shown in Figure (6), and is lower
than the average for lower middle income countries according to several indicators, as shown in
Figure (7). Similarly, Egypt’s spending on education, as a percentage to GDP, is lower than
several MENA countries as shown in Figure (8).
Figure 6. Egypt’s public spending on education (2003 to 2008)
Source: The World Bank, World Development Indicators online
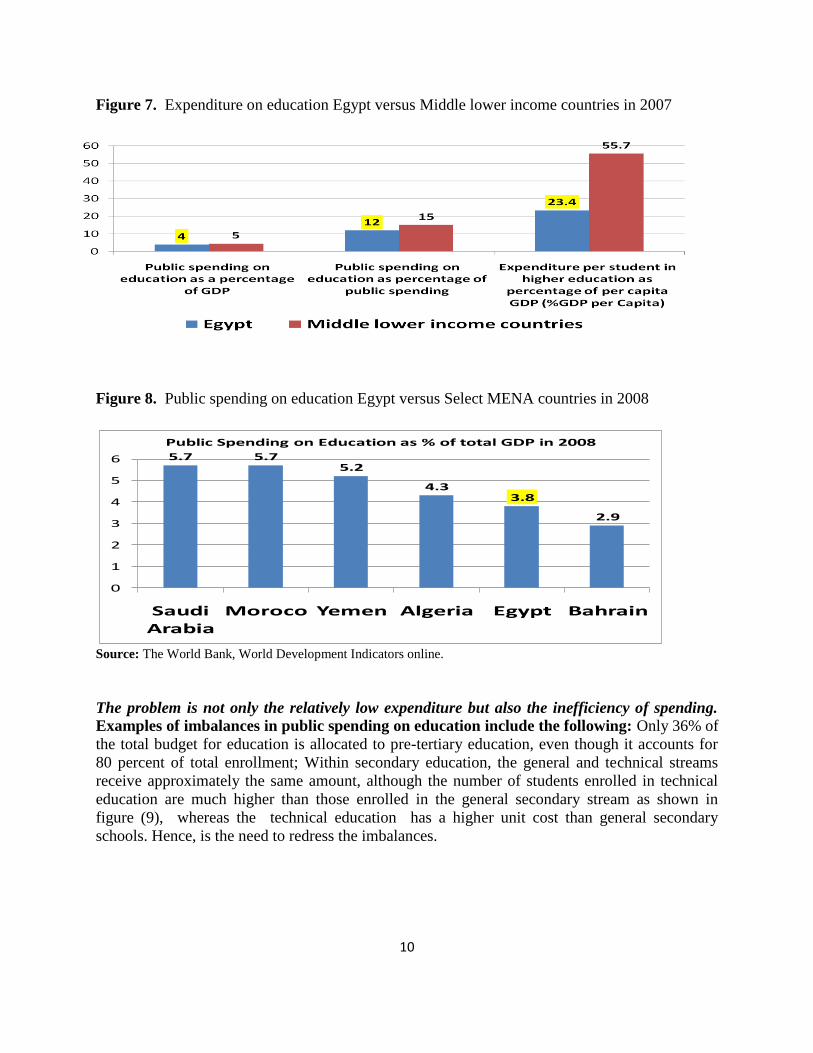
10
Figure 7. Expenditure on education Egypt versus Middle lower income countries in 2007
Source: The World Bank, World Development Indicators online.
Figure 8. Public spending on education Egypt versus Select MENA countries in 2008
Source: The World Bank, World Development Indicators online.
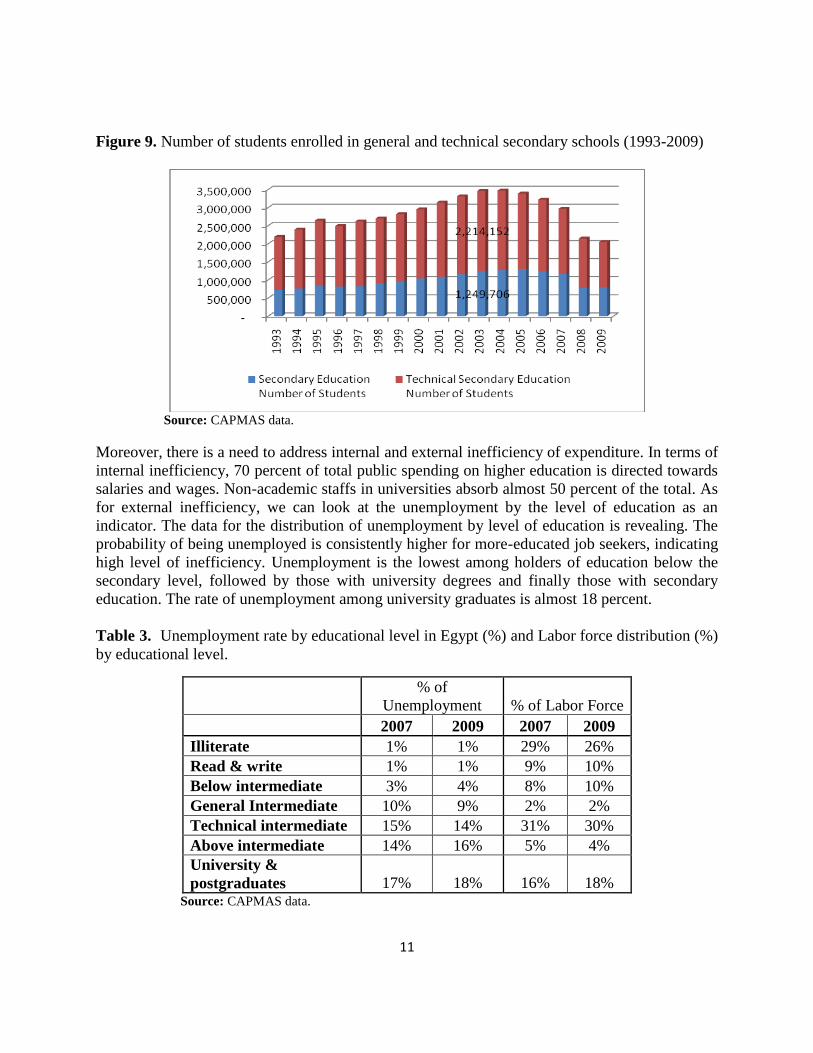
The problem is not only the relatively low expenditure but also the inefficiency of spending.
Examples of imbalances in public spending on education include the following: Only 36% of
the total budget for education is allocated to pre-tertiary education, even though it accounts for
80 percent of total enrollment; Within secondary education, the general and technical streams
receive approximately the same amount, although the number of students enrolled in technical
education are much higher than those enrolled in the general secondary stream as shown in
figure (9), whereas the technical education has a higher unit cost than general secondary
schools. Hence, is the need to redress the imbalances.
5.7 5.75.2
4.33.8
2.9
0
1
2
3
4
5
6
Saudi Arabia
Moroco Yemen Algeria Egypt Bahrain
Public Spending on Education as % of total GDP in 2008
11
Figure 9. Number of students enrolled in general and technical secondary schools (1993-2009)
Source: CAPMAS data.
Moreover, there is a need to address internal and external inefficiency of expenditure. In terms of
internal inefficiency, 70 percent of total public spending on higher education is directed towards
salaries and wages. Non-academic staffs in universities absorb almost 50 percent of the total. As
for external inefficiency, we can look at the unemployment by the level of education as an
indicator. The data for the distribution of unemployment by level of education is revealing. The
probability of being unemployed is consistently higher for more-educated job seekers, indicating
high level of inefficiency. Unemployment is the lowest among holders of education below the
secondary level, followed by those with university degrees and finally those with secondary
education. The rate of unemployment among university graduates is almost 18 percent.
Table 3. Unemployment rate by educational level in Egypt (%) and Labor force distribution (%)
by educational level.
% of
Unemployment % of Labor Force
2007 2009 2007 2009
Illiterate 1% 1% 29% 26%
Read & write 1% 1% 9% 10%
Below intermediate 3% 4% 8% 10%
General Intermediate 10% 9% 2% 2%
Technical intermediate 15% 14% 31% 30%
Above intermediate 14% 16% 5% 4%
University &
postgraduates 17% 18% 16% 18% Source: CAPMAS data.
12
Higher unemployment rates among higher education graduates represent waste of resources
invested by both government and households. Hence, is the need to improve the quality of
educational outcomes, and reduce mismatch between the educational qualifications and labor
market needs.
Moreover, the poor quality of higher education is reflected in the ranking of national universities
in the top world 500 universities for instance. Egypt has only 1 university in the last fifty of the
top 500 universities, namely Cairo University, whereas other countries such as China (16
Universities), India (3 Universities), Brazil (3 Universities), and Turkey (5 Universities). The
higher unemployment rate among highly educated job seekers is another indicative proxy of poor
quality. All those indicators reflect the need to improve the efficiency of expenditure and the
need to raise the quality of higher education institutions. Also, transition from public to private
provision of higher education should go hand in hand with introducing more efficient systems of
financial assistance that guarantee equal opportunities to the disadvantaged groups of students.
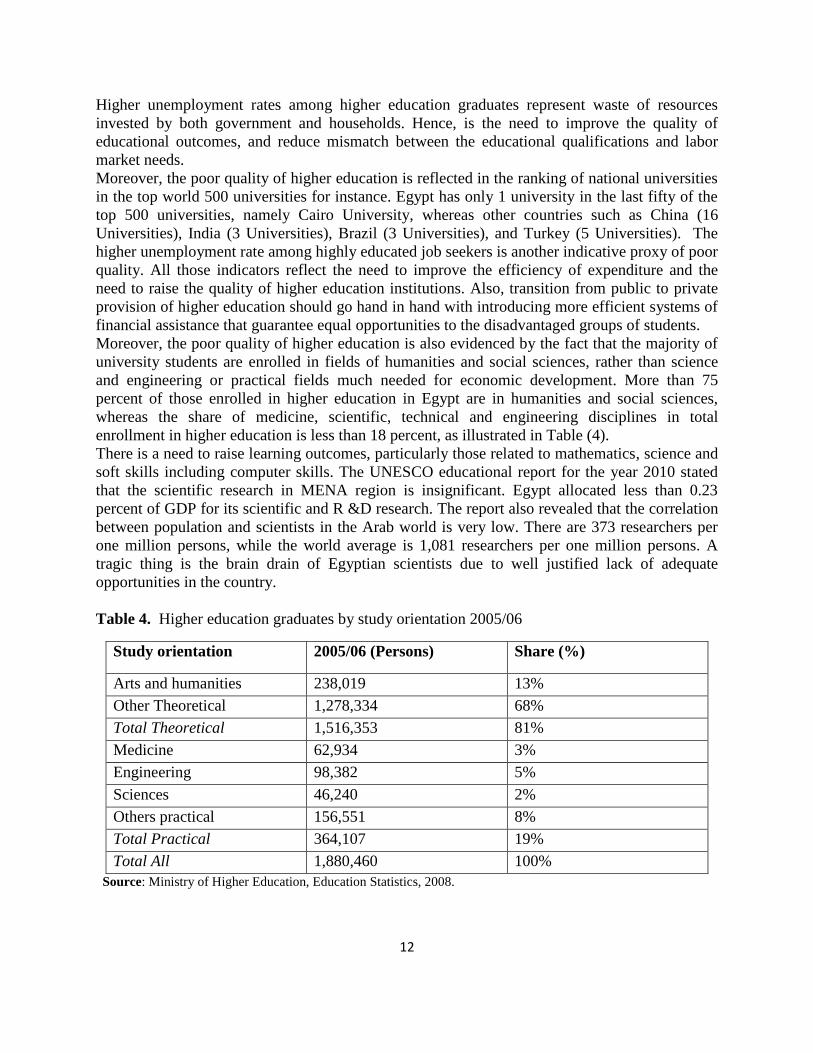
Moreover, the poor quality of higher education is also evidenced by the fact that the majority of
university students are enrolled in fields of humanities and social sciences, rather than science
and engineering or practical fields much needed for economic development. More than 75
percent of those enrolled in higher education in Egypt are in humanities and social sciences,
whereas the share of medicine, scientific, technical and engineering disciplines in total
enrollment in higher education is less than 18 percent, as illustrated in Table (4).
There is a need to raise learning outcomes, particularly those related to mathematics, science and
soft skills including computer skills. The UNESCO educational report for the year 2010 stated
that the scientific research in MENA region is insignificant. Egypt allocated less than 0.23
percent of GDP for its scientific and R &D research. The report also revealed that the correlation
between population and scientists in the Arab world is very low. There are 373 researchers per
one million persons, while the world average is 1,081 researchers per one million persons. A
tragic thing is the brain drain of Egyptian scientists due to well justified lack of adequate
opportunities in the country.
Table 4. Higher education graduates by study orientation 2005/06
Study orientation 2005/06 (Persons) Share (%)
Arts and humanities 238,019 13%
Other Theoretical 1,278,334 68%
Total Theoretical 1,516,353 81%
Medicine 62,934 3%
Engineering 98,382 5%
Sciences 46,240 2%
Others practical 156,551 8%
Total Practical 364,107 19%
Total All 1,880,460 100%
Source: Ministry of Higher Education, Education Statistics, 2008.
13
Moreover, universities stress routine learning and memorization of facts while more and more
the demand for labor is turning towards the skills of “expert thinking” and “complex
communications” and away from the ability to conduct routine tasks. Hence, is the inability of
graduates to meet the labor market demands.
Key targets for education reform should include not only the increase in public spending on
education but ensuring the efficiency of spending and the continuous monitoring of quality and
efficiency of outcomes. There is a need to apply quality assurance in all universities, including
national public and private universities with foreign affiliations. It is imperative to reduce
unnecessary expenditure to direct spending to areas of education that has an equivalent demand
in the labor market. That is, working on reducing the mismatch between education and the labor
market, particularly in the category of “educated and unemployed” due to mismatch between
qualifications and the needs of the job market. In addition, it is important to tackle the issues of
shortage of workers in technical and soft skills, which are required by the private sector, by
addressing the low quality of vocational training.
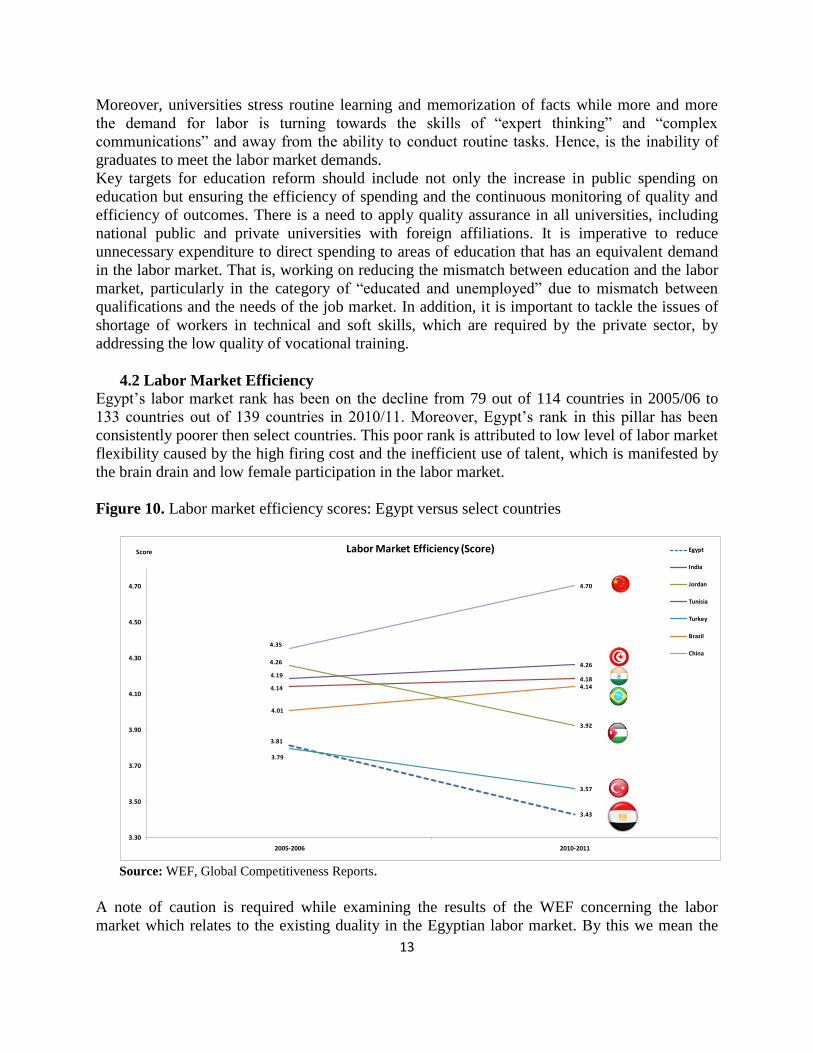
4.2 Labor Market Efficiency
Egypt’s labor market rank has been on the decline from 79 out of 114 countries in 2005/06 to
133 countries out of 139 countries in 2010/11. Moreover, Egypt’s rank in this pillar has been
consistently poorer then select countries. This poor rank is attributed to low level of labor market
flexibility caused by the high firing cost and the inefficient use of talent, which is manifested by
the brain drain and low female participation in the labor market.
Figure 10. Labor market efficiency scores: Egypt versus select countries
3.81
3.43
4.14
4.18
4.26
3.92
4.19
4.26
3.79
3.57
4.01
4.14
4.35
4.70
3.30
3.50
3.70
3.90
4.10
4.30
4.50
4.70
2005-2006 2010-2011
Labor Market Efficiency (Score) Egypt
India
Jordan
Tunisia
Turkey
Brazil
China
Score
Source: WEF, Global Competitiveness Reports.
A note of caution is required while examining the results of the WEF concerning the labor
market which relates to the existing duality in the Egyptian labor market. By this we mean the
14
existence of both formal and informal employment whereby, the informal labor market
constitutes more than 40 percent of the total employment market7.
The Egyptian labor market is perceived as highly inflexible, ranked 120 among 139 countries in
GCI 2010-11. The cost of firing an employee in Egypt, measured in weeks of wages, was 128
weeks in 20108. Egyptian firing costs are about 74 weeks longer then the MENA average of 53
weeks, creating a strong disincentive for businesses to employ full-time workers. Although the
Labor Law No. 12 of 2003 allowed greater working hour flexibility, fixed duration contracts and
a more streamlined firing process, there seems to be a need for greater flexibility.
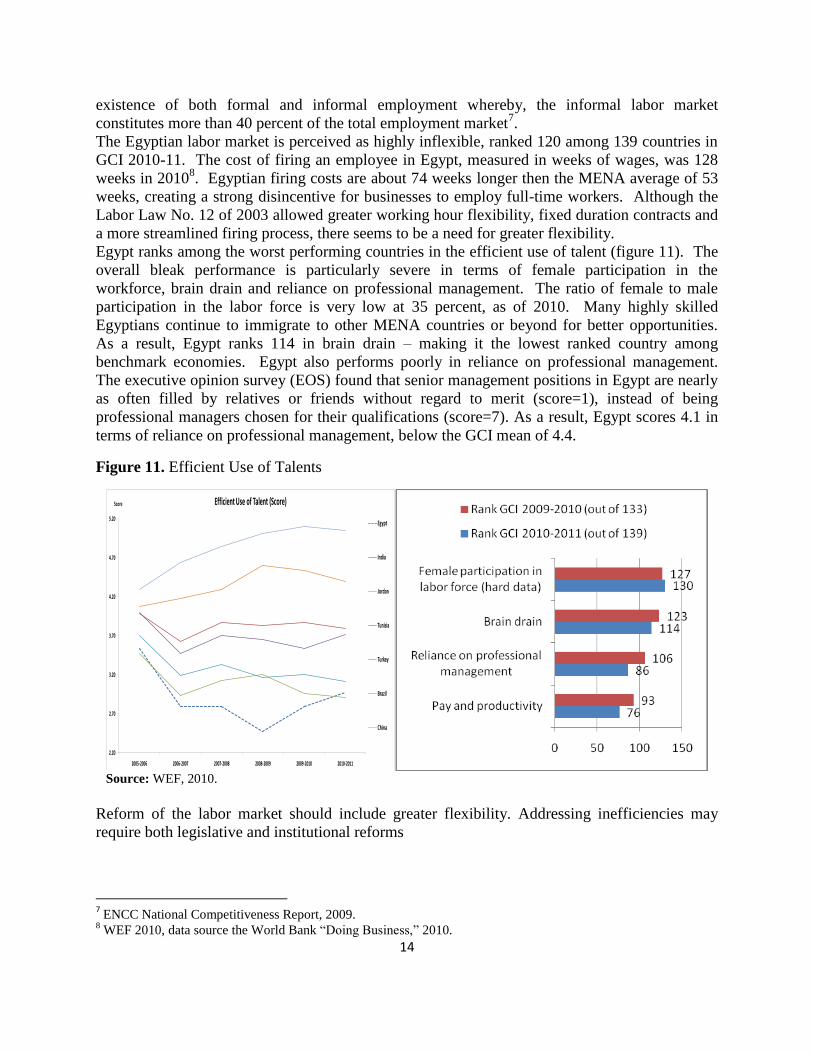
Egypt ranks among the worst performing countries in the efficient use of talent (figure 11). The
overall bleak performance is particularly severe in terms of female participation in the
workforce, brain drain and reliance on professional management. The ratio of female to male
participation in the labor force is very low at 35 percent, as of 2010. Many highly skilled
Egyptians continue to immigrate to other MENA countries or beyond for better opportunities.
As a result, Egypt ranks 114 in brain drain – making it the lowest ranked country among
benchmark economies. Egypt also performs poorly in reliance on professional management.
The executive opinion survey (EOS) found that senior management positions in Egypt are nearly
as often filled by relatives or friends without regard to merit (score=1), instead of being
professional managers chosen for their qualifications (score=7). As a result, Egypt scores 4.1 in
terms of reliance on professional management, below the GCI mean of 4.4.
Figure 11. Efficient Use of Talents
2.20
2.70
3.20
3.70
4.20
4.70
5.20
2005-2006 2006-2007 2007-2008 2008-2009 2009-2010 2010-2011
Efficient Use of Talent (Score)
Egypt
India
Jordan
Tunisia
Turkey
Brazil
China
Score
Source: WEF, 2010.
Reform of the labor market should include greater flexibility. Addressing inefficiencies may
require both legislative and institutional reforms
7 ENCC National Competitiveness Report, 2009.
8 WEF 2010, data source the World Bank “Doing Business,” 2010.
15
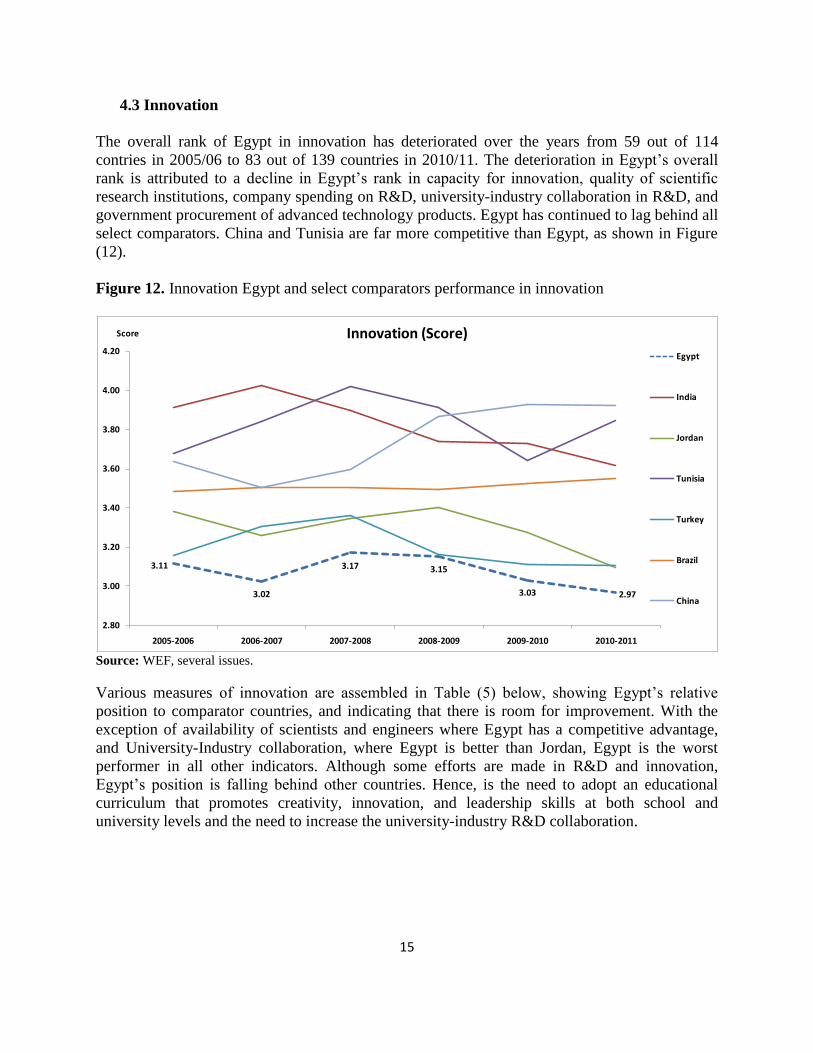
4.3 Innovation
The overall rank of Egypt in innovation has deteriorated over the years from 59 out of 114
contries in 2005/06 to 83 out of 139 countries in 2010/11. The deterioration in Egypt’s overall
rank is attributed to a decline in Egypt’s rank in capacity for innovation, quality of scientific
research institutions, company spending on R&D, university-industry collaboration in R&D, and
government procurement of advanced technology products. Egypt has continued to lag behind all
select comparators. China and Tunisia are far more competitive than Egypt, as shown in Figure
(12).
Figure 12. Innovation Egypt and select comparators performance in innovation
3.11
3.02
3.17 3.15
3.03 2.97
2.80
3.00
3.20
3.40
3.60
3.80
4.00
4.20
2005-2006 2006-2007 2007-2008 2008-2009 2009-2010 2010-2011
Innovation (Score)
Egypt
India
Jordan
Tunisia
Turkey
Brazil
China
Score
Source: WEF, several issues.
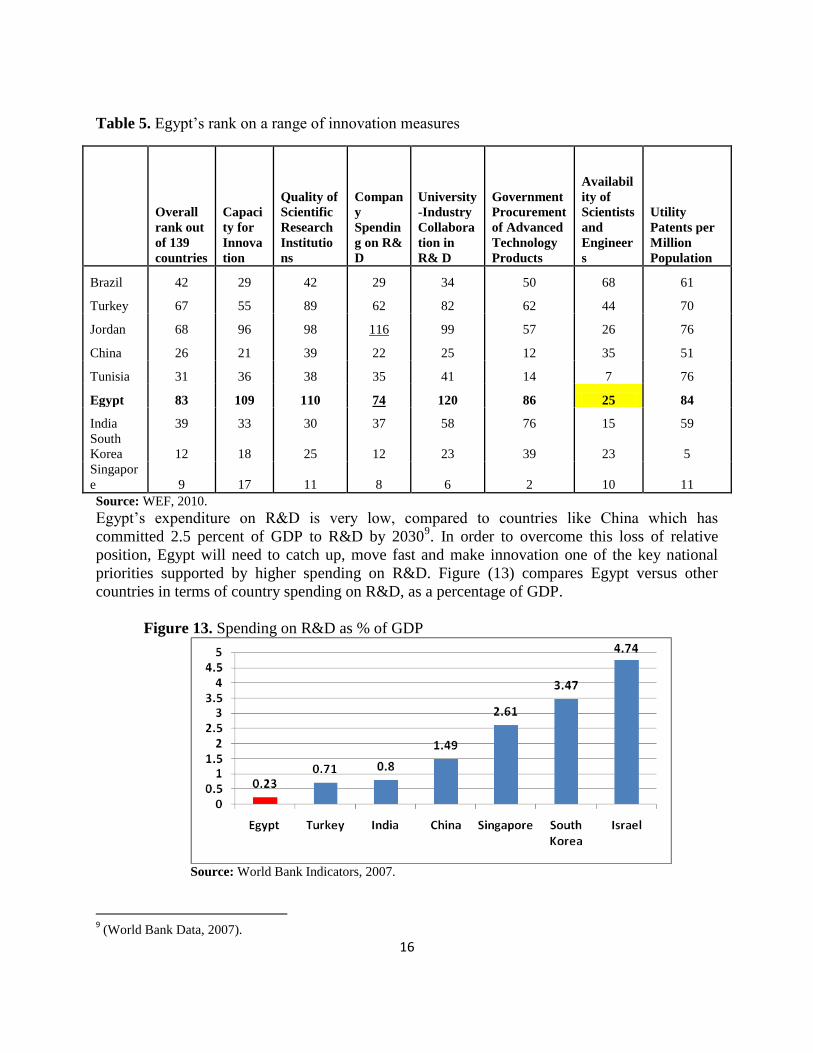
Various measures of innovation are assembled in Table (5) below, showing Egypt’s relative
position to comparator countries, and indicating that there is room for improvement. With the
exception of availability of scientists and engineers where Egypt has a competitive advantage,
and University-Industry collaboration, where Egypt is better than Jordan, Egypt is the worst
performer in all other indicators. Although some efforts are made in R&D and innovation,
Egypt’s position is falling behind other countries. Hence, is the need to adopt an educational
curriculum that promotes creativity, innovation, and leadership skills at both school and
university levels and the need to increase the university-industry R&D collaboration.
16
Table 5. Egypt’s rank on a range of innovation measures
Overall
rank out
of 139
countries
Capaci
ty for
Innova
tion
Quality of
Scientific
Research
Institutio
ns
Compan
y
Spendin
g on R&
D
University
-Industry
Collabora
tion in
R& D
Government
Procurement
of Advanced
Technology
Products
Availabil
ity of
Scientists
and
Engineer
s
Utility
Patents per
Million
Population
Brazil 42 29 42 29 34 50 68 61
Turkey 67 55 89 62 82 62 44 70
Jordan 68 96 98 116 99 57 26 76
China 26 21 39 22 25 12 35 51
Tunisia 31 36 38 35 41 14 7 76
Egypt 83 109 110 74 120 86 25 84
India 39 33 30 37 58 76 15 59
South
Korea 12 18 25 12 23 39 23 5
Singapor
e 9 17 11 8 6 2 10 11
Source: WEF, 2010.
Egypt’s expenditure on R&D is very low, compared to countries like China which has
committed 2.5 percent of GDP to R&D by 20309. In order to overcome this loss of relative
position, Egypt will need to catch up, move fast and make innovation one of the key national
priorities supported by higher spending on R&D. Figure (13) compares Egypt versus other
countries in terms of country spending on R&D, as a percentage of GDP.
Figure 13. Spending on R&D as % of GDP
Source: World Bank Indicators, 2007.
9 (World Bank Data, 2007).
17
Key inhibitors to greater innovation include: limited financial resources and R&D expenditure;
lack of education that encourages innovation; weak university-industry linkages, low private
sector contribution to scientific research and low rates of technology transfer.
For Egypt to achieve greater competitiveness there is a need to adopt a national strategy that
would increase the youth capacity to innovate and commercialize new goods and services. One
of the impediments is the lengthy process for obtaining patents which could take up to four years
and is inefficient. Moreover, Egypt needs to have a national science, technology and innovation
strategy. The adoption of a National Innovation System10
(NIS) should also be considered. Also,
innovation could play a role in providing solutions to many of the biggest global and national
challenges, such as climate change; water, energy, and food security.
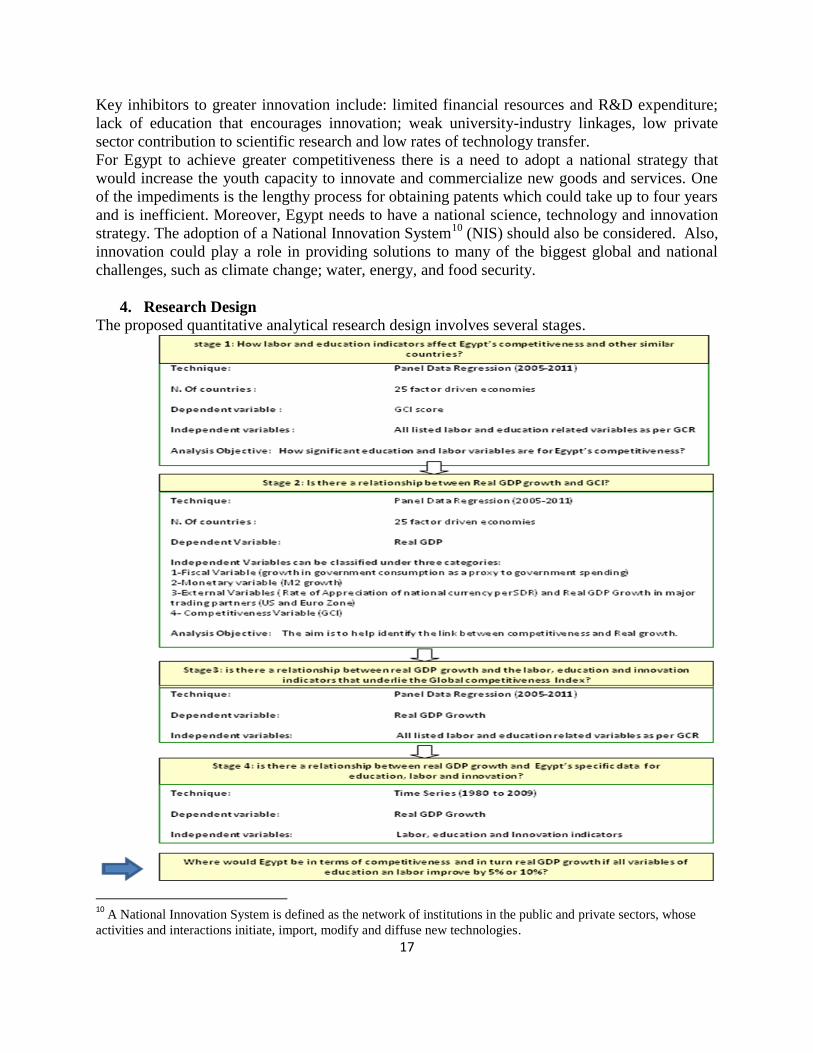
4. Research Design
The proposed quantitative analytical research design involves several stages.
10
A National Innovation System is defined as the network of institutions in the public and private sectors, whose
activities and interactions initiate, import, modify and diffuse new technologies.
18
5. Data and Methodology
Data Sources and Data Analysis
For stage 1, all data were obtained from the GCR reports, as for stages 2 and 3 we depended on
IFS statistics, available from IMF and The World Development Indicators by The World Bank.
Data for stage 4 are obtained from CAPMAS and the World Bank Development Indicators. For
data analysis we used STATA software for panel data multiple regressions’ estimation.
Methodology
The study involves a multi-stage analysis as follows:
Stage 1
In the first stage of analysis the key question we want to investigate is how labor, education and
innovation indicators affect Egypt’s competitiveness?
We will answer this question by running panel data regressions11
where the dependent variable is
the GCI score and the independent variables are all qualitative and quantitative variables that
relate to education, labor and innovation that form part of the GCI composite index. We run the
panel data regressions once using “The Fixed Effect Model” and once using “The Random
Effects Model” (REM). Our model uses a short balanced panel data, as the number of cross
sectional subjects N is greater than the number of time periods T. The panel data comprise 25
countries12
in stage 1 of development as defined by WEF, over 6 years (from 2005/06 to
2010/2011).
The model below is known in the literature as the fixed effects (regression) model (FEM). The
term “fixed effects” is due to the fact that, although the intercept may differ across countries,
each country’s intercept does not vary over time.
ititinnov
iteffuse
itflexs
itonjtritquaedusitqedusitpres
itiGC
87654321
(1)
i= 1,2,3,….25
t=1,2,…6
11 As reported by Gujarati and Porter (2009), panel data have several advantages over cross-section or time series
data of which: Panel data takes into account the heterogeneity of the units involved (countries in our case); Panel
data give “more informative data, more variability, less collinearity among variables, more degrees of freedom and
more efficiency”; and Panel data are better suited to study the dynamics of change such as unemployment and labor
mobility.
12 Countries and corresponding id’s are presented in Appendix.
19
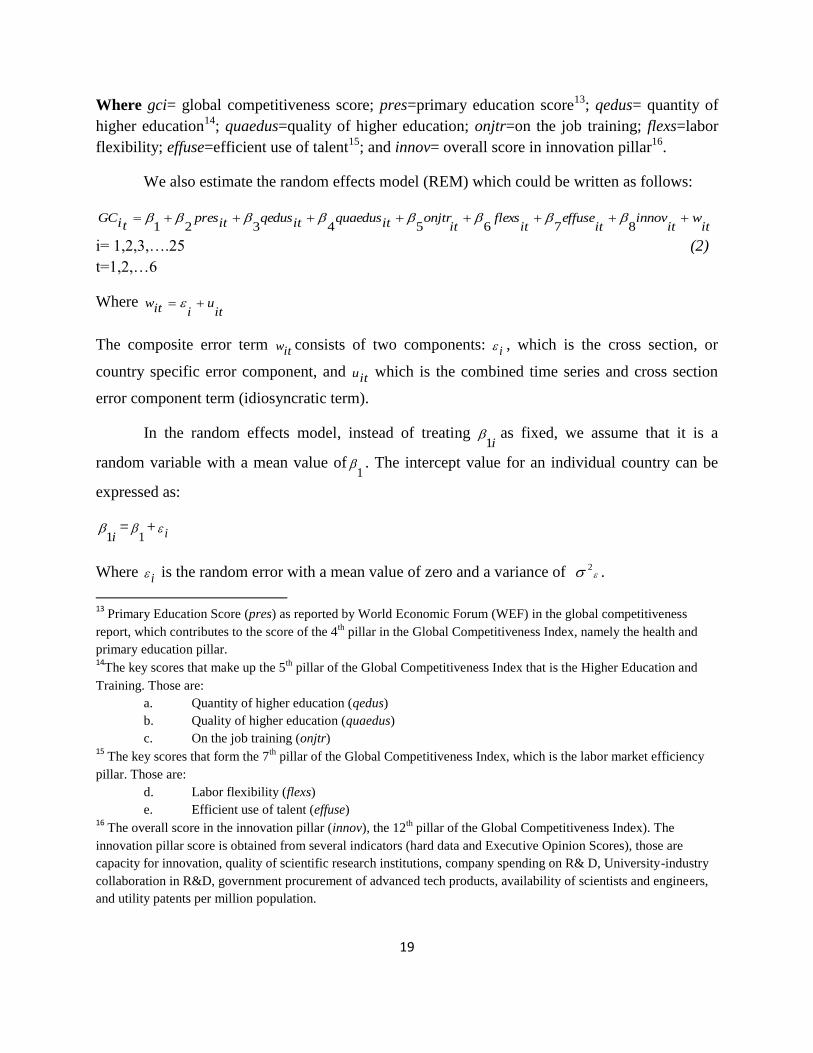
Where gci= global competitiveness score; pres=primary education score13
; qedus= quantity of
higher education14
; quaedus=quality of higher education; onjtr=on the job training; flexs=labor
flexibility; effuse=efficient use of talent15
; and innov= overall score in innovation pillar16
.
We also estimate the random effects model (REM) which could be written as follows:
itw
itinnov
iteffuse
itflexs
itonjtritquaedusitqedusitpres
tiGC
87654321
i= 1,2,3,….25 (2)
t=1,2,…6
Where it
uiitw
The composite error term itw consists of two components: i , which is the cross section, or
country specific error component, and itu which is the combined time series and cross section
error component term (idiosyncratic term).
In the random effects model, instead of treating i1
as fixed, we assume that it is a
random variable with a mean value of1
. The intercept value for an individual country can be
expressed as:
i1 =
1 + i
Where i is the random error with a mean value of zero and a variance of 2 .
13
Primary Education Score (pres) as reported by World Economic Forum (WEF) in the global competitiveness
report, which contributes to the score of the 4th
pillar in the Global Competitiveness Index, namely the health and
primary education pillar. 14
The key scores that make up the 5th
pillar of the Global Competitiveness Index that is the Higher Education and
Training. Those are:
a. Quantity of higher education (qedus)
b. Quality of higher education (quaedus)
c. On the job training (onjtr) 15
The key scores that form the 7th
pillar of the Global Competitiveness Index, which is the labor market efficiency
pillar. Those are:
d. Labor flexibility (flexs)
e. Efficient use of talent (effuse) 16
The overall score in the innovation pillar (innov), the 12th pillar of the Global Competitiveness Index). The
innovation pillar score is obtained from several indicators (hard data and Executive Opinion Scores), those are
capacity for innovation, quality of scientific research institutions, company spending on R& D, University-industry
collaboration in R&D, government procurement of advanced tech products, availability of scientists and engineers,
and utility patents per million population.
20
To see whether we should opt for Fixed Effects Model Or Random Effects Model we use
Hausman specification test and the Breusch and Pagan (BP) Lagrange Multiplier test.
Stage 2
In this stage we want to investigate whether there is a relationship between Growth in Real GDP
and GCI? We run panel data regressions that comprise the same countries as in stage 1 of the
analysis, over 6 years (from 2005/2006 to 2010/2011). The panel data we used could be
described as “Short Unbalanced Panel Data”.
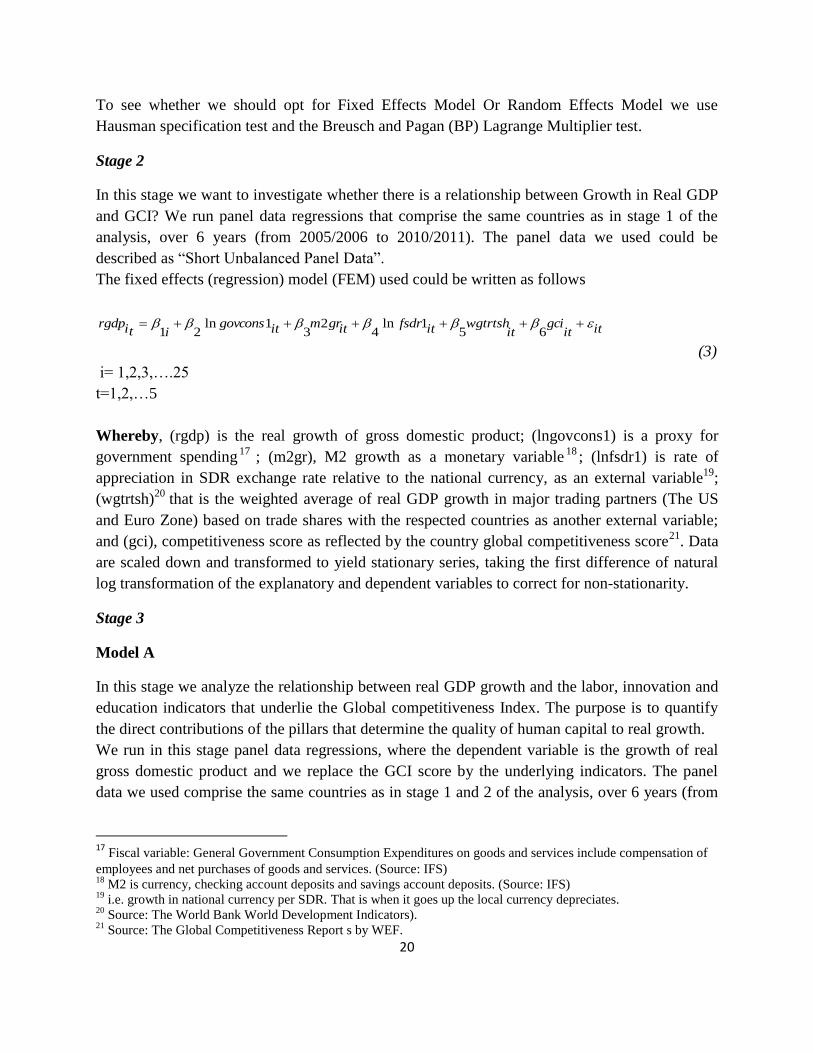
The fixed effects (regression) model (FEM) used could be written as follows
ititgci
itwgtrtshitfsdritgrmitgovcons
itirgdp
651ln
42
31ln
21
(3)
i= 1,2,3,….25
t=1,2,…5
Whereby, (rgdp) is the real growth of gross domestic product; (lngovcons1) is a proxy for
government spending17
; (m2gr), M2 growth as a monetary variable18
; (lnfsdr1) is rate of
appreciation in SDR exchange rate relative to the national currency, as an external variable19
;
(wgtrtsh)20
that is the weighted average of real GDP growth in major trading partners (The US
and Euro Zone) based on trade shares with the respected countries as another external variable;
and (gci), competitiveness score as reflected by the country global competitiveness score21
. Data
are scaled down and transformed to yield stationary series, taking the first difference of natural
log transformation of the explanatory and dependent variables to correct for non-stationarity.
Stage 3
Model A
In this stage we analyze the relationship between real GDP growth and the labor, innovation and
education indicators that underlie the Global competitiveness Index. The purpose is to quantify
the direct contributions of the pillars that determine the quality of human capital to real growth.
We run in this stage panel data regressions, where the dependent variable is the growth of real
gross domestic product and we replace the GCI score by the underlying indicators. The panel
data we used comprise the same countries as in stage 1 and 2 of the analysis, over 6 years (from
17 Fiscal variable: General Government Consumption Expenditures on goods and services include compensation of
employees and net purchases of goods and services. (Source: IFS) 18
M2 is currency, checking account deposits and savings account deposits. (Source: IFS) 19
i.e. growth in national currency per SDR. That is when it goes up the local currency depreciates. 20
Source: The World Bank World Development Indicators). 21
Source: The Global Competitiveness Report s by WEF.
21
2005/06 to 2010/2011). The panel data used could be described as “Short Unbalanced Panel
Data” due to one year data loss for some of the explanatory variables.
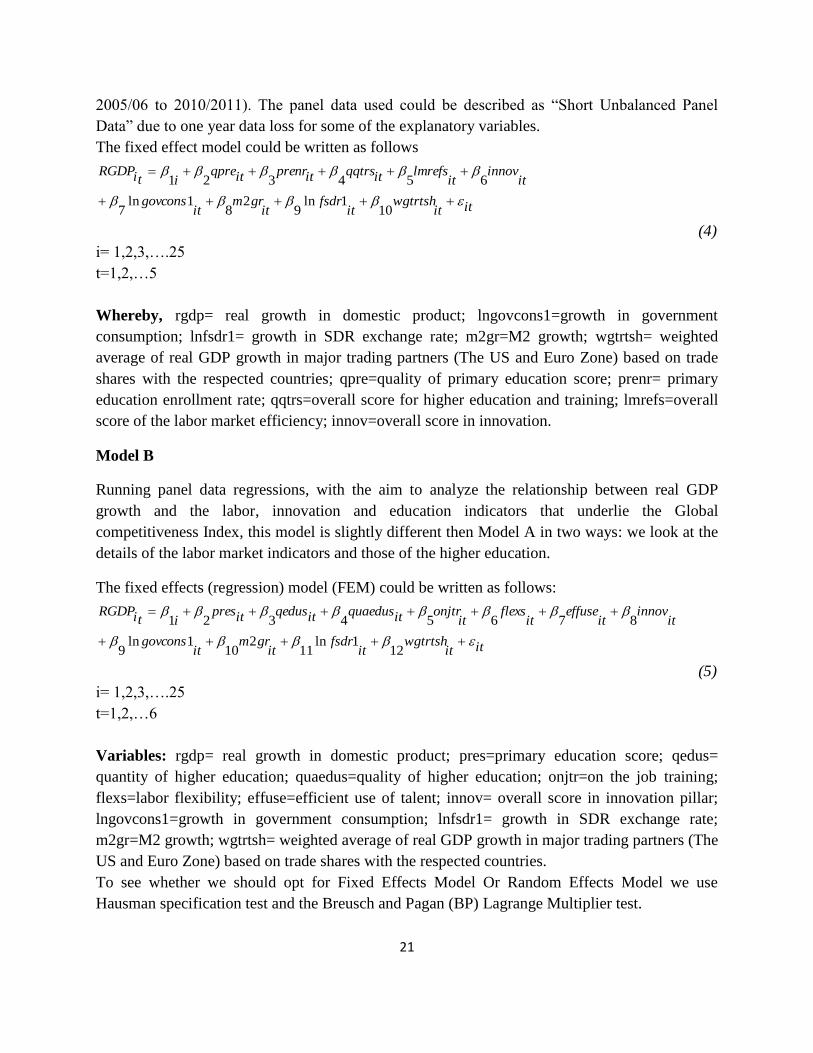
The fixed effect model could be written as follows
ititwgtrtsh
itfsdr
itgrm
itgovcons
itinnov
itlmrefsitqqtrsitprenritqpre
itiRGDP
101ln
92
81ln
7
654321
(4)
i= 1,2,3,….25
t=1,2,…5
Whereby, rgdp= real growth in domestic product; lngovcons1=growth in government
consumption; lnfsdr1= growth in SDR exchange rate; m2gr=M2 growth; wgtrtsh= weighted
average of real GDP growth in major trading partners (The US and Euro Zone) based on trade
shares with the respected countries; qpre=quality of primary education score; prenr= primary
education enrollment rate; qqtrs=overall score for higher education and training; lmrefs=overall
score of the labor market efficiency; innov=overall score in innovation.
Model B
Running panel data regressions, with the aim to analyze the relationship between real GDP
growth and the labor, innovation and education indicators that underlie the Global
competitiveness Index, this model is slightly different then Model A in two ways: we look at the
details of the labor market indicators and those of the higher education.
The fixed effects (regression) model (FEM) could be written as follows:
ititwgtrtsh
itfsdr
itgrm
itgovcons
itinnov
iteffuse
itflexs
itonjtritquaedusitqedusitpres
itiRGDP
121ln
112
101ln
9
87654321
(5)
i= 1,2,3,….25
t=1,2,…6
Variables: rgdp= real growth in domestic product; pres=primary education score; qedus=
quantity of higher education; quaedus=quality of higher education; onjtr=on the job training;
flexs=labor flexibility; effuse=efficient use of talent; innov= overall score in innovation pillar;
lngovcons1=growth in government consumption; lnfsdr1= growth in SDR exchange rate;
m2gr=M2 growth; wgtrtsh= weighted average of real GDP growth in major trading partners (The
US and Euro Zone) based on trade shares with the respected countries.
To see whether we should opt for Fixed Effects Model Or Random Effects Model we use
Hausman specification test and the Breusch and Pagan (BP) Lagrange Multiplier test.
22
Stage 4
In this stage, we run a regression model using Egypt’s specific time series data for the period
from 1980 to 2009 where the independent variable is the real gross domestic product (GDP)
growth and the explanatory variables are the following:
1- Education expenditure: two variables are chosen, education expenditure as a percentage
of GNI (eduexpgni) and public spending on education as a percentage of total spending
(pubspendedugdp)
2- Labor: youth employment (youthemp)
3- Innovation: number of patents per residents (patentappresidents)
4- Fiscal variable: growth of government consumption (lngovcons1)
5- Monetary variable: we take real M2 growth (m2gr)
6- External variable: foreign exchange (fxst) USD to LE whereby an increase indicates an
appreciation of the local currency.
6. Results
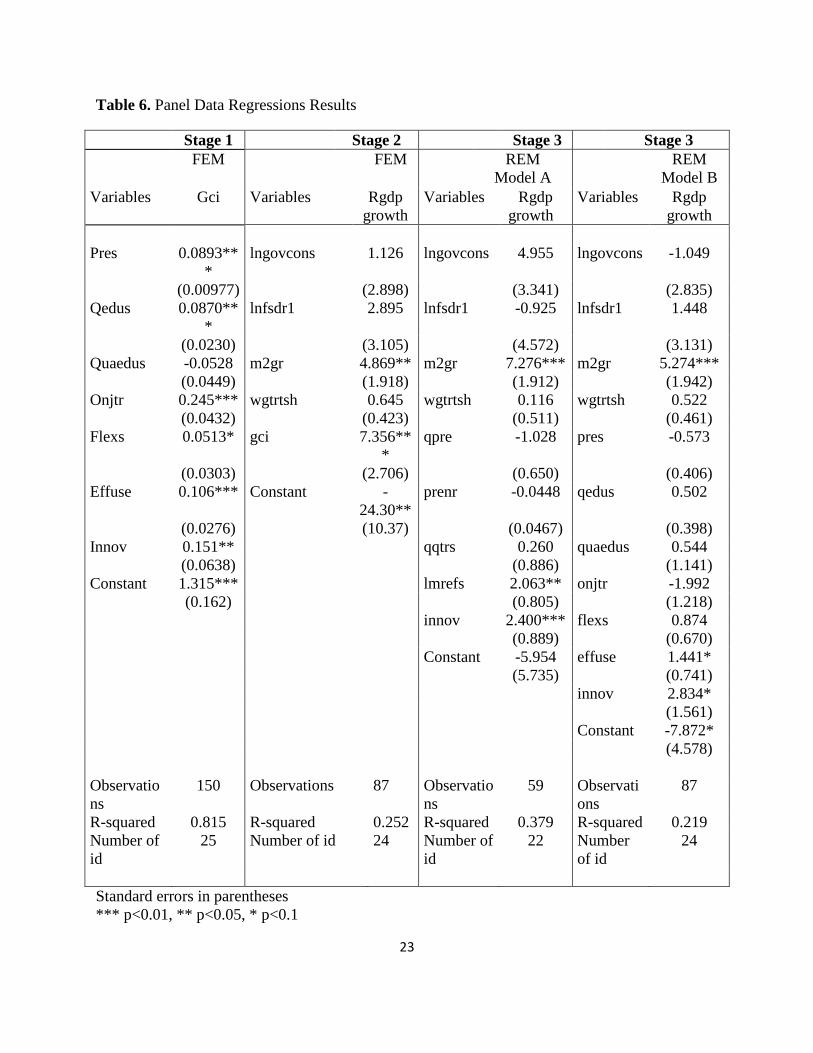
Running panel data regression models, our key results are summarized in Table 6.
Using Hausman specification test and the Breusch and Pagan (BP) Lagrange Multiplier test to
see whether we adopt the FEM or REM Model, the results indicate that both are equally valid22
.
Using the fixed effects regression, coefficients for all variables, with the exception of quality of
education, are significant at the 10 percent level. The regression coefficients that are highly
significant at the 1 percent level include primary education, quantity of higher education, on the
job training, and efficient use of talent. The multiple coefficient of determination R2 is very high.
The explanatory variables used in the model explain 81.5 percent of the variation of the global
competitiveness score. The F statistic value provides strong evidence that the model is significant
at both the one and five percent levels.
Our key finding from this stage of analysis is that improving primary education, quantity and
quality, positively affect the country’s competitiveness. Similarly, increasing the quantity of
higher education and on the job training will lead to greater competitiveness. Hence, Egypt
should aim to improve the quantity of primary education and the quality of education at all levels
and to increase on the job training to achieve greater competitiveness.
22
Results are presented in the Appendix.
23
Table 6. Panel Data Regressions Results
Stage 1 Stage 2 Stage 3 Stage 3
FEM FEM REM
Model A
REM
Model B
Variables Gci Variables Rgdp
growth
Variables Rgdp
growth
Variables Rgdp
growth
Pres 0.0893**
*
lngovcons 1.126 lngovcons 4.955 lngovcons -1.049
(0.00977) (2.898) (3.341) (2.835)
Qedus 0.0870**
*
lnfsdr1 2.895 lnfsdr1 -0.925 lnfsdr1 1.448
(0.0230) (3.105) (4.572) (3.131)
Quaedus -0.0528 m2gr 4.869** m2gr 7.276*** m2gr 5.274***
(0.0449) (1.918) (1.912) (1.942)
Onjtr 0.245*** wgtrtsh 0.645 wgtrtsh 0.116 wgtrtsh 0.522
(0.0432) (0.423) (0.511) (0.461)
Flexs 0.0513* gci 7.356**
*
qpre -1.028 pres -0.573
(0.0303) (2.706) (0.650) (0.406)
Effuse 0.106*** Constant -
24.30**
prenr -0.0448 qedus 0.502
(0.0276) (10.37) (0.0467) (0.398)
Innov 0.151** qqtrs 0.260 quaedus 0.544
(0.0638) (0.886) (1.141)
Constant 1.315*** lmrefs 2.063** onjtr -1.992
(0.162) (0.805) (1.218)
innov 2.400*** flexs 0.874
(0.889) (0.670)
Constant -5.954 effuse 1.441*
(5.735) (0.741)
innov 2.834*
(1.561)
Constant -7.872*
(4.578)
Observatio
ns
150 Observations 87 Observatio
ns
59
Observati
ons
87
R-squared 0.815 R-squared 0.252 R-squared 0.379 R-squared 0.219
Number of
id
25 Number of id 24 Number of
id
22 Number
of id
24
Standard errors in parentheses
*** p<0.01, ** p<0.05, * p<0.1
24
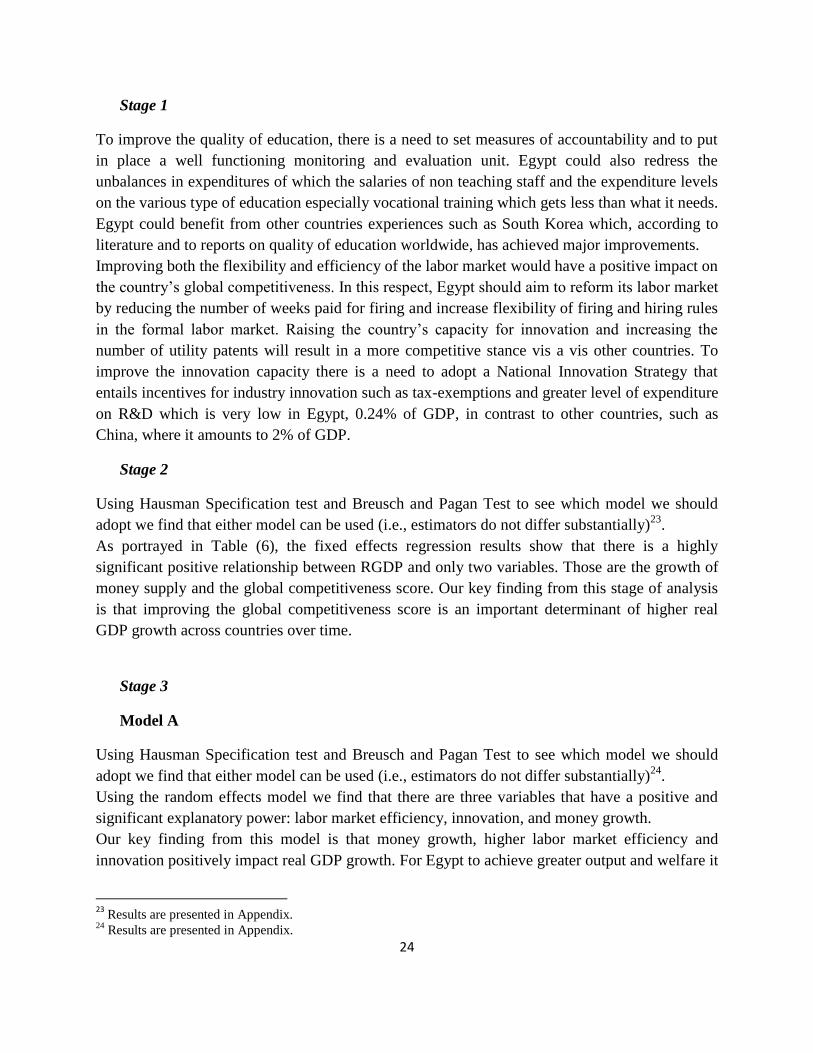
Stage 1
To improve the quality of education, there is a need to set measures of accountability and to put
in place a well functioning monitoring and evaluation unit. Egypt could also redress the
unbalances in expenditures of which the salaries of non teaching staff and the expenditure levels
on the various type of education especially vocational training which gets less than what it needs.
Egypt could benefit from other countries experiences such as South Korea which, according to
literature and to reports on quality of education worldwide, has achieved major improvements.
Improving both the flexibility and efficiency of the labor market would have a positive impact on
the country’s global competitiveness. In this respect, Egypt should aim to reform its labor market
by reducing the number of weeks paid for firing and increase flexibility of firing and hiring rules
in the formal labor market. Raising the country’s capacity for innovation and increasing the
number of utility patents will result in a more competitive stance vis a vis other countries. To
improve the innovation capacity there is a need to adopt a National Innovation Strategy that
entails incentives for industry innovation such as tax-exemptions and greater level of expenditure
on R&D which is very low in Egypt, 0.24% of GDP, in contrast to other countries, such as
China, where it amounts to 2% of GDP.
Stage 2
Using Hausman Specification test and Breusch and Pagan Test to see which model we should
adopt we find that either model can be used (i.e., estimators do not differ substantially)23
.
As portrayed in Table (6), the fixed effects regression results show that there is a highly
significant positive relationship between RGDP and only two variables. Those are the growth of
money supply and the global competitiveness score. Our key finding from this stage of analysis
is that improving the global competitiveness score is an important determinant of higher real
GDP growth across countries over time.
Stage 3
Model A
Using Hausman Specification test and Breusch and Pagan Test to see which model we should
adopt we find that either model can be used (i.e., estimators do not differ substantially)24
.
Using the random effects model we find that there are three variables that have a positive and
significant explanatory power: labor market efficiency, innovation, and money growth.
Our key finding from this model is that money growth, higher labor market efficiency and
innovation positively impact real GDP growth. For Egypt to achieve greater output and welfare it
23
Results are presented in Appendix. 24
Results are presented in Appendix.
25
should not only focus on improving its labor market overall efficiency, including the efficient
use of talent, but also, on labor market flexibility. The reform of the labor market would entail
several measures including addressing the mismatch between the labor market supply and
demand; encouraging private public partnerships in mega projects and supporting high growth
potential SMEs with the aim to create more jobs; the reform of the insurance legislation and
insurance practices; reviewing the labor law and facilitating the formalization of informal
businesses. Moreover, there is a need to match between the levels of labor productivity and level
of wages. In addition it is important to invest in innovation capacity, including investing in R&D
and strengthening capacity for research. It is also important to increase the efficient use of
scientists and engineers and to realize greater facilitation of registration of utility patents by
reducing the requirements and time required for patent registry.
Model B
Using Hausman Specification test and Breusch and Pagan Test to see which model we should
adopt we find that either model can be used (i.e., estimators do not differ substantially)25
. Based
on the results of the random effect model, we can see that there are three variables that have
positive significant effect on real GDP growth: money growth, efficient use of talent and
innovation. So the results of this modified model confirm our earlier findings in Model A.
Our key finding from this modified model is that the efficient use of talent is essential to realize
greater real GDP growth. Egypt should really focus on efficiently using its talents to achieve
greater economic output and welfare for its citizens, this could be achieved by assessing the
needs of the labor market and ensuring that the educational outcomes are in accordance with
market needs. As previously shown, based on indicators, Egypt is one of the worst countries in
the efficient use of talents. Brain drain, low female participation in the labor force, the low return
on education and high unemployment, especially among youth, are all problems that need to be
fixed. There is a need to establish a human development strategy that addresses those issues in
detail with key targets and time lines for implementation. As previously found in Model A,
improving Egypt’s innovation capacity could be a factor leading to greater real GDP growth.
Hence is the need to adopt a National Innovation Strategy.
Stage 4
Now that we have seen the panel data results, we would like to investigate further the
relationship between real GDP growth and education, labor and innovation indicators, using
time-series data for Egypt.
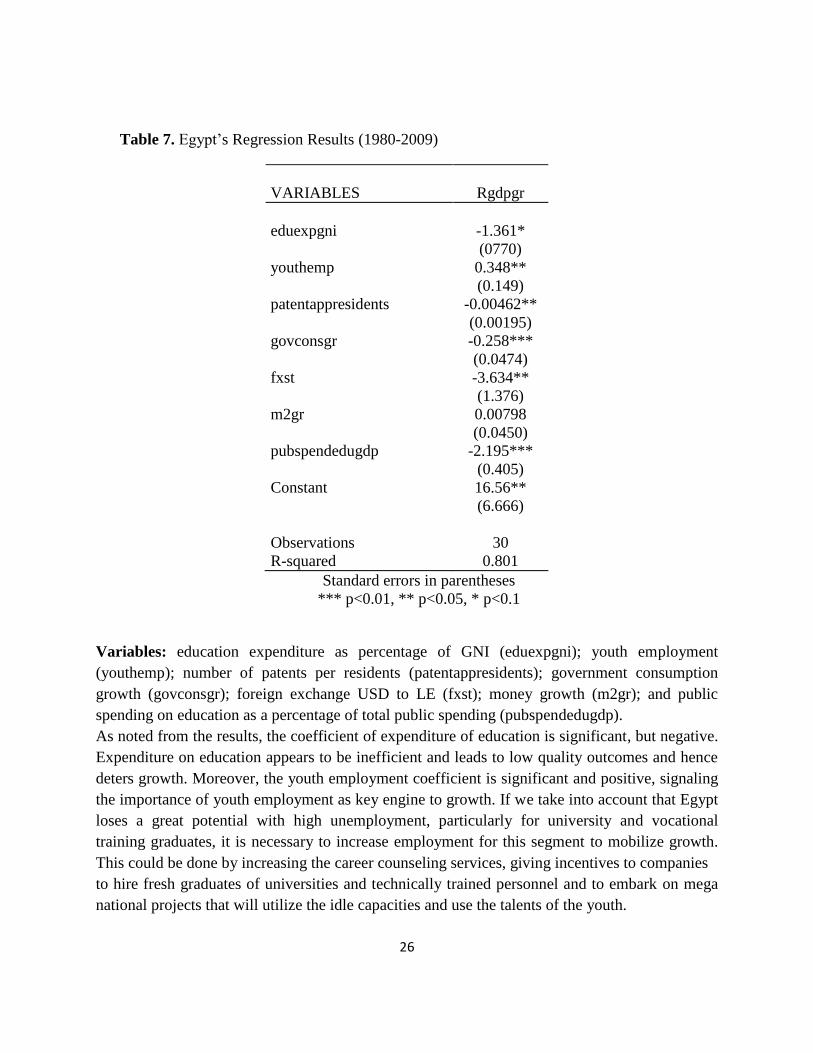
Running time series regression for the period 1980-2009, the results are portrayed in Table (7)
below.
25
Results are presented in Appendix.
26
Table 7. Egypt’s Regression Results (1980-2009)
VARIABLES Rgdpgr
eduexpgni -1.361*
(0770)
youthemp 0.348**
(0.149)
patentappresidents -0.00462**
(0.00195)
govconsgr -0.258***
(0.0474)
fxst -3.634**
(1.376)
m2gr 0.00798
(0.0450)
pubspendedugdp -2.195***
(0.405)
Constant 16.56**
(6.666)
Observations 30
R-squared 0.801
Standard errors in parentheses
*** p<0.01, ** p<0.05, * p<0.1
Variables: education expenditure as percentage of GNI (eduexpgni); youth employment
(youthemp); number of patents per residents (patentappresidents); government consumption
growth (govconsgr); foreign exchange USD to LE (fxst); money growth (m2gr); and public
spending on education as a percentage of total public spending (pubspendedugdp).
As noted from the results, the coefficient of expenditure of education is significant, but negative.
Expenditure on education appears to be inefficient and leads to low quality outcomes and hence
deters growth. Moreover, the youth employment coefficient is significant and positive, signaling
the importance of youth employment as key engine to growth. If we take into account that Egypt
loses a great potential with high unemployment, particularly for university and vocational
training graduates, it is necessary to increase employment for this segment to mobilize growth.
This could be done by increasing the career counseling services, giving incentives to companies
to hire fresh graduates of universities and technically trained personnel and to embark on mega
national projects that will utilize the idle capacities and use the talents of the youth.
27
Similarly, the coefficient for the change in foreign exchange, USD to LE, was found to be
negative and significant. An increase in this exchange rate indicates depreciation of the Egyptian
pound. Hence, a depreciation of the local currency will have a negative net effect on real GDP
growth. Depreciation increases the cost of imports and boosts exports competitiveness. The first
channel shrinks the output supply with a negative effect on growth while the second channel, if
effective, could stimulate growth. The evidence for Egypt indicates that higher cost of Imports
following depreciation outweighs the positive effect of depreciation on export competitiveness.
Moreover, the coefficient of number of patents per resident was found negative and significant.
This could be interpreted that the patents increase which remains negligible and is ineffective to
contribute to real growth. Therefore, for Egypt to catch up with more competitive economies, it
should focus on increasing its capacity for innovation by adopting a national innovation plan and
therefore, improve output growth. Egypt should design its own National Science, Technology
and Innovation Strategy (NSTI), such strategy shall aim at building a culture of innovation and
entrepreneurship, provides incentives that encourages industry and private sector to conduct
Research and Development (R&D) and raise the expenditure on R&D among others.
Scenarios
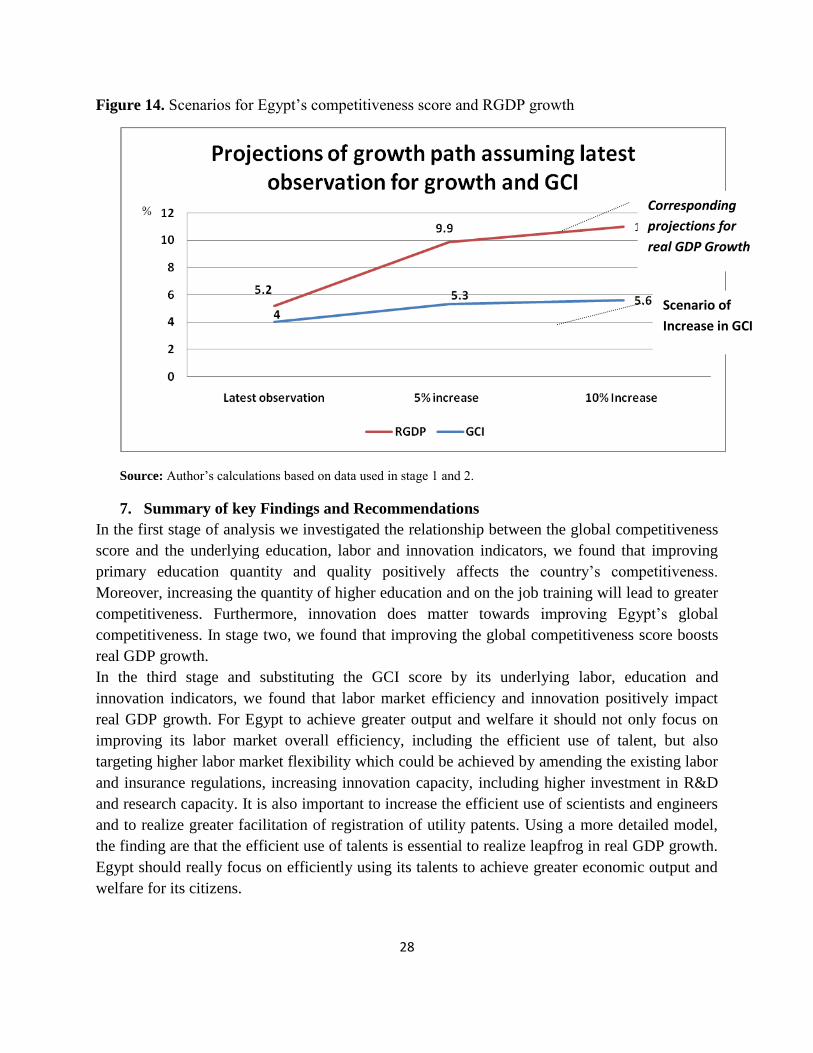
Given the confirmed relationship between Real GDP growth and the Global Competitiveness
score we want to see where Egypt would be in terms of competitiveness if it improves its labor,
innovation and education indicators by 5% or 10 % and the resulting effects on real GDP growth.
Using the last observation of GCI and RGDP that is the actual data for year 2009 obtained from
the Global Competitiveness Report 2010-2011, we assume an increase of 5 percent and 10
percent consecutively in education, labor and innovation indicators. We find that if Egypt were
to improve its education, labor and innovation indicators by 5% this would put the country at par
with countries like Canada, and Germany in terms of the global competitiveness score. This, in
turn, will translate into an expected real GDP growth of 9.9 %. If Egypt were to improve its
indicators for education, labor and innovation by 10% that would translate into greater
competitiveness similar to countries like Sweden and Singapore and will lead to a higher real
GDP growth rate in the vicinity of 11%. The implications are investing in education, labor and
innovation would pay-off and will lead to a realization of higher growth. Hence, those areas
should form part of the country’s priority going forward.
28
Figure 14. Scenarios for Egypt’s competitiveness score and RGDP growth
Source: Author’s calculations based on data used in stage 1 and 2.
7. Summary of key Findings and Recommendations
In the first stage of analysis we investigated the relationship between the global competitiveness
score and the underlying education, labor and innovation indicators, we found that improving
primary education quantity and quality positively affects the country’s competitiveness.
Moreover, increasing the quantity of higher education and on the job training will lead to greater
competitiveness. Furthermore, innovation does matter towards improving Egypt’s global
competitiveness. In stage two, we found that improving the global competitiveness score boosts
real GDP growth.
In the third stage and substituting the GCI score by its underlying labor, education and
innovation indicators, we found that labor market efficiency and innovation positively impact
real GDP growth. For Egypt to achieve greater output and welfare it should not only focus on
improving its labor market overall efficiency, including the efficient use of talent, but also
targeting higher labor market flexibility which could be achieved by amending the existing labor
and insurance regulations, increasing innovation capacity, including higher investment in R&D
and research capacity. It is also important to increase the efficient use of scientists and engineers
and to realize greater facilitation of registration of utility patents. Using a more detailed model,
the finding are that the efficient use of talents is essential to realize leapfrog in real GDP growth.
Egypt should really focus on efficiently using its talents to achieve greater economic output and
welfare for its citizens.
Corresponding
projections for
real GDP Growth
Scenario of
Increase in GCI
29
Examining Egypt specific data for the period 1980-2009, our results stress the inefficiency of
public expenditure on education and that youth employment is a catalyst for growth. Hence is the
need to raise the efficiency and level of expenditure on education and the importance of
decreasing unemployment, particularly among the youth. This could be done by increasing the
career counseling services, giving incentives to companies to hire fresh graduates of universities
and technically trained personnel and to embark on mega national projects that will utilize the
idle capacities and use the talents of the youth. Moreover, patents per residents, as a proxy for
innovation, were found to be ineffective, to contribute to growth. Therefore, for Egypt to catch
up with more competitive economies, it should focus on increasing its capacity for innovation by
adopting a national innovation plan towards boosting output growth.
In summary, there are a number of factors that hinder the efficient use of the abundant human
capital. The poor quality of education, the inefficiency of the labor market and weak innovation
are all contributing to poor utilization of Egypt’s greatest asset, i.e., human capital. This, in turn,
affects the country’s competitiveness negatively and leads to low productivity and output
growth.
In order to address this situation and to attain higher levels of competitiveness and achieve
greater real GDP growth, Egypt should invest heavily in education, on the job training and
innovation. Increasing the efficiency and actual expenditure on education and R&D is a priority.
Addressing the chronic mismatch between the supply and demand in the labor market and
employing the youth, especially those with vocational training and university graduates, is
essential for greater productivity and higher output growth. Moreover, there is a need to
reexamine labor market policies to allow for policies that are more conducive to employment.
Increasing female participation in the labor market by addressing social values and facilitating
flexible hours, increasing the opportunities for qualified and talented labor and professionals to
reduce the brain drain and reducing firing costs are all recommendations for a more flexible and
efficient labor market. Improving the capacity for innovation, whether by increasing the
expenditure on R&D or by increasing the collaboration between industry and universities, and
facilitating the patents registry and increasing the quality and quantity of scientists and engineers
are all measures that will lead to greater innovation enhancement and would, in turn, lead to
greater productivity and competitiveness.
At a time of change, removing the blocks that hinder the improvement of education, address
labor and mobilize innovation incentives should help achieve better quality of education, greater
labor market efficiency and higher capacity for innovation towards greater competitiveness and
higher growth. Indeed, if Egypt realizes a five percent improvement in its education, labor and
innovation indicators, the country would surpass efficiency driven economies, and be at par with
innovation driven economies, achieving a higher real GDP growth in the vicinity of 9.9 percent
and, thereby, increasing the scope for greater employment and higher welfare. Egypt could well
benefit from other countries experiences, such as in South Korea, in terms of improving the
quality of education or in terms of raising the capacity for innovation, such in Brazil.
30
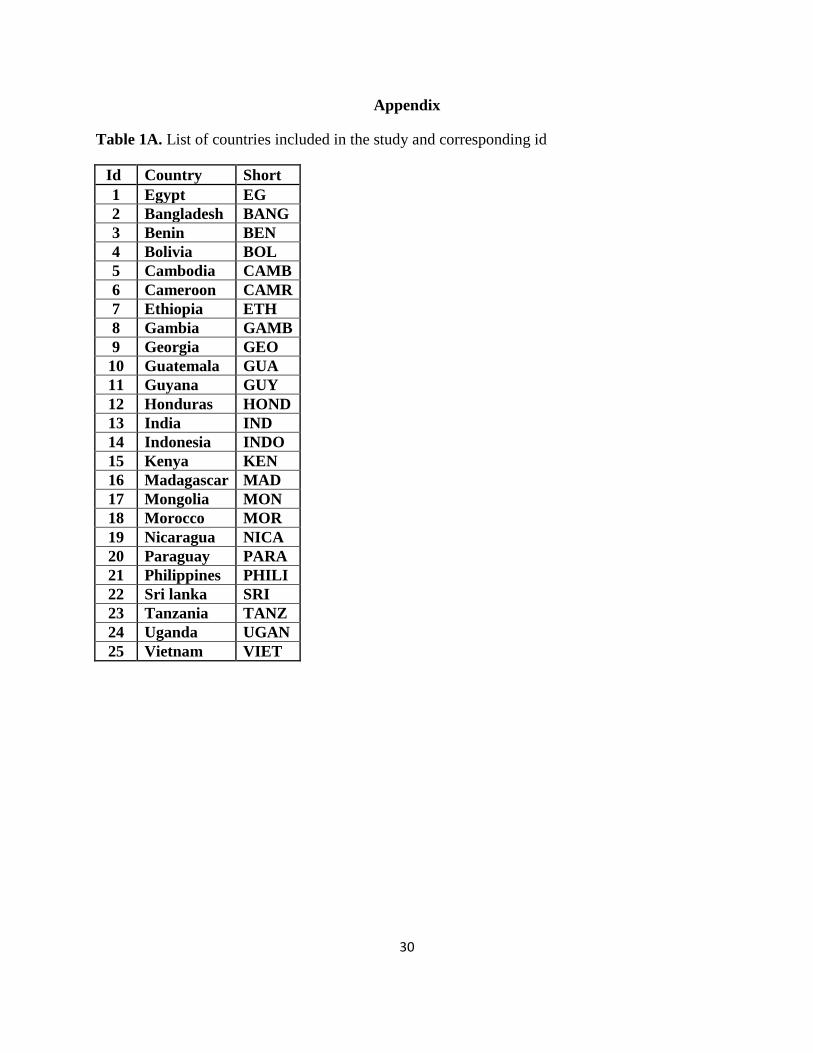
Appendix
Table 1A. List of countries included in the study and corresponding id
Id Country Short
1 Egypt EG
2 Bangladesh BANG
3 Benin BEN
4 Bolivia BOL
5 Cambodia CAMB
6 Cameroon CAMR
7 Ethiopia ETH
8 Gambia GAMB
9 Georgia GEO
10 Guatemala GUA
11 Guyana GUY
12 Honduras HOND
13 India IND
14 Indonesia INDO
15 Kenya KEN
16 Madagascar MAD
17 Mongolia MON
18 Morocco MOR
19 Nicaragua NICA
20 Paraguay PARA
21 Philippines PHILI
22 Sri lanka SRI
23 Tanzania TANZ
24 Uganda UGAN
25 Vietnam VIET
31
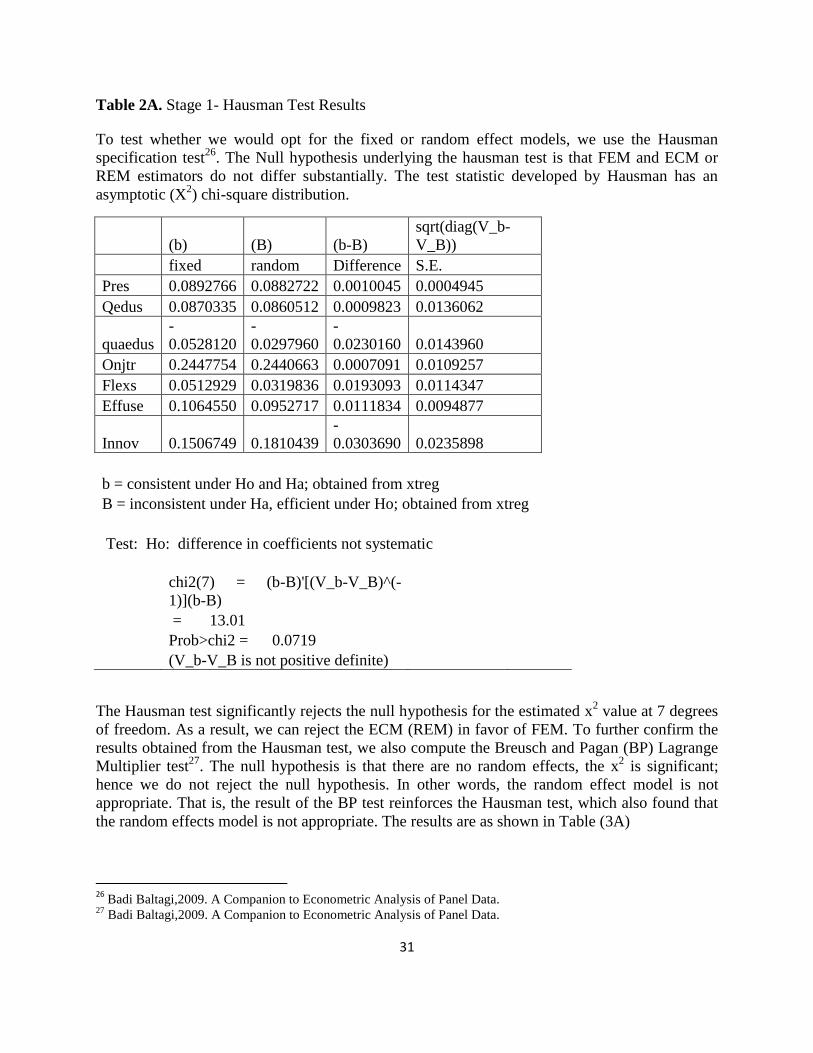
Table 2A. Stage 1- Hausman Test Results
To test whether we would opt for the fixed or random effect models, we use the Hausman
specification test26
. The Null hypothesis underlying the hausman test is that FEM and ECM or
REM estimators do not differ substantially. The test statistic developed by Hausman has an
asymptotic (X2) chi-square distribution.
(b) (B) (b-B)
sqrt(diag(V_b-
V_B))
fixed random Difference S.E.
Pres 0.0892766 0.0882722 0.0010045 0.0004945
Qedus 0.0870335 0.0860512 0.0009823 0.0136062
quaedus
-
0.0528120
-
0.0297960
-
0.0230160 0.0143960
Onjtr 0.2447754 0.2440663 0.0007091 0.0109257
Flexs 0.0512929 0.0319836 0.0193093 0.0114347
Effuse 0.1064550 0.0952717 0.0111834 0.0094877
Innov 0.1506749 0.1810439
-
0.0303690 0.0235898
b = consistent under Ho and Ha; obtained from xtreg
B = inconsistent under Ha, efficient under Ho; obtained from xtreg
Test: Ho: difference in coefficients not systematic
chi2(7) = (b-B)'[(V_b-V_B)^(-
1)](b-B)
= 13.01
Prob>chi2 = 0.0719
(V_b-V_B is not positive definite)
The Hausman test significantly rejects the null hypothesis for the estimated x2 value at 7 degrees
of freedom. As a result, we can reject the ECM (REM) in favor of FEM. To further confirm the
results obtained from the Hausman test, we also compute the Breusch and Pagan (BP) Lagrange
Multiplier test27
. The null hypothesis is that there are no random effects, the x2 is significant;
hence we do not reject the null hypothesis. In other words, the random effect model is not
appropriate. That is, the result of the BP test reinforces the Hausman test, which also found that
the random effects model is not appropriate. The results are as shown in Table (3A)
26
Badi Baltagi,2009. A Companion to Econometric Analysis of Panel Data. 27
Badi Baltagi,2009. A Companion to Econometric Analysis of Panel Data.
32
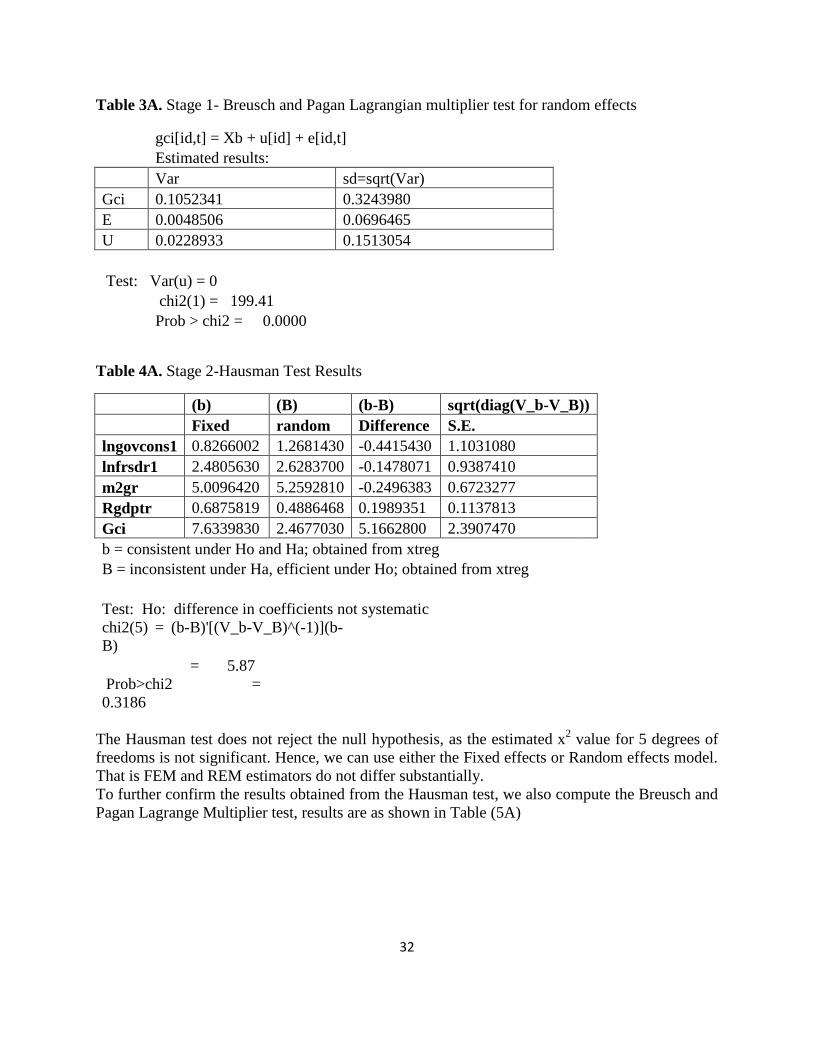
Table 3A. Stage 1- Breusch and Pagan Lagrangian multiplier test for random effects
gci[id,t] = Xb + u[id] + e[id,t]
Estimated results:
Var sd=sqrt(Var)
Gci 0.1052341 0.3243980
E 0.0048506 0.0696465
U 0.0228933 0.1513054
Test: Var(u) = 0
chi2(1) = 199.41
Prob > chi2 = 0.0000
Table 4A. Stage 2-Hausman Test Results
(b) (B) (b-B) sqrt(diag(V_b-V_B))
Fixed random Difference S.E.
lngovcons1 0.8266002 1.2681430 -0.4415430 1.1031080
lnfrsdr1 2.4805630 2.6283700 -0.1478071 0.9387410
m2gr 5.0096420 5.2592810 -0.2496383 0.6723277
Rgdptr 0.6875819 0.4886468 0.1989351 0.1137813
Gci 7.6339830 2.4677030 5.1662800 2.3907470
b = consistent under Ho and Ha; obtained from xtreg
B = inconsistent under Ha, efficient under Ho; obtained from xtreg
Test: Ho: difference in coefficients not systematic
chi2(5) = (b-B)'[(V_b-V_B)^(-1)](b-
B)
= 5.87
Prob>chi2 =
0.3186
The Hausman test does not reject the null hypothesis, as the estimated x2 value for 5 degrees of
freedoms is not significant. Hence, we can use either the Fixed effects or Random effects model.
That is FEM and REM estimators do not differ substantially.
To further confirm the results obtained from the Hausman test, we also compute the Breusch and
Pagan Lagrange Multiplier test, results are as shown in Table (5A)
33
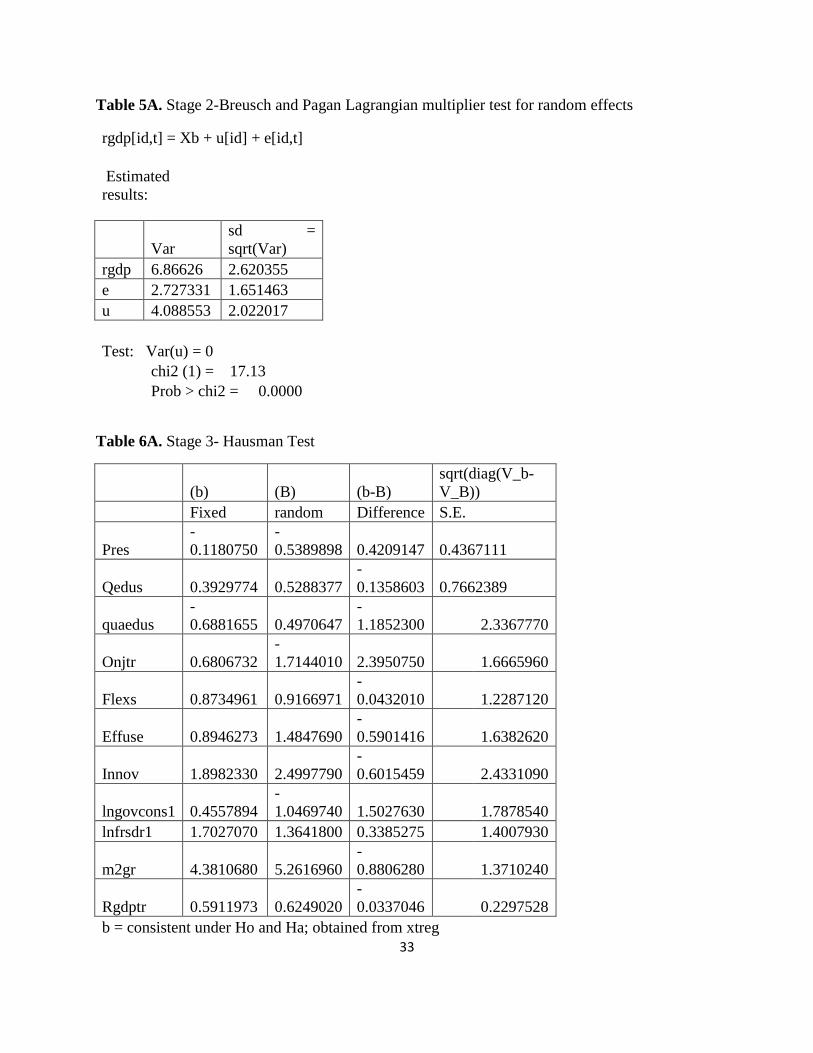
Table 5A. Stage 2-Breusch and Pagan Lagrangian multiplier test for random effects
rgdp[id,t] = Xb + u[id] + e[id,t]
Estimated
results:
Var
sd =
sqrt(Var)
rgdp 6.86626 2.620355
e 2.727331 1.651463
u 4.088553 2.022017
Test: Var(u) = 0
chi2 (1) = 17.13
Prob > chi2 = 0.0000
Table 6A. Stage 3- Hausman Test
(b) (B) (b-B)
sqrt(diag(V_b-
V_B))
Fixed random Difference S.E.
Pres
-
0.1180750
-
0.5389898 0.4209147 0.4367111
Qedus 0.3929774 0.5288377
-
0.1358603 0.7662389
quaedus
-
0.6881655 0.4970647
-
1.1852300 2.3367770
Onjtr 0.6806732
-
1.7144010 2.3950750 1.6665960
Flexs 0.8734961 0.9166971
-
0.0432010 1.2287120
Effuse 0.8946273 1.4847690
-
0.5901416 1.6382620
Innov 1.8982330 2.4997790
-
0.6015459 2.4331090
lngovcons1 0.4557894
-
1.0469740 1.5027630 1.7878540
lnfrsdr1 1.7027070 1.3641800 0.3385275 1.4007930
m2gr 4.3810680 5.2616960
-
0.8806280 1.3710240
Rgdptr 0.5911973 0.6249020
-
0.0337046 0.2297528
b = consistent under Ho and Ha; obtained from xtreg
34
B = inconsistent under Ha, efficient under Ho; obtained from xtreg
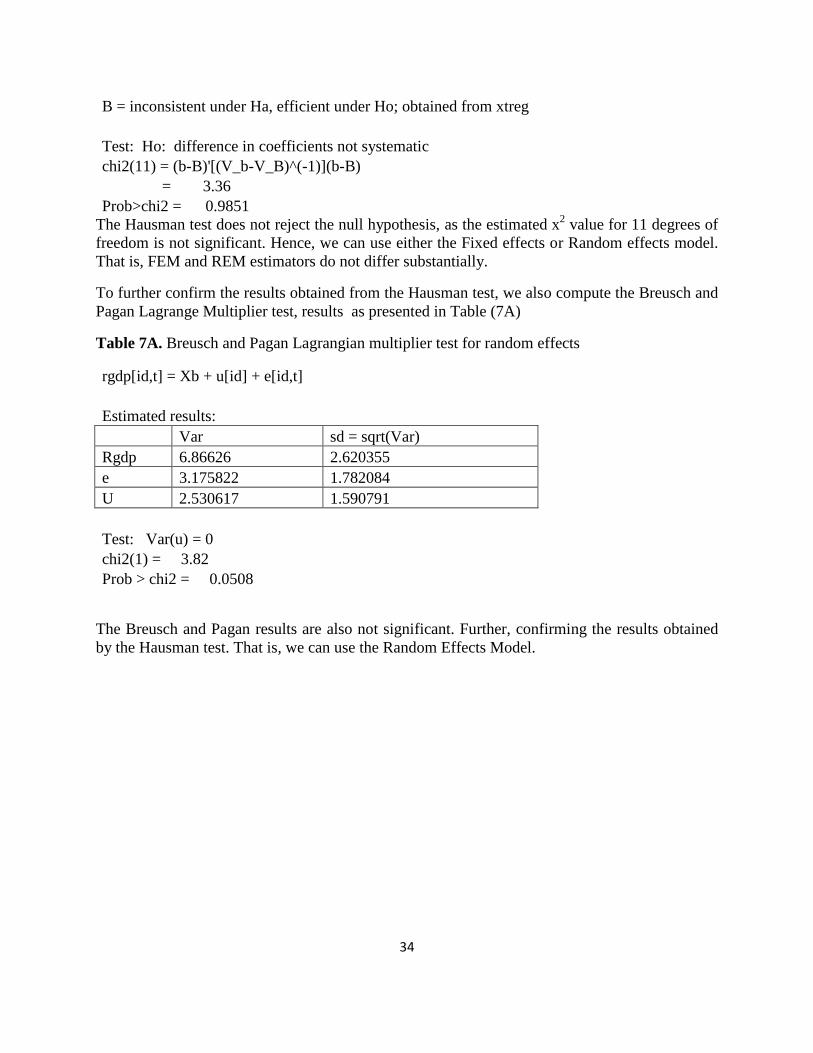
Test: Ho: difference in coefficients not systematic
chi2(11) = (b-B)'[(V_b-V_B)^(-1)](b-B)
= 3.36
Prob>chi2 = 0.9851
The Hausman test does not reject the null hypothesis, as the estimated x2 value for 11 degrees of
freedom is not significant. Hence, we can use either the Fixed effects or Random effects model.
That is, FEM and REM estimators do not differ substantially.
To further confirm the results obtained from the Hausman test, we also compute the Breusch and
Pagan Lagrange Multiplier test, results as presented in Table (7A)
Table 7A. Breusch and Pagan Lagrangian multiplier test for random effects
rgdp[id,t] = Xb + u[id] + e[id,t]
Estimated results:
Var sd = sqrt(Var)
Rgdp 6.86626 2.620355
e 3.175822 1.782084
U 2.530617 1.590791
Test: Var(u) = 0
chi2(1) = 3.82
Prob > chi2 = 0.0508
The Breusch and Pagan results are also not significant. Further, confirming the results obtained
by the Hausman test. That is, we can use the Random Effects Model.
35
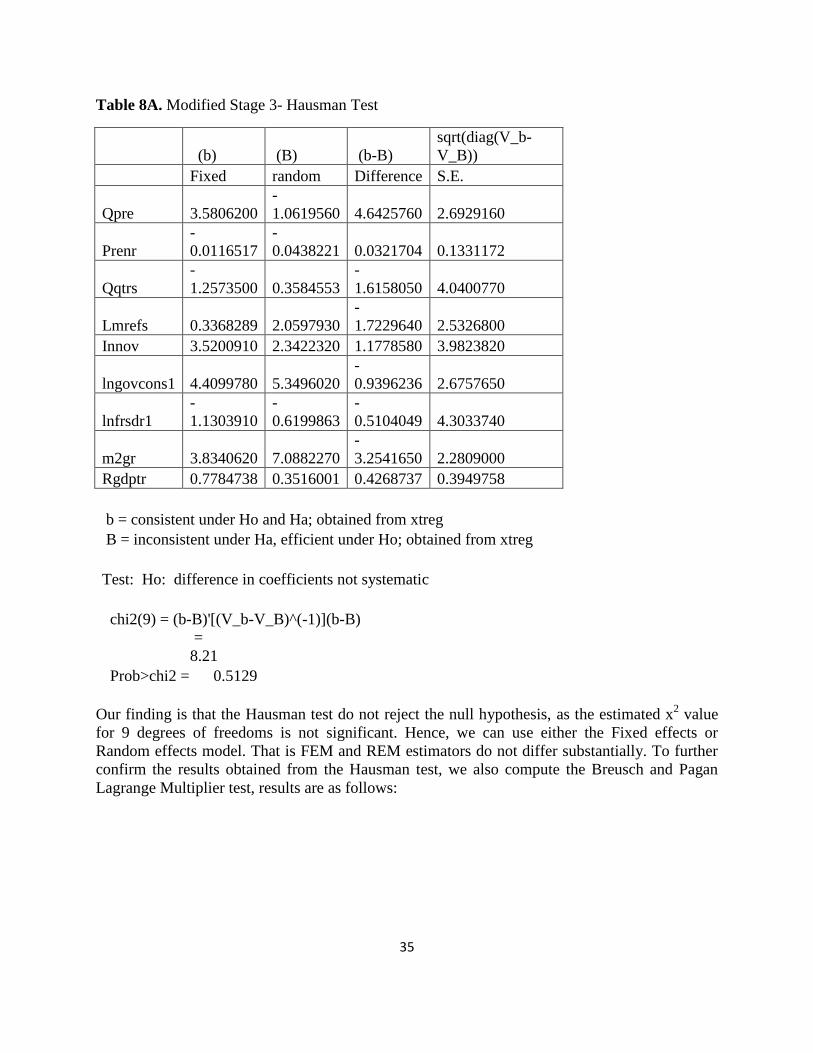
Table 8A. Modified Stage 3- Hausman Test
(b) (B) (b-B)
sqrt(diag(V_b-
V_B))
Fixed random Difference S.E.
Qpre 3.5806200
-
1.0619560 4.6425760 2.6929160
Prenr
-
0.0116517
-
0.0438221 0.0321704 0.1331172
Qqtrs
-
1.2573500 0.3584553
-
1.6158050 4.0400770
Lmrefs 0.3368289 2.0597930
-
1.7229640 2.5326800
Innov 3.5200910 2.3422320 1.1778580 3.9823820
lngovcons1 4.4099780 5.3496020
-
0.9396236 2.6757650
lnfrsdr1
-
1.1303910
-
0.6199863
-
0.5104049 4.3033740
m2gr 3.8340620 7.0882270
-
3.2541650 2.2809000
Rgdptr 0.7784738 0.3516001 0.4268737 0.3949758
b = consistent under Ho and Ha; obtained from xtreg
B = inconsistent under Ha, efficient under Ho; obtained from xtreg
Test: Ho: difference in coefficients not systematic
chi2(9) = (b-B)'[(V_b-V_B)^(-1)](b-B)
=
8.21
Prob>chi2 = 0.5129
Our finding is that the Hausman test do not reject the null hypothesis, as the estimated x2 value
for 9 degrees of freedoms is not significant. Hence, we can use either the Fixed effects or
Random effects model. That is FEM and REM estimators do not differ substantially. To further
confirm the results obtained from the Hausman test, we also compute the Breusch and Pagan
Lagrange Multiplier test, results are as follows:
36
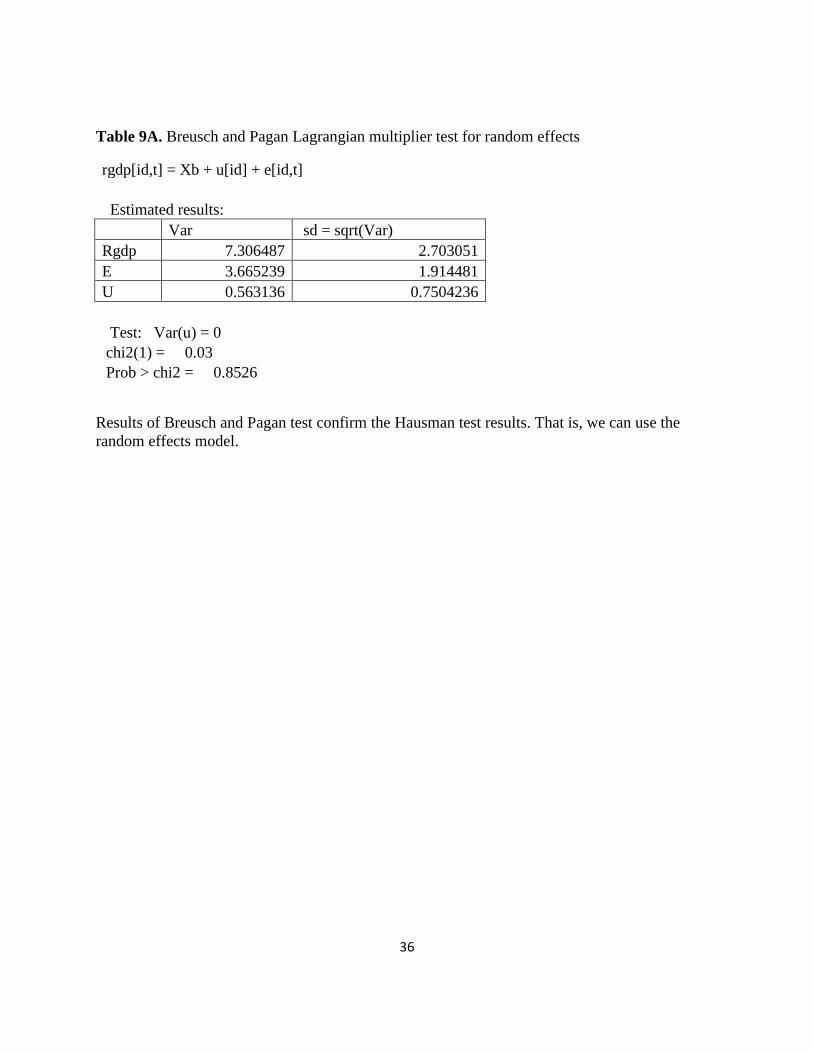
Table 9A. Breusch and Pagan Lagrangian multiplier test for random effects
rgdp[id,t] = Xb + u[id] + e[id,t]
Estimated results:
Var sd = sqrt(Var)
Rgdp 7.306487 2.703051
E 3.665239 1.914481
U 0.563136 0.7504236
Test: Var(u) = 0
chi2(1) = 0.03
Prob > chi2 = 0.8526
Results of Breusch and Pagan test confirm the Hausman test results. That is, we can use the
random effects model.
37
References
Baltagi, Badi (2009). A Companion to Econometric Analysis of Panel Data.
Egypt’s Business Climate Development Strategy, July 2010. MENA-OECD Investment Programme.
ERF Policy Research Report No. 34, July 2010. Financing Higher Education in Arab Countries. Edited by Ahmed
Galal and Taher Kanaan.
Gujarati, D. and Porter D. (2009). Basic Econometrics, Fifth Edition. McGraw Hill International Edition.
INSEAD. Global Innovation Report 2009-2010. http://www.globalinnovationindex.org
Situation Analysis : Key Development, Challenges Facing Egypt, 2010. Lead Author Professor Heba Handoussa.
The World Bank, 2007. Egypt Education Sector Policy Note. “Improving Quality, Equality, and Efficiency in
Education Sector: Fostering a Competent Generation of Youth”.
The World Bank (2007). World Development Report. Washington D.C.
World Economic Forum. The Global Competitiveness Report. Issues of years (2004-2005, 2005-2006, 2006-2007,
2007-2008, 2008-2009, 2009-2010, 2010-2011).