Embed Size (px)
Citation preview
CPL CHEMISTRY AND
Chemistry and Physics of Lipids PHYSICS OF LIPIDS E L S E V I E R 82 (1996) 147 162
Effect of 1-palmitoyl lysophosphatidylcholine on phase properties of 1,2-dipalmitoyl phosphatidylethanolamine: a
thermodynamic and NMR study
A. ChecchettP, A. Golemme ~, G. Chidichimo ~', C. LaRosa b, D. Grasso h, P. W. W e s t e r m a n c'*
~Dipartimento di Chimiea, Universit[t della Calabria, 87036 Arca~aeata di Rende (Cs) llalv bDipartimento di Seienze Chimiehe, Universitgt eli Catania, via A. Doria 8, Catankt, Italy
~ Department o/' Biochemistry, Northeastern Ohio Universities College o f Medic#w, P.O. Box 95, Rootstown. 0 t t 44272. USA
Received 25 March 1996: revised 20 May 1996: accepted 20 May 1996
Abstract
The effect of 1-palmitoyl lysophosphatidylcholine (PLPC) on the phase behaviour of 1,2-dipalmitoyl phos- phatidylethanolamine (DPPE) in excess water (34 wt%) has been examined by differential scanning calorimetry, scanning dilatometry and isothermal compressibility measurements. Mole percentages of PLPC in DPPE between 14 and 62% have been studied over the temperature range 30-75°C. The temperature dependence of orientational ordering at selected sites in 2H-labelled PLPC and 2H20 has been determined from measurement of time-averaged chemical shift anisotropies and quadrupole splittings in the 3~p_ and 2H-NMR spectra. These data have been used to further characterize phase behaviour. At less than equimolar contents of PLPC, when a single phase transition with a reduced transition temperature is observed, spectral and calorimetric data indicate complete miscibility of the two lipid components. An equimolar mixture of PLPC and DPPE shows a sharp first order transition at 47.3°C and a second order transition at 62.5°C. NMR data are consistent with the existence of a defective bilayer at intermediary temperatures. In this range it is proposed that PLPC molecules prefer regions with high curvature in the vicinity of the defects, while DPPE molecules are mostly confined to flatter regions of the bilayer. A possible molecular model is described. At temperatures above 62.5°C, PLPC and DPPE are completely miscible and exist as lamellae. At higher PLPC content ( > 50 mol"/,,), thermodynamic and spectral data are indicative of phase separation of the two components over the temperature range examined.
Kevwords: Lysolecithin; Phosphatidylethanolamine: 2H-NMR: ~Ip-NMR; DSC: Lipid bilayers
Abt~ret'iations: CSA, chemical shift anisotropy; DPPC, 1,2-dipalmitoyl-sn-glycero-3-phosphocholine: DPPE, 1,2-dipalmitoyl phosphatidylethanolamine or 1,2-dipalmitoyl-sn-glycero-3-phosphoethanolamine; DSC, differential scanning calorimetry: ESR, electron spin resonance: IC, isothermal compressibility; NMR, nuclear magnetic resonance: PLPC, l-palmitoyl phosphatidylcholine or 1-palmitoyl-sn-glycero-3-phosphocholine; SD, scanning dilatometry: TLC, thin-layer chromatography.
* Corresponding author.
0009-3084 96/$15.00 ,'<: 1996 Elsevier Science Ireland Ltd. All rights reserved Pll S0009-3084(96)02574-1
148 A. Checchetti et al./ Chemistry and Physics q/Lipids 82 (1996) 147 162
1. Introduction nounced influence on the phase properties and miscibility of different phospholipid classes [20].
Lysophosphatidylcholine (LPC) is an impor- Epand [29], reported that relatively small tant metabolite, produced by many cells and amounts of l-palmitoyl lysophosphatidylcholine widely distributed in a variety of tissues [1]. Yet (PLPC) significantly raised the bilayer to hexag- its functional role is poorly understood. Earlier onal phase transition temperature of two phos- studies in biological systems showed that at phatidylethanolamines, but had little effect on lower concentrations in a membrane, LPC pro- the gel-state to liquid crystalline-state transition motes cell fusion [2-4], whereas at higher con- temperature. The observed increase in the bi- centrations it destabilizes membrane structure layer to hexagonal phase transition was qualita- resulting in morphological changes [5,6], alter- tively interpreted in terms of a contraction in ations in permeability properties [7,8], and ulti- the hydrophobic domain, with a corresponding mately in cell lysis [9-12]. Recently it has been decrease in the hydrophilic surface area, when shown that LPC, added to the contacting mono- LPC is intercalated into phosphatidylethanol- layers of fusing membranes, inhibited the hemi- amine bilayers. fusion observed between lipid vesicles and We decided to better characterize the interac- planar membranes [13,14]. The effects of LPC tions of LPC with phosphatidylethanolamine by have been rationalized mostly in terms of its using differential scanning calorimetry (DSC)0 °wedge' shape [15-17], which, when inserted into scanning dilatometry (SD), isothermal compress- planar phospholipid bilayers, promotes a micel- ibility (IC) measurements, 3~p nuclear magnetic lar positive curvature and induces structural resonance (NMR) and 2H-NMR to define the changes and lamellar disruption. Attention has phase properties of several lipid binary mixtures focused mostly on the interaction of LPC with in the presence of water. Our results suggest phosphatidylcholine bilayers, this system having that the interaction of LPC with phos- been investigated by electron microscopy [12,18], phatidylethanolamine could be physiologically DSC [19,20], light scattering [4,21], X-ray [21] , significant and may provide the key to an un- fluorescence [8], ESR [22], and NMR [7,8,18,23]. derstanding of the role of LPC in cell mere- One of the principal findings has been the ob- brane fusion and lysis. servation that LPC in unilamellar vesicles of phosphatidylcholine prefers the outer bilayer
leaflet [23-28]. 2. Materials and methods The interaction of LPC with phos-
phatidylethanolamine has received much less at- tention. An early report by Blume et al. [20] 2.1. Mater&& found that the addition of 5% (w/w) desoxyLPC to an equimolar mixture of 1,2-dipalmitoyl Unlabelled DPPC was obtained from Sigma phosphatidylcholine (DPPC)and 1,2-dipalmitoyl Chemicals (Milan, Italy) and unlabelled DPPE phosphatidylethanolamine (DPPE)changed the and PLPC from Avanti Polar Lipids, Inc. calorimetric scan from a single peak into one (Birmingham, AL). Deuterated solutes and with three peaks. This observation indicated that reagents (C2H3I, 2H20 ) were purchased from a separation of three phases with different corn- Aldrich Chemical Co. (Milwaukee, WI). The positions had occurred. A consideration of purity of commercial and synthetic materials phase transition temperatures and enthalpy val- was checked by TLC analysis using Absorbosil ues led the authors to conclude that the effect Plus-l-silica gel plates (Applied Sciences). Chlo- of LPC on lipid membranes is highly complex roform/methanol water (65:25:4, v/v) was era- and probably depends on the lengths of the acyl ployed as the solvent system and molybdenum chains of both phospholipid and LPC moieties, blue and iodine vapor were used to visualize Relatively small amounts of LPC have a pro- spots.
A. Checchetti et al. / Chemistry and Physics qf Lipids 82 (1996) 147 162 149
2.2. Sample preparation tially of a film on the round-bot tom flask, was converted to a white powder by repetitive evapo-
Appropriate quantities of the dry lipids were rations of small amounts of diethyl ether. dissolved in chloroform/methanol (95:5, v/v). Sol- vent was evaporated in vacuo and the residue 2.4. S!,nthesis q/ 'PLPC-d,~ dried under high vacuum for 24 h. The necessary amount of water to give a final concentration of In a small round-bot tom flask equipped with a 34 wt% was mixed with the lipids in a 7.5-mm reflux condenser and a magnetic stirrer, a solution glass tube. The tube was flame sealed and the of DPPC (454 rag) in ether (98 ml) and methanol contents mixed by centrifugation back and forth (6 ml) was mixed with a suspension of phospholi- at a temperature slightly above the main phase pase A~ (from Crotalus adamanteus) in 0.1 M transition temperature, until homogeneity had borate buffer (24.5 ml; pH = 7.4). The two-phase been achieved. This process usually took about a system was vigorously stirred at 37°C for 5 h. day. Analysis by TLC of a small sample removed from
The samples were then allowed to stand an- the organic layer indicated the reaction was corn- other day at the same temperature before making plete. The layers were separated in a separating N M R measurements. A second series of N M R funnel, and the lower aqueous phase washed with spectra of the samples were recorded 4 weeks ether. This aqueous layer was spun on the rotary later, evaporator to remove dissolved ether, then frozen
and lyophilized. The resulting yellow powder was 2.3. ,~vnthesis q f D P P C - d ~ chromatographed on silica gel which had been
specially prepared by washing silicic acid with 6 N A solution of DPPE (500 mg) in chloroform hydrochloric acid and 28% (w/w) ammonium hy-
(3.75 ml) was added to a solution of 1 M Na2CO~ droxide. Elution with chloroform/methanol (1:1, (12.5 ml), 2-propanol (10 ml) and dimethylfor- w,'v) gave the product which showed a single spot mamide (6.25 ml) in a 50-ml round-bot tom flask, on TLC. equipped with a reflux condenser and magnetic stirrer. The reaction vessel was kept at ambient 2.5. Scanning dilatometric measurements temperature while iced water was circulated through the reflux condenser. After stirring for A Mettler TCIOA processor equipped with a about 30 min, the solution became homogeneous, TMA40 thermomechanical analyzer, previously and cold methyl-d~ iodide (0.5 ml) was added with calibrated for temperature and length, was used to a pre-cooled syringe. Stirring was continued while obtain measurements of length as a ['unction of samples were periodically removed for analysis by temperature at constant pressure. The analyzer TLC. The DPPE was almost completely methy- was interfaced with an IBM-XT computer with a lated after 4 h. After stirring for an additional 12 sampling rate of 0.329 points per second. A h, water (10 ml) and chloroform (10 ml) were quartz cylinder with a tight but freely movable added. The resulting two layers were separated in piston was used as the sample holder. The move- a separating funnel. The lower layer was filtered ment of the piston was measured as a change in to remove the precipitate of sodium iodide, and sample length. Further details are reported else- the organic solvents removed in vacuo. The crude where [30]. The sensitivity and reproducibility of product was chromatographed on silica gel (Bio- the scanning dilatometer, in the configuration de- Rad; 200 400 mesh). Pure DPPC-d, (single spot scribed, are 3.2 x 10 ~ ml and 0.2%, respec- on TLC) was eluted with chloroform/methanol tively. The temperature precision and stability (7/3). Residual dimethylformamide and other ira- were +0 .2 and +0.01, respectively. Each scan purities were first removed by elution with chloro- was recorded over the range, 25 80°C, at a rate form, and chloroform/methanol mixtures of 9:1 of 0.5°C/min. About 10 mg of sample were used (vv ) and 8:2 (v/v). The product, consisting ini- in each experiment.
150 A. Checchetti et al./ Chemistry and Physics o/ Lipids 82 (1996) 147 162
2.6. Compressibility measurements 3. Results
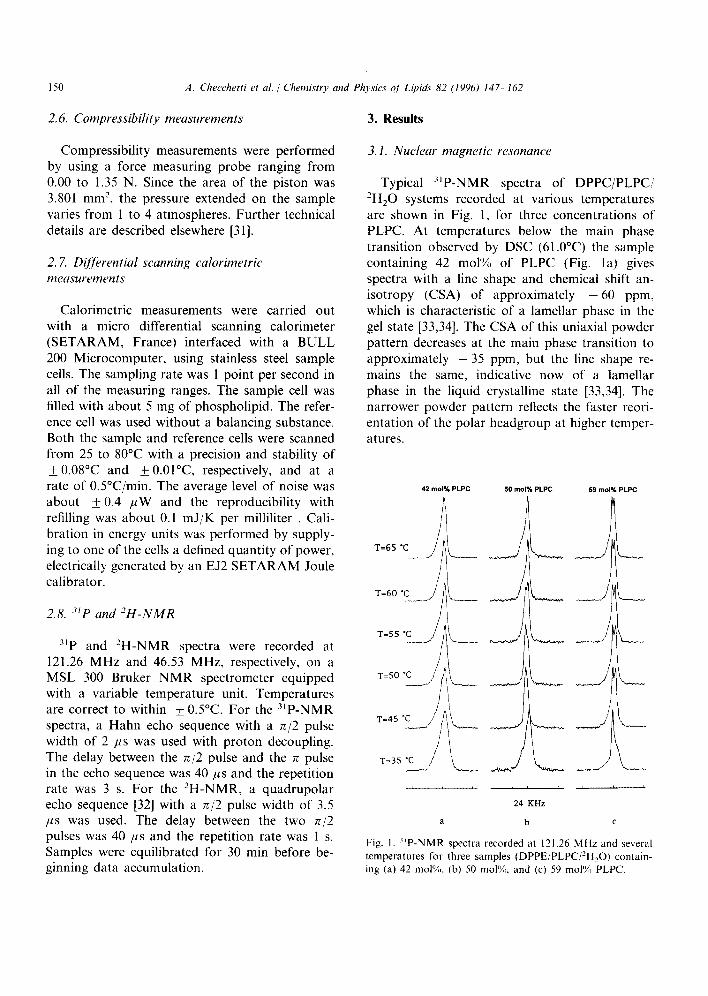
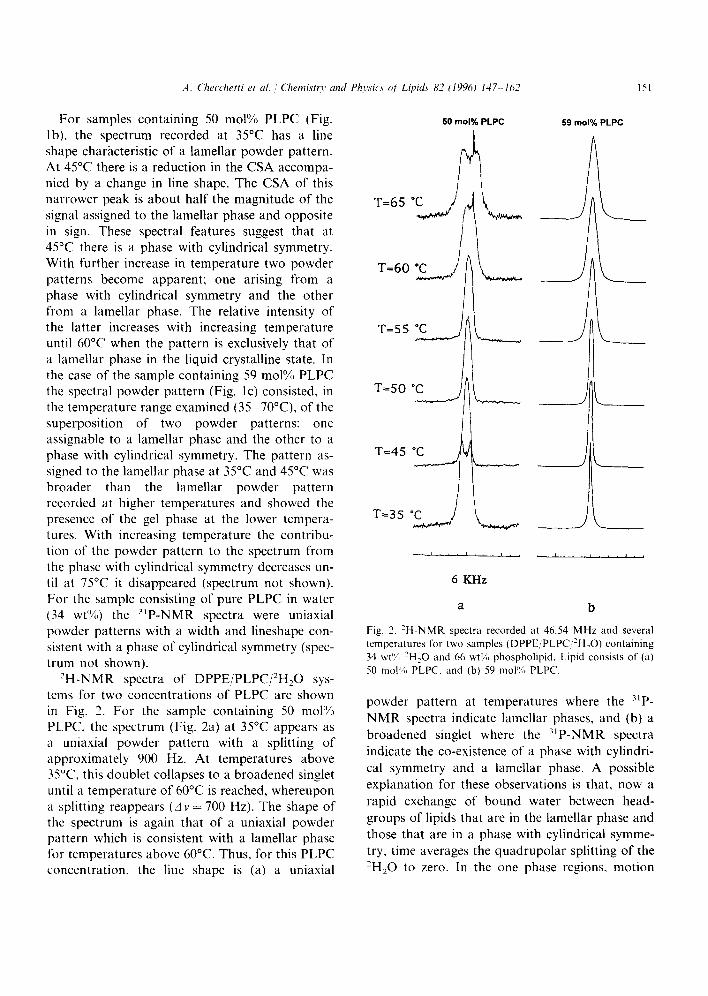
Compressibility measurements were performed 3.1. Nuclear magnetic resonance by using a force measuring probe ranging from 0.00 to 1.35 N. Since the area of the piston was Typical -~P-NMR spectra of DPPC/PLPC/ 3.801 mm 2, the pressure extended on the sample 2H20 systems recorded at various temperatures varies from 1 to 4 atmospheres. Further technical are shown in Fig. 1, for three concentrations of details are described elsewhere [31]. PLPC. At temperatures below the main phase
transition observed by DSC (61.0°C) the sample 2.7. Differential scanning calorimetric containing 42 mol% of PLPC (Fig. la) gives measurements spectra with a line shape and chemical shift an-
isotropy (CSA) of approximately - 6 0 ppm, Calorimetric measurements were carried out which is characteristic of a lamellar phase in the
with a micro differential scanning calorimeter gel state [33,34]. The CSA of this uniaxial powder (SETARAM, France) interfaced with a BULL pattern decreases at the main phase transition to 200 Microcomputer, using stainless steel sample approximately - 3 5 ppm, but the line shape re- cells. The sampling rate was 1 point per second in mains the same, indicative now of a lamellar all of the measuring ranges. The sample cell was phase in the liquid crystalline state [33,34]. The filled with about 5 mg of phospholipid. The refer- narrower powder pattern reflects the faster reori- ence cell was used without a balancing substance, entation of the polar headgroup at higher temper- Both the sample and reference cells were scanned atures. from 25 to 80°C with a precision and stability of +0.08°C and +0.01°C, respectively, and at a rate of 0.5°C/min. The average level of noise was 42 mot~ p,pc so mo~ PLP¢ 5~ moa~ PLPe about +0 .4 /zW and the reproducibility with C ~ ~ ~ ~ _ ~ refilling was about 0.1 mJ/K per milliliter . Cali- bration in energy units was performed by supply- ing to one of the cells a defined quantity of power, T-6s • electrically generated by an E J2 SETARAM Joule
cal ibrator . T = 6 0 ° C ~ ~----,-- S ~ ~ , S
31p and 2H-NMR spectra were recorded at 121.26 MHz and 46.53 MHz, respectively, on a . c ~ / i , _ _ ~ ~ ~ ~ . / / f ~ . ~ MSL 300 Bruker NMR spectrometer equipped x=so with a variable temperature unit. Temperatures / are correct to within + 0.5°C. For the 3~p-NMR / ^ / spectra, a Hahn echo sequence with a ~/2 pulse a-=4s" width of 2 /~s was used with proton decoupling, j The delay between the re/2 pulse and the rc pulse T=3s "c / ~ ~ in the echo sequence was 40/~s and the repetition - - - ' rate was 3 s. For the 2H-NMR, a quadrupolar . . . . . . . . . . echo sequence [32] with a rr/2 pulse width of 3.5 24 KHz /tS was used. The delay between the two 1r/2 a b c pulses was 40 t~s and the repetition rate was 1 s. Fig. 1. 3~p-NMR spectra recorded at 121.26 MHz and several Samples were equilibrated for 30 min before be- temperatures for three samples (DPPE/PLPC/2H20) contain- ginning data accumulation, ing (a) 42 mol%, (b) 50 tool%, and (c) 59 mol% PLPC.
A. (71ecchetti et al. Chemistry and Physics of Lipi&' 82 (1996) 147 162 151
For samples containing 50 mol% PLPC (Fig. so mol'~ PLPC 59 moP/° PLPC lb), the spectrum recorded at 35°C has a line shape characteristic of a lamellar powder pattern. / ' k e At 45°C there is a reduction in the CSA accompa- nied by a change in line shape. The CSA of this narrower peak is about half the magnitude of the T=65 ° ~.,=.._ ~ , . signal assigned to the lamellar phase and opposite , , , - , , ~ _--J in sign. These spectral features suggest that at 45°C there is a phase with cylindrical symmetry. With further increase in temperature two powder T=60 % ~ ( ~ . . , , , ~ J ~..______ patterns become apparent; one arising from a phase with cylindrical symmetry and the other from a lamellar phase. The relative intensity of a / the latter increases with increasing temperature T=55 ~C .. a [I } until 60°C when the pattern is exclusively that of - ~ k . ~ a lamellar phase in the liquid crystalline state. In the case of the sample containing 59 moP/,, PLPC the spectral powder pattern (Fig. lc) consisted, in T=50 °C I1 the temperature range examined (35 70°C), of the ...~.._.~ ~ _ j k. superposition of two powder patterns: one assignable to a lamellar phase and the other to a
J phase with cylindrical symmetry. The pattern as- T=45 °5- -.--J signed to the lamellar phase at 35°C and 45°C was "- "-'1 ~ ,J v, .... broader than the lamellar powder pattern recorded at higher temperatures and showed the
T=35 /
presence of the gel phase at the lower tempera- ~ , . . _J M_ tures. With increasing temperature the contribu- tion of the powder pattern to the spectrum from . . . . . . . . . . . . . . . . . . . . . . . the phase with cylindrical symmetry decreases un- til at 75°C it disappeared (spectrum not shown). 6 KHz For the sample consisting of pure PLPC in water
a b (34 wt%) the 3~p-NMR spectra were uniaxial powder patterns with a width and lineshape c o n - Fig. 2. 2H-NMR spectra recorded at 46.54 MHz and several sistent with a phase of cylindrical symmetry (spec- temperatures for two samples (DPPE/PLPC,2H.O) containing trum not shown). 34 wt~)Ji~ 2H20 and 66 wt% phospholipid. Lipid consists of (a)
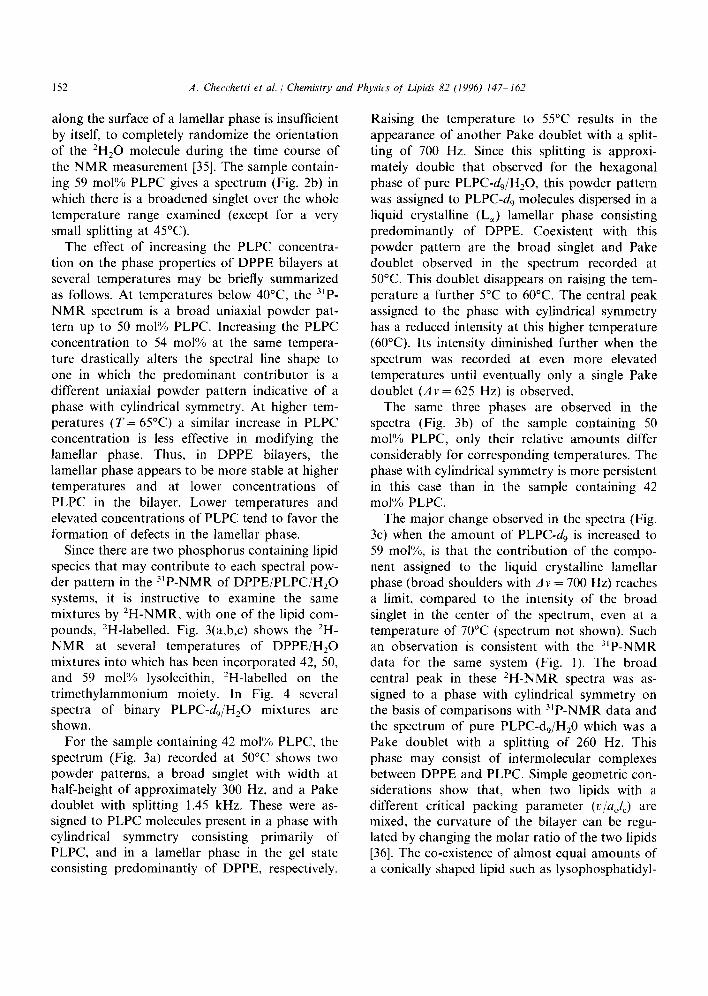
50 mol% PLPC, and (b) 59 mol% PLPC. 2H-NMR spectra of DPPE/PLPC/2H20 sys-
tems for two concentrations of PLPC are shown powder pattern at temperatures where the 3~p_ in Fig. 2. For the sample containing 50 mol% NMR spectra indicate lamellar phases, and (b) a PLPC, the spectrum (Fig. 2a) at 35°C appears as
broadened singlet where the ~'P-NMR spectra a uniaxial powder pattern with a splitting of
indicate the co-existence of a phase with cylindri- approximately 900 Hz. At temperatures above
cal symmetry and a lamellar phase. A possible 35°C, this doublet collapses to a broadened singlet until a temperature of 60°C is reached, whereupon explanation for these observations is that, now a a splitting reappears (Av = 700 Hz). The shape of rapid exchange of bound water between head- the spectrum is again that of a uniaxial powder groups of lipids that are in the lamellar phase and pattern which is consistent with a lamellar phase those that are in a phase with cylindrical symme- for temperatures above 60°C. Thus, for this PLPC try, time averages the quadrupolar splitting of the concentration, the line shape is (a) a uniaxial 2H~O to zero. In the one phase regions, motion
152 A. Checchetti et al./ Chemistry and Physics of Lipids 82 (1996) 147-162
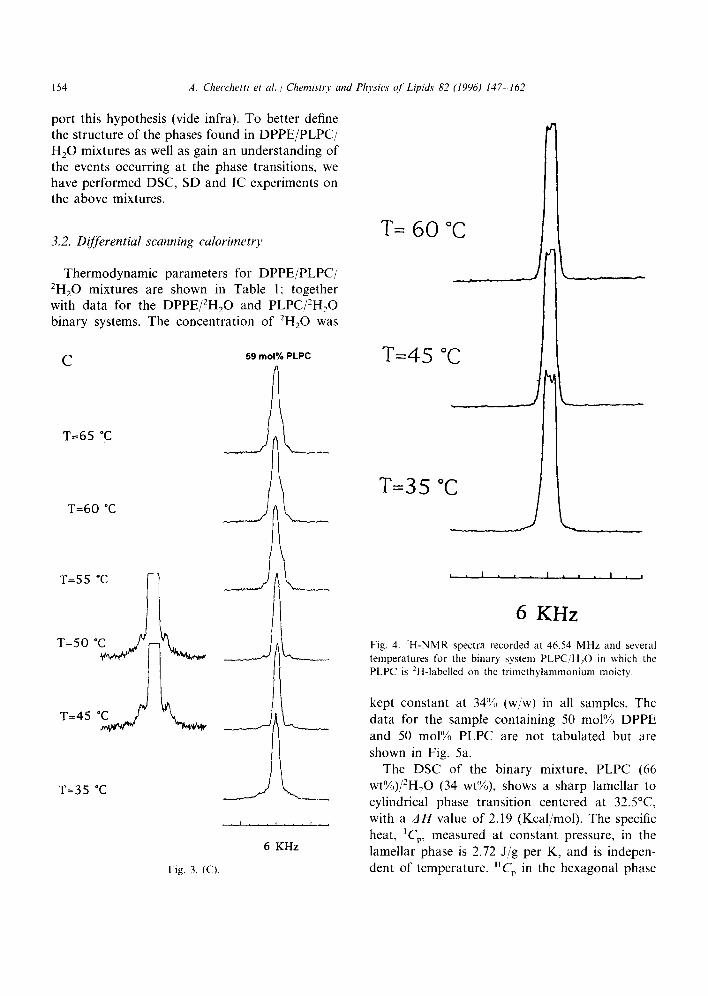
along the surface of a lamellar phase is insufficient Raising the temperature to 55°C results in the by itself, to completely randomize the orientation appearance of another Pake doublet with a split- of the 2H20 molecule during the time course of ting of 700 Hz. Since this splitting is approxi- the NMR measurement [35]. The sample contain- mately double that observed for the hexagonal ing 59 mol% PLPC gives a spectrum (Fig. 2b) in phase of pure PLPC-dg/H20, this powder pattern which there is a broadened singlet over the whole was assigned to PLPC-d 9 molecules dispersed in a temperature range examined (except for a very liquid crystalline (L~) lamellar phase consisting small splitting at 45°C). predominantly of DPPE. Coexistent with this
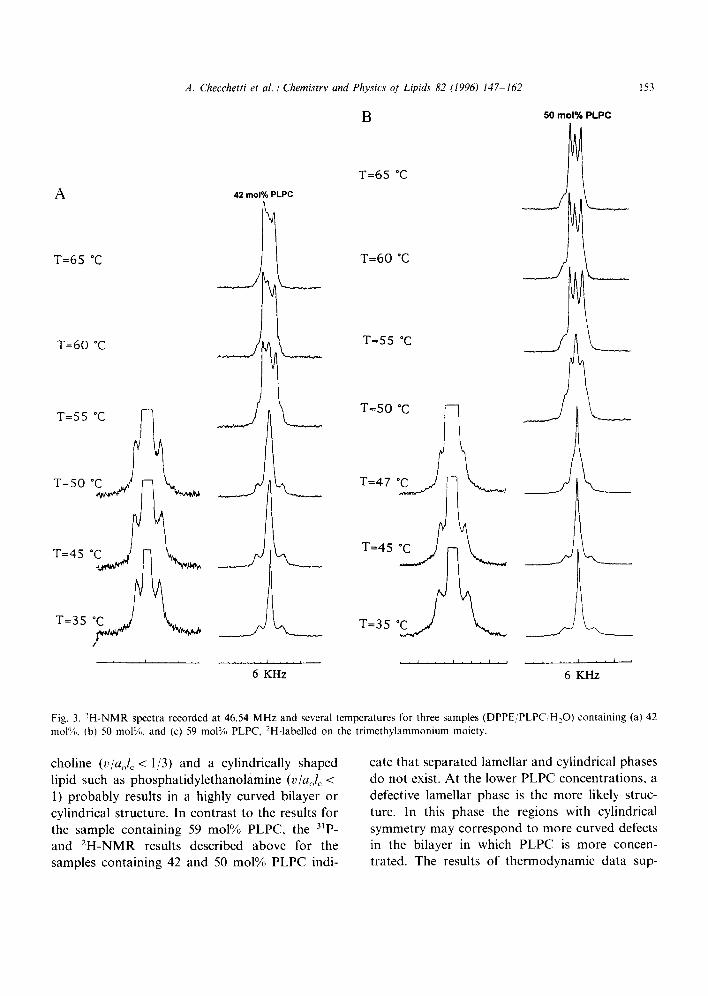
The effect of increasing the PLPC concentra- powder pattern are the broad singlet and Pake tion on the phase properties of DPPE bilayers at doublet observed in the spectrum recorded at several temperatures may be briefly summarized 50°C. This doublet disappears on raising the tern- as follows. At temperatures below 40°C, the 3Jp_ perature a further 5°C to 60°C. The central peak NMR spectrum is a broad uniaxial powder pat- assigned to the phase with cylindrical symmetry tern up to 50 mol% PLPC. Increasing the PLPC has a reduced intensity at this higher temperature concentration to 54 mol% at the same tempera- (60°C). Its intensity diminished further when the ture drastically alters the spectral line shape to spectrum was recorded at even more elevated one in which the predominant contributor is a temperatures until eventually only a single Pake different uniaxial powder pattern indicative of a doublet (Av = 625 Hz) is observed. phase with cylindrical symmetry. At higher tern- The same three phases are observed in the peratures (T= 65°C) a similar increase in PLPC spectra (Fig. 3b) of the sample containing 50 concentration is less effective in modifying the mol% PLPC, only their relative amounts differ lamellar phase. Thus, in DPPE bilayers, the considerably for corresponding temperatures. The lamellar phase appears to be more stable at higher phase with cylindrical symmetry is more persistent temperatures and at lower concentrations of in this case than in the sample containing 42 PLPC in the bilayer. Lower temperatures and mol% PLPC. elevated concentrations of PLPC tend to favor the The major change observed in the spectra (Fig. formation of defects in the lamellar phase. 3c) when the amount of PLPC-d9 is increased to
Since there are two phosphorus containing lipid 59 mol%, is that the contribution of the compo- species that may contribute to each spectral pow- nent assigned to the liquid crystalline lamellar der pattern in the 3~P-NMR of DPPE/PLPC/H20 phase (broad shoulders with A v = 700 Hz) reaches systems, it is instructive to examine the same a limit, compared to the intensity of the broad mixtures by 2H-NMR, with one of the lipid corn- singlet in the center of the spectrum, even at a pounds, 2H-labelled. Fig. 3(a,b,c) shows the 2H- temperature of 70°C (spectrum not shown). Such NMR at several temperatures of DPPE/H20 an observation is consistent with the 3~p-NMR mixtures into which has been incorporated 42, 50, data for the same system (Fig. 1). The broad and 59 mol% lysolecithin, 2H-labelled on the central peak in these 2H-NMR spectra was as- trimethylammonium moiety. In Fig. 4 several signed to a phase with cylindrical symmetry on spectra of binary PLPC-dg/H20 mixtures are the basis of comparisons with 3Jp-NMR data and shown, the spectrum of pure PLPC-d9/Hz0 which was a
For the sample containing 42 mol% PLPC, the Pake doublet with a splitting of 260 Hz. This spectrum (Fig. 3a) recorded at 50°C shows two phase may consist of intermolecular complexes powder patterns, a broad singlet with width at between DPPE and PLPC. Simple geometric con- half-height of approximately 300 Hz, and a Pake siderations show that, when two lipids with a doublet with splitting 1.45 kHz. These were as- different critical packing parameter (v/aol~) are signed to PLPC molecules present in a phase with mixed, the curvature of the bilayer can be regu- cylindrical symmetry consisting primarily of lated by changing the molar ratio of the two lipids PLPC, and in a lamellar phase in the gel state [36]. The co-existence of almost equal amounts of consisting predominantly of DPPE, respectively, a conically shaped lipid such as lysophosphatidyl-
A. Checchetti et al./ Chemistry and Physics of Lipids 82 (1996) 147 162 153
B 50 mol% PLPC
A 4 2 m o l % P L P C T=65 " C l [ V i l t
. - - . . - - - -~ ~ i n ~.- . . , . , . , ,~
T=55 o~ ~ ~ T=50 °C
T=50° j ~M.__ __ T=47 °i "
T=45 ~ ~ ~-----.-- T=45
T=35 ~ , , ~ , ~ ~ T=35
, , I . . . . . . . . I , . . . . . I , , , i . , . i . , , i . . . . . , I , J
6 KHz 6 KHz
Fig. 3. 2H-NMR spectra recorded at 46.54 MHz and several temperatures for three samples (DPPE/PLPC/H,O) containing (a) 42 mol%, (b) 50 mol%, and (c) 59 mol% PLPC, 2H-labelled on the trimethylammonium moiety.
choline (V/aolc < 1/3) and a cylindrically shaped cate that separated lamellar and cylindrical phases lipid such as phosphatidylethanolamine (V/aol c < do not exist. At the lower PLPC concentrations, a l) probably results in a highly curved bilayer or defective lamellar phase is the more likely struc- cylindrical structure. In contrast to the results for ture. In this phase the regions with cylindrical the sample containing 59 mol% PLPC, the 31p_ symmetry may correspond to more curved defects and 2H-NMR results described above for the in the bilayer in which PLPC is more concen- samples containing 42 and 50 mol% PLPC indi- trated. The results of thermodynamic data sup-
154 A. Checchetti et al . / Chemistry and Physics o1' Lipit£" 82 (1996) 147 162
port this hypothesis (vide infra). To better define the structure of the phases found in DPPE/PLPC/ r H20 mixtures as well as gain an understanding of the events occurring at the phase transitions, we have performed DSC, SD and 1C experiments on the above mixtures.
T= 6 0 °C 3.2. Differential scanning calorimetry ¢.
Thermodynamic parameters for DPPE/PLPC/ _ . _..) 2H20 mixtures are shown in Table 1; together with data for the DPPE/2H20 and PLPC/2H20 binary systems. The concentration of 2H20 was
c s, too,.,. ~,Pc T = 4 5 °C
T=65 °C
T=6ooc T=3 oc
=ss-c k _ _ _ _ ' ' ' ' ' ' _~~_ 6 K H z
T = 5 0 °C Fig. 4, 2H-NMR spectra recorded at 46.54 MHz and several temperatures for the binary system PLPC/H20 in which the PLPC is 2H-labelled on the trimethylammonium moiety.
kept constant at 34% (w/w) in all samples. The T=45 ° ~ data for the sample containing 50 mol% DPPE
and 50 mol% PLPC are not tabulated but are shown in Fig. 5a.
The DSC of the binary mixture, PLPC (66 T=35 °C wt%)/2H20 (34 wt%), shows a sharp lamellar to
cylindrical phase transition centered at 32.5°C, . . . . . . . . . . . . . with a AH value of 2.19 (Kcal/mol). The specific
heat, 'Cp, measured at constant pressure, in the 6 KHz lamellar phase is 2.72 J/g per K, and is indepen-
Fig. 3. (C). dent of temperature. "Cp in the hexagonal phase
A. Checchetti et al. / Chemistry and Physics ~?f Lipids 82 (1996) 147-162 155
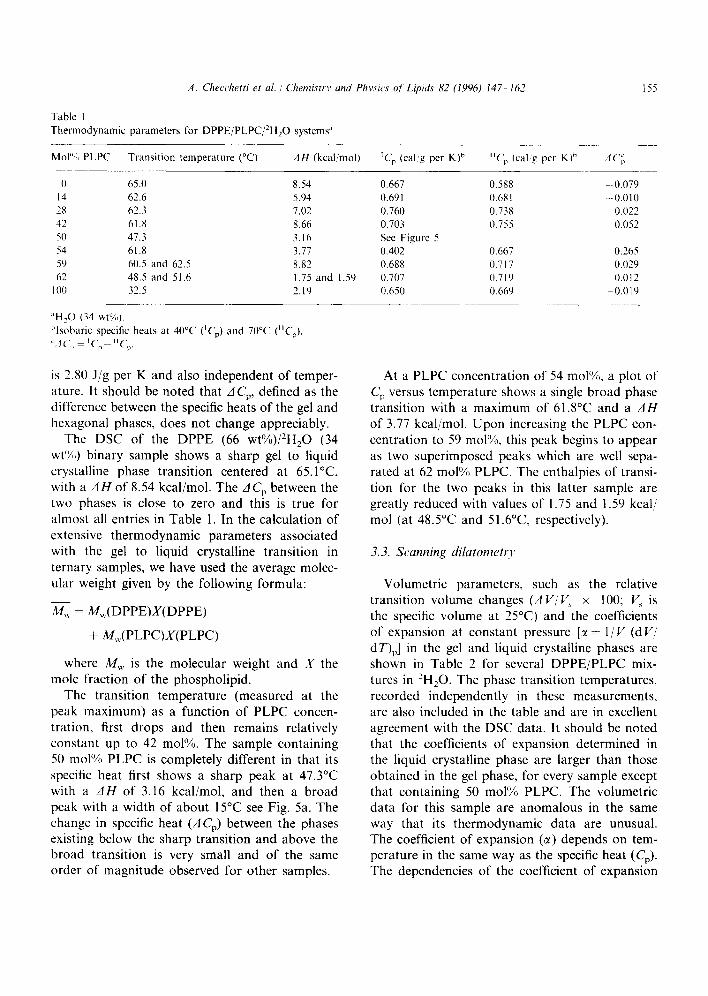
Table 1 Thermodynamic parameters for DPPE/PLPC/2H,O systems"
Mol'!i, PLPC Transition temperature (°C) 3 H (kcal/mol) ICp (cal/g per K) b UCp (cal,'g per K) ~' zIC~,
0 65.0 8.54 0.667 0.588 --0.079 14 62.6 5.94 0.691 0.681 -- 0.010 28 62.3 7.02 0.760 0.738 0.022 42 61.8 8.66 0.703 0.755 0.052 50 47.3 3.16 See Figure 5 54 61.8 3.77 0.402 0.667 0.265 59 60.5 and 62.5 8.82 0.688 0.717 0.029 62 48.5 and 51.6 1.75 and 1.59 0.707 0.719 0.012
100 32.5 2.19 0.650 0.669 -- 0.019
~'H~O (34 wt%). blsobaric specific heats at 40°C (ICp) and 70°C (uCp).
~IC v - ICp-ucp.
is 2.80 J/g per K and also independent of temper- At a PLPC concentration of 54 mol%, a plot of ature. It should be noted that 3 Cp, defined as the Cp versus temperature shows a single broad phase difference between the specific heats of the gel and transition with a maximum of 61.8°C and a AH hexagonal phases, does not change appreciably, of 3.77 kcal/mol. Upon increasing the PLPC con-
The DSC of the DPPE (66 wt%)/2H20 (34 centration to 59 mol%, this peak begins to appear wt%) binary sample shows a sharp gel to liquid as two superimposed peaks which are well sepa- crystalline phase transition centered at 65.1°C, rated at 62 mol% PLPC. The enthalpies of transi- with a A H of 8.54 kcal/mol. The A Cp between the tion for the two peaks in this latter sample are two phases is close to zero and this is true for greatly reduced with values of 1.75 and 1.59 kcal/ almost all entries in Table 1. In the calculation of mol (at 48.5°C and 51.6°C, respectively). extensive thermodynamic parameters associated with the gel to liquid crystalline transition in 3.3. Scanning dilatometrv ternary samples, we have used the average molec- ular weight given by the following formula: Volumetric parameters, such as the relative
transition volume changes (AV/V~ x 100; V~ is M~ = Mw(DPPE)X(DPPE ) the specific volume at 25°C) and the coefficients
+ M,,,(PLPC)X(PLPC) of expansion at constant pressure [:~ = 1IV (d V/ d T)v] in the gel and liquid crystalline phases are
where Mw is the molecular weight and X the shown in Table 2 for several DPPE/PLPC mix- mole fraction of the phospholipid, tures in 2H20. The phase transition temperatures,
The transition temperature (measured at the recorded independently in these measurements, peak maximum) as a function of PLPC concen- are also included in the table and are in excellent tration, first drops and then remains relatively agreement with the DSC data. It should be noted constant up to 42 tool%. The sample containing that the coefficients of expansion determined in 50 mol% PLPC is completely different in that its the liquid crystalline phase are larger than those specific heat first shows a sharp peak at 47.3°C obtained in the gel phase, for every sample except with a AH of 3.16 kcal/mol, and then a broad that containing 50 mol% PLPC. The volumetric peak with a width of about 15°C see Fig. 5a. The data for this sample are anomalous in the same change in specific heat (ACv) between the phases way that its thermodynamic data are unusual. existing below the sharp transition and above the The coefficient of expansion (c0 depends on tem- broad transition is very small and of the same perature in the same way as the specific heat (Cv). order of magnitude observed for other samples. The dependencies of the coefficient of expansion
156 A. Checchetti et al./ Chemistry and Physics of Lipids 82 (1996) 147 162
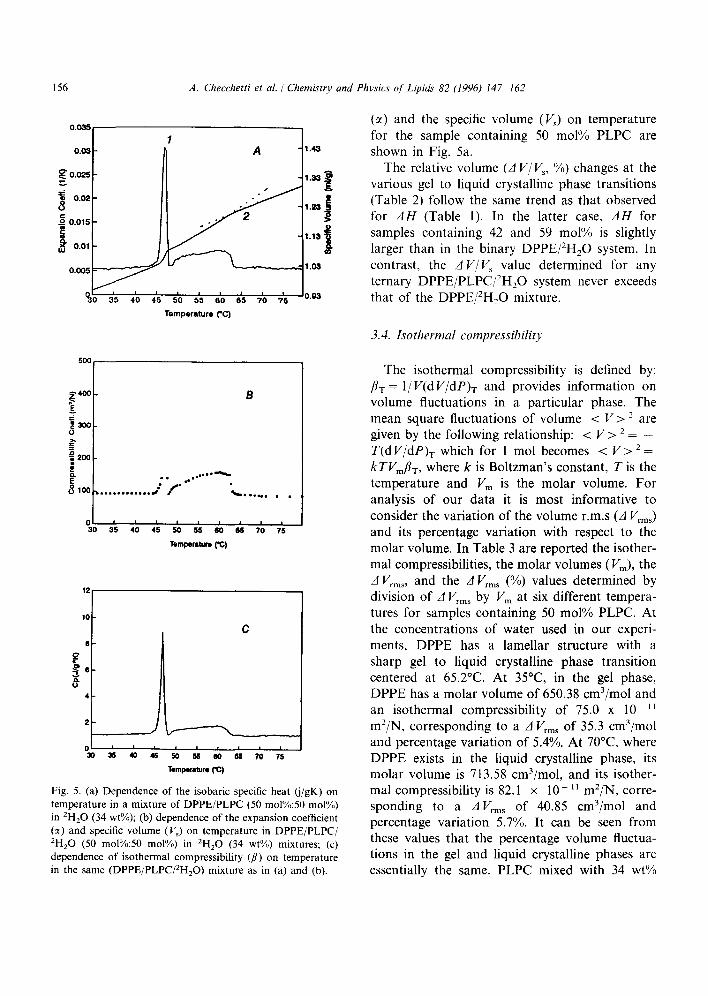
o.can (~) and the specific volume (Vs) on temperature 7 for the sample containing 50 mol% PLPC are
o.o3 A 1.~ shown in Fig. 5a. The relative volume (A V~ Vs, %) changes at the
0.025 1 . ~ .~, ~ various gel to liquid crystalline phase transitions
~ ° ' c a ~ I (Table 2) f°ll°w the same trend as that °bserved 1.~ ~o.ols, for AH (Table 1). In the latter case, AH for
i 1.1s samples containing 42 and 59 mol% is slightly o.ol larger than in the binary DPPE/2H20 system. In
o.oos ~ ~.o3 contrast, the A V/V~ value determined for any °a I, ~ ternary DPPE/PLPC/2H2 0 system never exceeds
a'5 4'o ~'5 5'o 5'5 do e'n 7'0 ~'5 o.~ that of the DPPE/2H20 mixture. Temperature ('C)
3.4. Isothermal compressibility
50o
The isothermal compressibility is defined by: fit = 1/V(dV/dP)T and provides information on ~40o B volume fluctuations in a particular phase. The g
3oo mean square fluctuations of volume < V > 2 are o given by the following relationship: < V > 2 = _ > ,
aoo T(d V/dP)-r which for 1 mol becomes < V > 2 = kTVmflv, where k is Boltzman's constant, T is the
8~oo .. . . . . . . . . . . , . " f . " - '~ temperature and Vm is the molar volume. For '~ . . . . . . . analysis of our data it is most informative to
o , , , consider the variation of the volume r.m.s (A Vrm~) 3o .~ 4o 4s r~ s5 6o ~ 7~ 7; and its percentage variation with respect to the
Tomp*,,w~. e¢) molar volume. In Table 3 are reported the isother- mal compressibilities, the molar volumes (Vm), the A V~.,, and the A V~ms (%) values determined by
~a division of A Vrm s b y V m at six different tempera- ~0 tures for samples containing 50 mol% PLPC. At
C the concentrations of water used in our experi- s ~ ments, DPPE has a lamellar structure with a
• ~ ~ sharp gel to liquid crystalline phase transition centered at 65.2°C. At 35°C, in the gel phase,
4 DPPE has a molar volume of 650.38 cm3/mol and an isothermal compressibility of 75.0 x 10 ~
2 _ _ mZ/N, corresponding to a d Vrm s of 35.3 cm3/mol and percentage variation of 5.4%. At 70°C, where
0 I I I I I I I I I
so ss 4o 45 5o 55 e0 as r0 7s DPPE exists in the liquid crystalline phase, its rom~,n,, e e) molar volume is 713.58 cm3/mol, and its isother-
Fig. 5. (a) Dependence of the isobaric specific heat (j/gK) on mal compressibility is 82.1 × 10 - ~ ~ mZ/N, corre- temperature in a mixture of DPPE/PLPC (50 mo1%:50 molV,,) sponding to a A V~m s of 40.85 cm3/mol and in 2H20 (34 wt%); (b) dependence of the expansion coefficient percentage variation 5.7%. It can be seen from (c0 and specific volume (Vs) on temperature in DPPE/PLPC/ these values that the percentage volume fluctua- 2H20 (50 mo1%:50 mol%) in ZH20 (34 wt%) mixtures; (c) dependence of isothermal compressibility (fl) on temperature tions in the gel and liquid crystalline phases are in the same (DPPE/PLPCflH20) mixture as in (a) and (b). essentially the same. PLPC mixed with 34 wt%
A. Checchetti et al. / Chemistry and Physics of Lipids 82 11996) 14Z 162 157
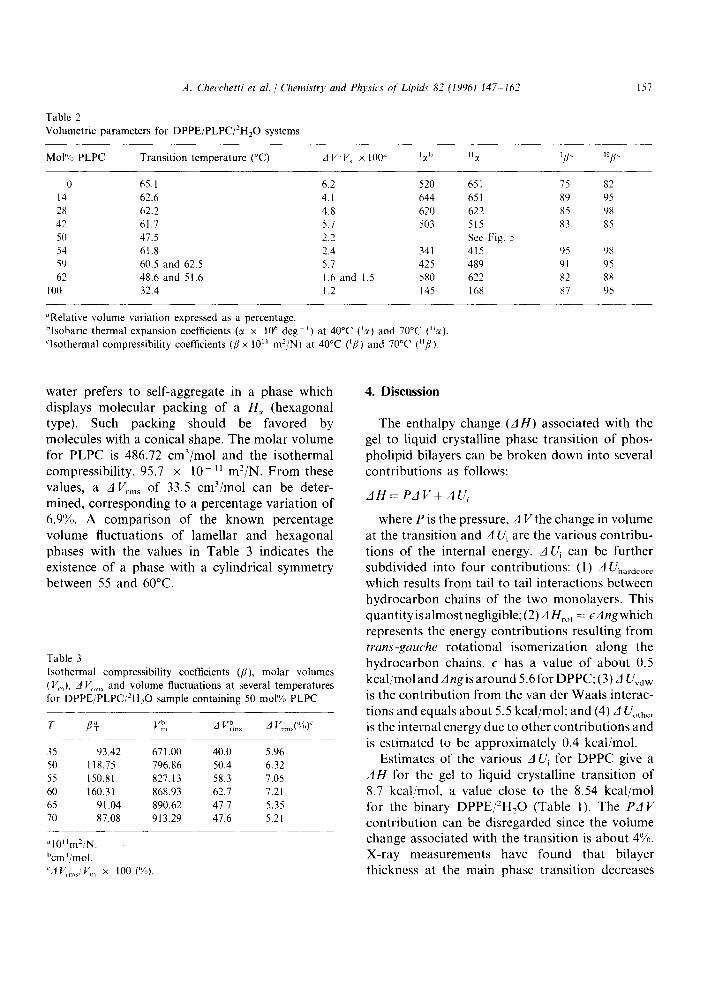
Table 2 Volumetric parameters for DPPE/PLPC/2H20 systems
Mol% PLPC Transit ion temperature (°C) A V/V~ x 100 ~ 1:~ ,:~ [/U "]U
0 65.1 6.2 520 651 75 82 14 62.6 4.1 644 651 89 95 28 62.2 4.8 620 622 85 98 42 61.7 5.7 503 515 83 85 51) 47.5 2.2 See Fig. 5 54 61.8 2.4 341 415 95 98 59 60.5 and 62.5 5.7 425 489 91 95 62 48,6 and 51.6 1.6 and 1,5 580 622 82 88
100 32,4 1.2 145 168 87 95
~'Relative volume variation expressed as a percentage. blsobaric thermal expansion coefficients (c~ x 106 deg t) at 40°C (t:~) and 70°C (":~). qso thermal compressibility coefficients ( f lx l0 II m2/N) at 40°C (tfl) and 70°C (H/l).
water prefers to self-aggregate in a phase which 4. Discussion displays molecular packing of a H~ (hexagonal type). Such packing should be favored by The enthalpy change ( A H ) associated with the molecules with a conical shape. The molar volume gel to liquid crystalline phase transition of phos- for PLPC is 486.72 cm3/mol and the isothermal pholipid bilayers can be broken down into several compressibility, 95.7 × 10 t~ m2/N. From these contributions as follows: values, a A Vrms of 33.5 cm3/mol can be deter-
A H = P A V + AUi mined, corresponding to a percentage variation of 6.9"/0. A comparison of the known percentage where Pis the pressure, A Vthe change in volume volume fluctuations of lamellar and hexagonal at the transition and A U~ are the various contribu- phases with the values in Table 3 indicates the tions of the internal energy. A U~ can be further existence of a phase with a cylindrical symmetry subdivided into four contributions: (l) A Uhard . . . . .
between 55 and 60°C. which results from tail to tail interactions between hydrocarbon chains of the two monolayers. This quantityis almost negligible; (2) A Hrot -- EAngwhich represents the energy contributions resulting from trans-gauche rotational isomerization along the
Table 3 hydrocarbon chains, e has a value of about 0.5 Isothermal compressibility coefficients (fl), molar volumes k c a l / m o l a n d A n g i s a r o u n d 5 . 6 f o r D P P C ; ( 3 ) A U v J w (V~), 3 V,-m~ and volume fluctuations at several temperatures for DPPE/PLPC/2H20 sample containing 50 mol% PLPC is the contribution from the van der Waals interac-
tions and equals about 5.5 kcal/mol: and (4) 3 Uoth~r T [¢~ vb, J vb~ ~ V~m~("/") ~ is the internal energy due to other contributions and
is estimated to be approximately 0.4 kcal/mol. 35 93.42 671.00 40.0 5.96 511 118.75 796.86 50.4 6.32 Estimates of the various 3 Ui for DPPC give a 55 150.81 827.13 58.3 7.05 3 H for the gel to liquid crystalline transition of 60 160.31 868.93 62.7 7.21 8.7 kcal/mol, a value close to the 8.54 kcal/mol 65 91.04 890.62 47.7 5.35 for the binary DPPE/ZH20 (Table 1). The P A V 70 87.08 913.29 47.6 5.21 contribution can be disregarded since the volume
,qO,,mZ/N. change associated with the transition is about 4%. %m3/mol. X-ray measurements have found that bilayer %~vm~jv,~, × 100 (%). thickness at the main phase transition decreases
158 A. Checchetti et al./ Chemistry and Physics oJ Lipids 82 (1996) 147 162
by approximately 20% for DPPC. In order to results indicate that van der Waals interactions balance volume change, it is necessary that the between the lipid chains increase to the point area per DPPC molecule should increase by about where they are the same as in pure DPPE, and 25%. The difference in the phase transitions of that volume fluctuations are diminished. These DPPC and DPPE is attributed to the presence of are expected consequences of more efficient pack- weak but cooperative and transient H-bonds be- ing of the hydrocarbon chains. A possible model tween the phosphate and ammonium groups of for the structure of this mixture, which is consis- DPPE. tent with the NMR data, is one in which microag-
Introduction of a small amount (14 mol%) of gregates of PLPC are randomly distributed in the PLPC into DPPE bilayers does not alter the DPPE bilayer. Such a model accounts for the overall arrangement of phospholipid molecules, small decrease in the phase transition temperature 3~p-NMR spectra in both gel and liquid crys- and the increase in AH and A V. If PLPC did not talline phases are uniaxial powder patterns indica- form microdomains but was distributed as single tive of lamellar structures. However, it is observed molecules in a random fashion, then both exten- that this small amount of PLPC affects the DPPE sive and intensive properties would decrease as in phase transition by lowering its temperature the case of intercalated substances whose shape is 2.5°C, its enthalpy change by 2.5 kcal/mol, and its quite different from phospholipids, for example, volume change by about 2%. The presence in cholesterol. This structural hypothesis is sup- PLPC of the trimethylammonium group, which is ported by the values of ~ and fl, which remain incapable of H-bond formation, has the effect of almost constant, there being no significant in- disrupting some intermolecular H-bonding be- crease of defects in the bilayer. If there were the tween DPPE molecules when PLPC is randomly formation of domains of different lipid composi- incorporated into the bilayer. This effect should tion, two peaks in the DSC and SD would be contribute to lowering the phase transition tem- seen, indicative of phase segregation. We propose perature together with reduced van der Waals that in this case phase segregation is not observed interactions between the hydrocarbon chains. A1- because PLPC, preferring a cylindrical phase, is though Ang for the chains in DPPE should not be forced into the lamellar bilayer above the transi- significantly altered by the random distribution of tion, whereas in the gel state it is already in the small numbers of PLPC molecules in the lamellar chain-melted condition and consequently at the structure, the contribution of Ang for the chains transition contributes nothing to the extensive in PLPC should be reduced. The distribution of properties. the conically-shaped PLPC molecule among a col- The sample containing 50 mol% PLPC, which lection of cylindrically-shaped DPPE molecules corresponds to a PLPC to DPPE mole ratio of should produce an increased number of gauche 1:1, shows unusual behaviour. The temperature conformers in the chains of PLPC for a given dependence of C w V~ ~, [1 and volume fluctua- temperature, and consequently a lower value of tions over the range 25-70°C has been described Ang. This hypothesis is reasonable in view of the above (Fig. 5 and Table 3). values of the isothermal compressibility and ther- In order to better understand this behaviour it mal expansion coefficients. Both ~ and fl, in the is helpful to divide the discussion of the ther- gel phase, have larger values in samples contain- mograms into four temperature ranges: (i) 30 ing 14 mol% PLPC than in pure DPPE bilayers, 45°C; (ii) the sharp transition; (iii) 51-65°C; and implying greater volume fluctuations and in- (iv) above 65°C. creased motional possibilities in the ternary sys- Between 30 and 45°C, the thermodynamic and tem (Table 2). NMR data are consistent with a lamellar aggre-
If the content of PLPC is increased from 14 to gate containing holes or linear defects whose 42 mol%, an increase in AH and A V for the phase edges are rich in PLPC, and whose flatter regions transition is observed while the thermal compress- are rich in DPPE. In this molecular arrangement ibility and expansion coefficient decrease. These the system minimizes the surface exposure of the
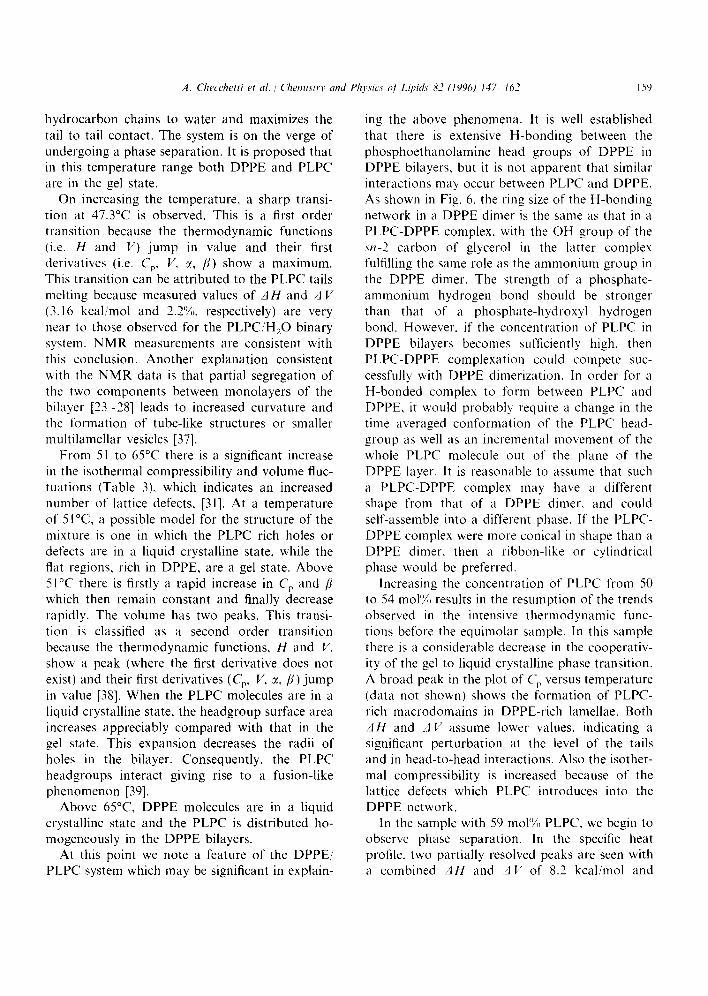
A. Checchetti et al . / (Ttemistr) and Physics O/ Lipide' 82 (1996) 147 162 159
hydrocarbon chains to water and maximizes the ing the above phenomena. It is well established tail to tail contact. The system is on the verge of that there is extensive H-bonding between the undergoing a phase separation. It is proposed that phosphoethanolamine head groups of DPPE in in this temperature range both DPPE and PLPC DPPE bilayers, but it is not apparent that similar are in the gel state, interactions may occur between PLPC and DPPE.
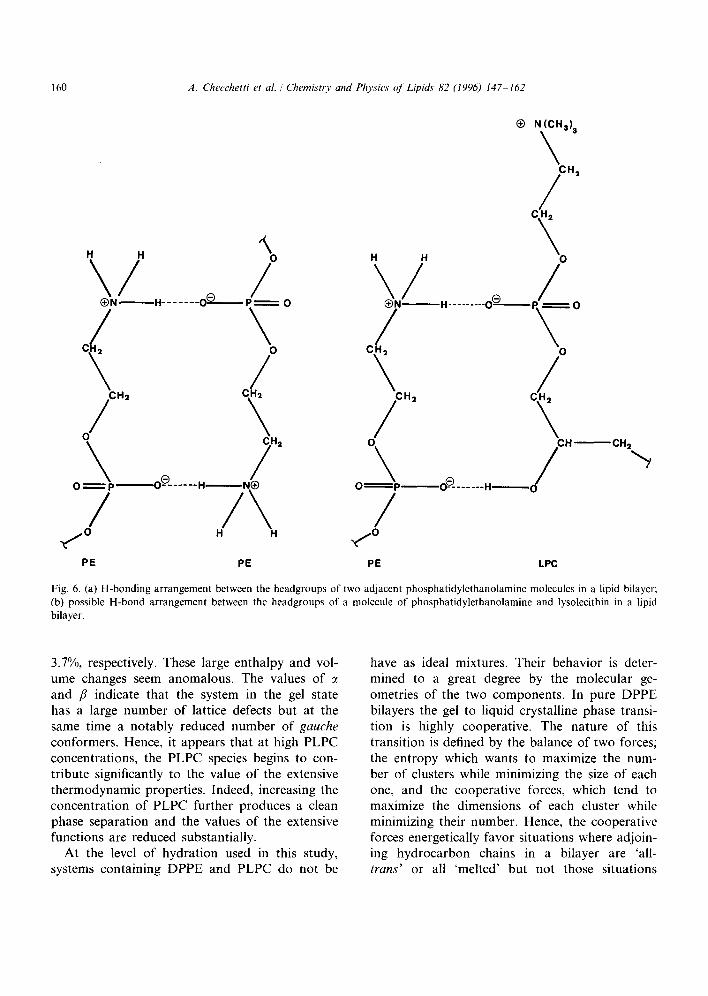
On increasing the temperature, a sharp transi- As shown in Fig. 6, the ring size of the H-bonding tion at 47.3°C is observed. This is a first order network in a DPPE dimer is the same as that in a transition because the thermodynamic functions PLPC-DPPE complex, with the OH group of the (i.e. H and V) jump in value and their first sn-2 carbon of glycerol in the latter complex derivatives (i.e. Cp, V, :~, /]) show a maximum, fulfilling the same role as the ammonium group in This transition can be attributed to the PLPC tails the DPPE dimer. The strength of a phosphate- melting because measured values of AH and A V ammonium hydrogen bond should be stronger (3.16 kcal/mol and 2.2%, respectively) are very than that of a phosphate-hydroxyl hydrogen near to those observed for the PLPC/H:O binary bond. However, if the concentration of PLPC in system. NMR measurements are consistent with DPPE bilayers becomes sufficiently high, then this conclusion. Another explanation consistent PLPC-DPPE complexation could compete suc- with the NMR data is that partial segregation of cessfully with DPPE dimerization. In order for a the two components between monolayers of the H-bonded complex to t\~rm between PLPC and bilayer [23-28] leads to increased curvature and DPPE, it would probably require a change in the the formation of tubeqike structures or smaller time averaged conformation of the PLPC head- multilamellar vesicles [37]. group as well as an incremental movement of the
From 51 to 65°C there is a significant increase whole PLPC molecule out of the plane of the in the isothermal compressibility and volume fluc- DPPE layer. It is reasonable to assume that such tuations (Table 3), which indicates an increased a PLPC-DPPE complex may have a different number of lattice defects, [31]. At a temperature shape from that of a DPPE dimer, and could of 51°C, a possible model for the structure of the self-assemble into a different phase. If the PLPC- mixture is one in which the PLPC rich holes or DPPE complex were more conical in shape than a defects are in a liquid crystalline state, while the DPPE dimer, then a ribbon-like or cylindrical flat regions, rich in DPPE, are a gel state. Above phase would be preferred. 51°C there is firstly a rapid increase in Cp and [] Increasing the concentration of PLPC from 50 which then remain constant and finally decrease to 54 mol% results in the resumption of the trends rapidly. The volume has two peaks. This transi- observed in the intensive thermodynamic func- tion is classified as a second order transition tions before the equimolar sample. In tiffs sample because the thermodynamic functions, H and V, there is a considerable decrease in the cooperativ- show a peak (where the first derivative does not ity of the gel to liquid crystalline phase transition. exist) and their first derivatives (Cp, V, ~, [~') jump A broad peak in the plot of C v versus temperature in value [38]. When the PLPC molecules are in a (data not shown) shows the formation of PLPC- liquid crystalline state, the headgroup surface area rich macrodomains in DPPE-rich lamellae. Both increases appreciably compared with that in the /JH and :J V assume lower values, indicating a gel state. This expansion decreases the radii of significant perturbation at the level of the tails holes in the bilayer. Consequently, the PLPC and in head-to-head interactions. Also the isother- headgroups interact giving rise to a fusion-like mal compressibility is increased because of the phenomenon [39]. lattice defects which PLPC introduces into the
Above 65°C, DPPE molecules are in a liquid DPPE network. crystalline state and the PLPC is distributed ho- In the sample with 59 tool% PLPC, we begin to mogeneously in the DPPE bilayers, observe phase separation. In the specific heat
AI this point we note a feature of the DPPE/ profile, two partially resolved peaks are seen with PLPC system which may be significant in explain- a combined AH and ~1V of 8.2 kcal/mol and
160 A. Checchetti et al. / Chemistry and Physics o f Lipids" 82 (1996) 147 162
N(CHa) a
\
~ N P" 0 N 0
\ # \ /" o p o -e- . . . . . . o p o -e- . . . . . . , o / / \ /
.e , . .o , , .~ , ,o
PE PE PE LPC
Fig. 6. (a) H-bonding arrangement between the headgroups of two adjacent phosphatidylethanolamine molecules in a lipid bilayer; (b) possible H-bond arrangement between the headgroups of a molecule of phosphatidylethanolamine and lysolecithin in a lipid bilayer.
3.7%, respectively. These large enthalpy and vol- have as ideal mixtures. Their behavior is deter- ume changes seem anomalous. The values of ~ mined to a great degree by the molecular ge- and fl indicate that the system in the gel state ometries of the two components. In pure DPPE has a large number of lattice defects but at the bilayers the gel to liquid crystalline phase transi- same time a notably reduced number of gauche tion is highly cooperative. The nature of this conformers. Hence, it appears that at high PLPC transition is defined by the balance of two forces; concentrations, the PLPC species begins to con- the entropy which wants to maximize the num- tribute significantly to the value of the extensive ber of clusters while minimizing the size of each thermodynamic properties. Indeed, increasing the one, and the cooperative forces, which tend to concentration of PLPC further produces a clean maximize the dimensions of each cluster while phase separation and the values of the extensive minimizing their number. Hence, the cooperative functions are reduced substantially, forces energetically favor situations where adjoin-
At the level of hydration used in this study, ing hydrocarbon chains in a bilayer are 'all- systems containing DPPE and PLPC do not be trans' or all 'melted' but not those situations
A. Checchetti et al./' Chemistry and Physics of Lipids 82 (1996) 147 162 161
where one chain is 'all-trans' and its ne ighbor is Acknowledgements melted.
In the above systems we see tha t P L P C at One o f the au tho r s ( P W W ) a c k n o w l e d g e s the low concen t ra t ions does no t show a tendency to va luab le technical suppor t p rov ided by Ms. phase separate . When there are equ imo la r R o b i n Jacque t in p repa r ing 2H-label led PLPC. a m o u n t o f P L P C and D P P E in the bi layer , a This work was par t i a l ly suppo r t ed by funds gel to l iquid crys ta l l ine phase t rans i t ion is ob- awarded to P W W from the Amer i can Hear t As- served for D P P E only after a g radua l va r i a t ion socia t ion, Ohio Affiliate. in the d imens ions o f the holes or defects takes place. Only at higher P L P C concen t ra t ions is phase sepa ra t ion observed.
These facts can be ra t iona l ized in the fol low- References ing way. P L P C has an a rea to length ra t io larger than D P P E so it prefers cyl indr ica l pack- [1] Weltzien, H.U. (1979) Biochim. Biophys. Acta 559, 259
ing while D P P E prefers a l amel la r a r rangement . 287. When PLPC is added to lamel lae o f D P P E in [2] Gratzl, M., Schudt, C. Ekerdt, R. and Dahl, G. (1980).
in: E.E. Bittar (Ed.), Membrane Structure and Function. the gel state, the h y d r o c a r b o n chains o f the Wiley, New York. Vol. 3, p. 59. P L P C a l ready conta in a significant n u m b e r o f [3] Ahkong, Q.F., Cramp, F.C., Fisher. D., Howell, J.I. and ,~auche confo rma t ions . Consequent ly , van der Lucy,, J.A. (1972) J. Cell Sci. t0, 769 787. W a a l s in terac t ions between the chains o f P L P C [4] Elamrani, K. and Blume, A. (1982) Biochemistry 21,
521 526. and D P P E are negligible at these tempera tures . [5] Klibansky, C. and De Vries, A. (1963) Biochim. Biophys. The fo rma t ion o f clusters o f PLPC, ra ther than Acta 70, 176 187. the r a n d o m dispers ion o f single molecules o f [6] Sato, T. and Fujii, T. (1974) Chem. Pharm. Bull. 22, P k P C in the lamel lae is favored, so that con- 152 156. tacts between D P P E chains in the gel s tate and [7] Lee, Y. and Chan, S.I. (1977) Biochemistry 16. 13(/3
1309. PLPC chains in a mel ted state, are minimized. [8] Morris, D.A., McNeil, R., Castellino, F.J. and Thomas, Increas ing the concen t ra t ion o f P L P C enlarges J.K. (1980) Biochim. Biophys. Acta, 380 39(I. the d imens ions o f l iquid crysta l l ine clusters o f [9] Reman, F.C., Demel, R.A., De Gier. J., Van Deenen, PLPC. As the t empera tu re is increased at a LL.M., Eibl, H. and Westphal, O. (1969) (;hem. Phys. given P L P C concen t ra t ion the en t rop ic factor , Lipids 3, 221 233. which increases with t empera tu re , u l t imate ly [t0] Weltzien, H.U., Arnold, B. and Kalkoff, H.G. (1976)
Biochim. Biophys. Acta 455, 56 65. prevai ls over the coopera t ive forces, and a t ran- [11] Inoue, K. and Kitagawa, T. (1974) Biochim. Biophys. sition or mel t ing o f the D P P E chains occurs. In Acta 363, 361 372. the sample con ta in ing equ imo la r a m o u n t o f [12] Bangham, A.D. and Horne, R.W. (1964) J. Mol. Biol. 8,
PLPC and D P P E , the gel to l iquid crys ta l l ine 660 668. phase t rans i t ion occurs coopera t ive ly only for [13] Chernomordik, L., Kozlov, M.M. and Zimmerberg, J.
(1995) J. Membr. Biol. 146, 1 14. the P L P C molecules. Wi th fur ther increase in [14] Chernomordik, L., Chanturiya, A.. Green, J. and Zim- t empera tu re , en t ropy prevai ls over coopera t ive merberg, J. (1995) Biophys. J. 69, 922 929. forces and a non-coope ra t ive t rans i t ion o f [15] Haydon, D.A. and Taylor. J. (1963) J. Theor. Biol. 4,
D P P E molecules occurs fo l lowed by their diffu- 281 296. [16] Cullis, P.R. and de Kruijff, B. (1979) Biochim. Biophys.
sion into regions where P L P C molecules are ag- Acta 559, 399 420. gregated with cyl indr ical symmet ry (see Fig. 7). [17] Carnie, S.J.. Israelachvili, J.N. and Pailthrope, B.A. Ul t imate ly such mo t ions recreate the lamel la r (1979) Biochim. Biophys. Acta 554, 340 357. phase. In conclus ion, up to a P L P C concent ra - [18] van Echteld, C.J.A., de Kruijff, B., Mandersloot, J.G.
and de Gier, J. (1981) Biochim. Biophys. Acta 649, 211 t ion o f 50 mol%, the dr iv ing force for the t ran- 220.
si t ion is en t rop ic in character , while at higher [19] Klopfenstein, W.E., de Kruijff, B., Verkleij, A.J., Demel, P L P C concent ra t ions , the dr iv ing force becomes R.A. and van Deenen, L.L.M. (1974)Chem. Phys. Lipids coopera t ive forces. 13. 215 222.
162 A. Checchetti et al. / Chemistry and Physics o f Lipids 82 (1996) 147- 162
[20] Blume, A., Arnold, B. and Weltzien, H.U. (1976) FEBS Malewicz, B. and Baumann, W.J. (1988) Biochemistry 27, Lett. 61, 199-202. 393 398.
[21] Mandersloot, J.G., Reman, F.C., van Deenen, L.L.M. [29] Epand, R.M. (1985) Biochemistry 24, 7092 7095. and de Gier, J. (1975) Biochim. Biophys. Acta 382, 22 [30] Grasso, D. (1987) Liq. Cryst. 2, 557 560. 26. [31] LaRosa, C. and Grasso, D. (1990) Nuovo Cimento 12D,
[22] Utsumi, H., lnoue, K., Nojima, S. and Kwan, T. (1978) 1213 1218. Biochemistry 17, 1990-1996. [32] Davis, J.H. (1983) Biochim. Biophys. Acta 737, 117-171.
[23] Kumar, V.V., Malewicz, B. and Baumann, W.J. (1989) [33] Seelig, J. (1978) Biochim. Biophys. Acta 515, 105- 140. Biophys. J. 55, 789 792. [34] Brown, M.F. and Seelig, J. (1978) Biochemistry 17, 381
[24] de Kruijff, B., van den Besselaar, A.M.H.P. and van 384. Deenen, L.L.M. (1977) Biochim. Biophys. Acta 465, 443 [35] Strenk, L.M., Westerman, P.W., Vaz, N.A.P. and Doane, 453. J.W. (1985) Biophys. J. 48, 355-359.
[25] van den Besselaar, A.M.H.P., van den Bosch, H. and van [36] lsraelachvili, J. (1992) in: Intermolecular and Surfaces Deenen, L.L.M. (1977) Biochim. Biophys. Acta 465, Forces, 2nd edn. Academic Press, New York, Chapter 17, 454-465. p. 382,.
[26] de Oliveira Filgueiras, O.M., van den Besselaar, [37] Fenske, D.B. (1993) Chem. Phys. Lipids 64, 143--162. A.M.H.P. and van den Bosch, H. (1977) Biochim. Bio- [38] Stanley, H.E. (1971) Introduction to Phase Transitions phys. Acta 471, 391 400. and Critical Phenomena, Oxford University Press, New
[27] Kumar, V.V. and Baumann, W.J. (1986) Biochem. Bio- York. phys. Res. Commun. 139, 25 30. [39] Landau, L.D. and Lifsitz, E.M. (1975) in: Statistical
[28] Kumar, V.V., Anderson, W.H., Thompson, E.W., Physics, Pergamon Press, London.


![Anti-Inflammatory Effect of 3-O-[(6'-O-Palmitoyl)-β-D-glucopyranosyl Sitosterol] from Agave angustifolia on Ear Edema in Mice](https://img.pdfslide.net/doc/110x75/6333dbcfe9e768a27a0fc67e/anti-inflammatory-effect-of-3-o-6-o-palmitoyl-v-d-glucopyranosyl-sitosterol.jpg)


