Embed Size (px)
Citation preview

www.elsevier.com/locate/jnoncrysol
Journal of Non-Crystalline Solids 352 (2006) 4155–4165
Disordered matter under extreme conditions: X-ray diffraction,electron spectroscopy and electroresistance measurements
Andrea Di Cicco a,*, Roberto Gunnella a, Roberto Marassi b, Marco Minicucci a,1,Riccardo Natali a, Gabriele Pratesi a, Emiliano Principi a, Sergio Stizza a
a CNISM, CNR-INFM, Dipartimento di Fisica, Universita di Camerino, Via Madonna delle Carceri, 62032 Camerino (MC), Italyb Dipartimento di Chimica, Universita di Camerino, Italy
Available online 26 September 2006
Abstract
In the last decade, we have developed a set of experimental techniques for in-house X-ray diffraction measurements under high-tem-perature (up to about 2300 K) and high-pressure (up to 10 GPa and 1500 K, up to 100 GPa and 700 K) conditions, electron energy-lossand Auger measurements for surface electronic structure measurements at high-temperature (up to about 1800 K), and electrical resis-tance measurements covering both low-temperatures (2 K) and high-temperatures/high-pressures (1500 K, 7 GPa) conditions. In thispaper we discuss some important technical features and possibilities of these new equipments and present novel data collected for phasetransitions and structural modifications occurring in liquid and solid systems. In particular, we present new results about phase transi-tions and undercooling of bismuth under pressure, extreme undercooling and metastable states in gallium films, and surface phase tran-sitions of Si at high-temperatures. The relevance of these experiments to the exploitation of the potential of equipments available atsynchrotron radiation facilities is emphasized.� 2006 Elsevier B.V. All rights reserved.
PACS: 07.05.Fb; 64.60.�i; 68.35.Rh; 62.50.+p
Keywords: X-ray diffraction; Surface and interfaces; Pressure effects
1. Introduction
Investigation on matter under extreme conditions oftemperature and pressure is currently regarded as a chal-lenging experimental activity, aimed to shed light on pecu-liar fundamental physical properties and to possibleapplications in material science. The importance of studiesof the fundamental properties of condensed matter underso called extreme conditions is evident as those are relevantto most of condensed and gaseous matter in the Universe(see [1] and Ref. therein). On the other hand, materials
0022-3093/$ - see front matter � 2006 Elsevier B.V. All rights reserved.
doi:10.1016/j.jnoncrysol.2006.07.040
* Corresponding author. Tel.: +39 0737 402535x550; fax: +39 0737402853.
E-mail address: [email protected] (A.D. Cicco).1 Also at former Centro Interdipartimentale Grandi Apparecchiature,
Universita degli Studi di Camerino, Italy.
for technological applications are frequently obtainedstarting from non-standard thermodynamic conditions,where chemical processes proceed along unconventionalhigh-pressure/temperature routes (see for example [2]).Therefore, studies of matter under extreme conditions areof outmost importance in different fields ranging fromphysics to earth science, from chemistry to material science,engineering and biology. In particular, studies underextreme conditions of disordered systems, ubiquitous innature in glassy and liquid forms, are of particular interestin view of the possibility of varying their electronic andstructural properties under imposed external conditions(polymorphism of liquids and glasses, see for example[3,4]).
Experiments at the forefront of the current knowledgeare often carried out at large-scale facilities like third-generation synchrotron radiation sources, where atomic

4156 A.D. Cicco et al. / Journal of Non-Crystalline Solids 352 (2006) 4155–4165
properties under extreme conditions can be probed in situby exploiting the high photon flux and micrometric beamspot sizes (see [5,6] for current reviews in the field and[7,13,12,15,14,8–11] for experiments directly relevant tothis work). However, successful preparation and executionof these complex experiments require proper know-howand expertise to be developed in suitable home Universitylaboratories, where low-cost experiments can be routinelyperformed. In this work, we describe new experimentalequipments for measurements under extreme temperatureor pressure conditions that we developed in our laboratoryin recent times. Due to some original technical solutionsand to the unusual combination of different experimentalmethods, this laboratory can be regarded as a facility formeasurements under extreme and metastable conditionsin our scientific national community. In this work we alsodiscuss some interesting results obtained using those tech-niques, showing their potential in studying phase transitionand structural modifications occurring in various systems.These advances are particularly relevant to accurate studiesof condensed matter properties at large-scale facilities,needing proper understanding of their basic propertiesprior to the execution of single-shot beamline experiments.
In Sections 2–4 we show that X-ray diffraction experi-ments under high-temperature and high-pressure condi-tions are accessible using quite standard low-costinstrumentation, developed for this specific purpose. Inparticular, phase transitions, equation of state (EOS) andordering of bulk samples can be investigated in a broadrange of pressure and temperature (up to 100 GPa andup to 2300 K in different configurations). The developmentof these equipments allowed us to perform several success-ful experiments about undercooling of liquids and phasetransitions under high-pressure conditions using synchro-tron radiation (see for example [10,11,16] for recentpapers). We also developed specific instrumentation fordetecting and studying phase transitions occurring under
M
R
SC
R: Rotating Anode
M: Monochromator
S: Sample
SC: Scintillator – NaI(Tl)
SSD: Solid State Detector – Ge
: Slits and soller
SX ray
Fig. 1. Overview of our X-ray diffraction set-up for measurements under extrdifferent configurations available: ADXD (Angular Dispersive X-ray Diffractiright side respectively.
high-temperatures (up to about 1800 K) at surfaces of sol-ids, applied to the incomplete surface melting of Ge (see[17] and Ref. therein) and to similar transitions occurringin Si, as shown in Section 5. The last two sections aredevoted to the presentation of novel equipments for electri-cal resistance measurements both under high-temperature/pressure (Section 6) and low-temperature conditions (Sec-tion 7). Interesting applications of these techniques, dis-cussed in those last Sections, include studies of phasetransitions occurring in metastable liquid and solid phasesin Ga films at low-temperature (see [12,18] for similar stud-ies on bulk samples) and in solid Bi at high-pressure andtemperature (see for example Ref. [20,21,19] and our recentwork [22]).
2. High-temperature angular X-ray diffraction
Study of phase transitions, thermal expansion of solidsand presence of metastable ordered and disordered statesunder high-temperature conditions can be carried out usingsuitable modifications of standard X-ray diffraction equip-ments. These studies are of obvious importance in deter-mining the long-range structure of the sample underconsideration and nicely complement and prepare possiblefurther X-ray diffraction and X-ray absorption spectros-copy (XAS) investigations [23] using synchrotron radia-tion. Recent XAS studies of liquid and undercooledmetals at high-temperature [24,26,10,25] were made possi-ble only by a detailed characterization of the behavior ofsamples composed by micrometric droplets under suchextreme conditions. For these reasons we developed anew experimental set-up for angular dispersive X-ray dif-fraction (ADXD) measurements under extreme high-tem-perature conditions (up to about 2300 K).
The X-ray source consists of a powerful Mo rotatinganode (18 kW) that furnishes two independent beams (Rig-aku RU300) simultaneously as shown in Fig. 1. The
SSDS
X ray
eme conditions, based on a Rigaku rotating anode source. There are twoon) and EDXD (Energy Dispersive X-ray Diffraction) systems at left and

Fig. 3. ADXD diffraction patterns as a function of temperature of solidAg (295 K, 473 K, 673 K, 873 K, 1053 K, see arrow for rising tempera-tures) and liquid Ag at 1250 K, shown in a restricted angular range. TheAg(200) peak moves as a consequence of the thermal expansion while theposition of the graphite Bragg peaks is practically unaffected bytemperature.
A.D. Cicco et al. / Journal of Non-Crystalline Solids 352 (2006) 4155–4165 4157
ADXD diffractometer is built around a two axis Huberhigh-precision goniometer h/2h achieving a resolution ofabout 0.06� HWHM in a typical configuration using sollercollimators and slits and a scintillator NaI(Tl) as detector.The X-ray beam is monochromatic at selected wavelength(kMo�Ka, E � 17.47 keV) using the (00 2) Bragg reflectionof a pyrolitic graphite crystal.
This instrument is suitable for high-temperature mea-surements, under high vacuum condition using an originaldesign for a furnace previously developed for XAS mea-surements [27]. The new ADXD furnace, shown inFig. 2, is characterized by a wide aperture (�190�) thatallow to collect the X-ray diffraction pattern in transmis-sion or reflection geometry. The sample, which is usuallya mixture of fine powders compacted in a pellet, is insertedin a crucible and is heated by the Joule effect. The temper-ature is monitored by a thermocouple in direct contact withthe sample. Many resistive materials (graphite, W, Mo andTa thin foils) have been tested and used as crucibles.
This set-up has been used to identify and study theoccurrence of phase transitions and for accurate measure-
Kaptonwindow
Coolingsystem
Crucible
Electrodes
Thermocouple
Voltage
X–rays
Angular window
Fig. 2. Furnace developed for high-temperature X-ray diffraction intransmission or reflection geometry. Temperatures as high as 2300 Kunder controlled conditions can be easily achieved.
ments of thermal expansion in a variety of applications.In particular, accurate ADXD patterns of solid and liquidpure metals and semiconductors like Ge, Si, Pd, Fe and Znup to very high-temperatures (about 1800 K) have beencollected. Some of these experiments, including thoseregarding superionic conductors and metal alloys, havebeen of crucial importance for producing well-character-ized samples for in situ high-temperature XAS measure-ments (see for example [24,26,10,25]). More recently,high-temperature XRD patterns were collected on materi-als of technological interest [28] working under extremeconditions.
As an example, in Fig. 3 we show the trend of the Ag(200) Bragg peak as a function of temperature in the range295–1215 K, selected from the whole ADXD pattern. Thesample was prepared mixing fine high-purity Ag powderswith graphite and pressing the resulting mixture into a pel-let. In Fig. 3 we show a portion of the diffraction patterncontaining the Ag (200), C (100) and C (101) Braggpeaks. Increasing the temperature, there is a clear shift ofthe Ag (20 0) peak due to the lattice thermal expansionwhile the graphite peaks are practically constant within thistemperature range. The pattern recorded at 1250 K (red)shows the disappearance of the Ag peak upon melting,and the increase of the background associated with thestructure factor. Measurements of the structure factor ofliquids and undercooled liquids (exceeding 100 K belowthe melting point in this case) are thus perfectly feasible.
3. High-pressure and temperature energy-dispersive
X-ray diffraction
X-ray experiments under high-pressure conditionsare even more challenging then those performed at

4158 A.D. Cicco et al. / Journal of Non-Crystalline Solids 352 (2006) 4155–4165
high-temperature because both of their technical complex-ity and of the need of high photon flux due to the limiteddimensions of the sample. The powerful rotating anodeX-ray source shown in Fig. 1 represents an excellent oppor-tunity for performing diffraction studies under high-pres-sure conditions and for this reason we have developed adedicated energy dispersive X-ray diffraction (EDXD) sys-tem, using the second white X-ray beam exit provided by aRigaku RU300 spectrometer (right side of Fig. 1).
The energy-dispersive technique, realized through asolid state detector positioned at a fixed scattering angle,is an ideal choice for collecting X-ray diffraction scansunder high-pressure and/or high-temperature conditionsin a wide q range within reasonable data collection times,due to the intensity of the emitted Bremsstrahlungradiation.
The EDXD diffractometer includes an energy sensitiveGe solid state detector (SSD) (Canberra Ltd.), with precisecollimation systems (sollers and slits) for confining the scat-tering region within the sample volume. The detection sys-tem is a LEGe detector with energy resolution of 195 eV at5.9 keV. A lead shield is used to minimize counting ofbackground scattering radiation from the environment.The scattering angle can be tuned continuously using ahigh-precision translation motor and a rotating stage ori-enting the collimators and detector system in order to selectscattering area and resolution. The cell or sample holder isinstalled on a high-precision YZ translation stage, whichallows a precise positioning of the sample along the beam.
The high-pressure cell we are currently using is a large-volume Paris–Edinburgh (PE) V5 150 Tonn press, coupledusually with a 10 mm or 7 mm boron-epoxy biconical gas-ket (see [29,30] for descriptions of the opposite WC anvils
Fig. 4. Lateral view of the Paris–Edinburgh press V5 installed on our ED
recessed geometry). The boron-epoxy gaskets are producedby us using an original preparation procedure while smallinner parts of the sample assembly (crucibles, sample con-tainers, thermocouple) are either commercial products ormachined by external companies. The press, installed onthe motorized stages of the energy-dispersive spectrometer,is shown in Fig. 4. The PE cell, using a non-toroidal sampleassembly, allows to generate pressures up to about10.0 GPa over large-volume samples (10–20 mm3). Thesample, confined in the gasket, can be heated using an hol-low graphite cylinder as a crucible reaching very high tem-peratures, while the temperature is monitored by using aK-type thermocouple.
The correct alignment of the scattering area is controlledwith the help of a set of cameras and fluorescent screens,and verified by maximizing the signal of a fluorescencepeak coming from the sample. The pressure is determinedby using an internal pressure marker, mixed with the sam-ple or contained in the sample assembly. In fact, the samplecan be mixed with inert substances which equation of state(EOS) is known with good accuracy (NaCl, BN, LiF, Au,MgO, etc.).
Successful EDXD experiments have been already per-formed on Ag and Ge samples, and on polyethylene underpressure up to about 6 GPa. Results will be presented else-where. In Fig. 5 we present a typical EDXD spectrum col-lected at h � 19.66� under ambient conditions of a Gesample, conceived for high-pressure measurements. Thesample consists in a compacted mixture of fine Ge andLiF powders filling a graphite heater, positioned insidethe B-epoxy gasket. The EDXD pattern reported inFig. 5 show 23 diffraction lines useful for refinement of cellparameters (EOS) and identification of phase transitions.
XD set-up, based on a Rigaku RU300 rotating anode spectrometer.

Fig. 5. EDXD scan at a given scattering angle for a Ge sample mixed with LiF, showing the typical spectral shape obtained with the Mo X-ray anode. Allof the Ge and LiF Bragg peaks coming from the sample are indexed in the figure. The background is due to the diffuse scattering mainly from the B-epoxygasket. Other sharp peaks are associated with Ge fluorescence and with the strong Mo X-ray emission lines (Ka and Kb).
A.D. Cicco et al. / Journal of Non-Crystalline Solids 352 (2006) 4155–4165 4159
Obviously, typical emission lines from Mo anode target(Mo Ka, Mo Kb) and fluorescence lines of germanium(Ge Ka, Ge Kb) are also visible in Fig. 5, but a large energyregion is available for structural studies. The q range acces-sible at this collecting angle using an X-ray white beamwith components up to 50.0 keV is 1.4 A 6 q 6 8.6 A andcan be easily extended by changing the scattering anglewith the motorized translator. This equipment allowsaccurate investigations about the structure and phase tran-sitions in materials under extreme high-pressure/tempera-ture conditions in our laboratory.
4. High-pressure angular X-ray diffraction
X-ray diffraction experiments in the 10–100 GPa pres-sure range (and more) are usually performed using dia-mond anvil cells (DACs), but in this case there arestringent conditions about photon flux and collimation asthe typical sample size is in the 10–100 lm range and forthis reason experiments are mostly performed using syn-chrotron radiation.
However, the use of laboratory X-ray sources is still via-ble when selecting suitable anode targets (photon energies)to be placed in proximity of the sample, proper collimatorsand area detectors. In this spirit, we have developed anhigh-pressure X-ray angular diffraction set-up for systemsconfined in a miniaturized Diamond Anvil Cell (DAC),by modifying both sample holder and detector arm in afour-circle Kuma-Oxford diffractometer. In principle, thisequipment is able to study structure and phase transitionsof condensed matter in a wide range of pressures up to100 GPa and temperatures up to about 700 K. The sample
pressure inside the DAC can be measured as usual bymeans of the ruby fluorescence using a specialized low-costset-up with a green diode laser and a SpectraPro 275monochromator.
The DAC currently used (D’Anvils Ltd.) achieves amaximum pressure of about 60 GPa (limited by diamonds’culet dimension) with an aperture of 40� (usually from�20� to +20� but tilting the cell respect the X-ray beamwe can have �10� to 30�). The Kuma-Oxford diffractome-ter is equipped with a 3 kW Mo anode (i.e. 17.47 keV emis-sion line) resulting in a very low absorption through thediamonds and a wider accessible q range for a limited angu-lar dispersion. This allows to perform precise structuralstudies of crystalline powders, single-crystals and disor-dered systems.
A special holder for the miniaturized DAC has beendeveloped as shown in Fig. 6, allowing a micrometric posi-tioning of the center of the cell. We have also developed anarea detector holder using a high-resolution X-ray photo-graphic film (AFGA Structurix D7 10 · 24 cm wide) inorder to increase statistics by collecting entire Debye-Scherrer rings at two different positions covering differentangular ranges. This low-cost technical solution resultedto be extremely efficient. However, it is still possible to col-lect standard x � h scans using the original Kuma softwarewith the point detector, although this will be of coursemuch more time consuming.
In Fig. 7 we show a 2D pattern (12 h integration timewith 1 kW power) with the typical Debye-Scherrer ringsof crystalline Si powders at a pressure of about 1.1 GPaand room temperature. Bragg spots of the diamonds andspurious rings of the gasket are also visible in the figure.

Fig. 7. Bidimensional image of the diffraction pattern of Si powderspressurized at about 1.1 GPa inside the DAC. Several diffraction ringsassociated with Si interplanar distances are visible, together with Braggspots from the diamonds and spurious rings from the gasket material.
Fig. 8. Angular diffraction profile obtained by radial integration of the 2Dpattern of Fig. 7. Silicon, diamond and gasket Bragg peaks are identified.
Fig. 6. Miniaturized DAC in the sample holder in front of the collimatorof the four-circle diffractometer.
4160 A.D. Cicco et al. / Journal of Non-Crystalline Solids 352 (2006) 4155–4165
The usual radial integration of 2D data (FIT2D soft-ware) produces one-dimensional 2h diffraction patternswhere several Si Bragg peaks (here 111, 220, 3 11) canbe clearly identified together with those coming out fromthe gasket (in our case Inconel) and from the diamonds.The profile obtained by radial integration is shown inFig. 8, where two peaks coming from the gasket materialsand diamonds and three Si Bragg peaks are found. Thisresult shows that this type of high-pressure experimentscan be successfully performed in a laboratory and opensthe way to further studies of stable and metastable phasesunder pressure.
5. High-temperature electron-spectroscopy measurements
Phase transitions occurring at surfaces of solid systemsare of special interest both for basic reasons related tothe onset of bulk transitions and study of ordering and dis-ordering of 2D structures and for applications related topossible use of surfaces under non-standard conditionsfor example in electronic and optoelectronic devices. Animportant issue addressed in several recent studies is thestructural transition of a class of silicon and germaniumsurfaces taking place at high-temperatures. The metaliza-tion of those surface, usually interpreted as due to incom-plete surface melting, has been subject of numerousrecent studies (see for example [31–35] and Ref. therein).
In particular, in a recent study, [17] we have shown thathigh-temperature metalization can be studied by usingEELS (Electron Energy Loss Spectroscopy) and AES(Auger Electron Spectroscopy) at different probing depthswith a fine temperature step and a precise calibration andmeasurement of the sample temperature.
We have further improved the experimental setup,shown in Fig. 9, with respect to that reported in recent pub-lications [17,36]. An important advantage of the presentsetup is that the experimental system is fully interfaced witha Linux PC running an original data acquisition and con-trol program written in C language and using a 16 bitacquisition card. High-temperature experiments are cur-rently performed in an ultra-high vacuum (UHV) chamberequipped with a LEED system, a cylindrical mirror ana-lyzer (CMA) with a coaxial electron gun. The acquisitionprogram is able to collect the electron-spectroscopy signalfrom the CMA and sample temperature measured by thethermocouple and pyrometer probes. The software is alsoable to control the CMA energy window and the heating

Fig. 10. Upper panel: AES silicon KLL and LMM spectra as a functionof the temperature (red and thicker curves are above 1200 K). Spectra areshown as first derivatives of the flux of emitted electrons dN(E)/dE, asmeasured directly in our experiment (exp # 1). Lower Panel: Temperaturevariation of the LMM AES intensity (DIAES) at fixed energy (83 eV) inthree separate experiments (crosses, squares circles). A sharp transition isobserved above 1200 K. (For interpretation of the references in colour inthis figure legend, the reader is referred to the web version of this article.)
Fig. 9. Sketch of the set-up for high-temperature electron spectroscopy.
A.D. Cicco et al. / Journal of Non-Crystalline Solids 352 (2006) 4155–4165 4161
power through a DELTA SM 100-30 power supply. Thissoftware has been designed to be particularly flexible forvarious purposes being able to perform a series of succes-sive scans while modifying sample environment parametersin a virtually unrestricted way.
A novel heating unit has been developed in order toimprove temperature control and homogeneity as com-pared to previous experiments. Details of the first proto-type of the heating unit can be found elsewhere [36]. Thegeometry of the crucible-sample assembly [36] is similarto that developed for high-temperature XAS studies [27]and offers precise temperature control and an excellenttemperature homogeneity. Temperatures can be now mea-sured using a variety of probes with an accuracy betterthan 5� using K-type or S-type thermocouples placedbetween the crucible and the sample, and a pyrometerworking above 1000 K. A �500 lm wide hole in the cruci-ble allows us to collect EELS, AES, and LEED (Low-Energy Electron Diffraction) signals from the surface.
This improved experimental set-up has been used tostudy the occurrence of surface phase transitions in cleanSi(111) surfaces, using the sensitivity of AES lineshape tothe position of the involved electronic levels. Therefore,we have collected AES KLL and LMM spectra (dN(E)/dE) as a function of the temperature, as shown in Fig. 10(upper panel). The kinetic energies of the electrons are verydifferent ranging from 70–100 eV (LMM) to about 1600 eV(KLL), corresponding to different escape depth (�5 A and�30 A respectively [37]). A clear change in the AES LMMspectra is observed at high-temperatures, while the KLLspectra are much more similar to each other. This meansthat a change of the valence levels and atomic structureof the surface layers is taking place, while deeper layersand levels are basically unaffected. The temperature ofthe transition, measured only by the pyrometric probe inthree different experiments is around 1200 K.
The transition is quite sharp and is associated with ametalization of the surface, marked by an average increaseof the electron kinetic energy of the order of 2 eV (abouttwo times the band gap, as two valence levels are involvedin the Auger process). This transition can be identified asthe (7 · 7)-DAS to the so-called (1 · 1) structure, indicated
previously as a relaxed bulklike structure with random ada-toms (see [35] and Ref. therein). The present discrepancy inthe transition temperature with that indicated in the litera-ture (1100 K) can be due to a systematic deviation in thetemperature read by the pyrometric probe on the surfaceof the crucible which may be slightly different from thatof the Si(1 11) surface. The use of a ‘S’-type thermocoupledid not solve the problem. However, the striking sensitivityof this technique to surface transitions occurring at high-temperature is clearly revealed in the lower panel ofFig. 10, where the variation of the AES LMM intensity(DIAES) at fixed kinetic energy (83 eV) is reported for threeseparate experiments. The energy was chosen in a region ofvery high contrast between a metallic and a non-metallicphase, but similar curves can be obtained in the wholerange 80–95 eV.
6. High-temperature/pressure resistance measurements
Electroresistance measurements are of obvious impor-tance in studying phase transitions under extreme condi-tions, and can nicely complement detailed microscopicinformation as obtained by X-ray diffraction and absorp-tion techniques. We have thus developed a new experi-mental set-up for measurements under high-pressure and

4162 A.D. Cicco et al. / Journal of Non-Crystalline Solids 352 (2006) 4155–4165
temperature conditions, using the same technology for thesample environment available for the PE press (see Section3). This will allow, in principle, combined in situ measure-ments of electrical resistance curves and X-ray diffractionpatterns.
The experimental setup (see Fig. 11) is presently com-posed by a 50 Tonn hydraulic press, a DC power supplyand an automated data acquisition system (PC and dataacquisition board). The press, originally designed forindustrial purposes, has been modified for operating usinga couple of opposite WC anvils in the so-called recessed PEgeometry (non-toroidal), [29,30] compatible with those ofthe V5 PE press which can be used when higher load isneeded. The oil pressure line can reach a maximum valueof about 500 bar, corresponding to a maximum of about4 GPa using a 7 mm boron gasket (see Fig. 11).
The resistance under pressure of a typical metallic sam-ple can be measured using the configuration shown inFig. 11, where the sample is of cylindrical shape and opti-mized diameter in the range 0.2–2 mm. The voltage dropupon the sample due to the constant current flow is mea-sured at the sample sides or by suitable contacts in theinner part of the gasket (‘four point’ method). The electri-cal contact with the sample is guaranteed by two thin metalfoils (Cu, Ag, Au) inserted between the gasket and theupper and lower anvils. The constant electrical current suit-able for heating the sample and measuring the sample resis-tance is generated by a DELTA SM 100-30 or 200-15power supplies, connected to the anvils by means of twohigh current wires.
Fig. 11. Set-up for high-pressure/temperature resistance measurements.The blow-up in the lower figures shows a typical sample environment inthe present high-pressure geometry. On the right the gasket-sampleassembly with electrodes, on the left the sample positioned between theanvils.
The data acquisition setup is composed by a personalcomputer running Linux (present kernel version 2.4) oper-ating system and a 16 bit analog-to-digital PCI-DAS1602/16 acquisition board (Measurement Computing TM) con-nected to the PCI slot. The board reads continuously thevoltage upon the sample running with a clock frequencyof 100 KHz. A thermocouple voltage can be also readsimultaneously. Moreover the board controls the powersupply using one of its analog output channels. The oilpressure is collected connecting the PC with a WIKA dig-ital probe using a serial RS232 protocol. A dedicated origi-nal software in C language has been developed for dataacquisition and control.
As an example of the potential of the new setup, wepresent new resistance measurements of Bi in a limitedpressure temperature range (estimated up to about 700 Kand 4 GPa). The sample has been obtained by filling com-pletely an hollow boron gasket with fine Bi powders,melted and compacted prior of application of pressure.We produced a cylindrical sample of about 17 mm3 forthe 7 mm boron-epoxy gasket. In this experiment the tem-perature is simply evaluated by the electrical power heatingthe sample.
The experimental setup currently allows us to carry outautomated measurements of the sample resistance underpseudo-isobar (constant oil pressure) and pseudo-isotherm(constant-power) conditions. A typical constant-powerscan of Bi is shown in Fig. 12, as a function of the externaloil pressure. The three curves shown in Fig. 12 correspondto different heating powers (temperatures) and follows theslope of the Bi I–Bi II and Bi II–Bi III transitions of theknown phase diagram [20,21].
A typical temperature scan at fixed oil pressure (82 bars)is shown in Fig. 13. The actual pressure on the sample isestimated to be about 1.7 GPa. The change of slope of
Fig. 12. Three pressure scans corresponding to different heating powers(temperatures). Data acquisition rate is one second per point. Twostructural phase transitions are detected which correspond to the I–II andII–III transitions.

Fig. 13. Temperature scans at fixed oil pressure (82 bars) obtained varyingcurrent flow through the sample from 3 to 55 A. The estimated pressure ofthe sample is about 1.7 GPa. The thermalization time is 1 s. The onset ofthe expected phase transitions (melting/crystallization) occur upon themaxima of the sample resistance.
A.D. Cicco et al. / Journal of Non-Crystalline Solids 352 (2006) 4155–4165 4163
the resistance upon melting is in agreement with previousdata [20] and now the highly-automated data collection isable to give additional hints about tiny details of the resis-tance curve, undercooling of Bi, and already observed hys-teresis phenomena [20,21]. In particular, this experimentopens the way to collect data of unprecedented statisticsabout the proposed existence of liquid–liquid transitionsin Bi [19].
Fig. 14. Scanning electron microscopy images of Ga films with nominalthickness of 44 nm (upper) and 100 nm (lower image). Ga films areconstituted by ensembles of submicrometric droplets of average sizeincreasing with the nominal thickness.
7. Low-temperature resistance measurements
As discussed in the previous Section, resistance measure-ments are a very sensitive tool for studying phase transi-tions in condensed systems. Particular efforts have beenthus devoted to the development of an original systemfor low-temperature resistance measurements of bulk andfilm samples.
In particular, we have modified the cold finger of a dou-ble-stage closed-cycle He cryostat with an additional stageable to reach temperatures as low as 2.3 K. The additionalstage is a chamber loaded with He at high-pressures(130 atm) and is connected to the previous two stagesthrough a separator which acts as a thermal key, hinderingthe heat flow to the additional stage. The He gas is cooleddown to about 12 K by the two-stage cryostat and is sub-ject to an adiabatic expansion by opening a valve. The tem-perature decrease is obtained only in the additional stagecontaining the sample, thermally isolated from the two-stage cryostat by the thermal key component.
This composite cryostat is operated through an elec-tronic and software control which allow us to performhighly-automated operations. The temperature is measuredthrough a set of 2 T-type thermocouples positioned on thedouble-stage elements and 1 graphite resistor-type ther-
mometer in direct contact with the sample, which can befilms or bulk-type systems. The resistance curves areobtained by imposing a current flow through the sampleand measuring the potential using both standard fourpoints and Van Der Pauw methods. In this way we are ableto obtain resistance measurements in a wide 1 lX–1 MXrange, using currents from 1 lA to 10 mA.
A quite interesting example of measurements, presentedhere for the first time, is the trend of the resistance of Gafilm of different thickness in the 2.2–300 K temperaturerange. The films were produced by evaporation of high-purity Ga under vacuum (�6 · 10�4 Pa) over suitable sub-strates (glass covered by a �60 A SiO film). The nominalthickness of the Ga films, in the 30–2000 A range, was eval-uated by a quartz microbalance (Inficon Leyold XTM).
The morphology of the film is obviously very importantaffecting various physical properties including the resistiv-ity. In Fig. 14 we report, as an example, the scanning elec-tron microscopy images of films with 44 nm (upper) and100 nm (lower image) as nominal thickness. The films arefound to be composed by an ensemble of submicrometricdroplets of approximate spherical shape, whose averagedimensions critically depends on the estimated total thick-ness. An accurate statistical analysis of those images showthat a log-normal model (see [38,12,18] and Ref. therein)reproduces accurately the size distribution with an average
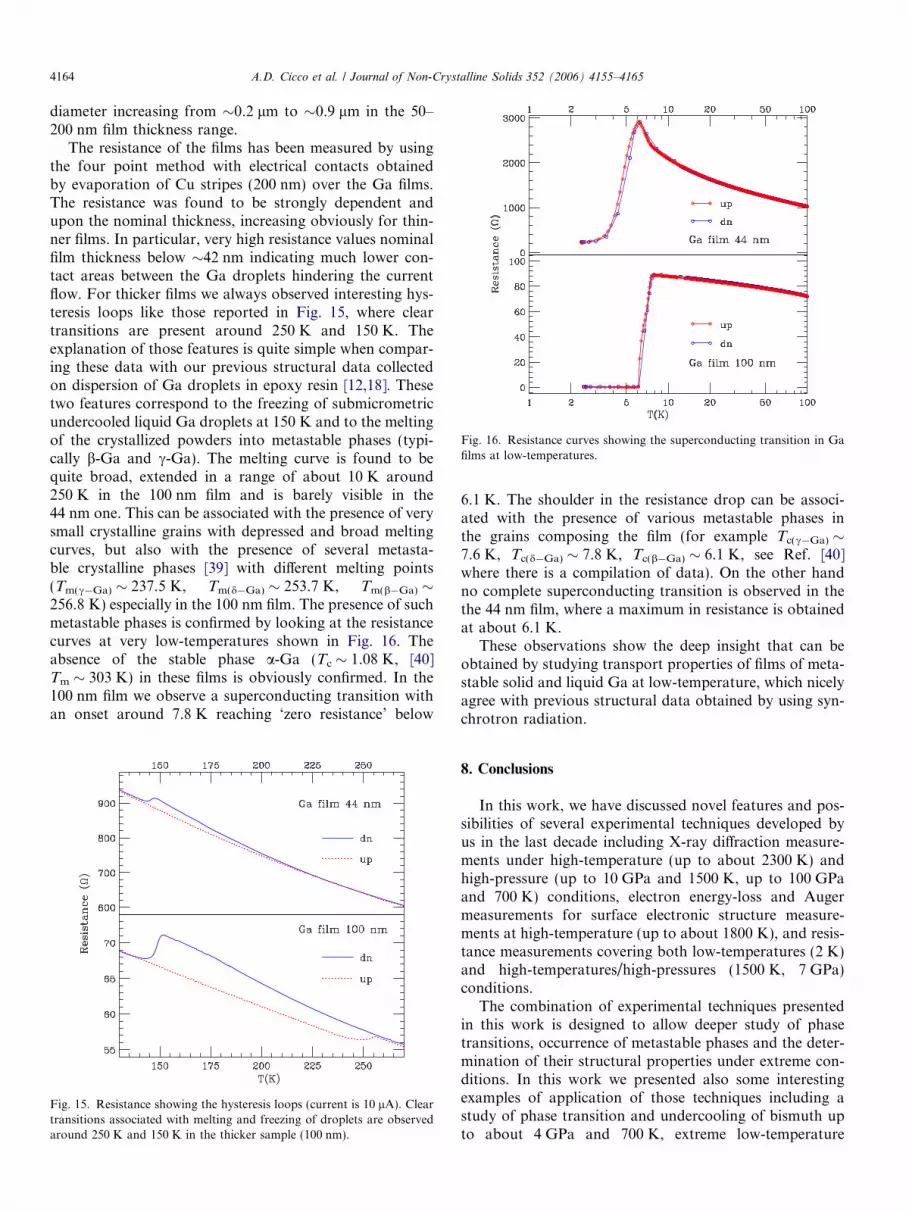
Fig. 16. Resistance curves showing the superconducting transition in Gafilms at low-temperatures.
4164 A.D. Cicco et al. / Journal of Non-Crystalline Solids 352 (2006) 4155–4165
diameter increasing from �0.2 lm to �0.9 lm in the 50–200 nm film thickness range.
The resistance of the films has been measured by usingthe four point method with electrical contacts obtainedby evaporation of Cu stripes (200 nm) over the Ga films.The resistance was found to be strongly dependent andupon the nominal thickness, increasing obviously for thin-ner films. In particular, very high resistance values nominalfilm thickness below �42 nm indicating much lower con-tact areas between the Ga droplets hindering the currentflow. For thicker films we always observed interesting hys-teresis loops like those reported in Fig. 15, where cleartransitions are present around 250 K and 150 K. Theexplanation of those features is quite simple when compar-ing these data with our previous structural data collectedon dispersion of Ga droplets in epoxy resin [12,18]. Thesetwo features correspond to the freezing of submicrometricundercooled liquid Ga droplets at 150 K and to the meltingof the crystallized powders into metastable phases (typi-cally b-Ga and c-Ga). The melting curve is found to bequite broad, extended in a range of about 10 K around250 K in the 100 nm film and is barely visible in the44 nm one. This can be associated with the presence of verysmall crystalline grains with depressed and broad meltingcurves, but also with the presence of several metasta-ble crystalline phases [39] with different melting points(Tm(c�Ga) � 237.5 K, Tm(d�Ga) � 253.7 K, Tm(b�Ga) �256.8 K) especially in the 100 nm film. The presence of suchmetastable phases is confirmed by looking at the resistancecurves at very low-temperatures shown in Fig. 16. Theabsence of the stable phase a-Ga (Tc � 1.08 K, [40]Tm � 303 K) in these films is obviously confirmed. In the100 nm film we observe a superconducting transition withan onset around 7.8 K reaching ‘zero resistance’ below
Fig. 15. Resistance showing the hysteresis loops (current is 10 lA). Cleartransitions associated with melting and freezing of droplets are observedaround 250 K and 150 K in the thicker sample (100 nm).
6.1 K. The shoulder in the resistance drop can be associ-ated with the presence of various metastable phases inthe grains composing the film (for example Tc(c�Ga) �7.6 K, Tc(d�Ga) � 7.8 K, Tc(b�Ga) � 6.1 K, see Ref. [40]where there is a compilation of data). On the other handno complete superconducting transition is observed in thethe 44 nm film, where a maximum in resistance is obtainedat about 6.1 K.
These observations show the deep insight that can beobtained by studying transport properties of films of meta-stable solid and liquid Ga at low-temperature, which nicelyagree with previous structural data obtained by using syn-chrotron radiation.
8. Conclusions
In this work, we have discussed novel features and pos-sibilities of several experimental techniques developed byus in the last decade including X-ray diffraction measure-ments under high-temperature (up to about 2300 K) andhigh-pressure (up to 10 GPa and 1500 K, up to 100 GPaand 700 K) conditions, electron energy-loss and Augermeasurements for surface electronic structure measure-ments at high-temperature (up to about 1800 K), and resis-tance measurements covering both low-temperatures (2 K)and high-temperatures/high-pressures (1500 K, 7 GPa)conditions.
The combination of experimental techniques presentedin this work is designed to allow deeper study of phasetransitions, occurrence of metastable phases and the deter-mination of their structural properties under extreme con-ditions. In this work we presented also some interestingexamples of application of those techniques including astudy of phase transition and undercooling of bismuth upto about 4 GPa and 700 K, extreme low-temperature

A.D. Cicco et al. / Journal of Non-Crystalline Solids 352 (2006) 4155–4165 4165
undercooling (150 K) and presence of metastable states ingallium films, and detection of metalization of the Si sur-face at high-temperature (about 1300 K).
The availability of these techniques in a joint UniversityLaboratory is an important factor for the success of crucialexperiments to be developed during limited dedicatedbeamtime in large-scale synchrotron radiation facilities,where usually state-of-the-art equipments for high-pres-sure/temperature experiments are available and the naturalX-ray collimation and beam intensity can be exploited forsmall-sized samples. The success of our experimental pro-gram using synchrotron radiation (see for example Ref.[13,12,14,10,11]) critically depends on these in-housedevelopments.
Acknowledgements
We would like to acknowledge the invaluable technicalhelp of Roberto Bernardini, Franco Bizzarri, TizianoGabrielli, Carlo Santoni, as well as several students collab-orating to the various experimental activities mentioned inthis paper: Riccardo Chiucchi, Lucia Comez, FrancescoCottone, Piergiorgia Falcioni, Simone Fusari, Joanna Gac-kowska, Dennis Moroni, Kuba Karczewski, Slawomir Zie-ba. We also thank Dr. Simone De Panfilis for helping us insetting up the instrumentation during his stay in the formerCamerino-INFM research unit. Professor Laura E. Depero(Universita di Brescia), who provided important instru-mentation tuned by us and used for this research, is kindlyacknowledged. Dr Valerio Rossi Albertini (ISM, CNR) isalso kindly acknowledged for providing us additionalexperimental equipments. We thank the former nationalinstitute INFM, supporting this research through the pro-jects FLUMET and HPIT and through its scientific sectionC under the direction of Professor G. Viliani. The alsothank CNR for the support of the X-ray diffraction instru-mentation during the initial stage of development of thelaboratory.
We emphasize that this work has been realized in spiteof the recent restrictions in research budget and supportof experimental activities by MIUR (Italian Minister ofEducation and Research) and by the management of theUniversity of Camerino.
References
[1] S. Scandolo, R. Yeanloz, Am. Sci. 91 (2003) 516.[2] P.F. McMillan, J. Mater. Chem. 14 (2004) 1506.[3] P.H. Poole, T. Grande, C.A. Angell, P.F. McMillan, Science 275
(1997) 322.[4] G. Franzese, G. Malescio, A. Skibinsky, S.V. Buldyrev, H.E. Stanley,
Nature 409 (2001) 692.
[5] T.S. Duffy, Rep. Prog. Phys. 68 (2005) 1811.[6] Various authors, J. Synchrotron Radiation, 12 (2005) Chapter SXD
at Mbar pressures, pp. 547–665.[7] J.P. Itie, A. Polian, D. Martinez-Garcia, V. Briois, A. Di Cicco, A.
Filipponi, A. San Miguel, J. Phys. IV 7 (1997) C2.[8] A. Filipponi, M. Borowski, D.T. Bowron, S. Ansell, A. Di Cicco, S.
De Panfilis, J.-P. Itie, Rev. Sci. Instrum. 71 (2000) 2422.[9] A. Filipponi, V.M. Giordano, S. De Panfilis, A. Di Cicco, E. Principi,
A. Trapananti, M. Borowski, J.-P. Itie, Rev. Sci. Instrum. 74 (2003)2654.
[10] A. Di Cicco, A. Trapananti, S. Faggioni, A. Filipponi, Phys. Rev.Lett. 91 (2003) 135505.
[11] E. Principi, A. Di Cicco, F. Decremps, A. Polian, S. De Panfilis, A.Filipponi, Phys. Rev. B 69 (2004) 201201, pages 4.
[12] A. Di Cicco, Phys. Rev. Lett. 81 (1998) 2942.[13] A. Di Cicco, M. Minicucci, A. Filipponi, Phys. Rev. Lett. 78 (1997)
460.[14] A. Filipponi, A. Di Cicco, S. De Panfilis, Phys. Rev. Lett. 83 (1999)
560.[15] A. Di Cicco, G. Aquilanti, M. Minicucci, A. Filipponi, J. Rybicki, J.
Phys.: Condens. Mat. 11 (1999) L43.[16] R. Poloni, S. De Panfilis, A. Di Cicco, G. Pratesi, E. Principi, A.
Trapananti, A. Filipponi, Phys. Rev. B 71 (2005) 184111.[17] A. Di Cicco, B. Giovenali, R. Gunnella, E. Principi, Solid State
Commun. 134 (2005) 577.[18] A. Di Cicco, S. Fusari, S. Stizza, Philos. Mag. B 79 (1999) 2113.[19] A.G. Umnov, V.V. Brazhkin, S.V. Popova, R.N. Voloshin, J. Phys.:
Condens. Mat. 4 (1992) 1427.[20] F.P. Bundy, Phys. Rev. 110 (1958) 314.[21] H. Tracy Hall, Rev. Sci. Instrum. 31 (1960) 125.[22] E. Principi, M. Minicucci, A. Di Cicco, A. Trapananti, S. De Panfilis,
R. Poloni, Phys. Rev. B 74 (2006) 064101.[23] A. Filipponi, J. Phys.: Condens. Mat. 13 (2001) R23.[24] A. Di Cicco, E. Principi, A. Filipponi, Phys. Rev. B 65 (2002) 212106.[25] A. Trapananti, A. Di Cicco, Phys. Rev. B 70 (2004) 014101.[26] A. Trapananti, A. Di Cicco, M. Minicucci, Phys. Rev. B 66 (2002)
014202.[27] A. Filipponi, A. Di Cicco, Nucl. Instrum. Meth. Phys. Res. B 93
(1994) 302.[28] D. Garipoli, P. Bergese, E. Bontempi, L.E. Depero, M. Minicucci, A.
Di Cicco, Abstracts for the 20th Conference of the IUCr, Acta Cryst.A61 (2005) C470.
[29] J.M. Besson, R.J. Nelmes, G. Hamel, J.S. Loveday, G. Weill, S. Hull,Physica B 180 & 181 (1992) 907.
[30] L.G. Khvostantsev, V.N. Slesarev, V.V. Brazhkin, High. Press. Res.24 (2004) 371.
[31] S. Modesti, V.R. Dhanak, M. Sancrotti, A. Santoni, B.N.J. Persson,E. Tosatti, Phys. Rev. Lett. 73 (1994) 1951.
[32] N. Takeuchi, A. Selloni, E. Tosatti, Phys. Rev. B 55 (1997) 15405.[33] A.L. Glebov, J.P. Toennies, S. Vollmer, Phys. Rev. Lett. 82 (1999)
3300.[34] S. Vandre, A. Santoni, A. Goldoni, V.R. Dhanak, M. Sancrotti, Surf.
Sci. 283 (1997) 377.[35] Y. Fukaya, Y. Shigeta, Phys. Rev. Lett. 85 (2000) 5150.[36] A. Di Cicco, B. Giovenali, R. Bernardini, E. Principi, Phys. Scripta
T115 (2005) 1068.[37] C.J. Powell, A. Jablonski, J. Phys. Chem. Ref. Data 28 (1999) 19.[38] L. Ottaviano, A. Filipponi, A. Di Cicco, Phys. Rev. B 49 (1994)
11749.[39] L. Bosio, A. Defrain, M. Dupont, J. Chim. Phys. 68 (1971) 542.[40] D. Teske, J.E. Drumheller, J. Phys.: Condens. Mat. 11 (1999) 4935.


