Embed Size (px)
Citation preview
JOURNAL OF MATERIALS SCIENCE, 32 (1997) 3375—3385
Effect of prior cold work on mechanicalproperties and structure of an age-hardenedCu–1.5wt% Ti alloy
S. NAGARJUNA, K. BALASUBRAMANIAN*Defence Metallurgical Research Laboratory, and *Non-Ferrous Materials TechnologyDevelopment Centre, Kanchanbagh-PO, Hyderabad 500 058, India
D. S. SARMADepartment of Metallurgical Engineering, Banaras Hindu University, Varanasi 221 005, India
The effects of prior cold work on hardness, tensile properties, electrical conductivity and
microstructure of an aged Cu—1.5 wt % Ti alloy have been studied by employing hardness
and resistivity measurements, tensile tests and scanning and transmission electron
microscopy. The hardness increased from 80 VHN in the solution-treated condition, to
210 VHN on peak ageing and 280 VHN with prior cold work followed by ageing. While
a similar trend has been observed in yield and tensile strengths, the ductility (percentage
elongation) decreased from 45% to 9%. The electrical conductivity of the alloy also increased
up to 26% International annealed copper standard upon ageing the cold-worked alloy.
Maximum strengthening of the alloy was associated with the precipitation of metastable,
coherent and ordered Cu4 Ti, b@ phase having body-centred tetragonal structure. The
differences in the properties and microstructural evolution between low and high titanium
alloys (for example, the absence of composition modulations and deformation twins in
Cu—1.5 Ti alloy, while they are present in Cu—4.5 Ti alloy) have been discussed. Prior cold
work did not change the fracture mode of microvoid coalescence.
1. IntroductionWorldwide research on Cu—Ti alloys has been mainlyaimed at developing a substitute for Cu—Be alloyswhich are highly expensive and pose health hazardsduring manufacture and processing, due to toxicity ofberyllium metal. It is now well established that Cu—Tialloys containing up to about 5.5 wt% Ti, can developvery high strength levels through precipitation hard-ening [1]. The following sequence of decompositionwas found to occur in these alloys [2—5]:
(i) spinodal decomposition leading to long-rangecomposition fluctuations and modulated structures;
(ii) formation of ordered, metastable and coherentCu
4Ti, b@ precipitates;
(iii) growth of the Cu4Ti precipitates;
(iv) loss of coherency and formation of the equilib-rium phase, b Cu
3Ti.
Earlier studies on Cu—Ti alloys were confined tomechanisms of spinodal decomposition, structure andproperty (mostly hardness and tensile properties, upto some extent) changes during ageing [6—17]. Fur-ther, work on the effects of prior cold work was limitedto hardness and microstructural investigations in hightitanium containing Cu—Ti alloys [1, 18—21]. How-ever, little work has been reported on the effects ofprior cold deformation on tensile properties and elec-trical conductivity in Cu—Ti alloys with low titanium
contents. Therefore, we have undertaken a project to0022—2461 ( 1997 Chapman & Hall
investigate the effects of prior cold work on hardness,tensile properties, electrical conductivity and micro-structure during ageing of Cu—Ti alloys containinglow ((3 wt %) and high ('3 wt%) titanium con-tents. Results on a Cu—4.5 wt% Ti (high titaniumcontent) alloy have been reported [22] recently, inwhich we have shown that the properties of the cold-worked and aged alloy approach those of the commer-cial Cu—2Be—0.5Co alloys.
The aim of the present investigation was to studythe influence of ageing on the structure and propertiesof a Cu—1.5 wt% Ti alloy with and without priorcold work and also to determine if the propertiesare comparable with those of the commercialCu—0.5Be—2.5Co alloy. This paper presents the resultsobtained on age-hardening curves, tensile properties,electrical conductivity and transmission electronmicroscopy (TEM) of the alloy in different tempers.
2. Experimental procedureA 30 kg melt of Cu—Ti alloy with an aimed titaniumcontent of 1.5 wt% was made in a vacuum inductionmelting (VIM) furnace with Cu—Ti master alloy and99.99% purity oxygen-free electronic copper (OFEC)as charge material. The liquid alloy was poured intoa graphite mould and cooled in the mould chamber of
the VIM furnace. The ingot was homogenized and3375
analysed for titanium content. The chemical analysisshowed that the analysed composition matched theaimed titanium content with $0.1 wt% accuracy.The ingot was hot forged and rolled at 800 °C toobtain 10 mm thick plates and 12 mm diameterrods.
Samples from hot-rolled plate were solution treatedat 900 °C for 2 h and rapidly quenched in water. Thesesamples were aged at different temperatures (400, 450,500 and 550 °C) and their hardness (VHN) was meas-ured. The solution-treated samples were cold-rolledgiving different amounts of cold deformation. Thehardness of the cold-deformed samples was measuredafter ageing at 400, 450 and 500 °C. Flat tensile sam-ples with 25 mm gauge length, as per the ASTM speci-fication E 8M-89b [23] (sub-size specimen) were madefrom the solution-treated and cold-rolled strips, peakaged at 400 °C and tested for tensile properties. Thetensile-tested specimens were observed under a scann-ing electron microscope (SEM) to identify the mode offracture occurring in this alloy with and without priorcold deformation.
Rod samples after solution treatment (900 °C/2 h/WQ), were cold drawn giving 30% and 95% re-duction in area, to a final diameter of 2 mm. Electricalresistance of these wires was measured using KelvinBridge apparatus at room temperature in solution-treated, aged, as-cold drawn, and cold drawn and aged(at 400 and 450 °C) conditions. Electrical conductivitywas determined according to the ASTM specificationB 193-89 [24].
Optical metallography of the alloy was carried outin solution-treated (ST), peak-aged (PA), overaged,solution-treated#cold-worked (CW) and ST#CW#
PA conditions. Thin foils for TEM were preparedboth from sheet and rod materials. Discs and sheetsamples were mechanically polished to 10—15 lm.Discs, 3 mm in diameter, were punched out from thethinned specimens and electropolished in a twin-jetelectropolisher, using a solution of 30 vol% nitric acidand 70 vol% methnol at !45 °C and at a voltage of10 V. The thin foils were examined at 160 kV usingJeol 200 CX TEM.
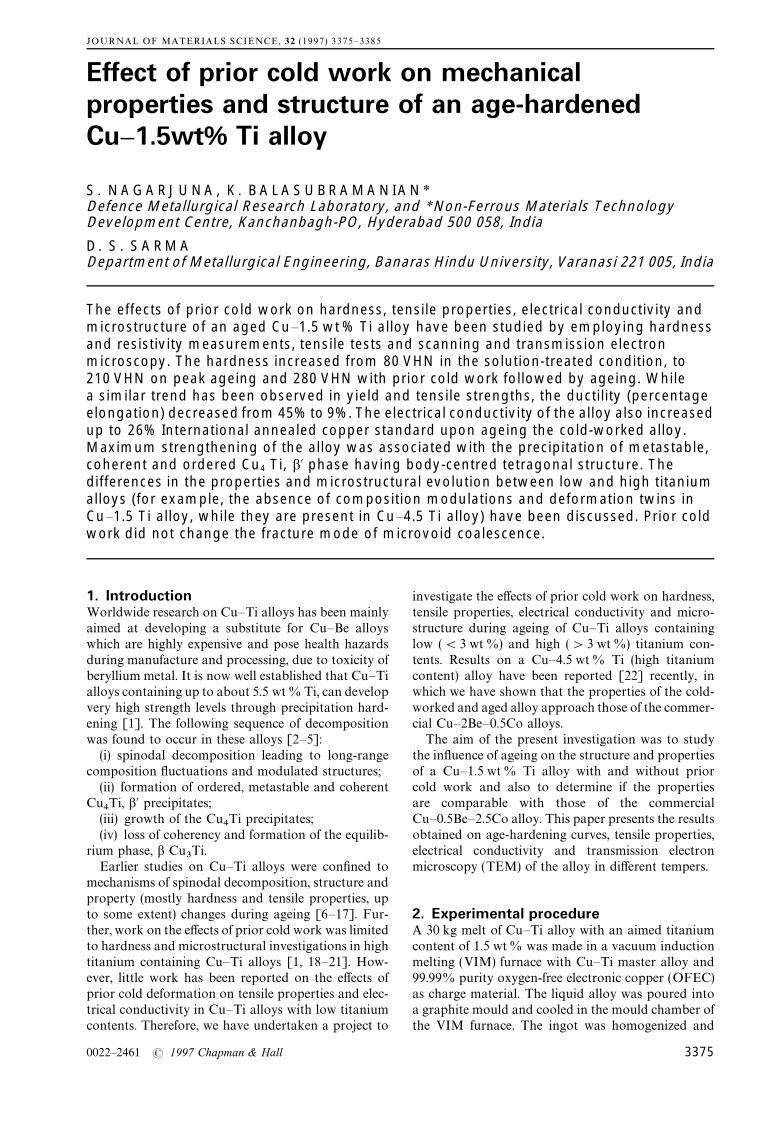
3. Results3.1. Mechanical propertiesThe effect of ageing time on the hardness of solution-treated Cu—1.5 wt % Ti alloy at different temperaturesis shown in Fig. 1. While the alloy has not attainedpeak hardness at 400 °C even after ageing for 32 h,a peak hardness of 210 VHN was reached after ageingat 450 °C for 16 h beyond which the hardness de-creased gradually with increasing time. The peakhardness was slightly lower (198 VHN) and overage-ing was rapid on ageing at 500 °C. The overageing wasdrastic and peak hardness was further lowered to180 VHN when aged at 550 °C.
The influence of prior cold work on the hardness ofthe alloy after ageing at 400, 450 and 500 °C is shownin Fig. 2—4, respectively. At all ageing temperatures,increasing the amount of cold work (20% to 80%)
caused an improvement in the peak hardness (the3376
Figure 1 Age hardening in Cu—1.5 wt% Ti alloy at (s) 400 °C, (h)450 °C, (n) 500 °C, (]) 550 °C.
Figure 2 Effect of prior cold work on age hardening in Cu—1.5 wt%Ti at 400 °C: (d) 80%, (]) 60%, (n) 40%, (h) 20% and (s) 0% coldrolled.
highest hardness measured was 280 VHN after 80%cold work followed by ageing at 400 °C for 6 h). Theoverageing of cold-worked alloy was marginal at400 °C, considerable at 450 °C and drastic at 500 °C.For example, the hardness of the 80% cold-workedalloy aged at 500 °C for 12 h was lower than that of theundeformed and aged one.
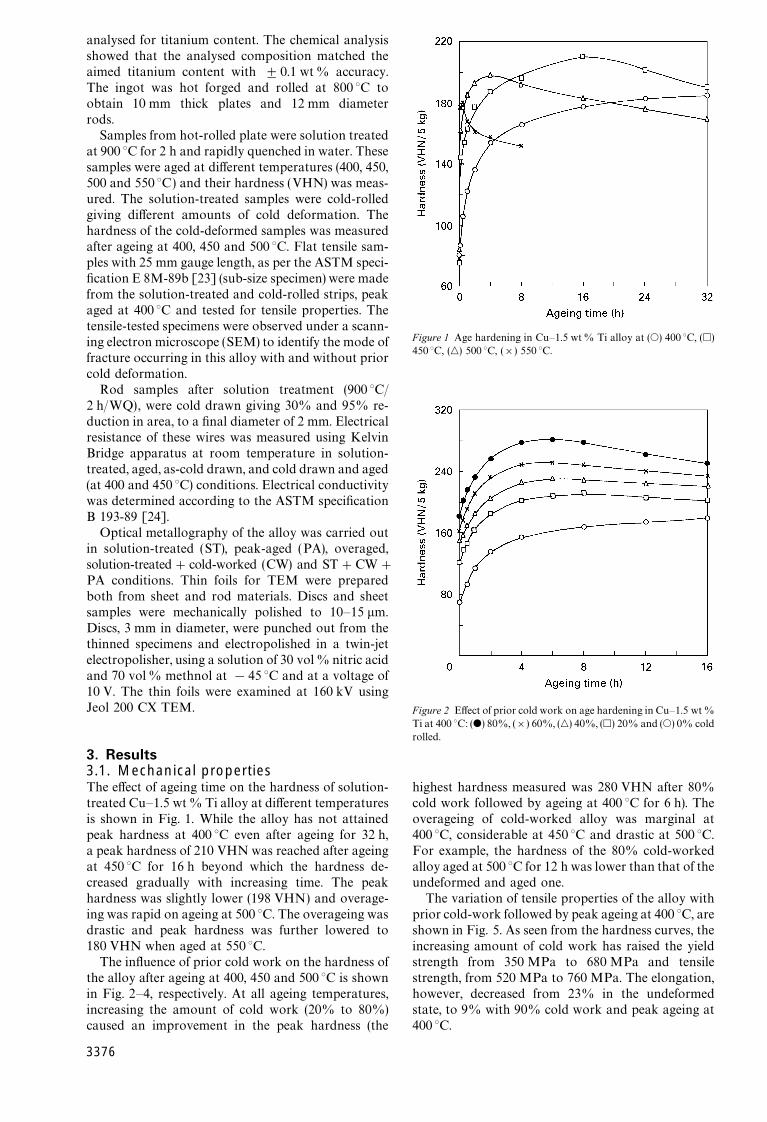
The variation of tensile properties of the alloy withprior cold-work followed by peak ageing at 400 °C, areshown in Fig. 5. As seen from the hardness curves, theincreasing amount of cold work has raised the yieldstrength from 350 MPa to 680 MPa and tensilestrength, from 520 MPa to 760 MPa. The elongation,however, decreased from 23% in the undeformedstate, to 9% with 90% cold work and peak ageing at
400 °C.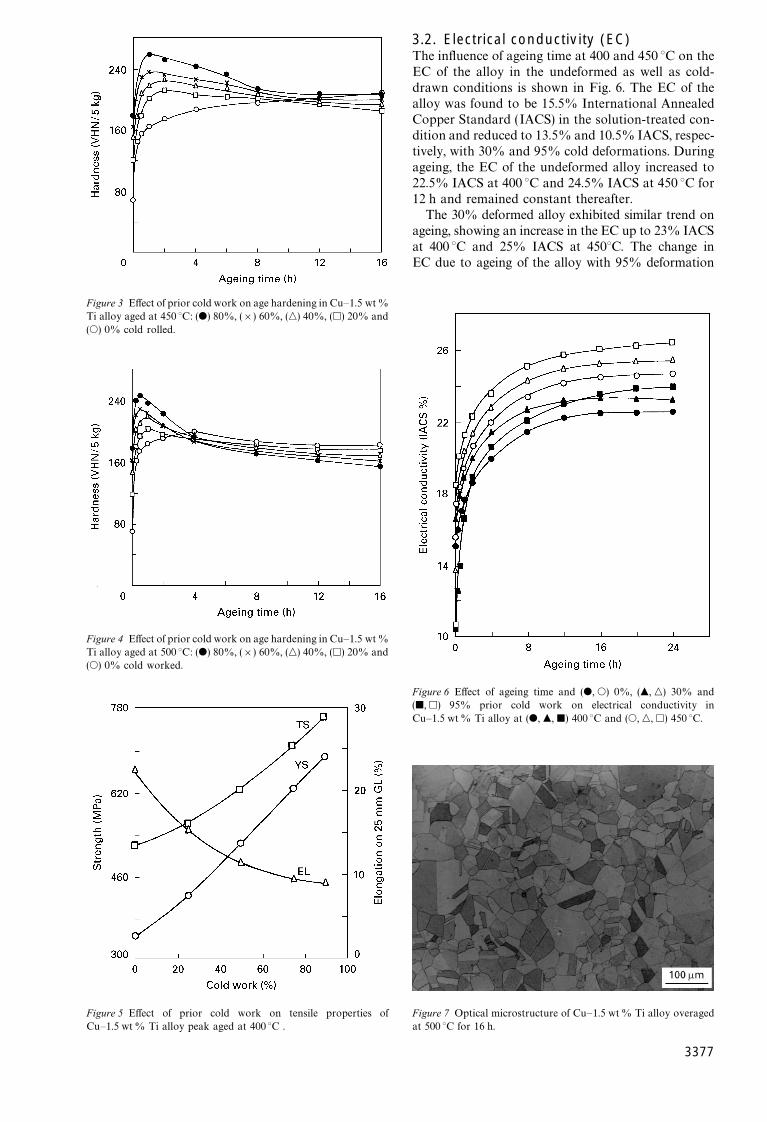
Figure 7 Optical microstructure of Cu—1.5 wt% Ti alloy overaged
Figure 3 Effect of prior cold work on age hardening in Cu—1.5 wt%Ti alloy aged at 450 °C: (d) 80%, (]) 60%, (n) 40%, (h) 20% and(s) 0% cold rolled.
Figure 4 Effect of prior cold work on age hardening in Cu—1.5 wt%Ti alloy aged at 500 °C: (d) 80%, (]) 60%, (n) 40%, (h) 20% and(s) 0% cold worked.
Figure 5 Effect of prior cold work on tensile properties of
Cu—1.5 wt% Ti alloy peak aged at 400 °C .3.2. Electrical conductivity (EC)The influence of ageing time at 400 and 450 °C on theEC of the alloy in the undeformed as well as cold-drawn conditions is shown in Fig. 6. The EC of thealloy was found to be 15.5% International AnnealedCopper Standard (IACS) in the solution-treated con-dition and reduced to 13.5% and 10.5% IACS, respec-tively, with 30% and 95% cold deformations. Duringageing, the EC of the undeformed alloy increased to22.5% IACS at 400 °C and 24.5% IACS at 450 °C for12 h and remained constant thereafter.
The 30% deformed alloy exhibited similar trend onageing, showing an increase in the EC up to 23% IACSat 400 °C and 25% IACS at 450°C. The change inEC due to ageing of the alloy with 95% deformation
Figure 6 Effect of ageing time and (d, s) 0%, (m, n) 30% and(j, h) 95% prior cold work on electrical conductivity inCu—1.5 wt% Ti alloy at (d, m, j) 400 °C and (s, n, h) 450 °C.
at 500 °C for 16 h.
3377
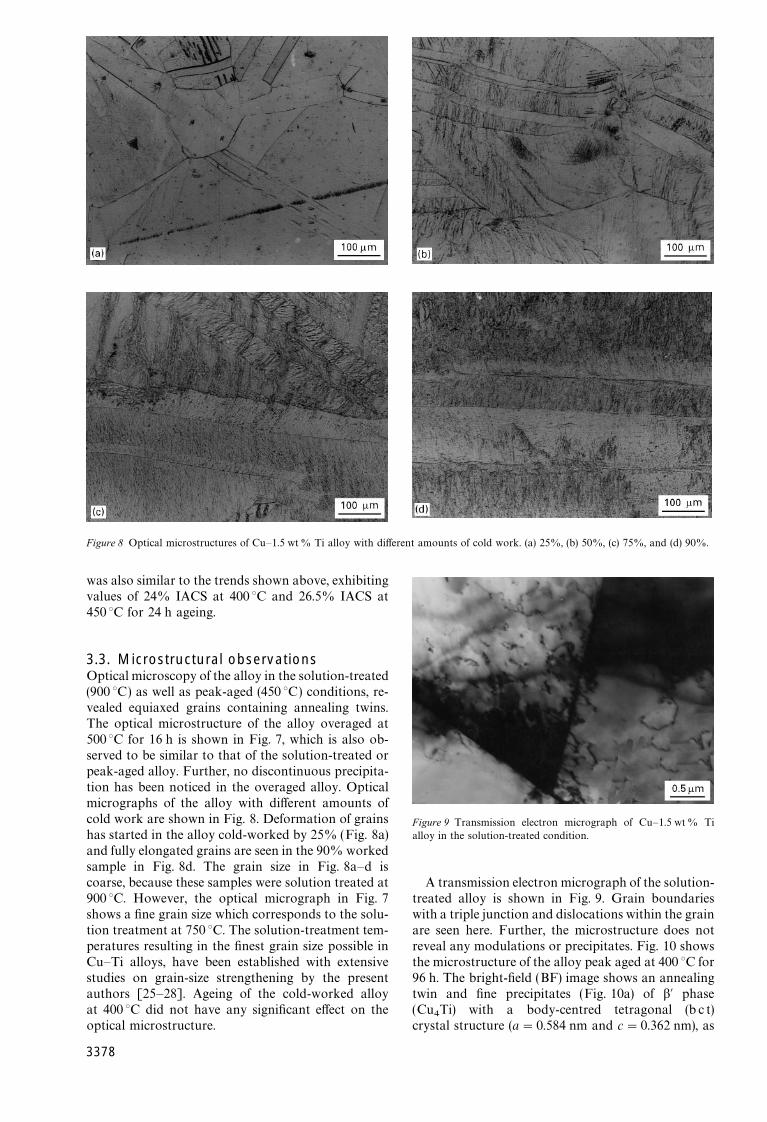
Figure 8 Optical microstructures of Cu—1.5 wt% Ti alloy with different amounts of cold work. (a) 25%, (b) 50%, (c) 75%, and (d) 90%.
was also similar to the trends shown above, exhibitingvalues of 24% IACS at 400 °C and 26.5% IACS at450 °C for 24 h ageing.
3.3. Microstructural observationsOptical microscopy of the alloy in the solution-treated(900 °C) as well as peak-aged (450 °C) conditions, re-vealed equiaxed grains containing annealing twins.The optical microstructure of the alloy overaged at500 °C for 16 h is shown in Fig. 7, which is also ob-served to be similar to that of the solution-treated orpeak-aged alloy. Further, no discontinuous precipita-tion has been noticed in the overaged alloy. Opticalmicrographs of the alloy with different amounts ofcold work are shown in Fig. 8. Deformation of grainshas started in the alloy cold-worked by 25% (Fig. 8a)and fully elongated grains are seen in the 90% workedsample in Fig. 8d. The grain size in Fig. 8a—d iscoarse, because these samples were solution treated at900 °C. However, the optical micrograph in Fig. 7shows a fine grain size which corresponds to the solu-tion treatment at 750 °C. The solution-treatment tem-peratures resulting in the finest grain size possible inCu—Ti alloys, have been established with extensivestudies on grain-size strengthening by the presentauthors [25—28]. Ageing of the cold-worked alloyat 400 °C did not have any significant effect on the
optical microstructure.3378
Figure 9 Transmission electron micrograph of Cu—1.5 wt% Tialloy in the solution-treated condition.
A transmission electron micrograph of the solution-treated alloy is shown in Fig. 9. Grain boundarieswith a triple junction and dislocations within the grainare seen here. Further, the microstructure does notreveal any modulations or precipitates. Fig. 10 showsthe microstructure of the alloy peak aged at 400 °C for96 h. The bright-field (BF) image shows an annealingtwin and fine precipitates (Fig. 10a) of b@ phase(Cu Ti) with a body-centred tetragonal (b c t)
4crystal structure (a"0.584 nm and c"0.362 nm), as
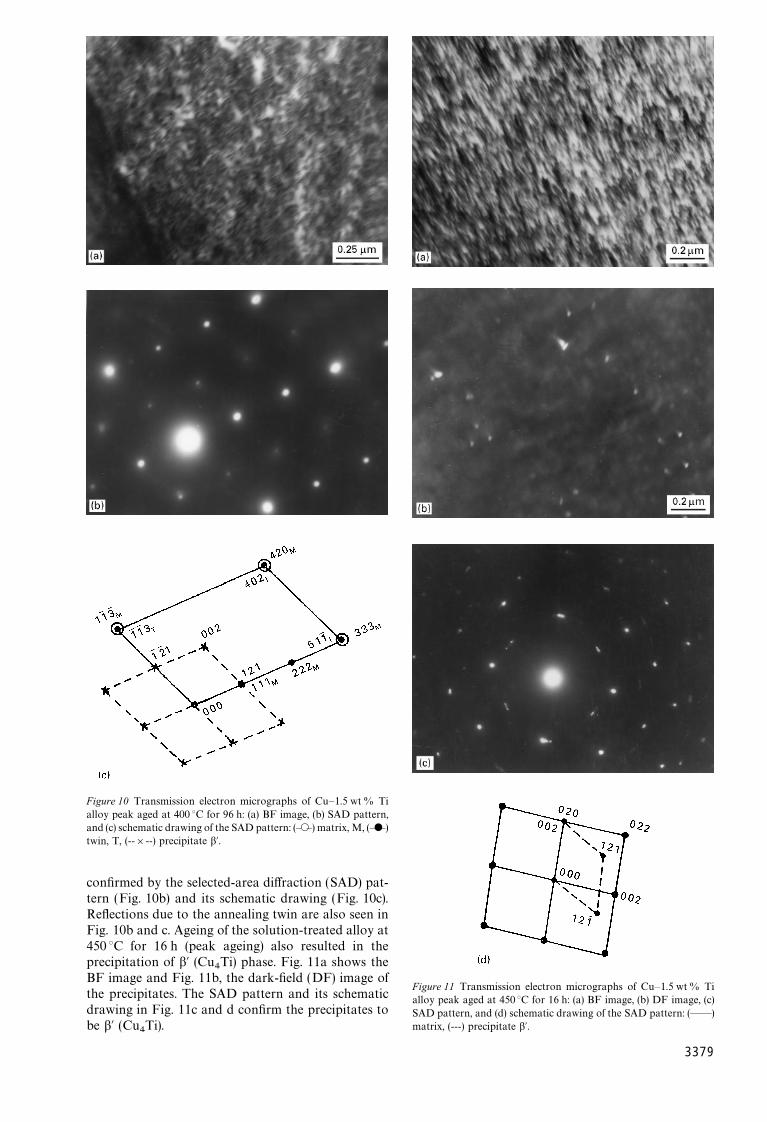
Figure 10 Transmission electron micrographs of Cu—1.5 wt% Tialloy peak aged at 400 °C for 96 h: (a) BF image, (b) SAD pattern,and (c) schematic drawing of the SAD pattern: (—s—) matrix, M, (—d—)twin, T, (--]--) precipitate b@.
confirmed by the selected-area diffraction (SAD) pat-tern (Fig. 10b) and its schematic drawing (Fig. 10c).Reflections due to the annealing twin are also seen inFig. 10b and c. Ageing of the solution-treated alloy at450 °C for 16 h (peak ageing) also resulted in theprecipitation of b@ (Cu
4Ti) phase. Fig. 11a shows the
BF image and Fig. 11b, the dark-field (DF) image ofthe precipitates. The SAD pattern and its schematicdrawing in Fig. 11c and d confirm the precipitates to
be b@ (Cu4Ti).
Figure 11 Transmission electron micrographs of Cu—1.5 wt% Tialloy peak aged at 450 °C for 16 h: (a) BF image, (b) DF image, (c)SAD pattern, and (d) schematic drawing of the SAD pattern: (——)
matrix, (---) precipitate b@.3379
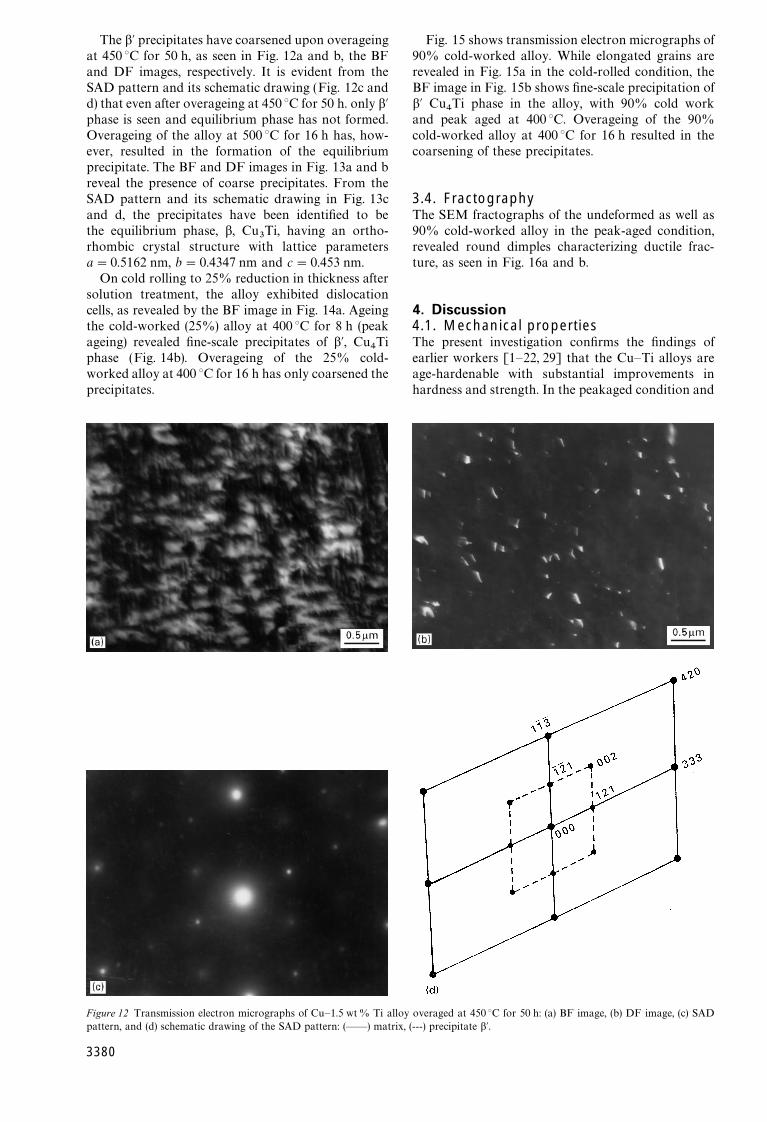
The b@ precipitates have coarsened upon overageingat 450 °C for 50 h, as seen in Fig. 12a and b, the BFand DF images, respectively. It is evident from theSAD pattern and its schematic drawing (Fig. 12c andd) that even after overageing at 450 °C for 50 h. only b@phase is seen and equilibrium phase has not formed.Overageing of the alloy at 500 °C for 16 h has, how-ever, resulted in the formation of the equilibriumprecipitate. The BF and DF images in Fig. 13a and breveal the presence of coarse precipitates. From theSAD pattern and its schematic drawing in Fig. 13cand d, the precipitates have been identified to bethe equilibrium phase, b, Cu
3Ti, having an ortho-
rhombic crystal structure with lattice parametersa"0.5162 nm, b"0.4347 nm and c"0.453 nm.
On cold rolling to 25% reduction in thickness aftersolution treatment, the alloy exhibited dislocationcells, as revealed by the BF image in Fig. 14a. Ageingthe cold-worked (25%) alloy at 400 °C for 8 h (peakageing) revealed fine-scale precipitates of b@, Cu
4Ti
phase (Fig. 14b). Overageing of the 25% cold-worked alloy at 400 °C for 16 h has only coarsened the
pattern, and (d) schematic drawing of the SAD pattern: (——) matrix,
precipitates.
3380
Fig. 15 shows transmission electron micrographs of90% cold-worked alloy. While elongated grains arerevealed in Fig. 15a in the cold-rolled condition, theBF image in Fig. 15b shows fine-scale precipitation ofb@ Cu
4Ti phase in the alloy, with 90% cold work
and peak aged at 400 °C. Overageing of the 90%cold-worked alloy at 400 °C for 16 h resulted in thecoarsening of these precipitates.
3.4. FractographyThe SEM fractographs of the undeformed as well as90% cold-worked alloy in the peak-aged condition,revealed round dimples characterizing ductile frac-ture, as seen in Fig. 16a and b.
4. Discussion4.1. Mechanical propertiesThe present investigation confirms the findings ofearlier workers [1—22, 29] that the Cu—Ti alloys areage-hardenable with substantial improvements in
hardness and strength. In the peakaged condition andFigure 12 Transmission electron micrographs of Cu—1.5 wt% Ti alloy overaged at 450 °C for 50 h: (a) BF image, (b) DF image, (c) SAD
(---) precipitate b@.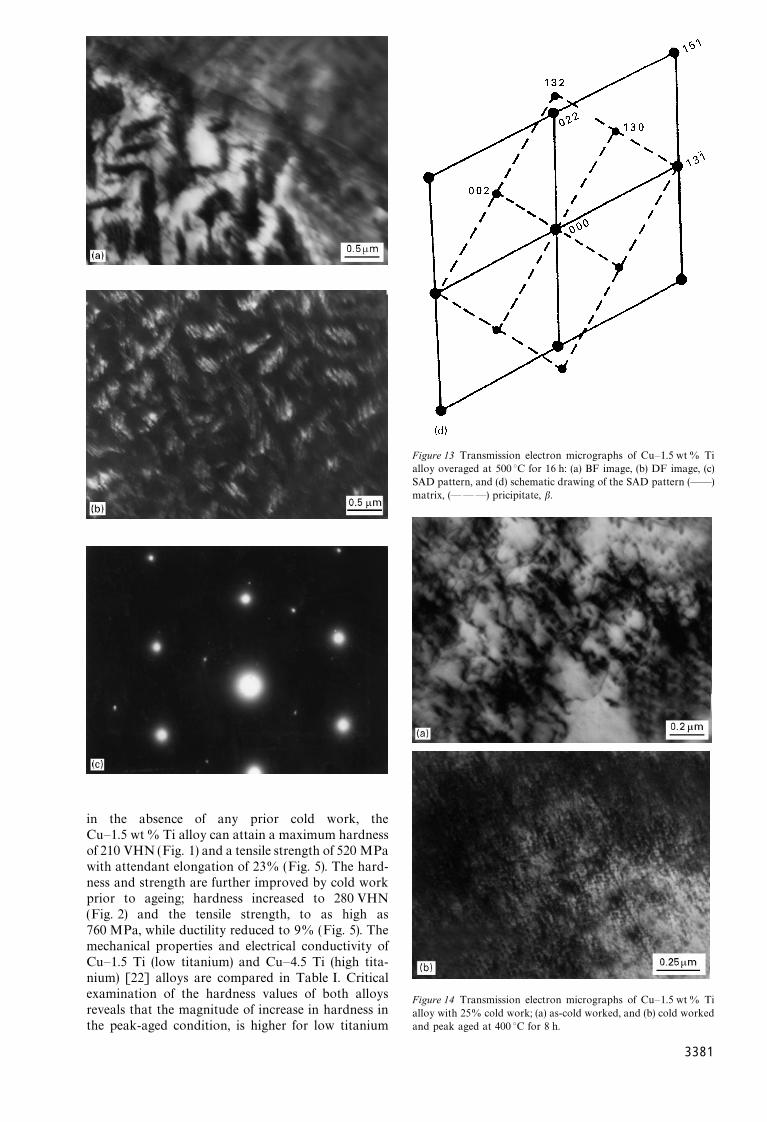
Figure 13 Transmission electron micrographs of Cu—1.5 wt% Tialloy overaged at 500 °C for 16 h: (a) BF image, (b) DF image, (c)SAD pattern, and (d) schematic drawing of the SAD pattern (——)matrix, (—— —) pricipitate, b.
in the absence of any prior cold work, theCu—1.5 wt% Ti alloy can attain a maximum hardnessof 210 VHN (Fig. 1) and a tensile strength of 520 MPawith attendant elongation of 23% (Fig. 5). The hard-ness and strength are further improved by cold workprior to ageing; hardness increased to 280 VHN(Fig. 2) and the tensile strength, to as high as760 MPa, while ductility reduced to 9% (Fig. 5). Themechanical properties and electrical conductivity ofCu—1.5 Ti (low titanium) and Cu—4.5 Ti (high tita-nium) [22] alloys are compared in Table I. Criticalexamination of the hardness values of both alloysreveals that the magnitude of increase in hardness in
the peak-aged condition, is higher for low titaniumFigure 14 Transmission electron micrographs of Cu—1.5 wt% Tialloy with 25% cold work; (a) as-cold worked, and (b) cold worked
and peak aged at 400 °C for 8 h.3381
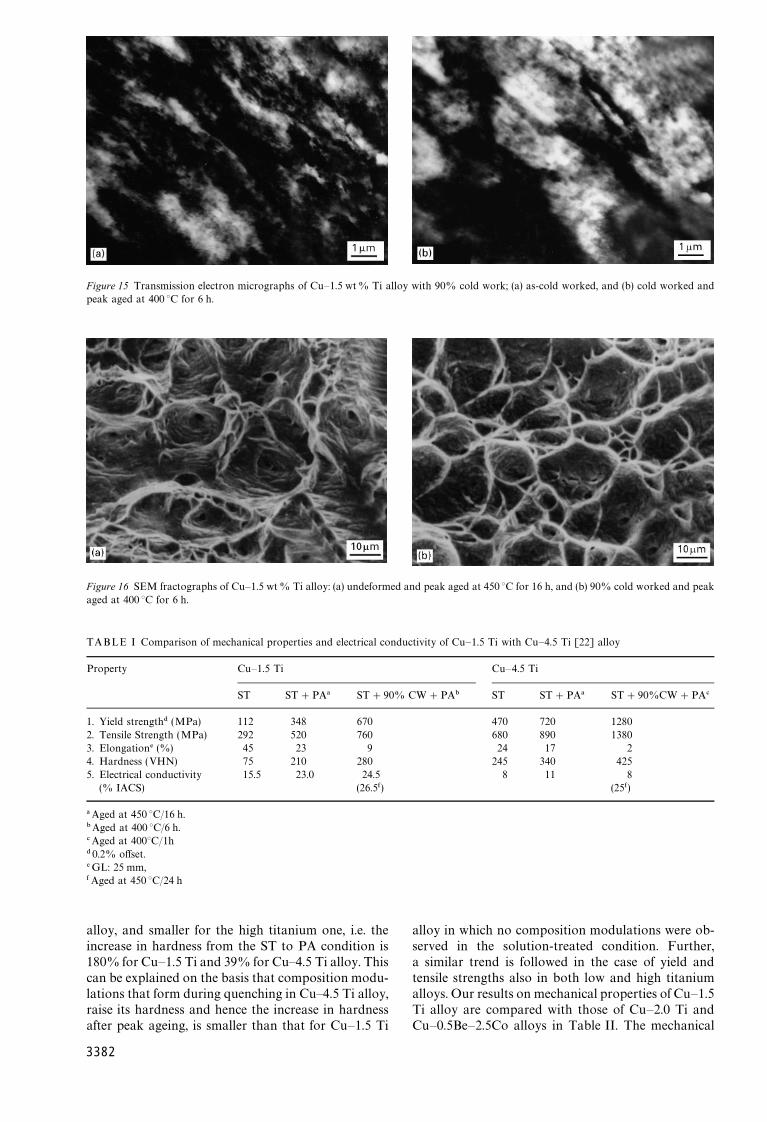
Figure 15 Transmission electron micrographs of Cu—1.5 wt% Ti alloy with 90% cold work; (a) as-cold worked, and (b) cold worked andpeak aged at 400 °C for 6 h.
Figure 16 SEM fractographs of Cu—1.5 wt% Ti alloy: (a) undeformed and peak aged at 450 °C for 16 h, and (b) 90% cold worked and peakaged at 400 °C for 6 h.
TABLE I Comparison of mechanical properties and electrical conductivity of Cu—1.5 Ti with Cu—4.5 Ti [22] alloy
Property Cu—1.5 Ti Cu—4.5 Ti
ST ST#PA! ST#90% CW#PA" ST ST#PA! ST#90%CW#PA#
1. Yield strength$ (MPa) 112 348 670 470 720 12802. Tensile Strength (MPa) 292 520 760 680 890 13803. Elongation% (%) 45 23 9 24 17 24. Hardness (VHN) 75 210 280 245 340 4255. Electrical conductivity 15.5 23.0 24.5 8 11 8
(% IACS) (26.5&) (25&)
!Aged at 450 °C/16 h."Aged at 400 °C/6 h.#Aged at 400°C/1h$ 0.2% offset.
%GL: 25 mm,&Aged at 450 °C/24 halloy, and smaller for the high titanium one, i.e. theincrease in hardness from the ST to PA condition is180% for Cu—1.5 Ti and 39% for Cu—4.5 Ti alloy. Thiscan be explained on the basis that composition modu-lations that form during quenching in Cu—4.5 Ti alloy,raise its hardness and hence the increase in hardness
after peak ageing, is smaller than that for Cu—1.5 Ti3382
alloy in which no composition modulations were ob-served in the solution-treated condition. Further,a similar trend is followed in the case of yield andtensile strengths also in both low and high titaniumalloys. Our results on mechanical properties of Cu—1.5Ti alloy are compared with those of Cu—2.0 Ti and
Cu—0.5Be—2.5Co alloys in Table II. The mechanical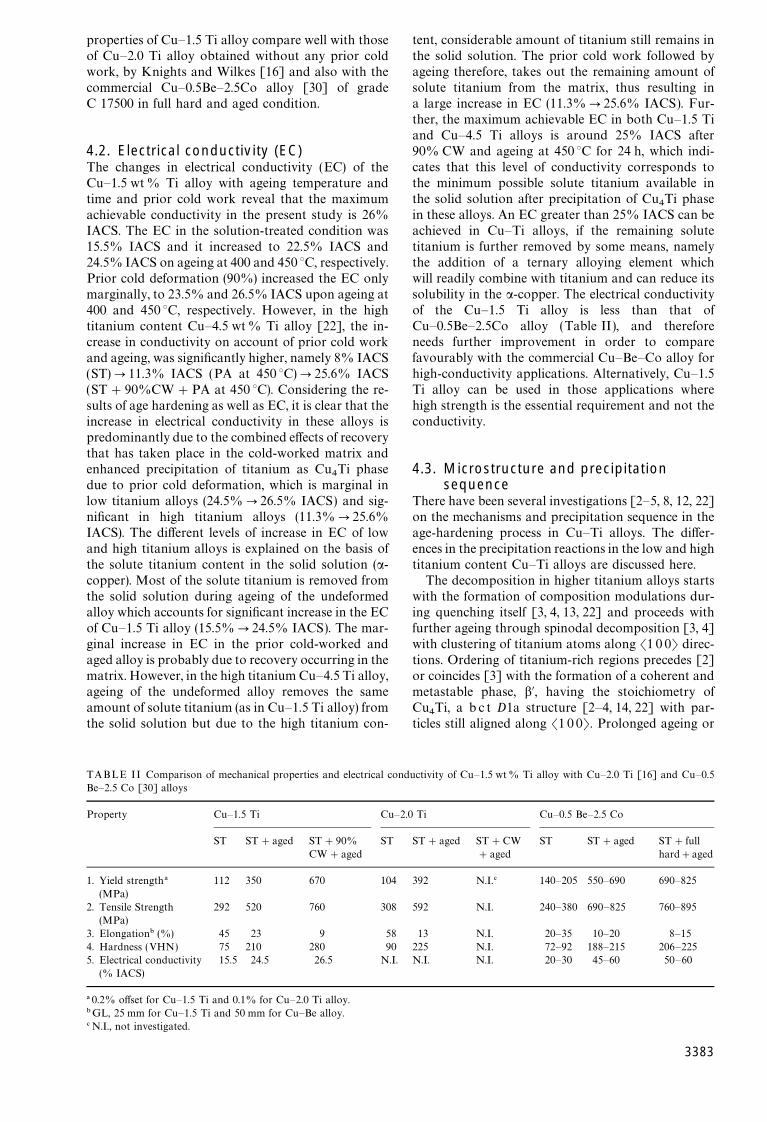
properties of Cu—1.5 Ti alloy compare well with thoseof Cu—2.0 Ti alloy obtained without any prior coldwork, by Knights and Wilkes [16] and also with thecommercial Cu—0.5Be—2.5Co alloy [30] of gradeC 17500 in full hard and aged condition.
4.2. Electrical conductivity (EC)The changes in electrical conductivity (EC) of theCu—1.5 wt% Ti alloy with ageing temperature andtime and prior cold work reveal that the maximumachievable conductivity in the present study is 26%IACS. The EC in the solution-treated condition was15.5% IACS and it increased to 22.5% IACS and24.5% IACS on ageing at 400 and 450 °C, respectively.Prior cold deformation (90%) increased the EC onlymarginally, to 23.5% and 26.5% IACS upon ageing at400 and 450 °C, respectively. However, in the hightitanium content Cu—4.5 wt% Ti alloy [22], the in-crease in conductivity on account of prior cold workand ageing, was significantly higher, namely 8% IACS(ST)P11.3% IACS (PA at 450 °C)P25.6% IACS(ST#90%CW#PA at 450 °C). Considering the re-sults of age hardening as well as EC, it is clear that theincrease in electrical conductivity in these alloys ispredominantly due to the combined effects of recoverythat has taken place in the cold-worked matrix andenhanced precipitation of titanium as Cu
4Ti phase
due to prior cold deformation, which is marginal inlow titanium alloys (24.5%P26.5% IACS) and sig-nificant in high titanium alloys (11.3%P25.6%IACS). The different levels of increase in EC of lowand high titanium alloys is explained on the basis ofthe solute titanium content in the solid solution (a-copper). Most of the solute titanium is removed fromthe solid solution during ageing of the undeformedalloy which accounts for significant increase in the ECof Cu—1.5 Ti alloy (15.5%P24.5% IACS). The mar-ginal increase in EC in the prior cold-worked andaged alloy is probably due to recovery occurring in thematrix. However, in the high titanium Cu—4.5 Ti alloy,ageing of the undeformed alloy removes the sameamount of solute titanium (as in Cu—1.5 Ti alloy) from
#N.I., not investigated.
the solid solution but due to the high titanium con-
tent, considerable amount of titanium still remains inthe solid solution. The prior cold work followed byageing therefore, takes out the remaining amount ofsolute titanium from the matrix, thus resulting ina large increase in EC (11.3%P25.6% IACS). Fur-ther, the maximum achievable EC in both Cu—1.5 Tiand Cu—4.5 Ti alloys is around 25% IACS after90% CW and ageing at 450 °C for 24 h, which indi-cates that this level of conductivity corresponds tothe minimum possible solute titanium available inthe solid solution after precipitation of Cu
4Ti phase
in these alloys. An EC greater than 25% IACS can beachieved in Cu—Ti alloys, if the remaining solutetitanium is further removed by some means, namelythe addition of a ternary alloying element whichwill readily combine with titanium and can reduce itssolubility in the a-copper. The electrical conductivityof the Cu—1.5 Ti alloy is less than that ofCu—0.5Be—2.5Co alloy (Table II), and thereforeneeds further improvement in order to comparefavourably with the commercial Cu—Be—Co alloy forhigh-conductivity applications. Alternatively, Cu—1.5Ti alloy can be used in those applications wherehigh strength is the essential requirement and not theconductivity.
4.3. Microstructure and precipitationsequence
There have been several investigations [2—5, 8, 12, 22]on the mechanisms and precipitation sequence in theage-hardening process in Cu—Ti alloys. The differ-ences in the precipitation reactions in the low and hightitanium content Cu—Ti alloys are discussed here.
The decomposition in higher titanium alloys startswith the formation of composition modulations dur-ing quenching itself [3, 4, 13, 22] and proceeds withfurther ageing through spinodal decomposition [3, 4]with clustering of titanium atoms along S1 0 0T direc-tions. Ordering of titanium-rich regions precedes [2]or coincides [3] with the formation of a coherent andmetastable phase, b@, having the stoichiometry ofCu Ti, a b c t D1a structure [2—4, 14, 22] with par-
4ticles still aligned along S1 0 0T. Prolonged ageing or
TABLE II Comparison of mechanical properties and electrical conductivity of Cu—1.5 wt% Ti alloy with Cu—2.0 Ti [16] and Cu—0.5Be—2.5 Co [30] alloys
Property Cu—1.5 Ti Cu—2.0 Ti Cu—0.5 Be—2.5 Co
ST ST#aged ST#90% ST ST#aged ST#CW ST ST#aged ST#fullCW#aged #aged hard#aged
1. Yield strength! 112 350 670 104 392 N.I.# 140—205 550—690 690—825(MPa)
2. Tensile Strength 292 520 760 308 592 N.I. 240—380 690—825 760—895(MPa)
3. Elongation" (%) 45 23 9 58 13 N.I. 20—35 10—20 8—154. Hardness (VHN) 75 210 280 90 225 N.I. 72—92 188—215 206—2255. Electrical conductivity 15.5 24.5 26.5 N.I. N.I. N.I. 20—30 45—60 50—60
(% IACS)
! 0.2% offset for Cu—1.5 Ti and 0.1% for Cu—2.0 Ti alloy."GL, 25 mm for Cu—1.5 Ti and 50 mm for Cu—Be alloy.
3383
P. Haasen, V. Gerold and G. Kostorz, Vol. 1 (Pergamon
ageing at high temperatures results in the formation ofthe equilibrium phase b, with stoichiometric composi-tion of Cu
3Ti [6, 7, 29] or Cu
4Ti [10] by discontinu-
ous or cellular reaction.In the present investigation on Cu—1.5 Ti alloy,
composition modulations have not been observed inthe solution-treated Cu—1.5 wt% Ti alloy, whichmeans that the decomposition in low titanium alloysis suppressed during quenching due to the limitedextent of supersaturation. This observation is in agree-ment with the reported behaviour for Cu—Ti alloys upto 2.7 wt% Ti [4, 13, 16, 17]. Decomposition inCu—1.5 Ti alloy starts only with ageing and maximumstrengthening is obtained when the alloy is aged at450 °C for 16 h (peak ageing). The b@ Cu
4Ti precipitate
is observed to occur predominantly in the peak-agedcondition. This observation is in agreement with thefindings by most of the investigators that b@ Cu
4Ti
precipitate with D1a b c t structure is responsible formaximum hardening [2—4, 12, 22] in Cu—Ti alloysbecause it is dominant at the peak-hardening time.The equilibrium phase b (Cu
3Ti) in Cu—1.5 wt% Ti
alloy starts forming as coarse precipitates at 500 °Caged for 16 h and has an orthorhombic structure[22, 29]. However, the equilibrium precipitate wasobserved at 450 °C itself (aged for 16 h) in theCu—4.5 wt% Ti alloy.
Several earlier workers [8, 14, 16] attributed over-ageing to the discontinuous precipitation leading toalternate (lamellar) distribution of a and b phases.However, such discontinuous precipitation has notbeen observed in Cu—1.5 wt% Ti alloy, even afteroverageing at 500 °C for 16 h (Fig. 7). It may be statedhere that Knights and Wilkes [16] reported the occur-rence of cellular reaction in a Cu—2.0 Ti alloy onlyafter ageing for 3 h at 600 °C. Thus, it is concludedthat the b@ phase is only responsible for peak harden-ing in Cu—1.5 wt% Ti alloy at 400 and 450 °C and theprecipitation of equilibrium phase b occurs at 500 °Ccausing considerable overageing, while the discontinu-ous precipitation may occur only at higher temper-atures ('550 °C).
In the prior cold-worked Cu—1.5 Ti alloy, disloca-tion cells are observed in the initial stages of deforma-tion (25% CW) and considerably elongated grains on90% cold work (Figs 14 and 15). Dislocation cellshave been reported to occur in low titanium alloyswith tensile deformation [26]. On ageing, the coldwork causes enhanced precipitation of metastable andcoherent b@ Cu
4Ti phase which is responsible for in-
crease in strength. In contrast to the formation ofdislocation cells in low titanium alloys, deformationtwinning was observed in Cu—4.5 wt% Ti alloy in thesolution-treated condition by the present authors[22, 26]. The twinning mode of deformation is ex-pected to be due to fine-scale precipitation present inthe high titanium alloys in the solution-treated condi-tion itself.
Regarding the fracture behaviour, the alloy de-formed by shear mode of fracture (microvoid coales-cence) in the undeformed as well as prior cold-workedand aged alloy. The observation of nearly equiaxed
dimples even in the 90% cold-worked and peak-aged3384
condition, confirms the ductile mode of fracture in theCu—1.5 Ti alloy. The ductile mode of fracture was alsoreported in Cu—4.5 Ti alloy by the present authors[22].
5. Conclusions1. Considerable strengthening of the alloy occurs
on ageing at 400 and 450 °C. The hardness increasedfrom 80 VHN in the solution-treated state, to a peakvalue of 210 VHN on ageing, in the undeformed con-dition and 280 VHN, with 80% prior cold work andageing. The peak values of yield strength for the cor-responding conditions are 112, 350 and 680MPa,while those of UTS are 292, 520 and 760 MPa.
2. While no composition modulations were ob-served after quenching in the solution-treated condi-tion, the principal strengthening mechanism of agehardening is the precipitation of the metastable, or-dered and coherent b@ phase, having body-centred tet-ragonal (b c t) crystal structure at the peak-hardeningtime. The equilibrium phase b, with the orthorhombicstructure, forms during overageing at 500 °C for 16 h.
3. The electrical conductivity increased from 15.5%IACS in the solution-treated condition, to 26.5%IACS when slightly overaged at 450 °C for 24 h after95% prior cold deformation. The increase in EC in theaged alloy with prior cold work is marginal in Cu—1.5Ti alloy, whereas it is significant in high titanium alloy(Cu—4.5 wt% Ti [22]). However, the maximumachievable EC in both low and high titanium alloys isaround 25% IACS.
4. The properties and microstructural evolution inlow titanium alloys are contrasted with that in hightitanium alloys in terms of the absence of (i) the devel-opment of modulations during quenching itself, and(ii) deformation twins after solution treatment andcold work.
5. Neither ageing treatment nor prior cold workchanged the mode of fracture, i.e. microvoid coales-cence in the alloy.
AcknowledgementsThe authors are grateful to the Director, DMRL, forpermission to publish this paper and the Head,Department of Metallurgical Engineering, BanarasHindu University, Varanasi, for providing TEMfacilities. One of the authors (S.N.) thanks Dr A.Venugopala Reddy, Scientist DMRL, for assistance inthe experimental work and helpful discussions.
References1. M. J . SAARIVIRTA and H. S. CANNON, Met. Prog. 76
(1959) 81.2. T. HAKKARAINEN, PhD thesis, Helsinki Technical
University, (1971).3. D. E. LAUGHLIN and J. W. CAHN, Acta Metall. Mater. 23
(1975) 329.4. A. DATTA and W. A. SOFFA, ibid. 24 (1976) 987.5. R. WAGNER, in ‘‘Proceedings of the 5th International Con-
ference on Strength of Metals and Alloys’’, edited by
Press, Oxford, 1979) p. 645.
6. U. HEUBNER and G. WASSERMANN, Z. Metallkde 53 (H3)(1962) 152.
7. H. T. MICHELS, I. B. CADOFF and E. LEVINE, Metall.¹rans. A 3 (1972) 667.
8. J . A. CORNIE, A. DATTA and W. A. SOFFA, ibid. 4 (1973)727.
9. J . GREGGI and W. A. SOFFA, in ‘‘Proceedings of the 5thInternational Conference on Strength of Metals and Alloys’’,edited by P. Haasen, V. Gerold and G. Kostorz, Vol. 1 (Per-gamon Press, Oxford, 1979) p. 651.
10. R. C. ECOB, J . V. BEE and B. RALPH, Phys. Status Solidi (a)52 (1979) 201.
11. P. KRATOCHVIL, M. SAXLOVA and J. PESICKA, in‘‘Proceedings of 5th International Conference on Strength ofMetals and Alloys’’, edited by P. Haasen V. Gerold andG. Kostorz, Vol. 1, (Pergamon Press, Oxford, 1979) p. 687.
12. W. A. SOFFA and D. E. LAUGHLIN, in ‘‘Proceedings of theInternational Conference on SolidPSolid Phase Transforma-tions’’, edited by H. I. Aaronson (The Metallurgical Society ofAIME, Warrendale, PA, 1982) p. 159.
13. K. -E. BIEHL and R. WAGNER, ibid, p. 185.14. A. W. THOMPSON and J. C. WILLIAMS, Metall. ¹rans.
15A (1984) 931.15. R. KAMPMANN and R WAGNER, in ‘‘Proceedings of the
Conference on Decomposition of Alloys: The Early Stages’’,edited by P. Haasen, V. Gerold, R. Wagner and M. F. Ashby(Pergamon Press, Oxford, 1984) p. 91.
16. R. KNIGHTS and P. WILKES, Acta Metall. Mater. 21 (1973)1503.
17. L. V. ALVENSLEBEN and R. WAGNER, in ‘‘Proceedings ofConference on Decomposition of Alloys: The Early Stages’’,edited by P. Haasen, V. Gerold, R. Wagner and M. F. Ashby(Pergamon Press, Oxford, 1984) p. 143.
18. U. ZWICKER, Z. Metallkde 53 (1962) 709.19. J . DUTKIEWICZ, Metall. ¹rans. 8A (1977) 751.
20. S. SAJI and E. HORNBOGEN, Z. Metallkde 69 (1978) 741.21. N. J. GRANT, A. LEE and M. LOU, in ‘‘Proceedings ofSymposium on High Conductivity Copper and AluminiumAlloys’’, edited by E. Ling and P.W. Taubenblat (The Metal-lurgical Society of AIME, Warrendale, PA, 1984) p. 103.
22. S. NAGARJUNA, K. BALASUBRAMANIAN and D. S.
SARMA, Mater. ¹rans. JIM 36 (1995) 1058.23. ‘‘Standard Test Methods for Tension Testing of Metallic Ma-
terials’’, ASTM: E 8M-89b Vol. 03.01, edited by P. C. Fazio,M. Gorman, E. L. Gutman, C. T. Hsia, G. Jones, J. Kramer,C. M. Leinweber, P. A. McGee, S. P. Milligan andK. W. O’Brien (Annual Book of ASTM Standards, Philadel-phia, PA, 1990), p. 146.
24. ‘‘Standard Test Method for resistivity of Electrical ConductorMaterials’’, ASTM: B 193—89, Vol. 02.01, edited by P. C.Fazio, M. Gorman, E. L. Gutman, C. T. Hsia, G. Jones, J.Kramer, C. M. Leinweber, P. A. McGee, S. P. Milligan andK. W. O’Brien (Annual Book of ASTM Standards, Philadel-phia, PA, 1990), p. 330.
25. S. NAGARJUNA, M. SRINIVAS, K. BALASUB-
RAMANIAN and D. S. SARMA, Scripta Metall. Mater. 30(1994) 1593.
26. Idem, ibid. 33 (1995) 1455.27. Idem, Acta Mater. 44 (1996) 2285.28. S. NAGARJUNA, K. BALASUBRAMANIAN and D. S.
SARMA, Scripta Mater. (1996) 35 (1996) 147.29. N. KARLSSON, J. Inst. Metals 79 (1951) 391.30. ‘‘Properties and Selection: Non-Ferrous Alloys and
Special Purpose Materials, Metals Hand Book’’ 10th edn,Vol. 2, L. A. Abel, R. T. Kiepura, P. Thomas, H. F. Lampmanand N. D. Wheaton (ASM International, Ohio, USA, 1990)p. 228.
Received 11 July 1996
and accepted 7 January 19973385