Embed Size (px)
Citation preview

Food Chemistry 114 (2009) 939–946
Contents lists available at ScienceDirect
Food Chemistry
journal homepage: www.elsevier .com/locate / foodchem
Effect of the feeding system on intramuscular fatty acidsand conjugated linoleic acid isomers of beef cattle, withemphasis on their nutritional value and discriminatory ability
Cristina P.M. Alfaia a, Susana P. Alves b, Susana I.V. Martins a, Ana S.H. Costa a,Carlos M.G.A. Fontes a, José P.C. Lemos a, Rui J.B. Bessa b, José A.M. Prates a,*
a CIISA, Faculdade de Medicina Veterinária, Avenida da Universidade Técnica, Pólo Universitário do Alto da Ajuda, 1300-477 Lisboa, Portugalb REQUIMTE, Unidade de Produção Animal, L-INIA, Instituto Nacional dos Recursos Biológicos, Fonte Boa, 2005-048 Vale de Santarém, Portugal
a r t i c l e i n f o
Article history:Received 26 July 2008Received in revised form 3 September 2008Accepted 21 October 2008
Keywords:Meat qualityFeeding systemFinishing periodFatty acidsCLA isomers
0308-8146/$ - see front matter � 2008 Elsevier Ltd. Adoi:10.1016/j.foodchem.2008.10.041
Abbreviations: ALA, a-linolenic acid; CLA, conjugaacid methyl esters; MUFA, monounsaturated fatty action of origin; PUFA, polyunsaturated fatty acids; SFtrans fatty acids.
* Corresponding author. Tel.: +351 213652890; faxE-mail address: [email protected] (J.A.M. Prates)
a b s t r a c t
Thirty two Alentejano purebred bulls were used to investigate the effect of four feeding systems (pastureonly, pasture feeding followed by 2 or 4 months of finishing on concentrate, and concentrate only) onmeat fatty acid composition (GC-FID), including conjugated linoleic acid (CLA) isomeric distribution(Ag[+]–HPLC–DAD). In addition, meat fatty acids and CLA isomers were used to elucidate the impact ofthe different feeding regimens on the nutritional value of intramuscular fat and their usefulness as chem-ical discriminators of meat origin. The diet had a major impact on the fatty acid composition of beef(affected 27 of 36 fatty acids and 10 of 14 CLA isomers), which was independent of the fatty acid concen-tration. Beef fat from pasture-fed animals had a higher nutritional quality relative to that from concen-trate-fed bulls. Finally, meat fatty acid composition was an effective parameter to discriminate betweenruminant feeding systems, including different finishing periods on concentrate.
� 2008 Elsevier Ltd. All rights reserved.
1. Introduction
Scientific evidence and nutritional guidelines recommend areduction in total fat intake, particularly of saturated fatty acids(SFA) (World Health Organization, 2003), which are associatedwith an increased risk of obesity, hypercholesterolemia and somecancers (Wood et al., 2004). Nutritionist advisers recommend ahigher intake of polyunsaturated fatty acids (PUFA), especiallyn�3 PUFA at the expense of n�6 PUFA (British Department ofHealth, 1994). Recently, the results of Griffin (2008) reinforcedthe current recommendations of increasing a-linolenic acid (ALA;18:3n�3) intake and decreasing linoleic acid (18:2n�6) intake, inorder to promote the endogenous synthesis of long chain (>C18)n�3 fatty acids. It is well known that the low PUFA/SFA and highn�6/n�3 ratios of some meats contribute to the imbalance in thefatty acid intake of todays consumers (Wood et al., 2004).
Besides the beneficial effects of n�3 fatty acids on humanhealth, conjugated linoleic acid (CLA) isomers have also attracted
ll rights reserved.
ted linoleic acid; FAME, fattyids; PDO, protected designa-A, saturated fatty acids; TFA,
: +351 213652895..
increased attention as a result of their health promoting biologicalproperties (Aldai, Osoro, Barron, & Najera, 2006; Prates & Mateus,2002). In fact, some CLA isomers, at least the cis9, trans11(c9,t11) and t10, c12, exhibit interesting biological activities thatinclude anticarcinogenic, anti-obesity, antidiabetogenic, anti-ath-erogenic qualities, immunomodulation and modulation of bonegrowth (Park & Pariza, 2007). Ruminant fats are the richest naturaldietary source of c9,t11, which is the major CLA isomer, commonlyknown as rumenic acid (Kramer et al., 1998). This isomer is mostlyproduced in tissues by delta9 desaturation of vaccenic acid(18:1t11) and by ruminal biohydrogenation of dietary PUFA(Griinari & Bauman, 1999; Nuernberg et al., 2005; Palmquist, St-Pierre, & McClure, 2004). Twenty four different CLA isomers havebeen reported as occurring naturally in food, especially from rumi-nant origin, including milk, dairy products and meat (Sehat et al.,1998).
As a result of the fatty acid imbalance in human diets, dietarystrategies have been used to improve the nutritional and health va-lue of the intramuscular fat of cattle. Thus, manipulation of thefatty acid composition in ruminant meat to reduce SFA contentand the n�6/n�3 ratio whilst, simultaneously increasing the PUFAand CLA contents, is of major importance in meat research. It hasbeen shown that in ruminants grazing have potential beneficial ef-fects on PUFA/SFA and n�6/n�3 ratios, increasing the PUFA andCLA contents and decreasing the SFA concentration of beef (Enser

940 C.P.M. Alfaia et al. / Food Chemistry 114 (2009) 939–946
et al., 1998; French et al., 2000). Although several factors influencethe fatty acid composition and the CLA content of beef (e.g. sea-sonal variation, animal genetics and production practices), dietplays the most important role (Schmid, Collomb, Sieber, & Bee,2006). Dietary factors are often linked with particular productionsystems (Geay, Bauchart, Hocquette, & Culioli, 2001).
Meat production systems are particularly important for thoselegally protected in the European Union, which assume a designa-tion of origin (PDO) or a geographical indication (PGI). The addedvalue allowed by legal protection of PDO and PGI products mayintroduce a strong pressure to the intensification of productionsystems. In previous reports we described the lipid compositionand nutritional value of some Portuguese PDO meats, includingCarnalentejana-PDO beef (Alfaia et al., 2006a) and Mertolenga-PDO beef (Alfaia et al., 2006b). Although these animals areproduced under traditional production systems, the productspecifications include a finishing period on concentrate feed from3 to 6 months. The discrimination between meat from ruminantsfinished on concentrate or pasture has been easily achieved withseveral chemical and physical markers (Bessa et al., 2006), whereasthe differences in fatty acid composition are well known (Frenchet al., 2000). However, a clear discrimination between animalsgrowing on pasture and finished on confinement, for variable timeperiods, is much more difficult (Bessa et al., 2006). Therefore, thedevelopment of methodologies for the estimation of the time onconcentrate feed, its effect on meat fatty acid composition andnutritional value is of outmost importance.
The goal of this work was to provide information concerning themeat fatty acid composition and distribution of CLA isomers of cat-tle allocated to concentrate only, pasture only and pasture feedingfollowed by 2 or 4 months of finishing on concentrate. In addition,the influence of these four feeding systems on the nutritional valueof the intramuscular fat content was assessed. Finally, the useful-ness of meat fatty acids and CLA isomers as chemical markers forthe discrimination of the finishing period of animal fed on concen-trate was also evaluated.
Table 1Ingredient (% feed), proximate (mg/g dry matter) and fatty acid (% of sum of fattyacids) compositions of the concentrate feed used in this experiment.
IngredientsBarley 40Corn 10Corn gluten 22Sunflower meal 18Soybean meal 5Minerals and premix 5
Proximate compositionCrude protein 128Total fat 30Crude fibre 65Ashes 90Nitrogen-free extract 687
Fatty acid composition14:0 3.416:0 14.518:0 2.818:1c9 19.618:2n�6 40.818:3n�3 2.6
2. Materials and methods
2.1. Reagents
Fatty acid methyl ester (FAME) standard mixtures were ac-quired from Nu-Chek-Prep Inc. (Elysian, MN, USA) and SupelcoInc. (Bellefonte, PA, USA). Commercial standards of individualCLA isomers (c9,t11, t10,c12, c9,c11 and t9,t11) as methyl esterswere purchased from Matreya Inc. (Pleasant Gap, PA, USA).Additional standards of individual (t8,c10, c11,t13) and mixtures(cis,trans, trans,cis and trans,trans from 7,9 to 12,14) of CLA isomerswere prepared as methyl esters according to the proceduredescribed by Destaillats and Angers (2003).
Analytical grade and liquid chromatographic grade chemicalswere purchased from Merck Biosciences (Darmstadt, Germany).Sodium methoxide (0.5 M solution in anhydrous methanol) wasobtained from Sigma–Aldrich Ltd. (St. Louis, MO, USA).
2.2. Animals and management
The experiment was conducted at Estação Zootécnica Nacional(EZN) facilities (Vale de Santarém, Portugal). Thirty two youngbulls from a Alentejano purebred EZN herd, born between Marchand July of 2003, were used. The herd was maintained in extensiveconditions in alluvium land near the Tagus river (39�070N;8�430W), grazing on spontaneous pastures, summer triticalis andmaize stubbles. After weaning, in February 2004, with live bodyweights ranging between 200 and 300 kg, 8 young bulls were
transferred to a feedlot (CCC) and fed at 2.75% live body weight,on a diet consisting of 70% concentrate feed and 30% molasses-fi-brous cubes. The ingredient and chemical compositions of the con-centrate feed are presented in Table 1. The animals wereslaughtered with approximately 600 kg of live body weight (Sep-tember and October 2004). One of the animals failed to grow atnormal rates and was removed from the experiment and anotheranimal died. The other young bulls were maintained for 15 monthson pasture lands, until June 2005, when 8 bulls were slaughtered(PPP), and 15 animals were transferred to feedlot facilities andfed the fattening diet described above. Eight bulls were slaugh-tered after 2 months in feedlot (PPC) and the last 7 animals wereslaughtered after 4 months in the feedlot (PCC).
Animals were slaughtered at an EZN experimental abattoir byexsanguination after stunning with a cartridge-fired captive boltstunner. Carcasses were suspended by the Achilles tendon andchilled at 10 �C for 24 h followed by refrigeration at 2 �C for 5 days.Longissimus lumborum muscle samples (ca. 200 g) were collected,trimmed of connective and adipose tissues before being blendedin a food processor, vacuum packed and finally stored at �70 �Cuntil lipid extraction and assessment of fatty acid compositionand CLA isomeric profile were performed.
2.3. Lipid extraction and methylation
Meat samples were lyophilised (�60 �C and 2.0 hPa) to constantweight, using a lyophilisator (Edwards High Vacuum International,UK), kept dry at room temperature, and analysed within twoweeks. For total lipid determination, intramuscular fat was ex-tracted from the lyophilised meat samples (ca. 250 mg), usingthe procedure described previously by Fritsche et al. (2000). Totallipids were measured gravimetrically, in duplicate, by weightingthe fatty residue obtained after solvent evaporation.
For both FAME and CLA methyl ester profile analysis, fatty acidsand CLA isomers were directly converted to methyl esters by a one-step extraction transterification procedure (Christie, Sébédio, &Juanéda, 2001), using base catalysis for lyophilised meat (ca.250 mg) and acid catalysis for concentrate feed (ca. 500 mg). Thebase-catalysed methylation, used for meat in order to avoid isom-erisation of CLA isomers, was performed with sodium methoxide(0.5 M solution in anhydrous methanol), while the acid-catalysedmethylation used sulphuric acid (0.04 M in anhydrous methanol),for 2 h at 30 �C, as proposed by Kramer, Blackadar, and Zhou

Table 2Effect of the four feeding systems on intramuscular fat (mg/g muscle) and fatty acidcomposition (g/100 g total fatty acids) of Longissimus lumborum muscle fromAlentejano purebred bulls. The feeding regimens were as follows: feedlot (CCC),pasture with finishing on concentrate during 4 (PCC) and 2 (PPC) months, and pasturegrazing (PPP).
Treatments SEM PA
CCC PCC PPC PPP
Total lipids 13.03 12.37 11.45 9.76 1.004 ns
Fatty acids12:0 0.06ab 0.09c 0.07b 0.05a 0.006 ***
14:0 1.84b 2.54c 2.01b 1.24a 0.154 ***
14:1c9 0.26b 0.31b 0.24b 0.10a 0.027 ***
15:0 0.35 0.39 0.42 0.37 0.026 ns16:0 20.79b 23.37c 22.07bc 18.42a 0.584 ***
16:1c9 2.22bc 2.44c 1.83b 1.18a 0.166 ***
16:1t9 0.08a 0.08a 0.08a 0.14b 0.012 **
17:0 1.05 0.98 0.99 0.90 0.046 ns17:1c9 0.69c 0.57b 0.51ab 0.45a 0.033 ***
18:0 14.96a 15.56a 16.43ab 17.54b 0.591 *
18:1c9 28.64c 27.74bc 24.75b 20.49a 1.270 ***
18:1c11 2.19b 1.76a 1.78a 1.69a 0.077 ***
18:1c12 0.26 0.27 0.32 0.26 0.032 ns18:1c13 0.16b 0.18b 0.14b 0.09a 0.017 **
18:1c15 0.10a 0.13b 0.15b 0.14b 0.011 *
18:1t6 + t8 0.19b 0.16b 0.17b 0.12a 0.014 *
18:1t9 0.26b 0.26b 0.26b 0.15a 0.018 ***
18:1t10 1.21b 0.81b 0.98b 0.20a 0.152 ***
18:1t11 0.92 1.10 1.15 1.35 0.132 ns18:1t12 0.23 0.24 0.24 0.25 0.021 ns18:1t16 + c14 0.19a 0.23ab 0.29bc 0.35c 0.032 **
18:2n�6 11.95 10.07 11.38 12.55 1.180 ns18:2t 0.38 0.30 0.35 0.26 0.036 ns18:2t11,c15 0.06a 0.18ab 0.29bc 0.35c 0.045 ***
18:3n�3 0.48a 0.84a 1.96b 5.53c 0.289 ***
20:0 0.19b 0.18b 0.08a 0.25c 0.013 ***
20:1c11 0.12c 0.10b 0.02a 0.10b 0.004 ***
20:2n�6 0.13 0.11 0.12 0.15 0.011 ns20:3n�6 0.96 0.74 0.76 0.91 0.096 ns20:4n�6 3.80b 2.45a 2.67a 4.04b 0.395 *
20:5n�3 0.47a 0.77a 1.28b 2.13c 0.154 ***
22:2n�6 0.15b 0.12b 0.02a 0.24c 0.017 ***
22:4n�6 0.08b 0.05a 0.03a 0.09b 0.011 **
22:5n�3 0.91a 1.04ab 1.48b 2.56c 0.158 ***
22:6n�3 0.11a 0.12a 0.14a 0.20b 0.021 *
24:1c15 0.34b 0.18a 0.13a 0.20a 0.027 ***
A Statistical probability of treatment: ns, P > 0.05; *P < 0.05; **P < 0.01;***P < 0.001; means in the same row with different superscripts are significantlydifferent (P < 0.05); SEM, standard error of mean.
C.P.M. Alfaia et al. / Food Chemistry 114 (2009) 939–946 941
(2002). Nonadecanoic acid (19:0) methyl ester, used as an internalstandard, was added to the samples prior to fat extraction andmethylation. The same FAME solution was used for the analysisof both fatty acid composition and CLA profile, enabling the directcomparison of quantitative data and eliminating differences insample preparation.
2.4. Analysis of fatty acid methyl esters
Fatty acid composition was analysed by gas chromatography(HP6890A; Hewlett–Packard, Avondale, PA, USA) using a fused-sil-ica capillary column (CP-Sil 88; 100 m � 0.25 mm i.d., 0.2 lm filmthickness, Chrompack, Varian Inc., Walnut Creek, CA, USA),equipped with a flame-ionisation detector (GC-FID) as describedby Bessa et al. (2007). Briefly, the initial column temperatureof 100 �C was held for 15 min, increased to 150 �C at a rate of10 �C/min and held for 5 min, then increased to 158 �C at1 �C/min and held for 30 min, and finally increased to 200 �C at arate of 1 �C/min and maintained for 65 min. Helium was used ascarrier gas and the injector and detector temperatures were 250and 280 �C, respectively. Identification was accomplished by com-parison of sample peak retention times with those of FAME stan-dard mixtures and with values published in the literature(Kramer et al., 1998). The identification of some unknown peakswere conducted by gas chromatography–tandem mass spectrome-try (GC–MS/MS), using a Varian Saturn 2000 system (Varian Inc.,Walnut Creek, CA, USA) equipped with a CP-Sil 88 capillary column(100 m � 0.25 mm i.d., 0.2 lm film thickness). Fatty acids were ex-pressed as g/100 g of total fatty acid content, assuming a directrelationship between peak area and fatty acid methyl ester weight.
2.5. Analysis of individual CLA isomer methyl esters
The distribution of methyl esters of CLA isomers were deter-mined using an high performance liquid chromatography system(Agilent 1100 Series, Agilent Technologies Inc., Palo Alto, CA,USA), equipped with 100 ll injection loop and diode array detector(DAD) operated at 233 nm, according to the procedure describedpreviously by Alfaia et al. (2006a). The CLA isomers were individu-ally separated by triple silver-ion columns in series (ChromSpher 5Lipids, 250 mm � 4.6 mm i.d., 5 lm particle size, Chrompack,Bridgewater, NJ, USA). The mobile phase was 0.1% acetonitrile inn-hexane, at a flow rate of 1 ml/min and volumes of 20 ll were in-jected by the autosampler. Identification of the individual CLA iso-mers was achieved by comparison of their retention times withcommercial and prepared standards, as well as with values pub-lished in the literature (Fritsche et al., 2000). In addition, the iden-tity of each isomer was controlled by the typical ultraviolet spectraof CLA isomers from the diode array detector in the range from 190to 360 nm, using the spectral analysis of Agilent Chemstation forLC 3D Systems rev. A.09.01 (Agilent Technologies, 2001). The quan-tification of total and individual CLA isomer contents were deter-mined based on the external standard technique (using c9,t11,t10,c12, c9,c11 and t9,t11 as representatives of each of the geomet-ric groups of CLA isomers) and on the method of area normalisa-tion, from standard curves for peak area vs. CLA isomerconcentration (AOAC 963.22, 2000). The CLA isomers were ex-pressed as gravimetric contents (mg/g muscle and mg/g fat) or asa percentage of the sum of identified CLA isomers (% total CLA).
2.6. Statistical analysis
Fatty acid composition and CLA isomers data were subjected toanalysis of variance (ANOVA), considering the treatment of differ-ent feeding regimens as a single effect, using the GLM procedure ofStatistical Analysis Systems Institute (SAS, 2004). Least squares
means were presented and compared, using the LSD test, whenthe effect of feeding system was significant (P < 0.05).
Canonical discriminant analysis (CDA) was applied to fatty acidsand CLA isomers data in order to classify and predict the feedingsystem. Variable selection for CDA was achieved using: (1) the sig-nificant variables after ANOVA and (2) an interactive forward step-wise analysis (SAS, Proc STEPDISC) that select the variables with amajor discriminant capacity. The CDA and cross-validation wereconducted using Proc DISCRIM from SAS.
3. Results and discussion
3.1. Intramuscular fat and fatty acid composition
Level of intramuscular fat (mg/g muscle) and fatty acid compo-sition (expressed as % of total fatty acids) in L. lumborum muscle ofAlentejano purebred bulls fed on different diets are presented inTable 2. Meat from cattle finished on concentrate feed usuallyhas higher intramuscular fat than that from animals finished onpasture (Wood et al., 2008). Therefore, the former meat has higherproportions of triacylglycerols, relative to phospholipids and, as a

Table 3Effect of the four feeding systems on partial sums of fatty acids (g/100 g total fattyacids) and nutritional fatty acid ratios of Longissimus lumborum muscle fromAlentejano purebred bulls. The feeding regimens were as follows: feedlot (CCC),pasture with finishing on concentrate during 4 (PCC) and 2 (PPC) months, and pasturegrazing (PPP).
Treatments SEM PA
CCC PCC PPC PPP
Partial sumsP
SFA 39.27ac 43.11b 42.08ab 38.76c 1.048 *P
MUFA 34.99c 33.69bc 29.87b 24.69a 1.430 ***P
TFA 3.52 3.36 3.82 3.17 0.230 nsP
n�6 PUFA 17.08 13.54 14.99 17.97 1.654 nsP
n�3 PUFA 1.97a 2.77a 4.85b 10.41c 0.552 ***P
PUFA 19.06a 16.31a 19.84a 28.99b 2.014 **P
Unidentified 3.15a 3.54a 4.39b 4.99c 0.193 ***
RatiosPUFA/SFA 0.50a 0.38a 0.48a 0.74b 0.063 **n�6/n�3 8.99c 5.26b 3.16a 1.77a 0.573 ***P
SFA = sum of 12:0, 14:0, 15:0, 16:0, 17:0 18:0 and 20:0.P
MUFA = sum of 14:1c9, 16:1c9, 17:1c9, 18:1c9, 18:1c11, 18:1c12, 18:1c13,18:1c15, 20:1c11 and 24:1c15.P
TFA = sum of 16:1t9, 18:1t6 + t8, 18:1t9, 18:1t10, 18:1t11, 18:1t12, 18:1t16 + c14,18:2t11,c15 and 18:2t.P
n�6 PUFA = sum of 18:2n�6, 20:2n�6, 20:3n�6, 20:4n�6; 22:2n�6 and22:4n�6.P
n�3 PUFA = sum of 18:3n�3, 20:5n�3, 22:5n�3 and 22:6n�3.P
PUFA = sum of 18:2n�6, 18:3n�3, 20:2n�6, 20:3n�6, 20:4n�6, 22:2n�6,20:5n�3, 22:4n�6, 22:5n�3 and 22:6n�3.PUFA/SFA = polyunsaturated/saturated ratio [(sum of 18:2n�6, 18:3n�3, 20:2n�6,20:3n�6, 20:4n�6, 22:2n�6, 20:5n�3, 22:4n�6, 22:5n�3 and 22:6n�3)/(sum of12:0, 14:0, 15:0, 16:0, 17:0, 18:0 and 20:0)].n�6/n�3 = n�6/n�3 ratio [(sum of 18:2n�6, 20:2n�6, 20:3n�6, 20:4n�6; 22:2n�6and 22:4n�6)/(sum of 18:3n�3, 20:5n�3, 22:5n�3 and 22:6n�3)].
A Statistical probability of treatment: ns, P > 0.05; *P < 0.05; **P < 0.01;***P < 0.001; means in the same row with different superscripts are significantlydifferent (P < 0.05); SEM, standard error of mean.
942 C.P.M. Alfaia et al. / Food Chemistry 114 (2009) 939–946
result, lower percentages of PUFA and higher proportions of SFAand monounsaturated fatty acids (MUFA). In the present experi-ment, the content of intramuscular fat was not directly relatedwith the extent of the finishing period on concentrate. Thus, thechanges observed in fatty acid composition reflect mainly dietaryinfluences rather than intramuscular fatness effects. According tothe Food Advisory Committee (1990) criteria (<5% fat), beef pro-duced in this experiment can be classified as a lean meat.
The predominant fatty acids in intramuscular fat were palmitic(16:0, 18–23% of total FAME) and stearic (18:0, 15–18%) acids asSFA, oleic acid (18:1c9, 20–29%) as MUFA, and linoleic (10–13%)and arachidonic (20:4n�6, 2–4%) acids as PUFA. Similar resultswere reported previously for beef cattle (e.g. Alfaia et al., 2006a;Nuernberg et al., 2005; Realini, Duckett, Brito, Rizza, & De Mattos,2004). The feeding system had a major impact on the fatty acidprofile of beef since 27 of the 36 fatty acids analysed were affected(P < 0.05) by the production system. Saturated hypercholesterol-emic fatty acids (12:0, 14:0 and palmitic acid) and their monoun-saturated derivatives (14:1c9 and 16:1c9) were affected (P < 0.001)by the dietary treatment, showing the lowest values in animals fedwith pasture only (PPP group). In addition, meat from animals fedon concentrate diets had higher percentages of oleic acid thanmeat from grazing bulls (CCC > PPC > PPP). Concentrate diets areexpected to increase the absorption of oleic acid and linoleic acid,which are major fatty acids in cereal grains (Jenkins, 1994). How-ever, other factors might be involved in the increased meat oleicacid concentration associated with concentrate feeding. In fact, itwas recently reported that the high level of oleic acid observedin ruminant fed high grain diets might be explained by an increasein delta9 desaturase activity, probably mediated by a higher pro-duction of insulin (Daniel, Wynn, Salter, & Buttery, 2004; Sinclair,2007). In this study, no significant differences were observed forthe concentration of linoleic acid among all treatments. In contrast,meat from the PPP diet had the highest percentages of ALA (5.53%),followed by the PPC group (1.96%), while meat from CCC and PCCanimals presented the lowest proportions of this fatty acid (0.48–0.84%). It is well known that green pastures are a good source ofALA, in contrast to concentrate diets, which explains this inverserelationship between the finishing period on concentrate and thelevels of ALA (Wood & Enser, 1997). The percentages of long chainn�3 fatty acids, eicosapentaenoic (20:5n�3, EPA), docosapentae-noic (22:5n�3, DPA) and docosahexaenoic (22:6n�3, DHA) acids,were significantly higher (P < 0.05) in bulls fed with grass whencompared to concentrate-fed animals.
Trans octadecenoates (18:1t) are the major intermediatesformed during rumen biohydrogenation of C18 PUFA (Bessa,Santos-Silva, Ribeiro, & Portugal, 2000). Significantly higher con-tents of 18:1t were found in animals fed on concentrate diets rel-ative to the PPP diet (data not shown). This is mainly due to thet6 + t8, t9 and t10 isomers, since the vaccenic acid and 18:1t12 re-mains unaffected by the dietary treatments. High concentrations of18:1t10 have been observed in tissues of concentrate-fed rumi-nants, whereas vaccenic acid is consistently associated with foragefeeding (Bessa et al. 2006; Dugan et al., 2007). Moreover, vaccenicacid is the precursor of rumenic acid, the major CLA isomer in ani-mals and humans (Turpeinen et al., 2002) and, therefore, it mightbe considered as a fatty acid with beneficial properties. Otherwise,recent studies on rabbits suggested that butter enriched with18:1t10, but not with vaccenic acid, had deleterious effects on plas-ma lipids and lipoprotein metabolism (Roy et al., 2007). The 18:2trepresents the octadecadienoic acid isomers (trans,trans, cis,transand trans,cis) eluting after 18:1c15 and before 18:2t11,c15. Thenon-conjugated linoleic acid isomer, 18:2t11,c15 is an intermedi-ate of a-linolenic acid biohydrogenation (Bessa et al. 2007), whichexplains its lowest concentration in CCC treatment and the highestproportion in PPP diet.
Regarding partial sums of fatty acids (Table 3), the observedpatterns reflect the values described above for the major individualfatty acids of each group. The relative proportions of MUFA in-creased in meat from concentrate-fed animals when compared toanimals fed on pasture diets, which is mainly due to an increasein oleic acid. Meat from pasture-fed bulls (PPP group) depicted sig-nificantly higher levels of PUFA (P < 0.05) than that from animalsfed on concentrate feeding (CCC, PCC and PPC animals). Severalauthors have reported a similar pattern of fatty acid compositionin pasture-fed cattle (e.g. Realini et al., 2004). Lorenzen et al.(2007) showed that meat from cattle finished on pasture had high-er concentrations of PUFA than that from cattle finished on feedlotdiets. In addition, the sum of n�3 PUFA increased with the inclu-sion of grass to the diet, whereas the proportion of n�6 PUFAwas unchanged for all treatments. According to Eriksson and Pick-ova (2007), the explanation for this higher PUFA percentage inmeat from pasture-fed bulls may be the higher protection of fattyacids in fresh grass from the ruminal biohydrogenation, relative tothat of grain or silage. Moreover, this increase in meat PUFA per-centage could also result from the presence of secondary plantmetabolites in spontaneous pastures that might inhibit microbialbiohydrogenation activity within the rumen (Lourenço, Van Ranst,Vlaeminck, De Smet, & Fievez, 2008).
The ratios of PUFA/SFA and n�6/n�3, which are indexes widelyused to evaluate the nutritional value of fat for human consump-tion, are defined and presented in Table 3. According to currentnutritional recommendations, the PUFA/SFA ratio in human dietsshould be above 0.45 and, within the PUFA, the n�6/n�3 ratioshould not exceed 4.0 (British Department of Health, 1994). Inview of the above guidelines, the n�6/n�3 ratio in meat was high-er in animals fed with the concentrate treatment (CCC, 8.99), inter-
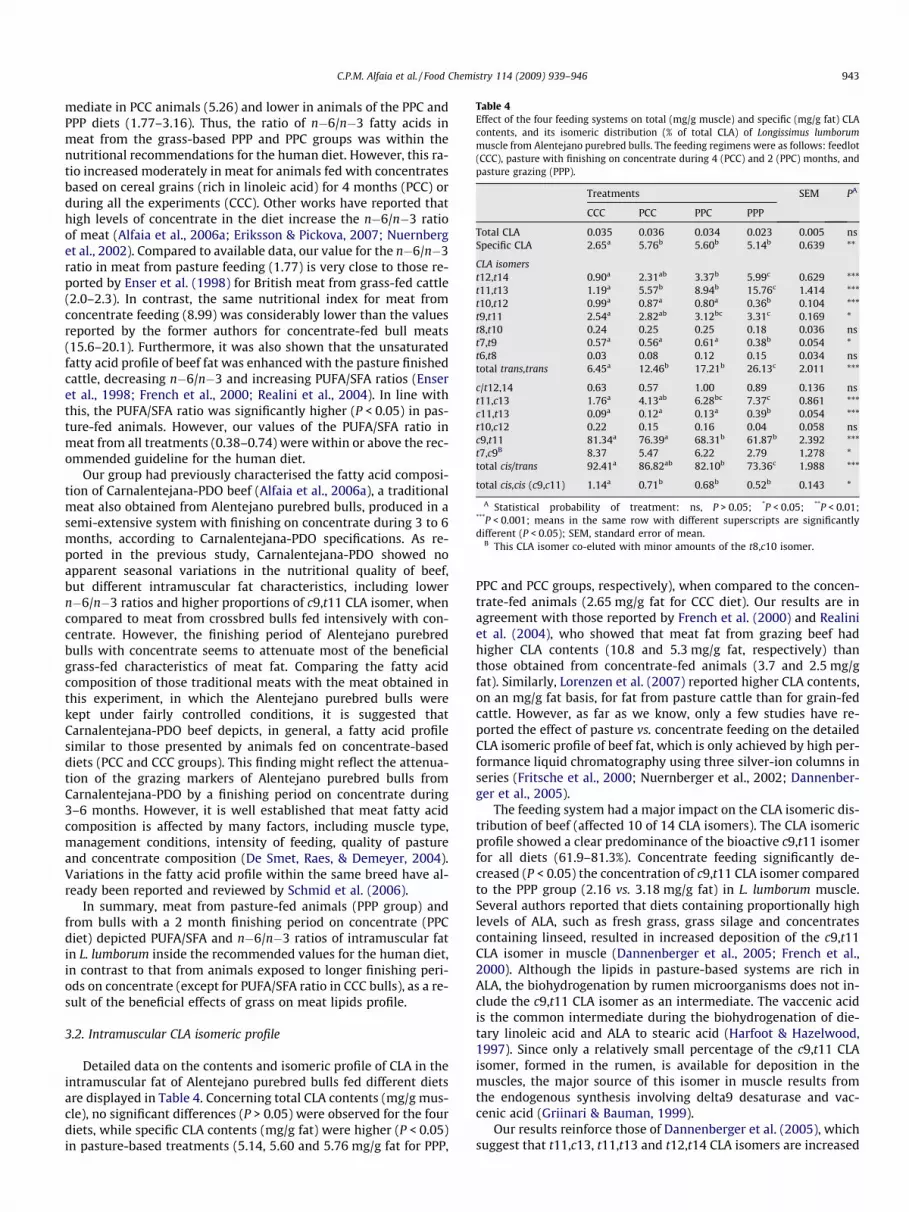
Table 4Effect of the four feeding systems on total (mg/g muscle) and specific (mg/g fat) CLAcontents, and its isomeric distribution (% of total CLA) of Longissimus lumborummuscle from Alentejano purebred bulls. The feeding regimens were as follows: feedlot(CCC), pasture with finishing on concentrate during 4 (PCC) and 2 (PPC) months, andpasture grazing (PPP).
Treatments SEM PA
CCC PCC PPC PPP
Total CLA 0.035 0.036 0.034 0.023 0.005 nsSpecific CLA 2.65a 5.76b 5.60b 5.14b 0.639 **
CLA isomerst12,t14 0.90a 2.31ab 3.37b 5.99c 0.629 ***t11,t13 1.19a 5.57b 8.94b 15.76c 1.414 ***t10,t12 0.99a 0.87a 0.80a 0.36b 0.104 ***t9,t11 2.54a 2.82ab 3.12bc 3.31c 0.169 *t8,t10 0.24 0.25 0.25 0.18 0.036 nst7,t9 0.57a 0.56a 0.61a 0.38b 0.054 *t6,t8 0.03 0.08 0.12 0.15 0.034 nstotal trans,trans 6.45a 12.46b 17.21b 26.13c 2.011 ***
c/t12,14 0.63 0.57 1.00 0.89 0.136 nst11,c13 1.76a 4.13ab 6.28bc 7.37c 0.861 ***c11,t13 0.09a 0.12a 0.13a 0.39b 0.054 ***t10,c12 0.22 0.15 0.16 0.04 0.058 nsc9,t11 81.34a 76.39a 68.31b 61.87b 2.392 ***t7,c9B 8.37 5.47 6.22 2.79 1.278 *total cis/trans 92.41a 86.82ab 82.10b 73.36c 1.988 ***
total cis,cis (c9,c11) 1.14a 0.71b 0.68b 0.52b 0.143 *
A Statistical probability of treatment: ns, P > 0.05; *P < 0.05; **P < 0.01;***P < 0.001; means in the same row with different superscripts are significantlydifferent (P < 0.05); SEM, standard error of mean.
B This CLA isomer co-eluted with minor amounts of the t8,c10 isomer.
C.P.M. Alfaia et al. / Food Chemistry 114 (2009) 939–946 943
mediate in PCC animals (5.26) and lower in animals of the PPC andPPP diets (1.77–3.16). Thus, the ratio of n�6/n�3 fatty acids inmeat from the grass-based PPP and PPC groups was within thenutritional recommendations for the human diet. However, this ra-tio increased moderately in meat for animals fed with concentratesbased on cereal grains (rich in linoleic acid) for 4 months (PCC) orduring all the experiments (CCC). Other works have reported thathigh levels of concentrate in the diet increase the n�6/n�3 ratioof meat (Alfaia et al., 2006a; Eriksson & Pickova, 2007; Nuernberget al., 2002). Compared to available data, our value for the n�6/n�3ratio in meat from pasture feeding (1.77) is very close to those re-ported by Enser et al. (1998) for British meat from grass-fed cattle(2.0–2.3). In contrast, the same nutritional index for meat fromconcentrate feeding (8.99) was considerably lower than the valuesreported by the former authors for concentrate-fed bull meats(15.6–20.1). Furthermore, it was also shown that the unsaturatedfatty acid profile of beef fat was enhanced with the pasture finishedcattle, decreasing n�6/n�3 and increasing PUFA/SFA ratios (Enseret al., 1998; French et al., 2000; Realini et al., 2004). In line withthis, the PUFA/SFA ratio was significantly higher (P < 0.05) in pas-ture-fed animals. However, our values of the PUFA/SFA ratio inmeat from all treatments (0.38–0.74) were within or above the rec-ommended guideline for the human diet.
Our group had previously characterised the fatty acid composi-tion of Carnalentejana-PDO beef (Alfaia et al., 2006a), a traditionalmeat also obtained from Alentejano purebred bulls, produced in asemi-extensive system with finishing on concentrate during 3 to 6months, according to Carnalentejana-PDO specifications. As re-ported in the previous study, Carnalentejana-PDO showed noapparent seasonal variations in the nutritional quality of beef,but different intramuscular fat characteristics, including lowern�6/n�3 ratios and higher proportions of c9,t11 CLA isomer, whencompared to meat from crossbred bulls fed intensively with con-centrate. However, the finishing period of Alentejano purebredbulls with concentrate seems to attenuate most of the beneficialgrass-fed characteristics of meat fat. Comparing the fatty acidcomposition of those traditional meats with the meat obtained inthis experiment, in which the Alentejano purebred bulls werekept under fairly controlled conditions, it is suggested thatCarnalentejana-PDO beef depicts, in general, a fatty acid profilesimilar to those presented by animals fed on concentrate-baseddiets (PCC and CCC groups). This finding might reflect the attenua-tion of the grazing markers of Alentejano purebred bulls fromCarnalentejana-PDO by a finishing period on concentrate during3–6 months. However, it is well established that meat fatty acidcomposition is affected by many factors, including muscle type,management conditions, intensity of feeding, quality of pastureand concentrate composition (De Smet, Raes, & Demeyer, 2004).Variations in the fatty acid profile within the same breed have al-ready been reported and reviewed by Schmid et al. (2006).
In summary, meat from pasture-fed animals (PPP group) andfrom bulls with a 2 month finishing period on concentrate (PPCdiet) depicted PUFA/SFA and n�6/n�3 ratios of intramuscular fatin L. lumborum inside the recommended values for the human diet,in contrast to that from animals exposed to longer finishing peri-ods on concentrate (except for PUFA/SFA ratio in CCC bulls), as a re-sult of the beneficial effects of grass on meat lipids profile.
3.2. Intramuscular CLA isomeric profile
Detailed data on the contents and isomeric profile of CLA in theintramuscular fat of Alentejano purebred bulls fed different dietsare displayed in Table 4. Concerning total CLA contents (mg/g mus-cle), no significant differences (P > 0.05) were observed for the fourdiets, while specific CLA contents (mg/g fat) were higher (P < 0.05)in pasture-based treatments (5.14, 5.60 and 5.76 mg/g fat for PPP,
PPC and PCC groups, respectively), when compared to the concen-trate-fed animals (2.65 mg/g fat for CCC diet). Our results are inagreement with those reported by French et al. (2000) and Realiniet al. (2004), who showed that meat fat from grazing beef hadhigher CLA contents (10.8 and 5.3 mg/g fat, respectively) thanthose obtained from concentrate-fed animals (3.7 and 2.5 mg/gfat). Similarly, Lorenzen et al. (2007) reported higher CLA contents,on an mg/g fat basis, for fat from pasture cattle than for grain-fedcattle. However, as far as we know, only a few studies have re-ported the effect of pasture vs. concentrate feeding on the detailedCLA isomeric profile of beef fat, which is only achieved by high per-formance liquid chromatography using three silver-ion columns inseries (Fritsche et al., 2000; Nuernberger et al., 2002; Dannenber-ger et al., 2005).
The feeding system had a major impact on the CLA isomeric dis-tribution of beef (affected 10 of 14 CLA isomers). The CLA isomericprofile showed a clear predominance of the bioactive c9,t11 isomerfor all diets (61.9–81.3%). Concentrate feeding significantly de-creased (P < 0.05) the concentration of c9,t11 CLA isomer comparedto the PPP group (2.16 vs. 3.18 mg/g fat) in L. lumborum muscle.Several authors reported that diets containing proportionally highlevels of ALA, such as fresh grass, grass silage and concentratescontaining linseed, resulted in increased deposition of the c9,t11CLA isomer in muscle (Dannenberger et al., 2005; French et al.,2000). Although the lipids in pasture-based systems are rich inALA, the biohydrogenation by rumen microorganisms does not in-clude the c9,t11 CLA isomer as an intermediate. The vaccenic acidis the common intermediate during the biohydrogenation of die-tary linoleic acid and ALA to stearic acid (Harfoot & Hazelwood,1997). Since only a relatively small percentage of the c9,t11 CLAisomer, formed in the rumen, is available for deposition in themuscles, the major source of this isomer in muscle results fromthe endogenous synthesis involving delta9 desaturase and vac-cenic acid (Griinari & Bauman, 1999).
Our results reinforce those of Dannenberger et al. (2005), whichsuggest that t11,c13, t11,t13 and t12,t14 CLA isomers are increased

Table 5Results of canonical discriminant analysis: loadings of correlation matrix betweenpredictor variables (standardized canonical coefficients) and discriminant functions(roots 1, 2 and 3), and some statistics for each function.
Root 1 Root 2 Root 3
Fatty acids12:0 �2.554 �0.395 2.14014:0 3.540 �0.525 �1.87816:1t9 1.020 �1.795 �1.64017:1c9 10.073 1.062 �3.96918:0 1.124 �0.290 �1.18118:1c9 �1.647 �2.345 �0.15718:1c13 �3.256 �0.387 1.61018:1t10 �2.942 �0.740 0.01018:1t16 + c14 2.306 0.763 �1.64818:3n�3 0.712 �4.588 0.28920:0 2.940 �1.600 1.48420:1c11 1.397 1.707 3.77022:4n�6 1.929 0.099 �1.65724:1c15 5.222 0.562 �2.624t11,t13 CLA isomer 1.422 �1.302 �0.638
StatisticsCanonical R 0.996 0.983 0.965Eigenvalue 139.4 28.22 13.70Cumulative proportion 0.769 0.924 1.000Probability P < 0.001 P < 0.001 P < 0.001
944 C.P.M. Alfaia et al. / Food Chemistry 114 (2009) 939–946
in meat from pasture-fed animals. However, in our experiment thet11,t13 isomer was the second-most predominant CLA isomer inmeat from pasture-fed animals, instead of the t11,c13 isomer asfound by Dannenberger et al. (2005). This discrepancy may be ex-plained by differences in pasture type and composition. In fact, asmentioned above, animals of the experiment reported here grazedon alluvium pastures, summer triticalis and maize stubbles. Theproportion of t11,t13 CLA isomer increased from 1.19% in the mus-cle of concentrate-fed bulls to 15.76% in meat from bulls fed onpasture. Moreover, the t11,c13 CLA isomer was the third most pre-valent CLA isomer in PPC and PPP diets, with 6.28% and 7.37%,respectively. In contrast, the t7,c9 CLA isomer, which co-elutedwith minor amounts of the t8,c10 isomer, was the second-mostabundant CLA isomer in the concentrate diet (CCC group). This iso-mer is usually identified as the second-most prevalent CLA isomerin commercial milk fat and beef muscle (Dannenberger et al., 2005;Fritsche et al., 2000). The t7,c9 CLA isomer, like the most abundantc9,t11 isomer, mainly result from the endogenous synthesisthrough delta9 desaturation of the rumen derived trans octadece-noate precursor (Palmquist et al., 2004). With the exception ofc9,t11 and t7,c9 isomers, the origin of all CLA isomers, includingthe t11,t13 isomer, is supposed to be the ruminal biohydrogenationof C18 PUFA. However, the metabolic pathways leading to theformation of these compounds, have not yet been elucidated(Nuernberger et al., 2002). Recently, results obtained with twonew Butyrivibrio fibrisolvens strains indicate that the t11,c13 CLAisomer can be formed by isomerisation of 18:2t11,c15 (Hino & Fuk-uda, 2006). Moreover, Bessa et al. (2007) suggested that the originof some minor CLA isomers may not be related with ruminalbiohydrogenation of dietary unsaturated C18 fatty acids, but withbacterial de novo synthesis in the rumen.
The other bioactive CLA isomer, t10,c12, which apparently af-fects lipid metabolism, was not influenced by dietary treatments(P > 0.05). The content of this isomer in meat, which was residualin all treatments, ranged from between 0.04% and 0.22% of totalCLA content. In addition, the diet had a significant effect(P < 0.05) on the total cis/trans (cis,trans and trans,cis), and cis,cisisomers, as well as in total trans,trans CLA isomers. Regarding thesum of trans,trans isomers, pasture feeding resulted in higher per-centages of t11,t13 and t12,t14 CLA isomers in meat than in CCCanimals. This distribution pattern of CLA isomers is consistent withother experiments, in which animals were fed pasture vs. concen-trate (Nuernberger et al., 2002; Dannenberger et al., 2005). Accord-ing to Dannenberger et al. (2005), the differences found in CLAprofiles may be explained by distinct grass intake, since it wasshown that pasture feeding, compared to concentrate feeding, in-creases the proportion of the t11,c13, t11,t13 and t12,t14 CLA iso-mers, and decreases the percentage of the t7,c9 isomer, in beeflipids. As suggested by the same authors, our results confirmedthat t11,t13, t11,c13 and t12,t14 CLA isomers are sensitive grass in-take indicators.
The CLA isomeric profile of intramuscular fat in Carnalentejana-PDO, a traditional meat previously characterised by our group(Alfaia et al., 2006a), is similar to the profile described here formeat from concentrate-fed Alentejano bulls (CCC diet). As men-tioned above, depending on several factors, such as diet composi-tion, slaughter season and muscle type, different profiles of CLAisomers are expected. Nevertheless, the specific CLA contents ofCarnalentejana-PDO beef (4.92–5.07 mg/g fat) are in agreementwith those found in this experiment for pasture-fed bulls (PPPtreatment).
3.3. Discriminatory ability of intramuscular fatty acid pattern
Canonical discriminant analysis was applied to a fatty acid pro-file in order to classify and discriminate the feeding systems used
in this experiment. A stepwise forward discriminant analysis waspreviously applied in order to select the most relevant variablesfor classification. In this procedure, variables that contribute withthe most discriminatory power were selected. The application ofcanonical discriminant analysis to selected variables producedthree canonical discriminant functions, which maximise the ratiobetween class variance and minimises the ratio within class vari-ance. The coefficients obtained for each variable are presented inTable 5. A larger coefficient corresponds to a greater contributionof the respective variable to the discrimination between groups.For treatment differentiation, the first two canonical discriminantfunctions were selected (Fig. 1). The recognition ability of the dis-criminant model was evaluated by the correct classifications of100% during the modelling step, allowing the differentiation ofthe four feeding systems. Afterwards, the prediction ability wascarried out with a cross-validation method, in which one sampleat a time was removed from the training set and considered as atest set. A correct classification of 100% obtained for all treatmentsshowed a high sensitivity and specificity of the class model (Table6).
Considering the data presented in Fig. 1, and the discriminantroot 1, feeding on grass and on concentrate (PPP and CCC treat-ments, respectively) were located on the right side of the plot,whereas the treatments fed on grass with finishing period on con-centrate (PCC and PPC groups) were located on the left side. More-over, according to discriminant root 2, the CCC and PCC treatmentshad positive scores, while the PPP treatment had a negative scoreand the PPC diet is located close to the origin. Nevertheless, betterseparation was achieved with the PPP and CCC diets. The meatfatty acids with the highest discriminant power were the 17:1c9,24:1c15, 14:0 and 18:1c13, on the root 1, and the ALA, oleic acid,16:1t9 and 20:1c11, on the root 2. In addition, the only CLA isomerin meat that entered into the discriminant function was the t11,t13isomer, which was the most sensitive grass intake indicator.
This methodology has been previously applied by Santos-Silva,Bessa, and Santos-Silva (2002) to the discrimination of lamb pro-duction systems: pasture, pasture supplemented with concentrateand concentrate-fed in confinement. The results indicated that themeat fatty acid profile enabled the lambs to be allocated to one ofthe three feeding systems with good accuracy, while both a-linole-nic acid and CLA (GC peak consisting mainly on c9,t11 isomer)

-20 -10 0 10 20-10
-5
0
5
10
Root 1
CCC
PCC
PPP
PPC
Roo
t 2
Fig. 1. Plot of the discriminant functions (root 1 vs. root 2) for classification of bullsaccording to their feeding system. The feeding regimens were as follows: feedlot(CCC), pasture with finishing on concentrate during 4 (PCC) and 2 (PPC) months,and pasture grazing (PPP).
Table 6Classification matrix of cross-validation results for Alentejano purebred bulls in thefour feeding systems, using canonical discriminant analysis. The treatments were asfollows: feedlot (CCC), pasture with finishing on concentrate during 4 (PCC) and 2(PPC) months, and pasture grazing (PPP).
Treatments
CCC PCC PPC PPP
Classified as ‘‘CCC” 7 0 0 0Classified as ‘‘PCC” 0 7 0 0Classified as ‘‘PPC” 0 0 8 0Classified as ‘‘PPP” 0 0 0 8Total 7 7 8 8% Correct classification 100 100 100 100
C.P.M. Alfaia et al. / Food Chemistry 114 (2009) 939–946 945
were the most discriminant fatty acids. Moreno et al. (2006) ap-plied this method to discriminate veal from weaned and unweanedcalves. The SFA lower than C11, followed by the heptadecanoic acid(17:0) and the n�6/n�3 ratio, was the most discriminant variablesfor separating the two weaning classes, regardless of the gender.Moreover, Dias et al. (2008) used the fatty acid profile in order todifferentiate the meat production sub-system (traditional andorganic farming) of two autochthonous bovine cattle breeds(Mirandesa and Barrosã). The authors conclude that the fatty acidcomposition, together with the PUFA/SFA and n�6/n�3 ratios,could be used as an effective tool to differentiate the breed andthe production sub-system used. However, the authors suggesteda larger number of meat samples should be analysed in order tosupport a better understanding of the role of breed and productionsystem on the fatty acid profile.
In summary, the results indicate that prediction of the feedingsystem using intramuscular fatty acids as tracers, including theduration of the finishing period of animals on concentrate, is highlyaccurate. However, caution must be taken in the interpretations ofthe results since the number of animals used here was small andthe number of variables analysed is large. Thus, this approach mustbe extended to larger databases.
4. Conclusions
Data reported here indicate that feeding systems have a majorimpact on the fatty acid profile, including CLA isomers, of
Alentejano beef, which is independent of the degree of intramus-cular fat deposition. a-Linolenic acid, long chain n�3 PUFA, andt11,t13, t11,c13 and t12,t14 CLA isomers in meat were the mostsensitive grass intake indicators. In addition, the data reinforcedthe evidence that beef from pasture-fed animals has a highernutritional quality (mainly due to the higher levels of n�3 PUFAand CLA) when compared to that from concentrate-fed bulls, asa result of the beneficial effects of grass on meat fatty acid profiles.Meat from bulls fed with pasture only and from animals with 2months of finishing on concentrate showed PUFA/SFA and n�6/n�3 ratios of intramuscular fat inside the recommended valuesfor the human diet, in contrast to that from animals exposed tolonger finishing periods on concentrate (except for PUFA/SFA ratioin CCC diet). Finally, meat fatty acid profiles seems to be an effi-cient chemical marker to discriminate between the four feedingsystems analysed, including the different finishing periods of ani-mals on concentrate, suggesting that this approach might be use-ful for the development of a practical discrimination tool forPortuguese PDO beef industry.
Acknowledgements
Financial support (Grants POCTI/CVT/2002/44750, AGRO/2003/512 and PTDC/CVT/2006/66114) and individual grants to Susana P.Alves (SFRH/BD/2007/37793) and Susana I.V. Martins (SFRH/BD/2005/22566) are acknowledged.
References
Agilent Technologies (2001). Agilent chemstation for LC 3D systems – Understandingyour spectra module user’s guide. Palo Alto, CA, USA: Agilent Technologies Inc.
Aldai, N., Osoro, K., Barron, L. J. R., & Najera, A. I. (2006). Gas–liquid chromatographicmethod for analysing complex mixtures of fatty acids including conjugatedlinoleic acids (cis9, trans11 and trans10, cis12 isomers) and long-chain (n�3 orn�6) polyunsaturated fatty acids – Application to the intramuscular fat of beefmeat. Journal of Chromatography A, 1110, 133–139.
Alfaia, C. P. M., Ribeiro, V. S., Lourenço, M. A., Quaresma, M. A., Martins, S. I.,Portugal, A. P., et al. (2006a). Fatty acid composition, conjugated linoleic acidisomers and cholesterol in beef from crossbred bulls intensively produced andfrom Alentejana purebred bulls reared according to Carnalentejana-PDOspecifications. Meat Science, 72, 425–436.
Alfaia, C. P. M., Quaresma, M. A., Castro, M. F., Martins, S. I., Portugal, A. P., Fontes, C.M. G. A., et al. (2006b). Fatty acid composition, including isomeric profile ofconjugated linoleic acid, and cholesterol in Mertolenga-PDO beef. Journal ofScience and Food Agriculture, 86, 2196–2205.
AOAC 963.22 (2000). Methyl esters of fatty acids in oils and fats 963.22. In OfficialMethods of Analysis (17th ed., pp. 24–26). Gaithersburg, MA, USA: Association ofOfficial Analytical Chemists International.
Bessa, R. J., Santos-Silva, J., Ribeiro, J. M., & Portugal, A. V. (2000). Reticulo-rumenbiohydrogenation and the enrichment of ruminant edible products with linoleicacid conjugated isomers. Livestock Production Science, 63, 201–211.
Bessa, R.J.B., Alves, S.P., Figueiredo, R., Teixeira, A.J.R., Rodrigues, A.I.P., Janeiro, A.,et al. (2006). Discrimination of production system and origin of animal productsusing chemical markers. In J.M.C. Ramalho Ribeiro, A.E.M. Horta, C. Mosconi, &A. Rosati (Eds.), Animal Products from the Mediterranean Area. EAAPPublication No. 119 (pp. 231–240). Wageningen (Netherlands): WageningenAcademic Publishers.
Bessa, R. J. B., Alves, S. P., Jerónimo, E., Alfaia, C. M., Prates, J. A. M., & Santos-Silva, J.(2007). Effect of lipid supplements on ruminal biohydrogenation intermediatesand muscle fatty acid in lambs. European Journal of Lipid Science and Technology,109(8), 868–878.
British Department of Health (1994). Nutritional aspects of cardiovascular disease.Report on Health and Social Subjects No. 46. London: HMSO.
Christie, W. W., Sébédio, J. L., & Juanéda, P. (2001). A practical guide to the analysisof conjugated linoleic acid (CLA). INFORM, 12, 147–152.
Daniel, Z., Wynn, R., Salter, A., & Buttery, P. (2004). Different effects of forage andconcentrate diets on the oleic acid and conjugated linoleic acid content of sheeptissues: the role of stearoyl-CoA desaturase. Journal of Animal Science, 82,747–758.
Dannenberger, D., Nuernberg, K., Nuernberg, G., Scollan, N., Steinhart, H., & Ender, K.(2005). Effect of pasture vs. concentrate diets on CLA isomer distribution indifferent tissue lipids of beef cattle. Lipids, 40, 589–598.
De Smet, S., Raes, K., & Demeyer, D. (2004). Meat fatty acid composition as affectedby fatness and genetic factors: a review. Animal Research, 53, 81–98.
Destaillats, F., & Angers, P. (2003). Directed sequential synthesis of conjugatedlinoleic acid isomers from d7,9 to d12,14. European Journal of Lipid Science andTechnology, 105, 3–8.

946 C.P.M. Alfaia et al. / Food Chemistry 114 (2009) 939–946
Dias, L. G., Correia, D. M., Sá-Morais, J., Sousa, F., Pires, J. M., & Peres, A. M. (2008).Raw bovine meat fatty acids profile as an origin discriminator. Food Chemistry,109, 840–847.
Dugan, M. E. R., Kramer, J. K. G., Robertson, W. M., Meadus, W. J., Aldai, N., & Rolland,D. C. (2007). Comparing subcutaneous adipose tissue in beef and muskox withemphasis on trans 18:1 and conjugated linoleic acids. Lipids, 42, 509–518.
Enser, M., Hallet, B., Hewitt, G., Fursey, J., Wood, D., & Harrington, G. (1998). Fattyacid content and composition of UK beef and lamb muscle in relation toproduction system and implications for human nutrition. Meat Science, 49,329–341.
Eriksson, S. F., & Pickova, J. (2007). Fatty acids and tocopherol levels in M.Longissimus dorsi of beef cattle in Sweden – A comparison between seasonaldiets. Meat Science, 76, 746–754.
Food Advisory Committee (1990). Report on review of food labelling and advertising.London: Her Majesty’s Stationery Office.
French, P., Stanton, C., Lawless, F., O’Riordan, E. G., Monahan, F. J., Caffrey, P. J., et al.(2000). Fatty acid composition, including conjugated linoleic acid, ofintramuscular fat from steers offered grazed grass, grass silage, orconcentrate-based diets. Journal of Animal Science, 78, 2849–2855.
Fritsche, J., Fritsche, S., Solomon, M. B., Mossoba, M. M., Yurawecz, M. P., Morehouse,K., et al. (2000). Quantitative determination of conjugated linoleic acid isomersin beef fat. European Journal of Lipid Science and Technology, 102, 667–672.
Geay, Y., Bauchart, D., Hocquette, J. F., & Culioli, J. (2001). Effect of nutritional factorson biochemical, structural and metabolic characteristics of muscles inruminants, consequences on dietetic value and sensorial qualities of meat.Reproduction, Nutrition and Development, 41, 1–26.
Griffin, B. A. (2008). How relevant is the ratio of dietary n�6 to n�3 polyunsaturatedfatty acids to cardiovascular disease risk? Evidence from the OPTILIP study.Current Opinion in Lipidology, 19, 57–62.
Griinari, J. M., & Bauman, D. E. (1999). Biosynthesis of conjugated linoleic acid andits incorporation into meat and milk in ruminants. In M. P. Yurawecz, M.Mossoba, J. K. Kramer, G. Nelson, & M. W. Pariza (Eds.). Advances in ConjugatedLinoleic Acid Research (Vol. 1, pp. 180–200). Champaign, Il, USA: AOCS Press.
Hino, T., & Fukuda, S. (2006). Biohydrogenation of linoleic and linolenic acids, andproduction of their conjugated isomers by Butyrivibrio fibrisolvens. InProceedings of the 4th euro fed lipid congress (p. 551). Madrid, Spain.
Harfoot, C. G., & Hazelwood, G. P. (1997). In The rumen microbial ecosystem(pp. 382–426). London (UK): Elsevier Science Publishers.
Jenkins, T. C. (1994). Regulation of lipid metabolism in the rumen. Journal ofNutrition, 124, 1372S–1376S.
Kramer, J. K. G., Sehat, N., Dugan, M. R., Mossoba, M. M., Yurawecz, M. P., Roach, J. A.,et al. (1998). Distributions of conjugated linoleic acid (CLA) isomers in tissuelipid classes of pigs fed a commercial CLA mixture determined by gaschromatography and silver ion higher-performance liquid chromatography.Lipids, 33(6), 549–558.
Kramer, J. K. G., Blackadar, C. B., & Zhou, J. (2002). Evaluation of two GC columns (60m Supelcowax 10 and 100 m CP Sil 88) for analysis of milk fat with emphasis onCLA, 18:1, 18:2 and 18:3 isomers, and short and long-chain fatty acids. Lipids,37(8), 823–835.
Lorenzen, C. L., Golden, J. W., Martz, F. A., Grün, I. U., Ellersieck, M. R., Gerrish, J. R., &Moore, K. C. (2007). Conjugated linoleic acid content of beef differs by feedingregime and muscle. Meat Science, 75, 159–167.
Lourenço, M., Van Ranst, G., Vlaeminck, B., De Smet, S., & Fievez, V. (2008). Influenceof different dietary forages on the fatty acid composition of rumen digesta aswell as ruminant meat and milk. Animal Feed Science Technology, 145(1–4),418–437.
Moreno, T., Varela, A., Oliete, B., Carballo, J. A., Sánchez, L., & Montserrat, L. (2006).Nutritional characteristics of veal from weaned and unweaned calves:Discriminatory ability of the fat profile. Meat Science, 73, 209–217.
Nuernberg, K., Nuernberg, G., Ender, K., Lorenz, S., Winkler, K., Rickert, R., &Steinhart, H. (2002). N�3 fatty acids and conjugated linoleic acids oflongissimus muscle in beef cattle. European Journal of Lipid Science andTechnology, 104, 463–471.
Nuernberg, K., Dannenberger, D., Nuernberg, G., Ender, K., Voigt, J., Scollan, N. D.,et al. (2005). Effect of a grass-based and a concentrate feeding system on meatquality characteristics and fatty acid composition of longissimus muscle indifferent cattle breeds. Livestock Production Science, 94, 137–147.
Palmquist, D. L., St-Pierre, N., & McClure, K. E. (2004). Tissue fatty acid profiles canbe used to quantify endogenous rumenic acid synthesis in lambs. Journal ofNutrition, 134, 2407–2414.
Park, Y., & Pariza, M. W. (2007). Mechanisms of body fat modulation by conjugatedlinoleic acid (CLA). Food Research International, 40(3), 311–323.
Prates, J. A. M., & Mateus, C. P. (2002). Functional foods from animal sources andtheir physiologically active components. Revue de Médecine Vétérinaire, 153(3),155–160.
Realini, C. E., Duckett, S. K., Brito, G. W., Rizza, M. D., & De Mattos, D. (2004). Effect ofpasture vs. concentrate feeding with or without antioxidants on carcasscharacteristics, fatty acid composition, and quality of Uruguayan beef. MeatScience, 66, 567–577.
Roy, A., Chardigny, J. M., Bauchart, D., Ferlay, A., Lorenz, S., Durand, D., et al. (2007).Butters rich either in trans-10-18:1 or in trans-11-C18:1 plus cis-9, trans-11 CLAdifferentially affect plasma lipids and aortic fatty streak in experimentalatherosclerosis in rabbits. Animal, 1(3), 467–476.
Santos-Silva, J., Bessa, R. J. B., & Santos-Silva, F. (2002). Effect of genotype, feedingsystem and slaughter weight on the quality of light lambs. II. Fatty acidcomposition of meat. Livestock Production Science, 77(2–3), 187–194.
Schmid, A., Collomb, M., Sieber, R., & Bee, G. (2006). Conjugated linoleic acid in meatand meat products: A review. Meat Science, 73, 29–41.
Sehat, N., Kramer, J. K., Mossoba, M. M., Roach, J. A., Yurawecz, M. P., Eulitz, K., et al.(1998). Identification of conjugated linoleic acid (CLA) isomers in cheese by gaschromatography, silver ion high performance liquid chromatography, and massspectral reconstructed ion profiles: comparison of chromatographic elutionsequences. Lipids, 33, 963–971.
Sinclair, L. A. (2007). Nutritional manipulation of the fatty acid composition ofsheep meat: A review. Journal of Agricultural Science, 145, 419–434.
Statistical Analysis System (2004). SAS/STAT 9.1 User’s Guide. Cary, NC, USA: SASInstitute Inc.
Turpeinen, A. M., Mutanen, M., Aro, A., Salminen, I., Basu, S., Palmquist, D. L., &Griinari, J. M. (2002). Bioconversion of vaccenic acid to conjugated linoleic acidin humans. American Journal of Clinical Hypnosis, 76, 504–510.
Wood, J. D., & Enser, M. (1997). Factors influencing fatty acids in meat and the roleof antioxidants in improving meat quality. British Journal of Nutrition, 78(1),S49–S60.
Wood, J. D., Richardson, R. I., Nute, G. R., Fisher, A. V., Campo, M. M., Kasapidou, P. R.,& Enser, M. (2004). Effects of fatty acids on meat quality: a review. Meat Science,66(1), 21–32.
Wood, J. D., Enser, M., Fisher, A. V., Nute, G. R., Sheard, P. R., Richardson, R. I., Hughes,S. I., et al. (2008). Fat deposition, fatty acid composition and meat quality: Areview. Meat Science, 78, 343–358.
World Health Organization (2003). Diet, nutrition and the prevention of chronicdiseases. Report of a Joint WHO/FAO Expert Consultation. WHO Technical ReportSeries No. 916. Geneva: World Health Organization.


