Embed Size (px)
Citation preview
Copyright © 2017 IJIRES, All right reserved
344
International Journal of Innovation and Research in Educational Sciences
Volume 4, Issue 3, ISSN (Online): 2349–5219
Effect on the Upper Consolute Temperature (UCT) of a
Partially Miscible Phenol-water Solution with Addition of
Ionic Compounds like NaCl, KCl, and Organic Compounds
like C10H8 (Naphthalene), and C10H16O (Camphor) Producing
a Ternary System
Anmol Mathur
Date of publication (dd/mm/yyyy): 06/06/2017
Abstract – Phenolic compounds are ubiquitous in today’s
modern pharmaceutics with immense uses in the aviation to
paint and to the cosmetics industries. Phenol’s properties have
been studied for centuries, particularly its partial miscibility
with water. Generally, partially miscible liquids become more
soluble with the increase in temperature and at a certain
temperature they are completely miscible. This temperature is
known as the critical solution temperature (CST) or consolute
temperature. The temperature above which the phases of a
system are completely miscible is known as the upper
consulate temperature (UCT) and it gets affected by the
addition of impurities. To find the miscibility temperature, the
mixture was heated in a boiling tube until the turbidity
disappeared and the final temperature was noted. Then, the
mixture was cooled down and the temperature noted when the
turbidity reappeared. Solutions of impurities of different
concentrations were formed and their effect on the UCT of the
ternary system created by the impurities, Phenol, and water
was analyzed.
It was found that the ionic compounds, which get hydrated
with water, show lesser increase in CST as they decrease the
miscibility to a lesser extent. Further, at all concentrations,
CST of phenol-water system containing Camphor as impurity
is maximum and it increases with increasing concentration.
Thus, Camphor is the most suitable substance to be added to
increase the UCT of phenol-water system.
Keywords – Critical Solution Temperature/Consolute
Temperature, Ionic and Organic Impurities in Phenol-Water
System, Phenol-Water System, Ternary System.
I. INTRODUCTION
A homogenous mixture of a solute (dispersed phase) and
a solvent (dispersion medium) is called as a true solution.1
Various solutions are: solid-solid, solid-liquid, liquid-
liquid, gas-liquid, etc. The liquid-liquid are of three types:
Completely miscible liquid pairs - E.g. Water-
Alcohol, Water-Sulphuric Acid
Partially miscible liquid pairs - E.g. Ether-Water,
Phenol-Water
1Xamplified. "True Solution, Suspension and Colloidal
Solution." Colloidal Solution. Xamplified, . Web. 14 Oct. 2015. 2 UA, Waterloo. "Solutions." Science.uwaterloo.ca. University of
Waterloo, . Web. 14 Oct. 2015. 3 Drugs.com. "Phenol Spray." Drugs.com: Phenol Spray. Drugs.com, 1
Jan. 2000. Web. 14 Oct. 2015. 4 Greener-Industry. "Phenol." Greener-industry.org.uk. Www.greener-
industry.org.uk, . Web. 15 Oct. 2015. 5 Britannica Ecyclopedia. "Bakelite." Encyclopedia Britannica Online.
Encyclopedia Britannica, . Web. 15 Oct. 2015.
Liquid pairs that are practically immiscible - E.g.
Mercury-Water, Nitrobenzene-water.2
Many substances that we use every day contain partially
miscible liquids like phenol-water, in which, the
components of a system might not be miscible over the
entire concentration range. If a component, say A, is added
to component B, gradually, after a certain composition the
system separates in two phases, one of which is a solution
of A in B and the other is a solution of B in A. But
increasing the temperature leads to a state of complete
miscibility. This happens because the kinetic energy of the
molecules increases due to the heat and they overcome the
repulsion between A and B.
Most commercially available, over-the-counter, bottles of
throat aid or spray contain phenol as a major ingredient.
Phenol is also known as carbolic acid or benzenol3.
C8H5OH is the molecular formula of phenol and contains an
alcohol group bonded to an aromatic ring. It is inexpensive
and its mixture with water is thus used for many small-scale
purposes, such as an antiseptic, in paint strippers,
chemically resistant coatings4, in the aviation industry,
preparation of plastics like Bakelite5, in the manufacture of
cosmetics like sunscreens, hair color and in skin
lightening6. Further, aqueous phenol is used in
pharmaceuticals for the formation of microcapsules and in
polymer coating methods7.
II. CRITICAL SOLUTION TEMPERATURE OR
CONSULATE TEMPERATURE
When phenol and water are mixed, a certain amount of
the two dissolves with the other due to hydrogen bonding
and two conjugate layers of liquids are obtained. The upper
layer of this system is water dissolved in phenol and the
lower layer is phenol dissolved in water. The composition
of these layers depends only on the temperature of the
system and is independent of the quantities of the liquids
6 Vermerris, Wilfred, and Ralph L. Nicholson. "Chapter 7: Phenolic
Compounds And Their Effects on Human Health." Phenolic Compound
Biochemistry. Dordrecht, the Netherlands: Springer, 2006. 235-37. Print. 7 Jadhav, Rajendra S., Vishal Mane, Avinash V. Bagle, Dilip G.
Hundiwale, Pramod P. Mahulikar, and Gulzar Waghoo. "Synthesis of Multicore Phenol Formaldehyde Microcapsules and Their Application in
Polyurethane Paint Formulation for Self-healing Anticorrosive Coating."
International Journal of Industrial Chemistry Int J Ind Chem 4.1 (2013): 31. Springer. Web. 16 Oct. 2015.
Copyright © 2017 IJIRES, All right reserved
345
International Journal of Innovation and Research in Educational Sciences
Volume 4, Issue 3, ISSN (Online): 2349–5219
mixed. For every temperature two solubilities can be
obtained, one for phenol dissolved in water and the other
for water dissolved in phenol.
Generally, for partially miscible liquids solubility
increases with increasing temperature and the temperature
at which they are completely miscible is termed as the
Critical Solution Temperature (CST) or Consolute
Temperature. The temperature above which the phases of a
system are completely miscible is known as the Upper
Consolute Temperature (UCT) or Upper Critical Solution
Temperature (UCST). Similarly, the temperature below
which the phases of a system are completely miscible is
known as the Lower Critical Solution Temperature (LCST).
For example, a hexane-nitrobenzene system has an UCST
of 19˚C and these substances are not miscible below this
temperature. Similarly, for a tri-ethylamine-water system
the LCST is 19˚C i.e. the system is completely miscible
below this temperature and not above it8. The phenol water
system exhibits an upper critical solution temperature and
this critical solution temperature can be used for testing the
purity of the mixture.
To Phenol–water system if impurities of ionic and
covalent substances are added, a ternary system is formed.9
For a ternary system, there are three components co-
existing in a system.10 The addition of a third substance to
a partially miscible system to increase its miscibility is
known as blending. This is also called as the ‘salting-out’
in pharmaceuticals and is used to select the best solvent for
the drugs.11 In this process, a salt is added to separate the
aqueous phase from the organic phase.
If the added salt dissolves in one of the phases only, it
results in an increase in the UCST, and a decrease in the
LCST, thus decreasing the miscibility of the system.
Further, if the added salt is soluble in both the phases, then
the UCST is lowered and the LCST is raised, thus
increasing the miscibility of the system. This increase or
decrease in the CST depends on the nature and the mass of
the added substance and the composition of the system.
II. FACTORS AFFECTING THE MISCIBILITY OF
A LIQUID-LIQUID SYSTEM
The various factors affecting the solubility of a liquid-
liquid system are: solute-solvent interactions, common ion
effect, molecular size and mass and polarity12. If the
attraction between the added substance and the solvent
particles is greater, higher miscibility can be observed in a
system and vice versa. When a substance containing an ion,
which is already present in the equilibrium state of the
system, is added to that system, a decrease in miscibility is
observed. This decreasing effect of the miscibility is known
as the common ion effect. As the size and mass of the
8 Atkins, P. W., and Julio De Paula. "Equilibrium: Simple Mixtures."
Atkins' Physical Chemistry. 8th ed. Oxford: Oxford UP, 2006. 180-82.
Print. 9 Nelson, Stephen A., Prof. "Ternary Phase Diagrams." Tulane
University. Prof. Stephen A. Nelson, 13 Jan. 2011. Web. 16 Oct. 2015. 10 DeVoe, Howard. "Phase Diagrams: Ternary Systems." UC Davis
ChemiWiki. UC Davis ChemiWiki, . Web. 16 Oct. 2015.
molecule of the added substance increases, the miscibility
of the system decreases and hence, the CST increases. Ionic
solutes dissolve in polar solvents whereas organic solutes
dissolve in non-polar solvents.
Thus, the addition of impurities like NaCl, KCl,
Naphthalene and Camphor should reduce the miscibility of
phenol and water. This is because of the nature of
combining of the water molecules with these ions and
hence, simple ions reduce the tendency of water to solvate
phenol13. As a result, the addition of salt should always
increase the critical solution temperature. Therefore, the
aim of this research is:
How does the Upper Consolute Temperature (UCT)(in˚C)
of a partially miscible phenol-water solution changes with
addition of varied concentrations of foreign ionic
compounds like NaCl (Sodium Chloride), KCl (Potassium
Chloride), and organic compounds like C10H8
(Naphthalene), and C10H16O (Camphor) producing a
ternary system?
Research Presupposition The CST is a characteristic feature of a partially miscible
liquid solution and addition of the foreign substances, ionic
like NaCl, KCl and organic like Naphthalene and Camphor
in phenol-water system affect the CST. Since organic
substances have large molecular mass, addition of organic
compounds should affect CST of the system the most as
compared to ionic substances.
III. RESEARCH VARIABLES
In a phenol-water system the concentration of phenol in
water in mass percentage is the independent variable which
is varied throughout the experiment from 75% to 30% and
from 90% to 45% along with 0.2% to 0.8% solution of
added impurities to determine the miscibility temperature.
Miscibility temperature and thus the CST, depends on the
concentration of phenol-water solutions and on the type of
impurities added to the system. Thus, the CST is a
dependent variable.
The concentration of all impurities added was kept
constant. Also, two ionic (Sodium Chloride and Potassium
Chloride) and two non-polar impurities (Naphthalene and
Camphor), all of which are only soluble in one phase of the
system, either phenol or water were used. Impurities like
succinic acid (soluble in both water and phenol) were
deliberately excluded because this research aimed to only
study the upper critical solution temperature of the system.
It was important to ensure that the readings are taken at
the precise moment of disappearance and reappearance of
the turbidity of the mixture. Hence, a white card with a
black cross was used, and it was suspended from the clamp
stand, right behind the boiling tube. The mixture was very
11 Turtinen, Lloyd W., and Brian D. Juran. "Protein Salting-Out Method
Applied to Genomic DNA Isolation from Fish Whole Blood." Protein
Salting-Out Method Applied to Genomic DNA Isolation from Fish Whole Blood 24.2 (1998): 238-39. BioTechniques. Web. 16 Oct. 2015.
12 Clugston, M. J., and Rosalind Flemming. "Chemical Equilibrium."
Advanced Chemistry. Oxford: Oxford UP, 2000. 182-84. Print. 13 Dhirendra, Singh. "Water-Phenol Miscibility Diagram."
Academia.org. Academia.org, . Web. 18 Oct. 2015.
Copyright © 2017 IJIRES, All right reserved
346
International Journal of Innovation and Research in Educational Sciences
Volume 4, Issue 3, ISSN (Online): 2349–5219
slightly stirred by a glass rod stirrer placed with the
thermometer in the boiling tube and hence the rod moved
up and down across a small height. To keep the stirring
regular, it was moved once in approximately every 30
seconds. To prepare the solutions of different
concentrations of ionic and organic compounds, only water
was used as a solvent irrespective of their respective extent
of solubility in water.
All experiments were carried out at R.T.P. since pressure
can also affect the solubilities of different components. The
standard state of all the four added impurities was the same,
i.e. all exist as solids at R.T.P. This is because the change
in state can also affect the solubility. While finding the
UCST of various solutions of phenol-water and impurities,
the mixtures were heated in the same water bath by a
constant flame of a Bunsen burner to provide the mixture
with constant heat.
IV. RESEARCH METHODOLOGY
Procedure for Calculating the CST of a Phenol-Water
System (without added impurity)- 1. The hard glass boiling tubes were thoroughly cleaned
and dried.
2. In one boiling tube, 75% phenol solution was prepared
by weighing 9g Phenol and adding 3ml of water to it.
(percentage from 75% was taken because for
concentrations above this the turbidity reappears only if
the solution is cooled down by putting it in an ice bath).
3. It was observed that turbidity appears.
4. The miscibility temperatures of the mixture prepared
were found as follows:
A. The inner boiling tubes with the solutions were
fitted in an outer jacket by means of a rubber cork. The
inner tube was fitted with a cork, a thermometer and a
stirrer.
B. This apparatus was then placed in a 500ml beaker
containing water, and its temperature was raised slowly
using a Bunsen burner, ignited on low flame.
C. The water bath was heated and the mixture was
stirred at regular intervals of time.
D. The heating of the water bath was slowed by
decreasing the flame of the burner, when the turbidity
started disappearing.
E. The temperature from the thermometer when the
turbidity disappeared completely was noted and the
burner was turned off.
F. Further, set up was left to cool down so that the
turbidity reappeared completely and this temperature
was noted.
G. Using these temperatures, the miscibility
temperature of the reaction mixture was calculated by
the formula: 𝑀𝑖𝑠𝑐𝑖𝑏𝑖𝑙𝑖𝑡𝑦 𝑇𝑒𝑚𝑝𝑒𝑟𝑎𝑡𝑢𝑟𝑒 𝑜𝑓 𝑎 𝑠𝑜𝑙𝑢𝑡𝑖𝑜𝑛
=
𝑇𝑒𝑝𝑒𝑟𝑎𝑡𝑢𝑟𝑒 𝑎𝑡 𝑤ℎ𝑖𝑐ℎ 𝑡𝑢𝑟𝑏𝑖𝑑𝑖𝑡𝑦 𝑑𝑖𝑠𝑎𝑝𝑝𝑒𝑎𝑟𝑠 +𝑇𝑒𝑚𝑝𝑒𝑟𝑎𝑡𝑢𝑟𝑒 𝑎𝑡 𝑤ℎ𝑖𝑐ℎ 𝑡𝑢𝑟𝑏𝑖𝑑𝑖𝑡𝑦 𝑟𝑒𝑎𝑝𝑝𝑒𝑎𝑟𝑠
2
5. After adding 1ml water to the boiling tube after each
trial, this procedure was repeated from step A to G; this
helped to obtain the miscibility temperature of different
percentage compositions of phenol in water.
6. The temperature data obtained was recorded in data
table.
Finding the Effect of NaCl on the CST of the Phenol-
Water system- 7. Preparation of 1% NaCl solution
1 gram of Sodium Chloride (NaCl) salt was weighed by
an electronic weighing machine.
This was dissolved NaCl in distilled water in the beaker
and made the volume 100ml by using measuring
cylinder: the solution obtained is 1% NaCl.
8. Then, 10ml each of 0.2%,0.4%,0.6% ,and 0.8% of NaCl
solutions were prepared by adding 2,4,6 and 8 ml of 1%
NaCl to 8,6,4 and 2ml of distilled water respectively in
4 different 50 ml beakers, with the help of 10ml
measuring cylinders.
9. The prepared 10 ml of 0.2% NaCl solutions were added
in the boiling tube containing 90% phenol solution
prepared by adding 9g of phenol in 1ml water.
10. The miscibility temperatures for the mixture prepared at
different concentrations of Phenol were found by
repeating steps 4 to 6.
11. The same is repeated for different concentrations of
NaCl and the data obtained is recorded.
Finding the Effect of KCl on the CST of the Phenol-
Water System- 12. Preparation of 1% KCl Solution
This was done in the same way as in step 7 but instead
of NaCl, KCl was taken.
13. Steps 8-11 were followed for calculating the effect of
KCl on the miscibility temperature of two partially
miscible liquids (Phenol-Water).
Finding the Effect of NaCl and KCl Mixed Together
on the CST of the Phenol-Water System- 14. Preparation of 1% NaCl solution and 1% KCl solution
The 1% NaCl and 1% KCl solutions prepared as per
aforementioned procedure.
15. Then to obtain 0.2% concentration of this solution, 1ml
each of 1%KCl and 1%NaCl solution were added to 8ml
water.
16. Similarly, the other concentrations were obtained, i.e.
0.4% by adding 2ml each of 1%KCl and 1% NaCl
solution to 6ml water, 0.6% by adding 3ml each of
1%KCl and 1%NaCl to 4ml water and henceforth.
Finding the Effect of Naphthalene on the CST of the
Phenol-Water System- 17. Preparation of Naphthalene solution-
Since Naphthalene is almost insoluble in water thus its
solution cannot be prepared as per other solutions.
And if alcohol is used for dissolving than it interferes
with the ternary system of Phenol-Water as both Phenol
and water can dissolve in alcohol.
Therefore, to prepare 0.2% Naphthalene solution 0.02g
of Naphthalene was weighed and added directly along
with 10 ml water to solution in boiling tube containing
90% phenol solution.
Similarly the 0.4%, 0.6%, 0.8%solutions were also
prepared.
18. The miscibility temperatures for the mixture prepared at
different concentrations of Phenol were found by
Copyright © 2017 IJIRES, All right reserved
347
International Journal of Innovation and Research in Educational Sciences
Volume 4, Issue 3, ISSN (Online): 2349–5219
repeating steps 4 to 6.
19. The same is repeated for different concentrations of
Naphthalene solutions for calculating the effect of
Naphthalene on the miscibility temperature of two
partially miscible liquids (Phenol-Water) and the data
obtained is recorded.
Finding the Effect of Camphor on the CST of the
Phenol-Water System- 20. Preparation of Camphor Solution-
Like Naphthalene, Camphor is also almost insoluble in
water, thus it was used via the same procedure as
Naphthalene.
21. The miscibility temperatures for the mixture prepared at
different concentrations were found and the data
obtained was recorded.
22. Steps 8-11 were followed for calculating the effect of
Camphor on the miscibility temperature of two partially
miscible liquids (Phenol-Water).
V. GENERAL OBSERVATIONS
At RTP, phenol is solid, white crystalline and its odor is
like that of a disinfectant. But, the crystals were found
slightly hydrated and discolored. Phenol has moderate
solubility in water - about 8.5 g per 100 g of water. On
dissolving more of phenol in water, white turbidity appears
and two layers of liquid are observed; the upper is a solution
of phenol in water, and the lower a solution of water in
phenol. When NaCl is added to the phenol-water system,
the solution immediately shows turbidity. Organic
compounds are readily soluble in phenol.
VI. RAW DATA TABLES
Note: Not all tables could be provided due to the
limitations of the format. These tables are provided to give
a basic understanding of the data collection process to the
reader.
Table I: Phenol-Water System
S.No.
Percentage
of Phenol
Solution
used per
trial (% ±
0.001%)
Temperature at which
turbidity disappears
(˚C ± 0.25˚C)
Temperature at which
turbidity reappears
(˚C ± 0.25˚C)
Trial
1
Trial
2
Trial
3
Trial
1
Trial
2
Trial
3
1. 75.00 30.0 29.5 30.5 12.0 11.4 12.6
2. 60.00 63.0 62.0 64.0 55.0 54.5 55.5
3. 50.00 72.0 70.0 74.0 62.0 61.0 63.0
4. 42.85 68.0 69.0 67.0 60.0 58.5 61.5
5. 37.50 61.5 61.0 62.0 60.5 59.5 61.5
6. 33.33 60.0 59.5 60.5 54.0 52.0 56.0
7. 30.00 53.0 55.0 51.0 51.0 52.5 49.5
Table II: Effect of 0.2% NaCl on the miscibility of Phenol-
Water System
S.No.
Percentage of
Phenol
Solution used
per trial (%
± 0.001%)
Temperature at which
turbidity disappears
(˚C ± 0.25˚C)
Temperature at which
turbidity reappears
(˚C ± 0.25˚C)
Trial 1 Trial 2 Trial 3 Trial 1 Trial 2 Trial 3
1. 90.00 65.0 64.0 66.0 57.0 56.5 57.5
2. 81.81 68.0 66.0 70.0 59.0 58.0 60.0
3. 75.00 71.0 69.5 72.5 60.0 61.5 58.5
4. 69.23 74.0 76.0 72.0 62.0 61.0 63.0
5. 64.28 72.5 73.0 72.0 61.5 61.0 62.0
6. 60.00 71.0 70.5 71.5 60.0 59.0 61.0
7. 56.25 69.0 70.0 68.0 59.0 58.0 60.0
8. 52.94 67.0 66.0 68.0 58.0 56.0 60.0
9. 50.00 66.0 65.5 66.5 56.0 55.0 57.0
10. 45.00 65.0 64.0 66.0 54.0 52.0 56.0
Table III: Effect of 0.2% KCl on the miscibility of Phenol-
Water System S.No. Percentage of
Phenol
Solution used
per trial (% ±
0.001%)
Temperature at which
turbidity disappears
(˚C ± 0.25˚C)
Temperature at which
turbidity reappears
(˚C ± 0.25˚C)
Trial
1
Trial 2 Trial 3 Trial 1 Trial 2 Trial 3
1. 90.00 64.0 65.0 63.0 61.0 62.0 60.0
2. 81.81 66.0 66.7 65.3 62.0 61.5 62.5
3. 75.00 67.0 67.0 67.0 63.0 63.0 63.0
4. 69.23 68.0 67.5 68.5 63.0 64.0 62.0
5. 64.28 70.0 71.0 69.0 62.0 61.0 63.0
6. 60.00 69.0 70.0 68.0 62.0 60.0 64.0
7. 56.25 68.0 68.5 67.5 62.0 61.5 62.5
8. 52.94 67.2 67.2 67.2 61.2 61.2 61.2
9. 50.00 66.0 65.5 66.5 60.0 60.0 60.0
10. 45.00 65.0 64.0 66.0 59.0 60.0 58.0
Table IV: Effect of 0.2% NaCl + KCl on the miscibility of
Phenol-Water System Similarly, data was collected for
Camphor and aphthalene too. S.No. Percentage of
Phenol
Solution used
per trial (% ±
0.001%)
Temperature at which
turbidity disappears
(˚C ± 0.25˚C)
Temperature at which
turbidity reappears
(˚C ± 0.25˚C)
Trial
1
Trial 2 Trial 3 Trial 1 Trial 2 Trial 3
1. 90.00 66.0 67.0 65.0 61.0 61.5 60.5
2. 81.81 67.0 66.0 68.0 65.0 64.0 66.0
3. 75.00 68.5 68.0 69.0 65.5 66.0 65.0
4. 69.23 69.0 68.0 70.0 66.0 66.0 66.0
5. 64.28 70.0 69.0 71.0 62.4 61.4 63.4
6. 60.00 71.0 70.0 72.0 60.0 59.0 61.0
7. 56.25 70.5 70.0 71.0 57.5 57.0 58.0
8. 52.94 69.0 68.0 70.0 57.0 56.0 58.0
9. 50.00 68.0 67.0 69.0 56.0 55.0 57.0
10. 45.00 65.0 64.0 66.0 55.0 54.0 56.0
VII. PROCESSED DATA TABLES
To find the CST for each system created by different
concentrations of impurities, a graph (using Vernier’s
LoggerPro 3.8.6.1) was plotted, taking the y-axis to be the
miscibility temperatures and the concentration of impurities
in the x-axis. The CST for each case was obtained from the
highest peak of each graph. Further, the standard deviation
was found for assessing the accuracy of the results. These
calculations were done on an Excel Workbook. Uncertainty
in T1and T2 (∆T) was ±0.25℃. To calculate the uncertainty
in the miscibility temperature (T3), the following formula
was used: 𝑈𝑛𝑐𝑒𝑟𝑡𝑎𝑖𝑛𝑡𝑦 𝑖𝑛 𝑇3 = ±(2 × ∆𝑇)
= ±(2 × 0.25℃)
= ±0.5℃
The standard deviation for the data was calculated using
the following formula:
𝜎 = √(∑(𝑇 − �̅�)2)
𝑁 − 1
Where T is the temperature recorded, �̅� is the average
reading (𝑇1 or 𝑇2), and N is the number of trials.
An example of standard deviation calculation is as
follows:
From Raw Data Table 1, for 75% Phenol, Calculating the
mean,
�̅� = (30.0 + 29.5 + 30.5
3) ℃
�̅� = 30.0℃
Copyright © 2017 IJIRES, All right reserved
348
International Journal of Innovation and Research in Educational Sciences
Volume 4, Issue 3, ISSN (Online): 2349–5219
For calculating standard deviation,
∑(𝑇 − �̅�)2 = (30.0 − 30.0)2 + (29.5 − 30.0)2
+ (30.5 − 30.0)2 ℃2
= 0.25 + 0.25 ℃2
= 0.5 ℃2
𝜎 = √0.5
3 − 1 ℃
𝜎 = 0.5 ℃
Table V: Phenol-Water System Percentage of Phenol Solution used per trial
(% ± 0.001%)
75.00 60.00 50.00 42.85 37.50 33.33 30.00
Average
Temperature
Readings
Turbidity disappears
(˚C ±
0.25˚C)
(T1)
30.0 63.0 72.0 68.0 61.5 60.0 53.0
Turbidity
disappears
(˚C ±
0.25˚C) (T2)
12.0 55.0 62.0 60.0 60.5 54.0 51.0
Standard
Deviation
Turbidity
disappears
(˚C ± 0.25˚C)
0.50 1.0 2.0 1.0 0.5 0.28 2.0
Turbidity
disappears
(˚C ± 0.25˚C)
0.60 0.28 1.0 1.25 0.76 2.0 1.75
Miscibility
Temperature
(˚C±0.50˚C) (T3)
T3=
T1+T2 2
21.0 59.0 67.0 64.0 61.0 57.0 52.0
Fig. 1. Phenol Concentration vs. Miscibility Temperature
for Phenol-Water System
Table VI: Effect of 0.2% NaCl on the miscibility of
Phenol-Water System Percentage of Phenol Solution used per trial
(% ± 0.001%)
90.0
0
81.8
1
75.0
0
69.2
3
64.2
8
60.0
0
56.2
5
52.9
4
50.0
0
45.0
0
Average
Temperatur
e Readings
Turbidity
disappear
s (˚C ±
0.25˚C) (T1)
65.0 68.0 71.0 74.0 72.5 71.0 69.0 67.0 66.0 65.0
Turbidity
disappear
s (˚C ±
0.25˚C) (T2)
57.0 59.0 60.0 62.0 61.5 60.0 59.0 58.0 56.0 54.0
Standard
Deviation
Turbidity
disappear
s (˚C ±
0.25˚C)
1.0 2.0 1.5 2.0 0.5 0.5 1.0 1.0 0.5 1.0
Turbidity
disappear
s (˚C ±
0.25˚C)
0.28 1.0 1.5 1.0 0.5 1.0 1.0 2.0 1.0 2.0
Miscibility
Temperatur
e (˚C±0.50˚C)
(T3)
𝑇3=
𝑇1+𝑇2 2
61.0 63.5 65.5 68.0 67.0 65.5 64.0 62.5 61.0 59.5
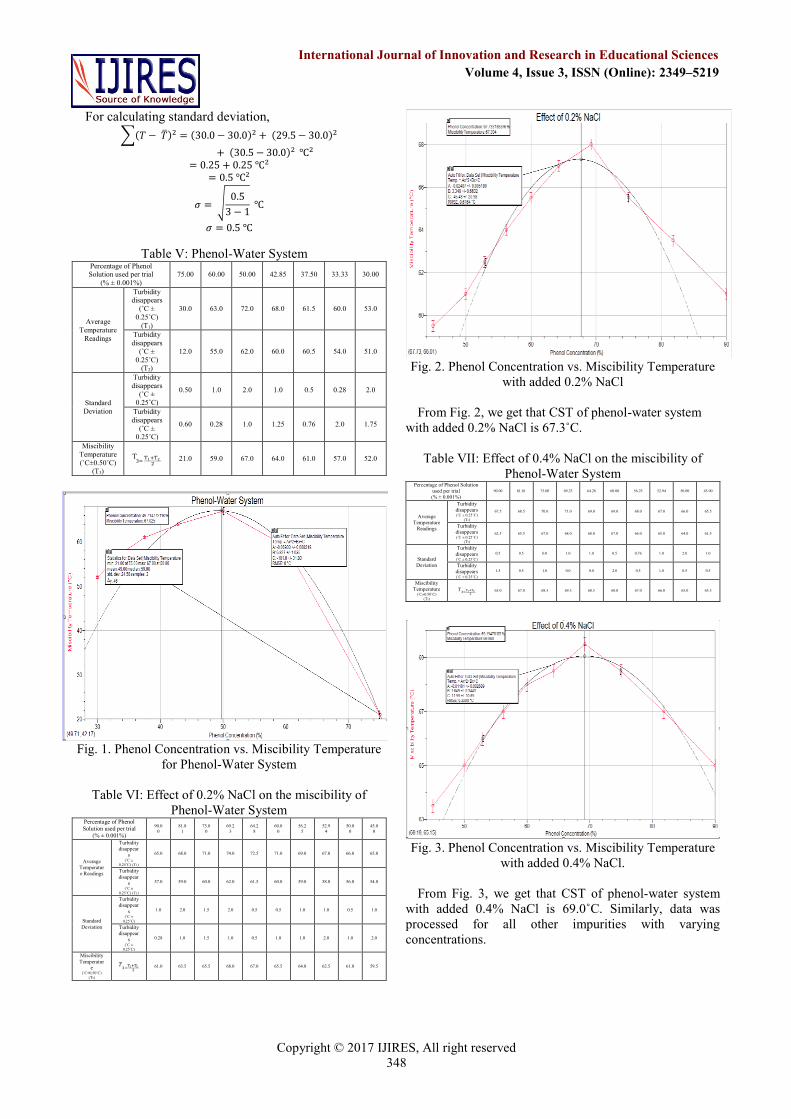
Fig. 2. Phenol Concentration vs. Miscibility Temperature
with added 0.2% NaCl
From Fig. 2, we get that CST of phenol-water system
with added 0.2% NaCl is 67.3˚C.
Table VII: Effect of 0.4% NaCl on the miscibility of
Phenol-Water System Percentage of Phenol Solution
used per trial
(% ± 0.001%)
90.00 81.81 75.00 69.23 64.28 60.00 56.25 52.94 50.00 45.00
Average
Temperature
Readings
Turbidity
disappears (˚C ± 0.25˚C)
(T1)
67.5 68.5 70.0 71.0 69.0 69.0 68.0 67.0 66.0 65.5
Turbidity
disappears (˚C ± 0.25˚C)
(T2)
62.5 65.5 67.0 68.0 68.0 67.0 66.0 65.0 64.0 61.5
Standard
Deviation
Turbidity
disappears (˚C ± 0.25˚C)
0.5 0.5 0.0 1.0 1.0 0.5 0.76 1.0 2.0 1.0
Turbidity
disappears (˚C ± 0.25˚C)
1.5 0.5 1.0 0.0 0.0 2.0 0.5 1.0 0.5 0.5
Miscibility
Temperature (˚C±0.50˚C)
(T3)
𝑇3=
𝑇1+𝑇2 2
65.0 67.0 68.5 69.5 68.5 68.0 67.0 66.0 65.0 63.5
Fig. 3. Phenol Concentration vs. Miscibility Temperature
with added 0.4% NaCl.
From Fig. 3, we get that CST of phenol-water system
with added 0.4% NaCl is 69.0˚C. Similarly, data was
processed for all other impurities with varying
concentrations.
Copyright © 2017 IJIRES, All right reserved
349
International Journal of Innovation and Research in Educational Sciences
Volume 4, Issue 3, ISSN (Online): 2349–5219
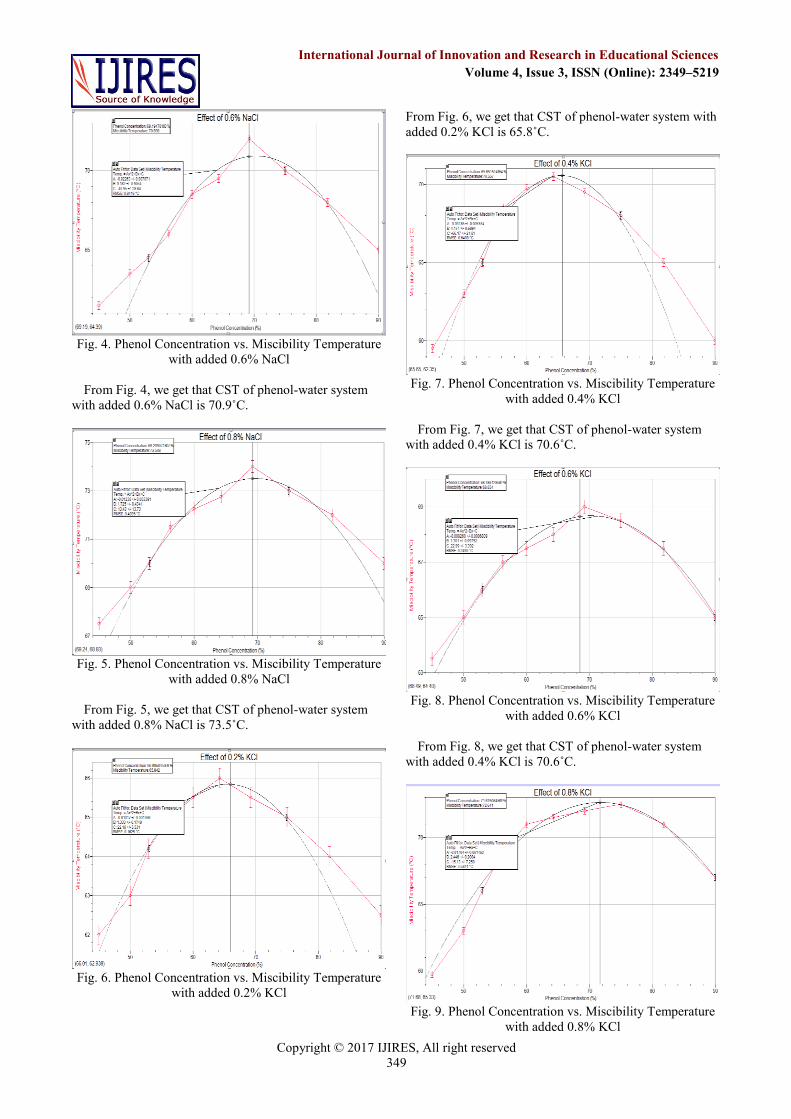
Fig. 4. Phenol Concentration vs. Miscibility Temperature
with added 0.6% NaCl
From Fig. 4, we get that CST of phenol-water system
with added 0.6% NaCl is 70.9˚C.
Fig. 5. Phenol Concentration vs. Miscibility Temperature
with added 0.8% NaCl
From Fig. 5, we get that CST of phenol-water system
with added 0.8% NaCl is 73.5˚C.
Fig. 6. Phenol Concentration vs. Miscibility Temperature
with added 0.2% KCl
From Fig. 6, we get that CST of phenol-water system with
added 0.2% KCl is 65.8˚C.
Fig. 7. Phenol Concentration vs. Miscibility Temperature
with added 0.4% KCl
From Fig. 7, we get that CST of phenol-water system
with added 0.4% KCl is 70.6˚C.
Fig. 8. Phenol Concentration vs. Miscibility Temperature
with added 0.6% KCl
From Fig. 8, we get that CST of phenol-water system
with added 0.4% KCl is 70.6˚C.
Fig. 9. Phenol Concentration vs. Miscibility Temperature
with added 0.8% KCl
Copyright © 2017 IJIRES, All right reserved
350
International Journal of Innovation and Research in Educational Sciences
Volume 4, Issue 3, ISSN (Online): 2349–5219
From Fig. 9, we get that CST of phenol-water system
with added 0.4% KCl is 70.6˚C.
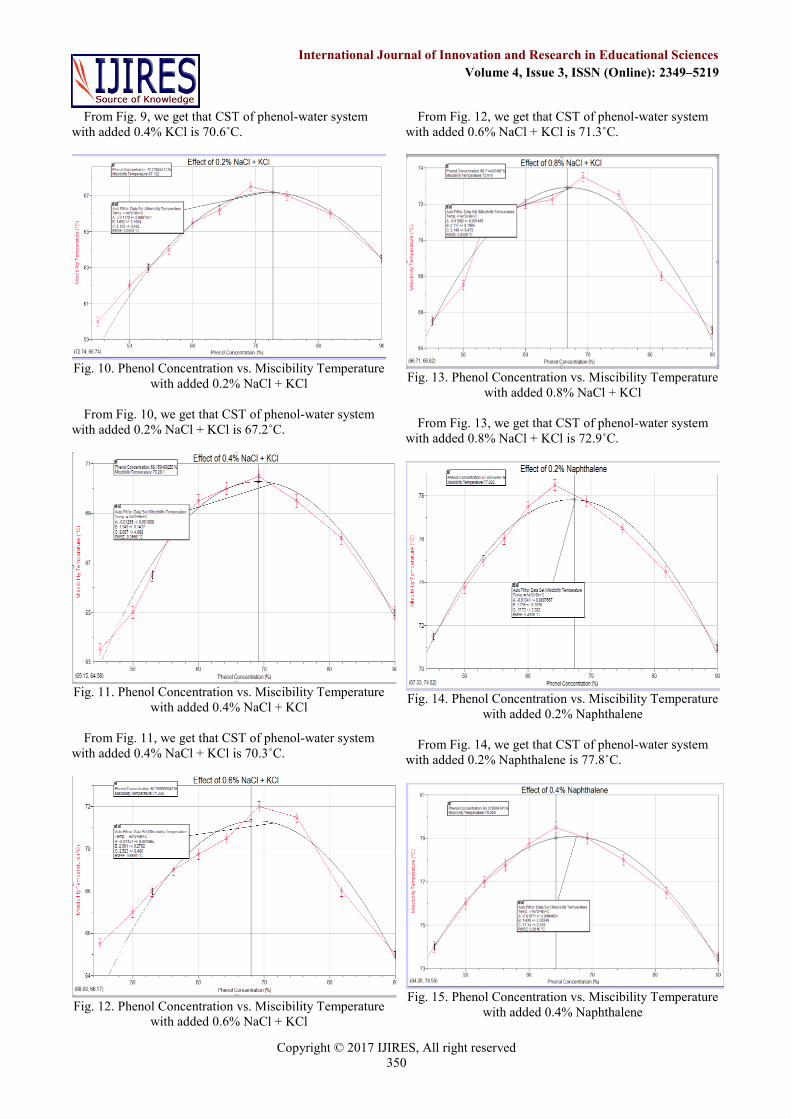
Fig. 10. Phenol Concentration vs. Miscibility Temperature
with added 0.2% NaCl + KCl
From Fig. 10, we get that CST of phenol-water system
with added 0.2% NaCl + KCl is 67.2˚C.
Fig. 11. Phenol Concentration vs. Miscibility Temperature
with added 0.4% NaCl + KCl
From Fig. 11, we get that CST of phenol-water system
with added 0.4% NaCl + KCl is 70.3˚C.
Fig. 12. Phenol Concentration vs. Miscibility Temperature
with added 0.6% NaCl + KCl
From Fig. 12, we get that CST of phenol-water system
with added 0.6% NaCl + KCl is 71.3˚C.
Fig. 13. Phenol Concentration vs. Miscibility Temperature
with added 0.8% NaCl + KCl
From Fig. 13, we get that CST of phenol-water system
with added 0.8% NaCl + KCl is 72.9˚C.
Fig. 14. Phenol Concentration vs. Miscibility Temperature
with added 0.2% Naphthalene
From Fig. 14, we get that CST of phenol-water system
with added 0.2% Naphthalene is 77.8˚C.
Fig. 15. Phenol Concentration vs. Miscibility Temperature
with added 0.4% Naphthalene
Copyright © 2017 IJIRES, All right reserved
351
International Journal of Innovation and Research in Educational Sciences
Volume 4, Issue 3, ISSN (Online): 2349–5219
From Fig. 15, we get that CST of phenol-water system
with added 0.4% Naphthalene is 79.0˚C.
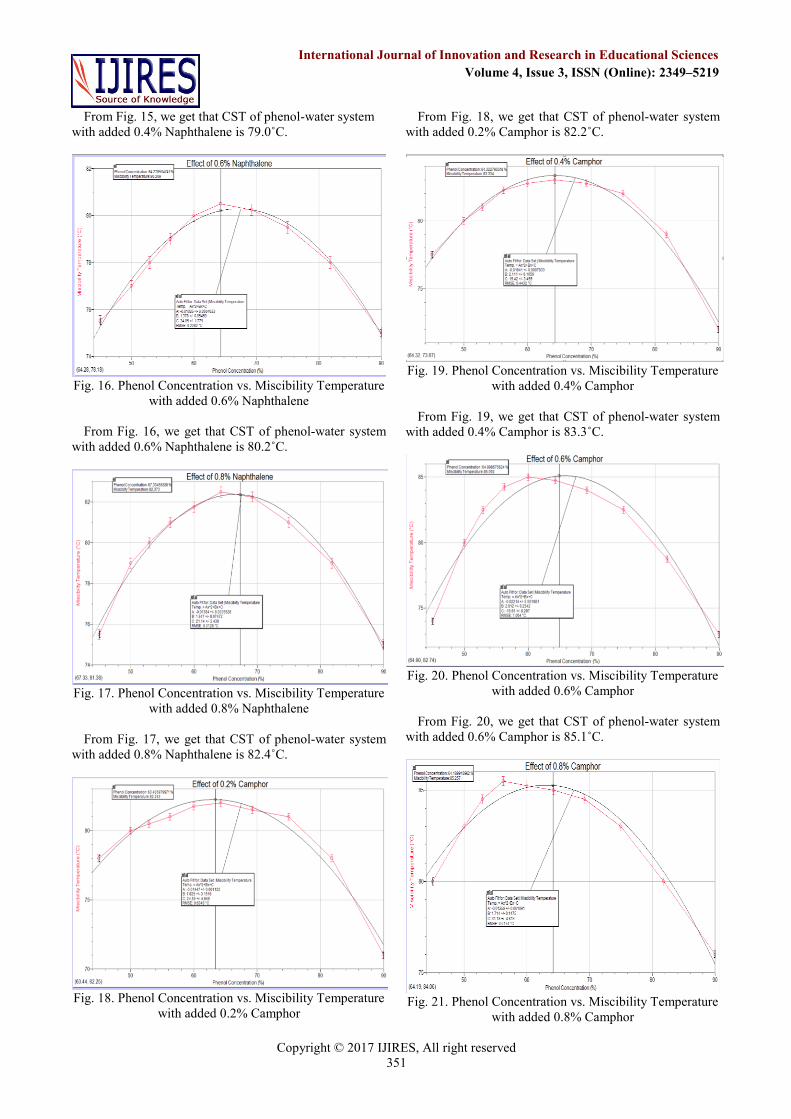
Fig. 16. Phenol Concentration vs. Miscibility Temperature
with added 0.6% Naphthalene
From Fig. 16, we get that CST of phenol-water system
with added 0.6% Naphthalene is 80.2˚C.
Fig. 17. Phenol Concentration vs. Miscibility Temperature
with added 0.8% Naphthalene
From Fig. 17, we get that CST of phenol-water system
with added 0.8% Naphthalene is 82.4˚C.
Fig. 18. Phenol Concentration vs. Miscibility Temperature
with added 0.2% Camphor
From Fig. 18, we get that CST of phenol-water system
with added 0.2% Camphor is 82.2˚C.
Fig. 19. Phenol Concentration vs. Miscibility Temperature
with added 0.4% Camphor
From Fig. 19, we get that CST of phenol-water system
with added 0.4% Camphor is 83.3˚C.
Fig. 20. Phenol Concentration vs. Miscibility Temperature
with added 0.6% Camphor
From Fig. 20, we get that CST of phenol-water system
with added 0.6% Camphor is 85.1˚C.
Fig. 21. Phenol Concentration vs. Miscibility Temperature
with added 0.8% Camphor
Copyright © 2017 IJIRES, All right reserved
352
International Journal of Innovation and Research in Educational Sciences
Volume 4, Issue 3, ISSN (Online): 2349–5219
From Fig. 21, we get that CST of phenol-water system
with added 0.8% Camphor is 85.3˚C.
VIII. ANALYSIS OF PROCESSED DATA
Throughout the analysis, uncertainty in temperature was
0.50℃. By analyzing the graphs and tables, it was found
that when the concentration of phenol is decreased from
75% to 30%, the miscibility decreased and consequently,
the miscibility temperature increased from 21˚C to 67˚C
upto 50% concentration of phenol. After this point, as the
concentration decreased, the miscibility temperature also
decreased to 52˚C (at 30% concentration of phenol), thus
producing a nearly parabolic graph. The peak of which gave
the CST of the system. The CST obtained for this pure
phenol-water system was 67˚C.
On adding impurities solutions of concentrations from
0.2% to 0.8% in the phenol water system with decreasing
concentration of phenol (from 90% to 45%) the CST
determined were:
S.No. Concentration of added
impurity (˚C)→ 0.2% 0.4% 0.6% 0.8%
Name of added impurity ↓
1. Sodium Chloride (NaCl) 67.3 69.0 70.9 73.5
2. Potassium Chloride (KCl) 65.8 70.6 68.7 72.6
3. NaCl + KCl 67.2 70.3 71.3 72.9
4. Naphthalene 77.8 79.0 80.2 82.4
5. Camphor 82.2 83.3 85.1 85.3
Interpreting the data used for Fig. 2 to 5, when the
concentration of NaCl solution added in 90% phenol-water
solution changes from 0.2% to 0.8% the miscibility
temperature also increases from 61ºC to 70ºC. The CST
calculated for these concentrations of NaCl using the Fig. 2
to 5 show that as the concentration increases CST also
increases. This is because the effect of an impurity on the
CST of the system depends on whether the impurity is
partially or completely soluble in one or both the
components of the system and in this case, as NaCl is
completely soluble in water whereas insoluble in phenol
solution, it increased the UCST of the system, hence
decreasing the miscibility.
Similarly, interpreting the data used for Fig. 6 to 9 from
for KCl solution, the miscibility temperature also increases
from 62.5ºC to 67.0ºC. The CST calculated for these
concentrations of KCl using the Fig. 6 to 9, show that as the
concentration increases CST also increases. Since KCl is
also completely soluble in water whereas insoluble in
phenol solution, it increased the UCST of the system, hence
decreasing the miscibility.
The effect of organic substances added in the phenol
water system, is also similar to that of ionic impurities, i.e.
the miscibility temperature increases and the miscibility of
the system decreases. Interpreting the data used for the Fig.
14 to 17, we see that when the concentration of naphthalene
solution added in 90% phenol-water solution changes from
0.2% to 0.8% the miscibility temperature also increases
from 71.0ºC to 75.0ºC. The CST calculated for these
concentrations of naphthalene using the Fig. 14 to 17, show
that as the concentration increases CST also increases.
Naphthalene increased the UCST of the system, hence
decreasing the miscibility. This is because naphthalene is
soluble only in phenol.
The data of Fig. 18 to 21 show that the same trend is
followed by Camphor too, i.e. the miscibility temperature
increases from 71.0ºC to 76.0ºC with the increase in
concentration. This is because camphor is insoluble in water
and soluble in phenol. The CST calculated for these
concentrations of Camphor using the Graphs 18 to 21, show
that Camphor increased the UCST of the system, hence
decreasing the miscibility.
The miscibility temperature in the case of the mixture of
NaCl and KCl also increased and hence reduced the
miscibility of the system. Though the rise in temperature
with concentration was not significant, it mostly fluctuated
between the temperature values of 63.5ºC to 65ºC.
Interpreting the data of Fig. 10 to 13, we see that when the
concentration of NaCl and KCl increased, the miscibility
temperature also increased. I expected these value readings
to be distinct since NaCl and KCl are two ionic compounds
that have a high lattice enthalpy. However, it can be noticed
that the readings are close to those observed using NaCl and
KCl used as separate impurities. Hence, it can be inferred
that there wasn’t much effect of combining these two
compounds but it must be noticed that we can do further
research in this using a mixture with different proportions
of NaCl and KCl.
IX. CONCLUSION AND EVALUATION
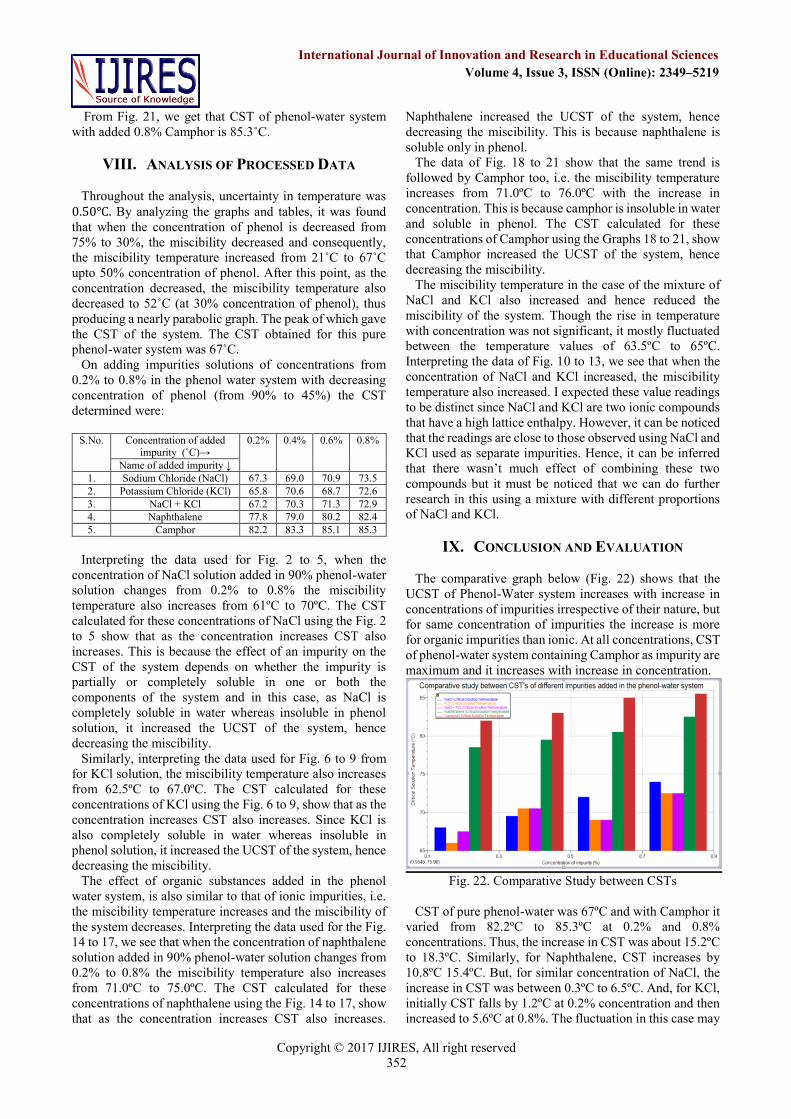
The comparative graph below (Fig. 22) shows that the
UCST of Phenol-Water system increases with increase in
concentrations of impurities irrespective of their nature, but
for same concentration of impurities the increase is more
for organic impurities than ionic. At all concentrations, CST
of phenol-water system containing Camphor as impurity are
maximum and it increases with increase in concentration.
Fig. 22. Comparative Study between CSTs
CST of pure phenol-water was 67ºC and with Camphor it
varied from 82.2ºC to 85.3ºC at 0.2% and 0.8%
concentrations. Thus, the increase in CST was about 15.2ºC
to 18.3ºC. Similarly, for Naphthalene, CST increases by
10.8ºC 15.4ºC. But, for similar concentration of NaCl, the
increase in CST was between 0.3ºC to 6.5ºC. And, for KCl,
initially CST falls by 1.2ºC at 0.2% concentration and then
increased to 5.6ºC at 0.8%. The fluctuation in this case may
Copyright © 2017 IJIRES, All right reserved
353
International Journal of Innovation and Research in Educational Sciences
Volume 4, Issue 3, ISSN (Online): 2349–5219
be due to some experimental errors. CST of mixture of KCl
and NaCl also showed an increase form 0.2ºC to 5.9ºC.
Thus, it can be concluded that the ionic compounds,
which get hydrated with water, show lesser increase in CST
as they decrease the miscibility to a lesser extent. The CST
of KCl was lesser than that of NaCl since NaCl is more
soluble. On the other hand, organic compounds, which
dissolve in phenol (do not get hydrated with water),
decrease the miscibility to a larger extent. Camphor
decreases more since it is more soluble in phenol.
The standard deviation of the readings was noted over the
three trials to measure the accuracy of the experiment
performed. The standard deviation in all the data is between
0 and 2. Despite of trying to minimize all the errors, there
might have been a few uncontrolled and unintended errors
such as parallax errors. Uncertainties in the calculations,
although calculated, came out to be too small to affect the
results. Hence, the uncertainties in the concentration were
neglected. For this experiment, all the solutions were made
first and were then heated one by one, thus the other
solutions were left in the open, and they might have
undergone some changes due to atmospheric interactions.
Also, due to the cold weather in the region where the
laboratory is situated, temperature of disappearance and
reappearance of turbidity might have been affected. Thus,
in the ideal scenario, the solutions should be prepared one
by one. The intensity of the flame of the Bunsen burner
might have fluctuated during the heating of the solutions
which might have caused an increase in the temperature
measured by the thermometer. Considering the small
inaccuracies, it can be argued that the experimental data
came out to be of a good quality.
X. FURTHER SCOPE
This experiment can further be extended to find the
miscibility of other partially miscible systems such as
water-ether using ionic and organic substances. As said
heretofore, mixtures of impurities with different
compositions can be prepared to find their effect on the
phenol-water CST. Different kinds of ionic salts of cations
and anions having different size and charge can be used to
determine the comparative effect on the CST. This can help
in various pharmaceutical salting out processes. In place of
UCST, impurities which affect the LCST (like succinic
acid), can also be added and the results can be compared.
REFERENCES
[1] Atkins, P. W., and Julio De Paula. "Equilibrium: Simple
Mixtures." Atkins' Physical Chemistry. 8th ed. Oxford: Oxford UP, 2006. 180-82. Print.
[2] Clugston, M. J., and Rosalind Flemming. "Chemical
Equilibrium." Advanced Chemistry. Oxford: Oxford UP, 2000. 182-84. Print.
[3] Vermerris, Wilfred, and Ralph L. Nicholson. "Chapter 7: Phenolic
Compounds And Their Effects on Human Health." Phenolic Compound Biochemistry. Dordrecht, the Netherlands: Springer,
2006. 235-37. Print.
[4] Britannica Ecyclopedia. "Bakelite." Encyclopedia Britannica Online. Encyclopedia Britannica, Web. 15 Oct. 2015.
[5] DeVoe, Howard. "Phase Diagrams: Ternary Systems." UC Davis
ChemiWiki. UC Davis ChemiWiki, Web. 16 Oct. 2015.
[6] Dhirendra, Singh. "Water-Phenol Miscibility Diagram."
Academia.org. Academia.org, Web. 18 Oct. 2015. [7] Drugs.com. "Phenol Spray." Drugs.com: Phenol Spray.
Drugs.com, 1 Jan. 2000. Web. 14 Oct. 2015.
[8] Greener-Industry. "Phenol." Greener-industry.org.uk. Www.greener-industry.org.uk, Web. 15 Oct. 2015.
[9] Jadhav, Rajendra S., Vishal Mane, Avinash V. Bagle, Dilip G.
Hundiwale, Pramod P. Mahulikar, and Gulzar Waghoo. "Synthesis of Multicore Phenol Formaldehyde Microcapsules and
Their Application in Polyurethane Paint Formulation for Self-
healing Anticorrosive Coating." International Journal of Industrial Chemistry Int J Ind Chem 4.1 (2013): 31. Springer. Web. 16 Oct.
2015.
[10] Nelson, Stephen A., Prof. "Ternary Phase Diagrams." Tulane University. Prof. Stephen A. Nelson, 13 Jan. 2011. Web. 16 Oct.
2015.
[11] PubChem. "Camphor." PubChem. PubChem, 25 Mar. 2005. Web. 18 Oct. 2015.
[12] PubChem. "Naphthalene." PubChem. PubChem, 25 Mar. 2005.
Web. 18 Oct. 2015. [13] Turtinen, Lloyd W., and Brian D. Juran. "Protein Salting-Out
Method Applied to Genomic DNA Isolation from Fish Whole
Blood." Protein Salting-Out Method Applied to Genomic DNA Isolation from Fish Whole Blood 24.2 (1998): 238-
39. BioTechniques. Web. 16 Oct. 2015.
[14] UA, Waterloo. "Solutions." Science.uwaterloo.ca. University of Waterloo, Web. 14 Oct. 2015.
[15] Xamplified. "True Solution, Suspension and Colloidal Solution." Colloidal Solution. Xamplified, Web. 14 Oct. 2015.
AUTHOR’S PROFILE
Anmol Mathur is a Chemical Engineering student at the
School of Chemical and Biomolecular Engineering of the
Georgia Institute of Technology, Atlanta, GA, United
States of America. He has the honors of Dean’s List and is also a member of the American Institute of Chemical
Engineers (AIChE). He also works as a Research
Scientist in Naq Global Companies. He did his International Baccalaureate
Diploma Programme from Jayshree Periwal International School, Jaipur,
India. Over the years, he has researched in subjects ranging from industrial and organic chemistry to mathematical economics. With several patents to
his name, he now specializes in technologies for the fertilizer industry and
has worked in collaboration with research groups across the world to produce novel eco-friendly solutions for fertilizer quality improvement.
LinkedIn: https://www.linkedin.com/in/anmol-mathur-65545398


