Embed Size (px)
Citation preview
This article appeared in a journal published by Elsevier. The attachedcopy is furnished to the author for internal non-commercial researchand education use, including for instruction at the authors institution
and sharing with colleagues.
Other uses, including reproduction and distribution, or selling orlicensing copies, or posting to personal, institutional or third party
websites are prohibited.
In most cases authors are permitted to post their version of thearticle (e.g. in Word or Tex form) to their personal website orinstitutional repository. Authors requiring further information
regarding Elsevier’s archiving and manuscript policies areencouraged to visit:
http://www.elsevier.com/copyright
Author's personal copy
Effects of ocean acidification on macroalgal communities
Lucia Porzio a, Maria Cristina Buia a,⁎, Jason M. Hall-Spencer b
a Stazione Zoologica Anton Dohrn of Naples, Functional and Evolutionary Ecology Laboratory, Villa Dohrn, Punta San Pietro, 80077 Ischia (Naples), Italyb Marine Institute, Marine Biology and Ecology Research Centre, University of Plymouth, Plymouth PL4 8AA, UK
a b s t r a c ta r t i c l e i n f o
Keywords:Ocean acidificationMacroalgal communitiesMarine biodiversityFunctional ecology
There are high levels of uncertainty about how coastal ecosystems will be affected by rapid ocean acidificationcaused by anthropogenic CO2, due to a lack of data. The few experiments to date have been short-term(b1 year) and reveal mixed responses depending on the species examined and the culture conditions used. Itis difficult to carry out long-term manipulations of CO2 levels, therefore areas with naturally high CO2 levelsare being used to help understand which species, habitats and processes are resilient to the effects of oceanacidification, and which are adversely affected. Here we describe the effects of increasing CO2 levels onmacroalgal communities along a pH gradient caused by volcanic vents.Macroalgal habitat differed at taxonomic and morphological group levels along a pH gradient. The vastmajority of the 101 macroalgal species studied were able to grow with only a 5% decrease in species richnessas the mean pH fell from 8.1 to 7.8. However, this small fall in species richness was associated with shifts incommunity structure as the cover of turf algae decreased disproportionately. Calcitic species were sig-nificantly reduced in cover and species richness whereas a few non-calcified species became dominant. Atmean pH 6.7, where carbonate saturation levels were b1, calcareous species were absent and there was a 72%fall in species richness. Under these extremely high CO2 conditions a few species dominated the simplifiedmacroalgal assemblage and a very few exhibited enhanced reproduction, although high CO2 levels seemed toinhibit reproduction in others.Our data show that many macroalgal species are tolerant of long-term elevations in CO2 levels but thatmacroalgal habitats are altered significantly as pH drops, contributing to a scant but growing body of evidenceconcerning the long-term effects of CO2 emissions in vegetated marine systems. Further study is now neededto investigate whether the observed response of macroalgal communities can be replicated in differentseasons and from a range of geographical regions for incorporation into global modelling studies to predicteffects of CO2 emissions on Earth's ecosystems.
© 2011 Elsevier B.V. All rights reserved.
1. Introduction
The oceans currently absorb over 25 million tonnes of anthro-pogenically produced CO2 every day, causing unprecedented changesto ocean chemistry (IPCC, 2007). Observations and models indicatethat the average pH of the surface ocean has declined from 8.2 by 0.1units since pre-industrial times due to CO2 emissions, and is projectedto be around mean pH 7.8 by the end of the century (The RoyalSociety, 2005). In addition to lowering pH, increasing CO2 levels arelowering calcium carbonate saturation states but increasing theamounts of bicarbonate ions (HCO3−). Laboratory and mesocosmexperiments have shown that these changes in carbonate chemistrycan significantly affect carbon fixation by photoautotrophs, whichmay cause global ecological disturbances over the coming decades
(Kroeker et al., 2010) although there are still too few data to confirmwhether this is the case (Hendricks and Duarte, 2010).
Benthic photoautotrophs exhibit mixed responses to oceanacidification, indicating that there will be changes in their settlement,competition and dominance that will have knock-on effects on coastalecosystems (Connell and Russell, 2010). However, it is very difficult toscale up the observations undertaken to date to predict the effects ofincreasing CO2 emissions at the ecosystem level since most studieshave been short-term (b1 year) on single or small groups of species.Some cyanobacteria grow well with CO2 enrichment and theirincreased N2 fixation may alter ocean biogeochemistry (Fu et al.,2008; Kranz et al., 2009). Some marine algae also benefit from higherCO2 levels, enhancing their growth (Gao et al., 1999; Kübler et al.,1999; Riebesell et al., 2007) and calcification (Iglesias-Rodriguez et al.,2008), although the effects can vary between closely related speciesand even between strains of the same species (Langer et al., 2009). Ingeneral, seagrasses seem able to thrive under high CO2 conditions(Palacios and Zimmerman, 2007; Hall-Spencer et al., 2008), althoughthe associated epiphytic algal cover falls as CO2 levels increase (Martin
Journal of Experimental Marine Biology and Ecology 400 (2011) 278–287
⁎ Corresponding author. Fax: +39 081 984201.E-mail addresses: [email protected] (L. Porzio), [email protected]
(M.C. Buia), [email protected] (J.M. Hall-Spencer).
0022-0981/$ – see front matter © 2011 Elsevier B.V. All rights reserved.doi:10.1016/j.jembe.2011.02.011
Contents lists available at ScienceDirect
Journal of Experimental Marine Biology and Ecology
j ourna l homepage: www.e lsev ie r.com/ locate / jembe
Author's personal copy
et al., 2008). Coralline algae appear to be amongst the most sensitivephotoautotrophs as they have a skeletal mineralogy that dissolveseasily at predicted levels of calcium carbonate saturation (Gao et al.,1993; Martin and Gattuso, 2009) and this is a particular concern asthese algae are of fundamental ecological importance in a range ofcoastal habitats worldwide (Nelson, 2009).
Macroalgal communities perform a range of ecosystem services inshallow coastal systems such as providing food, forming substrata forsettlement, offering protection from predators and shelter fromdisturbances. Macroalgal communities are sensitive to anthropogenicdisturbances and so are used to assess the status of coastal ecosys-tems, for example, under the European Water Framework Directive(Orfanidis et al., 2001; Ballesteros et al., 2007). The sensitivity ofMediterranean macroalgal communities is well documented; Ulvalescan become dominant in nutrient enriched areas (Pergent, 1991),habitat-forming Cystoseira spp. are lost from large stretches ofpolluted coastlines (Rodriguez-Prieto and Polo, 1996; Thibaut et al.,2005; Mangialajo et al., 2008) and ecosystems have been degraded bythe invasive behaviour of introduced organisms such as Caulerpa spp.(Balata et al., 2004).
Differences in the susceptibility of macroalgae to ocean acidifica-tion may completely alter coastal ecosystems as changes in algalcommunities lead to changes in herbivore diversity and abundance(Benedetti-Cecchi et al., 2001; Darcy-Hall and Hall, 2008). Suchchanges in species distributions and abundances are expected topropagate up through the trophic levels of marine food webs (Fabryet al., 2008; Guinotte and Fabry, 2008) but little research has beencarried out on the effects of ocean acidification at the ecosystem level(Wootton et al., 2008).
To improve knowledge regarding the responses of marineecosystems to ocean acidification we assess macroalgal communitychanges at a site described by Hall-Spencer et al. (2008), whereincreasing CO2 levels cause a natural pH gradient at ambient tempera-ture and salinity. We examine changes in seaweed species diversityand abundance along a pH gradient and also examine changes inmorphological groups to help link changes in community structure toecosystem functioning (Micheli and Halpern, 2005).
2. Materials and methods
2.1. Sampling
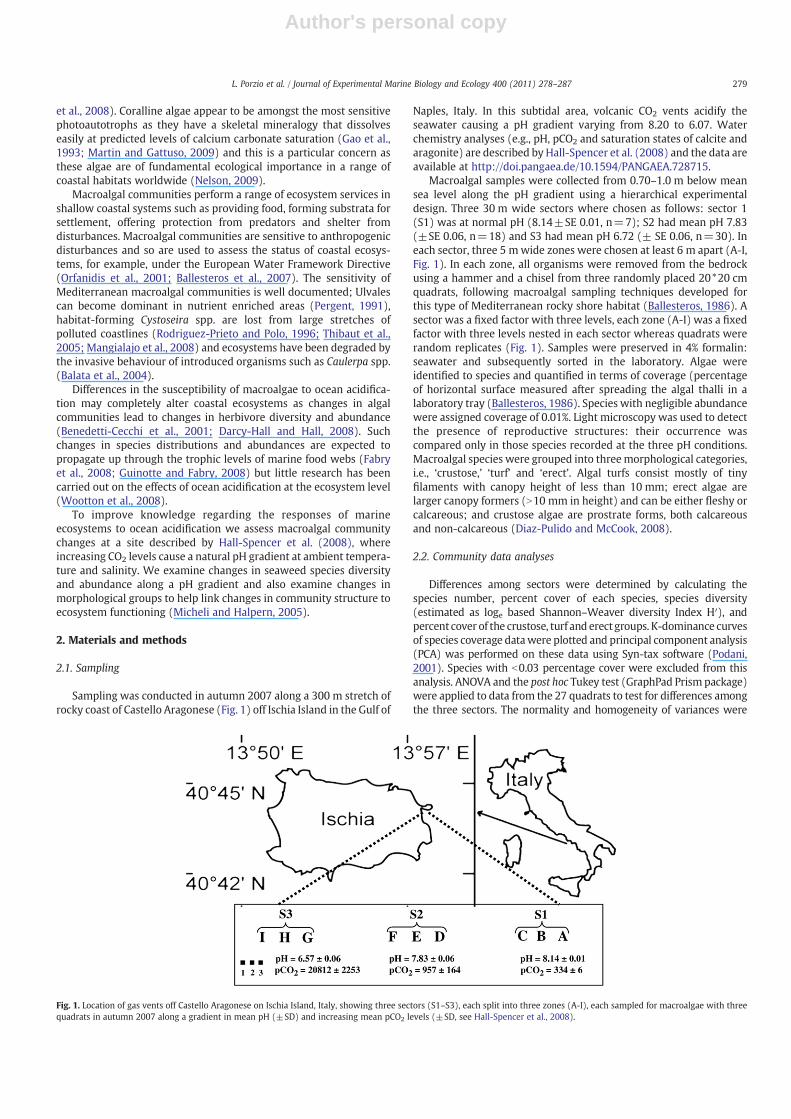
Sampling was conducted in autumn 2007 along a 300 m stretch ofrocky coast of Castello Aragonese (Fig. 1) off Ischia Island in the Gulf of
Naples, Italy. In this subtidal area, volcanic CO2 vents acidify theseawater causing a pH gradient varying from 8.20 to 6.07. Waterchemistry analyses (e.g., pH, pCO2 and saturation states of calcite andaragonite) are described by Hall-Spencer et al. (2008) and the data areavailable at http://doi.pangaea.de/10.1594/PANGAEA.728715.
Macroalgal samples were collected from 0.70–1.0 m below meansea level along the pH gradient using a hierarchical experimentaldesign. Three 30 m wide sectors where chosen as follows: sector 1(S1) was at normal pH (8.14±SE 0.01, n=7); S2 had mean pH 7.83(±SE 0.06, n=18) and S3 had mean pH 6.72 (± SE 0.06, n=30). Ineach sector, three 5 mwide zones were chosen at least 6 m apart (A-I,Fig. 1). In each zone, all organisms were removed from the bedrockusing a hammer and a chisel from three randomly placed 20*20 cmquadrats, following macroalgal sampling techniques developed forthis type of Mediterranean rocky shore habitat (Ballesteros, 1986). Asector was a fixed factor with three levels, each zone (A-I) was a fixedfactor with three levels nested in each sector whereas quadrats wererandom replicates (Fig. 1). Samples were preserved in 4% formalin:seawater and subsequently sorted in the laboratory. Algae wereidentified to species and quantified in terms of coverage (percentageof horizontal surface measured after spreading the algal thalli in alaboratory tray (Ballesteros, 1986). Species with negligible abundancewere assigned coverage of 0.01%. Light microscopy was used to detectthe presence of reproductive structures: their occurrence wascompared only in those species recorded at the three pH conditions.Macroalgal species were grouped into threemorphological categories,i.e., ‘crustose,’ ‘turf’ and ‘erect’. Algal turfs consist mostly of tinyfilaments with canopy height of less than 10 mm; erect algae arelarger canopy formers (N10 mm in height) and can be either fleshy orcalcareous; and crustose algae are prostrate forms, both calcareousand non-calcareous (Diaz-Pulido and McCook, 2008).
2.2. Community data analyses
Differences among sectors were determined by calculating thespecies number, percent cover of each species, species diversity(estimated as loge based Shannon–Weaver diversity Index H′), andpercent cover of the crustose, turf and erect groups. K-dominance curvesof species coverage datawere plotted and principal component analysis(PCA) was performed on these data using Syn-tax software (Podani,2001). Species with b0.03 percentage cover were excluded from thisanalysis. ANOVA and the post hoc Tukey test (GraphPad Prism package)were applied to data from the 27 quadrats to test for differences amongthe three sectors. The normality and homogeneity of variances were
Fig. 1. Location of gas vents off Castello Aragonese on Ischia Island, Italy, showing three sectors (S1–S3), each split into three zones (A-I), each sampled for macroalgae with threequadrats in autumn 2007 along a gradient in mean pH (±SD) and increasing mean pCO2 levels (±SD, see Hall-Spencer et al., 2008).
279L. Porzio et al. / Journal of Experimental Marine Biology and Ecology 400 (2011) 278–287
Author's personal copy
always tested;when notmet, datawere log-transformed. Differences incommunity composition among sectors were evaluated by means ofsimilarity analysis (ANOSIM). For samples found to be significantly
different using ANOSIM, SIMPER was used to determine which speciescontributed most to the differences between samples. This programcalculates the average similarity between all pairings of each replicatewithin a treatment to the replicates in another treatment and tabulatesthe average percent contribution of each species to the dissimilarityobserved between the treatments. Community structure based on algalcategories was examined by multivariate analysis (nMDS). K-domi-nance, ANOSIM, SIMPER and nMDS analyses were performed withPRIMER 5 (Clarke and Warwick, 2001).
3. Results
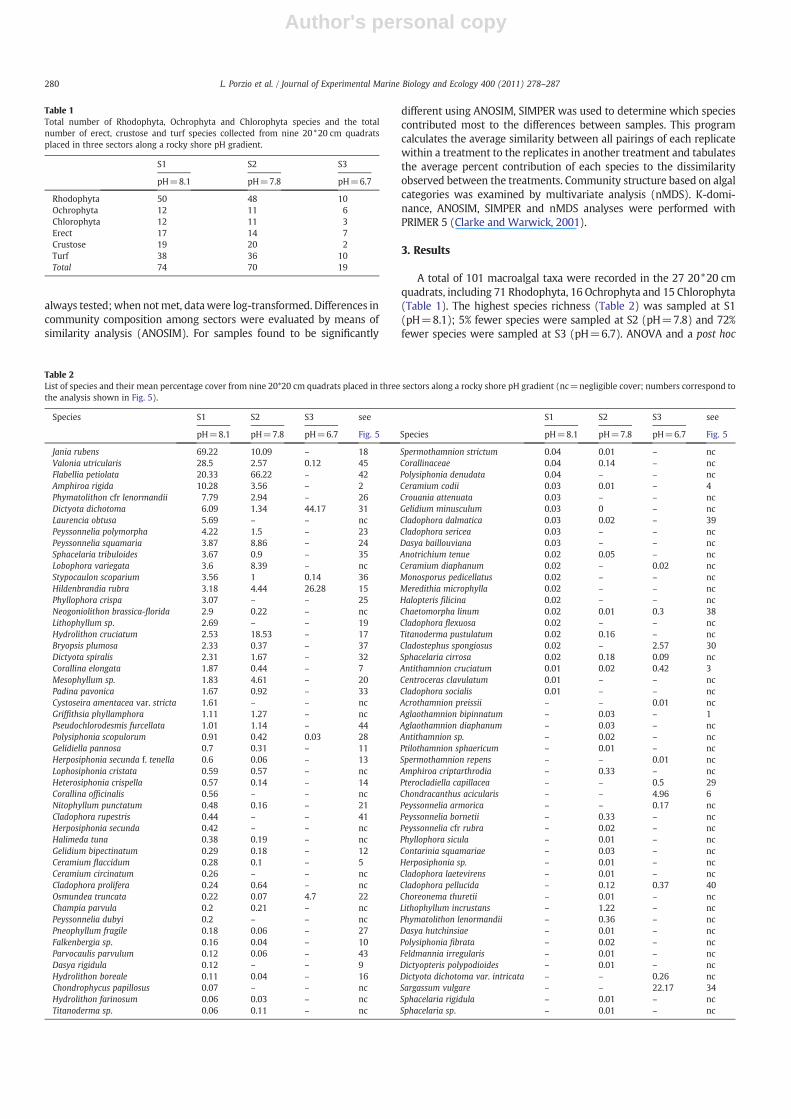
A total of 101 macroalgal taxa were recorded in the 27 20*20 cmquadrats, including 71 Rhodophyta, 16 Ochrophyta and 15 Chlorophyta(Table 1). The highest species richness (Table 2) was sampled at S1(pH=8.1); 5% fewer species were sampled at S2 (pH=7.8) and 72%fewer species were sampled at S3 (pH=6.7). ANOVA and a post hoc
Table 1Total number of Rhodophyta, Ochrophyta and Chlorophyta species and the totalnumber of erect, crustose and turf species collected from nine 20*20 cm quadratsplaced in three sectors along a rocky shore pH gradient.
S1 S2 S3
pH=8.1 pH=7.8 pH=6.7
Rhodophyta 50 48 10Ochrophyta 12 11 6Chlorophyta 12 11 3Erect 17 14 7Crustose 19 20 2Turf 38 36 10Total 74 70 19
Table 2List of species and their mean percentage cover from nine 20*20 cm quadrats placed in three sectors along a rocky shore pH gradient (nc=negligible cover; numbers correspond tothe analysis shown in Fig. 5).
Species S1 S2 S3 see S1 S2 S3 see
pH=8.1 pH=7.8 pH=6.7 Fig. 5 Species pH=8.1 pH=7.8 pH=6.7 Fig. 5
Jania rubens 69.22 10.09 – 18 Spermothamnion strictum 0.04 0.01 – ncValonia utricularis 28.5 2.57 0.12 45 Corallinaceae 0.04 0.14 – ncFlabellia petiolata 20.33 66.22 – 42 Polysiphonia denudata 0.04 – – ncAmphiroa rigida 10.28 3.56 – 2 Ceramium codii 0.03 0.01 – 4Phymatolithon cfr lenormandii 7.79 2.94 – 26 Crouania attenuata 0.03 – – ncDictyota dichotoma 6.09 1.34 44.17 31 Gelidium minusculum 0.03 0 – ncLaurencia obtusa 5.69 – – nc Cladophora dalmatica 0.03 0.02 – 39Peyssonnelia polymorpha 4.22 1.5 – 23 Cladophora sericea 0.03 – – ncPeyssonnelia squamaria 3.87 8.86 – 24 Dasya baillouviana 0.03 – – ncSphacelaria tribuloides 3.67 0.9 – 35 Anotrichium tenue 0.02 0.05 – ncLobophora variegata 3.6 8.39 – nc Ceramium diaphanum 0.02 – 0.02 ncStypocaulon scoparium 3.56 1 0.14 36 Monosporus pedicellatus 0.02 – – ncHildenbrandia rubra 3.18 4.44 26.28 15 Meredithia microphylla 0.02 – – ncPhyllophora crispa 3.07 – – 25 Halopteris filicina 0.02 – – ncNeogoniolithon brassica-florida 2.9 0.22 – nc Chaetomorpha linum 0.02 0.01 0.3 38Lithophyllum sp. 2.69 – – 19 Cladophora flexuosa 0.02 – – ncHydrolithon cruciatum 2.53 18.53 – 17 Titanoderma pustulatum 0.02 0.16 – ncBryopsis plumosa 2.33 0.37 – 37 Cladostephus spongiosus 0.02 – 2.57 30Dictyota spiralis 2.31 1.67 – 32 Sphacelaria cirrosa 0.02 0.18 0.09 ncCorallina elongata 1.87 0.44 – 7 Antithamnion cruciatum 0.01 0.02 0.42 3Mesophyllum sp. 1.83 4.61 – 20 Centroceras clavulatum 0.01 – – ncPadina pavonica 1.67 0.92 – 33 Cladophora socialis 0.01 – – ncCystoseira amentacea var. stricta 1.61 – – nc Acrothamnion preissii – – 0.01 ncGriffithsia phyllamphora 1.11 1.27 – nc Aglaothamnion bipinnatum – 0.03 – 1Pseudochlorodesmis furcellata 1.01 1.14 – 44 Aglaothamnion diaphanum – 0.03 – ncPolysiphonia scopulorum 0.91 0.42 0.03 28 Antithamnion sp. – 0.02 – ncGelidiella pannosa 0.7 0.31 – 11 Ptilothamnion sphaericum – 0.01 – ncHerposiphonia secunda f. tenella 0.6 0.06 – 13 Spermothamnion repens – – 0.01 ncLophosiphonia cristata 0.59 0.57 – nc Amphiroa criptarthrodia – 0.33 – ncHeterosiphonia crispella 0.57 0.14 – 14 Pterocladiella capillacea – – 0.5 29Corallina officinalis 0.56 – – nc Chondracanthus acicularis – – 4.96 6Nitophyllum punctatum 0.48 0.16 – 21 Peyssonnelia armorica – – 0.17 ncCladophora rupestris 0.44 – – 41 Peyssonnelia bornetii – 0.33 – ncHerposiphonia secunda 0.42 – – nc Peyssonnelia cfr rubra – 0.02 – ncHalimeda tuna 0.38 0.19 – nc Phyllophora sicula – 0.01 – ncGelidium bipectinatum 0.29 0.18 – 12 Contarinia squamariae – 0.03 – ncCeramium flaccidum 0.28 0.1 – 5 Herposiphonia sp. – 0.01 – ncCeramium circinatum 0.26 – – nc Cladophora laetevirens – 0.01 – ncCladophora prolifera 0.24 0.64 – nc Cladophora pellucida – 0.12 0.37 40Osmundea truncata 0.22 0.07 4.7 22 Choreonema thuretii – 0.01 – ncChampia parvula 0.2 0.21 – nc Lithophyllum incrustans – 1.22 – ncPeyssonnelia dubyi 0.2 – – nc Phymatolithon lenormandii – 0.36 – ncPneophyllum fragile 0.18 0.06 – 27 Dasya hutchinsiae – 0.01 – ncFalkenbergia sp. 0.16 0.04 – 10 Polysiphonia fibrata – 0.02 – ncParvocaulis parvulum 0.12 0.06 – 43 Feldmannia irregularis – 0.01 – ncDasya rigidula 0.12 – – 9 Dictyopteris polypodioides – 0.01 – ncHydrolithon boreale 0.11 0.04 – 16 Dictyota dichotoma var. intricata – – 0.26 ncChondrophycus papillosus 0.07 – – nc Sargassum vulgare – – 22.17 34Hydrolithon farinosum 0.06 0.03 – nc Sphacelaria rigidula – 0.01 – ncTitanoderma sp. 0.06 0.11 – nc Sphacelaria sp. – 0.01 – nc
280 L. Porzio et al. / Journal of Experimental Marine Biology and Ecology 400 (2011) 278–287
Author's personal copy
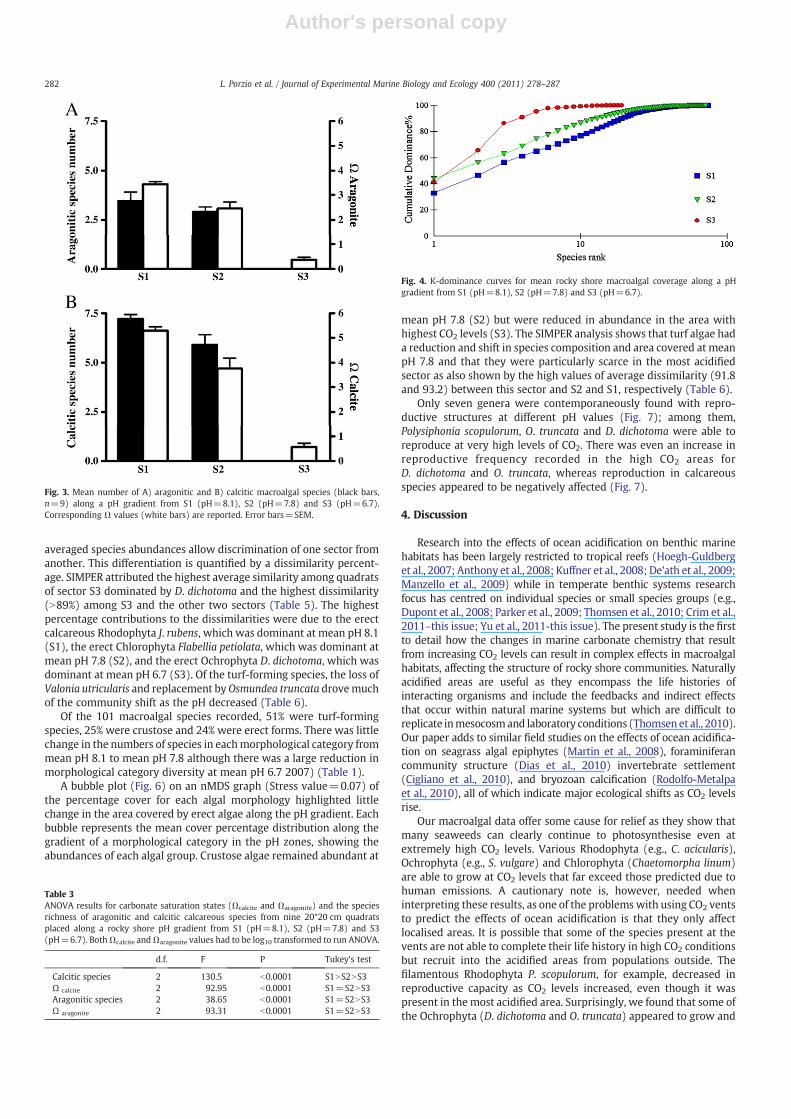
Tukey test showed highly significant reductions in species diversity (H′)as CO2 levels increased ( H′S1=2.29±0.07; H′S2=1.88±0.07 andH′S3=1.18±0.05, respectively) (F=25.62; pb0.0001, and S1NS2NS3).
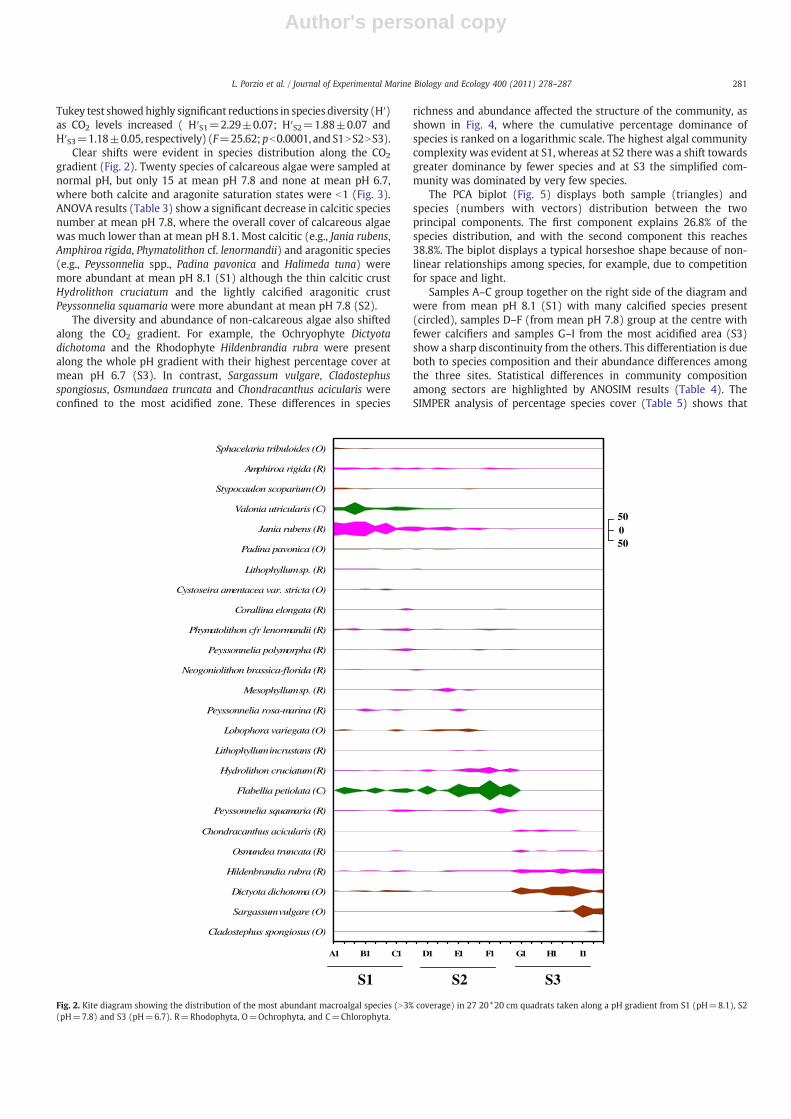
Clear shifts were evident in species distribution along the CO2
gradient (Fig. 2). Twenty species of calcareous algae were sampled atnormal pH, but only 15 at mean pH 7.8 and none at mean pH 6.7,where both calcite and aragonite saturation states were b1 (Fig. 3).ANOVA results (Table 3) show a significant decrease in calcitic speciesnumber at mean pH 7.8, where the overall cover of calcareous algaewas much lower than at mean pH 8.1. Most calcitic (e.g., Jania rubens,Amphiroa rigida, Phymatolithon cf. lenormandii) and aragonitic species(e.g., Peyssonnelia spp., Padina pavonica and Halimeda tuna) weremore abundant at mean pH 8.1 (S1) although the thin calcitic crustHydrolithon cruciatum and the lightly calcified aragonitic crustPeyssonnelia squamaria were more abundant at mean pH 7.8 (S2).
The diversity and abundance of non-calcareous algae also shiftedalong the CO2 gradient. For example, the Ochryophyte Dictyotadichotoma and the Rhodophyte Hildenbrandia rubra were presentalong the whole pH gradient with their highest percentage cover atmean pH 6.7 (S3). In contrast, Sargassum vulgare, Cladostephusspongiosus, Osmundaea truncata and Chondracanthus acicularis wereconfined to the most acidified zone. These differences in species
richness and abundance affected the structure of the community, asshown in Fig. 4, where the cumulative percentage dominance ofspecies is ranked on a logarithmic scale. The highest algal communitycomplexity was evident at S1, whereas at S2 there was a shift towardsgreater dominance by fewer species and at S3 the simplified com-munity was dominated by very few species.
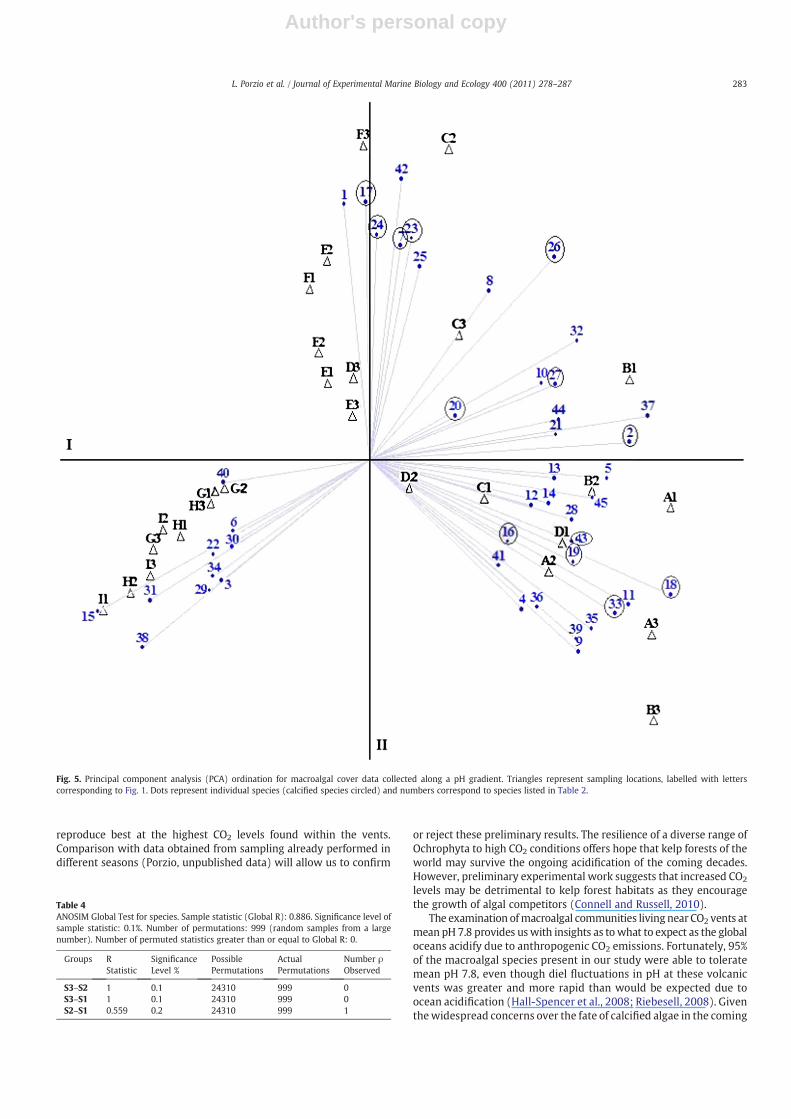
The PCA biplot (Fig. 5) displays both sample (triangles) andspecies (numbers with vectors) distribution between the twoprincipal components. The first component explains 26.8% of thespecies distribution, and with the second component this reaches38.8%. The biplot displays a typical horseshoe shape because of non-linear relationships among species, for example, due to competitionfor space and light.
Samples A–C group together on the right side of the diagram andwere from mean pH 8.1 (S1) with many calcified species present(circled), samples D–F (from mean pH 7.8) group at the centre withfewer calcifiers and samples G–I from the most acidified area (S3)show a sharp discontinuity from the others. This differentiation is dueboth to species composition and their abundance differences amongthe three sites. Statistical differences in community compositionamong sectors are highlighted by ANOSIM results (Table 4). TheSIMPER analysis of percentage species cover (Table 5) shows that
Sphacelaria tribuloides (O)
Amphiroa rigida (R)
Stypocaulon scoparium (O)
Valonia utricularis (C)
Jania rubens (R)
Padina pavonica (O)
Lithophyllum sp. (R)
Cystoseira amentacea var. stricta (O)
Corallina elongata (R)
Phymatolithon cfr lenormandii (R)
Peyssonnelia polymorpha (R)
Neogoniolithon brassica-florida (R)
Mesophyllum sp. (R)
Peyssonnelia rosa-marina (R)
Lobophora variegata (O)
Lithophyllum incrustans (R)
Hydrolithon cruciatum (R)
Flabellia petiolata (C)
Peyssonnelia squamaria (R)
Chondracanthus acicularis (R)
Osmundea truncata (R)
Hildenbrandia rubra (R)
Dictyota dichotoma (O)
Sargassum vulgare (O)
Cladostephus spongiosus (O)
A1 B1 C1 D1 E1 F1 G1 H1 I1
50
500
S1 S3S2
Fig. 2. Kite diagram showing the distribution of the most abundant macroalgal species (N3% coverage) in 27 20*20 cm quadrats taken along a pH gradient from S1 (pH=8.1), S2(pH=7.8) and S3 (pH=6.7). R=Rhodophyta, O=Ochrophyta, and C=Chlorophyta.
281L. Porzio et al. / Journal of Experimental Marine Biology and Ecology 400 (2011) 278–287
Author's personal copy
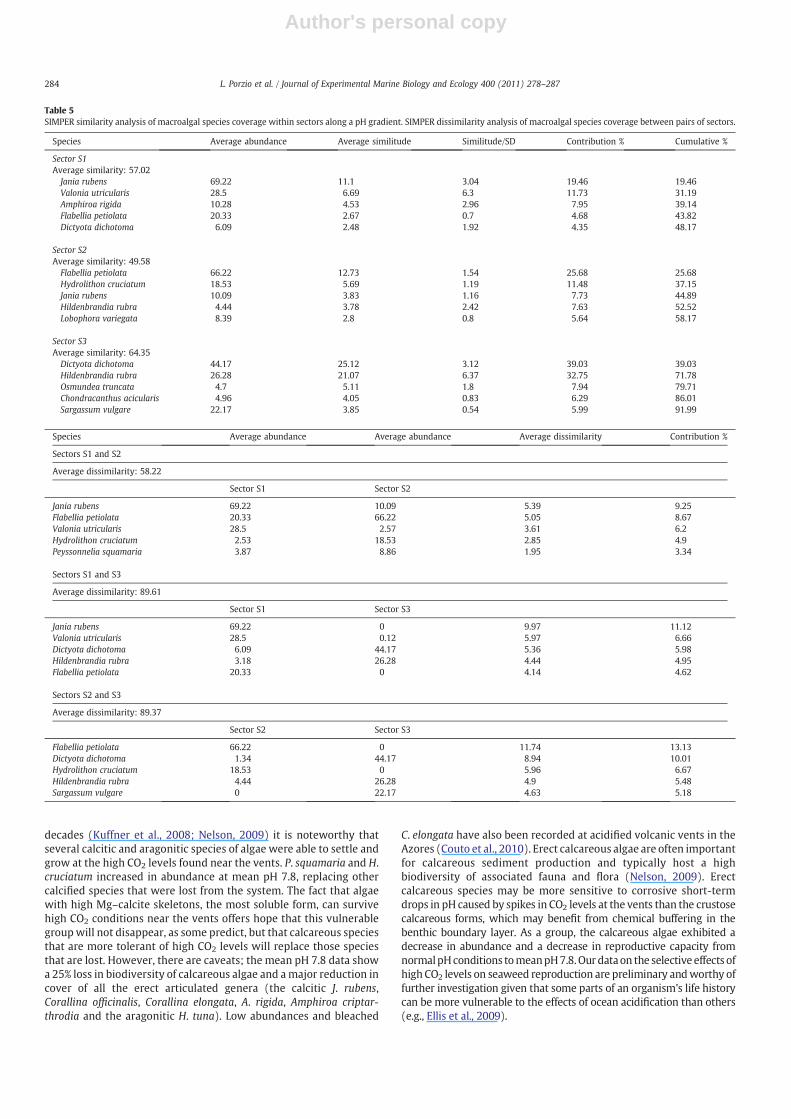
averaged species abundances allow discrimination of one sector fromanother. This differentiation is quantified by a dissimilarity percent-age. SIMPER attributed the highest average similarity among quadratsof sector S3 dominated by D. dichotoma and the highest dissimilarity(N89%) among S3 and the other two sectors (Table 5). The highestpercentage contributions to the dissimilarities were due to the erectcalcareous Rhodophyta J. rubens, which was dominant at mean pH 8.1(S1), the erect Chlorophyta Flabellia petiolata, which was dominant atmean pH 7.8 (S2), and the erect Ochrophyta D. dichotoma, which wasdominant at mean pH 6.7 (S3). Of the turf-forming species, the loss ofValonia utricularis and replacement by Osmundea truncata drovemuchof the community shift as the pH decreased (Table 6).
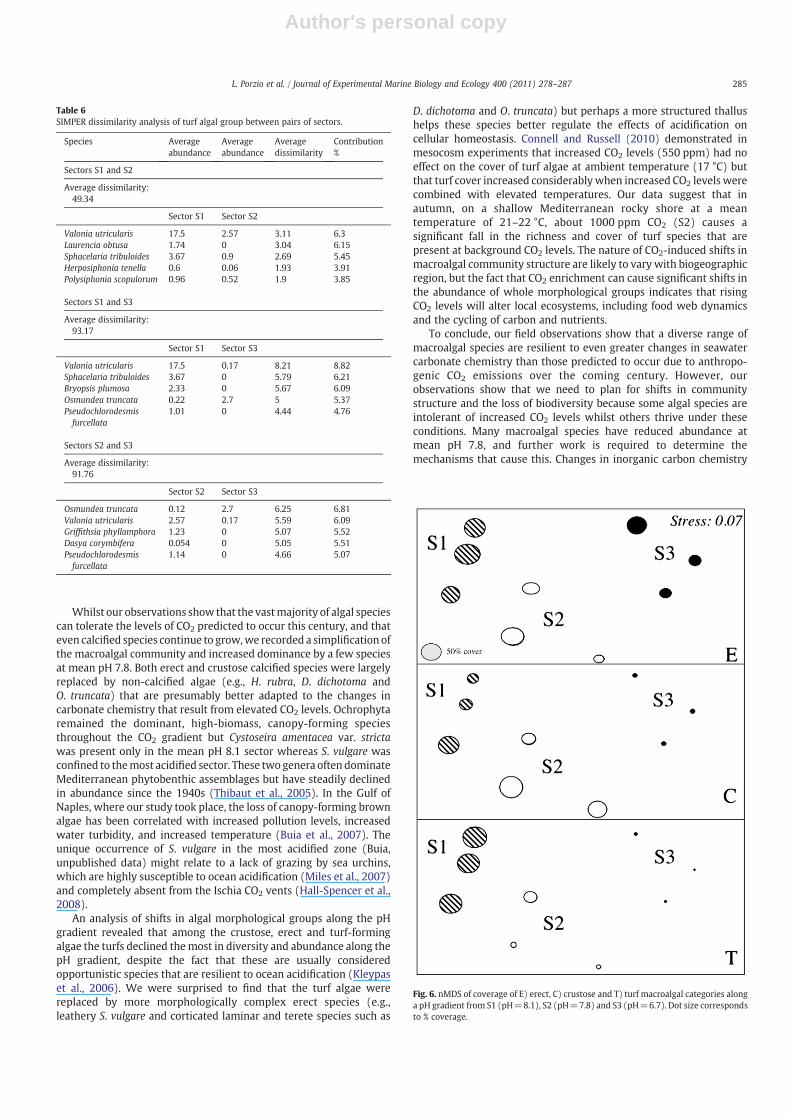
Of the 101 macroalgal species recorded, 51% were turf-formingspecies, 25% were crustose and 24% were erect forms. There was littlechange in the numbers of species in eachmorphological category frommean pH 8.1 to mean pH 7.8 although there was a large reduction inmorphological category diversity at mean pH 6.7 2007) (Table 1).
A bubble plot (Fig. 6) on an nMDS graph (Stress value=0.07) ofthe percentage cover for each algal morphology highlighted littlechange in the area covered by erect algae along the pH gradient. Eachbubble represents the mean cover percentage distribution along thegradient of a morphological category in the pH zones, showing theabundances of each algal group. Crustose algae remained abundant at
mean pH 7.8 (S2) but were reduced in abundance in the area withhighest CO2 levels (S3). The SIMPER analysis shows that turf algae hada reduction and shift in species composition and area covered at meanpH 7.8 and that they were particularly scarce in the most acidifiedsector as also shown by the high values of average dissimilarity (91.8and 93.2) between this sector and S2 and S1, respectively (Table 6).
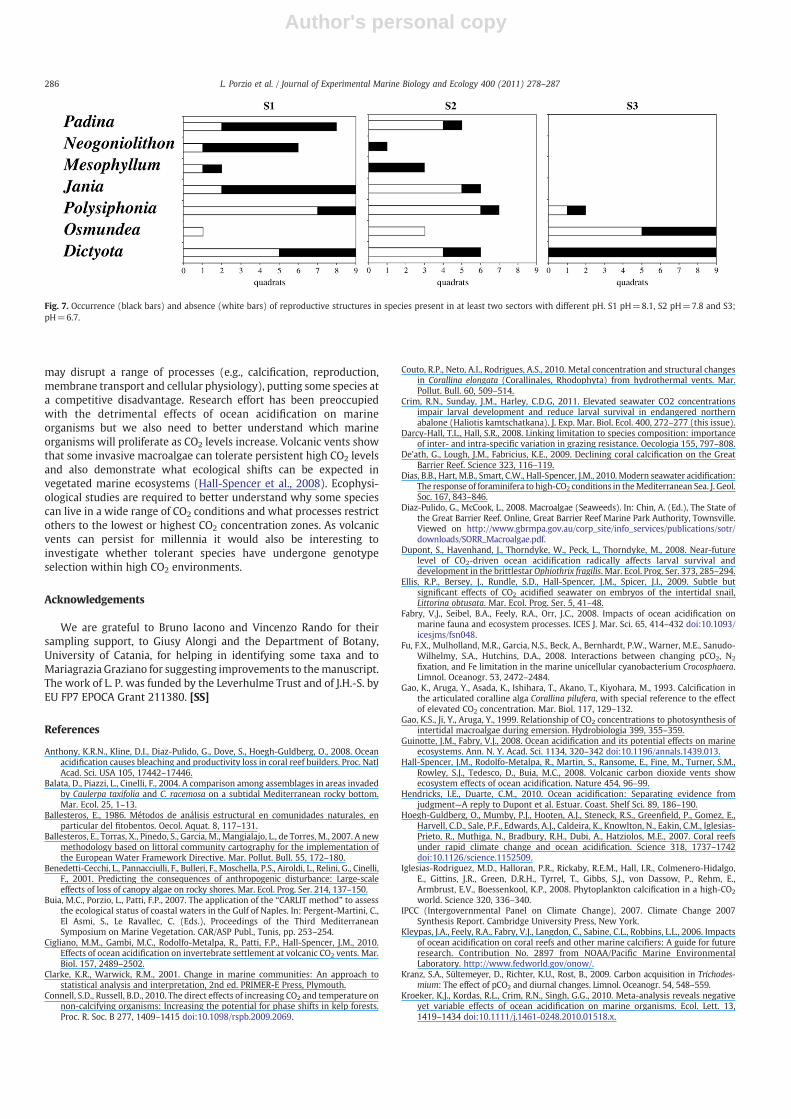
Only seven genera were contemporaneously found with repro-ductive structures at different pH values (Fig. 7); among them,Polysiphonia scopulorum, O. truncata and D. dichotoma were able toreproduce at very high levels of CO2. There was even an increase inreproductive frequency recorded in the high CO2 areas forD. dichotoma and O. truncata, whereas reproduction in calcareousspecies appeared to be negatively affected (Fig. 7).
4. Discussion
Research into the effects of ocean acidification on benthic marinehabitats has been largely restricted to tropical reefs (Hoegh-Guldberget al., 2007; Anthony et al., 2008; Kuffner et al., 2008; De'ath et al., 2009;Manzello et al., 2009) while in temperate benthic systems researchfocus has centred on individual species or small species groups (e.g.,Dupont et al., 2008; Parker et al., 2009; Thomsen et al., 2010; Crim et al.,2011–this issue; Yu et al., 2011-this issue). The present study is the firstto detail how the changes in marine carbonate chemistry that resultfrom increasing CO2 levels can result in complex effects in macroalgalhabitats, affecting the structure of rocky shore communities. Naturallyacidified areas are useful as they encompass the life histories ofinteracting organisms and include the feedbacks and indirect effectsthat occur within natural marine systems but which are difficult toreplicate inmesocosmand laboratory conditions (Thomsenet al., 2010).Our paper adds to similar field studies on the effects of ocean acidifica-tion on seagrass algal epiphytes (Martin et al., 2008), foraminiferancommunity structure (Dias et al., 2010) invertebrate settlement(Cigliano et al., 2010), and bryozoan calcification (Rodolfo-Metalpaet al., 2010), all of which indicate major ecological shifts as CO2 levelsrise.
Our macroalgal data offer some cause for relief as they show thatmany seaweeds can clearly continue to photosynthesise even atextremely high CO2 levels. Various Rhodophyta (e.g., C. acicularis),Ochrophyta (e.g., S. vulgare) and Chlorophyta (Chaetomorpha linum)are able to grow at CO2 levels that far exceed those predicted due tohuman emissions. A cautionary note is, however, needed wheninterpreting these results, as one of the problemswith using CO2 ventsto predict the effects of ocean acidification is that they only affectlocalised areas. It is possible that some of the species present at thevents are not able to complete their life history in high CO2 conditionsbut recruit into the acidified areas from populations outside. Thefilamentous Rhodophyta P. scopulorum, for example, decreased inreproductive capacity as CO2 levels increased, even though it waspresent in the most acidified area. Surprisingly, we found that some ofthe Ochrophyta (D. dichotoma and O. truncata) appeared to grow and
Fig. 4. K-dominance curves for mean rocky shore macroalgal coverage along a pHgradient from S1 (pH=8.1), S2 (pH=7.8) and S3 (pH=6.7).
Table 3ANOVA results for carbonate saturation states (Ωcalcite and Ωaragonite) and the speciesrichness of aragonitic and calcitic calcareous species from nine 20*20 cm quadratsplaced along a rocky shore pH gradient from S1 (pH=8.1), S2 (pH=7.8) and S3(pH=6.7). BothΩcalcite andΩaragonite values had to be log10 transformed to run ANOVA.
d.f. F P Tukey's test
Calcitic species 2 130.5 b0.0001 S1NS2NS3Ω calcite 2 92.95 b0.0001 S1=S2NS3Aragonitic species 2 38.65 b0.0001 S1=S2NS3Ω aragonite 2 93.31 b0.0001 S1=S2NS3
Fig. 3. Mean number of A) aragonitic and B) calcitic macroalgal species (black bars,n=9) along a pH gradient from S1 (pH=8.1), S2 (pH=7.8) and S3 (pH=6.7).Corresponding Ω values (white bars) are reported. Error bars=SEM.
282 L. Porzio et al. / Journal of Experimental Marine Biology and Ecology 400 (2011) 278–287
Author's personal copy
reproduce best at the highest CO2 levels found within the vents.Comparison with data obtained from sampling already performed indifferent seasons (Porzio, unpublished data) will allow us to confirm
or reject these preliminary results. The resilience of a diverse range ofOchrophyta to high CO2 conditions offers hope that kelp forests of theworld may survive the ongoing acidification of the coming decades.However, preliminary experimental work suggests that increased CO2
levels may be detrimental to kelp forest habitats as they encouragethe growth of algal competitors (Connell and Russell, 2010).
The examination ofmacroalgal communities living near CO2 vents atmean pH 7.8 provides uswith insights as towhat to expect as the globaloceans acidify due to anthropogenic CO2 emissions. Fortunately, 95%of the macroalgal species present in our study were able to toleratemean pH 7.8, even though diel fluctuations in pH at these volcanicvents was greater and more rapid than would be expected due toocean acidification (Hall-Spencer et al., 2008; Riebesell, 2008). Giventhewidespread concerns over the fate of calcified algae in the coming
Fig. 5. Principal component analysis (PCA) ordination for macroalgal cover data collected along a pH gradient. Triangles represent sampling locations, labelled with letterscorresponding to Fig. 1. Dots represent individual species (calcified species circled) and numbers correspond to species listed in Table 2.
Table 4ANOSIM Global Test for species. Sample statistic (Global R): 0.886. Significance level ofsample statistic: 0.1%. Number of permutations: 999 (random samples from a largenumber). Number of permuted statistics greater than or equal to Global R: 0.
Groups R Significance Possible Actual Number ρStatistic Level % Permutations Permutations Observed
S3–S2 1 0.1 24310 999 0S3–S1 1 0.1 24310 999 0S2–S1 0.559 0.2 24310 999 1
283L. Porzio et al. / Journal of Experimental Marine Biology and Ecology 400 (2011) 278–287
Author's personal copy
decades (Kuffner et al., 2008; Nelson, 2009) it is noteworthy thatseveral calcitic and aragonitic species of algae were able to settle andgrow at the high CO2 levels found near the vents. P. squamaria and H.cruciatum increased in abundance at mean pH 7.8, replacing othercalcified species that were lost from the system. The fact that algaewith high Mg–calcite skeletons, the most soluble form, can survivehigh CO2 conditions near the vents offers hope that this vulnerablegroupwill not disappear, as some predict, but that calcareous speciesthat are more tolerant of high CO2 levels will replace those speciesthat are lost. However, there are caveats; the mean pH 7.8 data showa 25% loss in biodiversity of calcareous algae and amajor reduction incover of all the erect articulated genera (the calcitic J. rubens,Corallina officinalis, Corallina elongata, A. rigida, Amphiroa criptar-throdia and the aragonitic H. tuna). Low abundances and bleached
C. elongata have also been recorded at acidified volcanic vents in theAzores (Couto et al., 2010). Erect calcareous algae are often importantfor calcareous sediment production and typically host a highbiodiversity of associated fauna and flora (Nelson, 2009). Erectcalcareous species may be more sensitive to corrosive short-termdrops in pH caused by spikes in CO2 levels at the vents than the crustosecalcareous forms, which may benefit from chemical buffering in thebenthic boundary layer. As a group, the calcareous algae exhibited adecrease in abundance and a decrease in reproductive capacity fromnormalpHconditions tomeanpH7.8.Our dataon the selective effects ofhigh CO2 levels on seaweed reproduction are preliminary andworthy offurther investigation given that some parts of an organism's life historycan be more vulnerable to the effects of ocean acidification than others(e.g., Ellis et al., 2009).
Table 5SIMPER similarity analysis of macroalgal species coverage within sectors along a pH gradient. SIMPER dissimilarity analysis of macroalgal species coverage between pairs of sectors.
Species Average abundance Average similitude Similitude/SD Contribution % Cumulative %
Sector S1Average similarity: 57.02Jania rubens 69.22 11.1 3.04 19.46 19.46Valonia utricularis 28.5 6.69 6.3 11.73 31.19Amphiroa rigida 10.28 4.53 2.96 7.95 39.14Flabellia petiolata 20.33 2.67 0.7 4.68 43.82Dictyota dichotoma 6.09 2.48 1.92 4.35 48.17
Sector S2Average similarity: 49.58Flabellia petiolata 66.22 12.73 1.54 25.68 25.68Hydrolithon cruciatum 18.53 5.69 1.19 11.48 37.15Jania rubens 10.09 3.83 1.16 7.73 44.89Hildenbrandia rubra 4.44 3.78 2.42 7.63 52.52Lobophora variegata 8.39 2.8 0.8 5.64 58.17
Sector S3Average similarity: 64.35Dictyota dichotoma 44.17 25.12 3.12 39.03 39.03Hildenbrandia rubra 26.28 21.07 6.37 32.75 71.78Osmundea truncata 4.7 5.11 1.8 7.94 79.71Chondracanthus acicularis 4.96 4.05 0.83 6.29 86.01Sargassum vulgare 22.17 3.85 0.54 5.99 91.99
Species Average abundance Average abundance Average dissimilarity Contribution %
Sectors S1 and S2
Average dissimilarity: 58.22
Sector S1 Sector S2
Jania rubens 69.22 10.09 5.39 9.25Flabellia petiolata 20.33 66.22 5.05 8.67Valonia utricularis 28.5 2.57 3.61 6.2Hydrolithon cruciatum 2.53 18.53 2.85 4.9Peyssonnelia squamaria 3.87 8.86 1.95 3.34
Sectors S1 and S3
Average dissimilarity: 89.61
Sector S1 Sector S3
Jania rubens 69.22 0 9.97 11.12Valonia utricularis 28.5 0.12 5.97 6.66Dictyota dichotoma 6.09 44.17 5.36 5.98Hildenbrandia rubra 3.18 26.28 4.44 4.95Flabellia petiolata 20.33 0 4.14 4.62
Sectors S2 and S3
Average dissimilarity: 89.37
Sector S2 Sector S3
Flabellia petiolata 66.22 0 11.74 13.13Dictyota dichotoma 1.34 44.17 8.94 10.01Hydrolithon cruciatum 18.53 0 5.96 6.67Hildenbrandia rubra 4.44 26.28 4.9 5.48Sargassum vulgare 0 22.17 4.63 5.18
284 L. Porzio et al. / Journal of Experimental Marine Biology and Ecology 400 (2011) 278–287
Author's personal copy
Whilst our observations show that the vastmajority of algal speciescan tolerate the levels of CO2 predicted to occur this century, and thateven calcified species continue to grow,we recorded a simplification ofthe macroalgal community and increased dominance by a few speciesat mean pH 7.8. Both erect and crustose calcified species were largelyreplaced by non-calcified algae (e.g., H. rubra, D. dichotoma andO. truncata) that are presumably better adapted to the changes incarbonate chemistry that result from elevated CO2 levels. Ochrophytaremained the dominant, high-biomass, canopy-forming speciesthroughout the CO2 gradient but Cystoseira amentacea var. strictawas present only in the mean pH 8.1 sector whereas S. vulgare wasconfined to themost acidified sector. These two genera often dominateMediterranean phytobenthic assemblages but have steadily declinedin abundance since the 1940s (Thibaut et al., 2005). In the Gulf ofNaples, where our study took place, the loss of canopy-forming brownalgae has been correlated with increased pollution levels, increasedwater turbidity, and increased temperature (Buia et al., 2007). Theunique occurrence of S. vulgare in the most acidified zone (Buia,unpublished data) might relate to a lack of grazing by sea urchins,which are highly susceptible to ocean acidification (Miles et al., 2007)and completely absent from the Ischia CO2 vents (Hall-Spencer et al.,2008).
An analysis of shifts in algal morphological groups along the pHgradient revealed that among the crustose, erect and turf-formingalgae the turfs declined themost in diversity and abundance along thepH gradient, despite the fact that these are usually consideredopportunistic species that are resilient to ocean acidification (Kleypaset al., 2006). We were surprised to find that the turf algae werereplaced by more morphologically complex erect species (e.g.,leathery S. vulgare and corticated laminar and terete species such as
D. dichotoma and O. truncata) but perhaps a more structured thallushelps these species better regulate the effects of acidification oncellular homeostasis. Connell and Russell (2010) demonstrated inmesocosm experiments that increased CO2 levels (550 ppm) had noeffect on the cover of turf algae at ambient temperature (17 °C) butthat turf cover increased considerablywhen increased CO2 levels werecombined with elevated temperatures. Our data suggest that inautumn, on a shallow Mediterranean rocky shore at a meantemperature of 21–22 °C, about 1000 ppm CO2 (S2) causes asignificant fall in the richness and cover of turf species that arepresent at background CO2 levels. The nature of CO2-induced shifts inmacroalgal community structure are likely to vary with biogeographicregion, but the fact that CO2 enrichment can cause significant shifts inthe abundance of whole morphological groups indicates that risingCO2 levels will alter local ecosystems, including food web dynamicsand the cycling of carbon and nutrients.
To conclude, our field observations show that a diverse range ofmacroalgal species are resilient to even greater changes in seawatercarbonate chemistry than those predicted to occur due to anthropo-genic CO2 emissions over the coming century. However, ourobservations show that we need to plan for shifts in communitystructure and the loss of biodiversity because some algal species areintolerant of increased CO2 levels whilst others thrive under theseconditions. Many macroalgal species have reduced abundance atmean pH 7.8, and further work is required to determine themechanisms that cause this. Changes in inorganic carbon chemistry
Fig. 6. nMDS of coverage of E) erect, C) crustose and T) turf macroalgal categories alonga pH gradient from S1 (pH=8.1), S2 (pH=7.8) and S3 (pH=6.7). Dot size correspondsto % coverage.
Table 6SIMPER dissimilarity analysis of turf algal group between pairs of sectors.
Species Averageabundance
Averageabundance
Averagedissimilarity
Contribution%
Sectors S1 and S2
Average dissimilarity:49.34
Sector S1 Sector S2
Valonia utricularis 17.5 2.57 3.11 6.3Laurencia obtusa 1.74 0 3.04 6.15Sphacelaria tribuloides 3.67 0.9 2.69 5.45Herposiphonia tenella 0.6 0.06 1.93 3.91Polysiphonia scopulorum 0.96 0.52 1.9 3.85
Sectors S1 and S3
Average dissimilarity:93.17
Sector S1 Sector S3
Valonia utricularis 17.5 0.17 8.21 8.82Sphacelaria tribuloides 3.67 0 5.79 6.21Bryopsis plumosa 2.33 0 5.67 6.09Osmundea truncata 0.22 2.7 5 5.37Pseudochlorodesmisfurcellata
1.01 0 4.44 4.76
Sectors S2 and S3
Average dissimilarity:91.76
Sector S2 Sector S3
Osmundea truncata 0.12 2.7 6.25 6.81Valonia utricularis 2.57 0.17 5.59 6.09Griffithsia phyllamphora 1.23 0 5.07 5.52Dasya corymbifera 0.054 0 5.05 5.51Pseudochlorodesmisfurcellata
1.14 0 4.66 5.07
285L. Porzio et al. / Journal of Experimental Marine Biology and Ecology 400 (2011) 278–287
Author's personal copy
may disrupt a range of processes (e.g., calcification, reproduction,membrane transport and cellular physiology), putting some species ata competitive disadvantage. Research effort has been preoccupiedwith the detrimental effects of ocean acidification on marineorganisms but we also need to better understand which marineorganisms will proliferate as CO2 levels increase. Volcanic vents showthat some invasive macroalgae can tolerate persistent high CO2 levelsand also demonstrate what ecological shifts can be expected invegetated marine ecosystems (Hall-Spencer et al., 2008). Ecophysi-ological studies are required to better understand why some speciescan live in a wide range of CO2 conditions and what processes restrictothers to the lowest or highest CO2 concentration zones. As volcanicvents can persist for millennia it would also be interesting toinvestigate whether tolerant species have undergone genotypeselection within high CO2 environments.
Acknowledgements
We are grateful to Bruno Iacono and Vincenzo Rando for theirsampling support, to Giusy Alongi and the Department of Botany,University of Catania, for helping in identifying some taxa and toMariagrazia Graziano for suggesting improvements to themanuscript.The work of L. P. was funded by the Leverhulme Trust and of J.H.-S. byEU FP7 EPOCA Grant 211380. [SS]
References
Anthony, K.R.N., Kline, D.I., Diaz-Pulido, G., Dove, S., Hoegh-Guldberg, O., 2008. Oceanacidification causes bleaching and productivity loss in coral reef builders. Proc. NatlAcad. Sci. USA 105, 17442–17446.
Balata, D., Piazzi, L., Cinelli, F., 2004. A comparison among assemblages in areas invadedby Caulerpa taxifolia and C. racemosa on a subtidal Mediterranean rocky bottom.Mar. Ecol. 25, 1–13.
Ballesteros, E., 1986. Métodos de análisis estructural en comunidades naturales, enparticular del fitobentos. Oecol. Aquat. 8, 117–131.
Ballesteros, E., Torras, X., Pinedo, S., Garcia, M., Mangialajo, L., de Torres, M., 2007. A newmethodology based on littoral community cartography for the implementation ofthe European Water Framework Directive. Mar. Pollut. Bull. 55, 172–180.
Benedetti-Cecchi, L., Pannacciulli, F., Bulleri, F., Moschella, P.S., Airoldi, L., Relini, G., Cinelli,F., 2001. Predicting the consequences of anthropogenic disturbance: Large-scaleeffects of loss of canopy algae on rocky shores. Mar. Ecol. Prog. Ser. 214, 137–150.
Buia, M.C., Porzio, L., Patti, F.P., 2007. The application of the “CARLIT method” to assessthe ecological status of coastal waters in the Gulf of Naples. In: Pergent-Martini, C.,El Asmi, S., Le Ravallec, C. (Eds.), Proceedings of the Third MediterraneanSymposium on Marine Vegetation. CAR/ASP Publ., Tunis, pp. 253–254.
Cigliano, M.M., Gambi, M.C., Rodolfo-Metalpa, R., Patti, F.P., Hall-Spencer, J.M., 2010.Effects of ocean acidification on invertebrate settlement at volcanic CO2 vents. Mar.Biol. 157, 2489–2502.
Clarke, K.R., Warwick, R.M., 2001. Change in marine communities: An approach tostatistical analysis and interpretation, 2nd ed. PRIMER-E Press, Plymouth.
Connell, S.D., Russell, B.D., 2010. The direct effects of increasing CO2 and temperature onnon-calcifying organisms: Increasing the potential for phase shifts in kelp forests.Proc. R. Soc. B 277, 1409–1415 doi:10.1098/rspb.2009.2069.
Couto, R.P., Neto, A.I., Rodrigues, A.S., 2010. Metal concentration and structural changesin Corallina elongata (Corallinales, Rhodophyta) from hydrothermal vents. Mar.Pollut. Bull. 60, 509–514.
Crim, R.N., Sunday, J.M., Harley, C.D.G, 2011. Elevated seawater CO2 concentrationsimpair larval development and reduce larval survival in endangered northernabalone (Haliotis kamtschatkana). J. Exp. Mar. Biol. Ecol. 400, 272–277 (this issue).
Darcy-Hall, T.L., Hall, S.R., 2008. Linking limitation to species composition: importanceof inter- and intra-specific variation in grazing resistance. Oecologia 155, 797–808.
De'ath, G., Lough, J.M., Fabricius, K.E., 2009. Declining coral calcification on the GreatBarrier Reef. Science 323, 116–119.
Dias, B.B., Hart, M.B., Smart, C.W., Hall-Spencer, J.M., 2010. Modern seawater acidification:The response of foraminifera to high-CO2 conditions in theMediterranean Sea. J. Geol.Soc. 167, 843–846.
Diaz-Pulido, G., McCook, L., 2008. Macroalgae (Seaweeds). In: Chin, A. (Ed.), The State ofthe Great Barrier Reef. Online, Great Barrier Reef Marine Park Authority, Townsville.Viewed on http://www.gbrmpa.gov.au/corp_site/info_services/publications/sotr/downloads/SORR_Macroalgae.pdf.
Dupont, S., Havenhand, J., Thorndyke, W., Peck, L., Thorndyke, M., 2008. Near-futurelevel of CO2-driven ocean acidification radically affects larval survival anddevelopment in the brittlestar Ophiothrix fragilis. Mar. Ecol. Prog. Ser. 373, 285–294.
Ellis, R.P., Bersey, J., Rundle, S.D., Hall-Spencer, J.M., Spicer, J.I., 2009. Subtle butsignificant effects of CO2 acidified seawater on embryos of the intertidal snail,Littorina obtusata. Mar. Ecol. Prog. Ser. 5, 41–48.
Fabry, V.J., Seibel, B.A., Feely, R.A., Orr, J.C., 2008. Impacts of ocean acidification onmarine fauna and ecosystem processes. ICES J. Mar. Sci. 65, 414–432 doi:10.1093/icesjms/fsn048.
Fu, F.X., Mulholland, M.R., Garcia, N.S., Beck, A., Bernhardt, P.W., Warner, M.E., Sanudo-Wilhelmy, S.A., Hutchins, D.A., 2008. Interactions between changing pCO2, N2
fixation, and Fe limitation in the marine unicellular cyanobacterium Crocosphaera.Limnol. Oceanogr. 53, 2472–2484.
Gao, K., Aruga, Y., Asada, K., Ishihara, T., Akano, T., Kiyohara, M., 1993. Calcification inthe articulated coralline alga Corallina pilufera, with special reference to the effectof elevated CO2 concentration. Mar. Biol. 117, 129–132.
Gao, K.S., Ji, Y., Aruga, Y., 1999. Relationship of CO2 concentrations to photosynthesis ofintertidal macroalgae during emersion. Hydrobiologia 399, 355–359.
Guinotte, J.M., Fabry, V.J., 2008. Ocean acidification and its potential effects on marineecosystems. Ann. N. Y. Acad. Sci. 1134, 320–342 doi:10.1196/annals.1439.013.
Hall-Spencer, J.M., Rodolfo-Metalpa, R., Martin, S., Ransome, E., Fine, M., Turner, S.M.,Rowley, S.J., Tedesco, D., Buia, M.C., 2008. Volcanic carbon dioxide vents showecosystem effects of ocean acidification. Nature 454, 96–99.
Hendricks, I.E., Duarte, C.M., 2010. Ocean acidification: Separating evidence fromjudgment—A reply to Dupont et al. Estuar. Coast. Shelf Sci. 89, 186–190.
Hoegh-Guldberg, O., Mumby, P.J., Hooten, A.J., Steneck, R.S., Greenfield, P., Gomez, E.,Harvell, C.D., Sale, P.F., Edwards, A.J., Caldeira, K., Knowlton, N., Eakin, C.M., Iglesias-Prieto, R., Muthiga, N., Bradbury, R.H., Dubi, A., Hatziolos, M.E., 2007. Coral reefsunder rapid climate change and ocean acidification. Science 318, 1737–1742doi:10.1126/science.1152509.
Iglesias-Rodriguez, M.D., Halloran, P.R., Rickaby, R.E.M., Hall, I.R., Colmenero-Hidalgo,E., Gittins, J.R., Green, D.R.H., Tyrrel, T., Gibbs, S.J., von Dassow, P., Rehm, E.,Armbrust, E.V., Boessenkool, K.P., 2008. Phytoplankton calcification in a high-CO2
world. Science 320, 336–340.IPCC (Intergovernmental Panel on Climate Change), 2007. Climate Change 2007
Synthesis Report. Cambridge University Press, New York.Kleypas, J.A., Feely, R.A., Fabry, V.J., Langdon, C., Sabine, C.L., Robbins, L.L., 2006. Impacts
of ocean acidification on coral reefs and other marine calcifiers: A guide for futureresearch. Contribution No. 2897 from NOAA/Pacific Marine EnvironmentalLaboratory. http://www.fedworld.gov/onow/.
Kranz, S.A., Sültemeyer, D., Richter, K.U., Rost, B., 2009. Carbon acquisition in Trichodes-mium: The effect of pCO2 and diurnal changes. Limnol. Oceanogr. 54, 548–559.
Kroeker, K.J., Kordas, R.L., Crim, R.N., Singh, G.G., 2010. Meta-analysis reveals negativeyet variable effects of ocean acidification on marine organisms. Ecol. Lett. 13,1419–1434 doi:10.1111/j.1461-0248.2010.01518.x.
Fig. 7. Occurrence (black bars) and absence (white bars) of reproductive structures in species present in at least two sectors with different pH. S1 pH=8.1, S2 pH=7.8 and S3;pH=6.7.
286 L. Porzio et al. / Journal of Experimental Marine Biology and Ecology 400 (2011) 278–287
Author's personal copy
Kübler, J.E., Johnston, A.M., Raven, J.A., 1999. The effects of reduced and elevated CO2
and O2 on the seaweed Lomentaria articulata. Plant Cell Environ. 22, 1303–1310doi:10.1046/j.1365-3040.1999.00492.x.
Kuffner, I.B., Andersson, A.J., Jokiel, P.L., Rodgers, K.S., Mackenzie, F.T., 2008. Decreasedabundance of crustose coralline algae due to ocean acidification. Nat. Geosci. 1,114–117.
Langer, G., Nehrke, G., Probert, I., Ly, J., Ziveri, P., 2009. Strain specific responses ofEmeliana huxleyi to changing seawater chemistry. Biogeosciences 6, 2637–2646.
Mangialajo, L., Chiantore, M., Cattaneo-Vietti, R., 2008. Loss of fucoid algae along agradient of urbanisation, and structure of benthic assemblages. Mar. Ecol. Prog. Ser.358, 63–74.
Manzello, D.P., Kleypas, J.A., Budd, D.A., Eakin, C.M., Glynn, P., Langdon, C., 2009. Poorlycemented coral reefs of the eastern tropical Pacific: Possible insights into reefdevelopment in a high CO2 world. Proc. Natl Acad. Sci. USA 30, 10450–10455.
Martin, S., Gattuso, J.P., 2009. Response of Mediterranean coralline algae to oceanacidification and elevated temperature. Glob. Change Biol. 15, 2089–2100doi:10.1111/j.13652486.2009.01874.x.
Martin, S., Rodolfo-Metalpa, R., Ransome, E., Rowley, S., Buia, M.C., Gattuso, J.P., Hall-Spencer, J.M., 2008. Effects of naturally acidified seawater on seagrass calcareousepibionts. Biol. Lett. 4, 689–692.
Micheli, F., Halpern, B.S., 2005. Low functional redundancy in coastal marineassemblages. Ecol. Lett. 8, 391–400.
Miles, H., Widdicombe, S., Spicer, J., Hall-Spencer, J.M., 2007. Effects of anthropogenicseawater acidification on acid-base balance in the sea urchin Psammechinusmiliaris. Mar. Pollut. Bull. 54, 89–96.
Nelson, W.A., 2009. Calcified macroalgae—Critical to coastal ecosystems and vulnerableto change: A review. Mar. Freshwater Res. 60, 787–801 doi:10.1071/MF08335.
Orfanidis, S., Panayotidis, P., Stamatis, N., 2001. Ecological evaluation of transitional andcoastal waters: A marine benthic macrophytes-based model. Medit. Mar. Sci. 2,45–65.
Palacios, S.L., Zimmerman, R.C., 2007. Response of eelgrass Zostera marina to CO2
enrichment: Possible impacts of climate change and potential remediation ofcoastal habitats. Mar. Ecol. Prog. Ser. 344, 1–13.
Parker, L.M., Ross, P.M., O'Connor, W.A., 2009. The effect of ocean acidification andtemperature on the fertilisation and embryonic development of the Sydney rock
oyster Saccostrea glomerata (Gould 1850). Glob. Change Biol., 15, pp. 2123–2136doi:10.1111/j.1365-2486.2009.01895.x.
Pergent, G., 1991. Les indicateurs écologiques de la qualité du milieu marin enMéditerranée. Océanis 17, 341–350.
Podani, J., 2001. Syn-tax 2000: Computer Program for Data Analysis in Ecology andSystematics. Scientia Publishing, Budapest.
Riebesell, U., 2008. Climate change: Acid test for marine biodiversity. Nature 454,46–47.
Riebesell, U., Schulz, K.G., Bellerby, R.G.J., Botros, B., Fritsche, P., Meyerhöfer, M., Neill, C.,Nondal, G., Oschlies, A., Wohlers, J., Zöllner, E., 2007. Enhanced biological carbonconsumption in a high CO2 ocean. Nature 450, 545–549.
Rodolfo-Metalpa, R., Lombardi, C., Cocito, S., Hall-Spencer, J.M., Gambi, M.C., 2010.Effects of ocean acidification and high temperatures on the bryozoan Myriaporatruncata at natural CO2 vents. Mar. Ecol. 31, 447–456.
Rodriguez-Prieto, C., Polo, L., 1996. Effects of sewage pollution in structure anddynamicsofthe community of Cystoseira mediterranea (Fucales, Phaeophyceae). Sci. Mar. 60,253–263.
The Royal Society, 2005. Ocean acidification due to increasing atmospheric carbondioxide. Policy document 12/05. The Royal Society, London.
Thibaut, T., Pinedo, S., Torras, X., Ballesteros, E., 2005. Long-term decline of the Fucales(Cystoseira spp. and Sargassum spp.) in the Albères coast (France, NorthwesternMediterranean). Mar. Pollut. Bull. 50, 1472–1489.
Thomsen, J., Gutowska, M.A., Saphörster, J., Heinemann, A., Trübenbacj, K., Fietzke, J.,Hiebenthal, C., Eisenhauer, A., Körtzinger, A., Wahl, M., Melzner, F., 2010. Calcifyinginvertebrates succeed in a naturally CO2 enriched coastal habitat but are threatenedby high levels of future acidification. Biogeosci. Discuss. 7, 5119–5156 doi:10.5194/bgd-7-5119-2010.
Wootton, J.T., Pfister, C.A., Forester, J.D., 2008. Dynamic patterns and ecological impactsof declining ocean pH in a high-resolution multi-year dataset. Proc. Natl Acad. Sci.USA 105, 18848–18853.
Yu, P., Matson, P.G., Martz, T.R., Hofmann, G.E., 2011. The ocean acidification seascapeand its relationship to the performance of calcifying marine invertebrates:laboratory experiments on the development of urchin larvae framed byenvironmentally-relevant pCO2/pH. J. Exp. Mar. Biol. Ecol. 400, 288–295(this issue).
287L. Porzio et al. / Journal of Experimental Marine Biology and Ecology 400 (2011) 278–287


