Embed Size (px)
Citation preview

Journal of Agriculture and Natural Resources (2019) 2(1): 282-300
ISSN: 2661-6270 (Print), ISSN: 2661-6289 (Online)
DOI: https://doi.org/10.3126/janr.v2i1.26092
282
Research Article
Effects of planting configuration and row spacing on growth and
production of potato under mulched condition in Dadeldhura,
Nepal
Roshan Dhakal1*
, Binod Joshi1, Santosh Bharati
1, Shiva Chandra Dhakal
2 and Khem Raj
Joshi3
1*
Faculty of Agriculture, Agriculture and Forestry University, Rampur, Chitwan, Nepal 2Department of Agriculture Economics and Agribusiness Management, Rampur, Chitwan, Nepal
3Ministry of Agriculture and Livestock Development, Nepal
*Corresponding author: [email protected]
ORCID: https://orcid.org/0000-0001-5768-5811
Received: July 12; Accepted: October 12; Published: October 25, 2019
© Copyright: Dhakal et al. (2019).
This work is licensed under a Creative Commons Attribution-Non Commercial 4.0
International License .
ABSTRACT An experiment was conducted at the research site of Dadeldhura, Nepal in 2019 to identify optimum plant
spacing for potato under mulched condition. Three levels of inter row spacing; 60 cm with single row per bed
(1RB), 45 cm with double row per bed (2RB) and 30 cm with triple row per bed (3RB) and intra row spacing
(20, 30 and 40 cm) were laid out in factorial randomized complete block design with three replications. Results
showed that there was significant difference (p<0.05) for all parameters except on days to 50% germination,
90% flowering, 50% maturity and on main stem number and graded large sized tuber number and it's weight.
Growth parameters namely canopy, leaf number and leaf area were significantly higher (p<0.05) in 60 cm
(1RB) ×30 cm spacing. Plant height and leaf area index was significantly higher (p<0.05) in 60 cm (1RB) × 20
cm and 30(3RB) ×20 cm spacing respectively. Total number of tubers m-2
, weight of tubers m-2
, weight of
marketable tubers m-2
, harvest index, number of small sized tuber m-2
,weight of small sized tubers m-2
and
weight of medium sized tubers m-2
were found to be 56.24%,39.79%, 47.98%,4.41%,90.56%, 113.23% and
70.15% significantly higher (p<0.05) in 30 cm (3RB) compared to 60 cm on (1RB) inter row spacing
respectively and 59.72%, 61.15%, 58.30%, 4.41%, 114.90%, 137.31%, 55.39% higher in 20cm compared to 40
cm intra row spacing. Interaction effect was significant (p<0.05) in marketable tuber number and medium sized
tuber number in which the average highest number of marketable tubers (134.44) and medium sized tubers
(121.08) was found in 30(3RB) ×20 cm spacing which was 165.95% and 235.03% significantly higher
compared to 60×40 cm spacing respectively. So, this study showed that 30(3RB) ×20 cm spacing would be best
spacing combination under mulched condition.
Keywords: Marketable; unmarketable; medium sized; inter; intra row; leaf area index
Correct citation: Dhakal, R., Joshi, B., Bharati, S., Dhakal, S.C., & Joshi, K. R.
(2019). Effects of planting configuration and row spacing on growth and production of
potato under mulched condition in Dadeldhura, Nepal. Journal of Agriculture and Natural
Resources, 2(1), 282-300. DOI: https://doi.org/10.3126/janr.v2i1.26092

Journal of Agriculture and Natural Resources (2019) 2(1): 282-300
ISSN: 2661-6270 (Print), ISSN: 2661-6289 (Online)
DOI: https://doi.org/10.3126/janr.v2i1.26092
283
INTRODUCTION
Potato ( Solanum tuberosum ) which is cultivated is highly heterozygous tetraploid (4x = 48)
in nature and belongs to Solanaceae family. It is amongst the major food crop to ensure food
security. Potato is grown in diverse land types (upland and lowlands), and agro ecological
conditions ranging from lowland terai (100masl) to high mountains upto 4000 masl
(SARPOD, 2014). It is cultivated in 197,037 hac of land with the production of 258,6287 t
and productivity of 13.13 mt/ha (MoAD, 2015). Potato grasps about 6.57 percent of
Agriculture Gross Domestic Product (AGDP) and about 2.17 percent of Gross Domestic
Product (GDP) of the country (MoF, 2015).. According to the recent statistics (ABPSD,
2015), potato ranks fifth in area coverage and second in quantity of production and first in
productivity compared with the main staple food crops of rice, maize, wheat and finger millet
grown in Nepal. The importance of potato is increasing day by day due to due to its
potentiality and wider adaptability to grow year round in the country. Due to the lack of
proper technology and dependency on conventional agriculture, the production of potato is
still very low compared to the attainable yield and yield of the neighboring countries like
India and China. China has the maximum productivity of potato in the world having more
than 40 t/ha (FAO, 2010).
Farmers follow ridge or raised bed with furrow system of plantation in which there is single
row per ridge or bed which is the conventional planting system in Nepal. There is also
haphazard use of spacing in potato due to which the production has been always under the
potential. If the well scientific research can provide them a scientific recommendation about
spacing under mulching, it can help them increase their productivity. Various literatures
like Endale and Gebremedhin (2001), Gulluoglu and Arrogilu (2009), Sanli et al. (2015),
Bussan et al. (2007), Jamaati et al. (2010), Tarkalson et al. (2011), Tahmorespour et al.,
(2013) etc had discussed about the effect of different planting configuration and row spacing
on yield and yield attributes of potato which findings may not be appropriate for the different
soil, environmental and varietal characteristics in context of Nepal. So, research had been
done with the objective to determine the optimum plant spacing or population within an unit
area by assessing the effects of different planting configuration and row spacing on growth,
yield and physical parameters of potato.
.
MATERIALS AND METHODS
The details of the materials and methods which were employed during the course of study are
described here under.
Description of the study area The experiment was conducted at the farmer's field located at Bhatkada, Dadeldhura. It was
located at co-ordinates of latitude 29.2188° N and longitude 80.4994° E respectively.
Dadeldhura had elevation ranging from 333 m to 2639 m above mean sea level (msl).

Journal of Agriculture and Natural Resources (2019) 2(1): 282-300
ISSN: 2661-6270 (Print), ISSN: 2661-6289 (Online)
DOI: https://doi.org/10.3126/janr.v2i1.26092
284
Meteorological condition during the experiment Data regarding meteorological parameters of the studied site like relative humidity,
precipitation, maximum and minimum rainfall, bright sunshine was taken from Department
of Hydrology and Meteorology, Dadeldhura during the cropping period. The average relative
humidity of 54.22 % was found during the experiment. Similarly the average maximum
temperature was 23.530C which ranged from 33.10
0C to 13.70
0C whereas the average
minimum temperature was 12.090C which ranged from 17.70
0C to 1.30
0C. The average
precipitation of 1.09mm with total 100.60 mm rainfall was observed in the experimental
field. The average bright sunshine of 8.07 hundredths of an hour with total 742.0 hundredths
of an hour was observed in the experimental area. These all parameters indicated that the area
was fit for the potato production during the experimental period.
Fig 1: Meteorological condition during the experimental period
Experimental design and Treatment details The treatments were designed in order to meet the objective i.e. to get the optimum plant
population under the black plastic mulch. Considering this, three levels of inter row spacing
(60 cm, 45 cm and 30 cm) were designed which can use a standard sized mulch plastic (120
cm in width) in different ways i.e. single, double and triple row of potato is covered with a
mulch in case of 60 cm,45 and 30 cm respectively. Three levels of inter row spacing (60 cm
with single row per bed (1RB), 45 cm with double rows per bed (2RB), 30 cm with triple
rows per bed (3RB) and three levels of intra row spacing (20, 30 and 40 cm) were also
designed.The experimental was be conducted in 3×3 Factorial Completely Randomized
Block Design (Factorial-RCBD) in 3 replication of each treatment.
Journal of Agriculture and Natural Resources (2019) 2(1): 282-300
ISSN: 2661-6270 (Print), ISSN: 2661-6289 (Online)
DOI: https://doi.org/10.3126/janr.v2i1.26092
285
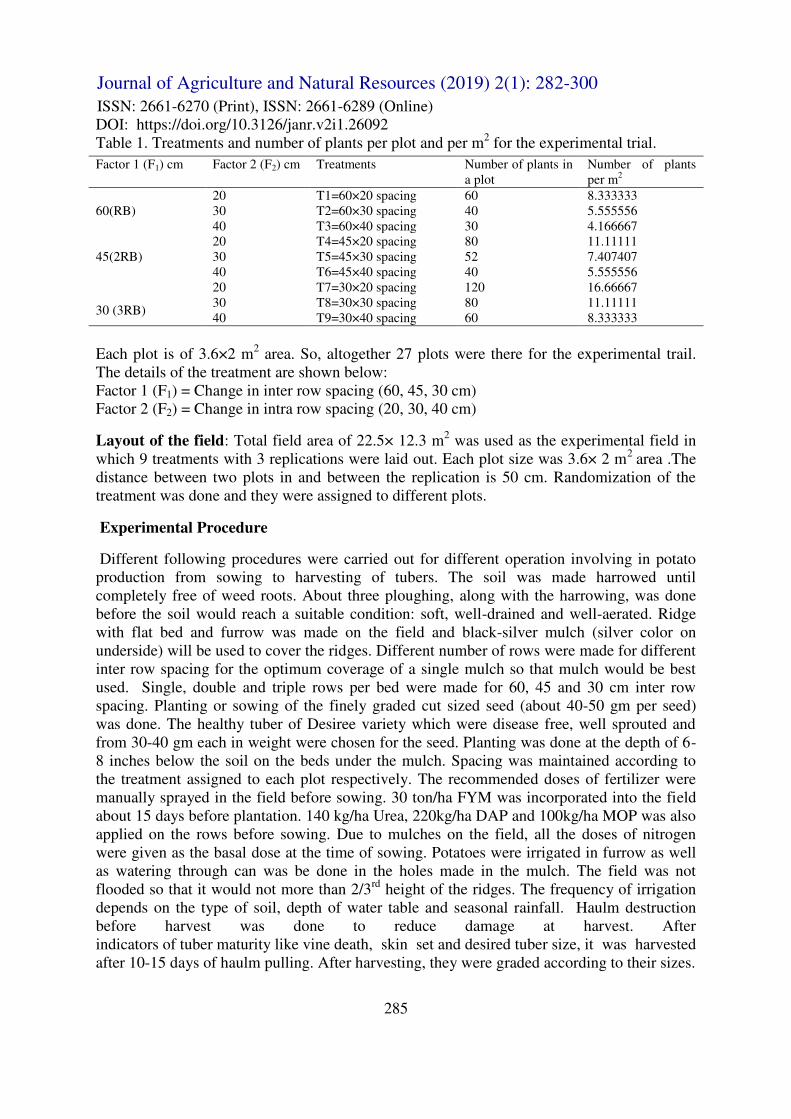
Table 1. Treatments and number of plants per plot and per m2 for the experimental trial.
Factor 1 (F1) cm Factor 2 (F2) cm Treatments Number of plants in
a plot
Number of plants
per m2
60(RB)
20 T1=60×20 spacing 60 8.333333
30 T2=60×30 spacing 40 5.555556
40 T3=60×40 spacing 30 4.166667
45(2RB)
20 T4=45×20 spacing 80 11.11111
30 T5=45×30 spacing 52 7.407407
40 T6=45×40 spacing 40 5.555556
30 (3RB)
20 T7=30×20 spacing 120 16.66667
30 T8=30×30 spacing 80 11.11111
40 T9=30×40 spacing 60 8.333333
Each plot is of 3.6×2 m2 area. So, altogether 27 plots were there for the experimental trail.
The details of the treatment are shown below:
Factor 1 (F1) = Change in inter row spacing (60, 45, 30 cm)
Factor 2 (F2) = Change in intra row spacing (20, 30, 40 cm)
Layout of the field: Total field area of 22.5× 12.3 m2 was used as the experimental field in
which 9 treatments with 3 replications were laid out. Each plot size was 3.6× 2 m2
area .The
distance between two plots in and between the replication is 50 cm. Randomization of the
treatment was done and they were assigned to different plots.
Experimental Procedure
Different following procedures were carried out for different operation involving in potato
production from sowing to harvesting of tubers. The soil was made harrowed until
completely free of weed roots. About three ploughing, along with the harrowing, was done
before the soil would reach a suitable condition: soft, well-drained and well-aerated. Ridge
with flat bed and furrow was made on the field and black-silver mulch (silver color on
underside) will be used to cover the ridges. Different number of rows were made for different
inter row spacing for the optimum coverage of a single mulch so that mulch would be best
used. Single, double and triple rows per bed were made for 60, 45 and 30 cm inter row
spacing. Planting or sowing of the finely graded cut sized seed (about 40-50 gm per seed)
was done. The healthy tuber of Desiree variety which were disease free, well sprouted and
from 30-40 gm each in weight were chosen for the seed. Planting was done at the depth of 6-
8 inches below the soil on the beds under the mulch. Spacing was maintained according to
the treatment assigned to each plot respectively. The recommended doses of fertilizer were
manually sprayed in the field before sowing. 30 ton/ha FYM was incorporated into the field
about 15 days before plantation. 140 kg/ha Urea, 220kg/ha DAP and 100kg/ha MOP was also
applied on the rows before sowing. Due to mulches on the field, all the doses of nitrogen
were given as the basal dose at the time of sowing. Potatoes were irrigated in furrow as well
as watering through can was be done in the holes made in the mulch. The field was not
flooded so that it would not more than 2/3rd
height of the ridges. The frequency of irrigation
depends on the type of soil, depth of water table and seasonal rainfall. Haulm destruction
before harvest was done to reduce damage at harvest. After
indicators of tuber maturity like vine death, skin set and desired tuber size, it was harvested
after 10-15 days of haulm pulling. After harvesting, they were graded according to their sizes.

Journal of Agriculture and Natural Resources (2019) 2(1): 282-300
ISSN: 2661-6270 (Print), ISSN: 2661-6289 (Online)
DOI: https://doi.org/10.3126/janr.v2i1.26092
286
Data Collection For the evaluation of effect of inter and intra row spacing on potato growth, seed tuber yield
and physical quality data were collected for individual response variables from the tagged
plants at different times according to the requirement.
After harvesting, tubers were graded into different size based on their diameter using caliper.
Each size of tubers will be counted and weighed using sensitive balance to be more accurate.
Growth parameters
Days to 50% emergence – Days to 50% emergence was recorded by counting the number of
days from the date of planting to the date at which about 50% of the plants in a plot emerged
out.
Days to 90% flowering – Days to flowering was recorded when 50% of the plant population
in each plot produced flowers.
Days to 50% physiological maturity – Days to physiological maturity was recorded as days
from emergence to maturity when the haulms of 50% of the plant population per plot have
showed sign of senescence or turn yellowish.
Plant height (cm) – Plant height was determined by measuring the height of the randomly
selected five plants per plot as the distance from the soil surface to the top most growth point
of above ground at full flowering (Zelalem et al., 2009).
Number stems (hill-1
) – The average number of main stems produced per hill was recorded
by counting the main stem s which came out from the seed tuber from five randomly selected
plants from each plot at full flowering (Zelalem et al., 2009).
Yield parameters
The number of tubers hill-1, tuber yield hill-1
, average tuber weight, average, marketable and
unmarketable tuber number m-2
, total tuber yield, marketable seed tuber yield and
unmarketable tuber yield ton ha-1
data will be collected at the time of harvesting from the two
middle rows.
Average number of tubers (hill-1
) – It is explained as total number of tubers harvested from
hills divided by number of plants harvested.
Average tuber yield (kg/hill) – Average weight of total tubers harvested from sampled
hills/plants was divided by the number of plants.
Average tuber weight (kg) - It was recorded as the ratio of the weight of tubers per plant/hill
to number of tubers per plant/hill which will be expressed in grams at harvest.
Average number of tubers (m-2
) - The total number of tubers harvested from net area was
counted.
Marketable number of seed tubers (m-2
) - At harvesting the tubers harvested from net area
was taken from each plot for determination of marketable seed tuber number. In this study
marketable tubers include healthy tubers having size categories greater than 25 mm in
diameter.
Unmarketable number of tubers (m-2
) - Among tubers harvested from net area diseased,
rotten, insect attacked, deformed and tubers with diameter less than 25mm will be separated
and counted.
Total tuber yield (kg m-2
) - Total tuber yield was recorded as the sum of marketable seed
tuber and unmarketable tuber yield
Marketable seed tuber yield (kg m-2
) - At harvesting the plants harvested from net area was
taken from each plot for determining marketable seed tuber yield. In this study marketable
tubers will include healthy tubers having size categories greater than 25 mm in diameter

Journal of Agriculture and Natural Resources (2019) 2(1): 282-300
ISSN: 2661-6270 (Print), ISSN: 2661-6289 (Online)
DOI: https://doi.org/10.3126/janr.v2i1.26092
287
Unmarketable tuber yield (kg m-2
) - Diseased, rotten, insect attacked, deformed tuber and
tubers with diameter less than 25mm (non-marketable) was weighed and tabulated
Harvest index (HI) - It was computed by using ratio of oven dry weight of tuber to the total
biomass of the plant i.e. oven dry weight of tuber and oven dry weight of haulm.
Physical quality parameters
Tuber size categories (under sized, small, medium and large), was recorded as follows.
Tuber size: Tubers from two central rows will be graded by size of tubers: <10mm (under
sized and unmarketable), 10-25 (small) 25-35 (medium) and >35mm (large) by visual method
(Fig 2). Tubers in each grade was counted and weighed.
Fig 2: Grading of potatoes into different groups according to their size by visual method
Statistical analysis: The collected data was analyzed by using R-STAT statistical computer
package. Analysis of variance (ANOVA) was performed and the significant differences
between treatments were determined using least significant difference (LSD) test at
probability level of 0.01 or 0.05 where the effects of the treatments were significant at 1% or
5% level of probability, respectively (Dahiru, 2008; Gomez & Gomez, 1984: Sharma et al.,
2016; Kunwar & Shrestha, 2014; Shrestha, 2019; Kandel & Shrestha, 2019). Graph and
tables was constructed by using the MS-excel version 2016 computer software program.
RESULTS AND DISCUSSION
Growth parameters
Days to 90 % germination, 50 % flowering and 90% maturity
The result of analysis of variance showed that there was no any significant difference
(P>0.05) by the main and interaction effects of inter and intra row spacing on phenological
parameters like Days to 90% germination, 50% flowering and 90% maturity of potato (Table
2). All the treatments took about 30 days, 50days and 90 days for 90% germination, 50%
flowering and 90 % maturity respectively.

Journal of Agriculture and Natural Resources (2019) 2(1): 282-300
ISSN: 2661-6270 (Print), ISSN: 2661-6289 (Online)
DOI: https://doi.org/10.3126/janr.v2i1.26092
288
Table 2. Effect of different plant configuration and row spacing on growth parameters like
germination, flowering and maturity of potato at Dadeldhura, Nepal
Inter row spacing in cm Days to 90% germination Days to 50% flowering Days to 90% maturity
60 (1 RB) 31.80 51.60 90.90
45 (2 RB) 31.75 50.75 91.25
30 (3RB) 31.11 50.11 91.22
SE(±) 0.77 1.11 1.44
LSD0.05 ns ns ns
F test ns ns ns
Intra row spacing (cm)
20 31.11 51.11 91.11
30 32.00 50.37 91.37
40 31.60 51.00 90.90
SE(±) 0.77 1.11 1.44
LSD0.05 ns ns ns
F test ns ns ns
CV (%) 7.37 6.58 4.76
Means followed by the same letter within a column are not significantly different (P > 0.05) from each other,
LSD= Least significant difference, CV= Coefficient of variation, ns= non significant, SE (±) = standard error of
mean, DAS= Days after sowing, F test is the test for analysis of variance.
Plant height
In case of plant height, the result of F-test showed that there was significant difference
(P<0.05) by the main effects of the both inter and intra row spacing on 60 and 70 days after
sowing (DAS) while on 45 DAS, there was significant difference (P<0.05) by the only main
effect of inter row spacing (Table 3).
Table 3. Effect of different plant configuration and row spacing on plant height and main
stem number of potato at Dadeldhura, Nepal Inter row spacing
in cm
Plant height Main stem number
45 DAS 60 DAS 75 DAS
60 (1 RB) 28.86a
33.88a
34.27a
6.177
45 (2 RB) 24.82b
31.11ab
30.63b 6.066
30 (3RB) 25.84b
29.22b
30.30b
5.77
SE(±) 0.89 0.94 0.77 0.544
LSD0.05 2.68 2.83 2.32 ns
F test * * ** ns
Intra row spacing
(cm)
20 27.22 33.46a
33.72a
6.22
30 27.17 31.82a
31.47ab
5.77
40 25.13 28.93b
30.01b
6.022
SE(±) 0.89 0.94 0.77 0.544
LSD0.05 ns 2.83 2.32 ns
F test ns * * ns
CV (%) 10.1 9.01 7.3 27.2
Means followed by the same letter within a column are not significantly different (P > 0.05) from each other,
LSD= Least significant difference, CV= Coefficient of variation, ns= non significant, SE (±) = standard error of
mean, DAS= Days after sowing, *,** represent significant at 5% and 1% level of significance respectively.
In case of inter row spacing, highest plant height (28.68 cm at 45 DAS, 33.88cm at 60 DAS

Journal of Agriculture and Natural Resources (2019) 2(1): 282-300
ISSN: 2661-6270 (Print), ISSN: 2661-6289 (Online)
DOI: https://doi.org/10.3126/janr.v2i1.26092
289
and 34.27cm at 75 DAS) was found in the highest level of inter row spacing; 60cm which
was followed by 45 and 30 cm respectively. But in case of intra row spacing, the highest
plant height (33.46cm at 60 DAS and 33.72 cm at 75 DAS) was found in the lowest intra row
spacing; 20 cm which was at par with 30 cm and followed by 40 cm.
Number of main stems per hill
There was no any significant difference on both main and interaction effects on main stem
number per hill (Table 3). There are about 5-6 number of tillers in all treatments.
Canopy diameter
The analysis of variance revealed that in case of inter row spacing on 45 DAS, the canopy
diameter (42.91cm) was found significantly higher ( P<0.05) in 60 cm which was at par with
45cm and followed by 30cm inter row spacing (Table 4). Similar result was obtained in 60
DAS (P<0.05) and 70 DAS (P<0.01). In case of intra row spacing, on 45 DAS; there was no
any significant effect on canopy diameter. But on 60 DAS, the highest canopy diameter
(52.33 cm) significant at P<0.01 was found in 40 cm intra row spacing and followed by 30
cm and 20 cm intra row spacing respectively. On 75 DAS, similar result was obtained, i.e.
canopy diameter (55.48 cm) was found significantly highest (P<0.01) in 40 cm intra row
spacing which was at par with 30 cm spacing and followed by 20 cm intra row spacing. There
was no any significant interaction effect on canopy diameter.
Number of leaves
The analysis of variance revealed that in case of inter row spacing on 45 DAS, number of
leaves was not found significant ( P>0.05) but on 60 DAS and 75 DAS, number of leaves
was found significantly higher (P<0.001) in 60 cm which was followed by 45 and 30 cm inter
row spacing respectively (Table 4).
Table 4. Effect of different plant configuration and row spacing on number of leaves
and canopy diameter of potato at Dadeldhura, Nepal Inter row spacing(cm) Number of leaves Canopy diameter(cm)
45 DAS 60 DAS 75 DAS 45 DAS 60 DAS 75 DAS
60 (1 RB) 41.97 54.20a
49.73a
42.91a 48.32
a 54.78
a
45 (2 RB) 39.00 43.40b
37.48b
40.42ab
48.20a 51.90
a
30 (3RB) 38.75 34.71c
28.06c
36.02b 40.51
b 45.85
b
SE(±) 3.085 2.68 2.88 1.655 2.20 1.68
LSD0.05 ns 8.06 8.65 4.96 6.62 5.05
F-test ns *** *** * * **
Intra row spacing (cm)
20 43.42 38.091b
32.24b
39.14 41.25b 45.98
b
30 37.84 46.00ab
38.60ab
38.37 43.44b
51.06a
40 38.46 48.22a
44.44a 41.83 52.33
a 55.48
a
SE(±) 3.085 2.68 2.88 1.655 2.20 1.68
LSD0.05 ns 8.06 8.65 ns 6.62 5.05
F-test ns * * ns ** **
CV (%) 23.2 18.3 22.5 12.5 14.5 9.94
Means followed by the same letter within a column are not significantly different (P > 0.05) from each other,
LSD= Least significant difference, CV= Coefficient of variation, ns= non significant, SE (±) = standard error of
mean, DAS= Days after sowing. *, **,*** represent significant at 5%,1% and 0.1% level of significance
respectively.

Journal of Agriculture and Natural Resources (2019) 2(1): 282-300
ISSN: 2661-6270 (Print), ISSN: 2661-6289 (Online)
DOI: https://doi.org/10.3126/janr.v2i1.26092
290
In case of intra row spacing, on 45 DAS; there was no any significant effect on number of
leaves. But on 60 DAS and 75 DAS, 40 cm intra row spacing had got the significantly
highest (P<0.05) number of leaves which was followed by 30 cm and 20 cm intra row
spacing respectively. There was no any significant interaction effect on the number of leaves.
The findings showed that with increase in space between the plants, there is increase in the
shoots and canopy coverage and increase in number of leaves due to more availability of
nutrients and sunlight.
Leaf Area
The analysis of variance revealed that in case of inter row spacing on 45 DAS, leaf area was
found statistically significant ( P<0.01) but on 60 DAS, number of leaves was not found
statistically significantly (Table 5). On 45 DAS, the largest leaf area of 2040.73 cm2 was
found in 60 cm spacing which was at par with 45 cm and followed by 30 cm inter row
spacing. Similarly, in case of intra row spacing, leaf area was found to be significant (P<0.01)
on only 45 DAS in which highest leaf area of 1347.96 cm2 was found to be in 40 cm
followed by 30 cm and 20 cm intra row spacing respectively.
Leaf area index
The analysis of variance revealed that leaf area index was found to be statistically significant
(P<0.01) on 45 DAS and significant at P=0.01 at 60 DAS in case of inter row spacing
whereas in case of intra row spacing, it was found significant at P<0.05 on 45 DAS and
P<0.001 on 60 DAS (Table 5). On 45 DAS, highest leaf area index (1.68) was found in 30 cm
followed by 45 cm and 60 cm inter row spacing respectively and in case of intra row spacing,
highest leaf area index (1.61) was found in 20 cm which was at par with 30 cm and followed
by 40 cm intra row spacing.
Table 5. Effect of different plant configuration and row spacing on leaf area and leaf area
index (LAI) of potato at Dadeldhura, Nepal
Inter row spacing(cm) Leaf Area (cm2) Leaf area index(LAI)
45 DAS 60 DAS 45 DAS 60 DAS
60 (1 RB) 2040.73(3.31)a
1896.41 1.22b
1.089(0.32)b
45 (2 RB) 1697.24(3.23)ab
2577.14 1.34b 1.818(0.45)
a
30 (3RB) 1379.38(3.13)b
1949.61 1.68a 2.090(0.498)
a
SE(±) 0.030 331.29 0.091 0.039
LSD0.05 0.0918 ns 0.274 0.117
F-test ** ns ** *
Intra row spacing (cm)
20 1347.96(3.13)c 2035.16 1.61
a 2.23(0.514)
a
30 1697.24(3.23)b 2784.81 1.34
ab 2.019(0.481)
a
40 2136.96(3.33)a
1603.20 1.28b
0.90(0.283)b
SE(±) 0.030 331.29 0.091 0.039
LSD0.05 0.0918 ns 0.274 0.117
F-test ** ns * ***
CV (%) 2.84 46.4 19.4 27.5
Means followed by the same letter within a column are not significantly different (P > 0.05) from each other,
LSD= Least significant difference, CV= Coefficient of variation, ns= non significant, SE (±) = standard error of
mean, DAS= Days after sowing. The figures inside the parenthesis are the log transformed values (Y=
log(x+1)). *, **, *** represent significant at 5%, 1% and 0.1% level of significance respectively.

Journal of Agriculture and Natural Resources (2019) 2(1): 282-300
ISSN: 2661-6270 (Print), ISSN: 2661-6289 (Online)
DOI: https://doi.org/10.3126/janr.v2i1.26092
291
Similarly on 60 DAS, highest leaf area index (2.090) was found in 30cm followed by 45 cm
and 60 cm inter row spacing whereas in case of intra row spacing, highest leaf area index
(2.23) was found in 20 cm followed by 30 cm and 40 cm intra row spacing. There was no any
significant interaction effect between the factors. This finding showed that with decrease in
spacing, there is increase in leaf area index.
Yield parameters
Average number of tuber per hill
The analysis of variance revealed that average number of tuber per hill was found to be
statistically significant (P<0.01) in case of inter row spacing whereas in case of intra row
spacing, it was found significant at P<0.05 (Table 6). The highest average number of tuber
per hill (14.55) was found in 60 cm which was at par with 45 cm and followed by 30 cm inter
row spacing and in case of intra row spacing, highest average tuber number per hill (14.66)
was found in 40 cm which was followed by 30 and 20 cm intra row spacing respectively.
There was no any significant interaction effect between the factors. This finding showed that
the highest number of tuber per hill was found in wider spacing.
Table 6. Effect of different plant configuration and row spacing on tuber number of potato at
Dadeldhura, Nepal
Inter row spacing(cm) Tuber number
Average number
of tuber per hill
Average
number of
tubers per m2
Marketable tuber
number per m2
Unmarketable tuber
number per m2
60 (1 RB) 14.55a
84.54c
66.00c
16.29(1.21)
45 (2 RB) 13.22ab
106.52b
82.13b
19.95(1.30)
30 (3RB) 11.44b
132.16a
108.95a
20.89(1.32)
SE(±) 0.62 5.58 4.59 0.062
LSD0.05 1.86 16.7 13.8 ns
F-test ** *** *** ns
Intra row spacing (cm)
20 11.86b
138.27a
107.53a
28.18(1.14)a
30 12.69b
98.36b
77.95b 17.78(1.25)
b
40 14.66a
86.57b
71.60b
13.48(1.13)b
SE(±) 0.62 5.58 4.59 0.062
LSD0.05 1.86 16.7 13.8 0.188
F-test * *** *** 0.008
CV (%) 14.2 15.6 16.1 14.7
Means followed by the same letter within a column are not significantly different (P > 0.05) from each other,
LSD= Least significant difference, CV= Coefficient of variation, ns= non significant, SE (±) = standard error of
mean, DAS= Days after sowing. The figures inside the parenthesis are the log transformed values (Y= log(x)).
Number of tubers per m2
The analysis of variance revealed that average number of tuber per m2 was found to be
statistically significant (P<0.001) in case of both inter row and intra row spacing (Table 6).
The highest number of tuber per m2 (132.16) was found in 30 cm which was followed by 45
cm and 60 cm inter row spacing respectively and in case of intra row spacing, highest tuber
number per m2 (138.27) was found in 20 cm which was followed by 30 and 40 cm intra row
spacing respectively. There was no any significant interaction effect between the factors.

Journal of Agriculture and Natural Resources (2019) 2(1): 282-300
ISSN: 2661-6270 (Print), ISSN: 2661-6289 (Online)
DOI: https://doi.org/10.3126/janr.v2i1.26092
292
Number of marketable tubers per m2
The analysis of variance revealed that average number of marketable tubers per m2 was found
to be statistically significant (P<0.001) in case of both inter row and intra row spacing as well
as significant (P<0.05) in the interaction effect of two factors (Table 6 and Fig 3). The highest
number of marketable tubers per m2 (108.95) was found in 30 cm which was followed by 45
cm and 60 cm inter row spacing respectively and in case of intra row spacing, highest
marketable tubers number per m2 (107.53) was found in 20 cm which was followed by 30
and 40 cm intra row spacing respectively. In case of interaction effect, highest number of
marketable tubers (134.44) was found in 30×20 spacing which was at par with 45×20 and
followed by 30×30,30×40,60×30,60×20,45×30,45×40 and lowest in 60×40 spacing (Fig 3).
Fig3: Relationship between Inter-Intra row spacing and Marketable tuber number
Number of unmarketable tuber per m2
The analysis of variance revealed that average number of unmarketable tubers per m2 was
found to be statistically significant (P<0.01) in case of intra row spacing as and non
significant in main effects of inter row spacing and interaction effects of two factors (Table
6). The highest average number of unmarketable tubers per m2 (28.18) was found in 20 cm
which was followed by 30 cm and 40 cm intra row spacing respectively. The findings showed
that in closer spacing, there is more unmarketable tuber number per m2 as compared to wider
spacing.
Total tuber yield per plant
The analysis of variance revealed that total tuber yield per plant was found to be statistically
significant (P<0.001) in main effect of inter row spacing and significant at P<0.05 in main

Journal of Agriculture and Natural Resources (2019) 2(1): 282-300
ISSN: 2661-6270 (Print), ISSN: 2661-6289 (Online)
DOI: https://doi.org/10.3126/janr.v2i1.26092
293
effect of intra row spacing (Table 7). The highest total yield per plant (0.67 kg) was found in
60 cm which was followed by 45 cm and 30 cm inter row spacing respectively and in case of
intra row spacing, highest total tuber yield per plant (0.61 kg) was found in 40 cm which was
at par with 30 and followed by 20 cm intra row spacing. There was no any significant
interaction effect between the factors.
Total yield per m2
The analysis of variance revealed that total tuber yield per m2 was found to be statistically
significant (P<0.01) in main effect of both inter row and intra row spacing (Table 7). The
highest total yield per m2 (5.41 kg) was found in 30 cm which was followed by 45 cm and 60
cm inter row spacing respectively and in case of intra row spacing, highest total tuber yield
per m2 (5.56 kg) was found in 20 cm which was followed by 30 and 40 cm intra row spacing
respectively. There was no any significant interaction effect between the factors.
Marketable tuber yield per m2
The analysis of variance revealed that marketable tubers per m2 was found to be statistically
significant (P<0.01) in case of both inter row and intra row spacing but not significant in the
interaction effect of two factors (Table 7). The highest yield of marketable tubers per m2
(5.15 kg) was found in 30 cm which was followed by 45 cm and 60 cm inter row spacing
respectively and in case of intra row spacing, highest yield of marketable tubers per m2 (5.24
kg) was found in 20 cm which was followed by 30 and 40 cm intra row spacing respectively.
Unmarketable tuber yield per m2
The analysis of variance revealed that total yield of unmarketable tubers per m2 was found to
be statistically significant (P<0.05) in case of intra row spacing as and non significant in main
effects of inter row spacing and interaction effects of two factors (Table 7).
Table 7. Effect of different plant configuration and row spacing on tuber yield of potato at
Dadeldhura, Nepal
Inter row spacing(cm) Tuber yield (kg)
Total yield per
plant
Total yield
per m2
Marketable tuber
yield per m2
Unmarketable tuber
yield per m2
60 (1 RB) 0.67a
3.87b
3.48b
0.20
45 (2 RB) 0.50b
3.92b
3.86b
0.23
30 (3RB) 0.45b
5.41a
5.15a
0.25
SE(±) 0.030 0.34 0.35 0.031
LSD0.05 0.0924 1.02 1.06 ns
F-test *** ** * ns
Intra row spacing (cm)
20 0.47b 5.56
a 5.24
a 0.31
a
30 0.54ab
4.18b 3.95
b 0.22
ab
40 0.61a
3.45b 3.31
b 0.16
b
SE(±) 0.030 0.34 0.35 0.031
LSD0.05 0.0924 1.02 1.06 0.0948
F-test * ** ** *
CV (%) 17 23.2 25.4 38
Means followed by the same letter within a column are not significantly different (P > 0.05) from each other,
LSD= Least significant difference, CV= Coefficient of variation, ns= non significant, SE (±) = standard error of
mean. *, **, *** represent significant at 5%, 1% and 0.1% level of significance respectively.
The highest yield of unmarketable tubers per m2 (0.31 kg) was found in 20 cm which was at
par with 30 cm and followed by 40 cm intra row spacing. The findings showed that in closer

Journal of Agriculture and Natural Resources (2019) 2(1): 282-300
ISSN: 2661-6270 (Print), ISSN: 2661-6289 (Online)
DOI: https://doi.org/10.3126/janr.v2i1.26092
294
spacing, there is higher unmarketable tuber yield in an unit area because of production of
higher unmarketable tuber number in closer spacing comparative to the wider spacing.
Harvest Index
The analysis of variance revealed that haulm fresh and dry weight per m2 was found to be
statistically non significant (P>0.05) in case of both main and interaction effects of inter and
intra row spacing (Table 8). In case of harvest index, it was found statistically significant
(P<0.01) in the main effect of inter row spacing whereas statistically significant at P<0.05 in
the main effect of intra row spacing but not significant in the interaction effect of both
factors. The highest harvest index (0.72) was found in 30 cm which was at par with 45 cm
and followed by 0.68 intra spacing. Similarly, in case of intra row spacing, highest intra row
spacing (0.72) was found in
20 cm which was at par with 30 cm and followed by 40 cm intra row spacing. The findings
that closed spaced potato has higher harvest index than wider spaced potato plants. It is
because the economic yield or total weight of potato is found higher in closed spaced plants
in unit area due to large number of tubers from densely populated plants in closed spacing
comparative to wider spacing.
Table 8. Effect of different plant configuration and row spacing on weight of haulm and
harvest index of potato at Dadeldhura, Nepal Inter row spacing(cm) Haulm Fresh weight in
kg per m2
Haulm dry weight in kg
per m2
Harvest index(HI)
60 (1 RB) 1.48 0.43 0.68b
45 (2 RB) 1.30 0.38 0.71a
30 (3RB) 1.69 0.49 0.72a
SE(±) 0.18 0.053 0.00844
LSD0.05 ns ns 0.0253
F-test ns ns **
Intra row spacing (cm)
20 1.78 0.52 0.72a
30 1.44 0.42 0.70ab
40 1.25 0.36 0.68b
SE(±) 0.18 0.053 0.00844
LSD0.05 ns ns 0.0253
F-test ns ns *
CV (%) 37.1 37.1 3.59
Means followed by the same letter within a column are not significantly different (P > 0.05) from each other,
LSD= Least significant difference, CV= Coefficient of variation, ns= non significant, SE (±) = standard error of
mean. *, **, *** represent significant at 5%, 1% and 0.1% level of significance respectively.
Physical parameter; Grading of potatoes
Small sized potato (1-2.5 cm)
The analysis of variance showed that there was significant difference (P<0.05) in the number
of small sized potato per m2 in main effect of inter row spacing and significant at P<0.01 in
the main effect of intra row spacing and there was no any significant interaction effect
between the two factors (Table 9). The highest number of small sized potatoes per m2 (60.25)
was found in 30cm which was at par with 45 cm and followed by 60 cm inter row spacing
whereas in the case of intra row spacing, the highest number of small sized potatoes per m2
(66.06) was found in 20cm which was followed by 30 cm and 40 cm intra row spacing

Journal of Agriculture and Natural Resources (2019) 2(1): 282-300
ISSN: 2661-6270 (Print), ISSN: 2661-6289 (Online)
DOI: https://doi.org/10.3126/janr.v2i1.26092
295
respectively.
Similarly, weight of small sized seed per m2 was found significant (P<0.01) in the main effect
of inter row spacing and significant at P<0.001 in the main effect of intra row spacing. The
highest weight of small sized seed (1.45 kg/m2) was found in 30 cm which was followed by
45 and 60 cm inter row space respectively. In case of intra row spacing, highest weight of
small sized potatoes (1.59 kg/m2) was found in 20 cm which was followed by 30 cm and 40
cm intra row space respectively.
Table 9. Effect of different plant configuration and row spacing on grading of potato at
Dadeldhura, Nepal Inter row spacing(cm)
Small sized seed(1-2.5cm)
Medium sized seed(2.5-3.5cm)
Large sized seed(>3.5cm)
No per m2 Kg per m
2 No per m
2 Kg per m
2 No per m
2 Kg per m
2
60 (1 RB) 31.62(1.50)b 0.68(0.22)
b 51.17
c 1.91
b 8.67 0.89
45 (2 RB) 45.70(1.66)ab
0.99(0.30)b 70.39
b 2.48
b 5.34 0.5
30 (3RB) 60.256(1.78)a 1.45(0.39)
a 97.25
a 3.25
a 5.18 0.48
SE(±) 0.0586 0.029 5.1 0.22 1.09 0.2
LSD0.05 0.176 0.0885 15.3 0.674 ns ns
F-test * ** *** *** ns ns
Intra row spacing (cm)
20 66.06(1.82)a 1.59(0.41)
a 94.36
a 3.17
a 6.23 0.65
30 42.65(1.63)b 0.90(0.28)
b 65.01
b 2.43
b 6.83 0.62
40 30.90(1.49)b 0.67(0.22)
b 59.44
b 2.04
b 6.14 0.59
SE(±) 0.0586 0.029 5.1 0.22 1.09 0.24
LSD0.05 0.176 0.0885 15.3 0.674 ns ns
F-test ** ** *** ** ns ns
CV (%) 10.6 28.7 21 26.4 ns ns
Means followed by the same letter within a column are not significantly different (P > 0.05) from each other,
LSD= Least significant difference, CV= Coefficient of variation, ns= non significant, SE (±) = standard error of
mean. The figures inside the parenthesis are the log transformed values. *, **, *** represent significant at
5%,1% and 0.1% level of significance respectively.
Medium sized potato (2.5-3.5 cm)
The analysis of variance showed that there was significant difference (P<0.001) in the
number of medium sized potato per m2 in main effect both of intra row spacing (Table 9).
The highest number of medium sized potatoes per m2 (97.25) was found in 30cm which was
followed by 45 cm and 60 cm inter row spacing whereas in the case of intra row spacing, the
highest number of medium sized potatoes per m2 (94.36) was found in 20cm which was
followed by 30 cm and 40 cm intra row spacing respectively. There was significant
interaction (P<0.05) between the two factors in the number of medium sized potato per m2. In
case of interaction, the highest number of medium sized potatoes was found in 30×20 spacing
which was at par with 45×20 and followed by 30×30,30×40,60×30,60×20,45×40,45×30 and
lowest in 60×40 spacing (Fig 4)
Similarly, weight of medium sized seed per m2 was found significant (P<0.001) in the both
main effects of inter row spacing and intra row spacing but not significant in the interaction
effect of the two factors (Table 12). The highest weight of medium sized seed (97.25 kg/m2)
was found in 30 cm which was followed by 45 and 60 cm inter row space respectively. In
case of intra row spacing, highest weight of small sized potatoes (94.36 kg/m2) was found in
20 cm which was followed by 30 cm and 40 cm intra row space respectively.

Journal of Agriculture and Natural Resources (2019) 2(1): 282-300
ISSN: 2661-6270 (Print), ISSN: 2661-6289 (Online)
DOI: https://doi.org/10.3126/janr.v2i1.26092
296
Fig 4: Relationship between Inter-Intra row spacing and Medium Sized tuber number
Large sized potato (>3.5 cm)
The analysis of variance showed that there was no any significant difference (P<0.05) in both
number and yield of large sized potato per m2 in both main and interaction effect of both
factors (Table 9). About 6-8 number and 0.4-.0.9 kg per m2 of large sized tuber were found in
all treatments. The non significant result may be due to treatment design, soil conditions,
experimental setup which differs from the previous similar experiment done by other
researchers.
Correlation analysis of growth and yield parameters Correlation analysis among growth and yield parameters showed that number of
leaves(r=0.98), leaf area index (r=0.96) was positively correlated at P<0.001 with average
tuber weight (Fig 5). Similarly, germination days, flowering days, maturity days, average
number of tillers, number and weight of marketable tubers, fresh weight of haulm and harvest
index also positively correlated with average weight of tubers. Average weight of tubers
negatively correlated with plant height, number of tillers and unmarketable tuber number. It
means increase in plant height, tiller number and unmarketable tuber decrease the total
weight of tubers but increase linearly with number of leaves, leaf area index and marketable
tuber number and its weight.

Journal of Agriculture and Natural Resources (2019) 2(1): 282-300
ISSN: 2661-6270 (Print), ISSN: 2661-6289 (Online)
DOI: https://doi.org/10.3126/janr.v2i1.26092
297
Fig 5: Correlogram showing correlation analysis of yield and growth parameters.
Note: The scale in the right side and values inside the columns indicates Pearson Correlation
value (>0= positively correlated, <0 = negatively correlated). Circle size and intensity
(Green) in the graph increases along with level of Positive correlation whereas intensity of
red color and circle size increases along with the level of negative correlation. R critical
value; R0.05=0.328, R0.01=0.445 and R0.001= 0.568
GEM= Days to germination, FLW= Days to flowering, MT= Days to maturity, PH= Plant
height, NL = Number of leaves, CP= Canopy diameter, NT= Number of tillers, LA= Leaf
Area, LAI= Leaf Area Index, ANT= Average number of tubers per, AW= Average weight of
tuber , UT_W= Average weight of unmarketable tubers, MT_W= Average weight of
marketable tubers, UT_N= Number of unmarketable tubers, MT_N= Number of marketable
tubers, FW= Fresh weight of tubers, HI_m2= Harvest index
DISCUSSION On 50 % germination, flowering and maturity that there was no significant difference effects
of inter and intra row spacing on potato which was also concluded by Arega et.al (2018).
This might be the fact that these traits related to germination, flowering and maturity are
controlled by genetic factors rather than environmental factors like plant spacing. The
findings showed that change in inter and intra row spacing does not change the number of
tillers. Similarly, Endale and Gebremedhin (2008) reported that main stem numbers depend

Journal of Agriculture and Natural Resources (2019) 2(1): 282-300
ISSN: 2661-6270 (Print), ISSN: 2661-6289 (Online)
DOI: https://doi.org/10.3126/janr.v2i1.26092
298
on seed bed conditions, planting method and seed tuber characteristics such as number of
eyes or sprouts, size, physiological age and variety. In growth parameters like plant height,
leaf area, number of leaves, canopy diameter was found highest in higher row spacing due to
increase in vegetative growth as a result of less competition in wider spaced plants
comparative to narrow spaced plants which was also reported by Bikila et al. (2014),
Gulloglu and Argioglu (2009), LawOgbomo and Egharevba, (2009) Tesfaye et al. (2012)
Zamil et al. (2010) Zebarth et al., (2006)
Yield parameters like total number and yield of tubers m-2
, number and weight of marketable
tubers m-2
,harvest index, number and yield of small sized tubers m-2
, and number and yield
of of medium sized tubers m-2
was found higher in lower inter and intra row spacing because
of large number of medium and small sized tubers having higher proportion in total yield and
number of tubers produced in narrow spaced plants compared to closed spaced plants which
was also reported by Gulluoglu and Arioglu (2009), Zamil et al., (2010) Jamaati et al. (2010),
Tahmorespour et al. (2013), Ayupov et al. (2014), Zabihi et al. (2010), Masarirambi et al.
(2012), Tesfaye et al. (2012), Harnet et al. (2014), Bikila et al. (2014). Increased in yield and
yield attributes in many rows per bed system compared to conventional system of planting
configuration was in accordance with Tarkalson et al.(2011).
CONCLUSION
The study concluded that 30 cm inter row with 3 rows per bed and 20 cm intra row spacing
resulted in higher weight and number of total and and marketable tubers. The higher
marketable tuber number was found in the treatment combinations like 30×20 cm, 45×20
and 30×30 spacing. The highest harvest index was also found in 30 cm inter row with 3 rows
per bed and 20 cm intra row spacing. In case of grading, to get small and medium sized
potatoes which can be used for seed purpose were also found higher in 30 ×20 spacing. So
this research recommends to use 30 or 45 intra row with triple rows per bed and 20 inter row
spacing as possible which can provide greater total and marketable yield.
ACKNOWLEDGEMENT
This research was technically and financially supported by Agriculture and Forestry
University and Prime Minister Agriculture Modernization Project- Superzone, Dadeldhura.
REFERENCES
Abbas, G., Hafiz, I.A., Abbasi, N.A., & Hussain, A.(2012). Determination of processing and
nutritional quality attributes of potato genotypes in Pakistan. Pakistan Journal of
Botany, 44 (1), 201-208.
ABPSD., (2015). Statistical information on nepalese agriculture. Agribusiness Promotion and
Statistical Division, Ministry of Agricultural Development, Government of Nepal,
Kathmandu, Nepal.
Arega, A., Tekalign, A., Solomon, T., & Tekile, B. (2018). Effect of Inter and Intra Row
Spacing on Tuber Yield and Yield Components of Potato (Solanum tuberosum L.) in
Guji zone, Southern Ethiopia. Journal of Advanced Plant Sciences, 1, 102.
Ayupov, Y., Apushev, A., Zamalieva, F.F., & Gabdulov, M., 2014. The effect of planting
density on the crop yield, the structure and the quality of middle-early variety of

Journal of Agriculture and Natural Resources (2019) 2(1): 282-300
ISSN: 2661-6270 (Print), ISSN: 2661-6289 (Online)
DOI: https://doi.org/10.3126/janr.v2i1.26092
299
potato in the west Kazakhstan. Life Science Journal, 11(8), 545-548.
Bikila, A., Derbew, B., & Adugna, D., (2014a). Effects of Inter and Intra row Spacing on
Potato (Solaanum tuberosum L.) Seed and Ware Tuber Seedling Emergency and
Establishment at Bako, Western Ethiopia. Journal of Agronomy, 13(3), 127-130.
Bussan, A. J., Mitchell, P. D., Copas, M. E., & Drilias, M. J. (2007). Evaluation of the effect
of density on potato yield and tuber size distribution. Crop Science, 47(6), 2462-
2472.40.
Dahiru, T. (2008). P-Value, a true test of statistical significance? A cautionary note. Annals of
Ibadan Postgraduate Medicine, 6(1), 21–26
Endale, G., & Gebremedhin, W.G., (2001). Effects of Spatial Arrangement on Tuber Yields of
Some Potato Cultivars. African Crop Science Journal, 9(1), 67-76.
FAO , (2010). Strengthening potato value chains: The International Year of the Potato, Rome,
Italy. Retrieved from www.potato2010.org/en/world/africa.html.
Gomez A. A., & Gomez K. A. (1984) Statistical procedures for agricultural research, 6, 680.
Gulluoglu, L., & Arıoglu, H., (2009). Effects of seed size and in row spacing on growth and yield of early potato in a Mediterranean-type environment in Turkey. African Journal
of Agricultural Research, 4 (5), 535-541.
Harnet. A, Derbew, B. and Gebremehdin, W.G., (2014). Effects of Inter-and Intra-Row
Spacing on Seed Tuber Yield and Yield Components of Potato in Ofla Woreda.
African Journal of Plant Science, 8(6), 285-290.
Jamaati-e-Somarin, S.H., Zabihi-e-Mahmoodabad, R., & Yari, A. (2010). Response of
agronomical, physiological, apparent recovery nitrogen use efficiency and yield of
potato tuber (Solanum tuberosum L.), to nitrogen and plant density. American-
Eurasian Journal of Agricultural and Environmental Sciences, 9(1), 16-21.
Kandel, M., & Shrestha J. (2019). Genotype x environment interaction and stability for grain
yield and yield attributing traits of buckwheat (Fagopyrum tataricum Geartn). Syrian
Journal of Agricultural Research, 6(3), 466-476.
Kunwar, C. B., & Shrestha, J. (2014). Evaluating Performance of Maize hybrids in Terai
Region of Nepal. World Journal of Agricultural Research, 2(1), 22-25.
Law-Ogbomo, K.E., & Egharevba, R.K.A. (2009). Effects of planting density and NPK
fertilizer application on yield and yield components of Tomato. World
Journal of Agricultural Sciences, 5, 152158.
Masarirambi, M.T., Mandisodza, F.C., Mashingaidze, A.B., & Bhebhe, E. (2012). Influence of
plant population and seed tuber size on growth and yield components of potato
(Solanum tuberosum). International Journal of Agriculture and Biological Sciences,
14, 545–549.
MoAD. (2015). Statistical Information on Nepalese Agriculture. Ministry of Agriculture
Development. Singh Durbar, Kathmandu, Nepal. Retreived from
http://www.moad.gov.np.
MoF. (2015). Economic Survey Report (2014-2015). Ministry of Finance (MoF), Government
of Nepal, Singh Durbar, Kathmandu, Nepal.
Şanli, A., Karadoğan, T., Erbaş, S., & Tosun, B., 2015. The effects of plant density and eye
number per seed piece on potato (Solanum tuberosum L.) tuber yield. Scientific
Papers-Series of Agronomy, 58, 325-331.
SARPOD. (2014). Annual Report 2070/71 (2013/14). Socioeconomics and Agricultural
Research Policy Division, NARC, Khumaltar, Lalitpur, Nepal.

Journal of Agriculture and Natural Resources (2019) 2(1): 282-300
ISSN: 2661-6270 (Print), ISSN: 2661-6289 (Online)
DOI: https://doi.org/10.3126/janr.v2i1.26092
300
Sharma, H.P., Dhakal, K.H., Kharel, R., & Shrestha, J. (2016). Estimation of heterosis in yield
and yield attributing traits in single cross hybrids of maize. Journal of Maize Research
and Development, 2 (1), 123-132, doi: http://dx.doi.org/10.3126/jmrd.v2i1.16223
Shrestha, J. (2019). P-Value: A true test of significance in agricultural research. Retrieved
from https://www.linkedin.com/pulse/p-value-test-significance-agricultural-research-
jiban-shrestha/
Tahmorespour, M.A., Vishkai, M.N.S., & Soleymani, A. (2013). Effect of Plant Density, Date
and Depth of Cultivation on Yield and Yield Components of Potato Planting in the
Chabahar. International Journal of Agronomy and Plant Production, 4(8), 1890-1897.
Tarkalson, D. D., King, B. A., Bjorneberg, D. L., & Taberna, J. P. (2011). Evaluation of in-
row plant spacing and planting configuration for three irrigated potato
cultivars. American Journal of Potato Research, 88(3), 207-217.
Tesfaye, G., Derbew, B., & Solomon, T., (2012). Yield and growth parameters of potato
(Solanum tuberosum L.) as influenced by intra row spacing and time of earthing up:
In Boneya Degem District, Central Highlands of Ethiopia. International Journal of
Agricultural Research, 7(5), 255-26.
Zabihi-e-Mahmoodabad, R., Jamaati-soaring. S., Khayatnezhad, M., & Gholamin, R. (2010).
Quantitative and Qualitative yield of potato tuber by used of nitrogen fertilizer and
plant density. American-Eurasian Journal of Agricultural and
Environmental Sciences, 9 (3), 310-318.
Zamil, M.F., Rahman, M.M., Rabbani, M.G., & Khatun, T. (2010). Combined effect of
nitrogen and plant spacing on the growth and yield of potato with economic
performance. Journal of Bangladesh Research Publications, 3(3), 1062-1070
Zebarth, B.J., Arsenault, W.J., & Sanderson, J.B. (2006). Effect of spacing and N fertilizer
use efficiency parameters of two potato cultivars. American Journal of Potato
Research, 83, 289-296.