Embed Size (px)
Citation preview
Effects of Pretreatments and Modifiers on Electrochemical Properties of Carbon Paste Electrodes Qijin Chi,+,++ Wolfgang Gopel,+ Tautgirdas Ruzgas,+++>++++ Lo Gorton,+++ and Peter Heiduschka*+++++ + University of Tiibingen, Institute of Physical and Theoretical Chemistry, Auf der Morgenstelle 8, D-72076 Tiibingen, Germany
Present address: Laboratory of Electroanalytical Chemistry, Changchun Institute of Applied Chemistry, Chinese Academy of Sciences, Jilin 130022, P.R. China University of Lund, Department of Analytical Chemistry, P.O. Box 124, S-22100 Lund, Sweden Present address: Institute of Biochemistry, Mokslininku 12, 2600 Vilnius, Lithuania
+++++University of Munster, Eye Hospital, Experimental Ophthalmology, D-48 149 Munster, Germany
Received: July 30, 1996 Final version: November 14, 1996
Abstract The electrochemical properties of carbon paste electrodes (CPEs), including unmodified and modified with protein and polycations, were investigated by impedance spectroscopy (IS) using femcyanide and ferrocene monocarboxylic acid (FcMA) as redox probes. Various electrochemical pretreatments were applied to the unmodified CPE. The heterogeneous charge transfer rate constant of ferro/femcyanide couple is enhanced by 2 to 10 times compared with that obtained at untreated electrodes. It was found that for femcyanide the more suitable pretreatments are successive cyclic voltammetric scans, cathodization and a square wave-like stepping rather than high-potential anodization. However, the pretreatment only exhibits a slight effect on the kinetics of FcMA. At the CPEs containing modifier, the electron transfer rate of the redox couple depends more on the pH of electrolyte solution if ferro/femcyanide is used. The results can be explained by the differently charged states of the CPEs that were caused by the protonation or deprotonation of the modifiers in various pH solutions and demonstrate the importance of the electrostatic interaction on the kinetics of the highly polar species such as ferricyanide. The different adsorptive behavior of femcyanide and FcMA is also discussed.
++
+++ +t++
Keywords: Carbon paste, Impedance spectroscopy, Cyclic voltammetry, Electrochemical pretreatment, Bovine serum albumin, Polyethyleneimine, Kanamycin, Chitosan glutamate
1. Introduction
As one of the most important composite electrodes, the carbon paste electrode (CPE) was invented by Adams in 1958 [l]. It normally consists of electrically conducting graphite powder and an organic liquid which is immiscible with contacting aqueous solution (2-41. During the past 15 years, CPE has received great attention and has been extensively used in the fields of electroanalysis and biosensors [S-71. The broad application of CPEs is based mainly on its attractive advantages such as low cost, a wide potential window, ease of preparation and renewal and convenient modification.
Although modification of CPE began in 1964 [8, 91, real chemical modification of CPE was first attempted by Cheek and Nelson who introduced complexing functional groups to the electrode surface. The resulting electrode was used in the preconcentration of silver [lo]. Later, Yao and Musha reported another modification method of dissolving a modifier in the organic liquid for immobilisa- tion of the electroactive species [l 11. Nevertheless, the break-through progress regarding widespread employment of the CPEs has been achieved after a more convenient modification way by directly mixing a modifier with carbon paste created by Ravichandran and Baldwin in 1981 [12]. Since then, the number of publications dealing with the modified CPEs exhibits an exponential increase. Since 1988, main development in this field has involved doping carbon paste with a variety of biological materials, such as proteins (e.g., enzymes), plant tissues and whole microbial cells, and the functionalised electrodes can be applied for the determination of phenols, lactate, glucose and other substances 161.
So far, the application of the CPEs has been extended to almost all fields of electroanalysis [5, 61, but only a little understanding is achieved with respect to their structure, electrochemical behavior and mechanism of action. At the early stage, the effects of paste composition and surface pretreatment on reaction kinetics and capacitance at the CPEs have been studied [13-161. Attempts have been made to assess surface properties of CPEs by scanning
tunneling [ 171, electron [ 181, and electrochemical scanning [ 191 microscopy as well as by electrogenerated chemiluminescence [20]. Kulys et al. recently studied electrochemical properties and corresponding possible mechanism of the unmodified and modified CPEs using chronoamperometry and cyclic voltammetry 121, 221. The surface structure of the CPE is very complex due to many feasible factors. Further investigations on surface properties of the CPE itself are necessary by using more effective techniques in order to understand better the relationships between structure and behavior. Impedance spectroscopy (IS) should be a useful tool for this purpose, because IS measurements are performed by a potential perturbation in a range of only a few mV which does not affect the surface structure of the electrode. Recently, this technique has been successfully used by us to explore influence of electrochemical pretreatment on surface properties of glassy carbon electrodes [23, 241. There are also first attempts to investigate properties of graphite-polymer composites by impedance spectroscopy [25].
The present work aims at obtaining more knowledge about effects of electrochemical pretreatment and modifiers on the surface structure and electrochemical properties of CPEs by IS measurements. Five different modifiers presented already in [21] have been used, which were shown previously to have beneficial properties on enzyme- modified carbon paste electrodes in terms of increased substrate response current densities and improved long-term stabilities [26-301: bovine serum albumin (BSA), polyethyleneimine (PEI), chitosan glutamate (CHI), kanamycin (KAN) and a co-polymer from vinylpyrrolidone and dimethylaminoethyl methacrylate (COP).
2. Experimental
2.1. Reagents and Materials
Graphite powder and paraffin oil were obtained from Fluka (Buchs, Switzerland). Bovine serum albumin (BSA), polyethyleneimine
Electroanalysrs 1997, 9, No. 5 0 VCH Verlagsgesellschaft mbH, 0-69469 Wemheim, 1997 1040-0397/97/0S03-03S7 $10.00+.25/0
358 Q. Chi et al.
(PEI) and kanamycin (KAN) were purchased from Sigma (St. Louis, MO, USA). Chitosan glutamate (CHI) was obtained as a gift from Protan Biopolymers (Drammen, Norway). Copolymer 845 (COP) (CAS Registry No. 30581-59-0) (GAF Chemicals, Cat. No. 047 19010; ISP International, Guildford, UK), namely a copolymer of vinylpyrrolidone and dimethylaminoethyl methacrylate, was provided by Dr. T. Gibson, University of Leeds, Leeds, UK. The structures of the four modifiers are illustrated in Scheme 1.
r
R = O$H,CH,CH,CHCOOH
0 NH*
polyethylene imine (PEI) pK, ca. 8.9-9.5 I
FH,OH
HO mo
NH, H
chitosan glutamate (CHI) pK, ca. 6.5-7.0
c
kanamycin (KAN) co-polymer 845 (COP) pK, above 8 7 pK, around 9.0
Scheme 1. Structures and suggested pK, values of the modifiers used in this work.
Other reagents including KCl, phosphates, potassium ferri- cyanide and ferrocene monocarboxylic acid (FcMA) were of analytical grade. Bidistilled water obtained from a Milli-Q-unit (Millipore Inc., Molsheim, France) was used in the preparation of all solutions.
2.2. Preparation of Carbon Paste Electrodes
Carbon pastes were prepared similarly as reported elsewhere [21]. Unmodified carbon paste was prepared by adding 8 m L of 0.05 M phosphate buffer (pH 6) to 2 g of graphite powder, and the mixture was allowed to dry for 2 days under reduced pressure in a desiccator. Subsequently, 0.8 mL. of paraffin oil was added and mixed in a mortar to produce the final paste. Carbon paste modified with BSA was prepared by incubating 2 g of graphite powder with 4 mL of a 0.5 % (w./w.) solution of BSA dissolved in 0.05M phosphate buffer (pH 6) and adding 4mL of the same buffer solution. The mixture was allowed to dry in a desiccator for 2 days. Finally, 0.8 mL of paraffin oil was added and mixed in a mortar. Carbon pastes containing BSA and additionally the modifiers COP, PEI, KAN or CHI were prepared by incubating 2 g of graphite powder with 4 mL of a solution containing 0.5 % (w./w.) of the modifier dissolved in 0.05 M phosphate buffer at pH 6 and additionally with 4 mL of 0.5 % (w./w.) BSA in the same buffer solution. The mixtures were dried and mixed in a mortar with paraffin oil as described above.
The CPEs were fabricated by pressing various types of carbon paste into a plastic tube (3mm inner diameter) with a geometric surface area of 0.071 cm2. Copper wires were inserted into the CP as electric contact. The actual surface areas of the CPEs were obtained
from cyclic voltammograms. The CPEs were smoothed manually by a clean filter paper before use.
2.3. Electrochemical Impedance Measurements and Data Treatment
All measurements were carried out in a conventional electro- chemical cell containing a three-electrode system with a large platinised platinum sheet shaped as a disk (diameter ca. 2.5 cm) as counter electrode and a silver wire as reference electrode. The AC impedance measurements were performed with the PARC M398 electrochemical impedance system (EG & G Princeton Applied Research, Princeton, USA) consisting of a potenhostat Model 273 and a lock-in amplifier model 5210 coupled via an IEEE-interface (National Instruments, Austin, Texas, USA) to a 486 PC. An AC voltage of 5 mV in amplitude (peak to peak) with a frequency range of 50 or 100 mHz to 100 kHz was superimposed on the DC potential and applied to the studied electrodes. The DC potential was always set up at equilibrium potential of the used redox couple. The supporting electrolyte was 10 mM phosphate buffer solution containing 1 M KCI for the ferricyanide system measurements. The same buffer solution with 10 % ethanol (vh.) was used in FcMA experiments.
First simulations of the impedance spectra to obtain the parameters of supposed equivalent circuits were made with the commercial program “Equivalent Circuit” by Dr. Bernard A. Boukamp, University of Twente, Netherlands. All further calculations to obtain the parameters were performed using programs written by P.H. in Borland’s Turbo Pascal [23]. In all calculations, diffusion coefficients of 7 . 8 ~ lop6 and 6 . 0 ~ lop6 em's-' for ferricyanide and FcMA, respectively, were used [31, 321. All reported data were taken from the average values of two or three independent measurements.
2.4. Electrochemical Pretreatment
In all electrochemical pretreatment experiments, a saturated calomel reference electrode (SCE) was used. The pretreatment procedures were chosen empirically based on our knowledge on the behavior of carbon as electrode material. The unmodified CPE was pretreated electrochemically by the following four modes:
a) Electrochemical anodisation: Polarisation of the electrode at 1.4 or 1.8 V for 40 s.
b) CV scanning: Successive cycling between -0.8 to 1.3V at a scan rate of 0.1 v.s-’ for 5 to 10 min.
c) Electrochemical cathodisation: A potential of - 1.8 V was applied to the electrode for 180 s.
d) A square wave-like stepping (SWLS) similar to a previous report [23] was taken as one of the pretreatment modes. Such a treatment mode was performed by stepping the potential to anodic (1.3 V) and cathodic (-0.8V) directions from the equilibrium potential, respectively, and holding the potential at the respective endpoint value for 0.5 s. Usually, it takes 10 to 12min to obtain a good response of the electrode by this treatment.
Electrochemical pretreatment was always performed in the same solution in which the measurement was carried out subsequently.
3. Results and Discussion
3.1. Unmodified CPE (Graphite + Oil)
Different factors influencing the electrochemical response of carbon electrodes are listed in a comprehensive review of carbon
Electrnnnalysis 1997, 9. No. 5
Electrochemical Properties of CPEs 359
150 I [FA] T A 100
50
0
-50
-1 00
-1501 I
-0 2 0 0.2 0.4 0.6
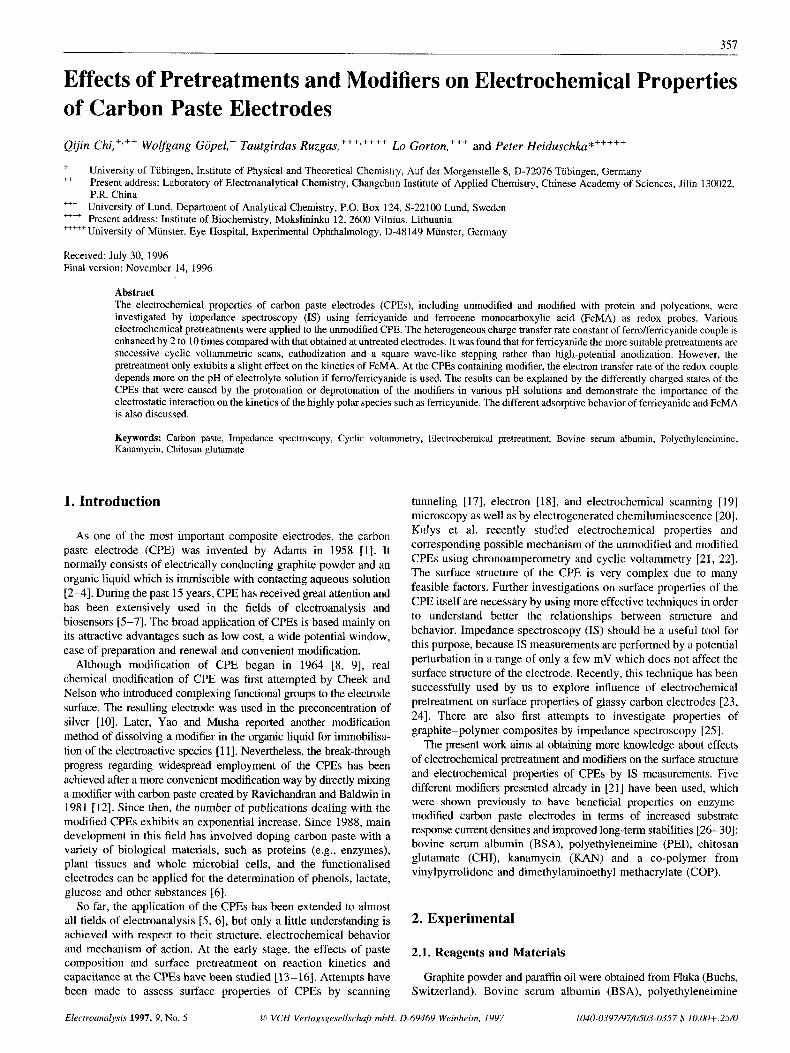
Fig. 1. Cyclic voltammograms of lOmM ferricyanide @H 5.3) obtained at the CPE. Scan rate 50 mV s-‘, 0) untreated CPE, A) CPE pretreated with CV scan. The lines represent calculated voltammograms.
electrodes [33]:
i) The distribution of edge vs. basal plane areas. At CPE, the areas with one orientation are very small, and no preferred orientation is expected.
ii) The electrode roughness. CPEs can be made with a very smooth surface, but this surface is not homogeneous due to the presence of organic liquid.
iii) Impurities at the surface (physi- or chemisorbed). The organic liquid itself is expected to act like an “impurity” at the surface.
Other factors are, e.g., the oxidation state of the carbon and the adsorptive behavior of the electrochemically active substrate in each step of the redox process. The presence of oxygen in the surface oxide can affect access of the substrate to the surface (if electrostatic interactions come into play) and the electron transfer.
Similar to other types of carbon electrodes, the CPEs have to be pretreated in some cases in order to improve the response sensitivity and selectivity. Many different techniques have been developed for this purpose. Electrochemical pretreatments are the most favorable methods, because they are convenient, very effective and can be performed in situ. Four different pretreatment modes were carried out here to investigate the changes of electrochemical properties of the CPE. Figure 1 shows cyclic voltammograms of 10 mM ferricyanide at the CPE before and after treatment. For the untreated case, a peak separation of ca. 120mV was observed, and the corresponding heterogeneous rate constant ks,h was 0.0014cm s-’. This indicates that the electrode exhibits a relative low activity compared to gold or platinum. Similar values were also obtained by other authors [3, 161.
Obvious improvement of ks,h has been achieved by pretreatments. As an example, after CV scan pretreatment, the peak separation decreases to 75 rnV, and ks,h is enhanced to 0.0084cm s-’. The detailed comparison of the parameters after the different pretreatment procedures is summarized in Table 1.
Since IS measurements usually enable one to provide more
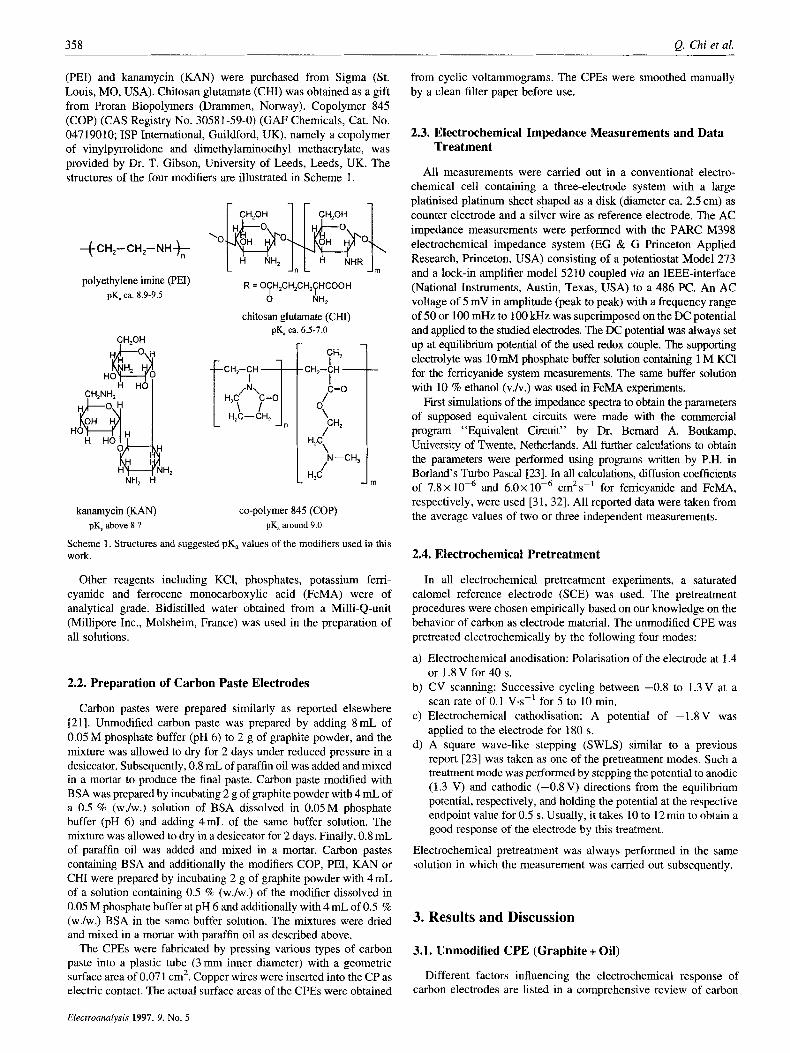
concrete information than that of CV ones, the following discussion will be based mainly on IS results. The equivalent circuit shown in Scheme 2 is demonstrated to be a suitable model for the systems studied in this article. The values of Rads and Cads reflect the contribution of the adsorbed species to the observed impedance behavior. &,ds is attributed to the surface concentration of an adsorbed intermediate, and Cads stands for the rate of its ad- or desorption [34]. For diminishing adsorptive effects, the values of both components approach zero. Some authors arrange the element consisting of Rads and cad, in parallel in series to R,, and the Warburg W, as it had been shown also in [23]. However, we could not fit our data with such an equivalent circuit.
Due to the irregular structure of carbon paste and the electrode
QD,
Scheme 2. Equivalent circuit used in the calculations with elements including electrolyte resistance (Re,), charge transfer resistance (&), Warburg element for reactant transport by diffusion (W), adsorption resistances (Rads), double layer capacitance (QoL) and adsorption capacitance (Qad,). Corresponding circuit description code in Boukamp’s program is R([RW]Q)(RQ) because both capacitances are considered as so-called constant-phase elements Q.
roughness, constant phase elements Q have been used instead of ideal capacitances C :
Q = c( jw)+
where $ is a number between 0 and 1. Therefore, the values of CDL or cad,, respectively, do not represent real capacitances. The exponent $ reflects the extent of deviation from an ideal capacitance behavior (where $ would be equal to 1). Transport properties of the component come into play increasingly with decreasing J / . With J / = 0.5, a Warburg-like diffusional behavior is reached, and with $ = 0, the component has properties of an ideal resistor. For accurate treatment, capacitances C, (x = DL or ads) are written as Q,. More extensive treatment of constant phase elements and their relation to electrode roughness can be found, e.g., in [34-361.
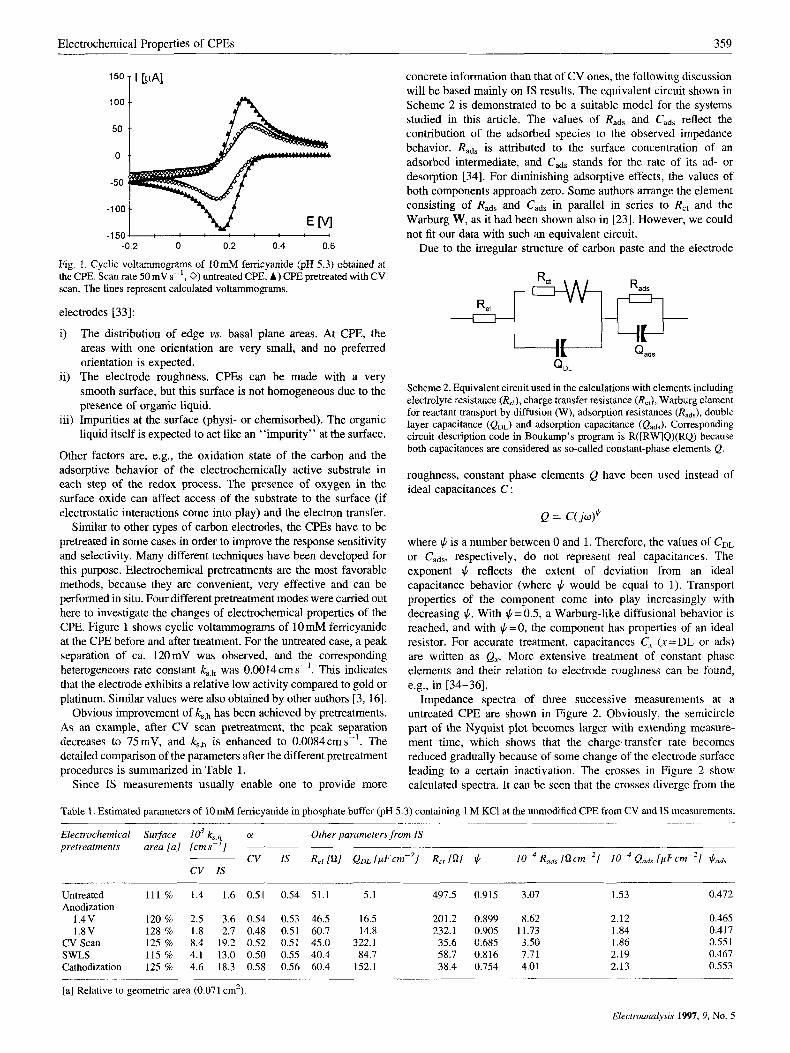
Impedance spectra of three successive measurements at a untreated CPE are shown in Figure 2. Obviously, the semicircle part of the Nyquist plot becomes larger with extending measure- ment time, which shows that the charge-transfer rate becomes reduced gradually because of some change of the electrode surface leading to a certain inactivation. The crosses in Figure 2 show calculated spectra. It can be seen that the crosses diverge from the
Table 1. Estimated parameters of 1OmM ferricyanide in phosphate buffer (pH 5 3) containing 1 M KC1 at the unmodified CPE from CV and IS measurements
Electrochemical Surface Id k, J , 01 Other parameters from IS pretreatments area [a] tcm s-’]
- _ _ - ~~~~ _--____ -
CV 1s R,I IQl QDL [pFcm-2/ R,, IQl $ Rads [ Q c K 2 / Qads IpFcm-’] cv IS
~
Untreated 111 % 1.4 1.6 0.51 0.54 51.1 5.1 Anodization
1.4V 120 % 2.5 3.6 0.54 0.53 46.5 16.5 1.8V 128 % 1.8 2.7 0.48 0.51 60.7 14.8
CV Scan 125 % 8.4 19.2 0.52 0.51 45.0 322.1 SWLS 115 % 4.1 13.0 0.50 0.55 40.4 84.7 Cathodization 125 % 4.6 18.3 0.58 0.56 60.4 152.1
497.5 0.915
201.2 0.899 232.1 0.905 35.6 0.685 58.7 0.816 38.4 0.754
3.07 1.53 0.472
8.62 2.12 0.465 11.73 1.84 0.417 3.50 1.86 0.551 7.71 2.19 0.467 4.01 2.13 0.553
[a] Relative to geometric area (0.071 cm’).
Electroanalysis 1991, 9, No. 5
360 Q. Chi et al.
0.6 t
0 0.2 0.4 0.6 0.8 1.0 1.2 1.4 1.6 1.8 2.0
Fig. 2. Nyquist plots of three successive measurements with 1OmM femcyanide (pH 5.3) at untreated CPE. 0) first measurement, 0) second measurement, 0) third measurement. The crosses represent calculated impedance spectra. Time interval between start of the measurement was ca. 30 min, whereas each measurement took ca. 20 min.
200 -Z"Q] T 150
100
1
50
n
1 0 0 ~
0 50 100 150 200 250 300 350 400 450
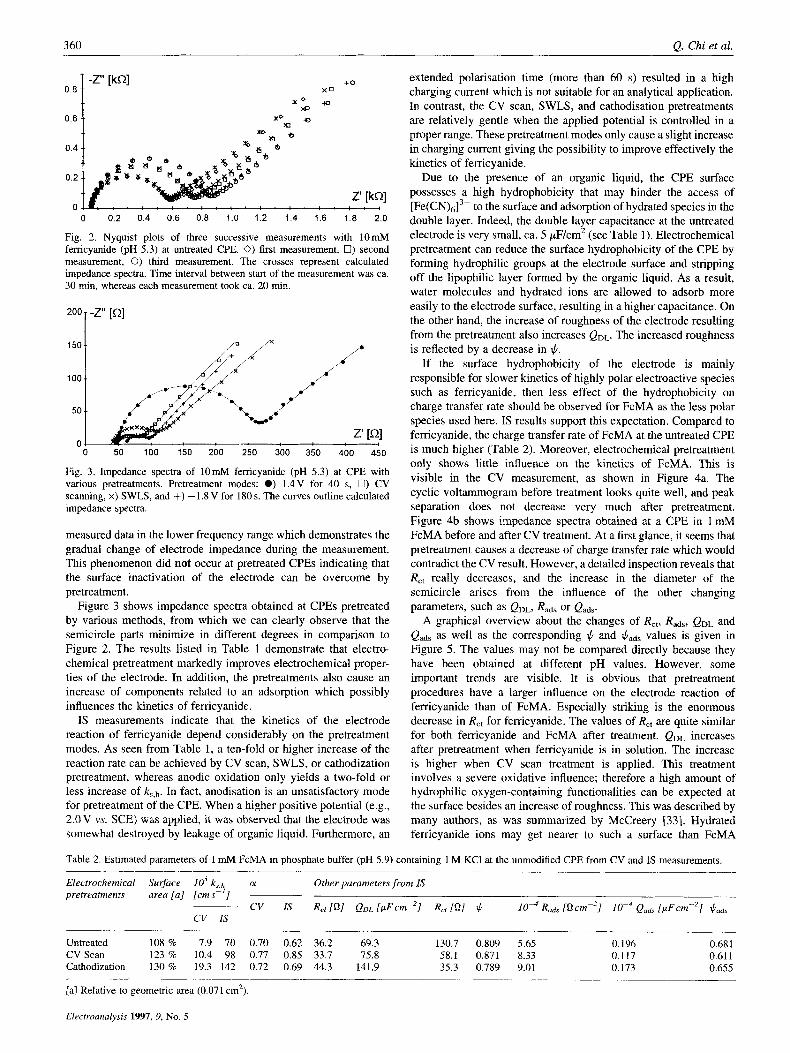
Fig. 3. Impedance spectra of 1OmM ferricyanide (pH 5.3) at CPE with various pretreatments. Pretreatment modes: 0) 1.4V for 40 s, 0) CV scanning, x) SWLS, and +) -1.8V for 180 s. The curves outline calculated impedance spectra.
measured data in the lower frequency range which demonstrates the gradual change of electrode impedance during the measurement. This phenomenon did not occur at pretreated CPEs indicating that the surface inactivation of the electrode can be overcome by pretreatment .
Figure 3 shows impedance spectra obtained at CPEs pretreated by various methods, from which we can clearly observe that the semicircle parts minimize in different degrees in comparison to Figure 2. The results listed in Table 1 demonstrate that electro- chemical pretreatment markedly improves electrochemical proper- ties of the electrode. In addition, the pretreatments also cause an increase of components related to an adsorption which possibly influences the kinetics of ferricyanide.
IS measurements indicate that the kinetics of the electrode reaction of ferricyanide depend considerably on the pretreatment modes. As seen from Table 1, a ten-fold or higher increase of the reaction rate can be achieved by CV scan, SWLS, or cathodization pretreatment, whereas anodic oxidation only yields a two-fold or less increase of kqn. In fact, anodisation is an unsatisfactory mode for pretreatment of the CPE. When a higher positive potential (e.g., 2.0V YS. SCE) was applied, it was observed that the electrode was somewhat destroyed by leakage of organic liquid. Furthermore, an
extended polarisation time (more than 60 s) resulted in a high charging current which is not suitable for an analytical application. In contrast, the CV scan, SWLS, and cathodisation pretreatments are relatively gentle when the applied potential is controlled in a proper range. These pretreatment modes only cause a slight increase in charging current giving the possibility to improve effectively the kinetics of ferricyanide.
Due to the presence of an organic liquid, the CPE surface possesses a high hydrophobicity that may hinder the access of [Fe(CN),I3- to the surface and adsorption of hydrated species in the double layer. Indeed, the double layer capacitance at the untreated electrode is very small, ca. 5 lF/cm2 (see Table 1). Electrochemical pretreatment can reduce the surface hydrophobicity of the CPE by forming hydrophilic groups at the electrode surface and stripping off the lipophilic layer formed by the organic liquid. As a result, water molecules and hydrated ions are allowed to adsorb more easily to the electrode surface, resulting in a higher capacitance. On the other hand, the increase of roughness of the electrode resulting from the pretreatment also increases QDL. The increased roughness is reflected by a decrease in $.
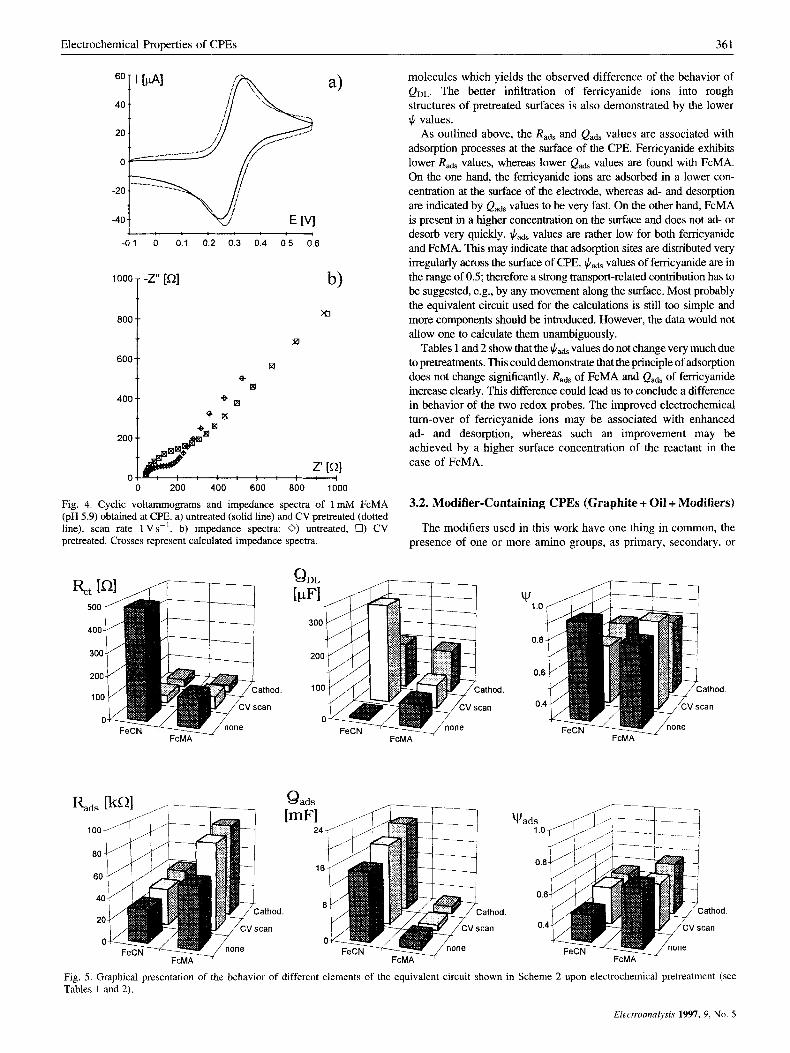
If the surface hydrophobicity of the electrode is mainly responsible for slower kinetics of highly polar electroactive species such as femcyanide, then less effect of the hydrophobicity on charge transfer rate should be observed for FcMA as the less polar species used here. IS results support this expectation. Compared to ferricyanide, the charge transfer rate of FcMA at the untreated CPE is much higher (Table 2). Moreover, electrochemical pretreatment only shows little influence on the kinetics of FcMA. This is visible in the CV measurement, as shown in Figure 4a. The cyclic voltammogram before treatment looks quite well, and peak separation does not decrease very much after pretreatment. Figure 4b shows impedance spectra obtained at a CPE in 1 mM FcMA before and after CV treatment. At a first glance, it seems that pretreatment causes a decrease of charge transfer rate which would contradict the CV result. However, a detailed inspection reveals that R,, really decreases, and the increase in the diameter of the semicircle arises from the influence of the other changing parameters, such as QDL, Rads or Qads.
A graphical overview about the changes of R,,, Rads, QDL and Qads as well as the corresponding $ and Gads values is given in Figure 5. The values may not be compared directly because they have been obtained at different pH values. However, some important trends are visible. It is obvious that pretreatment procedures have a larger influence on the electrode reaction of ferricyanide than of FcMA. Especially striking is the enormous decrease in R,, for ferricyanide. The values of R,, are quite similar for both ferricyanide and FcMA after treatment. QDL increases after pretreatment when ferricyanide is in solution. The increase is higher when CV scan treatment is applied. This treatment involves a severe oxidative influence; therefore a high amount of hydrophilic oxygen-containing functionalities can be expected at the surface besides an increase of roughness. This was described by many authors, as was summarized by McCreery [33]. Hydrated ferricyanide ions may get nearer to such a surface than FcMA
Table 2. Estimated parameters of I mM FcMA in phosphate buffer (pH 5.9) containing 1 M KCI at the unmodified CPE from CV and IS measurements.
Electrochemical Surface Id k8,h 01 Other parameters from IS pretreatments area [a] [cm s-']
..._________ ~~ ~
CV IS 4 1 [Ql QDL [ ~ F c m - ~ l Rc.r [Ql J / lo-' Rads [ Q C ~ T - ~ ] Qad, [pFcm-21 cv IS
Untreated 108 % 7.9 70 0.70 0.62 36.2 69.3 130.7 0.809 5.65 0.196 0.68 1 CV Scan 123 % 10.4 98 0.77 0.85 33.7 75.8 58.1 0.871 8.33 0.117 0.61 I Cathodization 130 % 19.3 142 0.72 0.69 44.3 141.9 3.5.3 0.789 9.01 0.173 0.655
[a] Relative to geometric area (0.071 cm'). __________
Electmanalysis 1997, 9, No. 5
Electrochemical Properties of CPEs 361
J -0.1 0 0.1 0.2 0.3 0.4 0.5 0.6
800
600 - -
400-
+
molecules which yields the observed difference of the behavior of QDL. The better infiltration of ferricyanide ions into rough structures of pretreated surfaces is also demonstrated by the lower $ values.
As outlined above, the Rads and Qads values are associated with adsorption processes at the surface of the CPE. Femcyanide exhibits lower Rads values, whereas lower Qads values are found with FcMA. On the one hand, the ferricyanide ions are adsorbed in a lower con- centration at the surface of the electrode, whereas ad- and desorption are indicated by Qads values to be very fast. On the other hand, FcMA is present in a higher concentration on the surface and does not ad- or desorb very quickly. values are rather low for both ferricyanide and FcMA. This may indicate that adsorption sites are distributed very irregularly across the surface of CPE. $ads values of femcyanide are in the range of 0.5; therefore a strong transport-related contribution has to be suggested, e.g., by any movement along the surface. Most probably the equivalent circuit used for the calculations is still too simple and more components should be introduced. However, the data would not allow one to calculate them unambiguously.
values do not change very much due to pretreatments. This could demonstrate that the principle of adsorption does not change significantly. Rads of FcMA and Qads of femcyanide increase clearly. This difference could lead us to conclude a difference in behavior of the two redox probes. The improved electrochemical turn-over of ferricyanide ions may be associated with enhanced ad- and desorption, whereas such an improvement may be achieved by a higher surface concentration of the reactant in the case of FcMA.
Tables 1 and 2 show that the
0 200 400 600 800 1000
Fig. 4. Cyclic voltammograms and impedance spectra of ImM FcMA (pH 5.9) obtained at CPE. a) untreated (solid line) and CV pretreated (dotted line), scan rate 1Vs-'. b) impedance spectra: 0) untreated, 0) CV pretreated. Crosses represent calculated impedance spectra.
3.2. Modifier-Containing CPEs (Graphite + Oil + Modifiers)
The modifiers used in this work have one thing in common, the presence of one or more amino groups, as primary, secondary, or
athod
can
Fig. 5. Graphical presentation of the behavior of different elements of the equivalent circuit shown in Scheme 2 upon electrochemical pretreatment (see Tables 1 and 2).
Electroanalysis 1997, 9, No. 5
362 Q. Chi et al.
tertiary amino groups. The ability of an amino group to bind a proton, i.e., its basic strength, depends on the electron density at the nitrogen atom. Steric properties also play an important role. In many cases, secondary amines have a pK, value which is higher than the pK, of corresponding primary or tertiary amines, i.e., secondary amines are the strongest bases.
The copolymer 845 (COP) has two tertiary amino groups. An expected strong basic character of COP is attenuated by sterical effects as well as by the - I effect of the oxygen of the carbonyl group adjacent to the nitrogen atom. However, its pK, should be above 9. Polyethyleneimine (PEI) should have a broad pK, interval due to its rather undefined structure which may include all three types of amines. Therefore, a pK, of 8.9-9.5 is expected for PEI (T. Gibson, personal communication). Kanamycin (KAN) has four primary amino groups per molecule which should give rise to many protonated sites. The pK, of chitosan glutamate (CHI) is determined both by the primary amino group at the hexose ring and by the glutamic acid residue which may extend into the solution because it is attached to chitosan by its y-carboxy group. The pK, of the amino groups of chitosan was reported to be 6.2 in water [37]. The a-carboxy group of glutamic acid has a pK, of 2.16, and the amino group has a pK, of 9.96. Finally, the pK, of CHI should be between 6.5 and 7.0. With the pK, values suggested for the modifiers COP, PEI and KAN, it is most likely that the surfaces are protonated at physiological pH to a high degree. The extent of protonation should not be very much lower when pH of 8.5 is applied. In contrast to this, protonation of CHI should decrease significantly at pH 8.5.
400 m A
B m
- - 0 4 : : : : : : : : : : : : : i
o zoo 400 600 800 1000 1200 1400
400 T - z Iszl B
z 0 200 400
6 O o r , F 0 200 400 600
: : , 0 0 200 400 0 200 400 600
2011 /*a z [ P z' [QI
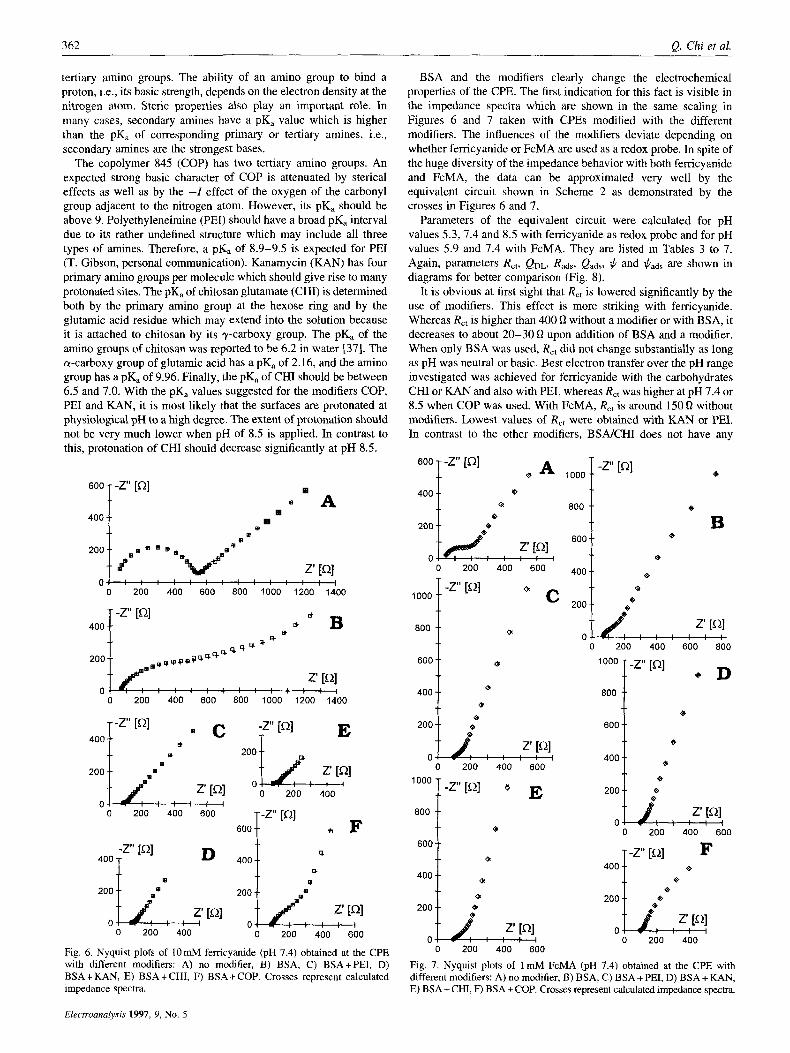
Fig. 6 . Nyquist plots of l O m M ferricyanide (pH 7.4) obtained at the CPE with different modifiers: A) no modifier, B) BSA, C) BSA+PEI, D) BSA+KAN, E) BSA+CHI, F) BSA+COP. Crosses represent calculated impedance spectra.
Electroanalysis 1997, 9, No. 5
BSA and the modifiers clearly change the electrochemical properties of the CPE. The first indication for this fact is visible in the impedance spectra which are shown in the same scaling in Figures 6 and 7 taken with CPEs modified with the different modifiers. The influences of the modifiers deviate depending on whether ferricyanide or FcMA are used as a redox probe. In spite of the huge diversity of the impedance behavior with both ferricyanide and FcMA, the data can be approximated very well by the equivalent circuit shown in Scheme 2 as demonstrated by the crosses in Figures 6 and 7.
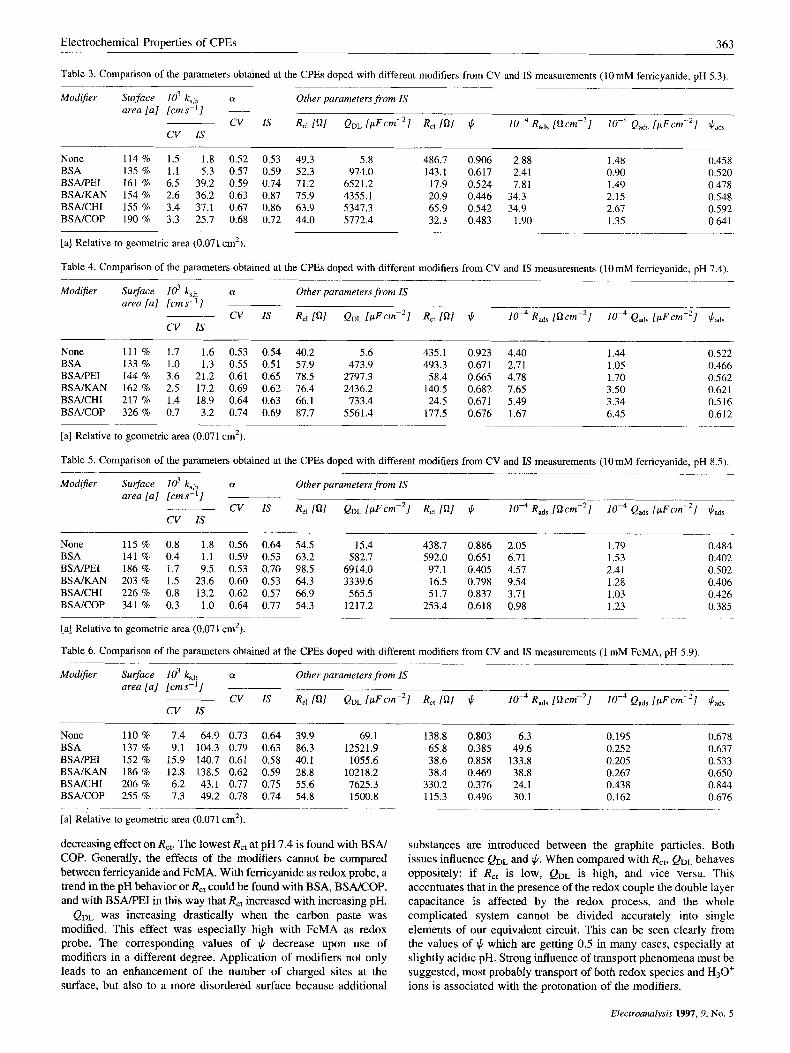
Parameters of the equivalent circuit were calculated for pH values 5.3,7.4 and 8.5 with ferricyanide as redox probe and for pH values 5.9 and 7.4 with FcMA. They are listed in Tables 3 to 7. Again, parameters R,,, Q D ~ , Rads, Qdds, $ and $ads are shown in diagrams for better comparison (Fig. 8).
It is obvious at first sight that R,, is lowered significantly by the use of modifiers. This effect is more striking with ferricyanide. Whereas R,, is higher than 400 Cl without a modifier or with BSA, it decreases to about 20-30 Q upon addition of BSA and a modifier. When only BSA was used, R,, did not change substantially as long as pH was neutral or basic. Best electron transfer over the pH range investigated was achieved for ferricyanide with the carbohydrates CHI or KAN and also with PEI, whereas R,, was higher at pH 7.4 or 8.5 when COP was used. With FcMA, R,, is around 150 8 without modifiers. Lowest values of R,, were obtained with KAN or PEI. In contrast to the other modifiers, BSMCHI does not have any
Q '""1 ** Q 800 f 200
0 200 400 600 4004 ..
Q
B Q
6
Q
400
looo?-z' In] e
800 t
800
D
0 0 200 400 600
Q 4001 ** 6 200
2 0 0 t ," I e
. 0 200 400 600
Fig. 7. Nyquist plots of 1 mM FcMA (pH 7.4) obtained at the CPE with different modifiers: A) no modifier, B) BSA, C) BSA+ PEI, D) BSA + KAN, E) BSA + CHI, F) BSA + COP. Crosses represent calculated impedance spectra.
Electrochemical Properties of CPEs 363
Table 3. Comparison of the parameters obtained at the CPEs doped with different modifiers from CV and IS measurements ( I O m M fenicyanide, pH 5.3).
Modifier Su$aee area [a]
Io3 ka,h [ems-']
None 114 % BSA 135 % BSAiPEI 161 % BSNKAN 154% BSNCHI 155 % BSNCOP 190%
cv IS
1.5 1.8 1.1 5.3 6.5 39.2 2.6 36.2 3.4 37.1 3.3 25.7
0.52 0.53 49.3 5.8 486.7 0.906 2.88 1.48 0.458
0.59 0.74 71.2 6521.2 17.9 0.524 7.81 1.49 0.478 0.63 0.87 75.9 4355.1 20.9 0.446 34.3 2.15 0.548 0.67 0.86 63.9 5347.3 65.9 0.542 34.9 2.67 0.592 0.68 0.72 44.0 5772.4 32.3 0.483 1.90 1.35 0.641
0.57 0.59 52.3 974.0 143.1 0.617 2.41 0.90 0.520
[a] Relative to geometric area (0.071 cm').
Table 4. Comparison of the parameters obtained at the CPEs doped with different modifiers from CV and IS measurements (1OmM ferricyanide, pH 7.4).
ModiJier Surface lo3 ks,h 01 Other parameters from IS -. - __ ~~~
-
area [a] [ems-' ]
cv IS CV 1s Re, [QI QOL I p F ~ m - ~ l Rct [nl $ Rads Qads [pFcm-2]
None 111 % 1.7 1.6 0.53 0.54 40.2 5.6 435.1 0.923 4.40 1.44 0.522 BSA 133 % 1.0 1.3 0.55 0.51 57.9 473.9 493.3 0.671 2.71 1 .05 0.466 BSAIPEI 144 % 3.6 21.2 0.61 0.65 78.5 2797.3 58.4 0.665 4.78 1.70 0.562 BSNKAN 162 % 2.5 17.2 0.69 0.62 76.4 2436.2 140.5 0.682 7.65 3.50 0.62 1 BSNCHI 217 % 1.4 18.9 0.64 0.63 66.1 733.4 24.5 0.671 5.49 3.34 0.516 BSNCOP 326 % 0.7 3.2 0.74 0.69 87.7 5561.4 177.5 0.676 1.67 6.45 0.6 12
[a] Relative to geometric area (0.071 cm2).
Table 5. Comparison of the parameters obtained at the CPEs doped with different modifiers from CV and IS measurements (10mM ferricyanide, pH 8.5).
ModiJier Surface lo3 ksIh ci Other parameters from IS
~ ____.- . ... ~- ~. ~
~. - ____
area [a] [cms-'1 ~
~ CV 1s Re, In1 QDL [ ~ F c m - ~ l RCt IQI $ cv IS
None 11.5 % 0.8 1.8 0.56 0.64 54.5 15.4 438.7 0.886 2.05 1.79 0.484 BSA 141 % 0.4 1.1 0.59 0.53 63.2 582.7 592.0 0.651 6.71 1.53 0.402 BSA/PEI 186 % 1.7 9.5 0.53 0.70 98.5 6914.0 97.1 0.405 4.57 2.41 0.502 BSNKAN 203 % 1.5 23.6 0.60 0.53 64.3 3339.6 16.5 0.798 9.54 1.28 0.406 BSNCHI 226 % 0.8 13.2 0.62 0.57 66.9 565.5 51.7 0.837 3.71 1.03 0.426 BSNCOP 341 % 0.3 1.0 0.64 0.77 54.3 1217.2 253.4 0.618 0.98 1.23 0.385
[a] Relative to geometric area (0.071 cm').
Table 6. Comparison of the parameters obtained at the CPEs doped with different modifiers from CV and IS measurements (1 mM FcMA, pH 5.9).
Modifier Surface Id ks,h a Other parameters from IS area [a] [ems-']
cv IS CV IS R,I In1 QDL R,, In1 4 Rads [ n ~ m - ~ ] Qads [ p F ~ m - ~ ] $ads
None 110 % 7.4 64.9 0.73 0.64 39.9 69.1 BSA 137 % 9.1 104.3 0.79 0.63 86.3 12521.9 BSAIPEI 152 % 15.9 140.7 0.61 0.58 40.1 105.5.6 BSNKAN 186 % 12.8 138.5 0.62 0.59 28.8 10218.2 BSNCHI 206 % 6.2 43.1 0.77 0.75 55.6 7625.3 BSNCOP 255 % 7.3 49.2 0.78 0.74 54.8 1500.8
[a] Relatlve to geometric area (0.071 cm2).
decreasing effect on RCp The lowest R,, at pH 7.4 is found with B S N COP. Generally, the effects of the modifiers cannot be compared between femcyanide and FcMA. With ferricyanide as redox probe, a trend in the pH behavior or R,, could be found with BSA, BSNCOP, and with BSAPEI in this way that R,, increased with increasing pH.
QDL was increasing drastically when the carbon paste was modified. This effect was especially high with FcMA as redox probe. The corresponding values of 1c. decrease upon use of modifiers in a different degree. Application of modifiers not only leads to an enhancement of the number of charged sites at the surface, but also to a more disordered surface because additional
- - _____
138.8 0.803 6.3 0.195 0.678 65.8 0.385 49.6 0.252 0.637 38.6 0.858 133.8 0.205 0.533 38.4 0.469 38.8 0.267 0.650
330.2 0.376 24.1 0.438 0.844 115.3 0.496 30.1 0.162 0.676
-~ ~ -
substances are introduced between the graphite particles. Both issues influence Q D L and $. When compared with R,,, Q o L behaves oppositely: if R,, is low, QDL is high, and vice versa. This accentuates that in the presence of the redox couple the double layer capacitance is affected by the redox process, and the whole complicated system cannot be divided accurately into single elements of our equivalent circuit. This can be seen clearly from the values of $ which are getting 0.5 in many cases, especially at slightly acidic pH. Strong influence of transport phenomena must be suggested, most probably transport of both redox species and H30f ions is associated with the protonation of the modifiers.
Elecrroanalysis 1997, 9, No. 5
364 Q. Chi et al.
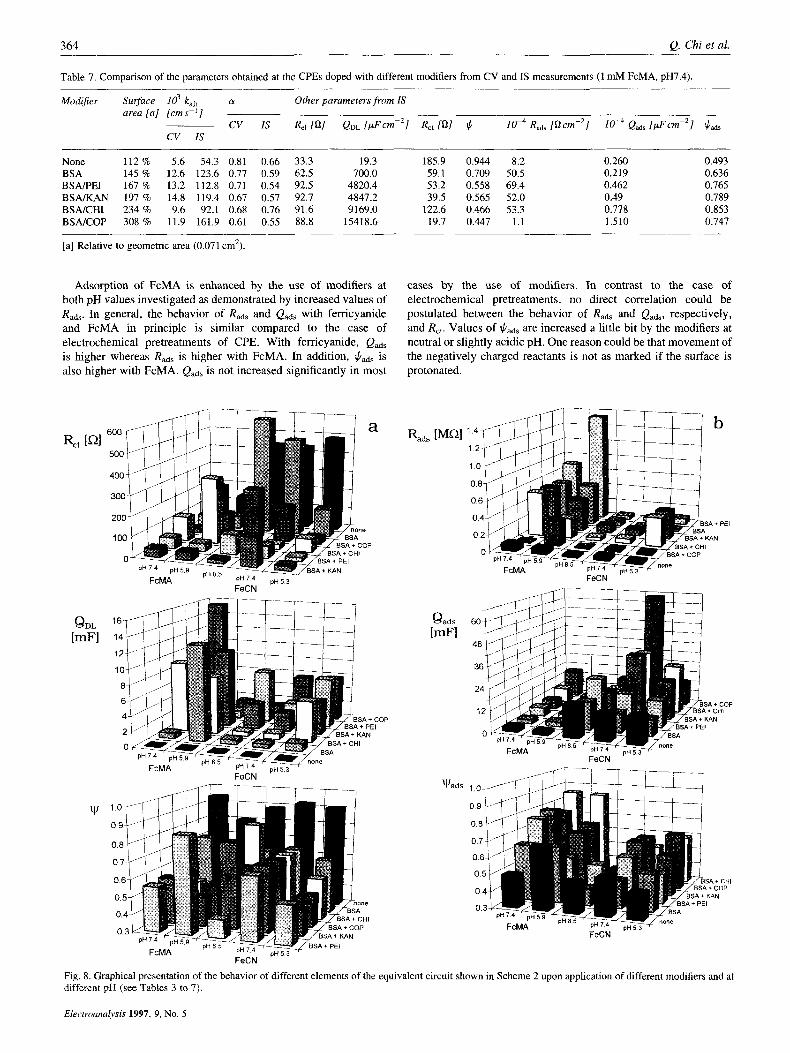
Table 7. Comparison of the parameters obtained at the CPEs doped with different modifiers from CV and IS measurements (1 mM FcMA, pH7.4).
Modijer Surface lo3 ks,h CY Other parameters from IS ~-
urea [a ] [cm s - l ] ~ CV IS R,I IQI QDL I ~ F c m - ~ l RCt [ Q l J / R,, [Qcm-’] Qads [ ~ F c m - ~ ] cv IS
~
None 112 % 5.6 54.3 0.81 0.66 33.3 19.3 BSA 145 % 12.6 123.6 0.77 0.59 62.5 700.0 BSAREI 167 % 13.2 112.8 0.71 0.54 92.5 4820.4 BSNKAN 197 % 14.8 119.4 0.67 0.57 92.7 4847.2 BSNCHI 234 % 9.6 92.1 0.68 0.76 91.6 9169.0 BSNCOP 308 % 11.9 161.9 0.61 0.55 88.8 15418.6
185.9 0.944 8.2 0.260 0.493 59.1 0.709 50.5 0.219 0.636 53.2 0.558 69.4 0.462 0.765 39.5 0.565 52.0 0.49 0.789
122.6 0.466 53.3 0.778 0.853 19.7 0.447 1.1 1.510 0.747
[a] Relative to geometric area (0.071 cm’).
Adsorption of FcMA is enhanced by the use of modifiers at both pH values investigated as demonstrated by increased values of Rads. In general, the behavior of Rads and Qads with femcyanide and FcMA in principle is similar compared to the case of electrochemical pretreatments of CPE. With ferricyanide, Qads is higher whereas Rads is higher with FcMA. In addition, $ads is also higher with FcMA. QadS is not increased significantly in most
%?
04L 03
cases by the use of modifiers. In contrast to the case of electrochemical pretreatments, no direct correlation could be postulated between the behavior of Rads and Qadsr respectively, and Rcr. Values of $ads are increased a little bit by the modifiers at neutral or slightly acidic pH. One reason could be that movement of the negatively charged reactants is not as marked if the surface is protonated.
FeCN
+ COP CHI N
Fig. 8. Graphical presentation of the behavior of different elements of the equivalent circuit shown in Scheme 2 upon application of different modifiers and at different pH (see Tables 3 to 7).
Elertrounalysis 1997, 9, No. 5
Electrochemical Properties of CPEs 365
4. Conclusions
In this work, we used BSA and four different compounds containing different amino groups. The results show clearly that the rate of electron transfer at the CPE can be enhanced drastically not only by electrochemical pretreatment but also with the help of chemical modifiers.
The protonation of the electrode surface may cause an electrostatic attraction of ferricyanide or FcMA which carry negative charges. Moreover, access to the surface of the electrode is facilitated by enhanced hydration of the surface which is expressed by increased values of QDL. The drastic decrease of R,, especially in the case of femcyanide can be interpreted as a consequence of the higher number of negative charges compared to FcMA. However, concise explanation of this effect requires a combination of the effects of the modifiers on the different parameters.
However, it is very complicated to figure out all single features which influence the electrochemical behavior of both ferricyanide and FcMA. For more detailed investigation, pH depending behavior of the modified CPE should be checked without a redox probe. Furthermore, different concentrations of the redox probes should be applied in order to obtain more clarity about the adsorption properties. Moreover, also other redox species should be used which are also important as substrates or mediators of enzymatic reaction important in amperometric biosensors.
Comparison of cyclic voltammograms for ferricyanide in buffer solution and in buffer containing 10 % of ethanol (data not shown) did not exhibit any significant differences. Characteristic parameters of the voltammograms did not change in a way which would suggest distortion of electron transfer. Influence of ethanol, e.g., by adsorption, may not be very important because FcMA exhibits stronger adsorptive behavior on graphite due to its two C5 rings. Nevertheless, effects of ethanol concentration in buffer solution when FcMA was used should be examined more carefully.
5. Acknowledgements
This work was supported by the European Union (SMT4-CT95- 2038). L.G. thanks the Swedish Natural Science Research Council (NFR) and the Swedish Research Council for the Engineering Sciences (TFR) for support. T.R. was supported by the Swedish Institute (SI), and the Royal Academy of Science (KVA), Q.C. by the Chinese Ministry of Science, and P.H. by the Bundesminister- ium f i r Bildung und Forschung, grant 0319325A, and the Deutsche Forschungsgemeinschaft. grants He 2046/1,2.
6. References
[I] R.N. Adams, Anal. Chem. 1958.30. 1576. "21 C. Olson, R.N. Adams, Anal. Chim. Acta 1960, 22, 582. 131 M.E. Rice, 2. Galus, R.N. Adams, J. Electroanal. Chem. 1983, 143, 89. 141 (Eds: P.T. Kissinger, W.R. Heineman), Laboratory Techniques in Elecfro-
analytical Chemi.rtry, Dekker, New York k984. [5l K. Kalcher, J:M. Kauffmann, J. Wang, I. Svancara, K. Vytras, C. Neuhold,
2. Yang, Electroanalysis 1995, 7, 5. [6] L. Gorton, Electroanalysis 1995, 7, 23. 171 N.A. Ulakhovich, E.P. Medyantseva, G.K. Budnikov, Zh. Anal. Khim. 1993,
181 T. Kuwana, W.G. French, Anal. Chem. 1964,36,241. 191 F.A. Schultz, T. Kuwana, J. Electroanal. Chem. 1965, 10, 95.
48, 980.
[lo] G.T. Cheek, R.F. Nelson, Anal. Lett. 1978, I I , 393. [ l l ] T. Yao, S . Musha, Anal. Chim. Acta 1979, 110, 203. 1121 K. Ravichandran, R.P. Baldwin, J. Electroanal. Chem. 1981, 126, 293. [I31 K. Ravichandran, R.P. Baldwin, Anal. Chem. 1984, 56, 1744. [141 F.N. Alhahadily, H.A. Mottola, Anal. Chem. 1987, 59, 958. [lSl M.E. Rice, 2. Galus, R.N. Adams, J. Electroanal. Chem. 1983, f43, 89. [I61 C. Urbanicky, K. Lundstrom, J. Electroanal. Chem. 1984, 176, 169. [17l J. Wang, T. Martinez, D.R. Yaniv, L. McCormick, J. Electroanal. Chem.
[181 I. Svancara, M. Hvizdalova, K. Vytras, K. Kalcher, R. Novotny,
1191 J. Wang, L.-H. Wu, R. Li, J. Electroanal. Chem. 1989, 272, 285. [ZOI R.C. Engstrom, K.W. Johnson, S . DesJarlais, Anal. Chem. 1987,59,670. [21l J. Kulys, L. Gorton, E. Dominguez, J. EmnCus, H. Jarskog, J. Electroanal.
[221 V.R. Taliene, T. Ruzgas, V. Razumas, J. Kulys, J. Electroanal. Chem. 1994,
(231 P. Heiduschka, J . Dittrich, Electrochim. Acta 1992, 37, 2573. [24l P. Heiduschka, A.W. Munz, W. Gopel, Electrochim. Acta 1994, 39, 2207. 1251 J. Navarro-Laboulais, J. Trijueque, J.J. Garcia-Jaxeiio, F. Vicente, J.
[26l L. Gorton, G. Jonsson-Pettersson, E. Csoregi, K. Johansson, E. Dominguez,
[27] E. Dom'nguez, H.L. Lan, Y. Okamoto, P.D. Hale, T.A. Skotheim, 8 . Hahn-
[28] K. Johansson, G. Jonsson-Pettersson, L. Gorton, G. Marko-Varga, E.
[29] E. Johansson, G. Jonsson-Pettersson, L. Gorton, J. Biomater. AppL. 1993, 8,
[301 I.C. Popescu, G. Zetterherg, L. Gorton, Biosens. Bioelectron. 1995, IO,
[311 R.N. Adams, Electrochemistry at Solid Electrode, Marcel Dekker, New
[32] U. Loffler, W. Gopel, B. Speiser, Electroanalysis 1991, 3, 917. f331 R.L. McCreery, in Etectroanalyticaf Chemistry, Vol. 17 (Ed: A.J. Bard),
[34] J.R. Macdonald, lmpedance Spectroscopy, Wiley, New York 1987, p. 75. [35] R. de Levie, Electrochim. Acta 1964, 9, 1231; 1965, 10, 113; J. Electroanal.
1361 L. Nyjkoss, T. Pajkossy, Electrochim. Acta 1985, 30, 1533; 1990, 35,
[37] J.W. Park, K.H. Choi, K.K. Park, Bull. Korean. Chem. Soc. 1983, 4, 68.
1990, 286, 65.
Electroanalysis 1996, 8, 61.
Chem. 1994,372,49.
372, 85.
Electroanal. Chem. 1995, 399, 115.
G. Marko-Varga, Analyst 1992, 117, 1235.
Hagerdahl, L. Gorton, Biosens. Bioelectron. 1993, 8, 229.
Csoregi, J. Biotechnol. 1993, 31, 301.
146.
443.
York, 1969, p. 219.
Marcel Dekker, New York 1991, pp. 221-374.
Chem. 1989.261, 1; 1990, 281, 1.
1567.
Electroanalysis 1997, 9, No. 5


