Embed Size (px)
Citation preview
E
RMa
b
c
d
e
a
ARR2AA
KRNILCG
1
bgapd
sstdso[h
MM
0d
Immunology Letters 135 (2011) 78–87
Contents lists available at ScienceDirect
Immunology Letters
journa l homepage: www.e lsev ier .com/ locate /
ffects of restraint stress on NALT structure and nasal IgA levels
igoberto Oros-Pantojaa, Adriana Jarillo-Lunaa,b, Víctor Rivera-Aguilarc, Luvia Enid Sánchez-Torresd,arycarmen Godinez-Victoriaa, Rafael Campos-Rodrígueze,∗
Sección de Estudios de Posgrado e Investigación, Escuela Superior de Medicina, Instituto Politécnico Nacional, Plan de San Luis y Diaz Miron, CP. 11340, México, DF, MexicoDepartamento de Morfología, Escuela Superior de Medicina, Instituto Politécnico Nacional, Plan de San Luis y Díaz Mirón, CP. 11340, México, DF, MexicoDepartamento de Microbiología, UBIPRO, FES-Iztacala, UNAM, Avenida de los Barrios s/n, Tlalnepantla Edo, de Mexico, CP. 54090, Mexico, DF, MexicoDepartamento de Inmunología, Escuela Nacional de Ciencias Biológicas, Instituto Politécnico Nacional, Prolongación Carpio s/n, Col. Santo Tomas, CP. 11340, México, DF, MexicoDepartamento Bioquímica, Escuela Superior de Medicina, Instituto Politécnico Nacional, Plan de San Luis y Díaz Mirón, CP. 11340, México, DF, Mexico
r t i c l e i n f o
rticle history:eceived 27 March 2010eceived in revised form3 September 2010ccepted 3 October 2010vailable online 16 October 2010
a b s t r a c t
The effects of stress on the mucosal immune responses in inflammatory disorders of the gut, as well as onsalivary and intestinal IgA levels are well known. However, its effects on the structure and function of theNALT have not yet been reported, and are examined in the present study. Balb/c mice were submitted torestraint stress for 3 h per day during 4 or 8 d. The immunohistochemistry and flow cytometric analysisrevealed that repeated restraint stress (4 and 8 d) decreased the percentage, compared to the control
+ + + +
eywords:estraint stressALT
gAymphocytesatecholamines
group, of CD3 and CD4 T cells, without affecting the percentage of CD8 T cells or B220 cells (B cells).The numbers of IELs (CD4+ and CD8+ T cells) were lower at 4 d of stress and higher at 8 d. IgA+ cells in NALTand nasal IgA levels showed a similar pattern, being significantly lower at 4 d of stress and significantlyhigher at 8 d. In summary, repeated restraint stress altered the distribution and number of lymphocytesand IgA+ cells in nasal mucosa, probably due to changes in norepinephrine and corticosterone levels.
© 2010 Elsevier B.V. All rights reserved.
lucocorticoids
. Introduction
The effects of stress on the mucosal immune responses haveeen widely analyzed in relation to inflammatory disorders of theut and the secretion of IgA in saliva. The robust information avail-ble confirms that psychological stress plays a key role in theathophysiology and clinical presentation of inflammatory bowelisease [1–5].
There are contradictory reports on the relationship betweenecretory IgA (S-IgA) levels in saliva and different conditions oftress, such as exercise, mood states and academic examina-ions. Whereas some studies found decreases in S-IgA, othersetected increases or no change [6–11]. We recently reported thattress decreases intestinal IgA levels, and affects the population
f intraepithelial lymphocytes in the duodenal mucosa of mice12,13]. However, the effects of stress on the nasal immune systemave not been explored in detail.∗ Corresponding author at: Departamento de Bioquímica. Escuela Superior deedicina. Instituto Politécnico Nacional, Plan de San Luis y Diaz Mirón, CP 11340,éxico, DF, Mexico. Tel.: +52 55 57 48 20 04; fax: +52 55 57 14 54 55.
E-mail address: [email protected] (R. Campos-Rodríguez).
165-2478/$ – see front matter © 2010 Elsevier B.V. All rights reserved.oi:10.1016/j.imlet.2010.10.001
It has been documented that psychological stress alters suscep-tibility to several different strains of respiratory viruses [14], andnumerous reports indicate that exercise stress can increase the riskfor upper respiratory tract infection, particularly in highly trainedand elite athletes [15–17]. Although some elite athletes and sub-jects under severe stress produce less IgA in saliva, it has not beenestablished that this is the cause of the higher incidence of res-piratory infections in these populations [17–20]. Other causativefactors that have been proposed are the presence of infiltratedinflammatory cells in mucous membranes and the removal of oneor more immune functions [15,16,21].
It is unknown whether chronic stress can alter the structureand/or function of the nasal-associated lymphoid tissue (NALT), andif so whether such change would contribute to the increased inci-dence of respiratory infections found among elite athletes. Studieson animals suggest that stress can affect the immune responsesin the upper respiratory tract. In mice infected intranasally withinfluenza virus, restraint stress increases levels of IgM and IgGantibody-secreting cells, which are virus-specific responses in the
superficial cervical lymph node, the latter being considered partof the NALT [22]. On the other hand, restraint stress inhibits theproduction of IgE, IgG1 and IgG2a, specific for an allergen inocu-lated intranasally [23]. Moreover, acute treadmill exercise of micedecreases the number of CD4+ T cells in the submandibular lymph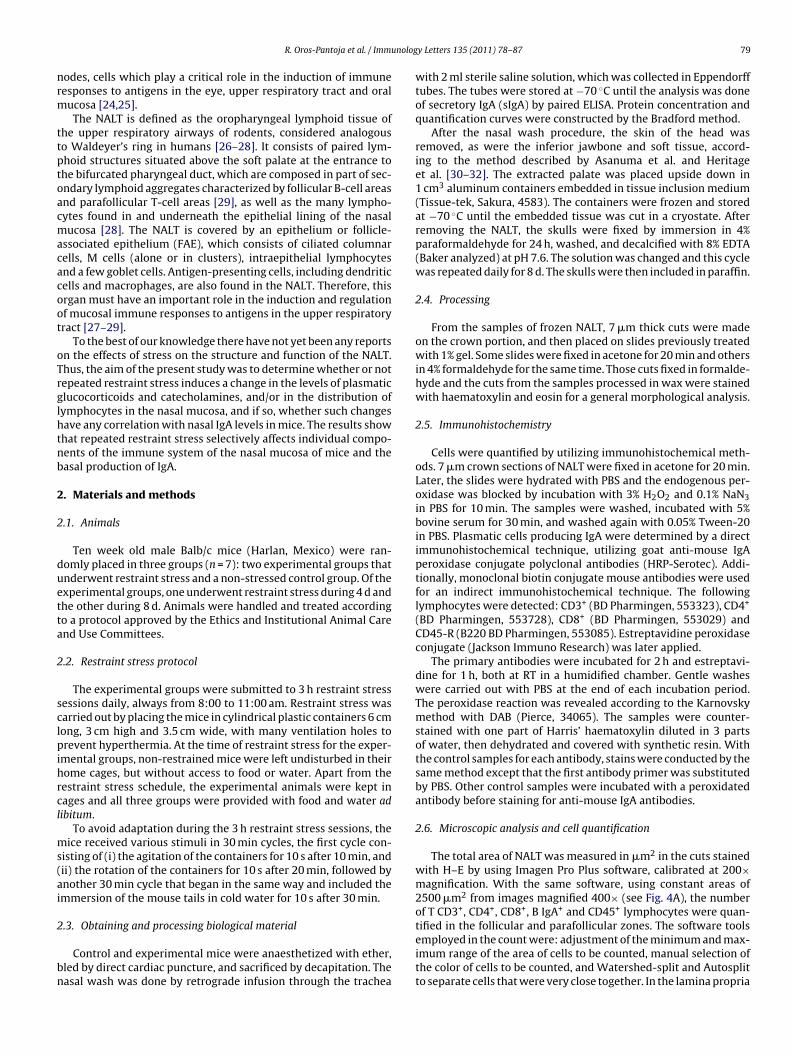
unolog
nrm
ttptoacmacacoot
oTrglhtnb
2
2
duetta
2
sclpihrcl
ms(ai
2
bn
R. Oros-Pantoja et al. / Imm
odes, cells which play a critical role in the induction of immuneesponses to antigens in the eye, upper respiratory tract and oralucosa [24,25].The NALT is defined as the oropharyngeal lymphoid tissue of
he upper respiratory airways of rodents, considered analogouso Waldeyer’s ring in humans [26–28]. It consists of paired lym-hoid structures situated above the soft palate at the entrance tohe bifurcated pharyngeal duct, which are composed in part of sec-ndary lymphoid aggregates characterized by follicular B-cell areasnd parafollicular T-cell areas [29], as well as the many lympho-ytes found in and underneath the epithelial lining of the nasalucosa [28]. The NALT is covered by an epithelium or follicle-
ssociated epithelium (FAE), which consists of ciliated columnarells, M cells (alone or in clusters), intraepithelial lymphocytesnd a few goblet cells. Antigen-presenting cells, including dendriticells and macrophages, are also found in the NALT. Therefore, thisrgan must have an important role in the induction and regulationf mucosal immune responses to antigens in the upper respiratoryract [27–29].
To the best of our knowledge there have not yet been any reportsn the effects of stress on the structure and function of the NALT.hus, the aim of the present study was to determine whether or notepeated restraint stress induces a change in the levels of plasmaticlucocorticoids and catecholamines, and/or in the distribution ofymphocytes in the nasal mucosa, and if so, whether such changesave any correlation with nasal IgA levels in mice. The results showhat repeated restraint stress selectively affects individual compo-ents of the immune system of the nasal mucosa of mice and theasal production of IgA.
. Materials and methods
.1. Animals
Ten week old male Balb/c mice (Harlan, Mexico) were ran-omly placed in three groups (n = 7): two experimental groups thatnderwent restraint stress and a non-stressed control group. Of thexperimental groups, one underwent restraint stress during 4 d andhe other during 8 d. Animals were handled and treated accordingo a protocol approved by the Ethics and Institutional Animal Carend Use Committees.
.2. Restraint stress protocol
The experimental groups were submitted to 3 h restraint stressessions daily, always from 8:00 to 11:00 am. Restraint stress wasarried out by placing the mice in cylindrical plastic containers 6 cmong, 3 cm high and 3.5 cm wide, with many ventilation holes torevent hyperthermia. At the time of restraint stress for the exper-
mental groups, non-restrained mice were left undisturbed in theirome cages, but without access to food or water. Apart from theestraint stress schedule, the experimental animals were kept inages and all three groups were provided with food and water adibitum.
To avoid adaptation during the 3 h restraint stress sessions, theice received various stimuli in 30 min cycles, the first cycle con-
isting of (i) the agitation of the containers for 10 s after 10 min, andii) the rotation of the containers for 10 s after 20 min, followed bynother 30 min cycle that began in the same way and included themmersion of the mouse tails in cold water for 10 s after 30 min.
.3. Obtaining and processing biological material
Control and experimental mice were anaesthetized with ether,led by direct cardiac puncture, and sacrificed by decapitation. Theasal wash was done by retrograde infusion through the trachea
y Letters 135 (2011) 78–87 79
with 2 ml sterile saline solution, which was collected in Eppendorfftubes. The tubes were stored at −70 ◦C until the analysis was doneof secretory IgA (sIgA) by paired ELISA. Protein concentration andquantification curves were constructed by the Bradford method.
After the nasal wash procedure, the skin of the head wasremoved, as were the inferior jawbone and soft tissue, accord-ing to the method described by Asanuma et al. and Heritageet al. [30–32]. The extracted palate was placed upside down in1 cm3 aluminum containers embedded in tissue inclusion medium(Tissue-tek, Sakura, 4583). The containers were frozen and storedat −70 ◦C until the embedded tissue was cut in a cryostate. Afterremoving the NALT, the skulls were fixed by immersion in 4%paraformaldehyde for 24 h, washed, and decalcified with 8% EDTA(Baker analyzed) at pH 7.6. The solution was changed and this cyclewas repeated daily for 8 d. The skulls were then included in paraffin.
2.4. Processing
From the samples of frozen NALT, 7 �m thick cuts were madeon the crown portion, and then placed on slides previously treatedwith 1% gel. Some slides were fixed in acetone for 20 min and othersin 4% formaldehyde for the same time. Those cuts fixed in formalde-hyde and the cuts from the samples processed in wax were stainedwith haematoxylin and eosin for a general morphological analysis.
2.5. Immunohistochemistry
Cells were quantified by utilizing immunohistochemical meth-ods. 7 �m crown sections of NALT were fixed in acetone for 20 min.Later, the slides were hydrated with PBS and the endogenous per-oxidase was blocked by incubation with 3% H2O2 and 0.1% NaN3in PBS for 10 min. The samples were washed, incubated with 5%bovine serum for 30 min, and washed again with 0.05% Tween-20in PBS. Plasmatic cells producing IgA were determined by a directimmunohistochemical technique, utilizing goat anti-mouse IgAperoxidase conjugate polyclonal antibodies (HRP-Serotec). Addi-tionally, monoclonal biotin conjugate mouse antibodies were usedfor an indirect immunohistochemical technique. The followinglymphocytes were detected: CD3+ (BD Pharmingen, 553323), CD4+
(BD Pharmingen, 553728), CD8+ (BD Pharmingen, 553029) andCD45-R (B220 BD Pharmingen, 553085). Estreptavidine peroxidaseconjugate (Jackson Immuno Research) was later applied.
The primary antibodies were incubated for 2 h and estreptavi-dine for 1 h, both at RT in a humidified chamber. Gentle washeswere carried out with PBS at the end of each incubation period.The peroxidase reaction was revealed according to the Karnovskymethod with DAB (Pierce, 34065). The samples were counter-stained with one part of Harris’ haematoxylin diluted in 3 partsof water, then dehydrated and covered with synthetic resin. Withthe control samples for each antibody, stains were conducted by thesame method except that the first antibody primer was substitutedby PBS. Other control samples were incubated with a peroxidatedantibody before staining for anti-mouse IgA antibodies.
2.6. Microscopic analysis and cell quantification
The total area of NALT was measured in �m2 in the cuts stainedwith H–E by using Imagen Pro Plus software, calibrated at 200×magnification. With the same software, using constant areas of2500 �m2 from images magnified 400× (see Fig. 4A), the numberof T CD3+, CD4+, CD8+, B IgA+ and CD45+ lymphocytes were quan-
tified in the follicular and parafollicular zones. The software toolsemployed in the count were: adjustment of the minimum and max-imum range of the area of cells to be counted, manual selection ofthe color of cells to be counted, and Watershed-split and Autosplitto separate cells that were very close together. In the lamina propria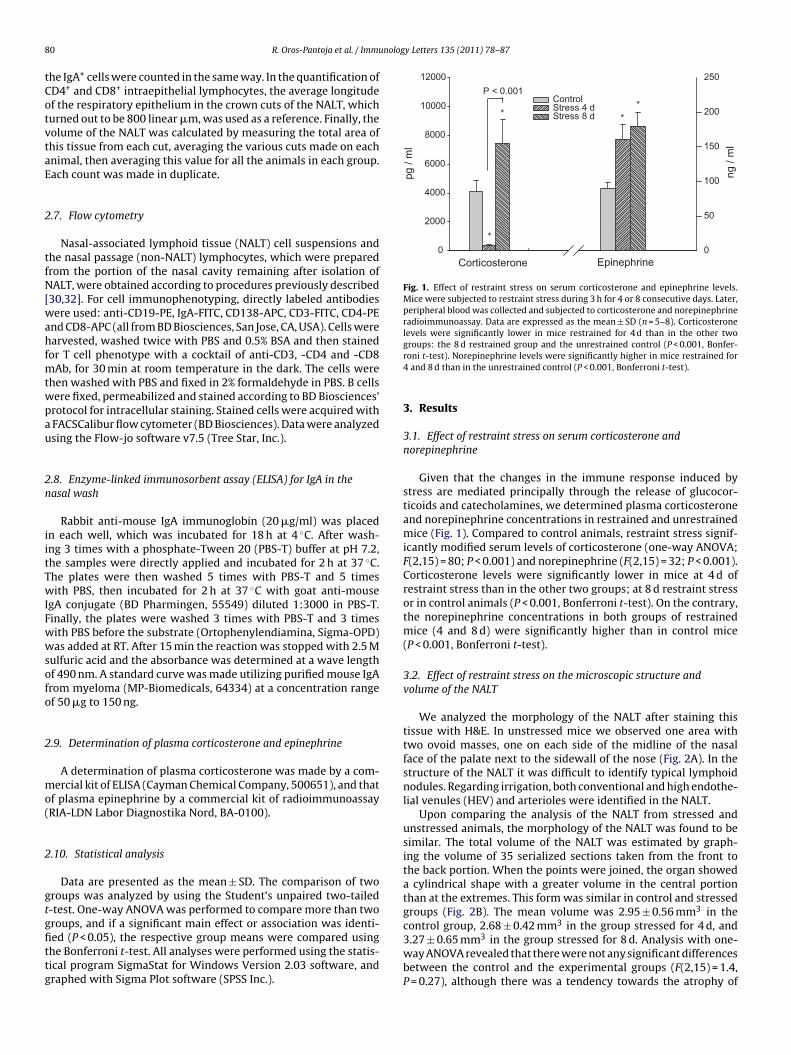
8 nology Letters 135 (2011) 78–87
tCotvtaE
2
tfN[wahfmtwpau
2n
iitTwIFwwsofo
2
mo(
2
gtgfittg
0
2000
4000
6000
8000
10000
12000
ng /
ml
0
50
100
150
200
250
ControlStress 4 dStress 8 d
pg /
ml
*
P < 0.001
**
*
Corticosterone Epinephrine
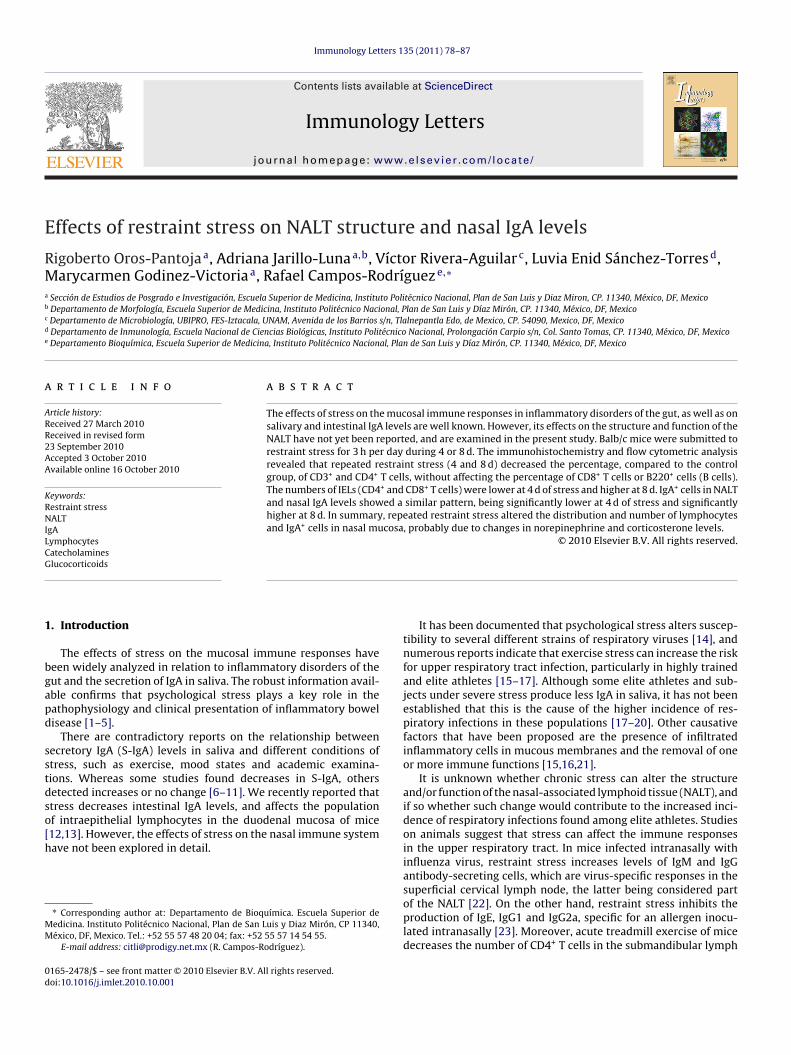
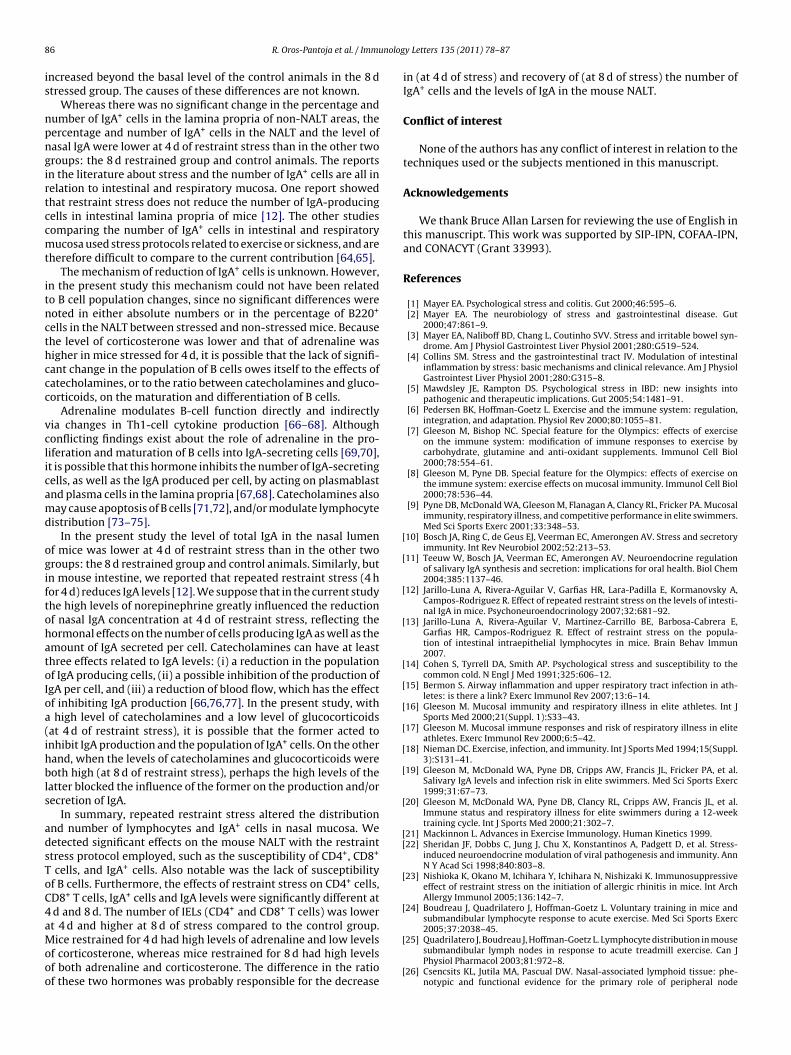
Fig. 1. Effect of restraint stress on serum corticosterone and epinephrine levels.Mice were subjected to restraint stress during 3 h for 4 or 8 consecutive days. Later,peripheral blood was collected and subjected to corticosterone and norepinephrineradioimmunoassay. Data are expressed as the mean ± SD (n = 5–8). Corticosteronelevels were significantly lower in mice restrained for 4 d than in the other two
0 R. Oros-Pantoja et al. / Immu
he IgA+ cells were counted in the same way. In the quantification ofD4+ and CD8+ intraepithelial lymphocytes, the average longitudef the respiratory epithelium in the crown cuts of the NALT, whichurned out to be 800 linear �m, was used as a reference. Finally, theolume of the NALT was calculated by measuring the total area ofhis tissue from each cut, averaging the various cuts made on eachnimal, then averaging this value for all the animals in each group.ach count was made in duplicate.
.7. Flow cytometry
Nasal-associated lymphoid tissue (NALT) cell suspensions andhe nasal passage (non-NALT) lymphocytes, which were preparedrom the portion of the nasal cavity remaining after isolation ofALT, were obtained according to procedures previously described
30,32]. For cell immunophenotyping, directly labeled antibodiesere used: anti-CD19-PE, IgA-FITC, CD138-APC, CD3-FITC, CD4-PE
nd CD8-APC (all from BD Biosciences, San Jose, CA, USA). Cells werearvested, washed twice with PBS and 0.5% BSA and then stained
or T cell phenotype with a cocktail of anti-CD3, -CD4 and -CD8Ab, for 30 min at room temperature in the dark. The cells were
hen washed with PBS and fixed in 2% formaldehyde in PBS. B cellsere fixed, permeabilized and stained according to BD Biosciences’rotocol for intracellular staining. Stained cells were acquired withFACSCalibur flow cytometer (BD Biosciences). Data were analyzedsing the Flow-jo software v7.5 (Tree Star, Inc.).
.8. Enzyme-linked immunosorbent assay (ELISA) for IgA in theasal wash
Rabbit anti-mouse IgA immunoglobin (20 �g/ml) was placedn each well, which was incubated for 18 h at 4 ◦C. After wash-ng 3 times with a phosphate-Tween 20 (PBS-T) buffer at pH 7.2,he samples were directly applied and incubated for 2 h at 37 ◦C.he plates were then washed 5 times with PBS-T and 5 timesith PBS, then incubated for 2 h at 37 ◦C with goat anti-mouse
gA conjugate (BD Pharmingen, 55549) diluted 1:3000 in PBS-T.inally, the plates were washed 3 times with PBS-T and 3 timesith PBS before the substrate (Ortophenylendiamina, Sigma-OPD)as added at RT. After 15 min the reaction was stopped with 2.5 M
ulfuric acid and the absorbance was determined at a wave lengthf 490 nm. A standard curve was made utilizing purified mouse IgArom myeloma (MP-Biomedicals, 64334) at a concentration rangef 50 �g to 150 ng.
.9. Determination of plasma corticosterone and epinephrine
A determination of plasma corticosterone was made by a com-ercial kit of ELISA (Cayman Chemical Company, 500651), and that
f plasma epinephrine by a commercial kit of radioimmunoassayRIA-LDN Labor Diagnostika Nord, BA-0100).
.10. Statistical analysis
Data are presented as the mean ± SD. The comparison of tworoups was analyzed by using the Student’s unpaired two-tailed-test. One-way ANOVA was performed to compare more than two
roups, and if a significant main effect or association was identi-ed (P < 0.05), the respective group means were compared usinghe Bonferroni t-test. All analyses were performed using the statis-ical program SigmaStat for Windows Version 2.03 software, andraphed with Sigma Plot software (SPSS Inc.).groups: the 8 d restrained group and the unrestrained control (P < 0.001, Bonfer-roni t-test). Norepinephrine levels were significantly higher in mice restrained for4 and 8 d than in the unrestrained control (P < 0.001, Bonferroni t-test).
3. Results
3.1. Effect of restraint stress on serum corticosterone andnorepinephrine
Given that the changes in the immune response induced bystress are mediated principally through the release of glucocor-ticoids and catecholamines, we determined plasma corticosteroneand norepinephrine concentrations in restrained and unrestrainedmice (Fig. 1). Compared to control animals, restraint stress signif-icantly modified serum levels of corticosterone (one-way ANOVA;F(2,15) = 80; P < 0.001) and norepinephrine (F(2,15) = 32; P < 0.001).Corticosterone levels were significantly lower in mice at 4 d ofrestraint stress than in the other two groups; at 8 d restraint stressor in control animals (P < 0.001, Bonferroni t-test). On the contrary,the norepinephrine concentrations in both groups of restrainedmice (4 and 8 d) were significantly higher than in control mice(P < 0.001, Bonferroni t-test).
3.2. Effect of restraint stress on the microscopic structure andvolume of the NALT
We analyzed the morphology of the NALT after staining thistissue with H&E. In unstressed mice we observed one area withtwo ovoid masses, one on each side of the midline of the nasalface of the palate next to the sidewall of the nose (Fig. 2A). In thestructure of the NALT it was difficult to identify typical lymphoidnodules. Regarding irrigation, both conventional and high endothe-lial venules (HEV) and arterioles were identified in the NALT.
Upon comparing the analysis of the NALT from stressed andunstressed animals, the morphology of the NALT was found to besimilar. The total volume of the NALT was estimated by graph-ing the volume of 35 serialized sections taken from the front tothe back portion. When the points were joined, the organ showeda cylindrical shape with a greater volume in the central portionthan at the extremes. This form was similar in control and stressedgroups (Fig. 2B). The mean volume was 2.95 ± 0.56 mm3 in the
3
control group, 2.68 ± 0.42 mm in the group stressed for 4 d, and3.27 ± 0.65 mm3 in the group stressed for 8 d. Analysis with one-way ANOVA revealed that there were not any significant differencesbetween the control and the experimental groups (F(2,15) = 1.4,P = 0.27), although there was a tendency towards the atrophy of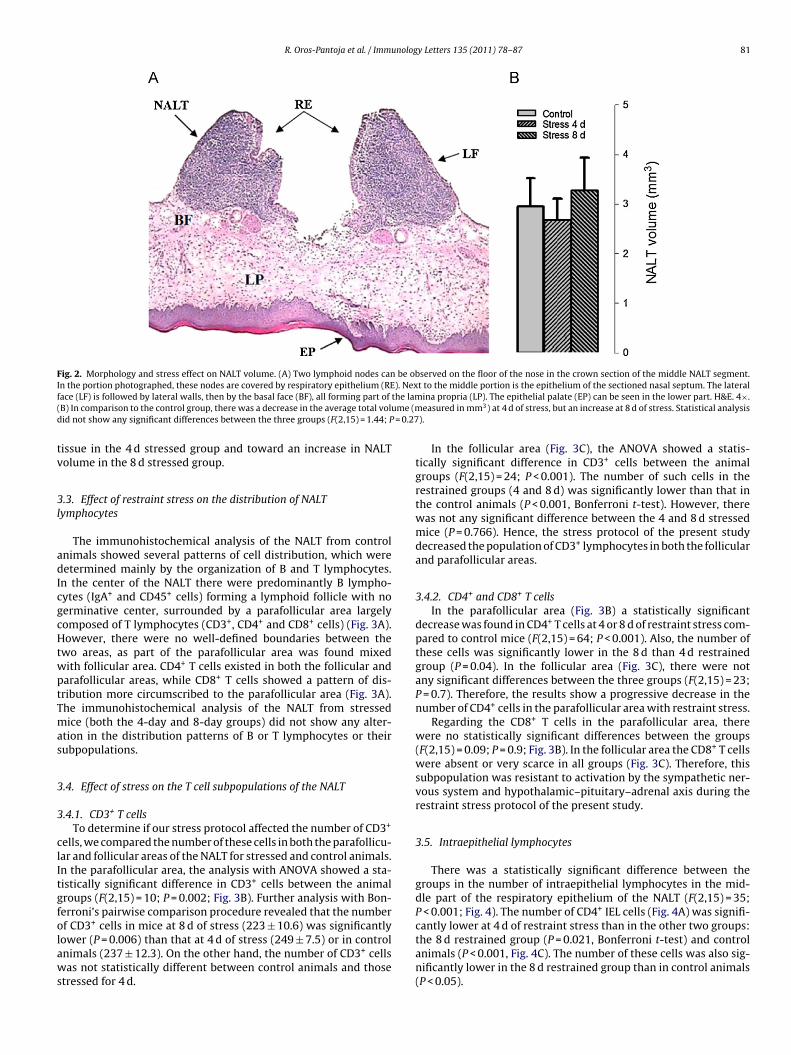
R. Oros-Pantoja et al. / Immunology Letters 135 (2011) 78–87 81
Fig. 2. Morphology and stress effect on NALT volume. (A) Two lymphoid nodes can be observed on the floor of the nose in the crown section of the middle NALT segment.I ). Nexf the lam( ume (md = 0.27
tv
3l
adIcgcHtwptTmas
3
3
clItgfolaws
n the portion photographed, these nodes are covered by respiratory epithelium (REace (LF) is followed by lateral walls, then by the basal face (BF), all forming part ofB) In comparison to the control group, there was a decrease in the average total volid not show any significant differences between the three groups (F(2,15) = 1.44; P
issue in the 4 d stressed group and toward an increase in NALTolume in the 8 d stressed group.
.3. Effect of restraint stress on the distribution of NALTymphocytes
The immunohistochemical analysis of the NALT from controlnimals showed several patterns of cell distribution, which wereetermined mainly by the organization of B and T lymphocytes.
n the center of the NALT there were predominantly B lympho-ytes (IgA+ and CD45+ cells) forming a lymphoid follicle with noerminative center, surrounded by a parafollicular area largelyomposed of T lymphocytes (CD3+, CD4+ and CD8+ cells) (Fig. 3A).owever, there were no well-defined boundaries between the
wo areas, as part of the parafollicular area was found mixedith follicular area. CD4+ T cells existed in both the follicular andarafollicular areas, while CD8+ T cells showed a pattern of dis-ribution more circumscribed to the parafollicular area (Fig. 3A).he immunohistochemical analysis of the NALT from stressedice (both the 4-day and 8-day groups) did not show any alter-
tion in the distribution patterns of B or T lymphocytes or theirubpopulations.
.4. Effect of stress on the T cell subpopulations of the NALT
.4.1. CD3+ T cellsTo determine if our stress protocol affected the number of CD3+
ells, we compared the number of these cells in both the parafollicu-ar and follicular areas of the NALT for stressed and control animals.n the parafollicular area, the analysis with ANOVA showed a sta-istically significant difference in CD3+ cells between the animalroups (F(2,15) = 10; P = 0.002; Fig. 3B). Further analysis with Bon-erroni’s pairwise comparison procedure revealed that the number
f CD3+ cells in mice at 8 d of stress (223 ± 10.6) was significantlyower (P = 0.006) than that at 4 d of stress (249 ± 7.5) or in controlnimals (237 ± 12.3). On the other hand, the number of CD3+ cellsas not statistically different between control animals and thosetressed for 4 d.
t to the middle portion is the epithelium of the sectioned nasal septum. The lateralina propria (LP). The epithelial palate (EP) can be seen in the lower part. H&E. 4×.easured in mm3) at 4 d of stress, but an increase at 8 d of stress. Statistical analysis
).
In the follicular area (Fig. 3C), the ANOVA showed a statis-tically significant difference in CD3+ cells between the animalgroups (F(2,15) = 24; P < 0.001). The number of such cells in therestrained groups (4 and 8 d) was significantly lower than that inthe control animals (P < 0.001, Bonferroni t-test). However, therewas not any significant difference between the 4 and 8 d stressedmice (P = 0.766). Hence, the stress protocol of the present studydecreased the population of CD3+ lymphocytes in both the follicularand parafollicular areas.
3.4.2. CD4+ and CD8+ T cellsIn the parafollicular area (Fig. 3B) a statistically significant
decrease was found in CD4+ T cells at 4 or 8 d of restraint stress com-pared to control mice (F(2,15) = 64; P < 0.001). Also, the number ofthese cells was significantly lower in the 8 d than 4 d restrainedgroup (P = 0.04). In the follicular area (Fig. 3C), there were notany significant differences between the three groups (F(2,15) = 23;P = 0.7). Therefore, the results show a progressive decrease in thenumber of CD4+ cells in the parafollicular area with restraint stress.
Regarding the CD8+ T cells in the parafollicular area, therewere no statistically significant differences between the groups(F(2,15) = 0.09; P = 0.9; Fig. 3B). In the follicular area the CD8+ T cellswere absent or very scarce in all groups (Fig. 3C). Therefore, thissubpopulation was resistant to activation by the sympathetic ner-vous system and hypothalamic–pituitary–adrenal axis during therestraint stress protocol of the present study.
3.5. Intraepithelial lymphocytes
There was a statistically significant difference between thegroups in the number of intraepithelial lymphocytes in the mid-dle part of the respiratory epithelium of the NALT (F(2,15) = 35;P < 0.001; Fig. 4). The number of CD4+ IEL cells (Fig. 4A) was signifi-
cantly lower at 4 d of restraint stress than in the other two groups:the 8 d restrained group (P = 0.021, Bonferroni t-test) and controlanimals (P < 0.001, Fig. 4C). The number of these cells was also sig-nificantly lower in the 8 d restrained group than in control animals(P < 0.05).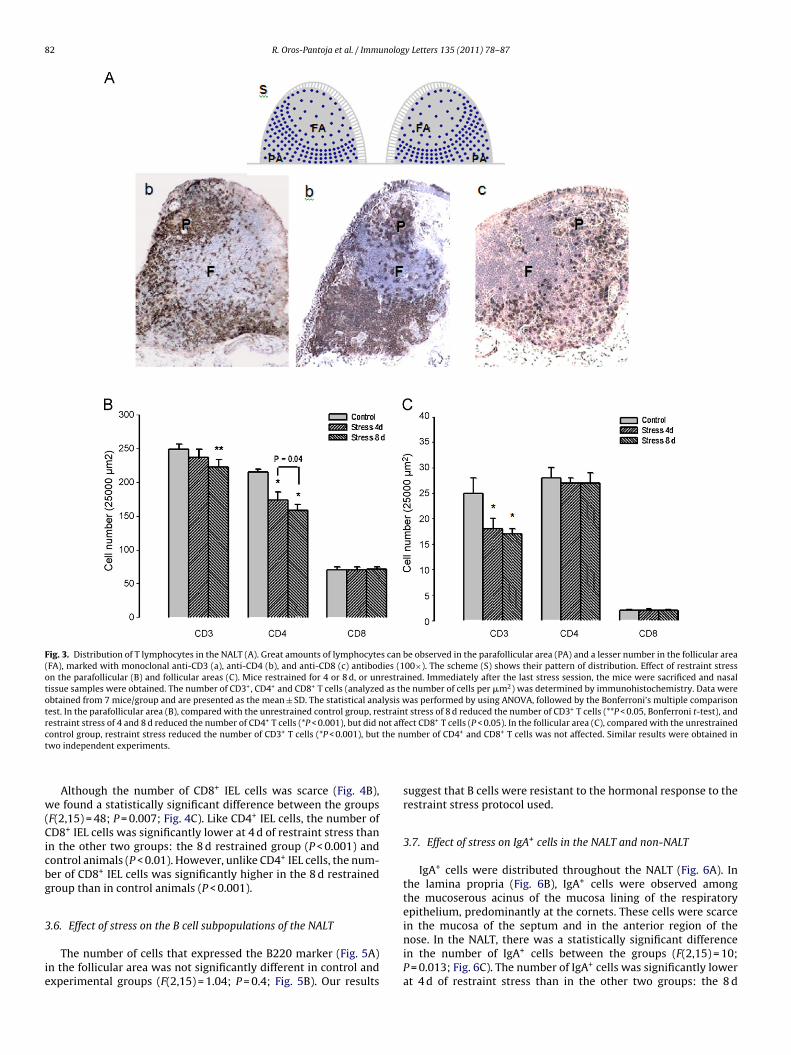
82 R. Oros-Pantoja et al. / Immunology Letters 135 (2011) 78–87
Fig. 3. Distribution of T lymphocytes in the NALT (A). Great amounts of lymphocytes can be observed in the parafollicular area (PA) and a lesser number in the follicular area(FA), marked with monoclonal anti-CD3 (a), anti-CD4 (b), and anti-CD8 (c) antibodies (100×). The scheme (S) shows their pattern of distribution. Effect of restraint stresson the parafollicular (B) and follicular areas (C). Mice restrained for 4 or 8 d, or unrestrained. Immediately after the last stress session, the mice were sacrificed and nasaltissue samples were obtained. The number of CD3+, CD4+ and CD8+ T cells (analyzed as the number of cells per �m2) was determined by immunohistochemistry. Data wereobtained from 7 mice/group and are presented as the mean ± SD. The statistical analysis was performed by using ANOVA, followed by the Bonferroni’s multiple comparisontest. In the parafollicular area (B), compared with the unrestrained control group, restraint stress of 8 d reduced the number of CD3+ T cells (**P < 0.05, Bonferroni t-test), andr + ot aff +
c the nt
w(Cicbg
3
ie
estraint stress of 4 and 8 d reduced the number of CD4 T cells (*P < 0.001), but did nontrol group, restraint stress reduced the number of CD3+ T cells (*P < 0.001), butwo independent experiments.
Although the number of CD8+ IEL cells was scarce (Fig. 4B),e found a statistically significant difference between the groups
F(2,15) = 48; P = 0.007; Fig. 4C). Like CD4+ IEL cells, the number ofD8+ IEL cells was significantly lower at 4 d of restraint stress than
n the other two groups: the 8 d restrained group (P < 0.001) andontrol animals (P < 0.01). However, unlike CD4+ IEL cells, the num-er of CD8+ IEL cells was significantly higher in the 8 d restrainedroup than in control animals (P < 0.001).
.6. Effect of stress on the B cell subpopulations of the NALT
The number of cells that expressed the B220 marker (Fig. 5A)n the follicular area was not significantly different in control andxperimental groups (F(2,15) = 1.04; P = 0.4; Fig. 5B). Our results
ect CD8 T cells (P < 0.05). In the follicular area (C), compared with the unrestrainedumber of CD4+ and CD8+ T cells was not affected. Similar results were obtained in
suggest that B cells were resistant to the hormonal response to therestraint stress protocol used.
3.7. Effect of stress on IgA+ cells in the NALT and non-NALT
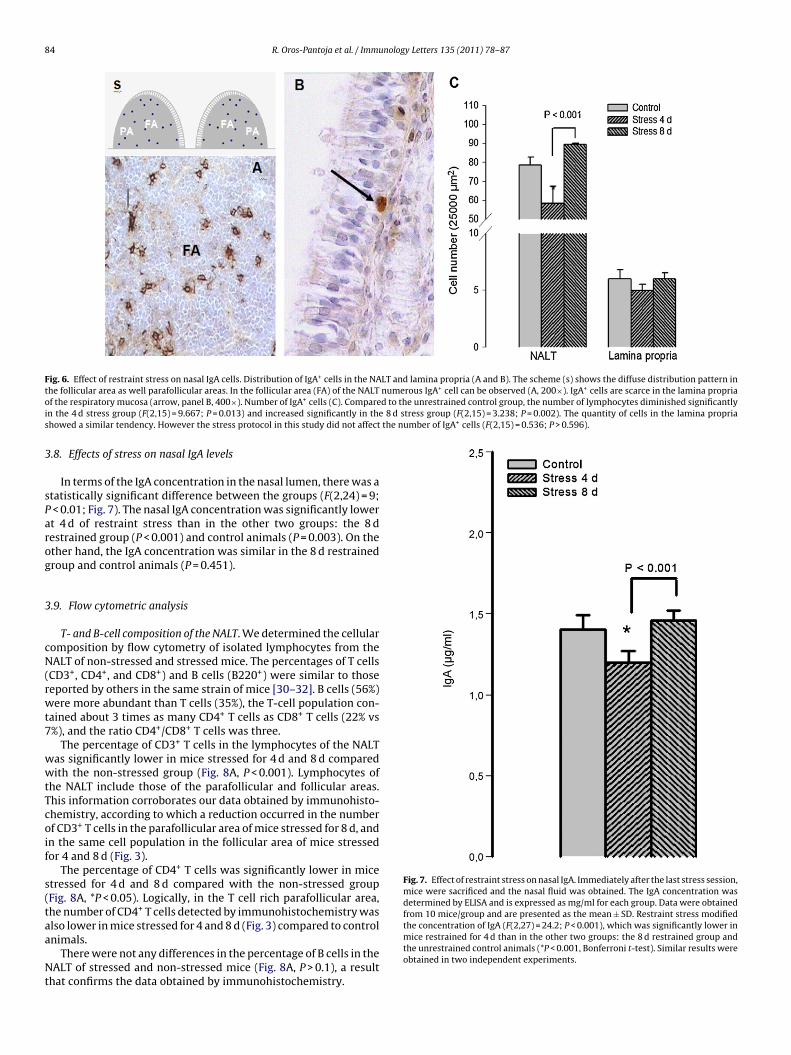
IgA+ cells were distributed throughout the NALT (Fig. 6A). Inthe lamina propria (Fig. 6B), IgA+ cells were observed amongthe mucoserous acinus of the mucosa lining of the respiratoryepithelium, predominantly at the cornets. These cells were scarce
in the mucosa of the septum and in the anterior region of thenose. In the NALT, there was a statistically significant differencein the number of IgA+ cells between the groups (F(2,15) = 10;P = 0.013; Fig. 6C). The number of IgA+ cells was significantly lowerat 4 d of restraint stress than in the other two groups: the 8 d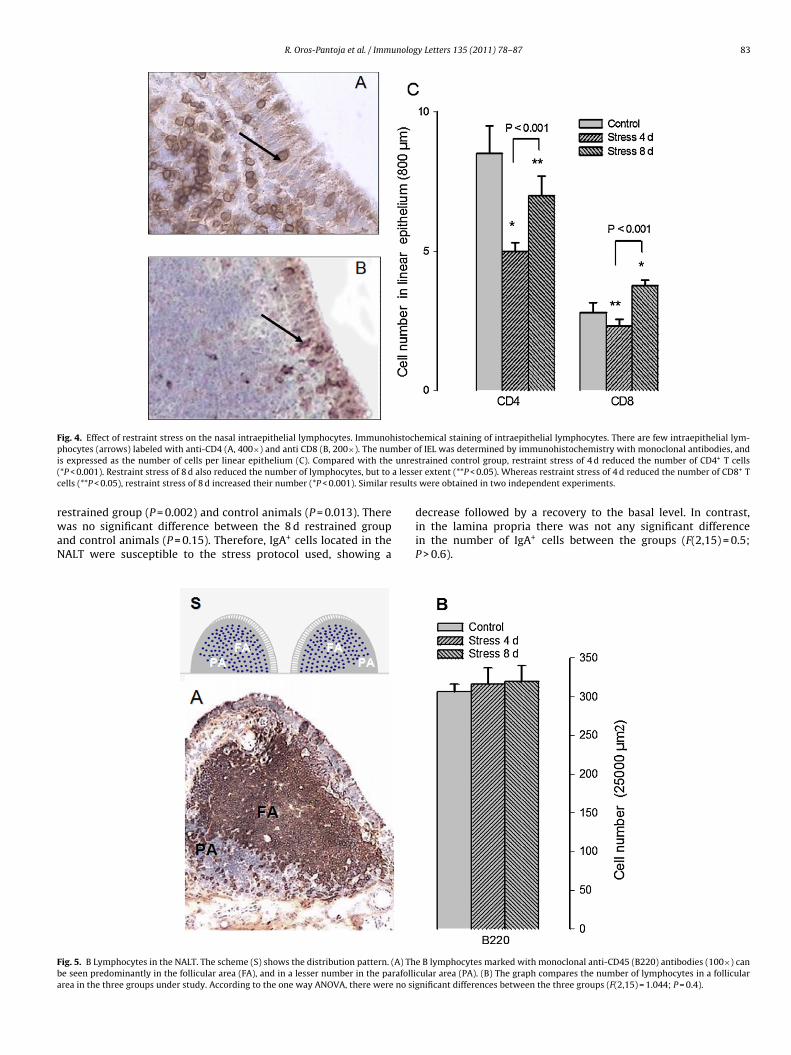
R. Oros-Pantoja et al. / Immunology Letters 135 (2011) 78–87 83
Fig. 4. Effect of restraint stress on the nasal intraepithelial lymphocytes. Immunohistochemical staining of intraepithelial lymphocytes. There are few intraepithelial lym-p ber oi unres( a lessec esults
rwaN
Fba
hocytes (arrows) labeled with anti-CD4 (A, 400×) and anti CD8 (B, 200×). The nums expressed as the number of cells per linear epithelium (C). Compared with the*P < 0.001). Restraint stress of 8 d also reduced the number of lymphocytes, but toells (**P < 0.05), restraint stress of 8 d increased their number (*P < 0.001). Similar r
estrained group (P = 0.002) and control animals (P = 0.013). Thereas no significant difference between the 8 d restrained group
nd control animals (P = 0.15). Therefore, IgA+ cells located in theALT were susceptible to the stress protocol used, showing a
ig. 5. B Lymphocytes in the NALT. The scheme (S) shows the distribution pattern. (A) The seen predominantly in the follicular area (FA), and in a lesser number in the parafollirea in the three groups under study. According to the one way ANOVA, there were no sig
f IEL was determined by immunohistochemistry with monoclonal antibodies, andtrained control group, restraint stress of 4 d reduced the number of CD4+ T cellsr extent (**P < 0.05). Whereas restraint stress of 4 d reduced the number of CD8+ Twere obtained in two independent experiments.
decrease followed by a recovery to the basal level. In contrast,in the lamina propria there was not any significant differencein the number of IgA+ cells between the groups (F(2,15) = 0.5;P > 0.6).
e B lymphocytes marked with monoclonal anti-CD45 (B220) antibodies (100×) cancular area (PA). (B) The graph compares the number of lymphocytes in a follicularnificant differences between the three groups (F(2,15) = 1.044; P = 0.4).
84 R. Oros-Pantoja et al. / Immunology Letters 135 (2011) 78–87
Fig. 6. Effect of restraint stress on nasal IgA cells. Distribution of IgA+ cells in the NALT and lamina propria (A and B). The scheme (s) shows the diffuse distribution pattern int numerous IgA+ cell can be observed (A, 200×). IgA+ cells are scarce in the lamina propriao d to the unrestrained control group, the number of lymphocytes diminished significantlyi 8 d stress group (F(2,15) = 3.238; P = 0.002). The quantity of cells in the lamina proprias the number of IgA+ cells (F(2,15) = 0.536; P > 0.596).
3
sParog
3
cN(rwt7
wwtTcoif
s(taa
Nt
Fig. 7. Effect of restraint stress on nasal IgA. Immediately after the last stress session,mice were sacrificed and the nasal fluid was obtained. The IgA concentration wasdetermined by ELISA and is expressed as mg/ml for each group. Data were obtainedfrom 10 mice/group and are presented as the mean ± SD. Restraint stress modified
he follicular area as well parafollicular areas. In the follicular area (FA) of the NALTf the respiratory mucosa (arrow, panel B, 400×). Number of IgA+ cells (C). Comparen the 4 d stress group (F(2,15) = 9.667; P = 0.013) and increased significantly in thehowed a similar tendency. However the stress protocol in this study did not affect
.8. Effects of stress on nasal IgA levels
In terms of the IgA concentration in the nasal lumen, there was atatistically significant difference between the groups (F(2,24) = 9;< 0.01; Fig. 7). The nasal IgA concentration was significantly lowert 4 d of restraint stress than in the other two groups: the 8 destrained group (P < 0.001) and control animals (P = 0.003). On thether hand, the IgA concentration was similar in the 8 d restrainedroup and control animals (P = 0.451).
.9. Flow cytometric analysis
T- and B-cell composition of the NALT. We determined the cellularomposition by flow cytometry of isolated lymphocytes from theALT of non-stressed and stressed mice. The percentages of T cells
CD3+, CD4+, and CD8+) and B cells (B220+) were similar to thoseeported by others in the same strain of mice [30–32]. B cells (56%)ere more abundant than T cells (35%), the T-cell population con-
ained about 3 times as many CD4+ T cells as CD8+ T cells (22% vs%), and the ratio CD4+/CD8+ T cells was three.
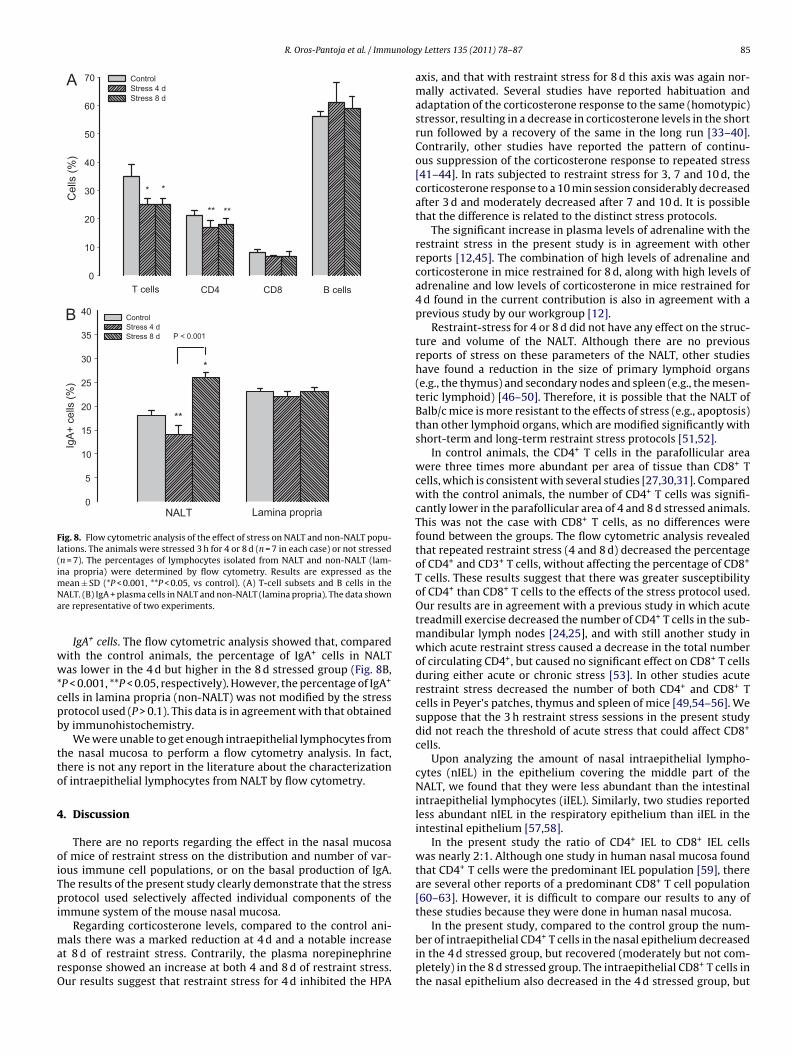
The percentage of CD3+ T cells in the lymphocytes of the NALTas significantly lower in mice stressed for 4 d and 8 d comparedith the non-stressed group (Fig. 8A, P < 0.001). Lymphocytes of
he NALT include those of the parafollicular and follicular areas.his information corroborates our data obtained by immunohisto-hemistry, according to which a reduction occurred in the numberf CD3+ T cells in the parafollicular area of mice stressed for 8 d, andn the same cell population in the follicular area of mice stressedor 4 and 8 d (Fig. 3).
The percentage of CD4+ T cells was significantly lower in micetressed for 4 d and 8 d compared with the non-stressed groupFig. 8A, *P < 0.05). Logically, in the T cell rich parafollicular area,he number of CD4+ T cells detected by immunohistochemistry was
lso lower in mice stressed for 4 and 8 d (Fig. 3) compared to controlnimals.There were not any differences in the percentage of B cells in theALT of stressed and non-stressed mice (Fig. 8A, P > 0.1), a result
hat confirms the data obtained by immunohistochemistry.
the concentration of IgA (F(2,27) = 24.2; P < 0.001), which was significantly lower inmice restrained for 4 d than in the other two groups: the 8 d restrained group andthe unrestrained control animals (*P < 0.001, Bonferroni t-test). Similar results wereobtained in two independent experiments.
R. Oros-Pantoja et al. / Immunolog
0
10
20
30
40
50
60
70 ControlStress 4 dStress 8 d
T cells
Cel
ls (%
)
CD4 CD8 B cells
**
A
**
* *
0
5
10
15
20
25
30
35
40ControlStress 4 dStress 8 d
IgA+
cel
ls (%
)
NALT Lamina propria
**
*
P < 0.001
B
Fig. 8. Flow cytometric analysis of the effect of stress on NALT and non-NALT popu-lations. The animals were stressed 3 h for 4 or 8 d (n = 7 in each case) or not stressed(n = 7). The percentages of lymphocytes isolated from NALT and non-NALT (lam-imNa
ww*cpb
tto
4
oiTpi
marO
In the present study, compared to the control group the num-
na propria) were determined by flow cytometry. Results are expressed as theean ± SD (*P < 0.001, **P < 0.05, vs control). (A) T-cell subsets and B cells in theALT. (B) IgA + plasma cells in NALT and non-NALT (lamina propria). The data shownre representative of two experiments.
IgA+ cells. The flow cytometric analysis showed that, comparedith the control animals, the percentage of IgA+ cells in NALTas lower in the 4 d but higher in the 8 d stressed group (Fig. 8B,
P < 0.001, **P < 0.05, respectively). However, the percentage of IgA+
ells in lamina propria (non-NALT) was not modified by the stressrotocol used (P > 0.1). This data is in agreement with that obtainedy immunohistochemistry.
We were unable to get enough intraepithelial lymphocytes fromhe nasal mucosa to perform a flow cytometry analysis. In fact,here is not any report in the literature about the characterizationf intraepithelial lymphocytes from NALT by flow cytometry.
. Discussion
There are no reports regarding the effect in the nasal mucosaf mice of restraint stress on the distribution and number of var-ous immune cell populations, or on the basal production of IgA.he results of the present study clearly demonstrate that the stressrotocol used selectively affected individual components of the
mmune system of the mouse nasal mucosa.Regarding corticosterone levels, compared to the control ani-
als there was a marked reduction at 4 d and a notable increaset 8 d of restraint stress. Contrarily, the plasma norepinephrineesponse showed an increase at both 4 and 8 d of restraint stress.ur results suggest that restraint stress for 4 d inhibited the HPA
y Letters 135 (2011) 78–87 85
axis, and that with restraint stress for 8 d this axis was again nor-mally activated. Several studies have reported habituation andadaptation of the corticosterone response to the same (homotypic)stressor, resulting in a decrease in corticosterone levels in the shortrun followed by a recovery of the same in the long run [33–40].Contrarily, other studies have reported the pattern of continu-ous suppression of the corticosterone response to repeated stress[41–44]. In rats subjected to restraint stress for 3, 7 and 10 d, thecorticosterone response to a 10 min session considerably decreasedafter 3 d and moderately decreased after 7 and 10 d. It is possiblethat the difference is related to the distinct stress protocols.
The significant increase in plasma levels of adrenaline with therestraint stress in the present study is in agreement with otherreports [12,45]. The combination of high levels of adrenaline andcorticosterone in mice restrained for 8 d, along with high levels ofadrenaline and low levels of corticosterone in mice restrained for4 d found in the current contribution is also in agreement with aprevious study by our workgroup [12].
Restraint-stress for 4 or 8 d did not have any effect on the struc-ture and volume of the NALT. Although there are no previousreports of stress on these parameters of the NALT, other studieshave found a reduction in the size of primary lymphoid organs(e.g., the thymus) and secondary nodes and spleen (e.g., the mesen-teric lymphoid) [46–50]. Therefore, it is possible that the NALT ofBalb/c mice is more resistant to the effects of stress (e.g., apoptosis)than other lymphoid organs, which are modified significantly withshort-term and long-term restraint stress protocols [51,52].
In control animals, the CD4+ T cells in the parafollicular areawere three times more abundant per area of tissue than CD8+ Tcells, which is consistent with several studies [27,30,31]. Comparedwith the control animals, the number of CD4+ T cells was signifi-cantly lower in the parafollicular area of 4 and 8 d stressed animals.This was not the case with CD8+ T cells, as no differences werefound between the groups. The flow cytometric analysis revealedthat repeated restraint stress (4 and 8 d) decreased the percentageof CD4+ and CD3+ T cells, without affecting the percentage of CD8+
T cells. These results suggest that there was greater susceptibilityof CD4+ than CD8+ T cells to the effects of the stress protocol used.Our results are in agreement with a previous study in which acutetreadmill exercise decreased the number of CD4+ T cells in the sub-mandibular lymph nodes [24,25], and with still another study inwhich acute restraint stress caused a decrease in the total numberof circulating CD4+, but caused no significant effect on CD8+ T cellsduring either acute or chronic stress [53]. In other studies acuterestraint stress decreased the number of both CD4+ and CD8+ Tcells in Peyer’s patches, thymus and spleen of mice [49,54–56]. Wesuppose that the 3 h restraint stress sessions in the present studydid not reach the threshold of acute stress that could affect CD8+
cells.Upon analyzing the amount of nasal intraepithelial lympho-
cytes (nIEL) in the epithelium covering the middle part of theNALT, we found that they were less abundant than the intestinalintraepithelial lymphocytes (iIEL). Similarly, two studies reportedless abundant nIEL in the respiratory epithelium than iIEL in theintestinal epithelium [57,58].
In the present study the ratio of CD4+ IEL to CD8+ IEL cellswas nearly 2:1. Although one study in human nasal mucosa foundthat CD4+ T cells were the predominant IEL population [59], thereare several other reports of a predominant CD8+ T cell population[60–63]. However, it is difficult to compare our results to any ofthese studies because they were done in human nasal mucosa.
ber of intraepithelial CD4+ T cells in the nasal epithelium decreasedin the 4 d stressed group, but recovered (moderately but not com-pletely) in the 8 d stressed group. The intraepithelial CD8+ T cells inthe nasal epithelium also decreased in the 4 d stressed group, but
8 nolog
is
npngirtccmt
itncthccc
vclicamd
ogiftohatoIoa(ihbls
adsToC4aMooo
[
[
[
[
[
[
[
[
[
[
[
[[
[
[
6 R. Oros-Pantoja et al. / Immu
ncreased beyond the basal level of the control animals in the 8 dtressed group. The causes of these differences are not known.
Whereas there was no significant change in the percentage andumber of IgA+ cells in the lamina propria of non-NALT areas, theercentage and number of IgA+ cells in the NALT and the level ofasal IgA were lower at 4 d of restraint stress than in the other tworoups: the 8 d restrained group and control animals. The reportsn the literature about stress and the number of IgA+ cells are all inelation to intestinal and respiratory mucosa. One report showedhat restraint stress does not reduce the number of IgA-producingells in intestinal lamina propria of mice [12]. The other studiesomparing the number of IgA+ cells in intestinal and respiratoryucosa used stress protocols related to exercise or sickness, and are
herefore difficult to compare to the current contribution [64,65].The mechanism of reduction of IgA+ cells is unknown. However,
n the present study this mechanism could not have been relatedo B cell population changes, since no significant differences wereoted in either absolute numbers or in the percentage of B220+
ells in the NALT between stressed and non-stressed mice. Becausehe level of corticosterone was lower and that of adrenaline wasigher in mice stressed for 4 d, it is possible that the lack of signifi-ant change in the population of B cells owes itself to the effects ofatecholamines, or to the ratio between catecholamines and gluco-orticoids, on the maturation and differentiation of B cells.
Adrenaline modulates B-cell function directly and indirectlyia changes in Th1-cell cytokine production [66–68]. Althoughonflicting findings exist about the role of adrenaline in the pro-iferation and maturation of B cells into IgA-secreting cells [69,70],t is possible that this hormone inhibits the number of IgA-secretingells, as well as the IgA produced per cell, by acting on plasmablastnd plasma cells in the lamina propria [67,68]. Catecholamines alsoay cause apoptosis of B cells [71,72], and/or modulate lymphocyte
istribution [73–75].In the present study the level of total IgA in the nasal lumen
f mice was lower at 4 d of restraint stress than in the other tworoups: the 8 d restrained group and control animals. Similarly, butn mouse intestine, we reported that repeated restraint stress (4 hor 4 d) reduces IgA levels [12]. We suppose that in the current studyhe high levels of norepinephrine greatly influenced the reductionf nasal IgA concentration at 4 d of restraint stress, reflecting theormonal effects on the number of cells producing IgA as well as themount of IgA secreted per cell. Catecholamines can have at leasthree effects related to IgA levels: (i) a reduction in the populationf IgA producing cells, (ii) a possible inhibition of the production ofgA per cell, and (iii) a reduction of blood flow, which has the effectf inhibiting IgA production [66,76,77]. In the present study, withhigh level of catecholamines and a low level of glucocorticoids
at 4 d of restraint stress), it is possible that the former acted tonhibit IgA production and the population of IgA+ cells. On the otherand, when the levels of catecholamines and glucocorticoids wereoth high (at 8 d of restraint stress), perhaps the high levels of the
atter blocked the influence of the former on the production and/orecretion of IgA.
In summary, repeated restraint stress altered the distributionnd number of lymphocytes and IgA+ cells in nasal mucosa. Weetected significant effects on the mouse NALT with the restrainttress protocol employed, such as the susceptibility of CD4+, CD8+
cells, and IgA+ cells. Also notable was the lack of susceptibilityf B cells. Furthermore, the effects of restraint stress on CD4+ cells,D8+ T cells, IgA+ cells and IgA levels were significantly different atd and 8 d. The number of IELs (CD4+ and CD8+ T cells) was lower
t 4 d and higher at 8 d of stress compared to the control group.ice restrained for 4 d had high levels of adrenaline and low levelsf corticosterone, whereas mice restrained for 8 d had high levelsf both adrenaline and corticosterone. The difference in the ratiof these two hormones was probably responsible for the decrease
[
[
y Letters 135 (2011) 78–87
in (at 4 d of stress) and recovery of (at 8 d of stress) the number ofIgA+ cells and the levels of IgA in the mouse NALT.
Conflict of interest
None of the authors has any conflict of interest in relation to thetechniques used or the subjects mentioned in this manuscript.
Acknowledgements
We thank Bruce Allan Larsen for reviewing the use of English inthis manuscript. This work was supported by SIP-IPN, COFAA-IPN,and CONACYT (Grant 33993).
References
[1] Mayer EA. Psychological stress and colitis. Gut 2000;46:595–6.[2] Mayer EA. The neurobiology of stress and gastrointestinal disease. Gut
2000;47:861–9.[3] Mayer EA, Naliboff BD, Chang L, Coutinho SVV. Stress and irritable bowel syn-
drome. Am J Physiol Gastrointest Liver Physiol 2001;280:G519–524.[4] Collins SM. Stress and the gastrointestinal tract IV. Modulation of intestinal
inflammation by stress: basic mechanisms and clinical relevance. Am J PhysiolGastrointest Liver Physiol 2001;280:G315–8.
[5] Mawdsley JE, Rampton DS. Psychological stress in IBD: new insights intopathogenic and therapeutic implications. Gut 2005;54:1481–91.
[6] Pedersen BK, Hoffman-Goetz L. Exercise and the immune system: regulation,integration, and adaptation. Physiol Rev 2000;80:1055–81.
[7] Gleeson M, Bishop NC. Special feature for the Olympics: effects of exerciseon the immune system: modification of immune responses to exercise bycarbohydrate, glutamine and anti-oxidant supplements. Immunol Cell Biol2000;78:554–61.
[8] Gleeson M, Pyne DB. Special feature for the Olympics: effects of exercise onthe immune system: exercise effects on mucosal immunity. Immunol Cell Biol2000;78:536–44.
[9] Pyne DB, McDonald WA, Gleeson M, Flanagan A, Clancy RL, Fricker PA. Mucosalimmunity, respiratory illness, and competitive performance in elite swimmers.Med Sci Sports Exerc 2001;33:348–53.
10] Bosch JA, Ring C, de Geus EJ, Veerman EC, Amerongen AV. Stress and secretoryimmunity. Int Rev Neurobiol 2002;52:213–53.
11] Teeuw W, Bosch JA, Veerman EC, Amerongen AV. Neuroendocrine regulationof salivary IgA synthesis and secretion: implications for oral health. Biol Chem2004;385:1137–46.
12] Jarillo-Luna A, Rivera-Aguilar V, Garfias HR, Lara-Padilla E, Kormanovsky A,Campos-Rodriguez R. Effect of repeated restraint stress on the levels of intesti-nal IgA in mice. Psychoneuroendocrinology 2007;32:681–92.
13] Jarillo-Luna A, Rivera-Aguilar V, Martinez-Carrillo BE, Barbosa-Cabrera E,Garfias HR, Campos-Rodriguez R. Effect of restraint stress on the popula-tion of intestinal intraepithelial lymphocytes in mice. Brain Behav Immun2007.
14] Cohen S, Tyrrell DA, Smith AP. Psychological stress and susceptibility to thecommon cold. N Engl J Med 1991;325:606–12.
15] Bermon S. Airway inflammation and upper respiratory tract infection in ath-letes: is there a link? Exerc Immunol Rev 2007;13:6–14.
16] Gleeson M. Mucosal immunity and respiratory illness in elite athletes. Int JSports Med 2000;21(Suppl. 1):S33–43.
17] Gleeson M. Mucosal immune responses and risk of respiratory illness in eliteathletes. Exerc Immunol Rev 2000;6:5–42.
18] Nieman DC. Exercise, infection, and immunity. Int J Sports Med 1994;15(Suppl.3):S131–41.
19] Gleeson M, McDonald WA, Pyne DB, Cripps AW, Francis JL, Fricker PA, et al.Salivary IgA levels and infection risk in elite swimmers. Med Sci Sports Exerc1999;31:67–73.
20] Gleeson M, McDonald WA, Pyne DB, Clancy RL, Cripps AW, Francis JL, et al.Immune status and respiratory illness for elite swimmers during a 12-weektraining cycle. Int J Sports Med 2000;21:302–7.
21] Mackinnon L. Advances in Exercise Immunology. Human Kinetics 1999.22] Sheridan JF, Dobbs C, Jung J, Chu X, Konstantinos A, Padgett D, et al. Stress-
induced neuroendocrine modulation of viral pathogenesis and immunity. AnnN Y Acad Sci 1998;840:803–8.
23] Nishioka K, Okano M, Ichihara Y, Ichihara N, Nishizaki K. Immunosuppressiveeffect of restraint stress on the initiation of allergic rhinitis in mice. Int ArchAllergy Immunol 2005;136:142–7.
24] Boudreau J, Quadrilatero J, Hoffman-Goetz L. Voluntary training in mice andsubmandibular lymphocyte response to acute exercise. Med Sci Sports Exerc
2005;37:2038–45.25] Quadrilatero J, Boudreau J, Hoffman-Goetz L. Lymphocyte distribution in mousesubmandibular lymph nodes in response to acute treadmill exercise. Can JPhysiol Pharmacol 2003;81:972–8.
26] Csencsits KL, Jutila MA, Pascual DW. Nasal-associated lymphoid tissue: phe-notypic and functional evidence for the primary role of peripheral node
unolog
[
[
[
[
[
[
[
[
[
[
[
[
[
[
[
[
[
[
[
[
[
[
[
[
[
[
[
[
[
[
[
[
[
[
[
[
[
[
[
[
[
[
[
[
[
[
[
[
[regulating mucosal immune responses. Brain Behav Immun 1998;12:53–63.
R. Oros-Pantoja et al. / Imm
addressing in naive lymphocyte adhesion to high endothelial venules in amucosal site. J Immunol 1999;163:1382–9.
27] Bienenstock J, McDermott MR. Bronchus- and nasal-associated lymphoid tis-sues. Immunol Rev 2005;206:22–31.
28] Kraal G. Nasal-associated lymphoid tissue. In: Mestecky J, Lamm ME, Strober W,Bienenstock J, McGhee JR, Mayer L, editors. Mucosal immunology. Amsterdam:Elsevier; 2005. p. 415–22.
29] Kiyono H, Fukuyama S. NALT- versus Peyer’s-patch-mediated mucosal immu-nity. Nat Rev Immunol 2004;4:699–710.
30] Asanuma H, Thompson AH, Iwasaki T, Sato Y, Inaba Y, Aizawa C, et al. Isolationand characterization of mouse nasal-associated lymphoid tissue. J ImmunolMethods 1997;202:123–31.
31] Heritage PL, Underdown BJ, Arsenault AL, Snider DP, McDermott MR. Com-parison of murine nasal-associated lymphoid tissue and Peyer’s patches. Am JRespir Crit Care Med 1997;156:1256–62.
32] Rodriguez-Monroy MA, Rojas-Hernandez S, Moreno-Fierros L. Phenotypic andfunctional differences between lymphocytes from NALT and nasal passages ofmice. Scand J Immunol 2007;65:276–88.
33] Dhabhar FS, McEwen BS, Spencer RL. Adaptation to prolonged or repeatedstress—comparison between rat strains showing intrinsic differences in reac-tivity to acute stress. Neuroendocrinology 1997;65:360–8.
34] Strausbaugh HJ, Dallman MF, Levine JD. Repeated, but not acute, stresssuppresses inflammatory plasma extravasation. Proc Natl Acad Sci U S A1999;96:14629–34.
35] Melia KR, Ryabinin AE, Schroeder R, Bloom FE, Wilson MC. Induction and habit-uation of immediate early gene expression in rat brain by acute and repeatedrestraint stress. J Neurosci 1994;14:5929–38.
36] Armario A, Hidalgo J, Giralt M. Evidence that the pituitary–adrenal axis doesnot cross-adapt to stressors: comparison to other physiological variables. Neu-roendocrinology 1988;47:263–7.
37] Hashimoto K, Suemaru S, Takao T, Sugawara M, Makino S, Ota Z. Corticotropin-releasing hormone and pituitary–adrenocortical responses in chronicallystressed rats. Regul Pept 1988;23:117–26.
38] Hauger RL, Lorang M, Irwin M, Aguilera G. CRF receptor regulation and sensi-tization of ACTH responses to acute ether stress during chronic intermittentimmobilization stress. Brain Res 1990;532:34–40.
39] Ma XM, Lightman SL. The arginine vasopressin and corticotrophin-releasinghormone gene transcription responses to varied frequencies of repeated stressin rats. J Physiol 1998;510(Pt 2):605–14.
40] Ma XM, Lightman SL, Aguilera G. Vasopressin and corticotropin-releasing hor-mone gene responses to novel stress in rats adapted to repeated restraint.Endocrinology 1999;140:3623–32.
41] Andres R, Marti O, Armario A. Direct evidence of acute stress-inducedfacilitation of ACTH response to subsequent stress in rats. Am J Physiol1999;277:R863–8.
42] Gadek-Michalska A, Bugajski J. Repeated handling, restraint, or chroniccrowding impair the hypothalamic–pituitary–adrenocortical response to acuterestraint stress. J Physiol Pharmacol 2003;54:449–59.
43] Dallman MF, Akana SF, Strack AM, Scribner KS, Pecoraro N, La Fleur SE, et al.Chronic stress-induced effects of corticosterone on brain: direct and indirect.Ann N Y Acad Sci 2004;1018:141–50.
44] Rich EL, Romero LM. Exposure to chronic stress downregulates corticos-terone responses to acute stressors. Am J Physiol Regul Integr Comp Physiol2005;288:R1628–36.
45] Uresin Y, Erbas B, Ozek M, Ozkok E, Gurol AO. Losartan may prevent the ele-vation of plasma glucose, corticosterone and catecholamine levels induced bychronic stress. J Renin Angiotensin Aldosterone Syst 2004;5:93–6.
46] Durnova GN, Kaplanskii AS, Glagoleva EV. Dynamics of morphological changesin the adrenal glands and lymphoid organs during immobilization stress in rats.Arkh Anat Gistol Embriol 1983;85:67–72.
47] Grigorenko DE, Budushkina EE. Mesenteric lymph nodes in the rat after expo-sure to hydrocortisone. Arkh Anat Gistol Embriol 1985;89:58–62.
48] Dominguez-Gerpe L, Rey-Mendez M. Time-course of the murine lym-phoid tissue involution during and following stressor exposure. Life Sci1997;61:1019–27.
49] Sudo N, Oyama N, Yu XN, Kubo C. Restraint stress-induced elevation of endoge-nous glucocorticoids decreases Peyer’s patch cell numbers via mechanismsthat are either dependent or independent on apoptotic cell death. Neuroim-
munomodulation 2001;9:333–9.50] Roy MJ, Walsh TJ. Histopathologic and immunohistochemical changes in gut-associated lymphoid tissues after treatment of rabbits with dexamethasone.Lab Invest 1992;66:437–43.
51] Kiank C, Holtfreter B, Starke A, Mundt A, Wilke C, Schutt C. Stress suscepti-bility predicts the severity of immune depression and the failure to combat
[
[
y Letters 135 (2011) 78–87 87
bacterial infections in chronically stressed mice. Brain Behav Immun 2006;20:359–68.
52] Gonzales XF, Deshmukh A, Pulse M, Johnson K, Jones HP. Stress-induced differ-ences in primary and secondary resistance against bacterial sepsis correspondswith diverse corticotropin releasing hormone receptor expression by pul-monary CD11c+ MHC II+ and CD11c− MHC II+ APCs. Brain Behav Immun2008;22:552–64.
53] Bauer ME, Perks P, Lightman SL, Shanks N. Are adhesion molecules involved instress-induced changes in lymphocyte distribution? Life Sci 2001;69:1167–79.
54] Sudo N, Yu XN, Sogawa H, Kubo C. Restraint stress causes tissue-specific changes in the immune cell distribution. Neuroimmunomodulation1997;4:113–9.
55] Yin D, Tuthill D, Mufson RA, Shi Y. Chronic restraint stress promotes lymphocyteapoptosis by modulating CD95 expression. J Exp Med 2000;191:1423–8.
56] Teshima H, Sogawa H, Kihara H, Nakagawa T. Influence of stress on the maturityof T-cells. Life Sci 1991;49:1571–81.
57] Sminia TKG. Nasal-associated lymphoid tissue. Mucosal Immunol1999:357–64.
58] Cesta MF. Normal structure, function, and histology of mucosa-associated lym-phoid tissue. Toxicol Pathol 2006;34:599–608.
59] Winther B, Innes Jr DJ, Mills SE, Mygind N, Zito D, Hayden FG. Lymphocytesubsets in normal airway mucosa of the human nose. Arch Otolaryngol HeadNeck Surg 1987;113:59–62.
60] Graeme-Cook F, Bhan AK, Harris NL. Immunohistochemical characterization ofintraepithelial and subepithelial mononuclear cells of the upper airways. Am JPathol 1993;143:1416–22.
61] Hameleers DM, Stoop AE, van der Ven I, Biewenga J, van der Baan S, SminiaT. Intra-epithelial lymphocytes and non-lymphoid cells in the human nasalmucosa. Int Arch Allergy Appl Immunol 1989;88:317–22.
62] Pawankar R, Okuda M. A comparative study of the characteristics of intraep-ithelial and lamina propria lymphocytes of the human nasal mucosa. Allergy1993;48:99–105.
63] Okuda M, Pawankar R. Flow cytometric analysis of intraepithelial lymphocytesin the human nasal mucosa. Allergy 1992;47:255–9.
64] Coutinho HB, Robalinho TI, Coutinho VB, Amorim AM, Furtado AF, Ferraz A, et al.Intra-abdominal sepsis: an immunocytochemical study of the small intestinemucosa. J Clin Pathol 1997;50:294–8.
65] Nilssen DE, Oktedalen O, Lygren I, Opstad PK, Brandtzaeg P. Intestinal IgA- andIgM-producing cells are not decreased in marathon runners. Int J Sports Med1998;19:425–31.
66] Elenkov IJ, Wilder RL, Chrousos GP, Vizi ES. The sympathetic nerve—an integra-tive interface between two supersystems: the brain and the immune system.Pharmacol Rev 2000;52:595–638.
67] Kohm AP, Sanders VM. Norepinephrine and beta 2-adrenergic receptor stimula-tion regulate CD4+ T and B lymphocyte function in vitro and in vivo. PharmacolRev 2001;53:487–525.
68] Sanders VM, Kohm AP. Sympathetic nervous system interaction with theimmune system. Int Rev Neurobiol 2002;52:17–41.
69] Li YS, Kouassi E, Revillard JP. Differential regulation of mouse B-cell activationby beta-adrenoceptor stimulation depending on type of mitogens. Immunology1990;69:367–72.
70] Winzer A, Ring C, Carroll D, Willemsen G, Drayson M, Kendall M. Secretoryimmunoglobulin A and cardiovascular reactions to mental arithmetic, coldpressor, and exercise: effects of beta-adrenergic blockade. Psychophysiology1999;36:591–601.
71] Bergquist J, Tarkowski A, Ewing A, Ekman R. Catecholaminergic suppression ofimmunocompetent cells. Immunol Today 1998;19:562–7.
72] Stevenson JR, Westermann J, Liebmann PM, Hortner M, Rinner I, Felsner P, et al.Prolonged alpha-adrenergic stimulation causes changes in leukocyte distribu-tion and lymphocyte apoptosis in the rat. J Neuroimmunol 2001;120:50–7.
73] Benschop RJ, Rodriguez-Feuerhahn M, Schedlowski M. Catecholamine-inducedleukocytosis: early observations, current research, and future directions. BrainBehav Immun 1996;10:77–91.
74] Gader AM, Cash JD. The effect of adrenaline, noradrenaline, isoprenaline andsalbutamol on the resting levels of white blood cells in man. Scand J Haematol1975;14:5–10.
75] Gonzalez-Ariki S, Husband AJ. The role of sympathetic innervation of the gut in
76] Schmidt PT, Eriksen L, Loftager M, Rasmussen TN, Holst JJ. Fast acting ner-vous regulation of immunoglobulin A secretion from isolated perfused porcineileum. Gut 1999;45:679–85.
77] Lundgren O. Sympathetic input into the enteric nervous system. Gut2000;47(Suppl. 4):iv33–35 [discussion iv36].


