Embed Size (px)
Citation preview

at SciVerse ScienceDirect
Quaternary Geochronology 19 (2014) 148e162
Contents lists available
Quaternary Geochronology
journal homepage: www.elsevier .com/locate/quageo
Research paper
Effects of sediment mixing on 10Be concentrations in the Zielbachcatchment, central-eastern Italian Alps
S. Savi a,*, K. Norton a,b, V. Picotti c, F. Brardinoni d, N. Akçar a, P.W. Kubik e, R. Delunel a,F. Schlunegger a
aUniversity of Bern, Institute of Geology, Baltzersstrasse 1þ3, CH-3012 Bern, SwitzerlandbVictoria University of Wellington, School of Geography, Environment and Earth Science, PO Box 600, 6140 Wellington, New ZealandcUniversity of Bologna, Department of Earth Science, Geology and Environment, Via Zamboni 67, 40127 Bologna, ItalydUniversity of Milano-Bicocca, Department of Geological Sciences and Geotechnologies, Piazza della Scienza 4, 20126 Milano, Italye ETH Zürich, Labor f. Ionenstrahlphysik (LIP), Schafmattstrasse 20, 8093 Zürich, Switzerland
a r t i c l e i n f o
Article history:Received 20 February 2012Received in revised form18 January 2013Accepted 21 January 2013Available online 4 February 2013
Keywords:Spatial mixingTemporal mixingMass-wasting processesBasin-wide erosion rateCosmogenic nuclidesSüdtirol
* Corresponding author. Tel.: þ41 (0) 31 6318772;E-mail address: [email protected] (S. Savi).
1871-1014/$ e see front matter � 2013 Elsevier B.V.http://dx.doi.org/10.1016/j.quageo.2013.01.006
a b s t r a c t
Basin-wide erosion rates can be determined through the analysis of in situ-produced cosmogenic nu-clides. In transient landscapes, and particularly in mountain catchments, erosion and transport processesare often highly variable and consequently the calculated erosion rates can be biased. This can be due tosediment pulses and poor mixing of sediment in the stream channels. The mixing of alluvial sediment isone of the principle conditions that need to be verified in order to have reliable results. In this paper weperform a field-based test of the extent of sediment mixing for a w42 km2 catchment in the Alps usingconcentrations of river-born 10Be. We use this technique to assess the mechanisms and the spatio-temporal scales for the mixing of sediment derived from hillslopes and tributary channels. The resultsshow that sediment provenance and transport, and mixing processes have a substantial impact on the10Be concentrations downstream of the confluence between streams and tributary channels. We alsoillustrate that the extent of mixing significantly depends on: the sizes of the catchments involved, themagnitude of the sediment delivery processes, the downstream distance of a sample site after a con-fluence, and the time since the event occurred. In particular, continuous soil creep and shallow land-sliding supply high 10Be concentration material from the hillslope, congruently increasing the 10Beconcentrations in the alluvial sediment. Contrariwise, a high frequency of mass-wasting processes or theoccurrence of sporadic but large-magnitude events results in the supply of low-concentration sedimentthat lowers the cosmogenic nuclide concentration in the channels. The predominance of mass-wastingprocesses in a catchment can cause a strong bias in detrital cosmogenic nuclide concentrations, andtherefore calculated erosion rates may be significantly over- or underestimated. Accordingly, it isimportant to sample as close as possible to the return-period of large-size sediment input events. This willlead to an erosion rate representative of the “mass-wasting signal” in case of generally high-frequencyevents, or the “background signal” when the event is sporadic. Our results suggest that a careful con-sideration of the extent of mixing of alluvial sediment is of primary importance for the correct estimationof 10Be-based erosion rates in mountain catchments, and likewise, that erosion rates have to be inter-preted cautiously when the mixing conditions are unknown or mixing has not been achieved.
� 2013 Elsevier B.V. All rights reserved.
1. Introduction
In the past decade, the use of cosmogenic nuclides for esti-mating basin-wide erosion rates has experienced a large increasethanks to the wide applicability of this technique and the con-tinuously increasing precision of calculated erosion rates. Basin-wide erosion rates are generally determined through the analysis
fax: þ41 (0) 31 6314843.
All rights reserved.
of in situ-produced cosmogenic nuclides (Brown et al., 1995) basedon the idea that samples taken at the outlet of a catchment arerepresentative of the entire upstream basin (Granger et al., 1996;von Blanckenburg, 2005; Dunai, 2010). Quartz grains on hillslopesare characterized by a specific nuclide concentration, which isproportional to the time they spent in the near surface and inver-sely proportional to the erosion rate (Lal, 1991; Gosse and Phillips,2001). After detachment, the grains will be transported to thechannels, mixed by water, and carried to the basin outlet, wherethey are considered to represent the natural variation of the entire
S. Savi et al. / Quaternary Geochronology 19 (2014) 148e162 149
catchment area (Brown et al., 1995; Granger et al., 1996). However,this is only true when a certain number of assumptions are verified(see review by von Blanckenburg, 2005). The fundamentalassumption is that denudation rates are uniform through space andtime; i.e. the catchment is in cosmogenic steady-state. If this is thecase, then the in-going nuclide flux through production is equal tothe out-going flux through decay and erosion, and the system is inisotopic equilibrium (Bierman and Steig, 1996). A related assump-tion, which becomes more important in regions with highly vari-able process rates, is that the sub-catchments deliver quartz inproportion to their erosion rates. In a geomorphic sense, this re-quires that the sediment flux downstream of a confluence is equalto the sum of the upstream fluxes, as has been exemplified for theeastern side of the Andes (Wittmann et al., 2009). These two as-sumptions can bemet when each of the surfaces and the tributariesdeliver sediment in proportion with their supply area and long-term erosion rates (Granger et al., 1996; von Blanckenburg, 2005).When these assumptions are not met, the catchment is not ingeomorphic equilibrium and the use of the cosmogenic techniquein the calculation of basin-wide erosion rates becomes problematic(von Blanckenburg, 2005).
In transient landscapes, catchments can be subjected to sporadicmass-wasting processes so that sediment delivery to streams be-comes highly irregular (Bierman and Steig, 1996; Belmont et al.,2007; Palumbo et al., 2011; Vassallo et al., 2011). When this oc-curs, the nuclide concentration can only be interpreted as an ero-sion rate after a detailed geomorphic analysis of the basin, since itsvalue will be biased toward a specific sub-catchment depending onthe mobilized volume of sediment (Granger et al., 1996; Binnieet al., 2006; Yanites et al., 2009; Van den Berg et al., 2012). In thiscase, a sample collected at the outlet of the basin cannot be con-sidered representative of the entire catchment since it would bedominated by material from only a fraction of the area. This mightresult in an over- or under-estimation of the erosion rate (Biermanand Steig, 1996; Granger et al., 1996; Niemi et al., 2005; Binnie et al.,2006; Yanites et al., 2009). According to these authors, there aretwo key-variables to take into account when working in transientlandscapes: the size of the catchment and the extent to which thesediments are mixed. Large catchments (e.g. >100 km2) mitigatethe effects of landslides and sporadic events, which can be dis-tributed through the system, minimizing the repercussion onnuclide concentrations in the alluvial sediment (Clapp et al., 2002;Matmon et al., 2003; von Blanckenburg, 2005; Wittmann et al.,2007; Yanites et al., 2009). Accordingly, when the catchment issmall (e.g. <50e70 km2) the mass-wasting effects cannot beneglected and the system has to be analyzed with more detail. Itthen becomes important that sediment is completely mixed inorder for a sample to be representative of the system (Bierman andSteig, 1996; Binnie et al., 2006).
Despite widespread assumptions of well-mixed samples, thereare only few studies that analyze perturbations in mountainchannels in detail (e.g., Kober et al., 2012). Moreover, the numberof studies decreases further if we consider the size of the catch-ments, since most of these focus on basins with generally well-mixed sediment (Clapp et al., 2002; Matmon et al., 2003;Wittmann et al., 2009), and only one study focuses on sedimentmixing in small-size catchments (Binnie et al., 2006). These au-thors showed that complete mixing typically occurs over w10 mdistance downstream from a junction in the steady state SanBernardino Mountains, USA. However, it is unclear whether sucha simple relationship will also be valid in a more complexenvironment.
Here, we bring a contribution toward the understanding ofsediment mixing effects on in-situ cosmogenic nuclide concentra-tions in alluvial sediment, within the framework of a transient
landscape. We proceed by following the methodology proposed byBinnie et al. (2006), and present the results from a sediment mixingmodel for a w33.5 km2 catchment in the central-eastern ItalianAlps. In contrast to the study of Binnie et al. (2006), we explore theextent of mixing in a geomorphic transient catchment wheremass-wasting processes (i.e., debris flows) are frequent. We also samplesoil in order to have a reference background value and to betterunderstand the dynamics between production and transfer ofsediment. Moreover, we test the extent of sediment mixingdownstream from a junction between two tributaries, samplingalluvial sediment at multiple locations along the basin’s trunkstream. The particular geomorphic setting of the catchment addi-tionally allows evaluating the effects of different processes (shallowlandslides and soil creep vs. debris flows) on 10Be concentrations inalluvial sediment. In this paper, we specifically address the limits tothe applicability of the cosmogenic nuclide method in Alpinecatchments and discuss the spatial and temporal repercussions ofsediment supply through mass-wasting events on cosmogenicnuclide concentrations in streams.
2. Setting and study site
The Zielbach catchment (33.5 km2) is located in the Südtirolregion of the central-eastern Italian Alps (Jarman et al., 2011)(Fig. 1). Elevation ranges between 505 m a.s.l. (at the confluencewith the Adige River) and 3337 m a.s.l. (Mt. Rosso). The basin isunderlain by the Upper Austroalpine metamorphic basement(Schmid et al., 2004), where the main lithologies are ortho- andpara-gneisses, mica schists, quartzites, amphibolites and marbles.From a geomorphic point of view, it can be divided in two sectors:(i) the w25.5 km2 main catchment where the Zielbach channel ischaracterized by steep bedrock reaches forming several meters-high cascades, tens of meters-long step-pool segments, and mul-tiple tributaries along its descent; and (ii) the w2.3 km2 easterntributary catchment, where a network of debris-flow channels isperched on a deep-seated sackung (here termed the debris-flowcatchment) (Fig. 2).
In the main catchment, the geometry of the channel network isstrongly controlled by the litho-tectonic fabric and channels followmajor faults and foliations. The Zielbach trunk stream originates atan altitude of ca. 20800 m a.s.l. and reaches the Adige River at anelevation of ca. 505 m a.s.l., after building a large fan (Fig. 1). Severalknick-zones are recognizable in the landscape along the mainlongitudinal profile. The lowest-knick zone is the most prominentand hosts one of the highest waterfalls of the region, with a verticaldrop of 97 m. These knick-zones are generally associated withlithologic and structural features or morphological steps related toglacial sculpting and represent high “steps” in the channel longprofile (Fig. 3). Overall, the morphology of the main catchment ischaracterized by steep headwaters and U-shaped tributary valleyswhere deposits of different origins are visible in the landscape. Inthe headwaters, till-mantled bedrock predominates, and rock gla-ciers and rock fall deposits have been deposited behind transversetopographic ridges that follow tectonic structures. These ridgeshave retained hillslope-derived sediment in semi-closed sedi-mentary traps, thus inhibiting the direct transfer of sediment to thechannel network. Shallow (<1 m thick) and small (<10’000 m2)superficial landslides locally affect the Quaternary till cover. Areasoccupied by loose material (as rock fall deposits, rock glaciers,moraines, scree and talus slope deposits) represent potentialsediment sources, but they are generally disconnected from theZielbach channel network (Figs. 1 and 2). Above 1500e1700m a.s.l.,soils are developed on glacial till, while below this altitude, agri-cultural activity is intense and grassland and orchards predomi-nate. Soils have a variable thickness, ranging between 30 and 80 cm

Fig. 1. Location and Quaternary deposits of the Zielbach catchment. The map shows the subcatchments (dotted line) and the tributaries analyzed. Sampling locations: filled di-amonds represent the Zielbach main stream deposits, empty diamonds represent tributary samples, the two debris-flow samples are marked with filled circles, and the soils aremarked with filled squares. Light color indicates loose material, dark color refers to residual till cover (above 1500e1700 m) or soil mantled areas (below these altitudes). Areas withno color represent bedrock. The location of S01 in this paper corresponds to the sample site of Norton et al., (2011).
S. Savi et al. / Quaternary Geochronology 19 (2014) 148e162150
(minimum), with less than 10 cm of organic horizon and well-developed major stratification. The tree line is located at about2’000 m a.s.l. and occupies the lower part of the catchment only.
The eastern debris flow catchment is characterized by steepbedrock headwaters (w50� on average) that have suppliedmaterialthrough rock fall events, and by a large amount of unconsolidatedsediment stored in scree and in colluvial deposits within thechannels (several meters thick), available to be transferred throughdebris flows to the fan and the Adige River (Fig. 2C). The highsteepness of this slope creates a direct connection between the
sediment sources in the headwaters and the channels, facilitatingthe initiation and the transfer of debris flow events. Indeed, largedebris flows and torrential floods have occurred frequently in thepast years. Recently, the largest debris-flow events in this catch-ment occurred in 2008 (70’000 m3) and August 2009 (22’800 m3).The 2008 event destroyed 5 bridges and damaged many applecultivations on the fan (Bolzano Province, SIRIO-IHR, ED30 data-base). During the same event, some of the sediment was alsosupplied by a small tributary of the main catchment (Fig.1, tributary13), as fresh unconsolidated material at the tributary bottom is

Fig. 2. Photographs of the Zielbach catchment. A) Panoramic view on the eastern side of the basin with visible the tops Höhe Waisse, Lodner and Tschigat; altitudes in parenthesis(taken from Tributary 16). B) Landscape of tributary 16. C) Slope of the debris-flow catchment; the picture is taken from an altitude of ca. 1700 m a.s.l. The two debris-flow channelsare partially hidden by trees and morphology. In the small picture (upper right corner of picture C) is shown the deposit within the western debris-flow channel (man as scale e
circle).
S. Savi et al. / Quaternary Geochronology 19 (2014) 148e162 151
visible on aerial orthophotos from that year. Debris flows betweenthe beginning of the survey in 1998 and 2008, e.g. the events in2004, were much smaller and did not exceed a transferred volumeof w3,000 m3 (Bolzano Province, SIRIO-IHR, ED30 database).
The topography of the entire catchment has been stronglyaffected by glaciations and glacial erosion. Despite the almostcomplete absence of active glaciers nowadays (few glaciers remain
in the uppermost part of the catchment), several indicators of pastglacial activity can be found in the landscape. U-shaped valleymorphologies, till deposits that almost entirely cover the upper-most area of the basin and moraines suggest that the landscape hasbeen strongly glaciated in the past. In addition, several rock-glaciersare present in the major tributary catchments. Penck and Brückner(1909) show that glaciers covered the entire catchment during the

Fig. 3. Sampling location in relationship with stream and catchment topographic profiles. Symbols follow Fig. 1. The ridgeline elevations are shown as black (east) and gray dashed(west) lines.
S. Savi et al. / Quaternary Geochronology 19 (2014) 148e162152
‘Würm’ period. Field observations, cosmogenic nuclides, and 14Cages also suggest that following the Last Glacial Maximum (LGM),deglaciation in this area of the Alps proceeded between 18,000 and15,000 yrs B P, with no evidence for glacier re-advance in morerecent cold periods (e.g., Younger Dryas; Bargossi et al., 2010; IviOchs et al., 2006). This is supported by Castiglioni (1928) whoshowed that glacial advances during the Little Ice Age (LIA) weremodest in this part of the Alps, when small glaciers formed above2’700 m a.s.l only. Accordingly, while lower elevations in thiscatchment have likely been ice-free since the LGM deglaciation, theupper sub-catchments have been subjected to repeated glacialperturbations lasting until the LIA.
3. Methods
3.1. Sampling strategy
We collected a total of 21 samples for 10Be analysis: 16 weretaken from alluvial sediments within the channel network andwere used to analyze the effects of sediment mixing, and 4 werecollected from soil, yielding information about the backgrounderosion rate on hillslopes (Fig. 1). Alluvial sediment was collectedfrom the surface, while soil samples were taken in the activelymixed top-soil between 10 and 50 cm depth. To investigate effectsrelated to the mixing of sediment, samples were taken from boththe Zielbach main channel and its major tributaries. For eachtributary, the samples were collected at the outlet of the tributary-catchment, while in the main channel the samples were takenbelow the junction with the tributaries and above and below theknick-zones. Two samples were collected from the outlet of thedebris-flow catchment as it hosts two separate channels. All thesamples were collected in sand bars in the corresponding activechannel; the location of the samples and their relationship to thestream long-profile are shown in Fig. 3.
The degree of sediment mixing was determined following thescheme proposed by Binnie et al. (2006), considering three samplesfor each junction: one each from the tributary andmain stream andone below the junction in the main river (Table 1; Fig. 4). The twodebris-flow samples S09 and S10 (Figs. 3 and 4) were consideredtogether, taking the average of their concentrations and summing
the two contributing areas. Binnie et al. (2006) sampled at a fixeddistance of w10 m from the junction, while here we have sampledtwo points at different downstream distances from the junction,ranging between w100 m and 3 km (depending on the best ach-ievable sample location). We did not collect further samples fromall smaller tributaries between the tributary junctions and thetrunk-stream samples (exceptions were the sites S06 and S08,where S07 enters in between). In this way, we build two sedimentmixing models for each junction, to calculate the differences inmixing ratios as the sediment is mixed downstream. This samplingstrategy allows us to analyze the spatial and temporal impact ofsediment mixing on in-situ cosmogenic nuclide concentrations.
3.2. Measurement of cosmogenic 10Be and erosion rates calculation
The 10Be concentrations were measured in quartz, which waspurified following a modified version (Akçar, 2006) of the onedescribed in Kohl and Nishiizumi (1992). The samples were firstsieved and only the fraction between 0.25 and 0.5 mmwas used inthe subsequent steps. The non-magnetic fraction was isolated witha Frantz magnetic separator and then treated with a series of acidsusing dilute HCl, HF and HNO3. Hydrochloric acid allows the dis-solution of carbonates and iron oxides while HF attacks all the othersilicate minerals. To accelerate the procedure, the mixture of acidsand samples were heated for few hours in an ultrasonic bath atw60 �C, and Aqua Regia was used for cleaning the samples of thelast acid residue (Akçar, 2006). Subsequently, extraction of thecosmogenic 10Be was performed at the University of Bern (Akçaret al., 2012). Samples were spiked with 0.15e0.18 mg of Be carrierbefore dissolution (Table 3). The 9Be/10Be ratios were corrected forthe measured long-term average blank ratio (3.13 � 0.12 � 10�15)and measured using accelerator mass spectrometer at the ETHZurich. The results were normalized to the S2007N standard witha nominal ratio of 28.1 � 10�12 (modified from Kubik and Christl,2010). Erosion rate calculations were performed following Balcoet al. (2008) using CRONUS EARTH calculator (ver. 2.2; http://hess.ess.washington.edu/) and are scaled for altitude and latitudeusing the scaling factors of Dunai (2001); with a SLHL productionrate of 4.43 � 0.52 atoms/g/a (Tables 2 and 3). For all the samplesthe mean elevation of the upstream catchment was used, with

Table 1Topographic features of the sub-catchments. Altitudes, areas and distances are calculated from a Digital Elevation Model with 2.5 m of resolution.
Sample name Sample site Sample altitudea
[m a.s.l.]Mean altitudeb
[m a.s.l.]Areac [km2] Downstream
distanced [m]Distance from thejunctione [m]
S01 Main channel e Fan 605 2363 31.29 1250 1850S02 Main channel e Fan 514 2339 31.70 230 2890S03 Main channel 1006 2529 25.53 3470 1290S06 Main channel 1546 2624 22.51 5420 125S07 Tributary 1527 2267 0.37 4990 e
S08 Main channel 1276 2564 24.54 5040 825S09 Debris flow channel 1135 1936 1.54 4860 e
S10 Debris flow channel 1163 2149 0.87 3900 e
S11 Main channel 1859 2674 17.91 3860 e
S13 Tributary 1556 2234 0.69 3900 e
S14 Main channel 1562 2654 21.26 6130 e
S15 Main channel 2206 2755 13.57 5250 150S16 Tributary 2224 2773 6.78 5290 e
S18 Main channel 2181 2746 14.17 8020 570S19 Main channel 1952 2714 15.37 8280 e
S20 Main channel 2340 2777 5.79 7610 e
S500 Soil sample 2200 e e e e
S501 Soil sample 2426 e e e e
S502 Soil sample 2426 e e e e
S504 Soil sample 2040 e e e e
a Altitude of the sample point.b Mean altitude of the upstream basin relative to sample point.c Area of the upstream basin relative to sample point.d Downstream distance of the sample from the Zielbach headwaters.e Downstream distance of the sample from the closest uppermost junction (only for the samples used in the models).
S. Savi et al. / Quaternary Geochronology 19 (2014) 148e162 153
exception for the soils were the site elevation was used. Soildenudation rates were also calculated using the surface productionrate. As pointed out by Granger and Riebe (2007), the nuclideconcentration at any depth in a mixed eroding soil is equal to the
Fig. 4. Scheme of the tributaries (black outlines) analyzed in the mixing m
surface concentration at cosmogenic steady state. We use a 10Behalf-life of 1.39 � 0.1 My (Chmeleff et al., 2010; Korschinek et al.,2010) and a sample density of 2.7 g/cm2 throughout (2.2 g/cm2
was used for the soils). For every sample, the shielding factor was
odels (Figs. 5 and 6) at two distances downstream of each junction.

Table 2Input parameters used for the CRONUS EARTH calculator. The shielding correctionsare calculated for topographic and snow shielding as explained in the text (para-graph 3.2). Density used for alluvial sediment is 2.7 g/cm3, for soils is 2.2 g/cm3.
Samplename
Lab IDa Latitude[DD]
Longitude[DD]
Mean altitude[m a.s.l.]
Shieldingcorrection
S01 SPI01 46.6780 11.0660 2363 0.85S02 SPI02 46.6706 11.0734 2340 0.86S03 SPI03 46.6932 11.0509 2530 0.85S06 SPI06 46.7036 11.0391 2624 0.85S07 SPI07 46.7013 11.0378 2268 0.84S08 SPI08 46.6951 11.0461 2564 0.85S09 SPI09 46.6970 11.0513 1937 0.84S10 SPI10 46.6968 11.0531 2150 0.84S11 SPI11 46.7103 11.0300 2675 0.85S13 SPI13 46.7043 11.0368 2235 0.83S14 SPI14 46.7046 11.0363 2655 0.85S15 SPC15 46.7182 11.0073 2756 0.85S16 SPC16 46.7225 11.0226 2773 0.86S18 SPC18 46.7070 11.0531 2746 0.85S19 SPC19 46.7191 11.0228 2714 0.85S20 SPC20 46.7141 11.0310 2778 0.84S500 S-500 46.7304 11.0194 e 0.87S501 S-501 46.7198 11.0236 e 0.87S502 S-502 46.7121 11.0268 e 0.87S504 S-504 46.7076 11.0313 e 0.87
a ID used during the laboratory procedures.
S. Savi et al. / Quaternary Geochronology 19 (2014) 148e162154
calculated as the sum of topographic shielding (St) and snowshielding (Ss) effects. The topographic shielding was determinedfrom a digital elevation model (DEM) with 2.5 m resolution usinga modified version of the Codilean (2006) shielding macro (B.Guralnik, ETH, pers. comm.), while the snow shielding was calcu-lated using an altitude dependent formula determined empirically(Norton, 2008) from snow depth-duration data (Auer, 2003). Sincethe snow cover duration is highly dependent on altitude and sincethere is a strong relationship between snow depth and elevation(Norton, 2008), we could use the formula:
Ss ¼ 1*10�8z2 � 8*10�5zþ 1:0242 (1)
where Ss is the snow shielding, z is the average altitude of the sub-basin (extrapolated from the DEM) and the numbers are constants.
Table 3Corrected 10Be concentrations and denudation rates calculated with CRONUS EARTH calcrates refer to the scaling factor of Dunai (2001) with spallogenic PSLHL ¼ 4.43 � 0.52 atomused.
10Be results:
Samplename
Sampleweight [g]
Carrerweight [mg]
10Be conc.[atoms/g] 103
Error þ/�[atoms/g] 103
Prod[muo[atom
S01 51.3437 0.1762 11.44 1.19 0.39S02 46.0990 0.1752 13.55 1.29 0.39S03 51.2614 0.1752 46.83 2.66 0.41S06 39.1442 0.1755 64.10 2.86 0.43S07 58.3232 0.1586 45.30 2.34 0.38S08 57.4298 0.1759 45.84 2.84 0.42S09 45.3242 0.1591 4.73 0.80 0.34S10 59.0581 0.1760 7.50 0.86 0.37S11 52.5342 0.1755 41.94 2.13 0.43S13 51.7709 0.1758 103.9 5.75 0.38S14 53.8055 0.1756 42.21 2.36 0.43S15 45.2908 0.1580 35.19 1.98 0.44S16 45.2037 0.1586 37.58 2.18 0.44S18 46.0250 0.1578 32.30 2.77 0.44S19 50.5993 0.1590 48.12 2.34 0.44S20 45.1733 0.1586 25.94 1.82 0.45S500 50.5537 0.1589 187.9 7.54 0.44S501 50.5399 0.1588 254.3 8.67 0.44S502 41.5100 0.1591 215.6 8.19 0.44S504 50.4539 0.1588 129.2 8.18 0.43
Average snow density of 0.2 g/cm3. The total shielding factor Stotwas calculated as
Stot ¼ 1� ðð1� SsÞ þ ð1� StÞÞ (2)
3.3. Mixing model
To evaluate the extent of sediment mixing in the main channel,we compared the ingoing sediment flux from the tributaries andthe outgoing sediment flux below the junction with the 10Be con-centration measured in the channels. Sediment mixing can becalculated in two ways; either by the nuclide balance or sedimentfluxes above and below the junction (see Binnie et al., 2006).
Based on the nuclide balance, if all sources are accounted for, thedownstream concentration must be between the concentrations ofthe two upstream segments. This can be expressed as:
½10Be�mc ¼ J½10Be�S1 þ K½10Be�S2 (3)
where J and K are less than 1, and J þ K ¼ 1; the subscripts “MC”represents the main channel while “S1” and “S2” represent the twosub-catchments. If 100% of the 10Be signal comes from basin S1,then J ¼ 1 (if 60% is from S1, J ¼ 0.6, etc.). In this way, a mixingrelationship based on nuclide concentrations can be determined.
The sediment fluxes from each sub-basin can also be calculatedfrom the erosion rate and upstream area:
Qx ¼ εx*Ax (4)
where Qx is the sediment flux at the point “x”, εx is the erosion ratederived from the 10Be concentrations (Section 3.2) and Ax is the areaof the analyzed sub-basin (determined here from the 2.5 m DEMusing the hydrological tools in ArcGIS).
According to the theory of steady state, if no storage occurs, thenQOUT (¼QMC, sample in the main channel below the junction) has tobe equal to QIN (coming from the two tributaries) so that we canwrite:
QMC ¼ QS1 þ QS2 or; QMC ¼ ðεS1*AS1Þ þ ðεS2*AS2Þ: (5)
ulator (ver. 2.2; http://hess.ess.washington.edu/; Balco et al., 2008). The denudations/g/yr with the ETH standard S2007N. For all the samples a thickness of “0” has been
uction ratens]s/g/a]
Production rate[spallation][atoms/g/a]
Denudationrate [mm/ka]
Internaluncertainty[mm/ka]
Externaluncertainty[mm/ka]
25.16 1460 160 21024.79 1210 120 17028.05 395 23 4629.80 307 14 3523.20 342 18 3928.67 412 26 4918.31 2650 490 53021.29 1920 230 29030.87 484 25 5622.48 146 8 1730.45 474 27 5632.50 606 35 7233.07 577 34 6932.29 657 58 8931.66 433 22 5032.71 829 60 10033.08 144 6 1633.82 109 4 1233.63 128 5 1431.14 196 13 24

S. Savi et al. / Quaternary Geochronology 19 (2014) 148e162 155
It is important to highlight that QMC is the mathematical sum ofthe fluxes of material supplied by the tributaries and quantifiedthrough the calculated erosion rates (derived from the corrected10Be concentrations) and the upstream sizes of catchments’ areas.
The relative contribution of a sub-catchment to the total sedi-ment flux is then (Table 4):
QSx% ¼ QSx=QMC*100: (6)
If the two tributaries do not contribute sediment in proportionto their erosion rates (or are poorly mixed), the nuclide concen-tration measured below the junction does not represent theweighted mean of the two tributaries. The signal in the mainchannel will then be biased toward the catchment, which hassupplied more material. Following the model proposed by Binnieet al. (2006) we used the 10Be concentrations from the two tribu-taries as endmembers for a possible mixing scenario and comparedthese values with the 10Be concentration below the junction. Asdescribed above, this “cosmogenic signature” in the main channelis the product of the mixing between the two tributaries and in-dicates which one has a “stronger” signal (i.e. which sub-catchmentis supplying more sediment). By comparing the signal derived fromthe 10Be concentrations with the calculated sediment fluxes, weestimate the state of mixing of the sediment in the channel, and therelative contribution of each tributary at two downstream samplingpoints.
4. Results
4.1. Cosmogenic 10Be and erosion rates
The results of the in-situ 10Be nuclide concentrations allow theidentification of three groups with large differences in 10Be con-centrations (Table 3, Fig. 5). Soil and till samples have the highestconcentrations, which implies that they have experienced thelowest erosion rate. Samples with the lowest 10Be concentrations,thus the highest erosion rates, are derived from the debris-flowcatchment while samples from the Zielbach and its tributariesyield intermediate values. There are a few exceptions in this lastgroup: sample S13 (tributary 13) yields a 10Be concentration that
Table 4Parameters used in the mixing models. The samples are reported in the table following ahighlighted in gray and precede the samples below the junction. For example, the model fafter the junctionwith themain Zielbach channel. The same is valid for S14 and S13 as inpuS10 are considered together in the model.
Sample name Area [km2] 10Be conc.[atoms/g] 103
Error þ/�[atoms/g] 103
S20 5.79 25.94 1.82S16 6.78 37.58 2.18S15 13.57 35.19 1.98S18 14.17 32.30 2.77S19 15.37 48.12 2.34S11 17.91 41.94 2.13S14 21.26 42.21 2.36S13 0.69 103.90 5.75S06 22.51 64.10 2.86S08 24.54 45.84 2.84S06 22.51 64.10 2.86S07 0.37 45.30 2.34S08 24.54 45.84 2.84S03 25.53 46.83 2.66S09 1.54 4.73 0.80S10 0.87 7.50 0.86S03 25.53 46.83 2.66S01 31.29 11.44 1.19S02 31.70 13.55 1.29
a Q represents the sediment flux calculated as explain in the paragraph 3.3, while Q%
plots within the same order of magnitude of the soil samples, whileS01 and S02 have concentration values closer to those recorded forthe debris-flow channels (Fig. 5).
There is an overall increasing trend in 10Be concentrations in themain channel in the downstream direction down to the junctionwith the debris-flow catchment, beyond which an abrupt decreaseoccurs. The 10Be concentrations of the soil samples decrease uni-formly with elevation in the downstream direction primarily due tolower production rates at lower altitudes (see Fig. 1 for location ofsites, and Fig. 5 for the concentration pattern). The concentrationsin Fig. 5 are not scaled to altitude. The scaled 10Be concentrationsare generally between 54 and 71% lower if the concentrations arescaled to the SLHL production rate of 4.43� 0.52 atoms/g/a, but theobserved trends do not change.
4.2. Mixing model
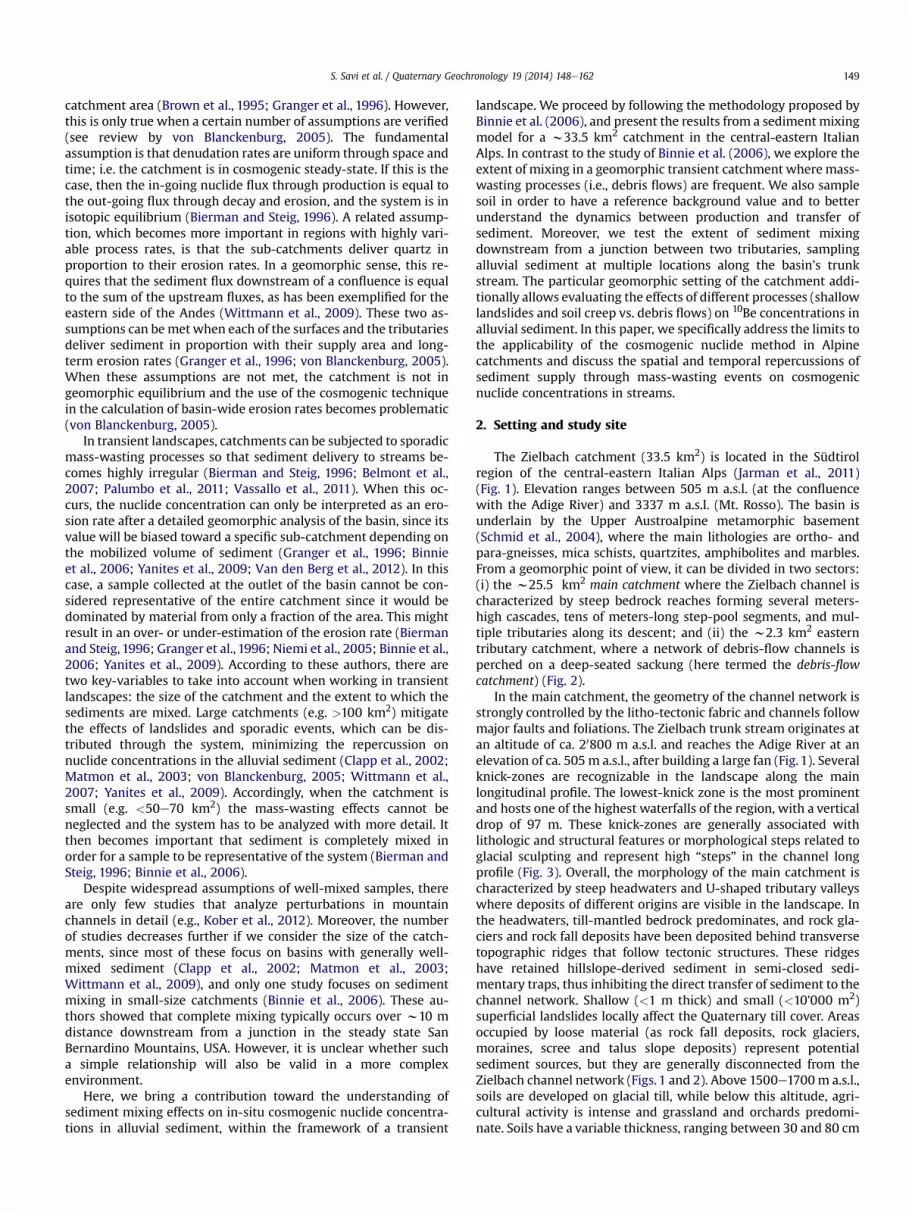
The trends described above highlight the tributary basins’contribution to the total amount of sediment transported by theZielbach. The clear imprint of the tributaries on the main channelnuclide concentration reveals the importance of considering thedegree of sediment mixing. The sediment mixing diagrams (Figs. 6and 7) are composed of two parts. First, simple nuclide mixingcalculations, based on the 10Be concentrations of the upstreamsegments, give the relative contributions from each tributarynecessary to produce the measured downstream nuclide concen-tration (e.g., equation (3)). For example, the concentration meas-ured at point S15 is mainly influenced by the tributary 16 since theoverlapping area corresponds to a range between 44, and 100% ofthe signal being derived from S16 (Fig. 6-A1). Likewise, the cos-mogenic nuclide signal registered at the point S06 (Fig. 6-B1) ismainly influenced by S14 (55e75%) and S08 is dominated by S07(70e100%). Farther downstream, S01 is clearly biased toward thedebris-flow concentrations (77e97%) (Fig. 6-C1 and 7-A1).
Second, we compare the mixing ratios determined from thenuclide balances with the calculated sediment fluxes of the twotributaries (e.g., equations (5) and (6)). If the sediment is wellmixed, the intersection between the cosmogenic nuclide signalswill be identical with the calculated sediment fluxes (Binnie et al.,
downstream location and they are grouped as in the model. The two tributaries areor tributary 16 considers S20 and S16 as input tributaries and S15 and S18 as samplest tributaries and S06, S08 as samples after the junction, and so on. * Samples S09 and
Denudationrate [mm/ka]
Externaluncertainty[mm/ka]
Qa [m3/yr] Q%
829 100 4800 55577 69 3910 45606 72 8230 e
657 89 9300 e
433 50 6650 e
484 56 8660 e
474 56 10,080 99146 17 100 1307 35 6910 e
412 49 10,120 e
307 35 6910 98342 39 130 2412 49 10,120 e
395 46 10,080 e
2650 530 4070 261920 290 1660 10395 46 10,080 64
1460 210 45,750 e
1210 170 38,510 e
is used in Figs. 6 and 7.

Fig. 5. 10Be concentrations versus downstream distance. Concentrations of the Zielbach samples show a slightly increasing trend in the downstream direction. The soil sampleconcentrations decrease in the same direction. Debris flow samples have the lowest concentrations. Filled diamonds indicate the main Zielbach river samples; empty diamondsrepresent the tributaries samples. Error bars show 1-sigma; concentrations are not scaled for altitude (see text for more discussion).
S. Savi et al. / Quaternary Geochronology 19 (2014) 148e162156
2006). As shown in Fig. 6 (A1-B1-C1), for the immediate down-stream sample, only S16 is well mixed. The sediment flux rangeoverlaps with the 10Be signals between 45 and 55% of S16,expressing roughly an equal contribution from the two tributaries.The sediment is not mixed in the other two cases (Fig. 6-B1 and 6-C1) where there is no overlap between the cosmogenic nuclidesignal and the calculated sediment flux. Likewise, the material fromthe debris-flow catchment is poorly mixed with the Zielbach sed-iments (Fig. 7-A1), as the 10Be signal shows a clear imprint of thedebris-flow concentrations (77e97%) while the calculatedsediment flux suggests a lower contribution from these tributaries(26e46%).
For the tributaries 16 and 13, the situation improves consid-erably if we consider a sample farther downstream (Fig. 6-A2 and6-B2). The cosmogenic nuclide signals are entirely matched by thesediment flux calculations, suggesting that the samples are wellmixed, with a 50:50 contribution from S16 and S20 for S18 at 570mdownstream of the junction. By 1250 m downstream at S08, S14and S13 are well mixed, and the sediment is almost entirely derivedfrom S14 (89e100%). Material supplied from S07 remains poorlymixed as does the debris-flowmaterial (Fig. 6-C2 and 7-A2), wherethe tributary’s nuclide signal remains higher than that of the mainZielbach channel.
Norton et al. (2011) also measured the 10Be concentration of theZielbach main channel on a sample collected at the outlet of thebasin in 2006. Their reported concentration, 23.8 � 3.3 *103 atomsg�1, is almost twice as high as those measured here for the samesite (S01 and S02). The mixing model of the debris-flow derived-material yields a completely different result when using the valueof Norton et al. (2011) (Fig. 7B), with an overlapping betweencosmogenic nuclide signal and sediment flux between 41 and 46%.
The pre-debris flow 10Be concentration shows a mixing between 41and 71%with the 41e46% of sediment derived from the debris-flowtributaries and the 54e59% supplied by the Zielbach in S03, valuesthat are concurrent with the calculated sediment flux.
5. Discussion
5.1. 10Be concentration in a complex Alpine setting
Taken at face value, these results show the increasing effect ofsediment supply from tributaries on the main channel 10Be con-centrations. In the main catchment, stream-borne 10Be concentra-tions average w42 * 103 atoms g�1, with a distinct trend towardincreasing concentrations in the downstream direction. Geo-morphic features, such as knick-zones, do not seem to affect 10Beconcentrations, since samples taken upstream and downstream ofthe knick-zones show similar values, suggesting that sediment hasbeen bypassed over these features. Likewise, samples abovea junction do not show any variation in 10Be concentration.
Field observations show that the Zielbach main catchment hasbeen mainly affected by local and shallow landslides which onlyinvolve the mobilization of unconsolidated regolith. Larger rockfalls occur in the upper portions of the basin, but this material tendsto be trapped on or behind talus deposits, which are disconnectedfrom the system (e.g., Figs. 1 and 2). While we have no directmeasurement of the residence time of this material, we anticipatethat it is removed at a rate similar to or slower than that of the soils(w100 mm/kyr). Accordingly, if our inference is correct, this sug-gests that storage in these traps spans time intervals on the order of103e104 yrs. This finding, however, awaits the results of furtherdetailed studies.
Fig. 6. Mixing models for the tributaries in the main Zielbach catchment. The filled sectors are representative of the cosmogenic nuclide signals: the overlapping area between lightfilled area (proportioned signal coming from the tributaries) and dark filled area (10Be concentration registered below the junction) represents the nuclide concentration mixing ofthe two tributaries in the main channel. The diagonal lines illustrate the calculated theoretical sediment flux from the tributaries (representing the theoretical true mixing). Inbetween vertical lines (space shown with an arrow) is indicated the 10Be-derived mixing signal. When the 10Be signal overlaps the modeled signal, the sediment is well-mixed andthe catchment is in isotopic equilibrium. The numbers between breaks indicate sample distance downstream of the junction for tributary S16 (A1 and A2), tributary S13 (B1 and B2),and tributary S07 (C1 and C2). In each case, the left hand plot is near the junction and the right hand plot is farther from the junction.
S. Savi et al. / Quaternary Geochronology 19 (2014) 148e162 157
Tributaries 16 and 13 add higher concentrations to the system,suggesting predominantly hillslope soil and sediment sources,which tend to have lower erosion rates (Norton et al., 2010). Thisinference is supported by the high concentrations measured locallyin till and soil samples, which show an order-of-magnitude higherconcentrations than stream sediment. These circumstances pro-mote the supply of material with higher 10Be concentrations andexplain why these two tributaries locally (and temporally) shift theZielbach 10Be concentration toward higher values. Likewise, we usethis mechanism to explain the higher-than-expected concentrationof sample S19, as a small, shallow landslide occurred upstream ofthe sampling location just few days before collection, potentiallyadding abundant high concentration material. Similarly, we
interpret the particularly high concentration measured in sampleS13 to be the result of the 2008 debris-flow event, which resulted inthe supply of high-concentration material derived from the lateralhillslopes (Fig. 8). The high-concentration measured in the sampleis due to the fact that this latter tributary normally does not delivermaterial via debris flows, as revealed by the survey of the region.Since the sampling campaign was performed during 2009 and2010, the collected S13 sample might show the overprinting of the2008 event, which mainly involved the entrainment and transportof regolith and rock fall-derived clasts deposited in the channel, asrevealed by orthophotos and field observations. The sample loca-tion, topographically higher than the main Zielbach channel andwith no coupling with the lateral earth flow visible in Fig. 8, implies

Fig. 7. Mixing models for the debris-flow catchment in the Zielbach basin. A1 and A2 represent the post-debris flow conditions (after the 2008 event) while B represents the modelcalculated with the Norton et al. (2011) value (pre-debris flow event). Symbols and explanation follow Fig. 5.
S. Savi et al. / Quaternary Geochronology 19 (2014) 148e162158
that thematerial has been directly derived from the higher portionsof the tributary. Accordingly, this supply could have introducedabundant material with high 10Be concentrations into the system,since the low activity of tributary 13 implies longer time forexposure of sediment prior to erosion.
The case of the tributary 07 is slightly different; since its value iscoherent with Zielbach average concentrations. The differencesbetween the effects of tributary 13 and tributary 07 (which havesimilar areas) on the main Zielbach concentration suggests thatcatchment size has relatively little importance while the mecha-nism of sediment release and transfer within a basin has a muchhigher impact on alluvial sediment concentration.
The two samples from the debris-flow catchment also havea clear overprint of the 2008 debris-flow event, but in the oppositedirection (input of material with low concentrations).
The remarkably lower concentration measured in S09 and S10could be due to either the high frequency of debris-flow events inthis catchment, or to the extraordinarily large size of the 2008debris flow that scoured the channel bed for several meters indepth. In the first case, high-frequency events would continuallystrip off the surface, keeping the concentrations low. This scenariodoes not necessarily contradict the assumption of steady stateerosion, as it can be thought of as a chipping process in whicha given depth is removed per event (e.g. Granger et al., 1996; Smallet al., 1999; Kober et al., 2007). In this case, the erosion rates cal-culated from the 10Be concentrations are representative of the truelong-term rates from the debris-flow catchments. In the secondcase, where the depth of scour is much greater than during anaverage event, the 10Be concentrations would be dominated bydeep, low concentration material, and they would not be repre-sentative of the long-termmean. If we can assume that thematerial
has beenwell mixed, then the true long-term erosion ratewould belower than those calculated after the 2008 event.
5.2. Sediment mixing considerations
The results of the models suggest a large variability in the de-gree of sediment mixing. With respect to the main Zielbach chan-nel, we can say that the sediment concentrations from thetributaries are eventually well mixed as sediment is transporteddownstream. The model suggests that if taken at a proper distancefrom the junction the sample can be reliable and proportionallyrepresentative of the tributaries’ contributions. Sediment fromtributaries 16 and 13 is poorly mixed 125e150 m downstream ofthe junction, but well mixed after additional w500e1000 m. It isclear that in this transient Alpine catchment, sediment-mixingdistances are longer than in the largely steady-state San Bernar-dinoMountains (California-USA) as reported by Binnie et al. (2006).However, because the rates and timing of erosion events in thissetting are so variable, it is difficult to define a fixed length that canbe used independently for all tributaries and for all basins. Ourresults illustrate that the supply mechanisms need to be carefullyconsidered when sampling alluvial sediment, because this canhighly affect the sediment 10Be concentrations. It is, therefore,difficult to identify a generalized strategy to collect samples inmountain catchments, since the erosional and transport mecha-nisms have to be detailed individually for each catchment. How-ever, a valid sampling strategy should take into account thata sample collected close to a junction has generally a higherprobability to be biased toward one of the two source areas, whilethis risk decreases when collecting further downstream.

Fig. 8. Orthophotos of catchment areas taken in 2006, 2008 and 2011 (downloaded from the geobrowser of the Bolzano province e http://www.provincia.bz.it/informatica/temi/maps-webgis.asp). In 2008, the debris flow effects are visible for both the tributary 13 (upper images-set) and the fan (lower images-set). The comparison between the 2006 and2008 photos show the different areas covered by sediment deposited during the 2008 event (tributary 13 and debris-flow tributary, with the deposit of the 2008 debris flow spreadson the entire length of the active channel in the fan). In the photos are also represented the major knick zones and the sampling locations. It is evident how the 2008 event affectedthe channels, with deposits still visible in 2011. In the lower images-set, the location of S01 also corresponds to the sampling location of Norton et al. (2011).
S. Savi et al. / Quaternary Geochronology 19 (2014) 148e162 159

S. Savi et al. / Quaternary Geochronology 19 (2014) 148e162160
With respect to sediment mixing, tributary 07 provides insightinto the variability in sediment transport in the Zielbach. FromFig. 6-B2, it is clear that the sediment derived from tributaries S14and S13 are well mixed at point S08. Since S08 also includes thesource area for S07, we can infer that either sediment from thetributary 07 is well mixed in S08, or that S07 has the same con-centration as the trunk stream (and is therefore invisible to ouranalysis). Alternatively, it is likewise possible that tributary 07 hasno effect on the 10Be concentration in the Zielbach. This can occur ifthe sediment supplied from the tributary 07 is deposited beforereaching the main channel or flushed in pulses out of the system. Ineither case, S07 does not change the main channel concentration,and S08 and S03 are representative for the mixing of the tributariesabove. The results expressed in Fig. 6C, therefore, show that nearly100% of the sediment at points S08 and S03 is delivered by thetrunk stream, which is well mixed with respect to the upper trib-utaries (Fig. 6-B2).
Themixingmodels from the debris-flowcatchment are harder tointerpret (Fig. 7). As expected for a debris flow-dominated basin, thesamples collected below the junction suggest that the sediment isnot well mixed (Fig. 7-A1). Even at almost 3 km downstream of thejunction (S02), the sediment is not well mixed and is clearly influ-enced by the debris flow (Fig. 7-A2). In 2006, Norton et al. (2011)sampled near the site S01, before the large debris-flow event thataffected the catchment in2008. The lower 10Be valuesof our sampleshighlight how debris flow activity can affect the 10Be concentrationof a basin, perturbing the nuclide concentrations from their spatialand temporal averages (Bierman and Steig, 1996; Granger et al.,1996; Niemi et al., 2005; Binnie et al., 2006; Yanites et al., 2009;Vassallo et al., 2011; Kober et al., 2012). The concentrationmeasuredby Norton et al. (2011) is also below the average for the Zielbachchannel (23.8*103 atoms g�1 versus 42.4*103 atoms3 g�1) suggestingthat the low concentrations in the trunk stream are persistent, andthe debris flows from catchments S09 and S10 are in fact high-frequency events (but with general smaller volumes or eroding ca-pabilities). In support of this interpretation, the model in Fig. 6Bshows that the 10Be signal is partially congruent with the calculatedsediment flux suggesting almost complete mixing. This either im-plies that this volume of the most recent debris flow event(w3,000 m3 in 2004) was too small to have substantially perturbedthe 10Be concentration of the trunk stream, or that the materialderived from that event was well mixed with the Zielbach materialwithin 2 years. The 2008 event, with a much larger volume ofmobilized sediment, clearly caused a large perturbation in the 10Beconcentration, leading to the question of how far in time froma largeevent a sample yields reliable nuclide concentrations for erosionrates calculations.
5.3. Spatial and temporal implications for sediment mixing
In agreement with previous studies (Bierman and Steig, 1996;Granger et al., 1996; Clapp et al., 2002; Matmon et al., 2003; Binnieet al., 2006; Yanites et al., 2009), the models calculated in this papershow that the sampling location has to be far enough from thejunction to avoid the imprint of a particular source area. Likewise,the size of the catchment can also influence the sediment mixingconditions. However, our study suggests that the complete mixingcan also be achieved even for relatively small catchments, since theresults of the Zielbach main catchment (size of w25.5 km2) showthat the sediment is overall well-mixed and that the cosmogenicnuclide signal is congruent with the relative sediment contribu-tions of the different tributaries. Our results highlight, moreover,the importance of knowing the sediment transfer mechanisms andthe magnitude of the relevant sediment input/disturbance. In theZielbach main catchment, the transport of sediment occurs mainly
through soil creep and rare, shallow landslides, allowing the supplyof high concentration material into the system; this is confirmed bythe higher concentrations of 10Be derived from the tributaries thatare affected by these hillslopes processes. Contrariwise, in thedebris-flow catchment, the high-frequency of debris-flow eventsallows the supply of low concentration sediment that results ina lower cosmogenic nuclide signal (Fig. 9). When low-frequencyhigh-magnitude events occur (e.g., 2008 event), the amount ofmaterial supplied to the main channel causes a strong overprint onthe mixing condition of the entire basin, moving the signal towardthe debris-flow catchment concentration. The larger the event, thelonger the response time necessary for the basin to recover to pre-disturbance mixing conditions (Schaller et al., 2004). Accordingly,the return period for events of large magnitude provides anothervariable that has to be taken into account for the sampling anderosion rate interpretation. We thus support the statement byYanites et al. (2009) that a high frequency of homogeneous pro-cesses does not affect the cosmogenic nuclide in the system, pro-vided that the sediment is spread homogenously through spaceand time. However, an episodic large event can completely throwthe system out of balance over the timescale of the catchmentprocesses, in agreement with the recent findings of Kober et al.(2012).
Therefore, it appears obvious that sediment mixing has to beachieved both in space and time. Following this result, a goodsampling campaign should take into consideration not only thespatial distance of the sample belowa junction, but also the previoushistory of the catchment in terms of sediment supply and masswasting disturbance. It is therefore advisable to collect 10Be sampleswith a sufficient, locally specified, time span after large debris flowevents, as seems to be the case for the Norton et al. (2011) sample.
5.4. Denudation rates
Catchment-wide denudation rates calculated for the Zielbachbasin vary from 146 to 2650 mm/kyr (Table 3). These results are inthe same range as those from other parts of the European Alps(Wittmann et al., 2007; Delunel et al., 2010; Norton et al., 2008,2010; 2011; Kober et al., 2012; Van den Berg et al., 2012). Theseprevious studies focused on basins encompassing the entire rangeof scales from the whole Alpine chain (Wittmann et al., 2007;Norton et al., 2011) to small catchments (Delunel et al., 2010; Koberet al., 2012; Norton et al., 2008, 2010). Our study is similar to thelatter, but shows similar denudation rate variability as the largeAlpine-wide studies (e.g., Wittmann et al., 2007). Here, we relatethe large variability in denudation rates to the mixing of sedimentfrom various sources. In particular, the mixing diagrams highlightthe strong influence that sediment supply mechanisms have on10Be concentrations and, subsequently, on erosion rates. The resultsalso allow us to identify the samples with biased erosion rate values(due to the 2008 event), which are related here to the poor mixingof debris-flow derived material. Removing these samples (S06, S13,S09, S10, S01 and S02) greatly reduces the variability of the data.Using only the well-mixed samples, we can observe that in themain Zielbach catchment, the denudation rates range between 342and 829 mm/kyr and show a downstream decreasing trend (i.e.,with decreasing elevations; Fig. 9).
The downstream trend of decreasing erosion rates could havetwo potential causes: increasing glacial impact with increasingaltitude, or increasing erosion and incorporation of soils at loweraltitudes. Thewellmixeddenudation rates yield integration times ofw700e1800 years. Therefore, all but the uppermost reaches of thecatchment will have reached cosmogenic steady state since degla-ciation. It is unlikely then that the nearly consistent trend is due tonon-steady state conditions due to glacial cover and erosion. The

Fig. 9. Relative basin-wide denudation rates, calculated through 10Be measured values. The Zielbach alluvial sediment (diamonds; open diamonds represent tributary’s samples)shows a decreasing trend moving downstream with local decreases due to the till contribution from hillslopes (squares). Below the junction with the debris-flow catchment theZielbach experiences an abrupt increase of erosion rate due to the sediment-supply from the high-frequency debris-flow processes affecting this tributary (circles). The light rhombrepresents the value of Norton et al. (2011).
S. Savi et al. / Quaternary Geochronology 19 (2014) 148e162 161
soils erode at 109e196 mm/kyr with no clear trend with elevation.Since the aerial coverage of soils increases generally downstream(Fig. 1), erosion (even if spatially homogeneous) and incorporationof this material into the stream will result in decreasing calculateddenudation rates in the downstream direction. In the Zielbach, thisseems to be the more reasonable explanation.
6. Conclusion
In this paper we show how sediment mixing models provideinsight into sediment transfer mechanisms and the overprintrelated to the supply of material by of debris-flow processes on thecosmogenic nuclides concentrations of an Alpine catchment. Ina transient landscape, the use of the cosmogenic nuclide techniquefor the calculation of basin-wide erosion rates can be difficult dueto the highly irregular supply of sediment. When sediment istransferred homogeneously through the basin (both in space andtime), the cosmogenic nuclide technique can be used reliably,independently from catchment size. The application of the 10Betechnique is, however, more complicated when the catchment hasbeen dominated by mass-wasting processes, since the cosmogenicsignature is more sensitive to sporadic events. In this case, thecalculated erosion rate might significantly over- or under-estimatethe real denudation rate. It is important that the sediment is wellmixed in the channel (i.e. the cosmogenic signature in the mainchannel equally represents the upstream tributaries) and that theprocesses affecting the basin are homogeneous both in frequencyand magnitude. The results presented here suggest that the return-period of high-magnitude events needs to be considered whenAlpine basins are sampled for erosion rate studies. Generally,sediment will be better mixed with increasing downstream
distances from confluence with a debris-flow dominated channel.Likewise, the extent of mixing will increase if samples are collectedafter sufficient, yet to be specified, time of a debris flow event. Inthis context, larger magnitude mass wasting events require theconsideration of longer distances and times for sampling. Accord-ingly, every sampling campaign as to be carefully planned,depending on the site-specific processes operating within indi-vidual catchments for different spatial and temporal scales, andparticularly, if landscapes are in transient state. In this sense, moredetailed studies are needed to better understand the spatial andtemporal effects of sporadic events on cosmogenic nuclide con-centrations, where mass-wasting processes are the dominatingmechanisms of sediment transfer in the catchment.
Acknowledgments
We greatly appreciate the financial support of ESF TopoEurope(CRP SedyMont e IP1) and the Swiss National Science Foundation(project No. 20T021-120464).
Editorial handling by: S. Ivy-Ochs
References
Akçar, N., 2006. Paleoglacial records from the Black Sea area of Turkey field anddating evidence. Ph.D. dissertation, Bern e University, Bern, Switzerland.
Akçar, N., Deline, P., Ivy-Ochs, S., Alfimov, V., Hajadas, I., Kubik, P.W., Christl, M.,Schlucter, C., 2012. The AD 1717 rock avalanche deposits in the upper FerretValley (Italy): a dating approach with cosmogenic 10Be. Journal of QuaternaryScience. ISSN: 0267-8179 ISSN: 0267-8179, 1e11. http://dx.doi.org/10.1002/jqs.1558.
Auer M. 2003. Regionalisierung von Schneeparametern e eine Methode zur dar-stellung von Schneeparametern im Relief, Unpublished Master’s thesis, Uni-versity of Bern, 97 pp.
S. Savi et al. / Quaternary Geochronology 19 (2014) 148e162162
Balco, G., Stone, J.O., Lifton, N.A., Dunai, T.J., 2008. A complete and easily accessiblemeans of calculating surface exposure ages or erosion rates from 10Be and 26Almeasurements. Quaternary Geochronology 3, 174e195.
Bargossi, G.M., Bove, G., Cucato, M., Gregnanin, A., Morelli, C., Moretti, A., Poli, S.,Zanchetta, S., Zanchi, A., 2010. Note illustrative della Carta Geologica d’Italia.Foglio 013 e Merano. Servizio Geologico d’Italia, ISPRA.
Belmont, P., Pazzaglia, F.J., Gosse, J.C., 2007. Cosmogenic 10Be as a tracer for hillslopeand channel sediment dynamics in the Clearwater River, western WashingtonState. Earth and Planetary Science Letters 264, 123e135.
Bierman, P., Steig, E.J., 1996. Estimating rates of denudation using cosmogenicisotope abundances in sediment. Earth Surface Processes and Landforms 21,125e139.
Binnie, S., Phillips, W.M., Summerfield, M.A., Fifield, L.K., 2006. Sediment mixingand basin-wide cosmogenic nuclide analysis in rapidly-eroding mountainousenvironments. Quaternary Geochronology 1, 4e14.
Bolzano Province, SIRIO-IHR, ED30 e Ripartizione 30 Opere Idrauliche.Brown, E.T., Stallard, R.F., Larsen, M.C., Bourles, D.L., Raisbeck, G.M., Yiou, F., 1995.
Denudation rates determined from the accumulation of in-situ-produced 10Bein the Luquillo experimental forest, Puerto Rico. Earth and Planetary ScienceLetters 129, 193e202.
Castiglioni, B., 1928. Ghiacciai delle Venoste Orientali. Bollettino Comitato Glacio-logico 8, 91e165.
Chmeleff, J., von Blanckenburg, F., Kossert, K., Jackob, D., 2010. Determination of the10Be half-life by multicollector ICP-MS and liquid scintillation counting. NuclearInstruments and Methods in Physics Research B 268, 192e199.
Clapp, E.M., Bierman, P.R., Caffee, M., 2002. Using 10Be and 26Al to determinesediment generation rates and identify sediment source areas in an arid regiondrainage basin. Geomorphology 45, 89e104.
Codilean, A.T., 2006. Calculation of the cosmogenic nuclide production topographicshielding scaling factor for large areas using DEMs. Earth Surface Processes andLandforms 31, 785e794.
Delunel, R., van der Beek, P.A., Carcaillet, J., Bourlès, D.L., Valla, P.G., 2010. Frost-cracking control on catchment denudation rates: Insights from in situ produced10Be concentrations in stream sediments (EcrinsePelvoux massif, FrenchWestern Alps). Earth and Planetary Science Letters 293, 72e83.
Dunai, T.J., 2001. Scaling factors for production rates of in situ produced cos-mogenic nuclides: a critical reevaluation. Earth and Planetary Science Letters176, 157e169.
Dunai, T.J., 2010. Cosmogenic Nuclides. Cambridge University Press, UK.Gosse, J.C., Phillips, F.M., 2001. Terrestrial in situ cosmogenic nuclides: theory and
application. Quaternary Science Reviews 20, 1475e1560.Granger, D.E., Riebe, C.S., 2007. Cosmogenic nuclides in Weathering and Erosion. In:
Drever, J.I. (Ed.), Surface and Ground Water, Weathering, and Soils. Treatise onGeochemistry, vol. 5. Elsevier-Pergamon, Oxford. Holland, H.D., Turekian, K.K.(eds.).
Granger, D.E., Kirchner, J.W., Finkel, R., 1996. Spatially averaged long-term erosionrates measured from in situ-produced cosmogenic nuclides in alluvial sedi-ment. Journal of Geology 104 (3), 249e257.
Ivi-Ochs, S., Kerschner, H., Reuther, A., Maisch, M., et al., 2006. The Timing of GlacierAdvances in the Northern European Alps Based on Surface Exposure Datingwith Cosmogenic 10Be, 26Al, 36Cl, and 21Ne. Geological Society of America.special Paper 415.
Jarman, D., Agliardi, F., Crosta, G.B., 2011.Megafans and outsize fans fromcatastrophicslope failures in Alpine glacial troughs: the Malser Haide and the Val Venostacluster, Italy. In: Jaboyedoff, M. (Ed.), Slope Tectonics. Special Publications, 351.Geological Society, London, pp. 253e277. http://dx.doi.org/10.1144/SP351.14.
Kober, F., Ivy-Ochs, S., Schlunegger, F., Baur, H., Kubik, P.W., Wieler, R., 2007.Denudation rates and a topography-driven rainfall threshold in northern Chile:multiple cosmogenic nuclide data and sediment yield budgets. Geomorphology83, 97e120.
Kober, F., Hippe, K., Salcher, B., Ivy-Ochs, S., Kubik, P.W., Wacker, L., Hählen, N., 2012.Debris-flow-dependent variation of cosmogenically derived catchment-widedenudation rates. Geology. http://dx.doi.org/10.1130/G33406.1.
Kohl, C.P., Nishiizumi, K., 1992. Chemical isolation of quartz for measurement ofin-situ produced cosmogenic nuclides. Geochimica Cosmochimica Acta 56,3583e3587.
Korschinek, G., Bergmaier, A., Faestermann, T., Gertmann, U.C., Knie, K., Rugel, G.,Wallner, A., Dillmann, I., Dollinger, G., Lierse von Gosstomski, Ch, Kossert, K.,Maiti, M., Poutivtsev, M., Remmert, A., 2010. A new value for the 10Be half-life byheavy-ion elastic recoil detection and liquid scintillation counting. Nuclear In-struments and Methods in Physics Research B 268, 187e191.
Kubik, P.W., Christl, M., 2010. 10Be and 26Al measurements at the Zurich 6 MVtandem AMS facility. Nuclear Instruments and Methods in Physics Research B268, 880e883.
Lal, D., 1991. Cosmic ray labeling of erosion surfaces: in situ nuclide production ratesand erosion models. Earth and Planetary Science Letters 104, 424e439.
Matmon, A., Bierman, P.R., Larsen, J., Southworth, S., Pavich, M., Finkel, R., Caffee, M.,2003. Erosion of an ancient mountain range, the Great Smoky Mountains, NorthCarolina and Tennessee. American Journal of Science 303 (9), 817e855.
Niemi, N.A., Oskin, M., Burbank, D.W., Heimsath, A.M., Gabet, E.J., 2005. Effects ofbedrock landslides on cosmogenically determined erosion rates. Earth andPlanetary Science Letters 237, 480e498.
Norton, K. P., 2008. Response of the landscape in the Swiss Alps to the late glacial toHolocene climate transision. PhD thesis, Leibniz University of Hannover, Ger-many, 148pp.
Norton, K.P., von Blanckenburg, F., Schlunegger, F., Schwab, M., Kubik, P.W., 2008.Cosmogenic nuclide-based investigation of spatial erosion and hillslope chan-nel coupling in the transient foreland of the Swiss Alps. Geomorphology 95,474e486.
Norton, K.P., von Blanckenburg, F., Kubik, P.W., 2010. Cosmogenic nuclide-derivedrates of diffusive and episodic erosion in the glacially sculpted upper RhoneValley, Swiss Alps. Earth Surface Processes and Landforms. http://dx.doi.org/10.1002/esp.1961.
Norton, K.P., von Blanckenburg, F., DiBiase, R., Schlunegger, F., Kubik, P.W., 2011.Cosmogenic 10Be-derived denudation rates of the Eastern and Southern Euro-pean Alps. International Journal of Earth Science (Geol Rundsch) 100, 1163e1179. http://dx.doi.org/10.1007/s00531-010-0626-y.
Palumbo, L., Hetzel, R., Tao, M., Li, X., 2011. Catchment-wide denudation rates atthe margin of NE Tibet from in situ-produced cosmogenic 10Be. Terra Nova23, 42e48.
Penck, A., Brückner, E., 1909. Die Alpen in Eiszeitalter, vol. III. Tauschnitz ed., Lipsia.Schaller, M., Von Blanckenburg, F., Veldkamp, A., Van den Berg, M.W., Hovius, N.,
Kubik, P.W., 2004. Paleo-erosion rates from cosmogenic 10Be in a 1.3 Ma terracesequence: River Meuse, the Netherlands. Journal of Geology 112, 127e144.
Schmid, S.M., Fügenschuh, B., Kissling, E., Schuster, R., 2004. Tectonic map andoverall architecture of the Alpine orogen. Eclogae Geologicae Helvetiae 97, 93e117. http://dx.doi.org/10.1007/s00015-004-1113-x.
Small, E.E., Anderson, R.S., Hancock, G.S., 1999. Estimates of the rate of regolithproduction using 10Be and 26Al from an alpine hillslope. Geomorphology 27,131e150.
Van den Berg, F., Schlunegger, F., Akçar, N., Kubik, P., 2012. 10Be-derived assessmentof accelerated erosion in a glacially conditioned inner gorge, Entlebuch, CentralAlps of Switzerland. Earth Surface Processes and Landforms. http://dx.doi.org/10.1002/esp.3237.
Vassallo, R., Ritz, J.F., Carretier, S., 2011. Control of geomorphic processes on 10Beconcentrations in individual clasts: Complexity of the exposure history in Gobi-Altay range (Mongolia). Geomorphology 135, 35e47.
von Blanckenburg, F., 2005. The control mechanisms of erosion and weathering atbasin scale from cosmogenic nuclides in river sediment. Earth and PlanetaryScience Letters 237, 462e479.
Wittmann, H., von Blanckenburg, F., Kruesmann, T., Norton, K.P., Kubik, P.W., 2007.Relation between rock uplift and denudation from cosmogenic nuclides in riversediment in the Central Alps of Switzerland. Journal of Geophysical Research112, F04010. http://dx.doi.org/10.1029/2006JF000729.
Wittmann, H., von Blanckenburg, F., Guyot, J.L., Maurice, L., Kubik, P.W., 2009. Fromsource to sink: preserving the cosmogenic 10Be-derived denudation rate signalof the Bolivian Andes in sediment of the Beni and Mamoré foreland basins.Earth and Planetary Science Letters 288, 463e474.
Yanites, B.J., Tucker, G.E., Anderson, R.S., 2009. Numerical and analytical models ofcosmogenic radionuclide dynamics in landslide-dominated drainage basins.Journal of Geophysical Research 114, F01007. http://dx.doi.org/10.1029/2008JF001088.


