Embed Size (px)
Citation preview
© 2013 Konieczny et al. This work is published by Dove Medical Press Limited, and licensed under Creative Commons Attribution – Non Commercial (unported, v3.0) License. The full terms of the License are available at http://creativecommons.org/licenses/by-nc/3.0/. Non-commercial uses of the work are permitted without any further
permission from Dove Medical Press Limited, provided the work is properly attributed. Permissions beyond the scope of the License are administered by Dove Medical Press Limited. Information on how to request permission may be found at: http://www.dovepress.com/permissions.php
International Journal of Nanomedicine 2013:8 3963–3975
International Journal of Nanomedicine Dovepress
submit your manuscript | www.dovepress.com
Dovepress 3963
O r I g I N a l r e s e a r c h
open access to scientific and medical research
Open access Full Text article
http://dx.doi.org/10.2147/IJN.S49612
effects triggered by platinum nanoparticles on primary keratinocytes
Piotr Konieczny1,*anna grazyna goralczyk1,*radoslaw szmyd1,*lukasz skalniak1,*Joanna Koziel2
Francesca larese Filon3
Matteo crosera4
agnieszka cierniak1
ewa K Zuba-surma5
Julia Borowczyk5
eliza laczna5
Justyna Drukala5
elzbieta Pyza6
Danuta semik6
Olga Woznicka6
andrzej Klein1
Jolanta Jura1
1Department of general Biochemistry, 2Department of Microbiology, Jagiellonian University, Kraków, Poland; 3Department of Public health sciences, 4Department of chemical and Pharmaceutical sciences, University of Trieste, Trieste, Italy; 5Department of cell Biology, 6Department of cell Biology and Imaging, Jagiellonian University, Kraków, Poland
*These authors equally contributed to this work
correspondence: Jolanta Jura Department of general Biochemistry, Faculty of Biochemistry, Biophysics and Biotechnology, Jagiellonian University, 7 gronostajowa street, Kraków 30-387, Poland Tel +48 12 664 6359 Fax +48 12 664 6902 email [email protected]
Abstract: The platinum (Pt)-group elements (PGEs) represent a new kind of environmental
pollutant and a new hazard for human health. Since their introduction as vehicle-exhaust catalysts,
their emissions into the environment have grown considerably compared with their low natural
concentration in the earth crust. PGE emissions from vehicle catalysts can be also in the form of
nanometer-sized particles (Pt nanoparticles [PtNPs]). These elements, both in their metallic form
or as ions solubilized in biological media, are now recognized as potent allergens and sensitizers.
Human skin is always exposed to toxic particles; therefore, in the present study we addressed the
question of whether polyvinylpyrrolidone-coated PtNPs may have any negative effects on skin
cells, including predominantly epidermal keratinocytes. In this study, PtNPs of two sizes were
used: 5.8 nm and 57 nm, in concentrations of 6.25, 12.5, and 25 µg/mL. Both types of NPs were
protected with polyvinylpyrrolidone. Primary keratinocytes were treated for 24 and 48 hours,
then cytotoxicity, genotoxicity, morphology, metabolic activity, and changes in the activation of
signaling pathways were investigated in PtNP-treated cells. We found that PtNPs trigger toxic
effects on primary keratinocytes, decreasing cell metabolism, but these changes have no effects
on cell viability or migration. Moreover, smaller NPs exhibited more deleterious effect on DNA
stability than the big ones. Analyzing activation of caspases, we found changes in activity of
caspase 9 and caspase 3/7 triggered mainly by smaller NPs. Changes were not so significant in
the case of larger nanoparticles. Importantly, we found that PtNPs have antibacterial properties,
as is the case with silver NPs (AgNPs). In comparison to our previous study regarding the effects
of AgNPs on cell biology, we found that PtNPs do not exhibit such deleterious effects on primary
keratinocytes as AgNPs and that they also can be used as potential antibacterial agents, especially
in the treatment of Escherichia coli, representing a group of Gram-negative species.
Keywords: platinum nanoparticles, keratinocytes, migration, signaling pathways, DNA dam-
age, toxicity
IntroductionThe platinum (Pt)-group elements (PGEs) represent a new kind of environmental pol-
lutant and a new hazard for human health. Since their introduction as vehicle-exhaust
catalysts, their emissions into the environment have grown considerably compared with
their low natural concentration in the earth crust.1 PGE contamination initially occurs in
airborne particulate matter, roadside dust, soil, sludge, and water, and afterwards results
in bioaccumulation in living organisms through different pathways.2 Traditionally, these
elements are considered to be nontoxic for human health, but the massive use of Pt,
palladium (Pd), and rhodium (Rh) as nanoparticles (NPs) and automotive catalytic
converters, causing their release into the environment, has determined a new risk
factor. In particular, PGE emissions from vehicle catalysts could also be in the form
International Journal of Nanomedicine 2013:8submit your manuscript | www.dovepress.com
Dovepress
Dovepress
3964
Konieczny et al
of nanometer-sized particles.3 These elements, both in their
metallic form or as ions solubilized in biological media, are
now recognized as potent allergens and sensitizers.1,4 They
have been also associated with asthma, dermatitis, and other
serious health problems in humans, resulting from chronic
exposure at low concentration levels.5
The effects of PtNPs on different types of cells are not
fully clarified. It is generally accepted that PtNPs are not
as toxic as silver NPs and exhibit remarkable antioxidant
activities, reducing reactive oxygen species (ROS) produc-
tion.6–8 Because of this strong antioxidative capacity, PtNPs
have been effectively used in the cosmetic sector in antiag-
ing formulations. Human skin is constantly exposed to solar
ultraviolet photons. Therefore, the formation of ROS, as
mediators of photooxidative stress, occurs on a daily basis,
especially in countries with enhanced sun exposure. The sun’s
ultraviolet ray-driven ROS production in skin cells results in
changes in skin structural integrity, signal transduction, gene
expression, and even tumorigenic initiation and progres-
sion.9,10 The use of antioxidative agents in skin cosmetics
could provide positive effects on skin condition. Thus, there
is a potential probability that PtNPs will be commonly used
in cosmetics in the future.
As there have not been any data concerning the impact of
PtNPs on primary keratinocytes so far, in the present study
we addressed the question of whether polyvinylpyrrolidone
(PVP)-coated PtNPs may have any negative effects on this
type of cell.
Materials and methodscharacterization of PtNPsIn this study, PtNPs of two sizes were used: 5.8 nm and
57 nm. Both types of NP were coated with PVP and dissolved
in water. The smaller NPs were synthesized by reduction of
K2PtCl
6, adapting the method described for palladium NPs by
Choo et al.11 Transmission electron microscopy (TEM) mea-
surements revealed that PtNPs were as small as 5.8 ± 0.9 nm
(number of measured NPs: 100). Total Pt concentration was
measured by inductively coupled plasma atomic emission
spectroscopy: the determined concentration of PtNPs in the
initial NP suspension was 2.0 g/L. A limulus amebocyte lysate
endotoxin assay was used to confirm that the PtNP solution was
free of bacterial endotoxins and endotoxin-like substances. The
bigger NPs were ordered from Particular (Hanover, Germany).
The company provided detailed characterization of the NPs.
To test whether the NPs were contaminated with bacteria,
a limulus amebocyte lysate endotoxin assay was conducted
by Clongen Labs (Germantown, MD, USA).
cell culture and PtNP treatmentProliferating normal human epidermal keratinocytes
(NHEKs) from adult donors derived from three individu-
als (Lonza, Basel, Switzerland) were cultured in 75 cm2
cell-culture flasks at 37°C in 5% CO2 atmosphere in kera-
tinocyte growth medium (keratinocyte cell basal medium
supplemented with KGM-Gold™ SingleQuots™ [Lonza]):
bovine pituitary extract, human endothelial growth factor,
insulin (bovine), hydrocortisone, gentamicin–amphotericin B
(GA-1000), epinephrine, and transferrin.
In several articles, the matter of units used for the NP
dose used (mass/number/concentration) has been raised.12,13
We decided to use µg/mL concentrations, as this unit of
measurement has been proposed as most appropriate for
in vitro toxicity testing of NPs.14 Different concentrations
of PtNPs (6.25, 12.5, and 25 µg/mL) were added to the
cultured cells 1 day after their seeding on multiwell plates,
and these cells were incubated for appropriate time periods
(24 and 48 hours).
Transmission electron microscopyKeratinocytes cultured in multiwell plates were fixed in 5%
and 2.5% glutaraldehyde in 0.1 M cacodylate buffer, pH 7.3,
at 10°C (Polysciences, Warrington, PA, USA) for 24 hours
in each concentration. Next, they were washed several
times in the buffer, removed from the wells, and transferred
to Eppendorf tubes. They were postfixed in 1.5% osmium
tetroxide in cacodylate buffer for 1 hour. After fixation, cells
were washed in cacodylate buffer again and dehydrated in
50%, 70%, 96%, and 100% ethanol. Finally, they were treated
with propylene oxide twice for 5 minutes and embedded in a
Poly/Bed 812 (Polysciences). After polymerization, 70 nm-
thick sections were cut on a Reichert (Depew, NY, USA)
Ultracut ultramicrotome, collected on copper Formvar-coated
single-slot grids, and contrasted with uranyl acetate and lead
citrate. Sections were viewed and photographed using a JEOL
(Tokyo, Japan) 100 SX TEM.
Viability and cytotoxicity testsTo measure cell viability and cytotoxicity, MTT (3-[4,5-
dimethylthiazol-2-yl]-2,5-diphenyltetrazolium bromide)
and adenosine triphosphate (ATP) assays were carried out.
For the MTT test, NHEKs were seeded on 96-well plates
(4 × 10³ cells/well). Following 24- and 48-hour stimula-
tion with PtNPs (6.25, 12.5, and 25 µg/mL), thiazolyl blue
tetrazolium bromide (Sigma-Aldrich, St Louis, MO, USA)
was added for an additional 3.5 hours to a final concentra-
tion of 500 ng/mL. The next steps of the assay were done as
International Journal of Nanomedicine 2013:8 submit your manuscript | www.dovepress.com
Dovepress
Dovepress
3965
Platinum nanoparticles and keratinocytes
described before.15 Absorbance was measured in an Infinite
M200 microplate reader (Tecan, Männedorf, Switzerland) at
570 nm with a reference wavelength of 650 nm. Absorbance
of PtNPs in cell-culture medium measured in the absence of
cells (NP background) was subsequently subtracted from the
total absorbance of the NP-treated cells. Four independent
experiments were done, each performed in triplicate. The
mean absorbance value for each PtNP concentration was
divided by the mean value for control cells and thus presented
as a percentage of control (control treated as 100%).
Cell viability was analyzed by quantification of intracel-
lular ATP content, as described before.16 Cells seeded on
96-well plates (4 × 10³ cells/well) were treated for 24 and
48 hours with PtNPs. The ATPlite™ luminescence assay
system (PerkinElmer, Waltham, MA, USA) was used for
ATP determination. Luminescence was measured using the
Infinite M200 microplate reader. The mean luminescence
value for each PtNP concentration was divided by the mean
value for control cells, and presented as percentage of control
(control treated as 100%).
caspase 3/7 and 9 activityThe activity of caspases 3 and 7 was measured using
Caspase-Glo 3/7 Assay (Promega, Fitchburg, WI, USA), as
described before.15 NHEKs (8 × 10³ per well) were seeded
on twelve-well plates and exposed to 12.5 and 25 ug/mL
PtNPs for 24 and 48 hours. Protein extracts (3 µg) were
mixed with 40 µL of Caspase-Glo® 3/7 Reagent on white
96-well plates. After 120 minutes of incubation, lumines-
cence was measured with the Infinite M200 microplate
reader. The experiment was repeated three times, and each
was performed in duplicate. Mean luminescence value for
each PtNP concentration was divided by the mean value
for control cells and thus presented as percentage of control
(control treated as 100%).
For determination of caspase 9 activity, NHEKs were
seeded on twelve-well plates at a density of 8 × 10³ cells
per well and stimulated the next day with 12.5 or 25 µg/mL
of PtNPs for 24 or 48 hours. Unstimulated cells served as
a control. Cells were lysed in 50 µL of radioimmunopre-
cipitation assay buffer containing protease and phosphatase
inhibitors (10 µM; Roche, Basel, Switzerland). Supernatants
were collected by spinning of samples at 14,000 rpm for
15 minutes at 4°C. Three micrograms of isolated protein
was mixed with 30 µL of Caspase-Glo 9 substrate on a white
96-well plate. The plate was incubated in the darkness for
2 hours, and luminescence was measured with the Infinite
M200 microplate reader. Three independent experiments
were carried out, each performed in duplicate. The mean
luminescence value for each PtNP concentration was divided
by the mean value for control cells and thus presented as a
percentage of control (control treated as 100%).
comet assayThe level of DNA damage was tested by electrophoresis of
single cells in agarose gel, with the experiment being carried
out exactly as described before,16 and two concentrations of
PtNPs (12.5 and 25 µg/mL) were used at two time points
(24 or 48 hours). The data were collected for 50 randomly
selected comets from each slide. Three independent experi-
ments were done, with two replicates each (number of cells
per condition = 300).
cell migrationNHEKs were seeded on six-well plates (4 × 10⁴ per well).
At 24 and 48 hours after PtNP addition, cell migration was
recorded for 90 minutes with 1.5-minute time lapse using the
Leica DMI6000 B microscope (Leica Microsystems, Wetzlar,
Germany) equipped with Leica Application Suite Advanced
Fluorescence software. The tracks of individual cells were
determined from series of changes in the cell-centroid posi-
tions, pooled and analyzed to determine the velocity of cell
movement. All analyses were done using Hiro software
version 1.0.0.4.16 The experiment was performed three times,
and the data were collected each time from 50 cells. Final
data are presented as mean values for 150 cells.
Western blotActivation of mitogen-activated protein kinases (MAPKs)
and protein kinase B (Akt) was investigated by Western
blot using procedures previously described.16 The follow-
ing antibodies and dilutions were used: Akt (1:1,000; Cell
Signaling Technology, Danvers, MA, USA), Phospho-Akt
(1:2,000; Cell Signaling Technology), stress-activated pro-
tein kinase (SAPK)/c-Jun N-terminal kinase (JNK) (1:500;
Cell Signaling Technology), Phospho-SAPK/JNK (1:500;
Cell Signaling Technology), p38 MAPK (1:1,000; Cell
Signaling Technology), Phospho-p38 MAPK (1:500;
Cell Signaling Technology), phosphorylated extracellular
signal-regulated kinase (p-ERK)-1/2 MAPK (1:2,000; Cell
Signaling Technology), Phospho-ERK1/2 MAPK (1:1,000;
Cell Signaling Technology). Tubulin (1:2,000, Calbiochem;
Merck Millipore, Billerica, MA, USA) was used as a
loading control. The following secondary antibodies were
used: peroxidase-conjugated antirabbit (1:3,000–1:10,000;
Cell Signaling Technology) and peroxidase-conjugated
International Journal of Nanomedicine 2013:8submit your manuscript | www.dovepress.com
Dovepress
Dovepress
3966
Konieczny et al
antimouse (1:20,000, Pharmingen; BD Biosciences, San
Jose, CA, USA).
colony-reduction assayThe assay was performed as described previously by
Sieprawska-Lupa et al.17 Briefly, Escherichia coli (33694;
American Type Culture Collection [ATCC], Manassas,
VA, USA) and Staphylococcus aureus (ATCC 29213) were
grown to the midexponential phase in Luria-Bertani broth or
tryptic soy broth, respectively. Then, bacteria were washed
four times in phosphate-buffered saline and diluted to a
final concentration of 2 × 10⁵ colony-forming units/mL in
Roswell Park Memorial Institute 1640 supplemented with
10% Hank’s balanced salt solution. PtNPs were diluted in
water to a designated concentration. Nine parts bacteria
were incubated with one part PtNPs for 2 hours at 37°C.
As a control, bacteria were incubated in the same solution,
but without the PtNPs. Each assay point was repeated at
least three times. Each sample was diluted 1:100, 1:200, and
1:400 and plated in triplicate on tryptic soy broth or Luria-
Bertani agar plates. After 24 hours’ incubation at 37°C,
colonies were counted. Data are shown as the percentage
of bacteria survival. The control sample was arbitrarily set
as 100% survival.
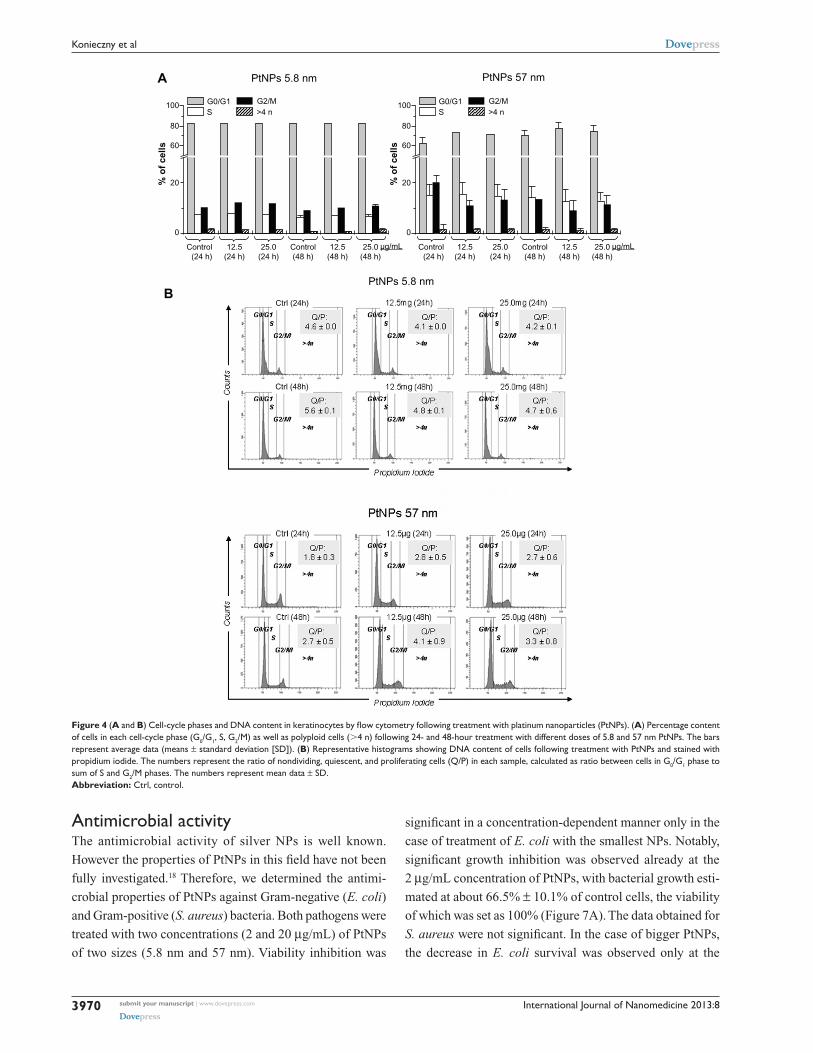
Cell-cycle analysis by flow cytometryThe impact of different concentrations of two sizes of PtNPs
(0, 12.5, and 25 µg/mL) on cell-cycle and DNA accumu-
lation was examined in keratinocytes following 24- and
48-hour incubation by flow cytometry. Control untreated
cells (1 × 10⁶) as well as the cells following 12.5 µg/mL
and 25 µg/mL treatment with PtNPs at two time points were
fixed in suspension employing fridge-cold 70% ethanol.
The cells were further washed in phosphate-buffered saline
without Ca2+ and Mg2+ (Invitrogen; Life Technologies,
Carlsbad, CA, USA), treated with DNase-free ribonuclease
(100 µg/mL, Sigma-Aldrich) to remove the RNA fraction,
and subsequently stained with propidium iodide (50 µg/mL,
Sigma-Aldrich) to visualize DNA content. Samples were
evaluated by flow cytometry (LSR II; BD Biosciences).
statistical analysisAll results are the means of at least three independent
experiments ± standard deviation. The data were analyzed
using Student’s t-test, and only in case of comet-assay
data were calculated by Tukey’s rank-invariant resampling
test. Statistical significance was accepted at the level of
P # 0.05.
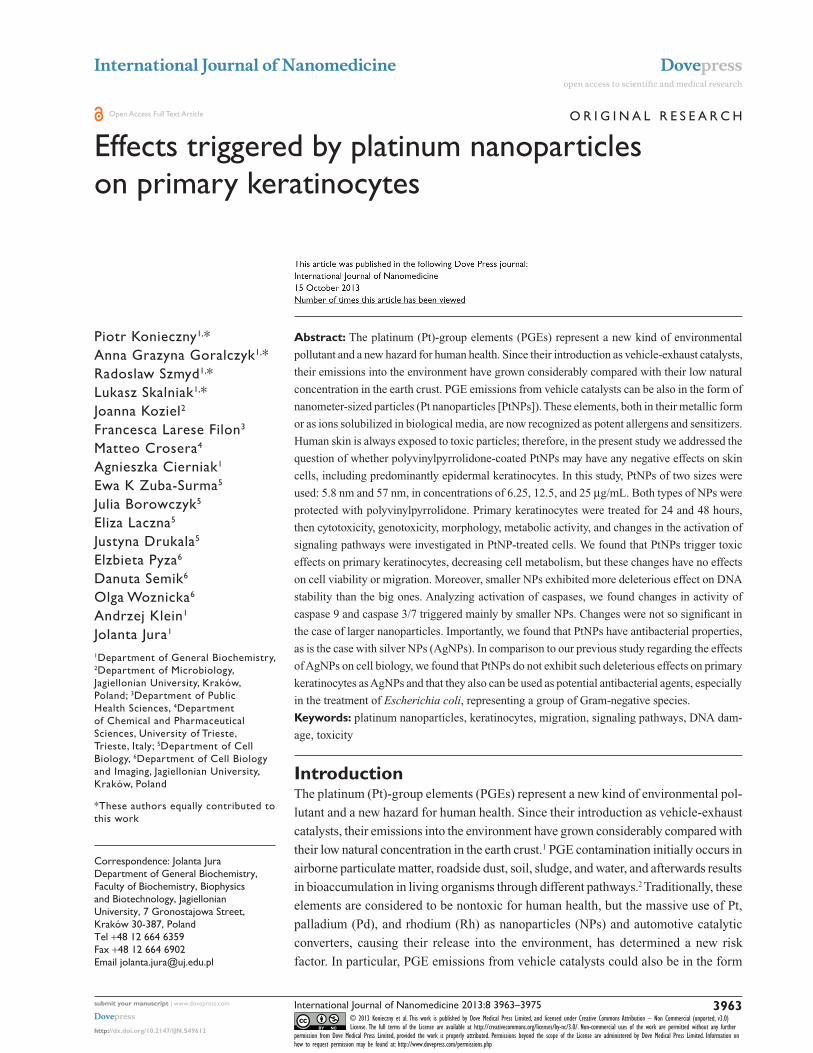
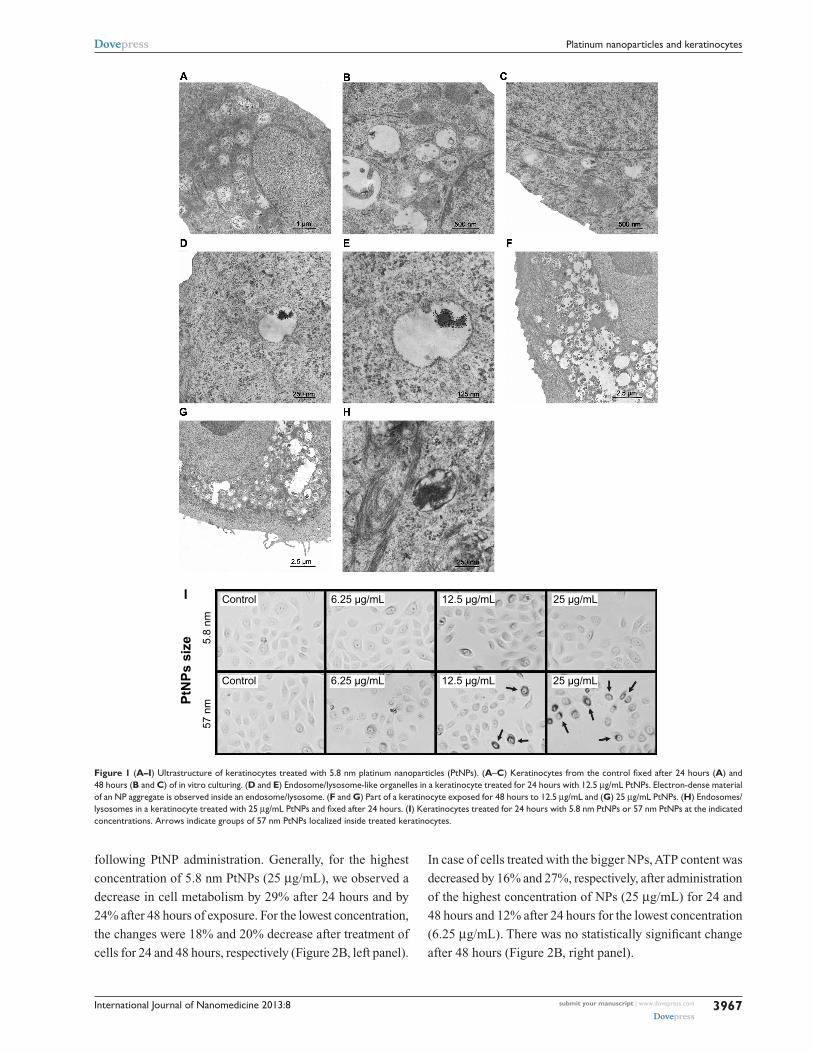
ResultsUltrastructure of PtNP-treated keratinocytesTo verify the interaction between PtNPs and normal human
keratinocytes, we treated the cells with 5.8 nm and 57 nm
PtNPs and performed TEM analysis. When compared
with the control (Figure 1A–C), keratinocytes treated with
PtNPs in 12.5 µg/mL concentration for 24 hours showed
cytoplasmic endosomes filled with electron-dense material,
probably aggregates of PtNPs (Figure 1D and E). When the
concentration of NPs was increased to 25 µg/mL, there were
more endosomes/lysosome-like organelles visible in the
cytoplasm (Figure 1H). Longer exposure of keratinocytes
to PtNPs increased the number and size of lysosomes in
the cytoplasm filled with NPs and cell-engulfed material
(Figure 1G). There were no obvious ultrastructural changes
noticed in the nucleus except changes in its shape (Figure 1F).
In some cells, the nucleolus was observed on the nucleus
territory (Figure 1F and G).
Besides weak changes in the nucleus, no clear changes
in cell morphology were observed in keratinocytes treated
for 24 hours with 5.8 nm PtNPs (Figure 1I). While the cells
treated with 57 nm PtNPs looked generally fine, strong accu-
mulation of NPs was observed when higher doses were used
(12.5 and 25 µg/mL, Figure 1I). The material accumulated
around cell nuclei. This suggests that 57 nm PtNPs undergo
endocytosis, similarly to 5.8 nm PtNPs, but for small NPs
TEM is necessary for the visualization of NP endocytosis.
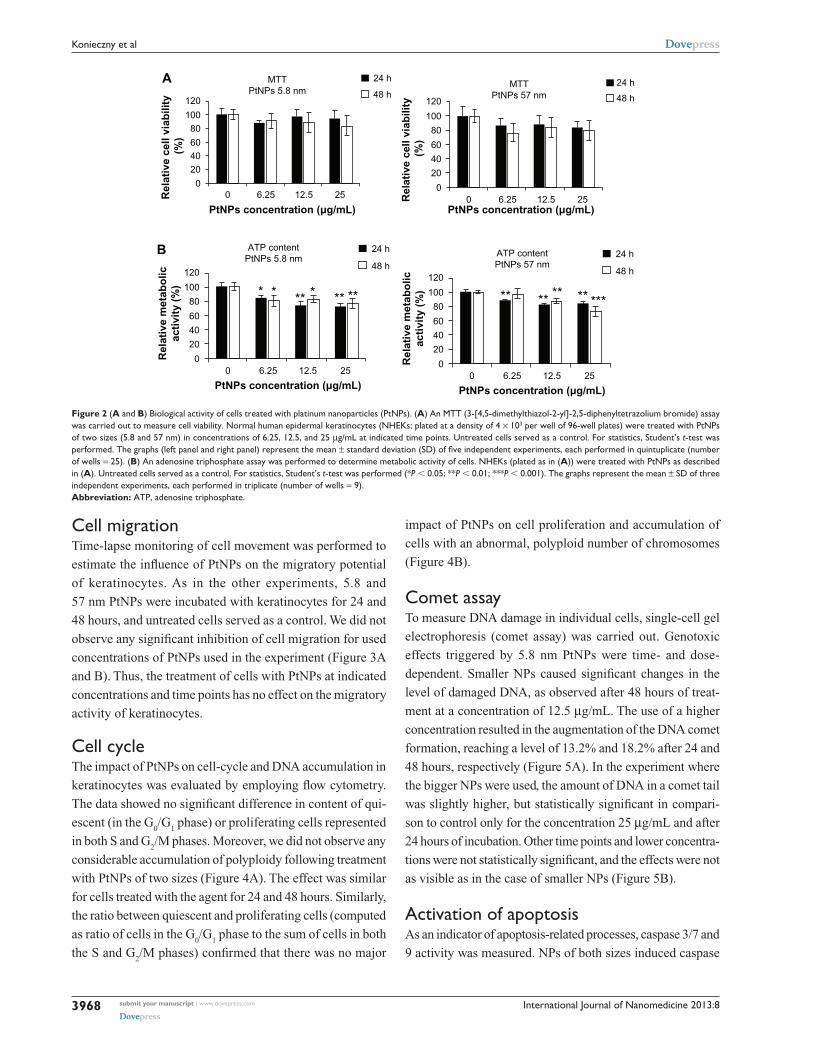
effects of PtNPs on cell viability and metabolismTo estimate the cytotoxic effects of PtNPs on keratinocytes,
we carried out a viability assay (MTT) and metabolic activity
test (ATP content). Cells were treated with PtNPs of two sizes
(5.8 and 57 nm) in three concentrations: 6.25, 12.5 and
25 µg/mL. The experiment was conducted at two time points:
24 and 48 hours. Untreated cells served as a control.
In the MTT assay, we observed that both the size and
the concentrations of NPs altered their influence on cell
viability. However, the observed changes were not statisti-
cally significant (Figure 2A).
In the case of metabolic activity, we noticed dose- and
time-dependent decrease of ATP content in cells treated
with PtNPs. Both NP fractions decreased cell metabolism,
but this effect was stronger for the cells treated with the
smaller NPs than with the bigger ones, and in most cases
it was more evident after 24 hours than after 48 hours
International Journal of Nanomedicine 2013:8 submit your manuscript | www.dovepress.com
Dovepress
Dovepress
3967
Platinum nanoparticles and keratinocytes
following PtNP administration. Generally, for the highest
concentration of 5.8 nm PtNPs (25 µg/mL), we observed a
decrease in cell metabolism by 29% after 24 hours and by
24% after 48 hours of exposure. For the lowest concentration,
the changes were 18% and 20% decrease after treatment of
cells for 24 and 48 hours, respectively (Figure 2B, left panel).
In case of cells treated with the bigger NPs, ATP content was
decreased by 16% and 27%, respectively, after administration
of the highest concentration of NPs (25 µg/mL) for 24 and
48 hours and 12% after 24 hours for the lowest concentration
(6.25 µg/mL). There was no statistically significant change
after 48 hours (Figure 2B, right panel).
Figure 1 (A–I) Ultrastructure of keratinocytes treated with 5.8 nm platinum nanoparticles (PtNPs). (A–C) Keratinocytes from the control fixed after 24 hours (A) and 48 hours (B and C) of in vitro culturing. (D and E) endosome/lysosome-like organelles in a keratinocyte treated for 24 hours with 12.5 µg/ml PtNPs. electron-dense material of an NP aggregate is observed inside an endosome/lysosome. (F and G) Part of a keratinocyte exposed for 48 hours to 12.5 µg/ml and (G) 25 µg/ml PtNPs. (H) endosomes/lysosomes in a keratinocyte treated with 25 µg/mL PtNPs and fixed after 24 hours. (I) Keratinocytes treated for 24 hours with 5.8 nm PtNPs or 57 nm PtNPs at the indicated concentrations. arrows indicate groups of 57 nm PtNPs localized inside treated keratinocytes.
PtN
Ps
size 5.
8 nm
57 n
m
Control 6.25 µg/mL 12.5 µg/mL 25 µg/mL
Control 6.25 µg/mL 12.5 µg/mL 25 µg/mL
I
International Journal of Nanomedicine 2013:8submit your manuscript | www.dovepress.com
Dovepress
Dovepress
3968
Konieczny et al
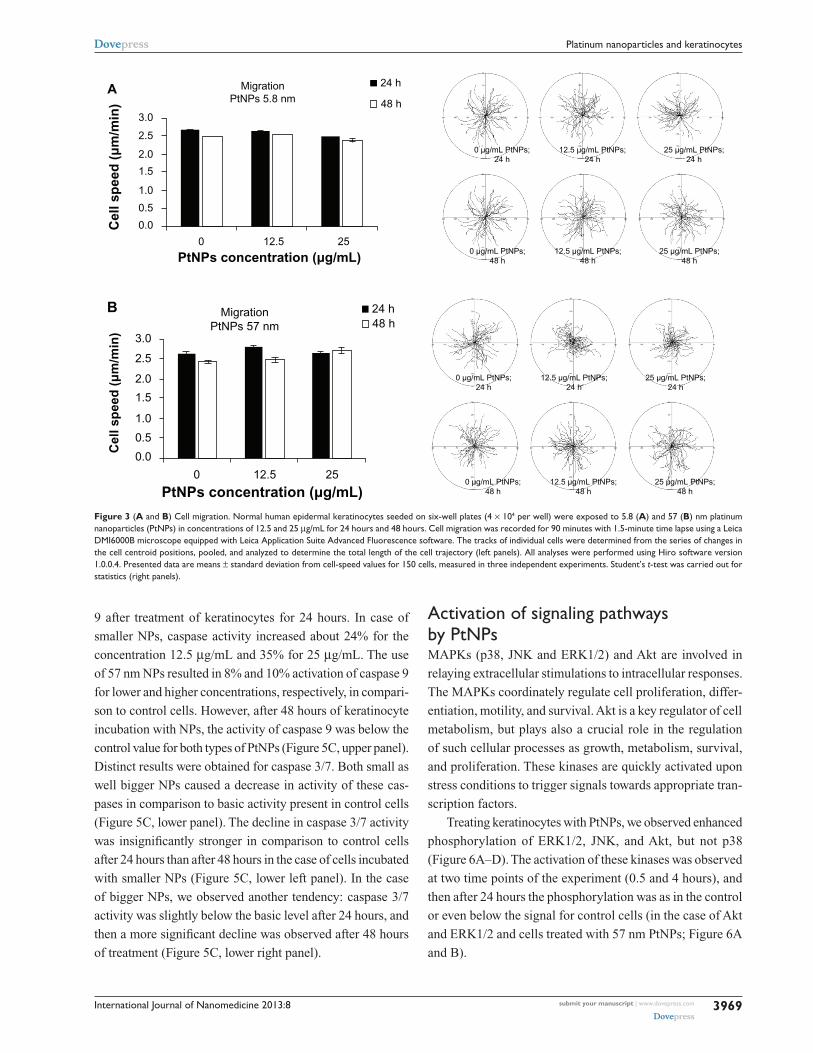
cell migrationTime-lapse monitoring of cell movement was performed to
estimate the influence of PtNPs on the migratory potential
of keratinocytes. As in the other experiments, 5.8 and
57 nm PtNPs were incubated with keratinocytes for 24 and
48 hours, and untreated cells served as a control. We did not
observe any significant inhibition of cell migration for used
concentrations of PtNPs used in the experiment (Figure 3A
and B). Thus, the treatment of cells with PtNPs at indicated
concentrations and time points has no effect on the migratory
activity of keratinocytes.
cell cycleThe impact of PtNPs on cell-cycle and DNA accumulation in
keratinocytes was evaluated by employing flow cytometry.
The data showed no significant difference in content of qui-
escent (in the G0/G
1 phase) or proliferating cells represented
in both S and G2/M phases. Moreover, we did not observe any
considerable accumulation of polyploidy following treatment
with PtNPs of two sizes (Figure 4A). The effect was similar
for cells treated with the agent for 24 and 48 hours. Similarly,
the ratio between quiescent and proliferating cells (computed
as ratio of cells in the G0/G
1 phase to the sum of cells in both
the S and G2/M phases) confirmed that there was no major
impact of PtNPs on cell proliferation and accumulation of
cells with an abnormal, polyploid number of chromosomes
(Figure 4B).
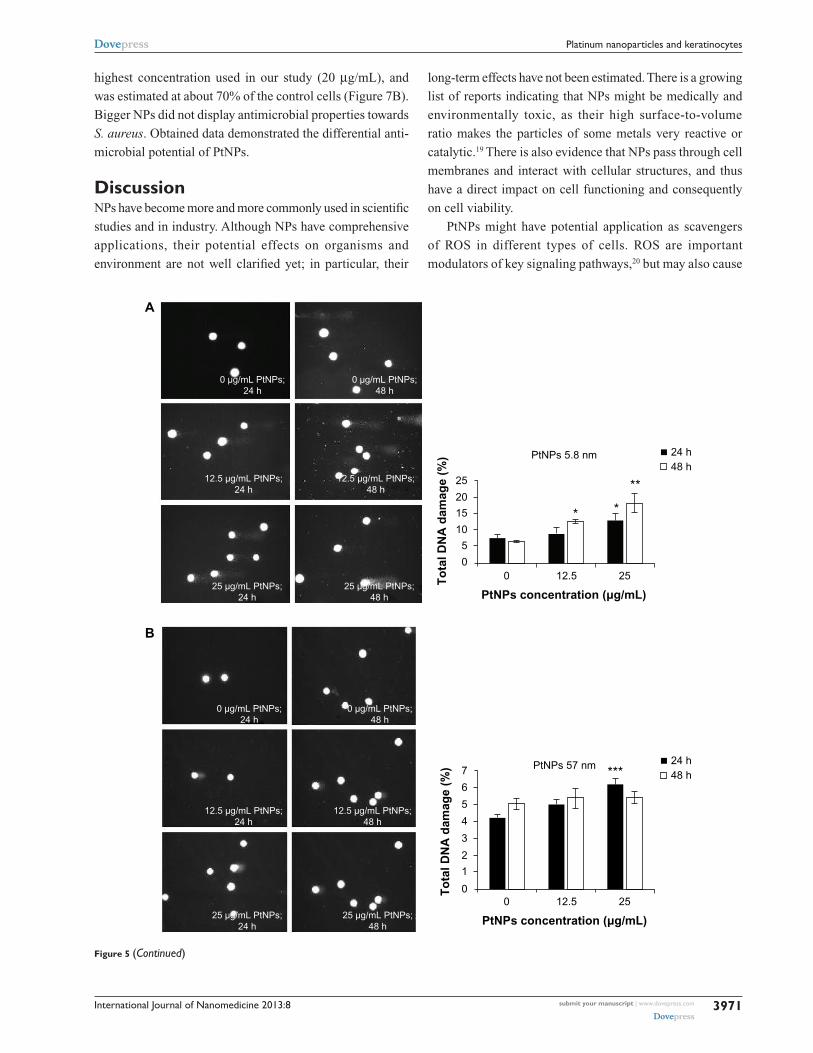
comet assayTo measure DNA damage in individual cells, single-cell gel
electrophoresis (comet assay) was carried out. Genotoxic
effects triggered by 5.8 nm PtNPs were time- and dose-
dependent. Smaller NPs caused significant changes in the
level of damaged DNA, as observed after 48 hours of treat-
ment at a concentration of 12.5 µg/mL. The use of a higher
concentration resulted in the augmentation of the DNA comet
formation, reaching a level of 13.2% and 18.2% after 24 and
48 hours, respectively (Figure 5A). In the experiment where
the bigger NPs were used, the amount of DNA in a comet tail
was slightly higher, but statistically significant in compari-
son to control only for the concentration 25 µg/mL and after
24 hours of incubation. Other time points and lower concentra-
tions were not statistically significant, and the effects were not
as visible as in the case of smaller NPs (Figure 5B).
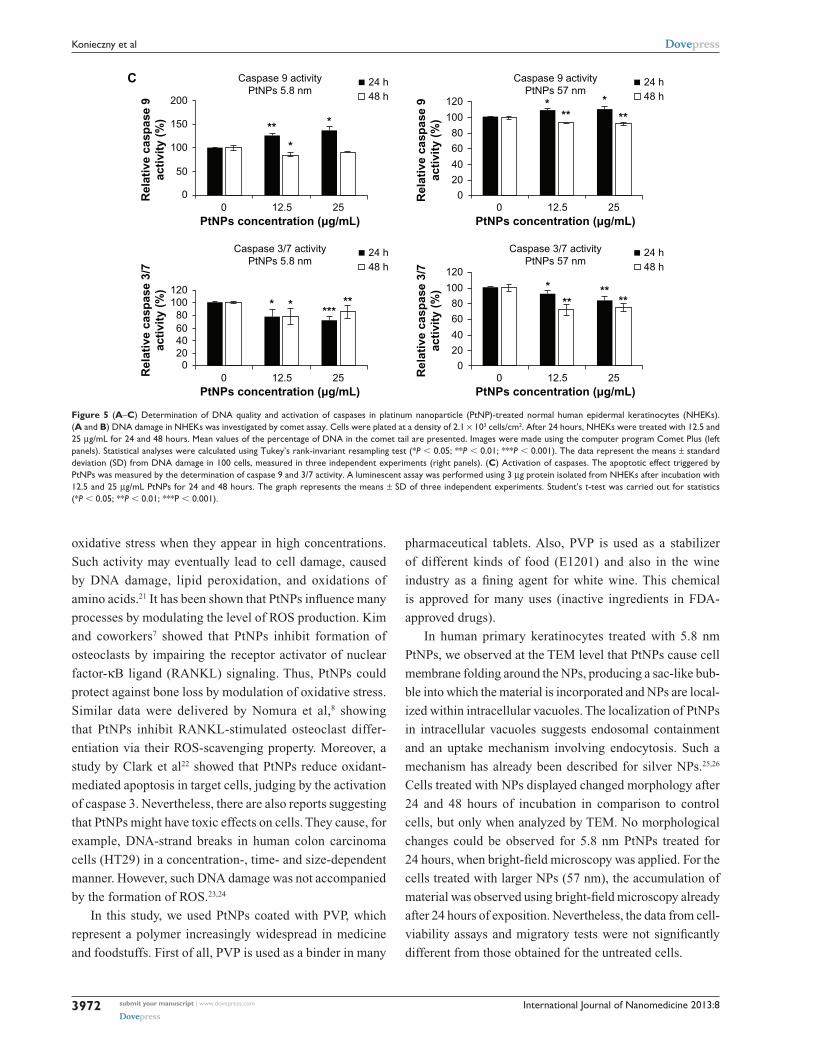
activation of apoptosisAs an indicator of apoptosis-related processes, caspase 3/7 and
9 activity was measured. NPs of both sizes induced caspase
120
10080
604020
00 6.25 12.5 25
PtNPs concentration (µg/mL)
Rel
ativ
e ce
ll vi
abili
ty (
%)
MTTPtNPs 5.8 nm
24 h
48 h
A
120
100
80
60
40
20
00 6.25 12.5 25
PtNPs concentration (µg/mL)
Rel
ativ
e ce
ll vi
abili
ty (
%)
MTTPtNPs 57 nm
24 h
48 h
B
120
100
80
60
40
20
00 6.25 12.5 25
PtNPs concentration (µg/mL)
Rel
ativ
e m
etab
olic
acti
vity
(%
)
ATP contentPtNPs 5.8 nm
24 h
48 h120
100
80
60
40
20
00 6.25 12.5 25
PtNPs concentration (µg/mL)R
elat
ive
met
abo
licac
tivi
ty (
%)
ATP contentPtNPs 57 nm
24 h
48 h
** ** ** ** ** ** ** ** ****
Figure 2 (A and B) Biological activity of cells treated with platinum nanoparticles (PtNPs). (A) an MTT (3-[4,5-dimethylthiazol-2-yl]-2,5-diphenyltetrazolium bromide) assay was carried out to measure cell viability. Normal human epidermal keratinocytes (NheKs; plated at a density of 4 × 10³ per well of 96-well plates) were treated with PtNPs of two sizes (5.8 and 57 nm) in concentrations of 6.25, 12.5, and 25 µg/ml at indicated time points. Untreated cells served as a control. For statistics, student’s t-test was performed. The graphs (left panel and right panel) represent the mean ± standard deviation (SD) of five independent experiments, each performed in quintuplicate (number of wells = 25). (B) an adenosine triphosphate assay was performed to determine metabolic activity of cells. NheKs (plated as in (A)) were treated with PtNPs as described in (A). Untreated cells served as a control. For statistics, student’s t-test was performed (*P , 0.05; **P , 0.01; ***P , 0.001). The graphs represent the mean ± sD of three independent experiments, each performed in triplicate (number of wells = 9).Abbreviation: aTP, adenosine triphosphate.
International Journal of Nanomedicine 2013:8 submit your manuscript | www.dovepress.com
Dovepress
Dovepress
3969
Platinum nanoparticles and keratinocytes
9 after treatment of keratinocytes for 24 hours. In case of
smaller NPs, caspase activity increased about 24% for the
concentration 12.5 µg/mL and 35% for 25 µg/mL. The use
of 57 nm NPs resulted in 8% and 10% activation of caspase 9
for lower and higher concentrations, respectively, in compari-
son to control cells. However, after 48 hours of keratinocyte
incubation with NPs, the activity of caspase 9 was below the
control value for both types of PtNPs (Figure 5C, upper panel).
Distinct results were obtained for caspase 3/7. Both small as
well bigger NPs caused a decrease in activity of these cas-
pases in comparison to basic activity present in control cells
(Figure 5C, lower panel). The decline in caspase 3/7 activity
was insignificantly stronger in comparison to control cells
after 24 hours than after 48 hours in the case of cells incubated
with smaller NPs (Figure 5C, lower left panel). In the case
of bigger NPs, we observed another tendency: caspase 3/7
activity was slightly below the basic level after 24 hours, and
then a more significant decline was observed after 48 hours
of treatment (Figure 5C, lower right panel).
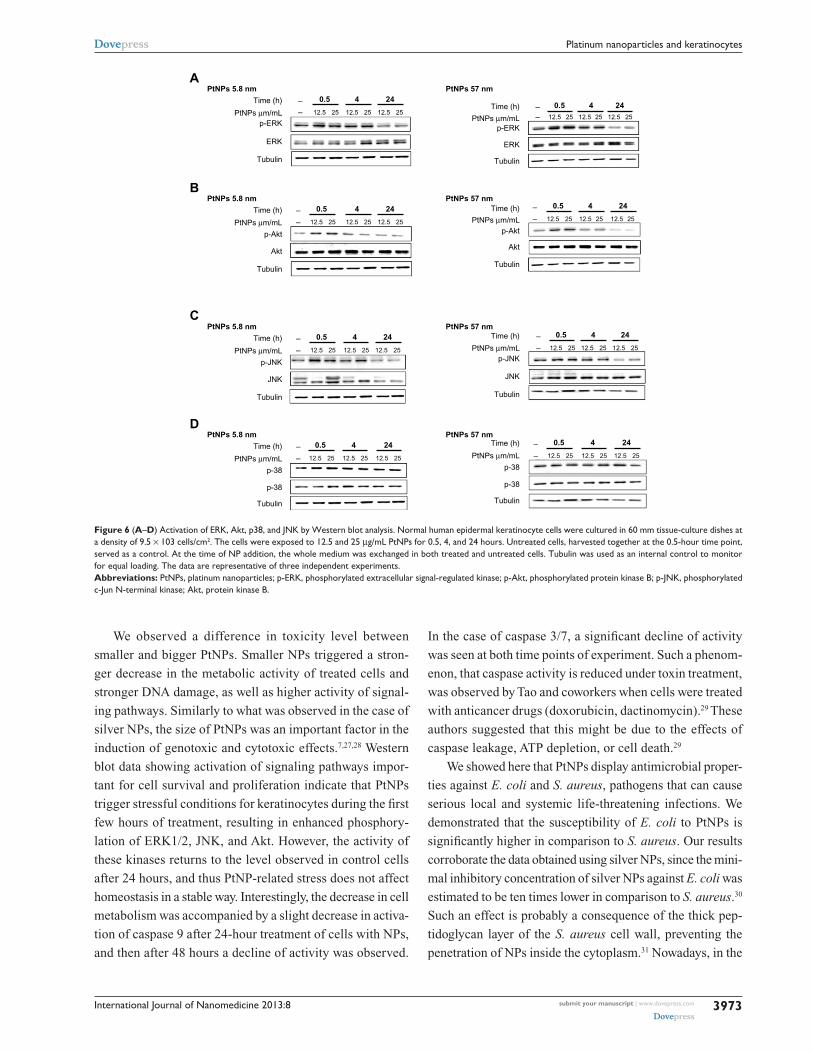
activation of signaling pathways by PtNPsMAPKs (p38, JNK and ERK1/2) and Akt are involved in
relaying extracellular stimulations to intracellular responses.
The MAPKs coordinately regulate cell proliferation, differ-
entiation, motility, and survival. Akt is a key regulator of cell
metabolism, but plays also a crucial role in the regulation
of such cellular processes as growth, metabolism, survival,
and proliferation. These kinases are quickly activated upon
stress conditions to trigger signals towards appropriate tran-
scription factors.
Treating keratinocytes with PtNPs, we observed enhanced
phosphorylation of ERK1/2, JNK, and Akt, but not p38
(Figure 6A–D). The activation of these kinases was observed
at two time points of the experiment (0.5 and 4 hours), and
then after 24 hours the phosphorylation was as in the control
or even below the signal for control cells (in the case of Akt
and ERK1/2 and cells treated with 57 nm PtNPs; Figure 6A
and B).
3.0
2.5
2.0
1.5
1.0
0.5
0.0
0 12.5
PtNPs concentration (µg/mL)25
Cel
l sp
eed
(µ
m/m
in)
MigrationPtNPs 5.8 nm
24 h
0 µg/mL PtNPs;24 h
12.5 µg/mL PtNPs;24 h
25 µg/mL PtNPs;24 h
0 µg/mL PtNPs;48 h
12.5 µg/mL PtNPs;48 h
25 µg/mL PtNPs;48 h
0 µg/mL PtNPs;48 h
12.5 µg/mL PtNPs;48 h
25 µg/mL PtNPs;48 h
0 µg/mL PtNPs;24 h
12.5 µg/mL PtNPs;24 h
25 µg/mL PtNPs;24 h
48 hA
3.0
2.5
2.0
1.5
1.0
0.5
0.0
0 12.5
PtNPs concentration (µg/mL)25
Cel
l sp
eed
(µ
m/m
in)
MigrationPtNPs 57 nm
24 h48 h
B
Figure 3 (A and B) cell migration. Normal human epidermal keratinocytes seeded on six-well plates (4 × 10⁴ per well) were exposed to 5.8 (A) and 57 (B) nm platinum nanoparticles (PtNPs) in concentrations of 12.5 and 25 µg/ml for 24 hours and 48 hours. cell migration was recorded for 90 minutes with 1.5-minute time lapse using a leica DMI6000B microscope equipped with leica application suite advanced Fluorescence software. The tracks of individual cells were determined from the series of changes in the cell centroid positions, pooled, and analyzed to determine the total length of the cell trajectory (left panels). all analyses were performed using hiro software version 1.0.0.4. Presented data are means ± standard deviation from cell-speed values for 150 cells, measured in three independent experiments. student’s t-test was carried out for statistics (right panels).
International Journal of Nanomedicine 2013:8submit your manuscript | www.dovepress.com
Dovepress
Dovepress
3970
Konieczny et al
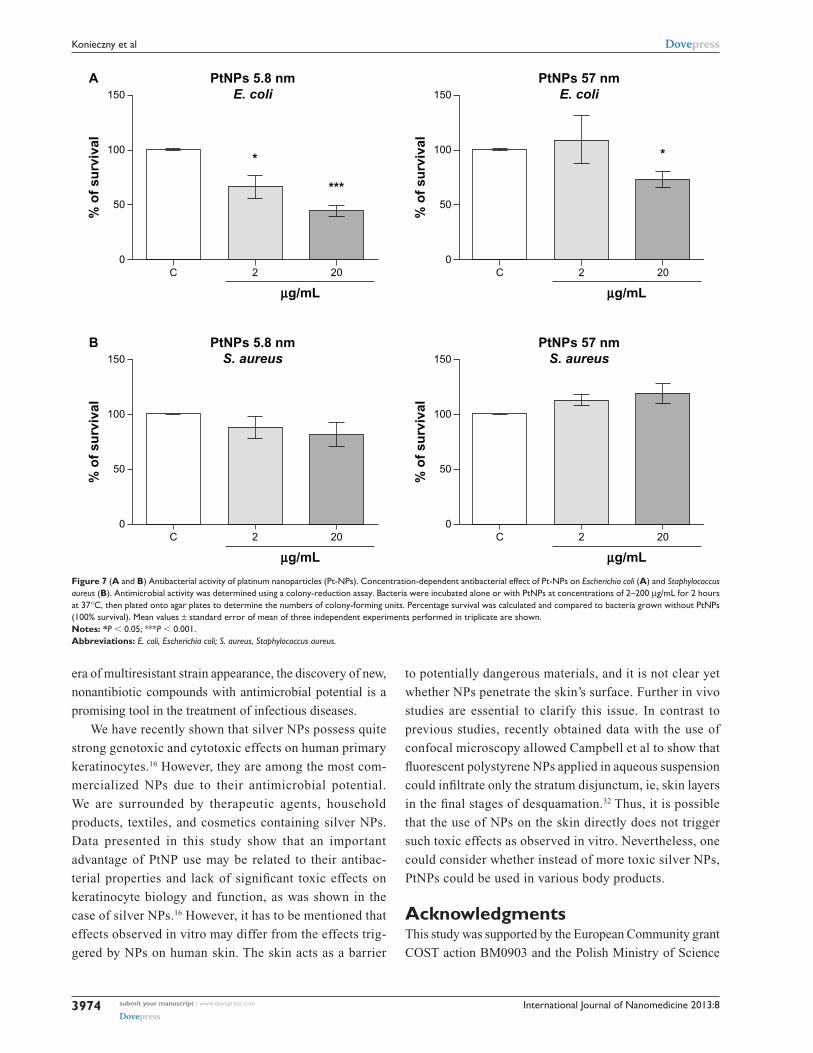
antimicrobial activityThe antimicrobial activity of silver NPs is well known.
However the properties of PtNPs in this field have not been
fully investigated.18 Therefore, we determined the antimi-
crobial properties of PtNPs against Gram-negative (E. coli)
and Gram-positive (S. aureus) bacteria. Both pathogens were
treated with two concentrations (2 and 20 µg/mL) of PtNPs
of two sizes (5.8 nm and 57 nm). Viability inhibition was
significant in a concentration-dependent manner only in the
case of treatment of E. coli with the smallest NPs. Notably,
significant growth inhibition was observed already at the
2 µg/mL concentration of PtNPs, with bacterial growth esti-
mated at about 66.5% ± 10.1% of control cells, the viability
of which was set as 100% (Figure 7A). The data obtained for
S. aureus were not significant. In the case of bigger PtNPs,
the decrease in E. coli survival was observed only at the
100 G0/G1 G2/M>4 nS
80
60
% o
f ce
lls
20
0
Control(24 h)
12.5(24 h)
25.0(24 h)
Control(48 h)
Ctrl (24h)
Ctrl (48h)
12.5(48 h)
25.0(48 h)
µg/mL
PtNPs 5.8 nmA
B
100 G0/G1 G2/M>4 nS
80
60
% o
f ce
lls
20
0
Control(24 h)
12.5(24 h)
25.0(24 h)
Control(48 h)
12.5(48 h)
25.0(48 h)
µg/mL
PtNPs 57 nm
PtNPs 5.8 nm
Figure 4 (A and B) Cell-cycle phases and DNA content in keratinocytes by flow cytometry following treatment with platinum nanoparticles (PtNPs). (A) Percentage content of cells in each cell-cycle phase (g0/g1, s, g2/M) as well as polyploid cells (.4 n) following 24- and 48-hour treatment with different doses of 5.8 and 57 nm PtNPs. The bars represent average data (means ± standard deviation [sD]). (B) representative histograms showing DNa content of cells following treatment with PtNPs and stained with propidium iodide. The numbers represent the ratio of nondividing, quiescent, and proliferating cells (Q/P) in each sample, calculated as ratio between cells in g0/g1 phase to sum of s and g2/M phases. The numbers represent mean data ± sD.Abbreviation: ctrl, control.
International Journal of Nanomedicine 2013:8 submit your manuscript | www.dovepress.com
Dovepress
Dovepress
3971
Platinum nanoparticles and keratinocytes
highest concentration used in our study (20 µg/mL), and
was estimated at about 70% of the control cells (Figure 7B).
Bigger NPs did not display antimicrobial properties towards
S. aureus. Obtained data demonstrated the differential anti-
microbial potential of PtNPs.
DiscussionNPs have become more and more commonly used in scientific
studies and in industry. Although NPs have comprehensive
applications, their potential effects on organisms and
environment are not well clarified yet; in particular, their
long-term effects have not been estimated. There is a growing
list of reports indicating that NPs might be medically and
environmentally toxic, as their high surface-to-volume
ratio makes the particles of some metals very reactive or
catalytic.19 There is also evidence that NPs pass through cell
membranes and interact with cellular structures, and thus
have a direct impact on cell functioning and consequently
on cell viability.
PtNPs might have potential application as scavengers
of ROS in different types of cells. ROS are important
modulators of key signaling pathways,20 but may also cause
0 12.5 25
24 h48 h
PtNPs 5.8 nm
25
20
15
10
5
0
PtNPs concentration (µg/mL)
To
tal D
NA
dam
age
(%)
* *
**
A
0 µg/mL PtNPs;24 h
0 µg/mL PtNPs;48 h
12.5 µg/mL PtNPs;24 h
12.5 µg/mL PtNPs;48 h
25 µg/mL PtNPs;24 h
25 µg/mL PtNPs;48 h
0 12.5 25
24 h48 h
PtNPs 57 nm7
5
4
6
3
2
1
0
PtNPs concentration (µg/mL)
To
tal D
NA
dam
age
(%) ***
B
0 µg/mL PtNPs;24 h
0 µg/mL PtNPs;48 h
12.5 µg/mL PtNPs;24 h
12.5 µg/mL PtNPs;48 h
25 µg/mL PtNPs;24 h
25 µg/mL PtNPs;48 h
Figure 5 (Continued)
International Journal of Nanomedicine 2013:8submit your manuscript | www.dovepress.com
Dovepress
Dovepress
3972
Konieczny et al
oxidative stress when they appear in high concentrations.
Such activity may eventually lead to cell damage, caused
by DNA damage, lipid peroxidation, and oxidations of
amino acids.21 It has been shown that PtNPs influence many
processes by modulating the level of ROS production. Kim
and coworkers7 showed that PtNPs inhibit formation of
osteoclasts by impairing the receptor activator of nuclear
factor-κB ligand (RANKL) signaling. Thus, PtNPs could
protect against bone loss by modulation of oxidative stress.
Similar data were delivered by Nomura et al,8 showing
that PtNPs inhibit RANKL-stimulated osteoclast differ-
entiation via their ROS-scavenging property. Moreover, a
study by Clark et al22 showed that PtNPs reduce oxidant-
mediated apoptosis in target cells, judging by the activation
of caspase 3. Nevertheless, there are also reports suggesting
that PtNPs might have toxic effects on cells. They cause, for
example, DNA-strand breaks in human colon carcinoma
cells (HT29) in a concentration-, time- and size-dependent
manner. However, such DNA damage was not accompanied
by the formation of ROS.23,24
In this study, we used PtNPs coated with PVP, which
represent a polymer increasingly widespread in medicine
and foodstuffs. First of all, PVP is used as a binder in many
pharmaceutical tablets. Also, PVP is used as a stabilizer
of different kinds of food (E1201) and also in the wine
industry as a fining agent for white wine. This chemical
is approved for many uses (inactive ingredients in FDA-
approved drugs).
In human primary keratinocytes treated with 5.8 nm
PtNPs, we observed at the TEM level that PtNPs cause cell
membrane folding around the NPs, producing a sac-like bub-
ble into which the material is incorporated and NPs are local-
ized within intracellular vacuoles. The localization of PtNPs
in intracellular vacuoles suggests endosomal containment
and an uptake mechanism involving endocytosis. Such a
mechanism has already been described for silver NPs.25,26
Cells treated with NPs displayed changed morphology after
24 and 48 hours of incubation in comparison to control
cells, but only when analyzed by TEM. No morphological
changes could be observed for 5.8 nm PtNPs treated for
24 hours, when bright-field microscopy was applied. For the
cells treated with larger NPs (57 nm), the accumulation of
material was observed using bright-field microscopy already
after 24 hours of exposition. Nevertheless, the data from cell-
viability assays and migratory tests were not significantly
different from those obtained for the untreated cells.
0 12.5 25
24 h
*
*
**
48 h
Caspase 9 activityPtNPs 5.8 nm
200
150
100
50
0
PtNPs concentration (µg/mL)
Rel
ativ
e ca
spas
e 9
acti
vity
(%
)
0 12.5 25
24 h
*****
*48 h
Caspase 9 activityPtNPs 57 nm
120
100
80
60
0
40
20
PtNPs concentration (µg/mL)
Rel
ativ
e ca
spas
e 9
acti
vity
(%
)
0 12.5 25
24 h
*******
48 h
Caspase 3/7 activityPtNPs 5.8 nm
120100
406080
200
PtNPs concentration (µg/mL)
Rel
ativ
e ca
spas
e 3/
7ac
tivi
ty (
%)
0 12.5 25
24 h
******
*
48 h
Caspase 3/7 activityPtNPs 57 nm
120
100
80
60
0
40
20
PtNPs concentration (µg/mL)
Rel
ativ
e ca
spas
e 3/
7ac
tivi
ty (
%)
C
Figure 5 (A–C) Determination of DNa quality and activation of caspases in platinum nanoparticle (PtNP)-treated normal human epidermal keratinocytes (NheKs). (A and B) DNa damage in NheKs was investigated by comet assay. cells were plated at a density of 2.1 × 10³ cells/cm2. after 24 hours, NheKs were treated with 12.5 and 25 µg/ml for 24 and 48 hours. Mean values of the percentage of DNa in the comet tail are presented. Images were made using the computer program comet Plus (left panels). statistical analyses were calculated using Tukey’s rank-invariant resampling test (*P , 0.05; **P , 0.01; ***P , 0.001). The data represent the means ± standard deviation (sD) from DNa damage in 100 cells, measured in three independent experiments (right panels). (C) activation of caspases. The apoptotic effect triggered by PtNPs was measured by the determination of caspase 9 and 3/7 activity. a luminescent assay was performed using 3 µg protein isolated from NheKs after incubation with 12.5 and 25 µg/ml PtNPs for 24 and 48 hours. The graph represents the means ± sD of three independent experiments. student’s t-test was carried out for statistics (*P , 0.05; **P , 0.01; ***P , 0.001).
International Journal of Nanomedicine 2013:8 submit your manuscript | www.dovepress.com
Dovepress
Dovepress
3973
Platinum nanoparticles and keratinocytes
We observed a difference in toxicity level between
smaller and bigger PtNPs. Smaller NPs triggered a stron-
ger decrease in the metabolic activity of treated cells and
stronger DNA damage, as well as higher activity of signal-
ing pathways. Similarly to what was observed in the case of
silver NPs, the size of PtNPs was an important factor in the
induction of genotoxic and cytotoxic effects.7,27,28 Western
blot data showing activation of signaling pathways impor-
tant for cell survival and proliferation indicate that PtNPs
trigger stressful conditions for keratinocytes during the first
few hours of treatment, resulting in enhanced phosphory-
lation of ERK1/2, JNK, and Akt. However, the activity of
these kinases returns to the level observed in control cells
after 24 hours, and thus PtNP-related stress does not affect
homeostasis in a stable way. Interestingly, the decrease in cell
metabolism was accompanied by a slight decrease in activa-
tion of caspase 9 after 24-hour treatment of cells with NPs,
and then after 48 hours a decline of activity was observed.
In the case of caspase 3/7, a significant decline of activity
was seen at both time points of experiment. Such a phenom-
enon, that caspase activity is reduced under toxin treatment,
was observed by Tao and coworkers when cells were treated
with anticancer drugs (doxorubicin, dactinomycin).29 These
authors suggested that this might be due to the effects of
caspase leakage, ATP depletion, or cell death.29
We showed here that PtNPs display antimicrobial proper-
ties against E. coli and S. aureus, pathogens that can cause
serious local and systemic life-threatening infections. We
demonstrated that the susceptibility of E. coli to PtNPs is
significantly higher in comparison to S. aureus. Our results
corroborate the data obtained using silver NPs, since the mini-
mal inhibitory concentration of silver NPs against E. coli was
estimated to be ten times lower in comparison to S. aureus.30
Such an effect is probably a consequence of the thick pep-
tidoglycan layer of the S. aureus cell wall, preventing the
penetration of NPs inside the cytoplasm.31 Nowadays, in the
Time (h) –
–
0.5 4 24
PtNPs µm/mL 12.5 25 12.5 25 12.5 25
p-ERK
ERK
Tubulin
PtNPs 5.8 nm
Time (h) –
–
0.5 4 24
PtNPs µm/mL 12.5 25 12.5 25 12.5 25
p-Akt
Akt
Tubulin
PtNPs 5.8 nm
Time (h) –
–
0.5 4 24
PtNPs µm/mL 12.5 25 12.5 25 12.5 25
p-JNK
JNK
Tubulin
PtNPs 5.8 nm
Time (h) –
–
0.5 4 24
PtNPs µm/mL 12.5 25 12.5 25 12.5 25
p-38
p-38
Tubulin
PtNPs 5.8 nm
Time (h) ––
0.5 4 24
PtNPs µm/mL 12.5 25 12.5 25 12.5 25
p-ERK
ERK
Tubulin
PtNPs 57 nm
Time (h) –
–
0.5 4 24
PtNPs µm/mL 12.5 25 12.5 25 12.5 25
p-Akt
Akt
Tubulin
PtNPs 57 nm
Time (h) –
–
0.5 4 24
PtNPs µm/mL 12.5 25 12.5 25 12.5 25
p-JNK
JNK
Tubulin
PtNPs 57 nm
Time (h) –
–
0.5 4 24
PtNPs µm/mL 12.5 25 12.5 25 12.5 25
p-38
p-38
Tubulin
PtNPs 57 nm
A
B
C
D
Figure 6 (A–D) activation of erK, akt, p38, and JNK by Western blot analysis. Normal human epidermal keratinocyte cells were cultured in 60 mm tissue-culture dishes at a density of 9.5 × 10³ cells/cm2. The cells were exposed to 12.5 and 25 µg/ml PtNPs for 0.5, 4, and 24 hours. Untreated cells, harvested together at the 0.5-hour time point, served as a control. at the time of NP addition, the whole medium was exchanged in both treated and untreated cells. Tubulin was used as an internal control to monitor for equal loading. The data are representative of three independent experiments. Abbreviations: PtNPs, platinum nanoparticles; p-erK, phosphorylated extracellular signal-regulated kinase; p-akt, phosphorylated protein kinase B; p-JNK, phosphorylated c-Jun N-terminal kinase; akt, protein kinase B.
International Journal of Nanomedicine 2013:8submit your manuscript | www.dovepress.com
Dovepress
Dovepress
3974
Konieczny et al
era of multiresistant strain appearance, the discovery of new,
nonantibiotic compounds with antimicrobial potential is a
promising tool in the treatment of infectious diseases.
We have recently shown that silver NPs possess quite
strong genotoxic and cytotoxic effects on human primary
keratinocytes.16 However, they are among the most com-
mercialized NPs due to their antimicrobial potential.
We are surrounded by therapeutic agents, household
products, textiles, and cosmetics containing silver NPs.
Data presented in this study show that an important
advantage of PtNP use may be related to their antibac-
terial properties and lack of significant toxic effects on
keratinocyte biology and function, as was shown in the
case of silver NPs.16 However, it has to be mentioned that
effects observed in vitro may differ from the effects trig-
gered by NPs on human skin. The skin acts as a barrier
to potentially dangerous materials, and it is not clear yet
whether NPs penetrate the skin’s surface. Further in vivo
studies are essential to clarify this issue. In contrast to
previous studies, recently obtained data with the use of
confocal microscopy allowed Campbell et al to show that
fluorescent polystyrene NPs applied in aqueous suspension
could infiltrate only the stratum disjunctum, ie, skin layers
in the final stages of desquamation.32 Thus, it is possible
that the use of NPs on the skin directly does not trigger
such toxic effects as observed in vitro. Nevertheless, one
could consider whether instead of more toxic silver NPs,
PtNPs could be used in various body products.
AcknowledgmentsThis study was supported by the European Community grant
COST action BM0903 and the Polish Ministry of Science
20
***
2
*
PtNPs 5.8 nmE. coli
µg/mL
% o
f su
rviv
al
C
150
100
50
020
*
2
PtNPs 57 nmE. coli
µg/mL
% o
f su
rviv
al
C
150
100
50
0
202
PtNPs 5.8 nmS. aureus
µg/mL
% o
f su
rviv
al
C
150
100
50
0202
PtNPs 57 nmS. aureus
µg/mL
% o
f su
rviv
al
C
150
100
50
0
A
B
Figure 7 (A and B) antibacterial activity of platinum nanoparticles (Pt-NPs). concentration-dependent antibacterial effect of Pt-NPs on Escherichia coli (A) and Staphylococcus aureus (B). antimicrobial activity was determined using a colony-reduction assay. Bacteria were incubated alone or with PtNPs at concentrations of 2–200 µg/ml for 2 hours at 37°c, then plated onto agar plates to determine the numbers of colony-forming units. Percentage survival was calculated and compared to bacteria grown without PtNPs (100% survival). Mean values ± standard error of mean of three independent experiments performed in triplicate are shown. Notes: *P , 0.05; ***P , 0.001.Abbreviations: E. coli, Escherichia coli; S. aureus, Staphylococcus aureus.
International Journal of Nanomedicine
Publish your work in this journal
Submit your manuscript here: http://www.dovepress.com/international-journal-of-nanomedicine-journal
The International Journal of Nanomedicine is an international, peer-reviewed journal focusing on the application of nanotechnology in diagnostics, therapeutics, and drug delivery systems throughout the biomedical field. This journal is indexed on PubMed Central, MedLine, CAS, SciSearch®, Current Contents®/Clinical Medicine,
Journal Citation Reports/Science Edition, EMBase, Scopus and the Elsevier Bibliographic databases. The manuscript management system is completely online and includes a very quick and fair peer-review system, which is all easy to use. Visit http://www.dovepress.com/ testimonials.php to read real quotes from published authors.
International Journal of Nanomedicine 2013:8 submit your manuscript | www.dovepress.com
Dovepress
Dovepress
Dovepress
3975
Platinum nanoparticles and keratinocytes
and Higher Education grant 776/N-COST/2010/0, both
awarded to Jolanta Jura. Francesca Larese Filon and Jolanta
Jura are members of the management committee of COST
Action BM0903.
DisclosureThe authors report no conflicts of interest in this work.
References 1. Ravindra K, Bencs L, Van Grieken R. Platinum group elements in the
environment and their health risk. Sci Total Environ. 2004;318(1–3): 1–43.
2. Conti ME, Alimonti A, Bocca B. Environmental exposure to platinum group elements released by automotive catalytic converters: the risk for children. Int J Environ Health. 2008;2(3):439–462.
3. Ek KH, Morrison GM, Rauch S. Environmental routes for platinum group elements to biological materials – a review. Sci Total Environ. 2004;334–335:21–38.
4. Burastero SE, Paolucci C, Fabbri M. Ambient pollutants as adjuvant for allergic sensitization: the emerging role of platinum group elements. J Biol Regul Homeost Agents. 2009;23(4):207–215.
5. Wiseman CL, Zereini F. Airborne particulate matter, platinum group elements and human health: a review of recent evidence. Sci Total Environ. 2009;407(8):2493–2500.
6. Asharani PV, Lianwu Y, Gong Z, Valiyaveettil S. Comparison of the toxicity of silver, gold and platinum nanoparticles in developing zebrafish embryos. Nanotoxicology. 2011;5(1):43–54.
7. Kim WK, Kim JC, Park HJ, et al. Platinum nanoparticles reduce ovariectomy-induced bone loss by decreasing osteoclastogenesis. Exp Mol Med. 2012;44(7):432–439.
8. Nomura M, Yoshimura Y, Kikuiri T, et al. Platinum nanoparticles suppress osteoclastogenesis through scavenging of reactive oxygen species produced in RAW264.7 cells. J Pharmacol Sci. 2011;117(4): 243–252.
9. Liebel F, Kaur S, Ruvolo E, Kollias N, Southall MD. Irradiation of skin with visible light induces reactive oxygen species and matrix-degrading enzymes. J Invest Dermatol. 2012;132(7):1901–1907.
10. Swalwell H, Latimer J, Haywood RM, Birch-Machin MA. Investigating the role of melanin in UVA/UVB- and hydrogen peroxide-induced cellular and mitochondrial ROS production and mitochondrial DNA damage in human melanoma cells. Free Radic Biol Med. 2012;52(3): 626–634.
11. Choo HP, Liew KY, Liu HF. Factors affecting the size of polymer stabilized Pd nanoparticles. J Mater Chem. 2002;12(4):934–937.
12. Teeguarden JG, Hinderliter PM, Orr G, Thrall BD, Pounds JG. Particokinetics in vitro: dosimetry considerations for in vitro nanoparticle toxicity assessments. Toxicol Sci. 2007;95(2):300–312.
13. Asefa T, Tao Z. Biocompatibility of mesoporous silica nanoparticles. Chem Res Toxicol. 2012;25(11):2265–2284.
14. Lison D, Thomassen LC, Rabolli V, et al. Nominal and effective dosimetry of silica nanoparticles in cytotoxicity assays. Toxicol Sci. 2008;104(1):155–162.
15. Wegrzyn P, Yarwood SJ, Fiegler N, et al. Mimitin – a novel cytokine-regulated mitochondrial protein. BMC Cell Biol. 2009;10:23.
16. Szmyd R, Goralczyk AG, Skalniak L, et al. Effect of silver nanoparticles on human primary keratinocytes. Biol Chem. 2013;394(1):113–123.
17. Sieprawska-Lupa M, Mydel P, Krawczyk K, et al. Degradation of human antimicrobial peptide LL-37 by Staphylococcus aureus-derived proteinases. Antimicrob Agents Chemother. 2004;48(12): 4673–4679.
18. Chwalibog A, Sawosz E, Hotowy A, et al. Visualization of interaction between inorganic nanoparticles and bacteria or fungi. Int J Nanomedicine. 2010;5:1085–1094.
19. Oberdorster G, Oberdorster E, Oberdorster J. Nanotoxicology: an emerging discipline evolving from studies of ultrafine particles. Environ Health Perspect. 2005;113(7):823–839.
20. Thannickal VJ, Fanburg BL. Reactive oxygen species in cell signaling. Am J Physiol Lung Cell Mol Physiol. 2000;279(6):L1005–L1028.
21. Ichihashi M, Ueda M, Budiyanto A, et al. UV-induced skin damage. Toxicology. 2003;189(1–2):21–39.
22. Clark A, Zhu A, Sun K, Petty HR. Cerium oxide and platinum nano-particles protect cells from oxidant-mediated apoptosis. J Nanopart Res. 2011;13(10):5547–5555.
23. Pelka J, Gehrke H, Esselen M, et al. Cellular uptake of platinum nanoparticles in human colon carcinoma cells and their impact on cel-lular redox systems and DNA integrity. Chem Res Toxicol. 2009;22(4): 649–659.
24. Gehrke H, Pelka J, Hartinger CG, et al. Platinum nanoparticles and their cellular uptake and DNA platination at non-cytotoxic concentrations. Arch Toxicol. 2011;85(7):799–812.
25. Asharani PV, Hande MP, Valiyaveettil S. Anti-proliferative activity of silver nanoparticles. BMC Cell Biol. 2009;10:65.
26. Greulich C, Diendorf J, Simon T, Eggeler G, Epple M, Koller M. Uptake and intracellular distribution of silver nanoparticles in human mesenchymal stem cells. Acta Biomater. 2011;7(1):347–354.
27. Osborne OJ, Johnston BD, Moger J, et al. Effects of particle size and coating on nanoscale Ag and TiO(2) exposure in zebrafish (Danio rerio) embryos. Nanotoxicology. Epub October 29, 2012.
28. Shi J, Xu B, Sun X, Ma C, Yu C, Zhang H. Light induced toxicity reduction of silver nanoparticles to Tetrahymena pyriformis: effect of particle size. Aquat Toxicol. 2013;132–133:53–60.
29. Tao Z, Goodisman J, Penefsky HS, Souid AK. Caspase activation by anticancer drugs: the caspase storm. Mol Pharm. 2007;4(4): 583–595.
30. Kim JS, Kuk E, Yu KN, et al. Antimicrobial effects of silver nanoparticles. Nanomedicine. 2007;3(1):95–101.
31. Taglietti A, Diaz Fernandez YA, Amato E, et al. Antibacterial activity of glutathione-coated silver nanoparticles against Gram positive and Gram negative bacteria. Langmuir. 2012;28(21):8140–8148.
32. Campbell CS, Contreras-Rojas LR, Delgado-Charro MB, Guy RH. Objective assessment of nanoparticle disposition in mammalian skin after topical exposure. J Control Release. 2012;162(1):201–207.


