Embed Size (px)
Citation preview

Frontier J. Vet. Anim. Sci.Vol. 4, No. 2 (July-Dec.) 2015 104
1Assistant Professor, Dept. of Veterinary Parasitology,corresponding author, email: [email protected] 2Assistant Professor, Dept. of LPM,Veterinary College, Hassan. 3Professor and Head, Centralized clinical laboratory, Madras Veterinary College, Chennai 4Assistant Professor and Head, Centralized clinical laboratory, Madras Veterinary College, Chennai 5Professor and Head, Dept. of ILFC, Veterinary College, Hassan. 6Assistant Professor, Dept. of Veterinary Physiology,Veterinary College, Hassan. 7Assistant Professor, Dept. of ILFC,Veterinary College, Hassan. 8Professor and Head,Dept. of Veterinary Parasitology, Veterinary College, Bangalore.
Gastro intestinal helminthes affecting the pigs are of
zoonotic and public health importance and attracted
more economic losses in swine rearing. The effect of
GI parasitism range from stunted growth,
unthriftiness, diarrhoea, anaemia and death (Blood
and Radostits, 1995). Gastrointestinal parasites are
responsible for substantial losses of productivity in
swine and livestock industry as well. Since losses
encountered in pigs due to helminth parasites are
enormous and it is imperative to carry out the
investigations on anthelmintic performance in the pig
industry and their usage to minimize the losses to
the extent possible.
Infections with internal parasites are
mostly subclinical, causing huge economic losses to
pig industry. Infected animals though have a higher
feed conversion rate, but thelower daily weight gain
and lower meat quality makes the industry to grow
on negative side.
Albendazole, a broad spectrum
anthelmintic drug, marketedunder different trade
names belongs to benzimidazole group and is being
used for the treatment of a variety of parasitic worm
infestations in general and nematodes in
particular.The present investigation was carried out
to evaluatethe performance of Albendazole using
the Faecal Egg Count Reduction Test (FECRT).
Although several reports have been published on
nematode parasites of pigs from different parts of
India (Yadav and Tandon, 1989), there is scanty of
information on the prevalence and efficacy of
Albendazole against GI parasites from Hassan
district of Karnataka.
MATERIALS AND METHODS
Selection of animals and study area: Two farms
located in Hassan district owned by private with
Thirty (30) pigs in each farm were selected for the
present study. The pigs belong to breeds of
Yorkshire, Landrace, Duroc and their crosses aged
2-2 ½ years. The farms had a history of
unthriftiness, weakness, lowered weight gain and
even death of piglets. The pigs in these selected
farms had a history of deworming with
Fenbendazole.
Dosing of animals: The animals that were tested
positive for parasitic infestation were dewormed as
a single dose withAlbendazole - 10mg/kg B.W.
Ten pigs in each farm served as control group.
Efficacy of Albendazole against Certain Parasites in Pigs
Dhanalakshmi,H1., Prasanna,S.B
2.,Vairamuthu, S
3., SubhaPriya,S
4., Shivakumar,M.C
5.,
Veena,M.P6 ., Mahadevappa,D.G
7., and Thimmareddy,P.M
8.
Department of Parasitology, Veterinary College, KVAFSU, Hassan-573202
Received: 05 October 2014; Accepted: 19 December 2014
ABSTRACT
Gastrointestinal parasites cause economic losses to the swine industry. A variety of anthelmintics are being used by
the pig rearers to eliminate the gastrointestinal parasites. Hence, it is imperative to carry out investigations on
anthelmintic efficacy in the pig industry to enable the swine rearers to adopt the suitable control measures. A study
was undertaken to study the efficacy of Albendazole against certain internal parasites in pigs (Yorkshire, Landrace,
Duroc and their crosses) using Faecal Egg Count Reduction Test (FECRT) in swine farms with long time exposure for
anthelmintics. The present study revealed the prevalence of highest infection rate of Ascaris suum,(83.30 and 76.60%
in farms I and II) followed by Eimeria spp., (60% and 40 % in farms I and II) and Trichuris suis (16.60 and 10.00% in
farms I and II) Albendazole (10mg/kg B.W) was found to be more than 95% effective in reducing the helminth
infection.
Key words: Pig, Ascaris suum, Albendazole, Efficacy
Frontier J. Vet. Anim. Sci.Vol. 4, No. 2 (July-Dec.) 2015 105
Collection and Processing of faecal sample:
Using disposable hand gloves faecal samples were
collected directly from the rectum. The collected
feacal samples were transferred into glass bottles,
were well labeled and filled upto to the brim to
exclude air as much as possible with the idea of
reducing the rate of development and hatching of
the eggs. In conditions where the laboratory
examination could not be carried out soon after
collection, the samples were kept in the refrigerator
at 4◦ C for not more than 24 hours. The faecal
samples were collected before treatment and 2
weeks after treatment. The eggs per gram (EPG)
was determined using a McMaster method
(Soulsby, 1982).
Statistical analysis of the data: The FECRT(%)
is calculated as per the below mentioned formula:
FECRT (%) = 100 x (1- arithmetic mean of post
DA FEC/ arithmetic mean of pre DA FEC)
Post DA FEC - post drug administration faecal
egg count
Pre DA FEC - pre drug administration faecal
egg count
The prevalence rate of the parasite was
calculated by formula, p=d/n where „d‟ is the
number of pigs diagnosed as having a given
parasite at that point of time and „n‟ is the no. of
pigs examined at that point of time and „p‟ is the
prevalence of the pig harboring each parasite.
Grading of EPG: Less than 500 – Low infection
rate, 500 – 2000 – moderate infection rate, 2000 -
5000 – high infection rate
RESULTS AND DISCUSSION
In the present study it was possible to recover eggs
of Ascarissuum, Trichuris suis and oocysts of
Eimeriaspp., and Balantidium coli cyst. Out of 60
pigs screened 10(33%) and 11(36.6%) of pigs had
multiple infection (Ascaris, Trichuris and Eimeria
spp.) in Farm I and II respectively (Table 1). The
intensity of Ascaris suum infection was more in
farm I than in farm II. Twenty animals (66%) in
farm I had high EPG count ranging from 2000 to
5000. In farm II, 16(53.33%) animals had high
infection rate, three (10%) had moderate infection
and one (3.33%) animal with low infection rate.
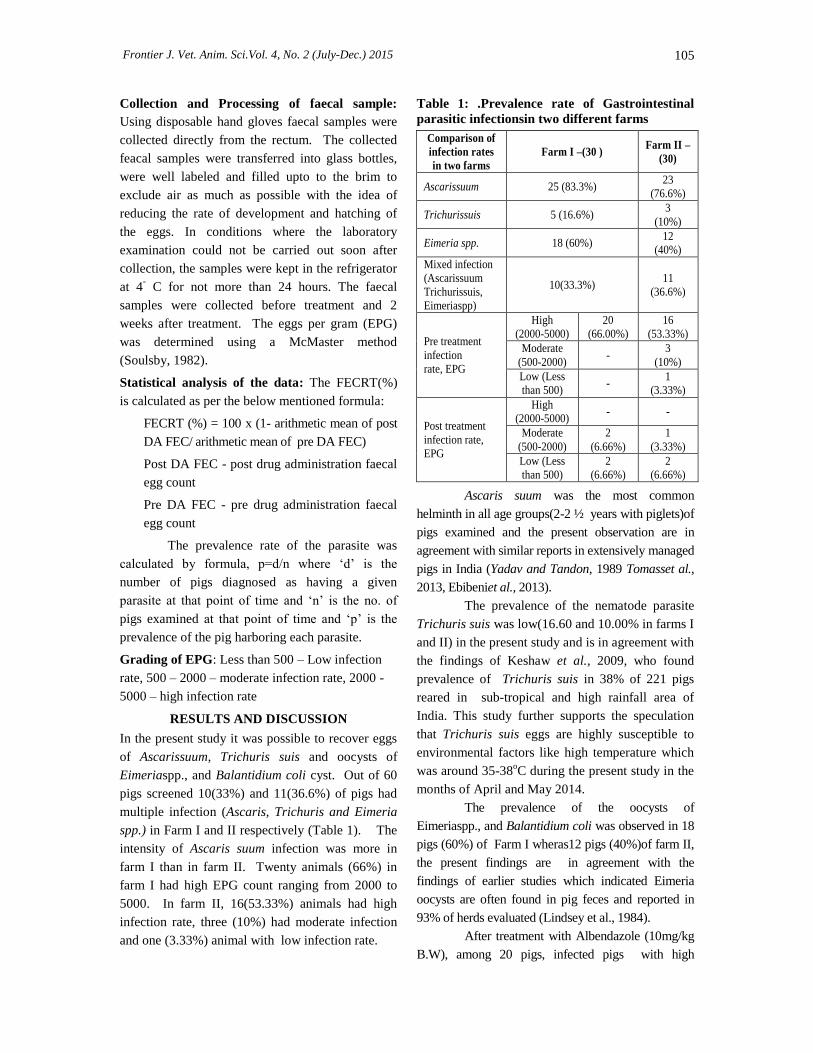
Table 1: .Prevalence rate of Gastrointestinal
parasitic infectionsin two different farms
Comparison of
infection rates
in two farms
Farm I –(30 ) Farm II –
(30)
Ascarissuum 25 (83.3%) 23
(76.6%)
Trichurissuis 5 (16.6%) 3
(10%)
Eimeria spp. 18 (60%) 12
(40%)
Mixed infection
(Ascarissuum
Trichurissuis,
Eimeriaspp)
10(33.3%) 11
(36.6%)
Pre treatment
infection
rate, EPG
High
(2000-5000)
20
(66.00%)
16
(53.33%)
Moderate
(500-2000) -
3
(10%)
Low (Less
than 500) -
1
(3.33%)
Post treatment
infection rate,
EPG
High
(2000-5000) - -
Moderate
(500-2000)
2
(6.66%)
1
(3.33%)
Low (Less
than 500)
2
(6.66%)
2
(6.66%)
Ascaris suum was the most common
helminth in all age groups(2-2 ½ years with piglets)of
pigs examined and the present observation are in
agreement with similar reports in extensively managed
pigs in India (Yadav and Tandon, 1989 Tomasset al.,
2013, Ebibeniet al., 2013).
The prevalence of the nematode parasite
Trichuris suis was low(16.60 and 10.00% in farms I
and II) in the present study and is in agreement with
the findings of Keshaw et al., 2009, who found
prevalence of Trichuris suis in 38% of 221 pigs
reared in sub-tropical and high rainfall area of
India. This study further supports the speculation
that Trichuris suis eggs are highly susceptible to
environmental factors like high temperature which
was around 35-38oC during the present study in the
months of April and May 2014.
The prevalence of the oocysts of
Eimeriaspp., and Balantidium coli was observed in 18
pigs (60%) of Farm I wheras12 pigs (40%)of farm II,
the present findings are in agreement with the
findings of earlier studies which indicated Eimeria
oocysts are often found in pig feces and reported in
93% of herds evaluated (Lindsey et al., 1984).
After treatment with Albendazole (10mg/kg
B.W), among 20 pigs, infected pigs with high

Frontier J. Vet. Anim. Sci.Vol. 4, No. 2 (July-Dec.) 2015 106
intensity parasite rate 16 had completely recovered
fromthe parasites but 4 exhibited low to moderate
intensity of infection in farm I. In farm II, Sixteen
highly infected animals became free of infection, 4
animals with low to moderate rate of infection became
3 and one was free of infection after treatment with
Albendazole at a dose rate of 10mg/kg B.W. The
results indicated the efficacy of 97.6% and 96% in
farm I and II respectively. (Table 2).
Table 2: Efficacy of albendazoleagainst
helminths and differences in mean EPG of pre
and post treatment
Farm
no
Ascaris
suum
Trichuris
suis
Eimeria,
spp
Pre
treat-
ment
Post
treat-
ment
I 97.60% 96.86 % 89.25 % 7520 180
II 96.00 % 98.45 % 88.74 % 2500 100
The results are in agreement with Adugna et
al., 2007 whose findings reported that Albendazole
revealed a cure rate of 83.9% and egg reduction rate of
96.3% against Ascarislumbricoides. In spite of the
fact that anthelmintics remove the worms 100%
effectively it is very difficult to control Ascaris suum
due to its high reinfection rate, improper anthelmintic
dosing and lack of suitable sanitary measures. Kipper
et al., 2011 concluded that Ascaris suum infections in
pigs are mostly subclinical, .are often overlooked by
the concerned personnel.
In conclusion, the present study indicated that
despite the extensive use of anthelmintics, the GI
nematode infections in pigs were existing in the area..
Though Piperazine is generally effective against
ascariasis, Albendazole was equally effective and
economical against all internal parasites including
ascariasis. It is suggested to use Albendazole
judiciously and rotate with different antihelmenthics to
avoid drug resistance. To increase productivity of pigs
in the study area it is suggested that control of GI
nematodes be coupled with proper management
practices such as planned appropriate strategic
anthelmintic treatments and proper execution regular
and frequent removal of dung from sites along with
cleaning of floors with antimicrobials and premises. In
locals where community rearing of pigs is involved
pork is consumed by a large part of the population, they
shouldbe educated about the scientific rearing of pigs
and zoonotic potentiality of certain diseases. This study
gave a scope tostudy the possible impact of parasitic
infestations of pigs on public health in Hassan district.
REFERENCES
Adugna, S., Kebede, Y., Moges, F., Tiruneh, M., (2007).
Efficacy of mebendazole and albendazole for
Ascarislumbricoides and hookworm
infections in an area with long time exposure
for antihelminthes, Northwest Ethiopia.
Ethiopian Medical Journal,45, 3, 301-6.
Blood, D. C and Radosites, O. M. (1995). Veterinary
Medicine. A textbook of the diseases of
cattle, sheep, pigs goats and horses 8th
edn,
published by Bailliene Tindal London.
pp1016-1065.
Ebibeni, N., Chamuah, J.K., Raina, O.K., Sakhrie, A., Per
umal, Borkotoky, P.D., and Lily, N., (2013).
Prevalence of gastrointestinal parasites of pigs
in Dimapur district (Nagaland). Journal of
Veterinary Parasitology, 27, 57-58.
Keshaw, P. T., Alfred,C., Guillaume, B., Guillaume, V.,
Claude, D., Graeme, S. and Ravindra, N. S.,
(2009). Prevalence of intestinal parasites in
pigs in Grenada. West Indian Veterinary
Journal, 9,1,34-37.
Kipper, M., Andretta, I., Monteiro, S.G., Lovatto, P.A.
and Lehnen, C.R., (2011). Meta-analysis of
the effects of endoparasites on pig
performance. Veterinary Parasitology, 181,
316-320.
Lindsey D.S., Ernst lVand Current WL,(1984).
Prevalence of oocysts of Isosporasuisand
Eimeria spp. from sows on farms with and
without a history of neonatal coccidiosis.
JAVMA. 1984; 185:419-421.
Soulsby E. J. L. (1982). A textbook of helminths,
arthropods and protozoa of domesticated
animals. 7thedn, Balliere, Tindal and Casell.
Tomass,Z., Iman,E., Kifleyohannes,T., Tekle,Y., and
Weldu,K., (2013). Prevalence of
gastrointestinal parasites and cryptosporidium
species in extensively managed pigs in
Mekelle and Urban areas of southern zone of
Tigray, Northern Ethiopia. Veterinary
world, 6,7,433-439.
Yadav, A.K., and Tandon, V., (1989). Nematode
parasite infections of domestic pigs in a
sub-tropical and high-rainfall area of India.
Veterinary Parasitology,31,133-9.

Frontier J. Vet. Anim. Sci.Vol. 4, No. 2 (July-Dec.) 2015 107
*Part of M.V.Sc. Thesis submitted to KVAFSU, Bidar by First author 1Assistant professor, Department of Veterinary Medicine, Veterinary College, Hassan 2Dean, Veterinary College, Hebbal, Bangalore 3Associate professor, Department of Veterinary Medicine, Veterinary College, Bangalore 4Professor and Head, Department of TVCC, Veterinary College, Hassan 5Professor, Department of Veterinary Pathology, Veterinary College, Bangalore
Chronic kidney disease is one of the important
problems that causes considerable morbidity and
mortality in dogs. Majority of the old dogs suffer
some degree of kidney damage thus it is one of the
major causes of death in older animals. The
underlying cause of the disease may have occurred
previously and remains unknown in most cases.
The prevalence of renal disease is high in dogs and
cats especially in aged population (Polzin et al.,
2000). Kidneys are one of the vital organs in the
body which perform multiple functions to keep the
system in homeostasis. They get rid of the body
waste that are either ingested or produced by
metabolism. Renal failure is characterized by
decline of glomerular filtration rate. Renal failure
results when more than three quarters of nephrons
in both kidneys are not functioning. Renal function
tests, such as serum creatinine, blood urea nitrogen
and endogenous creatinine clearance rates are
indices of glomerular filtration rate. Serum
creatinine and urea concentrations are widely used
biochemical parameters for rapid estimation of
glomerular filtration rate. Recent studies reported
that microalbuminuria seems to be a good indicator
of early renal disease in dogs, particularly those
diseases that involve the glomerulus (x- linked
hereditary nephropathy, heart worm disease)
(Grauer et al., 2002 and Lees et al., 2002).
Continually improving veterinary care has resulted
in an expanding geriatric pet population and an
increasing need to identify and understand
conditions of importance in older animals. This
paper reports haemato-biochemical changes in dogs
suffering from renal failure by comparing them
with control and suspected cases of renal failure.
MATERIALS AND METHODS
The present study was conducted using three
groups of animals. Group-I (n=10) consisted of 10
healthy animals. Group-II (n=60) consisted of 60
suspected cases of renal failure. Group-III (n=10)
consisted of 10 renal failure cases. Cases were
selected based on history, physical examination,
hematology, biochemistry and urine analysis.
Blood was collected with and without
EDTA in vacutainers. Serum was separated and
used for estimation of blood biochemical
parameters immediately. Blood collected with
EDTA was used for various hematological studies
immediately after collection. Total leukocyte count,
Haemoglobin, Packed cell Volume and total
erythrocyte count were determined as per the
standard procedure outlined by Schalm et al.
(1975). Creatinine and BUN were measured by
Artos® biochemical semi auto analyzer using
commercially available kits. Urine sample was
Haemato-Biochemical Changes in Dogs Suffering from Renal Failure*
Kavitha1, K., Yathiraj
2, S., Ansar Kamran
3, Narayana Bhat
4, M. and Suguna Rao
5
Department of Veterinary Medicine, Veterinary College, Bangalore Received: 03 April, 2015; Accepted: 25 May, 2015
ABSTRACT
Kidney function tests are useful to detect the nature, magnitude and the extent of impairement of renal function. A
total of 80 dogs were investigated. Group I (n=10) consisted of healthy animals, Group II (n=60) consisted of
suspected cases of renal failure and non azotemic based on creatinine value (< 1.4 mg/dl) and Group III (n=10)
consisted of renal failure cases. The present study reports the changes in haematology, serum creatinine, Blood urea
nitrogen and microalbuminuria in these three groups. There was statistical significant difference in haemoglobin, PCV
and TEC in Group III when compared to Group I and Group II (P ≤ 0.05).There was a difference in TLC between
three groups and was statistically significant (P ≤ 0.05). Most important findings were the significantly increase in the
values of Creatinine, BUN and microalbuminuria values in renal failure dogs compared to healthy dogs.
Key words: Haematology, Renal failure, Kidney function test, Biochemical change

Frontier J. Vet. Anim. Sci.Vol. 4, No. 2 (July-Dec.) 2015 108
collected using sterile catheter in to sterile vials and
were processed. Microalbumin in urine was
estimated using commercially available human kit
by turbidometric immunoassay using Artos ®
biochemical semi auto analyzer. Statistical analysis
was performed using one way analysis of variance
and Tukey's multiple comparison test by using
Graph pad prism software.
RESULTS AND DISCUSSION
In the present study TLC in renal failure cases was
22.43 ± 4.023 × 10³
cells /µl, There was significant
statistical difference (P≤0.05) in the mean between
Group III and Group I. It is evident that there is
leucocytosis in renal failure cases. Increased white
blood cell count generally indicates the presence of
inflammation, which may either have an infectious
or a non infectious cause. In patients with renal
failure, leucocytosis often is mainly due to
inflammation in one or more organ system. When
leucocytosis is caused by inflammation within the
urinary system, the site of inflammation generally
is in parenchymal tissue rather than in the excretory
pathways (Osborne and Finco, 1995; Hurley, 1998).
Leucocytosis has been documented by Adin and
Cowgill (2000) in azotemic cases caused by
leptospirosis. Polysystemic diseases such as
bacterial endocarditis, leptospirosis and pyometra
which involve urinary system are often associated
with leucocytosis as indicated by Osborne et al.
(1972). There was a significant difference in the
total leukocyte count between Group I and Group
II. This may be because of infection that caused
leucocytosis. However, in the present study the
reason for leucocytosis could not be ascribed as the
work did not involve insight into etiological
aspects.
In the present study mean ± SE of
haemoglobin, PCV and TEC in renal failure cases
(Table 1) were 7.89 ± 0.52 g%, 25.20 ± 1.48 per
cent, 4.003 ± 0.25× 10⁶ cells /µl. There was a
statistical significant difference (P ≤ 0.05) noticed
in the haemoglobin, packed cell volume and total
erythrocyte count of renal failure cases to that of
normal dogs indicating anemia. These findings are
similar to that found by Robinson et al., (1989).
Anemia is a feature in CRF due to reduced
erythropoietin secretion Michell (1988); Polzin et
al. (1995), or decreased RBC life span, uremic
inhibitors of erytropoiesis and external blood loss
(Cowgill 1995, Osborne and Finco, 1995). Anemia
can also be seen in concurrent infection like
leptospirosis. There was no statistically significant
(P ≥ 0.05) difference in haemoglobin, PCV and
TEC between Group I and Group II.
Table I: Mean ± SE values of TLC, haemoglobin,
PCV and TEC in Group I, Group II and Group III
dogs.
Group I
(n=10)
Group II
( n=60)
Group III
( n=10)
F-
ratio
Total Leukocyte
Count (× 103
cells /µl)
8.005
± 0.68a
15.16
± 1.041b
22.43
± 4.023c
7.509**
Haemoglobin ( g%)
12.06 ± 0.65a
12.00 ± 0.27a
7.89 ± 0.52b 15***
Packed Cell
Volume (%)
43.00
± 2.4a
38.00
± 1a
25.00
± 1.5b 17***
Total Erythrocyte
Count
(× 106 cells /µl)
7.00 ± 0.40a
4.00 ± 0.25a
6.40 ± 0.17b 18***
*** Significant at 5 % level (P≤0.05)
Common superscript Row = ab
Means bearing any one common superscript in a row do
not differ significantly with each other.
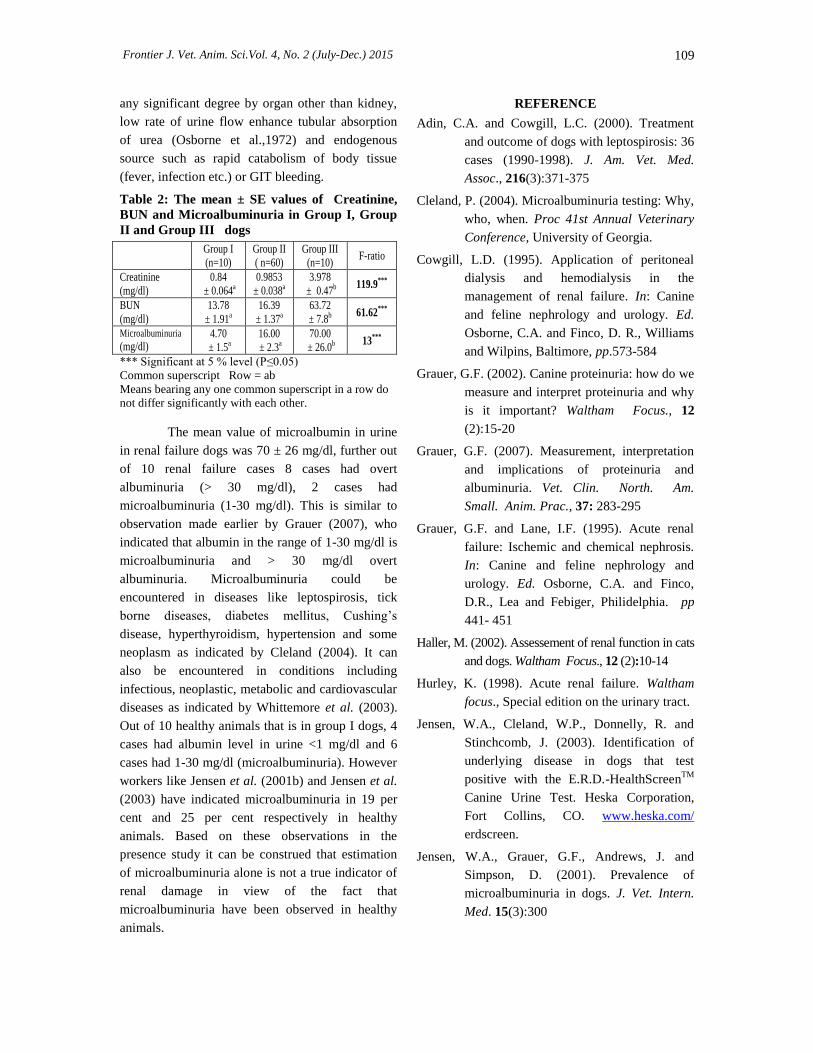
In the present study the mean ± SE of
Creatinine and Blood urea nitrogen in Group III
animals (Table 2)) were found to be 3.978 ± 0.47
mg/dl and 63.72 ± 7.8 mg/dl respectively, which is
much higher than Group I and indicates renal
damage. There was significant difference (P ≤ 0.05)
in mean of creatinine and BUN between Group III
and Group I. These findings are similar to the
observations made by Grauer and Lane, 1995 and
Haller, 2002.The finding of hypercreatinemia and
azotemia in dogs of Group III may be attributed to
the impaired filtration process as a consequence of
loss of physiological function of the nephrons.
About 70-75 % of the nephrons must be
nonfunctional before its values rise above the
normal range (Krawiec et al., 1986). Creatinine is
efficient for monitoring the progression of CRF or
the efficiency of treatment with the critical
difference of 0.4 mg/dl in the range of normal
values. The increased value of urea might be due to
the facts that urea cannot be utilized or excreted to
Frontier J. Vet. Anim. Sci.Vol. 4, No. 2 (July-Dec.) 2015 109
any significant degree by organ other than kidney,
low rate of urine flow enhance tubular absorption
of urea (Osborne et al.,1972) and endogenous
source such as rapid catabolism of body tissue
(fever, infection etc.) or GIT bleeding.
Table 2: The mean ± SE values of Creatinine,
BUN and Microalbuminuria in Group I, Group
II and Group III dogs
Group I
(n=10)
Group II
( n=60)
Group III
(n=10) F-ratio
Creatinine
(mg/dl)
0.84
± 0.064a 0.9853
± 0.038a 3.978
± 0.47b 119.9***
BUN
(mg/dl)
13.78
± 1.91a 16.39
± 1.37a 63.72
± 7.8b 61.62***
Microalbuminuria (mg/dl)
4.70
± 1.5a 16.00
± 2.3a 70.00
± 26.0b 13***
*** Significant at 5 % level (P≤0.05)
Common superscript Row = ab
Means bearing any one common superscript in a row do
not differ significantly with each other.
The mean value of microalbumin in urine
in renal failure dogs was 70 ± 26 mg/dl, further out
of 10 renal failure cases 8 cases had overt
albuminuria (> 30 mg/dl), 2 cases had
microalbuminuria (1-30 mg/dl). This is similar to
observation made earlier by Grauer (2007), who
indicated that albumin in the range of 1-30 mg/dl is
microalbuminuria and > 30 mg/dl overt
albuminuria. Microalbuminuria could be
encountered in diseases like leptospirosis, tick
borne diseases, diabetes mellitus, Cushing‟s
disease, hyperthyroidism, hypertension and some
neoplasm as indicated by Cleland (2004). It can
also be encountered in conditions including
infectious, neoplastic, metabolic and cardiovascular
diseases as indicated by Whittemore et al. (2003).
Out of 10 healthy animals that is in group I dogs, 4
cases had albumin level in urine <1 mg/dl and 6
cases had 1-30 mg/dl (microalbuminuria). However
workers like Jensen et al. (2001b) and Jensen et al.
(2003) have indicated microalbuminuria in 19 per
cent and 25 per cent respectively in healthy
animals. Based on these observations in the
presence study it can be construed that estimation
of microalbuminuria alone is not a true indicator of
renal damage in view of the fact that
microalbuminuria have been observed in healthy
animals.
REFERENCE
Adin, C.A. and Cowgill, L.C. (2000). Treatment
and outcome of dogs with leptospirosis: 36
cases (1990-1998). J. Am. Vet. Med.
Assoc., 216(3):371-375
Cleland, P. (2004). Microalbuminuria testing: Why,
who, when. Proc 41st Annual Veterinary
Conference, University of Georgia.
Cowgill, L.D. (1995). Application of peritoneal
dialysis and hemodialysis in the
management of renal failure. In: Canine
and feline nephrology and urology. Ed.
Osborne, C.A. and Finco, D. R., Williams
and Wilpins, Baltimore, pp.573-584
Grauer, G.F. (2002). Canine proteinuria: how do we
measure and interpret proteinuria and why
is it important? Waltham Focus., 12
(2):15-20
Grauer, G.F. (2007). Measurement, interpretation
and implications of proteinuria and
albuminuria. Vet. Clin. North. Am.
Small. Anim. Prac., 37: 283-295
Grauer, G.F. and Lane, I.F. (1995). Acute renal
failure: Ischemic and chemical nephrosis.
In: Canine and feline nephrology and
urology. Ed. Osborne, C.A. and Finco,
D.R., Lea and Febiger, Philidelphia. pp
441- 451
Haller, M. (2002). Assessement of renal function in cats
and dogs. Waltham Focus., 12 (2):10-14
Hurley, K. (1998). Acute renal failure. Waltham
focus., Special edition on the urinary tract.
Jensen, W.A., Cleland, W.P., Donnelly, R. and
Stinchcomb, J. (2003). Identification of
underlying disease in dogs that test
positive with the E.R.D.-HealthScreenTM
Canine Urine Test. Heska Corporation,
Fort Collins, CO. www.heska.com/
erdscreen.
Jensen, W.A., Grauer, G.F., Andrews, J. and
Simpson, D. (2001). Prevalence of
microalbuminuria in dogs. J. Vet. Intern.
Med. 15(3):300

Frontier J. Vet. Anim. Sci.Vol. 4, No. 2 (July-Dec.) 2015 110
Krawiec, D.R., Badertscher, R.R., Twardock, A.R.,
Rubin, S.I. and Gelberg, H.B. (1986).
Evaluation of 99m Tc-diethylenetriaminepenta
acetic acid nuclear imaging for quantitative
determination of the glomerular filtration
rate of dogs. Am. J. Vet. Res., 47 (10): 2175-
2179
Lees, G.E., Jensen, W.A. and Simpson, D.F.
(2002). Persistent albuminuria precedes
the onset of overt proteinuria in male dogs
with X- linked hereditary nephropathy. J.
Vet.Intern. Med., 16: 353
Michell, A.R. (1988). Renal function, renal damage
and renal failure. In: Renal disease in dogs
and cats. Ed. Michell, A.R., Blackwell
Scientific pub., London.pp5-29
Osborne, C.A. and Finco, D.R. (1995). Canine and
feline nephrology and urology. Williams
and Wilpins, Baltimore.
Osborne, C.A. and Finco, D.R. (1995). Canine and
feline nephrology and urology. Williams
and Wilpins, Baltimore.
Osborne, C.A., Donald, G.L. and Finco, D.R.
(1972). Laboratory findings in diseases of
urinary system. In: Canine and feline
nephrology and urology. Ed. Osborne,
C.A. Donald G.L., and Finco, D.R., W.B.,
Saunders Co., Philadelphia. pp 39-61
Polzin, D.J., Osborne C.A., Jacob, F. and Ross, S.
(2000). Chronic renal failure. In: Text
Book of Veterinary Internal Medicine.
Edt. Ettinger, S.J., Feldman, E.C., Edn. 5th
W.B. Saunders Company, Philadelphia.
pp 1633- 61
Polzin, D.J., Osborne, C.A., Bartges, J.W., James,
K.M. and Churchill, J.A. (1995). Acute
renal failure. In: Small animal internal
medicine. Edt. Ettinger, S. J. and Feldman,
E.C., vol II W.B., Saunders Co
Philadelphia. pp 1720-1760
Robinson, W.F., Shaw, S.E., Stanley, B., Huxtable,
C.R., Watson, A.D.J., Friend, S.E. and
Mitten. R. (1989). Chronic renal disease
in Bull Terrier. Aust. Vet. J., 60:
(7):193-195
Schalm, O.W., Jain, N.C. and Carroll, E.J.
(1975).Veterinary haematology 3rd
Ed.
Lea and Febiger, Philadelphia .
Whittemore, J.C., Jensen, W.A., Prause, L.,
Radecki, S., Gill, V. and Lappin, M.R.
(2003). Comparison of microalbuminuria,
urine protein dipstick, and urine protein
creatinine ratio results in clinically ill
dogs. J. Vet. Intern. Med., 17:437.

Frontier J. Vet. Anim. Sci.Vol. 4, No. 2 (July-Dec.) 2015 111
*Part of thesis of the first author submitted to KVAFSU Bidar (KS). 1Professor and Head, Dept of Gyn & Obst, Vet. College, Bangalore-24., 2Associate Professor, Dept of Gyn & Obst, Vet. College, Bangalore-24., 3Associate Professor, Dept of Gyn & Obst, Vet. College, Bangalore-24., 4Professor and Head, Dept of Animal Genetics and biostatistics, Vet. College, Banglore-24.,
In India over 54 millions goats are slaughtered
every year with an average meat yield of 9.63 kg
per goat. The annual population growth of goat has
been 0.22%. The goat population has increased
with an annual growth rate of 0.6% in spite of 38%
annual slaughter rate and approximately 15%
mortality. The rate in increase in goat population
during the last five decades has been the highest
among all ruminants. Among the states west Bengal
has the largest goat population of 18.77 million,
followed by Rajasthan (16.80 million), Uttar
Pradesh (12.94 million), Maharashtra (10.68
million), Bihar (9.49 million) and Karnataka (4.84
million) according to Livestock census India, 2003
Osmanabadi goat is an important
indigenous breed of the south western part of India
as per the Livestock census carried out in 2007. Its
estimated population is about 1.32 millions and is
extremely popular for its delicate meat. However,
many of its reproductive traits are still to be
documented. It was therefore the objectives of the
present study to establish the reproductive traits of
Osmanabadi goats and to make an effort to improve
the reproductive efficiency.
MATERIALS & METHOD
The data of various reproductive parameters of
Osmanabadi goats were generated from records
maintained at Tuljapur and Ambajogai goat farms
located at the border area of Maharashtra and
Karnataka state during the year 2005 to 2007. The
reproductive health records of 50 does at each farm
was selected and screened and clubbed together and
combined data was used to arrive the normal
reproductive parameter of the Osmanabadi does.
The normal reproductive parameters analysed were
age at puberty, weight at puberty, age at first
kidding, gestation period, postpartum anoestrus
period, inter-kidding period, frequency of single
and multiple births, frequency of ovarian cyclic
activity during the different months of the year and
distribution of kiddings during different month of
the year. Completely Randomized Design had been
used for the statistical analysis (Rangswamy, 2000).
The comparison of proportions was estimated by
chi-square test (Snedecor and Cochran 1968).
RESULTS AND DISCUSSION
The reproductive parameters studied in the
Osmanabdi goats reared in the border area of the
Karnataka and Maharashtra state were presented in
Table.
Age at puberty: the mean age at puberty was
recorded as 349.8±6.9 days and ranged between
180-510 days. Kamble et al. (2009) reported
similar findings 335.3±13.0 days while Lawer et al.
(2008) reported 219.34±0.72 days pubertal age in
Osmanabadi goats. Nevertheless the review of
available literature suggests that the puberty is a
breed dependent trait.
Reproductive Traits of Osmanabadi Goats in the Karnataka Maharashtra
Border Region
Bijurkar*, R.G., Krishnaswamy
1, A., Honnapa
2, T. G., Chandrashekhara Murthy
3, V.
and Jayashankar4, M. R.
Dept. of Veterinary Gynaecology and Obstetrics, Veterinary College, Hebbal, Bagngalore, KVAFSU, Bidar
Received: 18 November, 2014; Accepted: 20 April, 2015
ABSTRACT
The reproductive parameters like age at puberty, body weight at puberty, gestation period, age at kidding, post partum
anoestrus period, kidding interval, twinning and triplets ability of osmanabadi goats were studied and found to be
349.8±6.9 days, 17.45±0.23 kgs, 152.24±0.24 days, 494.4±8.1 days 67.34±6.31 days, 232.62±5.45 days, 11.99% and
0.75% subsequently. Breeding season was found to be about 4 months, commencing from the month of June and
extending up to September and the kidding season was extending from November to February.
Key words: Reproductive traits, Osmanabadi goat

Frontier J. Vet. Anim. Sci.Vol. 4, No. 2 (July-Dec.) 2015 112
Table: Reproductive traits of Osmanabadi goats
(n=100)
Sr.
No. Trait
Mean
with SE Range
1. Age at puberty
(Days) 349.8 ± 6.9 180-510
2. Weight at
puberty ( Kgs.) 17.45 ± 0.23 14.5-20.5
3. Gestation period
(Days) 152.24 ± 0.24 137-158
4. Age at first
kidding (Days) 494.4 ± 8.1 330-650
5.
Postpartum
anoestrus
period (Days)
67.24 ± 3.61 29-120
6. Interkidding
period (Days) 232.62 ± 5.45 181-310
7.
Frequency of
single and
multiple
births
Type of birth Obser-
vations
Single 233 (267)
(87.27%)
Twins 32 (267)
(11.99%)
Triplets 02 (267)
(0.75%)
Weight at puberty: In the present study puberty in
Osmanabadi goats occurred when the does attained an
average body weight of 17.45±0.23 kg. Smith (1997)
stated that, Angora goats should weigh 32-41 kgs
before being bred and recommended that breeding
should be delayed until the animal has attained 60% or
more of its adult body weight. It was also evident from
the study that the age at puberty ranged between 6-17
months and it is highly probable that Osmanabadi
goats attaining puberty at an early age had a better
growth rate resulting in a better body weight
cumulating in the onset of puberty.
Gestation period: The average gestation period in
Osmanabdi goats was determined as 152.24±0.24
days and it ranged from 137 to 158 days. The
average duration of gestation in goats is generally
reported as 147-155 days (Asdell, 1929).
Age at first kidding: The first kidding in
Osmanabadi goats occurred as early 330 days in
some does and as late as 650 days in few others.
The mean age at first kidding was determined as
494.4±8.1 days similar to the reports in other breeds
(Rao and Pattnayak, 2007).
Post partum anoestrus period: The average
duration of 67.34±6.31 days was recorded as
postpartum anoestrus period in the present study.
Reasonably close values are recorded in native
Katjang goats (92 days) by Devendra, (1962).
However, considerably lengthier postpartum
anoestrus period (120.70-137.92 days) was
recorded in Teddy goats (Azhar et. al.,1992) and
local Assam goats (Das et. al., 2004).
Inter-kidding period: The mean kidding interval
in Osmanabadi Does was recorded as 232.62±5.45
days and ranged between 181 to 310 days. A
similar kidding interval has been reported by
Markendeya and Devanagare (1997) in
Osmanabadi goats. Mabari goats also appear to
have a kidding interval similar to Osmanabadi does
(Raja and Mukundan, 1977). It was observed in the
present study that the average postpartum anoestrus
period in osmanabadi goats was only 67 days and it
perhaps was the major factor for Osmanabadi does
to have kidding interval of around 232 days.
Frequency of single and multiple births: In
Osmanabadi does, a majority of kidding resulted in
single births (87.27%) and with only 12.73 percent
of multiple births. Sahare et al.(2009) also recorded
a similar twinning ability in Osmanabadi goat under
farm conditions. The results of present study
suggested that the Osmanabadi does are not a breed
known for its high fecundity.
Breeding activity in Osmanabadi goats during
different months of the year: Osmanabadi does
appear to have distinct breeding season of about
four months commencing in the month of June and
extending up to September. During these months
77.19 percent does were observed to exhibit oestrus
activities. Wani et al. (1981) reported that more
than 50 percent of oestrus activity in Jamunapari
goats was observed in the month of June. Similarly
Misra et al. (1983) reported the breeding season of
Indian goats to be from June to October. The actual
time of onset and termination of cyclic activity
varies with several factors, including genetic
background, latitude and presence of male
(Bretzlaff, 1997). In these areas cyclicity is related
more to rainfall and nutrition.
Distribution of kiddings in Osmanabadi goats
during different months of the year: In the
present study found that 69.29 percent Osmanabadi
doe‟s kidding occurred between the month of

Frontier J. Vet. Anim. Sci.Vol. 4, No. 2 (July-Dec.) 2015 113
November to February as reported in Beetal goat
(Bhadulu and Prasad, 1987) and Jamunapari goats
(Wani et. al., 1980).
CONCLUSION
Osmanabadi goats reared in the Maharashtra
Karnataka border region had been analysed with
reproductive parameters and found that, the female
kids faced puberty at the age of 349.8±6.9 days
with 17.45±0.23 kgs body weight. The average
gestation period found was 152.24±0.24 days. The
mean age at first kidding was found to be
494.4±8.1days. The average duration of post
partum anoestrus was 67.34±6.31 days which was
responsible for short inter-kidding length which
shows high profile reproductive efficiency. The
mean kidding interval recorded as 232.62±5.45
days. Majority of kidding resulted in single births
(87.27%) and with only 12.73 percent of multiple
births. Breeding season was observed from the
month of June to September as a major while
kidding season was observed between the months
of November to February as a major.
REFERENCES
Asdell, S. A., 1929. Variation in the duration of gestation
in the goat. J.Agri. Sci. Cambridge; 19:382.
Azhar, M. S., Ahmad, M. K., Tahir, M. and Riaz,
M., 1992. Reproductive performance of
Teddy goats under local conditions. Pak.
J. Agril. Science, 29(3):230-232.
Bhadulu, S. K. and Prasad, R. B., 1987. Effect of
month and season on breeding and kidding
behavior of Barbari and Beetal goats in UP
Terai‟ Ind. J. of Dairy Sci., 11(2):346-347.
Bretzlaff, K., 1997. Control of the estrous cycle, In:
Youngquist RS, editor, Current Therapy in
Large Animal Theriogenology, Philadelphia:
WB Saunders & Co., 510-14.
Devendra, C., 1962. Upgrading of local goats by
the Anglo-Nubian at the federal
Experiment station, Serdang. Malaysian
Agricultural Journal, 43:265-280.
Kamble et al. (2009) cited in AGTR, website (Animal
Genetic Training Resource) ILRT
(International Livestock Resarch Institute),
SLV(Swedish University of Agricultural
Sciences)
Lawer et al.(2008) cited in AGTR, website (Animal
Genetic Training Resource) ILRT
(International Livestock Resarch Institute),
SLV(Swedish University of Agricultural
Sciences)
Livestock Census, 2007. Government of
Maharashtra Department of Staistics.
Markendeya, N.M. and Devanagare, A.A., 1997. XIV
annual convention and National symposium
on recent advances for enhancement of
reproductive efficiency in farm animals.
Nov. 14-16 held at Bidar (KS) pp. 94.
Misra, R. K., Gour, D. and Singh, D., 1983. Season
of breeding in relation to reproductive and
productive performance in Sirohi Doe.
Indian J. of Anim. Sci. 53 (5):567-569.
Raja, C. A. R. and Mukundan, G., 1977. Age at
first kidding, kidding rate and kidding
interval in Malabari cross goats. Kerala
Journal of Veterinary Science, 4 (2): 165-
169. Rao, P.K. and Pattanayak, G.R. 2007.
Reproductive performance of some
indigenous livestock of Orissa. Lead paper
presented in XXIII Annual Convention of
ISSAR & National Symposium 7th
-9th
December, 2007, OUAT, Bhubaneshwar,
India.pp 182-189.
Sahare, M. G., Sawaimul, A. D., Ali, S. Z. and
Kolte, B. R., 2009. Kidding percentage
and twinning ability in Osmanabadi goat
in Vidarbha climatic condition. Veterinary
world, 2(2):60-61.
Smith, M. C., 1997. Clinical reproductive anatomy
and physiology of doe. Current therapy in
large animal theriogenoloy: pp. 505-507.
Wani G. M., Sinha, N. K. and Sahni, K. L. 1980.
Note on postpartum oestrus in the
Jamnapari does. Indian Journal of Animal
Sciences, 50(8):663-665.
Wani G. M., Sinha, N. K. and Sahni, K. L. 1981. Note
on the seasonality of breeding behaviour in
Jamunapari does under tropical conditions.
ABA, 1981:49(11):766., abstr. No. 6436.

Frontier J. Vet. Anim. Sci.Vol. 4, No. 2 (July-Dec.) 2015 114
1Associate Professor, Dept of Vet. Gyn. & Obst. Vet. College, KVAFSU, Bidar. 2Professor & Head, Dept of Vet. Gyn. & Obst. Vet. College, KVAFSU, Bidar. 3Assistant Professor, Dept of Vet. Gyn. & Obst. Vet. College, KVAFSU, Bidar. 4Professor & Head, Dept. Of LPM, Vet. College, KVAFSU, Bidar. 5Associate Professor, Dept. Of LPM, Vet. College, KVAFSU, Bidar.
India is reach source of diverse ovine germplasm
with 74 million sheep, which constitutes as 6.8% of
world population (FAOSTAT 2010). There are 60
sheep breeds in India including well recognized,
lesser known and some wild species. Karnataka is
third largest sheep rearing state of India with 9.5
million sheep population (BAHS 2010). Kenguri is
purely mutton purpose breed of sheep and also
known as Tenguri (Tenguri the name of coat
colour, “Teng” meaning coconut).
Reproductive efficiency affects the overall
productivity as well as net returns of the sheep
rearing. Moaeen-ud-Din et al. (2008) stated that
reproductive efficiency of goats can be established
based on parameters such as number of live born
kids, mass of kids at birth and weaning, kidding
interval and duration of reproductive cycle.
Whereas Song et al. (2006) stated that reproductive
efficiency of goats is determined by age of goats at
first kidding, kidding interval, type of birth, litter
size and weight of kids at birth and weaning. There
is paucity of literature on the reproductive
performance of the Kenguri ewes. Hence the
present study was conducted to record the
reproductive parameters of Kenguri sheep.
MATERIALS AND METHODS
Total of 50 Kenguri sheep maintained at Veterinary
College, Bidar were studied for their reproductive
traits. Animals were observed for birth weight, age
at puberty, weight at puberty, oestrus, oestrus cycle,
breeding season, gestation period and interlambing
period and observations were documented. Animals
maintained at University farm with all scientific
managemental practices were carefully studied to
record proper reproductive data. Observations were
tabulated and interpretated.
RESULTS AND DISCUSSION
Reproductive parameters were recorded in Kenguri
ewes and analysed. Average birth weight of
Kenguri lamb was found to be 2.26±0.04 with the
range of 1.90 to 2.60 kgs (n=37). Birth weight of
Marwari sheep lambs was 2 to 3 kgs irrespective of
sex (Verma et. al., 2005), whereas birth weight in
Mecheri sheep was observed as 2.18 to 2.30 kgs
(Thiruvenkadan et. al.,2008).
Age at puberty of female lamb was
observed to be 300.6±3.52 days with the range of
280 to 328 (n=20) age at puberty in Marwari sheep
documented by Verma et al. (2005) was 18-24
months where as Rajanna et al. (2012) found it to
be 610.00±3.81 days in Nellore ewes. Average
body weight at pubertal age was found to be
25.5±0.40 kg with the range of 22 to 29 kgs (n=20).
Oestrus signs were observed in 46 Kenguri
ewes. Predominantly external signs were recorded
as swollen vulva and a transparent thick discharge
at the vulval opening. In the estrus behaviour, ewes
which were in oestrus were found to be isolated
from the flock. Mamming (vocal sound) was
observed frequently to attract the male and frequent
Reproductive Traits of Kenguri Ewes
Bijurkar1, R. G., Tandle
2, M. K., Khaja
3, M., Jadhav
4, N. V. and Waghmare
5, P. G.
Veterinary College, Nandinagar, KVAFSU, Bidar
Received: 18 November, 2014; Accepted: 20 April, 2015
ABSTRACT
The present study on reproductive traits of Kenguri sheep was carried out at the veterinary college, Bidar, KVAFSU
campus. Reproductive traits like birth weight, age at puberty, weight at puberty, oestrus duration, oestrus cycle length,
breeding season, gestation period, lambing period and lambing interval were studied and found to be 2.26kg, 300 days,
25.5 kg, 18-26 hrs, 17 days, June to October, 148 days, November to December and January and 215 days
subsequently.
Key words: Kenguri sheep, reproductive traits.

Frontier J. Vet. Anim. Sci.Vol. 4, No. 2 (July-Dec.) 2015 115
urination was evident. Ewes which were in oestrus
found restless and showed reduced feed intake.
Upon teasing by ram, ewes were static and
accepting the ram to get mounted. Teasing and
mounting by ram was observed throughout the day
of oestrus with interval of half to one hour. Oestrus
signs and acceptance of male was found up to 18-
26 hrs. The oestrus duration in Marwari sheep was
24 hrs as reported by Verma et al. (2005).
The average length of oestrus cycle was
observed to be 17 days (16-19) (n=10). Major
breeding activities were observed in month of June
and July (n=30). At the same time minor breeding
activities were also observed in the months of
August to October. The average gestation period
was found to be 148.97±0.21 days with the range of
146 to 151 days in Kenguri ewes (n=37).
The peak lambings were observed in
November and December months and least
lambings were observed in January month in the
present study. The lambing period in Mecheri sheep
was reported between September and February
months by Thiruvenkadan et al. (2008).
Average lambing interval in Kenguri
sheep was as 215.25±5.24 days with the range of
186-265 days (n=20). The lambing interval in
Sangamneri strain of Deccani ewes was reported
256.40±4.63 days by Mandakmale, (2013) but
292.58±2.56 days in Telangana region by Rajanna
et al. (2013). Verma et al. (2005) found 300 to 365
days lambing interval in Marwari sheep.
CONCLUSION
In the present study, reproductive traits have been
recorded viz. Birth weight of lamb (2.26 kg), age at
puberty (300 days), weight at puberty of female
lamb (25.5 kg), oestrus duration (18-26 hrs),
oestrus cycle length (17 days), breeding season
(June to October), gestation period (148 days),
lambing period (November to January) and
lambing interval (215 days). Present paper puts
on record important information on reproductive
record of Kenguri ewes and it is necessary to
record field data regarding the similar
reproductive parameters.
REFERENCES
BAHS- Basic Animal Husbandry Statistics (2010):
Department of Animal Husbandry, Dairing
& Fisheries, Ministry of Agriculture, Govt.
of India. Krishi Bhavan, New Delhi.
Mandakmale, s. D., Birari, D. R., Shinde, S. D. and
Sakhare, P. S. 2013. Effect of nongenetic
factors on reproductive performance of
Sangamneri strain of Deccani sheep.
Indian Journal of Small Ruminants 2013
19: 83-84.
Rajanna, N., Mahendar, M., Raghunandan, T.,
Sreenivasarao, D., Nagalakshmi, D. and
Thammiraju, D. 2012. Reproductive
performance of Nellore sheep in different
agroclimatic zones of Telangana. Animal
Science Reporter, 6 (4): 142-145.
Thiruvenkadan, A. K., Chinnamani, K.,
Muralidharan, J. And Karunanithi, K.
(2008). Effect of non genetic factors on
birth weight of Mecheri sheep of India.
Livestock Research For Rural
Development, Vol. 20, Article#96.
http://www.lrrd.org/lrrd20/6/thir20096.htm.
Verma, P. K., Joshi, Anil, Kumar Satish, Maurya,
V. P., Gulyani, R., Mittal, J. P. (2005).
Reproductive performance of Marwari
sheep reared by farmers in hot arid
environment . The Indian Journal of Small
Ruminants Year: 2005, 11(2).

Frontier J. Vet. Anim. Sci.Vol. 4, No. 2 (July-Dec.) 2015 116
* Part of Ph.D thesis submitted by first author to TANUVAS. 1Associate Professor, Department of Veterinary Microbiology, N.T.R.College of Veterinary Science, SVVU, Gannavaram (Andhra Pradesh) – 521102, E-mail : [email protected] 2 Retired Director, Centre for Animal Health Studies, TANVASU, Madhavaram milk colony, Madhavaram,Chennai (Tamil Nadu)
– 600051, India. 3 Professor and Head, Department of Veterinary Public Helath and Epidemiology, Veterinary College and Research Institute,
Orathanadu (Tamil Nadu) - 614625, India. 4Professor, Leptospira Laboratory, TANVASU, Madhavaram milk colony, Madhavaram,Chennai (Tamil Nadu) – 600051, India. 5 Retired Dean, Madras Veterinary College, Tamil Nadu Veterinary and Animal Sciences University, Vepery, Chennai (Tamil
Nadu) – 600007, India.
Chicken anaemia virus (CAV) was first isolated
from the contaminated Marek‟s disease vaccine
(Yuasa et al., 1979), belonging to family
Circoviridae, genus Gyrovirus and an emerging
viral pathogen of poultry. Chicken anaemia virus
causes disease in flocks between 2-4 weeks of age.
In these infected flocks, growth is retarded and
mortality is generally between 10-20% (Engstorm,
1988; Chettle et al., 1989a; Brentano et al., 1991
and Connor et al., 1991). This immunosuppressive
viral disease brings about loss to the farming
community directly or indirectly. The direct losses
can be attributed to the mortality which in turn
depends on the age and breed of the birds, dose of
inoculum and presence or absence of passive
immunity. Indirect losses are due to the acquired
immunodeficiency, impaired growth or interaction
following co-infection. The virulence of Marek‟s
disease virus (MDV) is enhanced by CAV and the
pathogenicity of CAV is increased by dual infection
with IBDV. The immunosuppression caused by
CAV and / or IBDV lead to the infection of
hydropericardium syndrome virus (HPSV), which
is sometimes considered as opportunistic pathogen
(van den Berg, 1995). But, chicks develop
resistance to experimentally induced disease due to
CAV as age advances. This age resistance may be
due to ability of the bird to develop humoral
antibody (McNulty, 1991) and lack of specific
target T cell – immature thymocytes. As a
consequence of CAV infection, average weight per
bird was lowered by 3.3% and average percentage
mortality was more than 2% higher than that of
unaffected flocks (McIlroy et al., 1992). This
infection can be controlled by transferring maternal
antibodies to hatchlings, so that conferring
resistance to CAV till bird develops age- resistance.
Hence, a serological assay which gives valid
Development of Single Serum Dilution ELISA and Flow Through Assay Using
Chicken Anaemia Virus VP1 Recombinant Antigen*
Subramanyam, K.V1., Purushothaman, V
2., Manoharan, S
3., Ravikumar, G
4.
and Muralimanohar, B5.
Department of Veterinary Microbiology, Madras Veterinary College, TANVASU, Vepery,
Chennai (Tamil Nadu) – 600007, India. Received: 03 December, 2014; Accepted: 29 May, 2015
ABSTRACT
The antibody status of breeder flock is important in assessing the level of protection conferred on hatchlings through
maternal antibodies. The single serum dilution ELISA (SSD ELISA) developed is statistically validated and reduces
the cost of reagents and saves time. The chicken anaemia virus (CAV) VP1 ORF3 recombinant clone was constructed
in pPROEXHTb plasmid and expressed in DH5α E.coli. The recombinant plasmid was analyzed with regard to size,
PCR amplification, sequencing of PCR product, restriction enzyme digestion using Sal I and Xho I enzymes and
immuno blotting. A positive negative threshold (PNT) line was developed using 10 negative serum samples. The
formula for prediction of titre was developed using 51 serum samples by subtraction method. The correlation
coefficient at 1:1000 dilution of serum is 0.90 and other constants viz., slope and intercept were 0.06 and 0.106
respectively. With developed prediction formula, 302 serum samples were screened for the presence of CAV
antibodies at 1: 1000 dilution of serum. A flow through assay was developed for the detection of recombinant viral
antigen and the assay was able to detect 3 µg/µl of CAV antigen.
Key words: CAV – Recombinant Antigen – SSD ELISA – Flow through assay

Frontier J. Vet. Anim. Sci.Vol. 4, No. 2 (July-Dec.) 2015 117
information regarding breeder flock immune status
helps to develop hyperimmunization schedule and
to transfer good quality maternal antibodies. The
indirect enzyme linked immunosorbent assay
(ELISA) helps in the determination of antibody
titres and such an assay if performed at single
serum dilution, saves reagents and time instead of
performing the assay at different dilutions and
assessing the titre.
MATERIALS AND METHODS
The chicken anaemia virus VP1 protein clones
obtained from the Department of Animal
biotechnology, Madras Veterinary College,
Chennai were used for the recombinant antigen
production. The clones received from department of
Biotechnology were further confirmed for presence
of CAV gene by analyzing plasmid profile, PCR
amplification, restriction enzyme digestion and
sequence analysis. The VP1 clones of CAV gene
was constructed in pPRO EX HT b vector and
expressed in E.coli DH5α by inducing the cultures
with isopropylthio-β-D-galactoside (IPTG) (1mM
concentration), after attaining approximately an OD
of 0.4 to 0.6 at 560 nm in Luria-Bertani (LB) broth.
Initially at hourly intervals the aliquots from LB
broth were collected up to 5 hours and the aliquots
were analyzed by sodium dodecyl sulphate
polyacrylamide gel electrophoresis (SDS-PAGE)
for the expression of proteins. The expressed VP1
protein was purified by using the Ni-CL (Nickel)
agarose column (M/s Bangalore Genei, Bangalore;
No. PC137). The expressed VP1 protein of CAV
was produced in bulk in LB broth and the cell
lysate was suspended in PBS (pH 7.2). The lysate
was subjected to sonication and again centrifuged at
5000 rpm for 30 min. The supernatant was
collected and subjected for purification in above
column. For the purification of VP1 protein linear
gradient of buffer from pH 5.8 to 3.8 was used and
1 ml fractions were collected. The fractions were
analyzed by PAGE for molecular weight and the
fractions showing the suitable molecular weight
were pooled, concentrated, protein content was
estimated and stored in -60oC for further use as
antigen. The recombinant antigen was analyzed for
immunodominant protein by Western blot
(Burnette, 1981). The Western blot analysis of
CAV VP1 recombinant protein was performed
using CAV specific antiserum (CR Laboratories,
USA). Later, for the detection of antibodies to CAV
an indirect ELISA was followed with modifications
(Otaki et al., 1991).
Estimation of PNT line: The positive negative
threshold line to find out the titre was carried out as
per the procedure (Snyder et al., 1983). For
construction of PNT line ten serum samples, which
were negative by dot ELISA, were selected. Serial
dilutions of the ten sera were made viz., 500, 1000,
2000, 5000, 10000, 50000 and 100,000 and indirect
ELISA was performed. The resultant OD values
were plotted on Y-axis against dilutions in X-axis.
The resultant line is referred as PNT line and used
for finding out the observed titre (OT).
Estimation of observed titre (OT): The OT of 51
serum samples was calculated using the subtraction
method (OD value for sample – OD value of
conjugate control) as specified (Snyder et al., 1983)
using the PNT line. The point where the sample
line cuts the PNT line is taken as titre of the
sample.
Development of titre calculation formula: The
formula to find out the titre from single serum
dilution instead of serial logarithmic dilution was
developed by applying the principle of linear
regression. The procedure described briefly, the OD
values obtained for every logarithmic dilution was
compared with OT and correlation coefficient was
obtained. The dilution that gave maximum positive
correlation was selected for predicting the titre from
that dilution. The other parameters like slope and
intercept were arrived by plotting a scatter chart
with OD values in Y-axis and OT in X-axis. The
linear regression formula Y=ax+b is reversed as
x=(y-b)/a to find out the log titre and antilog of titre
is referred as predicted titre of the sample.
Single serum dilution: The log ELISA titres were
arrived by applying the formula. The log10 titre =
(Corrected absorbance + 0.106)/ 0.06 and the titre =
antilog (log10 titre).
Flow through assay for detection of VP1 protein:
After production of hyperimmune serum for VP1
recombinant protein in rabbits, flow through assay
for the detection of CAV antigen was performed as

Frontier J. Vet. Anim. Sci.Vol. 4, No. 2 (July-Dec.) 2015 118
per the method described with modifications (Wang
et al., 2005). The cellulose acetate membrane (mdi,
Ambala Cantt) was placed above the absorbent
pads in a flow through module. One µl (3 µg / µl)
of CAV recombinant antigen was placed in the
middle and 1 µl of rabbit serum was placed in a
corner which acted as control. The membrane was
dried in an incubator at 37oC for 1 hour.
The membrane was washed twice with 200
µl of wash buffer and allowed to be absorbed
through the membrane. Then, 200 µl of 1:10 diluted
anti rabbit serum in wash buffer was added and
allowed to be absorbed through the membrane. The
membrane was washed again twice with wash
buffer. Followed by 200 µl of wash buffer diluted
(1:2) protein A colloidal gold conjugate was added
and allowed to be absorbed through the membrane.
The membrane was washed again twice with wash
buffer and appearance of pink color dot indicated
presence of antigen.
RESULTS AND DISCUSSION
The extracted plasmid DNA from the recombinant
clones was approximately 6 kbp in size which
comprises pPROEX HT b vector with a size of
approximately 4779 bp and insert of CAV –VP1
amplicon of approximately 1360 bp size. The
pPRO EX HT prokaryotic expression system was
designed for the expression of foreign protein in
E.coli. The protein was expressed as a fusion
protein to 6-histidine sequence for affinity
purification. The recombinant clone was made
expressed by inducing with IPTG at a concentration
of 1mM and observed to be maximum at 4-5 hours
after induction. The expressed recombinant protein
of CAV VP1 was further purified by using Ni-CL
agarose column and by linear gradient pH elution
from 5.8 to 3.8. The maximum elution of purified
protein took place with pH 5.8 of elution buffer and
all the fractions at this pH were pooled and
concentrated to make a final volume of one ml. The
purified protein was analyzed by SDS-PAGE
(Fig.1) which revealed 51 kDa band and these
findings are in agreement with other workers (Todd
et al., 1990). The Western blot analysis of CAV
VP1 recombinant protein blotted on nitrocellulose
membrane, after reacting with CAV antiserum
showed a single band with a size of 51kDa (Fig. 2).
Similar findings with CAV VP1 gene recombinant
protein expressed in prokaryotic system were
reported (Noteborn et al., 1992; Todd et al., 1990
and Pallister et al., 1994). In the present study, the
E.coli cells growth after attaining an OD of
approximately 0.4 to 0.6 at 560 nm was induced
with 1 mM IPTG. This is in agreement with other
workers (Pallister et al., 1994 and Dantas et al.,
2007). The expressed protein after induction was
analyzed by SDS-PAGE. The region of interest was
the largest ORF-3 which coded for a potential
protein of 51 kDa. The recombinant protein was
expressed as a fusion protein to 6-histidine
sequence for affinity purification. As the
recombinant protein was having the tag of histidine,
that could be purified alone by using affinity
purification. The Ni-CL agarose columns purified
the recombinant proteins effectively. In the present
study, the recombinant protein was eluted serially
from range of buffer pH from 5.8, 4.8 and 3.8. But,
maximum protein was eluted at pH 5.8 and scanty
at 4.8. This was confirmed by SDS-PAGE analysis
of fractions collected at different pH. This
expression of proteins is a useful method for
obtaining proteins in bulk that can be used further
in diagnostic laboratories. This recombinant
proteins production reduces the risk of handling
organisms in vitro. Some organisms may revert to
virulence or can change the virulence pattern while
handling in the laboratories. Some organisms
cannot be cultivated in vitro due to many reasons.
One of such problem faced during this present
study was difficulty in getting the chicken
lymphoblastoid cell line (MSB1) that allows the
growth of CAV. This cell line was difficult to
maintain and not available in India. This made the
workers difficult to work with CAV. Unlike the
native virus, the recombinant proteins will not react
nonspecifically in serological assays. The PCR
product was purified and used for sequence
analysis. The CAV isolate used for this study was
named as MIBTANUVAS and the NCBI, Gen bank
accession number obtained was EU 661362. The
PNT line was constructed using ten serum samples
which are negative for CAV antibodies by dot
ELISA (Fig.3).

Frontier J. Vet. Anim. Sci.Vol. 4, No. 2 (July-Dec.) 2015 119
Single serum dilution: The dynamic working
range with regard to antigen and conjugate was
determined by checker board titration. By this
titration, coating antigen of CAV was found to be
7.5 ng / µl and the conjugate was 1 in 3000. By
PNT line the correlation coefficient at 1: 1000 was
0.90, and which was more than that of all other
dilutions. Hence, 1:1000 was preferred to predict
the titre. The other two constants required to predict
titres from serum dilution of 1:1000 viz., slope (A)
and intercept (B) were estimated by drawing a
scatter chart (Fig.4). The slope and intercept were
0.06 and 0.106 respectively. For prediction of titres
formula was developed using 51 serum samples.
After developing the prediction formula, 302 serum
samples were screened for the presence of CAV
antibodies at 1: 1000 dilution of serum. In the
present study, an indirect ELISA to detect the CAV
antibodies was standardized. In this assay
recombinant protein was used as coating antigen.
The purified recombinant antigen did not give any
non-specific reaction in plate ELISA as the
purification of recombinant protein using nickel
column affinity chromatography had allowed only
elution of the recombinant protein as this was
having His tag and enabled to avoid the non-
specific reactions. The virus isolation is possible,
but usually not recommended as it is time-
consuming and expensive (McNulty, 1991).
Although the virus neutralization test (VNT) is
more sensitive than other tests, it is cumbersome
and it cannot be performed on large numbers of
samples. For the first time single serum dilution
ELISA was developed and standardized using
recombinant protein as antigen. The developed
ELISA reduced the cost of reagents, time and
interpretation of results was easy (Snyder et al.,
1983). The single serum dilution ELISA was highly
useful for screening breeder flock samples which
helped in assessment of flock status and there by
the vertical transmission of the CAV infection
could be checked.

Frontier J. Vet. Anim. Sci.Vol. 4, No. 2 (July-Dec.) 2015 120
Flow through assay for VP1 protein detection:
For the first time flow through assay was used to
detect the CAV antigen. This assay was able to
detect 3 µg / µl of purified recombinant protein
(Fig. 5). This assay highly useful to detect CAV
antigen, within no time and can be performed at
farm premises. The result can be interpreted very
easily without any technical expertise and
equipment.
CONCLUSIONS
The single serum dilution ELISA was standardized
using recombinant antigen of CAV VP1. The PNT
baseline was constructed using different field serum
samples and the formula to predict the titre from
single serum dilution was developed. The single
serum dilution ELISA for CAV found to be 1:1000.
By using developed SSD ELISA, 42 serum
samples can be screened at a time. Flow through
assay for the detection of recombinant viral antigen
was developed. This is an ideal pen-side test for the
detection of antigen. This assay is easy to perform
and not requiring any sophisticated instruments. By
using this test 3 µg/µl concentration of recombinant
antigen could be detected.
REFERENCES
Brentano, L.N., N. Mores, I. Wentz, D.
Chandratilleke and K. A. Schat, (1991).
Isolation and identification of chicken
anaemia virus in Brazil. Avian Dis., 35:
793-800.
Burnette, W.N. (1981). “Western blotting”
electrophoretic transfer of proteins from
sodium dodecyl sulphate polyacrylamide
gels to unmodified nitrocellulose and
radiographic detection with antibody and
radio iodinated protein A. Anal.Biochem.
112: 195-203. Cited in Development of
molecular diagnostics for infectious bursal
disease. Ph.D thesis submitted by
J.Hudson Taylor to Tamil Nadu Veterinary
and Animal Sciences University, Chennai.
Chettle, N.J., R.K.Eddy, P.J.Wyeth and S.A.Lister
(1989). An outbreak of disease due to
chicken anaemia agent in broiler chicken
in England. Vet.Rec., 124: 211-215.
Connor, T.J., F.McNeily, G.A.Firth and
M.S.McNulty (1991). Biological
characterization of Australian isolates of
chicken anaemia agent. Aust.Vet.J., 68:
199-201.
Dantas, N.E.O., A.J.Ferreira, C.S.Astolfi-Ferreira
and L.Brentano (2007). Cloning and
expression of chicken anaemia virus VP3
protein in Escherichia coli.
Comp.Immunol.Microbiol. Infect.Dis., 30:
133-142.
Engstorm, B.E. (1988). Blue wing disease of
chickens: Isolation of avian reovirus and
chicken anaemia agent. Avian Pathol., 17:
23-32.
McIlroy, S.G., M.S.McNulty, D.W.Bruce,
J.A.Smyth, E.A.Goodall and M.J.Alcorn,
(1992). Economic effects of clinical
chicken anaemia agent infection on
profitable broiler production. Aviaan Dis.,
36: 566-574.
McNulty, M.S. (1991). Chicken anaemia agent: a
review. Avian Pathol., 20: 187-203.
Noteborn, M.H.M., C.A.J.Verschueren, D.J.Van
Roozelaar, S. Veldhamp, A.J. Van Der Eb
and G.F.De Boer (1992). Detection of
chicken anaemia virus by DNA
hybridization and polymerase chain
reaction. Avian Pathol., 21: 107-118.
Frontier J. Vet. Anim. Sci.Vol. 4, No. 2 (July-Dec.) 2015 121
Otaki, Y., Saito.K, Tajima.M and Nomura.Y.
(1991). Detection of antibody to chicken
anaemia agent : a comparison of three
serological tests. Avian Pathol., 20: 315-
324.
Pallister, J., Fahey.K.J. and Sheppard.M. (1994).
Cloning and sequencing of chicken
anaemia virus (CAV) ORF-3 gene, and the
development of an ELISA for the
detection of serum antibody to CAV.
Vet.Microbiol., 39: 167-178.
Snyder, D.B., Marquardt.W.W., Williams.E.T. and
Russel.E. (1983). Rapid serological
profiling by enzyme linked
immunosorbent assay. Measurement of
antibody activity against the New castle
disease in a sigle serum dilution. Avian
Dis., 27: 161-170.
Todd, D., Creelan.J.L., Mackie.D.P, Rixon.F and
McNulty.M.S (1990a). Purification and
biochemical characterization of chicken
anaemia agent. J.Gen.Virol., 71: 819-823.
Wang, S.C., Zhang and Zhang.Y. (2005).
Development of a flow-through enzyme
linked immunosorbent assay and a dipstick
assay for the rapid detection of insecticide
caraxyl. Acta.Chimika.Actai. 535: 219-
225. Cited by G.Venkatesh. Development
of recombinant antigens for diagnosis of
avian mycoplasmosis.Ph.D thesis
submitted to Tamil Nadu Veterinary and
Animal Sciences University, Chennai.
Yuasa. N., Taniguchi.T. and Yoshida.I. (1979).
Isolation and some characteristics of an
agent inducing anaemia in chicks. Avian
Dis., 23: 366-385.
Frontier J. Vet. Anim. Sci.Vol. 4, No. 2 (July-Dec.) 2015 122
* Part of Ph.D thesis submitted by first author to TANUVAS. 1Associate Professor, Department of Veterinary Microbiology, N.T.R.College of Veterinary Science, SVVU, Gannavaram
(Andhra Pradesh) – 521102, E-mail : [email protected] 2 Retired Director, Centre for Animal Health Studies, TANVASU, Madhavaram milk colony, Madhavaram,Chennai (Tamil Nadu)
– 600051, India. 3 Professor and Head, Department of Veterinary Public Helath and Epidemiology, Veterinary College and Research Institute, Orathanadu (Tamil Nadu) - 614625, India. 4Professor, Leptospira Laboratory, TANVASU, Madhavaram milk colony, Madhavaram,Chennai (Tamil Nadu) – 600051, India. 5 Retired Dean, Madras Veterinary College, Tamil Nadu Veterinary and Animal Sciences University, Vepery, Chennai (Tamil
Nadu) – 600007, India.
Hydropericardium syndrome virus is an adenovirus
infection causing “Angara disease” and an
emerging poultry syndrome with high mortality. It
was first reported in broilers at Angara Goth,
Karachi of Pakistan (Khawaja et al., 1988; Anjum
et al., 1989). The etiological agent of
hydropericardium syndrome has been identified as
a group I aviadenovirus and serotype 4 (Chandra et
al., 1997). The Indian isolates of inclusion body
hepatitis-hydropericardium syndrome (IBH-HPS)
of poultry from different geographical parts of the
country were typed as serotype 4 (Jadhao et al.,
1997). In India, the disease was first noticed in
poultry farms of Jammu in 1994, and the condition
was known as “Leechi disease” because of the heart
lesions resembling skinned Leechi fruit.
Subsequently, the condition was reported from
Punjab and Delhi (Sreenivas Gowda and
Satyanarayana, 1994), West Bengal (Bhowmik,
1996), Himachal Pradesh (Asrani et al., 1997) and
Uttar Pradesh (Ravikumar et al., 1997).
The disease commonly occurs among
broilers (Shane, 1996) and broiler breeders (Anjum
et al., 1989; Toshiaki Abe et al., 1998). However,
sporadic incidences of hydropericardium syndrome
have also been reported among layer poultry
(Anjum et al., 1989; Qureshi, 1997; Shukla et al.,
1999). Moreover, adenoviruses are ubiquitous in
nature. The different species and strains of
adenoviruses, can rapidly be opportunistic when the
health of the bird is compromised as in co-infection
with other pathogens like chicken anaemia virus
(CAV) or infectious bursal disease virus (IBDV).
The immunosuppression caused by CAV and / or
IBDV lead to the infection of hydropericardium
syndrome virus (HPSV), which is sometimes
considered as opportunistic pathogen (van den
Berg, 1995). The maternally derived protection of
hatchlings in the form of antibodies is very
important till they develop resistance. If the
protection conferred by maternal antibodies is
good, the vaccination programme can be
Standardization of Single Serum Dilution ELISA and Flow through Assay for
Hydropericardium Syndrome Virus in Poultry
Subramanyam, K.V1., Purushothaman, V
2., Manoharan, S
3., Ravikumar, G
4.
and Muralimanohar, B5.
Department of Veterinary Microbiology, Madras Veterinary College, TANVASU, Vepery,
Chennai (Tamil Nadu) – 600007, India.
Received: 03 December, 2014; Accepted: 29 May, 2015
ABSTRACT
The hydropericardium syndrome virus (HPSV) antigen after purification was used as coating antigen for single serum
dilution Enzyme Linked Immunosorbent Assay (SS ELISA) and flow through assay (FTA). The HPSV was purified
and characterized with regard to viral proteins. The single serum dilution ELISA was developed for HPSV at 1:1000
dilution of serum and for prediction of titres formula was evolved based on testing 77 serum samples. The other two
constants required to predict titres from serum dilution of 1:1000 viz., slope (A) and intercept (B) were 0.041 and
0.027 respectively. After development of formula for prediction of titre, 302 serum samples were screened and the
observed and predicted titres were in agreement. The flow through assay was developed for the detection of viral
antigen and this could detect 200 ng/ µl of purified viral protein. The developed SS ELISA saves reagents by diluting
serum samples at a particular dilution and 42 serum samples can be screened in a single plate. The FTA can be
employed at the farm level, without much expertise and equipment for detection of virus.
Key words: HPSV – Purification – SS ELISA – Flow through assay

Frontier J. Vet. Anim. Sci.Vol. 4, No. 2 (July-Dec.) 2015 123
rescheduled, or sometimes in case of good maternal
antibody level, one dose of the vaccine can be
avoided. This helps both the bird and the farmer, as
the bird is relieved from the vaccination stress and
at the same time the farmer can avoid expenditure
on vaccine. In this direction, to monitor the immune
status of breeder flocks, a SS ELISA for antibody
titre and FTA for antigen detection were developed.
MATERIAL AND METHODS
The HPS virus used in the present study was an
isolate from a field outbreak in the Coimabatore
area of Tamil Nadu. The hydropericardium
syndrome virus antigen was prepared from liver
tissues of affected chicken (Roy et al., 2001). Fifty
and twenty five per cent liver tissues were prepared
in PBS (pH 7.4) and thoroughly mixed with
chloroform (4:1). After 15 minutes, the mixtures
were centrifuged and clear supernatants were used
for further work. The presence of virus was
confirmed by agar gel immunodiffusion and
counter immunoelectrophoresis (Roy et al., 2001)
with antiserum obtained from Central University
Laboratory, Madhavaram, TANUVAS, Chennai.
Isolation in cell culture: The liver samples which
were reacted positive by both AGID and CIE were
used for the virus isolation after treating with
antibiotics viz., Penicillin -10,000 units / ml,
Streptomycin - 10 mg/ml and Gentamicin - 250
μg/ml and kept at 370C for 2 hrs. Then antibiotic
treated material was filtered through 0.22 μm filter
and aliquoted into 0.5 ml and stored at -700C. For
the isolation of HPSV in cell culture, chicken
embryo liver (CEL) cultures were used as described
with modifications (Frank and Sheila, 1975). The
virus was adapted to CEL cultures by four passages
and by using fifteen per cent foetal calf serum in
the growth medium.
Purification and concentration: The CEL adapted
HPSV was partially purified (Ahmad and Burgess,
2001). A 30% ammonium sulphate solution (v/v)
was used to precipitate the antigen from infected
cell culture supernatant. The precipitate was
resuspended in PBS and lipoproteins were removed
with 2 parts of chloroform to 1 part of antigen. The
suspension was subjected to ultracentrifugation at
150, 000 x g for 4 hours and the resultant pellet was
resuspended in PBS and used for further studies.
Characterization of viral proteins: The sodium
dodecyl sulphate polyacrylamide gel
electrophoresis (SDS-PAGE) for HPSV proteins
was performed by using 12.5% acrylamide gel
(Laemmli, 1970). After purification and
characterization of virus, hyperimmune serum was
produced in chickens and rabbits as per standard
immunization procedure.
Enzyme linked immunosorbent assay for
antibodies: The ELISA for the detection of
antibodies to HPSV was performed as per
Dawson et al., (1979) with modifications. Prior
to performing the ELISA, checker board
titration was carried out to arrive at the
optimum dilutions of antigen and conjugate
(Sigma Cat No. A9046) (Rose et al., 1997).
The wells in polystyrene microtitre plates were
coated with 100 µl of 2.5 ng / µl concentration
of stock antigen in carbonate / bicarbonate
coating buffer, pH 9.6. The plates were
incubated overnight at 40C in refrigerator. After
overnight incubation, the plates were washed
three times with PBS-T (Tween-20 @ 0.05%
v/v) and each well was added with 100 µl of
blocking buffer (PBS – 100 ml, Skim milk
powder 5 g and Tween-20 5 µl) and incubated at
370C for one hour by keeping appropriate
controls. The plates were washed with PBS-T
for three times and 100 µl of each serum
dilution in serum dilution buffer was added to
wells and the plates were incubated for 1 hour at
370C. The plates were washed with PBS-T again
for three times. Then, 100 µl of anitichicken
HRP conjugate was added to all wells and
incubated for 1 hour at 370C. The unreacted
conjugate was washed again with PBS-T for
three times and finally 100 µl of freshly
prepared ABTS (2,2‟-Azino-bis-3 ethyl
benzthiazine 6-sulfonic acid) and hydrogen
peroxide substrate prepared in citrate substrate
buffer was added in subdued light. The plates
were incubated in the dark for 15- 30 minutes at
370C for colour development. The colour

Frontier J. Vet. Anim. Sci.Vol. 4, No. 2 (July-Dec.) 2015 124
reaction was stopped by adding 100 µl of 1%
SDS in distilled water. The optical density (OD)
values were recorded using an ELISA reader at
415 nm.
Estimation of positive negative threshold
(PNT) value: The positive-negative threshold
value was estimated to find out the titre (Snyder
et al., 1983). In brief, ten serum samples, which
were negative by AGID, were selected. Serial
dilutions of the serum were made from 500,
1000, 2000, 5000, 10000, 50000 and 100,000.
The resultant OD values were plotted on Y-axis
against dilutions in X-axis. The resultant line is
referred as PNT line and used for finding out
the observed titre (OT).
Estimation of observed titre: The OT of 77 serum
samples was calculated using the subtraction
method (OD value for sample – OD value of
conjugate control) (Snyder et al., 1983) using the
PNT line. Serial dilutions of the serum samples as
mentioned in PNT value estimation were carried
out and ELISA was performed with these samples.
The resultant OD values were plotted on Y-axis
against dilutions in X-axis. The point where the
sample line cuts the PNT line was taken as titre of
the sample.
Estimation of titre: The formula to find out the
titre from single serum dilution instead of serial
logarithmic dilution was developed by applying the
principle of linear regression. Briefly, The OD
values obtained for every logarithmic dilution was
compared with OT and correlation coefficient was
obtained. The dilution that resulted in maximum
positive correlation was selected for predicting the
titre from that dilution. The other parameters like
slope and intercept were arrived by plotting a
scatter chart with OD values in Y-axis and OT in
X-axis. The linear regression formula Y=ax+b is
reversed as x=(y-b)/a, to find out the log titre and
antilog of titre is referred as predicted titre of the
sample.
Single serum dilution: The log ELISA titres were
arrived by applying the formula. Log10 titre =
(Corrected absorbance + 0.0275)/ 0.041 and titre =
antilog (Log10 titre).
Flow through assay for antigen detection: The
flow through assay for the detection of HPS antigen
was performed as per the method described (Wang
et al., 2005) with little modifications. For the
standardization of this assay, hyperimmune serum
in rabbits was produced as per standard
immunization procedure. The cellulose acetate
membrane (M/s mdi, Ambala Cantt) was placed
above the absorbant pads in a flow through module.
One µl (100, 150 and 200 ng / µl) of HPSV was
placed in the middle and 1 µl of rabbit serum was
placed in a corner as control in three different FTA
modules. The membranes were dried in an
incubator at 370C for 1 hour. The membranes were
added with 200 µl of wash buffer and allowed to be
absorbed through the membrane. This was repeated
once again. Then the 200 µl of wash buffer diluted
(1:5, 1:10 and 1:15) antirabbit serum was added and
allowed to be absorbed through the membranes.
The membranes were washed again, twice with
wash buffer. Then the 200 µl of wash buffer diluted
(1:1, 1:2 and 1:5) protein A colloidal gold
conjugate was added and allowed to be absorbed
through the membrane. The membranes were
washed again twice. Appearance of pink color dot
indicated presence of antigen.
RESULTS AND DISCUSSION
Isolation in cell culture: The HPSV obtained from
liver suspension was passaged four times in CEL
cultures. The CPE was noticed in the first passage
itself. The CPE was characterized by rounding and
degeneration of cells at 48 hours post inoculation.
Eventhough HPSV can be cultivated in different
systems like embryonated eggs, chicken embryo
kidney cells, the chicken embryo liver cells are highly
sensitive to the virus and are most preferred system for
the cultivation of virus. As the virus readily adapted
to liver cells, there was no necessity for blind
passages. In the first passage, changes like rounding of
cells and degenerative changes were noticed in the
monolayer. The same was reported by other workers
(Rajesh Kumar et al., 2003; Toro et al., 1999).

Frontier J. Vet. Anim. Sci.Vol. 4, No. 2 (July-Dec.) 2015 125
Purification and concentration of virus: The
HPSV propagated in CEL was purified by
ammonium sulphate precipitation and chloroform
extraction. The ammonium sulphate was removed
after chloroform extraction by dialysis of
precipitate against PBS (pH 7.2). A total volume of
500 ml was concentrated to get a final volume of
one ml. The HPSV was concentrated by
precipitating with ammonium sulphate, followed by
removal of lipoproteins by chloroform. As the liver
is a highly active organ and the liver cells are
metabolically active, if the extraneous material
other than virus is present, they will definitely
affect the diagnostic tests, especially the sensitive
tests like ELISA. Hence, the liver suspensions from
natural cases or the liver cells from monolayer
should be treated carefully to remove the
unnecessary material. Initial purification of viral
proteins was not satisfactory. Hence, the cell
culture fluid was clarified again and subjected to
ultracentrifugation. The pellet thus obtained was
suspended in PBS (pH 7.2) and contained purified
virus particles.
Characterization of viral proteins: The purified
HPSV when subjected to protein analysis by SDS-
PAGE resolved into various polypeptides of the
virus. After staining the gel with Coomassie
brilliant blue, the viral protein bands were visible.
The HPSV resolved into 12 structural polypeptides
(Fig.1) with molecular weights of 110 kDa (II -
hexon), 85 kDa (III – penton base), 79 kDa (IV), 70
kDa (V – long fibre), 66 kDa (VI – short fibre), 50
kDa (VII), 45 kDa (VIII), 41 kDa (IX – core
protein 1), 22 kDa (X), 20 kDa (XI – core protein
2), 15 kDa (XII) and 13 kDa (XIII). In the present
study, the polypeptides of purified virus were
resolved by SDS-PAGE. In 12.5% acrylamide gel,
the purified virus yielded 12 polypeptides. This
finding was in agreement with some of the workers
(Rajesh Kumar and Rajesh Chandra, 2004). On the
contrary, some workers got 8 polypeptides on
resolution in 10% gel (Balamurugan et al., 2002).
This difference in number of polypeptides might be
attributed to difference in concentration of
resolving gel and various other physical conditions.
Enzyme linked immunosorbent assay for
antibodies: The dynamic working range with
regard to antigen and conjugate was determined by
checker board titration. By this the optimal
concentration of HPSV coating antigen was found
to be 2.5 ng / µl and the conjugate was1 in 5000
dilution. The present study evolved single serum
dilution method for screening antibodies to HPSV
for the first time. In case of adenoviruses and in
particular HPSV, most of the studies were confined
to the serotyping and classification of adenoviruses.
On an average, the ELISA test can be completed in
4 hours of time on average, when compared with
one week for the VNT (Dawson et al., 1980). This
is a major advantage when screening large number
of serum samples. The non - specific colour
development in ELISA was a major problem during
the initial standardization of system. But, by
increasing the detergent concentration i.e., Tween-
20 and by increasing the concentration of skim milk
powder during initial blocking steps relieved the
problem greatly. The same measures were taken up
by other workers (Dawson et al., 1979).
The other major problem with
adenoviruses is the serological cross reactivity as
they are ubiquitous in nature. In VNT, the
monospecific antisera discriminated among the
various serotypes of virus and the ELISA showed
cross reactivity. In this study, the antigen used for

Frontier J. Vet. Anim. Sci.Vol. 4, No. 2 (July-Dec.) 2015 126
ELISA was from disrupted liver cells and
contained group-specific and type-specific
antigens. The group-specific antigen was
responsible for cross-reactions. Some workers
adsorbed the sera with healthy liver tissue
powder to reduce the non-specific reaction and
thereby increasing the sensitivity of the assay
(Dawson et al., 1979). The adsorption of gamma
globulin preparation with liver and kidney
powder of SPF chicks reduced the non-specific
reaction (Saifuddin and Wilks, 1990).
Single serum dilution: The PNT line with ten
serum samples was constructed (Fig.2). The
correlation coefficient at 1: 1000 was 0.96, which
was more than that of all other dilutions. Hence,
1:1000 was preferred to predict the titre. For
prediction of titres formula was developed using
77 serum samples. The other two constants
required to predict titres from serum dilution of
1:1000 viz., slope (A) and intercept (B) were
estimated by drawing a scatter chart (Fig. 3). The
slope and intercept were 0.041 and 0.027
respectively. Using these two constants, by
applying the linear regression equation (y= ax+b),
the formula for calculating titre was obtained
which is read as follows x = (y-b) / a. The log 10
titre (x) = (Absorbance – intercept) / slope. The
bar graph was drawn with observed and predicted
titres of serum samples used for the construction
of formula (Fig. 4). After developing the
prediction formula, 302 serum samples were
screened for the presence of HPSV antibodies at
1: 1000 dilution of serum.
Flow through assay for antigen detection: Out of
different concentrations, dot with optimum
intensity was observed with 200 ng / µl
concentration of HPSV antigen and the dot
developed in five minutes with 1:10 diluted
antirabbit serum and 1:2 diluted protein A colloidal
gold conjugate (Fig. 5). For the first time flow
through assay was used to detect the HPSV antigen.
This assay was able to detect 200 ng of purified
virus.

Frontier J. Vet. Anim. Sci.Vol. 4, No. 2 (July-Dec.) 2015 127
CONCLUSIONS
The single serum dilution ELISA developed in
present study was highly useful for monitoring
breeder flocks for antibodies to HPSV. This saves
time and reagent cost and more number of samples
could be screened. The vaccination of breeder
flocks could be fine-tuned using this SS ELISA, to
ensure maximum protection to hatchlings in the
form of maternal antibodies. The FTA to detect
virus antigen, can be performed at farm premises
without much sophistication.
REFERENCES
Ahmad, M. and G.Burgess, 2001. Production
and Characterization of monoclonal
antibodies to fowl adenovirus. Avian
Pathol., 30: 457 - 463.
Anjum, A.D., M. A. Sabri and Z. Iqbal, 1989.
Hydropericarditis syndrome in broiler chicken
in Pakistan. Vet.Rec., 124: 247 - 248.
Asrani, R.K., V. K. Gupta, S. K. Sharma, S. P.
Singh and R. C. Katoch, 1997.
Hydropericariucm-hepatopathy syndrome
in Asian poultry. Vet.Rec., 141: 271 - 273.
Balamurugan, V., J .M. Kataria, R. S. Kataria, K. C.
Verma and T. Nanthakumar, 2002.
Characterization of fowl adenovirus-4
associated with hydropericardium syndrome
in chicken. Indian J of Comp Microbiol,
Immunol and Infect Dis., 25: 139 - 147.
Bhowmik, M.K, 1996. Leechi disease
(Hydropericardium syndrome) in broiler
chickens in West Bengal. In proceedings:
Abstracts XX World‟s poultry congress,
New Delhi, India., IV: 319.
Chandra, R., S.K.Shukla, M.Kumar and S.K.Garg,
1997b. Electron microscopic
demonstration of an adenovirus in the
hepatocytes of birds experimentally
infected with hydropericardium syndrome.
Vet. Rec, 140: 70-71.
Dawson, G.J., L.N.Orsi, V.J.Yates, P.W.Chang and
A.D.Pronovost, 1979. An enzyme linked
immunosorbent assay for detection of
antibodies to avian adenovirus and avian adeno
virus-associated virus. Avian Dis., 24: 393-402.
Frank S.K., and A.H.Sheila, 1975. Preparation of
primary chicken embryo liver cells.
Methods in Cell Science., 1 : 25-26.
Jadhao,S.J., J.M.Kataria,K.C.Verma and R.L. Sah,
1997. Serotyping of Indian isolates of fowl
adenovirus recovered from inclusion body
hepatitis- hydropericardium syndrome
(Litchi disease) in chickens. Indian Journal
of Comparative Microbiology, Immunology
and Infectious diseases., 18: 33-37.
Khawaja, D.A, S.Ahmad, A.M.Rauf, M.Zulfiqar,
S.M.I.Mahmood and Mahmood-ul-Hasan,
1988. Isolation of an adenovirus from
hydropericardium syndrome in broiler
chicks. Pakistan J.of Vet.Res., 1: 2-17.
Laemmli, U.K., 1970.Cleavage of structural
proteins during the assembly of the head
of bacteriophage, Nature. 227: 680-685.
Qureshi, A.A, 1997. Hydropericardium in layers.
Poult. International., 36: 46.
Rajesh Kumar, Rajesh Chandra and S.K.Shukla,
2003. Isolation of etiological agent of
hydropericardium syndrome in chicken
embryo liver cell culture and its
serological charaterization. Ind.J.Exp.
Biology., 41: 821-826.
Rajesh Kumar and Rajesh Chandra, 2004. Studies on
structural and immunogenic polypeptides of
hydropericardium syndrome virus by SDS-
PAGE and western blotting. Comp.Imm,
Micro and Inf.Dis., 27: 155-161.
Ravikumar, P., Rajesh Chandra, S.K.Shukla,
D.K.Agarwal and Mahesh Kumar, 1997.
Hydropericardium syndrome (HPS) in
India: A preliminary study on the
causative agent and control of the disease
by inactivated autogenous vaccine.
Trop.Anim.Hlth.Prod., 29: 158-164.
Rose, R.N., D.J.Folds, H.Chifford and
M.R.Nakamura, 1997. Manual of clinical
laboratory immunology. 5th
edition 24.
Roy, P., A.Koteeswaran and Ramagounder Manickam,
2001. Serological, cytopathological and
cytochemical studies on hydropericardium
syndrome virus. Veterinarski Archiv., 71: 97-
103.

Frontier J. Vet. Anim. Sci.Vol. 4, No. 2 (July-Dec.) 2015 128
Saifuddin, M., and C.R.Wilks, 1990. Development
of an enzyme linked immunosorbent assay
to detect and quantify adenovirus in
chicken tissues. Avian Dis., 34: 239-245.
Shane, S.M. 1996. Hydropericardium-hepatitis
syndrome the current world situation.
Zootecnica International. January 1996.
pp20-27.
Shukla, S.K., Rajesh Chandra and Mahesh Kumar,
1999. Outbreaks of hydropericardium
syndrome (HPS) in layer flocks of poultry
in India: A preliminary report.
Ind.J.Vet.Med., 19: 62-63.
Snyder, D.B., W.W.Marquardt, E.T.Williams and
E.Russel, 1983. Rapid serological
profiling by enzyme linked
immunosorbent assay. Measurement of
antibody activity against the New castle
disease in a sigle serum dilution. Avian
Dis., 27: 161-170.
Sreenivas Gowda, R.N., and M.L.Satyanarayana,
1994. Hydropericardium syndrome in
poultry. Indian J.Vet.Pathol., 18: 159-161.
Toro, H., C.Prusas, R.Raue, L.Cerda, C.Geisse,
C.Gonzalez and M.Hess, 1999.
Characterization of fowl adenoviruses
from outbreaks of inclusion body hepatitis
/ hydropericardium syndrome in Chile.
Avian Dis., 43: 262-270.
Toshiaki Abe, Kikuyasu Nakamura, Hidenori Tojo,
Masaji Mase Tomoyuki Shibahara, Shigeo
Yamaguchi and Noboru Yuasa, 1998.
Histology, immunohistochemistry and
ultrastructure of hydropericardium
syndrome in adult broiler breeders and
broiler chicks. Avian Dis., 42: 606-612.
Van den Berg, T.P, 1995. Immunosuppressive viral
diseases in poultry: Current situation and
perspectives. Lohmann Information., 19: 13-17.
Wang, S.C., Zhang and Y.Zhang, 2005. Development
of a flow-through enzyme linked
immunosorbent assay and a dipstick assay
for the rapid detection of insecticide caraxyl.
Acta.Chimika.Actai. 535: 219-225. Cited by
G.Venkatesh. Development of recombinant
antigens for diagnosis of avian
mycoplasmosis.Ph.D thesis submitted to
Tamil Nadu Veterinary and Animal Sciences
University, Chennai.

Frontier J. Vet. Anim. Sci.Vol. 4, No. 2 (July-Dec.) 2015 129
*Part of the Ph.D. thesis submitted by the first author to KVAFSU, Bidar 1Assistant Professor, Dept. of Veterinary Anatomy, Veterinary college, Shivamogga E-mail: [email protected]
Ruminants are classified based on their foraging
behaviour as grazers, browsers or intermediates.
Grazers, such as cattle, consume mostly low quality
grasses while browsers such as moose and mule
deer stay in the woods and eat highly nutritious
twigs and shrubs. Intermediates, such as sheep,
goats and white tail deer, have nutritional
requirements midway between grazers and
browsers. Of this group, sheep are more of a grazer,
while goats and deer are browser type.
Comparing gastrointestinal characteristics
of deer is one method to understand their
relationship with forage quality and quantity
(Hofmann, 1989; Ramzinski and Weckerly, 2007).
The forestomach of deer, like other ruminants,
contains a mucosal membrane that is studded with
papillae. Papillae absorb volatile fatty acids that are
products of microbial digestion, and their growth is
stimulated by the production of these volatile fatty
acids (Tamate et al., 1962; Hofmann, 1989). The
size, density and distribution of papillae can be
affected by the availability, quality and quantity of
forage (Hofmann, 1988) and can be used to
compare habitats and seasons as well as species,
age and gender differences (Zimmerman et al.,
2006). Research on rumen papillation of cervids
has been conducted on Moose (Alces alces)
(Hofmann and Nygren, 1992), Red Deer (Cervus
elaphus) (Lentle et al., 1996), Reindeer (Rangifer
tarandus) (Knott et al., 2005), and sympatric Mule
Deer and White-tailed Deer (Zimmerman et al.,
2006) and Mule Deer and White-tailed Deer
(Gerald and Hudson, 2008). The present study
adds to the growing body of knowledge by
comparing ruminal papillae characteristics of wild
and domestic ruminants in India.
MATERIALS AND METHODS
The rumen from six black bucks (Antelope
cervicapra), six nilgais (Boselaphus tragocamelus)
and six spotted deers (Axis axis) were collected
during postmortem at Bannerghatta Biological
Park, Bengaluru, Sri Jayachamaragendra
Zoological Gardens, Mysore and Lion Safari,
Tyavarekoppa, Shimoga. The cause of death for all
animals was ascertained before collection of the
Comparative Gross Morphology of Ruminal Papillae in Wild and
Domestic Ruminants*
Lakshmishree1, K.T., Prasad, R.V., Jamuna, K.V., Ravindra, J.P., Nagaraja, C. S.,
Chandrashekara Murthy, V. Ramkrishna, V., Dhoolappa, M. and Vinuthan, M.K. Veterinary College, KVAFSU, Shivamogga-577204, Karnataka state, India
Received: 26 February 2015; Accepted: 26 June, 2015
ABSTRACT
A comparative gross morphological study was conducted on the ruminal papillae of wild and domestic ruminants. The
density, length, width and surface enlargement factor (SEF) of the ruminal papillae in the wild (Spotted deer, Black
buck and Nilgai) and domestic ruminants (buffaloes, sheep and goats) were compared. The papillae were tongue or
conical shaped in black buck, nilgai and buffalo, while they were spatula or leaf shaped in spotted deer, sheep and
goat. The colour of papillae was brown in black buck, buffalo and sheep while it was dark brown or black in nilgai,
spotted deer and goat. The ruminal papillae were evenly distributed throughout the rumen in the spotted deer and goat
whereas they were uneven in the others. The density of ruminal papilla was highest in blackbuck (87.7±3.09) and
buffalo (69.3±1.79) while it was least in spotted deer (62.1±2.58) and goat (29.9±1.77). the surface enlargement factor
(SEF) was highest in nilgai (29.4±4.97) and sheep (44.1±14.5), but least in blackbuck (10.1±1.67) and buffalo
(9.75±0.29). Based on these morphological parameters buffalo and blackbuck had characteristics of the grazers, goat
and spotted deer of browsers, whereas sheep and nilgai showed the overlapping morphology of both grazers and
browsers, hence they are classified as intermediates.
Keywords: Comparative gross morphology, Rumen Papilla, Ruminants

Frontier J. Vet. Anim. Sci.Vol. 4, No. 2 (July-Dec.) 2015 130
specimens and was found unrelated to any
affections of the gastrointestinal system. Further,
healthy rumen from six buffaloes (Bubalus
bubalils), six sheep (Ovis aries) and six goats
(Capra hircus) were collected after slaughter from
the local slaughter house. The specimens thus
obtained were subjected to different anatomical
parameters.
The shape, colour and surface of papillae
were observed using a stereozoom microscope
(Lynx, Lawrence and Mayo). A square centimetre
sample was used to determine the papillae density
(No. of papillae/ square centimetre of rumen
mucosa). Ten papillae were chosen randomly to
measure the maximum length and width. The width
was measured as the distance at midpoint of
papillae using a Digimatic caliper (Mitutoyo®).
The means of various parameters were calculated
and used for subsequent statistical analysis. The
surface enlargement factor (SEF) was then
calculated according to Hofmann and Nygren,
(1992).
SEF= (2 X Papillae Surface Area) X [Papillae number + Base surface]
Base surface
Papillae Surface Area = Papillae length X Papillae
width
Base surface = Area of subsample (A square
centimetre sample which was used to determine
papillae density)
The photographs were taken with a Nikon
digital camera (Nikon, MH 611 COOLPIX P5100,
and Japan) attached to Lynx, Lawrence and Mayo
stereozoom microscope. The statistical analysis of
biometrical parameters of ruminal papillae in
different species was depicted in a tabular form.
The data was presented as mean±standard
deviation. Anatomical terms were used in
agreement with the Nomina Anatomica Veterinaria
(2005).
RESULTS AND DISCUSSION
The ruminal mucosal surface of the ruminants
studied was studded with many papillae giving it a
„turkey towel‟ appearance.
Shape of papillae: The papillae were tongue or
conical shaped in blackbuck, nilgai and buffalo (Fig
1a, 1b and 1d). Spatula or leaf shaped papillae were
seen in spotted deer, sheep and goat (Fig 1c, 1e and
1f). Rasha (2007) recorded a complete sequence of
transitional forms of ruminal papillae under the
influence of diet. These ranged from small, smooth
tongue-shaped papillae in hay-fed group to large,
heavily keratinized, finger-, foliate- or mushroom-
shaped papillae in concentrate-fed sheep. The shape
of the papillae was tongue or conical shaped in
blackbuck, nilgai and buffaloe (as in the hay-fed
group) while they were spatula or leaf shaped in
spotted deer, sheep and goat (as in the concentrate-
fed group). The results of Rasha (2007) may be
indirectly correlated to hay-fed group as grazers and
concentrate-fed group as browsers. The present study
showed that the forage type might have affected the
shape and colour of the papillae.
a b
c d
e f
Fig 1: Stereophotograph showing ruminal
papillae in a) Blackbuck b)Nilgai c) Spotted deer
d) Buffalo e)Sheep and f)Goat (x 30)

Frontier J. Vet. Anim. Sci.Vol. 4, No. 2 (July-Dec.) 2015 131
In this context, the sequential changes
from tongue or conical to spatula or leaf shapes
might be due to forage type dependent grazer and
browser ruminants respectively, which was an area
that showed large alteration in the absorptive
surface area of the papillae in relation to the feeding
regimes as reported by Gabel et al. (1987).
Possibly, the various forms of papillae were
initially shaped by mechanical forces which acted
on the mucosa, which could be from epithelium
expansion on the one hand and from muscular
contraction on the other hand (Wardrop, 1961).
Nevertheless, subsequent development of papillae
has been shown to have depended on the nature of
the feed stuffs (Brownlee, 1956) whose
metabolized products were short chain fatty acids
(SCFA), which are mainly butyric and to a lesser
extent propionic acids (Sander et al., 1959).
Colour: The colour of papillae was brown in
blackbuck, buffaloe and sheep while it was dark
brown or black in nilgai, spotted deer and goat. The
variations in colour of papillae could be due to the
type of forage in ruminants. Radostits et al. (2007)
observed that the ruminants such as cattle, sheep and
goats which were fed mainly on grains had short,
narrow and dark ruminal papillae. According to
Ellenberger and Baum (1912); Habel (1975) and
Church (1979) the ruminal epithelium of cattle was
dark brown to blackish except on the margins of the
pillars and the upper part of the dorsal sac where the
colour gradually turned to pale brown. According to
May (1964) the ruminal epithelium of sheep was
brown and became paler towards and on the pillars.
Nockels et al. (1966) predicted that the dark
brown colour of papillae appeared to be a combination
of a supply of keratinized tissue, resulted from rapid
growth and limited abrasion, high supply of iron, and
an acid pH. Rasha (2007) also revealed that the diet
changed the colour of papillae. Papillae from hay-fed
sheep or sheep fed concentrate for 4 weeks had light
brown colour. However, dark brown coloured papillae
were observed in 6 and 12 weeks in concentrate-fed
groups.
Surface of papillae: A stereozoom microscopic
observations revealed that the surface of papillae
was smooth in blackbuck and buffalo while it was
rough with serrated borders in nilgai and spotted
deer. In sheep and goat, the surface of the papillae
was rough with a ridge-like appearance. These
findings can be compared with the observations
made by Rasha (2007) where he revealed that the
surface of papillae was not smooth in hay-fed sheep
but it possessed shallow grooves, which gradually
became deeper and increased in number with
duration of concentrate feeding (more obvious in 4-
12 weeks concentrate-fed groups). These deep
grooves increased the surface of papillae and
offered a place for the ingesta to be settled for long
time, hence, it increased the absorptive capacity of
the epithelium. High magnification of these ridges
and grooves revealed highly keratinized squamous
cells on the surface of the epithelium.
Dimensions of papillae: The length, width and
surface area of papillae was comparatively high in
nilgai, spotted deer, sheep and goat as compared to
black buck and buffalo. These observations were in
accordance with those of Zitnan et al., (1999) in calf
and Rasha (2007) in sheep. In ruminants, it was
demonstrated that the development of papillae was
stimulated by the presence of volatile fatty acids
(VFA) (Sander et al., 1959; Sakata and Tamate,
1979). Because VFA production is also a function of
diet quality, the number and size of forestomach
papillae reflect the variation in it, e.g. within a species
between seasons (Hofmann, 1973;Langer, 1974;
Konig et al., 1976; Hofmann and Schnorr, 1982;
Hofmann et al., 1988; Hofmann and Nygren,1992;
Kamler, 2001), or between free-ranging and captive
individuals (Hofmann and Nygren, 1992).
Although papillae served as absorptive
structures, the total ruminal volume and surface area
had a significant influence on nutrient transport
(James et al., 1983), so changes in papillary size
indicate a marked increase of relative rumen epithelial
absorptive surface. The intake of high levels of protein
and carbohydrate appeared to increase the papillary

Frontier J. Vet. Anim. Sci.Vol. 4, No. 2 (July-Dec.) 2015 132
A B Fig 2: Bar diagram showing comparison of A) Surface enlargement factor (SEF) and B) Ruminal papillae
density (Mean±SD) in different ruminants studied (Data from table 1).
size and density via butyrate and propionate regulation
of IGF-1 production in goat (Shen et al., 2004) and
was partially due to SCFA dependent increase in the
mitotic index of the rumen epithelium of calf.
However, Lentle et al. (1996) reported that the quality
of ingested food affected the size of ruminal papillae
in red deer. The results of this study clearly
demonstrated the effect of the type of forage selected
on the development of the ruminal papillae. The
morphometrical evaluation revealed significant
differences in the development of papillae between
grazing and browsing type of feeding.
Density of ruminal papilla: The density of
ruminal papilla was highest in blackbuck
(87.7±3.09) and buffaloe (69.3±1.79) while it was
least in spotted deer (62.1±2.58) and goat
(29.9±1.77) (Fig. 2A and Table). According to
Hofmann (1989) these data corresponded with the
classification of food specialization of the studied
species. The variations in density of rumen papillae
observed between species corresponded with the
presumption that the development of rumen
papillation depended on the quality of the ingested
forage-on production of volatile fatty acids (VFA)
which stimulated papillary growth (Tamate et al.,
1962 and Hofmann, 1989). The high density of
papillae in blackbuck and buffalo in the preset
study was in accordance with the observations of
Hofmann (1973) in African antelope.
Rasha (2007) demonstrated that the
decrease in the number of papillae per cm2 mucosa
was due to increased duration of concentrate
feeding in sheep. But there was no indication of
fusion of several papillae into one papilla. In the
present study, the least density of papillae might be
in animals of concentrate feed selectors (browsers).
The reduction in the number might be due to
increase in thickness of individual papillae, thus,
accommodating fewer papillae per unit area. Tiwari
and Jamdar (1970) and Aafjes (1967) demonstrated
that areas of the rumen wall with large number of
papillae absorbed more volatile fatty acids than do
areas with few papillae. However, Lentle et al.
(1996) reported that the quality of ingested food
affected the density of rumen papillae in red deer.
Surface enlargement factor (SEF): The surface
enlargement factor (SEF) was recorded highest in
nilgai (29.4±4.97) and sheep (44.1±14.5), least in
blackbuck (10.1±1.67) and buffalo (9.75±0.29)
(Fig. 2B and Table). Josefsen et al. (1996) recorded
the surface enlargement factor (SEF) in reindeer
calves as 5.8-18.6 and reported that the papillar
length and number of papillae per cm2
had the
largest influence on SEF, and these two parameters
together accounted for 76-84% of the variation in
SEF. The least SEF was recorded in blackbuck and
buffalo which were corroborating with the
observations made by Clauss et al. (2009) where

Frontier J. Vet. Anim. Sci.Vol. 4, No. 2 (July-Dec.) 2015 133
Table: Gross parameters and measurements of ruminal papillae of different
animals studied (Mean±SD, n=6).
Sl.
No. Parameters Black Buck Nilgai
Spotted
Deer Buffaloe Sheep Goat
1 Shape Tongue or
conical
Tongue or
conical
spatula or
leaf
Tongue or
conical
spatula or
leaf
spatula or
leaf
2 Colour brown Dark
brown
Dark brown
to black brown brown Dark brown
3
Surface of
papillae (stereo
zoom)
smooth
Rough with
serrated
borders
Rough with
serrated
borders
smooth
Rough with
ridge
appearance
on surface
Rough with
ridge
appearance
on surface
4
Dimensions of
papillae
Length(mm)
3.36±0.26
3.78±0.31
4.37±0.04
3.57±0.09
6.33±0.05
3.97±0.05
5 Width(mm) 0.76±0.11 2.33±0.28 1.44±0.06 0.81±0.01 2.88±0.04 2.83±0.09
6 Surface area of
papillae (mm2) 2.7±0.426 8.79±1.05 6.31±0.32 2.88±0.07 18.2±0.37 11.2±0.36
7
Density of
papillae (No. of
papillae/cm2
mucosa
87.7±3.09 74.5±3.83 62.1±2.58 69.3±1.79 42.8±1.57 29.9±1.77
8
Surface
enlargement
factor (SEF)
10.1±1.67 29.4±4.97 18.5±3.64 9.75±0.29 44.1±14.5 29±0.96
they stated that the percentage of grass in their diet
significantly affected the SEF.
Hofmann and Schnorr (1982) studied
European roe deer (Capreolus capreolus),
European red deer (Cervus elaphus) and the
fallow deer (Cervus dama). In the roe deer and
the red deer, but not in the fallow deer,
significant correlations were observed between
the factor of increase in surface area (f.i.s.a.) and
the mitotic index (m.i.) could be found. Both
f.i.s.a. and m.i. were highest in the largest
species, the red deer, and much lower in the other
two deer species. The large species had large
papillae with intensive mitotic activity.
Nutritional differences between these three
species might have played an important role in
this.
Hofmann et al. (1988) investigated the
morphology of rumen and reticulum in roe deer
(Capreolus capreolus) and did not find any
significant differences between forest and field
ecotypes. There were, however, differences in
rumen papillary development, related to seasonal
differences in forage quality and availability. Forest
roe deer showed a wider range of the papillary
surface enlargement factor than field roe deer in
summer and had their optimal papillary
development in autumn.
Dyce et al. (2002) explained that changes
in the papillary prominence in wild ruminants could
be due to the availability of the forage quality
which was dependent upon seasonal changes. These
changes were restricted in domestic ruminants
whose diet was under the control of human
influence to a greater degree.
CONCLUSIONS
Based on these morphological parameters of
ruminal papillae in the present study, buffalo and
blackbuck could be classified as grazing ruminants,
goat and spotted deer represented typical
characteristics of browser ruminants whereas sheep
and nilgai showed the overlapping morphology of

Frontier J. Vet. Anim. Sci.Vol. 4, No. 2 (July-Dec.) 2015 134
both grazer and browsers, hence, they were
classified as intermediate feeders. These parameters
will help to schedule the ration (feeding schedule)
for these wild animals in zoos and game
sanctuaries.
ACKNOWLEDGEMENT
Author would like to thank PCCF, Karnataka and
Executive directors, Veterinarians and supporting
staffs of Sri Jayachamarajendra Zoological Park,
Mysore, Bannerghatta National park, Bangalore
and Lion safari, Shimoga for helping in collection
of samples.
REFERENCES
Aafjes J. H., (1967). Carbonic anhydrase in the wall
of the forestomachs of cows. Br. Vet.
J.,123: 252-255.
Brownlee A., (1956). The development of rumen
papilae in cattle fed on different diets. The
Brit. Vet. J., 112 (9):369-75.
Church D.C., (1979). Digestive Physiology and
Nutrition of Ruminants, vol.1 Edn.2nd
.
Digestive Physiology. O&B Books, Inc.,
Corvallis.
Clauss M., Hofmann R.R., Fickel J., Streich W.J. and
Hummel J., (2009). The intraruminal
papillation gradient in wild ruminants of
different feeding types: implications for
rumen physiology. J. Morphol., 270:929-942.
Dyce K.M., Sack W.O. and Wensing C.J.G., (2002).
The abdomen of ruminants. In: Textbook of
Veterinary Anatmoy. Edn. 3rd., WB Saunders
Co. (ed). Philadelphia., pp:666-690.
Ellenberger W. and Baum H., (1912). Handbuch
der Vergleichenden Anatomie der
Haustiere, Edn.13th . Berlin.
Gabel G., Martens H., Suendermann M. and Galfi P.,
1987. The effect of diet, intraruminal pH and
osmolarity on sodium, chloride and
magnesium absorption from the temporarily
isolated and washed reticulo-rumen of sheep.
Q. J. Exp. Physiol., 72: 501-511.
Gerald K.W. and Hudson R. J.. (2008). Rumen
Papillae Morphology of Mule Deer,
Odocoileus hemionus, and Whitetailed
Deer, Odocoileus virginianus, from East-
central Alberta. Canadian Field-
Naturalist, 122(2): 179-181.
Habel R.E., (1975). Ruminant digestive system. In:
Sisson, S. and Grossman, J. D. The
Anatomy of the Domestic Animals Edn.5th
, W.B. Saunders Co., Philadelphia
Hofmann R.R., (1973). The ruminant stomach.
Stomach structure and feeding habits of
East African game ruminants. East Afr.
Lit. Bureau., 2:1-354.
Hofmann R.R. and Schnorr B., (1982). The
Functional Morphology of the
Forestomachs (in German). Ferdinand
Enke Verlag, Stuttgart.
Hofmann R.R., (1988). Anatomy of the gastro-
intestinal tract. In:The ruminant animal:
digestive physiology and nutrition (D. C.
Church, ed.). Prentice-Hall, Inc.,
Englewood Cliffs, New Jersey. pp: 14-43.
Hofmann R.R., (1989). Evolutionary steps of
ecophysiological adaptation and
diversification of ruminants: a comparative
view of their digestive system. Oecologia,
78:443-457.
Hofmann R.R. and Nygren K., (1992). Ruminal
mucosa as indicator of nutritional status in
wild and captive moose. Alces., 1:77-83.
Hofmann R.R., Saber A. S., Pielowski Z. and
Fruziński B., (1988). Comparative
Morphological Investigations of Forest
and Field Ecotypes of Roe Deer in Poland.
Acta Theriologica., 33 (9):103-114.
James E., Nocek C., Heald W. and Polan C. E.,
(1983). Influence of ration physical form
and nitrogen availability on ruminal
morphology of growing bull calves. J.
Diary Sci., 67: 334-343.

Frontier J. Vet. Anim. Sci.Vol. 4, No. 2 (July-Dec.) 2015 135
Josefsen T. D., Aagnes T.H. and Mathiesen S.D.,
(1996). Influence of diet on the
morphology of the ruminal papillae in
reindeer calves (Rangifer tarandus
tarandus).Rangifer. 16(3):119-128.
Kamler J., (2001). Morphological variability of
forestomach mucosal membrane in red
deer, fallow deer, roe deer and mouflon.
Small Rumin Res., 41(2):101-107.
Knott K. K., Barboza, P. S. and Bowyer R. T.,
(2005). Growth in Arctic ungulates:
Postnatal development and organ
maturation in Rangifer tarandus and
Ovibos mos -chatus. J. of Mammalogy.,
86:121-130.
Konig H.E., Hofmann R.R. and Geiger G., (1976).
Differentiell-morphologische
Untersuchungen der resorbierenden
Schleimhautoberflaiche des Pansen beim
Rotwild (Capreolus capreolus) in Sommer
und Winter. Zeitschrift fur
Jagdwissenschaft., 22:191-196.
Langer P., (1974). Oberflachenmessungen an der
Innenauskleidung des Ruminoreticulums
von Rehwild (Capreolus capreolus) und
Damwild (Cervus dama). Zeitschrift fur
Saugetierkunde., 39:168-190.
Lentle R.G., Henderson I.M. and Stafford K.J.,
(1996). A multivariate analysis of rumen
papillary size in red deer (Cervus elaphus).
Can. J. Zool., 74:2089-2094.
May N.D.S., (1964). The anatomy of the sheep.
Edn. 2nd
., Univ. of Queensland Press.,
Brisbane, Australia.
Nockels C. F., Kintner L. D. and Pfander W. H.,
(1966). Influence of ration on morphology,
histology and trace mineral content of
sheep rumen papillae. J. Dairy Sci., 49:
1069-1074.
Nomina Anatomica Veterinaria - NAV. (2005).
Edn. 5th
., International Committee on
Veterinary Gross Anatomical
Nomenclature – ICVGAN.
Radostits O.M., Gay C.G., Hinchcliff P.D., and
Constable P.D., (2007). Diseases of the
alimentary tract. In: Veterinary Medicine:
a textbook of the diseases of cattle, sheep,
pigs and goats. Elsevier Saunders,
Edinburgh, pp:328.
Ramzinski D. M. and Weckerly F. W., (2007).
Scaling relationship between body
weight and fermentation gut capacity in
axis deer. J. of Mammalogy., 88: 415-
420.
Rasha S. A., (2007). Diet-dependent morphological
changes of the rumen epithelium in sheep.
Ph.D. Thesis., Institute of veterinary
anatomy faculty of veterinary medicine
free University of Berlin.
Sakata T. and Tamate H., (1979). Rumen
epithelium cell proliferation accelerated by
propionate and acetate. J. of Dairy Sci.,
62:49-52.
Sander E.G., Warner R.G., Harrison H.N. and
Loosli J.K., (1959). The stimulatory effect
of sodium butyrate and sodium
propionateon on the development of
rumen mucosa in the young calf. J. of
Dairy Sci., 42:1600-1605.
Shen Z., Seyfert H. M., Lohrke B., Schneider F.,
Zitnan R., Chudy A., Kuhla S., Hammon
H. M., Blum J. W., Martens H.,
Hagemeister H., and Viogt J., (2004). An
energy rich diet causes rumen papillae
proliferation associated with more IGF
type 1 receptors and increased plasma
IGF-1 concentrations in young goats. J.
Nutr., 134: 11-17.

Frontier J. Vet. Anim. Sci.Vol. 4, No. 2 (July-Dec.) 2015 136
Tamate H., McGilliard A. D., Jacobson N. L. and Getty
R., (1962). Effect of various dietaries on the
anatomical development of the stomach in the
calf. J. of Dairy Sci., 45: 408-420.
Tiwari G. P. and Jamdar M. N., (1970). Studies on
the gross and histological structure and
development of the forestomachs of Indian
water buffalo calf in early postnatal life
with reference to normal feeding. 1.
Rumen. Ind. J. Anim. Sci., 40: 489-494.
Wardrop I. D., (1961). Some preliminary observations
on the histological development of the
forestomachs of the lamb. 1. Histological
changes due to age in the period from 46
days of fetal life to 77 days of postnatal life.
J. Agr. Sci. Camb., 57: 335-341.
Zimmerman, T. J., Jenks J. A. and Leslie D. M.,
(2006). Gastrointestinal morphology of
female white-tailed and mule deer: Effects
of fire, reproduction, and feeding type. J.
of Mammalogy. 87: 598-605.
Zitnan R., Voigt J., Wegner J., Breves G., Schroder
B., Winckler C., Levkut M., Kokardova
M., Schonhusen U., Kuhla S., Hagemeister
H. and Sommer A., (1999). Morphological
and functional development of the rumen
in the calf: Influence of the time of
weaning. 1- Morphological development
of rumen mucosa.Arch. Anim. Nutr., 52:
351-362.

Frontier J. Vet. Anim. Sci.Vol. 4, No. 2 (July-Dec.) 2015 137
* Part of Ph.D Thesis submitted by the first author to KVAFSU, Bidar 1Ph.D Scholar: [email protected] 2Associate Professor: [email protected] 3Ph.D Scholar: [email protected] 4Professor and Head: [email protected]
Fertility status of dairy cattle is generally
decreasing. Overall estrus detection efficiency in
lactating dairy cattle is low, as expression of estrus
is often compromised. Consequently, undetected
estrus, low AI-submission rates, and long inter-
breeding intervals are the main contributors to poor
reproductive efficiency. Although, failure to
become pregnant is the most common reason for
culling dairy cattle, pregnancy rates could be
improved by increasing the AI-submission rates
through increased estrus detection efficiency or
timed artificial insemination (TAI). Ovsynch is a
protocol based on the administration of GnRH,
PGF2α and GnRH (Pursley et al., 1995) to schedule
the insemination time. Ovsynch protocol with FTAI
has been developed, tested and intensively used in
dairy cows and it yielded overall conception rates
similar to those obtained after breeding to detected
estrus (Pursley et al., 1997; Stevenson et al., 1999).
However, conception rate is usually lower in
Ovsynch-treated cows because ovulation is not
adequately synchronized in approximately one third
of the animals (Colazo and Ambrose, 2013). The
variability in synchronization with the Ovsynch
protocol is mainly due to the stage of the estrous
cycle at the time of the first GnRH treatment
(Vasconcelos et al., 1999; Moreira et al., 2000).
Studies have amply demonstrated that the success
of Ovsynch program is influenced by the number of
follicular waves or length of the follicular wave
(Pursley et al., 1997) and the stage of the estrous
cycle when the first GnRH is administered
(Vasconcelos et al., 1999; Moreira et al., 2000).
The best time to initiate the Ovsynch treatment is
between day 5 to 12 of the estrous cycle (early
diestrus) with higher probability of cows
responding to the treatment and become pregnant
(Vasconcelos et al., 1999; Moreira et al., 2000).
A common question among dairy
producers is the optimal interval between PGF2α
and the second GnRH treatment, and the optimal
time to inseminate cows that have been
synchronized with the Ovsynch protocol. In a
preliminary study, Peters et al. (1999) examined the
effect of delaying the second GnRH on synchrony
of ovulation in dairy cows subjected to a 7-day
Ovsynch and observed that ten out of 11 cows
treated with the second GnRH between 56 and 60
A Modified Ovsynch Protocol Improves Conception Rate in Repeat Breeder Cows*
Kantharaj, S1., Chandrashekara Murthy
2, V., Lakshmikanth
3, T.R.
and Krishnaswamy4, A.
Department of Veterinary Gynaecology and Obstetrics, Veterinary College, Bangalore-24.
Received: 16 May, 2015; Accepted: 11 July, 2015
ABSTRACT
The objective of the present study was to compare the effectiveness of Ovsynch-48 and modified Ovsynch protocol
(Ovsynch-56) on the conception rate in repeat breeder cows when initiated during the early luteal phase of the estrous
cycle. Thirty three repeat breeder cows were randomly selected and divided into three groups with 11 cows in each
group. Group-I (Control) was subjected to single A.I. during the observed estrus. Group-II was subjected to Ovsynch-
48 and Group-III was subjected to Ovsynch-56 during the early luteal phase of the estrous cycle. The mean serum
progesterone concentration did not differ significantly between Group-II and Group-III when the first GnRH was
administered. Similarly, the mean serum progesterone concentration did not differ significantly between the control
(Group-I) and treatment groups (Group-II, III) at the time of A.I. A conception rate of 18.18, 36.36 and 45.45 per cent
was obtained for Group-I, Group-II and Group-III, respectively. Conception rate obtained between the control and
treated repeat breeder cows differed significantly.
Key words: Ovsynch-56, repeat breeder cow, diestrus, conception rate

Frontier J. Vet. Anim. Sci.Vol. 4, No. 2 (July-Dec.) 2015 138
hours after administration of PGF2α ovulated within
24 h (between 72 and 96 hours after administration
of PGF2α). They concluded that GnRH
administration between 56 and 60 h following
PGF2α administration resulted in the tightest
synchrony of ovulation. Brusveen et al. (2008)
evaluated altering the time of the second GnRH
injection and AI during Ovsynch in lactating dairy
cows and observed that P/AI was lower in cows
receiving GnRH at 48 h (Cosynch-48, 29.2 %) or
72 h (Cosynch-72, 25.4 %) after PGF2α and
inseminated concurrently that in those given GnRH
at 56 h and inseminated 16 h later (Ovsynch-56,
38.6 %).
Although, Ovsynch-56 yielded better
conception rates in lactating dairy cattle, the
efficacy of the same has not been attempted in
repeat breeder cows when initiated during the early
diestrus stage. Hence, the present study was
conducted to evaluate the efficacy of Ovsynch and
modified Ovsynch protocol (Ovsynch-56) on the
conception rate in repeat breeder cows when
initiated during the early diestrus stage.
MATERIALS AND METHODS
The study was carried out on 33 randomly selected
repeat breeder cows aged 3-8 years in their first to
fourth lactation with BCS between 2.5 and 3.5. The
total number of services for repeat breeder cows in
the present study ranged from 3-7 with an average
number of 4.5 services. The number of days these
animals were not pregnant at the time of
presentation for treatment ranged from 150 to 240
days. All the cows were subjected to thorough
clinico-gynaecological examination to ascertain the
stage of estrous cycle based on trans-rectal
palpation for the presence of CL and correlating
with the history obtained from the owner regarding
the day of last estrus.
These 33 repeat breeder cows were
randomly divided into three groups with 11 cows in
each group. Group-I (Control) repeat breeder cows
were subjected to single A.I during the observed
estrus. Group-II repeat breeder cows were subjected
to Ovsynch-48 with FTAI. Repeat breeder cows in
this group received 10 µg GnRH intramuscular on
day 0 (day of start of the treatment) and 500 µg of
PGF2α intramuscular on day 7. A second dose of 10
µg of GnRH was administered on day 9 and FTAI
was carried out at 16-20 h after the second GnRH
injection. Group-III cows were subjected to
Ovsynch-56 with FTAI. 10 µg of GnRH was
administered to all the repeat breeder cows on day 0
(day of start of the treatment). 500 µg of PGF2α
was administered intramuscular on day 7. A second
dose of 10 µg of GnRH was administered at 56 h
after the PGF2α injection and FTAI was carried out
at 16-20 h from the second GnRH. Repeat breeder
cows in Group-II and III were initiated with
synchronization protocol anywhere between day 5-
12 of the estrous cycle.
Blood samples were collected from all the
three groups for estimation of serum progesterone
both at the time of induction of treatment (Group-II
and Group-III only) and at the time of A.I (Group-I,
II and III). Endometrial cytology was performed in
all the repeat breeder cows before A.I. by uterine
lavage technique as described by Salasel et al.
(2010) to rule out subclinical endometritis. The
diagnosis of subclinical endometritis was arrived
when the endometrial cytology revealed the
threshold of 10 % PMNs in the uterine smears
(Kasimanickam et al., 2004). Repeat breeder cows
in the three groups were subjected to pregnancy
diagnosis by trans-rectal ultrasound scanning using
linear array probe with 7.5 MHz frequency on day
30 post A.I. and confirmed by rectal examination at
day 45 post A.I. to evaluate the conception rate.
Mean values (± SE) for serum
progesterone levels for repeat breeder cows of three
groups were computed and analyzed statistically
using one way analysis of variance under
completely randomized design (Steel and Torrie,
1980). The conception rates for the three groups
were analyzed by Chi-square test. Results were
considered to be statistically significant when “P”
values are less than 0.05 (P < 0.05).
RESULTS AND DISCUSSIONS
Serum progesterone concentration: The mean
serum progesterone concentrations at the time of
first GnRH injection in the treated repeat breeder
cows (Group-II and III) were recorded as 2.95 ± 0.6
and 2.36 ± 0.41 ng/ml, respectively (Table). The

Frontier J. Vet. Anim. Sci.Vol. 4, No. 2 (July-Dec.) 2015 139
mean serum progesterone concentrations among the
treatment groups showed no significant variations
(P>0.05). The observation on serum progesterone
concentrations at first GnRH in the two treatment
groups confirm that all the repeat breeder cows in
these groups were in diestrus stage of the estrous
cycle when estrus synchronization protocol were
initiated. Vasconcelos et al. (1999) and Moreira et
al. (2000) initiated Ovsynch protocol during
different stages of the estrous cycle and concluded
that the best stage to initiate the Ovsynch protocol
was the early luteal phase of the estrous cycle to
obtain better conception rate.
The mean serum progesterone
concentrations at A.I. were 0.61 ± 0.06, 0.56 ± 0.08
and 0.39 ± 0.07 ng/ml in Group-I, II and III,
respectively (Table). Analysis of the data revealed
that there was no significant differences (P>0.05) in
the mean serum progesterone concentrations
between the control and treatment groups at the
time of A.I. This is in agreement with the findings
of Kim et al. (2007), Celik et al. (2009) and
Ravikumar et al. (2014) who also reported no
significant differences in serum progesterone
concentrations on the day of AI in the untreated and
treated repeat breeder cows. Further, the serum
progesterone concentrations in every animal
assigned to untreated and treated repeat breeder
groups was less than 1 ng/ml confirming the
complete luteolysis and the onset of estrus.
Endometrial cytology: None of the 33 repeat
breeder cows were found positive for subclinical
endometritis by lavage technique at the time of A.I.
Conception rate: The conception rates obtained
were 18.18, 36.36 and 45.45 per cent for Group-I,
Group-II and Group-III, respectively (Table).
Analysis of the data revealed that there was a
significant difference in the conception rate
(P<0.05) between the groups.
The conception rate (18.18%) obtained for
untreated repeat breeder cows (Group-I) is in
agreement with the values of 20 per cent (Awasthi
et al., 2002), 20.56 per cent (Amiridis et al., 2009),
25 per cent (More et al., 2012) and 25 per cent
(Vijayarajan and Meenakshisundaram, 2013)
reported for untreated repeat breeder cows. The low
conception rate of 18.18 per cent obtained for the
untreated repeat breeder cows (Group-I) could be due
to the small sample size, varying age of the cows,
parity and the suprabasal levels of progesterone (0.61
± 0.06 ng/ml) recorded in this group.
The conception rate of 36.36 per cent
obtained for repeat breeder cows subjected to
Ovsynch-48 with FTAI (Group-II) agrees with the
earlier reported values of 31.5 per cent (Bartolome
et al., 2000) for postpartum dairy cows. However,
the conception rate is lower than the reported
values of 50 per cent (Vijayarajan et al., 2009),
66.67 per cent (Ravikumar, 2014) in repeat breeder
cows. On the other hand, the conception rate
obtained in this group is much higher than the
reported values of 22.3 per cent (Kasimanickam et
al., 2005) and 27.2 per cent (Celik et al., 2009) for
repeat breeder cows.
Five out of 11 repeat breeder cows
subjected to Ovsynch-56 became pregnant with a
conception rate of 45.45 per cent. This is in close
agreement with the earlier reported value of 44.8
per cent (Brusveen et al., 2008) in dairy cows.
Higher conception rates have been reported for
cows subjected to Ovsynch-56 than Ovsynch
protocol alone (Brusveen et al., 2008; Mecitoglu et
al., 2012). The present study also reported a
significantly (P< 0.05) higher conception rate of
45.45 per cent for Ovsynch-56 group than 36.36 per
cent for Ovsynch-48 in repeat breeder cows. The
increase in conception rate for repeat breeder cows
subjected to OVS-56 could possibly be subscribed
to tight synchrony of ovulation and allowing more
time for the recruited follicle to undergo
maturation. Even though, Ovsynch-56 increases
fertility compared with Ovsynch-48, the difficulty
for dairy managers in implementing Ovsynch-56
will be handling cows in both the morning and
evening hours during reproductive management
protocol. Nevertheless, the improved conception
rate obtained using Ovsynch-56 in the present study
is likely to offset any increase in labor costs needed
to implement this change.
Hence, it can be concluded that Ovsynch-
56 can be effectively implemented to improve
conception rate than Ovsynch-48 in repeat breeder

Frontier J. Vet. Anim. Sci.Vol. 4, No. 2 (July-Dec.) 2015 140
cows when initiated during the early diestrus stage
of the estrous cycle. They can be implemented in
dairy herds as well as in cows of individual dairy
farmers with high milk yield. Such a treatment
would definitely reduce the number of days open
and enable the repeat breeder cows to conceive at
an early stage.
Table: Mean serum progesterone concentrations
and conception rate in control and treated
repeat breeder cows
Groups
Mean Serum
Progesterone
Concentration (ng/ml) Conce-
ption
rate
(%)
At first
GnRH of
Synchronization
Protocol
At the
time of
A.I
Group-I
(Control)
n= 11
*** 0.61 ±
0.06
18.18c
(2/11)
Group-II
(Ovsynch-48)
n=11
2.95 ± 0.60 0.56 ±
0.08
36.36b
(4/11)
Group-III
(Ovsynch-56)
n=11
2.36 ± 0.41 0.39 ±
0.07
45.45a
(5/11)
The values with different superscript in column differs
significantly (P< 0.05)
REFERENCES
Amiridis G.S., Tsiligianni T. H., Dovolou E.,
Rekkas C., Vouzaras D. and Menegatos I.
(2009). Combined administration of
gonadotrophin-releasing hormone,
progesterone, and meloxicam is an
effective treatment for the repeat-breeder
cow. Theriogenology, 72: 542-548.
Awasthi M.K., Tiwari R.P. and Mishra O.P. (2002).
Effect of progesterone supplementation
during mid luteal phase on conception in
repeat breeder crossbred cows. Indian. J.
Anim. Reprod. 23(1): 67-68.
Bartolome J.A, Archbald L.F., Morresey P.,
Hernandez J., Tran T., Kelbert D., Long
K., Risco C.A. and Thatcher W.W. (2000).
Comparison of synchronization of
ovulation and induction of estrus as
therapeutic strategies for bovine ovarian
cysts in the dairy cow. Theriogenology,
53:815-825.
Brusveen D.J., Cunha A.P., Silva C.D., Cunha
P.M., Sterry R.A., Silva E.P.B., Guenther
J.N. and Wiltbank M.C. (2008). Altering
the time of the second gonadotrophin-
releasing hormone injection and artificial
insemination (AI) during Ovsynch affects
pregnancies per AI in lactating dairy cows.
J. Dairy Sci., 91:1044-1052.
Celik H.A., Avci G., Aydin I., Bulbul A. and
Bulbul T. (2009). Effect of β-carotene and
ovarium functions and ovsynch success in
repeat breeder cows. Kafkas Univ Vet Fak
Derg., 15(1): 87-94.
Colazo M.G. and Ambrose D.J. (2013). New
Research in Controlled Breeding Programs
for dairy Cattle. WCDS Advances in Dairy
Technology. 25: 75-95.
Kasimanickam R., Cornwell J.M. and Nebel R.L.
(2005). Fertility following fixed-time AI
or insemination at observed estrus in
Ovsynch and Heatsynch programs in
lactating dairy cows. Theriogenology, 63:
2550-2559.
Kasimanickam R., Duffield T.F., Foster R.A., Gartley
C.J., Leslie K.E., Walton J.S. and Johnson
W.H. (2004). Endometrial cytology and
ultrasonography for the detection of
subclinical endometritis in postpartum dairy
cows. Theriogenology, 62: 9-23.
Kim U.H., Suh G.H., Hur T.Y., Kang S.J., Kang
H.G., Park, S.B., Kim H.S. and Kim I.H.
(2007). Comparison of two types of
CIDR-based timed artificial insemination
protocols for repeat breeder dairy cows. J.
Reprod. Dev., 53: 639-645.
Mecitoglu G.Y., Gumen A., Tasdem R.U., Keskin
A., Karakaya E., Alkan A. and Okut H.
(2012). Improving conception rate in
lactating dairy cows by using modified
Ovsynch protocol during summer. J. Biol.
Environ. Sci., 6(18): 207-212.
More R.M., Patil D., Kumbhar U.B. and Mugale
R.R. (2012). Fertility improvement by
hormonal therapies in repeat breeding
cows. Indian J. Anim. Reprod. 33(2): 61-63.

Frontier J. Vet. Anim. Sci.Vol. 4, No. 2 (July-Dec.) 2015 141
Moreira F., de la Sota R.L., Diaz T. and Thatcher
W.W. (2000). Effect of day of the estrous
cycle at the initiation of a timed
insemination protocol on reproductive
responses in dairy heifers. J. Anim. Sci.,
78: 1568-1576.
Peters A.R., Mawhinney I., Drew S.B., Ward S.J.,
Warren M.J. and Gordon P.J. (1999).
Development of a gonadotrophin releasing
hormone and prostaglandin regimen for
the planned breeding of dairy cows. Vet.
Rec., 145: 516-521.
Pursley J.R., Mee M.O., and Wiltbank M.C. (1995).
Synchronization of ovulation in dairy
cows using PGF2α and GnRH.
Theriogenology. 44: 915-923.
Pursley J.R., Wiltbank M.C., Stevenson J.S.,
Ottobre J.S., Garverick H.A. and Anderson
L.L. (1997). Pregnancy rates per artificial
insemination for cows and heifers
inseminated at a synchronized ovulation or
synchronized estrus. J. Dairy Sci., 80 (2):
295-300.
Ravikumar B.P., Krishnaswamy A., Devaraj M.,
Chandrashekara Murthy V., Sridhar Bhat
and Ramchandra S.G. (2014). Effect of
oxytocin and prostaglandins on conception
rate of repeat breeder cows during
ovulation synchronization. Frontier J. Vet.
Anim. Sci. 3(1): 24-26.
Salasel B., Mokhtari A. and Taktaz T. (2010).
Prevalence, risk factors for and impact of
subclinical endometritis in repeat breeder
dairy cows. Theriogenology, 74: 1271-1278.
Steel R.G.D. and Torrie J.H. (1980). Principles and
Procedures of Statistics, 2nd
Edn., New
York: McGraw-Hill Book Co.
Stevenson J.S., Kobayashi Y. and Thompson K.E.
(1999). Reproductive performance of dairy
cows in various programmed breeding
systems including Ovsynch and
combinations of gonadotrophin releasing
hormone and prostaglandin F2α. J. Dairy
Sci., 82:506-515.
Vasconcelos J.L.M., Silcox R.W., Rosa G.J.M.,
Pursley J.R. and Wiltbank M.C. (1999).
Synchronization rate, size of the ovulatory
follicle and pregnancy rate after
synchronization of ovulation beginning on
different days of the estrous cycle in
lactating dairy cow. Theriogenology, 52:
1067-1078.
Vijayarajan A and Meenakshisundaram S. (2013).
Effect of CIDR and PGF2α to augment
fertility in repeat breeding Holstein
Freisian crossbred cow. Indian J. Anim.
Reprod. 34 (1): 54-56.
Vijayarajan A., Chandrahasan C. and Ezakial
Napolean R. 2009. Synchronization of
estrus in repeat breeding crossbred cows.
Indian J. Field Vet., 5(1): 57-58.

Frontier J. Vet. Anim. Sci.Vol. 4, No. 2 (July-Dec.) 2015 142
*Part of M.V.SC thesis submitted by the first author to KVAFSU, Bidar- 585401, Karnataka, India 1Veterinary Officer, VD, Yaraganahalli, Maddur(Tq), Mandya(Dist). Karnataka. Email: [email protected] 2Assistant Professor, Department of Veterinary Physiology and Biochemistry
Sheep and goat are the important sources of milk,
meat and fibres as well as products of high
economic value. Many farmers especially small and
marginal farmers depend mainly on goat and sheep
husbandry but heavy mortality is reported due to
respiratory tract diseases, developmental deformity,
faulty branching of bronchiolar tree and defective
development of respiratory alveolar system. These
become the challenging problems in the growth of
goat and sheep husbandry. In order to gain
complete understanding of cause and their possible
elimination, the knowledge of histomorphology of
conducting and respiratory portion of lung very is
essential. There are no studies on the comparative
histomorphology of conducting portion of lung in
Bidri goat and Deccani sheep.
MATERIALS AND METHODS
The study was carried out in the Department of
Veterinary Anatomy and Histology, Veterinary
College, Bidar, Karnataka. The samples were taken
from medial, central and lateral portion of all six
lobes of lung from eight adult Bidri goat and eight
adult Deccani sheep immediately after slaughter
from local slaughter house and they were fixed in
different fixatives like 10% Neutral buffered
formalin, Zenker‟s fluid and Bouin‟s fluid. The
samples were processed in Isopropyl alcohol-
Xylene sequence and embedded in paraffin by
routine method (Luna, 1968) and sections were cut
at 6-8µm thickness. The following staining
techniques were carried out to study
histomorphological feature of lung. Harries
Haematoxylin and Eosin stain (Luna, 1968), Van
Geison‟s stain for collagen fibres (Bancroft et al.,
2008), Verhoeff‟s method for elastic fibres (Singh
and Sulochana, 1996), Gomori‟s method for
reticular fibres (Luna, 1968) and Azan‟s Trichrome
method for connective and muscle fibres (Singh
and Sulochana, 1996).
RESULTS AND DISCUSSION
The conducting portion consisted of intra
pulmonary bronchi, bronchioles and terminal
bronchioles in both adult Bidri goat and adult
Deccani sheep. This finding is similar to earlier
reports of Banks (1993), Trautmann and Fiebiger
(2002) in domestic animals.
In the present study, three types of
intrapulmonary bronchi were noticed in both adult
Deccani sheep and adult Bidri goat. This
classification is in accordance with Trautmann and
Fiebiger (2002) who reported primary, secondary
and tertiary bronchi based on abundance of smooth
Comparative Histomorphology of Conducting Portion of Lung in Bidri Goat
and Deccani Sheep*
Ashwinin1, S., Ashok Pawar, Sathisha, K. B
2., Girish, M. H. and Gadre, K. M.
Department of Veterinary Anatomy, Veterinary College, Bidar-585401.Karnataka.India
Received: 23 January, 2015; Accepted: 29 July, 2015
ABSTRACT
The present comparative histological study of lung in Bidri goat (Capra hircus) and Deccani sheep (Ovis aries) was
carried out to know the structural differences between these animals. The structures of conducting portion in both
species had mucosa lined by pseudo-stratified ciliated columnar epithelium with goblet cells and basal cells in bronchi,
ciliated columnar and non-ciliated columnar epithelium in bronchiole and simple low columnar to cuboidal epithelium
in terminal bronchiole. Lamina propria contained collagen, reticular and elastic fibres. Lamina muscularis had varying
amount of smooth muscle fibres in different regions. Submucosa of primary and secondary bronchi had serous
dominant bronchial glands. The fibroelastic layer had large hyaline cartilage plates in primary bronchi, small isolated
plates in secondary bronchi and these were absent in distal conducting portion. No major histomorphological
differences were noticed between these animals except more number of bronchial glands in Bidri goat.
Kay words: Lung, Goat, Sheep, Histomorphology

Frontier J. Vet. Anim. Sci.Vol. 4, No. 2 (July-Dec.) 2015 143
muscle fibres in lamina muscularis and presence of
hyaline cartilage plates in fibro elastic layer in
domestic animals.
Primary bronchi of both adult Bidri goat
and adult Deccani sheep consisted of folded
mucosa lined by pseudo-stratified ciliated columnar
epithelium, goblet cell and basal cell in the
epithelial lining (Fig.1 and 2). In the secondary and
tertiary bronchi the epithelial mucosa was lined by
pseudo-stratified ciliated columnar epithelium,
goblet cells and basal cells but the goblet cell
number reduced gradually from primary bronchi to
tertiary bronchi. The present findings are similar to
earlier findings of Mariassy and Plopper (1983) in
sheep, Trautmann and Fiebiger (2002) and
Dellmann (2006) in domestic animals. It was
observed that the height of epithelial mucosa of
primary bronchi was 54.14±2.97µm, secondary
bronchi 32.62±1.34µm and tertiary bronchi was
27.58±1.56µm in adult Bidri goat whereas, in adult
Deccani sheep it was 51.63±2.55µm,
30.50±0.20µm and 28.78±1.31µm respectively.
These studies showed a gradual reduction in height
of mucosal epithelia from primary bronchi to
tertiary bronchi. This finding is similar to Attar
Singh et al. (2001) who reported reduction in height
of mucosal epithelia from 57.43±2.98µm in more
proximal bronchi to 22.15±0.73µm in most distal
bronchi in buffalo.
Fig.1: Photomicrograph of primary bronchi showing
pseudo-stratified ciliated epithelium (A), goblet cell
(B) and basal cell (C) in epithelial lining, fibroblast in
lamina propria (D), smooth muscle fibres in lamina
muscularis (E) and bronchial gland in submucosa (F)
of adult Bidri goat (H&E, X 40)
Fig. 2: Photomicrograph of primary bronchi showing
mucosal epithelial lining (A), isolated bundles of
smooth muscle fibres (B) in lamina muscularis,
capillary (C) and bronchial gland (D) in submucosa
and large hyaline cartilage plates (E) in fibroelastic
layer of adult Deccani sheep (H&E, X 10)
Lamina propria of primary bronchi,
secondary bronchi and tertiary bronchi was made
up of loose connective tissue consisted of fine
network of elastic, reticular, collagen fibres and
fibroblasts in both adult Bidri goat and adult
Deccani sheep (Fig. 3 and 4). It is similar to earlier
reports of Mariassy and Plopper (1983) in sheep,
Trautmann and Fiebiger (2002) and Dellmann
(2006) in domestic animals.
Fig.3: Photomicrograph of primary bronchi showing
elastic fibres in lamina propria (arrow) of adult Bidri
goat (Verhoeff’s stain, X 40)
The muscularis mucosa of both adult Bidri
goat and adult Deccani sheep was discontinuous
and had bundles of smooth muscle fibres in primary
bronchi. In secondary bronchi, abundance of
smooth muscle increased relatively in lamina
muscularis and in tertiary bronchi lamina

Frontier J. Vet. Anim. Sci.Vol. 4, No. 2 (July-Dec.) 2015 144
muscularis consisted of continuous layer of smooth
muscle fibres (Fig. 4). The observations are similar
to earlier reports of Mariassy and Plopper (1983) in
sheep, Trautmann and Fiebiger (2002) and
Dellmann (2006) in domestic animals and Kalita et
al. (2003) in yak.
Fig.4: Photomicrograph primary bronchi showing
collagen fibre (A) in lamina propria and smooth
muscle (B) fibres in lamina muscularis of adult
Deccani sheep (Van Geison’s stain, X 40)
The submucosa of primary bronchi,
secondary bronchi and tertiary bronchi was wider
and composed of loosely arranged connective tissue
fibres in adult Bidri goat and adult Deccani sheep.
Presence of serous type of bronchial glands were
observed in submucosa of primary and secondary
bronchi only and it was also noticed that number of
bronchial glands were less in secondary bronchi
than in primary bronchi. Bronchial glands were not
observed in submucosa of tertiary bronchi in both
adult Bidri goat and adult Deccani sheep (Fig. 3).
This finding is similar to observation of Mariassy
and Plopper (1983) in sheep, Trautmann and
Fiebiger (2002) and Dellmann (2006) in domestic
animals. In the present study, it was noticed that
there was a difference in the distribution of
bronchial glands since they were more in both
primary and secondary bronchi of adult Bidri goat
than that of adult Deccani sheep. This may be due
to breed variations.
The primary bronchi consisted of
fibroelastic layer made up of large hyaline cartilage
plates which completely surrounded the submucosa
layer (Fig. 5) and in secondary bronchi fibro elastic
membrane contained isolated plates of hyaline
cartilage and no cartilage plates or strips were
observed in fibroelastic layer of tertiary bronchi.
The present findings were in agreement with the
earlier reports of Trautmann and Fiebiger (2002)
Dellmann (2006) in domestic animals.
Fig. 5: Photomicrograph of primary bronchi showing
mucosal epithelial lining (A), isolated bundles of
smooth muscle fibres (B) in lamina muscularis,
bronchial gland (C) in submucosa and large hyaline
cartilage plates (D) in fibroelastic layer of adult
Deccani sheep (H&E, X 4)
Peribronchial layer of primary, secondary
and tertiary bronchi consisted of loose connective
tissue mainly of collagen and little elastic fibres in
both adult Bidri goat and adult Deccani sheep and it
was also noticed the presence of blood vessels
nerve fibres, ganglions and lymphatic aggregations
in all region of intrapulmonary bronchi. These
observations were similar to the reports of
Trautmann and Fiebiger (2002) and Dellmann
(2006) in domestic animals, whereas Singh and
Mariappa (1981) observed aggregation of lymphoid
tissue in the connective tissue wall of the bronchi in
buffalo and Anderson et al. (1986) noticed the more
number of bronchus associated lymphoid tissue in
adult bovine as compare to young animals.
In the present study, the epithelial
mucosa of bronchioles in adult Bidri goat and
adult Deccani sheep was folded and lined by
simple columnar epithelium consisted of ciliated
columnar cells and non-ciliated columnar cells
(Fig.6). The present findings were similar to
earlier reports of Suman et al. (2005) in goat,
whereas Baskervilli (1970) reported four type of
cells viz., pseudo-stratified ciliated columnar
epithelium, non-ciliated, goblet and brush cells in
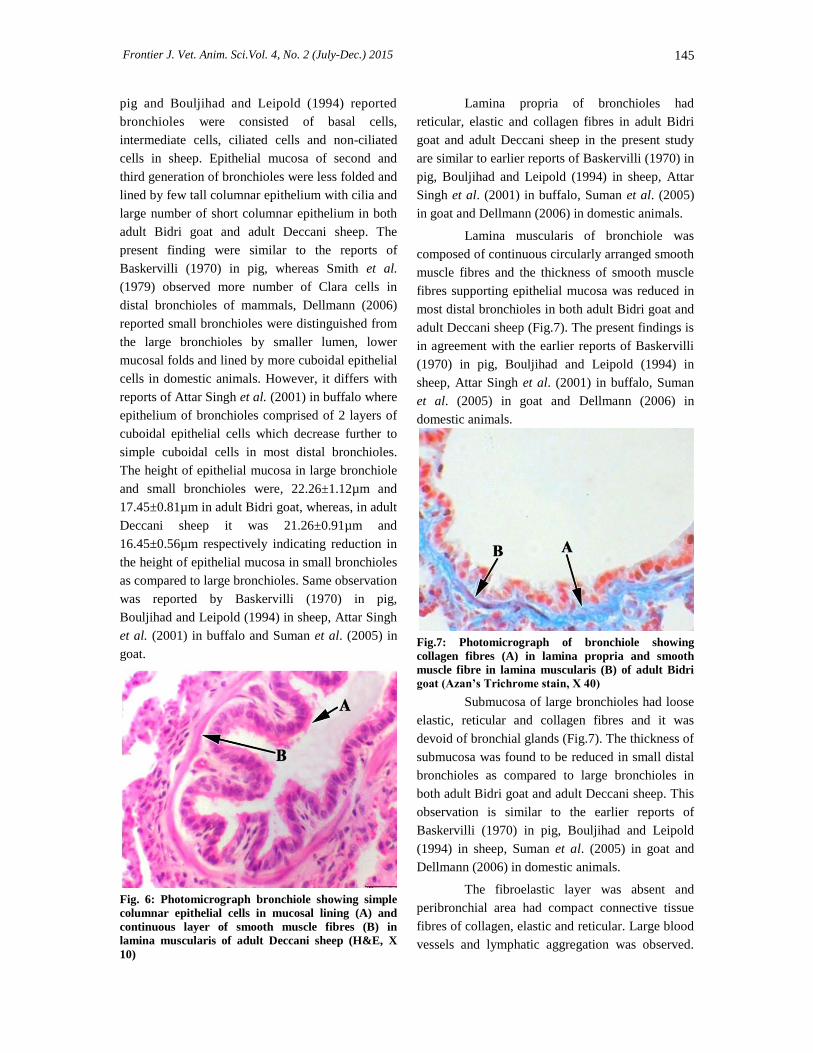
Frontier J. Vet. Anim. Sci.Vol. 4, No. 2 (July-Dec.) 2015 145
pig and Bouljihad and Leipold (1994) reported
bronchioles were consisted of basal cells,
intermediate cells, ciliated cells and non-ciliated
cells in sheep. Epithelial mucosa of second and
third generation of bronchioles were less folded and
lined by few tall columnar epithelium with cilia and
large number of short columnar epithelium in both
adult Bidri goat and adult Deccani sheep. The
present finding were similar to the reports of
Baskervilli (1970) in pig, whereas Smith et al.
(1979) observed more number of Clara cells in
distal bronchioles of mammals, Dellmann (2006)
reported small bronchioles were distinguished from
the large bronchioles by smaller lumen, lower
mucosal folds and lined by more cuboidal epithelial
cells in domestic animals. However, it differs with
reports of Attar Singh et al. (2001) in buffalo where
epithelium of bronchioles comprised of 2 layers of
cuboidal epithelial cells which decrease further to
simple cuboidal cells in most distal bronchioles.
The height of epithelial mucosa in large bronchiole
and small bronchioles were, 22.26±1.12µm and
17.45±0.81µm in adult Bidri goat, whereas, in adult
Deccani sheep it was 21.26±0.91µm and
16.45±0.56µm respectively indicating reduction in
the height of epithelial mucosa in small bronchioles
as compared to large bronchioles. Same observation
was reported by Baskervilli (1970) in pig,
Bouljihad and Leipold (1994) in sheep, Attar Singh
et al. (2001) in buffalo and Suman et al. (2005) in
goat.
Fig. 6: Photomicrograph bronchiole showing simple
columnar epithelial cells in mucosal lining (A) and
continuous layer of smooth muscle fibres (B) in
lamina muscularis of adult Deccani sheep (H&E, X
10)
Lamina propria of bronchioles had
reticular, elastic and collagen fibres in adult Bidri
goat and adult Deccani sheep in the present study
are similar to earlier reports of Baskervilli (1970) in
pig, Bouljihad and Leipold (1994) in sheep, Attar
Singh et al. (2001) in buffalo, Suman et al. (2005)
in goat and Dellmann (2006) in domestic animals.
Lamina muscularis of bronchiole was
composed of continuous circularly arranged smooth
muscle fibres and the thickness of smooth muscle
fibres supporting epithelial mucosa was reduced in
most distal bronchioles in both adult Bidri goat and
adult Deccani sheep (Fig.7). The present findings is
in agreement with the earlier reports of Baskervilli
(1970) in pig, Bouljihad and Leipold (1994) in
sheep, Attar Singh et al. (2001) in buffalo, Suman
et al. (2005) in goat and Dellmann (2006) in
domestic animals.
Fig.7: Photomicrograph of bronchiole showing
collagen fibres (A) in lamina propria and smooth
muscle fibre in lamina muscularis (B) of adult Bidri
goat (Azan’s Trichrome stain, X 40)
Submucosa of large bronchioles had loose
elastic, reticular and collagen fibres and it was
devoid of bronchial glands (Fig.7). The thickness of
submucosa was found to be reduced in small distal
bronchioles as compared to large bronchioles in
both adult Bidri goat and adult Deccani sheep. This
observation is similar to the earlier reports of
Baskervilli (1970) in pig, Bouljihad and Leipold
(1994) in sheep, Suman et al. (2005) in goat and
Dellmann (2006) in domestic animals.
The fibroelastic layer was absent and
peribronchial area had compact connective tissue
fibres of collagen, elastic and reticular. Large blood
vessels and lymphatic aggregation was observed.

Frontier J. Vet. Anim. Sci.Vol. 4, No. 2 (July-Dec.) 2015 146
The thickness of the peribronchial area was found to
be reduced in small distal bronchioles as compared to
proximal bronchiole in both adult Bidri goat and adult
Deccani sheep in the present study. These findings
were similar to findings of Bouljihad and Leipold
(1994) in sheep, Suman et al. (2005) in goat and
Dellmann (2006) in domestic animals.
In the present study the epithelial mucosa of
terminal bronchioles had smaller lumen compare to
bronchioles and were lined by low columnar to
cuboidal cells and also consisted of few ciliated
cuboidal epithelial cells but number of non ciliated
cuboidal epithelial cells were more in both adult
Bidri goat and adult Deccani sheep (Fig. 8). The
present findings are similar to earlier report of
Baskerville (1970) in pig, Mariassy and Plopper
(1983) and Bouljihad and Leipeld (1994) in sheep
and Wright et al. (1983) in dog, Bhatacharyya and
Bishya (1995), Kahwa and Purton (1996) and Khawa
and Atwal (1997) in goat and Trautmann and
Feibiger (2002) in domestic animals. The Mean±SE
height of epithelial mucosa of terminal bronchiole
was 12.90±0.49µm in adult Bidri goat, whereas, it
was 10.45±0.45µm in adult Deccani sheep. The
earlier reports were not available with respect to the
measurement of height of epithelial mucosa of
terminal bronchioles, whereas, Baskerville (1970) in
pig, Mariassy and Plopper (1983) and Bouljihad and
Leipeld (1994) in sheep, Kahwa and Purton (1996)
in goat and Trautmann and Fiebiger (2002) in
domestic animals reported the reduction in the height
of epithelial mucosa in terminal bronchiole as
compared to proximal bronchioles.
Fig.8: Photomicrograph of terminal bronchiole
showing cuboidal epithelial cells (arrow) in epithelial
mucosa of adult Deccani sheep (H&E, X 40)
Basement membrane of terminal
bronchioles was indistinct and cells lining were
supported loose connective tissue consisted of
small collagen, reticular, elastic fibres (Fig.9) and
bundle of smooth muscle fibres and the smooth
muscle fibres were seen more in proximal terminal
bronchioles than that of distal terminal bronchioles
in both adult Bidri goat and adult Deccani sheep in
the present study. These findings were similar to
earlier reports of Baskerville (1970) in pig,
Mariassy and Plopper (1983) in sheep, Khawa and
Atwal (1997) in goat and Trautmann and Fiebiger
(2002) in domestic animals and it was observed that
the distal terminal bronchioles gave 2-3 generations
of respiratory bronchioles in both adult Bidri goat
and adult Deccani sheep. These findings are almost
similar to earlier reports of King (1982) and Banks
(1993) who reported that the terminal bronchiole
gave off 3-5 generation of respiratory bronchioles
in pig and ruminants respectively.
Fig.9: Photomicrograph of terminal bronchiole
showing reticular fibres in lamina propria (arrow) of
adult Bidri goat (Gomorie’s stain, X 40)
CONCLUSION
In the present study, it was observed that little
histomorphological variation in conducting
portion in lung of adult Bidri goat and adult
Deccani sheep than that of other domestic
animals. There was no major structural
difference in the conducting portion in lung of
adult Bidri goat and adult Deccani sheep
whereas, the numbers of bronchial glands were
more in primary and secondary bronchi of adult
Bidri goat than that of adult Deccani sheep.

Frontier J. Vet. Anim. Sci.Vol. 4, No. 2 (July-Dec.) 2015 147
REFERENCES
Anderson, M.L., Moore, P. F., Hyde, D.M. and
Dungworth, D. L. (1986). Bronchus
associated lymphoid tissue in the lung of
cattle: relationship to age. Res. Vet. Sci.
41: 211-220
Attar Singh, Gurdial Singh and S. K. Nagpal.
(2001). Histomorphology of the
conducting and respiratory pathways of
buffalo lungs. Haryana Vet. J. 40: 41-44.
Bancroft, D. Jhon., Suvarna, S. KIM and
Christopher, Layton. (2008). Bancroft‟s
theory and practice of histological
techniques, Edn 6th
, Churchill livingstone,
Elsevier., pp:121-161
Banks. W. J. (1993). Applied Veterinary Histology,
Edn 3rd
. Williams and Wilkins, Mosby Year
Book, St Louis Baltimore., pp: 447-462
Baskerville, A. (1970). Ultrastuctural studies of the
normal pulmonary tissue of the pig. Res.
Vet. Sci., 11: 150-155
Bhattacharyya, R. and Baishya, G. (1995).
Histomorphological development of lung
in prenatal goat. Indian J. Anim. Sci.
65:1296-1300
Bouljihad, M. and Leipold, H. W. (1994). An
Ultrastructural study of pulmanory
bronchiolar and alveolar epithelium in
sheep. J. Vet. Med. Assoc. 41: 573-586
Dellmann, H.D. (2006). Text Book of Veterinary
Histology. Edn 6th
. Lea and Febiger,
Philadelphi, USA., pp: 153-169
Kahwa, C.K.B. and Purton, M. (1996). Histological
and histochemical study of epithelial
lining of the respiratory tract in adult
goats. Small Rum. Res. 20:181-186
Kahwa, C.K.B., Atwal, O. S. and Purton, M.
(1997). Transmission electron microscopy
of the epithelium of distal airways and
pulmonary parenchyma of goat lung. Res.
Vet. Sci. 63: 49-56
Kalita, H. C., P. C. Kalita, and M. Bhattacharya.
(2003). Histomorphological studies of the
bronchioles of yak (Bos grunions). Indian
J. Anim. Sci. 73 (9):969-971
King, A. S. (1982). Physiological and Clinical
Anatomy of the Thorax, 4th
edn.
University of Liverpool, pp: 376-403
Luna, L.G. (1968). Manual of histological staining
methods of armed forces of institute of
pathology, Edn 3rd
. McGraw Hill book co.,
New York., pp: 32-99
Mariassy, A. T and Plopper, C. G. (1983). Tracheo-
bronchial epithelium of sheep. I.
Quantitetive light microscopic study of
epithelial cell abundance and distribution.
Anat.Rec. 205:263-275
Singh, K. and Mariappa, D. (1981). Histological
studies of the conducting and respiratory
divisions of the buffalo lung. Indian Vet. J.
58: 9-103
Singh, U. B. and Sulochana, S. (1996). Handbook
of histological and histochemical
techniques, Edn 2nd
. Premier publishing
house, Hyderabad. pp: 39-42
Smith, M. N., S. D. Greenberg, and H. J. Sput.
(1979). The clara cell: a comparative
ulrtastructure study in mammals. Am. J.
Anat. 155:15-30
Suman, A.N., Gupta and Jain, R.K. (2005).
Histomorphology and histochemistry of
respiratory bronchioles during postnatal
development of lung in goat. Haryana Vet.
44: 55-59
Trautmann, A and Fiebiger, J. (2002).
Fundamentals of Histology of Domestic
Animals. Livestock Publishing Associate,
Ithaca, New York. pp: 106-119
Wright, N. G., Brown, R.M.H., Mccandlish, I.A.P.,
Thompson, H. and Cornwell, H. J. C.
(1983). Patterns of cilia formation in the
lower respiratory tract of the dog: A
scanning electron microscopic study. Res.
Vet. Sci. 34: 340-346.

Frontier J. Vet. Anim. Sci.Vol. 4, No. 2 (July-Dec.) 2015 148
*Part of M.V.Sc., Thesis of the First Author approved by S.V.V.U., Tirupati – 517 502. 1Assistant Professor, Animal Husbandry Polytechnic, LRIC, Konehalli,Tiptur- 572201 Tumkur Dist. Karnataka. E mail.:
[email protected], [email protected] 2Prof. and Head, Dept. of Clinical Veterinary Medicine, College of Veterinary Sciences, Tirupati, Andhra Pradesh. E mail:
Hepatic disorders are not uncommon in dogs due to
various insults to the liver. Early and accurate
identification of hepatic disorders is important to
improve the long-term outcome (Cooper, 2006).
Any insult to liver causes damage to hepatobiliary
system, which inturn causes leakage of enzymes
(ALT, AST), increase in enzymes because of
accelerated production stimulated by bile retention
(ALP, GGT) affects cell synthesis (proteins,
albumin and fibrinogens) and pigment metabolism
(Bilrubin stasis).
During recent years, hepatic
ultrasonography has become an important diagnosic
tool in the differentiation of canine hepatopathies
(Nyland and Mattoon, 1995). The present study
describes haemato-biochemical and
ultrasonographical changes in hepatic disorders in
dogs.
MATERIALS AND METHOD
Clinical cases of dogs (22) which were confirmed
to be positive for hepatic disorders (German
shepherd 8, Mongrel 5, Spitz 4, Labrador retriever
3, Dalmatian 1 and Dachshend 1) among the dogs
presented or referred to the Teaching Veterinary
Clinical Complex and College Hospital of College
of Veterinary Science, Tirupati, during the study
period of one year formed the material for the
present study. They were confirmed to be positive
for hepatic disorders based on dogs exhibiting few
or all the clinical signs of hepatic disorders like
anorexia / inappetance, loss of body weight,
jaundice, ascites, vomiting, diarrhea, dullness and
lethargy and haematobiochemical parameters. Six
apparently healthy dogs were kept as control for
comparison. Haematology was carried out on these
dogs by using whole blood for the parameters, Hb,
PCV, TLC and DLC. Liver enzymes ALT, ALP;
total protein, albumin, glucose, bilrubin were
estimated in serum samples by using
spectrophotometer. Hepatic ultrasonography was
done for 9 dogs with hepatic disorder (base on
clinical signs and haematobiochemical readings)
and in 6 dogs of control group. It was performed
with LOGIQ and 100 cls scanner using 3.5 / 7.5
MHL mechanical transducer as per the guidelines
of Nyland and Matton (1995) and the images were
recorded on thermal printing paper.
RESULTS AND DISCUSSION
Haematological findings in dogs with hepatic
disorders revealed anaemia as out of 22 dogs, 15
were found to be truly anaemic, i.e., with Hb < 8
gm / dl (Schalm, 1975). Anaemia could be due to
elevated bile acid content increasing the fragility of
the membrane of RBCs (Rothuizen and Meyer,
2000). Mean PCV was significantly low in dogs
with hepatic disorders (29.83 ± 1.76) compared to
Haematobiochemical and Ultrasonographical Studies of Hepatic
Disorders in Dogs*
Lathamani1, V. S. and Nalini Kumari
2, K.
Department of Clinical Medicine, Ethics & Jurisprudence,College of Veterinary Science, Tirupati – 517 502
Received: 11 September, 2014; Accepted: 27 July, 2015
ABSTRACT
Haemato-biochemical and ultrasonographical findings were analyzed in dogs with hepatic disorders. Haematological
investigations revealed reduced Hb, PCV and neutrophilic leukocytosis. Serum biochemical investigation revealed
moderately elevated ALT, marked ALP and bilrubin elevation in icteric dogs, hypoprotenaemia and
hypoalbuminaemia (marked in ascitic dogs) and hypoglycemia. Ultrasonographic findings were diffuse / focal
hyperechlogenicity of liver parenchyma, ascetic shadow in the abdomen and biliary sludge.
Key Words: Hepatic disorders, hyperechoic, ALT, ALP.

Frontier J. Vet. Anim. Sci.Vol. 4, No. 2 (July-Dec.) 2015 149
that of normal dogs (44 ± 2.08) (Table). In the 15
anaemic dogs, PCV was <25%, Hunt et al., (1993)
and Rallis et al., (2005) reported reduced PCV in
non-fibrosing liver disease and chronic hepatitis
respectively. The present findings are in agreement
with the above authors. Dogs with hepatic disorders
showed neutrophilic leukocytosis. Leukocytosis in
chronic liver diseases of dogs might be interpreted
as an inflammatory response to acute phase
stimulation and or as a stress response (Sevelius,
1995). Lucena et al., (2001) and Neill et al., (2006)
reported neutrophilic leukocytosis in hepatic
cirrhosis and bacterial cholangitis/cholangio-
hepatitis respectively.
Serum biochemical estimations showed
elevated hepatic enzymes ALT and ALT (Table 1).
Amino transferases are commonly elevated in
hepatocellular disease, hepatitis, hepatic trauma,
anaemia, toxaemia etc., (Jones, 1986) ALT, a
leakage enzyme, the magnitude of elevation is
roughly proportional to the number of injured
hepatocytes (Rothuizen and Meyer, 2000). ALP
elevation was marked in icteric dogs. Elevation in
ALP is subsequent to accelerated production
stimulated by bile retention (Meyer et al., 1992).
Marked elevation of ALP was noticed in cholestatic
dog and reported by Armstrong et al., (2000);
Vijayakumar et al., (2001), and Udayasree et al.,
(2006). The findings of the present study are in
concurrence with above reports.
Hypoproteinaemia and hypoalbuminaemia
was observed in the dogs with hepatic disorders
(Table) which was even marked in 3 ascitic dogs
(Total protein : 3.33, 3.72 and 2.28 g/dl and
Albumin : 1.84, 1.87 and 0.49 g/dl). Low serum
proteins and albumin could be attributed to
decreased production from liver, besides anorexia /
inappetance. Decreased total protein and albumin
levels in the present study are in agreement with the
reports of Sevelius (1995), Varshney and Hoque
(2002), Rutgers et al., (1993) and Lucena et al.,
(2001).
Almost all the dogs with hepatic disorders
were hypoglycemic, which could be due to
impaired carbohydrate metabolism in the liver and
was a rare finding that glucose is a bad prognostic
marker (Strombeck et al., 1988), Vijayakumar et
al., (2001) and Varshney and Hoque (2002)
reported hypoglycemia in canine hepatic disorders.
The mean total bilrubin value in the
affected dogs revealed slight elevation and with
marked elevation in 4 icteric dogs (3.37, 8.37,
10.78, 12.18 mg/dl). Presence of
hyperbilirubinaemia with equal amounts of direct
and indirect bilirubin as seen in first icteric dog
among above 4 is an indicative of hepatocellular
damage (Jones, 1986). And the remaining 3 icteric
dogs had more proportion of direct bilurubin
suggestive of cholestasis (Kaneko et al., 1999).
Dalton et al., (1975), Vijayakumar et al., (2001),
Saini et al., (2003) and Udayasree et al., (2006)
reported hyper bilrubinaemia in intrahepatic
cholestasis, cholecystitis, jaundiced dog of hepatic
origin and cholestatic hepatitis respectively. But
Lucena et al., (2001) reported severe
hyperbilrubinaemia (100 mg/dl) in hepatic
cirrhosis.
Ultrasonography findings of liver in
apparently healthy dogs showed uniform echo
pattern of low to medium echogenicity. The
diaphragm was seen as a continuous curvilinear
hyperechoic structure along the boundary of liver.
Liver was hypoechoic to spleen and isoechoic to
slightly hyperechoic to renal cortex. The findings
are in agreement with the findings of Voros et al.
(1991) and Nyland and Mattoon (1995) and
Varshney and Hoque (2002). Whereas in 9 dogs
with hepatic disorders it was observed that
hypercehogenicity of liver (6 dogs) i.e.,
hyperechoic liver of normal size (Fig.1), suggestive
of lymphosarcoma, hepatic lipidosis and chronic
hepatitis (Voros et al., 1991, Nyland and Mattoon,
1995). In addition to hyper echogenicity of liver,
there was free abdominal fluid in 2 ascitic dogs
(Fig.2). Cartee et al., (1995) and Nyland and
Mattoon (1995) mentioned massive accumulation
of free fluid separating intra abdominal organs by
large anechoic spaces. Focal hyperechoic
parenchymal changes were noticed in two dogs
which may indicate nodular hyperplasia /
calcification (Cartee et al., 1995 and Biller & Black
Welder, 1998). Biliary sludge (Fig.3) was noticed
in one dog but the wall of gall bladder did not show

Frontier J. Vet. Anim. Sci.Vol. 4, No. 2 (July-Dec.) 2015 150
any thickening. Biliary sludge is a common age
related finding as opinioned by Tiwari et al.,
(2005), but the above dog had clinical signs
suggestive of hepatitic disorder viz., anorexia,
anaemia, poilydipsia and laboratory findings
revealed ALP elevation (49.7 KA units). So the
condition was diagnosed to be suggestive of
cholangitis / cholangithepatitis. The finding was
similar to the observations of Neill et al.,
(2006).
Table: Haemato biochemical changes in dogs with
hepatic disorders
Sl.
No. Parameter
Apparently
healthy
dogs (n = 6)
Dogs with
hepatic
disorders
(n = 22)
1. Hb (g/dl) 15.17 ± 0.83 8.5 ± 0.37**
2. PCV (%) 44 ± 2.08 29.82 ± 1.76**
3. TLC (Cells / l) 9596 ± 908 15297 ± 895**
4. Neutrophils (%) 65.33 ± 2.12 78.77 ± 2.51**
5. Lymphocytes (%) 23.5 ± 1.78 15.77 ± 2.03**
6. Monocytes (%) 8.33 ± 0.42 3.82 ± 0.63**
7. Eosinophils (%) 2.83 ± 0.4 1.45 ± 0.27**
8. Basophils (%) --- 0.09 ± 0.06NS
9. ALT (U/L) 21.78 ± 2.09 117.1 ± 6.45**
10. ALP (KA Units) 5.79 ± 1.76 39.8 ± 9.07**
11. Total Serum
Protein (g/dl) 6.79 ± 0.26 4.3 ± 0.21**
12. Serum Albumin
(g/dl) 3.52 ± 0.24 1.9 ± 0.14**
13. Glucose (mg/dl) 95.93 ± 4.97 56 ± 3.25**
14. Total Bilirubin
(mg/dl) 0.2 ± 0.03 2.7 ± 0.8**
Fig-1. Ultrasonogram of liver showing hyperchogenicity
Fig-2. Ultrasonogram of dog with ascites
Fig-3. Ultrasonogram of liver showing sludge in
gall bladder
REFERENCES
Armstrong, J. A., Taylor, S. M., Tryon, K. A. and
Porter, C. D. (2000). Emphysematous
cholecystitis in a Siberian husky.
Canadian Vet. J. 41 : 60-62.
Biller, D. S. and Blackwelder, T. (1998). Hepatic
ultrasonography : A valuable tool in small
animals Veterinary Medicine 646 -653.
Cartee, R. E., Hudson, J. A., Marich, K. W., Selcer,
B. A., Johnson, P. L. and Bodner, S. F.
(1995). Practical Veterinary Ultrasound,
Lea and Febiger, Williams and Wilkins,
Philadelphia.
Cooper, J. (2006). Symposium on liver function.
Veterinary Medicine. 277-310.
Dalton, J. R. F., Hill, F. W. G. and Kelly, D. F.
(1975). Intrahepatic cholestasis in a dog :
A clinicopathological study. Veterinary
Record 97 : 383-386.

Frontier J. Vet. Anim. Sci.Vol. 4, No. 2 (July-Dec.) 2015 151
Hunt, G. B. Malik R, Chapman, B. L., Lamb, W. A.
and Allan, G. S. (1993). Ascites and portal
hypertension in three young dogs with
non-fibrosing liver disease.
J. Small Ani,Prac. 34 : 215-219.
Jones, B. D. (1986). The use of hepatic biochemical
tests : A clinician‟s perspective.
Veterinary Medicine 130-145.
Kaneko, J. J., Harvey, J. W. and Bruss, M. L.
(1999). In: Text book of clinical
biochemistry of domestic animals 5th
edition Academic Press, San Diego,
California.
Lucena, R., Mozol, E., Bautista, M. J., Ginel, P. J.
and Perez, J. (2001). Hepatic cirrhosis in a
five month-old dog. J. Small Ani,Prac. 42
: 239-242.
Meyer, D. J., Coles, E. H. and Rich, L. J. (1992).
Veterinary Laboratory Medicine Interpretation
and Diagnosis, W.B.Saunders Company,
Philadelphia.
Neill, E. J. O., Day, M. J., Hall, E. J., Holden, D. J.,
Murphy, K. F., Barr, F. J. and Pearson, G.
R. (2006). Bacterial cholangitis/cholangio
hepatitis with or without concurrent
cholecystitis in four dogs. J. Small
Ani,Prac. 47 : 325-335.
Nyland, T. G. and Mattoon, J. S. (1995).
Ultrasonography of the liver.
In : Veterinary Diagnostic Ultrasound.
W.B.Saunders W B, Philadelphia.
Rallis, T., Day, M. J., Saridomichelakis, M. N.,
Adamama – Moritou, K .K., Papazoglou,
L., Fytianou, A. and Koutinas, A. F. 2005.
Chronic hepatitis associated with canine
leishmaniosis (Leishmamnia infantum): a
clinicopathological study of 26 cases. J.
comp. pathology 132 :145 – 152.
Rothuizen, J. and Meyer, H. P. (2000). History
physical examination and signs of liver
disease In : Text book of veterinary
internal medicine 5th
edition Eds: Ettinger
S J and Feldman E C pp.1272-1276
W.B.Saunders Co, Philadelphia.
Rutgers, H. C., Haywood, S. and Kelly, D. F.
(1993). Idiopathic hepatic fibrosis in 15
dogs. Veterinary Record 133 : 115-118.
Saini, N., Chabra, S., Dua, K. and Randhawa, S. S.
(2003). Role of blood transfusion in the
management of jaundice – a case report.
Indian J. Vety. Med. 23 : 1 : 54 -55.
Schalm, O. W. Jain, J. C. and Carroll, E. J. (1975).
Veterinary haematology 3rd
edition, Lea
and Febiger, Philadelphia, U.S.A.
Sevelius, E. (1995). Diagnosis and prognosis of
chronic hepatitis and cirrhosis in dogs. J.
Small Ani,Prac. 36 : 521-528.
Strombeck, D. R., Miller, L. M. and Harrold, D.
(1988). Effects of corticosteroid treatment
on survival time in dogs with chronic
hepatitis : 151 cases (1977-1985). J. Ame.
Vety. Med. Asso. 203 : 680-684.
Tiwari, P., Varshney, J. P. and Hoque, M. (2005).
Significance of biliary sludge in dogs with
hepatobiliary diseases. Indian Veterinary
Journal 82 : 533-534.
Udayasree, V. J., Jayakumar, K. M., Usha, N. P.
and Vijayakumar, K. (2006). Cholestatic
hepatitis in a Labrador dog. Indian Vet. J.
83 : 314-315.
Varshney, J. P. and Hoque, M. (2002). Clinico-
pathological and ultrasonographic
observations in canine hepatopathies.
Indian J. Ani. Sci. 72(6) : 423-427.
Vijayakumar, Y., Thirunavukkarasu, P. S. and
Subramanian, M. (2001). Cholecystitis in
a dog – ulfrasonographic diagnosis. Indian
Vet. J. 78 : 840 – 841.
Vijayakumar, G., Subramanian, M. and
Thirunavukkarasu, P. S. (2004(a).
Treatment of canine hepatic disorder with
silymarin. Indian Vet. J. 81 : 930-932.
Voros, K., Vrabely, T., Papp, L., Horvath, L. and
Karsai, F. (1991). Correlation of
ultrasonographic and pathomorphological
findings in canine hepatic diseases. J. Small
Ani,Prac. 32 : 627-634.

Frontier J. Vet. Anim. Sci.Vol. 4, No. 2 (July-Dec.) 2015 152
*Part of M.V.Sc Thesis submitted by the first author to KVAFSU, Bidar 1Assistant Professor, Dept. of VAHE, Veterinary College, Shivamogga – 577204 Email: [email protected] 2Professor and Head, Department of VAHE, Veterinary College, Bangalore – 560024 3Assistant Professor, Department of VAHE, Veterinary College, Bangalore – 560024 4Professor and Head, Department of MBA, Dairy Science College, Bangalore - 560024 5Professor, Department of Livestock Production and Management, Veterinary College, Bangalore - 560024 6Professor, Department of Animal Genetics and Breeding, Veterinary College - Bangalore - 560024
Indian livestock industry makes up for a significant
amount of world's livestock resources. National
economy and socio-economic growth of the
country is backed by the livestock sector. It also
plays important role in the rural economy as it
improves the family income and generates a gainful
employment in the rural sector, particularly among
the landless labourers and small and marginal
farmers. Animal husbandry sector provides large
self-employment opportunities and is proved to be a
boon for sustaining livelihood of the landless and
marginal farmers. In India, dairying is recognized
as an instrument for social and economic
development. Milk production in India is
dominated by small, marginal farmers and landless
labourers who, in aggregate, own about 70 per cent
of the national milch animal herd and are dispersed
throughout the rural areas. These farmers maintain
an average herd of one or two milch animals
comprising cows and buffaloes. (BAHS, 2012)
Dairy sector in India has acquired substantial
growth momentum from 9th Plan onwards as a
result of which we now rank first among the
world‟s milk producing nations, this represents
sustained growth in the availability of milk and
milk products for our growing population. Dairying
has become an important primary source of income
for millions of rural families and has assumed the
most important role in providing employment and
income generating opportunities particularly for
marginal and women farmers (FAO, 2010). The per
capita availability of the milk has reached a level of
290 grams per day during year 2013-14 which is
slightly more than the world average. Dairying is a
major livestock activity in Kolar and
Chikkaballapur districts, because of regular and
sustainable income generation to the farmers and
also there is less agricultural activity due to low
underground water table. The present study was
undertaken to get an insight into the socio-
economic profile of the dairy farmers of this region.
Socioeconomic and Psychological Profile of Dairy Farmers of Kolar and
Chikkaballapur Districts of Karnataka*
Harisha, M1., Satyanarayan, K
2., Jagadeeswary, V
3., Lalith Achoth
4.,
Rajeshwari, Y. B5. and Nagaraj, C.S
6
Karnataka Veterinary, Animal and Fisheries Sciences University, Bidar
Received: 25 August, 2014; Accepted: 10 January, 2015
ABSTRACT
India owns the largest livestock population in the world. Dairy farming is one of the important activities of the rural
population of our country. It provides continuous income and reduces unemployment to a large number of the rural
poor. A study was undertaken to analyse the socioeconomic and psychological profile of dairy farmers in Kolar and
Chikkaballapur districts. Two taluks viz. Kolar and Malur from Kolar district, Chintamani and Gudibande taluks from
Chikkaballapur district were selected for the study. A total of 120 dairy farmers were randomly selected and data were
collected using an interview schedule. The analysis of socio economic and psychological profile revealed that majority
(61.67%) of the dairy farmers were of middle age group (35-50 years), and most of them had middle school education.
Majority lived in nuclear family with small family size (3-8 members) and had agriculture as their main occupation.
Most of them were large farmers (>4 acres) with low annual income and low material possession, had low livestock
possession and medium extension contact. Majority of the respondent dairy farmers had medium economic
motivation, medium risk and scientific orientation.
Key words: Socio-economic Profile, Psychological profile, Dairy farmers
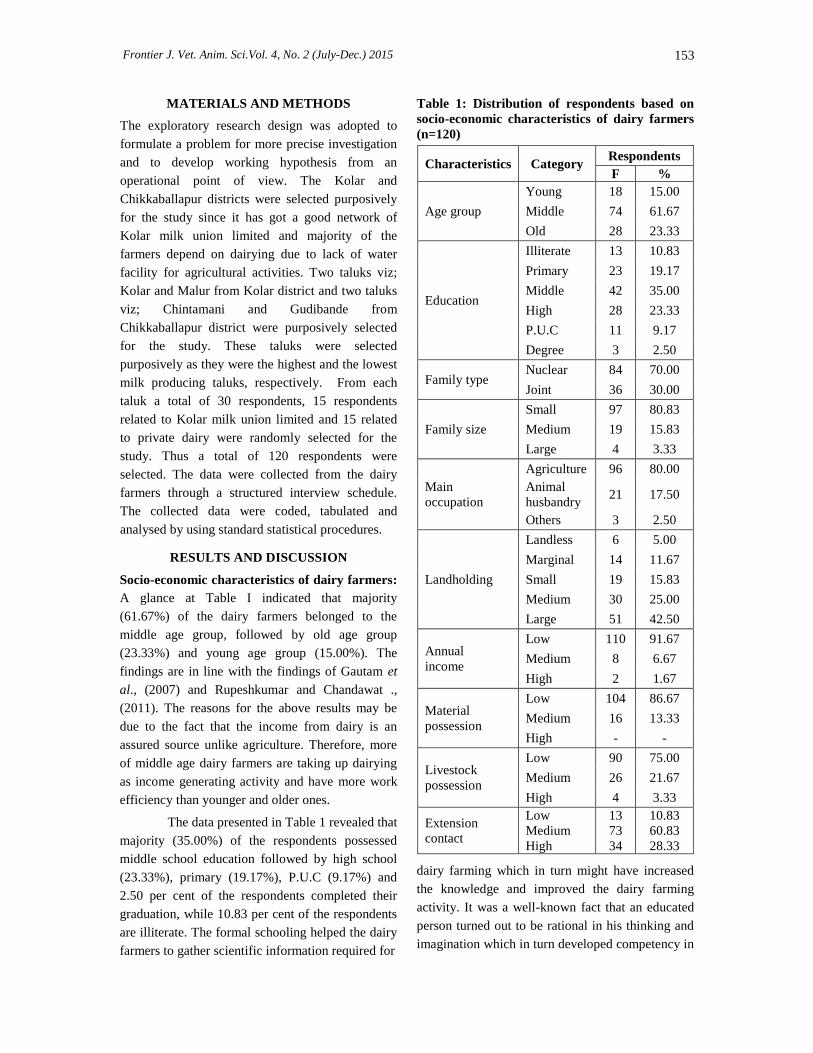
Frontier J. Vet. Anim. Sci.Vol. 4, No. 2 (July-Dec.) 2015 153
MATERIALS AND METHODS
The exploratory research design was adopted to
formulate a problem for more precise investigation
and to develop working hypothesis from an
operational point of view. The Kolar and
Chikkaballapur districts were selected purposively
for the study since it has got a good network of
Kolar milk union limited and majority of the
farmers depend on dairying due to lack of water
facility for agricultural activities. Two taluks viz;
Kolar and Malur from Kolar district and two taluks
viz; Chintamani and Gudibande from
Chikkaballapur district were purposively selected
for the study. These taluks were selected
purposively as they were the highest and the lowest
milk producing taluks, respectively. From each
taluk a total of 30 respondents, 15 respondents
related to Kolar milk union limited and 15 related
to private dairy were randomly selected for the
study. Thus a total of 120 respondents were
selected. The data were collected from the dairy
farmers through a structured interview schedule.
The collected data were coded, tabulated and
analysed by using standard statistical procedures.
RESULTS AND DISCUSSION
Socio-economic characteristics of dairy farmers:
A glance at Table I indicated that majority
(61.67%) of the dairy farmers belonged to the
middle age group, followed by old age group
(23.33%) and young age group (15.00%). The
findings are in line with the findings of Gautam et
al., (2007) and Rupeshkumar and Chandawat .,
(2011). The reasons for the above results may be
due to the fact that the income from dairy is an
assured source unlike agriculture. Therefore, more
of middle age dairy farmers are taking up dairying
as income generating activity and have more work
efficiency than younger and older ones.
The data presented in Table 1 revealed that
majority (35.00%) of the respondents possessed
middle school education followed by high school
(23.33%), primary (19.17%), P.U.C (9.17%) and
2.50 per cent of the respondents completed their
graduation, while 10.83 per cent of the respondents
are illiterate. The formal schooling helped the dairy
farmers to gather scientific information required for
Table 1: Distribution of respondents based on
socio-economic characteristics of dairy farmers
(n=120)
Characteristics Category Respondents
F %
Age group
Young 18 15.00
Middle 74 61.67
Old 28 23.33
Education
Illiterate 13 10.83
Primary 23 19.17
Middle 42 35.00
High 28 23.33
P.U.C 11 9.17
Degree 3 2.50
Family type Nuclear 84 70.00
Joint 36 30.00
Family size
Small 97 80.83
Medium 19 15.83
Large 4 3.33
Main
occupation
Agriculture 96 80.00
Animal
husbandry 21 17.50
Others 3 2.50
Landholding
Landless 6 5.00
Marginal 14 11.67
Small 19 15.83
Medium 30 25.00
Large 51 42.50
Annual
income
Low 110 91.67
Medium 8 6.67
High 2 1.67
Material
possession
Low 104 86.67
Medium 16 13.33
High - -
Livestock
possession
Low 90 75.00
Medium 26 21.67
High 4 3.33
Extension
contact
Low
Medium
High
13
73
34
10.83
60.83
28.33
dairy farming which in turn might have increased
the knowledge and improved the dairy farming
activity. It was a well-known fact that an educated
person turned out to be rational in his thinking and
imagination which in turn developed competency in
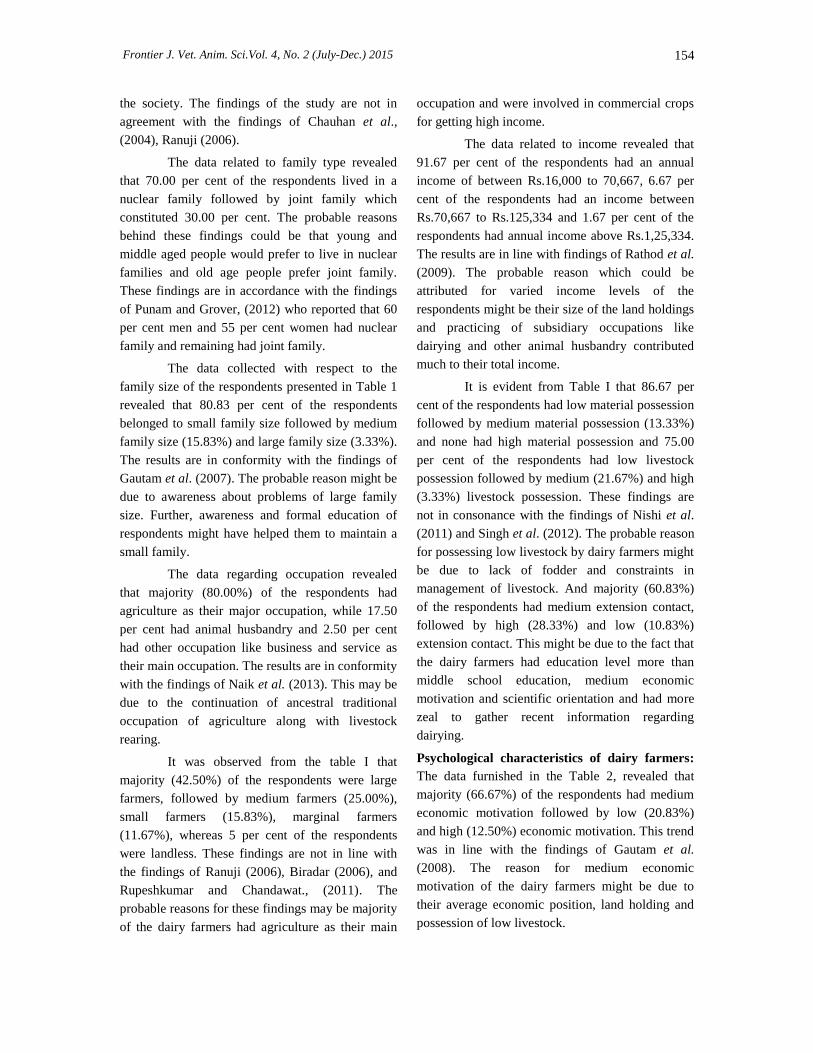
Frontier J. Vet. Anim. Sci.Vol. 4, No. 2 (July-Dec.) 2015 154
the society. The findings of the study are not in
agreement with the findings of Chauhan et al.,
(2004), Ranuji (2006).
The data related to family type revealed
that 70.00 per cent of the respondents lived in a
nuclear family followed by joint family which
constituted 30.00 per cent. The probable reasons
behind these findings could be that young and
middle aged people would prefer to live in nuclear
families and old age people prefer joint family.
These findings are in accordance with the findings
of Punam and Grover, (2012) who reported that 60
per cent men and 55 per cent women had nuclear
family and remaining had joint family.
The data collected with respect to the
family size of the respondents presented in Table 1
revealed that 80.83 per cent of the respondents
belonged to small family size followed by medium
family size (15.83%) and large family size (3.33%).
The results are in conformity with the findings of
Gautam et al. (2007). The probable reason might be
due to awareness about problems of large family
size. Further, awareness and formal education of
respondents might have helped them to maintain a
small family.
The data regarding occupation revealed
that majority (80.00%) of the respondents had
agriculture as their major occupation, while 17.50
per cent had animal husbandry and 2.50 per cent
had other occupation like business and service as
their main occupation. The results are in conformity
with the findings of Naik et al. (2013). This may be
due to the continuation of ancestral traditional
occupation of agriculture along with livestock
rearing.
It was observed from the table I that
majority (42.50%) of the respondents were large
farmers, followed by medium farmers (25.00%),
small farmers (15.83%), marginal farmers
(11.67%), whereas 5 per cent of the respondents
were landless. These findings are not in line with
the findings of Ranuji (2006), Biradar (2006), and
Rupeshkumar and Chandawat., (2011). The
probable reasons for these findings may be majority
of the dairy farmers had agriculture as their main
occupation and were involved in commercial crops
for getting high income.
The data related to income revealed that
91.67 per cent of the respondents had an annual
income of between Rs.16,000 to 70,667, 6.67 per
cent of the respondents had an income between
Rs.70,667 to Rs.125,334 and 1.67 per cent of the
respondents had annual income above Rs.1,25,334.
The results are in line with findings of Rathod et al.
(2009). The probable reason which could be
attributed for varied income levels of the
respondents might be their size of the land holdings
and practicing of subsidiary occupations like
dairying and other animal husbandry contributed
much to their total income.
It is evident from Table I that 86.67 per
cent of the respondents had low material possession
followed by medium material possession (13.33%)
and none had high material possession and 75.00
per cent of the respondents had low livestock
possession followed by medium (21.67%) and high
(3.33%) livestock possession. These findings are
not in consonance with the findings of Nishi et al.
(2011) and Singh et al. (2012). The probable reason
for possessing low livestock by dairy farmers might
be due to lack of fodder and constraints in
management of livestock. And majority (60.83%)
of the respondents had medium extension contact,
followed by high (28.33%) and low (10.83%)
extension contact. This might be due to the fact that
the dairy farmers had education level more than
middle school education, medium economic
motivation and scientific orientation and had more
zeal to gather recent information regarding
dairying.
Psychological characteristics of dairy farmers:
The data furnished in the Table 2, revealed that
majority (66.67%) of the respondents had medium
economic motivation followed by low (20.83%)
and high (12.50%) economic motivation. This trend
was in line with the findings of Gautam et al.
(2008). The reason for medium economic
motivation of the dairy farmers might be due to
their average economic position, land holding and
possession of low livestock.

Frontier J. Vet. Anim. Sci.Vol. 4, No. 2 (July-Dec.) 2015 155
Table 2: Distribution of dairy farmers based on
psychological characteristics dairy farmers
(n=120)
Characteristics Category Respondents
F %
Economic
motivation
Low 25 20.83
Medium 80 66.67
High 15 12.50
Scientific
orientation
Low 14 11.67
Medium 61 50.83
High 45 37.50
Risk
orientation
Low 9 7.50
Medium 88 73.33
High 23 19.17
The data regarding scientific orientation
revealed that majority (50.83%) of the respondents
had medium scientific orientation, followed by
37.50 per cent and 11.67 per cent of the
respondents had high and low scientific orientation
respectively. The above findings were in line with
the findings of Ranuji (2006) and Gautam et al.
(2008). The probable reason for this may be higher
formal education helps the respondents to use
scientific practices in dairying.
The data related to risk orientation
revealed that majority (73.33%) of the respondents
had medium risk orientation, followed by high
(19.17%) and low (7.5%) risk orientation. The
results of this study are not in line with results of
Bhagyalaxmi et al, (2003), Suresh (2004) and
Ranuji (2006). It might be due to ability of dairy
farmers under small, marginal and medium land
holding category and landless to face risk in dairy
activity, along with other activities.
The present study concluded that the
respondents had different level of education and
occupations with different economic and
psychological conditions and to improve the
socioeconomic status of dairy farmers in the study
area, there is a need for technical and institutional
intervention to alleviate the education and income
levels of the dairy farmers through dissemination of
appropriate technologies and extension strategies.
REFERENCES
Basic Animal Husbandry Statistics. (2012). ,
Department of Animal Husbandry,
Dairying & Fisheries, Ministry of
Agriculture. Government of India.
Bhagyalaxmi, K., Gopalakrishna Rao, V. and
Sudarshanreddy, M. (2003). Profile of the
rural women micro-entrepreneurs.
Journal of Research , Acharya N. G.
Ranga Agricultural University,
Hyderabad, 31 (4): 51-54.
Biradar, B. N. (2006). A study on impact of income
generating activities on sustainable rural
livelihoods of kawad project beneficiaries,
master‟s thesis in agricultural extension
education, University of Agricultural
sciences, Dharwad
Chauhan, D. S., Kamble, V. J., Padghan, P. V.,
Sawant, R. C. and Kamble, R. R. (2004).
Impact of farmers‟ status on milk
production in tribal area of Kinwat Tahasil
(Marathwada Region). Indian Journal of
Animal Research, 38 (2): 137-140.
Food and Agricuture Organisation Statistics,
(2010). United Nations. Statistics database
on the World Wide Web.
http://apps.fao.org/.
Gautam, U. S., Ram Chand. and Singh, D. K.,
(2007). Socio-Personal Correlation for
Decision-Making and Adoption of Dairy
practices, Indian Res. J. Ext. Edu. 7 (2&3).
Gautam, U. S., Ram Chand. and Singh, D. K.,
(2008). Effect of Motivation and
Knowledge on Decision Making and
Adoption of Dairy Practices, Indian Res.
J. Ext. Edu. 8 (2&3).
Naik, P. K., Dhuri, R. B., Swain, B. K.,
Karunakaran, M., Chakurkar, E. B. and
Singh, N. P. (2013). Analysis of existing
dairy farming in Goa, Indian Journal of
Animal Sciences, 83 (3): 299–303.
Nishi, A. K., Sah. and Ram Kumar. (2011). Dairy
farmers‟ satisfaction with dairy
cooperative societies : A case study,
Indian Res. J. Ext. Edu, 11 (1).

Frontier J. Vet. Anim. Sci.Vol. 4, No. 2 (July-Dec.) 2015 156
Punam, Y. and Indu Grover. (2012). Gender
Analysis of Constraints Faced By Dairy
Cooperative Society Members, Indian
Research Journal of Extension Education.
12(2).
Ranuji, C. R. (2006). A study on entrepreneurial
behaviour of dairy farmers, Doctor of
philosophy thesis, University of
Agricultural sciences, Dharwad.
Rathod, P., Sariput Landge., Nikam, T. R. and
Vajreshwari. S. (2009), Socio-personal
profile and constraints of dairy farmers,
Karnataka Journal of Agricultural
Sciences, 24 (4): 619-621.
Rupeshkumar, J. R. and Chandawat, M. S. (2011).
Extent of knowledge of improved animal
husbandry practices and socio-economical
characteristics of dairy farmers of district
Kheda, Gujarat, International Journal of
Farm Sciences, 1(2):129-137.
Singh, B., Jaspreet Singh. and Vijay Lakshmi Sharma.
(2012). Assessment of Farmers‟ Knowledge
about Safe Handling Practices of Dairy
Animals Indian Res.J.Ext.Edu. 12(2).
Suresh. (2004). Entrepreneurial behaviour of milk
producers in Chittoor district of Andhra
Pradesh – A critical study. Master‟s thesis,
Acharya N. G. Ranga Agricultural
University, Hyderabad.
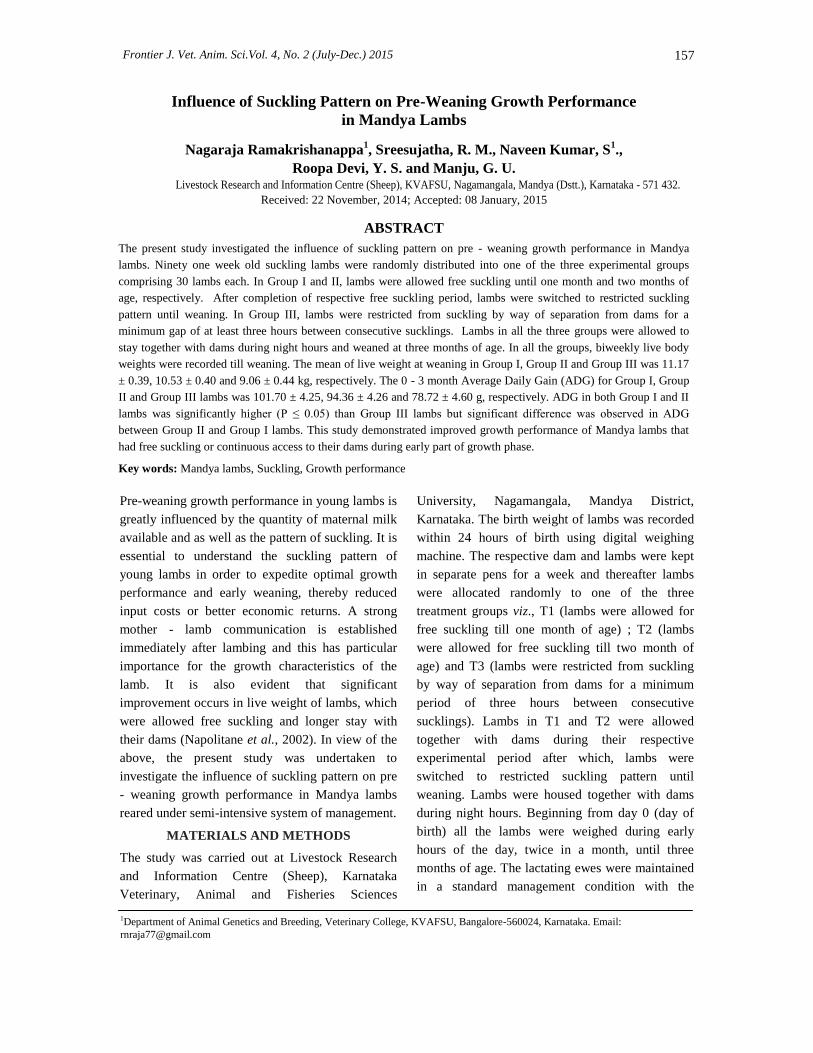
Frontier J. Vet. Anim. Sci.Vol. 4, No. 2 (July-Dec.) 2015 157
1Department of Animal Genetics and Breeding, Veterinary College, KVAFSU, Bangalore-560024, Karnataka. Email:
Pre-weaning growth performance in young lambs is
greatly influenced by the quantity of maternal milk
available and as well as the pattern of suckling. It is
essential to understand the suckling pattern of
young lambs in order to expedite optimal growth
performance and early weaning, thereby reduced
input costs or better economic returns. A strong
mother - lamb communication is established
immediately after lambing and this has particular
importance for the growth characteristics of the
lamb. It is also evident that significant
improvement occurs in live weight of lambs, which
were allowed free suckling and longer stay with
their dams (Napolitane et al., 2002). In view of the
above, the present study was undertaken to
investigate the influence of suckling pattern on pre
- weaning growth performance in Mandya lambs
reared under semi-intensive system of management.
MATERIALS AND METHODS
The study was carried out at Livestock Research
and Information Centre (Sheep), Karnataka
Veterinary, Animal and Fisheries Sciences
University, Nagamangala, Mandya District,
Karnataka. The birth weight of lambs was recorded
within 24 hours of birth using digital weighing
machine. The respective dam and lambs were kept
in separate pens for a week and thereafter lambs
were allocated randomly to one of the three
treatment groups viz., T1 (lambs were allowed for
free suckling till one month of age) ; T2 (lambs
were allowed for free suckling till two month of
age) and T3 (lambs were restricted from suckling
by way of separation from dams for a minimum
period of three hours between consecutive
sucklings). Lambs in T1 and T2 were allowed
together with dams during their respective
experimental period after which, lambs were
switched to restricted suckling pattern until
weaning. Lambs were housed together with dams
during night hours. Beginning from day 0 (day of
birth) all the lambs were weighed during early
hours of the day, twice in a month, until three
months of age. The lactating ewes were maintained
in a standard management condition with the
Influence of Suckling Pattern on Pre-Weaning Growth Performance
in Mandya Lambs
Nagaraja Ramakrishanappa1, Sreesujatha, R. M., Naveen Kumar, S
1.,
Roopa Devi, Y. S. and Manju, G. U. Livestock Research and Information Centre (Sheep), KVAFSU, Nagamangala, Mandya (Dstt.), Karnataka - 571 432.
Received: 22 November, 2014; Accepted: 08 January, 2015
ABSTRACT
The present study investigated the influence of suckling pattern on pre - weaning growth performance in Mandya
lambs. Ninety one week old suckling lambs were randomly distributed into one of the three experimental groups
comprising 30 lambs each. In Group I and II, lambs were allowed free suckling until one month and two months of
age, respectively. After completion of respective free suckling period, lambs were switched to restricted suckling
pattern until weaning. In Group III, lambs were restricted from suckling by way of separation from dams for a
minimum gap of at least three hours between consecutive sucklings. Lambs in all the three groups were allowed to
stay together with dams during night hours and weaned at three months of age. In all the groups, biweekly live body
weights were recorded till weaning. The mean of live weight at weaning in Group I, Group II and Group III was 11.17
± 0.39, 10.53 ± 0.40 and 9.06 ± 0.44 kg, respectively. The 0 - 3 month Average Daily Gain (ADG) for Group I, Group
II and Group III lambs was 101.70 ± 4.25, 94.36 ± 4.26 and 78.72 ± 4.60 g, respectively. ADG in both Group I and II
lambs was significantly higher (P ≤ 0.05) than Group III lambs but significant difference was observed in ADG
between Group II and Group I lambs. This study demonstrated improved growth performance of Mandya lambs that
had free suckling or continuous access to their dams during early part of growth phase.
Key words: Mandya lambs, Suckling, Growth performance

Frontier J. Vet. Anim. Sci.Vol. 4, No. 2 (July-Dec.) 2015 158
Table 1: Least squares mean of body weight (kg) recorded during pre-weaning stage of Mandya
lambs subjected for different suckling pattern
Parameter Birth wt. II wk IV wk VI wk VIII wk X wk XII wk
P value 3.514 0.0004 0.0023 0.0046 0.0023 0.0008 0.0016
1 month
free
suckling
2.02 ± 0.05
(30)
4.08 ± 0.13a
(30)
5.56 ± 0.19a
(30)
6.99 ± 0.24a
(30)
8.53 ± 0.32a
(30)
9.89 ± 0.33a
(30)
11.17 ± 0.39a
(30)
2 month
free
suckling
2.05 ± 0.06
(30)
4.15 ± 0.15a
(30)
5.53 ± 0.23a
(30)
6.87 ± 0.32a
(30)
8.23 ± 0.35a
(30)
9.47 ± 0.41a
(30)
10.77a ± 0.45
(30)
Restricted
suckling
1.99 ± 0.07
(30)
3.44 ± 0.11b
(30)
4.68 ± 0.18b
(30)
5.85 ± 0.22b
(30)
7.01 ± 0.28b
(30)
7.94 ± 0.36b
(30)
9.06 ± 0.44b
(30)
Figures in parentheses are number of observations. Means bearing common superscript in the same column do not
differ significantly.
supplement of compounded sheep feed. All the
lambs were encouraged to consume roughage ad
libitum during experimental period to stimulate
their ruminal activity.
The data of live body weight and ADG
were analyzed by least square method using GLM
procedure using “Statistical Analysis Software”
(SAS 9.3) and Duncan test was used to compare the
mean of different treatment groups. In the statistical
model, suckling pattern was considered as fixed
effects.
RESULTS AND DISCUSSION
The data on live weights of lambs recorded at
different age interval viz., birth weight, II week, IV
week, VI week, VIII week, X week and XII week
are presented in Table 1. Table 2, illustrates the
ADG of lambs recorded at different time intervals
viz., 0 - II wk, II - IV wk, IV - VI wk, VI - VIII wk,
VIII - X wk, X - XII wk and overall 0 - XII wk for
the lambs in T1, T2 and T3 groups.
Data analysis revealed that birth weight
had no significant effect between treatment groups
T1, T2 and T3 (2.02 ± 0.05, 2.05 ± 0.06 and 1.99 ±
0.07, kg). From week II, there was a highly
significant difference in growth performance,
which prevailed between the treatment groups. The
growth pattern of lambs in T1 and T2 found to be
similar, whereas the lambs in T3 group recorded a
significantly lower body weight in contrast to the
lambs in T1 and T2, which was in accordance with
the findings of Ozdal et al. (2006) in Karakas
lambs.
The lower body weight of lambs in T3
groups may be attributable to the fact that they
might have consumed lesser quantity of milk due to
interruption or gap during successive suckling,
which could have been further complimented by
decreased milk secretion from the dams. Long -
term nursing and stimulation of the mammary gland
is important for milk production (Hatfield et al.,
1995) as the decrease in number of daily milking
(or suckling) during early lactation results in
reduced milk yield in ewes (Knight and Gosling,
1994), due to decreased alveolar diameter (Li et al.,
1999) and/or reduced functional udder capacity
(Wojtowski et al., 2006). It has been demonstrated
that suckling would stimulate the mammary gland
(Bruckmaier and Wellnitz, 2008) and facilitates
secretion of neuro - pituitary peptides by neuro -
endocrine mechanisms (Marnet and Mckusick,
2001), which in turn release oxytocin for induction
of milk ejection (Negrao et al., 2001). In addition,
frequency of suckling and distribution of milk in
the udder is known to affect the milk composition
significantly (Jackuliakova and Tancin, 2011).
Mskusick et al. (2001) reported significant drop (30
to 40 %) in milk production due to less frequent
udder evacuation and lacking of the mother - young
one bonding. Extended suckling or milking
intervals increases the intra - mammary pressure,
decreases alveolar drainage and increases the
mammary tight junction permeability, all of which
affects the milk secretion and consequently daily
milk yield (Peaker, 1980), especially in ewes with
smaller cisterns of the udder (Jackuliakova and
Tancin, 2011). Castillo et al. (2009) reported that
ewes with large udder cisterns were better adaptive

Frontier J. Vet. Anim. Sci.Vol. 4, No. 2 (July-Dec.) 2015 159
Table 2: Least squares mean of ADG (g) recorded during pre-weaning stage of Mandya lambs subjected
for different suckling pattern
Parameter 0 – II wk II – IV wk IV – VI
wk
VI–VIII
wk VIII–X wk X – XII wk
Overall
0 - XII wk
P value <0.0001 0.4097 0.2412 0.1016 0.0961 0.6578 0.0013
1month free
suckling
137.90 ±
6.69a
(30)
98.09 ±
6.26
(30)
95.58 ±
6.84
(30)
102.4 ±
9.13
(30)
90.51 ±
9.90
(30)
85.61 ±
11.33
(30)
101.70 ±
4.25a
(30)
2 month free
suckling
140.00 ±
8.34a (30)
92.09 ±
9.03
(30)
86.69 ±
7.98
(30)
90.65 ±
7.51
(30)
82.27 ±
9.87
(30)
86.54 ±
9.39
(30)
96.87 ±
4.76a
(30)
Restricted
suckling
96.74 ±
5.22b (30)
82.33 ±
9.48
(30)
78.13 ±
7.29
(30)
77.46 ±
7.74
(30)
62.05 ±
8.48
(30)
74.90 ±
9.03
(30)
78.60 ±
4.62b
(30)
Figures in parentheses are number of observations. Means bearing common superscript in the same column do not
differ significantly
to extended milking interval than ewes with small
cisterns of the udder.
In the present study, the overall ADG in
restricted suckling group T3 (78.60 ± 4.62 g) was
significantly lower compared to the ADG in free
suckling group T1 (101.70 ± 4.25 g) and T2
(96.87 ± 4.76 g), which is in congruous with the
findings of Cimen and Karaalp (2009) in non -
dairy sheep. The bi - weekly ADG differed
significantly during initial days (0 – II wk of age)
and thereafter there was a non-significant
decrease of ADG levels in T3 lambs in contrast
to the ADG levels of lambs in T1 and T2 group.
During first few weeks of early life ADG levels
were higher than the subsequent weeks, which
may be attributable to the overall composition of
milk. Ewe milk production increases from birth
and reaches its peak between two and four weeks
and there after it declines slowly (Cardellino and
Benson, 2002). Milk yield, proteins and total
solids would be higher at the early stages of
lactation, then decreases during mid lactation
stage and it increases gradually during the late
stage of lactation, whereas fat, lactose and ash
were more stable throughout lactation stages
(Mahmoud et al., 2014).
The ADG in T1 group were lower during
IV – VI week interval (95.58 ± 6.84 g) than week
II – IV week interval (98.09 ± 6.26 g). The ADG
of T2 group had a similar pattern at VIII – X
week (82.27 ± 9.87 g) and VI - VII week (90.65
± 7.51g) interval, which may be attributable to
the stress due to switching over from free
suckling to restrict suckling mode. However,
such lambs would regain the ADG levels during
subsequent weeks. Lambs in T3 recorded lower
ADG levels throughout their experimental
period.
In conclusion, this study demonstrated
an improved growth performance of Mandya
lambs that had free suckling or continuous access
to their dams during early part of their pre -
weaning growth phase. Further it may be
concluded that lambs with sustained access to
milk and continuous bonding with dams would
enhance the weaning weight of lambs thereby
improved economic output.
ACKNOWLEDGEMENT
This study was undertaken as part of Indian
Council of Agricultural Research (ICAR), Govt.
of India funded project: Mega Sheep Seed
Project on Mandya Sheep. Authors acknowledge
the institutional support and facilities provided
by the Karnataka Veterinary, Animal and
Fisheries Sciences University, Bidar and the
coordinating support from CSWRI, Avikanagar,
India.
REFERENCES
Bruckmaier, R. M. and Wellnitz, O., 2008.
Induction of milk ejection and milk
removal in different production systems. J.
Anim. Sci., 86:15-20.
Cardellino, R. A. and Benson, M. E., 2002.
Lactation curves of commercial ewes
rearing lambs. J. Anim. Sci., 80:23–27.

Frontier J. Vet. Anim. Sci.Vol. 4, No. 2 (July-Dec.) 2015 160
Castillo, V., Such, X., Caja, G., Casals, R.,
Salama, A. A. K. and Abanell, E., 2009.
Long and short - term effects of omitting
two weekend milkings on the lactational
performance and mammary tight junction
permeability of dairy ewes. J. Dairy Sci.,
92: 3684-3695.
Cimen Murat and Karaalp Musa, 2009. Effect of
restricted suckling time on milk
components and sucking behavior of
lambs. Archiv Tierzucht., 52 (3): 299-308.
Hatfield, P. G., Snowder, G. D., Head, J. R. W. A.,
Glimp, H. A., Stobart, R. H. and Beser, T.,
1995. Production by ewes rearing single or
twin lambs: Effects of dietary crude
protein percentage and supplemental Zinc
methionine. J. Anim. Sci., 73:1227-1238.
Jackuliakova, L. and Tancin, V., 2011. Milk
distribution in the udder and reaction to
milking frequency in dairy ewes. Slovak J.
Anim. Sci., 44(3): 117-123.
Knight, T. W. and Gosling, L. S., 1994. Effects of
milking frequency and machine stripping
on milk yields of Dorset ewes. Proc NZ
Soc. Anim. Prod., 54:261-262.
Li, P., Rudland, P. S., Ferning, D. G., Finch, L. M.
B. and Wilde, C. J., 1999. Modulation of
mammary development and programmed
cell death by the frequency of milk
removal in lactating goats. J. Physiol.,
519: 885-900.
Mahmoud, N. M. A., El Zubeir, I. E. M. and
Fadlelmoula, A. A., 2014. Effect of Stage
of Lactation on Milk Yield and
Composition of First Kidder Damascus
does in the Sudan. J. Anim. Prod. Adv.,
4(3): 355-362.
Marnet, P. G. and Mckusick, B. C., 2001.
Regulation of milk ejection and
milkability in small ruminants. Liv. Prod.
Sci., 70: 125-133.
Mskusick, B. C., Berger, Y. M., Marnet, P. G. and
Thomas, D. L., 2001. Effect of two
weaning systems on milk composition,
storage and ejection in dairy ewes. J.
Dairy Sci., 79(1): 234.
Napolitane, F., Braghieri, A., Cifuni, G. F., Pacelli,
C. and Girolami, A., 2002. Behaviour and
meat production of organically farmed
unweaned lambs. Small Ruminant Res.,
43: 179-184.
Negrao, J. A., Marnet, P. G. and Labussiere, J.,
2001. Effect of milking frequency on
oxytocin release and milk production in
dairy ewes. Small Ruminant Res., 39: 181-
187.
Ozdal Gokda, Hasa Ulker, Ferda Karakus and Firat
Cengiz, 2006. The growth traits of
Karakas and its crosses Lambs (F1) with
Ile De France x Akkaraman (G1) under
unlimited suckling regime. J. Bio. Sci.,
6(4): 787-792.
Peaker, M., 1980. The effect of raised
intramammary pressure on mammary
function in the goat in relation to the
cessation of lactation. J. Physiol., 301:
415-428.
Wojtowski, J., Slosarz, P., Bielinska, S., Nowicki, S.,
Gut, A. and Dankow, R., 2006. Ultrasound
image of morphological changes of teat end in
sheep caused by machine milking. Arch Tierz.,
49: 231-237.

Frontier J. Vet. Anim. Sci.Vol. 4, No. 2 (July-Dec.) 2015 161
*Part of the Ph.D. Thesis submitted by the first author to KVAFSU, Bidar
The demand for feed resources for ruminant
production in India is increasing day by day
because of rising costs and limited supplies. It is,
therefore, imperative to use fully the locally
available feed resources such as crop residues, non-
conventional feedstuffs to alleviate feed shortage.
Such an attempt does not require additional arable
land for cultivation. In order to throw a light on
usage of such unconventional feed stuffs in large
scale, feed evaluation is essential. A range of feed
evaluation techniques is available to predict the
nutritional value of ruminant feedstuffs. A gas
production technique (GPT) is one such method to
predict ME value of ruminant feed stuffs, OM
degradation and microbial biomass synthesis. Thus,
the present study was undertaken to evaluate few
crop residues and concentrates by in vitro
techniques as potential feed for ruminants.
MATERIALS AND METHODS
The feed samples were divided arbitrarily into
roughages viz.. sugarcane bagasse (SCB) sorghum
stover (SS), fresh banana plant waste (BPW) and
fresh banana plant waste silage (BPWS), banana
pseudostem silage (BPS), BPS mixed with SS
(50:50), banana plant (85%) mixed with SCB
(13%) and ground sorghum grain (2%):BJS, 10%
urea treated (UT) BJS silage; concentrates
viz..ground sorghum (GS), maize (GM), wheat bran
(WB), soybean meal (SBM) and concentrate feed
mixture (CFM), 2% urea treated maize, 1% urea
treated wheat bran. All the feedstuffs were dried in
hot air oven at 600C until constant weight, ground
to pass 1mm sieve in Willey mill and stored in
airtight bottles at room temperature. Ground
samples were analyzed for proximate analysis
Evaluation of Some Tropical Feedstuffs on Fermentation Characteristics to
Assess their Fodder Potential*
Anjaneya, S.N., Ramachandra, B., Thirumalesh, T. Appannavar, M.M., Jadhav,
N.V. and Suranagi, M.D. Department of Animal Nutrition, Veterinary College, KVAFSU, Bidar-585401, India
Received: 16 December, 2014; Accepted: 02 February, 2015
ABSTRACT
Fifteen tropical feedstuffs comprising eight roughages viz., sugarcane bagasse; (SCB) sorghum stover (SS),
fresh banana plant waste (BPW) and fresh banana plant waste silage (BPWS), Banana pseudostem silage (BPS),
BPS mixed with SS (50:50), Banana plant (85%) mixed with SCB (13%) and ground sorghum grain (2%):BJS,
10% urea treated BJS silage and seven concentrates viz., ground sorghum (GS), maize (GM), wheat bran (WB),
soybean meal(SBM), concentrate feed mixture (CFM), 2% urea treated maize, 1% urea treated wheat bran,
which are commonly used for ruminant feeding were analyzed to evaluate rumen fermentation characteristics
and microbial biomass indices to assess their fodder potential. The fermentation characteristics were studied by
in vitro gas production technique by fitting cumulative gas production against time of incubation in the
exponential model, Y=D(1-e-k*t), where Y is gas volume at time t, D is potential gas production(ml/g DM) and
k(h-1) is rate at which gas is produced. The microbial biomass indices were obtained by determining the ratio of
truly digested OM and gas production at t1/2. The ME predicted based on chemical composition (Summative
equations of detergent system of feed analysis: SEDS) was compared with gas production technique (Rumen in
vitro incubation by gas production; RIVIGP). Among roughages, CP (g/kg) content was highest in banana plant
waste (88) and lowest in sugarcane bagasse (21.7). Whereas in fermented feedstuffs (BPWS), due to proteolysis,
the protein content was decreased than the parent (BPW) feedstuff (88vs 68g/kg). In concentrates, CP was
highest in wheat bran (158.1 g/kg) and lowest in sorghum grain (77.4). Among roughages the NDF content
exceeded 600(g/kg) in all feedstuffs reaching as high as 819 in SCB. While in concentrates, NDF (g/kg) was
varied from 123.9 in sorghum to 432.5 in wheat bran. Remaining values are between these two extremities. The
D and k values were higher for concentrates than roughages and so on for PF values. The ME derived from
SEDS had a close association with RIVIGP (R2 0.89). It can be concluded that SS, PS+SS and WB were
superior feedstuffs with high PF among roughages, fermented feedstuffs and concentrates respectively. But,
SBM ranked first with lowest gas, higher TDOM and PF when compared to other feedstuffs.
Key words: Tropical feedstuffs, In vitro gas production, Fermentation characteristics

Frontier J. Vet. Anim. Sci.Vol. 4, No. 2 (July-Dec.) 2015 162
(AOAC,1995) and detergent system of analysis
(Goering and Van Soest,1970). Predicted energy
was calculated based on chemical composition of
feedstuffs by summative equations of detergent
system (SEDS) for roughages as proposed by
Goering and Van Soest, (1970) ; Van Soest, (1971)
and for concentrates as per Giger – Reverdin et
al.(1994).
Donor cow and collection of rumen fluid: A
lactating dairy cow producing 9.0kg of milk per
day, fitted with a flexible rumen canula of large
diameter (Bar Diamond, Inc. USA), receiving a
basal diet consisting of 50% ragi straw, 50% maize
silage and CFM (maize-50, WB-45, urea-2%
mineral mixture-2%, salt-1%,) was used as the
donor cow for rumen fluid. The roughage and CFM
were fed separately. The roughage was offered 8 kg
in proportions six times in a day, starting at 9.00
a.m. The CFM was offered 4.0 kg per day in two
equal portions at 6.00 a.m. and 2.30 p.m. Rumen
fluid was collected in the morning between 9.00
a.m. and 9.30 a.m. before offering feed.
Metabolisable energy (ME) determination:
Using proximate composition and rumen in vitro
gas production (RIVIGP) the net gas production
(corrected for blanks and reference standard hay
and concentrate) at 24 h incubation, ME and in
vitro organic matter digestibility (IVOMD) in
roughages and concentrates were calculated by
equations 1 and 1a ; 2 and 2a according to Menke
and Steingass (1988).
Roughage:
ME= 2.2+0.1357GP+0.0057CP+0.0002859 EE2 …………....(1)
IVOMD= 16.49+0.9042GP+0.0492CP+0.0387TA………...(1a)
Concentrate ingredients and CFM:
ME= 1.06+0.1570GP+0.0084CP+0.022EE-0.0081TA…..…..(2)
IVOMD = 9+0.9991GP+0.0595CP+0.0181TA…………… (2a)
Where,
GP=Gas, ml/200mg DM
CP, EE, TA are crude protein, ether extract, total
ash respectively, in g/kg DM
ME=Metabolisable energy, MJ Kg-1
; IVOMD=In
vitro organic matter digestibility.
The ME derived by RIVIGP and SEDS were
compared and interpreted accordingly.
Kinetics of gas production: Air equilibrated feed
samples (200± 10 mg) of roughages and
concentrates were incubated in 100ml calibrated
glass syringes in triplicate according to Menke and
Steingass (1988) with 30 ml mixed rumen
suspension with three blank incubations and
standards. Cumulative gas production was recorded
at 2, 4, 6, 8, 10, 12, 16, 20, 24, 30, 36, 48, 60, 72,
84 and 96 h of incubation. The rate and extent of
gas production were calculated by non–linear
regression using the exponential model Y= D (1-e-
k*t) Where, Y is gas volume (ml) at time t, D is
potential gas production (ml) and k is rate (per
hour) at which gas is produced (Krishnamoorthy et
al., 1991). The time at half asymptotic gas
production (t1/2) was calculated as In2/k. Gas
production at 24 h, corrected for the blank and
standards were used for determination of ME.
Microbial biomass synthesis: The microbial
biomass synthesis of feedstuffs was obtained by
determining the ratio of truly digested organic
matter (TDOM) and gas production at t1/2 described
by Blummel et al. (1997). Incubation was run for
all feed stuffs in triplicate to determine PF valued at
t1/2. Air equilibrated feed samples (500±10mg) were
weighed into 100ml calibrated syringes and
incubated with 40ml of mixed rumen suspension at
390 C with parallel incubations of blanks (Makkar
et al.,1995). Incubations were terminated by
recording gas production at t1/2 for respective feed
samples by immersing in ice water bath to prevent
further microbial activity. The contents of the
syringes were rinsed with 100ml neutral detergent
solution (NDS) into the syringe each time.
Refluxed the incubation residue for 1h followed by
filtration on preweighed gooch crucibles (Grade-2)
to recover true undigested matter (Goering and Van
Soest,1970). Crucibles with undigested organic
matter (OM) of feed origin recovered in the residue.
The PF was calculated as the ratio of mg TDOM to
ml gas produced at t1/2.
RESULTS AND DISCUSSION
Chemical composition: The chemical composition
of roughages, fermented feedstuffs and concentrates
is summarized in Table 1. The OM (g/kg) content
of roughages, fermented feedstuffs and concentrates
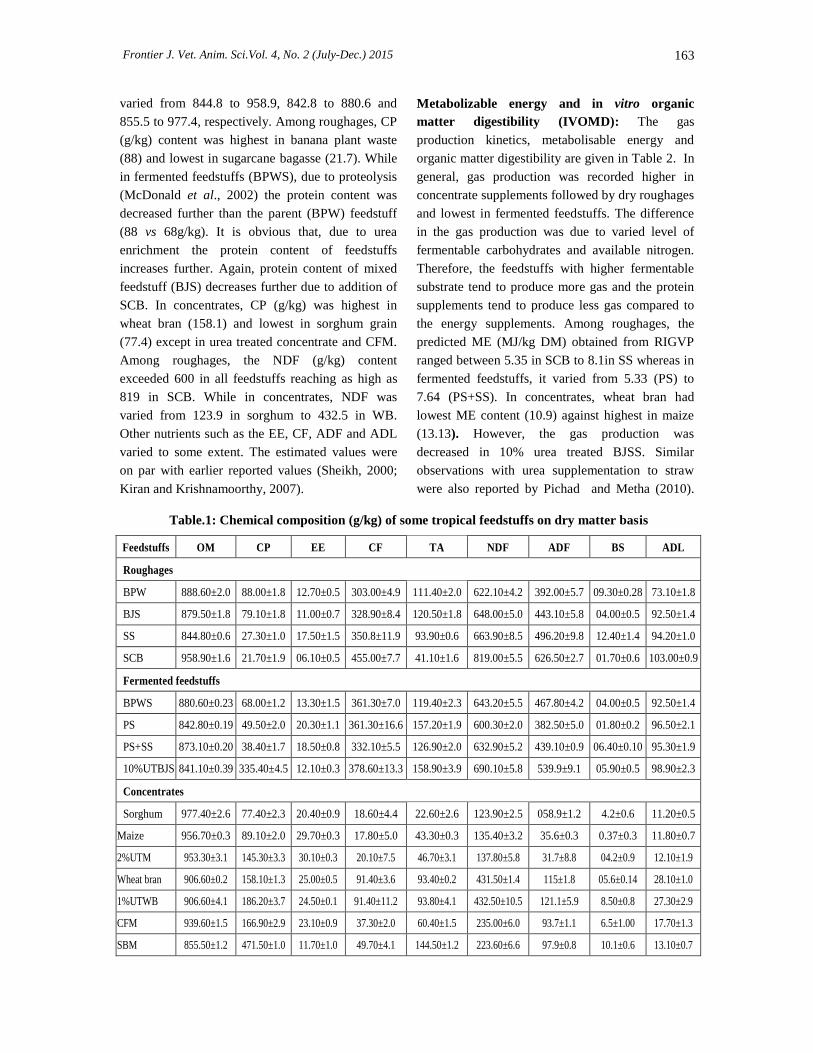
Frontier J. Vet. Anim. Sci.Vol. 4, No. 2 (July-Dec.) 2015 163
Table.1: Chemical composition (g/kg) of some tropical feedstuffs on dry matter basis
Feedstuffs OM CP EE CF TA NDF ADF BS ADL
Roughages
BPW 888.60±2.0 88.00±1.8 12.70±0.5 303.00±4.9 111.40±2.0 622.10±4.2 392.00±5.7 09.30±0.28 73.10±1.8
BJS 879.50±1.8 79.10±1.8 11.00±0.7 328.90±8.4 120.50±1.8 648.00±5.0 443.10±5.8 04.00±0.5 92.50±1.4
SS 844.80±0.6 27.30±1.0 17.50±1.5 350.8±11.9 93.90±0.6 663.90±8.5 496.20±9.8 12.40±1.4 94.20±1.0
SCB 958.90±1.6 21.70±1.9 06.10±0.5 455.00±7.7 41.10±1.6 819.00±5.5 626.50±2.7 01.70±0.6 103.00±0.9
Fermented feedstuffs
BPWS 880.60±0.23 68.00±1.2 13.30±1.5 361.30±7.0 119.40±2.3 643.20±5.5 467.80±4.2 04.00±0.5 92.50±1.4
PS 842.80±0.19 49.50±2.0 20.30±1.1 361.30±16.6 157.20±1.9 600.30±2.0 382.50±5.0 01.80±0.2 96.50±2.1
PS+SS 873.10±0.20 38.40±1.7 18.50±0.8 332.10±5.5 126.90±2.0 632.90±5.2 439.10±0.9 06.40±0.10 95.30±1.9
10%UTBJS 841.10±0.39 335.40±4.5 12.10±0.3 378.60±13.3 158.90±3.9 690.10±5.8 539.9±9.1 05.90±0.5 98.90±2.3
Concentrates
Sorghum 977.40±2.6 77.40±2.3 20.40±0.9 18.60±4.4 22.60±2.6 123.90±2.5 058.9±1.2 4.2±0.6 11.20±0.5
Maize 956.70±0.3 89.10±2.0 29.70±0.3 17.80±5.0 43.30±0.3 135.40±3.2 35.6±0.3 0.37±0.3 11.80±0.7
2%UTM 953.30±3.1 145.30±3.3 30.10±0.3 20.10±7.5 46.70±3.1 137.80±5.8 31.7±8.8 04.2±0.9 12.10±1.9
Wheat bran 906.60±0.2 158.10±1.3 25.00±0.5 91.40±3.6 93.40±0.2 431.50±1.4 115±1.8 05.6±0.14 28.10±1.0
1%UTWB 906.60±4.1 186.20±3.7 24.50±0.1 91.40±11.2 93.80±4.1 432.50±10.5 121.1±5.9 8.50±0.8 27.30±2.9
CFM 939.60±1.5 166.90±2.9 23.10±0.9 37.30±2.0 60.40±1.5 235.00±6.0 93.7±1.1 6.5±1.00 17.70±1.3
SBM 855.50±1.2 471.50±1.0 11.70±1.0 49.70±4.1 144.50±1.2 223.60±6.6 97.9±0.8 10.1±0.6 13.10±0.7
varied from 844.8 to 958.9, 842.8 to 880.6 and
855.5 to 977.4, respectively. Among roughages, CP
(g/kg) content was highest in banana plant waste
(88) and lowest in sugarcane bagasse (21.7). While
in fermented feedstuffs (BPWS), due to proteolysis
(McDonald et al., 2002) the protein content was
decreased further than the parent (BPW) feedstuff
(88 vs 68g/kg). It is obvious that, due to urea
enrichment the protein content of feedstuffs
increases further. Again, protein content of mixed
feedstuff (BJS) decreases further due to addition of
SCB. In concentrates, CP (g/kg) was highest in
wheat bran (158.1) and lowest in sorghum grain
(77.4) except in urea treated concentrate and CFM.
Among roughages, the NDF (g/kg) content
exceeded 600 in all feedstuffs reaching as high as
819 in SCB. While in concentrates, NDF was
varied from 123.9 in sorghum to 432.5 in WB.
Other nutrients such as the EE, CF, ADF and ADL
varied to some extent. The estimated values were
on par with earlier reported values (Sheikh, 2000;
Kiran and Krishnamoorthy, 2007).
Metabolizable energy and in vitro organic
matter digestibility (IVOMD): The gas
production kinetics, metabolisable energy and
organic matter digestibility are given in Table 2. In
general, gas production was recorded higher in
concentrate supplements followed by dry roughages
and lowest in fermented feedstuffs. The difference
in the gas production was due to varied level of
fermentable carbohydrates and available nitrogen.
Therefore, the feedstuffs with higher fermentable
substrate tend to produce more gas and the protein
supplements tend to produce less gas compared to
the energy supplements. Among roughages, the
predicted ME (MJ/kg DM) obtained from RIGVP
ranged between 5.35 in SCB to 8.1in SS whereas in
fermented feedstuffs, it varied from 5.33 (PS) to
7.64 (PS+SS). In concentrates, wheat bran had
lowest ME content (10.9) against highest in maize
(13.13). However, the gas production was
decreased in 10% urea treated BJSS. Similar
observations with urea supplementation to straw
were also reported by Pichad and Metha (2010).

Frontier J. Vet. Anim. Sci.Vol. 4, No. 2 (July-Dec.) 2015 164
Table 2: Gas production (GP-24h), predicted ME (MJ/kg DM) and in vitro organic matter
digestibility (IVOMD %) of some tropical feedstuffs
Feedstuffs GP-24h ME (RIVGP) ME (SEDS) IVOMD (%)
Roughages
BPW 134.62±2.54 6.37±0.07 5.41±0.07 49.25±0.46
BJS 130.38±02.10 6.19±0.06 5.05±0.07 48.39±0.38
SS 210.55±3.42 8.10±0.09 5.32±0.27 58.71±0.51
SCB 112.40±01.95 5.35±0.05 5.46±0.04 39.30±0.35
Fermented feedstuffs
BPWS 105.79±1.97 5.48±0.05 5.19±0.06 43.40±0.35
BPS 101.48±1.50 5.33±0.04 3.95±0.03 43.18±0.27
PS+SS 187.22±4.07 7.64±0.11 4.79±0.19 56.72±0.42
10%UTBJSS 53.52±0.84 5.62±0.02 3.92±0.15 48.90±0.15
Concentrate
Sorghum 356.09±5.15 13.05±0.16 13.13±0.02 84.46±1.02
Maize 354.57±4.96 13.13±0.15 13.03±0.04 84.16±0.98
2%UTM 376.01±1.37 14.28±0.04 13.15±0.09 92.86±0.27
Wheat bran 280.44±2.67 10.90±0.08 11.46±0.03 75.58±0.53
1%UTWB 281.42±4.05 11.17±0.13 11.54±0.08 77.44±0.80
CFM 303.18±3.36 11.91±0.10 12.79±0.07 80.00±0.67
SBM 217.19±2.41 10.86±0.08 13.81±0.02 82.62±0.48
The ME estimated by SEDS was 3.95, 5.19 5.05
5.46 (MJ/kg DM) in BPS, BPWS BJS, and SCB,
respectively. Among concentrates tested, WB had
lower ME than sorghum (11.46 vs 13.13).
Remaining values were in between these two
extremities. Among different feedstuffs tested,
SBM had highest ME (13.38MJ/kg), CP
(471.5g/kg). Although ME content of roughages
and CFM predicted by RIVIGP and SEDS differed,
the relationship between ME (RIVIGP) (y) and ME
(SEDS) (x) was y=2.60+0.75x(r 0.94, P<0.01).
Thus, in the present observation ME predicted from
RIVIGP and SEDS, were almost closely associated
(R2 0.89) with each other (Graph-1). Therefore,
energy estimation by SEDS had the advantage of
easy adaptability of feed analysis. The obtained ME
content of different feedstuffs were in concurrence
with the reported values of Elahi et al., 2012;
Krishnamoorthy et al.,1995 with some exceptions.
The IVOMD varied from 39.30 (SCB) to
58.71 (SS) in dry roughages while in fermented
feedstuffs it ranged from 43.18 (BPS) to 56.72
(PS+SS) and in all the concentrate feedstuffs tested,
the predicted IVOMD exceeded 75%. In general
IVOMD was lowest in fermented feedstuffs than
any dry roughages except sugarcane bagasse and
PS+SS. These IVOMD of banana plant waste
values reported by previous study (Viswanathan et
al.,1989) was higher than the values obtained in
this study. Variety difference could only be
possible reason between reported and observed
values. Urea treatment increased CP content of
BJSS but the ME, IVOMD were not affected by
urea treatment much.
In vitro rumen gas production kinetics: The gas
production kinetics, substrate degradation, PF and
MBP are summarized in Table 3. The D (ml/g DM)

Frontier J. Vet. Anim. Sci.Vol. 4, No. 2 (July-Dec.) 2015 165
Table 3. Gas production kinetics, microbial biomass production (MBP) and efficiency of
microbial biomass synthesis (EMBS) of different feedstuffs
Feedstuff t1/2
(hr)
D
(ml/g) k(h-1)
Gas at t1/2
(ml/g)
TDOM
(mg/g DM)
PF
(mg/ml)
MBP at
t1/2(mg)
EMBS at t1/2
(g/kg)
Roughages
BPW 13.3 189.1 0.05224 101 440.93 4.37 218.73 496.07
BJS 14.1 141.05 0.03869 86.72 356.34 4.11 165.56 464.60
SS 15.9 337.7 0.04351 79.03 395.78 5.01 221.91 560.70
SCB 20.6 193.95 0.03361 88.43 286.61 3.24 92.06 321.22
Fermented feedstuffs
BPWS 20 182.8 0.03462 86.35 388.9 4.52 198.93 511.52
BPS 18.5 172.55 0.03738 50.58 251.98 4.99 140.70 558.39
PS+SS 16.7 304.3 0.0416 71.78 375.89 5.24 217.97 579.89
10%UTBJSS 31.1 139.6 0.02229 35.66 329.55 9.27 251.10 761.94
Concentrates
GS 7.5 406.4 0.0928 156.52 801.81 5.12 435.55 543.21
GM 7.8 409.6 0.08878 167.68 886.81 5.31 494.43 557.54
2%UTM 7.5 430.25 0.09273 122.44 883.66 7.22 597.15 675.76
WB 9.5 344.4 0.07293 117.02 713.45 6.1 439.62 616.19
1%UTWB 9.1 342.55 0.07578 109.71 735.78 6.71 479.05 651.08
CFM 7.9 351.6 0.08825 106.73 790.35 7.43 540.60 684.0
SBM 9.2 265.5 0.07504 110.3 828.27 7.52 570.16 688.38
MBP= [TDOM – (gas at t1/2 x SF)], where SF (stoichiometric factor) was considered as 2.20 for roughages and
2.34 for concentrate. EMBS = (MBS/TDOM) x 1000
value for roughages, fermented feedstuffs and
concentrates were ranged between 141.05 to 337.7,
172.55 to 304.3 and 344.4 to 409.6, respectively.
The corresponding feedstuffs had k values between
0.03361 to 0.05224, 0.03462 to 0.0416 and 0.07293
to 0.0928, respectively.
The PF (ml/mg) ranged from 3.24 to 5 in
roughages while in fermented feedstuffs varied
from 4.52 to 5.24 but in concentrate it exceeded 5
in all feedstuffs. However, lower volume of gas
measured in 10% urea treated BJSS could be
attributed to highest PF but the TDOM was low as

Frontier J. Vet. Anim. Sci.Vol. 4, No. 2 (July-Dec.) 2015 166
compared to other banana plant based feedstuffs
indicating medium quality feedstuff. The PF of the
banana plants in this study was consistent with the
results of previous study (Amarnath and
Balakrishnan,2007). In all the feedstuffs tested, the
PF and EMBS for the concentrate supplements was
higher (5.12 mg/ml and 543.21g/kg) than other
feedstuffs. The PF of feedstuffs can theoretically
vary from 2.75 to 4.41 (Blummel et al., 1997).
Therefore, PF exceeding 4.41 is likely an analytical
artefact. Any factor that increases TDOM, such as
soluble unfermented OM, or that decreases gas
production, such as the degraded protein, contribute
to higher PF (Blummel et al.,2003). In this study
since the incubations were terminated at t1/2 as
recommended by Blummel et al.(2003) and for
concentrate sources was less than 12h, the
possibilities of unfermented OM contributing to
TDOM cannot be ruled out. Thus, using the GPT in
combination with substrate degradation may be
used to rank feeds of interest but for full tool in the
feed evaluation with whole rumen models are more
appropriate (Dijkstra et al., 2005).
CONCLUSION
The feedstuffs used in this study have their own
nutritive value and fermentation characteristics.
Among roughages which were evaluated for their
fodder potential to ruminants, SS ranks first with
highest ME, PF, MBP, lowest gas production than
BPW and BJS. Whereas for fermented feedstuffs
PS+SS ranks first with higher ME, PF, MBP and
lowest gas production than PS and BPWS. In
concentrates WB, CFM and maize were decreasing
order of feed quality. But, SBM ranked first with
lowest gas, higher TDOM and PF when compared
to other feedstuffs.
REFERENCES
Amarnath R. and Balakrishnan.(2007). Evaluation
of banana (Musa paradisiacal) plant by-
product‟s on fermentation characteristics
to assess their fodder potential.
International Journal of Dairy Science.
2(3):217-225.
A.O.A.C. (1995). Official methods of analysis 16th
Ed.Association of Official Analytical
Chemists,Washington, D.C, USA
Blummel, M., Makkar, H.P.S. and Becker, K.
(1997). In vitro gas production: a technique
revisited. Journal of Animal Physiology and
Animal Nutrition, 77: 24-34.
Blummel, M., Karsli, A. and Russel, J.R.(2003).
Influence of diet on growth yields of
rumen microorganisms in vitro and in
vivo: influence on growth yields of
variable carbon fluxes to fermentation
products. Br. J. Nutr. 90; 1–11.
Dijkstra, I., Kebreab, E., Bannink, A., France, J.
and Lopez, S. (2005). Application of the
gas production technique to feed
evaluation systems for ruminants. Anim.
Feed Sci. Techno., 123–124, 561–578.
Elahi,M.Y., Sheibak ,A. and Salem,F.A.(2012).
Influence of waste dates on the in vitro
ruminal gas production of banana tree by-
product silage in cows. Proceedings of the
XVI International Silage Conference
Hameenlinna, Finland, 2-4 July 2012.pp
234-235.
Giger-reverdin., Jocelyne aufrere, Sauvant, D.,
Demarquilly, C. and Vermorel, M.(1994).
Prediction of energy values of compound
feeds ruminants. Animal Feed Science
and Techno., 48 (1-2) :73-98.
Goering, H.K. and Van Soest, P.J. (1970). Forage
Fibre Analyses (Apparatus, Reagents,
Procedures and Some Applications).
Agricultural Handbook No. 379:1-12.
Agric. Research services, Washington,
DC, USA.
Kiran, D. and Krishnamoorthy, U. (2007). Rumen
fermentation and microbial biomass
synthesis indices of feedstuffs determined
by the in vitro gas production technique.
Animal Feed Science and Techno., 134:
170-179.
Krishnamoorthy, U., Soller, H., Steingass, H. and
Menke, K. H. (1991). A comparative study
on rumen fermentation of energy
supplements in vitro. Journal of Animal
Physiology and Animal Nutrition, 65:
28-35.

Frontier J. Vet. Anim. Sci.Vol. 4, No. 2 (July-Dec.) 2015 167
Krishnamoorthy, U., Soller, H., Steingass, H. and
Menke, K.H. (1995). Energy and protein
evaluation of tropical feedstuffs for whole
tract and ruminal digestion by chemical
analyses and rumen inoculums studies in
vitro. Anim. Feed Sci. Techno., 52: 177-188.
Makkar, H.P.S., Blummel, M. and Becker, K. (1995).
Formation of complexes between polyvinyl
pyrrolidones or polyethylene glycols and
tannins, and their implications in gas
production and true digestibility in in vitro
techniques. Br. J. Nutr. 73: 897–933.
McDonald,P., Edwards, R.A., Greenhalgh, J.F.D. and
Morgan, C.A.(2002). Animal Nutrition.
Sixth Edition. Dorling Kindersley (India)
Pvt.Ltd., New Delhi. pp.515-535.
Menke, K.H. and Steingass, H.(1988). Estimation of the
energetic feed value obtained from chemical
analysis and in vitro gas production using
rumen fluid. Anim. Res. Devpt., 28: 7-55.
Pichard K. and Metha W. (2010). Effect of
chemical treatment of rice straw on rumen
fermentation characteristics, anaerobic
fungal diversity in vitro. J. Anim and
Veterinary Advances., 9: 3070-3076.
Sheikh, N.H. (2000).The preservation of banana
crop residues through ensiling process.
Department of Animal Production, Faculty
of Agriculture, Somali National
University, FAO Corporate Documentary
Repositary, ILRI, Mogadishu, Somalia.
Van Soest, P.J. (1971). Estimation of nutritive
value from laboratory analysis. Proc.
Cornell Nutr. Conf. for feed
manufacturers.pp.106-117.
Viswanathan, K., Kadirvel, R. and Chandrasekaran,
D. (1989). Nutritive value of banana stalk
(Musa cavendishi) as a feed for
sheep.Anim. Feed Sci. Technol., 22: 327-
332.

Frontier J. Vet. Anim. Sci.Vol. 4, No. 2 (July-Dec.) 2015 168
*Part of Ph.D. Thesis submitted by the first author to KVAFSU, Bidar
Assistant Professor, Dept. of Animal Genetics & Breeding, email: [email protected] 1Professor and Head, Dept. of Animal Genetics and Breeding, 2Principal Scientist, AICRP on Poultry meat, Dept. of Poultry Science, 3Professor and Head, Dept. of LPT, 4Professor and Head, Dept. of VAHE,
Bandur sheep is an other popular name of Mandya
sheep, which has been acclaimed as one of the best
mutton type indigenous sheep breed of Karnataka
and in India. Besides, its meat is being treated at
National and International spectrum of sheep
products as the most nutritious and of high quality
in the diets of human beings. Bandur phenotype is
typically meat type with inverted 'U' shaped
conformation from the rear. Although it is highly
rated for its meat quality/ taste, there is scant
literature on the carcass traits and mutton quality
traits of Bandur sheep. While traditional methods to
improve carcass and meat quality traits turned out
to be inefficient, recent development of molecular
genetics tools eased the recognition of genes that
may have a large effect on specific traits. One of
the ways of identifying genes that determine a
given trait is to evaluate the polymorphism in a
candidate gene underlying the trait and contributing
to a specific phenotype (Gregula-Kania, 2012).
Ovine calpastatin gene is considered as
one of the potential candidate gene for growth,
carcass traits and to improve slaughter lamb
production (Palmer et al., 1999). Calpastatin gene
is of 100 kb length; includes 4 exons and located at
5q15 region on chromosome no. 5 (Gabor et al.,
2009). The „Calpain-Calpastatin System (CCS) is
found in most of the animal tissues and influences
many important processes including muscle
development and degradation, regulation of protein
degradation and rebuilding, cell cycle,
organogenesis, post mortem meat tenderization,
cataract formation and cell death (Merin et al.,
1998). The CCS is constituted of three well
characterized proteins, which include two
ubiquitous Ca2+
dependent proteolytic enzymes (µ
and m calpain). Whereas, Calpastatin is the third
member capable of inhibiting more than one
calpain molecule. Calpastatin is a variable
component of the calpain system and skeletal
muscle calpastatin activity is highly related to rate
of muscle protein turnover and post-mortem
tenderisation. All these factors are main concerns
for livestock industries to improve rate of growth
and meat quality (Goll et al., 2003).
Genetic Polymorphism of Calpastatin Gene in Bandur Sheep
Naveen Kumar, S*., Jayashankar, M.R1., Nagaraja Ramakrishnappa
1, Nagaraja, C.S
2.,
Nadeem Fairoze3 and Satyanarayana, K
4.
Dept. of Animal Genetics and Breeding,Veterinary College, Bengaluru-24
Received: 05 February, 2015; Accepted: 08 July, 2015
ABSTRACT
The present study was carried out to determine the genetic polymorphism of Calpastatin gene in Bandur sheep, a
native breed of Karnataka. Blood samples were collected from randomly chosen 100 Bandur ram lambs born at
Livestock Research and Information Centre (Sheep), KVAFSU, Nagamangala and from different farmer‟s flocks in
the home tract. Genomic DNA was extracted by following Miller‟s High salt method. Using gene specific primers,
ovine Calpastatin sequence of 620 bp comprising of exon 1C/1D (including the intervening intron) was amplified.
Further, PCR-RFLP analysis was carried out using MspI and NcoI restriction enzymes, which differentiated three
genotypes viz., MM, MN and NN having genotypic frequency of 0.24, 0.59 and 0.17, respectively. The frequency of
M and N allele were 0.535 and 0.465, respectively. Alignment of M and N allele sequences of Calpastatin by CLC
Main Workbench 6.8.1. showed 5 SNPs; G→A transition at 286 and 352 bp, C→T transition at 373 and 526 bp and
A→G transition at 443 bp position. Chi square test confirmed the existence of Hardy Weinberg equilibrium in the
studied population. Genetic variability observed in the calpastatin gene could be used to find association of observed
genotypes and SNPs with growth, carcass and meat quality traits.
Key words: Calpastatin, Restriction enzymes, SNPs, Bandur sheep

Frontier J. Vet. Anim. Sci.Vol. 4, No. 2 (July-Dec.) 2015 169
In recent years, increasing and
improving quality of meat have been highlighted,
by various reports confirm relationship of
calpastatin polymorphism with growth and meat
quality traits viz. Nassiry et al. (2006) found that
AB genotype had higher daily weight gain in
Iranian Kurdi sheep and whereas, Palmer et al.
(1999) reported that AC genotype (123 g/ day)
having increased live weight at 18 per cent more
than AA genotype in the crossbred Dorset and
Coopworth sheep. In view of these evidences
from the literature, the present study was carried
to identify the possible genetic polymorphism of
calpastatin gene, as a productive marker related
to growth and meat quality traits in Bandur
sheep.
MATERIALS AND METHODS
Collection of Blood Samples and Isolation of
DNA: Blood samples were collected from 100
Bandur ram lambs distributed over the villages of
Malavalli taluk, Mandya district as well as from
Livestock Research and Information Centre
(Sheep), KVAFSU, Nagamangala.
Approximately 5 ml of blood were collected in
vacutainer containing EDTA and stored at 4 °C.
The blood samples were processed within 24
hours of collection. Genomic DNA was isolated
by adopting High salt method as described by
Miller et al. (1988) with necessary modifications.
The purity of the isolated DNA was ascertained
by Spectrophotometer reading and
electrophoretic analysis using 0.8 per cent
agarose gel.
Polymerase Chain Reaction amplification of
Ovine Calpstatin sequence: Using sequence
specific primers, exon 1C/1D and the intervening
intron from a portion of the first repetitive
domain of the ovine CAST gene was amplified
by Polymerase Chain Reaction (PCR). Further,
the PCR amplified product was subjected for
RFLP analysis using MspI and NcoI restriction
enzymes. Oligonucleotide primers were procured
from Amnion Biosciences Pvt. Ltd., Benagluru,
India. Details of primer sequences, size of
expected PCR amplicons and related references
are presented in Table 1.
Table 1: Details of Primers used for
amplification of Calpastatin gene in Bandur
Sheep
Primer sequence
Expected
product
size (bp)
Reference
CAST 1C- Forward
(5' TGGGGCCCAATGA
CGCCATCGATG 3') 620
Palmer et al.,
1998; Nassiry
et al., 2006;
Mohammadi
et al., 2008
CAST 1D - Reverse
(5' GGTGGAGCAGCAC
TTCTGATCACC 3')
Thermal Cycler (S1000, Bio-Rad, USA)
was used for PCR amplification of CAST gene
using Red PCR Master Mix (Amnion Biosciences
Pvt. Ltd.). The reaction mixture of 25 µl consisted
of 12.5 µl of Red PCR Master Mix, 1 µl (10 pmol/
µl) each of Forward (Exon 1C) and Reverse (Exon
1D) primer, 9.5 µl of PCR grade water and 1 µl
(100 ng) of template DNA. The PCR reaction was
carried out with an initial denaturation temperature
of 95 °C (5 min), 33 cycles of 94
°C (1 min), 60
°C
(1 min) and 72 °C (2 min), followed by final
extension at 72 °C (8 min). The PCR amplified
products were confirmed by resolving on 1.5 per
cent agarose in parallel with 100 bp DNA ladder.
Gel electrophoresis was carried out at a constant
voltage of 100 V for 60 min in 1X TAE buffer.
Restriction Fragment Length Polymorphism
(RFLP) Analysis: RFLP analysis of PCR
amplified CAST gene was carried out using MspI
and NcoI restriction enzymes. The details of the
restriction enzymes and recognition sites are
mentioned in Table 2.
Table 2: Restriction enzymes used for digestion
of PCR amplicons
Sl.
No. Restriction enzymes Recognition site
1. MspI (Morexella
species)
5‟…C↓CGG…3‟
3‟…GGC↑C…5‟
2. NcoI (Nocardia
corallina)
5‟…C↓CATGG…3‟
3‟…GGTAC↑C…5‟
Restriction enzyme digestion was carried
in a total reaction mix of 10 µl, which consisted of
3.5 µl of autoclaved triple distilled water, 1 µl of 10
X assay buffer for RE, 0.5 µl of restriction enzyme
(10 U/µl) and 5 µl of PCR product. The digestion

Frontier J. Vet. Anim. Sci.Vol. 4, No. 2 (July-Dec.) 2015 170
mixture was incubated overnight at 37 °C. The
digested products were resolved along with 100 bp
DNA ladder on 2.5 per cent agarose gel
electrophoresis and the resultant fragments that
were stained with ethidium bromide were analysed
under Gel documentation system (Geldoc XR+,
Bio-Rad, USA).
Statistical analysis: The gene and genotypic
frequency was calculated based on the fragments
resolved by digested PCR products. Presence or
absence of Hardy Weinberg equilibrium in the
population was determined by Chi square test (P ≤
0.05).
RESULTS AND DISCUSSION
The PCR yielded 620 bp fragment comprising the
exon 1C/1D and the intervening introns of the
ovine CAST gene (Fig. 1). RFLP analysis of PCR
products yielded two alleles viz., M and N. The
presence of these two alleles in CAST gene was
differentiated using two restriction enzymes having
differing restriction sites. The enzyme MspI
digested only M amplimer but not the N whereas,
enzyme NcoI digested only N amplimer. MspI
digestion of M amplimer yielded digestion products
of 284 and 336 bp whereas, NcoI digestion of N
amplimer resulted in two fragments of size 370 bp
and 250 bp (Fig. 2).
Fig.1: Agarose gel electrophoresis (1.5 %)
showing the amplification of Calpastatin gene
(Exon 1C/ 1D and the intervening intron) under
gel documentation system.
Fig. 2: Agarose electrophoresis gel (2.5 %)
showing the PCR-RFLP pattern of Calpastatin
gene under gel documentation system.
Lane 1 & 8 – 100 bp Ladder Lane 2, 4, 6 –
CAST/MspI genotypes MM, MN & NN and
Lane 3, 5, 7 – CAST/NcoI genotypes MM, MN &
NN
Thus, the PCR-RFLP pattern for animals
that were homozygous for M allele (MM)
produced two and one bands by MspI and NcoI,
respectively and the animals that were
homozygous for N allele (NN) produced one and
two bands by MspI and NcoI, respectively. The
animals which were heterozygous (MN) yielded
three bands each for both MspI and NcoI.
In the present study the Bandur ram
lamb population showed three genotypes MM,
MN and NN with frequency of 0.24, 0.59 and
0.17, respectively. The allelic frequencies were
0.535 and 0.465 for allele M and N, respectively
(Table 3). The selected PCR product
corresponding to three genotypes: MM, MN and
NN were got sequenced and the expected size of
620 bp fragment was confirmed. Further,
restriction site analysis of these sequences
revealed presence of a single restriction site each
for MspI in M allele (Fig. 3) and NcoI in N allele
(Fig. 4). Each restriction cleavage yielded two
fragments of 284 and 336 bp and, 370 and 250 bp
length for M and N allele, respectively.

Frontier J. Vet. Anim. Sci.Vol. 4, No. 2 (July-Dec.) 2015 171
Table 3: Gene and Genotypic frequency of
Calpastatin gene in Bandur sheep
No. of
Samp
-les
Allele
frequency
Genotypic
frequency
Chi
square
value
(P <
0.05) M N MM MN NN
100 0.535 0.465 0.24 0.59 0.17 3.4526NS
Fig. 3: Annotated sequence of Calpastatin M allele
showing restriction site for MspI and Primer position
Fig. 4: Annotated sequence of Calpastatin N allele
showing restriction site for NcoI and Primer positio
Alignment of M and N allele sequences of
CAST by CLC Main Workbench 6.8.1. showed 5
SNPs: G→A transition at 286 and 352 bp (Fig. 5),
C→T transition at 373 and 526 bp (Fig. 6) and A→G
transition at 443 bp position (Fig. 7). Further, the PCR
amplified sequence of CAST gene (620 bp) was used
as query and subjected to nucleotide blast at NCBI
(http://blast.ncbi.nlm.nih.gov/ blast/Blast.cgi), which
revealed 100, 94 and 98 per cent identity with Ovis
aries (AF016006.1), Bos taurus (AY834771.1) and
Capra hircus (JQ739234.1), respectively.
Palmer et al. (1998) described two allele
systems of polymorphic variants (M and N) in a
region (Exon 1C/1D) of the ovine CAST by the
PCR-RFLP method in Dorset Down sheep. They
concluded that digestion with restriction enzymes
MspI and NcoI differentiates alleles M and N. The
present study confirm the presence of these alleles
as observed by previous workers (Gabor et al.,
2009; Gharahveysi et al., 2012; Khan et al., 2012;
Mohammadi et al., 2008; Nanekarani et al., 2011a;
Nanekarani et al., 2011b; Shahroudi et al., 2006;
Suleman et al., 2012 and Szkudlarek- Kowalczyk et
al., 2011) in different sheep breeds.
The results from present study are in
agreement with the observations from various
studies involving different breeds of sheep. Azari et
al. (2012) reported an allele frequency of 55.45 and
44.55 per cent for A1 (M) and A2 (N), respectively
in Dalagh sheep of Iran. Elyasi et al. (2009)
observed an allele frequency of 69, 48 and 50 per
cent for M allele in Ghezel, Arkhamerino and
Ghezel x Arkhamerino sheep, respectively.
Nanekarani et al. (2011a) found frequency of 63.8
and 36.2 per cent for M and N allele, respectively
in Lori Sheep, whereas Ata and Cemal (2013)
observed allele frequency of 54.4 and 45.6 per cent
for M and N alleles, respectively in synthetic Karya
sheep of Turkey. Further, higher MN genotype was
observed in Arkhamerino (47.62 %) and Ghezel x
Arkhamerino sheep (46.67 %), Lori sheep (46.2 %)
and Dalgh sheep (38 %).
However, the allele frequencies observed
from the present study were in contrast to that of
observations reported by Palmer et al. (1998)
wherein, M and N allele frequency were 77 and 23
per cent, respectively in Corriedale rams. Similar
results as per Palmert et al. (1998) were also
reported in different sheep breeds of Iran
(Shahroudi et al., 2006 and Gharahveysi et al.,
2012), Slovakia (Gabor et al., 2009), Pakistan
(Suleman et al., 2012) and Poland (Szkudlarek-
Kowalczyk et al., 2011). Further, with respect to
the genotypic frequency in the above studies, MM
genotype was found to be higher followed by MN
and NN. However, breeds like Berrichon du Cher,

Frontier J. Vet. Anim. Sci.Vol. 4, No. 2 (July-Dec.) 2015 172
A B
Fig. 5:Chromatograms showing G→A transition at 286 (A) and 352(B) bp position
A B
Fig. 6: Chromatograms showing C→T transition at 373 (A) and 526 (B) bp position
Fig. 7: Chromatograms showing A→G transition at 443bp position
lle de France (Szkudlarek-Kowalczyk et al., 2011)
and Slovakia (Gabor et al., 2009) showed only two
genotypes; MM and MN, whereas in the present
study, the frequency of MN genotype was higher
followed by MM and NN.
CONCLUSION
The present study successfully demonstrated the
molecular genetic polymorphism of CAST gene
(Exon 1C/1D and the intervening intron) in Bandur
sheep through PCR-RFLP analysis. It was

Frontier J. Vet. Anim. Sci.Vol. 4, No. 2 (July-Dec.) 2015 173
concluded that the PCR-RFLP method is suitable
for assessing genetic variability of CAST gene and
detects single nucleotide changes after DNA
sequence analysis of the investigated genomic
region. Further the results unwrap remarkable
prospects for future selection programmes,
especially marker assisted selection. The genetic
variability observed in the calpastatin gene could be
used to find association of observed genotypes and
SNPs with growth, carcass and meat quality traits.
REFERENCES
Ata, N. and Cemal , I., 2013. Calpastatin Gene
Polymorphism in Cine Capari and Karya
Sheep. Scientific Papers, Series D. Animal
Science, 56: 48-51
Azari, M. A., Dehnavi, E., Yousefi, S. and
Shahmohamadi, L., 2012. Polymorphism
of Calpastatin, Calpain and Myostatin
Genes in Native Dalagh Sheep in Iran.
Slovak J. Anim.Sci., 45(1): 1-6.
Elyasi, G., Shoja Jalil, N. M., Pirahari, O. and
Javanmard, A., 2009. Allelic and Genotypic
Frequency of Calpastatin Gene in Ghezel
and Arkhamerino Sheeps and their
Crossbreds. Journal of New Agricultural
Science, 4(13): 1.
Gabor, M., Trakovicka, A. and Miluchova, M.,
2009. Analysis of Polymorphism of CAST
Gene and CLPG Gene in Sheep by PCR –
RFLP Method. Zootehnie si Biotehnologii,
42(2): 470-476.
Gharahveysi, S., Abbasi, H. A., Irani, M.,
Abdullahpour, R. and Mirhabibi, S., 2012.
Polymorphism Investigation of Calpastatin
Gene in Zel Sheep Population of Iran by
PCR-RFLP Method. Afr. J. Biotechnol., 11:
3211- 3214.
Goll, E. G., Thompson, V. F., Li, H., Wei, W. and
Cong, J., 2003. The Calpain System. Phys
Rev., 83: 731-801.
Gregula-Kania, M., 2012. Effect of Calpastatin
Gene Polymorphism on Lamb Growth and
Muscling. Ann. Anim. Sci., 12(1): 63-72.
Khan, S. U. H., Riaz, M. N., Ghaffar, A. and Khan,
M. F. U., 2012. Calpastatin (CAST) Gene
Polymorphism and its Association with
Average Daily Weight Gain in Balkhi and
Kajli sheep and Beetal Goat Breeds.
Pakistan J. Med. Sci., 44: 377-382.
Merin, L. B., Kendal, T. V., Thompson, F. and
Goll, D. E., 1998. Change in the Calpains
and Calpastatin during Post Mortem
Storage of bovine Muscle. J. Anim. Sci.,
76: 2415-2434.
Miller, S. A., Dykes, D. and Polesky, H. F., 1988. A
sample Salting Out Procedure for Extraction
of DNA from Human Nucleated Cells.
Nucleic Acids Res., 16: 1215.
Mohammadi, M., Nasiri, M. T. B., Alami-Saeid, K.
H., Fayazi, J., Mamoee, M. and Sadr, A.
S., 2008. Polymorphism of Calpastatin
Gene in Arabic Sheep using PCR-RFLP.
African Journal of Biotechnology, 7(15):
2682-2684.
Nanekarani, S., Asadi, N. and Khederzadeh, S., 2011a.
Genotypic Frequency of Calpastatin Gene in
Lori Sheep by PCR-RFLP Method.
International Conference on Food
Engineering and Biotechnology, 4: 148-150.
Nanekarani, S., Khederzadeh, S. and Kaftarkari, A.
M., 2011b. Genotypic Frequency of
Calpastatin Gene in Atabi Sheep by PBR
Method. International Conference on Food
Engineering and Biotechnology, 9: 189-192.
Nassiry, M. R., Tahmoorespour, M., Javadmanesh, A.,
Soltani, M. and Far, S. F., 2006. Calpastatin
Polymorphism and its Association with
Daily Gain in Kurdi Sheep. Iranian Journal
of Biotechnology, 4(3): 188-192.
Palmer, B. R., Morton, J. D., Roberts, N., Ilian,
M.A. and Bickerstaffe, R., 1999. Marker-
Assisted Selection for Meat Quality and
the Ovine Calpastatin Gene. Proceedings
of the New Zealand Society of Animal
Production, 59: 266-268.

Frontier J. Vet. Anim. Sci.Vol. 4, No. 2 (July-Dec.) 2015 174
Palmer, B. R., Robert, N., Hickford, J. G. H. and
Bickerstaffe, G., 1998. Rapid
Communication: PCR-RFLP for MspI and
NcoI in the Ovine Calpastatin Gene. J.
Anim. Sci., 76: 1499-1500.
Shahroudi, F. E., Nassiry, M. R., Valizadh, R.,
Moussavi, A. H., Tahmoorespour, M. and
Ghiasi, H., 2006. Genetic Polymorphism
at MTNR1A, CAST and CAPN Loci in
Iranian Karakul Sheep. Iranian Journal of
Biotechnology, 4(2): 117 - 122.
Suleman, M., Khan, S. U., Riaz, M. N., Yousaf, M.,
Shah, A., Ishaq, R. and Ghafoor, A., 2012.
Calpastatin (CAST) Gene Polymorphism
in Kajli, Lohi and Thalli Sheep Breeds.
African Journal of Biotechnology, 11(47):
10655-10660.
Szkudlarek-Kowalczyk, M., Wisniewska, E. and
Mroczkowski, S., 2011. Polymorphisms of
calpastatin Gene in Sheep. Journal of
Central European Agriculture, 12(3): 425-
432.

Frontier J. Vet. Anim. Sci.Vol. 4, No. 2 (July-Dec.) 2015 175
aDairy Engineering Department, Dairy Science College, Hebbal, Bangalore- 560024, India
Water is the main component of all the food
products and stability of product depends upon the
interaction of water with other components present
in the product. The status of water in the product
plays a crucial role in the preservation of biological
materials in both the raw and processed states. The
simplest way for expressing such a status is the
concept of water activity.
Water activity (aw) has become one of the
most important intrinsic properties used for
predicting the survival and growth of
microorganisms in food (Scott, 1957), due to its
direct influence on product stability and quality.
The understanding and control of aw contributes to
safer food storage conditions in general and forms
the basis of much modern food formulations,
especially for intermediate-moisture foods. The
relationship between water activity and the
equilibrium moisture content of food is known as
moisture sorption isotherm. The moisture sorption
isotherm is an extremely valuable tool for food
scientists and technologists to predict potential
changes in food stability. It can be used for the
determination of storage conditions, packaging
requirements and ingredient selection.
MATERIALS AND METHODS
Test Sample: Whey protein Concentrate (35% and
70% protein content) was chosen as test sample for
the present study. Test sample was procured from a
commercial firm “M/S Modern Dairies Ltd”,
Karnal. Chemical composition of WPC was
determined using standard methods:
Moisture content (IS 1981), fat content
(Mojonnier method), total protein by Micro
Kjeldhal (AOAC, 2000), lactose (IS: SP-18, 1981)
and ash content was calculated by difference.
Average composition of WPC (35%) was found to
be protein 37.4%, moisture 4.4% (dry basis), fat
3.3%, lactose 46.7%, ash 8.3% and that of WPC
(70%) was protein 70.7%, moisture 3.9% (dry
basis), fat 4.6%, lactose 14.5% and ash 6.3%.
Establishing Moisture Sorption Isotherm
Sorption Apparatus: The standard sorption
apparatus recommended by COST 90 Project was
used in this study. The sorption device consisted of
a wide mouth glass bottle (200 ml) with vapor tight
lid used as sorbostat. Inside each sorbostat was a
support for weighing beaker (25 ml) and the
weighing beaker (10 ml) in which the sample
material was exposed to the humid atmosphere in
the container maintained by the saturated salt
slurries.
Selection of Salts for Maintaining Different
Humidity: Eight reagent grades salt slurries, viz.,
Lithium chloride, Magnesium chloride, Sodium
bromide, Ammonium sulphate, Potassium chloride,
Potassium chromate, Barium chloride and
Potassium sulphate were chosen. The salts were
dissolved in distilled water at 100°C and cooled to
Moisture Adsorption Characteristics of Whey Protein Concentrate
Smitha, R, Sawhney, I. K. and Mahesh Kumar, G.
Dairy Engineering Division, National Dairy Research Institute, Karnal – 132001, India
Received: 14 December, 2014; Accepted: 27 May, 2015
ABSTRACT
Water activity is considered as one of the most important parameters in food preservation and processing. Sorption
isotherms of Whey Protein Concentrate of 35% & 70% protein at 25, 35 and 450C were determined using a static-
Gravimetric method. Sorption isotherms followed a type II (sigmoidal) shape. Equilibrium moisture content decreased
with increase in temperature at constant water activity. The GAB, Modified Mizrahi, Caurie, Oswin, and Halsay
models were applied to the isotherm data. The GAB model, which was having least RMS% value, found as best fitted
equation. Net isosteric heats were estimated from equilibrium sorption data using the Clausius–Clapeyron equation.
The heat of sorption was found to increase initially and attain a peak value of 19.28 kJ/kg in WPC (35%) and 17.6
kJ/kg in WPC (70%) at 5% moisture level and then decreased.
Keywords: Whey Protein Concentrate (WPC), Isotherms, Sorption models.

Frontier J. Vet. Anim. Sci.Vol. 4, No. 2 (July-Dec.) 2015 176
test temperatures (25, 35 and 450C) for
crystallization to form saturated slurries. Water
activities of these salts ranges from 0.11 to 0.97 at
different temperature are given in the Table 1.
Table 1: Water Activity of saturated Salts
solutions at Different Temperature
Salts Water Activity
250C 35
0C 45
0C
LiCl.H2O 0.11 0.11 0.11
MgCl2. 6H2O 0.32 0.32 0.31
NaBr 0.57 0.57 0.56
(NH3)2SO4 0.81 0.80 0.79
KCl 0.84 0.83 082
K2cro4 0.87 0.84 0.80
BaCl2.2H2O 0.90 0.88 0.86
K2SO4 0.97 0.96 0.97
Maintenance of Temperature: A set of three
temperatures viz., 25, 35, and 450C were selected
for the study. Constant temperature cabinets were
used for maintaining these temperatures. Effect of
temperature on water activity of whey protein
concentrate was studied by comparing moisture
gain or loss of sample inside the sorbostats at
different water activity and at corresponding
temperatures.
Sorption Procedure: The sorption apparatus were
allowed to equilibrate at respective temperatures for
four days before the samples were placed into them.
For adsorption isotherm, samples were completely
dehydrated by placing them over P2O5 for 24hours.
Weighed quantity of the dry test samples (1.00 +/-
0.05g) was taken into tared sample beakers, which
was then transferred to the sorbostat, containing
saturated salt slurry.
To prevent mold growth, about 0.1mg of
potassium sorbate was added to each WPC sample. At
each designated controlled temperature, the samples
were weighed at intervals of 3 days and equilibrium
was judged to have been attained when difference
between three consecutive sample weighing was less
than 1 mg/ g of solids. The equilibration period ranged
from 12 to 14 days. Measurements for each
experiment were done in duplicate and average value
of the equilibrium moisture content was taken for
further analysis. Equilibrium moisture content (EMC)
at the designated temperature in terms of grams water
/ 100 g of solid was obtained for each sample by using
the equation (1). The EMC were plotted against
equilibrium relative humidities / water activities (aw)
to establish moisture sorption isotherm.
……. (1)
Where,
M = Moisture content (g water/100g solids, d.b)
W1 = Initial weight of the sample (g)
W2 = Final weight of the sample (g)
m1 = Initial moisture content of sample (g
water/100g solids, d.b)
Fitting Of Isotherm Equations: The five isotherm
equations that were used to fit the data are
presented below. The linearized forms of the two
parameter models were used for evaluating the
best-fitted values of constants using a regression
programme. The sorption data was analyzed
according to the models and the corresponding
constants were determined. The goodness of fit of
each model was computed in terms of root mean
square percent error (RMS %).
(Halsey) ………. (2)
(Oswin) ………. (3)
(Caurie) ..... (4)
(Mizrahi) ..……. (5)
(GAB) …. (6)
Where,
W = Equilibrium moisture content (g /100g dry
solids)
Wo = Monolayer moisture content (g /100g dry
solids)
aw = Water activity, decimal fraction
C = Density of sorbed water (g/ml)
G = Guggenheim constant
K = Correction factor
a, b, and c are constants

Frontier J. Vet. Anim. Sci.Vol. 4, No. 2 (July-Dec.) 2015 177
The GAB equation could be rearranged into a
second-degree polynomial equation
……….. (7)
Where,
………. (8)
………. (9)
………. (10)
W0 is the moisture content corresponding to
saturation of all primary adsorption sites by one
water molecule (equivalent to monolayer in the
BET theory), G is the Guggenheim constant and
k is the factor correcting for properties of
multilayer molecule with respect to the bulk
liquid. A non-linear regression analysis of aw/w
vs aw yields a polynomial of second order. The
coefficients a, b and c were obtained from this
polynomial equation and substituted one by one
to obtain GAB constants Wm, C and K.
Accuracy of Fit: The accuracy of fit was evaluated
by calculating root mean square percent error
(RMS %). (Lievonen and Roos, 2002):
…. (11)
Where,
Wexp = EMC experimentally obtained
Wcal = EMC predicted by the model
n = Number data points
2.7 Calculation of net isosteric heat of
sorption: The net isosteric heat of sorption was
evaluated from the following generalized
equation of Clausius- Clapeyron (Aguerre et al.,
1988):
……. (12)
Where,
ΔHW = Net isosteric heat of sorption (kJ/ mol)
R = Gas constant (8.314 J/ mol-K)
The isosteric heat of sorption was calculated from
above equation by plotting log (aw) vs. 1/ T and
determining slope of curve, which is equal to -∆
Hw/ 2.303 R. The slope of each line was found out
by linear regression and the net isosteric heat of
sorption was calculated.
Temperature dependence of isotherm parameters:
Temperature dependence of sorption phenomenon
provides the valuable information about the changes
related to the energetics of the system. The constants
in moisture sorption isotherm equations, which
represent either temperature or a function of
temperature, are used to calculate the temperature
dependence of water activity. Clausius-
Clapeyron equation was used to predict water activity
at any temperature. The variation in water activity
with temperature was predicted by incorporating
temperature terms into sorption equations.
………. (13)
………. (14)
………. (15)
The above equations together, with G.A.B.
equation were used to calculate the equilibrium
water content W (T) of WPC at a known water
activity and temperature by means of GAB (T)
constants.
RESULTS AND DISCUSSION
Sorption Isotherms: Moisture adsorption
isotherms for Dried Whey Protein Concentrate with
35% and 70% protein content at 25, 35 and 450C
were established and are shown in fig 1 & 2
respectively. All sorption isotherms demonstrate an
increase in equilibrium moisture content with
increasing water activity and beyond 0.8 aw the
increase in EMC was sharp. This behavior is
manifested in the form of a sigmoidal shaped curve,
thus reflecting a Type II isotherm which is typical
to the most of the foods.

Frontier J. Vet. Anim. Sci.Vol. 4, No. 2 (July-Dec.) 2015 178
Fig. 1: Adsorption isotherm of WPC (35%) at
various temperatures
Fig. 2: Adsorption isotherm of WPC (70%)at
various temperatures
Similar types of observations were found
by Lin et al. (2005) for milk powders (SMP,
WMP), Sahu (2006) for SMP, Govardhan (2007)
for Gulabjamun mix powder.
Effect of temperature on isotherms: It may be
observed from fig. 1 that in case of WPC (35%), up
to 0.5aw all the three curves are slightly
distinguishable. After that the curves are
superimposing on each other. Where as in WPC
(70%), the curves (fig. 2) are distinguishable upto
to 0.8aw, above that the curves were superimposed.
It was also noted that equilibrium moisture content
was lower at higher temperature. The equilibrium
moisture content decreased with increase in
temperature at the same aw, or the aw increased with
decrease in temperature at the same equilibrium
moisture content. A number of workers have
suggested explanations for this observation and
explained this trend as being due to the increased
state of excitation of molecules at higher
temperatures, leading to an increase in distance and
corresponding decrease in attractive forces between
them. This gives rise to the observed decrease in
degree of water sorption at a given relative
humidity as the temperature is increased.
The analysis of variance (ANOVA)
revealed that the effect of temperature on moisture
content was statistically not significant ( p > 0.05)
over temperature range 25- 450C. However beyond
0.8 aw the effect of temperature on equilibrium
moisture content was reverse, that is, the
equilibrium moisture content increased with
increase in temperature at the same water activity.
Isotherm Models: The two and three parameter
models as shown in equations from 2 to 10 were
used for evaluating the best-fitted values of
constants using a linear regression programme.
Values of different parameters and RMS at
different temperatures for different models have
been given in table 2 and 3.
Table 2: Statistical parameters and %RMS
values of Adsorption of WPC (35%) for selected
equations at different temperatures
Equation 0C Constants
% RMS a B c
Halsey
45
1.3424 1.0619 - 9.6746
Oswin 1.9002 0.7423 - 13.8403
Caurie -1.9002 0.7423 - 13.8403
Modified
Mizrahi -1.2568 -2.9486 -0.2563 11.4720
GAB 0.0477 0.2174 -0.2772 6.7242
Halsey
35
1.4826 0.9336 - 6.2097
Oswin 1.9837 0.6625 - 11.2973
Caurie -1.9837 0.6625 - 11.2973
Modified
Mizrahi -1.4165 -4.6257 2.4193 6.1256
GAB 0.0323 0.2246 -0.2594 5.2974
Halsey
25
1.6516 0.7961 - 6.9028
Oswin 2.0878 0.5732 - 12.8047
Caurie -2.0878 0.5732 - 12.8047
Modified
Mizrahi -2.1627 -4.1478 3.2933 6.1701
GAB 0.0148 0.2445 -0.2543 6.4388

Frontier J. Vet. Anim. Sci.Vol. 4, No. 2 (July-Dec.) 2015 179
Table 3: Statistical parameters and %RMS
values of Adsorption of WPC (70%) for selected
equations at different temperatures.
Equation
0C Constants %
RMS a b c
Halsey
45
1.1334 1.1150 - 6.3543
Oswin 1.7197 0.7782 - 12.2404
Caurie -1.7197 0.7782 - 12.2404
Modified
Mizrahi -0.9034 -2.5038 -0.6724 7.2392
GAB 0.0657 0.2503 0.3374 4.9398
Halsey
35
1.2697 0.9968 - 9.3212
Oswin 1.8016 0.7124 - 7.1051
Caurie -1.8016 0.7124 - 7.1051
Modified
Mizrahi -0.6931 -6.2721 3.9307 6.0153
GAB 0.0623 0.1574 -0.2152 5.2593
Halsey
25
1.4281 0.8613 - 7.5248
Oswin 1.8964 0.6256 - 7.3204
Caurie -1.8964 0.6256 - 7.3204
Modified
Mizrahi -1.0012 -7.0699 5.6074 5.2334
GAB 0.0385 0.2009 -0.2304 5.9926
At all the three temperatures 25, 35 and
45ºC GAB equation showed the best fit as
exemplified by the percentage RMS values of
6.4338, 5.2974 and 6.7242 at 25ºC, 35ºC and 45ºC
respectively for WPC (35% protein content) and
5.9926, 5.2593 and 4.9398 for WPC (70% protein
content). This was followed by modified Mizrahi
with % RMS between 6.1701 and 11.472 for WPC
(35%) and between 5.2334 and 7.2392 for WPC
(70%). The Halsey, Oswin and Cauri models were
inadequate for representing the adsorption isotherm
of whey protein concentrate giving % RMS above
13.8403 for WPC (35%) and 12.2404 for WPC
(70%). (Table 2 and 3). Since Modified Mizrahi
equation is not defined for the whole range of water
activity. this study resulted in the GAB as best
fitted equation for adsorption isotherms. GAB
equation was fitted precisely up to 0.90 aw as well
as it provided the better evaluation of amount of
water tightly bound by primary adsorption sites.
The parameters of GAB equation at
different temperatures for adsorption isotherms for
WPC (35% & 70%) are given in the table 4 and 5.
The values of GAB sorption constant for multilayer
moisture content (K) increased with increasing
temperature, where as the monolayer moisture
content decreased with increasing temperature. This
decrease in monolayer with increasing temperature
has also been reported for different foods and food
systems Govardhan (2006), Sahu (2005), Lin et al.,
(2005) and Foster et al., (2005).
Table 4: Set of parameters of GAB equation of
Adsorption of WPC (35%) at different temperature
Temperature
(0C)
GAB Parameters
Wm G K
25 3.78 12.85 0.971
35 3.45 10.52 1.008
45 3.15 8.59 1.038
Table 5: Set of parameters of GAB equation of
Adsorption of WPC (70%) at different
temperatures
Temperature
(0C)
GAB Parameters
Wm G K
25 4.10 25 4.10
35 5.57 35 5.57
45 2.84 45 2.84
Evaluation of Net Isosteric Heat of Sorption: Net
isosteric heat of sorption was calculated from the
generalized equation of Clausius Clapeyron as given
in equation 12 by plotting ln aw v/s inverse of absolute
temperature & determined its slope. The sorption
isosters of WPC (35% & 70%) at different moisture
content were shown in fig. 3 & 4. The slope of each
isosters decreased as the moisture content increased.
The net isosteric heat of sorption of the WPC (35% &
70%) as a function of the moisture content was given
in the table 6. The heat of sorption was found to
increase initially with increase in moisture content and
attain a peak value of 19.2812kJ/kg in WPC (35%)
and 17.6039 KJ/Kg in WPC (70%) at 5% moisture
level, and then decreased.

Frontier J. Vet. Anim. Sci.Vol. 4, No. 2 (July-Dec.) 2015 180
Table 7: Sets of parameters of WPC (35%) calculated using GAB equation from moisture
adsorption measurement
Temperatu
re (°C)
Calculated from GAB Calculated from Weissler
Equation RMS
(%)
RMS (T)
(%) Wm
g water/100g
solids
G K
Wm(T)
g water/100g
solids
G (T) K (T)
25 3.78 12.85 0.97 3.82 12.37 0.96 6.4388 8.5631
35 3.45 10.52 1.01 3.41 10.11 1.01 5.2974 6.8903
45 3.15 8.59 1.04 3.17 8.74 1.03 6.7242 5.3267
Table 6: Values of net isosteric heat of sorption of
WPC (35% & 70%) at different moisture contents
Fig. 3: Net isosteric heat of sorption (∆H) of WPC
(35%) at different moisture contents
Fig. 4: Net isosteric heat of sorption (∆H) of WPC
(70%) at different moisture contents
Evaluation of Temperature Dependence of
GAB Parameters: Temperature dependence of
GAB constants were predicted by Arrhenius type
relationship given by Weisser (1985). The
constants W‟, G‟, K‟ and the corresponding
exponents in the equations as shown in equations
13 to 15 were determined from the GAB
constants of WPC (35% & 70%) by least square
regression analysis are given below.
For WPC (35% protein)
Wm(T) = 0.3646 exp (5.725 x 10³ / RT) ……..(16)
G (T) = 0.0001 exp (4.274 x 10⁴ / RT) ……..(17)
K (T) = 2.3977 exp (-2.214 x 10³ / RT ……..(18)
For WPC (70% protein)
Wm(T) = 0.0167 exp (1.3465 x 10⁴ / RT) …….. (19)
G (T) = 0.0731 exp (1.1167 x 10⁴ / RT) .……. (20)
K (T) = 3.7903 exp (-3.4055 x 10³ / RT) …….. (21)
The parameters of GAB equations Wm, G and K
at each temperature and Predicted values by
Weissler equation GAB (T), Wm (T), G (T) and
K (T) of adsorption isotherm of WPC(35% &
70%) with %RMS are summarized in the table 7
and 8. %RMS value of GAB and GAB (T)
constants are nearly similar which showed the
best fit of GAB equation to the experimental
values.
Moisture
content
(g/100g solids)
Net isosteric heat of sorption
(KJ/Kg)
WPC 35% WPC 70%
5 19.2812 17.6039
7 3.7509 8.7445
8 2.6787 6.7647
9 1.8658 5.6944
10 1.1555 4.5272
15 0.1304 2.1203

Frontier J. Vet. Anim. Sci.Vol. 4, No. 2 (July-Dec.) 2015 181
Table 8: Sets of parameters of WPC (70%) calculated using GAB equation from moisture
adsorption measurement
Temperature
(°C)
Calculated from GAB Calculated from Weissler
Equation RMS
(%)
RMS
(T) (%) Wm
g water/100g
solids
G K
Wm(T)
g water/100g
solids
G (T) K (T)
25 4.10 7.24 0.95 4.2 7.16 0.94 5.9926 7.0361
35 5.57 5.61 0.99 5.72 5.73 1.00 5.2593 6.7423
45 2.84 4.86 1.05 2.72 4.99 1.04 4.9398 4.5391
CONCLUSIONS
Moisture adsorption isotherm of whey protein
concentrate with 35% and 70% protein content
obtained in the temperature range of 25- 450C were
sigmoid type II , common to most foods. A
negative temperature effect on EMC was evident as
often observed in foods with high protein content,
but it was not statistically significant. Adsorption
data was best described by GAB model. The
monolayer moisture content decreased with
increase in temperature. Equations were developed
by correlating the GAB constants with temperature.
The results would be valuable in appraising the
shelf life of the product under varying storage
conditions and design of suitable packaging system.
REFERENCES
Foster, K. D., Bronlund, J.E. and Paterson, A.H.J.
2005. The prediction of moisture sorption
isotherm for dairy powders. Journal of
Food Engineering 15: 411-418.
Govardhan, 2006. Evaluation of sorption isotherm
parameters of Gulabjamun mix powder.
M.Tech thesis, National Dairy Research
Institute, Karnal, Haryana.
IDF (2001) and AOAC (2000). Determination of total
nitrogen content in milk and milk products.
Lievonen, S.M. and Roos, Y.H. 2002. Water Sorption
of Food models for studies of Glass
Transition and Reaction Kinetics. Journal of
Food Science., 67(5): 1758-1766
Lin., S.X.Q., Chen, X.D. and Pearce, D.l. 2005.
Desorption isotherm of milk powders at
elevated temperatures and over a wide
range of relative humidity. Journal of
Food Engineering., 68: 257-264.
Sahu D., 2005. Evaluation of sorption isotherm
parameters of skim milk powder. M.Tech
thesis, National Dairy Research Institute,
Karnal, Haryana.
Sawhney, I.K., Bikram Kumar., Agrawala, S.P. and
Patel, A.A. 2000. Evaluation of moisture
sorption hysteresis in khoa., Indian
Journal of Dairy Science., 53(3): 184-189.
Smitha R., 2009. Measurement and Modelling of
moisture sorption characteristics of dried Whey
Protein Concentrate. M.Tech thesis, National
Dairy Research Institute, Karnal, Haryana.

Frontier J. Vet. Anim. Sci.Vol. 4, No. 2 (July-Dec.) 2015 182
*Part of M.F.Sc Thesis submitted by first author to KVAFSU, Bidar, India 1Assistant Professor, E-mail: [email protected] 2Professor, E-mail: [email protected]
Canning is one of the ideal methods among the
various methods of food preservation, and has been
playing an important role in long term preservation
of foods (Chandra et al., 2014). One of the
important advantages of thermally processed foods
over foods processed by other methods is its longer
shelf life at room temperature (Ali et al., 2005).
One of the important factors contributing to the
success of a canning operation is an efficient
container that can form a hermetic seal, protects the
food from damage during storage and transport and
which can provide an aesthetic appearance to the
product (Sreenath et al., 2009).
The awareness of health benefits of fish has
created a higher demand for fish and fishery
products. Further, the consumption of processed
fish products like fillets, mince based products,
surimi and canned products such as fish in brine,
oil, curry, sauce and masala medium is increasing
worldwide. However, it has become difficult to
meet the demand due to short supply. Ribbon fish
(Trichiurus lepturus) is one of the major species
contributing to the 6% of total marine fish landings
of India (CMFRI, 2013). In order to cater the
supply of value added products, long term
preservation by using canning is being used
commercially.
Heat transfers in processed foods are
affected by the filling medium used, resistance
incurred at the container wall, size of the container
and thermo physical properties of foods. F0 values
of the sterilization process highly depend upon the
amount of raw material, cans and filling medium.
Consistency of the medium affects the heat
penetration characteristics of thermal processing.
Therefore, for arriving at the heat penetration
characteristics requirements, knowledge on the
pattern of heat penetration in the food inside the can
is very essential. Reports on the canning of ribbon
fish are meagre and also much information
regarding evaluation of thermal process is not
available. Hence, in the present investigation the
effect of different filling medium viz., masala and
tomato sauce on heat penetration characteristics
and quality of canned ribbon fish (Trichiurus
lepturus) in tin free steel cans was evaluated.
MATERIALS AND METHODS
Raw Material: Ribbon Fish (Trichiurus lepturus)
caught by trawl net along the west coast of
Mangalore (India) was used for the study. The
Effect of Filling Media on Heat penetration and Quality Characteristics of Canned
Ribbon Fish (Trichiurus lepturus) in Tin Free Steel Cans (TFS)*
Chandra1, M.V and Raju
2, C.V.
*
Department of Fish Processing Technology, College of Fisheries, Mangalore
Received: 30 May, 2015; Accepted: 27 July, 2015
ABSTRACT
In the present investigation the effect of different filling media on heat penetration characteristics and the quality
changes of ribbon fish in tin free-steel (TFS) cans was assessed. About 110 g of ribbon fish meat was packed into 6-oz
TFS cans (303 x 109) and filled with 60 g of different media such as masala and tomato sauce. The F0 values of ribbon
fish in masala pack and sauce pack were 15.16 min and 13.80 min respectively whereas process time for ribbon fish in
masala pack and sauce pack was 48.08 and 52.20 min respectively. The results indicated that heat penetration is faster
in masala than sauce. Total volatile base nitrogen (TVB-N) and tri-methylamine nitrogen (TMA-N) contents were
found to be slightly higher but within the acceptable limit at the end of five months storage, while thiobarbituric acid
(TBA) and free fatty acid (FFA) content increased slightly in masala and sauce pack at the end of the storage period.
The sensory evaluation scores revealed that quality of the processed products was rated as good and the products were
in acceptable condition even after storage period.
Keywords: Ribbon fish, TFS can, Heat penetration, Filling media and Quality.

Frontier J. Vet. Anim. Sci.Vol. 4, No. 2 (July-Dec.) 2015 183
mean total length of fish used was 64 ± 1 cm,
weighing about 230-240g. The fish was iced
immediately in the ratio of 1:1 (fish: ice) and
transported to the laboratory under iced condition
(0-4 ºC) in an insulated box. After reaching to the
laboratory, the raw material was dressed and cut
into pieces of 2.5 cm size followed by thorough
washing in potable chilled water in order to make it
free of blood and visceral remains after which it
was subjected to brining. The brining was done by
keeping the dressed fish in saturated brine for about
8 min at room temperature then it was immediately
washed with water to remove adhering salt crystals
on surface of fish pieces so as to reduce salt
concentration and drained for 5 min.
Fish masala preparation: Fish masala was
prepared as per the recipe given by Saralaya (1978),
with some modifications. Dressed fish (1kg), onion
(30g), garlic (10g), garam masala (25g), Chili
powder (30g), jeera (8g), mustard (2g), refined oil
(150ml) and salt (10g)
Heat penetration studies of ribbon fish in
different filling media: For standardization of
temperature and time for processing of ribbon fish
in masala and sauce media was carried out
according to the method described by Chandra et
al, (2014). Freshly dressed ribbon fish pieces were
brined in saturated brine solution for 8 min and then
about 140±2 g of fish pieces were filled into the
TFS cans (307 X109) of 6-oz capacity supplied by
M/s Amtech packs, Mysore, India. The filled cans
were pre-cooked in steam for 25 min. Cans after
precooking were drained and about 110g of pre-
cook weight of fish pieces was maintained in the
cans. Later about 60g of hot filling medium either
(1) fish masala or (2) diluted sauce (1:3):: sauce:
water) was added to the respective cans. The filled
cans were then steam exhausted for 10 min and
immediately sealed in a double seaming machine.
The cans had been instrumented with thermocouple
glands by inserting thermocouple probes (Ellab
SSA- 12050-G700-TS stainless steel) in which
method the tip of the thermocouple gland was
inserted into the ribbon fish piece. The position of
perforation was such that thermocouple tip would
be finally at the predetermined cold spot and at one
third of the height of the can from the bottom so as
to record the core temperature. The sealed cans
were loaded inside the retort (John Fraser and Sons
Ltd., UK. Model.No.5682) and processed at 115.6 ○C. Heat penetration data were recorded using Ellab
(CTF 9008, Denmark) temperature recorder and
process value integrator. Data were recorded for
every min of processing. The process was carried
out according to the optimized time and the
lethality (F0) value obtained is recorded. Time
optimization was done based on the time taken for
softening of the bone at a constant temperature.
Heat penetration data was plotted on a semi
logarithmic paper with temperature deficit (Retort
temperature-core temperature) on log scale against
time. Lag factor for heating (Jh), slope of the heating
curve (fh), time in min for sterilization at retort
temperature (U), lag factor for cooling (Jc), final
temperature deficit (g) and cook value (cg) were
determined. Total process time was calculated as
per the method given by Stumbo (1973). Actual
process time was determined by adding process
time (B) and the effective heating period during
come-up time i.e. 58% of the come up time. After
processing, the samples were drawn for quality
analysis with an interval of one month period up to
five months.
Proximate composition: The moisture and ash
content were determined according to (AOAC,
2000). Total lipid content was determined by Bligh
and Dyer (1959) method. The crude protein content
was calculated by multiplying the nitrogen content
with 6.25 which was determined by Kjeldahl
digestion as described by AOAC (2000).
Biochemical analysis: Total volatile base nitrogen
(TVB-N) content and tri-methylamine nitrogen
(TMA-N) content were determined using the
Conway micro diffusion unit according to Siang &
Kim (1992). The thiobarbituric acid (TBA) of fish
sample was determined following the method

Frontier J. Vet. Anim. Sci.Vol. 4, No. 2 (July-Dec.) 2015 184
described by Tarladgis et al, (1960). The free fatty
acid (FFA) content of canned fish samples was
estimated by the method described in AOCS
(1989). Peroxide value of the fish sample was
determined using the method described in AOCS
(1989). The pH of the sample was measured using a
pH meter (Systronic 324 pH meter, Ahemdabad,
India). Five gm of meat was macerated with 45 ml
distilled water to measure the pH.
Sensory analysis: Sensory characteristics of
canned ribbon fish in masala and tomato sauce
were evaluated by minimum of 12 members trained
taste panel on a ten point hedonic scale as per the
guideline given by IS: 6273 (II)-1971. The product
with equivalent scores of 9-10 was considered as an
excellent, whereas, product with scores of 7-8, 5-6,
3-4 and 1-2 was considered as good, fair, poor and
rejected respectively.
Statistical analysis: Significant difference between
the means at 5% level of significance was
determined using ANOVA and Duncan‟s Multiple
Range test as described by Snedecor and Cochran
(1962). Statistical package used in the study was
SPSS Version 16.0.
RESULTS AND DISCUSSION
Proximate composition of the fish gives an idea
about the nutritional quality of fish. The moisture
content of ribbon fish was 75.86% which is in
agreement with reported value (Chandra et al.,
2014). Fish muscle is a good source of protein.
Most finfish muscle tissue contains about 18-22%
protein (Sidwell, 1981). Ribbon fish meat had a
crude protein content of 18.05 %. Ribbon fish had
the fat content less than 2%, indicating that they are
lean variety fish (Table 1A). The protein and ash
content were little higher than that reported by
Dileep et al. (2005). The contents of TMA-N and
TVB-N are reported to be good indicators of
freshness of fishes (Keay and Hardy, 1972). These
two parameters are reported to get increased with
thermal treatment of fish muscle (Gallardo et al.,
1990).
Table 1: A. Proximate and biochemical composition
of fresh ribbon fish (Trichiurus lepturus)
Parameters Mean value
Moisture (%) 75.9 ( 0.8)
Fat (%) 1.6 (0.10)
Protein (%) 18.1 ( 0.5)
Ash (%) 1.52 (1.0)
pH 6.6 ( 0.80
PV( milliequi. of O2 /kg of fat) 4.2 ( 0.10
TVB-N (mg/100gm) 4.6 (0.2)
TMA-N (mg/100gm) 1.1 ( 0.1)
FFA (as % of oleic acid) 0.7 (0.07)
TBA value ( mg malonaldehyde/kg
of fish sample) 0.10 0.02)
B. Proximate composition of processed fish
products during storage periods
Pro-ducts
Storage duration (months)
Moisture (%)
Protein (%)
Fat (%) Ash (%)
Masala
0
1
2
3
4
5
61.47 (1.2)
62.02 (0.7)
62.60 (0.9)
62.54 (1.4)
61.90 ( 1.0)
61.86 (0.9)
23.85 (1.1)
23.70 ( 1.8)
22.60 ( 1.2)
23.42 (1.3)
22.19 ( 1.5)
22.65 ( 1.3)
5.12 ( 0.1)
6.08 ( 0.6)
6.20 (1.1)
5.90 (0.6)
5.70 ( 0.7)
6.28 ( 0.5)
3.40 ( 0.3)
3.15 (0.4)
2.90 (0.1)
2.65 (0.2)
2.42 ( 0.1)
2.36 (0.3)
Tomato
sauce
0
1
2
3
4
5
67.43 (0.1)
67.40 (0.3)
68.53 (0.7)
67.37 (0.9)
66.37 (1.0)
66.87 ( 0.5)
22.64 (0.8)
23.41 (1.0)
22.66 (1.6)
22.16 (0.9)
22.77 (1.1)
22.84 ( 0.5)
2.33 (0.2)
2.56 (0.5)
2.35 (0.2)
2.38 (0.2)
2.45 (0.3)
2.53 ( 0.7)
2.82 (0.2)
2.58 (0.4)
2.35 (0.5)
2.06 (0.3)
2.10 ( 0.1)
2.05 (0.1)
*Values in parenthesis represent standard deviation, n=3
In the present study the changes in
proximate composition of the ribbon fish packed in
TFS can with masala and sauce as a packing media,
during the storage period is given in Table 1B. The
higher fat and ash content in the respective masala
and sauce packs were attributed to the media in
which they were packed. Overall quality of the
products was acceptable even after 5 months of
storage.

Frontier J. Vet. Anim. Sci.Vol. 4, No. 2 (July-Dec.) 2015 185
Heat penetration studies of ribbon fish in different
media: Severe sterility heat treatments are most
often applied to low acid foods (pH > 4.6)
packaged in hermetically sealed containers.
Temperature of treatment in the case of low acid
foods ranges from about 115 °C (Jaiswal, 2002).
Heat penetration parameters of ribbon fish in
different media are presented in Table 2A. In
the present investigation a retort temperature of
115.6 ºC and process time of 90 min for masala
and sauce pack were taken as optimum process
required, the values got from process
calculation to achieve the required lethality
values of 15.16 min for masala pack and 13.80
min for sauce pack and total process time were
48.08 min and 52.20 min for masala and sauce
respectively. Froot and Lewis, (1994) reported
the F0 value recommended for the thermal
processing of fish and fish products ranged from
5-20 min. Ali et al. (2005) reported that, a F0 at
121.1 oC was 10 min, sufficient to get the
product with good sensory attributes and
commercial sterility in case of tuna in oil,
whereas F0 for herring in tomato sauce with 6-8
min is sold in U.K. (Brennan et al., 1990).
Hence, the final products were processed based
on the values got from process calculation and
was studied during the storage. The semi log
heat penetration graph revealed fh (The time
required to attain 1 log cycle reduction) value
was 25 min for masala and sauce products. This
indicates that both the products filled with
masala and sauce as a medium showed more or
less same rate heat penetration. Ramaswamy
and Grabowski (1999) reported that the jh is
highly influenced by the processing temperature
and container shape. The log factor of cooling
(jc) shows a contrasting trend with jh factor and
increased with increase of processing
temperature. Heat penetration studies showed a
faster heat penetration rate in TFS can pack
products as the body thickness is thin compared
to tin cans (Sreenath et al., 2008).
Table 2: A. Thermal process parameters of
ribbon fish in different media
Products
Parameter
Ribbon
fish in
Masala
Ribbon
fish in
sauce
Heating rate of index fh
(min) 25 25
Heating lag factor (Jh )
min 0.683 1.114
Cooling lag factor( Jc)
min 1.08 1.138
F 0 value (min) 15.16 13.80
Temperature deficit (g)
min 0.0138 0.0348
Cook value (Cg )min 213 208.7
Initial deficit
temperature (I) 84.9 71.8
Number of minutes for
sterilization at the retort
temperature (U) min
61.75 55.5
Process time (B) min 44.08 47.56
Total process time (T)
min 48.08 52.20
B. Sensory evaluation (overall acceptability) of
thermally processed ribbon fish in masala and
tomato sauce during storage at ambient
temperature
*Values in parenthesis represent standard deviation,
n=10. Different alphabetical letters indicate a
significant difference (p < 0.05) between the
storage periods.
Total process time (B+0.42 of come up time)
taken to reach an F0 value of 15.6 was 44.08 min for
masala pack and F0 value of 13.80 was 52.20 min for
tomato sauce respectively. It may be attributed to
more lethality resulting from more heat penetration.
As more heat penetration takes place, the cold spot
Storage
duration
(months)
Overall acceptance
Ribbon fish in
masala
Ribbon fish in
tomato sauce
0
1
2
3
4
5
8.52 ( 0.5)a
8.43 (0.1)b
8.30 ( 0.1)c
8.11 (0.2)d
7.86 ( 0.2)e
7.58 ( 0.1)f
8.38 (0.14)e
8.25 ( 0.12)d
8.14 (0.29)ed
8.01 (0.17)c
7.85 (0.30)b
7.50 (0.13)a

Frontier J. Vet. Anim. Sci.Vol. 4, No. 2 (July-Dec.) 2015 186
temperature is closing towards the processing
temperature of 115.6 oC. Tomato sauce medium has
taken more time than the masala pack. The similar
trend was also reported by Ali (2003) in tuna canned
in oil, brine and curry media in aluminium cans.
A prescribed normal limits for TVB-N and
TMA-N as 30-35 mg/100g and <15 mg/100g
respectively (Connell, 1995). Changes in
biochemical characteristics of ribbon fish in masala
and tomato sauce packed in TFS can during canning
and subsequent storage are depicted in Fig. 1, 2, 3
and 4. The present study revealed that, the volatile
compounds such as TMA-N and TVB-N were found
to increase slightly, but were within the acceptable
limit. The TVB-N of raw ribbon fish flesh increased
from 4.55 mg /100g to 22.10 mg /100g flesh in case
of both the products during the storage period. The
TMA-N content showed similar trend, increasing
from 1.05 mg to 13.2 mg /100g at the end of the
storage period of 5 months in both the canned
products. Based on the results of biochemical
characteristics, the ribbon fish canned in masala and
sauce were found wholesome and acceptable.
TM
A-N
(m
g/
10
0g
)
Fig 1: Changes in TMA-N content in masala and
sauce packed ribbon fish in tin-free-steel can
during storage.
TM
A-N
(m
g/
10
0g
)
Fig 2: Changes in TVB-N content in masala and
sauce packed ribbon fish in tin-free-steel can
during storage
TB
A (
mg
ma
lon
ald
ehy
de
/kg
fis
h s
am
ple
)
Fig 3: Changes in thiobarbutaric acid content in
masala and sauce packed ribbon fish in tin-free-
steel can during storage
FF
A (
as
% o
leic
aci
d)
Fig 4: Changes in free fatty acid content in masala
and sauce packed ribbon fish in tin-free-steel can
during storage.
Changes in TBA value of ribbon fish in
masala and tomato sauce during storage at room
temperature are given in (Fig.1C). In ribbon fish
packed in masala as a filling medium there was an
increase in TBA value during storage from 0.09 to
0.58 mg malonaldhyde/kg of sample. Ribbon fish in
sauce also showed an increasing trend in TBA value
during storage from 0.095 to 0.483 mg
malonaldhyde/kg of sample is given in (Fig. 1C).
Even though the TBA values have been increased
with the storage period they are within the limits of 0-
39 mg malonaldhyde/kg suggested as being noticeable
levels of rancid taste in foods for TBA (Shamberger et
al., 1977). Therefore the results found in this study
showed that there was a slight increase in TBA value
throughout the storage period. The Free Fatty Acid
(FFA) content varied between 7.55 to 17.1 % in
masala packs and 5.43 to 19.4 % in sauce packs as
oleic acid in fat respectively. Peroxide content was
negligible throughout the storage period.
0
4
8
12
16
A
0
10
20
30
B
0
2
4
6
8
10
C
0
10
20
30
40
0 2 4 6Storage period (Months)
masala sauce
D

Frontier J. Vet. Anim. Sci.Vol. 4, No. 2 (July-Dec.) 2015 187
The overall acceptability for ribbon fish
canned in masala and tomato sauce showed
significant difference (p < 0.05) between storage
periods (Table 2B). The fish masala was delicious
with attractive reddish brown color and the fish
pieces were distinctly present without breakage. It
is seen from the results that ribbon fish in masala
got higher overall acceptable score than sauce
packs and the fish products were acceptable even
after 5 months of storage at room temperature. The
initial overall acceptability score of about 8.75 was
gradually reduced to around 8.0.
CONCLUSION
It can be concluded that the heat penetration was
highly influenced by the type of filling medium
used for the canning purpose. Among the
different media used for the study, heat
penetration was found to be faster in masala than
tomato sauce media. Hence the process
parameters are found suitable for preparing value
added products like the ribbon fish in masala and
sauce medium in TFS cans. The biochemical and
sensory attributes also indicate the quality of
canned ribbon fish in masala and sauce medium
were in acceptable condition even after 5 months
of storage at room temperature.
ACKNOWLEDGEMENTS
The authors wish to thank Dean, College of
Fisheries, Mangalore for permission to publish
this paper. The study was a part of M.F.Sc
dissertation submitted to Karnataka Veterinary,
Animal and Fisheries Sciences University, Bidar
and also the authors are thankful to Director,
CIFT, Cochin for providing facilities to conduct
heat penetration studies.
REFERENCES
Ali A A, Sudhir B and Gopal T K S. 2005. Effect of
rotation on heat penetration characteristics
of thermally processed tuna in oil in
aluminium cans. Fishery Technol., 42: 55-
60.
Ali A A. 2003. Suitability of indigenous aluminium
cans as an alternative to tin cans for fish
canning and process time evaluation. Ph.
D. Thesis submitted to the Cochin
University of Science and Technology, pp.
219, Cochin, India.
AOAC. 2000. Official methods of Analysis of
Association of Official Analytical Chemists
International. (17th
eds.) Suite 500, 481
North Frederick Avenue, Gaithersburg,
Maryland 20877-2417 USA.
AOCS. 1989. Official methods and recommended
practices of American oil Chemists
Society, A.O.A.C., and Champaign, USA.
Bligh E G and Dyer W J. 1959. A rapid method for
total lipid extraction and purification. Can.
J. Biochem. Physiol, 37: 911-917.
Brennan J G, Butters J R, Cowell N D and Lilley A E
V. 1990. Food engineering operations, (3rd
Eds.) Elsevier Applied sciences, London.
Chandra M V and Raju C V. 2014. Influence of
heat penetration on the quality of canned
ribbon fish (Trichiurus lepturus)” J. of
Food Proc. and Preser., 38: 807-814.
CMFRI. 2013. Central Marine Fisheries Research
Institute Annual Report 2012-2013.
Connell JJ. 1995. Control of fish quality, pp. 152-
157, Fishing News Books, London.
Dileep A O, Shamasundar B A, Binsi P K, Badii F
and Howel N K. 2005. Effect of ice
storage on the physicochemical and
dynamic viscoelastic properties of ribbon
fish (Trichurus. spp) meat. J. Food Sci.,
70(9): 230-234.
Froot R and Lewis A S. 1994. Canning of meat and
fish products. London: Chapman Hall.
Gallardo J, Perez-Martin R, Franco J, Aubourg S
and Sotelo C. 1990. Changes in volatile
bases and trimethylamine oxide during the
canning of albacore (Thunnus alalunga).
Int. J. Food Sci.Technol., 25: 78-81.

Frontier J. Vet. Anim. Sci.Vol. 4, No. 2 (July-Dec.) 2015 188
IS: 6273 (II). 1971. Guide for sensory evaluation of
foods (Part-II) Methods and Evaluation
cards. Bureau of Indian Standards, New
Delhi-1.12p.
Jaiswal A K, Sharma S K and Kumar S. 2002.
Microbiological critical control points in
conventionally canned foods. Packaging
India, 3: 31-35.
Keay J N and Hardy R. 1972. The separation of
aliphatic amines in dilute aqueous solution
by gas chromatography and application of
this technique to the quantitative analysis tri
and dimethyl amine in fish. J. Sci. Food
Agri., 23: 9-19.
Ramaswamy H S and Grabowski S. 1999. Thermal
processing of pacific salmon in steam/air and
water-immersion still retorts: influence of
container type/shape on heating behaviour.
Lebensm-wiss technol, 29: 82-93.
Saralaya K V. 1978. Studies on the utilization of
shell fishes of Karnataka coast by canning.
Mysore J. Agri. Sci, 12: 484-490.
Shamberger R J, Shamberger B A and Willis C E.
1977. Malonaldehyde content of food. J.
Nutrition, 107: 1049-1050.
Siang N C and Kim L L. 1992. Determination of
Trimethylamine Oxide, Trimethylamine and
Total Volatile Basic Nitrogen by Conway's
Micro-Diffusion Method. In Laboratory
Manual on Analytical Methods and
Procedures for Fish and Fisheries Products
(Miwa and Ji, Eds.) Southeast Asia Fisheries
Development Centre. B3.1-B 3.6.
Sidwell V D. 1981. Chemical and nutritional
composition of fin fishes, whales,
crustaceans, molluscs and their products.
Technical Memorandum, NOAA, National
Marine Fisheries Services, Dept of
Commerce, Washington DC. p 432.
Snedecor G W and Cochran W G. 1962. Factorial
experiments. In statistical methods. pp.
339-380, Oxford and IBH publishing
Co., Calcutta, India.
Sreenath P G, Abhilash S, Ravishankar C N and
Srinivas Gopal T K.2008. Standardization
of process parameters for ready-to-eat
shrimp curry in tin-free-steel cans. J. Food
Process. Preserv., 32(2): 247-269.
Sreenath P G, Abhilash S, Ravishankar C N,
Anandan R and Srinivas Gopal T K. 2009.
Heat penetration characteristics and
quality changes of Indian mackerel
(Rastrelliger kanagurta) canned in brine at
different retort temperatures. J. Food
Process Engi., 32(6): 893-915.
Stumbo C R. 1973. Thermo bacteriology in food
processing. (2nd
Eds.) Pp.93-120,
Academic Press, New York.
Tarladgis B G, Watts B M and Younthan M T.
1960. A distillation method for the
quantitative determination of
malonaldehyde in rancid foods. J. Am.
Oil Chem. Soc., 37: 44-45.

Frontier J. Vet. Anim. Sci.Vol. 4, No. 2 (July-Dec.) 2015 189
* Part of the Ph.D. Thesis submitted by the first author to KVAFSU, Bidar 1Professor and Head. Email: [email protected]
In recent years, increased importance has been
given to health management in aquaculture. Use of
drugs and antibiotics is discouraged in aquaculture
in view of residual accumulation, destruction of gut
micro flora, development of resistant bacteria and
other various harmful effects. Use of
immunostimulants is practiced as a potential route
for the reduction in the widespread use of
antibiotics
Immunostimulants have promising
beneficial effects in aquaculture. They are
known to enhance growth and disease resistance
in fish (Robertsen, 1999) and in shrimp (Smith
et al., 2003). Dietary supplements, including
killed bacteria, -glucans, lipopolysaccharides,
and nucleotides have exhibited
immunostimulatory effects (Sakai, 1999) and
are known to enhance non-specific defense
mechanisms in shrimp (Sung et al., 1994).
Dietary nucleotides have been shown to have
several beneficial effects in humans (Carver et
al., 1990; Carver & Walker, 1995) as well as
aquatic animals (Devresse, 2000; Burrells,
2001). Other benefits derived from
administration of nucleotides include rapid
intestinal repair improved mucosal gut flora and
mucosal surfaces (Uauy, 1989; Gil, 2002), and
elongation of the intestinal tract (Burrells et al.,
2001) in aquatic animals. Nucleotides also have
been shown to enhance the immune system
(Quan, 1992) and disease resistance of various
animals (Kulkarni et al., 1986a, 1986b). Most
cell types can synthesize nucleotides from
purines and pyramidines. However, de novo
synthesis and salvage pathways are
metabolically expensive processes. Further,
sufficient quantities of nucleotides required to
meet the metabolic requirements are presumably
not synthesized by shrimp under stressful
conditions (Devresse, 2000). Additional sources
of exogenous nucleotides in the diet optimize
function of rapidly dividing tissues (Burrells et
al., 2001) and may enhance feed intake
(Burrells et al., 2001), increase growth rate
(Adamek et al., 1996), and elevate immune
responses (Ramadan et al., 1994).
The present study was carried out to
evaluate the effect of nucleotide on growth,
survival and body composition of Labeo rohita
fed with different levels of nucleotide
supplemented diet.
MATERIALS AND METHODS
Experimental setup: Labeo rohita with an
average weight of 1.3 g produced in the carp
hatchery at the College of Fisheries, Mangalore,
India, were used for the study. All the
fingerlings were acclimatized by feeding control
diet for two weeks. Rohu were randomly
distributed into four groups. Four experimental
Growth, Survival and Body Composition of Labeo Rohita Fed with Different Levels
of Nucleotide Supplemented Diets*
Sampa Baidya and Shivananda Murthy1, H.
Department of Aquaculture, College of Fisheries, KVAFSU, Mangalore 575002, India
Received: 22 April, 2015; Accepted: 11 August, 2015
ABSTRACT
Eight weeks feeding trial was conducted to evaluate the effect of dietary nucleotide on growth, survival and body
composition of rohu (Labeo rohita). The nucleotide was supplemented at 0, 5, 10, 15 g kg-1 nucleotide diet. The test
diets were fed for eight weeks in triplicate groups of rohu, which had initial weight of 1.3 g. At the end of the feeding
trial, growth and survival of rohu was recorded. Fish fed with 10 g kg-1 nucleotide incorporated diets had significantly
(p<0.05) greater weight gain, specific growth rate and protein percentage in body composition.
Keywords: Nucleotide, Labeo rohita, proximate composition, growth, survival

Frontier J. Vet. Anim. Sci.Vol. 4, No. 2 (July-Dec.) 2015 190
groups, namely, control (T0) (basal diet with no
nucleotide), T1 (5 g kg-1
nucleotide), T2 (10 g
kg-1
nucleotide) and T3 (15 g kg-1
nucleotide)
were arranged in triplicate groups following a
completely randomized design (CRD) design
and fed respective diets. The total volume of
water in each tank was maintained at 100 l
throughout the experimental period. Fish were
fed with one of the four experimental diets at a
feeding rate of 4% of body weight per day for
eight weeks. The amount of feed for each tank
was divided to two equal meals, which were
offered to fish at 10:00 and 17:00 h. Fish in
each tank were collected, counted and weighed
at 2-week intervals, and the offered diets were
subsequently readjusted. Three quarters of
tank's water volume along with fish excreta was
removed daily by siphoning and replaced with
an equal volume of well-aerated fresh water.
Dead fish if any were removed and recorded. At
the end of the experiment, fish were collected
from each tank, counted, and weighed.
Experimental diet: The composition of
experimental diet is given in Table 1. Soybean
meal and groundnut cake were used as protein
sources and rice bran and tapioca flour were
used as carbohydrate sources. Graded levels of
dietary nucleotide (combination mixture of
AMP, IMP,CMP, GMP in equal proportions,
were procured from Sri Durga Laboratories,
Mangalore) were added to the respective diet
(Table I). Dry and powdered ingredients were
thoroughly mixed and mixed with water to make
soft dough. The dough was steam cooked for
10–15 minutes in a pressure cooker. Vitamin-
mineral premix was added and thoroughly
mixed with diets after cooling and diets were
extruded through a laboratory pelletizer having
2 mm dia. Pellets were dried in hot air oven at
60C till the moisture content was reduced to
less than 10%. Diets were packed in high-
density polythene bags and stored in
refrigerator.
Table 1. Composition and proximate analyses
(% on dry matter bases) of the experimental
diets containing different levels of Nucleotide
Treatment
Ingredient T0 T1 T2 T3
Soyabean
Meal 47.95 47.95 47.95 47.95
Ground
nut oil cake 20.0 20.0 20.0 20.0
Rice bran 26.05 25.55 25.05 24.55
Tapiocaflour 5.0 5.0 5.0 5.0
Vitamin and
mineral
mixture
1.0 1.0 1.0 1.0
Nucleotide 0 0.5 1.0 1.5
Total 100 100 100 100
Proximate composition of diets (%)
Moisture 8.84
±0.16
8.78
±0.21
8.69
±0.07
8.43
±0.18
Dry matter 91.00
±0.05
91.22
±0.11
91.29
±0.09
91.57
±0.13
Protein 30.94
±0.12
30.64
±0.13
30.53
±0.09
30.71
±0.21
Fat 6.32
±0.05
6.39
±0.10
6.44
±0.15
6.34
±0.12
Fibre 9.67
±0.11
9.24
±0.24
9.72
±0.21
9.59
±0.16
Ash 8.88
±0.16
8.63
±0.09
8.49
±0.19
8.70
±0.21
NFE 35.27
±0.2
36.32
±0.10
36.11
±0.09
36.23
±0.14
Growth studies: Rohu were weighed at the
beginning of the experiment and every 15 days
interval thereafter till the completion of the
experiment. The growth performance of rohu was
assessed in terms of weight attained.
Specific growth rate (SGR): Specific growth rate
was calculated by using the following formula
ln final weight (g) – ln initial weight (g)
SGR X 100
No of days
The calculated value gives the average
percentage increase in weight per day over the
experimental period.

Frontier J. Vet. Anim. Sci.Vol. 4, No. 2 (July-Dec.) 2015 191
Food conversion ratio (FCR): Food conversion
ratio was calculated by using the following formula
Dry weight of the feed given (g)
FCR =
Gain in wet weight of fish (g)
Protein efficiency ratio (PER): Protein
efficiency ratio was calculated by using the
following formula
Weight gain(g)
PER= …………………………..
Protein intake (g)
Survival: Survival was calculated as the difference
between the number of live animals stocked at the
beginning and those survived at the end of the
experiment.
Table 2. Growth performance and survival
(mean ± SD) of rohu fed different levels of
nucleotide for 8 weeks
Items Nucleotide levels (g/kg diet)
T0 T1 T2 T3
Final weight
gain (g fish-1)
3.55
±0.11a
3.57
±0.16a
3.88
±0.14b
3.57
±0.12a
Weight gain
(% of initial
weight)
273.58
±8.58a
275.07
±12.02a
298.46
±11.61b
274.61
±8.87a
SGR
(% day-1)
1.68
±0.05a
1.69
±0.08a
1.79
±0.07a
1.67
±0.06a
Survival
rate (%)
62.66
±4.61a
64.0
±6.93a
72.0
±8.0a
65.33
±6.11a
FCR (g feed
g gain−1 )
2.86
±0.15a
2.81
±0.28a
2.60
±0.36a
2.78
±0.34a
Protein
efficiency
ratio
1.41
±0.07a
1.44
±0.05 a
1.44
±0.04 a
1.44
±0.04 a
Means with the same letter in the same row are not
significantly different at P<0.05.
Proximate analysis: Proximate composition of
experimental diet before starting the experiment
and fish muscle was estimated soon after
completion of the experiment (Tables 1 & 3).
Whole meat of the fish was taken for proximate
analysis. The fish meat was minced thoroughly and
dried at 60C for 12 hours to obtain the dry matter.
The dry matter thus obtained was powdered and
stored in air tight containers for further analysis.
The samples were analyzed for crude protein, crude
fat, total ash and carbohydrate (NFE) employing
standard methods (APHA, 1995).
Table 3: Proximate body composition of rohu
fed with different levels of nucleotide for 8 weeks
Items Nucleotide levels (g/kg diet)
T0 T1 T2 T3
Moisture
(%)
77.99
±0.56a
77.76
±0.31a
77.12
±0.12a
78.02
±0.56a
Dry matter
(%)
22.01
±0.55 a
22.23
±0.31 a
22.88
±0.11 a
21.98
±0.56 a
Protein (%) 14.72
±0.26a
15.05
±0.08ab
15.56
±0.42b
14.74
±0.25a
Fat (%) 2.52
±0.13a
2.43
±0.22a
2.36
±0.10a
2.45
±0.18a
Ash (%) 2.23
±0.16a
2.19
±0.08a
2.20
±0.08a
2.25
±0.13a
NFE (%) 2.52
±0.32 a
2.43
±0.33 a
2.76
±0.21 a
2.54
±0.28 a
Means with the same letter in the same row are not
significantly different at P<0.05.
Analysis of physicochemical parameters of water:
Water quality parameters were maintained within the
normal range throughout the experimental period.
Water samples collected on each sampling day were
analyzed for pH, temperature, dissolved oxygen, free
carbon dioxide, ammonia and total alkalinity. Digital
portable kit model CK 704 was used to record pH,
atmospheric temperature and water temperature.
Dissolved oxygen was estimated by Wrinkler‟s
method, total alkalinity, ammonia and free carbon
dioxide were determined by following Standard
methods (APHA, 1995).
In all treatments, dissolved oxygen
concentrations ranged from 7.03 to 7.60 mgL−1
, free
CO2 ranged from 1.39 to 3.05 mgL−1
. The ambient
water temperature varied from 26.4 to 27.3°C. The pH
range was 7.43–7.83. Free carbon dioxide, and
unionized ammonia concentration ranged from 1.22 to
3.08 mg L−1
and 0.040 to 0.279 mg L−1
. Total
alkalinity ranged from 63.18 to 77.63 mg L−1
as
CaCO3. All the water quality parameters were within
the acceptable ranges for growth (Boyd, 1982).
Statistical analysis: The mean growth, survival
and body composition of rohu were recorded, and
significant difference among them was tested by
one way ANOVA. A statistical package SPSS
version 20.0 was used for data analysis.

Frontier J. Vet. Anim. Sci.Vol. 4, No. 2 (July-Dec.) 2015 192
RESULTS AND DISCUSSION
Effect of nucleotide on growth and survival of
Labeo rohita: The final weight of rohu fed with
supplemental nucleotides was found to be greater
than that of rohu fed the basal (control) diet.
However, significant (P=0.052) difference in growth
was observed between rohu fed with nucleotide 10 g
kg-1
diet (Table 2) and control. Survival over the 60
days feeding period was higher for rohu fed with 10
g kg-1
nucleotide compared to other treatment
groups. Rohu had attained mean weight of 298.46%
in T2 group, which is 24.88% higher growth than the
groups fed control diet. Highest survival was
recorded in T2 (72.0%) (P=0.051) (Table II). No
significant difference (P=0.125) was observed in
survival rate due to the inclusion of nucleotide in fish
diets. The survival of rohu ranged from 62.66 to
72.0% overall.
Effect of nucleotide on proximate composition: No
significant change in moisture content of flesh was
observed among the different treatments (P=0.108) and
it ranged from 77.12 to 78.02 % (Table 3). Crude
protein increased significantly (P=0.023), while total
lipids decreased with the increase of nucleotide level in
fish diet (P=0.707). The highest content of crude protein
(15.56±0.42%) was found in fish group fed 1.0%
nucleotide diet, while the lowest crude protein level
(14.73±0.27%) was seen in control group. The highest
content of total lipid (2.52±0.14%) was found in the
control group, while the lowest one (2.36±0.10%) was
found in the fish group fed on 10 gkg-1 nucleotide diet,
respectively. No significant difference (P=0.919) was
observed in ash content among different treatments and
it ranged from 2.19 to 2.25 %.
The main objective of the present
investigation was to evaluate the efficiency of
dietary nucleotide on growth, survival and body
composition of rohu. Nucleotide incorporated diets
in the present study enhanced the growth and
survival of rohu (Table 2). The results are
comparable with the published reports.
Supplementation of fish diets with nucleotides
influence a positive effect on growth in salmons
(Burrells, 2001). The biologically active brewers
yeast had been reported to serve as a probiotic and
enhance growth in tilapia (Lara-Flores et al., 2002).
It is reported that dietary supplementation of
nucleotide enabled the fish to survive through salt
water grower phase as a result of nucleotide
supplementation (Burrells et al., 2001). The effect
of dietary nucleotide is comparable to probiotics
and other dietary supplements (Murthy et al., 2009;
Li et al., 2007). The survival of P. monodon
brooders fed with a diet containing -1; 3-glucan
(from Schizophyllum commune) was significantly
higher than that of control groups. Labeo rohita fed
0.3% brewers yeast had higher growth and survival
(Mohseni et al., 2011).
Proximate analysis of the whole body of
rohu at the end of the feeding trial indicated a
decline in lipid content of fish fed with 10 g kg−1
nucleotide. There was an inverse relationship
observed between total protein and lipid contents.
Moisture and ash contents did not vary.
It can be concluded that the present
investigation indicate that the inclusion of
nucleotide at 10 g kg-1
diet improve the growth
performance and body composition. A dietary level
of 10 g kg-1
nucleotide diet was found optimal.
REFERENCES
Adamek, Z., Hamackova, J., Kouril, R., Vachta, I.
and Stibranyio, A. (1996). Effect of
ascogen probiotics supplementation on
farming success in rainbow trout
Oncorhynchus mykiss and wels Silurus
glanis, under conditions of intensive
culture. Krmivaagreb. 38:11–20.
APHA, (1995). Standard methods for examination
of water and waste water, American Public
Health Association. Washington, DC.
Aquacult. 9: 101-144.
Boyd, C. D. (1982). Water quality mangagement
for pond fish culture. Elsevier scientific
publishing company, Amsterdam,
Netherlands. Pp 318

Frontier J. Vet. Anim. Sci.Vol. 4, No. 2 (July-Dec.) 2015 193
Burrells, C. 2001. Nucleotides aid dietary louse
control. Fish Farmer. 24:62.
Burrells, C., William, P. D., Southage, P. J. and
Wadsworth, S. L. (2001). Dietary
nucleotides: A novel supplement in fish
feeds 2. Effects on vaccination, salt water
transfer, growth rate and physiology of
Atlantic salmon. Aquacult. 199:171–184.
Carver, J. D. and Walker, W. A. (1995). The role of
nucleotides in human nutrition. J. Nutr.
Biochem. 6:58–72.
Carver, J. D., Cox, W.I., and Barness, L. A. (1990).
Dietary nucleotide effects upon marine natural
killer cell activity and macrophage activation.
J. Parent. Enteral Nutr. 14:18–22.
Devresse, B. (2000). Nucleotides-a key nutrient for
shrimp immune system. Feed Mix. 8:20–22.
Gil, A. (2002). Modulation of immune response
mediated by dietary nucleotides. Er.J.
Clin. Nutr. 56(3): 1–4.
Kulkarni, A. D., Fanslow, W. C., Drath, D. B.,
Rudolph, F. B. and Vanburen, C. T.,
(1986a). Influence of dietary nucleotide
restriction on bacterial sepsis and
phagocytic cell function in mice. Arch
Surgery journal. 121:169–172.
Kulkarni A D, Fanslow W C, Rudolph F B and
Vanburen C T. (1986b). Effect of dietary
nucleotides on response to bacterial infections.
J. Parent. Enteral Nutr.10:169–171.
Lara-Flores M, Olivera-Novoa M A, Guzman-
Mendez B E, Lopez-Madrid W. (2002).
Use of the bacteria Streptococcus faecium
and Lactobacillus acidophilus, and the
yeast Saccharomyces cerevisiae as growth
promoters in Nile tilapia (Oreochromis
niloticus). Aquacult.216:193 201
Li P, Neill W H, Gatlin D M III. (2007). Dietary
supplementation with a purified nucleotide
mixture transiently enhanced growth and
feed utilization of juvenile red drum
Sciaenops ocellatus. J.World Aquacult. Soc.
38:281–288
Mohesni, A., Murthy, H. S., Jayaraj, E. G.,
Shankar, R. and Tejpal, C.S., (2012).
Effect of brewer‟s yeast (Saccharomyces
cerevisiae) on growth, survival and
immune response in Labeo rohita. Indian
J.Anim. Sci. 82(7):114-00.
Murthy, H. S., Li, P., Lawrence, A. L., Gatlin, D. M
III. (2009). Dietary -glucan and
nucleotide effects on growth, survival and
immune responses of pacific white shrimp,
Litopenaeus vannamei. J.Appl. Aquacult.
21:160–168
Quan, R. (1992). Dietary nucleotides: Potential for
immune enhancement. In Foods, Nutrition
and Immunity, (Eds.) Paubert-Braquet M,
Dupout Ch, Poaoletti R. Vol.1, Dynamic
Nutrition Research, Karger Basel. pp.13–
21.
Ramadan, A., Afifi, N. A., Moustafa, M. M. and
Samy, A. M. (1994). The effect of
ascogen on the immune response of
tilapia fish to Aeromonas hydrophila
vaccine. Fish Shellfish Immunol. 4:59–
165.
Robertsen, B. (1999). Modulation of the non-
specific defence of fish by structurally
conserved microbial polymers. Fish
Shellfish Immunol. 9:269–290.
Sakai, M. (1999). Current research status of fish
immunostimulants. Aquacult. 172:63–92.
Smith, V. J., Brown, J. H. and Hauton, C. (2003).
Immunostimulation in crustaceans: Does it
really protect against infection. Fish
Shellfish Immunol. 15:71–90.
Sung, H. H., Kou, G. H. and Song, Y. L. (1994).
Vibriosis resistance induced by glucan
treatment in tiger shrimp (Penaeus
monodon). Fish Pathol. 29:11–17.
Uauy, R. (1989). Dietary nucleotides and
requirements in early life. In Textbook of
gastroenterology and nutrition in infancy,
2nd Ed., ed. E. Lebenthal, New York:
Raven Press., pp 265–280

Frontier J. Vet. Anim. Sci.Vol. 4, No. 2 (July-Dec.) 2015 194
Congenital anomaly are caused by genetic or
environmental factors or by interaction of both and
is one of the cause for dystocia in buffaloes
(Roberts 1971). Monstrosities are malformed
foetuses, which are rare in buffaloes (Chauhan and
Verma, 1995). Dicephalus monster is one such
congenital abnormality which occurs due to
incomplete separation of head resulting from
twining (Unver et al., 2007). The present paper
reports a case of dystocia due to Dicephalus
monster in Murrah buffalo.
CASE HISTORY AND OBSERVATION
A multiparous full term pregnant Murrah buffalo
was presented to Department of Teaching
Veterinary Clinical Complex, Veterinary College,
Bidar with the history of labor pain, ruptured water
bag with relaxed pelvic ligaments and difficulty in
parturition. On per vaginal examination, dicephalic
fetus in anterior longitudinal presentation, dorso-
sacral position and oriented towards the pelvic inlet
with the absence of fetal reflex was noticed. Based
on the case history and observation, the present
case was tentatively diagnosed as dystocia due to
dicephalus monster.
TREATMENT AND DISCUSSION
Dystocia was relieved under caudal epidural
anaesthesia with 2% lignocaine hydrochloride. The
birth canal was lubricated with castor oil. The rope
was applied to both the forelimbs of the foetus and
then by forceful traction the dicephalus monster
dead calf was delivered (Fig-1). The dam was
administered with Rintose 3L, Calcium
borogluconate 450 ml and Oxytocin 40 IU
intravenously after delivery of monster calf.
Meloxicam (Melonex®) was administered @
0.3mg/kg body weight intramuscularly for two days
and Ceftriaxone 3g (Intacef®) was administered
intravenously for three days. The fetal membranes
expelled after 5 hours of delivery and the dam made
uneventful recovery.
Fig-1: Delivered calf with Dicephalus monster
The female fetus had two heads on a single
neck, four eyes, three ears, two mandibles, two
maxillas with two fore and hind limbs. Both the
heads were united at 900
angle which was devoid of
bone and skin covering (Fig-2).
Fig-2: Dicephalus monster calf brain devoid of
bone and skin covering
Dystocia due to Dicephalus Monster in Murrah Buffalo
Manjunatha, D. R., Bhoyar. R., Harish Kulkarni, Tandle, M. K. and Vivek Kasaralikar Department of Teaching Veterinary Clinical Complex, Veterinary College, Bidar-585401
Received: 11 November, 2014; Accepted: 25 February, 2015
ABSTRACT
Dicephalus monster is a congenital abnormality due to incomplete separation of head resulting from twining. The
present paper involves a case report of a Murrah Buffalo with history of labor pain and difficulty in parturition. On per
vaginal examination, the dead foetus was found to have duplicated cranial portion. Upon lubrication and forceful
traction dystocia due to Dicephalus monster was relieved.
Key words: Dicephalus monster, Dystocia, Murrah Buffalo.

Frontier J. Vet. Anim. Sci.Vol. 4, No. 2 (July-Dec.) 2015 195
Dicephalus monster had been reported in
Jersey crossbred heifer (Napolean et al., 2008),
buffalo (Shama et al., 2010) and in Osmanabadi
goat (Daimi et al., 2014). Abnormal duplication of
the germinal area in the fetus gives rise to
congenital fetal abnormalities with partial
duplication of the body structure, duplication of
cranial portion of fetus is more common that of
caudal part (Roberts 2004). Incidence among all
calves seems to range from 0.2 to 3.0 percent with
40 to 50 percent born dead (Bugalia et al., 2001).
Rao et al., (2011) relieved the dystocia due to
Dicephalus monster in a Graded Murrah buffalo by
caesarian section, whereas in present case by
lubrication and forceful traction to the Dicephalus
monster calf was used to relieve the dystocia in
Murrah buffalo.
CONCLUSION
Successful management of dystocia due to
Dicephalus monster in Murrah buffalo was
reported and discussed.
REFERENCES
Bugalia, N.S., R.K. Biswas and R.D. Sharma.
(2001). Diplopagus sternopagus monster
in an Indian water buffalo (Bubalus
bubalis). Indian J. Anim. Reprod., 22(2):
102-104
Chauhan, K.S. and H.K. Verma. (1995). A case of
dystocia due to diplopagus monster in
buffalo. Indian J. Anim. Reprod., 16(1): 75
Daimi, S.G.R., Sajid Ali, S., Vaidya, M.S.,
Masood, A.J. and Manzoor, A.B. (2014).
Dicephalus Monster in an Osmanabadi
Goat. . Indian Vet. J., 91 (02): 62-63.
Napolean, E. R., Krishnakumar, K., Prabhakaran, V.,
Kavitha, P., Kumaresan, A. and Nagarajan,
L. (2008). Dicephalus monosomus monster
in a crossbred heifer. Indian Vet. J.,
85:1336.
Rao, M.C.H., Hari Krishna, N.V.V. and Chandra
Prasad. (2011). Dicephalic Monster in a
Graded Murrahh Buffalo. Intas Polivet
Vol. 12 (I):30-31.
Robert, S. J. (1971). Veterinary Obstetrics and
Genital Diseases, 2nd
Edition, CBS
Publishers and Distributers, New
Delhi.
Robert, S. J. (2004). Veterinary Obstetrics and
Genital Diseases, Indian reprint 2nd
Edition, CBS Publishers and Distributers,
New Delhi. Pp73-74.
Shama, A., Shama, S. and Vasishta, N.K. (2010). A
diprosopus buffalo neonate: A case report
Buffalo Bulletin 29 (1): 62-64.
Unver, O., Kilinc, M and Ozyurtu, N. (2007).
Cranial Duplication (Dicephalus) in a
Lamb. Turk J Vet Anim. Sci 31(6): 415-
417.

Frontier J. Vet. Anim. Sci.Vol. 4, No. 2 (July-Dec.) 2015 196
1Assistant Professor, Dept. of TVCC, Veterinary College, Bidar-585401. Karnataka Email: [email protected]
Teasers are used to detect or aid in identification of
females in estrus to allow them to be bred by
natural or artificial means to males of greater
genetic merit than the teasers. Ideal methods for
creating teaser animals involve rendering the teaser
both infertile and incapable of mating to prevent
spread of venereal diseases. Epididymectomy is
generally a surgical technique used to produce
teaser males or as an adjunct to vasectomy and it
achieves infertility but does not alter the ability or
desire of males to mate (Gilbert and Fubini, 2004).
CASE HISTORY AND OBSERVATION
A two year old, Non Descriptive buffalo bull from an
organized dairy farm was presented to large animal
clinic, MVC, Chennai-07 for teaser preparation.
Thorough clinical examination was performed and the
physiological and haemato – biochemical parameters
were well within the normal range. Epididymectomy
was decided. Preoperatively streptopenicillin 2.5g, IM
and meloxicam @ 0.2 mg/kg BW, IM were
administered.
TREATMENT AND DISCUSSION
Epidural anaesthesia was achieved by using 10ml
of 2% lignocaine, injected at sacro-coccygeal joint.
Once the scrotal area was desensitized, the surgical
site was aseptically prepared and tincture iodine
was applied at the site.
A horizontal skin incision was made at the
ventral aspect of left scrotum, fascia and tunica
vaginalis were also incised (Fig. 1). The tail of the
epididymis was exposed and separated carefully
from the distal aspect of the testis (Fig. 2) with
blunt dissection (Fig. 3) and ligated between two
sites with 2cm apart with catgut 1-0 (Fig. 4), and
the tail of epididymis was resected. The tunica
vaginalis was closed by simple continuous pattern
using catgut 1-0 (Fig. 5) and skin incision was
closed with silk by horizontal mattress pattern. The
same procedure was performed for the right side
epididymis.
Fig. 1: Surgical incision
Fig. 2: Separation of epididymis
Caudectomy (Epididymectomy) For Teaser Buffalo Bull Preparation –
A Case Report
Harish Kulkarni1, Md. Shafiuzama and William,
B.J.
Department of Veterinary Surgery and Radiology, Madras Veterinary College, Chennai-600007
Received: 27 February, 2015; Accepted: 12 June, 2015
ABSTRACT
Epididymectomy is generally a surgical technique used to produce teaser males or as an adjunct to vasectomy and it
achieves infertility but does not alter the ability or desire of males to mate. The present paper reports teaser buffalo
bull preparation by epididymectomy technique.
Keywords: Epididymectomy, Teaser, Tunica vaginalis & Buffalo bull.

Frontier J. Vet. Anim. Sci.Vol. 4, No. 2 (July-Dec.) 2015 197
Fig 3: Exposed tail of epididymis
Fig. 4: Double ligation using catgut 1-0
Fig. 5: Suturing of tunica vaginalis
Weaver et al. (2005) stated after
caudectomy sclerosing agents have also been
injected into the testicle and epididymis of bulls to
produce fibrosis and to abolish spermatogenesis
and tease the bull weekly for three weeks and when
no live sperm were seen, then the bull be
considered suitable for work.
Gilbert and Fubini (2004) reported this
procedure was performed as the main or
supplementary method for producing teaser
animals. It may be performed in ruminants of all
species either in laterally restrained or standing
animals. This technique should be performed at
least 30 days before intended use of the teaser to
allow sufficient time to achieve infertility.
REFERENCES
Gilbert R. O. and S. L. Fubini, (2004). Surgical
Management of Specific Conditions, In
Farm Animal Surgery by S. L. Fubini and
N. G. Ducharme. pp: 363.
Weaver, A. D., G. S. Jean and A. Steiner, (2005). In
Bovine Surgery and Lameness, Second
Edition. pp: 185-186.

Frontier J. Vet. Anim. Sci.Vol. 4, No. 2 (July-Dec.) 2015 198
Parturient haemoglobinuria is one of the potent
threats to the milking buffaloes and cows in India
which is a non infectious haemolytic syndrome
characterized by intravascular haemolysis, anaemia
and haemoglobinuria (Akhtar et al., 2007). The
exact pathogenesis is not yet known however
associated risk factors include ingestion of
cruciferous plants, saponin from berseem, dietary
phosphorous deficiency, decreased serum copper
and selenium whereas increased molybdenum
(Radostits et al., 2007). The present case report
discusses the successful clinical management of
phosphorous deficient haemoglobinuria in a
pregnant buffalo.
A 6 year aged female buffalo was
presented to the TVCC Veterinary college Bidar,
with history of not taking feed, passing coffee
decoction coloured urine since 3 days (Plate: 1).
The history revealed that the animal was kept on
exclusive sugarcane top feeding since 3-4 months.
Clinical examination of the animal revealed pale
mucous membrane which was icteric at edge, slight
hurried respiration with distress. Rectal temperature
was normal (100.4ºF). On examination the body
coat revealed no tick infestation. Examination of
blood smear stained with Giemsa‟s stain confirmed
that the animal was negative for Babesia spp. The
serum sample was analysed for Phosphorous level
revealing 2.5 mg/dl inorganic phosphorous against
the normal range of 5.6-6.5 mg/dl. The
haemoglobin content was hardly 5.5 g/dl (normal 8-
13 g/dl). The case was diagnosed as phosphorous
deficient haemoglobinuria. The animal was treated
with NovizacR, Intas pharmaceuticals Ltd. (Kit of
Buffered Phosphorous, Inosine and Pyruvate
Injection) 25 ml intravenously and 10 ml
subcutaneously. Supportive treatment included
haematinics (FerritasR,
Intas pharmasuitical Ltd.) 7
ml and Liver extracts (BelamylR, Sarabhai zydus
Pvt.Ltd) 15 ml by IM route and 50 grams of sodium
bicarbonate powder PO.
Fig: Pregnant buffalo passing coffee decoction
coloured urine.
Twelve hours after treatment animal
passed the urine which was of almost normal colour
indicating uneventful improvement in the
condition. The treatment was continued for 3days
Successful Clinical Management of Pre-Parturient Haemoglobinuria in a
Buffalo –A Case Report.
Satheesha, S.P. Halamandge, S., Vivek Kasaralikar and Bhoyar, R. Dept of TVCC, Veterinary College, BIDAR-585401. Karnataka.
Received: 02 March, 2015; Accepted: 03 June, 2015
ABSTRACT
Nutritional haemoglobinuria is one of the potent threats to the milking buffaloes and cows in India, occurring as post -
parturient episode; however pre-partum reports are available. The present case report discusses successful clinical
management of phosphorous deficient haemoglobinuria in a pregnant buffalo. An 8 month pregnant buffalo was
presented to TVCC veterinary college Bidar, with a history of passing coffee decoction coloured urine since 4 days.
Based on the thorough clinical examination and laboratory findings the case was diagnosed as pre- parturient
haemoglobinuria. The animal was treated with NovizacR, Intas pharmaceuticals Ltd. (kit of Buffered Phosphorous,
Inosine and Pyruvate Injection) along with haematinics and liver extracts as supportive therapy. An uneventful
recovery was observed with follow-up treatment for three days suggestive of efficacy of NovisacR which can be used
as the good alternative for phosphorous deficient haemoglobinuria.
Key words: Buffalo, Buffered phosphorous, Haemoglobinuria, Pregnant.

Frontier J. Vet. Anim. Sci.Vol. 4, No. 2 (July-Dec.) 2015 199
with NovizacR and Belamyl
R. The normal appetite
was resumed on third day onwards. Orally FerritasR
bolus as haematinics was given once a day for 10
days. LivotasR syrup (Intas pharmaceuticals Ltd.)
was dispensed to owner with advice of giving 40 ml
per day for one week.
Increased demand for phosphorous and
calcium for developing foetus and subsequent
dietary deficiency of these compounds leads to
hypophosphataemia in peri-parurient periods
(Digraskar et al. 1991). Pandey and Misra (1987)
reported that hypophosphataemia leads to
intravascular haemolysis due to impaired glycolytic
pathway and depletion of ATP in erythrocytes that
inturn alter functions and structure of RBC,
causing a loss of normal formability and an
increase in fragility, ultimately leading to
haemolysis.
NovizacR supplies necessary phosphorous
which helps in augmenting the cell activity through
enhancing the production of ATP and also aids in
relieving oxidative stress and stabilising RBC
membrane.
Durrani et al. (2010) conducted clinical
trials on post parturient haemoglobinuria with
sodium acid phosphate, toldimfos sodium and tea
leaves. They noticed the highest efficacy with
toldimfos sodium (85%) followed by tea leaves
(56%) while the lowest efficacy was observed with
sodium acid phosphate (18%). The present clinical
report showed that parturient haemoglobinuria can
be successfully managed by NovizacR injections in
accordance with earlier reports of Rashmi and
Yadav (2014).
REFERENCES
Akhtar, M. Z., Khan, A., Sarwar M. and Javaid A.
(2007). Influence of soil and forage minerals
on buffalo parturient haemoglobinuria.
Asian-Aust. J. Anim. Sci, 20: 393-398.
Digraskar, S., Singh, B., Deshpande, B. B. (1991).
Epidemiology and clinico-pathology of
haemoglobinuria in buffalo (Bubalus
bubalis). Livest. Advisor., 16: 32-38.
Durrani, A. Z., Kamal, N., Shakoori, A. R. and
Younus, R. M. (2010). Prevalence of post
parturient haemoglobinuria in buffalo and
therapeutic trials with toldimfos sodium
and tea leaves in Pakistan. Turk. J. Vet.
Anim. Sci., 34(1): 45-51.
Pandey, N.N. and Misra, S.K. (1987). Clinico-
biochemical studies on nutritional
haemoglobinuria in buffaloes and therapy.
Indian Vet., J., 64: 39-43.
Radostits, O. M., Gay, C. C., Hinchcliff K. W. and
Constable, P. D. (2007). Veterinary
Medicine: A Textbook of the Diseases of
Cattle, Sheep, Pigs, Goats and Horses, 10th
Edn. Elsevier‟s Health Sciences 1600 John
F. Kennedy Boulevard, Suite 1800,
Philadelphia, PA 19103 – 2899, U.S.A.
1682 – 83 pp.
Rashmi, C. and Yadav D.S. (2014). Therapeutic
Management of Post-Parturient
Haemoglobinuria (PPH) in a Buffalo. Intas
Polivet., 15 (1): 64-65.

Frontier J. Vet. Anim. Sci.Vol. 4, No. 2 (July-Dec.) 2015 200
Intussusception is one of the major surgical
condition in canines most common at jejunojejunal
and ileo-colic regions (Fossum et al., 2002) and
commonly observed in puppies less than one year
of age, with more occurrence in German Shepherd
and less commonly in cocker spaniels (Sivasankar,
2000 ; Khan et al., 2011 and Vineet et al., 2012). It
is classified as high (proximal to the jejunum) and
low (distal to the duodenum) intussusception
(Dixon, 2004). Predisposing factors and
aetiological agents responsible for intestinal
intussusception were intestinal parasitism, linear
foreign bodies, hyper motility of intestines and
prior abdominal surgery (Wilson and Burt, 1974).
Ultrasonography and radiographic evaluation of
abdominal region are very helpful in establishing a
definitive diagnosis (Lewis and Ellison, 1987 and
Oakes et al., 1994). Present case paper reports
ultrasonography findings of intussusception in two
Labrador pups.
CASE HISTORY AND OBSERVATIONS
Case1: A six month old male, Labrador pup was
presented to Teaching Veterinary Clinical Complex
(City Hospital), APMC yard, Gandhi Gunj, Bidar
with a history of recurrent rectal prolapse,
inappetance and not passed stools since two days
and owner had manually applied ice packs and
replaced the rectum inside. On clinical examination
the pet was dullwith congested mucus membrane
and slightly distended abdomen. Rectal temperature
and heart rate were 103.9°F and 106 beats/minute,
respectively with tachypnea. Haemato–biochemical
examination revealed leucocytosis with
neutrophilia indicating underlying infection. On
abdominal palpation, hard mass was felt at the left
caudal abdominal part and suspected for
intussusception or intestinal obstruction.
Case 2: A two and half month old female Labrador
pup was presented to Teaching Veterinary Clinical
Complex (City Hospital), APMC yard, Gandhi
Gunj, Bidar with a history of not passing feces
since two days with normal appetite. One week
back pup was treated for acute enteritis by local
veterinarian. On clinical examination pet was active
with congested mucus membrane. Rectal
temperature and heart rate were 101.5°F and 88
beats/minute, respectively. Haemato–biochemical
values were within the normal physiological range.
On abdominal palpation, firm hard mass was felt
near the anterior portion of the abdomen and
suspected for jejunal intussusception or intestinal
obstruction.
Both the puppies were subjected to
ultrasonographical examination for confirmation of
the condition.
ULTRASONOGRAPHICAL FINDINGS AND
DISCUSSION
Ultrasonography of both the cases revealed
concentric rings on transverse section, hyperechoic
outer (intussuscipiens-ensheathing layer) and
hypoechoic (intussusceptum -entering layer) at the
centre giving characterstic appearance of “Bull eye”
at the ileo colic region for case 1(Fig.1 & Fig.2)
where in ultrasonography probe was placed at the
left mid abdominal region and at jejunojejunal
segments for case 2 (Fig.3 & Fig.4) wherein the
ultrasonography probe was placed at the lower
anterior abdomen region.
Diagnosis of Intussusception by Ultrasonography in Pups - A Case Report
Harish Kulkarni, Shivanand Magadum, Bhoyar, R. and Vivek Kasaralikar
Department of Teaching Veterinary Clinical Complex, Veterinary College, Bidar. Received: 05 May, 2015; Accepted: 30 July, 2015
ABSTRACT
Intussusception is recognized as a common cause of bowel obstruction in small animals and has been classified
according to their location in the alimentary tract as gastroesophageal, pylorogastric, enteroenteric, enterocolic and
colocolic had been reported in small animals. Ultrasonography and radiographic evaluation of abdominal region are
very helpful in establishing a definitive diagnosis (Lewis and Ellison, 1987 and Oakes et al., 1994). Present case paper
reports ultrasonography findings of intussusception in two Labrador pups were discussed.
Key words: Intussusception, Enteroenteric, Ultrasonography and Labrador pup.

Frontier J. Vet. Anim. Sci.Vol. 4, No. 2 (July-Dec.) 2015 201
Fig.1: Concentric rings at the ileo-colic
junction
Fig.2: “BULL EYE” appearance of
intussusception mass
Fig.3: Concentric Hypo and hyperechoic part at
the jejunojejunal part in a Labrador pup
Fig.4: Concentric Hypo and hyperechoic part at
the jejunojejunal part in a Labrador pup in
transverse plane
Intussusception is recognized as a
common cause of bowel obstruction in small
animals and has been classified according to their
location in the alimentary tract as gastroesophageal,
pylorogastric, enteroenteric, enterocolic and
colocolic (Wilson and Burt, 1974 and Lewis and
Ellison, 1987). Acute enteritis or gastroenteritis has
been demonstrated as the most likely predisposing
factor for intestinal intussusceptions in young dogs
(Rallis et al., 2000). It forms as a result of
abnormality within the intestinal wall that alters the
intestinal pliability and motility (Sivasankar, 2000;
Hedlund and Fossum, 2007). Puppies and kittens
are most likely ones to develop intussusceptions.
Although it can occurs in any age or species but
more than 80 per cent of intussusceptions occurs at
one year old puppies (Oakes et al., 1994; Dixon,
2004; Hedlund and Fossum, 2007). Most frequently
observed clinical signs in case of low
intussusceptions were bloody mucoid diarrhea,
tenesmus, intermittent vomiting and weight loss
(Dixon, 2004). Intussuception at the enterocolic
level appeared to be more at risk of developing
adhesion than those involving only the
enteroenteric region (Kumar et al., 2011).
Accumulation of gas proximal to the
intussusception was observed on plain radiography

Frontier J. Vet. Anim. Sci.Vol. 4, No. 2 (July-Dec.) 2015 202
(Vineet et al., 2012). On ultrasonography,
intussusceptum and intussuscipiens appear as
hyperechoic and hypoechoic concentric rings in
transverse plane and as multiple hyperechoic and
hypoechoic parallel lines in longitudinal plane (Lewis
and Ellison, 1987 and Oakes et al., 1994).
Ultrasonography of ileocolic intussusception showed
concentric hyperechoic and hypoechoic rings in the
transverse plane however, longitudinal plane revealed
a sausage-shaped mass with folded layers of intestinal
wall (Khan et al., 2011). In the present cases
characteristic circular hyperechoic and hypoechoic
(bull eye) appearance of intestinal segments were
noticed which concurred with the findings of Wilson
and Burt (1974), Lewis and Ellison (1987), Oakes et
al. (1994) and Khan et al. (2011).
CONCLUSION
Ultrasonography can be used as confirmative
diagnostic tool for diagnosing intestinal
intussusception in paediatric patients without any
harmful effects.
REFERENCES
Dixon, B. C., (2004). In L.P. Tilley and F. W. K
Smith, Jr. The 5-minute veterinary consult
Canine and Feline 3rd edition, Lippincott
Williams and Wilkins. pp: 721-722.
Fossum, T. W., C. S. Hedlund, D. A. Hulse, A. L.
Johnson, H. B. Seim, M. D. Willard and
G. L. Carroll, (2002). Small Animal
Surgery, 2nd ed. Mosby an Elsevier
Science company. Pp: 390- 391.
Hedlund, C.S and T.W. Fossum, (2007). Surgery of
the digestive system. In: Small Animal
Surgery, Fossum, T. W., (Eds.). 3rd Edn.,
Mosby Elsevier, Missouri.
Khan, M. A., M. M. Ali, S. Azeem, A. Safdar, Ijaz A.
Ziaullah and M. T. Sajjad., (2011). Ileocolic
Intussusception in a Cocker Spaniel Dog: A
Case Report. The Journal of Animal & Plant
Sciences, 21(3): 635-637.
Kumar, K., P. Shekhar and P. K.Singh. (2011).
Intussusception in a Labrador dog- a case
report.E.A.M.R., 1(1):91-92.
Lewis, D. D and G. W. Ellison, (1987).
Intussusception in dogs and cats.
Compendium on Continuing Education for
the Practicing Veterinarian. 9:523- 534.
Oakes, M. G., D. D. Lewis, G. Hosgood and B. S.
Beale, (1994). Enteroplication for the
prevention of intussusception recurrence in
dogs: 3 1 cases (1978-1992). J.A.V.M.A.,
205:72-75.
Rallis, T.S., Papazoglou, L.G., Adamama-
Moraitou, K. K. and N.N. Prassinos,
(2000). Acute enteritis or gastroenteritis in
young dogs as a predisposing factor for
intestinal intussusception: a retrospective
study. J. Vet. Med. A Physiol. Pathol. Clin.
Med., 47: 507-511.
Sivasankar, M. (2000). Recurrent intussusception in
a 14-month old, spayed female German
shepherd cross. Can. Vet. J., 41: 407-408.
Vineet K, A. A. Raja and P. Rekha., (2012).
Ileocolic Intussusception and its Surgical
management in a Labrador Pup. Intas
Polivet, 13(1): 108-110.
Wilson, G. P and J. K. Burt, (1974). Intussusception
in the dog and cat: A review of 45 cases.
J.A.V.M.A., 164:515-518.

Frontier J. Vet. Anim. Sci.Vol. 4, No. 2 (July-Dec.) 2015 203
*Part of M.V.Sc. Thesis submitted by the first author to KVAFSU, Bidar 1Wildlife Veterinarian, Bannerghatta Biological Park, Bannerghatta, Bengaluru Email: [email protected] 2Professor and Head, Department of TVCC, Veterinary College, Hassan 3Professor and Head, Dept. of Parasitology, Veterinary College, Bengaluru 4Dean, Veterinary College, Bengaluru
A study was carried out to study incidence of
theileriosis in cattle brought to in Veterinary
College Hospital, Bangalore based on blood smear
examination and Dot-ELISA. The cattle brought
to Veterinary College Hospital, Hebbal for a
period of six months from April to September
2004 were included for the study. The cases were
recorded based on clinical signs of theileriosis.
Blood samples were collected for smear
examination and serum was separated for
detection of antibodies by Dot-ELISA.
Fresh smears were made and quickly dried
by waving in the air and stained with Giemsa stain
using standard procedure as described by Schalm et
al. (1975). The stained smears were
microscopically examined under oil immersion.
Dot-ELISA test was performed using nitrocellulose
strips according to the method described by
Prasanna et al. (2001).
Based on clinical signs 11 (14.67 per
cent) out of 75 were suspected to be suffering
from clinical theileriosis. Among them 8 were
HF cross and 3 were Jersey cross. The common
clinical signs observed were anorexia (100%),
pyrexia of 103º to 104.4 F (90.90%), paleness of
mucous membranes viz., oral, conjunctival and
vulval mucosa (63.64%) and swelling of
superficial lymph nodes namely prescapular and
prefemoral lymph nodes (54.55%). In addition
some cases also exhibited reduced milk yield
(36.36%), panting (27.27%), salivation (27.27%),
weakness (18.18%) and nasal discharge (9.09%).
Similar clinical signs were recorded by Sisodia and
Mandial (1986) and Sundaram et al. (2003).
However occasional signs of haemoglobinuria and
urticarial lesions were reported by few workers.
In the present study, 6 (8.00%) out of 75
animals were positive for theileriosis by blood
smear examination. Further, ring form of T.
annulata organism was predominantly found on
blood smear examination. However, Venugopal
(1983) reported oval forms of the parasite in
higher percentage as compared to rod and ring
forms. Out of these 11 clinical cases, all were
(14.47% of total 75 animals) were positive by
Dot-ELISA.
Tanwar et al. (1984) reported an
incidence of 42.86 per cent in Rathi calves in
Bikaner, Rajasthan. Sundar et al., 1993 reported
a prevalence of 53.19 per cent by ELISA, while
Soundararajan et al., 2000 reported a prevalence
of 22.8 per cent by blood smear examination and
66.4 per cent by Dot-ELISA in Madras
Veterinary College, Chennai.
Incidence of Theileriosis in Cattle at Veterinary College Hospital, Bangalore*
Roopa Satish1, Narayan Bhat
2, M., Placid E. D’Souza
3 and Yathiraj
4, S.
Department of Veterinary Medicine, Veterinary College, Bengaluru-560024
Received: 30 September, 2014; Accepted: 14 December, 2014
ABSTRACT
A study on the incidence of theileriosis at Veterinary College Hospital, Hebbal, Bangalore was undertaken for a period
of six months from April to September 2004. The incidence was studied based on the clinical signs, blood smear
examination and Dot-ELISA using schizont antigen. Eleven (14.66%) out of 75 cattle presented to Veterinary College
Hospital, Hebbal had clinical signs of theileriosis. Out of these 11 cases, 6 were positive by blood smear examination
and all were positive by Dot-ELISA. The clinical signs recorded in the present study included anorexia, pyrexia of
103 to 104.4F, paleness of mucous membranes and swelling of superficial lymph nodes. In addition some cases
showed reduced milk yield, panting, salivation, weakness and nasal discharge.
Key Words: Theileriosis, Incidence, Dot-ELISA
Frontier J. Vet. Anim. Sci.Vol. 4, No. 2 (July-Dec.) 2015 204
REFERENCES
Mishra, K.C., Achar, K.C. and Lama, N.D.
(1983). Efficacy of some chemo-
therapeutic agents against clinical
Theileria annulata infection in exotic
cattle. Indian Vet. J., 60: 313-318.
Prasanna, K.M., Jagannath, and Placid, E.D.
(2001). Evaluation of Dot-ELISA in the
detection of Taenia solium cysticercosis in
pigs. Indian J. Anim. Sci., 71: 235-236.
Schalm, O.W., Jain, N.C. and Carroll, E.J.(1975).
In Veterinary Hematology, 3rd
edition, Lea
Febiger, Philadelphia.
Sisodia, R.S and Mandial, R.K. (1986). Prevalence of haemo-
protozoan diseases in cattle at Mhow, Madhya
Pradesh. Indian J. Anim. Sci., 56: 864-866.
Soundararajan, C., Rajavelu, G., Anandan, R.
and Ramadass, P. (2000). Enzyme-
linked immunosorbent assay for the
detection of Theileria annulata infection
in cattle and buffaloes.Indian J. Anim.
Sci., 70: 815-816.
Sundar, N., Balasundaram, S., Ramadass, P and
Anandan, R. (1993). Usefulness of
enzyme-linked immunosorbent assay for
the diagnosis of Theileria annulata
infection, Indian J. Anim. Sci., 63: 1219-
1221.
Sundaram, A.M., Sivaseelan.S., Ramamurthy, N
and Sundararaman, M.N. (2003).
Concurrent Theileriosis and Anaplasmosis
infection in crossbred cows -- a case
report. Cheiron, 32: 89-90.
Tanwar, R.K., Ajey, K., Yadav, J.S., Sharma,
S.N. and Lodha, K.R. (1984).
Theileriosis (Theileria annulata) in
indigenous Rathi calves. Indian J.
Anim. Sci., 54: 118-120.
Venugopal, T.( 1983). Observations on the
relation of morphology of parasites to
pathogenesis in bovine theileriasis.
M.V.Sc., thesis, Univ. Agri. Sci.,
Bangalore.

Frontier J. Vet. Anim. Sci.Vol. 4, No. 2 (July-Dec.) 2015 205
Regucalcin (RGN) gene is located on the X-
chromosome of humans (region Xp11.3-q11.2), rats
(region Xq11.1-12) (Fujita et al., 1995) and a
number of other mammalian organisms, except in
yeast (Shimokawa et al., 1995). The RGN gene
consists of seven exons and six introns, encodes a
protein of 299 amino acids that has a molecular
weight of ~33kDa. A high degree of conservation
in both genomic and protein levels has been shown
by a comparison study made between gene
sequences from seven different vertebrate species
(Misawa and Yamaguchi, 2000). This high
conservation of RGN protein throughout evolution,
from invertebrates to vertebrates, indicates its
involvement in basic and important biological
functions. RGN regulates intracellular calcium
homeostasis by modulating the activity of enzymes
regulating Ca2+
concentration, and enhancing Ca2+
pumping activity through the plasma membrane,
endoplasmic reticulum and mitochondria of several
cell types (Yamaguchi, 2005). It is also
demonstrated to have role in calcium signaling.
RGN is shown to regulate apoptosis both in-vivo
and in-vitro (Ishigami et al., 2002, Izumi and
Yamaguchi, 2004). It regulates glycogenolysis and
gluconeogenesis stimulated by Ca2+
in liver cells
(Yamaguchi and Shibano, 1987). Here we have
done the PCR amplification and RE
characterization of buffalo RGN. This can be
further used for cloning in to appropriate host for
future research.
RNA was isolated from the testis tissue of
buffalo using PROMEGA, Total RNA Isolation
System, according to manufacturer‟s instruction.
cDNA was synthesized from the RNA using Revert
AidTM
H-Minus First Strand cDNA Synthesis kit
(Fermentas). Forward and reverse primers
(ExRGNF and ExRGNR) for the full length
amplification of coding sequence of bovine RGN
were designed using DNA star molecular biology
software. PCR reaction mixture of 25ul, consisting
of 1X Taq buffer with MgSo4, 0.2mM of dNTP
mixture, 10pmol of each of forward and reverse
primers, 100ng of buffalo testis cDNA and 5U of
Taq polymerase enzyme was subjected to initial
denaturation at 950C for 5 min followed by 30
cycles of 1min of denaturation at 950C, 1min of
annealing at 550C and 1min of extension at 72
0C,
and final extension for 10min at 720C. The
amplified PCR products were confirmed for their
size by 1% agarose gel electrophoresis. The
electrophoresis was carried out in a horizontal
submarine gel electrophoresis at 50V for 2h with
100bp ladder and visualized in gel documentation
system. The PCR product was loaded in a LMP
agarose gel and given a long run at 50V. Gel
extraction was done according to the standard
protocol (Sambrook, 2001). Pellet was reconstituted
PCR Amplification and Characterization of RGN Gene in Buffalo
(Bubalus bubalis)
Harikrishna, P., Shende, A.M. and Bhure, S. K. Division of Animal Biochemistry, Indian Veterinary Research Institute, Izatnagar, Bareilly (U.P.), India
Received: 07 February, 2015; Accepted: 29 March, 2015
ABSTRACT
Successful PCR amplification of the whole buffalo regucalcin (RGN) gene and restriction enzyme characterization
was done. Single amplification product showed the primers designed were working well and the thermal protocol was
standardized. The PCR product was further characterized using three different restriction enzymes (Cla I, Pst I and
Kpn I) The RFLP pattern obtained proved that the product obtained is regucalcin and not any nonspecific product.
This is the first report of PCR amplification of RGN from tissue of buffalo. The RGN amplicon can be further used for
structure prediction of the RGN protein. It can be used for molecular cloning work. So far no buffalo RGN clones
were reported to use in any studies.
Key words: Regucalcin, PCR, RFLP.

Frontier J. Vet. Anim. Sci.Vol. 4, No. 2 (July-Dec.) 2015 206
in NFW and further used for RE characterization
using ClaI, PstI, KpnI enzymes. A 20 µl reaction was
put for each enzyme containing 2µl of gel extract, 1µl
of enzyme, 2µl of respective 10x buffer and volume
made up by NFW. Overnight digestion at 37°C was
done and checked by running a 2% agarose gel.
The PCR product was confirmed by
running a 1% agarose gel. The expected size of ~893
bp of PCR product was confirmed. Gel extraction
was done to remove the salts and buffers and used
for RE characterization. RE digestion with Cla1
yielded two fragments (~300bp and ~600bp), Pst1
yielded three fragments (~548bp, ~357 and ~273bp)
and Kpn1 yielded two fragments (~350bp and
550bp). The attainment of predicted fragment sizes
after RE digestion suggests the specificity of the
product. The RGN amplicon can be further used for
structure prediction of the RGN protein. It can be
used for molecular cloning work. So far no buffalo
RGN clones were reported to use in any studies.
REFERENCES
Fujita T, Mandel J L, Shirasawa T, Hino O, Shirai T
and Maruyama N. 1995. Isolation of cDNA
clone encoding human homologue of
senescence marker protein-30 (SMP30) and
its location on the X chromosome.
Biochimica et biophysica acta. 1263: 249-52.
Ishigami A, Fujita T, Handa S, Shirasawa T, Koseki
H, Kitamura T, Enomoto N, Sato N,
Shimosawa T and Maruyama N. 2002.
Senescence marker protein-30 knockout
mouse liver is highly susceptible to tumor
necrosis factor-alpha- and Fas-mediated
apoptosis. Am J Pathol. 161: 1273-81.
Izumi T and Yamaguchi M. 2004. Overexpression of
regucalcin suppresses cell death and
apoptosis in cloned rat hepatoma H4-II-E
cells induced by lipopolysaccharide, PD
98059, dibucaine, or Bay K 8644. J. Cellul.
Biochem. 93: 598-608.
Misawa H and Yamaguchi M. 2000. Intracellular
signaling factors enhanced hepatic nuclear
protein binding to TTGGC sequence in the rat
regucalcin gene promoter: involvement of
protein phosphorylation. Biochem. Biophys.
Res. Commun. 279: 275-81.
Sambrook J, Russel D W, Irwin N and Janssen K
A. 2001. In: Molecular Cloning: A
Laboratory Manual. Edition 3. Cold
Spring Harbor, New York: Cold Spring
Harbor Laboratory Press.
Shimokawa N, Matsuda N and Yamaguchi M.
1995. Genomic cloning and
chromosomal assignment of rat
regucalcin gene. Mol. Cell. Biochem.
151: 157-163.
Yamaguchi M and Shibano H. 1987. Effect of calcium-
binding protein on the activation of
phosphorylase a in rat hepatic particulate
glycogen by Ca2+
. Chem. Pharm. Bull. 35:
2581-2584.
Yamaguchi M. 2005. Role of regucalcin in maintaining
cell homeostasis and function (Review). Int J
Mol Med.15: 371-389.Radostits, O. M, Gay,
C. C., Hinchcliff K. W. and Constable P. D.
(2006):Veterinary Medicine- A text book o
diseases of cattle, sheep, goats, pigs and
horses. 10th edition, Elsevier publication: pp
1863-65.
Frontier J. Vet. Anim. Sci.Vol. 4, No. 2 (July-Dec.) 2015 207
*Part of M.V.Sc. Thesis submitted by the first author to KVAFSU, Bidar 1Wildlife Veterinarian, Bannerghatta Biological Park, Bannerghatta, Bengaluru Email: [email protected] 2Professor and Head, Department of TVCC, Veterinary College, Hassan 3Professor and Head, Dept. of Parasitology, Veterinary College, Bengaluru 4Dean, Veterinary College, Bengaluru
Swine industry is growing swiftly at present due to
the change in food habits of a fairly good human
population and also due to the change in perception
towards pig rearing in our county, which earlier
was solely an occupation of weaker sections of
society. Pigs are the crux of enhancing rural
economy through an account of high prolificacy,
better efficiency of feed conversion, shorter
generation interval, faster growth rate, low
maintenance cost and high dressing percentage
besides ability to utilize unconventional feed stuffs
and human leftovers efficiently. Hence, they can be
crucial in resolving the acute demand for protein of
high biological value, comparatively at low cost.
This minimized cost of production and eventual
higher returns on investment is a good fortune for
animal husbandry activities in rural masse.
Although, India ranks 3rd
in Asia for pig population,
with 11.134 million (BAHS, 2013), only 21.46%
are of improved genotype (crossbred) pigs and
remaining 78.54% are of indigenous with poor
reproductive efficiency. Therefore, superior
germplasms of improved exotic pig breeds were
introduced in our country to enhance important
economic traits genetically in native pigs through
crossbreeding. Also, the performance of purebreds
was assessed in our environmental conditions. This
performance of pigs is controlled by various genetic
and non-genetic factors. Therefore, with dearth of
information on the factors affecting the economic
traits, the present study was undertaken with an
objective to study the effect of various factors
affecting reproductive traits in pigs.
Data on litter size of pigs at birth and at
weaning spread over a period of 29 years from
1972 to 2000 were extracted from the available
History cum Pedigree sheets maintained at
Regional Pig Breeding station-cum-Bacon factory,
Haringhata, West Bengal. This data was classified
according to genetic group, period and parity of
dams. Genetic factor considered in this study were
Large White Yorkshire (LWY), Landrace (LR),
LWY x LR and LR x Desi (D) pigs. Total period
was divided into five periods, the first period of
nine years duration and the remaining four periods
of five years duration each and up to 5th
parity of
dams was considered in our investigation. The data
was subjected to Least Squares Analysis as per
Harvey (1966) and modified Duncan‟s multiple
range (DMR) test (Kramer, 1957) was utilized for
pair-wise comparison of the least squares means.
Least Squares means SE of Litter Size at Birth
and at Weaning in pigs are detailed in the Table.
Effect of Genetic and Non-Genetic Factors on Litter Size in Pigs
Prem Prakash Choudhary1, Sanjeev Ranjan
1, Yathish, H. M
1. and Misra
1, S.K.
Department of Animal Genetics and Breeding, WBUAFS, Mohanpur, West Bengal
Received: 08 January, 2015; Accepted: 15 April, 2015
ABSTRACT
The present investigation was undertaken to evaluate the effect of genetic and non-genetic factors on litter size of
various pig breeds. Least Squares Analysis of data has revealed the significant (P<0.01) effect of genetic factor and
non-significant effect of environmental factors on litter size at birth and litter size at weaning. This result might be
attributed to the uniform housing, feeding, and other managemental conditions provided to the different groups of pig.
Also, the higher litter size at birth and at weaning, when compared to the previous reports, in some pig breeds under
this investigation, suggest the importance of genetic factor in improving reproductive efficiency of sows than non-
genetic factors. Although, this finding is of use in pig rearing practices, Least Squares Analysis of more data with
additional environmental factors will prove the importance of reducing/ eliminating non-genetic factors in enhancing
the returns on investments in pig husbandry.
Key words: Swine, Genetic factor, Non-genetic Factor, Litter Size

Frontier J. Vet. Anim. Sci.Vol. 4, No. 2 (July-Dec.) 2015 208
Table: Least Squares Means ± SE of litter size at
birth and at weaning in Pigs
Effects n Litter Size (numbers)
at Birth at Weaning
A. Breed: Genetic Factor
a) LWY 196 7.678a 0.217 5.304a 0.160
b) LR 369 8.150b 0.142 6.419b 0.160
c) LWYxLR 218 8.486b 0.190 6.719b 0.214
d) LR x D 161 7.946a 0.214 5.444a 0.242
B. Period: Non-Genetic Factors
a) Period 1 207 8.496 0.194 8.496 0.194
b) Period 2 167 7.960 0.226 7.960 0.226
c) Period 3 220 7.717 0.193 7.717 0.193
d) Period 4 196 8.200 0.212 8.200 0.212
e) Period 5 154 8.71 + 0.236 8.71 + 0.236
C. Parity: Non-Genetic Factors
a) Parity 1 275 7.806 0.181 7.806 0.181
b) Parity 2 238 8.143 0.189 8.143 0.189
c) Parity 3 198 8.160 0.199 8.160 0.199
d) Parity 4 146 8.075 0.224 8.075 0.224
e) Parity 5 87 8.291 0.287 8.291 0.287
n= Number of observations in each subclass of a factor.
Mean with different superscript differ significantly at
p<0.05.
Litter Size at Birth: The average litter size at birth
in LWY, Landrace, LWY x LR and LR x D were
estimated to be 7.678 0.217, 8.150 0.142, 8.486
.190 and 7.946 0.214 respectively. The highest
and lightest litter size at birth was observed in
LWY x LR and LWY, respectively. Previous
studies have reported the average litter size at birth
of 6.4 to 10.60 in LWY (Singh et al., 1979;
Mohanty and Nayak, 1986; Goonewardene et al.,
1984; Jayarajan and Ulaganathan, 1992); 6.8 to
10.12 in LR (Kumar et al., 1990; Chauhan et al.,
1993; Sharma and Singh, 1993); and 5.71 to 10.17
in LWY x LR (Sharma and Singh, 1993; Singh and
Devi, 1997; Sukhades et al., 1979;). Therefore, the
litter size at birth values obtained in the present
study for various subclasses of genetic factor was
well within the reported range.
A significant (P<0.01) effect of genetic
factor on litter size at birth in pigs has been
revealed by Least Squares Analysis of variance.
This is in accordance with the findings of Sharma
and Singh (1993), Pandey et al. (1996) and Singh
and Devi (1997, 1997a). Landrace and LWY x LR
had significantly (p<0.05) higher litter size at birth
than that in LWY and LR x D. Although, LWY x
LR had 0.336 higher litter size at birth than LR they
did not differ significantly due to the similar
managemental conditions followed for all the
genetic groups. Similarly, Landrace differ
significantly from Large White Yorkshire X
Landrace and Landrace x Desi for litter size at
birth. Least squares analysis of variance has found a
non-significant influence of period on Litter size at
birth in pigs. This is supported aptly by the findings
of Mishra et al. (1990). However, the significant
effect of period on litter size at birth has been
reported by Gupta et al. (1982). Similarly, non-
significant effect of parity on litter size at birth was
also found in present investigation. This is in synch
with the findings of Sukhdeo et al. (1979) who also
reported the non significant effect of parity on litter
size at birth in Large white Yorkshire, Landrace
and their crosses.
Litter Size at Weaning: The average litter size at
weaning of 5.304 0.245, 6.419 0.160, 6.719
0.214 and 5.444 0.242 respectively has been
revealed for LWY, LR, LWY x LR and LR x D
pigs. Highest and lowest litter size at weaning was
found in LWY x LR and LWY, respectively.
Erstwhile researchers have revealed the average
litter size at weaning of 5.1 to 8.4 in LWY
(Mohanty and Nayak, 1986; Goonewardene et al.,
1984) and value more than the finding of present
study has been found by Singh et al. (1977),
Sukhdeo et al. (1979), Sing et al. (1979 a), Gupta et
al. (1982), Goonewardene et al. (1984), Singh et al.
(1979); 4.2 to 7.3 in LR (Chauhan et al., 1993;
Sukhdeo et al., 1979) and value more than the
present study has been found by Siagian et al.
(1986), Mukhopadhyay et al. (1992), Sharma and
Singh (1993), Singh and Devi, 1997; 6.5 to 7.7 in
LWY x LR (Sukhdeo et al., 1979; Sharma and
Singh, 1993); and 5.52 to 6.00 in LR x D pigs
(Mukhopadhyay et al., 1992; Singh and Devi,

Frontier J. Vet. Anim. Sci.Vol. 4, No. 2 (July-Dec.) 2015 209
1997). These reports suggest the similarity in the
values obtained in our investigation.
Least squares analysis of variance has
revealed the significant (P<0.01) effect of genetic
group on litter size at weaving in pigs. Large White
Yorkshire x Landrace and Landrace had
significantly (p<0.05) higher litter size at weaning
than Large White Yorkshire and LR x D pigs.
Although Large White Yorkshire X Landrace had
0.300 higher litter sizes at weaning than Landrace
yet it did not differ significantly. This variation in
the present finding for same genetic groups might
be due to difference in managemental and
environmental conditions. Similar reports of
significant influence of genetic factor on litter size
at weaning was observed in LWY, LR and their
crosses (Sukhdeo et al., 1979); in indigenous, Large
White Yorkshire and their crosses (Goonewardene
et al., 1984); in exotic, desi pigs and their crosses
(Singh et al., 1990; Kumar et al., 1990); in
Landrace, Desi, Tomworth and their crosses
(Mukhopadhyay et al., 1992); in Desi, Landrace,
Tamworth and their various mating combination
groups (Sharma and Singh, 1993). Contrarily to the
present finding, the non-significant effect of genetic
factor on litter size at weaning has been found by
Mohanty and Nayak (1986) in Local, LWY and
their crosses and Chatterjee et al. (1988) in Desi,
LWY and their crosses. Least squares analysis of
variance presented a non-significant effect of period
on Litter size at weaning. This is supported by the
similar finding of Mishra et al. (1990). Contrast to
this, Gupta et al. (1982) has reported significant
effect of period on litter size at weaning. Similarly,
a non-significant effect of parity on litter size at
weaning has been found in this investigation by
least square analysis of variance. Similar to this
result, Sukhdeo et al. (1979) found a non-
significant influence of parity on litter size at
weaning in LR, LWY, Desi and their crossbreds.
Present study was undertaken to evaluate
the effect of genetic and non-genetic factors on
litter size of pig. Least Squares Analysis of data has
revealed the significant effect of genetic factor and
non-significant effect of environmental factors on
litter size. This result might be attributed to the
uniform housing, feeding, and other managemental
conditions provided to the different groups of pig.
Also, the higher litter size at birth and at weaning,
when compared to the previous reports, in some pig
breeds under this investigation, suggest the
importance of genetic factor in improving
reproductive efficiency of sows than non-genetic
factors. Although, this finding is of use in pig
rearing practices, Least Squares Analysis of more
data with additional environmental factors will
prove the importance of reducing/ eliminating non-
genetic factors in enhancing the returns on
investments in pig husbandry.
REFERENCES
Basic Animal Husbandry Statistics (BAHS). 2013.
Department of Animal Husbandry and
Dairying (DAHD), Government of India,
New Delhi.
Chatterjee J K, Majumder S C and Dutta Gupta R.
1988. Study on some pre-weaning traits in
Large White Yorkshire and crossbred
piglets under an intensive management.
Indian Vet. J, 65 (8): 683-686.
Chauhan V P S, Arora R L, Chhabra A K and Bhat
P N. 1993. Litter traits and litter weights of
Landrace pigs in India. Indian Vet. J, 70:
29-31.
Goonewardene L A, Sahayaruban P, Rajamahendran
R and Rajaguru A S B. 1984. A study of
some production traits among indigenous
pigs in Sri Lanka and its crosses with
improved white breeds. World Rev. Anim.
Breed. Abstr, 53 (8): 5120.
Gupta R N, Pormar S N S, Johar K S and Dhingara
M N. 1982. Effects of sire, sex and year on
birth weight of Large White Yorkshire
pigs. Indian Vet. J, 59 (4): 289-291.
Harvey W R. 1966. Least Squares Analysis of data
with unequal subclass numbers. Agric. Resi.
Services, U.S. Dept. Agriculture, 20:8.
Jayarajan S and Ulaganathan V. 1992. Non-genetic
factors affecting performance of pigs.
Indian J. of Ani. Sci, 62: 899-903.

Frontier J. Vet. Anim. Sci.Vol. 4, No. 2 (July-Dec.) 2015 210
Kumar S, Singh S K, Singh R L, Shanna B D, Dubey
C B and Venna S S. 1990. Effects of
genetic and non-genetic factors on body
weight effecting of feed utilization,
reproductive performance and survivability
in Landrace, Desi and their halfbreds.
Indian J. of Ani. Sci, 60: 219 - 1223.
Mishra R R, Prasad S and Lal K. 1990. A study on
variation in birth weight of Large White
Yorkshire piglets under farm conditions.
Indian Vet. J, 67: 619-622.
Mohanty S and Nayak J B. 1986. Reproductive
performance of Large White Yorkshire and
their crosses with indigenous pigs in hot
humid climate of Orissa: A note. Indian J.
of Ani. Prod. and Man, 2 (3): 134-137.
Mukhopadhyay A, Singh R L and Singh S K. 1992.
A comparative study on the effect of
genetic and non-genetic factors of
Landrace, Tamworth, Desi pigs and their
crosses on some reproductive characters.
Indian J. of Ani. Sci, 62: 482-484.
Pandey R N, Singh S K and Dubey C B. 1996. A
genetic study of reproductive traits in
various genetic groups of pigs. Indian J. of
Ani. Sci, 66 (2): 198-200.
Sharma B D and Singh S K. 1993. Effect of genetic
and non-genetic factors on reproductive
performance of Landrace, Large White
and Desi pigs and their crosses. Indian J.
of Ani. Sci, 63 (2): 208-211.
Siagian P H, Argan V C, Alcantura P F, Aquino A
G and Millena R J. 1986. The reproductive
performance of Yorkshire, Landrace and
Duroc breeds of swine. Philippine
Agriculturist, 69 (1): 53-62.
Singh B, Khanna J M, Khan A S and Shukla B R.
1979. Reproductive performance of certain
exotic breeds of swine under tropical
climate. Indian J. of Ani. Health, 18 (2):
17-20.
Singh K I, Singh R L, Singh S K, Sharma B D and
Dubey C B. 1990. Reproductive traits and
mortality rate in pigs. Indian J. of Ani. Sci,
60: 886-887.
Singh R N, Pandey R S and Biswas S C. 1977. A
study of some of the economic characters
of Yorkshire pigs under farm conditions.
Indian Vet. J, 54 (3): 175-179.
Singh S K and Devi A A. 1997. Performance of
reproductive traits in various genetic
groups of pigs. Indian J. of Ani. Sci, 67
(11): 1021-1022.
Singh S K and Devi A A. 1997a. Studies on some
preweaning traits in exotics, Desi and their
crossbred pigs under tropical climate.
Indian Vet. Med. J, 21 (12): 288-292.
Sukhdeo, Raina B L and Bhat P N. 1979. Studies on
some reproductive traits in Landrace, Large
white and their halfbreds. Indian J. of Ani.
Sci, 49: 807-811.


