Embed Size (px)
Citation preview

Market Assessment ofEFFICIENT ELECTRIC COOKINGAPPLIANCES IN NEPAL

This report is prepared by Practical Action Nepal Office with the financial and technical support of the Modern Energy Cooking Services (MECS) programme. The MECS programme is funded by the UK Aid and managed by Loughborough University, UK. The programme aims to leverage investment in renewable energy, both on-grid and off-grid, to address the clean cooking challenge by integrating modern energy cooking services into the electricity access, quality, reliability and sustainability plans. The following individuals and organisations contributed to prepare this report:
Members of Research Team from Practical Action Mr Min Bikram Malla, Team Leader and Economist (Project Manager) Ms Pooja Sharma, Energy Policy Expert (Energy Thematic Lead) Ms Monisha Shrestha, Market System Expert Mr Subarna Prasad Kapali, Electric Cooking Expert (Consultant) Ms Swasti Aryal, Consultant (Engineer) Ms Preshika Baskota, Data Entry and Management Consultant
Partner NGOs for coordination of field survey Sundar Nepal, Surkhet Development Concern Society, Rolpa Environment Protection Centre, Saptari
Contributors and Reviewers Mr Sher Singh Bhat, Power Sector Expert Ms Manjari Shrestha, Senior Project Officer, Practical Action Mr Vishwa B Amatya, Energy Expert
Stakeholder Reviewers Mr Richard Sieff, Ms Melinda Barnard and Ms Karin Tranccoso, MECS Mr Daniel Fuchs and Mr Bhusan Chandra Adhikari, GIZ EnDev Ms Karuna Bajracharya, CCA Mr Govinda Khanal, Mr Rabin Shrestha and Ms Nisha Jaishwal, Winrock
ACKNOWLEDGEMENTS
i

Copyright © Practical Action, 2021
Editing: Anil Shrestha, PagePerfectGraphic design and layout: PagePerfectReviewer: Prabin Gurung
Published by: Practical Action Nepal Office
Disclaimer : This report is funded by the UK Aid; however, the views expressed in the report do not necessarily reflect the UK government's official policies.
ii

CONTENTS
Abbreviations and Acronyms ....................................................................................................... vi
Executive Summary ......................................................................................................................viiiBackground ................................................................................................................................................................ viiiMethodology .............................................................................................................................................................. viiiFindings ........................................................................................................................................................................ xiRecommendations ........................................................................................................................................................x
1. Introduction ...................................................................................................................................11.1 Background .............................................................................................................................................................. 11.2 Objectives .................................................................................................................................................................21.3 Research Questions .................................................................................................................................................21.4 Rationale of the Study ............................................................................................................................................31.5 Limitations of the Study .........................................................................................................................................3
2. Study Methodology ...................................................................................................................... 42.1 Study Framework ....................................................................................................................................................42.2 Data Collection Methodology ...............................................................................................................................5
2.2.1 Geographic focus ...........................................................................................................................................52.2.2 Research methods and tools ........................................................................................................................6
2.3 Data Analysis .........................................................................................................................................................10
3. Enabling Environment .............................................................................................................. 113.1 Plans and Policies ................................................................................................................................................. 11
3.1.1 Federal plans and policies ........................................................................................................................... 113.1.2 Provincial plans and policies......................................................................................................................123.1.3 Local plans and policies .............................................................................................................................. 13
3.2 Regulatory Framework ........................................................................................................................................ 133.2.1 Tariff structure .............................................................................................................................................. 133.2.2 Standards ...................................................................................................................................................... 14
3.3 Analysis and Conclusion ..................................................................................................................................... 14
4. Financing Ecosystem .................................................................................................................154.1 Public Funding ...................................................................................................................................................... 154.2 Financing by Banks and Financial Institutions ............................................................................................... 174.3 Private Sector Involvement in Cookstove Sector and Financing .................................................................. 174.4 Analysis and Conclusion ..................................................................................................................................... 17
iii

5. Key Stakeholders ........................................................................................................................185.1 Market Enablers ....................................................................................................................................................185.2 Development Organisations ............................................................................................................................... 19
5.2.1 International development partners ......................................................................................................... 195.2.2 Civil society organisations ......................................................................................................................... 19
5.3 Programmes, Projects and Research on Electric Cooking ............................................................................. 195.3.1 Programmes and projects ........................................................................................................................... 195.3.2 Studies ...........................................................................................................................................................215.3.3 Development of standards on e-cooking .................................................................................................21
5.4 Analysis and Conclusion .....................................................................................................................................22
6. Electricity Supply Status and Plan ......................................................................................... 236.1 Electricity Access Situation .................................................................................................................................236.2 Electricity Generation Situation .........................................................................................................................236.3 Status of Transmission System...........................................................................................................................256.4 Status of Distribution System .............................................................................................................................266.5 Status of Electricity Connection in Households ..............................................................................................276.6 Environmental Impact of Electricity Generation and Distribution ..............................................................286.7 Analysis and Conclusion ......................................................................................................................................28
7. Supply Chain of E-cooking Appliances ................................................................................. 307.1 Product: E-cooking Appliances ..........................................................................................................................307.2 Supply Chain/System of E-cooking Appliances ..............................................................................................30
7.2.1 Supply status of electric stoves ...................................................................................................................307.2.2 Supply system of utensils ............................................................................................................................ 31
7.3 Prices of EECAs ..................................................................................................................................................... 317.4 Market Trends ........................................................................................................................................................327.5 Competition ............................................................................................................................................................327.6 Entry Barriers for Suppliers .................................................................................................................................337.7 Issues and Challenges for Supply Chain Actors ...............................................................................................337.8 Support Services ....................................................................................................................................................34
7.8.1 Repair and maintenance service centres ...................................................................................................347.8.2Stove-testing centre and quality assurance ..............................................................................................347.8.3 Promotion services .......................................................................................................................................34
7.9 Analysis and Conclusion ......................................................................................................................................34
8. Consumer Preferences .............................................................................................................. 358.1 Status of Cooking Fuel/Stove in Use ..................................................................................................................358.2 Expenditure on Cooking Fuel .............................................................................................................................36
8.2.1 Annual fuel consumption ...........................................................................................................................368.2.2 Expenditure on cooking fuel......................................................................................................................368.2.3 Fuel collection time ..................................................................................................................................... 37
8.3 Main Food Items ................................................................................................................................................... 378.4 Electric Appliances in Use ...................................................................................................................................388.5 Preferences and Need ...........................................................................................................................................38
8.5.1 Interest to switch to e-cooking ..................................................................................................................388.5.2 Motivation towards e-cooking ..................................................................................................................39
iv

8.6 Capacity and Willingness to Pay of Consumers ...............................................................................................418.6.1 Willingness to pay ........................................................................................................................................418.6.2 Capacity to pay .............................................................................................................................................42
8.7 Potential Demand for EECAs in Nepal ..............................................................................................................448.8 Analysis and Conclusion .....................................................................................................................................45
9. Conclusion: Potential for E-cooking in Nepal ..................................................................... 469.1 Enablers and Barriers in E-cooking .................................................................................................................. 479.2 Transition to E-cooking Scenario ...................................................................................................................... 47
10. Recommendations ................................................................................................................... 49
References ........................................................................................................................................51
Annex 1: Research Matrix ............................................................................................................. 53
Annex 2: Key Stakeholders of E-cooking Sector in Nepal ......................................................55
Annex 3: Distribution System Upgrading Works .................................................................... 56
Annex 4: E-cooking Appliances Brands Available in Nepali Market .................................. 58
Annex 5: List of Persons and Organisations Consulted ......................................................... 59
v

ABBREVIATIONS AND ACRONYMSABF Ajummery Bikas Foundation
ADB Asian Development Bank
AEPC Alternative Energy Promotion Centre
BCT Brahmin, Chhetri, Thakuri
BEST Biomass Energy Strategy
BFIs Banks and financial institutions
CBS Central Bureau of Statistics
CCA Clean Cooking Alliance
CG Chaudhary Group
CLASP Collaborative Labelling and Appliance Standards Programme
CO2 Carbon dioxide
COVID-19 Corona Virus Disease 2019
CREE Community Rural Electrification Entity
CREF Central Renewable Energy Fund
CSOs Civil Society Organisations
DFID Department for International Development
E-cooking Electric Cooking
EECAs Efficient Electric Cooking Appliances
EnDev Energising Development
ERC Electricity Regulatory Commission
FCDO Foreign, Commonwealth & Development Office
FY Fiscal Year
GHG Green House Gas
GIZ Deutsche Gesellschaft für Internationale Zusammenarbeit
GON Government of Nepal
GW Giga Watt
GWh Giga Watt Hour
HAP Household Air Pollution
HH Household
ICS Improved Cooking Stove
INGOs International Non-governmental Organisations
IPPs Independent Power Producers
IRADE Integrated Research and Action for Development
vi

ISO International Organization for Standardization
kg Kilogram
KII Key Informant Interview
kV Kilovolt
kWh Kilowatt-hour
LFIs Local Financial Institutions
LPG Liquefied Petroleum Gas
MFIs Microfinance Institutions
MoEWRI Ministry of Energy, Water Resources and Irrigation
MoFE Ministry of Forests and Environment
MoICS Ministry of Industry, Commerce and Supplies
MTF Multi-Tier Framework
MVA Megavolt Amperes
MW Megawatt
NACEUN National Association of Community Electricity Users Nepal
NAMA Nationally Appropriate Mitigation Action
NBSM Nepal Bureau of Standards and Metrology
NEA Nepal Electricity Authority
NEF Nepal Energy Foundation
NPC National Planning Commission
NPR Nepali Rupees
NREP Nepal Renewable Energy Programme
PAC Practical Action Consulting
PEEDA People, Energy & Environment Development Association
PV Photovoltaic
RE Renewable Energy
RERA Renewable Energy for Rural Areas
SDGs Sustainable Development Goals
SE4ALL Sustainable Energy for All
SLREC Southern Lalitpur Rural Electric Cooperative
SMEs Small and Medium Enterprises
UNCDF United Nations Capital Development Fund
UNDP United Nations Development Programme
UNFCC United Nations Framework Convention on Climate Change
VAT Value Added Tax
WHO World Health Organization
WoNEE Women Network for Energy and Environment
vii

EXECUTIVE SUMMARY
This study explores the market opportunities for efficient electric cooking appliances (EECAs) in Nepal. Practical Action carried out this research on behalf of Loughborough University under the Modern Energy Cooking Services (MECS) programme. MECS is a five-year programme funded by the UK Aid (FCDO). It aims to break out the business as usual cycle to accelerate the transition from biomass to clean cooking (i.e. with electricity or liquefied petroleum gas, or LPG). By integrating modern energy cooking in the electricity access planning, MECS intends to leverage investments in renewable energy, both on-grid and off-grid, by addressing the issues of quality, reliability and sustainability.
BackgroundMajority of households in Nepal, especially in rural areas, use solid biomass fuel, mainly firewood, for cooking. In most cases, firewood is burnt on inefficient traditional cookstoves. This emits unacceptable levels of household air pollution (HAP), causing more than 22,500 premature deaths every year (WHO, 2016) and loss of productive time of more than 710,000 disability-adjusted life years (DALYs) annually. Electric cooking (e-cooking) is seen as one of the preferred options in Nepal to address HAP, improve health, and reduce the import of LPG. With the recent improvement in electricity supply and likely power surplus in the days to come, e-cooking is gradually gaining attention and is found critical for the utilisation of indigenous hydroelectricity in the country in the long run.
This study aims to understand the opportunities for an e-cooking market system in Nepal by accumulating the knowledge of market intelligence scattered over multiple agencies. It will also provide a basis for developing a strategy for scaling up e-cooking, which will help to reduce the health problems caused by HAP, CO2 emissions, deforestation and trade deficit as well as increase the internal consumption of electricity.
MethodologyThe study is focused on the market potential for EECAs, such as infrared cooktops, induction cooktops, and electric pressure cookers. The market system approach is used as a research framework. The framework considers multiple aspects of a market system, leading to the identification of missing or weak functions and links in the market. The market assessment includes a comprehensive analysis of the three levels of a market system: i) market enablers; ii) market actors; and iii) market service providers. Mainly ten issues of e-cooking market system have been looked at in depth: (i) enabling environment; (ii) stakeholder analysis; (iii) mapping of e-cooking programmes/projects; (iv) electricity supply status; (v) supply of e-cooking appliances; (vi) demand-side analysis; (vii) financial ecosystem; (viii) status of support services; (ix) environmental impact; and (x) possibility of e-cooking in Nepal.
Using standard structured checklists, consultations were carried out at federal, provincial and local levels. Provincial-level consultations were held in Province 2, Lumbini and Karnali provinces, while local-level consultations were held in six sampled municipalities in these provinces. Likewise, a household survey was carried out in 310 households in the sampled municipalities.
viii

FindingsEnabling environment: The electric cookstove market in Nepal is at an early stage of development. The country managed to get rid of power cuts in 2018, and a supply surplus is expected in the near future. This has increased the political will and interest among all three tiers of government to promote e-cooking as a feasible clean cooking solution. E-cooking is currently one of the priorities of the government to achieve the vision of ‘smokeless kitchen’ and replace solid biomass-based cooking with e-cooking, thereby reducing the import of LPG. Various fiscal incentives have been announced by federal, provincial and local governments to promote e-cooking with new appliances like induction, infrared cooktop, electric pressure cooker, etc.
Financial ecosystem: The availability of public funds for e-cooking is increasing, but it is still inadequate to achieve large upscaling. The gap between ambition and resource allocation is evident. Private sector investments are also increasing, leading to expansion of trade and services. Banks and financial institutions (BFIs) perceive the sector as no different from any other sectors. Microfinance institutions (MFIs) and cooperatives are highly interested to provide loans for buying e-cooking products. A few MFIs have already started providing loans. Availability of credit services is found to influence the purchasing behaviour of households.
Stakeholder engagement: The stakeholder engagement from different sectors seems satisfactory. There is increased interest of government organisations, international and national development organisations, private sectors, and civil society. The organisations working for the alleviation of HAP see e-cooking as the best option for Nepal. Likewise, stakeholders from electricity supply see it as an excellent option for increasing electricity consumption, but they are concerned about the implications on the peak hours. There is definitely a need for increasing stakeholder engagement in terms of awareness raising, capacity building, financing, research, and promotion of e-cooking. There is a lack of coordination and collaboration between different organisations working in e-cooking promotion. Therefore, there should be proper coordination between organisations working in energy, health, environment, gender and social inclusion, and income-generating sectors.
E-cooking programmes and projects: The number of programmes and projects on the promotion, research and capacity building in e-cooking has been increasing since 2018. Alternative Energy Promotion Centre (AEPC) is working in partnership with local governments, with focus on the southern plain areas, to promote e-cooking. However, there is no clear subsidy policy. The incentives or subsidies provided by different programmes and projects are not uniform. It creates confusion and disrupts the natural market growth. Compared to the need and aspiration, the existing projects have very low targets.
Electricity supply: Electricity is expected to be cheaper with substantial increase in the generation capacity in the near future. At present, Nepal has about 1,200 megawatts (MW) of installed capacity of electricity. The government's target is to achieve 15,000 MW by 2030. Currently, there are 172 projects, with a total capacity of 4,642 MW, at different stages of construction after obtaining licence for electricity generation (White Paper). Therefore, to meet the demand for e-cooking, the transmission and distribution systems will have to be improved by upgrading transformers and conductors. Likewise, frequent power cuts due to damage to the supply system and transformer overload will have to be tackled and peak load better managed in order to promote e-cooking on a larger scale.
Stove supply-side analysis: The electric cook stove market is at an early stage of development and is slowly expanding. Although e-cooking technologies are constantly evolving, they are concentrated only in big cities. Retail networks in peri-urban and rural areas are weak and limited. The supply chain of electric cooktops (e-cooktops) and compatible utensils needs to be strengthened in different parts of the country. In rural areas, entrepreneurs have low risk-taking appetite and capacity. The private sectors see lots of challenges to demand creation. There is also a need to address local retailers’ perceived risks to leverage their investments in the e-cooking business. Timely availability of repair and maintenance services for e-cooking
ix

appliances must be in place to increase the confidence of customers. Nevertheless, there is a need to improve and ensure adequate demand for e-cooking.
Demand-side analysis: The awareness of HAP is increasing; therefore, the aspiration for clean cooking solutions is growing. However, for majority of households, switching to e-cooking as a preferred solution comes with lots of hurdles. E-cooking is a new and relatively unknown concept for a large number of households. Poor wiring, inadequate meter capacity, and a lack of knowledge of electrical safety are the common problems faced by consumers. Moreover, consumers do not have full confidence in the reliability of electricity supply, which can hinder the uptake and sustainability of e-cooking. The availability of good quality EECAs and timely and readily available repair and maintenance services are the key factors that drive consumer choice. The current electricity distribution system is also not designed to bear the load of e-cooking. Therefore, substantial investment is required to upgrade the electricity distribution system.
From a running cost perspective, e-cooking is cheaper than LPG and other available options. When EECAs are used as primary cookstove, electricity bills come to around NPR 617 per month (NPR 37,030 for a five-year period) per household. The amount is beyond the capacity of poor families, as it makes up more than 5 percent of their total monthly expenditures. Moreover, poor households who collect fuel wood for cooking do not account for the time cost of collecting fuel wood. For other groups, the spending on LPG seems within capacity and willingness to pay. LPG users seem to be early adopters of e-cooking as they are aware of the benefits of clean cooking. HAP is much higher with the use of solid biomass fuel; therefore, development organisations should support the households shifting from solid biomass fuel to e-cooking.
Environmental impact: The main source of electricity in Nepal is hydropower; therefore, the greenhouse gas (GHG) emission from e-cooking is negligible. There is a high potential for replacing solid biomass fuel with electricity for cooking, which will significantly reduce the CO2 emission (over 2.8 ton/HH/year). Considering the high number of firewood users in Nepal (around 4.5 million households), the potential for reducing carbon emission through e-cooking is very high.
Potential for e-cooking in Nepal: Our research findings indicate that, considering the present electricity supply infrastructures, market system and demand for electric cooking appliances, there is a possibility for uptake of about 410,000 EECAs by 2023/24. A much faster transition and greater uptake are possible if significant investments are made and electricity distribution system and electricity access rate with demand-side management are improved.
RecommendationsThe two most critical issues that need to be addressed for unlocking the high potential for e-cooking in Nepal are: (i) improving the reliability of electricity supply; and (ii) revising the tariff to encourage e-cooking, i.e. increasing the quantity of units in the lower bands to accommodate the additional demand created by e-cooking. Similarly, the electricity distribution infrastructure needs to be improved to sustain the demand for e-cooking. In addition, a national clean cooking strategy is urgently required to facilitate coherent planning and investment, clarify the roles of different tiers of government, and to facilitate multiple stakeholder coordination to upscale e-cooking. Engagement of local governments is also very important in the promotion of e-cooking.
x
1. INTRODUCTION
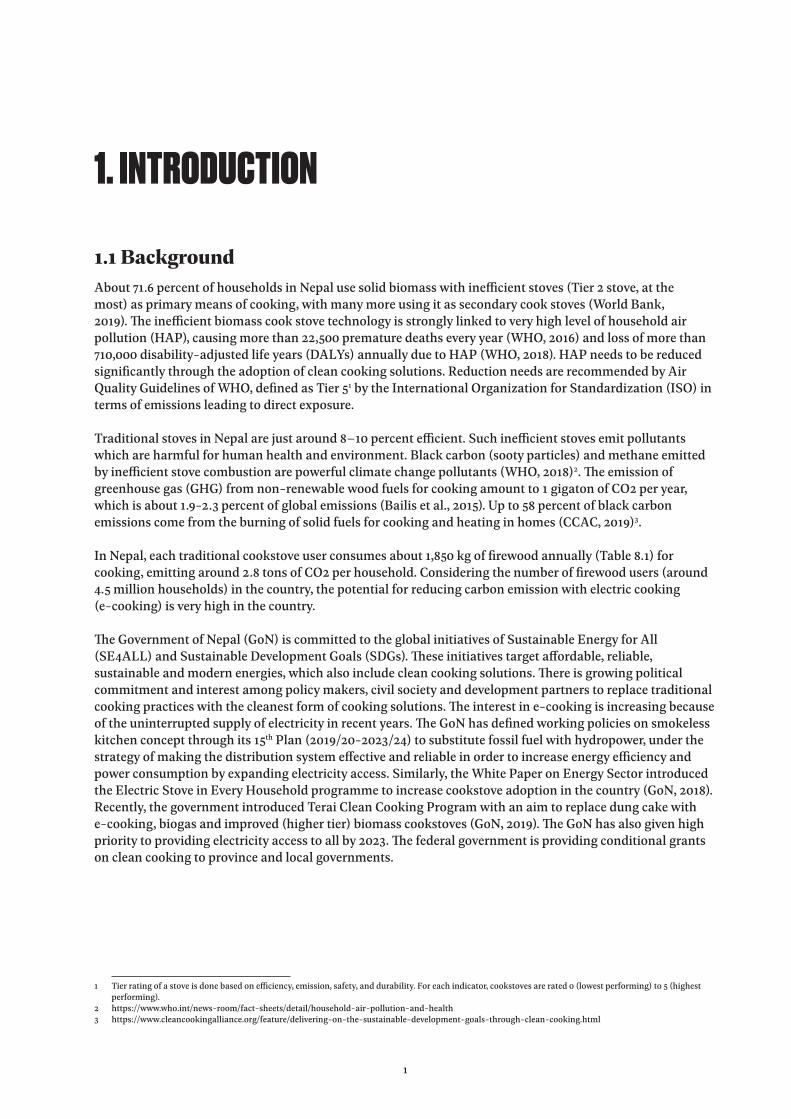
1.1 BackgroundAbout 71.6 percent of households in Nepal use solid biomass with inefficient stoves (Tier 2 stove, at the most) as primary means of cooking, with many more using it as secondary cook stoves (World Bank, 2019). The inefficient biomass cook stove technology is strongly linked to very high level of household air pollution (HAP), causing more than 22,500 premature deaths every year (WHO, 2016) and loss of more than 710,000 disability-adjusted life years (DALYs) annually due to HAP (WHO, 2018). HAP needs to be reduced significantly through the adoption of clean cooking solutions. Reduction needs are recommended by Air Quality Guidelines of WHO, defined as Tier 51 by the International Organization for Standardization (ISO) in terms of emissions leading to direct exposure.
Traditional stoves in Nepal are just around 8–10 percent efficient. Such inefficient stoves emit pollutants which are harmful for human health and environment. Black carbon (sooty particles) and methane emitted by inefficient stove combustion are powerful climate change pollutants (WHO, 2018)2. The emission of greenhouse gas (GHG) from non-renewable wood fuels for cooking amount to 1 gigaton of CO2 per year, which is about 1.9-2.3 percent of global emissions (Bailis et al., 2015). Up to 58 percent of black carbon emissions come from the burning of solid fuels for cooking and heating in homes (CCAC, 2019)3.
In Nepal, each traditional cookstove user consumes about 1,850 kg of firewood annually (Table 8.1) for cooking, emitting around 2.8 tons of CO2 per household. Considering the number of firewood users (around 4.5 million households) in the country, the potential for reducing carbon emission with electric cooking (e-cooking) is very high in the country. The Government of Nepal (GoN) is committed to the global initiatives of Sustainable Energy for All (SE4ALL) and Sustainable Development Goals (SDGs). These initiatives target affordable, reliable, sustainable and modern energies, which also include clean cooking solutions. There is growing political commitment and interest among policy makers, civil society and development partners to replace traditional cooking practices with the cleanest form of cooking solutions. The interest in e-cooking is increasing because of the uninterrupted supply of electricity in recent years. The GoN has defined working policies on smokeless kitchen concept through its 15th Plan (2019/20-2023/24) to substitute fossil fuel with hydropower, under the strategy of making the distribution system effective and reliable in order to increase energy efficiency and power consumption by expanding electricity access. Similarly, the White Paper on Energy Sector introduced the Electric Stove in Every Household programme to increase cookstove adoption in the country (GoN, 2018). Recently, the government introduced Terai Clean Cooking Program with an aim to replace dung cake with e-cooking, biogas and improved (higher tier) biomass cookstoves (GoN, 2019). The GoN has also given high priority to providing electricity access to all by 2023. The federal government is providing conditional grants on clean cooking to province and local governments.
1 Tier rating of a stove is done based on efficiency, emission, safety, and durability. For each indicator, cookstoves are rated 0 (lowest performing) to 5 (highest performing).
2 https://www.who.int/news-room/fact-sheets/detail/household-air-pollution-and-health3 https://www.cleancookingalliance.org/feature/delivering-on-the-sustainable-development-goals-through-clean-cooking.html
1

The GoN aims to reduce the import of LPG by 40 percent by 2030 (GoN, 2017). The issue was highlighted after the economic blockade in 2015, when Nepal realised that full dependency on fuel import results in high economic cost to the nation, including intentional irregular supply of fuels.
E-cooking is regarded as the best alternative to LPG as it provides a cleaner cooking solution, apart from environmental and economic benefits. Furthermore, it is considered as the best solution to health implications of the existing cooking practices and probable electricity surplus scenario in Nepal and the growing import of LPG. There is very high positive impact of e-cooking in terms of protection of human health and the environment from the adverse effects of HAP. Cooking on efficient electric appliances (e-appliances), such as induction stove, is much cheaper than cooking on traditional biomass and LPG stoves (CCA, 2021; Nakarmi, 2019). However, there is little evidence of opportunities for e-cooking, potential market size and gaps in e-cooking appliances in the market system in Nepal.
In this context, this study aims to understand the e-cooking market by accumulating knowledge and gathering market intelligence scattered over multiple agencies to highlight the opportunities for the development of an e-cooking market system in Nepal. This study provides a basis on which strategies and next steps for scaling up e-cooking outreach can be developed, which will then contribute to reduce the health problems caused by HAP, along with GHG emissions, deforestation and trade deficit.
1.2 ObjectivesThe study aims to provide a comprehensive overview of the e-cooking market in Nepal and the opportunities for e-cooking, which will contribute to the development of an e-cooking promotion strategy and programme design. The specific objectives of the study are as follows:
Review the readiness of the existing policies and plans in the clean cooking sector for e-cooking. Identify key stakeholders of the e-cooking sector and assess interlinkages, roles, interests, and incentives. Map the e-cooking programmes and projects. Evaluate the capacity of electricity supply and distribution networks for responding to the potential load
of e-cooking in the future. Analyse the supply side of e-cooking appliances. Assess the demand for different e-cooking appliances. Assess the financing ecosystem for household cooking energy and electricity access sector.
1.3 Research QuestionsThe major research questions that underlie our study are: Are the existing policy and regulatory frameworks sufficient for scaling up e-cooking outreach? Who are the key stakeholders and how do their roles, interests and incentives impact the development of
an e-cooking market in Nepal? What are the learning of e-cooking energy programmes and projects? How do these programmes and
projects enable or do not enable opportunities for e-cooking in Nepal? Is the electricity supply side ready for the future load of e-cooking? How does this vary by province? How
does this vary if off-grid electricity is used? What is the status of the supply chain of e-cooking appliances? What is the readiness of the supply chain
for increased uptake of e-cooking?
2

Will there be adequate demand for e-cooking appliances in Nepal? What should be done to augment the demand?
What is the financial ecosystem for e-cooking promotion in Nepal? Is it sufficient for scaling up e-cooking outreach?
1.4 Rationale of the StudyThe outcomes of the research will be a key milestone for upscaling e-cooking solutions in Nepal and achieve the objectives of the Modern Energy Cooking Services (MECS) programme. The study will contribute to understand and promote cost-effective access to modern energy and clean cooking solutions, thereby overall livelihood improvement. In this way, it is expected to contribute to achieving GoN’s objective of smokeless kitchens in all households and substitute the use of fossil fuels with hydroelectricity. It will also contribute to achieving the priorities of Foreign, Commonwealth & Development Office (FCDO), like tackling extreme poverty and promoting global prosperity. This research assesses the overall market system of e-cooking in Nepal, which includes the supply chain of cooking appliances, demand, electricity, enabling environment, and support services.
It is expected that the study findings will be useful to formulate a policy and programmes, support private sectors to explore business opportunities, advance an advocacy agenda and identify programme themes for civil society organisations (CSOs), widen research horizon to researchers and academia, and devise appropriate financing products for financial institutions. Furthermore, the study findings will be useful for improving the value for money for the donors in this sector.
1.5 Limitations of the StudyThe study is based on a sample survey of 310 households in one municipality each from six districts in three provinces, viz. Province 2, Lumbini and Karnali. Although the survey sites were selected based on socioeconomic and geographical diversities to make this study more inclusive, it may not represent the whole country scenario due to small sample size. Likewise, majority of the surveyed households were not practising e-cooking.
3

2. STUDY METHODOLOGY
2.1 Study FrameworkThe research framework is based on the market system approach. This approach considers all aspects of a market system and helps find missing or weak functions in the market. The market actors comprise the private sector businesses and public sectors active in the various layers of supply of electric cooking appliances, utensils and electricity. Within the market system approach, the key market actors can be grouped into the following levels or categories:
Market enablers: enabling environment (policy, regulation, financing, etc.) Market actors: supply chain of fuel and stoves (demand and supply) Service providers: support services (availability of financing, e-cooking accessories, maintenance
services, transportation, etc.)
The overall market system of electric cookstoves in Nepal is illustrated in Figure 2.1.
Figure 2.1: Market system map of efficient electric cooking appliances
Source: CCA (2021)
The market assessment includes a comprehensive analysis of the three levels of the market system. For a vibrant and sustainable market, linkages between the market system actors should be strong and the policy environment should be favourable. Therefore, the study collected information on the gaps and identified the leverage points in the existing market system of e-cooking appliances, using the market system approach/analysis. Mainly, ten themes of the e-cooking market system have been identified as important factors from the market system map, based on literature review and preliminary consultations, which were further analysed in depth as below:
4

Enabling environment Stakeholder analysis Mapping of e-cooking programmes and projects Electricity supply status Supply of e-cooking appliances Demand-side analysis Financial ecosystem Support services status Environmental impact, and Possibility of e-cooking in Nepal
The scope, objectives, research methods and tools, and sources of information are described in Annex 1: Research Matrix.
2.2 Data Collection MethodologyThe assessments are based on primary and secondary information collected during November 2020-March 2021 through various means, which are described below. The views expressed in this report are based on the information available during the research period and do not take into account any subsequent changes. In addition to secondary information, to meet the specific needs of this research, information was collected through the primary data collection method. The information collected from the two sources complemented each other. It also helped to cross verify the information and gain a representative perspective. A research matrix (see Annex 1) was developed as a guide to carry out an assessment. It presents a comprehensive outlay of the research questions, themes of interest, data acquisition methodology, information sources, and potential respondents for the study. Literature review, central-level consultations, and data analysis were carried out by Practical Action, whereas; provincial and local-level information collection was done by local partner NGOs, viz. Sundar Nepal, Surkhet, Development Concern Society (DECOS), Rolpa, and Environment Protection Centre, Saptari, under close supervision and guidance of the research team.
2.2.1 Geographic focusFor primary information collection, three provinces, viz. Province 2, Lumbini and Karnali (shown in Map 1) were selected for an inclusive sample survey as these provinces represent different climatic, geographic, and socioeconomic diversities, and road and communication access, along with different cooking fuel or stove users in Nepal.
Province 2 represents the southern plain areas of eastern Nepal, Lumbini province represents southern plains and mid hills, and Karnali province represents western hill and mountain areas.
5

2.2.2 Research methods and toolsThe research methods and tools of the study are summarised below.
a. Desk review: Relevant plans, policies, targets, and regulations at different levels of government influence e-cooking promotion in Nepal. Different case studies on the implementation and cost-benefits of e-cooking were reviewed, along with content analysis of all relevant documents.
b. Stakeholder mapping and analysis: A stakeholder mapping was conducted to identify the key stakeholders whose acts could positively or negatively impact e-cooking. Participatory Market System Development approach was used to map the relevant stakeholders and value chain actors in Nepal’s e-cooking sector.
c. Consultations: Federal, provincial and local-level consultations were carried out with the key stakeholders from energy and clean cooking sectors, including e-cooking, using standard sem-structured checklists, as described below.
Central-level consultations Government institutions: Nepal Electricity Authority (NEA) and Alternative Energy Promotion
Centre (AEPC) Organisations active in e-cooking promotion and research: Winrock, SNV, GIZ EnDev,
Clean Cooking Alliance (CCA), Ajummery Bikas Foundation (ABF), National Association of Community Electricity Users Nepal (NACEUN), and People, Energy & Environment Development Association (PEEDA)
Private sector: Chaudhary Group
CHINA
INDIA
Sudurpashchim
Karnali
Lumbini
Gandaki
Bagmati
Province No.1Province No.2
Map: Primary information collection areas in the map of Nepal
6

Province-level consultationsProvincial-level consultations were held using checklists with key stakeholders, listed below, from Province 2, Lumbini and Karnali provinces.
Ministry of Physical Infrastructure Development Provincial Office of AEPC Ministry of Industry, Tourism, Forest and Environment Ministry of Social Development Provincial Planning Commission NEA Provincial Office E-cooking appliances supplier (importers/wholesalers/retailers) Biomass stove supplier
Municipality-level consultations Municipality-level consultations, focus group discussions (FGDs) and household surveys were held in a municipality in each of the six districts (see Table 2.1).
Table 2.1: Details of survey sitesProvinces Districts Municipalities
KarnaliSurkhet Birendranagar MunicipalityDailekh Guransh Rural Municipality
LumbiniRolpa Rolpa MunicipalityDang Shantinagar Rural Municipality
Province 2Dhanusha Dhanushadham MunicipalityMahottari Pipra Rural Municipality
At municipality level, the following activities were performed: Interview with municipality chairperson or vice chairperson Data collection from municipality office Interview with Community Rural Electrification Entity (CREE) or NEA local distribution centre Interview with local e-cooking appliance retailers Interview with a local financial institution
d. Focus group discussions were held with users and non-users of e-cooktop stoves in Dhanusa, Mahottari, Rolpa, Dang, Surkhet, and Dhailekh districts as follows:(i) Women group (1) x 2 municipalities(ii) Disadvantaged group (1) x 2 municipalities(iii) Community forest users group (1) x 2 municipalities
In the FGDs, efforts were made to understand the existing cooking practices and analyse the participants’ readiness to adopt e-cooking, using a checklist. The research team was able to gather qualitative data and in-depth insights. Information was collected on the beliefs and perceptions to know true customer preferences, attitudes and opinions.
7

e. Household survey: Household surveys were carried out in 310 households having electricity access and who were immediate potential customers of EECAs in the six sampled municipalities (Table 2.2).
Table 2.2: Population of surveyed municipalities and sampled householdsMunicipalities Total population Total households (no.) Sampled households (no.)Birendranagar Municipality 115,451 29,216 66Guransh Rural Municipality 23,725 3,978 44Rolpa Municipality 33,292 7,133 68Shantinagar Rural Municipality 25,203 5,328 32Dhanushadham Municipality 45,585 8,715 58Pipra Rural Municipality 31,500 5,400 42Total 310
Source: Municipality offices concerned, Survey 2020
The household survey was mainly focused on collecting information on usage of fuel and stove by their types, access to electricity, quality of electricity connection and wiring, electrical safety, willingness and capacity to pay, etc., using a household survey questionnaire. Additionally, quantitative information was collected on demographic, socioeconomic and energy access.
Sampling methodology for household survey: The sampled households were selected using the stratified purposive sampling method. Nepal has diverse settlements in terms of ethnicity, religion, geography, remoteness, income level, and access to resources. Each of them may have distinct needs and choices. Therefore, it is necessary to include them all. So, stratification was done on the basis of gender of household head, ethnicity, income level, electricity access, and cooking fuel used, as described below.
A. Gender of household headIn Nepal, about 25.9 percent of households are female headed (CBS, 2016). Considering this, an effort was made to maintain the same ratio of female-headed households in the survey (Figure 2.2). Both de jure and de facto female-headed households are counted as female-headed households.
Total
Pipra
Dhanushadham
Shantinagar
Rolpa
Guransh
Birendranagar
79.3 20.7
2575
39.7 60.3
2575
0% 10% 20%
Male Female
30% 40% 50% 60% 70% 80% 90% 100%
87.9 12.1
22.3 27.7
85.7 14.3
Source: Household survey, 2020
Figure 2.2: Gender of household heads of sampled households
8
B. EthnicitySampled households were also selected based on ethnicity, caste, religion and geographical region to represent different groups. Special focus was given to include adequate number of dalits and disadvantaged groups in the survey (Table 2.3).

Table 2.3: Caste/ethnicity/religion of sampled households (in percentage)
Municipality BCT* Janajati Dalit Madhesi (High) Madhesi (Middle) Madhesi (Low) Muslim
Birendranagar (n = 66) 50.0 21.2 28.8 0.0 0.0 0.0 0.0Guransh (n =44) 22.7 55.6 22.7 0.0 0.0 0.0 0.0Rolpa (n= 68) 32.4 52.9 14.7 0.0 0.0 0.0 0.0Shantinagar (n=32) 62.5 18.8 18.8 0.0 0.0 0.0 0.0Dhanushadham (n=58) 3.5 0.0 6.9 5.2 69.0 8.6 6.9Pipra (n = 42) 0.0 2.4 0.0 2.4 90.5 4.8 0.0Total 28.1 26.1 15.8 1.3 25.2 2.3 1.3
*Note: BCT = Brahmin, Chhetri, ThakuriSource: Household survey, 2020
C. Income level Sample households were divided in four income groups based on ownership of assets like type of house roof, television, toilet and vehicle as proxy of income level (Table 2.4).
Table 2.4: Sampled households by income groupsType of house roof and assets (television, flush toilet, vehicle) Income group Sample sizeCement roof with at least any two assets GI sheet or tile roof with all three assets
Rich 53
GI sheet or tile roof with any two assets Higher middle 45GI sheet or tile roof with one asset Lower middle 114Straw/thatch with one asset or GI sheet or tile roof with no asset Poor 98
Total 310Source: Household survey, 2020
D. Electricity accessThe sampled households were equally divided into two categories: (i) having electricity connection for more than 5 years (before 2015 AD) and (ii) having electricity connection between last 1 and 5 years (2015–2020). The research tried to identify if there were any distinct evolving behaviours in the use of electricity and analysed if the number of years of use of electricity had an infuence on the uptake of e-cooking. The distribution of sampled households according to years of electricity connection is shown in table 2.5.
Table 2.5: Sampled households by years of electricity connection
Province Municipality Grid connection year (in %)<5 years >5 years
KarnaliBirendranagar (n = 66) 42.4 57.6
Guransh (n = 44) 63.6 36.4
LumbiniRolpa (n=68) 66.2 33.8
Shantinagar (n = 32) 78.1 21.9
Province 2Dhanushadham (n = 58) 3.4 96.6Pipra (n = 42) 19.0 81.0
Total (n= 310) 43.9 56.1
Source: Household survey, 2020
9

E. Cooking fuel usedThe sample households were stratified based on the use of fuels, mainly firewood, cow dung, biogas, LPG, and e-cooking (Figure 8.1).
2.3 Data AnalysisDescriptive statistics were generated through quantitative data collection, mainly from the household survey. For in-depth understanding of issues and detailed information, a qualitative analysis was carried out based on the information collected during consultations with stakeholders.
10

3. ENABLING ENVIRONMENT3.1 Plans and PoliciesThe existing plans and policies which encourage and integrate electricity as a clean cooking fuel in the cooking fuel mix are analysed below.
3.1.1 Federal plans and policiesThe SDG roadmap of Nepal emphasises providing electricity access to 99 percent of households, reducing fuelwood for cooking to 30 percent, and limiting the use of LPG to 39 percent. Moreover, it targets to increase per capita electricity consumption to 1,500 kilowatt hour (kWh) and install 15,000 megawatt (MW) of hydropower by 2030. As per the 2019 review of SDG, the proportion of households with access to electricity in the country has reached 90 percent. While 68.59 percent of households use solid fuels as primary source of energy for cooking, the targets for 2019 and 2030 are 65 percent and 30 percent respectively. The proportion of people using LPG for cooking and room heating increased from 18 percent in 2015 to 26.6 percent in 2018/19, which is more than the target of 23.6 percent for 2019 (NPC, 2020). The review also indicates that there has been substantive improvement in this sector compared to a few years ago when the actual supply of energy was not sufficient. The per capita electricity consumption also increased from 80 kWh in 2015 to 260 kWh in 2019, which is again more than the target of 230 kWh (NPC, 2020).
The political will and interest of the federal government to promote e-cooking as the most feasible solution to clean cooking has increased in recent years. The Energy White Paper, issued in May 2018 by the Ministry of Energy, Water Resources and Irrigation (MoEWRI), is considered an important roadmap for fulfilling the national energy demand and achieving energy access with time-bound plans. The white paper is committed to providing electricity access to all by 2023 and further enhancing per capita consumption to 700 kWh from the current 267 kWh by 2023. Similarly, the 15th Five-Year Plan (2019/20–2023/24) of Nepal highlights the GoN's vision of ‘smokeless kitchen’ and aims to replace solid biomass with electrical energy (NPC, 2019). The plan also aims to generate 5,000 MW electricity by FY 2023/24. This will be crucial in the effort towards achieving the SDGs and graduating from the status of Least Developed Countries. The Biomass Energy Strategy (BEST) 2017 also targets clean cooking solution for all by 2022 and modern solutions of cooking with at least Tier 3 level by 2030. However, BEST does not exclude provision of e-cooking solutions. As per Nepal’s Nationally Determined Contributions (NDC), the main emitting sector is agriculture, but the overall GHG emission from the energy sector is in increasing trend. The GoN’s commitment is also reflected in the second NDC submitted to the United Nations Framework Convention on Climate Change (UNFCCC) in January 2021, which aims to reach 25 percent of households adopting e-cooking as their primary mode of cooking by 2030.
Likewise, the GoN introduced a dung cake replacement programme in the Terai to transform cooking patterns by implementing clean cooking solutions. The programme will benefit 49,000 households in 22 districts of the southern plain region of Nepal. It will promote the induction cooktop as one of the main clean cooking solutions.
During the first wave of COVID-19 pandemic, import tax exemption of 5 percent on induction cooktops was introduced. In addition, a rebate on electricity bill was introduced for residential users consuming less than 10 kWh per month. A discount of 25 percent was provided to users consuming up to 150 kWh and 15 percent to users consuming up to 250 kWh during the lockdown period. Manufacturing industries affected by COVID-19 were also provided a full discount on demand charge during the lockdown and 50 percent
11

discount during the low demand period. Additionally, to alleviate the economic burden to the people due to the country-wide lockdown in the wake of the second wave of COVID-19, the GoN announced free electricity for small residential and small-scale industries consuming less than 20 kWh per month, 50 percent discount to users consuming up to 150 kWh, and 30 percent discount to users consuming up to 250 kWh. Similarly, manufacturing industries, hotels and theatres were given a full discount on demand charge.
These are indicative of the federal government’s growing interest to promote e-cooking in the country. In fiscal year (FY) 2019/20, NPR 4.13 billion was allocated to renewable energy (RE) projects, which included 200 solar photovoltaic (PV)-based mini-grid projects in the areas where grid extension was not feasible. However, there was no mention of funds or targets for e-cooking explicitly in the federal budget announcement. In the FY2021/22 budget, the GoN announced significant reduction on import tax (i.e. 1% from 10%) on induction cooktops.
3.1.2 Provincial plans and policiesEvery year, the federal government provides conditional grants to all provincial and local governments for renewable energy, including clean cooking. The studied municipalities mentioned that conditional grants were not sufficient. Fiscal resources from the federal government are made available to the provincial governments under the Inter-government Fiscal Arrangement Act 2017 and National Natural Resources and Fiscal Commission Act 2017 to regulate fiscal resource flow. Provincial governments receive finances under four modalities: (i) Fiscal equalisation grant, (ii) Conditional grant, (iii) Complementary grant, and (iv) Special grant. The e-cooking programmes usually come under conditional and complementary grants.
Gandaki Province allocated NPR 20 million for the promotion and uptake of e-cooking for FY 2020/21, and recently announced a programme to displace LPG and encourage e-cooking in its urban and semi-urban areas. It also solicited electronic bids for the supply and delivery of infrared cookers.4 Likewise, Bagmati Province is committed to achieving 100 percent grid electrification, and Lumbini Province has allocated budget to upgrade the distribution system in the areas electrified by community rural electrification. (MoF, 2020)
All the provincial governments are aware of the need to invest in the cookstove sector for socioeconomic benefits. However, the priorities of the provinces differ in terms of type of clean cooking solution. Policy priorities and fund allocation by provincial governments related to electricity access and e-cooking in FY 2020/21 are summarised in table 3.1.
Table 3.1: Electrification status and targets of provincial governmentsProvince Current grid access (%)* Planned electricity access in next 5 years
(%)**Province 1 75.9 100Province 2 79.8 100Bagmati 90.3 100Gandaki 87.4 100Lumbini 81.0 100Karnali 27.0 90Sudur Paschim 58.9 Periodic plan not available
Source: * NEA, 2019; ** Provincial plans
4 http://moitfe.gandaki.gov.np/ne/2021/02/17/invitation-for-electronic-bids-for-the-supply-and-delivery-of-infrared-cookers-having-two-burners-for-household-indoor-use/
12

3.1.3 Local plans and policiesThe Constitution of Nepal 2015 has provided provincial and local governments with the power to enact local laws, prepare annual budgets, and formulate and implement policies and plans within their jurisdictions. Schedule 8 of the Constitution specifies exclusive powers of local governments, which include jurisdiction over “water supply, small hydropower projects, and alternative energy”. Alternative Energy Promotion Centre (AEPC) has initiated a programme in partnership with local governments to encourage households to make a transition to e-cooking. Buying of induction cook stoves, together with house wiring upgrading, is supported by AEPC in partnership with local governments (AEPC: 60% and LG: 40%). Individual households are required to pay for induction-compatible utensils. Mahankal and Kyunjesum rural municipalities in the area of Southern Lalitpur Rural Electric Cooperative (SLREC) have already signed agreements with AEPC for the distribution of induction cook stoves with cost-sharing provision. According to AEPC, 10,000 households were targeted in the first year, but due to COVID-19, no budget was allocated. AEPC has again solicited bids from private sectors willing to participate in this programme. It is expected that this initiative will be replicated by other municipalities, including the ones in our research areas.
The MoEWRI and AEPC have been supporting a national campaign led by NACEUN and ABF on CREEs. The campaign aims to reduce indoor air pollution contributing to people's health through e-cooking. This directly contributes to the GoN’s drive, ‘electric stoves for all households’ , supported by the Energy White Paper. This campaign encourages households to move towards e-cooking and relieve the country of trade deficit due to import of LPG, thereby, contributing to improve energy security of the country.
The Renewable Energy for Rural Areas (RERA) programme, supported by GIZ, helped to establish a revolving fund to provide wholesale loans to local financial institutions (LFIs). The scope is open for e-cooking as well. However, no LFI has utilised the fund for e-cooking products yet. The RERA programme also supported local governments of Province 1 and 7 to prepare municipal energy plans, along with e-cooking solutions.
3.2 Regulatory Framework3.2.1 Tariff structureThe 15th Plan outlines the government’s plan to fix electricity tariff to make it more favourable for e-cooking users. Electricity Regulatory Commission (ERC) announced revised electricity tariffs in June 2020. The new tariff structure provides free energy (excluding demand charge) to the households consuming electricity up to 10 kWh and a cheaper tariff that allows use of at least one induction cooktop (or efficient electric stove) to meet the nominal cooking need. At present, NEA uses a seven-tier increasing block tariff for domestic consumers. Such tariffs with many blocks are intended to encourage efficient use of electricity among diverse income and consumption groups. However, CREEs have mixed experience with the current tariff structure. The impact of tariff on the performance of CREEs is currently being analysed with the support of GIZ/RERA. Findings from the analysis will provide recommendations on business performance and capacity building of CREEs, which would also be crucial for the uptake of e-cooking.
In Bhutan, rural households used to pay Ngultrum 0.85 per kWh for consumption below 100 kWh. Bhutan’s Free Power Implementation Programme (2013–2016) provided 100 kWh of free electricity to rural households. A total of 77,030 rural households benefitted from this programme. Even after the phase out of the programme, low-voltage consumers in rural areas were provided free 100 units of electricity for domestic consumption. Consumers under this scheme included locals, small shops and monasteries. Electricity was provided for a maximum for 3 hours per day and could support the use of 20-watt fluorescent light bulbs, water boilers, rice cookers, curry cookers, and television.
13

3.2.2 StandardsThe Nepal Bureau of Standards and Metrology (NBSM) has recently endorsed national standards for household electric appliances, and the implementation of the standards is being planned. This is a timely progress that complements the e-cooking promotion efforts in Nepal. The NBSM has set technical standards for induction hobs and hotplates for household use, which has been endorsed by the Nepal Council for Standards. The four endorsed interlinked standards include: NS 561, which deals with electrical safety of induction cooktop, NS 562, deals with electric hotplates, NS 563, which deals with measuring the performance of induction hobs for household use, and NS 564, which deals with the safety of electric appliances for household and similar purposes.
The Nepal Energy Foundation (NEF), in collaboration with the Collaborative Labelling and Appliance Standards Program (CLASP) and financial support of the United Nations Foundation/Clean Cooking Alliance (UNF/CCA), has developed electric stove standards and prepared an implementation strategy, which has been endorsed by the NBSM.
3.3 Analysis and ConclusionE-cooking is a top priority of the GoN, which has been reflected in the White Paper and the 15th Five-Year Plan. From FY 2021/22, customs duty on import of induction cooktops will be reduced from 15 percent to 1 percent. In this way, inclusion of various e-cooking promotion campaigns and programmes in the energy plans and policies will contribute to building a positive policy environment. However, the government will have to come up with concrete targets and favourable laws and regulations to make e-cooking an attractive choice for the people. The study team recommends establishing province-wise targets based on investment plans on infrastructure, electricity tariff revisions, inputs from various studies, and evidence generated in recent years. NEA will have to set e-cooking-related targets for its provincial and district offices. This will require e-cooking budget to be explicitly mentioned in the budgets of provincial and local governments. The targeted programmes introduced during the lockdown period should continue to eliminate unequal distribution and further strengthen the availability of electricity to all, including those who reside in very remote areas and have poor economic conditions. Furthermore, e-cooking standards will have to be formulated and implemented other than for induction hobs and hotplates.
The electricity sector of Nepal is to undergo restructuring on federal basis as conceived by the Constitution. Federal, provincial and local governments have exclusive and concurrent rights in the electricity sector and will exercise these rights after the restructuring. This may have an impact on all future plans related to the electricity sector. For example, constitutionally, the distribution and supply business is not an exclusive right of the federal government. The provincial governments may not follow the distribution plans prepared in the integrated structure. Similarly, constitutionally, renewable energy is the exclusive right of local governments. External facilitation and coordination may be required for smooth transition of the electricity sector to the federal structure so that it does not give rise to conflicts between the three tiers of government. The scope of policy, planning, regulatory, and executing entities might change following the restructuring of the electricity sector.
14
4. FINANCING ECOSYSTEM
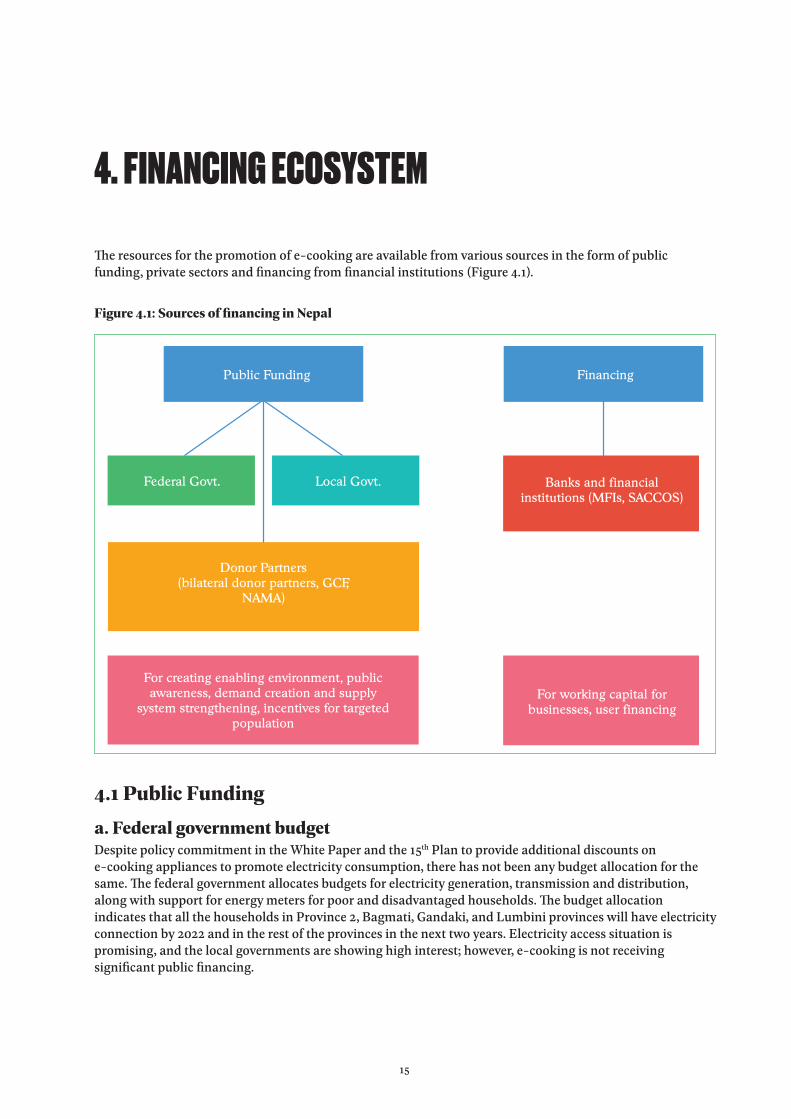
The resources for the promotion of e-cooking are available from various sources in the form of public funding, private sectors and financing from financial institutions (Figure 4.1).
Figure 4.1: Sources of financing in Nepal
Public Funding
Federal Govt. Local Govt.
Donor Partners(bilateral donor partners, GCF,
NAMA)
For creating enabling environment, public awareness, demand creation and supply
system strengthening, incentives for targeted population
For working capital for businesses, user financing
Banks and financial institutions (MFIs, SACCOS)
Financing
4.1 Public Fundinga. Federal government budgetDespite policy commitment in the White Paper and the 15th Plan to provide additional discounts on e-cooking appliances to promote electricity consumption, there has not been any budget allocation for the same. The federal government allocates budgets for electricity generation, transmission and distribution, along with support for energy meters for poor and disadvantaged households. The budget allocation indicates that all the households in Province 2, Bagmati, Gandaki, and Lumbini provinces will have electricity connection by 2022 and in the rest of the provinces in the next two years. Electricity access situation is promising, and the local governments are showing high interest; however, e-cooking is not receiving significant public financing.
15

b. Province and local governments In the FY 2020/21 budget, the provincial governments have allocated sufficient budgets to electricity and Renewable Energy Technology (RET), which may help to promote e-cooking. However, specific budget allocation to e-cooking is not indicated except in Gandaki Province, which has allocated funds for 5,000 infrared cooktops for FY 2020/21.
Similarly, a few local governments have allocated funds for e-cooking and a few others have shown high interest. For example, Chandrapur, Nijgadh, and Paterwa Sugauli municipalities in Province 2 and Rohini, Kanchan, and Siddharthanagar municipalities in Lumbini Province have allocated budget for e-cooking promotion. In the future, there is a high possibility of investment leverage from provincial and local governments for e-cooking promotion.
c. Development partnersThere is a huge interest among development partners for mobilising resources for the development of an e-cooking market. A number of e-cooking promotion projects, research and capacity development activities are ongoing with funding and technical assistance of development partners (see Chapter 5 for details).
Similarly, there is bilateral and multilateral funding for large-scale electricity projects like hydropower and mega solar projects. Denmark, Finland, India, UK, Kuwait Fund, the Netherlands, Norway, Saudi Fund, ADB, Global Environment Facility, UNDP, UNCDF, and World Bank are the major bilateral and multilateral countries/ agencies in the sectors.
d. Challenge fundsFinancial instruments such as Challenge Funds can facilitate broader change in the development of an e-cooking market. Challenge Funds support projects with the approach and interventions that focus on value for money and leverage resources from private or public resources5:
Sustainable Energy Challenge Fund (SCEF) of Nepal Renewable Energy Programme (NREP) is a four and a half year programme funded by the UK Foreign, Commonwealth & Development Office (FCDO). The programme plans to increase energy access to 95,000 households and promote 70,000 e-cooking appliances.
Sakchyam–Access to Finance for the Poor programme is funded by the UK Aid to leverage access and facilitate financial sector development for Small and Medium Enterprises (SMEs) and can be accessed by e-cooktop supply chain actors.
Vendor Finance Challenge Fund is funded by the UNCDF and can be accessed by entrepreneurs engaged in the supply chain of e-cooking appliances.
Clean Start programme, UNCDF, supports partner financial institutions with technical assistance for lending cookstove technologies. The programme supports partner banks and MFIs in providing loans for e-cooking appliances.
e. Global funds and carbon financingGreen Climate Fund (GCF) and AEPC have signed an agreement to promote 500,000 e-cooktops for households using LPG and firewood, along with reliable electricity access in twenty-two Terai districts. The stakeholders also see Nationally Appropriate Mitigation Action (NAMA) as an opportunity to work in the e-cooking sector to mitigate GHG emission.
5 https://www.nrepnepal.com/se-challenge-fund/
16

4.2 Financing by Banks and Financial InstitutionsNepal Rastra Bank, the central bank of the country, has made it mandatory for commercial banks, development banks and finance companies to lend up to 5 percent of their total credits to deprived groups (low income and socially backward women, adivasi/janajati, dalit, visually impaired, hearing impaired, differently able, marginalised communities, small farmers, artisans, labour, and landless squatter families).
Under priority sector loan mobilisation, commercial banks are required to invest at least 10 percent of their total loans in the energy sector. BFIs should provide loans not exceeding NPR 100,000 per household for solar home system, solar cookers, solar dryers, solar pumps, biogas, improved water mills, and improved cooking stoves (ICSs). Since an e-cooking appliance market is yet to develop, no bank has leveraged the service yet. However, they are willing, and are capable, to provide loans for e-cooking.
Another channel for increasing access to finance in rural areas could be local financial institutions (LFIs). LFIs include microfinance and cooperatives. More than 34,000 cooperatives are functioning throughout the country. Likewise, more than 85 MFIs have branches in different parts of the country. They provide loans to consumers either against their savings or on group guarantee. The field survey found a few LFIs (MFIs and cooperatives) providing loans for biogas and ICSs. However, they do not have adequate information about the risks entailed in lending for e-cooking; so, they hesitate to provide loans for e-cooking. However, during our discussions with them, the LFIs said they were closely watching the development of e-cooking and were ready to include it in their financing portfolio if traders or programmes approached them with plans. Nirdhan Utthan Laghubitta Bittiya Sanstha and a few other MFIs have already started working on it.
The Central Renewable Energy Fund (CREF) works under AEPC, which looks after the core financial mechanism and is responsible for the delivery of subsidies and credits to the RE sector. The CREF has not handled any e-cooking financing yet, but it has participated in the dialogues on revising the AEPC’s subsidy policy. Therefore, it is expected that e-cooking will be included in their financing portfolio.
4.3 Private Sector Involvement in Cookstove Sector and FinancingThere is possibility for the private sectors to leverage their investments. They can contribute in different stages of the supply chain and also in support services like production, import, marketing and distribution, as well as capacity development and quality control. However, despite the potential, private sector engagement is limited to a few big cities. One of the main causes for weak private sector involvement is the low and uncertain demand. The commercial market is also yet to be developed. Capacity building of the private sectors in technology selection, business planning, marketing, and access to finance is deemed necessary to improve the situation.
4.4 Analysis and ConclusionThe interest of development partners in mobilising resources for the e-cooking market development is growing. Likewise, all three tiers of government have expressed their eagerness to create a favourable policy environment and to increase public funding for e-cooking promotion. Public funding is increasing with strong commitment, but fund allocation is insufficient to meet the ambition within the targeted time period. Private sector investments are also increasing, but the scale is very small compared to the need. BFIs are not pursuing their strategy in a proactive manner, may be because it is a new investment avenue for them and they are not yet confident. For commercial and development banks, the loan amount required for consumer financing for e-cooking is very small and the transaction cost is high; so, it is not viable for them. However, they also have high incentive to mobilise loans for e-cooking to meet their target of priority sector loan mobilisation. The option could be MFIs and cooperatives increasing access to finance in rural areas. The MFIs and cooperatives have high penetration and high interest to provide loans for e-cooking. Our field survey and key informant interviews (KIIs) reveal that a few MFIs have already started to work on it.
17

5.1 Market EnablersThe main market enablers for e-cooking are government agencies (policy makers, planners, and regulatory institutions) and development organisations.
The key actors involved in policy making, planning and regulation include Ministry of Energy, Water Resources and Irrigation (MoEWRI), Ministry of Industry, Commerce and Supplies (MoICS), Ministry of Forests and Environment (MoFE), Nepal Bureau of Standards and Metrology (NBSM), National Planning Commission (NPC), provincial and local governments, Alternative Energy Promotion Centre (AEPC), and Electricity Regulatory Commission (ERC) (see Table 5.1).
Table 5.1: Market enablers stakeholdersName of organisation Role and engagement Remarks
Ministry of Energy, Water Resources and Irrigation
Formulation of power sector policy Development of water resource Oversight and regulation of Nepal Electricity
Authority Development of private power
Ministry’s White Paper (2018) has given priority to the promotion of e-cooking
Ministry of Industry, Commerce and Supplies
Formulation of industrial and commercial sector policies Setting of mandatory policies and standards for
businessesMinistry of Forests and Environment Management of forests and environment Included electric cooking under
the NDC6 target
Ministry of Finance and National Planning Commission
Formulation of a national vision, periodic plans and policies for development
E-cooking is a priority of the 15th periodic plan
Provincial governments Formulation of provincial plans Gandaki province has already included e-cooking in its plan
Local governments
Overseeing the implementation of renewable energy projects, including management, operation and monitoring Regulation of local electricity distribution system
Nepal Bureau of Standards and Metrology
National standards body for standardisation and quality control
Prepared Nepal’s first standards on electric cooktops
Alternative Energy Promotion Centre
Apex government body for the promotion of renewable energy
Actively promoting clean cooking solutions
Electricity Regulatory Commission Regulation of the power sector
Nepal Electricity Authority Development and distribution of electricity
5. KEY STAKEHOLDERS
6 Nationally Determined Contributions (NDC)
18

5.2 Development Organisations5.2.1 International development partnersInternational development partners and international non-governmental organisations (INGOs) have an important role in the promotion of RE technologies to meet international and national commitments, such as Sustainable Energy for All (SE4All), Sustainable Development Goals (SDGs), Nationally Determined Contributions (NDC), White Paper, etc. E-cooking is a recent intervention in Nepal and not much work has been done in this area, but many envision it to be an important intervention in the household energy mix of the country. At the moment, most of the organisations are in the stage of planning and have shown an interest to support the promotion of e-cooking programmes and projects. Some of the initiatives supported by international development partners and INGOs are as follows:
Clean Cooking Alliance (CCA) is one of the first development partners to pilot an e-cooking project in Nepal. Maximising the Health Benefits of Clean Household Energy in Urban Nepal: A demonstration project was implemented to promote e-cooking along with other clean cooking options to combat HAP and promote smoke-free kitchen. The project was implemented in Panchkhal and Mandan Deupur municipalities in Kavrepalanchok district from 2017 to 2019.
GIZ EnDev programme, in partnership with ABF/NACEUN, implemented Market-led Promotion of Electric Cooking in Timal Community Rural Electrification Area from 2019 to 2020. It was a research project intended to understand the impact of increased use of induction cooktops and users’ behavioural change in Timal Rural Municipality. Under the project, a total of 569 households adopted e-cooking. GIZ EnDev also worked with Practical Action and SNV Nepal in similar projects to promote more than 1,000 electric stoves in 2020.
Forest without Borders, Canada, in partnership with ABF/NACEUN, implemented the Contributing to Forest Conservation through Electric Cooking Promotion in Nepal project to promote e-cooking and afforestation in Baluwa village in Kavrepalanchok district.
FCDO-funded, Nepal Renewable Energy Programme (NREP) aims to promote renewable energy to 95,000 households in Province 2, Lumbini and Karnali provinces. E-cooking is considered as a potential intervention to be promoted through the mobilisation of Sustainable Energy Challenge Fund.
5.2.2 Civil society organisationsCivil society organisations (CSOs) are gradually taking up the agenda of e-cooking promotion in the country. National Association of Community Electricity Users Nepal (NACEUN), LEADERS Nepal, ABF, and Radio Sagarmatha are the key CSOs active in this sector. Other CSOs include Community Rural Electrification Entities (CREEs), Women Network for Energy and Environment (WoNEE), female community health volunteers, and cooperative associations.
5.3 Programmes, Projects and Research on Electric Cooking5.3.1 Programmes and projectsE-cooking started receiving policy-level attention in Nepal only after 2018, when the country got rid of load shedding. That year, CCA started the promotion of e-cooking. ABF and NACEUN started promoting e-cooking in partnership with local CREEs and municipalities in 2017 and was later joined by CCA. With funding from GIZ EnDev programme, ABF/NACEUN implemented Market-led Promotion of Electric
19

Cooking in Timal CREE project in 2019 to promote 569 induction cooktops in Timal Municipality. Under the same programme, Practical Action and SNV also promoted 1,000 induction cooktops until March 2021. More actors and bigger programmes are coming in this sector. The NREP plans to promote more than 70,000 e-cooktops by 2023. AEPC plans to promote 500,000 e-cooktops in 22 Terai districts with funding from GCF. The World Bank also has an e-cooking promotion programme in the pipeline, which will be launched in the near future. Table 5.2 describes the e-cooking related programmes and projects till date.
Table 5.2: Ongoing electric cooktop promotion programmes/projectsOrganisation Programme/project name
and financing modelDuration of
fundingNumber of electric
cooktops
GIZ/EnDev, ABF and NACEUN
Market-led Promotion of Electric Cooking in Timal Community Rural Electrification Area
June 2019–February 2020
569 induction (completed)
Practical ActionResult-based Financing for Improved Cook Stove Market Development in Nepal (EnDev funded)
January–December 2020
500 induction
SNV Improving Access to Clean Energy through ICS (EnDev-III)
2020–2021 500 induction
FwB, ABF and NACEUN
Contributing to Forest Conservation through Electric Cooking Promotion
November 2019–November 2020
200 induction (completed)
CCA
Demonstration on the Environmental and Health Benefits of Electric Cooking in Nuwakot District
2018 42 induction (completed)
Maximizing the Health Benefits of Clean Cooking in Urban Nepal (market development part implemented by ABF)
July–December 2019
95 induction (completed)
AEPC Electric Cooking Promotion in Partnership of Local Governments
Ongoing 14,350 induction
Gandaki provincial government
Electric Cooking Promotion Ongoing 5,000 infrared
GIZ/EnDev, ABF and NACEUN
Private-Community Partnership for E-cooking
March 2021–September 2021
1500 induction (ongoing)
Source: CCA 2021, Landscape Study
A few more projects are in the pipeline under the AEPC and NREP programme (Table 5.3).
Table 5.3: Electric cooktop promotion programmes/projects in pipelineOrganisation Programme/project name and
financing modelDuration and type of
fundingNumber of electric
cooktopsAEPC Terai Cookstoves Programme 2021–2025 (planned) 500,000 (planned)NREP Nepal Renewable Energy Programme February 2019–March 2023 70,000 electric cooktops
Source: CCA 2021, Landscape Study
20

5.3.2 StudiesSeveral studies on the e-cooking sector are in progress, with focus on supply-side readiness, market assessment, adoption, etc. (Table 5.4).
Table 5.4: Research on electric cooking in NepalOrganisations/ programmes Study areas/focus Remarks
CCA
Maximizing the environmental and health benefits of clean cooking in urban Nepal (2019)Landscape analysis of cookstove sector in Nepal Conducted by PACAssessment of the readiness for widespread adoption of electric cooking in Nepal
Conducted by Winrock, Vrock and NEA Engineering Company Ltd.
Consumer assessment to support the adoption of electric cooking in Nepal
Conducted by ABF/NEF/NACEUN
Practical Action
Study on institutional and market readiness of electriccooking in NepalMarket assessment of efficient electric cooking appliances in Nepal
MECS funded
Analysis of factors affecting adoption of electric cooking options in electrified community of Nepal
MECS funded; being conducted by PA/ABF/NACEUN
Hivos/ENERGIA Research on gender-responsive electric clean cooking in Nepal
MECS funded
PEEDA
Assessing electric cooking potential in micro hydropower micro-grids in Nepal
MECS funded
Understanding the suitability of electric pressure cookers in Nepali households
MECS funded
IRADE Testing electric pressure cooker adoption in socio-economic and cultural context of Nepal
MECS funded
Winrock Efficient electric cooking market uptake in Nepal MECS fundedSource: CCA 2021, Landscape Study
5.3.3 Development of standards on e-cookingWith the technical and financial support of CCA, the NBSM has prepared standards for e-cooking appliances (Table 5.5).
Table 5.5: Capacity-building SupportOrganization Year Capacity-building support
Nepal Bureau of Standards and Metrology (supported by CCA)
2018–19 Development of electric stove standards and standard implementation strategy in Nepal: Household and similar electrical appliances—Safety—Part 1: General
requirements Household and similar electrical appliances—Safety—Part 2-x: Particular
requirements for induction hobs Performance standards for household induction hobs Household and similar electrical appliances—Safety—Part 2-x: Particular
requirements for hot plates
21
5.4 Analysis and ConclusionE-cooking is on the priority of the GoN, national and international development organisations, private sectors, and civil society. The organisations working for HAP alleviation consider e-cooking as the best clean cooking option for Nepal. Likewise, stakeholders from electricity supply also consider e-cooking as a good opportunity for increasing electricity consumption in the country. However, the current stakeholder engagement is very low to meet the aspiration and interest. There is need for meaningful engagement on awareness creation, capacity building, financing, research, and overall promotion of e-cooking.
Likewise, stakeholder engagement needs to be strengthened to ensure reliable and adequate electricity supply. There are coordination and collaboration gaps between different organisations engaged in the promotion of e-cooking. The interlinkages between the roadmap, strategy, medium- and short-term plans, financial allocation, monitoring, development plan, and annual budget are weak.
The number of programmes and projects on research and capacity building of e-cooking has been increasing since 2018. Most of them are guided by market-based approach and provide little incentive to customers to boost the demand. AEPC, in partnership with local governments, is working in the southern plain areas to promote e-cooking. The incentives and subsidies provided by different programmes and projects are not uniform. This creates confusion and hampers market growth. Likewise, compared to the need, the existing projects have very low targets. Similarly, the current and past programmes and projects on e-cooking are found to be gender neutral. They are focused on the viability of e-cooking technology and assessing the cooking behaviour. There is a growing interest among the development partners, like GIZ/EnDev, to consider and prioritise gender transformative approach7 and address the existing norms and power dynamics within households. Future programmes need to integrate the gender transformative approach and understand ways to achieve sustainable results.
Furthermore, there is a potential for integrating e-cooking with climate policy as it helps to reduce GHG emission. Therefore, support is required to improve coordination of the e-cooking promotion initiatives with health, environment, gender and social inclusion, income-generating and other programmes.
7 Gender-sensitive programmes may not actively seek to change gender norms and power relations, while gender transformative programmes aim to transform gender roles, norms and power relations to create more gender equitable outcomes.
22

6.1 Electricity Access SituationAbout 90.1 percent of the total population of the country have access to on-and off-grid electricity. The country’s per capita electricity consumption stands at 267 kWh.8 The number of consumers of NEA is steadily increasing over the years. It increased by 7.88 percent, from 3.91 million to 4.22 million, during FY 2019/20. The consumers of Community Rural Electrification number about 0.57 million (NEA, 2020).
Around NPR 36 billion is allocated to electricity transmission and NPR 4 billion to rural electrification projects. The increase in strengthened grid network is enhancing the supply of electricity in the country.
6.2 Electricity Generation SituationNepal has a huge hydropower potential, and the country has the capacity to generate over 40,000 MW of electricity. The GoN declared National Energy Crisis Reduction and Electricity Development Decade in 2016 to end energy crisis, and a number of activities are set down in the action plan to generate 10,000 MW of electricity by 2025 (JICA, 2020). Though the target of generating 10,000 MW of electricity is unlikely to be met during this period, a large number of grid-connected generation projects are under different phases of construction, development and planning. The projects under construction are considered to be commissioned in three years from now, those under development projects considered to be operational within five years, and the planned projects are optimistically considered to be commissioned in ten years (NEA, 2019). The status of generation is summarised in Annex 3. With a significant number of large-sized hydropower projects in the pipeline, Nepal is expected to have enough generating capacity by the end of FY 2029/30. The existing hydropower stations have a total installed capacity of only around 1,200 MW, or less than 3 percent generated, at the end of FY 2019/20. Recently, Upper Trishuli 3A (60MW) and Chameliya Hydroelectric (30 MW) projects came into operation, and several hydroelectric projects, including the Upper Tamakoshi Hydroelectric Project, are in the pipeline. An additional 1,300 MW of electricity is estimated to be generated through various under-construction hydropower projects by 2021. The generation capacity will exceed the peak load demand of 3,703 MW in FY 2023/24, which indicates a favourable situation for the adoption of e-cooking on a mass scale.
6. ELECTRICITY SUPPLY STATUS AND PLAN
8 https://data.worldbank.org/indicator/
23

Table 6.1: Status of electricity generation in NepalType Currently
available (MW)Additional
(MW) by 2023/24Additional (MW)
by 2025/26Indicative additional
(MW) by 2029/30
Run-of-river (RoR) 647.28 2,119.28 2,659.91 60.20Peak ROR (PRoR) 383.25 493.60 0 1760.00Storage 106.00 140.00 0 5,019.00Allocation from joint projects 26.00 243.00 0 108.00Thermal/co-generation 53.41 0 6.00 0Solar 1.64 24.50 14.00 0Total installed capacity (MW) 1,217.58 3,020.38 2,679.91 6,947.20Available power in wet peak 1,215.99 2,995.88 2,659.91 6,947.20Available power in driest peak 7,58.84 1,512.38 803.97 6,905.06Total available power in wet peak 1,215.99 4,211.81 6,871.72 13,818.92Total available power in driest peak 758.844 2,271.23 3,075.199 9,980.259Available annual energy (GWh) 5,383.43 13,521.15 12,849.61 22,196.18Total available annual energy (GWh) 5,383.43 18,904.55 31,754.15 53,950.33
NEA’s hydropower plants, including small power stations, generated a total of 3,021 GWh of electricity in FY 2019/20—an increase of 18.57 percent, from 2,548 GWh in FY 2018/19 (NEA Annual Report, 2020). The addition of Upper Trishuli 3A and Kulekhani III (14 MW); contributed to the increment of electricity generation. The total power purchased from independent power producers (IPPs) was 2,991 GWh—an increase of 36.57 percent, from 2,190.05 GWh in FY 2018/19. The total energy imported from India decreased by 38.55 percent, from 2,813.07 GWh to 1,729 GWh in FY 2018/19. However, the total available energy in the system increased by 2.51 percent, from 7,551 GWh to 7,741 GWh in FY 2018/19. Of the total electricity generated, 39.02 percent was generated by NEA, 22.33 percent was imported from India and 38.64 percent by domestic IPPs (NEA, 2020).
Most of the large projects are at a very preliminary stage. To put the scenario in a clear perspective, the generation status of domestic generating facilities is compared with the demand forecast by NEA (Annual Report 2018/19).
Table 6.2: Demand forecast of electricity and supply availabilityYear Demand forecast Dependable supply in
wet season peak (MW) Dependable supply in dry season peak (MW)
Available annual energy (GWh)Peak power
(MW)Annual energy
(GWh)2019/20 2,225.7 10,138.28 1,094.4 720.86 5,383.432023/24 3,703.3 16,869.13 3,790.62 2,157.64 18,904.552025/26 4,519.1 20,585.22 6,184.53 2,921.44 31,754.152029/30 6,848.5 31,196.38 12,437.01 9,481.29 53,950.33
It is predicted that the dependable peak supply capacity during wet season will be able to cater to the projected peak power demand in 2023 and beyond. However, the dependable peak supply capacity from domestic sources during dry season is substantially lower than the projected demand.
NEA has recorded the maximum peak demand of 2020 at 1,404 MW, which is about 37 percent lower than its projection of 2,225.7 MW. The demand forecast by NEA is always on the optimistic side and, with the same correlation between actual and projected peak demands, the actual peak demand for 2024 will be 2,333
24

MW, considering the present trend. The dependable peak supply availability in the wet season of 2024 is estimated at 1,457 MW, which is above the estimated actual demand of 2,333 MW. It can meet the e-cooking load of 1,239 MW at consumer point after adjusting system losses at 15 percent. It is highly unlikely that the full 2 kW e-cooking load of all households will occur at the same time; therefore, average e-cooking load is considered as 1.5 kW per household. The available 1,239 MW supply will cater to the e-cooking load of 820,000 households. However, during the dependable supply in dry season peak, the supply of 2,157.64 MW will not be sufficient to meet the estimated actual load. Therefore, it is evident that the dependable supply in dry season peak will not be able to meet the e-cooking load in 2024.
Similarly, using the same correlation, the actual peak demand for 2026 is estimated at 2,847 MW. The dependable supply in the wet season peak of 6,184.53 for 2026 is 3,337.5 MW, which more than the actual peak power demand. The utilisation plan of the surplus energy may include allocating 2,500 MW to e-cooking and the rest to other sectors. Out of the 2,500 MW allocated to e-cooking, 2,125 MW will be available after system loss adjustment of 15 percent at the consumer end. The available power will be sufficient for 1.4 million e-cooking users at 1.5 kW per user.
The dependable supply in dry season is just sufficient to cater to the actual demand and will not be able to meet any e-cooking load. However, there are alternatives that can address the energy deficit for the uptake of e-cooking. Seasonal import from India may be exercised during dry season, targeting urban consumers who would continue with e-cooking during dry season with higher seasonal tariff. Likewise, the seasonal surplus energy during wet season can be used for seasonal e-cooking by employing seasonal tariff as a demand-side management tool. All-round-the-year e-cooking may not be possible through domestic sources; therefore, seasonal e-cooking and seasonal import could be a quick fix. Depending on the import capacity, limited round-the-year e-cooking may be implemented in phases. For seasonal e-cooking, not only seasonal electricity tariff should be employed, but seasonal pricing of LPG should also be implemented to ensure seasonal switching of cooking energy sources.
If the indicative peak supply capacity for 2030 is realised in advance, the domestic system can meet above 4,000 MW of e-cooking load round the year. In addition, the wet season surplus will be available in a much larger quantity. With the 4,000 MW surplus, 3,400 MW will be available at consumer point after adjusting system loss of 15 percent, which can supply electricity for e-cooking to 2.26 million consumers. This will be a very comfortable situation for adopting e-cooking.
Similarly, there are many off-grid hydropower systems (micro-hydro plants) serving rural and remote communities. They are generally faced with limited power supply for households and other managerial issues.
6.3 Status of Transmission SystemThe majority of high voltage transmission lines in Nepal are of 132 kV. With the increased generating capacity and load demand, new lines of 220 kV and 400 kV have been introduced. After the completion of the 400 kV Dhalkebar–Muzzafarpur cross-border transmission line in February 2016, the highest voltage level in Nepal is 400 kV. It is expected that the under construction 400 kV east–west vertebral transmission infrastructure of Hetauda–Inarawa transmission line, Hetauda–Bharatpur–Butwal transmission line, and the 132 kV double circuit Butwal–Kohalpur–Attariya–Mahendranagar transmission line will be completed by 2023. Likewise, for the east–west transmission system, the north–south transmission infrastructure comprising the 132 kV Mechi corridor transmission line, the under construction 220 kV Koshi corridor transmission line, the under construction 132 kV Solu corridor transmission line, the 220 kV Khimti–Dhalkebar transmission line, the 132 kV Kathmandu–Hetauda transmission line, the 132 kV Pokhara–Kaligandaki–Butwal transmission line, and the 220 kV Kaligandaki corridor transmission lines will also be
25

completed by 2023. Besides these major transmission lines, a number of other transmission lines are under construction or in the planning phase to facilitate power evacuation from generating stations (NEA, 2020).
6.4 Status of Distribution SystemA total of 35,537 distribution transformers, with a total capacity of 3,285 MVA, have been installed in 2020 (NEA, 2020). However, the existing sub-transmission lines of 33 kV and 11 kV voltage level and distribution lines of 400 V and 220 V are not designed to cater to the e-cooking load. A capacitor bank installation project for different substations and distribution transformers, which will help to reduce voltage fluctuations and reduce technical loss, will be implemented in each of the grid and distribution substations.
There is a need to develop a transmission and system to cater to increased power generation capacity and fulfill the national demand. In 2018, the GoN developed Transmission System Development Plan of Nepal to lay out plans for the development of a higher voltage transmission network in Nepal to cater to hydro-generation capacity and the national power demand, and export electricity to neighbouring countries. Many high voltage transmission lines are under construction and are preparing to generate electricity from hydropower stations along river corridors. A plan for the development of a distribution network and a rural electrification network has also been developed under the Nepal Distribution System/Rural Electrification Master Plan, with the aid of the Asian Development Bank (ADB). At present, Project Management Directorate of NEA is executing several transmission and distribution system strengthening projects, including transmission lines, substations, distribution system, distribution system modernisation, smart meters and automation under the ADB-financed SASEC Power System Expansion Project, Electricity Transmission Expansion and Supply Improvement Project, Power Transmission and Distribution Efficiency Enhancement Project, SASEC Power Transmission and Distribution System Strengthening Project, and Electricity Grid Modernization Project9.
The study survey shows that the distribution system in Province 2 can support the e-cooking load if used at different times of the day. Lumbini Province has a robust distribution system and plans to strengthen the network. Therefore, the current capacities of the distribution infrastructure in Province 2 and Lumbini Province are sufficient to bear the load of e-cooking. In Karnali Province, the transformer capacity needs to be increased by 50 percent to support the e-cooking load. (NEA Distribution Annual Report, 2019–20)
Karnali Province and Province 2 do not have explicit plans on e-cooking, while Lumbini Province has adequate infrastructure; therefore, it has included e-cooking in its plan and programmes. Increased internal consumption is the main motivation in Lumbini Province, while Province 2 has expressed its interest to understand consumer behaviour, starting with urban consumers. However, Karnali Province is less motivated towards meeting e-cooking loads. (NEA Distribution Annual Report, 2019-20)
Annex 3 gives summarised information on the distribution system upgrading work of Province 2, Karnali Province and Lumbini Province. It includes the projects that were completed in FY 2019/20, as well as the undergoing projects of the GoN. (NEA Distribution Annual Report, 2019-20)
The enhancement of system reliability through network strengthening is a major aspect of the implementation of e-cooking. Consumers will desire greater reliability of the system when e-cooking is implemented. NEA is working to increase the reliability of the system. The underground cable-laying work to upgrade the distribution system for safety and reliability has been initiated in Ratnapark and Maharajgunj areas in Kathmandu district in FY 2020/21. Similarly, the underground cable-laying work
9 JICA-Follow Up Data Collection Survey for Transmission and Distribution Network Development- Final Report-Japan International Cooperation Agency, Nepal Office, March 2020.
26

in Balaju, Kirtipur, Kuleshwor, Baneshwor, and Jorpati areas will be initiated in FY 2020/21. Contracts will be signed for underground cable-laying work in Lalitpur and Bhaktapur within FY 2020/21. (NEA, 2020)
The automation of grid substations, funded by the ADB, will ensure controlled and systematic operation of the grid system. This will ultimately lead to reliable power supply and remarkable saving in the operation of grid substations. Contracts have been signed and work started for installation of substation automation systems in 13 grid substations within the valley and work is expected to be completed by 2022. Contracts for the automation of additional 40 grid substations will be signed within FY 2020/21. (NEA, 2020)
The NEA has executed transformer reinforcement upgrading work at various substations. Upgrading, reactive power compensation and rehabilitation of power system equipment are being carried out to meet the increasing power demand and reduce voltage drop. The work executed by NEA is expected to reduce the power disruptions caused by inadequate substation capacity.
The NEA is also planning to improve the quality of services through new technologies and capacity building to meet the challenges of a new environment in utility business. Consumers' complaints are being addressed without delay and the procedure for applying for new connections is being made simpler and user friendly.
6.5 Status of Electricity Connection in HouseholdsThe majority (95.2%) of the surveyed households have 5 ampere meter connection. Hundred percent of households in Province 2 have 5 ampere connection (Table 6.3). Only about 1.5 percent of households in rural areas have 15 ampere meter connections. The requirement of minimum 15 ampere connection to operate e-cooking appliances is a constraint on e-cooking promotion. The charge for upgrading to 15 amperes is NPR 550 per connection.
Table 6.3: Status of meter connection Province Settlement 5 Ampere 15 Ampere
KarnaliUrban 76.8 23.2Rural 98.1 1.9Total 87.3 12.7
LumbiniUrban 100.0 0.0Rural 97.6 2.4Total 99.0 1.0
Province 2Urban 100.0 0.0Rural 100.0 0.0Total 100.0 0.0
TotalUrban 92.5 7.5Rural 98.5 1.5Total 95.2 4.8
As high as 79 percent of households in Lumbini Province had duct wiring in the kitchen, whereas 62 percent households in Province 2 had loose wiring (Table 6.4).
27

Table 6.4: Type of wiring in the surveyed households
Province MunicipalityWiring type (% of total HHs)
Duct wiring Loose wiring
Karnali
Birendranagar UM 71.2 28.8
Guransh RM 0.0 100.0
Total 42.7 57.3
Lumbini
Rolpa UM 83.8 16.2Shantinagar RM 68.8 31.3Total 79.0 21.0
Province 2Dhanushadham UM 43.1 56.9Pipra RM 31.0 69.1
Total 38.0 62.0
Source: Household survey, 2020
There are a few fraudulent practices in electricity connections, like hooking, mainly in southern Terai. Such practices should be strictly discouraged, as they are illegal and not safe, and also affect the promotion of e-cooking.
6.6 Environmental Impact of Electricity Generation and DistributionThe main source of electricity in Nepal is hydropower. It is regarded as a clean and environment-friendly source of energy in terms of carbon emissions, but large hydropower plants can have certain negative impacts on the environment due to blocking, diverting, or changing of the natural course of rivers, which may even alter the surrounding landscape. Likewise, reduction in downstream water flow can cause loss of habitat. The GoN is committed to protecting national environmental and social safeguards. As per the Hydropower Environmental Impact Assessment Manual (MoFE, 2028), all hydroelectricity projects have to carry out an environmental impact assessment. The GoN aims to develop the renewable energy sector and encourage households to use renewable energy, like mini or micro hydropower, solar and wind energy, by providing subsidy on deployment. Currently, Nepal is importing 250 MW of electricity (fossil fuel-based electricity) from India. It raises questions on the feasibility of e-cooking, discounts, etc. Furthermore, India is aiming to increase its renewable energy capacity to 220 GW from 175 GW by 2022.
6.7 Analysis and ConclusionThe available peak power supply capacity from domestic sources in 2024 and 2026 can afford to allocate 1,450 MW and 2,500 MW respectively to meet the e-cooking load only in wet season10 which indicates e-cooking is feasible only in wet season. However, to practise e-cooking throughout the year, a substantial quantity of peak power may have to be imported during dry season, which requires infrastructure development of cross-border transmission. Alternatively, e-cooking can be practised only in wet season and tariff structure can be based on the demand-side management tool to chop off e-cooking load in dry season. Seasonal tariffs should be set accordingly. In wet season, the tariff should be set to promote e-cooking, whereas in dry season, it should be hiked to cut down the load. In order to roll out e-cooking throughout the year via domestic sources, we must have seasonal storage of at least 2,000 MW. According to the demand forecast of electricity and supply availability, peak power availability via domestic generation is possible only in 2030 to facilitate e-cooking, but it is very unlikely that the figures will actually be realised.
10 June - November
28
High voltage transmission infrastructure in Lumbini Province will be able to facilitate inter- and intra-province power flow to facilitate e-cooking loads. However, inter- and intra-province high voltage transmission infrastructure in Karnali Province will have to be augmented to facilitate e-cooking on a larger scale. Additionally, massive augmentation and reinforcement of sub-transmission lines of 33 kV and 11 kV, along with corresponding 33/11 kV substations and distribution lines of 400 V and 220 V, will be required by 2025 to facilitate e-cooking on a larger scale.
The grid substation step-down transformation capacity of 220, 132, 66 kV/ 33, 11 kV will have to be increased to 8,000 MVA by 2025 from its current capacity of 2,672.5 MVA to facilitate e-cooking on a larger scale.
The distribution transformation capacity of 33 kV, 11 kV/ 400 V, 220 V will have to be increased to 10,000 MVA from its current capacity of 3,241.33 MVA. The distribution transformer capacities of 33 kV, 11 kV/ 400 V, 220 V connected to the distribution system will have to be increased to 100,000 from the current 32,252, which will require an addition of 67,748 new transformers by 2025.
The contingency distribution plan has estimated available peak power capacity during wet and dry seasons over different time horizons and studied the status of the transmission and distribution networks. Considering the status of the transmission and distribution system as well as the investment plan of NEA, e-cooking should be implemented in the region with high grid and distribution substation capacity, as well as networks with shorter radial lengths, such as the urban corridors of Bagmati and Gandaki. After the improvement of inter-province transmission facility along with the distribution system, e-cooking should be implemented in the remaining provinces in a phase-wise manner.
The current and future projects supported by the ADB and World Bank (WB), along with the GoN’s budget for electricity distribution and transmission, will definitely help to address the issue of reliability of electricity supply. Although the NEA and other stakeholders have expressed their commitment to the e-cooking promotion efforts, plans and targets are not triggered at provincial and district levels, nor are such plans reflected in any of the studied municipalities. Therefore, NEA needs to set targets for its province and district offices to increase e-cooking loads.
29

7.1 Product: E-cooking AppliancesThe major types of e-cooking stoves available in the Nepali market are: Resistance type: Use resistive heating coils, hot plate stoves. Infrared: Heat with infrared radiation that passes through ceramic glass supporting pots and pans. Induction: Create a moving electromagnetic field to generate resistance in ferromagnetic stoves and pans,
heat to cook. Other cooking appliances: Electric rice cookers, microwave ovens, electric pressure cooker, roti maker,
electric kettle, etc.
The study is focused on efficient e-cooking appliances (EECAs) having more than 60 percent thermal efficiency. Based on this criterion, the study considered the market potential for infrared, induction and electric pressure cookers. Different brands of induction cooktops, infrared and electric pressure cookers are available in the Nepali market. Based on the availability, choices and number of uses, induction cooktop is the most popular type of EECAs. Baltra, CG, Phillips, Samsung, Surya, and Yasuda are popular brands of induction cooktops. Similarly, the use of electric pressure cookers and infrared cooktops is increasing in urban and semi-urban areas. Appliances come with different capacities (volume), functionalities, and rated power for different brands. Different brands of EECAs are available in Nepal (see Annex 4 for their list).
Rice cooker, kettle, hotpot (water boiler with dispenser), hotplate, roti maker, and microwave oven are other e-cooking appliances widely available in the market. Electric rice cooker is very common.
7.2 Supply Chain/System of E-cooking AppliancesThe market actors comprise the private sector businesses active in different layers of supply of electric stoves, utensils and electricity. Three distinct supply systems that enable households to adopt e-cooking and are in operation:
Supply system for electric stoves Supply system for utensils, and Supply system for electricity
7.2.1 Supply status of electric stovesThe electric stove market in Nepal is at an early stage of development. E-cooking is new and relatively unknown to many households, and it is yet to earn the trust of consumers. However, the electric stove market is gradually evolving, and business competition is becoming visible in terms of price and product differentiation.
The market for e-cooking appliances has been rapidly developing in Nepal since 2018. With potential oversupply of electricity, appropriate policies are in place to encourage e-cooking. Therefore, the current market can be said to be in the initial stage, with numerous challenges to be addressed. For instance, there are no electric stove-testing facilities. There are standards for stove categorisation but no dedicated stakeholders
7. SUPPLY CHAIN OF E-COOKING APPLIANCES
30

have been assigned for it. A few stove maintenance services are available, but they are not easily accessible. None of the rural electrification projects were designed for e-cooking. There is a great need and urgency for upgrading the infrastructure for electricity supply suitable for e-cooking and developing the market further.
There are different EECA brands available in the market, out of which the Chaudhary Group (CG) is the most popular brand. CG is a Nepali company and manufactures all its products in China and has the highest market share in Nepal. They have 35 to 40 percent share in total sales of e-cooking appliances in Nepal. At present, their annual induction cooktops sale is around 10,000, which is growing at 20 percent every year. They have more than 200 dealers all over Nepal, but only a few of them sell EECAs. Baltra and Phillips are other major suppliers of e-cooking appliances in Nepal. Diamond brand is also coming up as a new supplier of induction cooktops.
However, the electric stove market is limited to big cities with small retail networks in peri-urban and rural areas. Almost all EECAs are imported from China and India. According to CG, local manufacturing and assembling of induction cooktops are not viable. The supply chain starts with importers, who are often big business houses. They have dealer networks in city centres. Local retailers bring the stock from these dealers and sell them to consumers. The electric stove business constitutes only a very small part of business for importers and dealers, who mostly deal with household electric appliances, including kitchenware. The retailers maintain only a small inventory of the products. Although there is a huge potential for e-cooking market in Nepal, there are various gaps at present. Therefore, there is need for government and development organisation financing and support to narrow the gap and make the EECA market vibrant and sustainable.
7.2.2 Supply system of utensilsThe utensils commonly available in the market can be used on the infrared stove, whereas induction stoves need compatible utensils. To reap maximum benefit from the induction stove, at least a pressure cooker, saucepan and karai (wok) are needed. A pressure cooker is generally used for cooking main dishes like lentils and rice, a wok is used for cooking vegetables, while a sauce pan is used for boiling tea, water and milk. As most Nepali households possess round-bottom woks, infrared stove users also need to purchase flat-bottomed woks. A household using kasaudi (cauldron) for cooking rice and lentils also needs to purchase a pressure cooker.
Although normal and induction-compatible pressure cookers, saucepans and woks are imported, such products have also started being manufactured in Nepal. The supply chain for utensils starts from manufacturers or importers and at the subsequent levels are dealers and retailers. The retailers dealing in kitchenware are more likely to include electric stoves in their menu than the retailers dealing only in electrical items.
7.3 Prices of EECAsDifferent brands and quality of EECAs are available in different price ranges. The prices vary depending on the quality, attributes/functionalities and brands. Well-established brands are generally costlier and leave less margin for retailer than new and less popular ones. The price range, supply chain and support services of EECAs are presented in table 7.1.
31

Table 7.1: Price range of EECAs and status of supply chain
Types of Stove Price range (in NPR) Supply chain and support services
Induction cooktops2,500–12,000 Weak supply chain in peri-urban and rural areas
Difficult to get in large quantity on time Repair and maintenance services available in large cities only
Infrared cooktops2,500–15,000 Very limited supply
Difficult to get repair services on time and in accessible locations
Electric pressure cookers
6,000–17,000 Very limited supply Difficult to get repair services on time and in accessible locations
* Note: Price range of popular brands among general public only Source: Consultations with private sectors, 2020.
An import duty of 15 percent is imposed on household electric cooking appliances. The government has recently made provision of 5 percent rebate on induction cooktops to promote them. Despite the rebate, the 10 percent import duty is still high. From FY 2021/22, the customs duty on induction cooktops will be a mere 1 percent, and, as a result, the market prices are expected to go down further.
7.4 Market TrendsImport of e-cooking appliances is in an increasing trend. According to the Customs Department, in the first nine months of FY 2020/21, 125,302 induction stoves and 355,688 rice cookers were imported. There are no separate data for infrared stoves. The data is not as reliable as for the previous fiscal years. Although separate reporting on induction stoves and rice cookers started in FY 2018/19, the major portion of the data were reported under the broad category of e-cooking appliances.
The e-cooking market is gradually expanding in terms of total sales and geographical coverage. According to CG, the demand for e-cooking appliances is increasing by around 20 percent annually in recent years. The company sells around 10,000 EECAs annually at present. The e-cooking market is in a very initial phase. The growth rate seems high, but the broader sales pattern is still unclear. The major trends contributing to the positive growth of the market are: i) more stimulus efforts are coming from the government and development partners providing thrust to the market, ii) existing private sector players are investing more to cater to the growing market demand, and iii) new private players are entering the business.
In FY 2018/19, more than 428,840 tons of LPG, worth NPR 35.54 billion, was imported into the country. Half of the imported LPG is used for household cooking purposes. The trend shows significant rise in LPG import in the coming years in the business as usual scenario. If this trend continues, it will be difficult to limit the use of LPG to less than 40 percent of households, as per the GoN's decision to meet the SDG target. Therefore, e-cooking promotion will help in achieving the target.
7.5 CompetitionThe main competition of the e-cooking appliances is with the LPG stove, considering the combustion efficiency, time saving, convenience, cost, and aesthetic value. However, from the running cost perspective, e-cooking is much cheaper than other options.
In case of LPG for household cooking purpose, a family needs around 9-12 cylinders every year. On average, it costs NPR 1,131-NPR 1,478 per month. Relatively, e-cooking is much cheaper than LPG (Table 7.2). Thermal efficiency of e-cooking appliances is much higher than that of LPG stoves when the heat transfer efficiency from the burner to the pot is considered. LPG stoves have 40 percent efficiency compared to 84 percent for induction cooktops. According to a study conducted by Tribhuvan University, Institute of Engineering,
32

in 2020, the running cost of induction cooktops is 42.2 percent cheaper than that of LPG stoves.11 A study conducted by CCA in 2019 shows that cooking on induction cooktops is about 47 percent cheaper than cooking on LPG stove with respect to fuel cost. According to the study, the monthly running costs for LPG, firewood and induction cooktop are NPR 755, NPR 613 and NPR 400 respectively.
As e-cooking appliances require frequent repair and maintenance services compared to LPG stoves, a separate cost analysis and comparison has been done for five years (Table 7.2).
Table 7.2: Comparative cost analysis of cooking on LPG and electricity
Cost type LPG (in NPR)
Electric Induction cooktop (in NPR) Remarks
Capital cost4,825 7,500 LPG stove: NPR 2,500, LPG cylinder: NPR 2,325,
Induction stove: NPR 4,000, Induction-compatible utensils: NPR 3,500
Running cost for 5 years
65,250 37,030 9 LPG cylinder (about 780 kWh electricity) use per year @ NPR 1,450/cylinder and NPR 9.50/kWh for electricity
Maintenance cost in 5 years
400 1,000
Total 70,475 45,530
The above table indicates that cooking on LPG can be replaced with e-cooking as e-cooking on induction cooktop is much cheaper than cooking on LPG.
7.6 Entry Barriers for SuppliersIn Nepal, there are no policies or regulations that restrict new companies from engaging in the e-cooking business. Registration of the company with the government body concerned is mandatory and the company must receive an approval to deal with electrical or electronic goods from the department concerned. Similarly, general regulatory systems should be followed for manufacturing, importing and trading in goods. However, there are no formal requirements other than basic protocols.
There are new actors entering the e-cooking market business, such as Diamond induction cooktop and E-Chulo infrared cooktop. The e-cooking market is growing rapidly in recent years.
7.7 Issues and Challenges for Supply Chain ActorsMost of the suppliers for e-cooking are located in big cities. They do not have networks in peri-urban and remote areas. The after-sales service centres, mainly those of repair and maintenance, are located only in big cities; so, users from remote areas find it difficult to access them. Providing timely repair and maintenance services is a big challenge in the promotion of e-cooking appliances. The demand for e-cooking appliances is limited to urban areas where people are constantly searching for alternatives to LPG due to its uncertain availability. In rural areas, the demand for e-cooking appliances is very low due to lack of awareness. Due to the uncertain demand for e-cooking appliances, rural retailers do not stock them. Therefore, they purchase e-cooking appliances only after receiving orders from buyers.
One of the challenges in the e-cooking sector is quality assurance. The established companies, such as Baltra, CG and Phillips, are relatively aware and sensitive towards quality assurance. They provide warranty services
11 Shrestha, J.N. et. al. (2020)
33
that range from simple repair and maintenance to replacing the product within the warranty period. Less common brands, especially from China, are sold by retailers at their own risk.
7.8 Support Services7.8.1 Repair and maintenance service centresMost big brands have service centres in main cities, and most of them are located only in Kathmandu. Rice cookers, hotpots, water boilers, and microwave ovens have well-established after-sales service in urban and peri-urban markets, whereas the after-sales service for induction, infrared stoves and electric pressure cooker is not satisfactory.
Besides company-authorised service centres, independent repair and maintenance service providers play an important role in the market chain. Some e-cooking appliance stores provide the services irrespective of the brand. There are very few independent service centres in Kathmandu that provide repair services for induction cooktops.
7.8.2 Stove-testing centre and quality assuranceWith the technical and financial support of the CCA and active involvement of the NBSM, Electric Stove Standards and Standards Implementation Strategy in Nepal has been developed. But electric stove-testing facilities are not being accredited by the NBSM yet. The AEPC is working closely with the NBSM to create an enabling environment for the enforcement of Nepal Electric Cooktops Standards. Efforts are ongoing for establishing a dedicated testing laboratory for e-cooking appliances. Desginated testing centres are important not only for quality control and monitoring of e-cooking appliances but also for promoting innovation and investment in high quality products.
7.8.3 Promotion servicesAdvertisements of e-cooking appliances are rare in public media. However, the appliances can be seen on the shelves of outlets in cities. Recently, development projects have launched mass awareness campaigns, focusing on the benefits of e-cooking and promoting e-cooking as the best clean cooking option, with the objective of replacing inefficient stoves and fuels with clean cooking. Similarly, mass promotion of e-cooking is attracting interest of policy makers.
7.9 Analysis and ConclusionThe electric stove market in Nepal is at an early stage of development. For many consumers, e-cooking is a new and relatively unknown technology and is yet to gain consumers' trust. However, the electric stove market is gradually evolving, and business competition is becoming visible in terms of price and product differentiation.
A range of e-cooking appliances are available in the market, but they are small in number and have low market penetration. Currently, the e-cooking market is limited to big cities with little retail network in peri-urban and rural areas. There are established supply chains of electric appliances in different city centres, but there is no supply chain in rural areas. In rural areas, entrepreneurs have low risk-taking appetite and capacity. The private sectors still have doubts about the demand. There is need for strengthening the supply chain of e-cooktops and compatible utensils to different parts of the country. Additionally, there is need for improving and ensuring timely repair and maintenance services for e-cooking appliances. There is also a knowledge gap between promoting agencies and market actors, including federal government, local governments, stove manufactures and consumers on standards, certification, and labelling of e-cooking appliances, which needs to be bridged.
34

8.1 Status of Cooking Fuel/Stove in Use Seventy one percent of households in our survey locations use biomass fuel for cooking. A majority of 50.3 percent of them use it as primary fuel and the remaining 9.8 percent use it as secondary fuel. Among the households who use biomass as primary fuel, 41.9 percent use it with traditional stove and a mere 8.4 percent use it with ICS.
A significant 69.3 percent of households also use LPG. Of such households, 46.1 percent use LPG as primary cooking fuel, whereas 3.5 percent use biogas as primary fuel.
Only 8.1 percent of households use electric rice cookers. Among them, 6.8 percent use it as secondary cooking appliance and 1.3 percent use it as tertiary cooking appliance (Figure 8.1). A significant number of households (18.1 percent) use pressure cookers.
8. CONSUMER PREFERENCES
Figure 8.1: Cooking fuel/stove in use in surveyed locations (by type)
Not applicable
Tertiary
Secondary
Primary
Traditional biomass stove
Metalic ICS used for room heating also
Improved biomass stove with chimney (mud)
Biogas
98.1
23.2
41.9
0% 10% 20% 30% 40% 50% 60% 70% 80% 90% 100%
6.8 46.1
8.110.6 50.0
Electric rice-cookerLPG stove
Source: Field survey, 2020
The use of EECAs, like induction, infrared and electric pressure cooker, is limited to metropolitan cities such as Kathmandu, Pokhara, Birtanagar, Butwal, and Birgunj. They were not found used in the sampled households.
The findings are close to the national figures. According to the Multi-Tier Framework (MTF) survey of the World Bank (2019), 71.6 percent of households use biomass stoves as primary cookstove. An open fire stove is the primary stove for 15.1 percent of households, whereas the traditional stove is the primary stove for 47.6 percent, making it the most common type of stove used as primary stove. About 8.9 percent of households use improved biomass stoves as primary stove, and 26.3 percent use the LPG stove, making it the most common primary stove. Biogas stoves are used by 2 percent of the population, and a very small portion of the population uses electric and solar cookers.
35

8.2 Expenditure on Cooking Fuel8.2.1 Annual fuel consumptionThe households using firewood for cooking consume on average 1,846 kg/HH of firewood a year. Similarly, LPG users consume 75 kg/HH of LPG a year. Among the sample provinces, Province 2 is the only province that uses dung cake for cooking. The average annual use of dung cake for cooking is 275 kg/HH. Annual average electricity consumption is about 456 units. Table 8.1: Annual average fuel consumption in a household
Province Location Wood (kg) LPG (kg) Electricity (unit) Dung (kg)
KarnaliRural 3,636 60 210 0Urban 2,089 71 678 0Total 2,708 67 491 0
LumbiniRural 951 34 309 0Urban 1,149 38 447 0Total 1,086 37 403 0
Province 2Rural 1,828 74 434 333Urban 1,004 140 497 100Total 1,475 126 471 275
TotalRural 2,312 55 316 333Urban 1,519 85 542 100Total 1,846 75 456 275
Source: Field survey, 2020
8.2.2 Expenditure on cooking fuelOn average, a family spends NPR 8,327 (NPR 8,088 for fuel plus NPR 238 for transportation) for LPG and NPR 3,585 for electricity per year. Spending on LPG and electricity is higher in urban areas than in rural areas (Table 8.2).
Table 8.2: Annual household expenditure on LPG and electricity (in NPR/HH)
Province Rural/UrbanLPG Cost
ElectricityFuel Transport
KarnaliRural 6,341 423 2,100Urban 7,500 500 6,782Total 7,036 469 4,909
LumbiniRural 3,829 8 583Urban 4,570 30 938Total 4,309 22 825
Province 2Rural 8,996 100 4,571Urban 14,818 71 5,118Total 13,736 76 4,888
TotalRural 5,970 247 2,568Urban 9,117 234 4,210Total 8,088 238 3,585
Note: The electricity cost includes the running total electricity cost of a family used for different purposes like lighting, cooking, communication, etc. Source: Household survey, 2020
36

A study carried out under the MECS programme, Gender Responsive Electric Cooking in Nepal, shows spending of NPR 315/month for induction cooktop users compared to NPR 122/month for non-users. There was a net increment of NPR 193/month in electricity bills after induction cooktops started being used. (Energia, 2021)
8.2.3 Fuel collection timeA significant amount of time, 3-4 hours/bhari, is spent on collecting firewood and also LPG from the market. Average annual time spent on firewood collection is 214 hours (table 8.3).
Table 8.3: Time spent on fuelwood collection (in hours)
Province LocationWood LPG Dung cake
per bhari Annual per cylinder Annual per bucket Annual
KarnaliRural 3.3 403 1.1 6 - -
Urban 3.0 213 1.1 6 - -Total 3.1 282 1.1 7 - -
LumbiniRural 4.5 149 0.3 1 - -
Urban 4.7 183 0.4 2 - -Total 4.6 170 0.4 2 - -
Province 2Rural 2.7 167 0.8 5 1.3 56
Urban 1.3 44 1.4 15 0.5 7Total 2.1 105 1.3 13 1.1 39
TotalRural 3.4 265 0.8 4 1.3 56Urban 3.4 177 1.0 6 0.5 7Total 3.4 214 0.9 5 1.1 39
Note: Per bhari firewood is equivalent to 30 kg; per cylinder LPG is 14.2 kg and per bucket dung cake is equivalent to around 8 kg.
8.3 Main Food ItemsThe main food items cooked in common Nepali households are rice, Dhindo (millet porridge), daal (lentil soup), and vegetable curry. The frequency of cooking of different food items is shown in table 8.4.
Table 8.4: Main food items and frequency of their cooking a month (Unit: % of HHs)
Food items Twice a day regularly
Once a day regularly
Mostly but not regularly Occasionally Never
Rice 37.1 50.6 12.3 - -Dhindo 0.6 17.1 4.8 41.3 36.1Daal (Lentil soup) 37.1 56.1 5.2 1.6 -Vegetable curry 37.7 48.1 11.6 1.0 1.6Snacks 36.8 9.7 12.9 10.6 30.0Tea 35.8 39.7 16.8 2.0 5.8
Source: Household survey, 2020
Stove or fuel stacking is quite common in Nepal. People prefer to use LPG stove for making tea and biomass stoves for cooking foods that take a long time to cook. Most cooked food items can also be easily cooked on EECAs, as reported by MECS ECO-1 Nepal partners and Energia (2021).
37

8.4 Electric Appliances in UseThe use of electric appliances is increasing in Nepal, and a significant number of households are already using them. The majority of the surveyed households own mobile phones, television sets and fans. A significant number of them also own iron, radio, refrigerator, rice cooker, electric jugs, computer, and water pumps (Table 8.5).
Table 8.5: Use of electric appliances in surveyed locationsElectric appliances Number %Rice cooker 60 19.4Hot plate stove 1 0.3Induction 0 0.0Infrared 0 0.0Electric pressure cooker 0 0.0Electric jug 48 15.5Fans 165 53.2Iron 94 30.3Refrigerator 38 12.3Television 190 61.3Radio 70 22.6Washing machine 1 0.3Water pump 34 11.0Mobile phone 285 91.9Computer 34 11.0Mixer 38 12.3
Source: Field Survey, 2020
8.5 Preferences and Need8.5.1 Interest to switch to e-cookingVery few households are practising e-cooking, which suggests that not many families are aware of it. A total of 44.5 percent of households reported that they are not aware of e-cooking (Table 8.6). There are also regional disparities with respect to e-cooking. In Karnali Province, 91.8 percent of families are not aware of e-cooking, whereas, in Lumbini Province, 100 percent of households know about e-cooking (Table 8.6). Electricity and transportation access is much better in Lumbini compared to Karnali. Similarly, human development index of Lumbini is much better than that of Karnali. Lumbini is in the southern part, mostly plain lowland bordering India, while Karnali is in the northern part, mostly covered by mountains and high hills. The combined effects of these factors might be the reason behind the vast disparity in awareness level.
Table 8.6: Awareness of e-cookingProvince Total respondents Not aware respondents %Karnali 110 101 91.8Lumbini 100 0 0.0Province 2 100 37 37.0Grand Total 310 138 44.5
Without adequate information, families are not able to clearly state whether they want to switch to e-cooking or not. However, all the respondent families are definitely looking for better solutions to their existing cookstoves, as they see lots of negative aspects with the cookstoves they are using.
38

Table 8.7: Positive and negative aspects of different stove typesStove types Positive aspects Negative aspects
Biomass traditional stove
Free availability of firewood Food is tastier Smoke is used to protect timber Smoking meat Room heating Use of local resources
Air pollution Difficult to cook Negative health impact Time cost is high for fuel collection and cooking Difficult to clean utensils
Biomass ICS Clean pots Saving of firewood Cheaper solution
Difficult to ignite in the beginning Household air pollution
LPG
Clean cooking Easily available Easy to cook Easy to ignite Provides instant heat Saves time Clean pots
Irregular supply Difficult to get in time Costly Need to bring from far Imported Safety concern
Biogas
Clean cooking Saves time Saves money Clean kitchen
Very high initial investment Unavailability of repair and maintenance services Decreasing number of livestock
Source: Field survey, 2020
“In the past, all families in my municipality used traditional biomass stoves. As a result, respiratory problems were very common. In recent years, many families have shifted
to LPG and biomass ICS, and the number of families with respiratory problems has declined. For clean and sustainable solution, we have to go for e-cooking.
The municipality is ready to provide necessary support for promoting e-cooking.”
- Ms Mana Kumari Pun, Deputy Mayor, Rolpa Municipality
8.5.2 Motivation towards e-cookingThe main motivating factors for families to use e-cooking appliances are convenience to use, time saving and fuel efficiency (Figure 8.2). However, there are still a large number of families who have the notion that e-cooking is costlier than other cooking options. Likewise, many people think that it is not safe to cook food on e-cooking appliances.
A majority of 64.8 percent of households are interested to switch to e-cooking. Among them, 38.7 percent want to switch only if discounts are offered on EECAs and 6.1 percent want to switch only if soft loans are available. A significant 16.8 percent of households are undecided as they are not fully aware of e-cooking. With respect to income groups, 36.6 percent of poor families are unable to decide due to their poor economic conditions as well as lack of adequate knowledge. About 18.4 percent of families do not want to switch to e-cooking, maybe due to lack of knowledge and lack of confidence in the technology (Table 8.8).
39

Table 8.8: Interest to switch to e-cooking
Settlement StatusYes
No Undecided Yes If incentive
from projectIf loan
available
Urban
Rich (n = 35) 20.0 62.9 5.7 11.4 0.0Higher middle income (n=36) 8.3 52.8 5.6 25.0 8.3Low middle income (n = 45) 22.2 42.2 8.9 17.8 8.9Poor (n = 58) 15.5 25.9 3.4 6.9 48.3Total (n 174) 16.7 43.1 5.7 14.4 20.1
Rural
Rich (n = 18) 16.7 77.8 0.0 0.0 5.6Higher middle income (n=9) 33.3 55.6 0.0 0.0 11.1Low middle income (n = 66) 25.8 22.7 10.6 31.8 9.1Poor (n=43) 23.3 25.6 4.7 25.6 20.9Total (n=136) 24.3 33.1 6.6 23.5 12.5
Total
Rich (n = 53) 18.9 67. 9 3.8 7.5 1.9Higher middle income (n=45) 13.3 53.3 4.4 20.0 8.9Low middle income (n=111) 24.3 30.6 9.9 26.1 9.0Poor (n=101) 18.8 25.7 4.0 14.9 36.6Total (n=310) 20.0 38.7 6.1 18.4 16.8
Note: The table is based on the responses of the households who do not have full information/knowledge about e-cooking. With adequate information, the response may be different.
33%
1%
35%
2%
27%
2%
Comfort
Soundless
Cost saving
Easy to do other works
Time saving
Clean air
Figure 8.2: Motivational factors for using e-cooking appliances
Source: Household survey, 2020: n = 139** Note: Among 172 aware households, there was no response from 33 respondents
40

Electric pressure cooker saves Indra Bahadur's cooking hours
Indra Bahadur Adhikari of Ramche, Kavre has been using an electric pressure cooker for the past one and a half months as part of research to examine the viability of e-cooking appliances for cooking regular Nepali meals in rural Nepal. Earlier, he was using LPG as primary fuel for cooking. However, with the use of the electric pressure cooker, the LPG consumption has reduced significantly. Said he, “The electric pressure cooker has been very beneficial to me. Not only does the food cook faster and saves a lot of time but also tastes better. Now, I can cook food in the electric pressure cooker and leave it to cook and also do other chores simultaneously.” Moreover, the electric pressure cooker does not leave black spots like woodstoves do. So, cleaning pots is also easier.
Mr. Adhikari has been cooking regular meals on the electric pressure cooker, such as rice, vegetables, lentils, and meat. It takes him around two hours to cook all four items. According to him, frying on e-cooker takes longer than stewing, but if it is covered with a lid, it cooks faster. One electric pressure cooker is sufficient to cook regular meals for his family of three. His electricity consumption per month is around 40 kWh.
However, Mr. Adhikari is concerned about power outage. During power cuts, he is forced to use the woodstove. Likewise, the electric pressure cooker comes with only one pot; so he has to repeatedly transfer the cooked food to another utensil and clean the pot to cook another dish. He thinks that, being able to cook more than one food item simultaneously is time saving and beneficial. Overall, he is glad that the electric pressure cooker is helping him lead a healthy life with smokeless kitchen. He is happy to share his experience with other households to promote e-cooking in the community.
8.6 Capacity and Willingness to Pay of Consumers8.6.1 Willingness to payAccording to the preference model/theory, preference or willingness of consumers can be revealed by their purchasing habits. The model can determine the price customers are willing to pay by observing their spending on similar or substitute products. LPG stove and e-cooking appliances are substitute products, which has also been confirmed by the key stakeholders and potential customers. So, based on existing spending of households on LPG, the study team calculated the willingness to pay for e-cooking.
41

A positive correlation seems to exist between income level and expenditure on LPG. The families with higher income spend more. Similarly, urban families spend more than rural families (Table 8.9).
Table 8.9: Annual expenditure on LPG for cooking
Location Income status Number Annual expenditure on LPG (in NPR)
Urban
Rich 35 13,174Higher middle income 33 10,853Low middle income 44 8,565Poor 42 6,032Total 154 9,412
Rural
Rich 8 9,869Higher middle income 8 6,794Low middle income 55 6,173Poor 29 4,559Total 100 6,050
Total
Rich 43 12,559Higher middle income 41 10,061Low middle income 99 7,236Poor 71 5,430Total 254 8,088
Source: Household survey, 2020
The average annual spending on LPG for cooking is NPR 8,088 (NPR 674/month). A study carried out in Temal by Energia shows that an induction cooktop user spends NPR 315/month. The analysis shows that the monthly running cost of e-cooking is within users’ capacity or willingness to pay.
The initial capital cost on LPG stove is NPR 5,000/HH. A set of induction cooktop, including three types of induction-compatible utensils, costs around NPR 7,000. An electric pressure cooker also costs almost the same, while infrared is a little cheaper at around NPR 4,500/piece. Based on this, it can be said that the capital costs of EECAs are similar to LPG stove, which is within the willingness to pay for majority of customers.
8.6.2 Capacity to payEconomists consider an “affordable” energy bill to be within 6 percent of income12. The total energy costs include expenses for lighting, cooking and other energy services. Likewise, there is also stacking of fuel for cooking. According to CBS 2016, average spending in Nepal is 4 percent of total spending, on education, 5.5 percent on durables and 2.2 percent on utilities. Considering all these facts, we assumed 5 percent of income as the affordable electricity cost for cooking, which was also confirmed during FGDs.
In terms of spending, poor families spend more than other income groups on LPG. They spend more than 5 percent of their total monthly expenditure on LPG, while other groups spend less than 4 percent. In the monthly expenditure basket, the portion of LPG spending is lowest for rich families (Table 8.10).
12 Boyce D. and Wirfs-Brock J., 2016, Chandler A., 2016, Drehobl A., Ross L., and Ayala R. (2020)
42

Table 8.10: Expenditure on LPG with respect to total household expenditure
Location Status Household expenditure (NPR/month)
Expenditure on LPG(NPR/month) % of total
Urban
Rich (n = 35) 55,157 1,098 2.0Higher middle income (n= 36) 30,747 904 2.9Low middle income (n = 45) 22,653 714 3.2Poor (n = 58) 7,898 503 6.4Total (n= 174) 25,948 784 3.0
Rural
Rich (n = 18) 46,222 822 1.8Higher middle income (n= 9) 19,222 566 2.9Low middle income (n = 66) 15,644 514 3.3Poor (n = 43) 6,849 380 5.5Total 17,147 504 2.9
Total
Rich (n = 53) 52,123 1,047 2.0Higher middle income (n= 45) 28,442 838 2.9Low middle income (n = 111) 18,486 603 3.3Poor (n = 101) 7,451 453 6.1Total (n = 310) 22,087 674 3.1
Source: Household Survey, 2020
The spending on LPG looks within capacity to pay for groups other than poor families as it is below 5 percent of their total monthly expenditure.
While using only EECAs for the entire month for cooking, the electricity bill per household comes around NPR 625/month (Table 7.2). This amount does not seem within capacity to pay for the poor families as it is more than 5 percent of their total monthly expenditure. So, poor families will need discount on electricity bills to use EECAs as their primary cookstove. Or else, they will not use it at all or will use it only as secondary or tertiary cooking option.
The initial capital cost investment for buying EECAs seems within capacity to pay for the rich and higher middle income groups, whereas, for the poor income group, it is beyond capacity to pay, as the investment requirement is more than 2 percent of their annual income. For the lower middle income group, the initial investment required for the induction cooktop and electric pressure cooker also seems beyond capacity to pay. However, since it is within 5 percent of their annual income, if the loan facility is made available to them, they will be able to afford it.
Table 8.11: Initial investment for EECAs and capacity to pay
Income group Annual income*Capital cost
as percentage of annual incomeInduction set Infrared EPC
Rich (n = 53) 625,476 1.2 0.7 1.0Higher middle income (n= 45) 341,304 2.2 1.3 1.9Low middle income (n = 111) 221,832 3.4 2.0 2.9Poor (n = 101) 89,412 8.4 5.0 7.3
* Proxy income based on their annual expenditureSource: Household survey, 2020
43

8.7 Potential Demand for EECAs in NepalConsidering the existing access and capacity of the distribution system, there seems potential demand for more than 600,000 EECAs in Nepal (Table 8.12).
Table 8.12: Technically feasible number of EECAs in Nepal
Province Number of HHs* Electrified HHs (%)
Technically feasible (%)
Total potential HHs (no.)
Province 1 991,750 75.90 15 112,911Province 2 932,087 79.80 15 111,571Bagmati 1,269,144 90.30 15 171,906Gandaki 577,682 87.40 15 75,734Lumbini 884,757 81.00 15 107,498Karnali 298,174 27.00 15 12,076Sudhur Paschim 469,703 58.90 15 41,498Total 5,423,297 633,193
* Source: Central Bureau of Statistics (CBS), Nepal
Efforts are being made to improve the distribution systems; so, the factors used under technically feasible EECAs will increase with improvement in the electricity transmission and distribution system. Likewise, the electrification rate is also improving rapidly. The table shows only the existing potential.
Not all households under the technically feasible category may adopt e-cooking due to various reasons, including low capacity to pay. So, based on the findings of the household survey, a calculation has been made, which is shown in table 8.13.
Table 8.13: Potential demand of EECAs in Nepal by 2023/24
Province Total potential HHs*
Demand
Yes If project support If loan available TotalProvince 1 112,911 22,582 43,696 6,888 73,166Province 2 111,571 22,314 43,178 6,806 72,298Bagmati 171,906 34,381 66,527 10,486 111,395Gandaki 75,734 15,147 29,309 4,620 49,076Lumbini 107,498 21,500 41,602 6,557 69,659Karnali 12,076 2,415 4,673 737 7,825Sudhur Paschim 41,498 8,300 16,060 2,531 26,891Total 633,193 126,639 245,046 38,625 410,309
Source: *Calculation based on Table 3.1, 8.8 and 8.12.
If coordinated efforts are made, there is potential for the promotion of about 410,000 EECAs by 2023/2413, as shown in table 8.13.
13 Final year of 15th Development Plan
44

However, it depends on the priority of the provincial and local governments. The promotion of e-cooking is a top priority of Gandaki Province, which has a clear plan, whereas Bagmati, Lumbini, Province 1, and Province 2 have shown interest, but none of them has developed a clear plan. Karnali and Sudhur Paschim Provinces, it seems, will take some time to achieve e-cooking promotion at a scale.
8.8 Analysis and ConclusionWith increased knowledge of the negative impacts of HAP, the aspiration for clean cooking has been increasing. As a solution, families who desire improved indoor air quality are opting for LPG. In terms of both clean cooking solution and cost, e-cooking is a better option than LPG. So, it has potential for replacing LPG and biomass fuel for cooking. However, there is a knowledge gap on cost and benefits of e-cooking as well as required safety measures such as poor wiring, inadequate meter capacity, and a lack of knowledge about electrical safety among consumers. Furthermore, consumers have doubts about the reliability of electricity supply, which can hinder the uptake and sustained use of e-cooking. Cooking behaviour needs substantial change for the demand for EECAs to increase, especially in rural and peri-urban areas. For changing the practice, attitude and behaviour in favour of e-cooking adoption, there is a need to increase awareness of e-cooking and ensure quality of EECAs through quality control monitoring and labelling. Although e-cooking is cheaper than LPG, it is still beyond the capacity of poor families to afford. The potential customers have limited access to finance due to apprehension of banks to provide small consumer loans, as it involves high financing cost and hassles for the vendors for both upfront and working capital. Therefore, a mix of subsidy and access to finance should be in place for poor families to adopt e-coooking.
45

Although e-cooking is in a very initial phase in Nepal, the potential for it is very high. It is regarded as the best technology based on a local energy resource which can reduce household air pollution, leading to significant health and environmental benefits. Therefore, e-cooking is a top priority of the government and other key stakeholders. Recently, EECAs have witnessed increasing demand, especially in residential applications, although lots of gaps still exist in the market system.
Electricity is expected to be cheaper with substantial increase in generating capacity in the near future. At present, Nepal has about 1,200 MW of installed capacity of electricity. The government is targeting to achieve 15,000 MW by 2030. Currently, there are 172 projects, with a total capacity of 4,642 MW, at different stages of construction, after obtaining electricity generation licence (white paper). It indicates that Nepal is all geared for e-cooking.
However, electricity transmission and distribution capacity is still inadequate to go for large-scale e-cooking promotion. The present level of electricity supply infrastructures, market system of electric appliances and demand can support the uptake of about 410,000 EECAs by 2023/24. A much faster transition and greater uptake are possible if significant investments are made, electricity distribution system is further improved, and electricity access rate with demand-side management is improved.
The rapid growth of EECAs has been constrained by a combination of factors, which include high upfront investments leading to high risk to suppliers without the knowledge of the actual demand. As EECAs are imported, there is need for bulk demand. However, making bulk imports without the knowledge of the actual demand would be risky, as the competition between importers and suppliers is not significant.
Another constraint on the scalability of the market is the implementation of the standards for EECAs, which has resulted in products that do not meet the standards flooding the market. Moreover, households’ confidence is impaired by the unavailability of support services for such low quality products.
The electricity distribution infrastructure in rural areas is not in a state that can meet the demand for electricity if all households use electric appliances for cooking. The reliability of electricity supply is another challenge. Likewise, people are not aware of the different aspects of e-cooking; so, the demand for EECAs is still very low. Therefore, development and assurance of reliable and sufficient electricity supply is essential to replace traditional biomass and LPG with EECAs.
9. CONCLUSION: POTENTIAL FOR E-COOKING IN NEPAL
46

9.1 Enablers and Barriers in E-cookingThere will be significant market opportunities for e-cooking in the near future, provided the key issues are addressed. Table 9.1 summarises the key enablers and barriers affecting the key e-cooking market issues.
Table 9.1: Summary of enablers and barriers for key issuesKey issues Enablers Barriers
Policy/Regulation
Electric cooking receiving policy attention, as reflected in the government’s white paper and the 15th Plan
Reduction in customs duty
Lack of coordinated efforts Lack of a national strategy supported by
a comprehensive study
Financial ecosystem
Increasing public funding with strong commitment
Potential for working with local financial institutions
Low public funding allocation Lack of interest in retail lending among
banks
Stakeholder analysis and project mapping
High priority given by different government, development, private sector, research, utility, and other organisations
Lack of coordination Diverse implementation models and
financial incentive rates
Electricity supply Rapidly increasing electricity generation Expected electricity surplus in the near future
Inadequate distribution infrastructure and reliability of electricity supply
Supply-side analysis
Established supply chain of electric appliances in a number of city centres
Absence of supply channels in rural areas
Low risk-taking appetite and capacity of private sectors
Consumer preference
Increasing demand for clean cooking stove/fuel Increasing awareness of negative health impact
of HAP
Lack of awareness of the benefits of electric cooking
Reluctance to change existing cooking practices
Low capacity to pay
Environmental considerations
Renewable source of electricity High potential for reducing GHG emissions
from burning solid biomass fuel for cooking
Continuing import of fossil fuel-based electricity
9.2 Transition to E-cooking ScenarioAt present, the demand for EECAs appears to be more prevalent in big urban centres, like Kathmandu, Pokhara, Biratnagar, and Butwal. Considering the uncertainty in the supply of LPG, as it is dependent on various external factors, families are taking up e-cooking as a substitute for LPG for their energy security. With increasing reliability of electricity supply, the customers’ confidence is increasing. The market for e-cooking is gradually becoming stronger with the presence of adequate number of supply chain actors.
Interventions are required to improve households’ willingness to use e-cooking appliances by leveraging price and quality, as well as creating awareness of health benefits, safety and efficient use of electricity. The supply side needs to adhere to the standards and strengthen the supply chain infrastructure, along with better load management, especially during peak and dry seasons. Additionally, many poor families do not have the capacity to pay electricity bills. Therefore, to address this, as well as manage electricity supply to meet e-cooking demand, the existing tariff rate needs to be revised and also smart electricity meters introduced. Introduction of smart meter can make differential tariff rates for e-cooking promotion possible.
47

LPG seems to be the preferred option for families who are educated and aware, have high income, and have easy access to the market. LPG users have visible financial benefits of adopting e-cooking compared to LPG. Therefore, compared to biomass fuel users, LPG users seem to be the first adopters of EECAs. In large cities, potential exists for e-cooking promotion led by private sectors without any direct public funding for EECAs. For urban areas, improvement in electricity supply infrastructures and mass awareness alone are inadequate to boost e-cooking.
In rural and peri-urban areas, majority of households still use solid biomass fuel for cooking as they are unable to switch to e-cooking without external support, due to which air pollution is much higher in such areas. Therefore, the government and development organisations should support them to shift to e-cooking as it has high economic and social benefits and little direct financial benefits. Likewise, there is a chicken or egg causality dilemma between the supply of and demand for EECAs, which can only be eliminated with external interventions. Coordinated support packages from public sectors are required to establish a vibrant and sustainable market for EECAs. In rural areas, interventions can be started in CREE-managed electricity distribution areas as they have better presence and rapport at local level. The member households in rural areas are consuming electricity for lighting purpose only. There are more than 300 CREEs active in 54 districts, which can gradually be expanded to NEA-managed and off-grid areas. A continuous research should be carried out to observe the evolution of households’ preference, acceptance and switching patterns over the years to track the progress and take corrective measures for e-cooking.
48

Recommendations for addressing the two most critical issues for unlocking the high potential for e-cooking in Nepal are: i) improve the reliability of electricity supply and ii) revise the tariff to encourage e-cooking, i.e. increasing the quantity of units in the lower bands to accommodate the additional demand created by e-cooking. Similarly, the electricity distribution infrastructure needs to be improved to sustain the demand for e-cooking. A national clean cooking strategy is urgently required to facilitate coherent planning and investment, clarify the roles of different tiers of government, and to facilitate multiple stakeholder coordination to upscale e-cooking. Engagement of local governments is also very important in the promotion of e-cooking. Other recommendations are as follows:
E-cooking programmes and projects Implement development projects within a comprehensive framework that capitalises on multisectoral
expertise beyond the energy sector. Provincial and local governments should embed and prioritise localising SDGs and NDCs in their plans,
particularly on the e-cooking agenda and encourage development organisations to promote e-cooking. Implement development projects of different nature, targeting capacity building, infrastructure
development, awareness raising, access to finance, market strengthening, etc. High priority should be given to replacing solid biomass fuel with e-cooking in remote locations.
Electricity supply Introduce mandatory provision of electricity safety audits by trained auditors to ensure quality house
wiring and legal connections. Incentivise energy meter upgradation to cater to e-cooking loads. Prioritise demand-side management (wet/dry seasons and peak/off-peak hours) of electricity with
infrastructure improvement, differential tariffs and plans. Widely disseminate information about Distribution Master Plan, with inclusion of e-cooking load.
Supply-side of e-cooking appliances and support services Encourage the private sector to invest more in e-cooking appliances business, addressing the working
capital need and risk management through Challenge Funds and guarantee funds. Strengthen the supply chain of e-cooking appliances and accessories, focusing on developing a large
number of local retailers. Ensure availability of maintenance services at accessible locations through capacity-building
interventions. Enforce the mandatory standards on e-cooking appliances for quality control.
10. RECOMMENDATIONS
49

Demand-side promotion Launch mass awareness and behavioural change campaigns, including demonstrations, in close
coordination with community groups, like CREEs, community forest user groups, and LFIs. Revise the existing tariffs to encourage e-cooking. Make electricity cheaper during morning and evening
cooking hours for domestic consumers via smart meters and time-of-day tariff. Reduce the market price of e-cooking appliances through fiscal measures, such as reduction of customs
duty and waiver of value added tax. Provide incentives to targeted populations to encourage cooking on electricity. Provide user education on safe use of electricity for cooking.
Financial ecosystem The government should increase budgetary allocation to e-cooking while encouraging public–private
partnerships to supplement limited resources. Public and private investments need to be increased with innovative financing models.
Encourage financial institutions to develop loan products for e-cooking and value chain financing. Upscale alternative credit scoring like innovative financial mechanisms.
50

REFERENCES
Bailis, R., Drigo R., Ghilardi A. & Masera, O., ‘The Carbon Footprint of Traditional Woodfuels’, Nature Climate Change 5 (3) (2015) 266–72.
Boyce, D and Wirfs-Brock, J. ‘High Utility Costs Force Hard Decisions for The Poor’, Inside Energy (Denver: May 2016). Retrieved March 2021 from http://insideenergy.org/2016/05/08/high-utility-costs-force-hard-decisions-for-the-poor/
CBS, Annual Household Survey 2015/16 (Kathmandu: Central Bureau of Statistics, National Planning Commission, 2016).
CCA, Fuel economics study in Mandan Deupur, Kavre (cost of cooking/month for a household) (Kathmandu: conducted by Leaders Nepal for Clean Cooking Alliance, 2019).
CCA, ‘Electric Cooking in Peri-Urban Nepal: Impacts of clean cookstove adoption on household energy use’, Policy Brief (Kathmandu: Clean Cooking Alliance, May 2021). Landscape Analysis of the Cookstove Sector in Nepal, carried out by Practical Action for Clean Cooking Alliance, Kathmandu, Nepal (unpublished).
CCAC, Relation between Short-lived Climate Pollutants and Rural Cooking in the Residential Sector: Prospective Study Applied to Colombia, Mexico, and Peru. Climate and Clean Air Coalition (2019), https://www.ccacoalition.org/en/resources/relation-between-slcps-and-rural-cooking-residential-sectorChandler, A., ‘Where the Poor Spend More Than 10 Percent of Their Income on Energy, Hint: almost everywhere in the United States’, The Atlantic (2016), https://www.theatlantic.com/business/archive/2016/06/energy-poverty-low-income-households/486197/
Drehobl, A., Ross, L. and Ayala, R., How High Are Household Energy Burdens?: An Assessment of National and Metropolitan Energy Burden across the United States, (American Council for Energy Efficiency Economy, Sept. 2020).
Energia, Gender Responsive Electric Cooking in Nepal (prepared by International Network on Gender and Sustainable Energy (Energia/Hivos) and submitted to MECS, April 2021).
GoN, Biomass Energy Strategy 2017 (Kathmandu: Government of Nepal, Ministry of Population and Environment, January 2017).
GoN, White paper on energy, water resources and irrigation, 2075 with current scenario and future perspectives, (Kathmandu: Government of Nepal, Ministry of Energy, Water Resources and Irrigation, 2018).
GoN, 15th National Five-Year Development Plan 2019/20–2023/24 (Kathmandu: Government of Nepal, National Planning Commission, February 2020).
GoN, Nepal’s Sustainable Development Goals Status and Roadmap: 2016–2030 (Kathmandu: Government of Nepal, National Planning Commission, 2017).
JICA, Follow Up Data Collection Survey for Transmission and Distribution Network Development, Final Report (Japan International Cooperation Agency, Nepal Office, March 2020).
51

MoF, Federal Budget Speech for 2020/21 (Kathmandu: Government of Nepal, Ministry of Finance, 2020).
MoFE, Hydropower Environmental Impact Assessment Manual (Kathmandu: Government of Nepal, Ministry of Forests and Environment, July 2018).
NACEUN/ABF, Market-led Promotion of Electric Cooking in Timal Community Rural Electrification Area: Project Completion Report (Lalitpur: Energising Development Nepal, GIZ, Nepal, February 2020).
Nakarmi, A.M., Energy Security Issues/Challenges and Transitioning to Cleaner Cooking in Nepal. (Kathmandu: Modern Energy Cooking Services Workshop, CRT/GenDev Centre for Research and Innovation, 2019).
NEA, A Year Book Fiscal Year 2018/19 (Nepal Electricity Authority, Distribution and Consumer Services Directorate, 2019).
NPC, National Review of Sustainable Development Goals (Kathmandu: Government of Nepal, National Planning Commission, 2020).
Shrestha, J.N., Raut, D.B., Shrestha, D.L., Cooking Cost Comparison using LPG, Rice Cooker, Induction and Infrared Cooker (Kathmandu: Tribhuvan University, Institute of Engineering, 2020).
WHO, Burden of disease from Household Air Pollution for 2012 (Geneva: World Health Organization 2014).
WHO, 2018, Global Health Observatory data repository, DALYs by country. Retrieved from: https://apps.who.int/gho/data/node.main.BODHOUSEHOLDAIRDALYS?lang=en
World Bank, Investment Prospectus for Clean Cooking Solutions in Nepal: A Roadmap to National Goal of Providing Clean Cooking Solutions for All (Government of Nepal, Energy Sector Management Assistance Program and The World Bank, 2016).
World Bank, Nepal: Beyond Connections, Energy Access Diagnostic Report based on the Multi-Tier Framework. (Washington, DC.: The World Bank, 2019).
52

ANNEX 1: RESEARCH MATRIX
Scope Objective Research methods/tools Source of information
1. Enabling environment
Analyse effectiveness, readiness and implication of existing policies and plan on e-cooking sector
Identify enabling environment and entry barriers
Analyse resources and constraints
Literature review for assessing relevant policies and regulations
KIIs with key stakeholders
Policies, plan, and regulations of different tiers of Government
Federal, provincial and local governments
Private sectors AEPC and NEA
2. Stakeholders analysis
Identify key stakeholders, their current involvement, interests and incentives
Literature review KIIs with key
stakeholders Market system
mapping
Publications of different organisations
Central, provincial and local level consultations
Development organisations active in research and implementation of e-cooking.
3. Mapping of e-cooking programmes/ project
Identification and review of past and existing HH energy programmes and researches
Compile lessons-learned and key challenges
Literature review KIIs with key
stakeholders
Publications of relevant organisations
Central, provincial and local level consultations
Development organisations
4. Electricity supply status
Evaluate capacity of electricity-supply and distribution network/infrastructures
Availability, reliability and affordability of the electricity supply to cater electricity demand from e-cooking
Literature review KIIs with key
stakeholders FGDs Household survey Market system
mapping
NEA Annual report NEA. CREEs and local
governments Private sectors Sampled households from
survey sites
5. Supply of e-cooking appliances
Identify enablers and barriers in supply chain including entry barriers, capacity of market actors, market trend,
Risks and Opportunities
Literature review KIIs with key
market actors FGDs Market system
mapping
Private sectors in supply chain and support services
Sampled households from survey sites
53

Scope Objective Research methods/tools Source of information
6. Demand side analysis
Assess consumer perception for different e-cooking appliances by their attributes
Enablers and barriers Willingness to pay of
potential customers for e-cooking
Household survey and FGD
Revealed preference data (expenditure on LPG)
300 HHs survey in 3 provinces
3 FGDs with women cook
7. Financial ecosystem
Understanding: Current funding situation
and potential funding resources
Private sector involvement in cookstoves sector and financing
Resource constraints and gaps
Literature review KIIs and
stakeholder workshops (national, provincial and municipality)
Market system mapping
Publication of AEPC, CREF, DFID
KIIs with BFIs and LFIs
8. Support services status
Status of other support services like lab testing, repair maintenance, transportation etc.
KIIs with key stakeholders
Private sectors Organisations active in
e-cooking promotion
9. Environmental impact
Environmental impact due to electricity generation, distribution and use as cooking fuel
Literature review Published articles
10. Possibility of Electric Cooking in Nepal
Risks and opportunities of e-cooking in Nepal
Enablers and barriers to uptake electric cooking
KIIs Market system
mapping HH survey
NEA. CREEs and local governments
Private sectors Sampled households from
survey sites
54
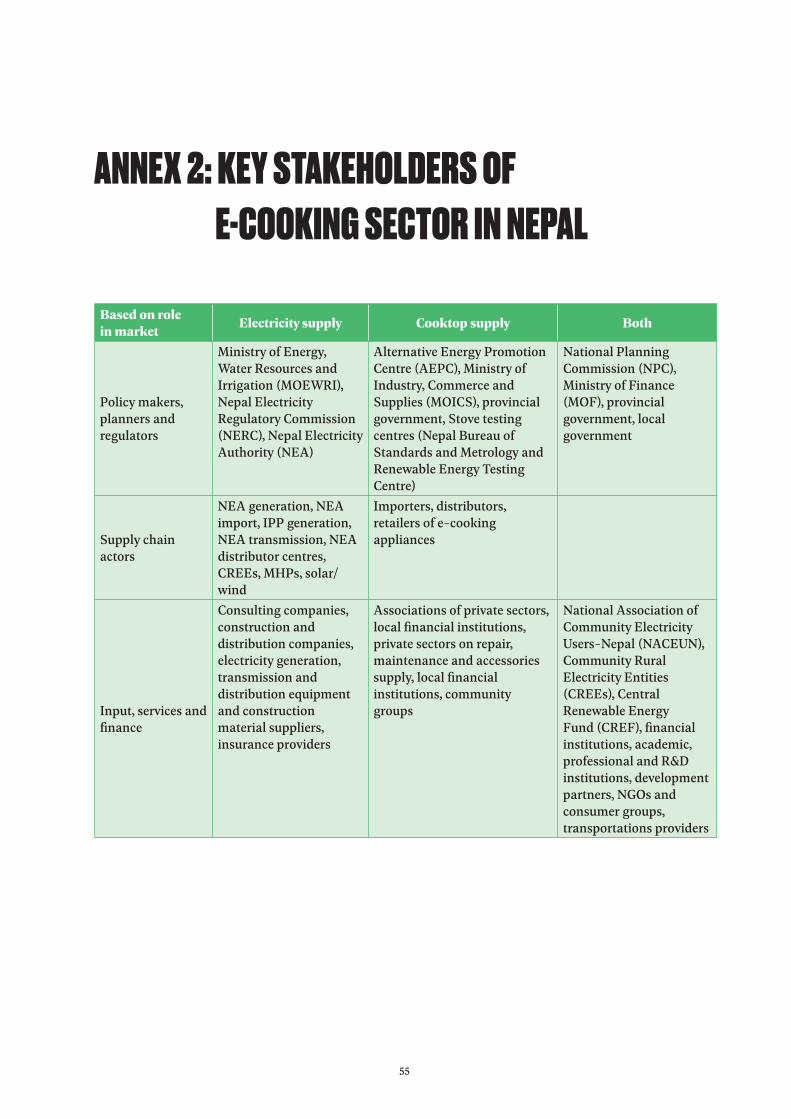
Based on role in market Electricity supply Cooktop supply Both
Policy makers, planners and regulators
Ministry of Energy, Water Resources and Irrigation (MOEWRI), Nepal Electricity Regulatory Commission (NERC), Nepal Electricity Authority (NEA)
Alternative Energy Promotion Centre (AEPC), Ministry of Industry, Commerce and Supplies (MOICS), provincial government, Stove testing centres (Nepal Bureau of Standards and Metrology and Renewable Energy Testing Centre)
National Planning Commission (NPC), Ministry of Finance (MOF), provincial government, local government
Supply chain actors
NEA generation, NEA import, IPP generation, NEA transmission, NEAdistributor centres, CREEs, MHPs, solar/wind
Importers, distributors, retailers of e-cooking appliances
Input, services and finance
Consulting companies, construction and distribution companies, electricity generation, transmission and distribution equipment and construction material suppliers, insurance providers
Associations of private sectors, local financial institutions, private sectors on repair, maintenance and accessories supply, local financial institutions, community groups
National Association of Community Electricity Users-Nepal (NACEUN), Community Rural Electricity Entities (CREEs), Central Renewable Energy Fund (CREF), financial institutions, academic, professional and R&Dinstitutions, developmentpartners, NGOs andconsumer groups, transportations providers
ANNEX 2: KEY STAKEHOLDERS OF E-COOKING SECTOR IN NEPAL
55

ANNEX 3: DISTRIBUTION SYSTEM UPGRADING WORKS
Province Project ScopeTarget
completion Date
Province 2Khokana - Nijgadh 33/11kVsubstation project
Construction of 33kV sub-transmission line and 33/11kV, 16.6 MVA substation.
F/Y 2021/22
Lumbini
33 kV line expansion and rehabilitation project
Construction of Bhurigaun-Gulariya (Bardia) 72km of 33 kV line and construction of Yadukuha-Dhanushadham 15 km of 33 kV line
F/Y 2021/22.
Province 2 and Lumbini
33/11 KV substation rehabilitation project
Rehabilitation of 33/11 KV substation at Dharan, Inaruwa, Mirchaiya, Rajbiraj, Mujalia with 33/11kV power transformers of 10/13.3/16.6 MVA capacity.
Rehabilitation of 33/11 KV substation in Pokharia, Harsa, Simrangaud with 33/11 kV power transformers of 20/24 MVA capacity.
Rehabilitation of 33/11 KV substation in Mukundapur, Kawasoti, Kalaiya with 33/11 kV power transformers of 20/24 MVA capacity.
Rehabilitation of 33/11 KV substation in Guleria, Jeetpur, Bhairahawa and Lumbini with 33/11 kV power transformers of 20/24 MVA capacity.
F/Y 2021/22.
Province 2
Construction of 33 kV line,33/11 kV substations and distribution line
Okhaldhunga-Salleri 33 KV transmission line project Gadahia-Dumaria 33/11 kV S/S construction project. Haripurwa-Basantpur 33 kV transmission line and
sub-station construction project. Bhagwanpur 33/11 kV S/S construction project. Lohana Janakpur 33/11 kV S/S construction project. HT/LT line construction at Singhdevi Raniban,
Okhaldhunga Districts HT/LT Line construction at Nirmalidada, Khotang. NijgadhKolhvi 33/11 kV S/S construction project.
Completed in 2019/20
56

Province Project ScopeTarget
completion Date
Lumbini
Construction of 33 kV line,33/11 kV substations and distribution line
Jeetpur-Thada 33 kV substation project Gulmi Shantipur 33 kV transmission line and
substation Project. Jitpur Saljandi 33 kV transmission line and
substation project. Saljhandi – Majganwa (Marchawar) 33 kV Transmission line and substation project. Distribution line reinforcement at Arghakhachi Distribution line reinforcement at Palpa
Completed in 2019/20
Karnali
Construction of 33 kV line,33/11 kV substations and distribution line
Chhinchu-Rukum-Jajarkot 33 kV transmission line project
Sitalpati -Musikot 33 kV transmission line and substation project Dailekh Substation and Rural electrification project Surkhet, Bijaura 33 kV substation project Ramghat, Surkhet 33 kV transmission line project Gangate- Matela, Surkhet 33 kV transmission line
project Dailekh- Jumla 33 kV transmission line and
substation project Kudu-Chaukha Bajar - Jajarkot 33 kV transmission
line and substation project Chaukha Bajar – Jajarkot - Dolpa 33 kV transmission
line and substation project Nagma – Mugu (Gamgadi) 33 kV transmission line
and substation project Dullu – Kalikot 33 kV transmission line and
substation project
Completed in 2019/20
57

Brand ID Brand Name Induction Cooktop Infrared Cooktop Electric pressure cookers1 CG √ O O
2 Baltra √ √ √3 Philips √ √ √4 Diamond √ O O
5 Colors √ O O
6 Bajaj √ O O
7 V-cook √ O O
8 Asent √ O O
9 Khaitan √ √ O
10 Surya √ √ O
11 Pigeon √ √ O
12 Xurong O √ O
13 Geepas O O √14 Electron Mrc O O √15 Urban O O √16 Media O O √17 Sinbo O O √18 Swifton √ O O
19 Prestige √ √ √20 Yasuda O √ O
21 Unirize √ O O
22 Hoffmans O √ O
Total 14 8 8
ANNEX 4: E-COOKING APPLIANCES BRANDS AVAILABLE IN NEPALI MARKET
58

ANNEX 5: LIST OF PERSONS AND ORGANISATIONS CONSULTED
S.N. Name Position Name of Organisation1 Shree Ram Pokhrel Provincial Chief NEA, Pokhara2 Narayan Gyawali Chairperson NACEUN3 Mukesh Ghimire Assistant Director,
Bioenergy AEPC
4 Karuna Bajracharya Nepal Country Manager
Clean Cooking Alliance
5 Manoj Khadka Sales Executive Chaudhary Group6 Subarna Kapali Managing Director Ajummery Bikas Foundation7 Biraj Gautam Chief Executive Officer PEEDA8 Govind Khanal Program Officer Winrock9 Bhusan Adhikari Program Advisor GIZ EnDev10 Junga Bahadur Thapa Electric Engineer Ministry of Physical Infrastructure
Development, Lumbini
11 Arun Lal Karn Chief Director Ministry of Physical Infrastructure Development, Province 2
12 Robin Sharma Provincial Coordinator
AEPC, Lumbini
13 Pankaj Karn Program Coordinator AEPC, Province 214 Surendra Prasad Agrahari Provincial Office head Nepal Electricity Authority (NEA),
Birendranagar, Surkhet, KarnaliProvince
15 Narendra Yadav Engineer Nepal Electricity Authority (NEA), Dhanusha, Province 2
16 Munindra Thakur Province Manager Nepal Electricity Authority (NEA), Lumbini Province
17 Govinda Shahi Market manager BishnuRedio, Karnali Province18 Sanjog Kanta Proprietor Electric Cooking Appliances- Market Actors,
Lumbini, Rupandehi
19 Manoj Kumar Shah Proprietor Nepal Kitchen House, Dhanusha, Province 220 Ser Bahadur Rokaya Officer Ministry of Industry, Tourism, Forest and
Environment, Karnali
21 Ramchandra Kandel Secretariat Ministry of Industry, Tourism, Forest and Environment, Province 2
22 Dr. Laxmi Narayan Tiwari Ministry of Social Development, Karnali23 Dev Kumari Khatri Second Secretariat Ministry of Social Development, Province 2
59

S.N. Name Position Name of Organisation24 Bhupendra Chaudhary Sales Manager Renewable Energy Water Supply Sanitation
Promotion Center (REWSSPC), Mahottari, Province 2
25 Dev Kumar Subedi Mayor Birendranagar Municipality, Surkhet, Karnali Province
26 Man Kumari Pun Deputy-Mayor Rolpa Municipality, Rolpa, Lumbini Province27 KamansinghDangi Chairperson Shantinagar Rural Municipality, Shantinagar,
Dang, Lumbini Province28 Baleshwor Mandal Chairperson Dhanushadham Municipality,
Dhanushadham, Province 229 Bikram Chaudhary Mayor Pipra Rural Municipality, Pipra, Mahattori,
Province 230 Tanka Lamichhane Social Development
OfficerBirendranagar Municipality, Surkhet, Karnali Province
31 NandaramChaulagain Administrative Officer Guransh Rural Municipality32 Sushil Thapa Section Officer Rolpa Municipality33 Dharmendra Belbase Planning Officer Shantinagar Rural Municipality34 Sanjib Prasad Das Administrative Officer Dhanushadham Municipality35 Bikram Chaudhary Mayor Pipra Rural Municipality36 Lal Babu Chaudhary Engineer NEA Office, Mahottari37 Jay Gopal Shah Office Chief NEA distribution centre, dhanushadham38 Rina Yadav President Dhanushadham Mahila Utthan Kendra39 Binay Mukhiya Secretariat Ratanpur Upbhoktaanch40 Ram Shankar Subedi Branch head Muktinath Bikash Bank41 RamitaGharti Magar Chairperson Deuthan Mahila Agri. Cooperative Ltd42 Gyanendra Kumar Yadav Branch Manager Gharelu Laghu Bittiye Bikas Bank43 Amit Kumar Gupta Assistant Branch
ManagerSwadeshi Laghu Bittiye Sanstha Limited
44 Chandra Prakash Aacharya
Proprietor Local Level Electric Appliances Supplier
45 Subash Adhikari Proprietor Local Level Electric Appliances Supplier46 Bishnudev Thakur Proprietor Dhanusha Electric and electronics47 Suraj Dev Yadav Proprietor Shivam Electrical
(Footnotes)1 Nationally Determined Contributions (NDC)2 LPG has a specific calorific value of 46.1 megajoules per kilogram. Every cylinder with 14.2 kg of cooking gas gives equivalent to 181.9 units of energy from
electricity. If efficiency factor is considered, one cylinder of LPG is equivalent to 86.62 units electricity consumption from an induction cooktop.
60


BIGCHANGEstarts small
Practical Action is a global change-making group. It consists of a UK registered charity with communityprojects in Africa, Asia and Latin America, an independent publishing company and a technical consultingservice. It combines these specialisms to multiply its impact and help shape a world that works betterfor everyone. In Nepal, Practical Action is focused on putting ingenious ideas into work to contributeto poverty reduction and sustainable wellbeing through three change areas: energy that transforms;farming that works and resilience that protects.
To harness the transformational power of energy, Practical Action is working to enable productive use ofenergy services in order to improve living conditions of poor households and strengthen operation of ruralenterprises and community facilities. Practical Action contributes in sustainable market development andbehavioural and policy change to promote clean cooking solutions in rural Nepal.
Modern Energy Cooking Services (MECS) programme is funded by UK Aid and managed by Loughborough University, UK. The programme aims to leverage investment in renewable energy, both grid and off-grid, to address the clean cooking challenge by integrating modern energy cooking services into the electricity access, quality, reliability and sustainability plans.
Practical ActionHouse No. 1114, PanipokhariKathmandu, NepalT: +977 1 4423 639/ 640E: [email protected]: practicalaction.org