Embed Size (px)
Citation preview
Pub
lic D
iscl
osur
e A
utho
rized
Pub
lic D
iscl
osur
e A
utho
rized
Pub
lic D
iscl
osur
e A
utho
rized
Pub
lic D
iscl
osur
e A
utho
rized

746 A Roadmap to National Goal of Providing Clean Cooking Solutions for All
► In the high-growth scenario, 22 percent of households will graduate to factory-produced ICS by 2030, many of them using cleaner stoves with forced air draft and even photovoltaic chargers. In situ ICS will account for 34 percent of households, and traditional cookstove use will be negligible.
In the high-growth scenario, the period 2017–2030 is divided into four phases, recognizing that the national goal of CCS4All and the goal of SE4All will be achieved with a gradual shift toward cleaner cooking fuel and technology in successive phases, with an increasing focus on “pull” from the market rather than “push” from the public sector. The key characteristics of the four phases are:
► Gestation phase (till 2017)—Preparatory phase. ► Market growth phase (2017–2023)—100 percent penetration of ICS in households using solid biomass. ICS
disseminated in the ratio of 60:40, in situ to factory-produced stoves. ► Market sustenance phase (2023–2027)—Market instruments crafted for driving competition in fuel sources and
cooking technologies, and a tighter focus on cleaner factory-produced ICS. More robust and sustainable supply chain of clean cooking solutions.
► Graduation phase (2027–2030)—Fully functional market-based business models. Graduation of households to clean technologies.
Nepal has huge market potential for clean cooking solutions and so are the opportunities for the government, development partners, private players, and consumers.
The government provides technical assistance, awareness raising, quality control, and subsidy support for promotion and dissemination of clean cooking solutions. It has set ambitious targets under its periodic plans with the aim of raising rural people’s living standards, protecting the environment, and developing commercially viable alternative energy industries.
International development partners aspire to alleviate poverty, safeguard the environment, and foster income growth among poor nations worldwide. To meet these goals, they create unique partnerships that help national governments to meet their long-terms goals.
Private players have high potential to add value to cookstove production and distribution, as well as capacity development and quality control. But despite this potential, private players are few.
The proposed initiatives will require heavy “impact investments” to allow market forces more leeway to operate, through a three-pronged strategy:
► Enhance demand by motivating potential consumers, developing cleaner and more efficient technologies, and offering consumer finance to enhance affordability and provide incentives for off-take such as results-based incentives and smart subsidies.
► Strengthen supply by attracting more finance and investment to domestic production or funding for imports, by enhancing market intelligence, and by creating inclusive value-chains and innovative distribution models for remote consumers.
► Foster an enabling environment by engaging national and local stakeholders, building the evidence base for the benefits of clean cookstoves and fuels, promoting international standards and rigorous testing protocols, and strengthening monitoring and evaluation.
iInvestment prospectus for clean cooking solutions in Nepal
Acknowledgements The financial and technical support by the Energy Sector Management Assistance Program (ESMAP) is gratefully acknowledged. ESMAP—a global knowledge and technical assistance program administered by the World Bank—assists low- and middle-income countries to increase their know-how and institutional capacity to achieve environmentally sustainable energy solutions for poverty reduction and economic growth. ESMAP is funded by Australia, Austria, Denmark, Finland, France, Germany, Iceland, Japan, Lithuania, the Netherlands, Norway, Sweden, Switzerland, the United Kingdom, and the World Bank Group. We also acknowledge the work done by Ernst & Young LLP as the consulting firm that worked closely with the World Bank, AEPC, and other stakeholders, in producing the Investment Prospectus.
ii A Roadmap to National Goal of Providing Clean Cooking Solutions for All
About the Document 'Investment Prospectus for Clean Cooking Solutions in Nepal: A Roadmap to National Goal of Providing Clean Cooking Solutions for All (CCS4ALL)' is developed under the ‘Developing Improved Solutions for Cooking (DISC)’, a technical assistance program, undertaken by World Bank with support from Energy Sector Management Assistance Program under the country action track of the Sustainable Energy for All (SE4ALL) initiative. The consulting firm, Ernst & Young LLP (India), hired under the DISC initiative, has worked closely with Alternative Energy Promotion Center (AEPC), the agency of Government of Nepal mandated to promote renewable and alternative energy in the country as well as various others stakeholders to bring together this document.
The Investment Prospectus emphasizes the SE4ALL goal of providing universal access to clean cooking by 2030 and also takes into consideration the national goal of CCS4ALL in the changed context. The Investment Prospectus can serve as a guiding document for the GON as it elaborates on the development status, estimates cost and time duration and highlights potential role of key players in the long run, required to achieve ambitious goal set under CCS4ALL. In addition, the document provides a vision for the GON and also proposes adjustments in policy and institutional structure, thereby supporting the Government in achieving accelerated adoption of clean cooking solutions.
The Investment Prospectus also aims to strengthen the capacities of development partners, enabling formulation of their own development projects and programs, notably regional business and climate investments. This document can be relevant in enabling strong coordination among key development agencies that are already supporting SE4ALL initiatives, thus exploring options of innovative financing.
The Investment Prospectus can also be a valuable tool for private entities as it comprehensively outlines the key information that investors require in order to engage in a specific investment opportunity pertaining to clean cooking solutions. The Investment Prospectus also attempts to explore varied business opportunities generated for private sector entities in clean cooking sectors.
The investment prospectus was formally endorsed by Government of Nepal on 4 Nov 2017 as a living document which will get refined further as things progress.
iiiInvestment prospectus for clean cooking solutions in Nepal
Contents
Acknowledgements i About the document ii Abbreviations vi Executive Summary vii 1. Clean Cooking Solutions for All: A Nepali Initiative 2
1.1 Introduction 2
1.2 Need for Clean Cooking Solutions for All 2
1.3 CCS4ALL: Rationale 3
1.4 CCS4ALL: History of Initiatives 4
1.4.1 Cookstoves 4
1.4.2 Biogas 5
1.5 Initiatives Aligned with CCS4ALL in Nepal 6
1.6 Climate Finance 6
1.7 Nepal’s Graduation from LDC Status Through CCS4ALL 7
2. Energy Use in Nepal, with a Focus on Cooking 10
2.1 Baseline 10
2.2 Cooking Practices 11
2.2.1 Cooking, Cookstove, and Fuel Preferences 12
2.2.2 Cooking Fuel Use in the Business-as-Usual Scenario 12
2.2.3 Barriers for scaling Up Clean Cooking Technologies 16
2.3 Cooking Fuels and Technologies 17
3. Policy Framework on Clean Cooking Solutions 22
3.1 Position of Clean Cooking Solutions in Periodic Plans 22
3.2 Regulations for Industrial Promotion 22
3.3 Evolution of the Policy Environment 23
3.3.1 Rural Energy Policy, 2006 23 3.3.2 National Energy Strategy 24 3.3.3 Renewable Energy Subsidy Policy 2016 24
4. Projected Scenarios and Interventions Needed to Achieve the High-Growth Scenario 28
4.1 Defining Consumer Segments 28
4.2 Factors that Influence Fuel Sources 29
4.3 Methodology and Assumptions for calculating Fuel Consumption 30
4.4 Projected Business-as-Usual Scenario 32
4.4.1 Urban Households 33 4.4.2 Rural Households 34 4.5 Projected High-Growth Scenario 35
4.5.1 Urban Households 37 4.5.2 Rural Households 39 4.6 Proposed Critical Interventions to Achieve the high-Growth Scenario 39
4.6.1 Economic Interventions 39 4.6.2 Policy Measures and Institutional Strengthening 42 4.7 Projected Moderate-Growth Scenario 43
5. Opportunities Envisaged through CCS4ALL 46
5.1 Government of Nepal 46
5.2 International Development Partners 46
5.3 Private Players 47
5.3.1 Clean Cooking Solutions and Product Market Potential 48
5.3.2 Business Opportunities 49 5.4 Consumers 52
6. Impact Investments and Budget Funding 54
6.1 Need for Strategic Drive of Impact Investments 54
6.2 Investment Timelines 54

iv A Roadmap to National Goal of Providing Clean Cooking Solutions for All
6.3 Impact Investments for Improved Cookstoves 55
6.3.1 Government and Development Partners 55
6.3.2 Financial Institutions and Micro-Financial Institutions 55 6.3.3 Private Sector 55 6.3.4 Consumers 56 6.3.5 Stakeholder Group Contributions for Improved Cookstoves 57 6.4 Impact Investments for Biogas-Based Cooking Solutions 57
6.4.1 Government and Development Partners 57 6.4.2 Financial Institutions and Micro-Financial Institutions 58 6.4.3 Private Sector 58 6.4.4 Consumers 58 6.4.5 Stakeholder Group Contributions for Biogas Projects 59 6.5 Stakeholder Group Contributions in Overall Project Spending 59
6.6 The Green Card Program 61
6.6.1 Government and Development Partners 61 6.6.2 Private Sector 62 6.6.3 Consumer Participation 62 6.6.4 Stakeholder Group Contributions 63 Annex: Business Opportunities in Nepal 64 Figures Figure 1: Annual installation of improved cookstoves supported by AEPC 5 Figure 2: Annual installation of biogas plants supported by AEPC 6 Figure 3: Cooking fuel use by households in Nepal20 10 Figure 4: Cooking sources 10 Figure 5: Energy used by source in Nepal 11 Figure 6: Energy consumption by sector 11 Figure 7: Planned installed electrical capacity vs peak demand 14 Figure 8: Energy supply of LPG and kerosene (terajoules) 15 Figure 9: LPG price analysis 15 Figure 10: Ecological zones for projected scenarios 28 Figure 11: Projected business-as-usual scenario 33 Figure 12: Projected high-growth scenario 36 Figure 13: The four phases of the projected high-growth scenario 37 Figure 14: Sample PPP Modality 42 Figure 15: Projected moderate-growth scenario 44 Figure 16: Annual market potential of ICS overall (in situ and factory-produced) (thousand US$) 49 Figure 17: Annual market potential of in situ ICS (thousand US$) 50 Figure 18: Annual market potential of factory-produced biomass-based ICS (thousand US$) 50 Figure 19: Annual market potential of biogas-based cooking solutions (US$ thousands) 51 Figure 20: The ecosystem for impact investments 54 Figure 21: ICS stakeholder group contributions, 2017–2023 57 Figure 22: Biogas stakeholder group contributions, 2017–2023 59 Figure 23: Multi-stakeholder contributions, 2017–2023 59 Figure 24: Number of household cooking solutions deployed, 2016–2023 (thousands) 60 Figure 25: Multi-stakeholder investment shares 61 Figure 26: Green Card Program stakeholder group contributions, 2017–2023 63 Figure 27: Ranking of Nepal on the ease of doing business compared with South Asian neighbors 64 Figure 28: Rankings on Doing Business indicators, Nepal 65 Figure 29: Distance to frontier scores on Doing Business indicators, Nepal 65 Tables Table 1: Cost and benefits of clean and improved cooking solutions 7 Table 2: Number of households using firewood and cow dung by ecological belt 13 Table 3: Domestic electricity tariffs in some South Asian Countries (converted to equivalent NPR) 14
Table 4: Major acts and regulations on investment 22 Table 5: Subsidy per household for each domestic biogas plant 24 Table 6: Socio-economic correlation coefficients for different fuels 30 Table 7: Basic demographic parameters 31 Table 8: Assumptions made for projecting the scenarios and conducting statistical analysis until 2030 32 Table 9: Cooking solutions by fuel, projected business-as-usual scenario 33 Table 10: Cooking solutions by fuel, projected urban business-as-usual scenario 34 Table 11: Cooking solutions by fuel, projected rural business-as-usual scenario 34 Table 12: High-growth interventions 35 Table 13: Cooking solutions by fuel, projected high-growth scenario 36 Table 14: Cooking solutions by fuel, urban high-growth scenario 38 Table 15: Cooking solutions by fuel, projected rural high-growth scenario 39 Table 16: Cooking solutions by fuel, projected moderate-growth scenario 44 Table 17: International development partners active in Nepal and key areas of cooperation 46 Table 18: Model split assumptions for in situ and factory-produced ICS (%) 48 Table 19: Region split assumptions for ICS and biogas (%) 48 Table 20: Average prices of prevalent technologies (NPR) 49 Table 21: Technical assistance and subsidies, 2017–2023 (million US$) 55 Table 22: Breakdown of technical assistance cost components, 2017–2023 (%) 55 Table 23: Estimated viability gap funding, 2018–2023 (million US$) 55 Table 24: Private sector investment breakdown, 2017–2023 (%) 56 Table 25: Estimated private sector investment required, 2017–2023 (million US$) 56 Table 26: Consumer willingness to pay for clean cooking solutions, 2017–2023 (million US$) 56 Table 27: Technical assistance and subsidies, 2017–2023 (million US$) 57 Table 28: Estimated viability gap funding, 2018–2023 (million US$) 58 Table 29: Breakdown of private investment in biogas plants, 2017–2023 (%) 58 Table 30: Estimated investments required from the private sector, 2017–2023 (million US$) 58 Table 31: Consumer willingness to pay for clean cooking solutions, 2017–2023 (million US$) 58 Table 32: Estimated government and development partner investments in the Green Card Program, 2017–2023 61 Table 33: Investment shares of key project components, 2017–2023 (%) 61 Table 34: Estimated investments required from the private sector, 2017–2023 (million US$) 62 Table 35: Cumulative consumer willingness to pay for clean cooking solutions, 2017–2023 (million US$) 62 Table 36: Doing business in Nepal, 2015 and 2016 64 Boxes Box 1: The Investment Prospectus 2 Box 2: Key characteristics of cooking solutions in Nepal 3 Box 3: National Rural and Renewable Energy Program 4 Box 4: Objectives of the Nepal Alliance for Clean Cook-stoves 5 Box 5: Hydropower has yet to be harnessed 11 Box 6: Factors working against the uptake of LPG as a primary cooking fuel 16 Box 7: Fuels used 17 Box 8: Technologies available 18 Box 9: The Green Card Program—An alternative approach 40 Box 10: Non-conforming stoves sell well 50 Box 11: Briquette manufacturing in Nepal 52
vi A Roadmap to National Goal of Providing Clean Cooking Solutions for All
Abbreviations AEPC Alternative Energy Promotion Center
CAGR Compound annual growth rate
CBS
CCS4ALL
Central Bureau of Statistics
Clean Cooking Solutions for All
CREF Central Renewable Energy Fund
DISC
DTF
EMI
Developing Improved Solutions for Cooking in Nepal
Distance to frontier
Equated monthly installment
ESAP Energy Sector Assistance Program
ESMAP
E&Y
FI
Energy Sector Management Assistance Program
Ernst & Young LLP
Financial institution
GDP Gross domestic product
GIZ
GNI
GON
ICS
German Federal Enterprise for International Cooperation
Gross national income
Government of Nepal
Improved cooking stoves
IFI
kWh
International financial institution
Kilowatt-hour
LDC Least developed country
LPG Liquefied petroleum gas
M&E
MFI
Monitoring and evaluation
Micro-financial institution
NGO Non-governmental organization
NOC Nepal Oil Corporation
NPR Nepalese rupee
NRREP National Rural and Renewable Energy Program
R&D Research and development
SE4ALL Sustainable Energy for All
SME Small and medium-sized enterprise
VDC
WBG
WHO
Village Development Committee
World Bank Group
World Health Organization
viiInvestment prospectus for clean cooking solutions in Nepal
Executive Summary Seventy-five percent of Nepal’s population (4 million out of 5.43 million households) use solid biomass (firewood, cattle-dung, or agro-waste) as their primary fuel with traditional cookstoves. With an efficiency of 10 percent, these cookstoves cause health problems. This Investment Prospectus for Clean Cooking Solutions for All (CCS4ALL) encapsulates a two-year journey of consensus-building with the government’s Alternative Energy Promotion Center (AEPC). It has been developed under the Sustainable Energy for All (SE4ALL) framework for clean cooking in Nepal. In such a country, where solid biomass constitutes 80 percent of total energy consumption and where space heating is a necessity, the importance of clean cooking options cannot be over-emphasized. Clean cooking is also very important from the perspective of indoor air pollution, energy efficiency, climate change mitigation, and gender equality.
Clean cooking solutions also have great potential for reducing carbon dioxide emissions and can save as much as 1–4 metric tons per cookstove a year under the right conditions. AEPC has developed a clean development mechanism program of activities under which 1.2 million Certified Emission Reductions have already been issued, and some US$6.1 million has been generated from these reductions.
One of the main goals of the World Bank’s Developing Improved Solutions for Cooking technical assistance program is to push for a paradigm change to a wider range of manufactured stoves that meet customers’ needs, produce replicable results, and can be reliably tested and labeled consistently. This change will allow for scale-up and outreach to the unserved 75 percent of households over the next decade and a half.
The Investment Prospectus uses three scenarios—business-as-usual, moderate growth and high growth—to show trajectories to 2030, based on assumptions on socio-economic, policy, and macro-economic parameters. These scenarios have been developed and agreed with AEPC. The assumptions underlying these scenarios are the result of current information, and may well be modified. The Investment Prospectus is meant to be a “living” document, promoting a step-by-step approach to reaching the SE4ALL (and Nepali national) goals of universal access to clean cooking.
Scenario analysis shows that:
Support for large expansion of liquefied petroleum gas (LPG) imports is unlikely due to affordability issues, fiscal limits for subsidies, and supply insecurities. Despite this, LPG remains an aspirational fuel source, and is expected to reach about a third of households in 2030. Lower-income households are seen using LPG as part of their stove-stacking approach (using LPG as a secondary or tertiary source for cooking).
Nepal has had a successful history with biogas-based clean cooking, but expansion is restricted by the number of cattle, and it will serve only those parts of the country (mostly rural Terai plains and the Hill region) where cattle rearing and dairy farming are common. Biogas use is likely to peak at less than 15 percent of households by 2030, even in the best-case (high-growth) scenario.
Despite the spike in use of induction cookers and other electric cooking devices in urban areas in 2015 during an LPG supply shortage, use of electricity for cooking is set to remain a niche application, limited to high-income, mainly urban households. This is largely because of the current power deficit and unreliable supplies; poor grid infrastructure, resilience, and stability; size of infrastructure work required; long lead times in developing hydropower resources; and concerns over the medium-term financial viability of the power sector. Electricity-based cooking is forecast to be the primary technology in only 0.25 percent of Nepali households in 2030 (though this could change based on developments over the next few years).
Nepal s reliance on solid biomass is therefore expected to continue till 2030 under all three projected scenarios. Even under the most optimistic scenario, 55 percent of households will still use solid biomass as their primary fuel source in 2030, a mild decline from 68 percent in 2015.
With appropriate movement toward a market-based approach, policy incentives, and efforts in generating public awareness of clean cooking solutions and in changing behaviour, the shift toward scalable, factory-produced stoves can take root.
By scenario:
In the business-as-usual scenario, over 12 percent of households will still be using traditional cookstoves in 2030, and factory-produced models will have only about a 2 percent share of households.
In the moderate-growth scenario, 14 percent of households will graduate to factory-produced improved cookstoves (ICS) by 2030, with in situ ICS accounting for 42 percent of households. Traditional cookstove use will be negligible.
viii A Roadmap to National Goal of Providing Clean Cooking Solutions for All
In the high-growth scenario, 22 percent of households will graduate to factory-produced ICS by 2030, many of them using cleaner stoves with forced air draft and even photovoltaic chargers. In situ ICS will account for 34 percent of households, and traditional cookstove use will be negligible.
In the high-growth scenario, the period 2017–2030 is divided into four phases, recognizing that the national goal of CCS4ALL and the goal of SE4ALL will be achieved with a gradual shift toward cleaner cooking fuel and technology in successive phases, with an increasing focus on “pull” from the market rather than “push” from the public sector. The key characteristics of the four phases are:
Gestation phase (till 2017) Preparatory phase. Market growth phase (2017 2023) 100 percent penetration of ICS in households using solid biomass. ICS
disseminated in the ratio of 60:40, in situ to factory-produced stoves. Market sustenance phase (2023 2027) Market instruments crafted for driving competition in fuel sources and
cooking technologies, and a tighter focus on cleaner factory-produced ICS. More robust and sustainable supply chain of clean cooking solutions.
Graduation phase (2027 2030) Fully functional market-based business models. Graduation of households to clean technologies.
Nepal has huge market potential for clean cooking solutions and so are the opportunities for the government, development partners, private players, and consumers.
The government provides technical assistance, awareness raising, quality control, and subsidy support for promotion and dissemination of clean cooking solutions. It has set ambitious targets under its periodic plans with the aim of raising rural people’s living standards, protecting the environment, and developing commercially viable alternative energy industries.
International development partners aspire to alleviate poverty, safeguard the environment, and foster income growth among poor nations worldwide. To meet these goals, they create unique partnerships that help national governments to meet their long-terms goals.
Private players have high potential to add value to cookstove production and distribution, as well as capacity development and quality control. But despite this potential, private players are few.
The proposed initiatives will require heavy “impact investments” to allow market forces more leeway to operate, through a three-pronged strategy:
Enhance demand by motivating potential consumers, developing cleaner and more efficient technologies, and offering consumer finance to enhance affordability and provide incentives for off-take such as results-based incentives and smart subsidies.
Strengthen supply by attracting more finance and investment to domestic production or funding for imports, by enhancing market intelligence, and by creating inclusive value-chains and innovative distribution models for remote consumers.
Foster an enabling environment by engaging national and local stakeholders, building the evidence base for the benefits of clean cookstoves and fuels, promoting international standards and rigorous testing protocols, and strengthening monitoring and evaluation.
1Investment prospectus for clean cooking solutions in Nepal
2 A Roadmap to National Goal of Providing Clean Cooking Solutions for All
1. Clean Cooking Solutions for All: A Nepali Initiative
1.1 Introduction In the last decade, Nepal has launched economic reforms that are steadily improving its socio-economic conditions. It has achieved solid results in areas such as the macro-economic environment, health, and primary education (World Economic Forum 2016). In line with other development activities, the government announced a national goal to provide Clean Cooking Solutions for All (CCS4ALL), which complements Sustainable Energy for All (SE4ALL) and other international and national initiatives
The Alternative Energy Promotion Center (AEPC)1 developed this Investment Prospectus with support from the World Bank, to provide a roadmap for attaining Nepal’s national goal of CCS4ALL (box 1).
Box 1: The Investment Prospectus
This Investment Prospectus is being developed under the Developing Improved Solutions for Cooking, a technical assistance program undertaken by the World Bank with support from the Energy Sector Management Assistance Program under the country action track of the SE4ALL initiative. It emphasizes attaining the SE4ALL goal of providing universal access to clean cooking by 2030 and considers the national goal of CCS4ALL.
The document aims to serve as guidance for the government by elaborating on cost and time estimates of interventions and by highlighting the potential role of key players in achieving the goals of CCS4ALL. It also presents a vision to the government of a life with clean cooking solutions, and proposes tweaks to policy and institutional structure so as to improve the investment climate, especially for regional businesses.
The Investment Prospectus aims to enable development partners to formulate better their own development projects and programs, points to ways to get key development agencies to work more closely in concert, and explores finance options. It also touches on the information that private investors require to take up investment opportunities, and business opportunities for private sector entities.
1.2 Need for Clean Cooking Solutions for All Nepal wishes to attain economic growth targets sustainably, without threatening the local environment and public health by using polluting and inefficient technologies, while dealing with serious threats to the local environment and public health. Indoor air pollution is one of the biggest health risks in the country, and much is attributed to cooking and indoor heating using solid biomass, mainly firewood. Box 2 illustrates the status of cooking solutions.
1 AEPC, a nodal institution, was established under the Ministry of Science Technology and Environment to promote the use of renewable energy technologies (consequently raising the standard of living of rural people), safeguarding the environment, and developing commercially viable alternative energy industries and use. AEPC now functions under the Ministry of Population and Environment.
3Investment prospectus for clean cooking solutions in Nepal
Box 2: Key Characteristics of Cooking Solutions in Nepal
Biomass is by far the most used primary energy source in Nepal, accounting for over 80 percent of all energy consumed.
While electrification has reached about 70 percent of the population (only about 63 percent in rural areas) (CBS 2011), service is unreliable especially in the dry winter months (given that most electricity comes from hydro), when heating is most needed.
Eighty-three percent of the population lives in rural areas, and few rural dwellers have access to clean cooking solutions.
About 75 percent (around 4 million) of Nepal s 5.43 million households use fuels like firewood, cattle dung, or agro-waste as the main cooking fuel in traditional cookstoves.
Around 3.75 million households are potential customers for improved cookstoves (ICS) in the short term. Some 800,000 households are potential customers for domestic biogas, particularly those using cattle dung for cooking.
8,700 is the estimated number of annual premature deaths in Nepal due to indoor air pollution (WHO 2009).
The negative health consequences for rural people who use traditional open fires and burn solid fuel in inefficient cookstoves have been well documented. Smoke from these stoves penetrates deep into the lungs, causing deadly chronic and acute health effects such as child pneumonia, lung cancer, and chronic obstructive pulmonary and heart diseases. The severe impacts of using traditional cookstoves are not restricted to the cook (generally females) but also harm children and other household members. Children born to mothers who routinely cook on traditional cookstoves have low mean birth weight (Boy, Bruce 2002). Over a decade ago, the World Health Organization (WHO) estimated that exposure to indoor air pollution is a leading risk factor for disease in developing countries, and was responsible for the deaths of roughly 1.6 million people annually (WHO 2002).
A growing body of evidence indicates a linear relationship between indoor air pollution from cooking fires and respiratory health issues in exposed young children. In some cases, studies have confirmed that regular exposure to smoke from inefficient cookstoves leads to chronic diseases like tuberculosis. Blisters, burns, and injuries from traditional open fire cookstoves (WHO 2008) are additional risks faced by poor households dependent on traditional cookstoves, contributing to many burn deaths. Recurrent exposure to cookstove smoke can also cause incapacitating health impacts like cataracts, and has been found to be the leading cause of blindness in developing countries. Nepal has 8,700 deaths a year from indoor air pollution (WHO 2009).
Wore widely, aspects of environmental problems such as air pollution, climate change, and deforestation can be traced back to solid-fuel use and rudimentary cookstoves: traditional mud stoves have an efficiency of less than 10 percent. ICS, with an efficiency greater than 25 percent, pose fewer threats to the environment (GIZ 2011).
Excessive firewood consumption by traditional cookstoves exerts enormous pressure on forest resources in Nepal. In addition, they require rural women to spend more time collecting firewood and cooking, in turn limiting their ability to participate in income-generating activities.
1.3 CCS4ALL: Rationale Since the 1950s, the government of Nepal and civil society organizations have been addressing the severe health and environment issues associated with traditional cookstoves and promoting clean cooking solutions. Since 1999, the number of traditional cookstove users with no access to clean cooking solutions has declined, largely reflecting the start of AEPC’s dissemination of ICS through national programs.
In January 2013, the Prime Minister announced an ambitious mission of CCS4ALL by 2017, throughout the country. The rationale was to decrease fuel wood consumption and greenhouse gas emissions, as well as the drudgery of women, while improving their health by lowering respiratory infections and eye problems. The following month, the concept was presented to the AEPC Board and the Coordination Committee & Steering Committee of the National Rural and Renewable Energy Program (NRREP; box 3). By June that year, the government received endorsement from more than 30 (out of 75) District Development Committees after extensive regional, national, and international stakeholder consultations. The initiative was incorporated in the government’s policy and program for fiscal year 2071–2072 BS by the President on 29 June 2014.
4 A Roadmap to National Goal of Providing Clean Cooking Solutions for All
Box 3: National Rural and Renewable Energy Program
AEPC has run NRREP since 16 July 2012. The program’s main objective is to improve the living standards of rural and vulnerable communities, increase employment and productivity, minimize reliance on traditional energy, and attain sustainable development through integration of alternative energy with the socio-economic activities of women and men in rural communities. NRREP has three main components: the Central Renewable Energy Fund (CREF), Technical Support and Business Development for Renewable Energy, and Productive Energy Use.
Under this program, five governments (those of Denmark, Germany, Nepal, Norway, and the United Kingdom), two multilateral banks (the Asian Development Bank and the World Bank), two United Nations organizations (United Nations Development Program and the United Nations Capital Development Fund), and the Netherlands Development Organization (SNV) have committed US$184 million to execute the program over 2012–2017. A major portion of this budget is to establish CREF, which will be the core financial institution responsible for the effective delivery of subsidies and credit support to the renewable energy sector.
US$ 184 million
has been committed to implement NRREP over 2012–2017
1.4 CCS4ALL: History of Initiatives
1.4.1 Cook-Stoves Although ICS promotion in Nepal dates back to the 1950s, ICS received recognition in government plans and programs only from the 1980s. In 1981 for example, the Community Forestry Development Project, supported by the Food and Agriculture Organization of the United Nations, initiated dissemination of prefabricated ceramic ICS. In 1982, the Research Center for Applied Science and Technology initiated field testing and design modification. Other major organizations and projects involved in ICS were the Small Farmer Development Project of the Agriculture Development Bank, the United Mission to Nepal, the Terai Community Forestry Development Project, the Nepal-Australian Forestry Project, the Resource Conservation and Utilization Project, and CARE Nepal. However, continued use of the stoves was the primary issue given a lack of skills at local level for the stoves’ repair and maintenance; lack of “ownership” owing to fully subsidized products; and a target-oriented and top-down approach.
Promotion of ICS gained momentum with the start of the AEPC-executed Energy Sector Assistance Program (ESAP). It was started with Danish government support in 1999. The key approaches of the National ICS Program of the AEPC/ESAP included participation of central, regional, and local partners; targeting to rural women; information dissemination and awareness campaigns to create demand; in situ ICS2 designs to suit users’ demands; skills transfer at local level; no direct subsidy for mud ICS; regular follow-up, monitoring, and field testing; and integration of ICS in other rural development programs related to energy, the environment, health, and gender. The National ICS Program initially started in the hills (see the map at figure 10), gradually expanded its geographical scope (to all ecological regions) and its technology (promoting mud ICS, metallic ICS, institutional ICS, and gasifiers), and ultimately became the Biomass Energy Support Program with the start of ESAP Phase II in March 2007. ESAP came to an end with the start of NRREP on 16 July 2012 (see box 3). ICS initiatives under AEPC have been carried forward under the Biomass Energy Sub-Component of NRREP.
Realizing the need of a stronger joint collaboration between the different stakeholders, AEPC and stakeholders formed the Nepal Alliance for Clean Cookstoves in July 2013 (box 4). Further, in July 2013, to achieve CCS4ALL, the government and AEPC promoted the Clean Cookstoves Market Place with an objective to showcase national and international products as well as business models. The Market Place also facilitated business-to-business links and explored investment opportunities. AEPC also organized product development and research and development (R&D) initiatives such as a Biomass Cook-stove Design Listing and a Biomass Cook Stove Design Competition.
2 Also called “site-built” ICS.
5Investment prospectus for clean cooking solutions in Nepal
Box 4: Objectives of the Nepal Alliance for Clean Cook-stoves
The Alliance focuses on encouraging and supporting tighter coordination in clean cooking via the following objectives:
Create an enabling environment: To create synergy among partner organizations and a strong platform for information exchange and engage stakeholders in policy discussions.
Attract additional finances: Support collaboration of various national and international actors with interest to invest on impact and those with implementation expertise to achieve the strategic intent.
Improve the quality of customized product lines: Showcase the successful national and international products and business models that have improved level of affordability, replicability, and scalability in Nepal. This will include information on Nepali cookstoves market intelligence including the market size, nature of market, present actors, and so on.
Understand rural and urban Nepali markets for cookstoves: Develop better understanding of rural as well as urban Nepali markets and household decision making processes for cookstoves adoption. The Alliance should attract private expertise and investment in cookstove markets to assist market transformation.
Collaborate with international platforms: Establish relations with the Global Alliance for Clean Cookstoves to represent Nepal.
Considering the need for gaining a measurable shift from business as usual, AEPC/NRREP has revised the existing service delivery mechanism of the Biomass Energy Sub-Component, primarily implementing the program through District Development Committees/Environment, Energy & Climate Change Section instead of Regional Service Centers in most of the hill districts (see the map at figure 10) where program activities have been in place for more than a decade or so.
In 2014, the government developed Service Delivery Guidelines for District Development Committees for activities of the Biomass Energy Sub-Component. The same year, a National Interim Benchmark for Solid Biomass Cook-stoves was established to set minimum standards for subsidies. During the latter half of 2014, the Renewable Energy Test Station was upgraded for testing biomass-based cookstoves. A study on feasibility and market identification of densified biomass briquettes was also conducted by AEPC.
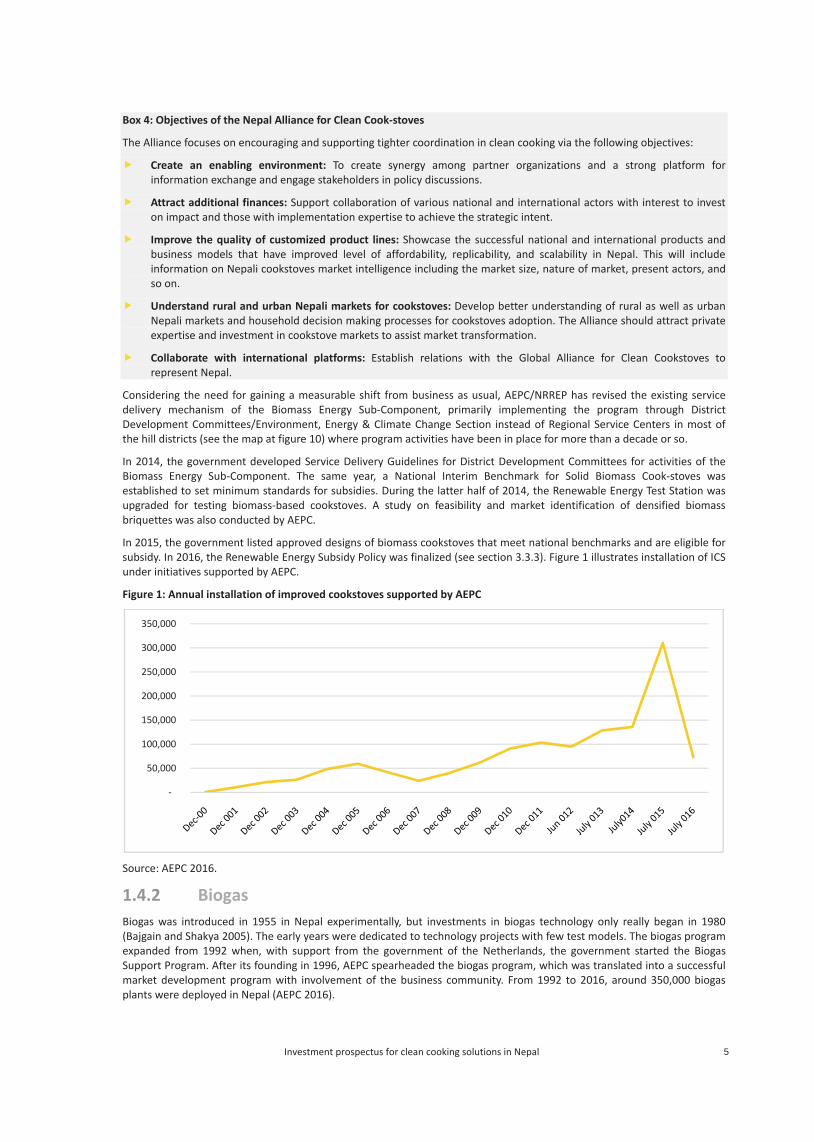
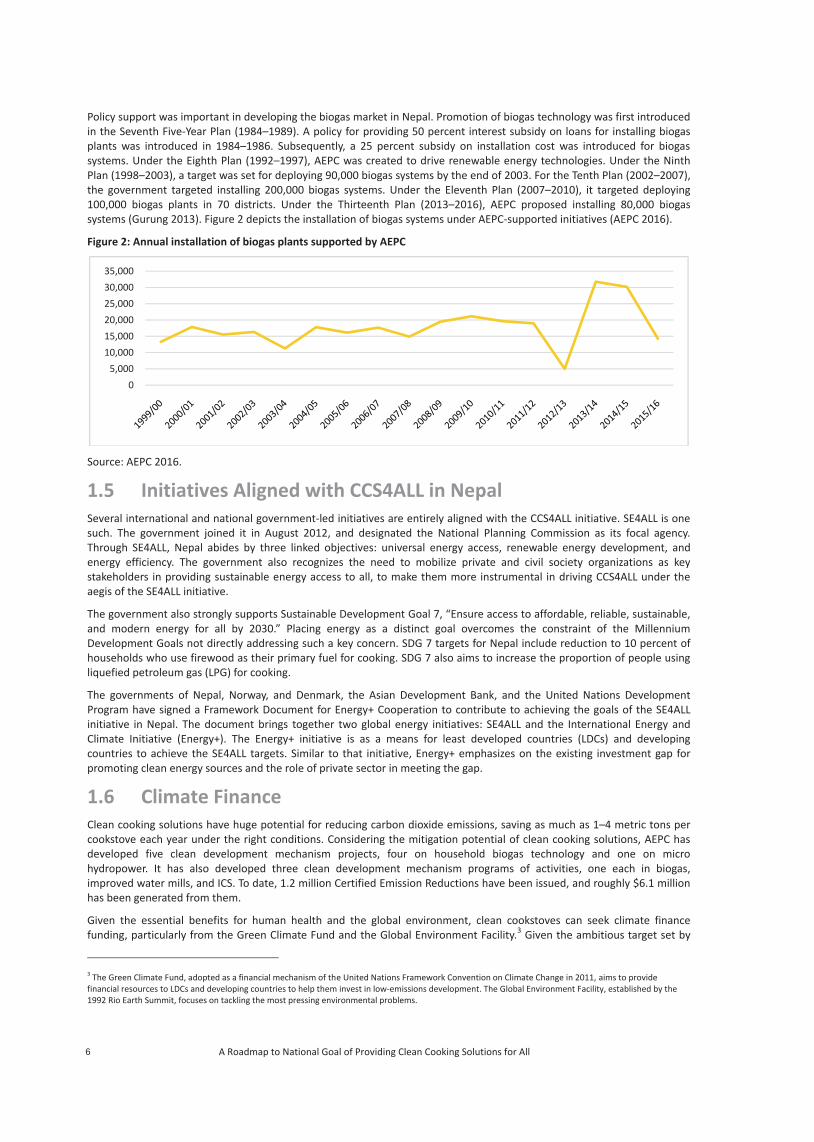
In 2015, the government listed approved designs of biomass cookstoves that meet national benchmarks and are eligible for subsidy. In 2016, the Renewable Energy Subsidy Policy was finalized (see section 3.3.3). Figure 1 illustrates installation of ICS under initiatives supported by AEPC.
Figure 1: Annual installation of improved cookstoves supported by AEPC
Source: AEPC 2016.
1.4.2 Biogas Biogas was introduced in 1955 in Nepal experimentally, but investments in biogas technology only really began in 1980 (Bajgain and Shakya 2005). The early years were dedicated to technology projects with few test models. The biogas program expanded from 1992 when, with support from the government of the Netherlands, the government started the Biogas Support Program. After its founding in 1996, AEPC spearheaded the biogas program, which was translated into a successful market development program with involvement of the business community. From 1992 to 2016, around 350,000 biogas plants were deployed in Nepal (AEPC 2016).
-
50,000
100,000
150,000
200,000
250,000
300,000
350,000
6 A Roadmap to National Goal of Providing Clean Cooking Solutions for All
Policy support was important in developing the biogas market in Nepal. Promotion of biogas technology was first introduced in the Seventh Five-Year Plan (1984–1989). A policy for providing 50 percent interest subsidy on loans for installing biogas plants was introduced in 1984–1986. Subsequently, a 25 percent subsidy on installation cost was introduced for biogas systems. Under the Eighth Plan (1992–1997), AEPC was created to drive renewable energy technologies. Under the Ninth Plan (1998–2003), a target was set for deploying 90,000 biogas systems by the end of 2003. For the Tenth Plan (2002–2007), the government targeted installing 200,000 biogas systems. Under the Eleventh Plan (2007–2010), it targeted deploying 100,000 biogas plants in 70 districts. Under the Thirteenth Plan (2013–2016), AEPC proposed installing 80,000 biogas systems (Gurung 2013). Figure 2 depicts the installation of biogas systems under AEPC-supported initiatives (AEPC 2016).
Figure 2: Annual installation of biogas plants supported by AEPC
Source: AEPC 2016.
1.5 Initiatives Aligned with CCS4ALL in Nepal Several international and national government-led initiatives are entirely aligned with the CCS4ALL initiative. SE4ALL is one such. The government joined it in August 2012, and designated the National Planning Commission as its focal agency. Through SE4ALL, Nepal abides by three linked objectives: universal energy access, renewable energy development, and energy efficiency. The government also recognizes the need to mobilize private and civil society organizations as key stakeholders in providing sustainable energy access to all, to make them more instrumental in driving CCS4ALL under the aegis of the SE4ALL initiative.
The government also strongly supports Sustainable Development Goal 7, “Ensure access to affordable, reliable, sustainable, and modern energy for all by 2030.” Placing energy as a distinct goal overcomes the constraint of the Millennium Development Goals not directly addressing such a key concern. SDG 7 targets for Nepal include reduction to 10 percent of households who use firewood as their primary fuel for cooking. SDG 7 also aims to increase the proportion of people using liquefied petroleum gas (LPG) for cooking.
The governments of Nepal, Norway, and Denmark, the Asian Development Bank, and the United Nations Development Program have signed a Framework Document for Energy+ Cooperation to contribute to achieving the goals of the SE4ALL initiative in Nepal. The document brings together two global energy initiatives: SE4ALL and the International Energy and Climate Initiative (Energy+). The Energy+ initiative is as a means for least developed countries (LDCs) and developing countries to achieve the SE4ALL targets. Similar to that initiative, Energy+ emphasizes on the existing investment gap for promoting clean energy sources and the role of private sector in meeting the gap.
1.6 Climate Finance Clean cooking solutions have huge potential for reducing carbon dioxide emissions, saving as much as 1–4 metric tons per cookstove each year under the right conditions. Considering the mitigation potential of clean cooking solutions, AEPC has developed five clean development mechanism projects, four on household biogas technology and one on micro hydropower. It has also developed three clean development mechanism programs of activities, one each in biogas, improved water mills, and ICS. To date, 1.2 million Certified Emission Reductions have been issued, and roughly $6.1 million has been generated from them.
Given the essential benefits for human health and the global environment, clean cookstoves can seek climate finance funding, particularly from the Green Climate Fund and the Global Environment Facility.3 Given the ambitious target set by
3 The Green Climate Fund, adopted as a financial mechanism of the United Nations Framework Convention on Climate Change in 2011, aims to provide financial resources to LDCs and developing countries to help them invest in low-emissions development. The Global Environment Facility, established by the 1992 Rio Earth Summit, focuses on tackling the most pressing environmental problems.
0
5,000
10,000
15,000
20,000
25,000
30,000
35,000
7Investment prospectus for clean cooking solutions in Nepal
the government under CCS4ALL and the existing investment gap for achieving them, it is vital to mobilize climate finance to catalyze adoption of clean cooking solutions in Nepal.
1.7 Nepal’s Graduation from LDC Status Through CCS4ALL LDCs are the poorest and weakest segments of the international community, characterized by low per capita income, low human development, and economic and structural handicaps to growth that limit resilience to vulnerabilities (UN 2011). One key challenge faced by LDCs is access to sustainable energy sources. The energy access rates are much lower for LDCs than developing countries, creating a substantial energy gap and requiring these countries to focus on providing universal energy access to all, which is critical for long-term economic growth and sustainable development.
The government aims to “graduate” Nepal from LDC status by 2022 and recognizes that adequate supply and consumption of reliable, high-quality, and sustainable energy are fundamentals to achieve the socio-economic growth required. Universal access to sustainable energy will not only help the government address the challenge of climate change, but also the challenge of poverty.
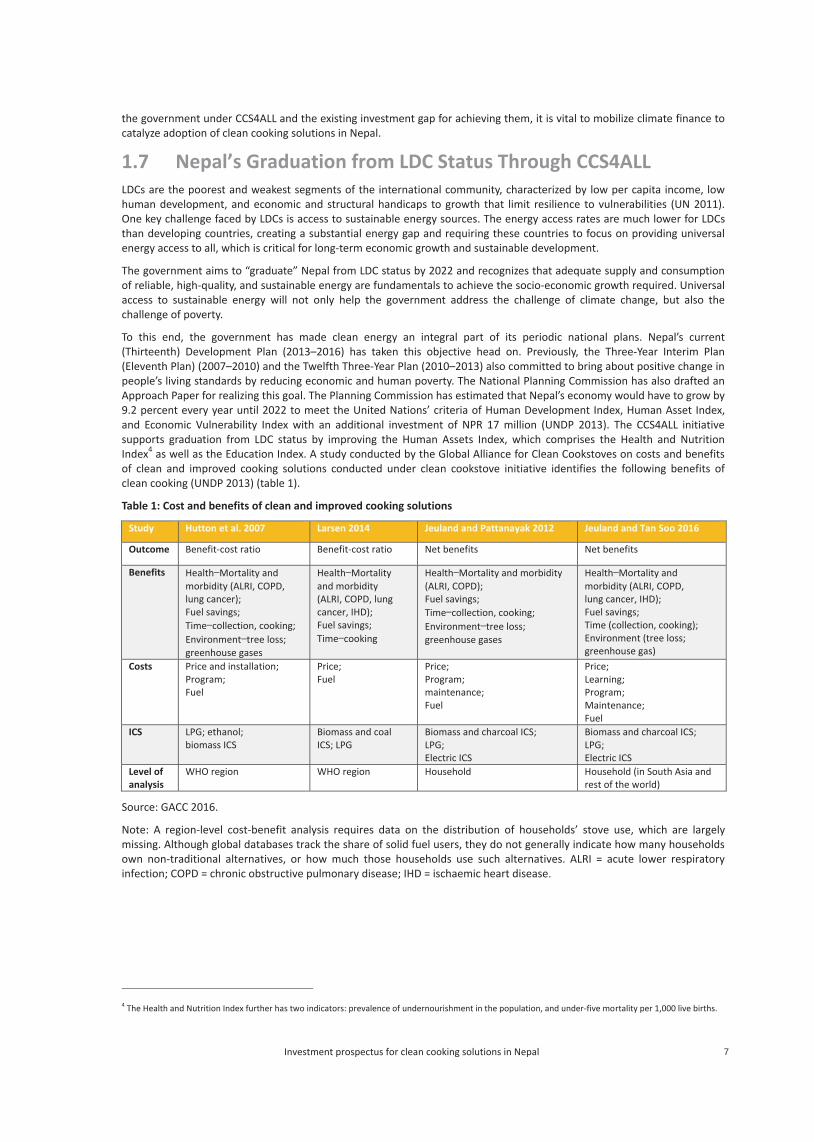
To this end, the government has made clean energy an integral part of its periodic national plans. Nepal’s current (Thirteenth) Development Plan (2013–2016) has taken this objective head on. Previously, the Three-Year Interim Plan (Eleventh Plan) (2007–2010) and the Twelfth Three-Year Plan (2010–2013) also committed to bring about positive change in people’s living standards by reducing economic and human poverty. The National Planning Commission has also drafted an Approach Paper for realizing this goal. The Planning Commission has estimated that Nepal’s economy would have to grow by 9.2 percent every year until 2022 to meet the United Nations’ criteria of Human Development Index, Human Asset Index, and Economic Vulnerability Index with an additional investment of NPR 17 million (UNDP 2013). The CCS4ALL initiative supports graduation from LDC status by improving the Human Assets Index, which comprises the Health and Nutrition Index4 as well as the Education Index. A study conducted by the Global Alliance for Clean Cookstoves on costs and benefits of clean and improved cooking solutions conducted under clean cookstove initiative identifies the following benefits of clean cooking (UNDP 2013) (table 1).
Table 1: Cost and benefits of clean and improved cooking solutions
Study Hutton et al. 2007 Larsen 2014 Jeuland and Pattanayak 2012 Jeuland and Tan Soo 2016
Outcome Benefit-cost ratio Benefit-cost ratio Net benefits Net benefits
Benefits Health Mortality and morbidity (ALRI, COPD, lung cancer); Fuel savings; Time collection, cooking; Environment tree loss; greenhouse gases
Health Mortality and morbidity (ALRI, COPD, lung cancer, IHD); Fuel savings; Time cooking
Health Mortality and morbidity (ALRI, COPD); Fuel savings; Time collection, cooking; Environment tree loss; greenhouse gases
Health Mortality and morbidity (ALRI, COPD, lung cancer, IHD); Fuel savings; Time (collection, cooking); Environment (tree loss; greenhouse gas)
Costs Price and installation; Program; Fuel
Price; Fuel
Price; Program; maintenance; Fuel
Price; Learning; Program; Maintenance; Fuel
ICS LPG; ethanol;biomass ICS
Biomass and coalICS; LPG
Biomass and charcoal ICS; LPG; Electric ICS
Biomass and charcoal ICS; LPG; Electric ICS
Level of analysis
WHO region WHO region Household Household (in South Asia and rest of the world)
Source: GACC 2016.
Note: A region-level cost-benefit analysis requires data on the distribution of households’ stove use, which are largely missing. Although global databases track the share of solid fuel users, they do not generally indicate how many households own non-traditional alternatives, or how much those households use such alternatives. ALRI = acute lower respiratory infection; COPD = chronic obstructive pulmonary disease; IHD = ischaemic heart disease
4 The Health and Nutrition Index further has two indicators: prevalence of undernourishment in the population, and under-five mortality per 1,000 live births.

8 A Roadmap to National Goal of Providing Clean Cooking Solutions for All
9Investment prospectus for clean cooking solutions in Nepal
10 A Roadmap to National Goal of Providing Clean Cooking Solutions for All
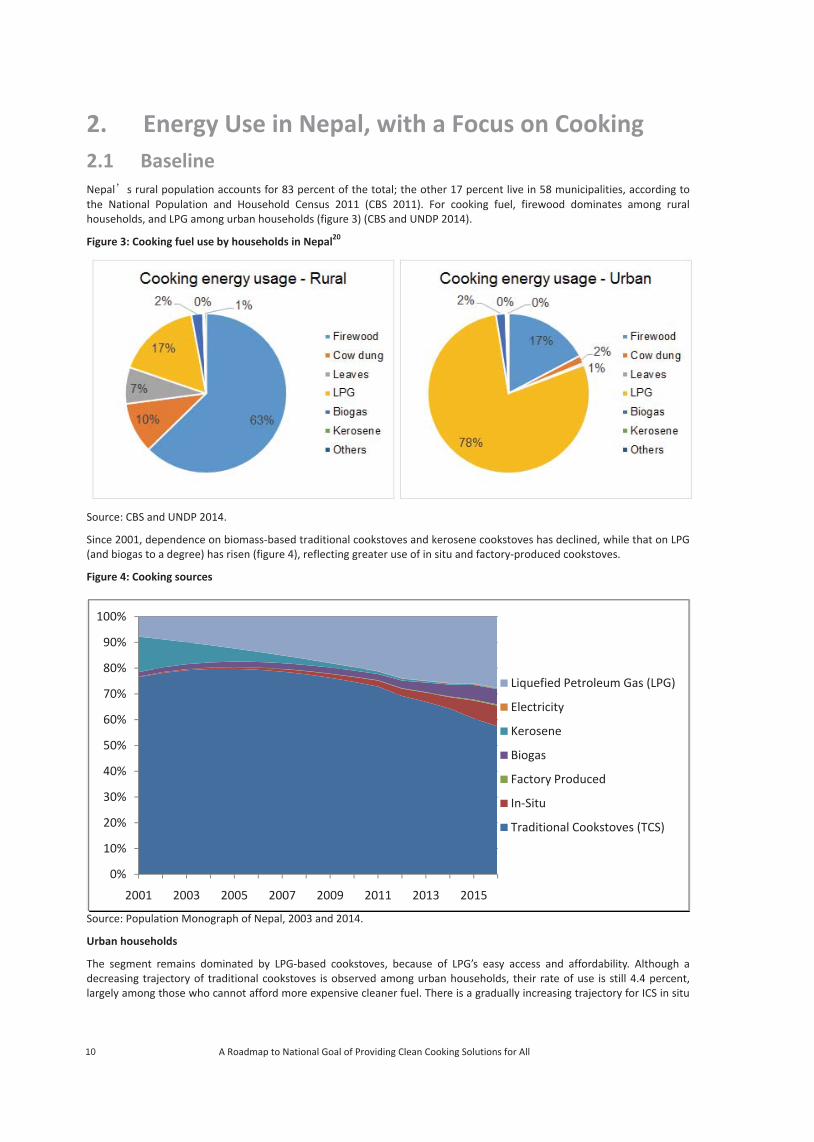
2. Energy Use in Nepal, with a Focus on Cooking 2.1 Baseline Nepal s rural population accounts for 83 percent of the total; the other 17 percent live in 58 municipalities, according to the National Population and Household Census 2011 (CBS 2011). For cooking fuel, firewood dominates among rural households, and LPG among urban households (figure 3) (CBS and UNDP 2014).
Figure 3: Cooking fuel use by households in Nepal20
Source: CBS and UNDP 2014.
Since 2001, dependence on biomass-based traditional cookstoves and kerosene cookstoves has declined, while that on LPG (and biogas to a degree) has risen (figure 4), reflecting greater use of in situ and factory-produced cookstoves.
Figure 4: Cooking sources
Source: Population Monograph of Nepal, 2003 and 2014.
Urban households
The segment remains dominated by LPG-based cookstoves, because of LPG’s easy access and affordability. Although a decreasing trajectory of traditional cookstoves is observed among urban households, their rate of use is still 4.4 percent, largely among those who cannot afford more expensive cleaner fuel. There is a gradually increasing trajectory for ICS in situ
0%
10%
20%
30%
40%
50%
60%
70%
80%
90%
100%
2001 2003 2005 2007 2009 2011 2013 2015
Liquefied Petroleum Gas (LPG)
Electricity
Kerosene
Biogas
Factory Produced
In-Situ
Traditional Cookstoves (TCS)
11Investment prospectus for clean cooking solutions in Nepal
modelaccess
Rural h
Despitcookstincomsuppois, a laand mproducfor pro
Energy
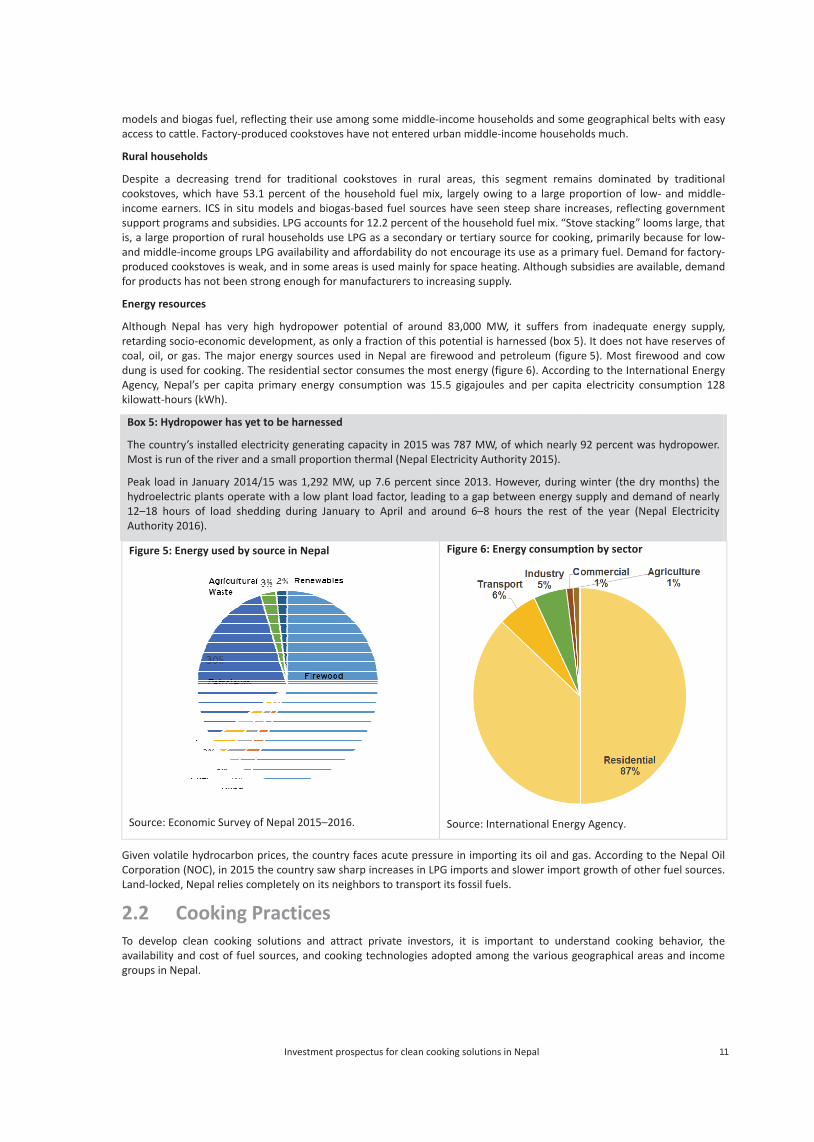
Althouretardcoal, odung iAgenckilowa
Box 5
The cMost
Peak hydro12–1Autho
Figur
Sour
Given CorpoLand-l
2.2 To devavailabgroups
ls and biogas fus to cattle. Facto
households
te a decreasintoves, which hae earners. ICS rt programs an
arge proportionmiddle-income g
ced cookstovesoducts has not
y resources
ugh Nepal has ing socio-econo
oil, or gas. The s used for cooky, Nepal’s per
att-hours (kWh)
5: Hydropower
country’s instalt is run of the ri
load in Januaroelectric plants8 hours of loaority 2016).
re 5: Energy use
ce: Economic S
volatile hydrocration (NOC), inocked, Nepal re
Cookivelop clean cobility and cost s in Nepal.
uel, reflecting thory-produced c
g trend for trave 53.1 percein situ models d subsidies. LPG
n of rural housegroups LPG avais is weak, and inbeen strong en
very high hydomic developmmajor energy
king. The residecapita primary
).
has yet to be h
led electricity gver and a small
ry 2014/15 wass operate with aad shedding du
ed by source in
urvey of Nepal
carbon prices, tn 2015 the couelies completely
ing Practooking solutionof fuel sources
heir use amongcookstoves have
raditional cookent of the hous
and biogas-baG accounts for eholds use LPGilability and affn some areas is
nough for manu
dropower potement, as only a f
sources used iential sector coy energy consu
harnessed
generating capal proportion the
s 1,292 MW, upa low plant loauring January t
n Nepal
2015–2016.
the country facntry saw sharp y on its neighbo
tices ns and attract s, and cooking t
g some middle-e not entered u
kstoves in rurasehold fuel mixsed fuel source12.2 percent of as a secondaryordability do nos used mainly fo
ufacturers to inc
ntial of aroundfraction of this in Nepal are fir
onsumes the moumption was 15
acity in 2015 wermal (Nepal El
p 7.6 percent sd factor, leadinto April and a
ces acute pressincreases in LP
ors to transport
private investotechnologies a
-income househurban middle-in
l areas, this sx, largely owinges have seen stf the householdy or tertiary soot encourage itor space heatincreasing supply
d 83,000 MW, potential is ha
rewood and peost energy (figu5.5 gigajoules
was 787 MW, oflectricity Autho
since 2013. Hong to a gap betround 6–8 hou
Figure 6: Ene
Source: Inter
ure in importinPG imports andt its fossil fuels
ors, it is impodopted among
holds and somencome househo
segment remaig to a large proteep share incrd fuel mix. “Sto
ource for cookints use as a primng. Although suy.
it suffers fromrnessed (box 5)etroleum (figurure 6). Accordinand per capita
f which nearly ority 2015).
wever, during wween energy surs the rest of
ergy consumpti
rnational Energy
ng its oil and ga slower import .
rtant to under the various ge
e geographical olds much.
ns dominated oportion of lowreases, reflectin
ove stacking” long, primarily be
mary fuel. Demaubsidies are ava
m inadequate ). It does not h
re 5). Most firewng to the Interna electricity con
92 percent was
winter (the dryupply and demf the year (Ne
ion by sector
y Agency.
as. According togrowth of othe
rstand cookingeographical are
belts with easy
by traditionalw- and middle-ng governmentoms large, thatecause for low-and for factory-ilable, demand
energy supply,ave reserves ofwood and cownational Energynsumption 128
s hydropower.
y months) the mand of nearly
pal Electricity
o the Nepal Oiler fuel sources.
g behavior, theeas and income
y
l -t t - -d
, f
w y 8
l .
e e

12 A Roadmap to National Goal of Providing Clean Cooking Solutions for All
2.2.1 Cooking, Cookstove, and Fuel Preferences Cooking and food consumption patterns vary by area and income group. The country has 75 districts with 16 districts in the mountainous north, 39 districts in the hills, and 20 districts in the lowland Terai in the south (see the map at figure 10).5 It has seven states.6 Households are grouped into three broad ecological regions—Mountain (35 percent of the landmass), Hills (42 percent), and Terai (23 percent)—which influence their food habits and cooking behavior. The staples in all regions are rice, maize, pulses, and wheat.
To study cooking behavior and cooking technology used by population segments, field visits followed by focused group discussion were conducted. Based on the visit recordings and literature review, critical observations were made. As heard from users, many households use a stove three or four times a day for cooking food such as breakfast, lunch, khaja,7and dinner, and the average time for cooking a meal falls sharply once households use ICS(ESAP 2013).
The National Center for Biotechnology Information, funded by the United States government, in 2014 conducted a study whose results were published as “Behavioral Attitudes and Preferences in Cooking Practices with Traditional Open-Fire Stoves in Peru, Nepal, and Kenya: Implications for Improved Cook Stove Interventions” (NCBI 2014). Its field research showed that rural Nepali households traditional use a mato ko chulho (mud stove). The study’s participants often explained that it represented an important part of their customs and ancestral heritage, and felt that it cooked the food well and produced the right flavor. The heat distributed by a traditional open fire stove and its stability was a direct function of the staple food cooked in the region. For example, in Nepal rice is a staple food, and women boil rice in a large metal pot without stirring, requiring an even distribution of heat across the pot to avoid burning the rice at the bottom. Because they do not stir the pot continuously, they do not require a firmly grounded stove. The mato ko chulho has a large burner opening and distributes heat across a wide area of the pot and so meets their cooking requirements. Per the National Center for Biotechnology Information study, women in Nepal likes the convenience of leaving large logs on the fire of traditional cookstoves that keep embers warm throughout the day. Women in the mountains (where temperatures are extremely low in winter) use stoves not only for cooking but also keeping the room warm.
The design and type of traditional stoves vary by socio-economic groups, with women from wealthier groups (or with higher status) using stoves with stronger walls, better aesthetics, and greater durability, and so need less maintenance. Women with fewer resources use cruder version of cookstoves, or sometimes cook on a “three-stone” open fire (NCBI 2014).
Weather and local customs also help determine cookstove selection. During monsoon and harsh winter conditions, women prefer to cook indoors, whereas in peak summer, with uncomfortably warm kitchens, they prefer to cook outdoors—as they do when using crop residues, as these generate large amounts of sparks and ash. In many households, non-vegetarian diets also dictate where people cook, as meats are often considered “impure” and require separate handling. This is seen especially during religious festivals when families build temporary stoves for cooking the foods to be offered to deities and consumed by households as Prasad (NCBI 2014).
Cleaning and maintaining stoves often depend on the type of fuel used and ash generated. Stoves using firewood are cleaned less often than those fuelled by animal dung and crop residues. Stoves are also rebuilt or maintained for religious reasons like appeasing “Lakshmi,” the goddess of wealth and prosperity, for whom the stove is an abode(NCBI 2014).
Ashes are put to good use. The ash from firewood, for example, is used for cleaning, and the ash from dung fuel is used as fertilizer. Nepali women have to complete several household chores along with cooking, including gathering fuel, water, tending to animals, crops, caring for children, and cleaning of their homes and clothing. Hence, they appreciate the flexibility of traditional stoves, as they can leave them burning to finish other household chores. Women can easily and quickly repair minor breaks in their traditional cookstoves using local materials (NCBI 2014).
But the existing traditional cookstoves cannot cook food for many people quickly, often an important social need. Women are sometimes verbally or even physically abused if they are slow to serve food, triggering their aspiration for a new stove (NCBI 2014).
2.2.2 Cooking Fuel Use in the Business-as-Usual Scenario Biomass is the major cooking fuel in 75 percent of Nepali households (Population Monograph 2014, National Planning Commission) (table 2). Under the business-as-usual scenario (one of three scenarios—see chapter 4), over 65 percent of the country will still use biomass for cooking in 2030 (around 57 percent solid biomass and roughly 8 percent biogas).
5 Under the new constitution, adopted on 20 September 2015, the districts may be realigned. 6 Schedule 4 of the new constitution provides for the division of the country into seven states. Before that, it was divided into five development regions. 7A typical dish of rice, roasted soybeans, and potatoes mixed with carrots, cucumbers, ginger, and garlic, served with ginger, garlic, salt, and a touch of lemon.
13Investment prospectus for clean cooking solutions in Nepal
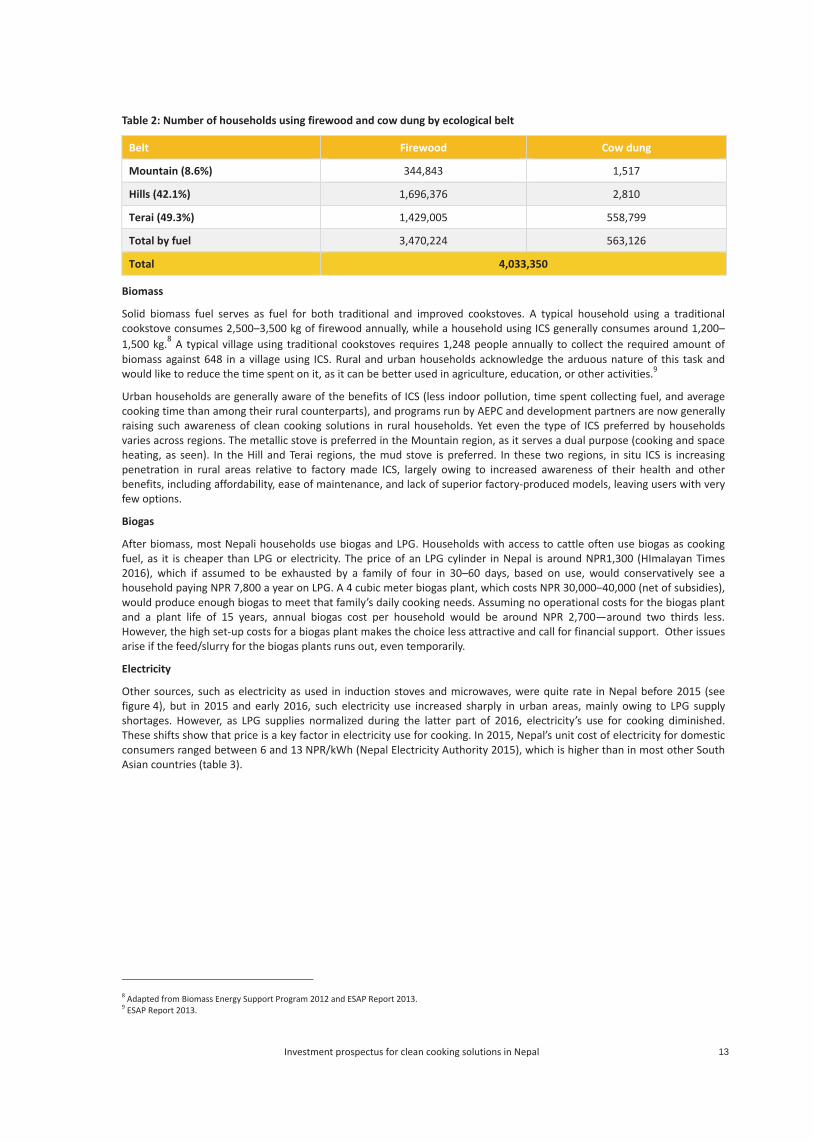
Table 2: Number of households using firewood and cow dung by ecological belt
Belt Firewood Cow dung
Mountain (8.6%) 344,843 1,517
Hills (42.1%) 1,696,376 2,810
Terai (49.3%) 1,429,005 558,799
Total by fuel 3,470,224 563,126
Total 4,033,350
Biomass
Solid biomass fuel serves as fuel for both traditional and improved cookstoves. A typical household using a traditional cookstove consumes 2,500–3,500 kg of firewood annually, while a household using ICS generally consumes around 1,200–1,500 kg.8 A typical village using traditional cookstoves requires 1,248 people annually to collect the required amount of biomass against 648 in a village using ICS. Rural and urban households acknowledge the arduous nature of this task and would like to reduce the time spent on it, as it can be better used in agriculture, education, or other activities.9
Urban households are generally aware of the benefits of ICS (less indoor pollution, time spent collecting fuel, and average cooking time than among their rural counterparts), and programs run by AEPC and development partners are now generally raising such awareness of clean cooking solutions in rural households. Yet even the type of ICS preferred by households varies across regions. The metallic stove is preferred in the Mountain region, as it serves a dual purpose (cooking and space heating, as seen). In the Hill and Terai regions, the mud stove is preferred. In these two regions, in situ ICS is increasing penetration in rural areas relative to factory made ICS, largely owing to increased awareness of their health and other benefits, including affordability, ease of maintenance, and lack of superior factory-produced models, leaving users with very few options.
Biogas
After biomass, most Nepali households use biogas and LPG. Households with access to cattle often use biogas as cooking fuel, as it is cheaper than LPG or electricity. The price of an LPG cylinder in Nepal is around NPR1,300 (HImalayan Times 2016), which if assumed to be exhausted by a family of four in 30–60 days, based on use, would conservatively see a household paying NPR 7,800 a year on LPG. A 4 cubic meter biogas plant, which costs NPR 30,000–40,000 (net of subsidies), would produce enough biogas to meet that family’s daily cooking needs. Assuming no operational costs for the biogas plant and a plant life of 15 years, annual biogas cost per household would be around NPR 2,700—around two thirds less. However, the high set-up costs for a biogas plant makes the choice less attractive and call for financial support. Other issues arise if the feed/slurry for the biogas plants runs out, even temporarily.
Electricity
Other sources, such as electricity as used in induction stoves and microwaves, were quite rate in Nepal before 2015 (see figure 4), but in 2015 and early 2016, such electricity use increased sharply in urban areas, mainly owing to LPG supply shortages. However, as LPG supplies normalized during the latter part of 2016, electricity’s use for cooking diminished. These shifts show that price is a key factor in electricity use for cooking. In 2015, Nepal’s unit cost of electricity for domestic consumers ranged between 6 and 13 NPR/kWh (Nepal Electricity Authority 2015), which is higher than in most other South Asian countries (table 3).
8 Adapted from Biomass Energy Support Program 2012 and ESAP Report 2013. 9 ESAP Report 2013.

14 A Roadmap to National Goal of Providing Clean Cooking Solutions for All
Table 3: Domestic electricity tariffs in some South Asian Countries (converted to equivalent NPR)
Nepal India Bangladesh Bhutan
6–13 NPR/kWh 3.22–9.98 NPR/kWh (UPPCL 2016)
4.53–13.59 NPR/kWh (DPDCL 2015)
2.06–5.20 NPR/kWh (Bhutan Power Corporation Ltd. 2016)
Note: Tariff rates vary as per monthly kWh consumption. Households consuming less electricity pay lower tariffs than those with higher consumption.
Source: Nepal Electricity Authority 2016b.
Power imports from neighboring countries are expected to increase, as will the unit cost of imported electricity. Captive renewable generation is seen bridging the supply–demand gap, and solar power plants are being promoted, though as with imported power, captive renewable plants will be increasing the cost unit to consumers. The electricity peak demand forecast versus planned future generation capacities is in figure 7. Some assumptions are that50 percent of generation capacities under construction will be deployed by 2018 and 100 percent capacity by 2022; and that 100 percent of generation capacities of planned and proposed plants will be deployed by 2030. The figure points to a consistent deficit in indigenous electricity supply against expected peak demand. Cost implications are huge for investments in generation, transmission, and distribution. Connecting 100 percent of the population to reliable electricity is a tough proposition given the terrain, and financial and technical resources.
Figure 7: Planned installed electrical capacity vs peak demand
Nepal Electricity Authority.
For electricity to be used as the primary fuel source for cooking, besides cost and supply considerations, another factor is grid infrastructure, which will have to be resilient to variable generation and demand—and thus expensive. Necessary controls (such as primary, secondary, and tertiary controls) and grid support services that have fast-ramping actions to support such variability must be contracted and scheduled. Thermal plants have technical limitation for in-grid support actions. Finally, capacity charges need to be provided for contracting grid support services, adding to the cost. Hence, in our assessment, electricity as a primary fuel source for cooking is not foreseeable. While widespread use of electricity as a primary cooking source will take longer, there is increasing use of electric cookers and induction cooking devices in many Nepali households, and this is expected to increase more rapidly, especially as the grid becomes more reliable.
Liquefied petroleum gas
LPG as a primary cooking fuel is used mainly by urban households; most rural households use it as a secondary or tertiary source. Given demand for LPG in urban and semi-urban areas, the government provides a subsidy on LPG to all LPG consumers, though it is very unlikely to be sustainable (box 6), given the LPG price ups and downs on the international market. NOC, established by the government as a state-owned trading company to deal with the import, transport, storage, and distribution of petroleum products in the country, is currently profitable owing to low import prices of LPG and other petroleum fuels. In the past, NOC incurred losses because of fuel subsidies (Nepal Oil Corporation Ltd. 2016).
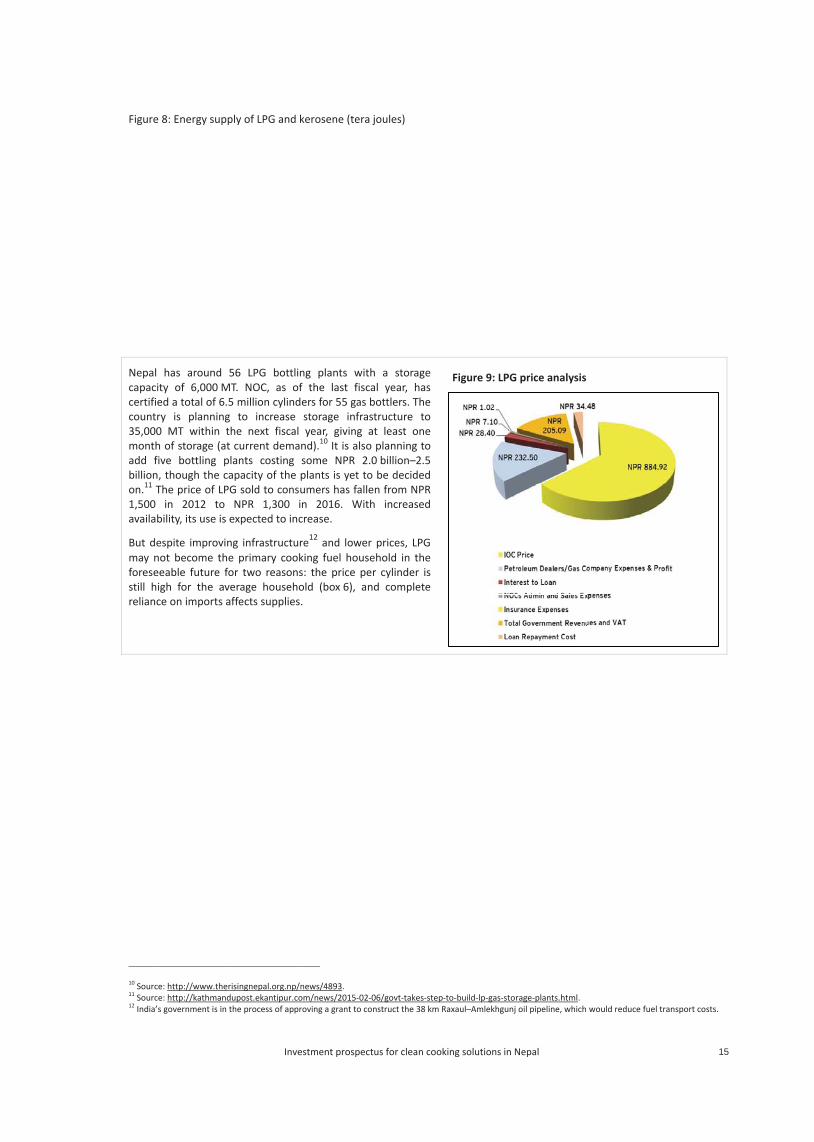
To control use of kerosene as a transport fuel, NOC had made the domestic prices of kerosene equivalent to diesel (HImalayan Times 2016). This decreased consumption of kerosene for cooking while equivalent use of LPG increased in urban areas. Overall trends of LPG and kerosene consumption are shown in figure 8.
12861742
2378
4614
787 913
1826
4004
0
500
1000
1500
2000
2500
3000
3500
4000
4500
5000
2015 2016 2017 2018 2019 2020 2021 2022 2023 2024 2025 2026 2027 2028 2029 2030
Demand(MW)
Supply(MW)
15Investment prospectus for clean cooking solutions in Nepal
Figure
Nepal capacicertifiecountr35,000monthadd fibillionon.11 T1,500 availab
But demay nforesestill hirelianc
10 Sourc11 Sourc12 India’s
8: Energy supp
has around 5ty of 6,000 Med a total of 6.5ry is planning0 MT within th of storage (ative bottling p, though the ca
The price of LPGin 2012 to
bility, its use is e
espite improvinnot become theeeable future foigh for the avce on imports a
e: http://www.there: http://kathmands government is in t
ply of LPG and k
56 LPG bottlinMT. NOC, as of
5 million cylindg to increase he next fiscal
t current demanlants costing apacity of the pG sold to consuNPR 1,300 i
expected to inc
ng infrastructure primary cookor two reasonserage househo
affects supplies.
risingnepal.org.np/ndupost.ekantipur.cothe process of appr
kerosene (tera j
ng plants withf the last fiscaers for 55 gas bstorage infrasyear, giving a
nd).10 It is also some NPR 2.0plants is yet toumers has fallen 2016. With
crease.
re12 and lower king fuel houses: the price peold (box 6), an.
news/4893. om/news/2015-02-0roving a grant to co
joules)
h a storage al year, has bottlers. The structure to at least one
planning to 0 billion–2.5 be decided
en from NPR h increased
prices, LPG ehold in the r cylinder is d complete
06/govt-takes-step-nstruct the 38 km R
-to-build-lp-gas-stoRaxaul–Amlekhgunj
Figure 9: LPG
rage-plants.html. oil pipeline, which
G price analysis
would reduce fuel transport costs.

16 A Roadmap to National Goal of Providing Clean Cooking Solutions for All
Box 6: Factors working against the uptake of LPG as a primary cooking fuel
Nepal’s gross national income (GNI) per capita is NPR 79,570 (around US$ 740/annum) or NPR 6,630/month (circa US$ 62/month), according to 2015 World Bank data.
Cooking three typical meals (roti, vegetables, dal, and rice) in an average Nepali household of 4.5 members with LPG would consume a 14.2 kg LPG cylinder in one month, costing NPR 1,300 (around US$ 12 per month).
Considering at least two members earning the average per capita income in the average household, the cost of the LPG-to-income ratio exceeds 9.5 percent, which does not seem commercially viable.
For poorer households, LPG as a primary fuel makes no financial sense.
For LPG as a secondary fuel source, which is used for at least three months, households with one member earning the average national per capita income will need, to afford LPG for cooking, to spend at least 6 percent of their monthly income (at least 3.0 percent for two such income earners).
For LPG to be a primary fuel, it needs to cost less than 5 percent of household income. Even if it is assumed that LPG cost stays unchanged, household income would need to exceed NPR 28,000 a month (NPR 336,000 or around US$ 3,100 annually) to afford LPG, or over four times current GNI per capita.
To have a cost of LPG-to-income ratio less than 5 percent and using LPG as a primary fuel source for cooking, the average earning of the household may well have to be more than NPR 28,000 a month.
And even if average income rises dramatically, income disparities will persist, and poor households will continue to find LPG unaffordable as a primary fuel.
Although LPG may be an aspirational cooking fuel for Nepali households, the current realities are not conducive for it to become a primary cooking fuel for most households in rural and semi-urban areas. Regular use will remain low in average rural households. Nor are electricity and solar power expected to be dominant sources by 2023. Hence, biomass will stay the major cooking fuel source in Nepal which, given reliance on traditional cookstoves, burdens not only forest resources but also families’ health and safety
2.2.3 Barriers for Scaling Up Clean Cooking Technologies Barriers in the following four areas have hampered the scaling-up of clean cooking solutions in Nepal.
Policy
CCS4ALL was not envisioned in the past, and so policies never worked toward this goal. The focus remained on disseminating a few thousand clean cooking solutions in every development plan. Programs such as ESAP and NRREP were focused on experimental and incremental improvements enough to meet the targets for the period. Despite the announcement of CCS4ALL, foundations like setting up dedicated programs and budgets are yet to firmly set—in itself is a major barrier toward realizing the national goal.
Even though AEPC is implementing a national framework program, many agencies do not seem to have aligned their efforts with AEPC’s, duplicating efforts.
Economic
Subsidies are on offer, but one of the predominant economic barriers is the lack of financing schemes for potential consumers to buy an ICS. Access to finance has been made either through the informal financial sector or through instruments that offers no benefit to users, feeding into low willingness to pay among consumers.
Market players, stove builders, and stove technologies are few, in contrast to the global market. Even though a growing number of private actors and non-governmental organizations (NGOs) are coming up, most are small and yet to scale up. The number of trained technicians and stove builders who can build ICS/biogas plants and provide post-installation maintenance is also very limited, further suppressing the market for disseminating clean cooking solutions. Cost and availability of processed biomass fuel also present major challenges. Larger businesses are less interested in the cookstove market because of the paucity of public incentives.
Social
Rural Nepalis are yet to regard indoor air pollution as a health hazard.
Many users feel that traditional stoves cook properly and produce the right flavor.
Many people also consider the traditional way of cooking to be much easier.
17Investment prospectus for clean cooking solutions in Nepal
Technological
Consumers face a lack of choice of the models in the country, stemming from poor communication between cookstove manufacturers and users. Thus most people see new stove designs as ill-suited for cooking.
There is too little R&D in developing models and products that meet users’ requirements.
2.3 Cooking Fuels and Technologies Box 7 illustrates fuels used, and box 8 technologies available, for cooking in Nepal.
Box 7:Fuels used
Of the technologies options available, traditional cookstoves are the most widely used, followed by improved biomass cookstoves (in situ or factory-produced), LPG, and biogas. LPG, biogas, and electric cookers have the most technological maturity, while that for biomass-based ICS, gasifiers, and solar cookers still needs to evolve much further.
Processed biomass
An agrarian country, Nepal produces abundant agricultural residue year round for processing biomass fuel such as briquettes and pellets. Such fuel is still in the initial phase of growth.
Briquettes and pellets are high-density, dry, and energy-concentrated biomass fuels, converted from low-density and high-moisture bulky materials. They produce less smoke than fuel wood. Other advantages include higher heating values, lower emission of sulphur dioxide and nitrogen oxides. These fuels can be charred or non-charred.
Briquetting involves compacting loose biomass under pressure in a mould so as to retrieve a compact solid shaped by a die. The pelletizing press, piston press, roller press, and compaction are all used. A variety of stoves is used with processed biomass, such as clay stoves, double-wall metal stoves, and forced-draft stoves, in urban and semi-urban areas.
Biomass gasification
Gasification is the process of converting a solid fuel to a combustible gas. A small amount of oxygen is usually added during the process, either pure or from the air. Gasification with pure oxygen results in a gas with a medium calorific value, free of nitrogen. Household gasifiers have started to enter the market in Nepal, mostly imported.
The government subsidizes biomass-based gasifier stoves for rural and peri-urban households.
This technology has the potential to replace, or at least provide an alternative, to LPG if the supply chain of processed modern fuel can be strengthened. This technology is smoke free.
Biogas

18 A Roadmap to National Goal of Providing Clean Cooking Solutions for All
The cleanest stoves are in tiers 3 and 4. However, they are impractical, from affordability and utility perspectives, such that their market penetration through purely market mechanisms (the consumer pays for the stove) is virtually non-existent. They are really only seen in areas where consumers get them from a charity, or owing to CSR and subsidies. The focus here is on tier 2 stoves, a more cost-effective solution for Nepal at the moment
Box 8: Technologies available
Mud brick ICS
Mud brick ICS are very popular among rural households. They have been widely disseminated, partly reflecting support from NRREP for training and awareness programs, their flexibility (one-pot hole, two-pot hole, and so on), low construction cost, and higher efficiencies than traditional stoves.
Two types of mud ICS are disseminated in the country.
Metal ICS
AEPC promotes metallic ICS for cooking and space heating purpose in the high hills. These stoves are more efficient than traditional stoves, especially with their dual purpose. Four models are subsidized for households living at least 1,500 m above sea level.
Most other metallic ICS in Nepal are factory-produced, usually natural draft and forced draft.
LPG stoves
LPG is the predominant fuel in urban areas. These stoves are more efficient than firewood-burning stoves as the flames are more concentrated. Losses are also reduced because LPG storage and use allows very little scope for spillage or incomplete combustion.
This is a clean method of cooking. NOC is the regulating body for the distribution and import of LPG in Nepal.
19Investment prospectus for clean cooking solutions in Nepal
Rock
Thescombby a comp
The efficiinclucham
AEPCrocke“inststovemeet
Solar
The hbe uareas
Solarpopusuch cook
Elect
Electin urgoodgene
Duringrowthe s
ket stove
e stoves—mubustion, owing very short chim
plete combustio
main benefitsiency, ease of tde the mud r
mber, often diss
C distributes det stove, the itutional” rockes for householt the national b
r technology
high heat genesed for cookings and as backup
r cookers in Neular where woo
as trekking roukers.
tricity
tricity—the cleaban and rural a
d. Electricity is eration, transmi
ng recent disrwth momentumsupply of LPG w
ud or metal to their smallmney, which ason of volatiles,
s of the mud transport, and rocket stove wseminated by in
ifferent mud rportable fixe
ket stove. The lds in peri-urba
benchmark crite
rated by solar rg. (Solar technop for grid electr
epal are the cod is scarce andutes and high h
anest form of careas where fuenot a mainstreission, and distr
uptions of LPGm, especially in uwas restored.
lic—offer effi-diameter comssure good draand efficient us
rocket stove in situ constru
with a metallicnstitutions like C
rocket stoves, ed octagonal government s
an and rural areeria.
radiation conceology is mainlyricity in urban a
oncentric typed LPG is hard oills. AEPC and m
cooking technoel wood is scarc
eam cooking soribution.
G supply, induurban areas, bu
cient, high-tembustion chambaft, controlled use of heat prod
are low cost,uction capabilitc or ceramic cCRT.
like the portarocket stove,
subsidizes metaeas, provided th
entrated by a rey used for lightareas.)
e and box typeor expensive tomany NGOs pro
ology—is sometce but electricit
olution because
ction cookers ut that soon fell
emperature ber topped use of fuel, duced.
high fuel ty. Variants combustion
ble conical , and the allic rocket hese stoves
eflector can ing in rural
e. They are o transport, omote solar
times used ty supply is
e of limited
saw some l back once

20 A Roadmap to National Goal of Providing Clean Cooking Solutions for All
21Investment prospectus for clean cooking solutions in Nepal

22 A Roadmap to National Goal of Providing Clean Cooking Solutions for All
3. Policy Framework on Clean Cooking Solutions
3.1 Position of Clean Cooking Solutions in Periodic Plans Clean cooking solutions were first recognized in the Sixth Five-Year Plan (1980–1985) under the Food and Agriculture Organization of the United Nations–supported Community Forestry Development Project. This Plan aimed to prioritize ICS distribution and other forest-related initiatives. The Seventh Five-Year Plan (1985–1990) set a target for the first time, of distributing 160,000 ICS, to which end ICS with lower fuel consumption were made available at zero cost in districts facing fuel wood shortages. (Only 31 percent of the target was achieved.)Activities continued in the interim period (1990–1992). In the Eighth Five-Year Plan (1992–1997), the focus stayed on developing institutional arrangements for clean energy initiatives. AEPC was established in November 1996 under the then Ministry of Science and Technology with the objective of developing and promoting renewable/alternative energy technologies in Nepal. AEPC is now under the Ministry of Population and Environment. The Eighth Plan also focused on generating awareness of biomass energy technology and set a target of distributing 250,000 ICS in the Hill and Terai regions.
The Ninth Five-Year Plan (1997–2002) also had a target of 250,000 ICS, with a parallel focus on conducting ICS training and research. The same target was set under the Tenth Five-Year Plan (2002–2007), with the objective of expanding research, promotion, and capacity-building activities—85 percent of the target was attained. The Interim Plan (2007–2010) aimed to install 300,000 ICS and other bioenergy technologies. The same target was set in the next Interim Plan (2010–2013), which achieved 81 percent of target by the end of the plan’s first year.
3.2 Regulations for Industrial Promotion The government has passed investment-friendly laws and regulations for promoting industry. The 2011 Industrial Policy and the Foreign Investment and Technology Transfer Act 2049 (IBN 1992) outlines strategies for encouraging foreign direct investment and innovative product development, via customs relief to investors when they import raw materials or foreign-made goods. Some of the more important acts and regulations on investment are in table 4.
Table 4: Major acts and regulations on investment
Companies Act, 2006
The act regulates the legal limits for companies conducting business in Nepal. It consolidates the laws on companies in Nepal and aims to drive economic development by encouraging investment in trade, industry, and business through economic liberalization. The act makes it simpler and more transparent to incorporate, operate, and administer a company.
Banking and Financial Institution Act, 2006
The act introduces provisions on establishing, operating, managing, and regulating banks and financial institutions. It aims to develop public trust in the banking and financial system, and to boost and consolidate the economy through liberalizing the banking and financial sectors.
The act protects and promotes the rights and interests of depositors, and aims to ensure provision of high-quality and reliable banking and financial intermediary services to the public. It promotes healthy competition among banks and financial institutions, and minimizes risks relating to the sector.
Securities Act, 2006
The act covers securities legislation, amending and consolidating it to regulate and manage activities of the securities markets and persons. It regulates the issuance, purchase, sale, and exchange of securities, to protect the interests of private investors, through developing the capital market with the object of mobilizing capital for the country’s economic development.
Security Registration and Issues Regulations, 2008
In exercise of the power conferred by section 116 of the Securities Related Act, the Securities Board of Nepal has postulated certain rules and guidelines. The rules and guidelines were developed to regulate the registration, issuance, operation, and exit of securities in Nepali financial market.
23Investment prospectus for clean cooking solutions in Nepal
Tax Act
The Constitutive Assembly of Nepal passed this act. It prescribes guidelines on charges, taxes, duties, excises, and fees, continuing or altering existing ones. It also amends laws on revenue administration.
Foreign Technology and Technical Transfer Act, 1992
This act aims to expedite and promote foreign investment and technology transfer, given the economy’s limited capital, human, and natural resources.
Nepal had previously opened up a little to foreign investment through the Foreign Investment Technology Act, 1981, though actual investment from abroad only picked up after the Industrial Enterprise Act, 1992 (see next row).
Industrial Enterprise Act, 1992
This act aims to drive inclusive development and economic growth. It helps make the environment for industrial investment simpler and more encouraging.
Source: Nepal Law Commission 2016.
In addition, the Nepali and Indian governments signed a Bilateral Investment Promotion and Protection Agreement in October 2011 to create an enabling environment for encouraging private investors in one state to invest in the other.
3.3 Evolution of the Policy Environment Since 2006, the government has enacted policies to support the expansion of clean cooking solutions, including the Rural Energy Policy, 2006, with the aim of reducing dependency on traditional energy sources and providing clean and reliable energy in rural areas. In 2009, the government announced a Renewable (Rural) Energy Subsidy Arrangement for metallic ICS, including a direct subsidy of NPR 4,000 for three-pot-hole ICS and NPR 2,700 for two-pot-hole ICS. The policy also supported R&D, training, and capacity building. In 2010, the National Energy Strategy focused on reducing the share of traditional energy and on promoting technologies that improve ICS efficiencies. In 2015, the government drafted the 20 Years’ Renewable Energy Perspective Plan for developing renewable energy technologies. It defines a cumulative target of 1 million clean cookstoves by 2020, 1.5 million by 2025, and 2 million by 2030. The following year, it formulated the Renewable Energy Subsidy Policy, 2016 for achieving universal access to clean, reliable, and affordable renewable energy solutions by 2030. Three of these measures are now discussed in more detail.
3.3.1 Rural Energy Policy, 2006 The Rural Energy Policy was introduced in 2006 by the Ministry of Environment, which paved the way for setting up the Rural Energy Fund at the central level to mobilize financial resources that can be tapped by various sources and expanded to the local level according to need (Ministry of Environment 2006). It has the following working policies:
Increased public awareness on smokeless and fuel wood efficient ICS.
Emphasis on R&D and dissemination of household and institutional stoves appropriate to geographical and cultural needs.
Activities for technology transfer of ICS in rural areas.
Reduction in fuel wood consumption by developing technologies like ICS and gasifiers.
Emphasis on R&D and studies to increase efficiency, reduce costs of household biogas production technology, and promote it in the high Mountains.
Emphasis on R&D and dissemination of community and institutional biogas plants.
Establishment of biogas-related information center and exhibitions encouraged to help coordinate and support local institutions.
Use of animal dung as household fuel discouraged.
Charcoal supply system managed through scientific management of production, distribution, and use.
Development and dissemination of technology for production of briquettes, biofuel, biomass gasification, and so on, based on availability of fuel wood, paddy husks, sawdust, and other agricultural residues, via identifying suitable locations.
Emphasis on R&D activity to identify raw materials for production of briquettes and to reduce production costs.
24 A Roadmap to National Goal of Providing Clean Cooking Solutions for All
Activities on awareness creation in using briquettes, biofuel, biomass gasification, and so on conducted via use of local skills and resources.
Solar energy technologies fostered by integrating them with technologies for food drying and cooking, water purification, and lighting and communication systems.
Public awareness activities to increase use of solar cookers.
The policy also suggested how the subsidy rate and disbursement criteria (as per the existing renewable rural energy subsidies) may be revised on the basis of geographical conditions, population, and resources.
3.3.2 National Energy Strategy The National Energy Strategy was drafted in 2010 and coordinated by the Water and Energy Commission Secretariat, with the following key objectives:
Energy demand for cooking and heating met by traditional biomass such as fuel wood.
Decreased share of traditional energy mix in the country.
Technologies promoted that improve ICS efficiencies.
Biomass energy developed through decentralized implementation arrangements.
Alternative livelihood strategies formulated in response to the fuel wood trade.
3.3.3 Renewable Energy Subsidy Policy 2016 The Renewable Energy Subsidy Policy 2012 had brought down costs of renewable energy technologies, raising their quality and increasing beneficiaries’ trust in them. However, most poor rural dwellers stayed without access to clean energy owing to high upfront costs. And there was too little commercial investment—public and private—to meet the needs of the left-out rural population. To encourage poor households to use clean energy, the policy was revised to replace subsidies by credit over the long term.
The policy states, “Although subsidy amount differs according to technology and region, subsidy amount generally covers 40 percent of the total costs. Out of the remaining amount, around 30 percent from credit and around 30 percent from private sector investment or community or households in kind and/or cash can be mobilized.” Credit mobilization is ensured by institutional strengthening and working area expansion of CREF.
Subsidies for renewable energy technologies
For biogas, the policy lays out subsidies as follows:
Subsidy per household for each domestic biogas plant (table 5).
An additional 10 percent of the subsidy will be provided to “targeted beneficiary groups.”13
For biogas plants using household bio-degradable waste, a subsidy of up to 50 percent of the total cost, but not exceeding NPR 10,000, will be provided to specific designs of domestic biogas plants with a capacity of 4 cubic meters or less.
Table 5: Subsidy per household for each domestic biogas plant
Region Subsidy (NPR)
2 cubic meters 4 cubic meters 6 cubic meters and above
Mountain Districts 25,000 30,000 35,000
Hill Districts 20,000 25,000 30,000
Terai Districts 16,000 20,000 24,000
13 Targeted beneficiary groups are “women-led households with dependent children, earthquake victims from earthquake affected districts, endangered indigenous community, and Dalit identified by the [government of Nepal].” (Clarifications, Renewable Energy Subsidy Policy 2016).
25Investment prospectus for clean cooking solutions in Nepal
For biomass energy, the policy states:
There is no direct subsidy for mud ICS.
The maximum subsidy is 50 percent but not exceeding NPR 3,000 per stove per household for one- or two-pot-hole metallic ICS, and NPR 4,000 per stove per household for three-pot-hole metallic ICS in areas above 1,500 m. An additional subsidy of NPR 1,000 and NPR500 per stove per household will be provided for category “A” and “B” Village Development Committees (VDCs).14
The maximum subsidy is 50 percent of the stove cost but not exceeding NPR 20,000 per stove for metallic ICS in institutions.
The maximum subsidy is 50 percent of the stove cost but not exceeding NPR 3,000 for one- or two-pot-hole, with full or partial metal body, rocket cookstoves in rural and peri-urban areas.
The maximum subsidy is 50 percent of the stove cost but not exceeding NPR 4,000 for one- or two-pot-hole, with full or partial metal body gasifier system, household cookstoves in rural and peri-urban areas.
An additional subsidy of NPR 1,000 per stove per household will be provided for metallic ICS to targeted beneficiary groups.
Credit and other provisions
An institutional credit mechanism will be created to provide both a credit line and a credit guarantee scheme under CREF, which will disburse soft loans and subsidies.
For ICS, the unit cost price will be determined for suppliers every fiscal year depending on demand from districts and geographical regions. Consumers will receive the subsidy from a recognized company on the basis of the determined unit cost price. However, the subsidy will not exceed the amount mentioned above.
Institutional arrangements
AEPC will be responsible for providing technical assistance; evaluating subsidy application forms or documents of different renewable energy systems and projects; selecting companies for manufacturing, supply, and installation of renewable energy-related material and equipment; monitoring installed systems; and standardizing equipment and materials.
CREF is established for mobilizing subsidies, and will be managed by an “A class” commercial bank competitively selected by the government.
Local bodies will be responsible for promotion, demand collection, on-site monitoring, and disbursement of subsidies for clean cooking solutions.
14 Category "A", Category "B", and Category "C" regions refers to Very Remote, Remote, and Accessible areas (Clarifications, Renewable Energy Subsidy Policy 2016).

26 A Roadmap to National Goal of Providing Clean Cooking Solutions for All
27Investment prospectus for clean cooking solutions in Nepal
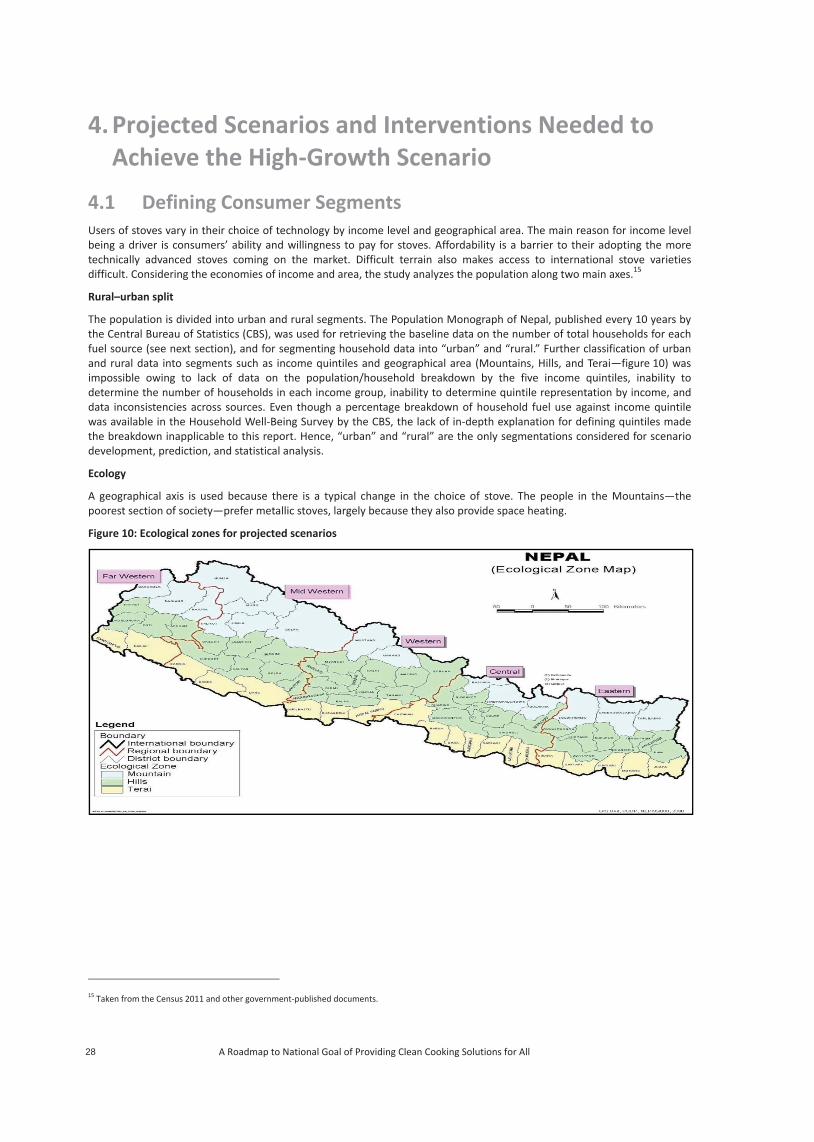
28 A Roadmap to National Goal of Providing Clean Cooking Solutions for All
4. Projected Scenarios and Interventions Needed to Achieve the High-Growth Scenario
4.1 Defining Consumer Segments Users of stoves vary in their choice of technology by income level and geographical area. The main reason for income level being a driver is consumers’ ability and willingness to pay for stoves. Affordability is a barrier to their adopting the more technically advanced stoves coming on the market. Difficult terrain also makes access to international stove varieties difficult. Considering the economies of income and area, the study analyzes the population along two main axes.15
Rural–urban split
The population is divided into urban and rural segments. The Population Monograph of Nepal, published every 10 years by the Central Bureau of Statistics (CBS), was used for retrieving the baseline data on the number of total households for each fuel source (see next section), and for segmenting household data into “urban” and “rural.” Further classification of urban and rural data into segments such as income quintiles and geographical area (Mountains, Hills, and Terai—figure 10) was impossible owing to lack of data on the population/household breakdown by the five income quintiles, inability to determine the number of households in each income group, inability to determine quintile representation by income, and data inconsistencies across sources. Even though a percentage breakdown of household fuel use against income quintile was available in the Household Well-Being Survey by the CBS, the lack of in-depth explanation for defining quintiles made the breakdown inapplicable to this report. Hence, “urban” and “rural” are the only segmentations considered for scenario development, prediction, and statistical analysis.
Ecology
A geographical axis is used because there is a typical change in the choice of stove. The people in the Mountains—the poorest section of society—prefer metallic stoves, largely because they also provide space heating.
Figure 10: Ecological zones for projected scenarios
15 Taken from the Census 2011 and other government-published documents.
29Investment prospectus for clean cooking solutions in Nepal
4.2 Factors that Influence Fuel Sources In any economy, to accomplish a social objective using a new technology, the following governing factors need to be assessed:
Consumer willingness to adopt to the proposed change.
Economic and social benefits to the consumer.
Economic progress of the country or state.
Financial health of the country or state.
The technology’s user friendliness to consumers.
Effective deployment and development of value and supply chains.
Ease of access to raw materials and accessories.
High consumer willingness to pay is the most important parameter for achieving the objective. Government and other development-partner support programs are directing clean cooking solutions in Nepal through subsidies and other financial incentives, expecting them to influence consumer behavior. A time-series analysis was used to set up the baseline of fuel use patterns for cooking, as described above. This was then projected forward based on Nepal’s energy picture, the use of cooking technologies, and observed cooking behavior across the three different classes of households in urban and rural settings. The transitioning of cooking solutions and technologies from a regulated top-down model to a market-driven approach will require careful evaluation of macro-economic factors.
The Nepal Living Standards Survey, conducted in 2010/11, highlighted socio-economic changes that could alter Nepal’s fuel source, cooking technology changes, food cooking behavior, cooking methodology, and nutrition landscape. Inferences from the business-as-usual case suggest that the following socio-economic factors have a strong impact on fuel consumption trends, poverty reduction, and improved food security:
Per capita income influences the change in economic status of households and the change in standard of living. It directly affects food consumption patterns, cooking behavior, and cooking technology.
The education index improved by 23 percent from 2005 to 2013 (largely attributed to gains in upper- and middle-income groups). It can directly affect fuel consumption and cooking technology patterns.
Per capita health costs can have a direct impact on cooking technology and fuel use trends, as more people become aware of the negative impacts of indoor air pollution.
Per capita gross domestic product (GDP) growth rate and urbanization indicate the economic status alleviation of the economy, affordability of and access to fuel sources, and job creation and thereby migration to urban areas. Nepal’s statistics show an increase in the rate of growth of the urban population. This can be attributed to two reasons: organic increase in the urban population and faster migration from rural to urban areas.
Socio-economic factors (SEF) can thus be defined as:
SEF = f (per capita income, education, per capita health cost, per capita GDP growth rate, climatic zone)
From the business-as-usual case analysis, correlations of these key macro-economic parameters of socio-economic factors were analyzed and correlation coefficients derived for various fuels (table 6).
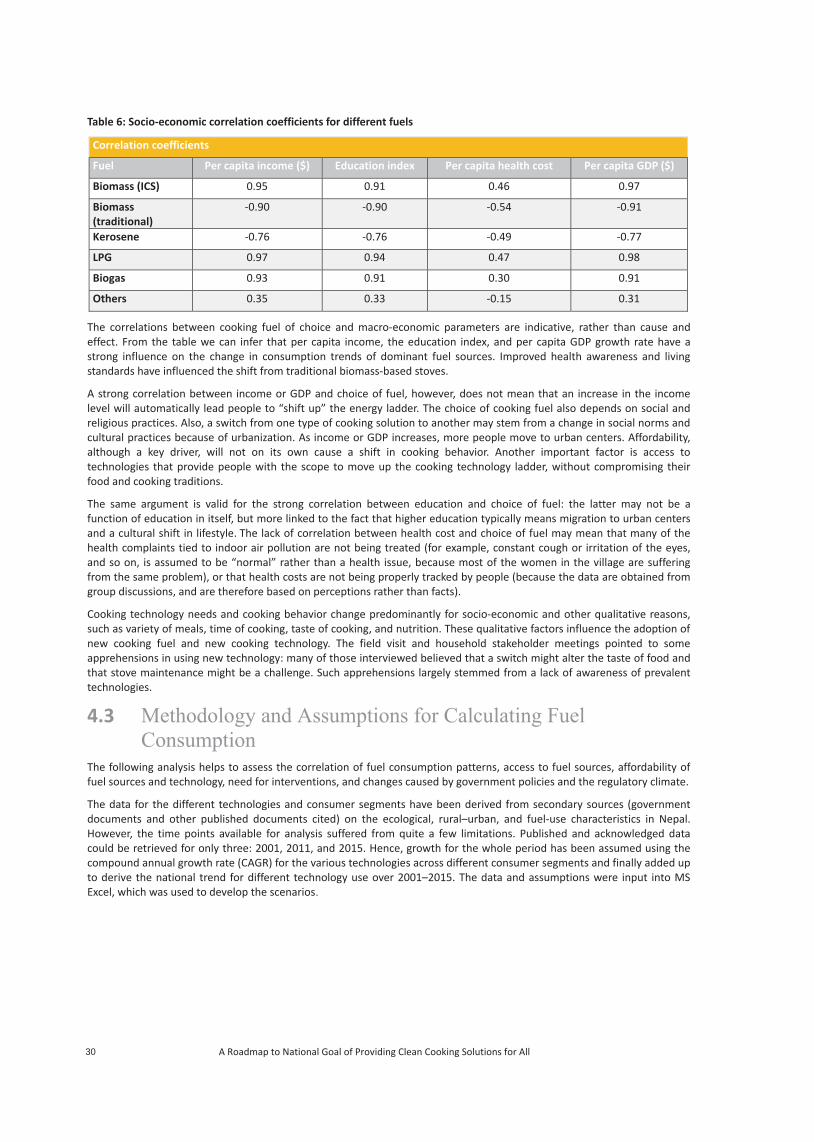
30 A Roadmap to National Goal of Providing Clean Cooking Solutions for All
Table 6: Socio-economic correlation coefficients for different fuels
Correlation coefficients
Fuel Per capita income ($) Education index Per capita health cost Per capita GDP ($)
Biomass (ICS) 0.95 0.91 0.46 0.97
Biomass (traditional)
-0.90 -0.90 -0.54 -0.91
Kerosene -0.76 -0.76 -0.49 -0.77
LPG 0.97 0.94 0.47 0.98
Biogas 0.93 0.91 0.30 0.91
Others 0.35 0.33 -0.15 0.31
The correlations between cooking fuel of choice and macro-economic parameters are indicative, rather than cause and effect. From the table we can infer that per capita income, the education index, and per capita GDP growth rate have a strong influence on the change in consumption trends of dominant fuel sources. Improved health awareness and living standards have influenced the shift from traditional biomass-based stoves.
A strong correlation between income or GDP and choice of fuel, however, does not mean that an increase in the income level will automatically lead people to “shift up” the energy ladder. The choice of cooking fuel also depends on social and religious practices. Also, a switch from one type of cooking solution to another may stem from a change in social norms and cultural practices because of urbanization. As income or GDP increases, more people move to urban centers. Affordability, although a key driver, will not on its own cause a shift in cooking behavior. Another important factor is access to technologies that provide people with the scope to move up the cooking technology ladder, without compromising their food and cooking traditions.
The same argument is valid for the strong correlation between education and choice of fuel: the latter may not be a function of education in itself, but more linked to the fact that higher education typically means migration to urban centers and a cultural shift in lifestyle. The lack of correlation between health cost and choice of fuel may mean that many of the health complaints tied to indoor air pollution are not being treated (for example, constant cough or irritation of the eyes, and so on, is assumed to be “normal” rather than a health issue, because most of the women in the village are suffering from the same problem), or that health costs are not being properly tracked by people (because the data are obtained from group discussions, and are therefore based on perceptions rather than facts).
Cooking technology needs and cooking behavior change predominantly for socio-economic and other qualitative reasons, such as variety of meals, time of cooking, taste of cooking, and nutrition. These qualitative factors influence the adoption of new cooking fuel and new cooking technology. The field visit and household stakeholder meetings pointed to some apprehensions in using new technology: many of those interviewed believed that a switch might alter the taste of food and that stove maintenance might be a challenge. Such apprehensions largely stemmed from a lack of awareness of prevalent technologies.
4.3
The following analysis helps to assess the correlation of fuel consumption patterns, access to fuel sources, affordability of fuel sources and technology, need for interventions, and changes caused by government policies and the regulatory climate.
The data for the different technologies and consumer segments have been derived from secondary sources (government documents and other published documents cited) on the ecological, rural–urban, and fuel-use characteristics in Nepal. However, the time points available for analysis suffered from quite a few limitations. Published and acknowledged data could be retrieved for only three: 2001, 2011, and 2015. Hence, growth for the whole period has been assumed using the compound annual growth rate (CAGR) for the various technologies across different consumer segments and finally added up to derive the national trend for different technology use over 2001–2015. The data and assumptions were input into MS Excel, which was used to develop the scenarios

31Investment prospectus for clean cooking solutions in Nepal
This section’s assessment of household fuel trends is based on the above statistical data, fuel sales patterns, and other demographic parameters:
Historical statistics of household fuel consumption trends.
Deployment statistics of ICS.
Use pattern of other improved fuel sources.
Population growth rate in 2014.
Number of households in 2011.
Average household size.
Rural and urban households in 2011 and 2001.
Unit rural and urban household size in 2011.
Rural, urban, and total population in 2011 and 2014.
Predominant fuel and cooking options among available options, like biomass-based cookstoves, biogas stoves, gasifiers, LPG, electric, and solar options were considered based on the assumptions in chapter 2.
AEPC provided data for the number of ICS (in situ models and factory-produced) and biogas plants deployed until 2015. Data for the aggregate number of households (in urban and rural areas) and their fuel use patterns were derived from the Population Monograph of Nepal, 2001 and 2011. Data for households using electricity were not explicitly available and hence for calculation purposes are assumed to be 100 for urban and rural households in 2001.
The serviceable lifetime and use pattern of an in situ ICS cookstove is assumed to be two years, for the convenience of the scenario modeling.
Stove stacking is inevitable, and the approach taken is moving the population above the energy ladder, given the total stove stack in the kitchen. Presumably this grade shift is into ICS (in situ or metallic) cookstoves. The Sustainable Development Goal 716 does not explicitly mention tier 4 (LPG, electric, and so on) cookstoves.
We do not foresee entry of any new fuel source or any other technology that is not indigenous to Nepal over the period to 2030. The current state of the cooking energy sector is not mature enough to make the shift, and the possibility of imports at present is severely limited by affordability and user-friendliness issues.
Nepal’s demography was studied in detail to understand the basic demand for stoves, beyond simply using total population figures. Estimates can be strengthened if urban and rural household numbers for all years can be derived. The basic demographic parameters (table 7) were reported by the CBS, but for certain years only. For example, average household size (rural and urban separately) were reported for 2011 only.
Table 7: Basic demographic parameters
16 “Ensure access to affordable, reliable, sustainable, and modern energy for all."
Parameter Figure Source
Population growth rate, 2014 (%) 1.21 United Nations Population Division(various years)
Number of households, 2011 5,423,297 Census 2011
Population, 2011 27,179,237 Census 2011
Average household size 5.01 Derived
Number of urban households, 2011
1,045,575 Census 2011
Number of rural households, 2011
4,377,722 Census 2011
Unit urban household size, 2011 4.46 Derived
Unit rural household size, 2011 5.14 Derived
Rural population as share of total, 2014
81.757 World Bank Staff estimates based on United Nations, World Urbanization Prospects.
32 A Roadmap to National Goal of Providing Clean Cooking Solutions for All
Note: The average household number for 2011 has been used to derive household populations for others years.
The focus is on growth rates thus derived, used for projections in urban and rural segments for different fuels. However, the objective is not to speculate on future household size; absolute numbers may well vary for some years.
The national figures were divided by the population number for each year to derive the proportional use of different fuels across the country for the different consumer segments. Although the CAGR may have led to erroneous predictions for some years, dividing the numbers with the same population across the technologies settles the aggregation proportionally across all fuels, rendering the trend the main focus rather than the numbers.
4.4 Projected Business-as-Usual Scenario The business-as-usual scenario is developed by projecting the baseline. It is also assumed that there will be no further economic interventions in the sector by the government and development partners beyond those in the clean cookstove sector. Figure 11 shows that under business as usual, even by 2030, basic clean cooking solutions will not be available to all households: a proportion will still rely on traditional cookstoves. To achieve CCS4ALL, integrated support is required from public and private enterprises.
Some other assumptions for projecting the scenarios and conducting statistical analysis until 2030 are in table 8.
Table 8: Assumptions made for projecting the scenarios and conducting statistical analysis until 2030
Technology Assumptions
Traditional cookstoves beyond 2011
The penetration of traditional cookstoves is dependent on household growth rates. However, the shift to cleaner cooking solutions has already begun, and it is assumed that in situ ICS penetration is replacing traditional cookstoves. The majority of the rural population and semi-poor find it is easier to switch to in situ ICS because of its low costs. There is limited availability and use of metallic ICS owing to the few private players producing them, and lack of market demand. Hence, growth in traditional cookstoves is a summation of both the components—household growth rates and replacements of in situ ICS.
Kerosene and electricity
Kerosene and electricity growth rates are assumed to keep growing at the CAGR seen over 2001–2011 and are projected to 2030.
LPG No interventions have been made to affect LPG growth, and hence projections are made in line with the following assumed ceilings. This was critical because LPG has had very high growth in urban areas, reaching 77 percent penetration by 2012. The key assumption is that the ceiling on LPG penetration is 77 percent of total urban household size. A similar logic follows for rural areas, where the penetration ceiling is kept at 23 percent from 2020 onwards, largely on distribution issues.
Biogas Biogas has an extremely steep increase from 2011 to 2015. However, this might not be the case in the business-as-usual scenario. We believe that the use of biogas stoves will only be predominant in rural areas because of the ease of access to biomass in the form of agricultural residues and cattle dung. After 2015, the use of biogas cookstoves becomes popular, mainly in rural areas. Hence, we capped dissemination at 0.58 million households by 2030.
ICS Factory-produced ICS are assumed to grow slowly, because of the limited number of private players stemming from low demand from the population for metallic stoves, demand for which is low because of high prices and inappropriateness for space heating. Demand from the market is unattractive for producers. In 2015, we assumed only five dominant producers of metallic stoves, producing 150 stoves a month. We assumed a gradual increase in the number of producers of 10 percent per year till 2030. With the current CCS4ALL program, the CAGR for in situ ICS is extremely high, and we have assumed that it grows at 15 percent till 2030—lower than the extremely high CAGR value seen in 2001–2015 because we assume, under the business-as-usual scenario, that there will be no further programs incentivizing ICS. However, improving general awareness of clean cooking solutions among the rural population ensures that ICS use grows steadily.
Based on the assumptions in table 8, the projected business-as-usual scenario is depicted in figure 11, with more information in table 9.
33Investment prospectus for clean cooking solutions in Nepal
Figure 11: Projected business-as-usual scenario
Table 9: Cooking solutions by fuel, projected business-as-usual scenario
Year Traditional cookstoves
In situ ICS Factory-
produced ICS Biogas stoves
Kerosene stoves
Electric stoves
LPG stoves
2015 3759938 (60.83)
434635 (7.03)
23060 (0.37)
349586 (5.66)
21137 (0.34)
15747 (0.25)
1577060 (25.51)
2023 2876912 (41.02)
1329558 (18.96)
101360 (1.45)
450289 (6.42)
3211 (0.05)
17854 (0.25)
2233806 (31.85)
2028 1711725 (22.76)
2674217 (35.56)
150860 (2.01)
527475 (7.01)
989 (0.01)
19388 (0.26)
2435415 (32.39)
2030 962795 (12.36)
3536652 (45.39)
170660 (2.19)
580000 (7.44)
617 (0.01)
20056 (0.26)
2520245 (32.35)
Note: Table shows numbers of households; figures in parentheses show the percentage of households in the total.
In the business-as-usual scenario, achieving CCS4ALL by 2030 is infeasible. In situ ICS will be the dominant cooking solution in households. Factory-produced ICS will witness slow growth because of high prices and lack of market incentives to attract manufacturers and retailers. Biogas will see a steadily increasing trajectory because of demand from that population with access to biomass, mainly rural. The LPG trajectory shows steady growth across households; because it is not an indigenous fuel source and because of challenges highlighted earlier, it will not be a primary fuel source, and thus there will be stove stacking. Owing to the LPG ceiling (see table 8), the share of LPG use by households will slowly decrease from 2023. (Our analysis indicates that the absolute number of households using LPG will continue to increase after 2023, but that will be slower than among other cooking solutions, and so the share will decrease.) Availability, affordability, and economic feasibility of this fuel source as primary fuel for low- and middle-income households is poor. Moreover, the country is keen on promoting indigenous fuel sources rather than imported fuel with associated price and supply uncertainties.
4.4.1 Urban Households Table 10 shows cooking solutions by fuel in urban households as a share of the total (rural and urban).
The urban segment stays dominated by LPG in this scenario with 17.20 percent of the total household fuel mix by 2030. This can be attributed to the high-income group, which has easy access and can afford the fuel. In other income groups, LPG would be used as a secondary or tertiary fuel source for cooking. Though a steep decreasing trajectory of traditional cookstoves is observed, there is still a remnant of households using traditional cookstoves of 0.94 percent in 2030, owing to a small proportion of the population in the urban low-income group that may not have willingness to pay, or lacks awareness. Although this share is tiny, it is surprising that current programs in this scenario do not remove it all together.
Most of the population moving out of traditional cookstoves are replacing them with in situ ICS, because of their low cost and ease of use. Factory-produced ICS and biogas stoves grow slowly, because market demand stays weak, and thus producers of factory-produced ICS remain few.
0%
10%
20%
30%
40%
50%
60%
70%
80%
90%
100%
LPG Stove
Electricity Cooking Heater
Kerosene Cooking Stove
Biogas
Metallic ICS
In-Situ ICS
Traditional Cookstoves (TCS)
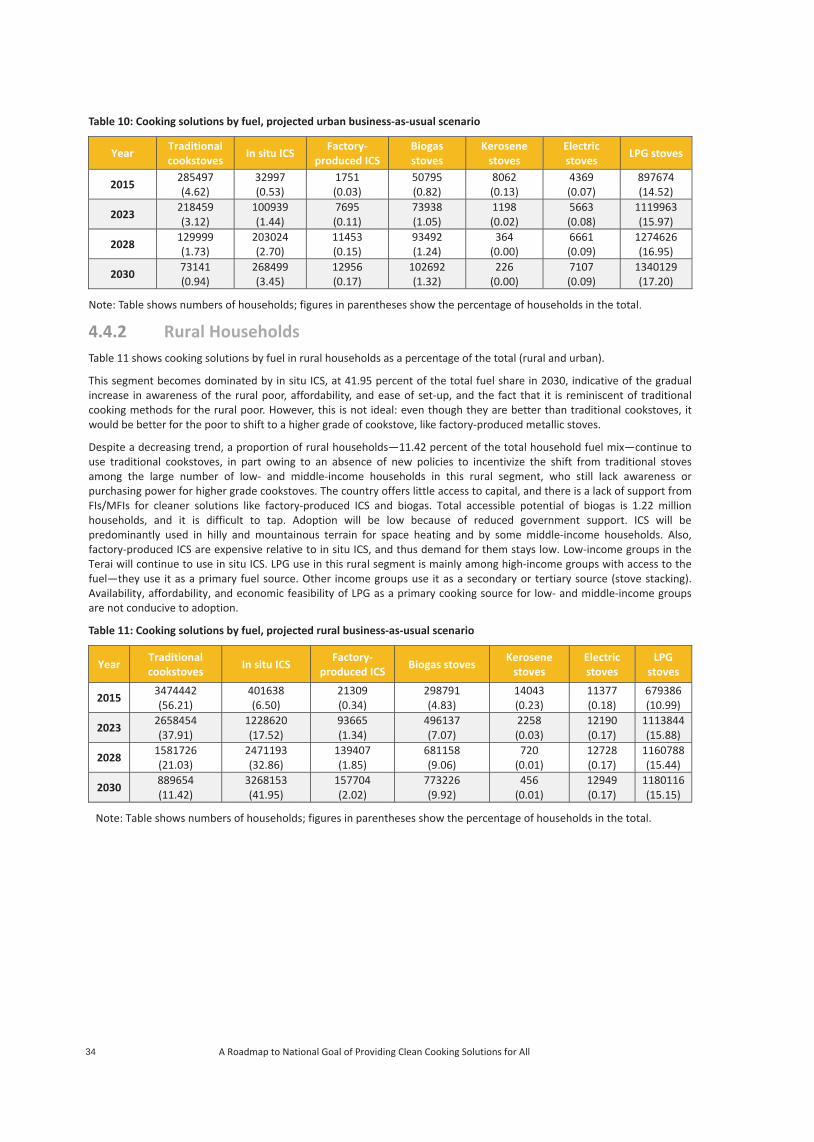
34 A Roadmap to National Goal of Providing Clean Cooking Solutions for All
Table 10: Cooking solutions by fuel, projected urban business-as-usual scenario
Year Traditional cookstoves
In situ ICS Factory-
produced ICS Biogas stoves
Kerosene stoves
Electric stoves
LPG stoves
2015 285497 (4.62)
32997 (0.53)
1751 (0.03)
50795 (0.82)
8062 (0.13)
4369 (0.07)
897674 (14.52)
2023 218459 (3.12)
100939 (1.44)
7695 (0.11)
73938 (1.05)
1198 (0.02)
5663 (0.08)
1119963 (15.97)
2028 129999 (1.73)
203024 (2.70)
11453 (0.15)
93492 (1.24)
364 (0.00)
6661 (0.09)
1274626 (16.95)
2030 73141 (0.94)
268499 (3.45)
12956 (0.17)
102692 (1.32)
226 (0.00)
7107 (0.09)
1340129 (17.20)
Note: Table shows numbers of households; figures in parentheses show the percentage of households in the total
4.4.2 Rural Households Table 11 shows cooking solutions by fuel in rural households as a percentage of the total (rural and urban).
This segment becomes dominated by in situ ICS, at 41.95 percent of the total fuel share in 2030, indicative of the gradual increase in awareness of the rural poor, affordability, and ease of set-up, and the fact that it is reminiscent of traditional cooking methods for the rural poor. However, this is not ideal: even though they are better than traditional cookstoves, it would be better for the poor to shift to a higher grade of cookstove, like factory-produced metallic stoves.
Despite a decreasing trend, a proportion of rural households—11.42 percent of the total household fuel mix—continue to use traditional cookstoves, in part owing to an absence of new policies to incentivize the shift from traditional stoves among the large number of low- and middle-income households in this rural segment, who still lack awareness or purchasing power for higher grade cookstoves. The country offers little access to capital, and there is a lack of support from FIs/MFIs for cleaner solutions like factory-produced ICS and biogas. Total accessible potential of biogas is 1.22 million households, and it is difficult to tap. Adoption will be low because of reduced government support. ICS will be predominantly used in hilly and mountainous terrain for space heating and by some middle-income households. Also, factory-produced ICS are expensive relative to in situ ICS, and thus demand for them stays low. Low-income groups in the Terai will continue to use in situ ICS. LPG use in this rural segment is mainly among high-income groups with access to the fuel—they use it as a primary fuel source. Other income groups use it as a secondary or tertiary source (stove stacking). Availability, affordability, and economic feasibility of LPG as a primary cooking source for low- and middle-income groups are not conducive to adoption.
Table 11: Cooking solutions by fuel, projected rural business-as-usual scenario
Year Traditional cookstoves
In situ ICS Factory-
produced ICS Biogas stoves
Kerosene stoves
Electric stoves
LPG stoves
2015 3474442 (56.21)
401638 (6.50)
21309 (0.34)
298791 (4.83)
14043 (0.23)
11377 (0.18)
679386 (10.99)
2023 2658454 (37.91)
1228620 (17.52)
93665 (1.34)
496137 (7.07)
2258 (0.03)
12190 (0.17)
1113844(15.88)
2028 1581726 (21.03)
2471193 (32.86)
139407 (1.85)
681158 (9.06)
720 (0.01)
12728 (0.17)
1160788(15.44)
2030 889654 (11.42)
3268153 (41.95)
157704 (2.02)
773226 (9.92)
456 (0.01)
12949 (0.17)
1180116(15.15)
Note: Table shows numbers of households; figures in parentheses show the percentage of households in the total.
35Investment prospectus for clean cooking solutions in Nepal
4.5 Projected High-Growth Scenario Unlike the business-as-usual projections, where the analysis is carried out by continuing with the baseline CAGRs into the future, the high-growth scenario sees CCS4ALL achieved by 2023. To develop this scenario, some assumptions have been made using the same baseline (2015) numbers derived earlier.
2023 target to eliminate traditional mud-based stoves: The high-growth scenario is developed with a strong vision of distributing clean cooking solutions by 2023. In other words, the focus of this best-case scenario is to see no traditional biomass cookstoves. The policies, strategies, and institutional framework (see earlier chapters) will help to dis-incentivize the use of traditional cookstoves and incentivize ICS users and manufacturers. Financial investments (see later chapters) are critical for achieving the high-growth scenario targets.
Substitution of traditional cookstoves: Most traditional stoves, the number of which is seen falling steeply over 2016–2023, are added to ICS, and some to biogas in segments that show off-take affinity. However, biogas has a maximum potential of 1.22 million household deployments, reflecting geographical and resource-availability issues. Biogas is projected to see steady growth among rural rich and middle-class income groups, while the proposed investment requirements will accelerate the off-take and penetration even into lower-income groups, owing to relatively easy access to capital.
No intervention in LPG: The government in this scenario focuses on limiting reliance on imported fuels, both from an energy-independence and balance-of-payment perspective, and thus supports development of indigenous fuel sources. No specific interventions are considered for promoting LPG. Still, LPG projections use the CAGR till 2015. The key assumption is that the ceiling on LPG penetration is kept at 77 percent of the total urban household market segment. The same logic follows for the rural segment, where the penetration ceiling is 23 percent from 2020 onwards.
Growth rates for ICS: To project the growth rates for ICS, the historical trend for the household growth rate was used. It is expected that the number of households using ICS after 2023 will grow at the household/population growth rate. It is also assumed that the ratio of in situ ICS to factory-produced ICS stays at 60:40 till 2023.
Growth rates for biomass and others: With the household growth rate, we determine total households using ICS every year (using the earlier methodology).The residual number of households for other fuels such as biogas and other users are distributed in proportion to the weighted proportions the fuels have for 2015. Kerosene consumption is assumed eliminated as a source of cooking fuel.
The scenario-specific interventions used in the calculations are in table 12.
Table 12: High-growth interventions
Target Intervention
Target 1 Completed replacement of traditional cookstoves by ICS in 2023
Target 2 60% in situ against 40% metallic by 2023
Target 3 Maximum biogas potential: 1,220,000 households by 2030
2015 total ICS number
Summation of in situ and metallic ICS in 2015
2023 total ICS number
Summation of ICS and traditional cookstoves - Intuition: Target of replacing traditional cookstoves by ICS by 2023. So, the total ICS number in 2023 is the ICS summation plus the added traditional cookstoves that have to be replaced by 2023.
60% in situ 2023 Derived from 2023 number
40% metallic 2023 Derived from 2023 number
In this scenario, the share of traditional cookstoves users is expected to decline from 60.83 percent to 0 percent by 2023 (figure 12 and table 13), substituted predominantly by ICS.

36 A Roadmap to National Goal of Providing Clean Cooking Solutions for All
Figure 12: Projected high-growth scenario
Table 13: Cooking solutions by fuel, projected high-growth scenario
Year Traditional cookstoves
In situ ICS Factory-
produced ICS
Biogas stoves
Kerosene stoves
Electric stoves
LPG stoves
2015 3759938 (60.83)
434635 (7.03)
23060 (0.37)
349586 (5.66)
21137 (0.34)
15747 (0.25)
1577060 (25.51)
2023 0
(0.00) 2530580 (35.38)
1687053 (23.58)
680848 (9.52)
3211 (0.04)
17854 (0.25)
2233806 (31.23)
2028 0
(0.00) 2687430 (33.73)
1791620 (22.49)
1032727 (12.96)
989 (0.01)
19388 (0.24)
2435415 (30.57)
2030 0
(0.00) 2752860 (32.97)
1835240 (21.98)
1220000 (14.61)
617 (0.01)
20056 (0.24)
2520245 (30.19)
Note: Table shows numbers of households; figures in parentheses show the percentage of households in the total.
Thereafter, high-performance ICS technology will largely replace existing ICS technology. As there are close to an estimated 3.28 million households using traditional cookstoves, to achieve complete removal of traditional stoves by 2023, 0.47 million stoves need to be distributed every year, for an annual reduction of some 14 percent of traditional cookstoves. It is expected that in situ models will dominate the segment, though it can be ensured that consumers replacing their traditional cookstoves shift to at least to one level higher grade of clean cooking technology. After 2023, market forces will have greater impact, and a continued decrease in the number of biomass ICS (preferably among lower tiers) can be carried out to promote movement toward cleaner technologies such as briquettes and pellets. Changes are expected in four phases (figure 13).
0%
10%
20%
30%
40%
50%
60%
70%
80%
90%
100%
LPG Stove
Electricity Cooking HeaterKerosene Cooking StoveBiogas
Metallic ICS
In-Situ ICS
Traditional Cookstoves (TCS)
37Investment prospectus for clean cooking solutions in Nepal
Figure 13: The four phases of the projected high-growth scenario
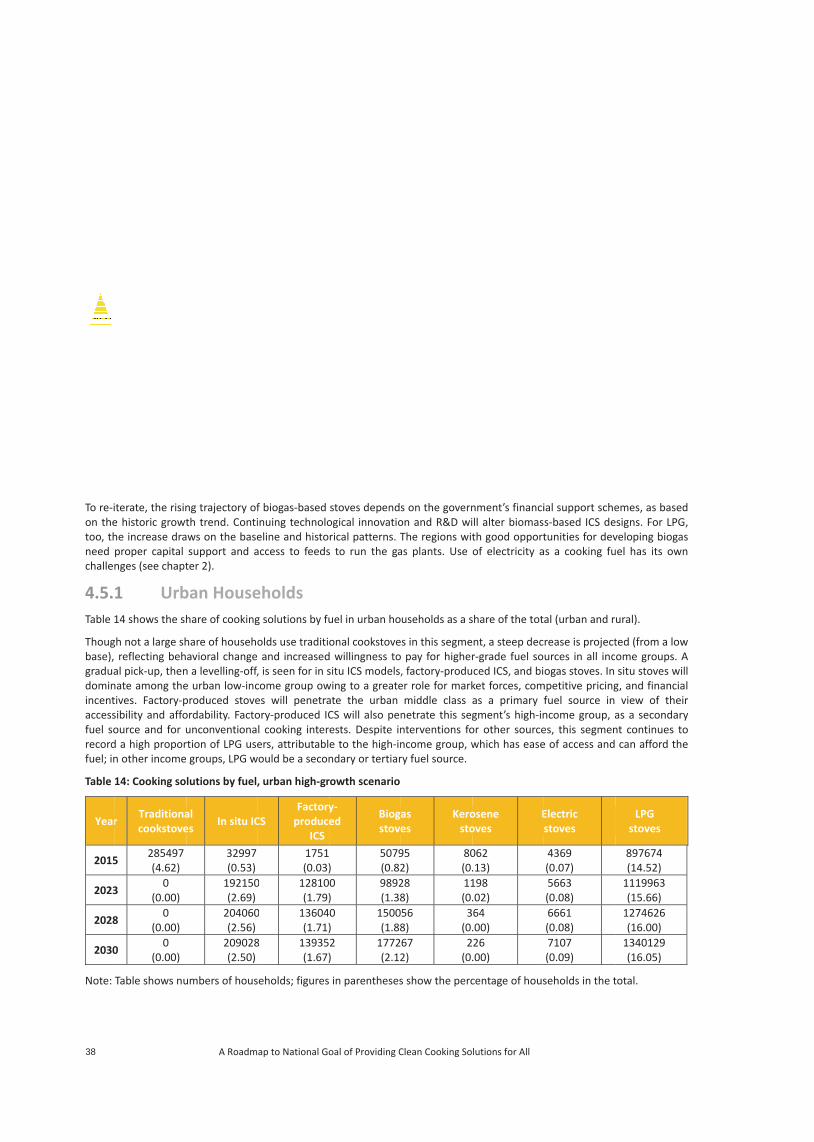
38 A Roadmap to National Goal of Providing Clean Cooking Solutions for All
To re-ion thetoo, thneed challen
4.5.Table 1
Thougbase), graduadominincentaccessfuel sorecordfuel; in
Table
Year
2015
2023
2028
2030
Note:
terate, the risine historic growthe increase draproper capital nges (see chapt
1 Urb14 shows the sh
gh not a large shreflecting beh
al pick-up, thennate among thetives. Factory-psibility and affoource and for ud a high proporn other income
14: Cooking so
r Traditionacookstove
5 285497 (4.62)
3 0
(0.00)
8 0
(0.00)
0 0
(0.00)
Table shows nu
ng trajectory ofth trend. Conti
aws on the basesupport and a
ter 2).
ban Househare of cooking
hare of househoavioral change
n a levelling-off,e urban low-incproduced stoveordability. Factounconventionartion of LPG use groups, LPG w
lutions by fuel,
al es
In situ IC
32997 (0.53)
192150(2.69)
204060(2.56)
209028(2.50)
umbers of hous
f biogas-based inuing technoloeline and histoaccess to feeds
eholds g solutions by fu
olds use traditioand increased
, is seen for in scome group owes will penetraory-produced ICl cooking interers, attributabl
would be a secon
, urban high-gr
CS Factory
produceICS
1751(0.03)
0 12810(1.79)
0 13604(1.71)
8 13935(1.67)
eholds; figures
stoves dependsogical innovatiorical patterns. T
s to run the ga
uel in urban ho
onal cookstoved willingness tositu ICS models,
wing to a greateate the urban CS will also penests. Despite ine to the high-inndary or tertiar
rowth scenario
y-ed
Biogstove
)
5079(0.82
0 )
9892(1.38
0 )
1500(1.88
2 )
1772(2.12
in parentheses
s on the governon and R&D wiThe regions witas plants. Use
useholds as a s
s in this segme pay for higher, factory-produ
er role for markmiddle class
netrate this segnterventions foncome group, wry fuel source.
as es
Kerosto
95 2)
80(0.
28 8)
11(0.
56 8)
3(0.
67 2)
2(0.
s show the perc
nment’s financill alter biomasth good opportof electricity a
share of the tot
nt, a steep decr-grade fuel soced ICS, and biket forces, comas a primary fgment’s high-in
or other sourcewhich has ease
osene oves
E
062 .13) 198 .02) 64 .00) 26 .00)
centage of hous
ial support sches-based ICS detunities for dev
as a cooking fu
al (urban and r
rease is projecturces in all incogas stoves. In
mpetitive pricingfuel source in ncome group, aes, this segmene of access and
Electric stoves
4369 (0.07) 5663 (0.08) 6661 (0.08) 7107 (0.09)
seholds in the t
emes, as basedesigns. For LPG,veloping biogasuel has its own
ural).
ted (from a lowome groups. Asitu stoves will
g, and financialview of their
as a secondarynt continues to can afford the
LPG stoves
897674 (14.52)
1119963 (15.66)
1274626 (16.00)
1340129 (16.05)
total.
d , s n
w A l l r y o e
39Investment prospectus for clean cooking solutions in Nepal
4.5.2 Rural Households Table 15 shows the share of cooking solutions by fuel in rural households as a share of the total (urban and rural).
The impact of the key interventions (see next section) is most felt in this segment; one dominated by traditional cookstoves that will see a collapse in use by 2023, from 56.21 percent to 0 percent. This fall stems from interventions that enable the large proportion of the low- and middle-income groups to shift at least one grade higher in cooking source. Capacity building, promotional activities, and pilot projects will enable many in the low-income group to use in situ ICS as their primary cooking solution, given affordability and ease of maintenance. Greater capital access alongside support from FIs/MFIs is expected to boost off-take of factory-produced ICS and biogas stoves. Besides space-heating benefits, factory-produced ICS will see higher off-take owing to financial schemes such as equated monthly installments (EMIs), and lower costs stemming from greater private sector involvement. The increase in penetration for biogas comes from government support programs, subsidies, and low-interest/low-upfront schemes from the formal financial sector and from private investors offering attractive pricing. LPG use in this segment is mainly among the high-income group with access, which uses it as a primary fuel source, and among other income groups that use it as a secondary or tertiary fuel source. LPG’s poor availability, affordability, and economic feasibility do not promote its use as a primary fuel source for low- and middle-income rural groups.
Table 15: Cooking solutions by fuel, projected rural high-growth scenario
Year Traditional cookstoves
In situ ICS Factory-
produced ICS
Biogas stovesKerosene
stoves Electric stoves
LPG stoves
2015 3474442 (56.21)
401638 (6.50)
21309 (0.34)
298791 (4.83)
14043 (0.23)
11377 (0.18)
679386 (10.99)
2023 0
(0.00) 2338430 (32.69)
1558953 (21.79)
581921 (8.13)
2258 (0.03)
12190 (0.17)
1113844 (15.57)
2028 0
(0.00) 2483370 (31.17)
1655580 (20.78)
882671 (11.08)
720 (0.01)
12728 (0.16)
1160788 (14.57)
2030 0
(0.00) 2543831 (30.47)
1695888 (20.31)
1042733 (12.49)
456 (0.01)
12949 (0.16)
1180116 (14.13)
Note: Table shows numbers of households; figures in parentheses show the percentage of households in the total.
4.6 Proposed Critical Interventions to Achieve the High-Growth Scenario
Of the four phases of the projected high-growth scenario (see figure 13), the most crucial phase is the market growth phase (2017–2023). To allow market forces to work more efficiently, a multi-stakeholder investment model is needed, involving the government and development partners; FIs/MFIs; the private sector; and consumers. The next two sections review economic interventions and then policy and institutional-strengthening measures. Chapter 6 goes into greater detail on some of these elements, and looks at the investment required from each of the stakeholder groups.
4.6.1 Economic Interventions Government and development partners
As seen in earlier chapters, many households believe that it is much easier to build and use traditional mud-based biomass stoves because they need hardly any investment and access to fuel is not a major concern, and only a very few appreciate the health risks of prolonged use, and the environmental impacts. And so most households resist paying for cleaner technologies. For these reasons, it is vital to develop measures and channel investments to dis-incentivize the use of traditional technologies and nudge consumers to switch to cleaner technologies.
To achieve the high-growth scenario, heavy investment is needed over 2017–2023. Several strategies and programs will be designed and executed. As most investment will not secure financial returns—but enable economic and social benefits for the local population—the support of international development partners is required. Investment can be categorized into two: technical assistance and subsidies.
Funding for technical assistance should be channeled into the following key activities (the approximate cost distribution is in table 22):
40 A Roadmap to National Goal of Providing Clean Cooking Solutions for All
Extensive capacity-building programs are needed in parallel to the multimedia campaign, and these are expected to absorb the largest share of technical assistance funding. A training-of-trainers program for field-level marketing and awareness building is proposed at least twice a year for each district. Training programs for human resources, facilitating local operation and maintenance networks, will generate jobs. Training courses for manufacturers, supplier, and retailers, focusing on new technologies and highlighting opportunities for investment, are highly recommended. Above all, innovative programs to all potential consumers to enhance their knowledge of clean cooking solutions, new technologies on the market, how they are used, and their benefits, will be crucial for changing cooking behavior.
A national multimedia campaign, through innovative marketing, will reinforce the disadvantages of traditional cookstoves and communicate new incentives on ICS. The government needs to analyze campaign benefits every quarter, such as number of people who have shifted to clean technologies, and to closely monitor disbursement of funds. It should then publicly announce the benefits at least once a year to keep key actors—development partners, manufacturers, retailers, and so on—and beneficiaries well informed.
Central Financial Assistance is required for risk guarantees on financial products to consumers with no access to credit or collateral.
M&E mechanisms need to be set up (see chapter 3). New state nodal agencies (see next section) will be responsible for M&E. Investments should be channeled into establishing M&E facilities, mainly in state nodal agencies (see below). Technology-based M&E or smart M&E, through third-party monitoring using resources from R&D institutes (or academic institutions) need to evaluated and set up.
Support is required for R&D and for setting up test centers for monitoring performance standards, and for programs for revising test protocols and standards.
Demonstration pilot projects, such as try-before-you-buy, allow households via a cluster- or VDC-based approach to try clean technologies. They are critical to raise awareness of clean cooking solutions and remove misapprehensions. Pilots on technology-based M&E to assess and improve operational modalities are also recommended, and their potential for scale-up evaluated.
The government should continue with the Renewable Energy Subsidy Policy 2016 (see section 3.3.3).More specifically, subsidies (including smart subsidies or RBF) are needed for income groups in urban and rural areas that cannot afford cleaner cooking solutions. An alternative would be the Green Card Program (box 9).
Box 9: The Green Card Program—An alternative approach
An innovative investment proposition—the Green Card Program—should be considered. This program aims to encourage manufacturers and retailers to expand and distribute only AEPC approved and labelled products.
Under this program, when adopting an ICS, the consumer becomes eligible for a Green Card preloaded with a subsidy, provided she (or he) signs an undertaking with the District Development Committee specifying the date of deployment, the unique reference number, and other details. The stove has a monitoring device. The card can be recharged based on use. The preloaded amount will vary for different types of ICS. For instance, under the present system, a metallic ICS costing NPR 4,500 is eligible for a subsidy of NPR 2,000. With the Green Card, NPR 2,000 can be preloaded or recharged. The preloaded amount can be redeemed against the upfront cost (previously borne by the consumer). The remaining amount will be paid by the consumer.
Through such technologies, households will be strongly dis-incentivized to use traditional cookstoves. Greater product demand and value for money through robust monitoring mechanisms with minimal leakage, and higher private-company participation are some key benefits of the Green Card Program.
To promote the Green Card, a few households could be selected through a lottery. They would become eligible for a free stove, a Green Card, and a monitoring device. Seeing the benefits, other households are likely to want to join the program, which will help offer incentives to communities and mitigate willingness-to-pay issues.
The estimated investment required for all the above programs and subsidies over 2017–2023 is detailed in chapter 6.
Financial institutions and micro-financial institutions
Inbound and active participation of FIs/MFIs will be critical for developing the clean cooking sector. FIs/MFIs can contribute in three main ways.
First, the Renewable Energy Subsidy Policy 2016 proposes financing schemes for factory-produced ICS. Central Financial Assistance will help FIs/MFIs mitigate risk and enable them to develop innovative financing, such as EMIs, to all levels of consumers, including low-income groups. The EMIs can be designed for 12–18 months, which should boost consumer demand.
41Investment prospectus for clean cooking solutions in Nepal
Second, FIs/MFIs should offer consumers with biogas plants low-interest financing—and probably need support from development partners or international financial institutions (IFIs) for viability gap funding—and procedures for accessing capital from FIs/MFIs should be simplified. Viability gap funding is a grant to support projects or programs that are economically justified but fall short on financial viability, usually because of long gestation periods and the inability to raise user charges to commercial levels.
Third, FIs/MFIs should support small-and medium-sized enterprises (SMEs) in clean cooking solutions in manufacturing, distribution, marketing, and retailing. Small manufacturers of ICS and cleaner fuel technologies, such as briquettes and pellets, should be supported with loan guarantees and higher working capital. Formal financial institutions have lending policies and protocols to determine their creditworthiness, but newly setup and small entrepreneurs cannot access sizeable loans from banks without collateral because they have no credit record. They either need to pledge equivalent collateral or seek a loan repayment guarantee from larger creditworthy business entities, which is often tricky. But stakeholder consultations suggested that the working capital or guaranteed overdraft is only up to 60 percent of the pledged collateral. Central Financial Assistance should be used in guaranteeing such risks.
Private sector
Private sector investment and participation are imperative for developing the clean cooking sector and transforming the market. One measure of success here will be a shift of leadership from the government and development partners to the private sector. Some measures to encourage engagement by manufacturers and other private players include:
Timely payment guarantees of the product sold without the hassles of accessing subsidies. This will enable manufacturers to build manufacturing capacity, increase production, and build retailer networks for selling ICS.
Ease of access to capital for growth.
If feasible, some tax benefits against the volume of ICS distributed by the manufacturer.
With the right enabling environment, the private sector should lead the transformation, supporting investments in their areas of strength by:
Assuring supplies, through manufacturing or importing.
Ensuring quality of supplies.
Developing logistical and supply chain networks.
Building service support: after sales, repair, maintenance, and customer service.
Marketing products and raising awareness.
Options of new business models or operating models such as the aggregator model, which would be appropriate for private participation, will be discussed in detail in the proposed “Business Model Development” report, which is the next phase of this assignment. Figure 14 synthesizes the roles of the various stakeholders, including public–private partnerships (discussed just below).
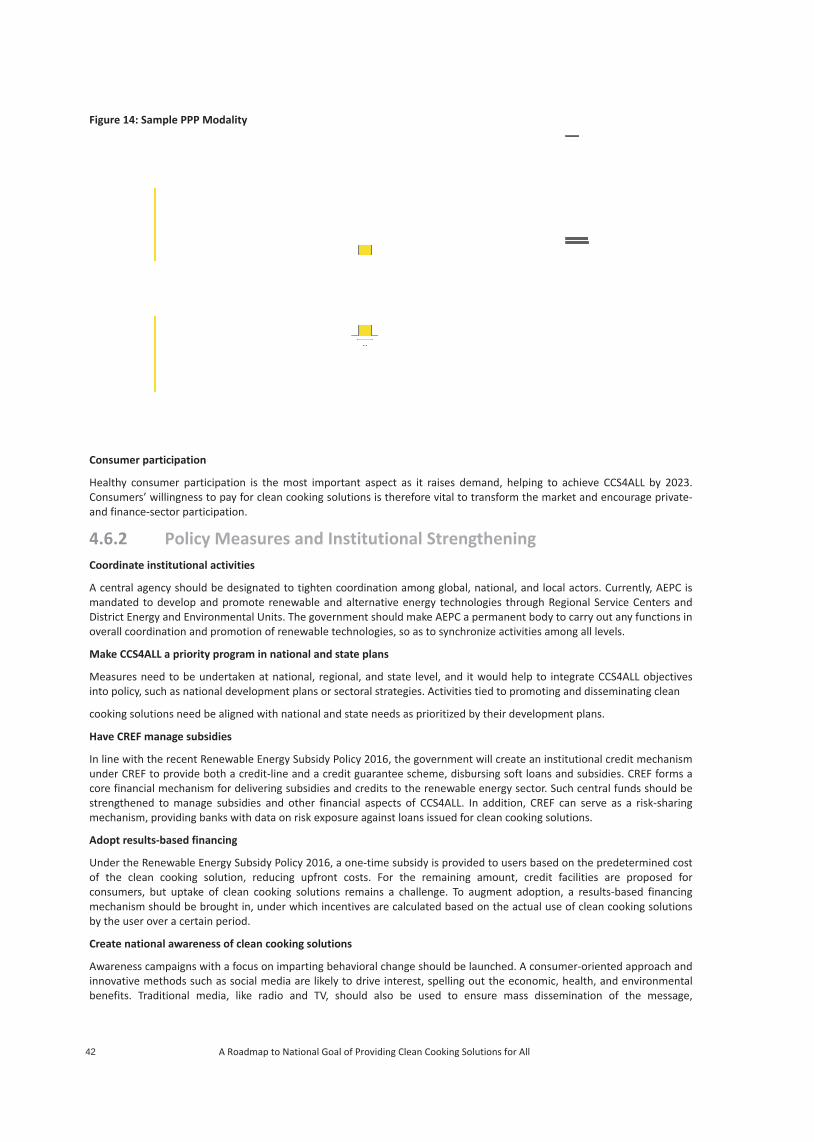
42 A Roadmap to National Goal of Providing Clean Cooking Solutions for All
Figure
Consu
HealthConsuand fin
4.6.2Coord
A centmandaDistricoveral
Make
Measuinto po
cookin
Have C
In lineunder core fistrengmecha
Adopt
Underof theconsummechaby the
Create
Awareinnovabenefi
e 14: Sample PP
mer participat
hy consumer pmers’ willingnenance-sector pa
2 Poliinate institutio
tral agency shoated to develoct Energy and Enl coordination a
CCS4ALL a prio
ures need to beolicy, such as na
ng solutions nee
CREF manage s
with the recenCREF to provid
inancial mechagthened to mananism, providin
t results-based
r the Renewablee clean cookinmers, but uptaanism should be user over a ce
e national awar
eness campaignative methods sits. Traditional
PP Modality
ion
articipation is ess to pay for carticipation.
icy Measuonal activities
ould be designap and promotenvironmental Uand promotion
ority program in
e undertaken aational develop
ed be aligned w
subsidies
nt Renewable Ede both a credinism for delivenage subsidies g banks with da
financing
e Energy Subsidng solution, reake of clean coe brought in, urtain period.
reness of clean
ns with a focus osuch as social m
media, like r
the most impolean cooking so
ures and I
ated to tighten e renewable anUnits. The gover of renewable t
n national and
at national, regpment plans or
with national an
nergy Subsidy it-line and a creering subsidies
and other finaata on risk expo
dy Policy 2016, ducing upfron
ooking solutionunder which inc
cooking soluti
on imparting bemedia are likelyradio and TV,
ortant aspect aolutions is ther
nstitution
coordination and alternative ernment should technologies, so
state plans
gional, and statsectoral strateg
nd state needs a
Policy 2016, thedit guarantee and credits to tancial aspects osure against lo
a one-time subt costs. For th
ns remains a chcentives are cal
ions
ehavioral changy to drive intershould also b
as it raises demefore vital to tr
nal Streng
among global, nenergy technolmake AEPC a po as to synchro
e level, and it gies. Activities t
as prioritized by
e government wscheme, disbuthe renewable of CCS4ALL. In
oans issued for
bsidy is providehe remaining hallenge. To auculated based
ge should be larest, spelling ou
be used to en
mand, helping transform the m
thening
national, and loogies through
permanent bodynize activities a
would help to tied to promoti
y their develop
will create an inrsing soft loansenergy sector.
n addition, CREclean cooking s
ed to users baseamount, credi
ugment adoption the actual u
unched. A consut the economsure mass dis
to achieve CCSmarket and enco
ocal actors. CurRegional Servicy to carry out a
among all levels
integrate CCS4ng and dissemi
ment plans.
nstitutional cres and subsidiesSuch central fu
EF can serve assolutions.
ed on the predt facilities areon, a results-b
use of clean coo
sumer-orientedic, health, and semination of
S4ALL by 2023.ourage private-
rrently, AEPC isce Centers and
any functions ins.
4ALL objectivesinating clean
edit mechanisms. CREF forms aunds should bes a risk-sharing
etermined coste proposed forbased financingoking solutions
d approach andenvironmentalthe message,
. -
s d n
s
m a e g
t r g s
d l ,
43Investment prospectus for clean cooking solutions in Nepal
encouraging communities to give up their traditional cookstoves. Ways to integrate teaching on cookstoves into school curricula need to be explored. School teachers could be trained to include the benefits into lessons and school materials.
Build capacity and develop skills
Capacity should be built among consumers, District Development Agencies, Village Development Agencies, and FIs. Skills for constructing mud-based ICS may be useful for consumers. FIs/MFIs could be trained in innovative financing facilities. The agencies at district and village level should be trained in how to conduct M&E for capturing the real-time use of newly installed clean cooking solutions. Gender-specific targets should be set to ensure that certain numbers of female and male entrepreneurs are trained as master trainers to reflect the needs of women and men in their products, business models, and livelihood opportunities. The training might be focused on entrepreneurial skill sets, including marketing, business management, credit/loan management, business planning, and engagement with the private sector. A focus should remain on demonstration/pilot-based training, including try-before-you-buy schemes to reduce consumer-perceived risk. The results of the pilot set-up can then be disseminated through in-person communication networks.
Strengthen ICS supply chains
Non-cooking product distribution networks, such as those for seeds and fertilizers that have potential to accommodate ICS and target the right consumer segments, should be identified for disseminating clean cooking solutions.
Scale up testing and R&D facilities
Regional testing and knowledge centers for cookstoves need to be strengthened in order to evaluate stoves against international guidelines or standards set through International Organization for Standardization processes for emissions and fuel efficiency, to improve labelling of cookstoves and fuels, and to strengthen consumer education. Incentives should be provided to stove manufacturers and marketers to educate consumers on the benefits of such labelling.
Encourage public–private partnerships
The government has developed a market for renewable energy technology areas, though mobilization of commercial investment has been inadequate. Impediments include policy barriers for private investors and service providers to access subsidies, keeping out management skills and technology dissemination that private companies can bring. Both public and private investments will be required to meet the needs of remaining rural groups without access to clean cooking solutions (Renewable Energy Subsidy Policy 2016). Subsidies should be provided for renewable energy systems or projects, managed by communities or the private sector. No tax would be levied on such subsidies.
Create state nodal agencies
At state level, nodal agencies should be created to promote clean cooking solutions—this can be part of the overall renewable energy agenda—and to carry out the programs, in coordination with the central agency (such as AEPC). The state nodal agencies should be made responsible for M&E under the National Planning Commission’s current M&E framework. A mechanism for sharing best experiences at state level could be developed. Smart and low-cost monitoring mechanisms should be established to monitor real-time use of clean cooking solutions, which would include affordable sensors combined with information technology for collection and transmission of data on cookstove use and indoor air pollution. Sensor-based monitoring devices have been used in a research study by the Massachusetts Institute of Technology, and adopted in northern India.
4.7 Projected Moderate-Growth Scenario The high-growth scenario is certainly achievable. However, if some of its key measures are not implemented on time, perhaps stemming from financial shortfalls, a moderate-growth scenario is more likely to result. Three main areas are seen to be vulnerable:
Capacity to implement only a few policy measures, due to:
Implementation challenges in engaging all proposed critical stakeholders, including FIs/MFIs and banks.
Inability to bring on board top-quality trainers for outreach and skills development programs.
Obstacles in program design, communication infrastructure, and a strong message reaching all actors and consumers.
Timeline challenges in:
Aligning national and state plans.
Implementing the effective regulatory bodies.
Developing state nodal agencies.
Accessing financial support from CREF.
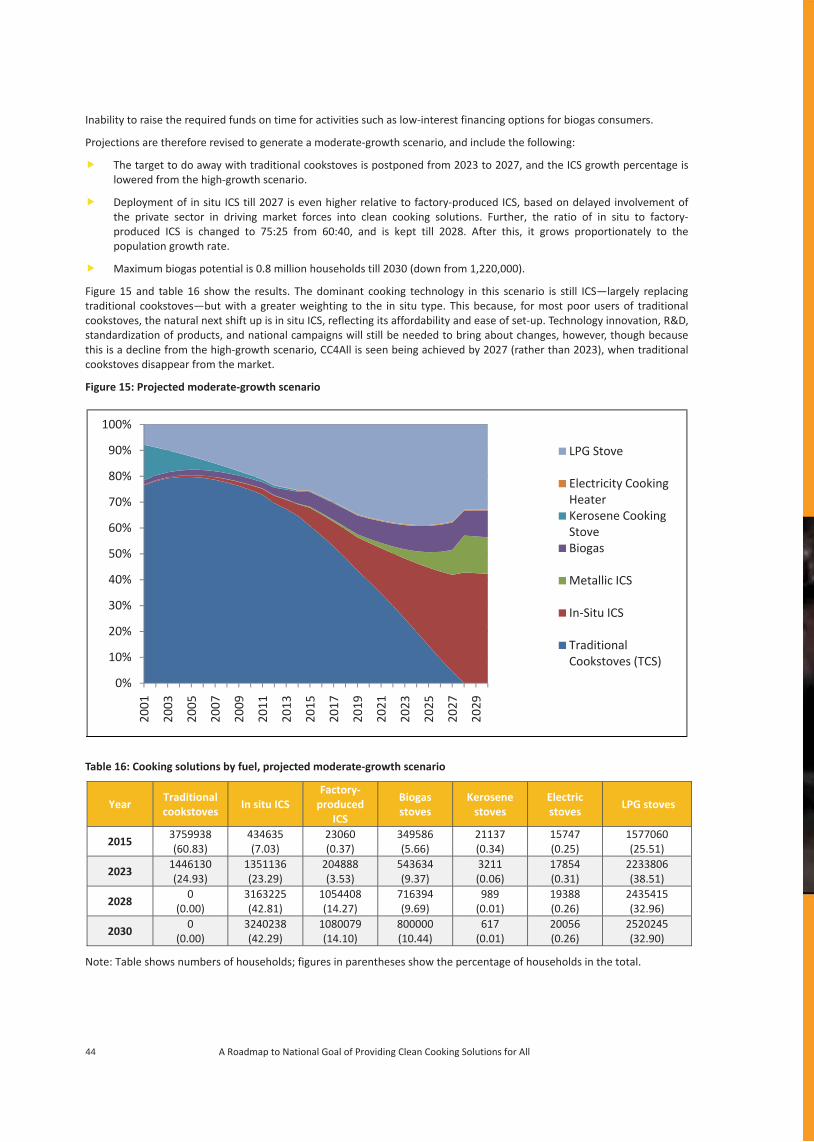
44 A Roadmap to National Goal of Providing Clean Cooking Solutions for All
Inability to raise the required funds on time for activities such as low-interest financing options for biogas consumers.
Projections are therefore revised to generate a moderate-growth scenario, and include the following:
The target to do away with traditional cookstoves is postponed from 2023 to 2027, and the ICS growth percentage is lowered from the high-growth scenario.
Deployment of in situ ICS till 2027 is even higher relative to factory-produced ICS, based on delayed involvement of the private sector in driving market forces into clean cooking solutions. Further, the ratio of in situ to factory-produced ICS is changed to 75:25 from 60:40, and is kept till 2028. After this, it grows proportionately to the population growth rate.
Maximum biogas potential is 0.8 million households till 2030 (down from 1,220,000).
Figure 15 and table 16 show the results. The dominant cooking technology in this scenario is still ICS—largely replacing traditional cookstoves—but with a greater weighting to the in situ type. This because, for most poor users of traditional cookstoves, the natural next shift up is in situ ICS, reflecting its affordability and ease of set-up. Technology innovation, R&D, standardization of products, and national campaigns will still be needed to bring about changes, however, though because this is a decline from the high-growth scenario, CC4All is seen being achieved by 2027 (rather than 2023), when traditional cookstoves disappear from the market.
Figure 15: Projected moderate-growth scenario
Table 16: Cooking solutions by fuel, projected moderate-growth scenario
Year Traditional cookstoves
In situ ICS Factory-
produced ICS
Biogas stoves
Kerosene stoves
Electric stoves
LPG stoves
2015 3759938 (60.83)
434635 (7.03)
23060 (0.37)
349586 (5.66)
21137 (0.34)
15747 (0.25)
1577060 (25.51)
2023 1446130 (24.93)
1351136 (23.29)
204888 (3.53)
543634 (9.37)
3211 (0.06)
17854 (0.31)
2233806 (38.51)
2028 0
(0.00) 3163225 (42.81)
1054408 (14.27)
716394 (9.69)
989 (0.01)
19388 (0.26)
2435415 (32.96)
2030 0
(0.00) 3240238 (42.29)
1080079 (14.10)
800000 (10.44)
617 (0.01)
20056 (0.26)
2520245 (32.90)
Note: Table shows numbers of households; figures in parentheses show the percentage of households in the total.
0%
10%
20%
30%
40%
50%
60%
70%
80%
90%
100%
2001
2003
2005
2007
2009
2011
2013
2015
2017
2019
2021
2023
2025
2027
2029
LPG Stove
Electricity Cooking HeaterKerosene Cooking StoveBiogas
Metallic ICS
In-Situ ICS
Traditional Cookstoves (TCS)
45Investment prospectus for clean cooking solutions in Nepal
46 A Roadmap to National Goal of Providing Clean Cooking Solutions for All
5. Opportunities Envisaged through CCS4ALL Nepal has huge market potential for clean cooking solutions. Equally large are the opportunities for the government, development partners, private players, and consumers. The opportunities are not confined to Nepal and can potentially benefit the entire South Asian region, with increased supplies of clean energy and shared best practices, provided that global and regional cooperation materializes. Foreign direct investment and development aid are essential.
Ensuring that the development of clean cooking solutions is rapid, equitable, and sustainable in the coming years requires augmented investment from the private sector and transformation initiatives from development institutions and NGOs. Improved coordination among development partners, governments, and the private sector will also be fundamental to mobilize substantial new funding
5.1 Government of Nepal The government provides technical assistance, awareness raising, quality control, and subsidy support for disseminating and promoting clean cooking solutions. It has set ambitious targets under its periodic plans for access, with the aim of raising living standards of rural people, protecting the environment, and developing commercially viable alternative energy industries. Alleviating the drudgery of women and children using traditional cookstoves and mitigating climate change by reducing carbon and other emissions are also important. As indoor pollution is a major cause of respiratory health problems, extensive use of clean cooking solutions will minimize the government’s health spending. The state will have the largest role in developing policies, regulations, institutional structures, and incentives (and their disbursement mechanisms).
5.2 International Development Partners International development partners aspire to alleviate poverty, safeguard the environment, and foster income growth among poor nations worldwide. To meet these goals, they create individual partnerships that help governments to meet their own long-term goals. Along similar lines, international organizations are supporting the government of Nepal in achieving its CCS4ALL mission by providing technical support and financial aid to non-profit, grassroots NGOs and to government agencies. Extensive policy advice, research and analysis, and technical assistance reinforce the ultimate objective of financing and can help inform Nepal’s own investments. In other words, development partners are significant in mobilizing global resources for clean cooking solutions and in supporting the creation of an enabling environment for CCS4ALL. Table 17 offers a profile of Nepal’s development partners (Ministry of Finance 2014).
Table 17: International development partners active in Nepal and key areas of cooperation
Bilateral development partner
Country Key areas of cooperation
Australia Education and scholarships, health, governance and peace building, and rural development.
China Road and transport, industries, water resources, health, sports, other construction projects, and goods and materials.
Denmark Education, energy, and governance and peace building.
Finland Energy, water resources, agriculture, and forestry.
Germany Education, rural development, good governance, climate protection, and sustainable economic development.
India Education and scholarships, road and transport, industries, water resources, irrigation, health, technology, economic infrastructure, other construction projects, goods and materials, and energy.
Japan Social sector, agriculture, economic infrastructure, and environment.
Republic of Korea Education and scholarships, social sector, and so on.
Kuwait Fund for Arab Economic Development
Energy, road and transport, and irrigation.
Netherlands Renewable energy, water and sanitation, forestry program (biodiversity) including non-timber forest products, tourism, and cash crops.
Norway Education and scholarships, energy, and governance and peace building.
Switzerland Animal husbandry, road and transport, education, and water.
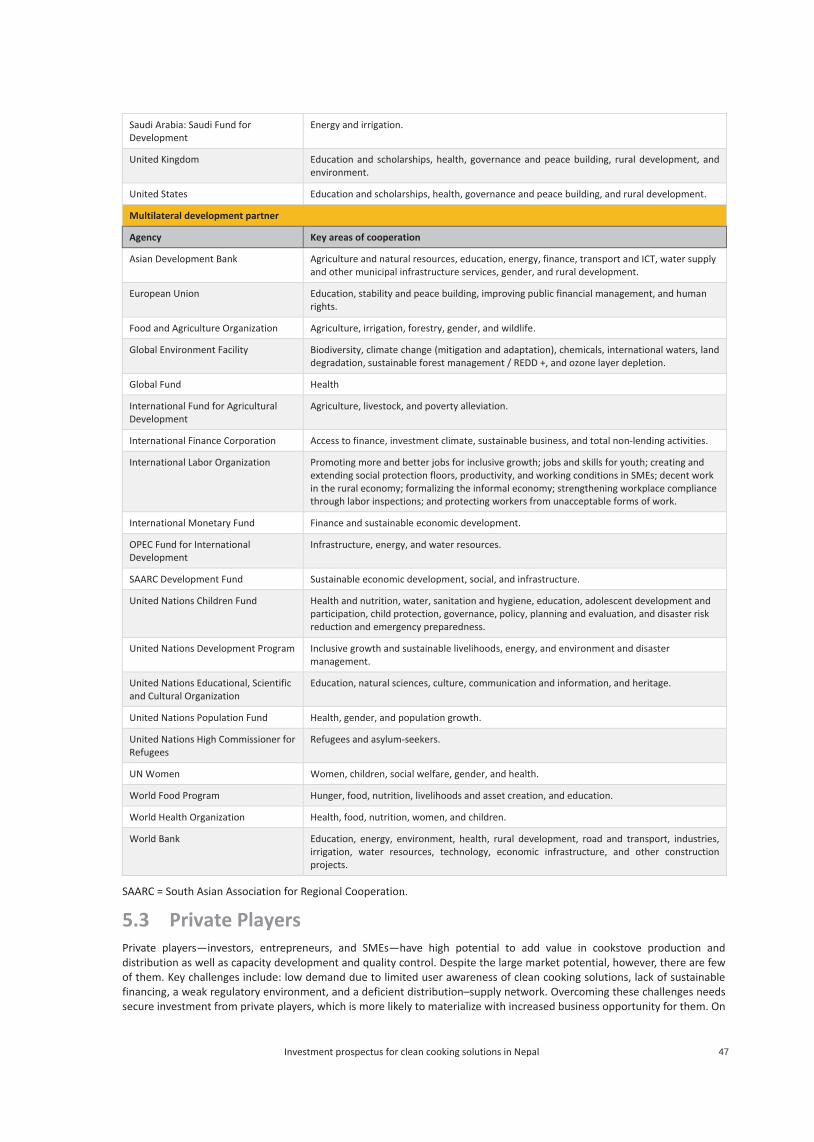
47Investment prospectus for clean cooking solutions in Nepal
SAARC = South Asian Association for Regional Cooperatio
5.3 Private Players Private players—investors, entrepreneurs, and SMEs—have high potential to add value in cookstove production and distribution as well as capacity development and quality control. Despite the large market potential, however, there are few of them. Key challenges include: low demand due to limited user awareness of clean cooking solutions, lack of sustainable financing, a weak regulatory environment, and a deficient distribution–supply network. Overcoming these challenges needs secure investment from private players, which is more likely to materialize with increased business opportunity for them. On
Saudi Arabia: Saudi Fund for Development
Energy and irrigation.
United Kingdom Education and scholarships, health, governance and peace building, rural development, and environment.
United States Education and scholarships, health, governance and peace building, and rural development.
Multilateral development partner
Agency Key areas of cooperation
Asian Development Bank Agriculture and natural resources, education, energy, finance, transport and ICT, water supply and other municipal infrastructure services, gender, and rural development.
European Union Education, stability and peace building, improving public financial management, and human rights.
Food and Agriculture Organization Agriculture, irrigation, forestry, gender, and wildlife.
Global Environment Facility Biodiversity, climate change (mitigation and adaptation), chemicals, international waters, land degradation, sustainable forest management / REDD +, and ozone layer depletion.
Global Fund Health
International Fund for Agricultural Development
Agriculture, livestock, and poverty alleviation.
International Finance Corporation Access to finance, investment climate, sustainable business, and total non-lending activities.
International Labor Organization Promoting more and better jobs for inclusive growth; jobs and skills for youth; creating and extending social protection floors, productivity, and working conditions in SMEs; decent work in the rural economy; formalizing the informal economy; strengthening workplace compliance through labor inspections; and protecting workers from unacceptable forms of work.
International Monetary Fund Finance and sustainable economic development.
OPEC Fund for International Development
Infrastructure, energy, and water resources.
SAARC Development Fund Sustainable economic development, social, and infrastructure.
United Nations Children Fund Health and nutrition, water, sanitation and hygiene, education, adolescent development and participation, child protection, governance, policy, planning and evaluation, and disaster risk reduction and emergency preparedness.
United Nations Development Program Inclusive growth and sustainable livelihoods, energy, and environment and disaster management.
United Nations Educational, Scientific and Cultural Organization
Education, natural sciences, culture, communication and information, and heritage.
United Nations Population Fund Health, gender, and population growth.
United Nations High Commissioner for Refugees
Refugees and asylum-seekers.
UN Women Women, children, social welfare, gender, and health.
World Food Program Hunger, food, nutrition, livelihoods and asset creation, and education.
World Health Organization Health, food, nutrition, women, and children.
World Bank Education, energy, environment, health, rural development, road and transport, industries, irrigation, water resources, technology, economic infrastructure, and other construction projects.
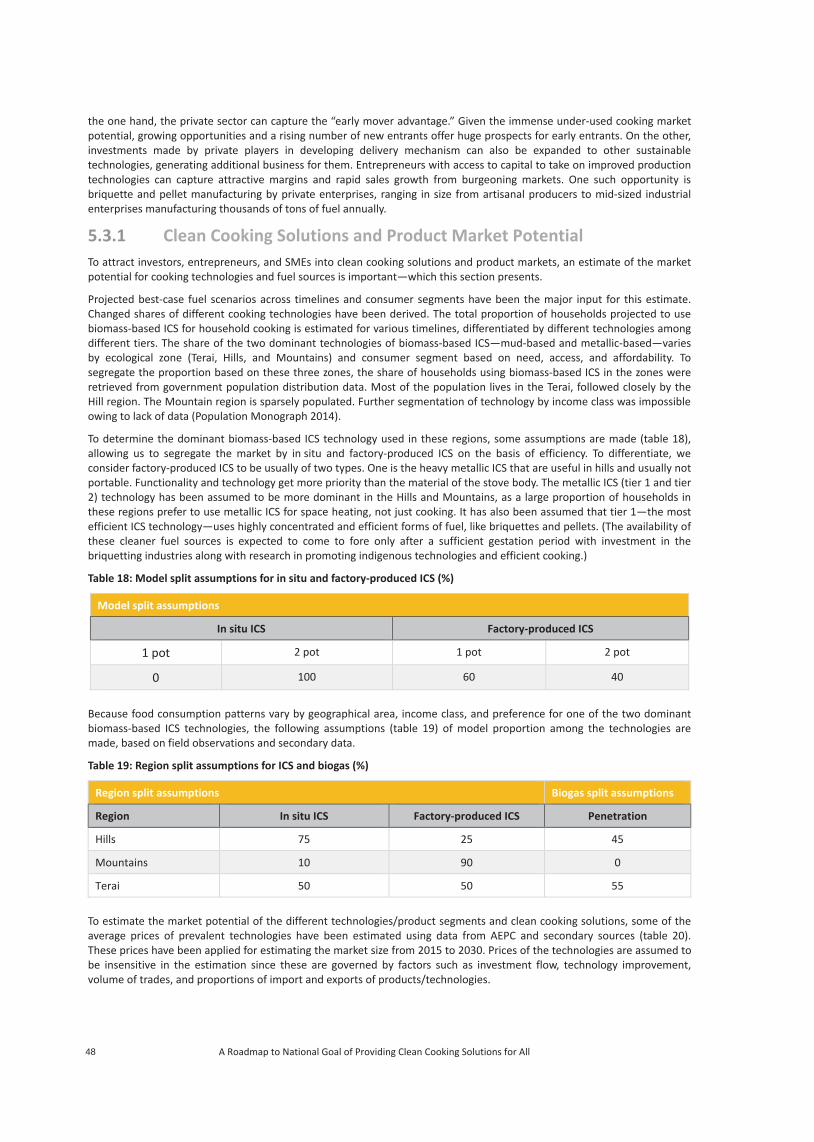
48 A Roadmap to National Goal of Providing Clean Cooking Solutions for All
the one hand, the private sector can capture the “early mover advantage.” Given the immense under-used cooking market potential, growing opportunities and a rising number of new entrants offer huge prospects for early entrants. On the other, investments made by private players in developing delivery mechanism can also be expanded to other sustainable technologies, generating additional business for them. Entrepreneurs with access to capital to take on improved production technologies can capture attractive margins and rapid sales growth from burgeoning markets. One such opportunity is briquette and pellet manufacturing by private enterprises, ranging in size from artisanal producers to mid-sized industrial enterprises manufacturing thousands of tons of fuel annually.
5.3.1 Clean Cooking Solutions and Product Market Potential To attract investors, entrepreneurs, and SMEs into clean cooking solutions and product markets, an estimate of the market potential for cooking technologies and fuel sources is important—which this section presents.
Projected best-case fuel scenarios across timelines and consumer segments have been the major input for this estimate. Changed shares of different cooking technologies have been derived. The total proportion of households projected to use biomass-based ICS for household cooking is estimated for various timelines, differentiated by different technologies among different tiers. The share of the two dominant technologies of biomass-based ICS—mud-based and metallic-based—varies by ecological zone (Terai, Hills, and Mountains) and consumer segment based on need, access, and affordability. To segregate the proportion based on these three zones, the share of households using biomass-based ICS in the zones were retrieved from government population distribution data. Most of the population lives in the Terai, followed closely by the Hill region. The Mountain region is sparsely populated. Further segmentation of technology by income class was impossible owing to lack of data (Population Monograph 2014).
To determine the dominant biomass-based ICS technology used in these regions, some assumptions are made (table 18), allowing us to segregate the market by in situ and factory-produced ICS on the basis of efficiency. To differentiate, we consider factory-produced ICS to be usually of two types. One is the heavy metallic ICS that are useful in hills and usually not portable. Functionality and technology get more priority than the material of the stove body. The metallic ICS (tier 1 and tier 2) technology has been assumed to be more dominant in the Hills and Mountains, as a large proportion of households in these regions prefer to use metallic ICS for space heating, not just cooking. It has also been assumed that tier 1—the most efficient ICS technology—uses highly concentrated and efficient forms of fuel, like briquettes and pellets. (The availability of these cleaner fuel sources is expected to come to fore only after a sufficient gestation period with investment in the briquetting industries along with research in promoting indigenous technologies and efficient cooking.)
Table 18: Model split assumptions for in situ and factory-produced ICS (%)
Model split assumptions
In situ ICS Factory-produced ICS
1 pot 2 pot 1 pot 2 pot
0 100 60 40
Because food consumption patterns vary by geographical area, income class, and preference for one of the two dominant biomass-based ICS technologies, the following assumptions (table 19) of model proportion among the technologies are made, based on field observations and secondary data.
Table 19: Region split assumptions for ICS and biogas (%)
Region split assumptions Biogas split assumptions
Region In situ ICS Factory-produced ICS Penetration
Hills 75 25 45
Mountains 10 90 0
Terai 50 50 55
To estimate the market potential of the different technologies/product segments and clean cooking solutions, some of the average prices of prevalent technologies have been estimated using data from AEPC and secondary sources (table 20). These prices have been applied for estimating the market size from 2015 to 2030. Prices of the technologies are assumed to be insensitive in the estimation since these are governed by factors such as investment flow, technology improvement, volume of trades, and proportions of import and exports of products/technologies.
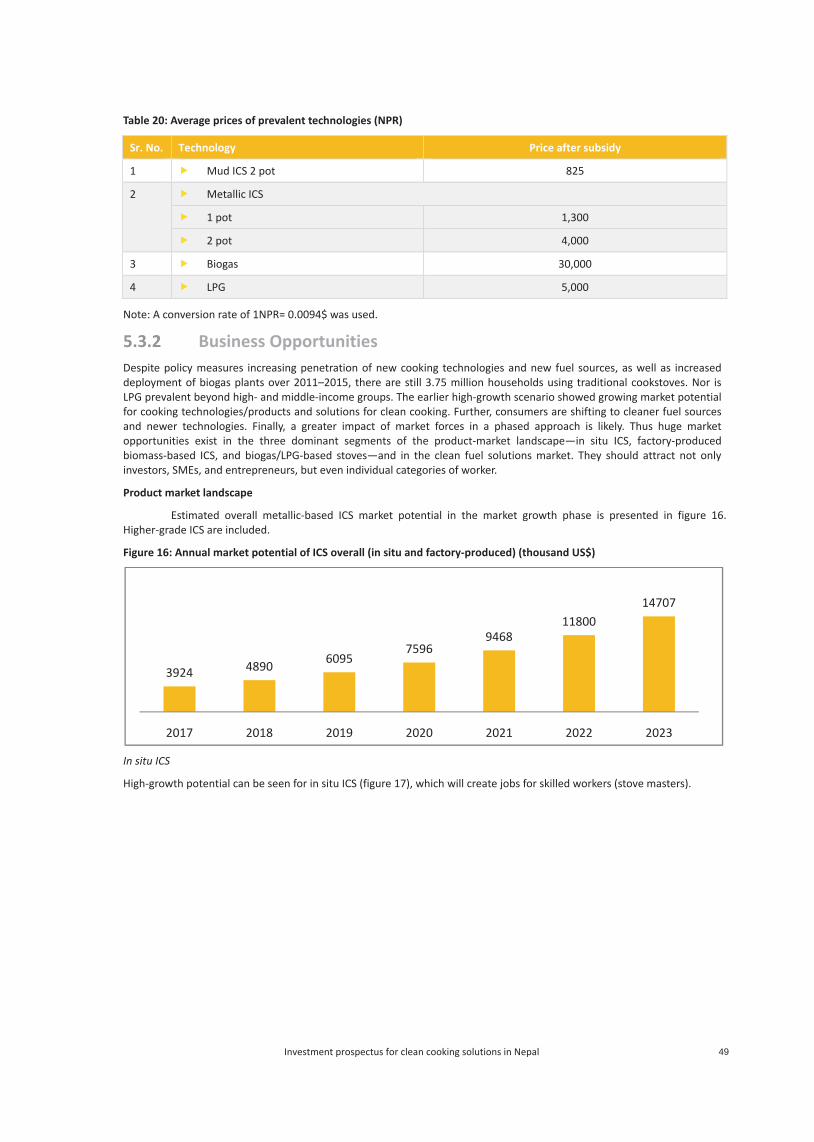
49Investment prospectus for clean cooking solutions in Nepal
Table 20: Average prices of prevalent technologies (NPR)
Sr. No. Technology Price after subsidy
1 Mud ICS 2 pot 825
2
Metallic ICS
1 pot 1,300
2 pot 4,000
3 Biogas 30,000
4 LPG 5,000
Note: A conversion rate of 1NPR= 0.0094$ was used.
5.3.2 Business Opportunities Despite policy measures increasing penetration of new cooking technologies and new fuel sources, as well as increased deployment of biogas plants over 2011–2015, there are still 3.75 million households using traditional cookstoves. Nor is LPG prevalent beyond high- and middle-income groups. The earlier high-growth scenario showed growing market potential for cooking technologies/products and solutions for clean cooking. Further, consumers are shifting to cleaner fuel sources and newer technologies. Finally, a greater impact of market forces in a phased approach is likely. Thus huge market opportunities exist in the three dominant segments of the product-market landscape—in situ ICS, factory-produced biomass-based ICS, and biogas/LPG-based stoves—and in the clean fuel solutions market. They should attract not only investors, SMEs, and entrepreneurs, but even individual categories of worker.
Product market landscape
Estimated overall metallic-based ICS market potential in the market growth phase is presented in figure 16. Higher-grade ICS are included.
Figure 16: Annual market potential of ICS overall (in situ and factory-produced) (thousand US$)
In situ ICS
High-growth potential can be seen for in situ ICS (figure 17), which will create jobs for skilled workers (stove masters).
3924 4890 60957596
946811800
14707
2017 2018 2019 2020 2021 2022 2023
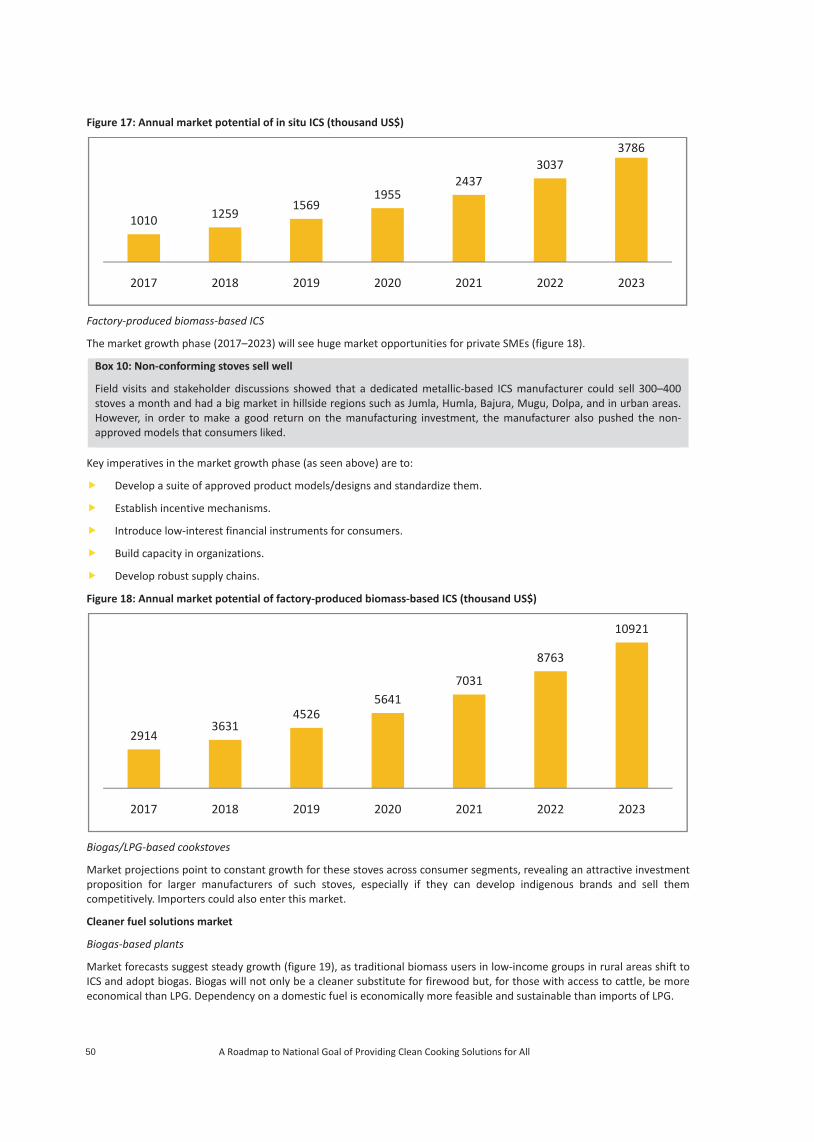
50 A Roadmap to National Goal of Providing Clean Cooking Solutions for All
Figure 17: Annual market potential of in situ ICS (thousand US$)
Factory-produced biomass-based ICS
The market growth phase (2017–2023) will see huge market opportunities for private SMEs (figure 18).
Box 10: Non-conforming stoves sell well
Field visits and stakeholder discussions showed that a dedicated metallic-based ICS manufacturer could sell 300–400 stoves a month and had a big market in hillside regions such as Jumla, Humla, Bajura, Mugu, Dolpa, and in urban areas. However, in order to make a good return on the manufacturing investment, the manufacturer also pushed the non-approved models that consumers liked.
Key imperatives in the market growth phase (as seen above) are to:
Develop a suite of approved product models/designs and standardize them.
Establish incentive mechanisms.
Introduce low-interest financial instruments for consumers.
Build capacity in organizations.
Develop robust supply chains.
Figure 18: Annual market potential of factory-produced biomass-based ICS (thousand US$)
Biogas/LPG-based cookstoves
Market projections point to constant growth for these stoves across consumer segments, revealing an attractive investment proposition for larger manufacturers of such stoves, especially if they can develop indigenous brands and sell them competitively. Importers could also enter this market.
Cleaner fuel solutions market
Biogas-based plants
Market forecasts suggest steady growth (figure 19), as traditional biomass users in low-income groups in rural areas shift to ICS and adopt biogas. Biogas will not only be a cleaner substitute for firewood but, for those with access to cattle, be more economical than LPG. Dependency on a domestic fuel is economically more feasible and sustainable than imports of LPG.
1010 12591569
19552437
30373786
2017 2018 2019 2020 2021 2022 2023
29143631
45265641
7031
8763
10921
2017 2018 2019 2020 2021 2022 2023
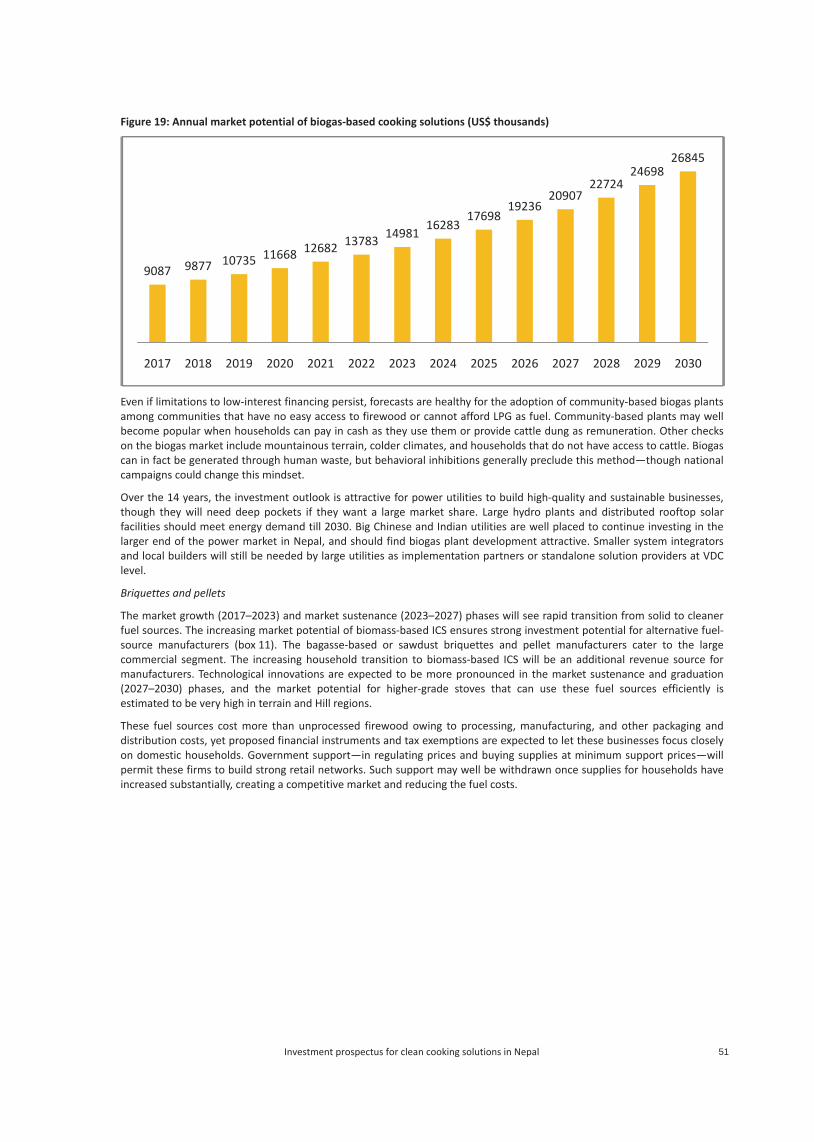
51Investment prospectus for clean cooking solutions in Nepal
Figure 19: Annual market potential of biogas-based cooking solutions (US$ thousands)
Even if limitations to low-interest financing persist, forecasts are healthy for the adoption of community-based biogas plants among communities that have no easy access to firewood or cannot afford LPG as fuel. Community-based plants may well become popular when households can pay in cash as they use them or provide cattle dung as remuneration. Other checks on the biogas market include mountainous terrain, colder climates, and households that do not have access to cattle. Biogas can in fact be generated through human waste, but behavioral inhibitions generally preclude this method—though national campaigns could change this mindset.
Over the 14 years, the investment outlook is attractive for power utilities to build high-quality and sustainable businesses, though they will need deep pockets if they want a large market share. Large hydro plants and distributed rooftop solar facilities should meet energy demand till 2030. Big Chinese and Indian utilities are well placed to continue investing in the larger end of the power market in Nepal, and should find biogas plant development attractive. Smaller system integrators and local builders will still be needed by large utilities as implementation partners or standalone solution providers at VDC level.
Briquettes and pellets
The market growth (2017–2023) and market sustenance (2023–2027) phases will see rapid transition from solid to cleaner fuel sources. The increasing market potential of biomass-based ICS ensures strong investment potential for alternative fuel-source manufacturers (box 11). The bagasse-based or sawdust briquettes and pellet manufacturers cater to the large commercial segment. The increasing household transition to biomass-based ICS will be an additional revenue source for manufacturers. Technological innovations are expected to be more pronounced in the market sustenance and graduation (2027–2030) phases, and the market potential for higher-grade stoves that can use these fuel sources efficiently is estimated to be very high in terrain and Hill regions.
These fuel sources cost more than unprocessed firewood owing to processing, manufacturing, and other packaging and distribution costs, yet proposed financial instruments and tax exemptions are expected to let these businesses focus closely on domestic households. Government support—in regulating prices and buying supplies at minimum support prices—will permit these firms to build strong retail networks. Such support may well be withdrawn once supplies for households have increased substantially, creating a competitive market and reducing the fuel costs.
9087 9877 10735 11668 12682 13783 1498116283
1769819236
2090722724
2469826845
2017 2018 2019 2020 2021 2022 2023 2024 2025 2026 2027 2028 2029 2030
52 A Roadmap to National Goal of Providing Clean Cooking Solutions for All
Box 11:Briquette manufacturing in Nepal
Briquette manufacturing that uses waste biomass was introduced in 1982 by the private sector as an alternative to fuel wood. By 1987, private enterprises had started manufacturing charred rice briquettes and rice-husk briquettes. These early days of briquette manufacturing were completely market driven—there was no indigenous technical backstopping and minimal R&D support. Technological and economic challenges forced most of the briquetting industries to close.
Matters improved after 2010 when the government (via AEPC) started promoting alternative fuels and technologies (see earlier chapters). With increased use of ICS in hotels, demand for bio-briquettes rose, attracting private investors.
The government and development partners have shown interest in developing better bio-briquettes at lower prices, supporting R&D. With decent innovations, price rationalization through R&D and larger production facilities, policy support, and government incentives, the sector offers high growth potential in the near term.
Source: Singh 2013.
5.4 Consumers Using clean cooking solutions, consumers see not only fewer negative health impacts but also livelihood and environmental benefits. Each NPR spent by the beneficiaries on procuring these solutions can help build a thriving market for them. The clean cookstove and fuel value chains can offer new conduits for, by way of example, women’s economic empowerment: they can earn income from all aspects of an enterprise that involves cooking. The local population can stimulate the market as clean cooking entrepreneurs and can leverage their networks to encourage adoption of these new technologies. Replacing traditional cookstoves with more efficient technologies saves households’ time and money, opening additional livelihood opportunities. Consumers can direct their monetary savings from using less fuel when adopting ICS to better education and health.
53Investment prospectus for clean cooking solutions in Nepal
54 A Roadmap to National Goal of Providing Clean Cooking Solutions for All
6. IThe stinvestm
Eoa
Sec
Fbs
These partneinvestm
6.1 Severachaptethe coaware
Impacattractpreparthe invleader
Figure
6.2 A fourgrowth
mpact trategies and ments” should
Enhance demaoffering consumand smart subs
Strengthen supenhancing marconsumers.
Foster an enabbenefits of clestrengthening M
impact investmers, FIs/MFIs, tments, and ma
Need al programs haers 1 and 3), fosookstove and fness is still low
t investments sting more invere the market fvestor communrship from the p
e 20: The ecosys
Investr-phase investmh phase (2017–
Investmeasures outlallow a greater
and by motivamer finance to esidies.
pply by attractrket intelligence
bling environmean cookstovesM&E.
ments need to bhe private sectkes broad estim
for Stratve disseminatestered by the gfuel markets a.
should aim not stments. To inc
for scaling up, snity of opportupublic to private
stem for impac
tment Timent timescale–2023), which t
tments ined in earlier
r role for marke
ating potential enhance afford
ting more finane, and by creat
ment by engagis and fuels, p
be supported btor (including p
mates of the am
tegic Dried clean cookingovernment andare highly fragm
only to achievecrease these in
support developunities, and mite sector.
ct investments
imelinese was outlined takes up the bu
and Bur chapters wil
et forces, throug
consumers, ddability and pro
nce and investting inclusive va
ing national anpromoting inte
by a raft of stakpublic–private
mounts required
ve of Imng solutions and public sector mented, stretc
e a certain missnvestments so pment of commtigate investme
in figure 13. Oulk of the rest o
udget Fl require heavgh a three-pron
developing cleavide incentives
tment to domealue-chains and
nd local stakehrnational stand
keholder groupspartnerships), d for achieving
pact Invnd enhanced ubut with only l
ching resources
sion, but to preas to expand t
mercially viable ent risks (figure
Of the four phof this chapter.
Fundingvy investment nged strategy:
aner and mores for off-take su
estic productiod innovative di
holders, buildindards and rigo
s, notably the gand consumersCCS4ALL by 202
estmentuser capacities little private ses too thinly. A
epare a market the clean cookand scalable e
e 20). This will
ases, the mostAs much inves
g and funding.
e efficient techch as results-ba
n or funding fstribution mod
ng the evidencorous testing
government ands. This chapter23
ts and awarenessctor input. Onend in many ar
that is self-susking sector, it is
nterprises, raishelp to gradua
t crucial phasetment will be c
These “impact
hnologies, andased incentives
for imports, bydels for remote
e base for theprotocols, and
d developmentr reviews these
s of them (seee upshot is thatreas consumer
staining, in turns imperative tose awareness inlly transfer the
e is the marketchannelled into
t
d s
y e
e d
t e
e t r
n o n e
t o
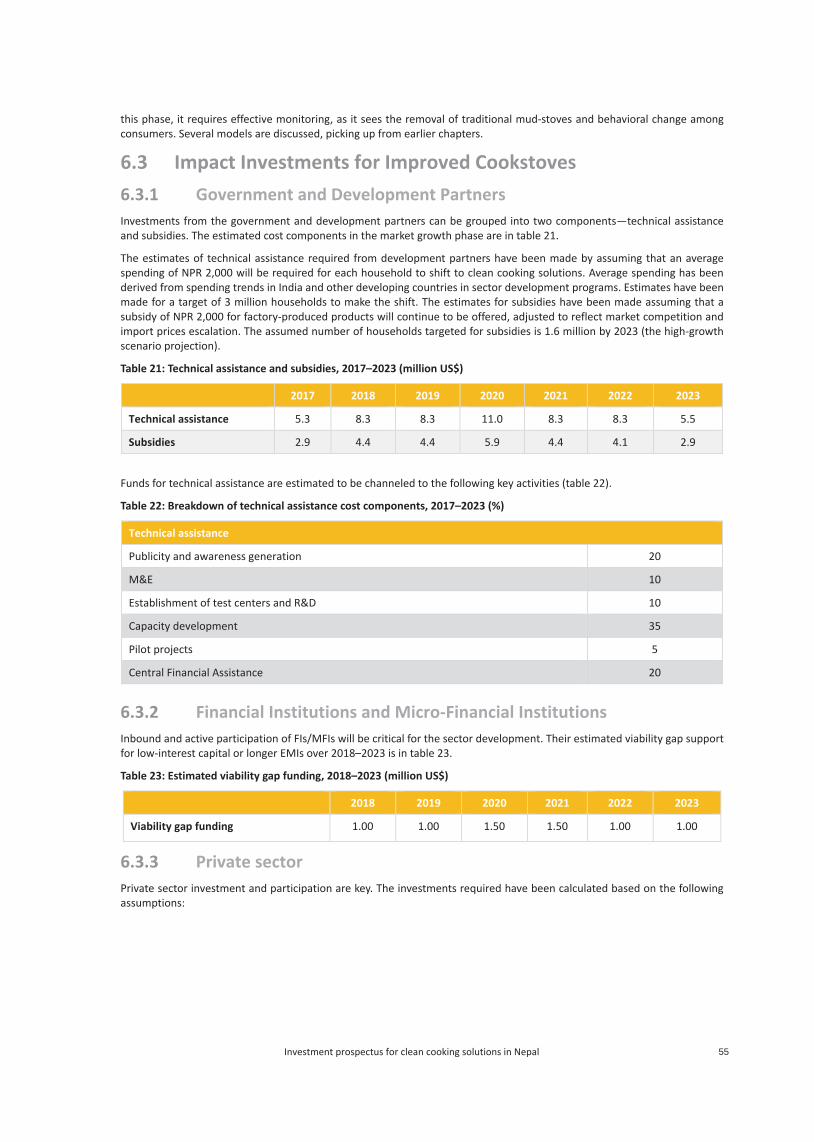
55Investment prospectus for clean cooking solutions in Nepal
this phase, it requires effective monitoring, as it sees the removal of traditional mud-stoves and behavioral change among consumers. Several models are discussed, picking up from earlier chapters.
6.3 Impact Investments for Improved Cookstoves
6.3.1 Government and Development Partners Investments from the government and development partners can be grouped into two components—technical assistance and subsidies. The estimated cost components in the market growth phase are in table 21.
The estimates of technical assistance required from development partners have been made by assuming that an average spending of NPR 2,000 will be required for each household to shift to clean cooking solutions. Average spending has been derived from spending trends in India and other developing countries in sector development programs. Estimates have been made for a target of 3 million households to make the shift. The estimates for subsidies have been made assuming that a subsidy of NPR 2,000 for factory-produced products will continue to be offered, adjusted to reflect market competition and import prices escalation. The assumed number of households targeted for subsidies is 1.6 million by 2023 (the high-growth scenario projection).
Table 21: Technical assistance and subsidies, 2017–2023 (million US$)
2017 2018 2019 2020 2021 2022 2023
Technical assistance 5.3 8.3 8.3 11.0 8.3 8.3 5.5
Subsidies 2.9 4.4 4.4 5.9 4.4 4.1 2.9
Funds for technical assistance are estimated to be channeled to the following key activities (table 22).
Table 22: Breakdown of technical assistance cost components, 2017–2023 (%)
Technical assistance
Publicity and awareness generation 20
M&E 10
Establishment of test centers and R&D 10
Capacity development 35
Pilot projects 5
Central Financial Assistance 20
6.3.2 Financial Institutions and Micro-Financial Institutions Inbound and active participation of FIs/MFIs will be critical for the sector development. Their estimated viability gap support for low-interest capital or longer EMIs over 2018–2023 is in table 23.
Table 23: Estimated viability gap funding, 2018–2023 (million US$)
2018 2019 2020 2021 2022 2023
Viability gap funding 1.00 1.00 1.50 1.50 1.00 1.00
6.3.3 Private sector Private sector investment and participation are key. The investments required have been calculated based on the following assumptions:
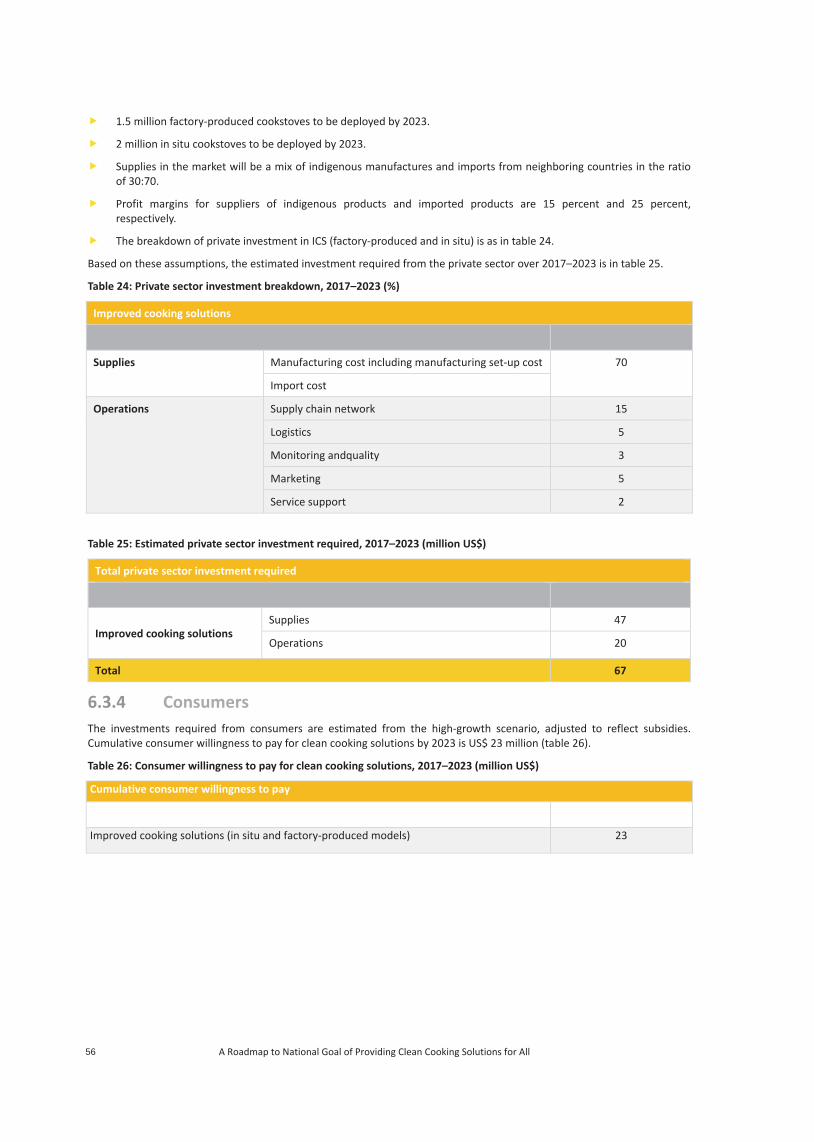
56 A Roadmap to National Goal of Providing Clean Cooking Solutions for All
1.5 million factory-produced cookstoves to be deployed by 2023.
2 million in situ cookstoves to be deployed by 2023.
Supplies in the market will be a mix of indigenous manufactures and imports from neighboring countries in the ratio of 30:70.
Profit margins for suppliers of indigenous products and imported products are 15 percent and 25 percent, respectively.
The breakdown of private investment in ICS (factory-produced and in situ) is as in table 24.
Based on these assumptions, the estimated investment required from the private sector over 2017–2023 is in table 25.
Table 24: Private sector investment breakdown, 2017–2023 (%)
Improved cooking solutions
Supplies Manufacturing cost including manufacturing set-up cost 70
Import cost
Operations Supply chain network 15
Logistics 5
Monitoring andquality 3
Marketing 5
Service support 2
Table 25: Estimated private sector investment required, 2017–2023 (million US$)
Total private sector investment required
Improved cooking solutions Supplies 47
Operations 20
Total 67
6.3.4 Consumers The investments required from consumers are estimated from the high-growth scenario, adjusted to reflect subsidies. Cumulative consumer willingness to pay for clean cooking solutions by 2023 is US$ 23 million (table 26).
Table 26: Consumer willingness to pay for clean cooking solutions, 2017–2023 (million US$)
Cumulative consumer willingness to pay
Improved cooking solutions (in situ and factory-produced models) 23
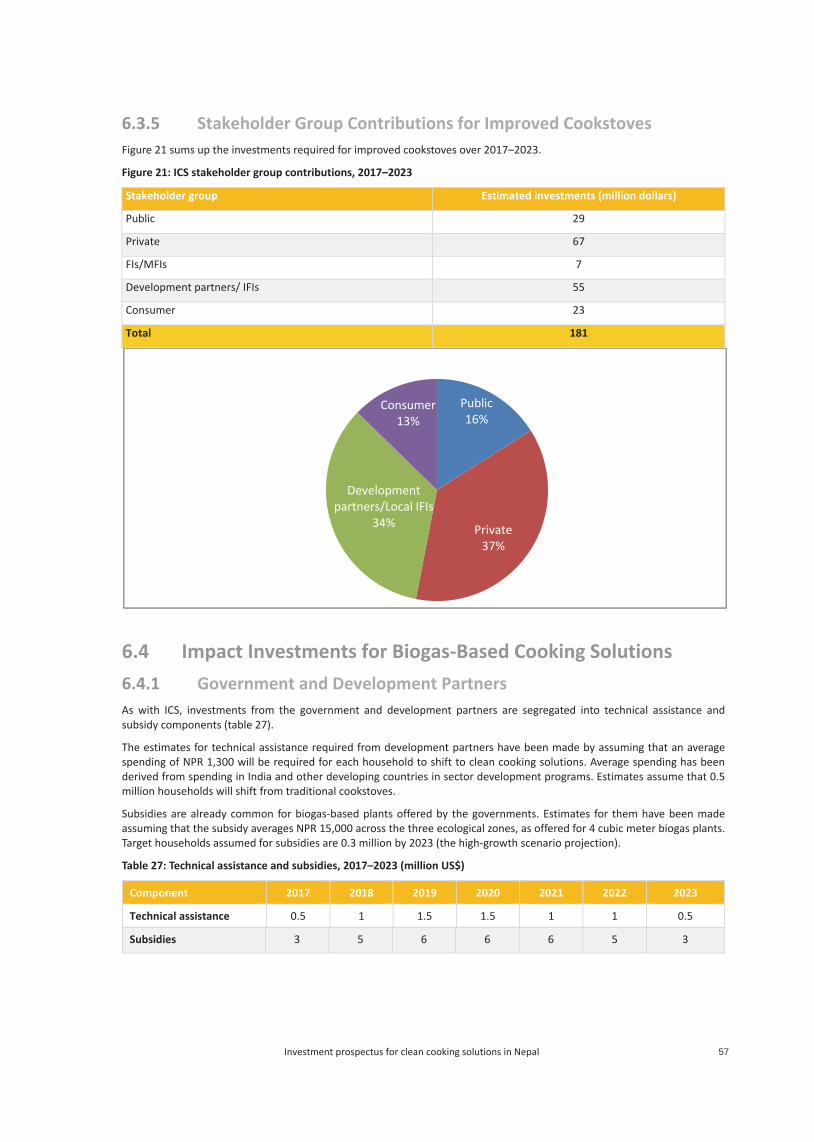
57Investment prospectus for clean cooking solutions in Nepal
6.3.5 Stakeholder Group Contributions for Improved Cookstoves Figure 21 sums up the investments required for improved cookstoves over 2017–2023.
Figure 21: ICS stakeholder group contributions, 2017–2023
Stakeholder group Estimated investments (million dollars)
Public 29
Private 67
FIs/MFIs 7
Development partners/ IFIs 55
Consumer 23
Total 181
6.4 Impact Investments for Biogas-Based Cooking Solutions
6.4.1 Government and Development Partners As with ICS, investments from the government and development partners are segregated into technical assistance and subsidy components (table 27).
The estimates for technical assistance required from development partners have been made by assuming that an average spending of NPR 1,300 will be required for each household to shift to clean cooking solutions. Average spending has been derived from spending in India and other developing countries in sector development programs. Estimates assume that 0.5 million households will shift from traditional cookstoves.
Subsidies are already common for biogas-based plants offered by the governments. Estimates for them have been made assuming that the subsidy averages NPR 15,000 across the three ecological zones, as offered for 4 cubic meter biogas plants. Target households assumed for subsidies are 0.3 million by 2023 (the high-growth scenario projection).
Table 27: Technical assistance and subsidies, 2017–2023 (million US$)
Component 2017 2018 2019 2020 2021 2022 2023
Technical assistance 0.5 1 1.5 1.5 1 1 0.5
Subsidies 3 5 6 6 6 5 3
Public16%
Private37%
Development partners/Local IFIs
34%
Consumer13%

58 A Roadmap to National Goal of Providing Clean Cooking Solutions for All
6.4.2 Financial Institutions and Micro-Financial Institutions Inbound participation of FIs/MFIs will be critical. Their estimated viability gap support for low-interest capital over 2018–2023 is in table 28.
Table 28: Estimated viability gap funding, 2018–2023 (million US$)
Description of key programs 2018 2019 2020 2021 2022 2023
Viability gap funding 5.50 5.50 5.50 5.50 5.50 5.50
6.4.3 Private Sector Private sector investment and participation are key. The investments required have been calculated based on the following assumptions:
Deployment capacities of biogas plants and electric stoves are derived for 2017–2023 from the high-growth scenario.
Profit margins for biogas plants and electric induction stoves are 15 percent and 20 percent, respectively.
Private sector investment in biogas plants is as in table 29.
Based on these assumptions, the estimated investment required from the private sector over 2017–2023 is in table 30.
Table 29: Breakdown of private investment in biogas plants, 2017–2023 (%)
Biogas, solar, and other clean cooking solutions
Supplies Plant set-up 80
Operations Logistics 15
Monitoring and quality 1
Marketing 2
Service support 2
Table 30: Estimated investments required from the private sector, 2017–2023 (million US$)
Total private sector investments required
Biogas, solar, and other clean cooking solutions
Supplies 68
Operations 18
Net expenditure 86
6.4.4 Consumers The investments required from consumers are estimated from the high-growth scenario, adjusted to reflect subsidies. Cumulative consumer willingness to pay for clean cooking solutions by 2023 is US$ 48 million (table 31).
Table 31: Consumer willingness to pay for clean cooking solutions, 2017–2023 (million US$)
Cumulative consumer willingness to pay
Biogas, solar, and other clean cooking solutions 48
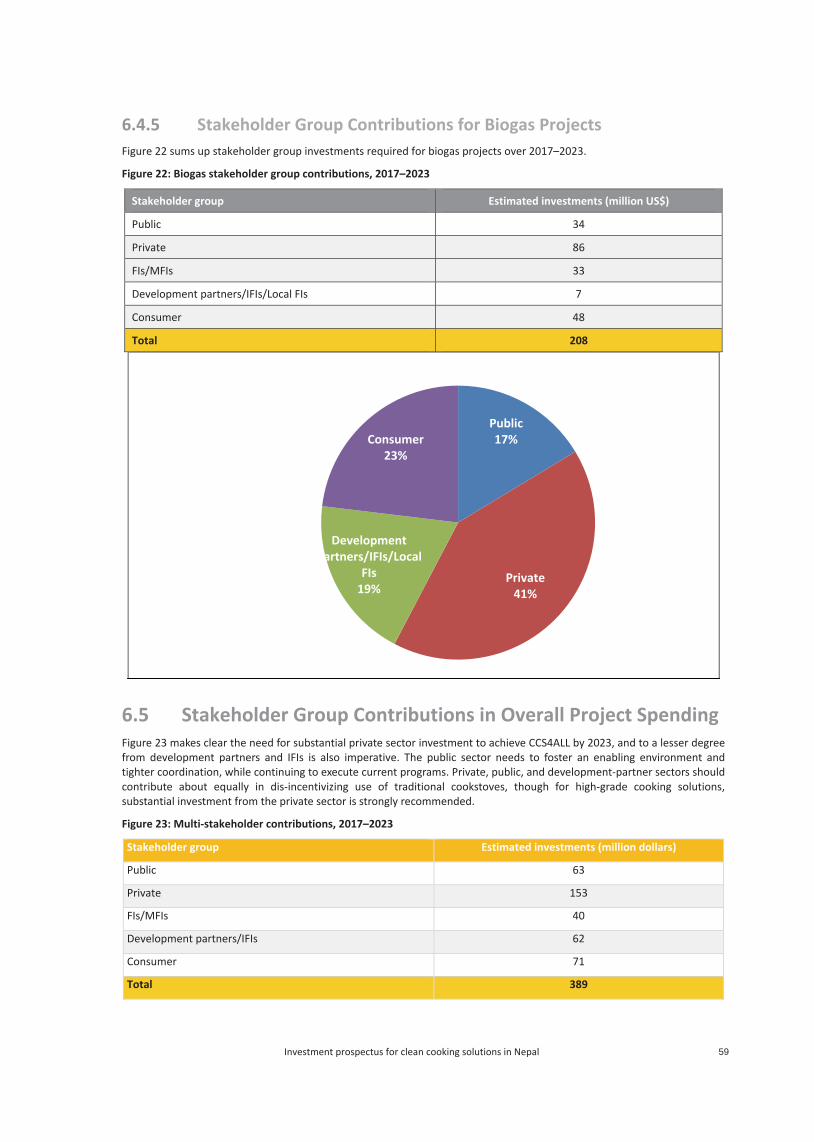
59Investment prospectus for clean cooking solutions in Nepal
6.4.5 Stakeholder Group Contributions for Biogas Projects Figure 22 sums up stakeholder group investments required for biogas projects over 2017–2023.
Figure 22: Biogas stakeholder group contributions, 2017–2023
Stakeholder group Estimated investments (million US$)
Public 34
Private 86
FIs/MFIs 33
Development partners/IFIs/Local FIs 7
Consumer 48
Total 208
6.5 Stakeholder Group Contributions in Overall Project Spending Figure 23 makes clear the need for substantial private sector investment to achieve CCS4ALL by 2023, and to a lesser degree from development partners and IFIs is also imperative. The public sector needs to foster an enabling environment and tighter coordination, while continuing to execute current programs. Private, public, and development-partner sectors should contribute about equally in dis-incentivizing use of traditional cookstoves, though for high-grade cooking solutions, substantial investment from the private sector is strongly recommended.
Figure 23: Multi-stakeholder contributions, 2017–2023
Stakeholder group Estimated investments (million dollars)
Public 63
Private 153
FIs/MFIs 40
Development partners/IFIs 62
Consumer 71
Total 389
Public17%
Private41%
Development partners/IFIs/Local
FIs19%
Consumer23%

60 A Roadmap to National Goal of Providing Clean Cooking Solutions for All
Figure 24: Number of household cooking solutions deployed, 2016–2023 (thousands)
TCS = traditional cookstoves.
Figure 25 illustrates the involvement of public (government agencies) and private sectors in achieving CCS4ALL by 2023. For completely shifting from traditional cookstoves in rural and urban areas, higher public sector involvement is required. For programs related to rural or urban in situ cookstoves almost equal contributions are required from public and private sectors. For factory-produced ICS and biogas units, less involvement is expected from the public sector. For driving electricity or LPG-based cooking, little engagement is expected from the public sector. For LPG and electricity, involvement of government enterprises may be limited to developing infrastructure.
Public16%
Private40%
Development partners/IFIs
26%
Consumer18%
1
1
44
257
125
1523
151
1838
-250
-3040
Urban- Electricity
Rural- Electricity
Urban- Biogas
Rural- Biogas
Urban- Factory produced
Rural- Factory produced
Urban- Insitu
Rural- Insitu
Urban- TCS
Rural-TCS
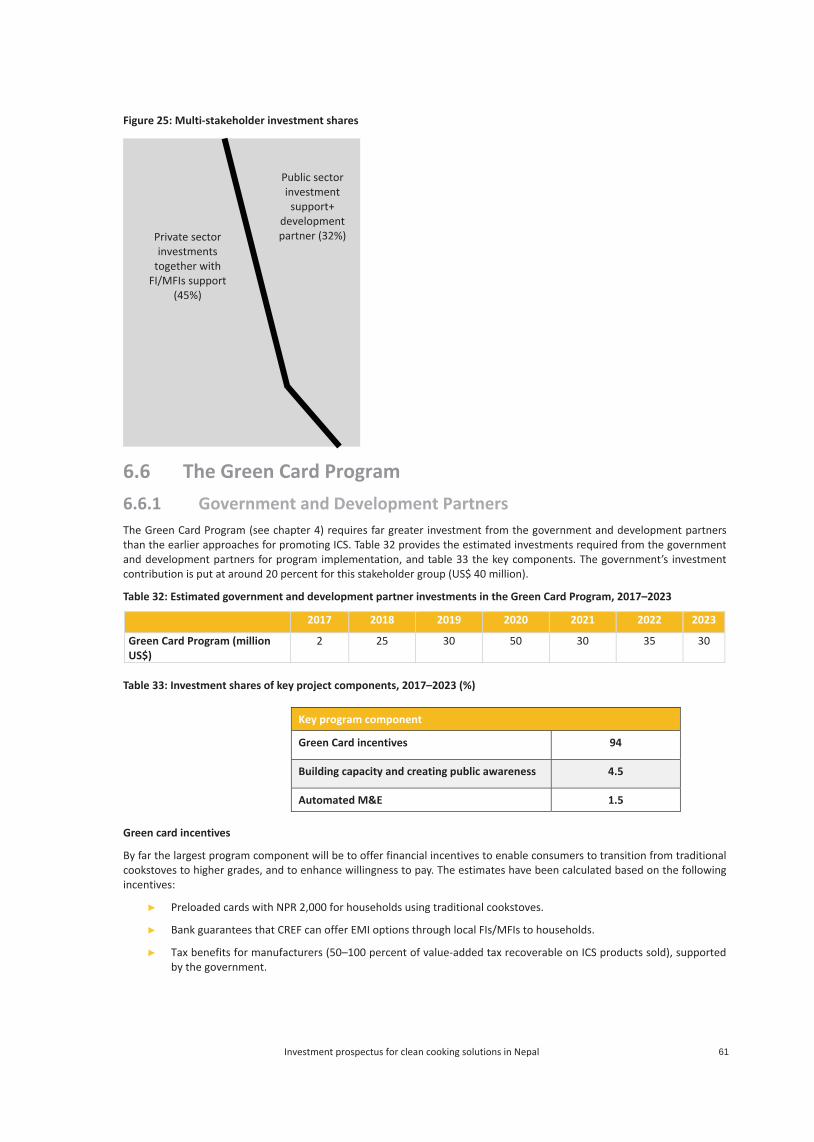
61Investment prospectus for clean cooking solutions in Nepal
Figure 25: Multi-stakeholder investment shares
6.6 The Green Card Program
6.6.1 Government and Development Partners The Green Card Program (see chapter 4) requires far greater investment from the government and development partners than the earlier approaches for promoting ICS. Table 32 provides the estimated investments required from the government and development partners for program implementation, and table 33 the key components. The government’s investment contribution is put at around 20 percent for this stakeholder group (US$ 40 million).
Table 32: Estimated government and development partner investments in the Green Card Program, 2017–2023
2017 2018 2019 2020 2021 2022 2023
Green Card Program (million US$)
2 25 30 50 30 35 30
Table 33: Investment shares of key project components, 2017–2023 (%)
Green card incentives
By far the largest program component will be to offer financial incentives to enable consumers to transition from traditional cookstoves to higher grades, and to enhance willingness to pay. The estimates have been calculated based on the following incentives:
Preloaded cards with NPR 2,000 for households using traditional cookstoves.
Bank guarantees that CREF can offer EMI options through local FIs/MFIs to households.
Tax benefits for manufacturers (50–100 percent of value-added tax recoverable on ICS products sold), supported by the government.
Key program component
Green Card incentives 94
Building capacity and creating public awareness 4.5
Automated M&E 1.5
Private sector investments
together with FI/MFIs support
(45%)
Public sector investment
support+ development partner (32%)
62 A Roadmap to National Goal of Providing Clean Cooking Solutions for All
Capacity and public-awareness building
The investment estimates are calculated based on the following assumptions:
Designing, printing, and deploying promotional and communication products, and banners (in 40 VDCs).
Creating and airing of video or radio spots in various media over five years, and SMS campaigns.
Conducting pilot programs of new technologies on the market.
Conducting workshops, awareness-raising seminars, and road shows.
Conducting training-of-trainers programs for District Development Committees, VDCs, NGOs, and civil society organizations (at least two per district each year for five years).
Automated M&E
This component involves use of digital technology for M&E, ensuring minimal leakage. Estimated spending over 2017–2023 is based on the following assumed or proposed activities:
Launching pilot programs in five districts with at least 40 VDCs where ICS have not been installed as a proof of concept in the first year.
Establishing a Central Data Center with all hardware and software, including the necessary infrastructure to record and monitor data. The data sanitization and quality of data management will be improved during the pilot, as the data are critical and will reflect the use pattern of the household.
After fine tuning and completion of the pilot, for accelerated deployment of technology hardware equipment will be made in larger consumer households.
For the overheads of the resources deployment in the M&E and data management will be encompassed.
6.6.2 Private Sector The private sector investments required have been calculated based on the following assumptions:
3.5 million factory-produced cookstoves to be deployed by 2023.
Supplies in the market will be a mix of indigenous manufactures and imports from neighboring countries in the ratio of 30:70.
Profit margins for suppliers of indigenous products and imported products are 15 percent and 25 percent, respectively.
Private sector investments channeled toward ICS are as in table 34.
Based on these assumptions, the estimated investment required from the private sector over 2017–2023 is in table 34.
Table 34: Estimated investments required from the private sector,2017–2023 (million US$)
Total private sector investments required
Improved cooking solutions Supplies 100
Operations 46
Total 146
6.6.3 Consumer Participation The investments required from consumers are estimated from the high-growth scenario, and all households are assumed to buy factory-produced ICS. Cumulative consumer willingness to pay for clean cooking solutions by 2023 is US$ 59 million (table 35).
Table 35: Cumulative consumer willingness to pay for clean cooking solutions, 2017–2023 (million US$)
Cumulative consumer willingness to pay
ICS (factory-produced) 59
63Investment prospectus for clean cooking solutions in Nepal
6.6.4 Stakeholder Group Contributions The stakeholder group contributions for this program are outlined in figure 26.
Figure 26: Green Card Program stakeholder group contributions, 2017–2023
Stakeholder group Estimated investments (million dollars)
Public 40
Private 146
Development partners/ IFIs 162
Consumer 59
Total 407
Public10%
Private36%
Development partners/IFIs
40%
Consumer14%
64 A Roadmap to National Goal of Providing Clean Cooking Solutions for All
AnAfter mAssessinclusidemocIts adothe Wopen athat, a
Table 3
Regi
Incocate
Popu
GNI capit
City
Note:
When given t
Figure
The D(figure
17http://18 The diof each Business
Re
nex: Bumore than two sment of the Uve growth for cratic process, option is expect
World Bank’s Gloand run an SMalthough the ran
36: Doing busin
ion So
ome egory Lo
ulation 28
per ta (US$) 73
covered Ka
DTF = distance
set against its that India is on
e 27: Ranking of
oing Business res 28 and 29).
/www.doingbusinesistance to frontier seconomy to the “frs sample since 2005
Afga
Pa
egional Ave
Sr
usinessdecades of inte
United Nations the vulnerablNepal adopted ted to support obal Doing BusE while complynking of Nepal
ness in Nepal, 2
outh Asia
ow income
8,120,740
30
athmandu
to frontier.
neighbors in Se neighbor and
f Nepal on the
ranking system
ss.org/. score aids in assessirontier,” which repr5.
anistan (Ran
akistan (Ran
India (Ran
erage (South
ri Lank (Ran
Nepal (Ra
Butan (Ra
s Oppoernal conflict, NAgencies in N
le communitiesa new constitu
Nepal in adoptsiness Report 2ying with reguladeclined from 2
2015 and 2016
Doing Busin
99
Doing Busin(% points)
60.41
South Asia, Nepd Bhutan is a ve
ease of doing b
in 2016 has 1
ing the absolute levresents the best per
nk 177)
nk 138)
nk 130)
h Asia)
nk 107)
ank 84)
ank 71)
ortunitiNepal is steadilyepal suggesteds was one of ution in Septeming progressive
2016.17 This revations. The repo2015, the dista
ess 2016 rank
ess 2016 DTF
pal ranks seconry small econom
business comp
0 indicators fo
vel of regulatory performance observed
es in Ny settling into a
d that the statethe major cau
mber 2015, whice economic refoveals how easy ort covers 189 nce to frontier
Doing Busine
94
Doing Busine(% points)
60.30
d in the regionmy, with a popu
ared with Sout
r evaluating co
rformance and howd on each of the ind
Nepal a peaceful deme’s failure to deuses of the coch focuses on s
orms. This anneor demanding
economies, inc(DTF)18 slightly
ess 2015 rank
ess 2015 DTF
n after Bhutan. ulation of abou
th Asian neighb
ountry perform
w it improves over tdicators across all e
40
ocracy. The Coeliver rural devnflict. As a pa
social and econex was written wg it is for a buscluding Nepal. Ty improved.
Change in
-5
Change in points)
0.11
This is a decenut 700,000.
bours
ance and dista
ime. This measure seconomies in the Do
0.58
51.6
5
5
mmon Countryvelopment andart of the newomic inclusion.
with input fromsinessperson toTable 36 shows
rank
DTF (%
nt achievement
nce to frontier
shows the distanceoing
69
54.68
55.25
58.96
60.41
65.21
y d w
. m o s
t
r
1

65Investment prospectus for clean cooking solutions in Nepal
Figure 28: Rankings on Doing Business indicators, Nepal
Scale: Rank 189 center, rank 1 outer edge
Figure 29: Distance to frontier scores on Doing Business indicators, Nepal
Scale: Score 0 center, score 100 outer edge
This ranking shows that Nepal performs higher than its overall ranking on the following indicators:
Dealing with construction permits.
Registering property.
Protecting minority investors.
Trading across borders.
Resolving insolvency.
The country does poorly on indicators like enforcing contracts and getting credits.
Starting abusiness (105)
Dealing withconstructionpermits (78)
Gettingelectricity
(131)
Registeringproperty (72)
Getting credit(133)
Protectingminority
investors (57)
Paying taxes(124)
Trading acrossborders (60)
Enforcingcontracts (152)
Resolvinginsolvency
(86)
Starting abusiness (83.48)
Dealing withconstruction
permits (70.25)
Gettingelectricity (57.51)
Registeringproperty (66.96)
Getting credit(30)
Protectingminority
investors (58.33)
Paying taxes(66.5)
Trading acrossborders (81.6)
Enforcingcontracts (45.26)
Resolvinginsolvency
(44.19)

66 A Roadmap to National Goal of Providing Clean Cooking Solutions for All
References AEPC (Alternative Energy Promotion Center). 2016. "Year-Wise Installation of Biogas Plants (1992/93 to 2015/16)." Lalitpur,
Nepal: AEPC. http://www.aepc.gov.np/?option=statistics&page=substatistics&mid=6&sub_id=49&id=4.
–––––. 2016. "Year-Wise Installation of ICS." Lalitpur, Nepal: AEPC. http://www.aepc.gov.np/?option=statistics&page=substatistics&mid=6&sub_id=46&id=3.
Bajgain, S., and I. S. Shakya. 2005. The Nepal Biogas Support Program: A Successful Model of Public Private Partnership for Rural Household Energy Supply. The Hague, the Netherlands and Kathmandu, Nepal: SNV Netherlands Development Organization and Biogas Sector Partnership-Nepal.
Bhutan Power Corporation Ltd. 2016. "Tariff Rates." Thimphu, Bhutan: Bhutan Power Corporation Ltd. http://www.bpc.bt/utilities/electricity-tariffs/.
CBS (Central Bureau of Statistics). 2011. National Population and Housing Census 2011. Kathmandu, Nepal: CBS. http://unstats.un.org/unsd/demographic/sources/census/wphc/Nepal/Nepal-Census-2011-Vol1.pdf.
CBS and UNDP (United Nations Development Program). 2014. Annual Household Survey 2013–14. Thapathali, Nepal: CBS. http://cbs.gov.np/image/data/Surveys/2015/Report%20on%20Annual%20Household%20Survey%202013-14.pdf.
DPDCL (Dhaka Power Distribution Company Ltd.). 2015. "Tariff Rates." Dhaka, Bangladesh: DPDCL. https://www.dpdc.org.bd/index.php/customer-service/tariff-rates.
ESAP (Energy Sector Assistance Program). 2013. ESAP Overview Report 2013. Lalitpur, Nepal: AEPC.
GIZ (Deutsche Gesellschaft für Internationale Zusammenarbeit). 2011. Nepal Energy Efficiency Program (NEEP): Testing New Technologies for the Terrai. Kathmandu, Nepal: Practical Action Nepal Office. http://energyefficiency.gov.np/uploads/practical_actio_1343378991.pdf.
Gurung, T. B. 2013. Preparation of 13th Three-Year Renewable Energy Sector Plan (2013/14–2015/16). Lalitpur, Nepal: AEPC. http://www.aepc.gov.np/docs/resource/subreport/20140212051127_Preparation%20of%20%2013th%20Three%20Year%20Renewable%20Energy%20Sector%20Plan%202013_14%202015_16.pdf.
HImalayan Times. 2016. "Nepal Oil Corporation Slashes Prices of Petrol, Diesel, ATF."January 19. https://thehimalayantimes.com/business/nepal-oil-corporation-slashes-prices-of-petrol-diesel-atf/.
–––––. 2016. "NOC Cuts Price of LPG by Rs 50 Per Cylinder." September 2. https://thehimalayantimes.com/business/nepal-oil-corporation-cuts-price-lpg-rs-50-per-cylinder/.
IBN (Investment Board Nepal). 1992. "The Foreign Investment and Technology Transfer Act, 2049(1992)." Kathmandu, Nepal: IBN.
Ministry of Environment. 2006. Rural Energy Policy, 2006.
Ministry of Finance. 2014. Profiles of Development Partners. http://mof.gov.np/ieccd/newsbook/20140820115245.pdf.
NCBI (National Center for Biotechnology Information). 2014. "Behavioral Attitudes and Preferences in Cooking Practices with Traditional Open-Fire Stoves in Peru, Nepal, and Kenya: Implications for Improved Cookstove Interventions." International Journal of Environmental Research and Public Health 11 (10): 10310–26.
Nepal Electricity Authority. 2015. NEA Annual Report 2014–15. http://www.nea.org.np/images/supportive_docs/year-review-2014-15.pdf.
–––––. 2016a. "Loadshedding Schedule."http://nea.org.np/loadshedding.html.
–––––. 2016b. A Year in Review-Fiscal Year 2015/2016. Kathmandu, Nepal: Nepal Electricity Authority.
Nepal Law Commission. 2016. "Nepal Laws."http://www.lawcommission.gov.np/en/.
Nepal Oil Corporation Ltd. 2016. "Fortnightly Profit/Loss."http://www.nepaloil.com.np/.
Parajuli, I., H. Lee, and K. R. Shrestha. 2016. "Indoor Air Quality and Ventilation Assessment of Rural Mountainous Households of Nepal."International Journal of Sustainable Built Environment 5(2): 301–11.
Singh, R. M. 2013. "Biobriquetting in Nepal - Scope and Potentials: A Review." Kathmandu University Journal of Science, Engineering and Technology 9 (11): 104–20.
67Investment prospectus for clean cooking solutions in Nepal
UNDP (United Nations Development Program). 2013. "Nepal Braces for Graduation from an LDC. "http://www.np.undp.org/content/nepal/en/home/operations/projects/poverty_reduction/snpc/nepal-braces-for-graduation-from-an-ldc.html.
UPPCL (Uttar Pradesh Power Corporation Ltd.). 2016. "Rate Schedule for 2015–16."
WHO (World Health Organization). 2002. "Indoor Air Pollution and Household Energy. "http://www.who.int/heli/risks/indoorair/indoorair/en/.
–––––.2008. A WHO Plan for Burn Prevention and Care. Geneva: WHO Press.
WHO (World Health Organization), 2009. "Country profiles of Environmental Burden of Disease." http://www.who.int/quantifying_ehimpacts/national/countryprofile/nepal.pdf?ua=1.
World Economic Forum. 2016. "Nepal: Performance Overview.".

68 A Roadmap to National Goal of Providing Clean Cooking Solutions for All

746 A Roadmap to National Goal of Providing Clean Cooking Solutions for All
► In the high-growth scenario, 22 percent of households will graduate to factory-produced ICS by 2030, many of them using cleaner stoves with forced air draft and even photovoltaic chargers. In situ ICS will account for 34 percent of households, and traditional cookstove use will be negligible.
In the high-growth scenario, the period 2017–2030 is divided into four phases, recognizing that the national goal of CCS4All and the goal of SE4All will be achieved with a gradual shift toward cleaner cooking fuel and technology in successive phases, with an increasing focus on “pull” from the market rather than “push” from the public sector. The key characteristics of the four phases are:
► Gestation phase (till 2017)—Preparatory phase. ► Market growth phase (2017–2023)—100 percent penetration of ICS in households using solid biomass. ICS
disseminated in the ratio of 60:40, in situ to factory-produced stoves. ► Market sustenance phase (2023–2027)—Market instruments crafted for driving competition in fuel sources and
cooking technologies, and a tighter focus on cleaner factory-produced ICS. More robust and sustainable supply chain of clean cooking solutions.
► Graduation phase (2027–2030)—Fully functional market-based business models. Graduation of households to clean technologies.
Nepal has huge market potential for clean cooking solutions and so are the opportunities for the government, development partners, private players, and consumers.
The government provides technical assistance, awareness raising, quality control, and subsidy support for promotion and dissemination of clean cooking solutions. It has set ambitious targets under its periodic plans with the aim of raising rural people’s living standards, protecting the environment, and developing commercially viable alternative energy industries.
International development partners aspire to alleviate poverty, safeguard the environment, and foster income growth among poor nations worldwide. To meet these goals, they create unique partnerships that help national governments to meet their long-terms goals.
Private players have high potential to add value to cookstove production and distribution, as well as capacity development and quality control. But despite this potential, private players are few.
The proposed initiatives will require heavy “impact investments” to allow market forces more leeway to operate, through a three-pronged strategy:
► Enhance demand by motivating potential consumers, developing cleaner and more efficient technologies, and offering consumer finance to enhance affordability and provide incentives for off-take such as results-based incentives and smart subsidies.
► Strengthen supply by attracting more finance and investment to domestic production or funding for imports, by enhancing market intelligence, and by creating inclusive value-chains and innovative distribution models for remote consumers.
► Foster an enabling environment by engaging national and local stakeholders, building the evidence base for the benefits of clean cookstoves and fuels, promoting international standards and rigorous testing protocols, and strengthening monitoring and evaluation.