Embed Size (px)
Citation preview
The Journal of Financial Research • Vol. III, No.3· Fall 1980
EFFICIENT PORTFOLIOS VERSUS EFFICIENT MARKET
James S. Ang*, Jess H. Chua", and Anand S. Desai***
One of the most important developments in modern investment theory is the efficient market hypothesis. Market efficiency refers to the speed with which information is rationally absorbed. Thus, statements about market efficiency are alwaysmade with respect to a particular set of information. Three information sets withrespect to which the market mayor may not be efficient have been defined, resultingin the weak, semi-strong, and strong form efficient market hypothesis. Weak formefficiency refers to efficiency with respect to past prices, semi-strong form to allpublicly available information, and strong form to all available information, publicor private. All three forms of the efficient market hypothesis have been tested byresearchers. For an excellent review see Fama [5].
Only the weak-form hypothesis is of concern in this paper. The study comparesthe performance of the market portfolio with those of portfolios that are mean-betaefficient on the basis of historical means and betas. The tests are important becausethey have implications for both the multi-security weak-form efficient markethypothesis and the construction of efficient portfolios.
It is unfortunate that the word "efficient" is used to convey very different concepts in portfolio theory and the efficient market hypothesis. What is even moreironic is that the two concepts are actually contradictory. If the market is truly efficient, it does not matter if efficient portfolios are derived with historical return andrisk measures, historical measures adjusted for other publicly or privately availableinformation, or completely subjective measures. The efficient portfolios cannot beexpected to consistently earn returns superior to that yielded by the market portfolio. On the other hand, if any of these portfolios can earn consistently superiorreturns, then the market cannot be efficient.
Although this paradox has not been addressed directly before, studies by Cohenand Pogue [3] and Frankfurter [8] do contain some relevant results. Cohen andPogue found that efficient portfolios outperformed random portfolios of 50securities. Frankfurter, on the other hand, found efficient portfolios to perform only as well as the market portfolio. Since Evans and Archer [4] have shown that random porfolios of the size used by Cohen and Pogue are essentially equivalent to themarket portfolio, the two sets of results are contradictory.
A problem with the results is that the tests were both conducted on a very limitednumber of securities and for only one time period. For example, althoughFrankfurter utilized a sample of 522 stocks to construct his efficient portfolios, heselected only one portfolio for comparison with the market portfolio, the portfoliobeing one with the risk equal to that of the market portfolio. When the efficientportfolio was found to be insignificantly different from the market portfolio, theconclusion was drawn that the efficient portfolios only perform as well as themarket portfolio. It should be remembered, of course, that the main purpose of
*Florida State University**The University of Calgary
"*The University of Michigan
309

310 The Journal of Financial Research
Frankfurter's paper was not to test the performance of efficient portfolios vis-a-visthe market portfolio.
If one discounts Frankfurter's results and looks only at Cohen and Pogue'sresults, he would then have to conclude that the market may actually not be multisecurity weak-form efficient. Obviously, only an examination with a more extensivesample of securities and covering more than one time period can resolve the issue.
As pointed out by Fama [5], weak-form tests have been mainly concerned with information in single securities. Accordingly, inferences about market efficiency canbe made only with regard to the set of information contained in past prices ofsecurities taken one at a time. No conclusion can be drawn with respect to the set ofsecurities taken all at once. This study tests the weak-form hypothesis with an information set containing historical means and betas. Since only historical returns areused to generate the means and betas, it is a weak-form test. Since the beta of a particular security is based on the historical relationship between the security and allothers in the market, multi-security information is used. Thus, this study may beseen as an addition to the very lean literature on multi-security market efficiency.
In Section I the empirical methodology is explained. Results are presented and interpreted in Section II. Conclusions are made in Section III.
I. Empirical Methodology
The procedure consisted of three steps. First, Sharpe efficient portfolios were constructed from the universe of NYSE stocks using data from several time periodsdesignated as construction periods. Second, the returns, means, betas of these efficient portfolios were computed in the evaluation period. Third, performances wereevaluated against the market portfolio.
Step 1: Construction of Efficient Portfolios
The basic data for the study were the dividend adjusted monthly security returnseries of the CRSP (Center for Research in Security Prices, University of Chicago)tape and the CRSP market value weighted index (see Fisher [7]). The period coveredin this study was January, 1926 to December, 1965. This corresponds to the periodused by Black, Jensen and Scholes [2] (BJS, hereafter). The interval was divided into21 subperiods consisting of the first 60 months, three 105-month subperiods, andseventeen 24-month subperiods. The return observations from each of thesesubperiods were used to generate efficient portfolios for each of the constructionperiods. All stocks with complete data for each construction period were included inthe population for that particular period. These stocks were considered even if theydid not have complete data for the subsequent evaluation period, thus avoiding asource of selection bias and imitating feasible investor behavior.
Using the Sharpe [15] model, a total of 1,395 portfolios was generated for the 21subperiods. The compositions of the efficient portfolios were, thus, obtained in thisstep.
Step 2: Computation of Returns in the Evaluation Periods
For each of the portfolios generated, the returns for the evaluation periods werecalculated. The evaluation periods were those immediately following the construe-
Efficient Portfolios vs Efficient Markets 311
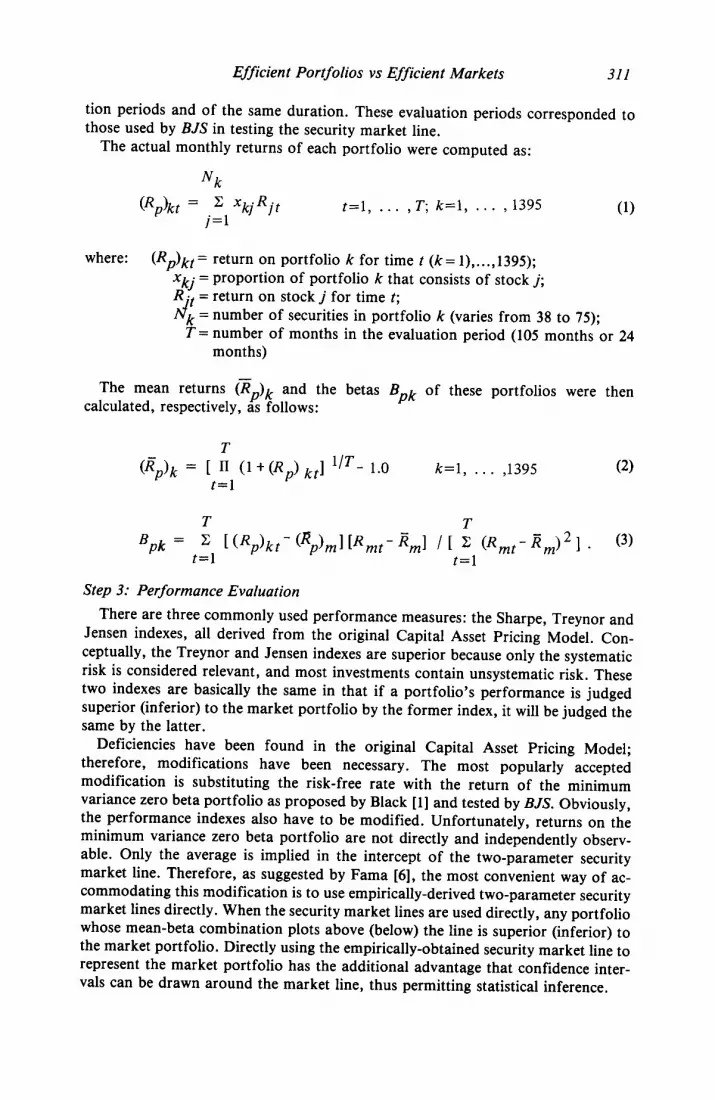
tion periods and of the same duration. These evaluation periods corresponded tothose used by BJS in testing the security market line.
The actual monthly returns of each portfolio were computed as:
N k
(Rp)kt = ~ xkjR j tj=l
t=l, ... ,T; k=l, . o. , 1395 (1)
where: (Rp)kt= return on portfolio k for time t (k= 1), ... ,1395);Xkj = proportion of portfolio k that consists of stock j;ROt= return on stock j for time t;Nk = number of securities in portfolio k (varies from 38 to 75);
T= number of months in the evaluation period (105 months or 24months)
The mean returns (Rp)k and the betas Bp k of these portfolios were thencalculated, respectively, as follows:
T(~)k = [II (1+(R p)kt] 1IT-1.0
t=lk=l, ., 0 ,1395 (2)
T TBpk = ~ [(Rp)kt-(Rp)m][Rmt-Rm] J[ ~ (R mt-R m)2]. (3)
t=l t=l
Step 3: Performance Evaluation
There are three commonly used performance measures: the Sharpe, Treynor andJensen indexes, all derived from the original Capital Asset Pricing Model. Conceptually, the Treynor and Jensen indexes are superior because only the systematicrisk is considered relevant, and most investments contain unsystematic risk. Thesetwo indexes are basically the same in that if a portfolio's performance is judgedsuperior (inferior) to the market portfolio by the former index, it will be judged thesame by the latter.
Deficiencies have been found in the original Capital Asset Pricing Model;therefore, modifications have been necessary. The most popularly acceptedmodification is substituting the risk-free rate with the return of the minimumvariance zero beta portfolio as proposed by Black [1] and tested by BJS. Obviously,the performance indexes also have to be modified. Unfortunately, returns on theminimum variance zero beta portfolio are not directly and independently observable. Only the average is implied in the intercept of the two-parameter securitymarket line. Therefore, as suggested by Fama [6], the most convenient way of accommodating this modification is to use empirically-derived two-parameter securitymarket lines directly. When the security market lines are used directly, any portfoliowhose mean-beta combination plots above (below) the line is superior (inferior) tothe market portfolio. Directly using the empirically-obtained security market line torepresent the market portfolio has the additional advantage that confidence intervals can be drawn around the market line, thus permitting statistical inference.

312 The Journal of Financial Research
The reader familiar with weak-form efficient market tests will note that the cor
rect comparison in a fair-game test should be between the test portfolios and the
buy-and-hold strategy. In this particular study the CRSP market portfolio is indeed
the buy-and-hold strategy since the opportunity set considered consisted of all the
stocks in the CRSP tape.The two-parameter security market lines used here are those obtained by BJS.
Confidence intervals equal to two times the reported standard errors of intercepts
were constructed. The confidence intervals should have been based on the standard
errors of regressions; however, this was not reported by BJS. Using the standard er
ror of the intercept understates the width of the confidence interval and biases the
results in favor of rejecting the efficiency hypothesis. Therefore, this inaccuracy
does not cause problems if the evidence obtained does not reject the hypothesis. Per
formance evaluation consisted of plotting the mean-beta combinations of the test
portfolios onto the security market line of the evaluation period.
Roll [13, 14]has shown that if the market proxy is ex post mean variance efficient,
then no superior or inferior performance can be found by the security market line. If
superior performance is found, however, it is always possible to find another market
proxy that will indicate inferior performance. In effect, Roll has shown that perfor
mance evaluations based on the security market line are ambiguous. Mayers and
Rice [11] have salvaged the use of the security market line for performance evalua
tion somewhat by arguing that, empirically, the market proxy is unlikely to be ex
post mean-variance efficient. Theoretically, they argue that if the security market
line depicts the experience of uninformed investors, and a particular investment con
sistently plots above the market line, then there is relative, if not absolute, superiori
ty. However, they have no answer to the question of highly correlated market prox
ies that could indicate contradictory evaluations. Therefore, there are still problems
with CAPM-based performance evaluations.
To circumvent the ambiguity problem, the second-degree stochastic dominance
(SSD) framework (Hadar and Russell [9], Hanoch and Levy [l0]) was used to com
pare the performances of the test portfolios with that of the market portfolio as
represented by the CRSP value-weighted index. Theoretically, this is not as proper a
test as the one with the CAPM. First, mean-variance efficiency is not equivalent to
stochastic dominance efficiency. Since the information set used contains only the
first two moments, it is unfair to require the portfolios based on it to perform better
than the market portfolio when all moments are taken into account. To this objec
tion we have recourse only to expediency for defense. Second, in the stochastic
dominance framework, the market portfolio does not dominate other portfolios. To
this objection, precedence in many studies of performances of mutual funds can be
noted (e.g. [12]). In fact, there is a better reason for using the market portfolio since
it is the buy-and-hold alternative.For an illustration of the procedure, refer to Table 1. The first sample used return
observations from the construction period (1/1926-12/1930) to obtain the composi
tions of 49 efficient portfolios. Then the returns, means, and betas of these port
folios were calculated for the evaluation period (1/1931-9/1939). The mean-beta
combinations calculated were then plotted on the security market line obtained by
BJS for the period (1/1931-9/1939). When a portfolio was above (below) the line
and outside the confidence interval, it was designated a superior (inferior) portfolio;

Efficient Portfolios vs Efficient Markets 313
TABLE 1. STEP I - Efficient Portfolio Generation
Size of No. ofSample Construction Evaluation Candidate Efficient
No. Period Period List Portfolios
1 11/1926 - 12/1930 1/1931 - 9/1939 375 492 1/1931 - 9/1939 10/1939 - 6/1948 545 443 10/1939 - 6/1948 7/1948 - 3/1957 710 754 7/1948 - 3/1957 4/1957 - 1211965 860 75
5 1/1930 - 12/1931 1/1932 - 12/1933 625 386 1/1932 - 1211933 1/1934 - 1211935 650 627 1/1934 - 1211935 1/1936 - 1211937 660 758 1/1936 - 1211937 1/1938 - 1211939 680 559 1/1938 - 12/1939 1/1940 - 12/1941 735 44
10 1/1940 - 1211941 1/1942 - 1211943 760 5411 1/1942 - 1211943 1/1944 - 12/1945 780 7512 1/1944 - 12/1945 1/1946 - 12/1947 790 7513 1/1946 - 1211947 1/1978 - 12/1949 840 7514 1/1948 - 1211949 1/1950 - 1211951 930 74
15 1/1950 - 1211951 1/1952 - 1211953 970 7516 1/1952 - 12/1953 1/1954 - 12/1955 1,000 7517 1/1954 - 12/1955 1/1956 - 12/1957 1,000 7518 1/1956 - 12/1957 1/1958 - 12/1959 1,000 7519 1/1958 - 1211959 1/1960 - 1211961 1,025 7520 1/1960 - 1211961 1/1962 - 1211963 1,025 7521 1/1%2 - 1211963 1/1964 - 1211965 1,065 75
otherwise its performance was deemed equal to that of the market. The stochasticdominance evaluations also used exactly the same time period partitions.
II. Results and Analysis
Table 1 shows the 21 subperiods for which efficient portfolios were constructedand evaluated. The opportunity set for each subperiod consisted of those stocks withcomplete monthly return data during the construction periods. Data availability onthe CRSP tape during the construction period was thus the only criterion for asecurity to be a member of the opportunity set. The opportunity set increased in themore recent years since complete return data were available for a greater number ofsecurities in these years than in the 30's and early 40's.
The first sample had a construction period of 60 months and an evaluation periodof 105 months. The second, third, and fourth samples had both construction andevaluation periods of 105 months. Samples 5 to 21 had construction and evaluationperiods of 24 months. As stated previously, the subperiods were chosen to make theevaluation periods coincide with the subperiods used by BJS in constructing theirmarket lines.
The portfolio generating algorithm was designed to produce a maximum of 75 efficient portfolios. The maximum was chosen after the observation that when morethan 75 efficient portfolios were constructed, many ofthe portfolios were redundantin that their compositions were almost the same. For certain samples (specifically 1,

314 The Journal of Financial Research
TABLE 2. Comparison of Portfolio Performance with BJS Lines
No. of Portfolios No. of PortfoliosAbove BJS Lines Below BJS Lines
Total No. Within Outside Within OutsideSample of ISO ISO ISO ISO
No. Portfolios Bond Bond Bond Bond
1 49 0 0 49 02 44 0 0 44 03 75 0 0 75 04 75 0 0 75 0
5 38 27 0 11 06 62 1 0 11 07 75 31 0 44 08 55 48 0 7 09 44 5 0 39 0
10 54 22 0 32 011 75 34 0 41 012 75 0 0 75 013 75 2 0 73 014 74 0 0 74 015 75 60 0 15 016 75 29 0 46 017 75 17 0 58 018 75 75 0 0 019 75 75 0 0 020 75 0 0 74 121 75 65 0 10 0
TOTAL 1,395 491 0 903
2, 5, 6, 8, 9, 10, and 14 in Table 1), less than 75 efficient portfolios were obtainedbecause of the interval used in partitioning the range of returns and betas.
A. Performance Evaluation With the BJS Lines
Table 1 shows the results of performance evaluation against the BJS lines. Of the1,395 portfolios compared, 1,394 lay within one standard error from the BJS lines.One was outside the one standard error interval, but well within the two standard error interval. Thus, the results overwhelmingly show that the efficient portfolios performed ony as well as the market portfolios.
If the confidence intervals around the BJS lines are neglected, the results showthat almost twice as many portfolios lay below the BJS lines as above (905 versus491) implying that utilizing the information set does not result in superior performances, at least not on any consistent basis. In addition, it was found that portfolioswhich were above the market lines could not be identified a priori on the basis ofmeans or betas. Therefore, there is no way for one to invest only in the "superior"efficient portfolios. If one invests in all the efficient portfolios, then two-thirds ofthe investment will underperform the market and only one-third will outperform themarket.

Efficient Portfolios vs Efficient Markets 315
TABLE 3. Comparison of Portfolio Performance: Stochastic Dominance Test
STOCHASTIC DOMINANCE TEST
Performance Total No. Portfolio Portfolio PortfolioSample Evaluation of > <
No. Period Portfolios Market Market Market
I 1131 - 9/39 49 24 20 52 10/39 - 6/48 44 16 12 163 7/48- 3/57 75 61 13 14 4/57 - 12/65 75 0 3 72
5 1132 - 12/33 38 30 8 06 1134 - 12/35 62 24 15 237 1/36 - 12/37 75 8 0 678 1138 - 12/39 55 44 5 69 1140 - 12/41 44 25 5 14
10 1142 - 12/43 54 47 0 7
11 1144 - 12/45 75 75 0 012 1146 - 12/47 75 0 0 7513 1148 - 12/49 75 75 0 014 1150 - 12/51 74 0 0 7415 1152 - 12/53 75 0 5 7016 1/54 - 12/55 75 0 0 7517 1156 - 12/57 75 0 7 6818 1158 - 12/59 75 63 7 519 1160 - 12/61 75 66 9 020 1/62 - 12/63 75 0 0 7521 1164 - 12/65 75 75 0 0
TOTAL 1,395 633 109 653
Again, if the statistical insignificance of the "superior" and "inferior" performances is neglected, the results would show that in each one of the four lO5-monthsubperiods the efficient portfolios underperformed the market. For the 24-monthsubperiods greater than half the efficient portfolios outperformed the market in only six out of seventeen subperiods. This is no evidence to prove any superiority of theefficient portfolios. Furthermore, the fact that 24-month evaluations showed betterresults than the I05-month evaluations could indicate the transiency of even thestatistically insignificant "superiority." Since, by the present criterion, the efficientportfolios clearly did not outperform the market portfolio, it was found unnecessaryto evaluate the performances of the portfolios in subperiods following the evaluation periods.
B. Performance Evaluation With the SSD Framework
Table 3 shows the results when the performances of the 1,395 efficient portfolioswere evaluated against the CRSPvalue-weighted index used as a proxy of the marketportfolio. The evaluation periods used for the previous tests were also used here.
Overall, the results agree with the CAPM-based tests. The performances of efficient portfolios vis-a-vis the market portfolio question the usefulness of the infor-

316 The Journal of Financial Research
TABLE 4. Comparison of Portfolio Performance: Stocbastic Dominance Test Second EvaluationPeriod
STOCHASTIC DOMINANCE TEST
Performance Total No. Portfolio Portfolio PortfolioSample Evaluation of > <
No. Period Portfolios Market Market Market
I 10/39 - 6/48 49 8 19 222 7/48- 3/57 44 0 12 323 4/57 - 12165 75 69 I 54 4/66 - 9/74 75 47 6 22
5 1/34 - 12135 38 34 0 46 1/36 - 12137 62 44 12 67 1/38 - 12139 75 5 61 98 1/40 - 12141 55 44 2 99 1/42 - 12143 44 1 0 43
10 1/44 - 12145 54 26 3 2511 1/46 - 12147 75 0 1 7412 1/52 - 12153 74 1 5 2613 1/50 - 12/51 75 0 1 7414 1/52 - 12153 74 1 1 7215 1/54 - 12155 75 53 2 2016 1/56 - 12157 75 75 0 017 1/58 - 12159 75 53 0 2218 1/60 - 12161 75 73 0 219 1/62 - 12/63 75 0 0 7520 1/64 - 12165 75 45 9 2121 1/66 - 12167 75 15 3 57
TOTAL 1,395 637 138 620
mation set in attaining performances consistently superior to that of the marketportfolio.
Of the 1,395 efficient portfolios tested, 633 were found by the SSD framework toperform better than the market, 109 to perform as well as the market, and 653 toperform worse. Therefore, slightly less than half (43.3070) outperformed the marketportfolio in their respective periods. Such a division of number between superiorand inferior performance is well within the range of errors when comparing randomsamples with equivalent properties. If the evaluation periods within which morethan half the efficient portfolios outperformed the market are counted, the resultsare similar. One (sample No.3) of four 105-month periods and nine (sample Nos. 5,8,9, 10, 11, 13, 18, 19, and 21) of seventeen 24-month periods showed this tendency.The presence of the 633 "superior" portfolios must be further discounted becausethere is no test for the statistical significance of the superiority. Further, there is noway of identifying a priori the portfolios that would outperform or underperformthe market portfolio either through the means or the betas.
To examine these portfolios further, their performances in respective secondevaluation periods were compared with the corresponding market returns. If, again,about half seem to outperform the market and the other half seem to underperform,
Efficient Portfolios vs Efficient Markets 317
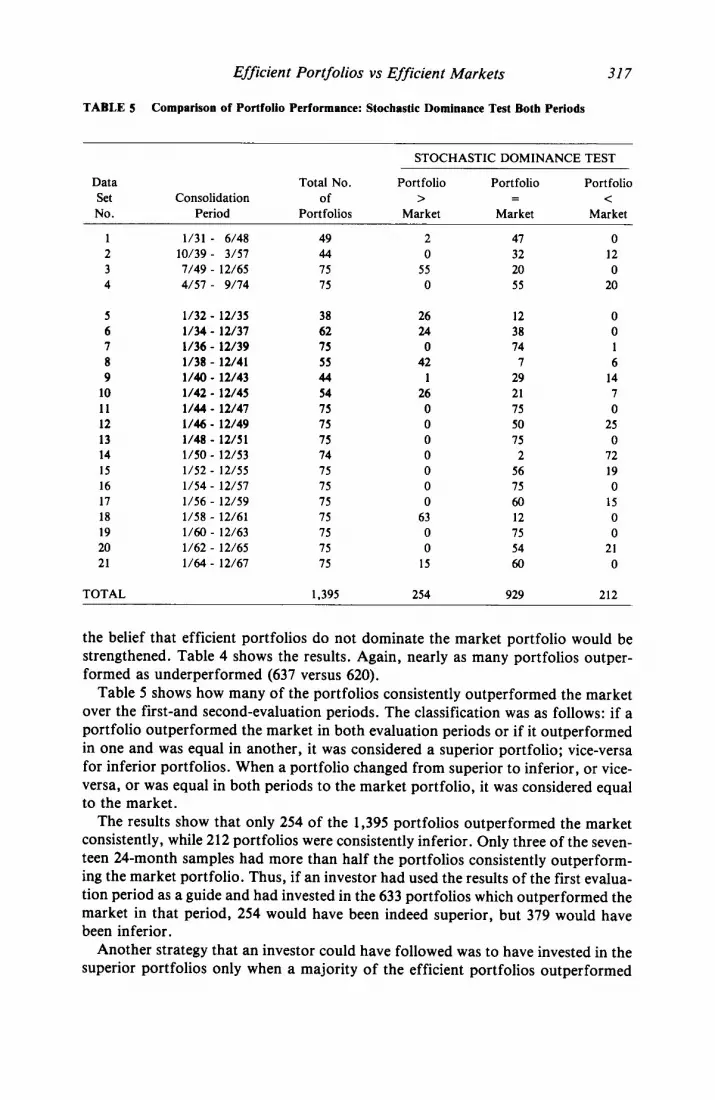
TABLE 5 Comparison of Portfolio Performance: Stochastic Dominance Test Both Periods
STOCHASTIC DOMINANCE TEST
Data Total No. Portfolio Portfolio PortfolioSet Consolidation of > <No. Period Portfolios Market Market Market
1 1/31 - 6/48 49 2 47 02 10/39 - 3/57 44 0 32 123 7/49 - 12/65 75 55 20 04 4157 - 9/74 75 0 55 20
5 1/32 - 12135 38 26 12 06 1/34 - 12/37 62 24 38 07 1136 - 12/39 75 0 74 18 1138 - 12/41 55 42 7 69 1140 - 12143 44 1 29 14
10 1/42 - 12/45 54 26 21 7II 1144 - 12/47 75 0 75 012 1146 - 12149 75 0 50 2513 1/48 - 12151 75 0 75 014 1/50 - 12153 74 0 2 7215 1/52 - 12155 75 0 56 1916 1/54 - 12/57 75 0 75 017 1/56 - 12159 75 0 60 1518 1/58 - 12161 75 63 12 019 1/60 - 12163 75 0 75 020 1/62 - 12165 75 0 54 2121 1/64 - 12167 75 15 60 0
TOTAL 1,395 254 929 212
the belief that efficient portfolios do not dominate the market portfolio would bestrengthened. Table 4 shows the results. Again, nearly as many portfolios outperformed as underperformed (637 versus 620).
Table 5 shows how many of the portfolios consistently outperformed the marketover the first-and second-evaluation periods. The classification was as follows: if aportfolio outperformed the market in both evaluation periods or if it outperformedin one and was equal in another, it was considered a superior portfolio; vice-versafor inferior portfolios. When a portfolio changed from superior to inferior, or viceversa, or was equal in both periods to the market portfolio, it was considered equalto the market.
The results show that only 254 of the 1,395 portfolios outperformed the marketconsistently, while 212 portfolios were consistently inferior. Only three of the seventeen 24-month samples had more than half the portfolios consistently outperforming the market portfolio. Thus, if an investor had used the results of the first evaluation period as a guide and had invested in the 633 portfolios which outperformed themarket in that period, 254 would have been indeed superior, but 379 would havebeen inferior.
Another strategy that an investor could have followed was to have invested in thesuperior portfolios only when a majority of the efficient portfolios outperformed

318 The Journal of Financial Research
the market. This strategy would have worked with one of the three 105-monthsamples. Of the 61 superior portfolios in sample No.3, 55 remained superior in thesubsequent subperiod. However, when the 24-month samples are examined, only infour (Nos. 5, 8, 10, and 18) of the nine subperiods would an investor have outperformed the market. In the others he would have fared worse than the market.
One may, therefore, conclude that the evidence from using the SSD frameworksupports the evidence from the previous tests using the BJS lines. The paradox between the efficient market hypothesis and efficient portfolios based on historicalmeans and betas should be resolved in favor of the efficient market hypothesis.
I1I.Summary and Conclusions
This study provides the results of two extensive tests to resolve the paradox that amulti-security efficient market may make futile efforts to construct efficient portfolios other than the market portfolio. 1,395 efficient portfolios for 21 subperiodsfrom January, 1926 to December, 1965 were constructed. These portfolios were notfound to outperform or underperform the market represented by the Black-JensenScholes market lines. The second-degree stochastic dominance tests also indicatedno consistently superior performance by these efficient portfolios. The results, in effect, show that the market has already used the information set incorporated in thisstudy in its pricing of securities. Therefore, one may conclude that the evidence doesnot reject the multi-security weak-form efficient market hypothesis.
REFERENCES
1. F. Black, "Capital Market Equilibrium with Restricted Borrowing," Journal of Business (July1972), 444-454.
2. F. Black, M.C. Jensen, and M. Scholes, "The Capital Asset Pricing Model: Some EmpiricalTests," in M.C. Jensen (ed.) Studies in the Theory ofCapital Markets (New York, Praeger), 1972,79-121.
3. K.J. Cohen, and J.A. Pogue, "An Empirical Evaluation of Alternative Portfolio SelectionModels," Journal of Business (April 1967), 166-193.
4. J.H. Evans and S.H. Archer, "Diversification and the Reduction of Dispersion: An EmpiricalAnalysis," Journal of Finance (December 1968), 761-767.
5. E.F. Fama, 'Efficient Capital Markets: A Review of Theory and Empirical Work," Journal ofFinance (May 1970), 383-417.
6. E.F. Fama, "Components of Investment Performance," Journal of Finance (June, 1972),551-568.
7. L. Fisher, "Some New Stock Market Indexes," Journal of Business (January 1966), 191-225.8. a.M. Frankfurter, "The Effect of 'Market Indexes' on the Ex Post Performance of the Sharpe
Portfolio Selection Model," Journal of Finance (June 1976), 949-955.9. J. Hadar and W. Russell, "Rules for Ordering Uncertain Prospects," American Economic Review
(March 1969), 25-34.10. a. Hanoch and H. Levy, "The Efficiency Analysis of Choices Involving Risk," Review of
Economic Studies (July 1969), 335-346.11. D. Mayers and E.M. Rice, "Measuring Portfolio Performance and the Empirical Content of
Asset Pricing Models," Journal of Financial Economics (May 1979), 3-28.12. J. Meyer, "Further Applications of Stochastic Dominance to Mutual Fund Performance," Jour
nal of Financial and Quantitative Analysis (June 1977), 235-242.13. R. Roll, "A Critique of the Asset Pricing Theory's Tests," Journal of Financial Economics
(March 1977), 129-176.

Efficient Portfolios vs Efficient Markets 319
14. R. Roll, "Ambiguity When Performance is Measured by the Securities Market Line," Journal ofFinance (September 1978), 1051-1069.
15. W. Sharpe, "A Simplified Model for Portfolio Analysis," Management Science (January 1963),277-293.