Embed Size (px)
Citation preview
Materials 2020, 13, 2492; doi:10.3390/ma13112492 www.mdpi.com/journal/materials
Article
Elastic Critical Moment for the Lateral–Torsional
Buckling (LTB) Analysis of Structural Glass Beams
with Discrete Mechanical Lateral Restraints
Dario Santo, Silvana Mattei and Chiara Bedon*
Department of Engineering and Architecture, University of Trieste, 34127 Trieste, Italy;
[email protected] (D.S.); [email protected] (S.M.)
* Correspondence: [email protected] (C.B.); Tel.: +39-040-558-3837
Received: 30 April 2020; Accepted: 27 May 2020; Published: 29 May 2020
Abstract: Structural glass beams and fins are largely used in buildings, in the form of primary load-
bearing members and bracing systems for roof or facade panels. Several loading and boundary
conditions can be efficiently solved by means of bonded composites that involve the use of
laminated glass sections. Additionally, the so-obtained glass members are often characterized by
high slenderness. To this aim, several literature studies were dedicated to the lateral–torsional
buckling (LTB) behavior of laterally unrestrained (LU) glass elements, with the support of full-scale
experiments, analytical models, or finite element (FE) numerical investigations. Standardized
design recommendations for LU glass members in LTB are available for designers. However, several
design issues still require “ad hoc” (and often expensive) calculation studies. In most of the cases,
for example, the mechanical interaction between the structural components to verify involves
various typologies of joints, including continuous sealant connections, mechanical point fixings, or
hybrid solutions. As a result, an accurate estimation of the theoretical LTB critical moment for such
a kind of laterally restrained (LR) element represents a first key issue toward the definition and
calibration of generalized design recommendations. Careful consideration should be spent for the
description of the intrinsic features of materials in use, as well as for a combination of geometrical
and mechanical aspects (i.e., geometry, number, position of restraints, etc.). In this paper, the
attention is focused on the calculation of the elastic critical buckling moment of LR glass beams in
LTB. Existing analytical approaches of the literature (mostly developed for steel constructional
members) are briefly recalled. An additional advantage for extended parametric calculations is then
taken from finite element (FE) numerical analyses, which are performed via the LTBeam or the
ABAQUS software codes. The actual role and the effect of discrete mechanical restraints are, thus,
explored for selected configurations of practical interest. Finally, the reliability of simplified
calculation approaches is assessed.
Keywords: structural glass beams; laminated glass sections; lateral–torsional buckling (LTB);
discrete mechanical lateral restraints; analytical methods; finite element (FE) numerical modeling;
design
1. Introduction and State of the Art
Structural glass is largely used in building, in the form of load-bearing components [1]. While
harmonized European standards for structural designs are still in preparation [2-4], the last few years
showed a huge spread of technical guidelines, codes of practice, and documents in support of
designers [5–7].
For structural applications, glass members are typically characterized by a laminated resisting
cross-section, in which viscoelastic bonding interlayers are required to offer a certain mechanical
Materials 2020, 13, 2492 2 of 27
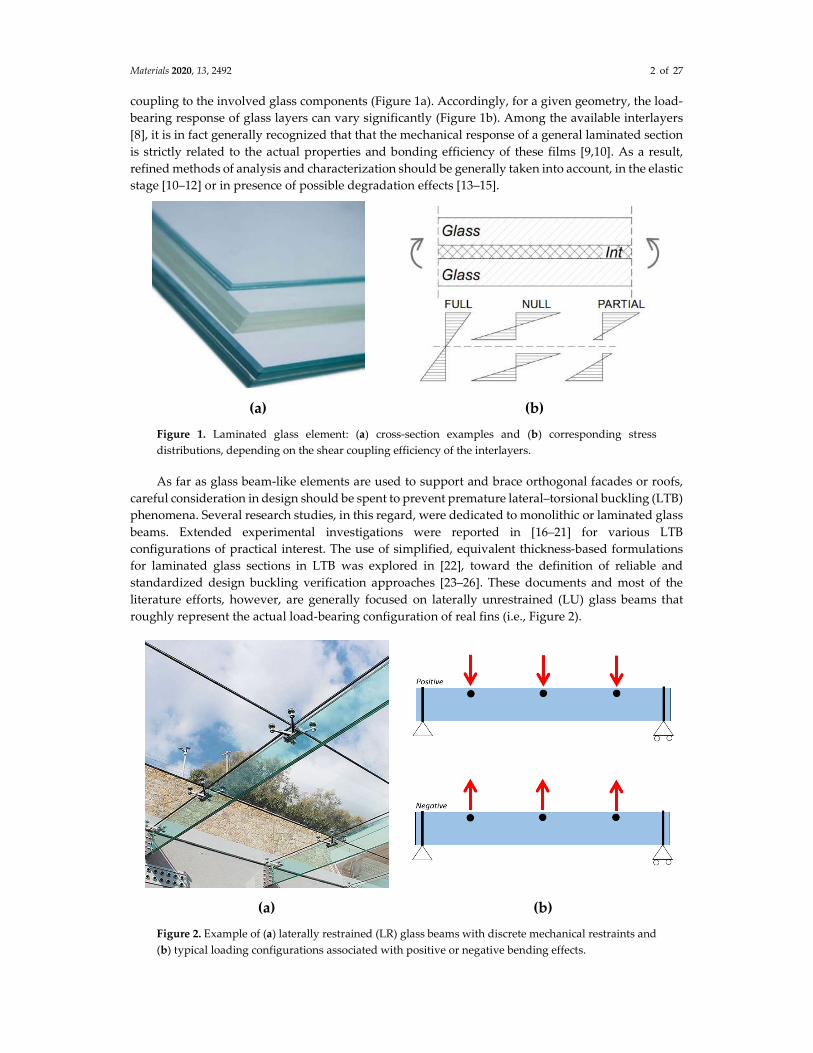
coupling to the involved glass components (Figure 1a). Accordingly, for a given geometry, the load-
bearing response of glass layers can vary significantly (Figure 1b). Among the available interlayers
[8], it is in fact generally recognized that that the mechanical response of a general laminated section
is strictly related to the actual properties and bonding efficiency of these films [9,10]. As a result,
refined methods of analysis and characterization should be generally taken into account, in the elastic
stage [10–12] or in presence of possible degradation effects [13–15].
(a) (b)
Figure 1. Laminated glass element: (a) cross-section examples and (b) corresponding stress
distributions, depending on the shear coupling efficiency of the interlayers.
As far as glass beam-like elements are used to support and brace orthogonal facades or roofs,
careful consideration in design should be spent to prevent premature lateral–torsional buckling (LTB)
phenomena. Several research studies, in this regard, were dedicated to monolithic or laminated glass
beams. Extended experimental investigations were reported in [16–21] for various LTB
configurations of practical interest. The use of simplified, equivalent thickness-based formulations
for laminated glass sections in LTB was explored in [22], toward the definition of reliable and
standardized design buckling verification approaches [23–26]. These documents and most of the
literature efforts, however, are generally focused on laterally unrestrained (LU) glass beams that
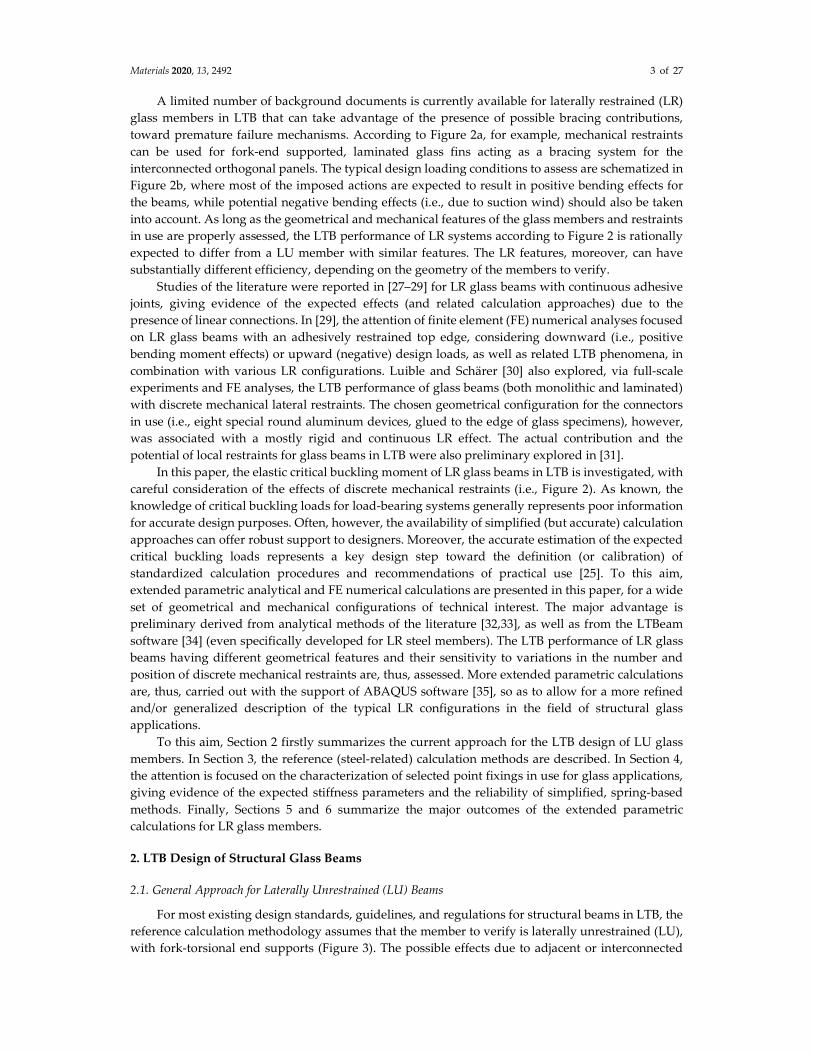
roughly represent the actual load-bearing configuration of real fins (i.e., Figure 2).
(a) (b)
Figure 2. Example of (a) laterally restrained (LR) glass beams with discrete mechanical restraints and
(b) typical loading configurations associated with positive or negative bending effects.
Materials 2020, 13, 2492 3 of 27
A limited number of background documents is currently available for laterally restrained (LR)
glass members in LTB that can take advantage of the presence of possible bracing contributions,
toward premature failure mechanisms. According to Figure 2a, for example, mechanical restraints
can be used for fork-end supported, laminated glass fins acting as a bracing system for the
interconnected orthogonal panels. The typical design loading conditions to assess are schematized in
Figure 2b, where most of the imposed actions are expected to result in positive bending effects for
the beams, while potential negative bending effects (i.e., due to suction wind) should also be taken
into account. As long as the geometrical and mechanical features of the glass members and restraints
in use are properly assessed, the LTB performance of LR systems according to Figure 2 is rationally
expected to differ from a LU member with similar features. The LR features, moreover, can have
substantially different efficiency, depending on the geometry of the members to verify.
Studies of the literature were reported in [27–29] for LR glass beams with continuous adhesive
joints, giving evidence of the expected effects (and related calculation approaches) due to the
presence of linear connections. In [29], the attention of finite element (FE) numerical analyses focused
on LR glass beams with an adhesively restrained top edge, considering downward (i.e., positive
bending moment effects) or upward (negative) design loads, as well as related LTB phenomena, in
combination with various LR configurations. Luible and Schärer [30] also explored, via full-scale
experiments and FE analyses, the LTB performance of glass beams (both monolithic and laminated)
with discrete mechanical lateral restraints. The chosen geometrical configuration for the connectors
in use (i.e., eight special round aluminum devices, glued to the edge of glass specimens), however,
was associated with a mostly rigid and continuous LR effect. The actual contribution and the
potential of local restraints for glass beams in LTB were also preliminary explored in [31].
In this paper, the elastic critical buckling moment of LR glass beams in LTB is investigated, with
careful consideration of the effects of discrete mechanical restraints (i.e., Figure 2). As known, the
knowledge of critical buckling loads for load-bearing systems generally represents poor information
for accurate design purposes. Often, however, the availability of simplified (but accurate) calculation
approaches can offer robust support to designers. Moreover, the accurate estimation of the expected
critical buckling loads represents a key design step toward the definition (or calibration) of
standardized calculation procedures and recommendations of practical use [25]. To this aim,
extended parametric analytical and FE numerical calculations are presented in this paper, for a wide
set of geometrical and mechanical configurations of technical interest. The major advantage is
preliminary derived from analytical methods of the literature [32,33], as well as from the LTBeam
software [34] (even specifically developed for LR steel members). The LTB performance of LR glass
beams having different geometrical features and their sensitivity to variations in the number and
position of discrete mechanical restraints are, thus, assessed. More extended parametric calculations
are, thus, carried out with the support of ABAQUS software [35], so as to allow for a more refined
and/or generalized description of the typical LR configurations in the field of structural glass
applications.
To this aim, Section 2 firstly summarizes the current approach for the LTB design of LU glass
members. In Section 3, the reference (steel-related) calculation methods are described. In Section 4,
the attention is focused on the characterization of selected point fixings in use for glass applications,
giving evidence of the expected stiffness parameters and the reliability of simplified, spring-based
methods. Finally, Sections 5 and 6 summarize the major outcomes of the extended parametric
calculations for LR glass members.
2. LTB Design of Structural Glass Beams
2.1. General Approach for Laterally Unrestrained (LU) Beams
For most existing design standards, guidelines, and regulations for structural beams in LTB, the
reference calculation methodology assumes that the member to verify is laterally unrestrained (LU),
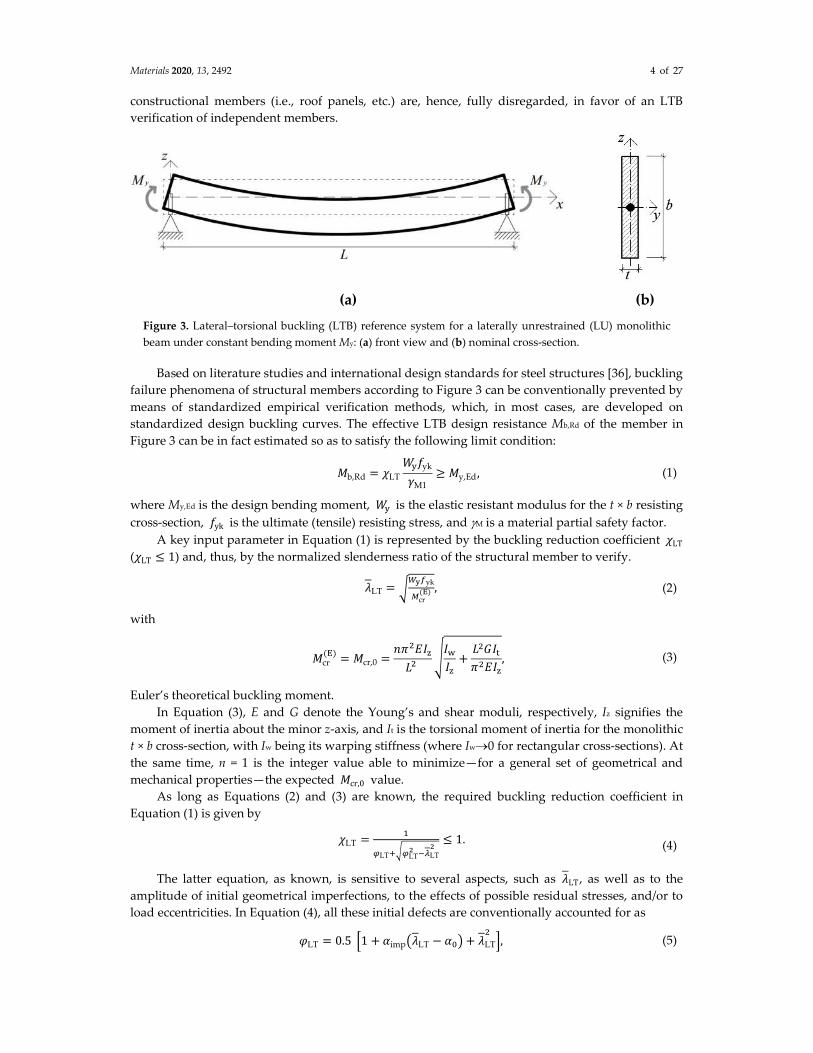
with fork-torsional end supports (Figure 3). The possible effects due to adjacent or interconnected
Materials 2020, 13, 2492 4 of 27
constructional members (i.e., roof panels, etc.) are, hence, fully disregarded, in favor of an LTB
verification of independent members.
(a)
(b)
Figure 3. Lateral–torsional buckling (LTB) reference system for a laterally unrestrained (LU) monolithic
beam under constant bending moment My: (a) front view and (b) nominal cross-section.
Based on literature studies and international design standards for steel structures [36], buckling
failure phenomena of structural members according to Figure 3 can be conventionally prevented by
means of standardized empirical verification methods, which, in most cases, are developed on
standardized design buckling curves. The effective LTB design resistance Mb,Rd of the member in
Figure 3 can be in fact estimated so as to satisfy the following limit condition:
�b,Rd = �LT
���yk
�M1
≥ �y,Ed, (1)
where My,Ed is the design bending moment, �� is the elastic resistant modulus for the t × b resisting
cross-section, �yk is the ultimate (tensile) resisting stress, and M is a material partial safety factor.
A key input parameter in Equation (1) is represented by the buckling reduction coefficient �LT
(�LT ≤ 1) and, thus, by the normalized slenderness ratio of the structural member to verify.
�LT = ����yk
�cr(�) , (2)
with
�cr(�)
= �cr,0 =������
�� ���
��
+�����
�����
, (3)
Euler’s theoretical buckling moment.
In Equation (3), E and G denote the Young’s and shear moduli, respectively, Iz signifies the
moment of inertia about the minor z-axis, and It is the torsional moment of inertia for the monolithic
t × b cross-section, with Iw being its warping stiffness (where Iw0 for rectangular cross-sections). At
the same time, n = 1 is the integer value able to minimize—for a general set of geometrical and
mechanical properties—the expected �cr,0 value.
As long as Equations (2) and (3) are known, the required buckling reduction coefficient in
Equation (1) is given by
�LT =�
�LT���LT� ��LT
�≤ 1. (4)
The latter equation, as known, is sensitive to several aspects, such as �LT, as well as to the
amplitude of initial geometrical imperfections, to the effects of possible residual stresses, and/or to
load eccentricities. In Equation (4), all these initial defects are conventionally accounted for as
�LT = 0.5 �1 + �imp��LT − ��� + �LT
��, (5)
Materials 2020, 13, 2492 5 of 27
where imp and 0 are appropriate imperfection factors (see [36] for the reference values in use for
steel sections).
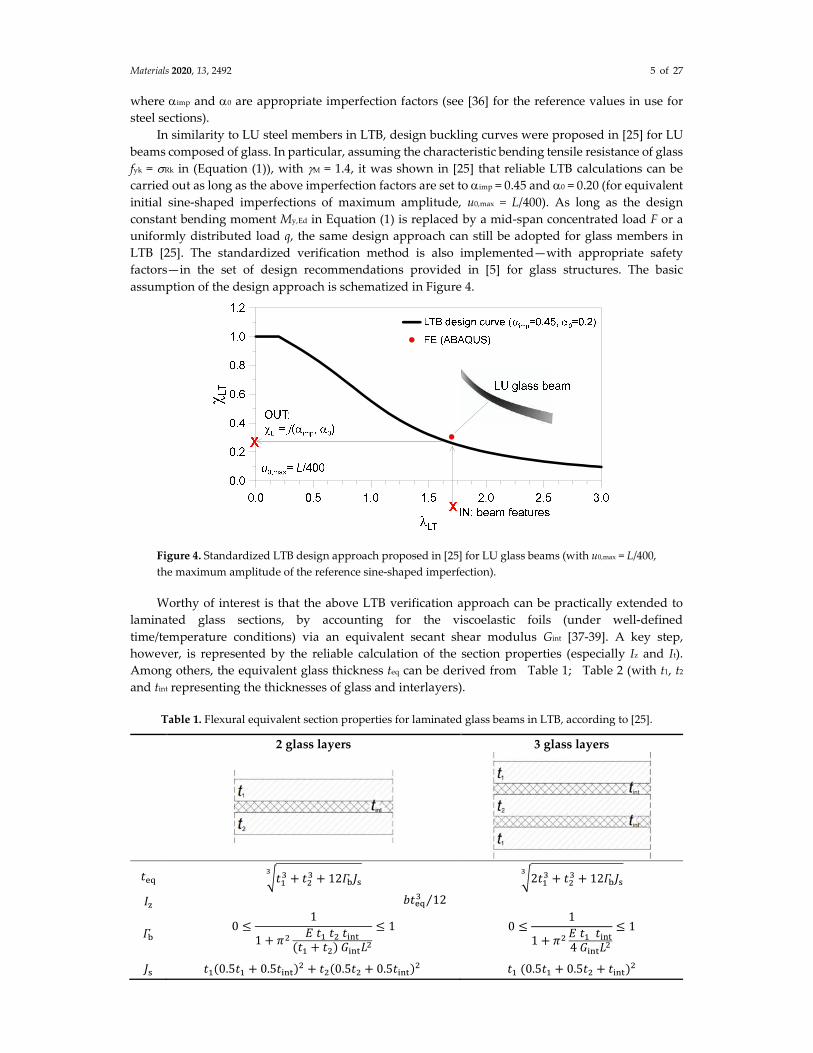
In similarity to LU steel members in LTB, design buckling curves were proposed in [25] for LU
beams composed of glass. In particular, assuming the characteristic bending tensile resistance of glass
fyk = Rk in (Equation (1)), with M = 1.4, it was shown in [25] that reliable LTB calculations can be
carried out as long as the above imperfection factors are set to imp = 0.45 and 0 = 0.20 (for equivalent
initial sine-shaped imperfections of maximum amplitude, u0,max = L/400). As long as the design
constant bending moment My,Ed in Equation (1) is replaced by a mid-span concentrated load F or a
uniformly distributed load q, the same design approach can still be adopted for glass members in
LTB [25]. The standardized verification method is also implemented—with appropriate safety
factors—in the set of design recommendations provided in [5] for glass structures. The basic
assumption of the design approach is schematized in Figure 4.
Figure 4. Standardized LTB design approach proposed in [25] for LU glass beams (with u0,max = L/400,
the maximum amplitude of the reference sine-shaped imperfection).
Worthy of interest is that the above LTB verification approach can be practically extended to
laminated glass sections, by accounting for the viscoelastic foils (under well-defined
time/temperature conditions) via an equivalent secant shear modulus Gint [37-39]. A key step,
however, is represented by the reliable calculation of the section properties (especially Iz and It).
Among others, the equivalent glass thickness teq can be derived from Table 1; Table 2 (with t1, t2
and tint representing the thicknesses of glass and interlayers).
Table 1. Flexural equivalent section properties for laminated glass beams in LTB, according to [25].
2 glass layers 3 glass layers
��� ���� + ��
� + 12����
� �2��
� + ��� + 12����
�
�� ����� 12⁄
�� 0 ≤
1
1 + �� � �� �� ����
(�� + ��) ������
≤ 1 0 ≤1
1 + �� � �� ����
4 ������
≤ 1
�� ��(0.5�� + 0.5����)� + ��(0.5�� + 0.5����)� �� (0.5�� + 0.5�� + ����)�
Materials 2020, 13, 2492 6 of 27
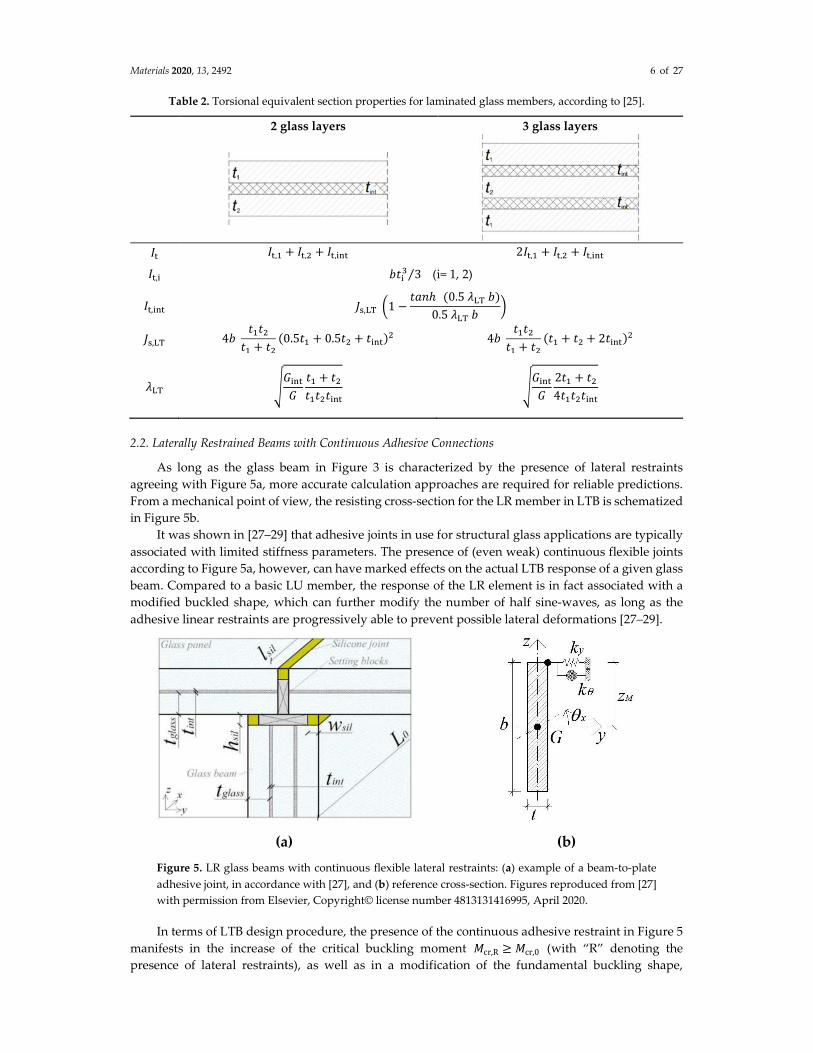
Table 2. Torsional equivalent section properties for laminated glass members, according to [25].
2 glass layers 3 glass layers
�� ��,� + ��,� + ��,��� 2��,� + ��,� + ��,���
��,� ���� 3⁄ (i= 1, 2)
��,��� ��,�� �1 −���ℎ (0.5 ��� �)
0.5 ��� ��
��,�� 4� ����
�� + ��
(0.5�� + 0.5�� + ����)� 4� ����
�� + ��
(�� + �� + 2����)�
��� �����
�
�� + ��
��������
�����
�
2�� + ��
4��������
2.2. Laterally Restrained Beams with Continuous Adhesive Connections
As long as the glass beam in Figure 3 is characterized by the presence of lateral restraints
agreeing with Figure 5a, more accurate calculation approaches are required for reliable predictions.
From a mechanical point of view, the resisting cross-section for the LR member in LTB is schematized
in Figure 5b.
It was shown in [27–29] that adhesive joints in use for structural glass applications are typically
associated with limited stiffness parameters. The presence of (even weak) continuous flexible joints
according to Figure 5a, however, can have marked effects on the actual LTB response of a given glass
beam. Compared to a basic LU member, the response of the LR element is in fact associated with a
modified buckled shape, which can further modify the number of half sine-waves, as long as the
adhesive linear restraints are progressively able to prevent possible lateral deformations [27–29].
(a) (b)
Figure 5. LR glass beams with continuous flexible lateral restraints: (a) example of a beam-to-plate
adhesive joint, in accordance with [27], and (b) reference cross-section. Figures reproduced from [27]
with permission from Elsevier, Copyright© license number 4813131416995, April 2020.
In terms of LTB design procedure, the presence of the continuous adhesive restraint in Figure 5
manifests in the increase of the critical buckling moment �cr,R ≥ �cr,0 (with “R” denoting the
presence of lateral restraints), as well as in a modification of the fundamental buckling shape,
Materials 2020, 13, 2492 7 of 27
compared to Figure 4. Given the shear stiffness contribution ky of the linear restraint (with k= 0), it
was, thus, proven in [27] that �cr,R for a general cross-section can be reliably calculated as
�cr,R = ���� ��
����
�
+ ����� ����
���
�
+ �� ��
����
�
� ���� ����
��
�
+ ��� + ��� �� �
�
����
�
�, (6)
where nR 1 is the integer number of half-sine waves able to minimize Equation (6), while zM is the
distance between the lateral restraint and the longitudinal axis of the beam (Figure 5b).
It is important to note that, as long as Mcr,R is modified in Equation (6), the normalized
slenderness ratio �LT in Equation (2) is also modified. Accordingly, the susceptibility of a given LR
glass member to LTB phenomena (i.e., Equation (4)) can be reasonably different from that of an
identical LU geometry. In any case, it was shown in [27] that Equations (1)–(5) and Figure 4 can be
still adopted for LTB design purposes, as long as the actual Mcr,R value is properly estimated
(Equation (6)) and possible global imperfections for the element to verify do not exceed the reference
equivalent amplitude (u0,max = L0/400).
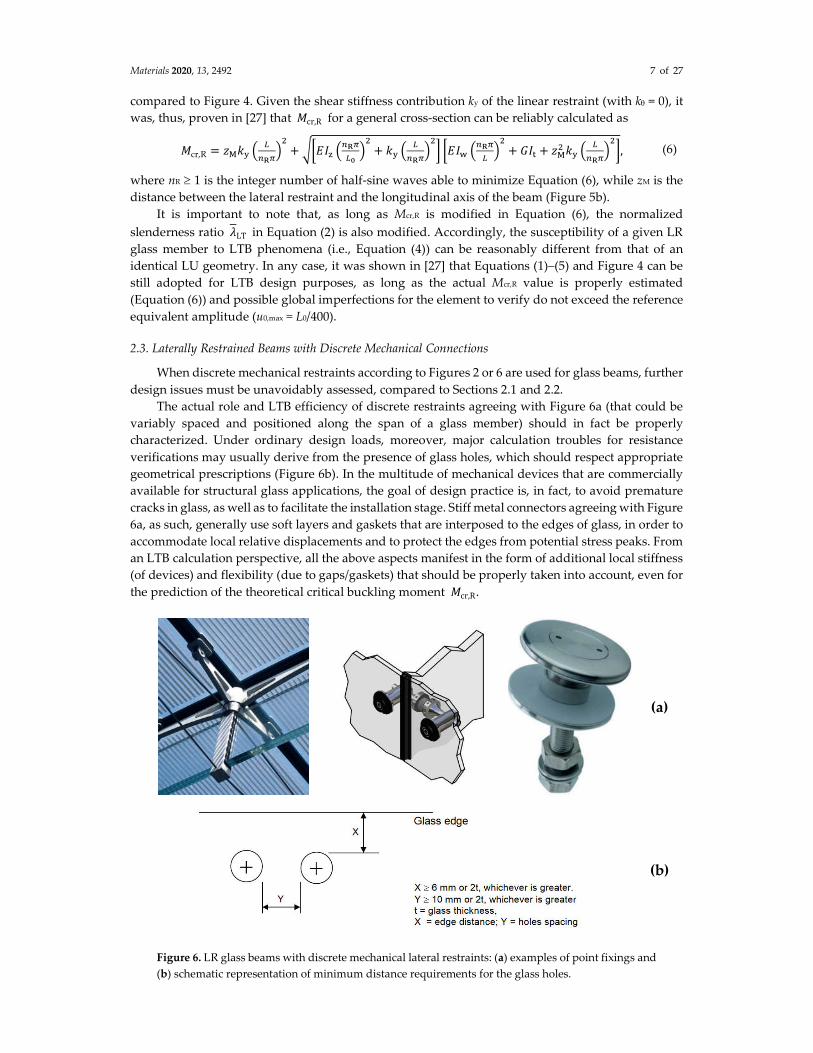
2.3. Laterally Restrained Beams with Discrete Mechanical Connections
When discrete mechanical restraints according to Figures 2 or 6 are used for glass beams, further
design issues must be unavoidably assessed, compared to Sections 2.1 and 2.2.
The actual role and LTB efficiency of discrete restraints agreeing with Figure 6a (that could be
variably spaced and positioned along the span of a glass member) should in fact be properly
characterized. Under ordinary design loads, moreover, major calculation troubles for resistance
verifications may usually derive from the presence of glass holes, which should respect appropriate
geometrical prescriptions (Figure 6b). In the multitude of mechanical devices that are commercially
available for structural glass applications, the goal of design practice is, in fact, to avoid premature
cracks in glass, as well as to facilitate the installation stage. Stiff metal connectors agreeing with Figure
6a, as such, generally use soft layers and gaskets that are interposed to the edges of glass, in order to
accommodate local relative displacements and to protect the edges from potential stress peaks. From
an LTB calculation perspective, all the above aspects manifest in the form of additional local stiffness
(of devices) and flexibility (due to gaps/gaskets) that should be properly taken into account, even for
the prediction of the theoretical critical buckling moment �cr,R.
(a)
(b)
Figure 6. LR glass beams with discrete mechanical lateral restraints: (a) examples of point fixings and
(b) schematic representation of minimum distance requirements for the glass holes.
Materials 2020, 13, 2492 8 of 27
3. LTB Theoretical Background and Solving Methods for LR beams with Discrete Mechanical
Restraints
In the last few decades, several research projects focused on the LTB analysis of (non-glass) load-
bearing members with discrete mechanical restraints. Most efforts were specifically aimed at steel
load-bearing systems, offering accurate theoretical formulations and simplified analytical approaches
in support of designers [32, 33, 40-42]. A brief overview of suitable methods is proposed in this
section.
Among the available calculation tools that could be extended to LR glass members in LTB, the
first issue is related to the accurate prediction of the theoretical critical moment Mcr,R. In addition to
the basic variations in the intrinsic material properties, compared to steel girders, glass beams are in
fact expected to have relatively higher length-to-thickness and length-to-height ratios, thus further
enforcing their susceptibility to possible LTB phenomena. Further key parameters to account for in
LTB calculations of LR glass members are then represented by the following mechanical restraints in
use (rotules, etc.).
their number (generally nb> 1),
the spacing s and position (with the respect of minimum edge-distance of glass holes, etc.),
the detailing features, for devices that are specifically designed for glass applications (i.e., Figure
6),
finally, the presence of gaps and soft gaskets at the glass-to-restraint interface, as typically in use
to prevent local stress peaks in the region of holes.
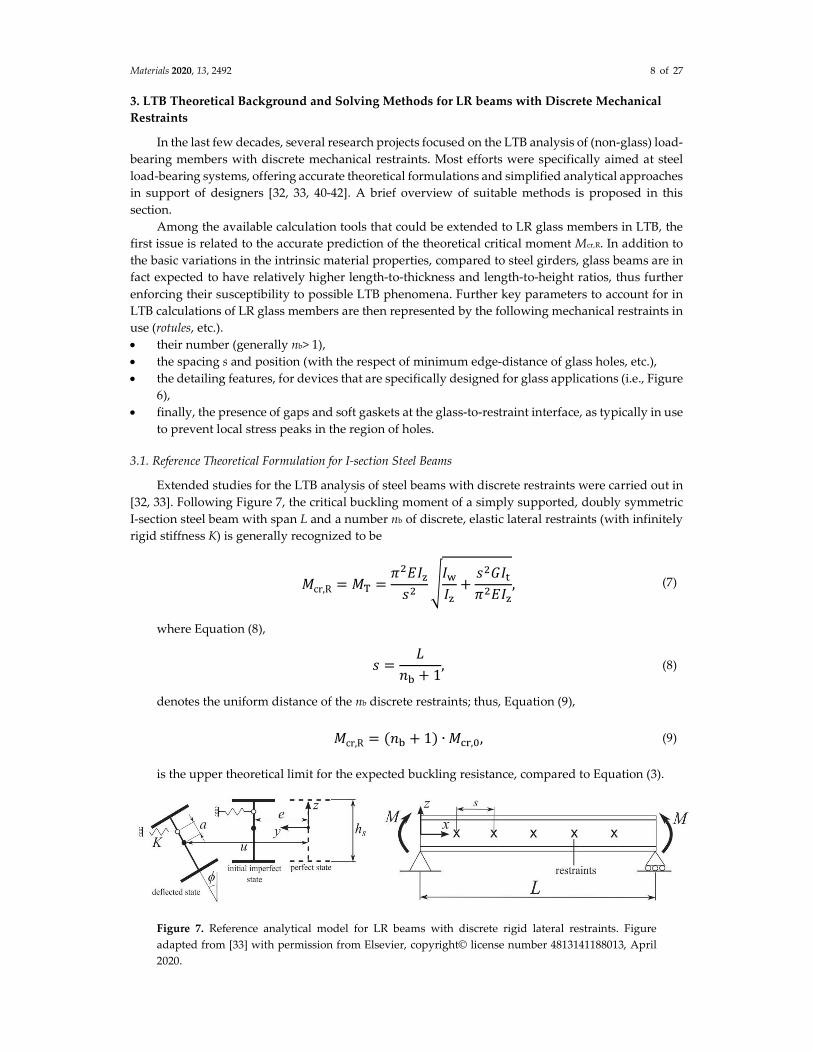
3.1. Reference Theoretical Formulation for I-section Steel Beams
Extended studies for the LTB analysis of steel beams with discrete restraints were carried out in
[32, 33]. Following Figure 7, the critical buckling moment of a simply supported, doubly symmetric
I-section steel beam with span L and a number nb of discrete, elastic lateral restraints (with infinitely
rigid stiffness K) is generally recognized to be
�cr,R = �� =�����
���
��
��+
�����
�����, (7)
where Equation (8),
� =�
�� + 1, (8)
denotes the uniform distance of the nb discrete restraints; thus, Equation (9),
�cr,R = (�� + 1) ∙ ���,�, (9)
is the upper theoretical limit for the expected buckling resistance, compared to Equation (3).
Figure 7. Reference analytical model for LR beams with discrete rigid lateral restraints. Figure
adapted from [33] with permission from Elsevier, copyright© license number 4813141188013, April
2020.
Materials 2020, 13, 2492 9 of 27
The above formulation assumes that the so-called “threshold” moment MT represents the
bending moment for which the LR beam buckles in (nb + 1) half-sine waves. In other words, the
stiffness K of nb ≥ 1 restraints is so high that a fully rigid lateral bracing can be offered to the beam to
verify, i.e., with null lateral displacements at the locally restrained nodes. As such, the same MT value
is equivalent to the critical moment of an LU beam segment with identical cross-section properties
but total span s (see Equation (8)).
Major issues for the LTB analysis of a general steel girder (see [32,33]) are thus represented by
the “rigidity efficiency” of the discrete restraints in use and, thus, by the detection of possible
intermediate configurations in which certain nodal displacements could be expected in the region of
discrete restraints. McCann et al. [33], for example, solved a linear Rayleigh–Ritz analysis and
proposed an extended formulation for the LTB analysis of general LR steel beams. According to [33],
it was shown that, once K exceeds the “threshold” stiffness value KT, the lateral restraints in use have
a full bracing effect; thus, Equation (10),
� ≥ ��, (10)
reflects a critical buckling moment �cr,R agreeing with Equation (7). To this aim, the threshold
stiffness value must be estimated as
�� = ����
�� �62 (1 + ��)
�� + ���̑, (11)
with the equations below denoting the normalized distance between the discrete restraints and
the section shear center (with hs representing the total height of the I-shaped profile in Figure 7).
�� =�
(�� + 1)�, (12)
� =� ���
�����, (13)
�∗ =2�
ℎ�, (14)
Finally, according to [33],
�� = 0.45 + 2.8 �b,T ��, (15)
�� = 6.3 �b,T + 2.2 �� − 1, (16)
�b,T =1
1 + ���[(� �� + 1⁄ )]. (17)
More in detail, vb,T in Equation (17) is respectively equal to 1.0 for nb = 1, 0.667 for nb = 2, and
0.586 for nb = 3, while it tends progressively to the lower limit vb,T = 0.5 for higher nb values.
Following Figure 7, a key condition for Equations (7)–(17) is that the discrete restraints in use
are positioned at a height a above the shear center of the cross-section object of analysis (with positive
distance values for bracing systems on the compression side), such that the following equation
applies [33]:
� ≥ �lim =ℎ� + ��
4�1 + ��
. (18)
3.2. Linear Interpolation Approaches
According to Equation (7), it is rationally expected that the critical buckling moment of a given
LR member in LTB can increase significantly, as long as rigid lateral restraints (with nb ≥ 1 and s < L)
are able to prevent possible displacements of the involved nodes. At the same time (see Equations (7)
Materials 2020, 13, 2492 10 of 27
and (9)), �cr,R .progressively decreases for K < KT, and finally returns to the limit condition
represented by the LTB response of a simple LU beam (see Equation (3)).
Several research studies were carried out over the years for the LTB assessment of LR steel
girders, where relatively stiff purlins of other bracing systems were used to provide stabilization.
Major calculation troubles arise when node-displacing critical modes can occur, since closed-form
solutions cannot be analytically derived for the reliable prediction of the critical moment �cr,R .
McCann et al. [33], in this context, proposed a conservative, linear approximation for intermediate
stiffnesses (i.e., 0 < K < KT), so that the corresponding Mcr,R value could be reliably estimated as
�cr,R = �cr,0 +�
����� − �cr,0�, (19)
with Mcr,0 and MT representing the unrestrained and threshold critical values given by Equations (3)
and (7), respectively. Past comparative calculations and validation studies discussed in [32,33] proved
that Equation (19) can be suitable for the LTB design of general steel beams. However, the same
studies highlighted that a higher degree of accuracy can be expected, especially for steel members
with a braced compression flange and with a single restraint (nb = 1) at the mid-span section.
An alternative linear fitting approach was suggested by Trahair [43], for LR beams with a single
restraint (nb = 1). The latter, however, can be applied with accuracy to beams with a discrete restraint
on the shear center (i.e., �∗ = 0 in Equation (14)). Many other approximation proposals are also
available in the literature, and they are specifically validated for a given number, position, and
stiffness of discrete restraints in steel members. Parametric studies were discussed in [42], for steel
members under various loading and LR conditions of technical interest for design. Extended
parametric analyses were presented in [29] for steel beams under various LR configurations, but
giving evidence of the intrinsic advantages or limits for several linear interpolation approaches of the
literature.
In this research paper, parametric calculations are, thus, proposed for several LR glass members
in LTB. As a reference toward more refined calculations, the linear interpolation approach in
Equation (19) is taken into account.
3.3. LTBeam Tool for Steel Beams
The LTBeam tool is firstly considered as an alternative calculation method. The software, more
in detail, was developed at CTICM (Centre Technique Industriel de la Construction Metallique,
www.cticm.com [34]), as part of a past European research project. The original goal of this tool is to
compute the elastic critical moment Mcr,R of LR steel beams with general cross-sectional features, in
any number of different load cases and boundaries, according to the finite element (FE) method.
For a given cross-section (both mono- or double-symmetric), the assigned beam to verify is
discretized into a maximum of 300 FE elements. Non-steel members can also be efficiently
investigated, once the flexural, torsional, and warping cross-section properties are defined in the
input parameters, together with the Young’s modulus and Poisson’s ratio for the material in use. The
presence of LR mechanical restraints (up to nb = 2), finally, can be described in the form of equivalent
elastic springs with input stiffness and position. When alternative calculation methods are not
available, an intrinsic advantage of the LTBeam tool is that the expected KT value in Equation (19) can
be numerically derived by iteration, i.e., as the minimum stiffness K that leads Mcr,R to coincide with
the threshold critical moment MT for the member object of analysis.
3.4. General FE Numerical Method
When the input geometrical details for the system to verify do not match with the approaches
summarized in Sections 3.2 and 3.3, commercially available computer software codes can be adapted
to specific configurations.
In this paper, for example, a set of parametric linear buckling analyses were developed with the
ABAQUS/Standard software (“buckle–linear perturbation” step). Through the parametric
investigation, the same modeling technique was taken into account to describe various LTB
Materials 2020, 13, 2492 11 of 27
configurations characterized by different number, position, and stiffness of discrete restraints, among
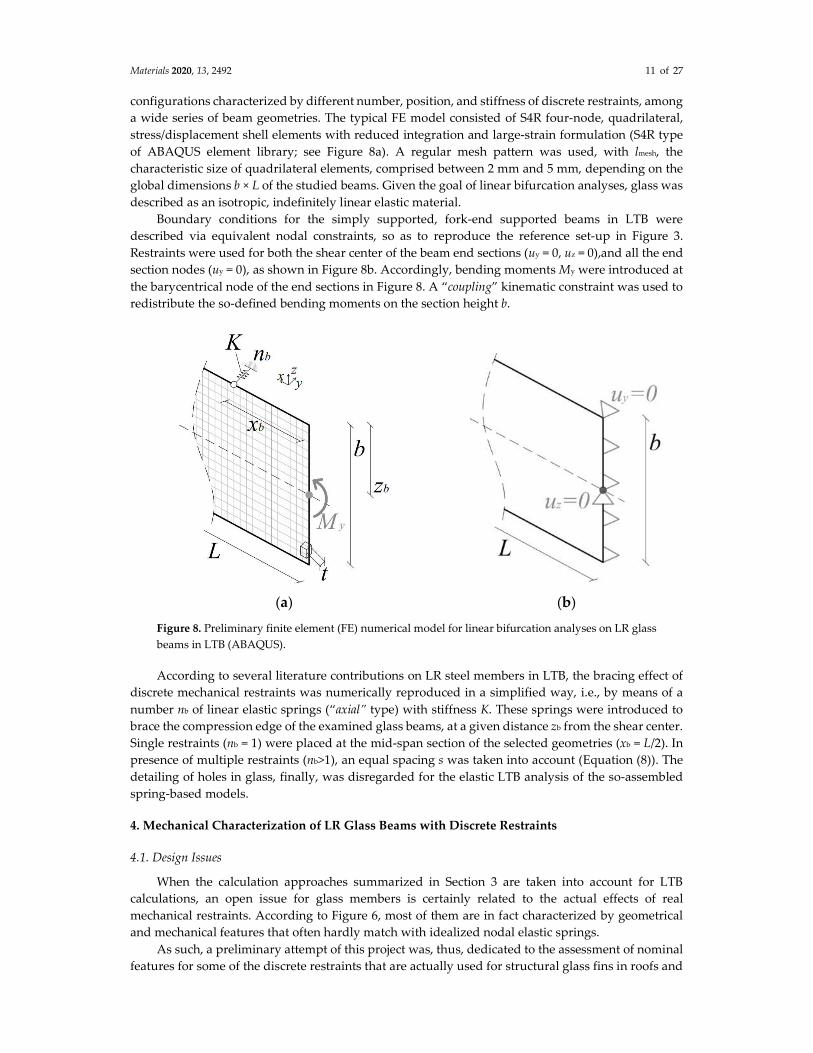
a wide series of beam geometries. The typical FE model consisted of S4R four-node, quadrilateral,
stress/displacement shell elements with reduced integration and large-strain formulation (S4R type
of ABAQUS element library; see Figure 8a). A regular mesh pattern was used, with lmesh, the
characteristic size of quadrilateral elements, comprised between 2 mm and 5 mm, depending on the
global dimensions b × L of the studied beams. Given the goal of linear bifurcation analyses, glass was
described as an isotropic, indefinitely linear elastic material.
Boundary conditions for the simply supported, fork-end supported beams in LTB were
described via equivalent nodal constraints, so as to reproduce the reference set-up in Figure 3.
Restraints were used for both the shear center of the beam end sections (uy = 0, uz = 0),and all the end
section nodes (uy = 0), as shown in Figure 8b. Accordingly, bending moments My were introduced at
the barycentrical node of the end sections in Figure 8. A “coupling” kinematic constraint was used to
redistribute the so-defined bending moments on the section height b.
(a) (b)
Figure 8. Preliminary finite element (FE) numerical model for linear bifurcation analyses on LR glass
beams in LTB (ABAQUS).
According to several literature contributions on LR steel members in LTB, the bracing effect of
discrete mechanical restraints was numerically reproduced in a simplified way, i.e., by means of a
number nb of linear elastic springs (“axial” type) with stiffness K. These springs were introduced to
brace the compression edge of the examined glass beams, at a given distance zb from the shear center.
Single restraints (nb = 1) were placed at the mid-span section of the selected geometries (xb = L/2). In
presence of multiple restraints (nb>1), an equal spacing s was taken into account (Equation (8)). The
detailing of holes in glass, finally, was disregarded for the elastic LTB analysis of the so-assembled
spring-based models.
4. Mechanical Characterization of LR Glass Beams with Discrete Restraints
4.1. Design Issues
When the calculation approaches summarized in Section 3 are taken into account for LTB
calculations, an open issue for glass members is certainly related to the actual effects of real
mechanical restraints. According to Figure 6, most of them are in fact characterized by geometrical
and mechanical features that often hardly match with idealized nodal elastic springs.
As such, a preliminary attempt of this project was, thus, dedicated to the assessment of nominal
features for some of the discrete restraints that are actually used for structural glass fins in roofs and
Materials 2020, 13, 2492 12 of 27
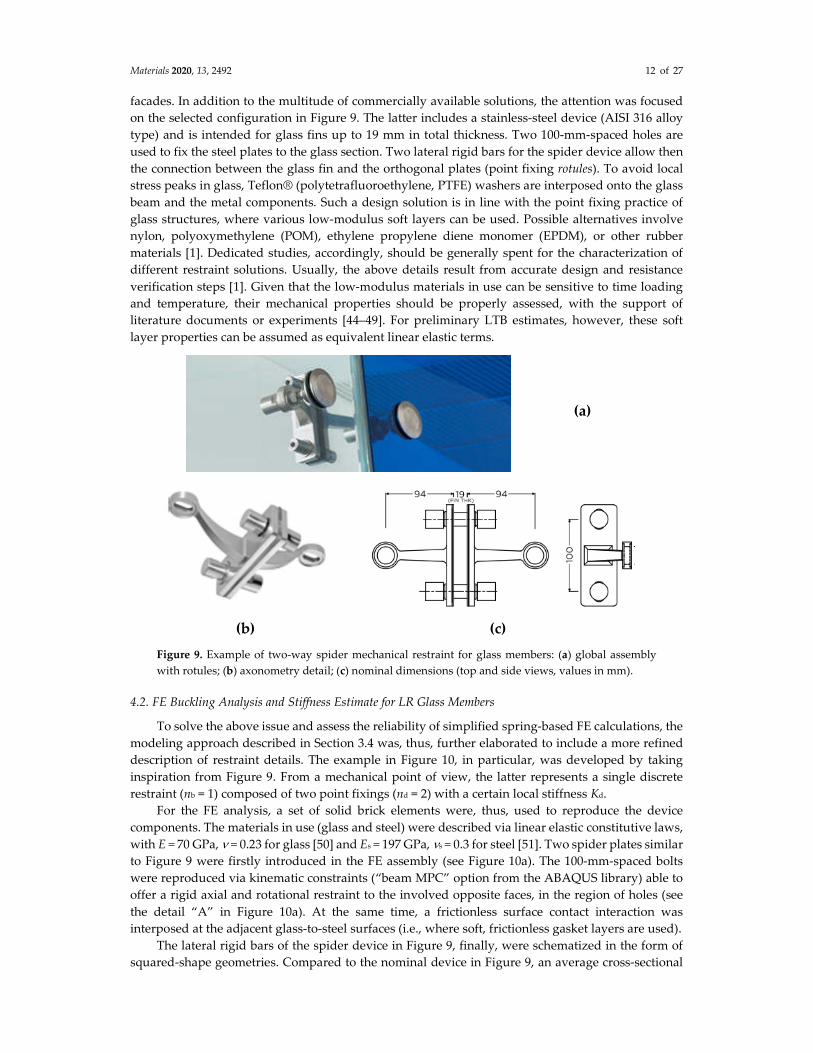
facades. In addition to the multitude of commercially available solutions, the attention was focused
on the selected configuration in Figure 9. The latter includes a stainless-steel device (AISI 316 alloy
type) and is intended for glass fins up to 19 mm in total thickness. Two 100-mm-spaced holes are
used to fix the steel plates to the glass section. Two lateral rigid bars for the spider device allow then
the connection between the glass fin and the orthogonal plates (point fixing rotules). To avoid local
stress peaks in glass, Teflon® (polytetrafluoroethylene, PTFE) washers are interposed onto the glass
beam and the metal components. Such a design solution is in line with the point fixing practice of
glass structures, where various low-modulus soft layers can be used. Possible alternatives involve
nylon, polyoxymethylene (POM), ethylene propylene diene monomer (EPDM), or other rubber
materials [1]. Dedicated studies, accordingly, should be generally spent for the characterization of
different restraint solutions. Usually, the above details result from accurate design and resistance
verification steps [1]. Given that the low-modulus materials in use can be sensitive to time loading
and temperature, their mechanical properties should be properly assessed, with the support of
literature documents or experiments [44–49]. For preliminary LTB estimates, however, these soft
layer properties can be assumed as equivalent linear elastic terms.
(a)
(b) (c)
Figure 9. Example of two-way spider mechanical restraint for glass members: (a) global assembly
with rotules; (b) axonometry detail; (c) nominal dimensions (top and side views, values in mm).
4.2. FE Buckling Analysis and Stiffness Estimate for LR Glass Members
To solve the above issue and assess the reliability of simplified spring-based FE calculations, the
modeling approach described in Section 3.4 was, thus, further elaborated to include a more refined
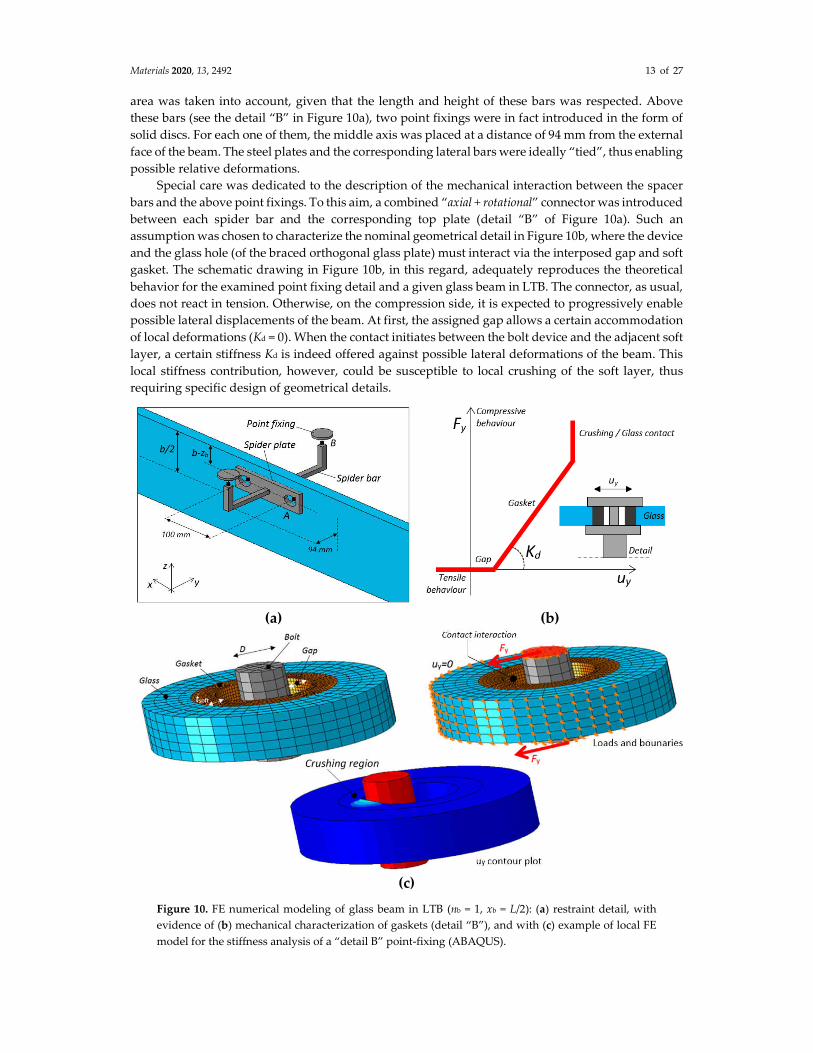
description of restraint details. The example in Figure 10, in particular, was developed by taking
inspiration from Figure 9. From a mechanical point of view, the latter represents a single discrete
restraint (nb = 1) composed of two point fixings (nd = 2) with a certain local stiffness Kd.
For the FE analysis, a set of solid brick elements were, thus, used to reproduce the device
components. The materials in use (glass and steel) were described via linear elastic constitutive laws,
with E = 70 GPa, = 0.23 for glass [50] and Es = 197 GPa, s = 0.3 for steel [51]. Two spider plates similar
to Figure 9 were firstly introduced in the FE assembly (see Figure 10a). The 100-mm-spaced bolts
were reproduced via kinematic constraints (“beam MPC” option from the ABAQUS library) able to
offer a rigid axial and rotational restraint to the involved opposite faces, in the region of holes (see
the detail “A” in Figure 10a). At the same time, a frictionless surface contact interaction was
interposed at the adjacent glass-to-steel surfaces (i.e., where soft, frictionless gasket layers are used).
The lateral rigid bars of the spider device in Figure 9, finally, were schematized in the form of
squared-shape geometries. Compared to the nominal device in Figure 9, an average cross-sectional
Materials 2020, 13, 2492 13 of 27
area was taken into account, given that the length and height of these bars was respected. Above
these bars (see the detail “B” in Figure 10a), two point fixings were in fact introduced in the form of
solid discs. For each one of them, the middle axis was placed at a distance of 94 mm from the external
face of the beam. The steel plates and the corresponding lateral bars were ideally “tied”, thus enabling
possible relative deformations.
Special care was dedicated to the description of the mechanical interaction between the spacer
bars and the above point fixings. To this aim, a combined “axial + rotational” connector was introduced
between each spider bar and the corresponding top plate (detail “B” of Figure 10a). Such an
assumption was chosen to characterize the nominal geometrical detail in Figure 10b, where the device
and the glass hole (of the braced orthogonal glass plate) must interact via the interposed gap and soft
gasket. The schematic drawing in Figure 10b, in this regard, adequately reproduces the theoretical
behavior for the examined point fixing detail and a given glass beam in LTB. The connector, as usual,
does not react in tension. Otherwise, on the compression side, it is expected to progressively enable
possible lateral displacements of the beam. At first, the assigned gap allows a certain accommodation
of local deformations (Kd = 0). When the contact initiates between the bolt device and the adjacent soft
layer, a certain stiffness Kd is indeed offered against possible lateral deformations of the beam. This
local stiffness contribution, however, could be susceptible to local crushing of the soft layer, thus
requiring specific design of geometrical details.
(a) (b)
(c)
Figure 10. FE numerical modeling of glass beam in LTB (nb = 1, xb = L/2): (a) restraint detail, with
evidence of (b) mechanical characterization of gaskets (detail “B”), and with (c) example of local FE
model for the stiffness analysis of a “detail B” point-fixing (ABAQUS).
Materials 2020, 13, 2492 14 of 27
The reliable calculation of Mcr,R for a given LR member, according to Section 3, requires that the
global elastic stiffness K for the spider device should be estimated first.
For practical LTB calculations, it is assumed that each detail agreeing with Figures 10a,b (where
nb = 1 and nd = 2) is the result of multiple local stiffness contributions Kd (if nd > 1) that can be placed
at different xb positions of the span L for the LR beam to verify. The cumulative stiffness K due to the
mechanical restraint in Figure 10 is, thus, expected to be
� = � ��
��
���
, (20)
where Equation (21),
�� =��
��
, (21)
represents the equivalent stiffness for a single point fixing. The latter depends on the Young’s
modulus of the soft layer in use (Esoft), its thickness tsoft, and the contact surface in compression (Asoft),
in the region of interaction between the bolt and the glass hole. Accordingly, dedicated experimental
analyses or refined FE calculations should support the accurate characterization of local mechanical
behaviors (Figure 10c). As long as the calculations are limited to the linear elastic regime, however,
an approximate prediction of this local stiffness Kd can be obtained as
�� ≈����� �����
�����, (22)
with
����� ≈ ����� 0.8�, (23)
and D the nominal diameter of the bolt.
It is, thus, clear that, as long as the input parameters in Equations (22) and (23) are modified, a
markedly different prediction can be achieved for the total stiffness K in Equation (20). The latter, in
addition, can have different bracing effects and efficiency, depending on the geometry of the LR beam
to verify.
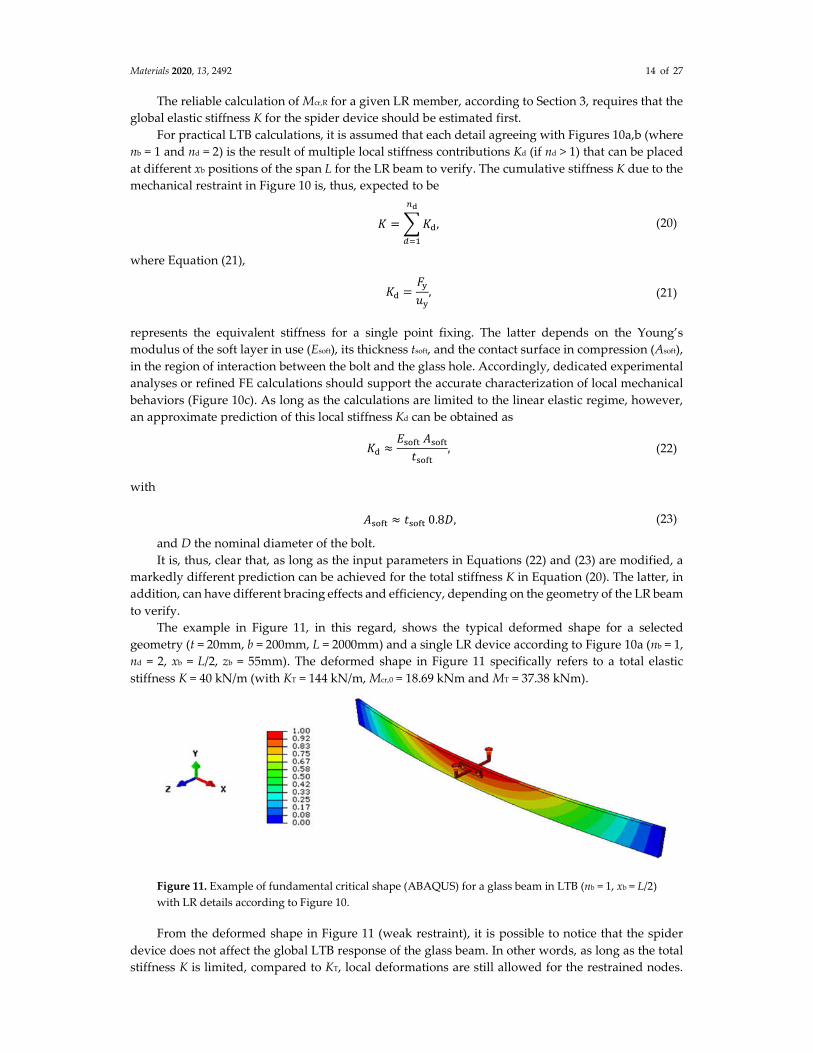
The example in Figure 11, in this regard, shows the typical deformed shape for a selected
geometry (t = 20mm, b = 200mm, L = 2000mm) and a single LR device according to Figure 10a (nb = 1,
nd = 2, xb = L/2, zb = 55mm). The deformed shape in Figure 11 specifically refers to a total elastic
stiffness K = 40 kN/m (with KT = 144 kN/m, Mcr,0 = 18.69 kNm and MT = 37.38 kNm).
Figure 11. Example of fundamental critical shape (ABAQUS) for a glass beam in LTB (nb = 1, xb = L/2)
with LR details according to Figure 10.
From the deformed shape in Figure 11 (weak restraint), it is possible to notice that the spider
device does not affect the global LTB response of the glass beam. In other words, as long as the total
stiffness K is limited, compared to KT, local deformations are still allowed for the restrained nodes.
Materials 2020, 13, 2492 15 of 27
From Table 3, moreover, it is possible to see the variation of critical moment estimates for the same
beam geometry, as long as K increases. The collected values are obtained from the linearized
analytical approach, the LTBeam tool, and the refined FE model in Figure 11.
Table 3. Comparison of critical buckling moment variations for the selected beam geometry from
Figure 11 (nb = 1 and nd = 2), as a function of K (3D= three-dimensional).
Mcr,R / Mcr,0
K
(kN/m)
Analytical
(Equation (19))
LTBeam
(spring-based model)
FE
(model with 3D restraints)
40 1.278 1.350 1.383
80 1.554 1.632 1.655
120 1.725 1.870 1.858
As long as K increases, the bracing effect of local restraints manifests in a progressive increase of
Mcr,R, within the limit values Mcr,0 and MT. The comparison of analytical, LTBeam, and more refined
FE calculations in ABAQUS shows that the first approach tends to underestimate the expected
bracing effect, while the general trend of numerical calculations is mostly in good correlation. For the
selected example, the spring-based estimates show less than a 2% scatter from the more accurate FE
model with three-dimensional (3D) restraints.
A relevant calculation issue is, thus, represented by the threshold stiffness value KT described in
Equation (19), given that Equations (11)–(17) were specifically proposed in [32,33] for doubly
symmetric I-section steel members. The reference analytical approach can be further adapted to
rectangular t × b glass sections, as long as it is assumed that the warping stiffness in Equation (13)
reduces to
�� ≈ ��∗ =
��(��)
4=
����
48. (24)
Consequently (with G≈ E/3 the shear modulus of glass), the original Equation (13) can be
expressed as
� ≈16�
����. (25)
Once k is estimated from Equation (25), the final KT value can, thus, be calculated via Equation
(11). Compared to the exact formulation (i.e., Equation (13) or iterative calculations with the LTBeam
tool, see Section 3.3), it is important to note that Equation (25) can result in rough threshold stiffness
predictions for a given LR glass member. Therefore, careful consideration should be spent, at the
design stage, to account for these intrinsic approximations.
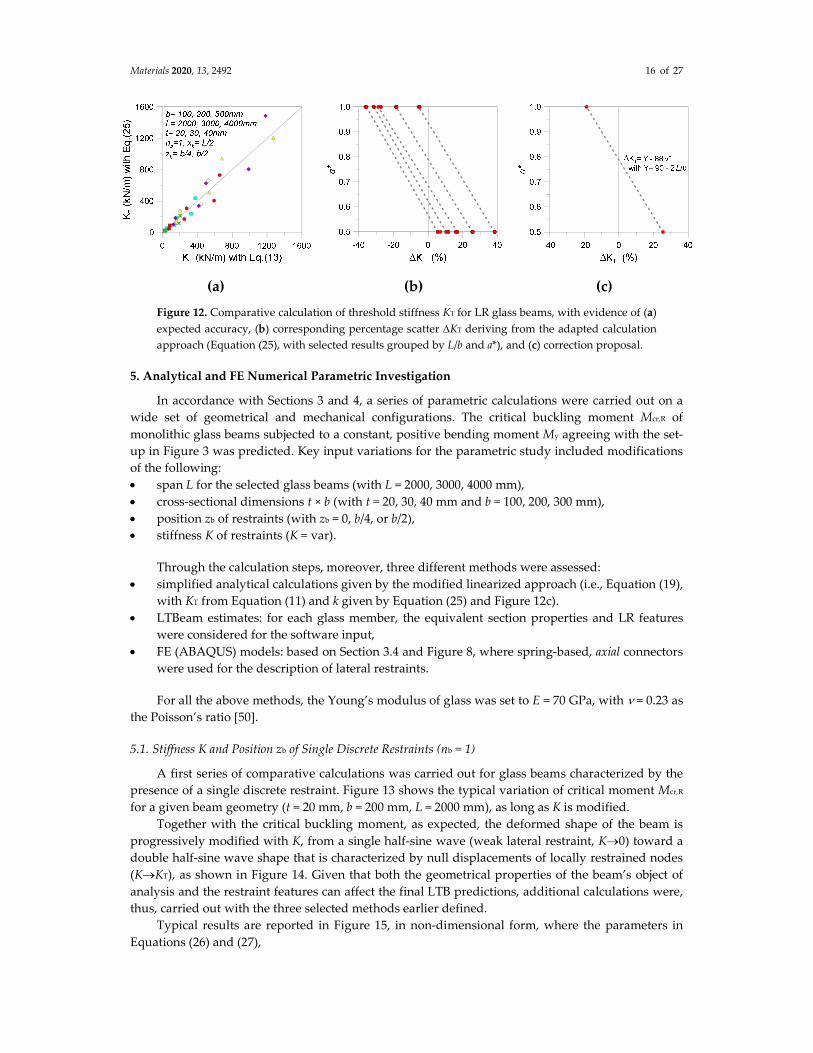
In this regard, comparative calculation examples are proposed in Figure 12a for selected LR
configurations, while the corresponding percentage scatter KT (as obtained from Equation (25) or
more accurate predictions) is shown in Figure 12b. The latter, given the assumption of Equation (25),
can result in both positive or negative scatter (depending on the distance a*), and even in severe
scatter. The combination of geometrical properties for the beam to verify, as well as the position of
restraints, can both contribute to affect the final KT result. According to Figure 12c, however, it is
possible to see that the approximation in KT calculated from Equation (25) can be efficiently addressed
(for various glass beam geometries and restraint positions), as long as the suggested interpolation
function is taken into account.
Materials 2020, 13, 2492 16 of 27
(a) (b) (c)
Figure 12. Comparative calculation of threshold stiffness KT for LR glass beams, with evidence of (a)
expected accuracy, (b) corresponding percentage scatter KT deriving from the adapted calculation
approach (Equation (25), with selected results grouped by L/b and a*), and (c) correction proposal.
5. Analytical and FE Numerical Parametric Investigation
In accordance with Sections 3 and 4, a series of parametric calculations were carried out on a
wide set of geometrical and mechanical configurations. The critical buckling moment Mcr,R of
monolithic glass beams subjected to a constant, positive bending moment My agreeing with the set-
up in Figure 3 was predicted. Key input variations for the parametric study included modifications
of the following:
span L for the selected glass beams (with L = 2000, 3000, 4000 mm),
cross-sectional dimensions t × b (with t = 20, 30, 40 mm and b = 100, 200, 300 mm),
position zb of restraints (with zb = 0, b/4, or b/2),
stiffness K of restraints (K = var).
Through the calculation steps, moreover, three different methods were assessed:
simplified analytical calculations given by the modified linearized approach (i.e., Equation (19),
with KT from Equation (11) and k given by Equation (25) and Figure 12c).
LTBeam estimates: for each glass member, the equivalent section properties and LR features
were considered for the software input,
FE (ABAQUS) models: based on Section 3.4 and Figure 8, where spring-based, axial connectors
were used for the description of lateral restraints.
For all the above methods, the Young’s modulus of glass was set to E = 70 GPa, with = 0.23 as
the Poisson’s ratio [50].
5.1. Stiffness K and Position zb of Single Discrete Restraints (nb = 1)
A first series of comparative calculations was carried out for glass beams characterized by the
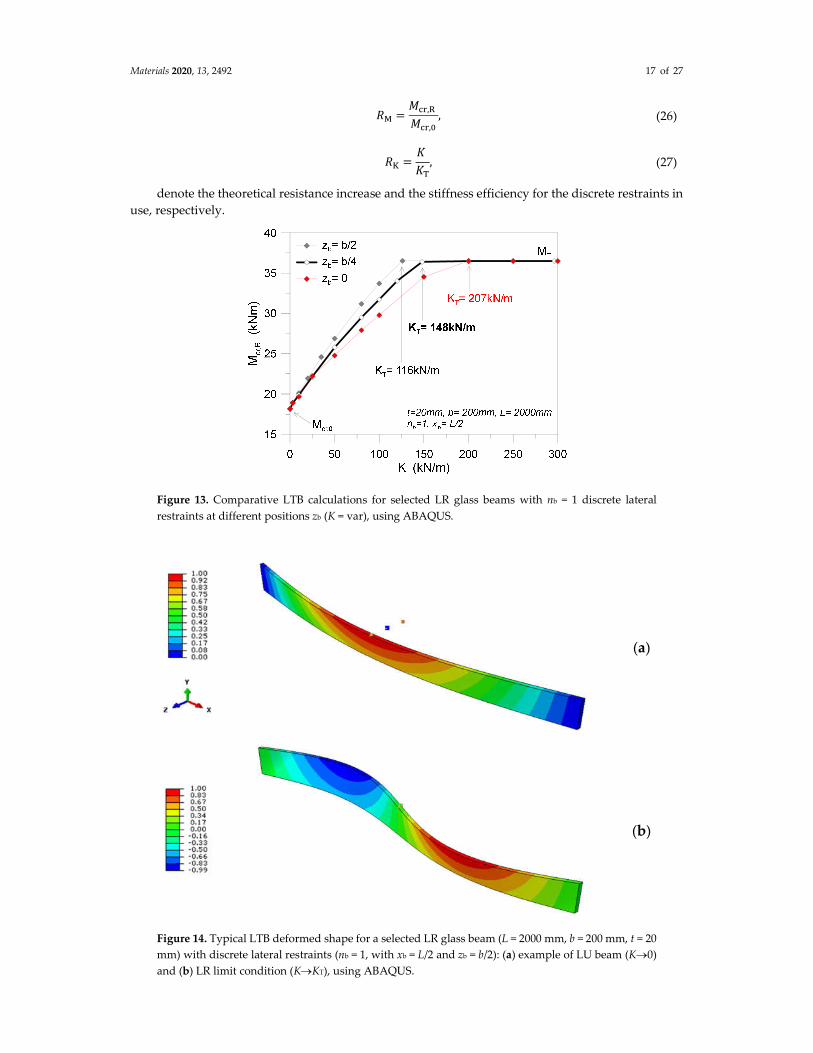
presence of a single discrete restraint. Figure 13 shows the typical variation of critical moment Mcr,R
for a given beam geometry (t = 20 mm, b = 200 mm, L = 2000 mm), as long as K is modified.
Together with the critical buckling moment, as expected, the deformed shape of the beam is
progressively modified with K, from a single half-sine wave (weak lateral restraint, K0) toward a
double half-sine wave shape that is characterized by null displacements of locally restrained nodes
(KKT), as shown in Figure 14. Given that both the geometrical properties of the beam’s object of
analysis and the restraint features can affect the final LTB predictions, additional calculations were,
thus, carried out with the three selected methods earlier defined.
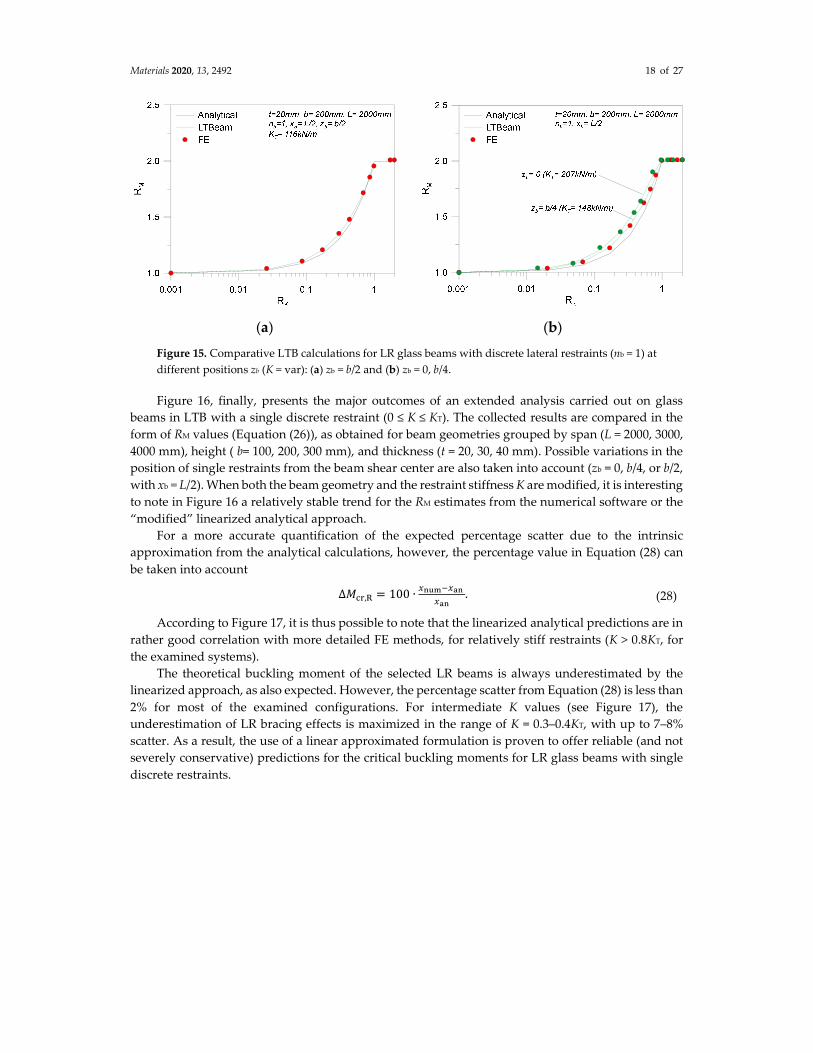
Typical results are reported in Figure 15, in non-dimensional form, where the parameters in
Equations (26) and (27),
Materials 2020, 13, 2492 17 of 27
�� =���,�
���,�
, (26)
�� =�
��
, (27)
denote the theoretical resistance increase and the stiffness efficiency for the discrete restraints in
use, respectively.
Figure 13. Comparative LTB calculations for selected LR glass beams with nb = 1 discrete lateral
restraints at different positions zb (K = var), using ABAQUS.
(a)
(b)
Figure 14. Typical LTB deformed shape for a selected LR glass beam (L = 2000 mm, b = 200 mm, t = 20
mm) with discrete lateral restraints (nb = 1, with xb = L/2 and zb = b/2): (a) example of LU beam (K0)
and (b) LR limit condition (KKT), using ABAQUS.
Materials 2020, 13, 2492 18 of 27
(a) (b)
Figure 15. Comparative LTB calculations for LR glass beams with discrete lateral restraints (nb = 1) at
different positions zb (K = var): (a) zb = b/2 and (b) zb = 0, b/4.
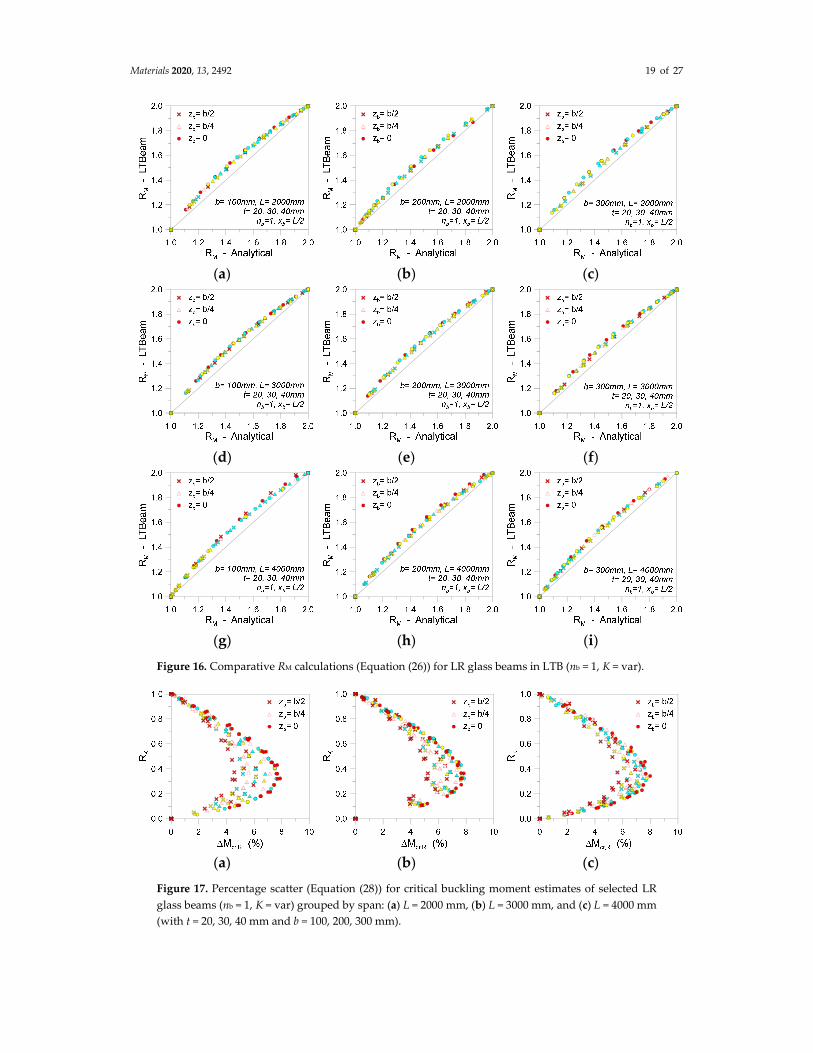
Figure 16, finally, presents the major outcomes of an extended analysis carried out on glass
beams in LTB with a single discrete restraint (0 ≤ K ≤ KT). The collected results are compared in the
form of RM values (Equation (26)), as obtained for beam geometries grouped by span (L = 2000, 3000,
4000 mm), height ( b= 100, 200, 300 mm), and thickness (t = 20, 30, 40 mm). Possible variations in the
position of single restraints from the beam shear center are also taken into account (zb = 0, b/4, or b/2,
with xb = L/2). When both the beam geometry and the restraint stiffness K are modified, it is interesting
to note in Figure 16 a relatively stable trend for the RM estimates from the numerical software or the
“modified” linearized analytical approach.
For a more accurate quantification of the expected percentage scatter due to the intrinsic
approximation from the analytical calculations, however, the percentage value in Equation (28) can
be taken into account
Δ���,� = 100 ∙��������
���. (28)
According to Figure 17, it is thus possible to note that the linearized analytical predictions are in
rather good correlation with more detailed FE methods, for relatively stiff restraints (K > 0.8KT, for
the examined systems).
The theoretical buckling moment of the selected LR beams is always underestimated by the
linearized approach, as also expected. However, the percentage scatter from Equation (28) is less than
2% for most of the examined configurations. For intermediate K values (see Figure 17), the
underestimation of LR bracing effects is maximized in the range of K = 0.3–0.4KT, with up to 7–8%
scatter. As a result, the use of a linear approximated formulation is proven to offer reliable (and not
severely conservative) predictions for the critical buckling moments for LR glass beams with single
discrete restraints.
Materials 2020, 13, 2492 19 of 27
(a) (b) (c)
(d) (e) (f)
(g) (h) (i)
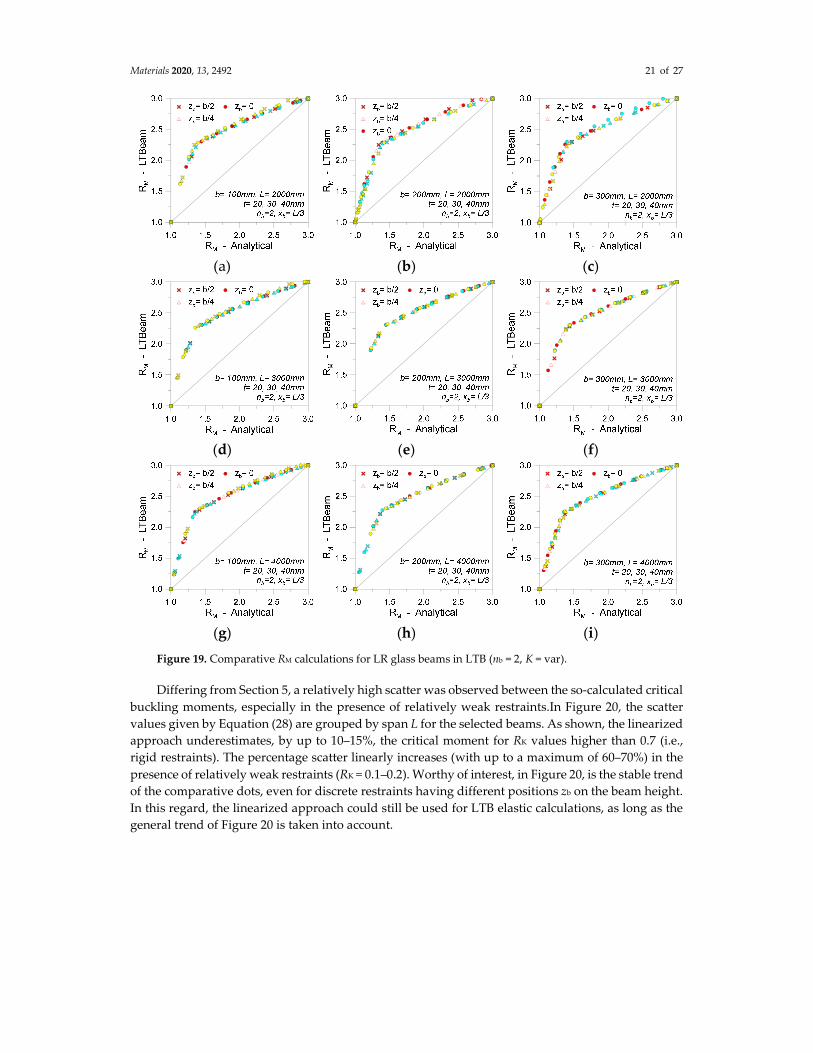
Figure 16. Comparative RM calculations (Equation (26)) for LR glass beams in LTB (nb = 1, K = var).
(a) (b) (c)
Figure 17. Percentage scatter (Equation (28)) for critical buckling moment estimates of selected LR
glass beams (nb = 1, K = var) grouped by span: (a) L = 2000 mm, (b) L = 3000 mm, and (c) L = 4000 mm
(with t = 20, 30, 40 mm and b = 100, 200, 300 mm).
Materials 2020, 13, 2492 20 of 27
6. Analysis of Glass Beams with Multiple Discrete Restraints
At a subsequent stage, the parametric analysis was extended to LR glass beams characterized by
the presence of multiple discrete restraints. Major results are grouped in Sections 6.1 and 6.2, as a
function of nb (with 2 ≤ nb ≤ 5).
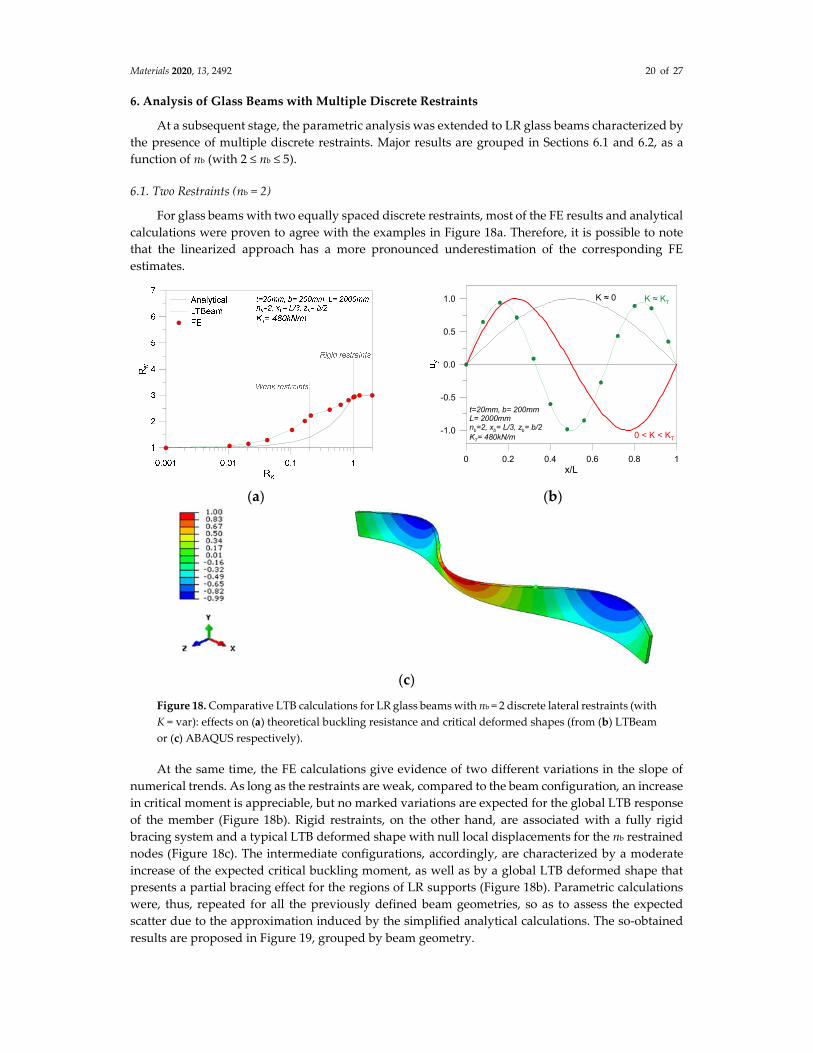
6.1. Two Restraints (nb = 2)
For glass beams with two equally spaced discrete restraints, most of the FE results and analytical
calculations were proven to agree with the examples in Figure 18a. Therefore, it is possible to note
that the linearized approach has a more pronounced underestimation of the corresponding FE
estimates.
(a) (b)
(c)
Figure 18. Comparative LTB calculations for LR glass beams with nb = 2 discrete lateral restraints (with
K = var): effects on (a) theoretical buckling resistance and critical deformed shapes (from (b) LTBeam
or (c) ABAQUS respectively).
At the same time, the FE calculations give evidence of two different variations in the slope of
numerical trends. As long as the restraints are weak, compared to the beam configuration, an increase
in critical moment is appreciable, but no marked variations are expected for the global LTB response
of the member (Figure 18b). Rigid restraints, on the other hand, are associated with a fully rigid
bracing system and a typical LTB deformed shape with null local displacements for the nb restrained
nodes (Figure 18c). The intermediate configurations, accordingly, are characterized by a moderate
increase of the expected critical buckling moment, as well as by a global LTB deformed shape that
presents a partial bracing effect for the regions of LR supports (Figure 18b). Parametric calculations
were, thus, repeated for all the previously defined beam geometries, so as to assess the expected
scatter due to the approximation induced by the simplified analytical calculations. The so-obtained
results are proposed in Figure 19, grouped by beam geometry.
0 0.2 0.4 0.6 0.8 1x/L
-1.0
-0.5
0.0
0.5
1.0
t=20mm, b= 200mmL= 2000mmnb=2, xb= L/3, zb= b/2
KT= 480kN/m
K ≈ KTK ≈ 0
0 < K < KT
Materials 2020, 13, 2492 21 of 27
(a) (b) (c)
(d) (e) (f)
(g) (h) (i)
Figure 19. Comparative RM calculations for LR glass beams in LTB (nb = 2, K = var).
Differing from Section 5, a relatively high scatter was observed between the so-calculated critical
buckling moments, especially in the presence of relatively weak restraints.In Figure 20, the scatter
values given by Equation (28) are grouped by span L for the selected beams. As shown, the linearized
approach underestimates, by up to 10–15%, the critical moment for RK values higher than 0.7 (i.e.,
rigid restraints). The percentage scatter linearly increases (with up to a maximum of 60–70%) in the
presence of relatively weak restraints (RK = 0.1–0.2). Worthy of interest, in Figure 20, is the stable trend
of the comparative dots, even for discrete restraints having different positions zb on the beam height.
In this regard, the linearized approach could still be used for LTB elastic calculations, as long as the
general trend of Figure 20 is taken into account.
Materials 2020, 13, 2492 22 of 27
(a) (b) (c)
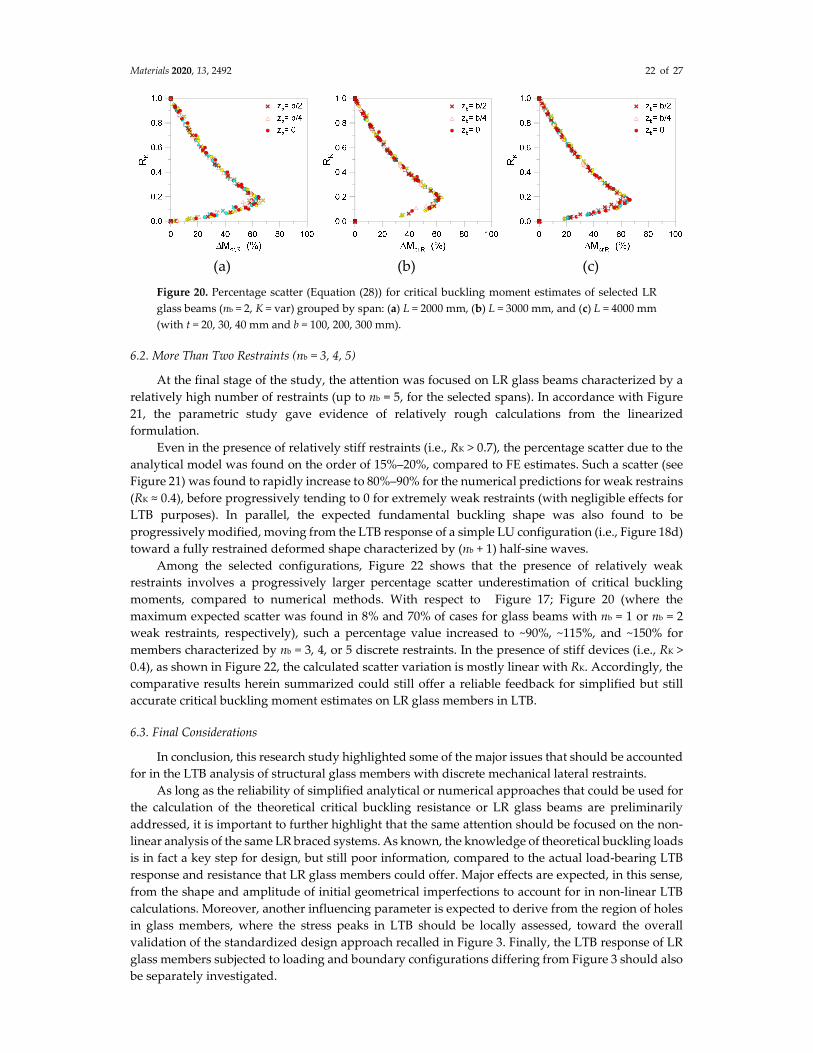
Figure 20. Percentage scatter (Equation (28)) for critical buckling moment estimates of selected LR
glass beams (nb = 2, K = var) grouped by span: (a) L = 2000 mm, (b) L = 3000 mm, and (c) L = 4000 mm
(with t = 20, 30, 40 mm and b = 100, 200, 300 mm).
6.2. More Than Two Restraints (nb = 3, 4, 5)
At the final stage of the study, the attention was focused on LR glass beams characterized by a
relatively high number of restraints (up to nb = 5, for the selected spans). In accordance with Figure
21, the parametric study gave evidence of relatively rough calculations from the linearized
formulation.
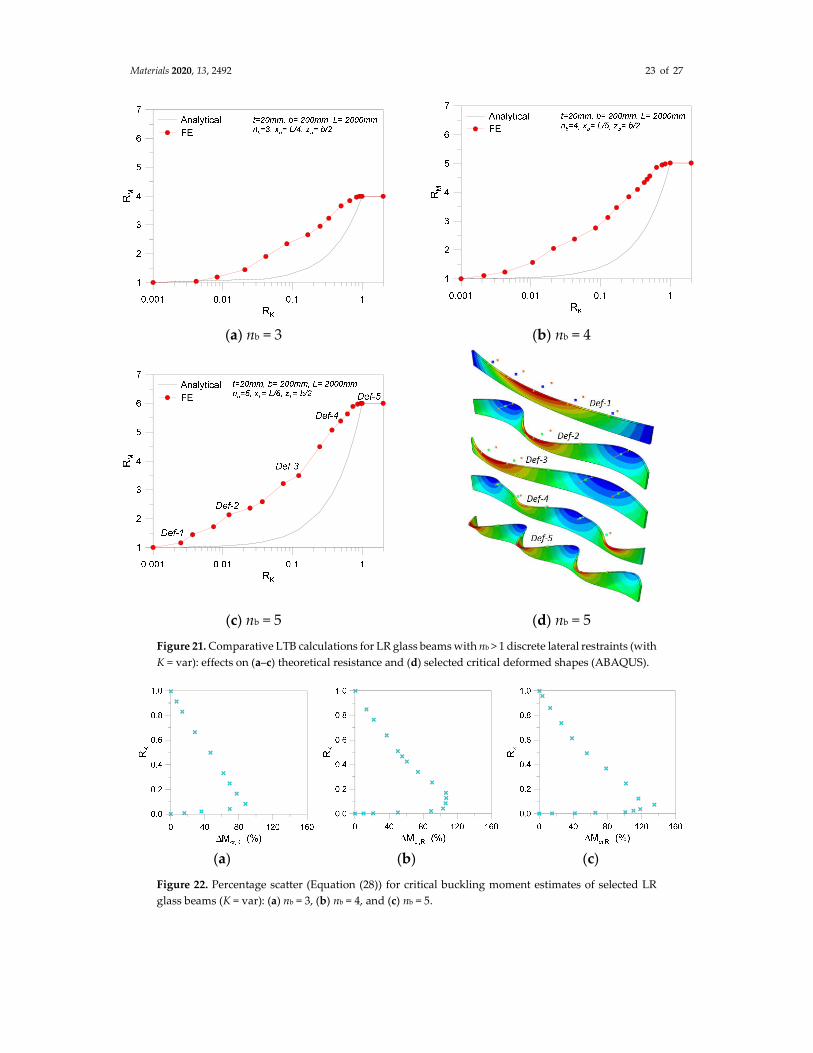
Even in the presence of relatively stiff restraints (i.e., RK > 0.7), the percentage scatter due to the
analytical model was found on the order of 15%–20%, compared to FE estimates. Such a scatter (see
Figure 21) was found to rapidly increase to 80%–90% for the numerical predictions for weak restrains
(RK ≈ 0.4), before progressively tending to 0 for extremely weak restraints (with negligible effects for
LTB purposes). In parallel, the expected fundamental buckling shape was also found to be
progressively modified, moving from the LTB response of a simple LU configuration (i.e., Figure 18d)
toward a fully restrained deformed shape characterized by (nb + 1) half-sine waves.
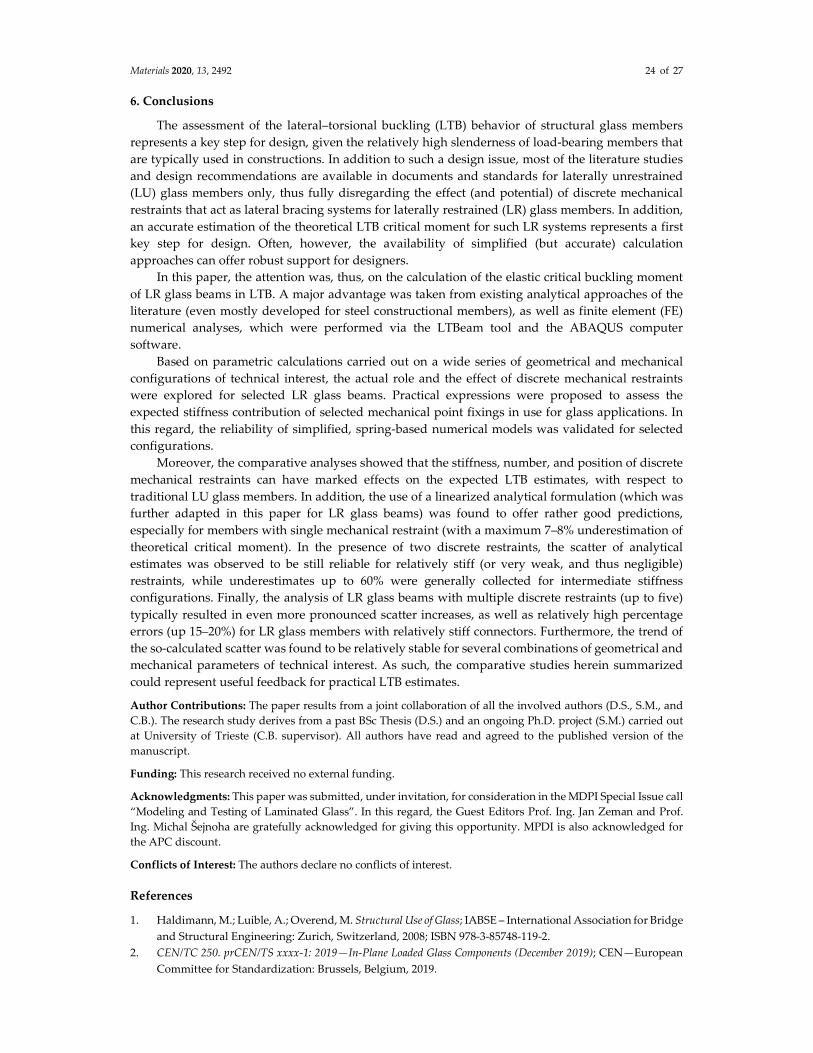
Among the selected configurations, Figure 22 shows that the presence of relatively weak
restraints involves a progressively larger percentage scatter underestimation of critical buckling
moments, compared to numerical methods. With respect to Figure 17; Figure 20 (where the
maximum expected scatter was found in 8% and 70% of cases for glass beams with nb = 1 or nb = 2
weak restraints, respectively), such a percentage value increased to ~90%, ~115%, and ~150% for
members characterized by nb = 3, 4, or 5 discrete restraints. In the presence of stiff devices (i.e., RK >
0.4), as shown in Figure 22, the calculated scatter variation is mostly linear with RK. Accordingly, the
comparative results herein summarized could still offer a reliable feedback for simplified but still
accurate critical buckling moment estimates on LR glass members in LTB.
6.3. Final Considerations
In conclusion, this research study highlighted some of the major issues that should be accounted
for in the LTB analysis of structural glass members with discrete mechanical lateral restraints.
As long as the reliability of simplified analytical or numerical approaches that could be used for
the calculation of the theoretical critical buckling resistance or LR glass beams are preliminarily
addressed, it is important to further highlight that the same attention should be focused on the non-
linear analysis of the same LR braced systems. As known, the knowledge of theoretical buckling loads
is in fact a key step for design, but still poor information, compared to the actual load-bearing LTB
response and resistance that LR glass members could offer. Major effects are expected, in this sense,
from the shape and amplitude of initial geometrical imperfections to account for in non-linear LTB
calculations. Moreover, another influencing parameter is expected to derive from the region of holes
in glass members, where the stress peaks in LTB should be locally assessed, toward the overall
validation of the standardized design approach recalled in Figure 3. Finally, the LTB response of LR
glass members subjected to loading and boundary configurations differing from Figure 3 should also
be separately investigated.
Materials 2020, 13, 2492 23 of 27
(a) nb = 3 (b) nb = 4
(c) nb = 5 (d) nb = 5
Figure 21. Comparative LTB calculations for LR glass beams with nb > 1 discrete lateral restraints (with
K = var): effects on (a–c) theoretical resistance and (d) selected critical deformed shapes (ABAQUS).
(a) (b) (c)
Figure 22. Percentage scatter (Equation (28)) for critical buckling moment estimates of selected LR
glass beams (K = var): (a) nb = 3, (b) nb = 4, and (c) nb = 5.
Materials 2020, 13, 2492 24 of 27
6. Conclusions
The assessment of the lateral–torsional buckling (LTB) behavior of structural glass members
represents a key step for design, given the relatively high slenderness of load-bearing members that
are typically used in constructions. In addition to such a design issue, most of the literature studies
and design recommendations are available in documents and standards for laterally unrestrained
(LU) glass members only, thus fully disregarding the effect (and potential) of discrete mechanical
restraints that act as lateral bracing systems for laterally restrained (LR) glass members. In addition,
an accurate estimation of the theoretical LTB critical moment for such LR systems represents a first
key step for design. Often, however, the availability of simplified (but accurate) calculation
approaches can offer robust support for designers.
In this paper, the attention was, thus, on the calculation of the elastic critical buckling moment
of LR glass beams in LTB. A major advantage was taken from existing analytical approaches of the
literature (even mostly developed for steel constructional members), as well as finite element (FE)
numerical analyses, which were performed via the LTBeam tool and the ABAQUS computer
software.
Based on parametric calculations carried out on a wide series of geometrical and mechanical
configurations of technical interest, the actual role and the effect of discrete mechanical restraints
were explored for selected LR glass beams. Practical expressions were proposed to assess the
expected stiffness contribution of selected mechanical point fixings in use for glass applications. In
this regard, the reliability of simplified, spring-based numerical models was validated for selected
configurations.
Moreover, the comparative analyses showed that the stiffness, number, and position of discrete
mechanical restraints can have marked effects on the expected LTB estimates, with respect to
traditional LU glass members. In addition, the use of a linearized analytical formulation (which was
further adapted in this paper for LR glass beams) was found to offer rather good predictions,
especially for members with single mechanical restraint (with a maximum 7–8% underestimation of
theoretical critical moment). In the presence of two discrete restraints, the scatter of analytical
estimates was observed to be still reliable for relatively stiff (or very weak, and thus negligible)
restraints, while underestimates up to 60% were generally collected for intermediate stiffness
configurations. Finally, the analysis of LR glass beams with multiple discrete restraints (up to five)
typically resulted in even more pronounced scatter increases, as well as relatively high percentage
errors (up 15–20%) for LR glass members with relatively stiff connectors. Furthermore, the trend of
the so-calculated scatter was found to be relatively stable for several combinations of geometrical and
mechanical parameters of technical interest. As such, the comparative studies herein summarized
could represent useful feedback for practical LTB estimates.
Author Contributions: The paper results from a joint collaboration of all the involved authors (D.S., S.M., and
C.B.). The research study derives from a past BSc Thesis (D.S.) and an ongoing Ph.D. project (S.M.) carried out
at University of Trieste (C.B. supervisor). All authors have read and agreed to the published version of the
manuscript.
Funding: This research received no external funding.
Acknowledgments: This paper was submitted, under invitation, for consideration in the MDPI Special Issue call
“Modeling and Testing of Laminated Glass”. In this regard, the Guest Editors Prof. Ing. Jan Zeman and Prof.
Ing. Michal Šejnoha are gratefully acknowledged for giving this opportunity. MPDI is also acknowledged for
the APC discount.
Conflicts of Interest: The authors declare no conflicts of interest.
References
1. Haldimann, M.; Luible, A.; Overend, M. Structural Use of Glass; IABSE – International Association for Bridge
and Structural Engineering: Zurich, Switzerland, 2008; ISBN 978-3-85748-119-2.
2. CEN/TC 250. prCEN/TS xxxx-1: 2019—In-Plane Loaded Glass Components (December 2019); CEN—European
Committee for Standardization: Brussels, Belgium, 2019.
Materials 2020, 13, 2492 25 of 27
3. CEN/TC 250. prCEN/TS xxxx-2: 2019—Out of-Plane Loaded Glass Components (December 2019); CEN—
European Committee for Standardization: Brussels, Belgium, 2019.
4. Langosch, K.; Dimova, S.; Pinto Artur, V.; Siebert, G.; Kasper, R.; Louter, C.; Royer-Carfagni, G.; Abeln, B.;
Rajcic, V.; Hoegner, H.; et al. Guidance for European Structural Design of Glass Components—Support to the
Implementation, Harmonization and Further Development of the Eurocodes; Report EUR 26439–Joint Research
Centre-Institute for the Protection and Security of the Citizen; Dimova, S., Pinto, A., Feldmann, M., Denton,
S., Eds.; European Union: Luxembourg, 2014, doi:10.2788/5523.
5. CNR-DT 210/2013. Istruzioni per la Progettazione. l'Esecuzione ed il Controllo di Costruzioni con Elementi
Strutturali in Vetro [Guideline for Design, Execution and Control of Constructions Made of Structural Glass
Elements (in Italian)]; National Research Council (CNR): Roma, Italy, 2013.
6. Buildings Department. Code of Practice for the Structural Use of Glass. 2018. Available online:
http://www.bd.gov.hk./ (accessed on 25 April 2020).
7. AIS Glass. Code of Practice for Use of Glass in Buildings. 2011. Available online:
https://www.aisglass.com/sites/default/files/pdfs/technical%20papers/AIS-59.pdf (accessed on 25 April
2020).
8. Martín, M.; Centelles, X.; Solé, A.; Barreneche, C.; Fernández, A.I.; Cabeza, L.F. Polymeric interlayer
materials for laminated glass: A review. Constr. Build. Mater. 2020, 230, 116897,
doi:10.1016/j.conbuildmat.2019.116897.
9. Kuntsche, J.; Schuster, M.; Schneider, J. Engineering design of laminated safety glass considering the shear
coupling: A review. Glass Struct. Eng. 2019, 4, 298–228.
10. Hänig, J.; Bukieda, P.; Engelmann, M.; Stelzer, I.; Weller, B. Examination of Laminated Glass with Stiff
Interlayers – Numerical and Experimental Research. Int. J. Struct. Glass Adv. Mater. Res. 2019, 3, 1–14,
doi:10.3844/sgamrsp.2019.1.14.
11. Hána, T.; Eliášová, M.; Sokol, Z. Structural Performance of Double Laminated Glass Panels with EVA and
PVB Interlayer in Four-Point Bending Tests. Int. J. Struct. Glass Adv. Mater. Res. 2018, 2, 164–177,
doi:10.3844/sgamrsp.2018.164.177.
12. Hána, T.; Janda, T.; Schmidt, J.; Zemanová, A.; Šejnoha, M.; Eliášová, M.; Vokáč, M. Experimental and
Numerical Study of Viscoelastic Properties of Polymeric Interlayers Used for Laminated Glass:
Determination of Material Parameters. Materials 2019, 12, 2241, doi:10.3390/ma12142241.
13. Dural, E. Analysis of delaminated glass beams subjected to different boundary conditions. Compos. Part B
Eng. 2016, 101, 132–146.
14. Bedon, C. Issues on the Vibration Analysis of In-Service Laminated Glass Structures: Analytical,
Experimental and Numerical Investigations on Delaminated Beams. Appl. Sci. 2019, 9, 3928,
doi:10.3390/app9183928.
15. Sable, L.; Kinsella, D.; Kozłowski, M. Influence of EVA, PVB and Ionoplast Interlayers on the Structural
Behaviour and Fracture Pattern of Laminated Glass. Int. J. Struct. Glass Adv. Mater. Res. 2019, 3, 62–78,
doi:10.3844/sgamrsp.2019.62.78.
16. Belis, J. Kipsterkte van Monolithische en Gelamineerde Glazen Liggers; Ghent University: Ghent, Belgium, 2005.
17. Belis, J.; Bedon, C.; Louter, C.; Amadio, C.; van Impe, R. Experimental an analytical assessment of lateral
torsional buckling of laminated glass beams. Eng. Struct. 2013, 51, 295–305.
18. Pešek, O.; Melcher, J. Lateral-torsional buckling of laminated structural glass beams. Experimental study.
Procedia Eng. 2017, 190, 70–77.
19. Rosati, G.; Orlando, M.; Piscitelli, L.R. Flexural-torsional buckling tests on laminated glass beams. Glass on
Web. 2013. Available online: https://www.glassonweb.com/article/flexural-torsional-buckling-tests-
laminated-glass-beams (accessed on 25 April 2020).
20. Horcicková, I.; Eliášová, M. Lateral and torsional stability of glass beams. In Proceedings of the 53rd
Conference on Experimental Stress Analysis, Český Krumlov, Czech Republic, 1–4 June 2015, pp. 130–133.
21. Valarihno, L.; Correia, J.R.; Machado-e-Costa, M.; Branco, F.A.; Silvestre, N. Lateral-torsional buckling
behaviour of long-span laminated glass beams: Analytical, experimental and numerical study. Mater. Des.
2016, 102, 264–275.
22. Bedon, C.; Belis, J.; Luible, A. Assessment of existing analytical models for the lateral torsional buckling
analysis of PVB an SG laminated glass beams via viscoelastic simulations and experiments. Eng. Struct.
2014, 60, 52–67.
Materials 2020, 13, 2492 26 of 27
23. Amadio, C.; Bedon, C. Buckling of laminated glass elements in out-of-plane bending. Eng. Struct. 2010, 32,
3780–3788.
24. Luible, A.; Crisinel, M. Design of Glass Beams Subjected to Lateral Torsional Buckling; IABSE Symposium
“Responding to Tomorrow s Challenges in Structural Engineering”, Report n. 92; Budapest, Hungary, 2006;
pp. 45–53. IABSE– International Association for Bridge and Structural Engineering: Zurich, Switzerland
25. Bedon, C.; Amadio, C. Design buckling curves for glass columns and beams. Struct. Build. 2015, 168, 514–
526.
26. Riddell-Smith, L.; Cunningham, L.S.; Mandal, P. Design of glass elements for lateral-torsional buckling:
Review of existing approaches. J. Archit. Eng. 2017, 23, doi:10.1061/(ASCE)AE.1943-5568.0000255.
27. Bedon, C.; Belis, J.; Amadio, C. Structural assessment and lateral-torsional buckling design of glass beams
restrained by continuous sealant joints. Eng. Struct. 2015, 120, 214–229.
28. Bedon, C.; Amadio, C. Analytical and numerical assessment of the strengthening effect of structural sealant
joints for the prediction of the LTB critical moment in laterally restrained glass beams. Mater. Struct. 2015,
10.1617/s11527-015-0661-z.
29. Sonck, D.; Belis, J. Elastic lateral-torsional buckling of glass beams with continuous lateral restraints. Glass
Struct. Eng. 2016, 1, 173–194.
30. Luible, A.; Schärer, D. Lateral torsional buckling of glass beams with continuous lateral support. Glass
Struct. Eng. 2016, 1, 153–171.
31. Belis, J.; van Impe, R.; Lagae, G.; Vanlaere, W. Enhancement of the buckling strength of glass beams by
means of lateral restraints. Struct. Eng. Mech. 2003, 15, 495–511.
32. McCann, F. Stability of Beams with Discrete Lateral Restraints. Ph.D. Thesis, Imperial College London,
London, UK, 2012.
33. McCann, F.; Gardner, L.; Wadee, M.A. Design of steel beams with discrete lateral restraints. J. Constr. Steel
Res. 2013, 80, 82–90.
34. LTBeam Freeware Software. Available online: https://www.cticm.com/logiciel/ltbeam/ (accessed on 25
April 2020).
35. Simulia. Dassault Systemes; Providence, RI, USA, 2020.
36. EN 1993-1-1: 2005. Eurocode 3 – Design of Steel Structures – Part 1–1: General Rules and Rules for Buildings; May
2005; CEN – European Committee for Standardization: Brussels, Belgium, 2005.
37. Galuppi, L.; Manara, G.; Royer, G. Practical expressions for the design of laminated glass. Compos. Part B
Eng. 2013, 45, 1677–1688.
38. Luible, A. Stabilität von Tragelementen aus Glas; Ecole Polytechnique Fédérale de Lausanne: Lausanne,
Switzerland, 2004.
39. Bedon, C.; Amadio, C. Flexural–torsional buckling: Experimental analysis of laminated glass elements. Eng.
Struct. 2014, 73, 85–99.
40. Valentino, J.; Pi, Y.L.; Trahair, N.S. Inelastic buckling of steel beams with central torsional restraints. J.
Struct. Eng. 1997, 123, doi:10.1061/(ASCE)0733-9445(1997)123:9(1180).
41. Lindner, J. Lateral Torsional Buckling of Steel Beams and Rectangular Glass Beams Consisting of Single Panes - A
Comparison. Steel - A New and Traditional Material for Building; Dan Dubina & Viorel Ungureanu Eds.; 2006;
pp. 199–205, ISBN 0-415-40817-2. Taylor & Francis Group, London, UK
42. Bruins, R.H.J. Lateral-Torsional Buckling of Laterally Restrained Steel Beams. Master’s Thesis, Eindhoven
University of Technology, Eindhoven, The Netherlands, 2005.
43. Trahair, N.S. Flexural-Torsional Buckling of Structures; E & FN SPON: London, UK, 1993.
44. Handbook, P. Teflon PTFE. Available online: http://www.rjchase.com/ptfe_handbook.pdf. (accessed on 25
May 2020).
45. Rae, P.J.; Dattelbaum, D.M. The properties of poly (tetrafluoroethylene) (PTFE) in compression. Polymer
2004, 45, 7615–7625.
46. Hernández-Jimánez, A.; Hernández-Santiago, J.; Macias-García, A.; Sánchez-González, J. Relaxation
modulus in PMMA and PTFE fitting by fractional Maxwell model. Polym. Test 2002, 21, 325–331.
47. Nunes, L.C.S.; Dias, F.W.R.; da Costa Mattos, H.S. Mechanical behavior of polytetrafluoroethylene in
tensile loading under different strain rates. Polym. Test. 2011, 30, 791–796.
48. Ge, C.; Maimaitituersun, W.; Dong, Y.; Tian, C. A Study on the Mechanical Properties and Impact-Induced
Initiation Characteristics of Brittle PTFE/Al/W Reactive Materials. Materials 2017, 10, 452,
doi:10.3390/ma10050452.
Materials 2020, 13, 2492 27 of 27
49. Krempl, E.; Khan, F. Rate (time)-dependent deformation behavior: An overview of some properties of
metals and solid polymers. Int. J. Plast. 2003, 19, 1069–1095.
50. EN 572-2:2004. Glass in Buildings – Basic Soda Lime Silicate Glass Products; CEN – European Committee for
Standardization: Brussels, Belgium, 2004.
51. EN 10088-2: 2014. Stainless Steels - Part 2: Technical Delivery Conditions for Sheet/Plate and Strip of Corrosion
Resisting Steels for General Purposes; CEN – European Committee for Standardization: Brussels, Belgium,
2014.
© 2020 by the authors. Licensee MDPI, Basel, Switzerland. This article is an open access
article distributed under the terms and conditions of the Creative Commons Attribution
(CC BY) license (http://creativecommons.org/licenses/by/4.0/).


