Embed Size (px)
Citation preview
Electrochemical Characterization of a Solid Oxide MembraneElectrolyzer for Production of High-Purity Hydrogen
SOOBHANKAR PATI, KYUNG JOONG YOON, SRIKANTH GOPALAN,and UDAY B. PAL
A laboratory-scale solid oxide membrane (SOM) steam electrolyzer that can potentially useenergy value in waste or any source of carbon or hydrocarbon to produce high-purity hydrogenhas been fabricated and evaluated. The SOM electrolyzer comprises an oxygen-ion-conductingyttria-stabilized zirconia (YSZ) electrolyte with a Ni-YSZ cermet cathode coated on one sideand liquid-metal anode on the other side. The SOM electrolyzer is operated at 1000 �C byproviding a steam-rich gas feed to the Ni-YSZ cermet cathode and feeding a reductant sourceinto the liquid-metal anode. The steam is reduced over the cathode, and oxygen ions aretransported through the YSZ electrolyte and are oxidized at the molten metal electrode by thereductant feed. The advantage of SOM electrolyzer over the state-of-the-art solid oxide elec-trolyzer is its ability to use solid, liquid, and gaseous reductant feed in the liquid-metal anode toreduce the oxygen chemical potential and drive the reaction for hydrogen production. In thisstudy, an electrochemical process model for a SOM electrolyzer was developed. The conditionof the liquid-metal anode with reductant was simulated by bubbling humidified hydrogen (3 pctH2O) in the liquid metal, and the electrochemical performance of the SOM electrolyzer wasmodeled. The experimental data were curve-fitted into the model to identify the variouspolarization losses. It showed that the performance of the SOM electrolyzer was dominated bythe ohmic resistance of the YSZ membrane. Based on the results of this study, future work isneeded toward increasing the performance efficiency of the SOM electrolyzer.
DOI: 10.1007/s11663-009-9286-3� The Minerals, Metals & Materials Society and ASM International 2009
I. INTRODUCTION
THE annual energy consumption is approximately450 quadrillion BTU and is expected to double in thenext 40 years.[1] Most of this energy (~85 pct) isobtained from nonrenewable carbon-based sources withno means for CO2 sequestration. This process hascontributed to global warming because of the increase incontent of the atmospheric CO2. Hydrogen-basedenergy economy from carbon-neutral energy sourceshas been envisioned as one of the potential solutions tothis crisis.[2] Currently, almost all the hydrogen isproduced by the reformation of methane with steamor coal gasification reactions with steam, and the use islimited to ammonia production and petroleum refin-ing.[3] A cleaner, reliable, cheaper hydrogen productionroute that is independent of fossil fuel is necessary forhydrogen to be used extensively as an energy carrier.
Another process to produce pure hydrogen is elec-trolysis of water at a high temperature using a solidoxide steam electrolyzer (SOSE) based on an oxygen-conducting stabilized electrolyte.[4] In a SOSE, a mixture
of steam and hydrogen is fed to the cathode and air iscirculated over the anode. At the cathode–electrolyteinterface, steam is dissociated, which employs an exter-nal electrical power source to form hydrogen andoxygen ions. The oxygen ions migrate across theelectrolyte and are oxidized to form gaseous oxygen atthe anode–electrolyte interface. The overall reaction ofthe SOSE is as follows:
2H2O gð Þ ¼ 2H2 gð Þ þO2 gð Þ ½1�
The open-circuit/Nernst potential at 1000 �C of theSOSE with a gas composition of 90 pct H2O-H2 at thecathode and air at the anode is 0.75 V. The appliedpotential across the cathode and the anode must begreater than the open-circuit potential to drive thereaction (Eq. [1]) forward and produce hydrogen. In aconventional SOSE, 60 to 70 pct of the electric poweris used to overcome this energy barrier to drive thereaction forward.[4] The open-circuit potential (energybarrier) and, thus, the electrical energy consumptioncan be reduced by reducing the oxygen chemical po-tential at the anode using a reductant. In previousstudies, researchers have proposed using CO and natu-ral gas to decrease the anodic oxygen chemical poten-tial in a SOSE.[5–7] However, the conventional SOSEanode cannot handle solid waste as a reductant feed,because the solid anode in the SOSE does not providesites to perform charge transfer simultaneously whileoxidizing the reductant feed. In this article, a solid
SOOBHANKAR PATI, Graduate Student, KYUNG JOONGYOON, Postdoctoral Research Associate, SRIKANTH GOPALAN,Associate Professor, and UDAY B. PAL, Professor, are with theDivision of Materials Science and Engineering, Department ofMechanical Engineering, Boston University, 15 Saint Mary’s Street,Brookline, MA 02446. Contact e-mail: [email protected].
Manuscript submitted January 28, 2009.Article published online September 1, 2009.
METALLURGICAL AND MATERIALS TRANSACTIONS B VOLUME 40B, DECEMBER 2009—1041
oxide membrane (SOM) electrolyzer with liquid-metalanode is proposed in which any hydrocarbon wasteand fossil fuel such as coal, methane, and natural gascan be used as the reductant in the anode, and purehydrogen can be produced from steam at the cathode.When the electrolyzer is operated between 850 �C and1100 �C with coal or carbon containing waste in theliquid-metal anode, the net reaction of hydrogen pro-duction is given as follows[8]:
H2O gð Þ þ C ¼ H2 gð Þ þ CO gð Þ ½2�
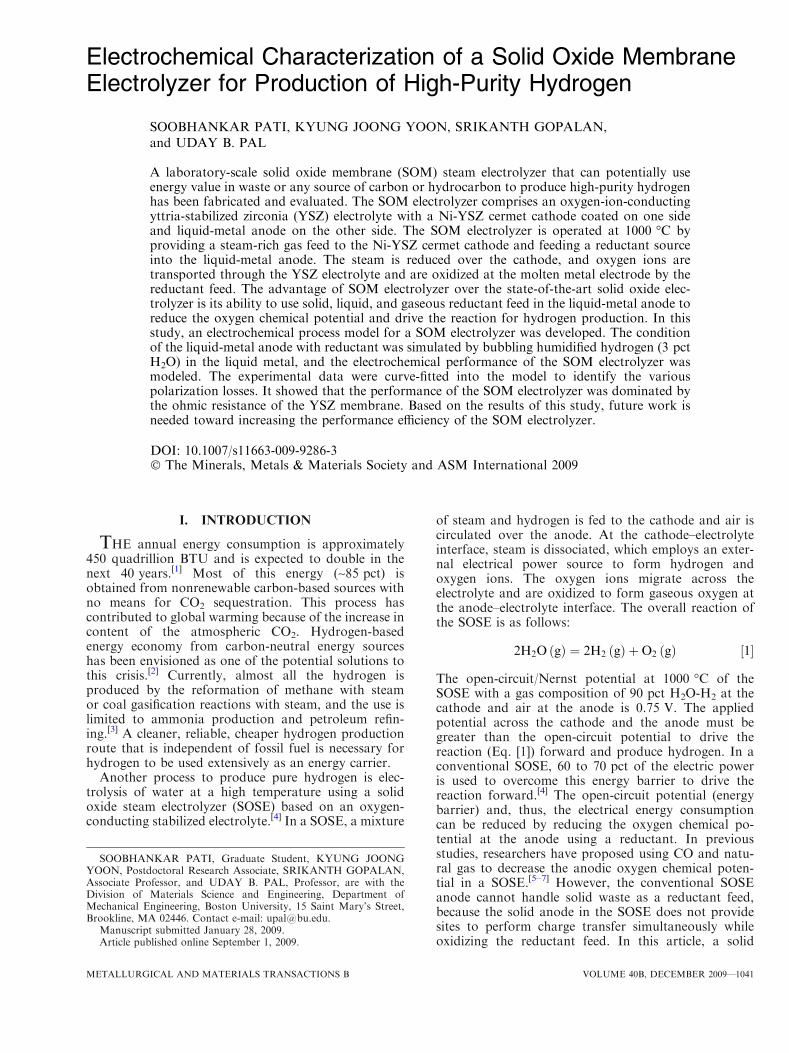
Comparison of the energy required for the SOSEand SOM electrolyzer is shown in Figure 1. It clearlyshows that when carbon is used as a reductant in theliquid-metal anode, an inherent thermodynamic drivingforce exists for hydrogen production (Eq. [2]) attemperatures greater than 650 �C. Therefore, thehydrogen production reaction is spontaneous in suchconditions, and any additional electrical energy sup-plied to the SOM electrolyzer would accelerate thehydrogen production rate. Any hydrocarbon wasteused as feedstock in the liquid-metal anode also willhave a similar effect.
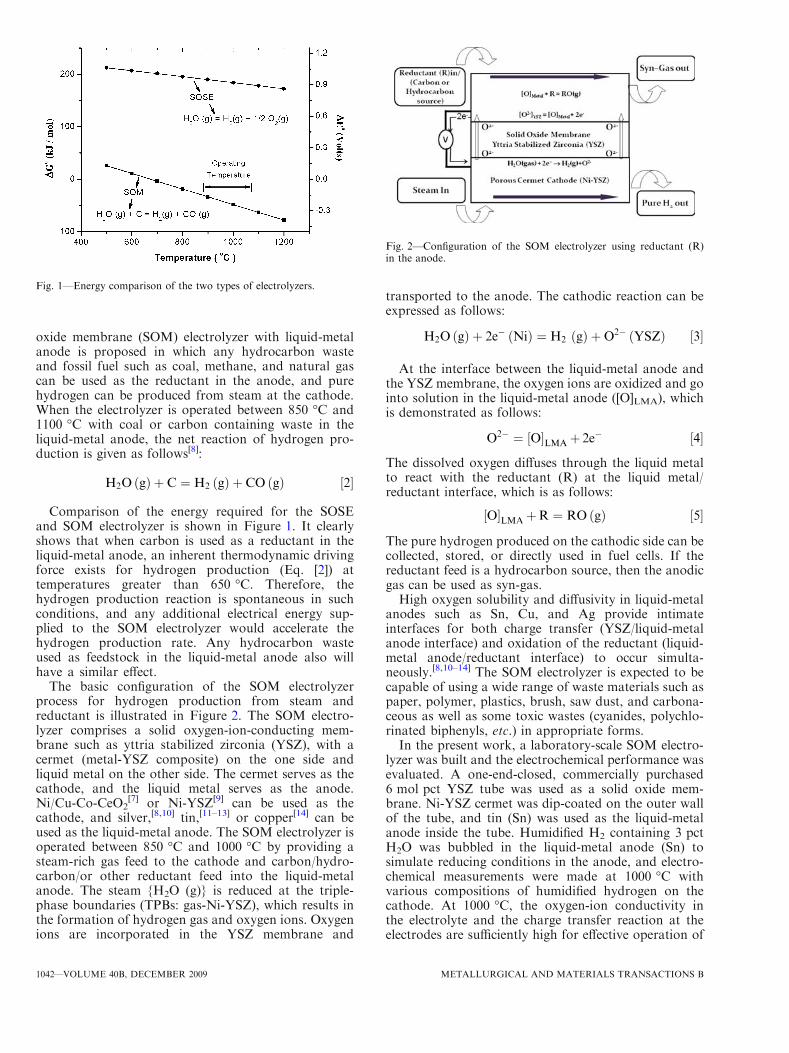
The basic configuration of the SOM electrolyzerprocess for hydrogen production from steam andreductant is illustrated in Figure 2. The SOM electro-lyzer comprises a solid oxygen-ion-conducting mem-brane such as yttria stabilized zirconia (YSZ), with acermet (metal-YSZ composite) on the one side andliquid metal on the other side. The cermet serves as thecathode, and the liquid metal serves as the anode.Ni/Cu-Co-CeO2
[7] or Ni-YSZ[9] can be used as thecathode, and silver,[8,10] tin,[11–13] or copper[14] can beused as the liquid-metal anode. The SOM electrolyzer isoperated between 850 �C and 1000 �C by providing asteam-rich gas feed to the cathode and carbon/hydro-carbon/or other reductant feed into the liquid-metalanode. The steam {H2O (g)} is reduced at the triple-phase boundaries (TPBs: gas-Ni-YSZ), which results inthe formation of hydrogen gas and oxygen ions. Oxygenions are incorporated in the YSZ membrane and
transported to the anode. The cathodic reaction can beexpressed as follows:
H2O gð Þ þ 2e� Nið Þ ¼ H2 gð Þ þO2� YSZð Þ ½3�
At the interface between the liquid-metal anode andthe YSZ membrane, the oxygen ions are oxidized and gointo solution in the liquid-metal anode ([O]LMA), whichis demonstrated as follows:
O2� ¼ O½ �LMAþ 2e� ½4�
The dissolved oxygen diffuses through the liquid metalto react with the reductant (R) at the liquid metal/reductant interface, which is as follows:
O½ �LMAþR ¼ RO gð Þ ½5�
The pure hydrogen produced on the cathodic side can becollected, stored, or directly used in fuel cells. If thereductant feed is a hydrocarbon source, then the anodicgas can be used as syn-gas.High oxygen solubility and diffusivity in liquid-metal
anodes such as Sn, Cu, and Ag provide intimateinterfaces for both charge transfer (YSZ/liquid-metalanode interface) and oxidation of the reductant (liquid-metal anode/reductant interface) to occur simulta-neously.[8,10–14] The SOM electrolyzer is expected to becapable of using a wide range of waste materials such aspaper, polymer, plastics, brush, saw dust, and carbona-ceous as well as some toxic wastes (cyanides, polychlo-rinated biphenyls, etc.) in appropriate forms.In the present work, a laboratory-scale SOM electro-
lyzer was built and the electrochemical performance wasevaluated. A one-end-closed, commercially purchased6 mol pct YSZ tube was used as a solid oxide mem-brane. Ni-YSZ cermet was dip-coated on the outer wallof the tube, and tin (Sn) was used as the liquid-metalanode inside the tube. Humidified H2 containing 3 pctH2O was bubbled in the liquid-metal anode (Sn) tosimulate reducing conditions in the anode, and electro-chemical measurements were made at 1000 �C withvarious compositions of humidified hydrogen on thecathode. At 1000 �C, the oxygen-ion conductivity inthe electrolyte and the charge transfer reaction at theelectrodes are sufficiently high for effective operation of
Fig. 1—Energy comparison of the two types of electrolyzers.
Fig. 2—Configuration of the SOM electrolyzer using reductant (R)in the anode.
1042—VOLUME 40B, DECEMBER 2009 METALLURGICAL AND MATERIALS TRANSACTIONS B
the SOM electrolyzer.[4,5,16,17] A polarization model thatdescribed the performance of the SOM electrolyzer wasdeveloped, and the experimental data were fitted intothe model to analyze various polarization losses.
II. ELECTROCHEMICAL MODEL
The electrochemical process model for hydrogenproduction using a SOM electrolyzer is similar to themodel proposed by Oberg et al.[16] and Yuan et al.[17]
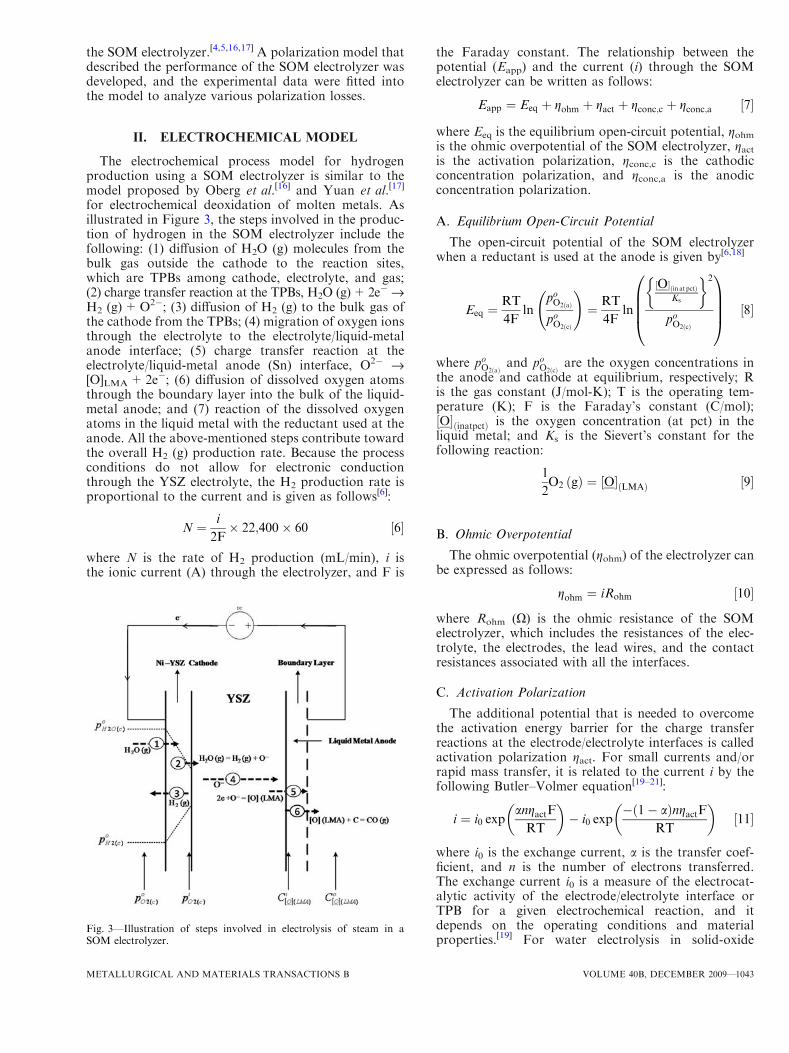
for electrochemical deoxidation of molten metals. Asillustrated in Figure 3, the steps involved in the produc-tion of hydrogen in the SOM electrolyzer include thefollowing: (1) diffusion of H2O (g) molecules from thebulk gas outside the cathode to the reaction sites,which are TPBs among cathode, electrolyte, and gas;(2) charge transfer reaction at the TPBs, H2O (g)+2e� fiH2 (g)+O2�; (3) diffusion of H2 (g) to the bulk gas ofthe cathode from the TPBs; (4) migration of oxygen ionsthrough the electrolyte to the electrolyte/liquid-metalanode interface; (5) charge transfer reaction at theelectrolyte/liquid-metal anode (Sn) interface, O2� fi[O]LMA+2e�; (6) diffusion of dissolved oxygen atomsthrough the boundary layer into the bulk of the liquid-metal anode; and (7) reaction of the dissolved oxygenatoms in the liquid metal with the reductant used at theanode. All the above-mentioned steps contribute towardthe overall H2 (g) production rate. Because the processconditions do not allow for electronic conductionthrough the YSZ electrolyte, the H2 production rate isproportional to the current and is given as follows[6]:
N ¼ i
2F� 22;400� 60 ½6�
where N is the rate of H2 production (mL/min), i isthe ionic current (A) through the electrolyzer, and F is
the Faraday constant. The relationship between thepotential (Eapp) and the current (i) through the SOMelectrolyzer can be written as follows:
Eapp ¼ Eeq þ gohm þ gact þ gconc;c þ gconc;a ½7�
where Eeq is the equilibrium open-circuit potential, gohmis the ohmic overpotential of the SOM electrolyzer, gactis the activation polarization, gconc,c is the cathodicconcentration polarization, and gconc,a is the anodicconcentration polarization.
A. Equilibrium Open-Circuit Potential
The open-circuit potential of the SOM electrolyzerwhen a reductant is used at the anode is given by[6,18]
Eeq ¼RT
4Fln
poO2ðaÞ
poO2ðcÞ
!¼ RT
4Fln
½O�ðin at pctÞKs
� �2
poO2ðcÞ
0BBB@
1CCCA ½8�
where poO2 að Þand poO2 cð Þ
are the oxygen concentrations inthe anode and cathode at equilibrium, respectively; Ris the gas constant (J/mol-K); T is the operating tem-perature (K); F is the Faraday’s constant (C/mol);O½ � inatpctð Þ is the oxygen concentration (at pct) in theliquid metal; and Ks is the Sievert’s constant for thefollowing reaction:
1
2O2 gð Þ ¼ O½ � LMAð Þ ½9�
B. Ohmic Overpotential
The ohmic overpotential (gohm) of the electrolyzer canbe expressed as follows:
gohm ¼ iRohm ½10�
where Rohm (X) is the ohmic resistance of the SOMelectrolyzer, which includes the resistances of the elec-trolyte, the electrodes, the lead wires, and the contactresistances associated with all the interfaces.
C. Activation Polarization
The additional potential that is needed to overcomethe activation energy barrier for the charge transferreactions at the electrode/electrolyte interfaces is calledactivation polarization gact. For small currents and/orrapid mass transfer, it is related to the current i by thefollowing Butler–Volmer equation[19–21]:
i ¼ i0 expangactFRT
� �� i0 exp
� 1� að ÞngactFRT
� �½11�
where i0 is the exchange current, a is the transfer coef-ficient, and n is the number of electrons transferred.The exchange current i0 is a measure of the electrocat-alytic activity of the electrode/electrolyte interface orTPB for a given electrochemical reaction, and itdepends on the operating conditions and materialproperties.[19] For water electrolysis in solid-oxide
Fig. 3—Illustration of steps involved in electrolysis of steam in aSOM electrolyzer.
METALLURGICAL AND MATERIALS TRANSACTIONS B VOLUME 40B, DECEMBER 2009—1043
electrolyzers, the transfer coefficient (a) and the num-ber of electrons transferred (n) are found to be 0.5 and2, respectively.[20,22] If the values of a = 0.5 andn = 2 are substituted into Eq. [11], then the Butler–Volmer equation is expressed as follows:
i ¼ i0 expgactFRT
� �� i0 exp �
gactFRT
� �½12�
Using hyperbolic sine, Eq. [12] can be written asfollows:
1
2
i
i0
� �¼
exp gactFRT
� �� exp �gactF
RT
� �2
8<:
9=; ¼ sin h
gactFRT
� �
½13�
Using the inverse hyperbolic sine function in Eq. [13],gact can be expressed as follows:
gact ¼RT
Fsin h�1
i
2i0
� �½14�
Equation [14] can be written in logarithm form, andthus, the relationship between the activation polariza-tion and the current can be expressed as follows[20,21]:
gact ¼RT
Fln
i
2i0
� �þ
ffiffiffiffiffiffiffiffiffiffiffiffiffiffiffiffiffiffiffiffiffii
2i0
� �2
þ1
s24
35 ½15�
Both activation polarizations occurring at the cathode(gact,c) and anode (gact,a) are lumped together in gact, asgiven in Eq. [15].
D. Cathodic Concentration Polarization
The cathodic concentration polarization is caused bythe slow mass transport of the gas species (H2, H2O)across the cathode and can be expressed as follows[21–23]:
gconc;c ¼RT
4Fln
poO2 cð Þ
pðiÞO2 cð Þ
0@
1A ½16�
where poO2 cð Þis the oxygen partial pressure in the cath-
ode bulk gas and pðiÞO2 cð Þ
is the oxygen partial pressure
at the cathode–electrolyte interface under a certain
current density. The values of poO2 cð Þand p
ðiÞO2 cð Þ
are deter-
mined by the local H2-H2O equilibrium in the cathodebulk gas and at the cathode–electrolyte interface,respectively, which is demonstrated as follows:
poO2 cð Þ¼ Keq
poH2O cð Þ
poH2 cð Þ
!2
½17�
pðiÞO2 cð Þ¼ Keq
pðiÞH2O cð Þ
pðiÞH2 cð Þ
0@
1A
2
½18�
where Keq is the equilibrium constant for the reac-tion 2H2O (g) = O2 (g)+2H2 (g) and poH2 cð Þ
and poH2O cð Þ
are the partial pressures of H2 and H2O in the cathodebulk gas, respectively, as well as the partial pressures ofH2 and H2O at the cathode–electrolyte interface undera given current density, respectively. SubstitutingEq. [17] and Eq. [18] into Eq. [16], the cathodic concen-tration polarization can be expressed as follows:
gconc;c ¼RT
2Fln
poH2OðcÞ � pðiÞH2ðcÞ
poH2ðcÞ � pðiÞH2OðcÞ
0@
1A ½19�
The partial pressure of hydrogen pðiÞH2ðcÞ and partial
pressure of steam pðiÞH2OðcÞ at the cathode–electrolyte
interface can be obtained from the analysis of thetransport of the gas species through the porous cath-ode assuming that the dominant contribution to thegas transport is binary diffusion.[25] The SOM electro-lyzer operates at a fixed total pressure (P), and themolar consumption rate of H2O (g) is equal to the H2
(g) production rate; therefore, the sum of partial pres-sure of H2 and H2O at any location (x) in the cathodeat steady state would be equal to the total pressure(P), which is indicated in the following equation:
P ¼ pxH2ðcÞ þ pxH2OðcÞ ½20�
Because the fluxes of hydrogen (JH2) and steam (JH2O)
are equal and in opposite direction (JH2þ JH2O ¼ 0),
JH2and JH2O can be expressed as follows:
JH2A ¼ �JH2OA ¼
i
2F½21�
where i is the total current and A is the effective elec-trode area. The mass transport in the cathode, asshown in Figure 3, is driven by the concentration gra-dient, and the flux of steam can be expressed by Fick’sfirst law as follows:
JH2O ¼ DeffH2-H2O
d
dx
pH2OðcÞRT
� �½22�
where DeffH2-H2O
is the effective binary diffusivity of H2
and H2O in the cathode.[20,21,25] From Eqs. [21] and[22], the following occurs:
� i
2F¼
ADeffH2-H2O
RT
dpH2OðcÞdx
½23�
The partial pressures of the H2O (g) at the cathode–electrolyte interface and in the bulk gas are given as
pH2OðcÞ��x¼ t¼ piH2OðcÞ ½24�
pH2OðcÞ��x¼0¼ poH2OðcÞ ½25�
where t is the thickness of the cathode. The partialpressure of H2O at the cathode–electrolyte interfacecan be obtained by integrating Eq. [23] across thecathode using the boundary conditions given inEqs. [24] and [25], as follows:
pðiÞH2OðaÞ ¼ poH2OðaÞ �
RTt
2FADeffH2-H2O
i ½26�
1044—VOLUME 40B, DECEMBER 2009 METALLURGICAL AND MATERIALS TRANSACTIONS B
The partial pressure of H2 at the cathode–electrolyteinterface can be obtained from Eqs. [20] and [26] asfollows:
piH2ðcÞ ¼ P� piH2OðcÞ ¼ poH2ðcÞ þ poH2OðcÞ
� �
� poH2OðcÞ �RTt
2FADeffH2-H2O
i
!
¼ poH2ðcÞ þRTt
2FADeffH2-H2O
i ½27�
Substituting Eqs. [26] and [27] into Eq. [19], the catho-dic concentration polarization can be expressed asfollows[21,25]:
gconc;c ¼RT
2Fln
1þ RTt2FADeff
H2-H2OpoH2ðcÞ
i
1� RTt2FADeff
H2-H2OpoH2OðcÞ
i
0@
1A ½28�
E. Anodic Concentration Polarization
The anodic concentration polarization is generatedbecause of the diffusion of dissolved oxygen atomsacross the boundary layer in the liquid-metal anode(Figure 3). The anodic concentration polarization gconc,acan be expressed by a Nernst type equation, which is asfollows:
gconc;a ¼RT
2Fln
aiO½ �ðLMAÞ
aoO½ �ðLMAÞ
0@
1A ½29�
where aiO½ �ðLMAÞ is the activity of dissolved oxygen in
the liquid-metal anode at the liquid-metal anode–electrolyte interface and ao
O½ �ðLMAÞ is the activity of dis-
solved oxygen in the bulk of the liquid-metal anode.Assuming a Henrian solution, Eq. [29] can be writtenas[16–18]
gconc;a ¼RT
2Fln
CiO½ � LMAð Þ
CoO½ � LMAð Þ
0@
1A ½30�
where CiO½ � LMAð Þ and Co
O½ � LMAð Þ are the concentrations
of the dissolved oxygen in the liquid-metal anode atthe electrolyte–anode interface and in the bulk, respec-tively. The oxygen chemical potential or the concentra-tion of the dissolved oxygen in the bulk of the liquidmetal is determined by the reductant used in theanode. The oxygen flux in the melt across the bound-ary layer is expressed as follows:
J O½ � ¼ DLMAO½ �
dC O½ � LMAð Þ
dx½31�
where DLMAO½ � is the diffusivity of dissolved oxygen in the
liquid-metal anode. The flux of dissolved oxygen (J[O])can be described in terms of the current in theelectrolyzer, as follows:
J O½ �A ¼ �i
2F½32�
Using Eqs. [31] and [32] and assuming mass accumula-tion does not occur at the liquid-metal anode/electro-lyte interface, the concentration of dissolved oxygen atthe liquid-metal anode/electrolyte interface (mol/m3)can be expressed as follows[17]:
CiO½ � LMAð Þ ¼ Co
O½ � LMAð Þ þZb0
i
2FADLMA
O½ �dx ½33�
where b is the boundary layer thickness in the liquidtin anode. Substituting Eq. [33] into Eq. [30], theanodic concentration polarization can be rewritten asfollows:
nconc;a ¼RT
2Fln 1þ b
2FADLMAO½ � Co
O½ � LMAð Þi
0@
1A ½34�
F. Total Overpotential
The relationship between the operating potential andthe current density is obtained by substituting Eqs. [8],[10], [15], [28], and [34] into Eq. [7], which is demon-strated as follows:
Eapp ¼RT
4Fln
O½ �in at pctð ÞKs
2
poO2ðcÞ
0B@
1CAþ i� Rohm
þRT
Fln
i
2i0
� �þ
ffiffiffiffiffiffiffiffiffiffiffiffiffiffiffiffiffiffiffiffiffii
2i0
� �2
þ1
s24
35
þRT
2Fln
1þ RTt2FADeff
H2-H2OpoH2ðcÞ
i
1� RTt2FADeff
H2-H2OpoH2OðcÞ
i
0@
1A
þRT
2Fln 1þ b
2FADLMAO½ � Co
O½ � LMAð Þi
0@
1A
½35�
The electrochemical model developed in this section is ageneral phenomenological model for the SOM electro-lyzer. It can be modified to evaluate the SOM electro-lyzers with different design and operating conditions.
III. EXPERIMENTAL
A. Fabrication and Electrochemical Characterizationof SOM Electrolyzer
The SOM electrolyzer was fabricated by dip coatingNi-YSZ cermet cathode on the outer wall of an end-closed YSZ (6 mol pct yttria) (6YSZ) tube that waspurchased from McDanel Advance Ceramic Technolo-gies (Beaver Falls, PA). The dip coating process, whichwas developed for making the Ni-YSZ cermet cathode,
METALLURGICAL AND MATERIALS TRANSACTIONS B VOLUME 40B, DECEMBER 2009—1045
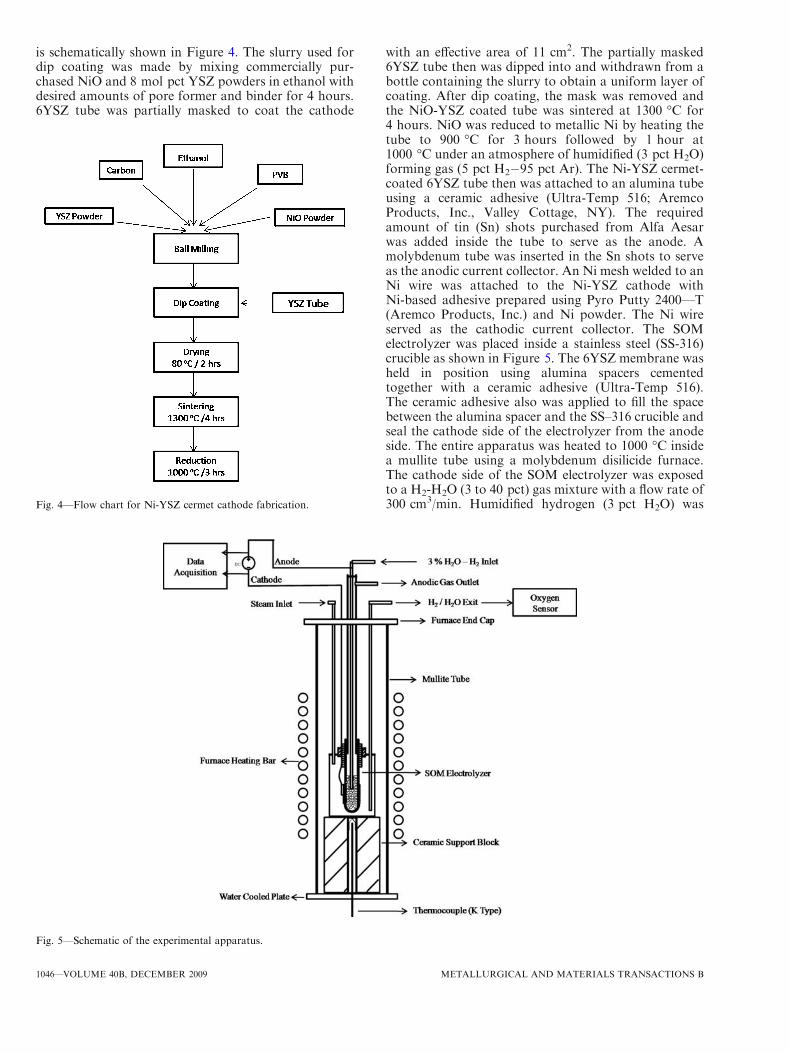
is schematically shown in Figure 4. The slurry used fordip coating was made by mixing commercially pur-chased NiO and 8 mol pct YSZ powders in ethanol withdesired amounts of pore former and binder for 4 hours.6YSZ tube was partially masked to coat the cathode
with an effective area of 11 cm2. The partially masked6YSZ tube then was dipped into and withdrawn from abottle containing the slurry to obtain a uniform layer ofcoating. After dip coating, the mask was removed andthe NiO-YSZ coated tube was sintered at 1300 �C for4 hours. NiO was reduced to metallic Ni by heating thetube to 900 �C for 3 hours followed by 1 hour at1000 �C under an atmosphere of humidified (3 pct H2O)forming gas (5 pct H2�95 pct Ar). The Ni-YSZ cermet-coated 6YSZ tube then was attached to an alumina tubeusing a ceramic adhesive (Ultra-Temp 516; AremcoProducts, Inc., Valley Cottage, NY). The requiredamount of tin (Sn) shots purchased from Alfa Aesarwas added inside the tube to serve as the anode. Amolybdenum tube was inserted in the Sn shots to serveas the anodic current collector. An Ni mesh welded to anNi wire was attached to the Ni-YSZ cathode withNi-based adhesive prepared using Pyro Putty 2400—T(Aremco Products, Inc.) and Ni powder. The Ni wireserved as the cathodic current collector. The SOMelectrolyzer was placed inside a stainless steel (SS-316)crucible as shown in Figure 5. The 6YSZ membrane washeld in position using alumina spacers cementedtogether with a ceramic adhesive (Ultra-Temp 516).The ceramic adhesive also was applied to fill the spacebetween the alumina spacer and the SS–316 crucible andseal the cathode side of the electrolyzer from the anodeside. The entire apparatus was heated to 1000 �C insidea mullite tube using a molybdenum disilicide furnace.The cathode side of the SOM electrolyzer was exposedto a H2-H2O (3 to 40 pct) gas mixture with a flow rate of300 cm3/min. Humidified hydrogen (3 pct H2O) wasFig. 4—Flow chart for Ni-YSZ cermet cathode fabrication.
Fig. 5—Schematic of the experimental apparatus.
1046—VOLUME 40B, DECEMBER 2009 METALLURGICAL AND MATERIALS TRANSACTIONS B
bubbled through the molybdenum tube at a rate of70 cm3/min into the liquid-metal anode (Sn). Electro-chemical measurements were made with the AMETEKPrinceton Applied Research 263A potentiostat (OakRidge, TN), Solartron 1250B frequency response ana-lyzer (Emerson Process Management, Pittsburgh, PA),and Kepco power amplifier (Flushing, NY). After theelectrochemical measurements, the electrolyzer wassectioned for microstructural evaluation.
IV. RESULTS AND DISCUSSION
A. Microstructure
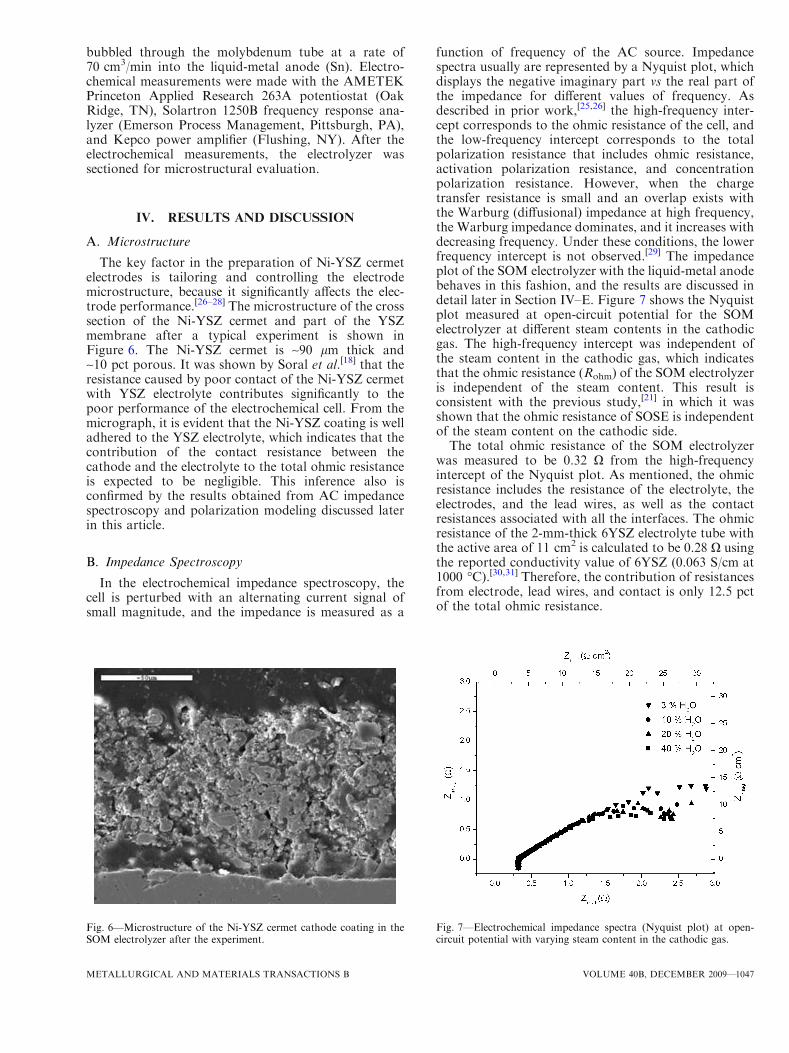
The key factor in the preparation of Ni-YSZ cermetelectrodes is tailoring and controlling the electrodemicrostructure, because it significantly affects the elec-trode performance.[26–28] The microstructure of the crosssection of the Ni-YSZ cermet and part of the YSZmembrane after a typical experiment is shown inFigure 6. The Ni-YSZ cermet is ~90 lm thick and~10 pct porous. It was shown by Soral et al.[18] that theresistance caused by poor contact of the Ni-YSZ cermetwith YSZ electrolyte contributes significantly to thepoor performance of the electrochemical cell. From themicrograph, it is evident that the Ni-YSZ coating is welladhered to the YSZ electrolyte, which indicates that thecontribution of the contact resistance between thecathode and the electrolyte to the total ohmic resistanceis expected to be negligible. This inference also isconfirmed by the results obtained from AC impedancespectroscopy and polarization modeling discussed laterin this article.
B. Impedance Spectroscopy
In the electrochemical impedance spectroscopy, thecell is perturbed with an alternating current signal ofsmall magnitude, and the impedance is measured as a
function of frequency of the AC source. Impedancespectra usually are represented by a Nyquist plot, whichdisplays the negative imaginary part vs the real part ofthe impedance for different values of frequency. Asdescribed in prior work,[25,26] the high-frequency inter-cept corresponds to the ohmic resistance of the cell, andthe low-frequency intercept corresponds to the totalpolarization resistance that includes ohmic resistance,activation polarization resistance, and concentrationpolarization resistance. However, when the chargetransfer resistance is small and an overlap exists withthe Warburg (diffusional) impedance at high frequency,the Warburg impedance dominates, and it increases withdecreasing frequency. Under these conditions, the lowerfrequency intercept is not observed.[29] The impedanceplot of the SOM electrolyzer with the liquid-metal anodebehaves in this fashion, and the results are discussed indetail later in Section IV–E. Figure 7 shows the Nyquistplot measured at open-circuit potential for the SOMelectrolyzer at different steam contents in the cathodicgas. The high-frequency intercept was independent ofthe steam content in the cathodic gas, which indicatesthat the ohmic resistance (Rohm) of the SOM electrolyzeris independent of the steam content. This result isconsistent with the previous study,[21] in which it wasshown that the ohmic resistance of SOSE is independentof the steam content on the cathodic side.The total ohmic resistance of the SOM electrolyzer
was measured to be 0.32 X from the high-frequencyintercept of the Nyquist plot. As mentioned, the ohmicresistance includes the resistance of the electrolyte, theelectrodes, and the lead wires, as well as the contactresistances associated with all the interfaces. The ohmicresistance of the 2-mm-thick 6YSZ electrolyte tube withthe active area of 11 cm2 is calculated to be 0.28 X usingthe reported conductivity value of 6YSZ (0.063 S/cm at1000 �C).[30,31] Therefore, the contribution of resistancesfrom electrode, lead wires, and contact is only 12.5 pctof the total ohmic resistance.
Fig. 6—Microstructure of the Ni-YSZ cermet cathode coating in theSOM electrolyzer after the experiment.
Fig. 7—Electrochemical impedance spectra (Nyquist plot) at open-circuit potential with varying steam content in the cathodic gas.
METALLURGICAL AND MATERIALS TRANSACTIONS B VOLUME 40B, DECEMBER 2009—1047
C. Open-Circuit Potential
As discussed in Section II(C), the open-circuitpotential is determined by the ratio of oxygen concen-trations in the anode and cathode. The open-circuitpotentials at different steam content can be calculatedusing Eq. [8]. The partial pressure of oxygen in thecathodic gas can be calculated using Eq. [17] at varioussteam contents. In the present study, liquid tin was usedas the anode, and the partial pressure of oxygen on theanode side was maintained by bubbling humidifiedhydrogen (3 pct H2O) in the liquid tin. The oxygenpartial pressure in the liquid tin anode is calculated byusing Eq. [36], which is as follows:
poO2ðaÞ ¼poH2OðaÞpoH2ðaÞ
!2
�Keq ½36�
Where poH2OðaÞ and poH2ðaÞ are partial pressure of watervapor and hydrogen, respectively, in the anode bub-bling gas, and Keq is the thermodynamic equilibriumconstant for the following reaction:
2 H2O gð Þ ¼ 2 H2 gð Þ þO2 gð Þ ½37�
When oxygen partial pressure poO2ðaÞ on the anodic sideof the SOM electrolyzer is known, the equilibriumconcentration of dissolved oxygen (at pct) in the liquidtin can be expressed as follows:
½O�ðin at pctÞ ¼ Ks poO2ðaÞ
� �12¼ Ks
poH2OðaÞpoH2ðaÞ
!�
ffiffiffiffiffiffiffiffiKeq
p½38�
The Sievert’s constant Ks for oxygen dissolution (reac-tion [9]) was calculated from the equilibrium solubilityof oxygen Ns
O½ �Sn
� �in liquid tin[32]:
Ks ¼Ns
O½ �Sn
pSn=SnO2
O2
� �1=2 ¼ 1:3� 105 exp 30;000~R�T
� �pSn=SnO2
O2
� �1=2 ½39�
where ~R is the gas constant (cal/mol-K) and pSn=SnO2
O2is
the oxygen partial pressure that corresponds to theequilibrium between Sn (l) and SnO2 (s). Table I givesthe measured and predicted open-circuit potential valueswith various steam contents at the Ni-YSZ cathode. Themeasured open-circuit potential becomes increasinglynegative with an increase in steam content at thecathode. A negative open-circuit potential indicates theelectrolysis process is spontaneous without external
electrical energy (Eq. [9]). A practical steam electrolyzeris operated at 90 pct steam content, which would makethe open-circuit potential significantly negative.[5–7] Anyapplied external potential will continue to increase therate of hydrogen production.
D. i-V Characteristics and Polarization Modeling
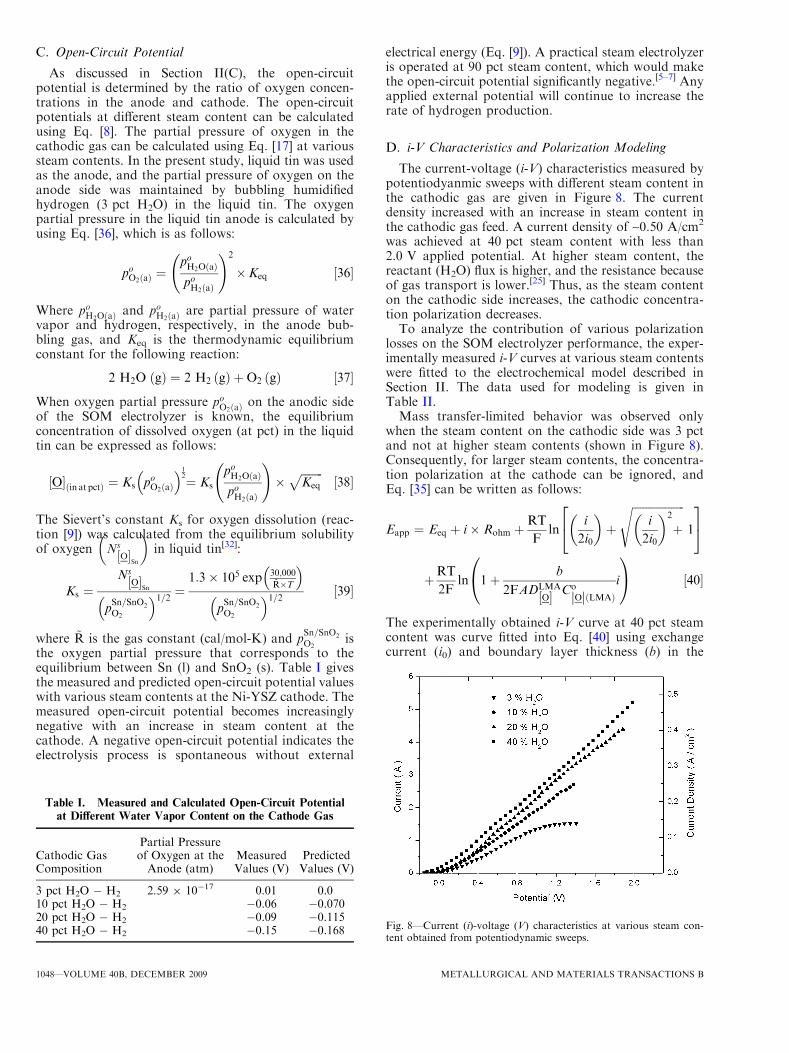
The current-voltage (i-V) characteristics measured bypotentiodyanmic sweeps with different steam content inthe cathodic gas are given in Figure 8. The currentdensity increased with an increase in steam content inthe cathodic gas feed. A current density of ~0.50 A/cm2
was achieved at 40 pct steam content with less than2.0 V applied potential. At higher steam content, thereactant (H2O) flux is higher, and the resistance becauseof gas transport is lower.[25] Thus, as the steam contenton the cathodic side increases, the cathodic concentra-tion polarization decreases.To analyze the contribution of various polarization
losses on the SOM electrolyzer performance, the exper-imentally measured i-V curves at various steam contentswere fitted to the electrochemical model described inSection II. The data used for modeling is given inTable II.Mass transfer-limited behavior was observed only
when the steam content on the cathodic side was 3 pctand not at higher steam contents (shown in Figure 8).Consequently, for larger steam contents, the concentra-tion polarization at the cathode can be ignored, andEq. [35] can be written as follows:
Eapp ¼ Eeq þ i� Rohm þRT
Fln
i
2i0
� �þ
ffiffiffiffiffiffiffiffiffiffiffiffiffiffiffiffiffiffiffii
2i0
� �2
þ
s1
24
35
þRT
2Fln 1þ b
2FADLMAO½ � Co
Oj jðLMAÞi
0@
1A ½40�
The experimentally obtained i-V curve at 40 pct steamcontent was curve fitted into Eq. [40] using exchangecurrent (i0) and boundary layer thickness (b) in the
Table I. Measured and Calculated Open-Circuit Potentialat Different Water Vapor Content on the Cathode Gas
Cathodic GasComposition
Partial Pressureof Oxygen at theAnode (atm)
MeasuredValues (V)
PredictedValues (V)
3 pct H2O � H2 2.59 9 10�17 0.01 0.010 pct H2O � H2 �0.06 �0.07020 pct H2O � H2 �0.09 �0.11540 pct H2O � H2 �0.15 �0.168 Fig. 8—Current (i)-voltage (V) characteristics at various steam con-
tent obtained from potentiodynamic sweeps.
1048—VOLUME 40B, DECEMBER 2009 METALLURGICAL AND MATERIALS TRANSACTIONS B
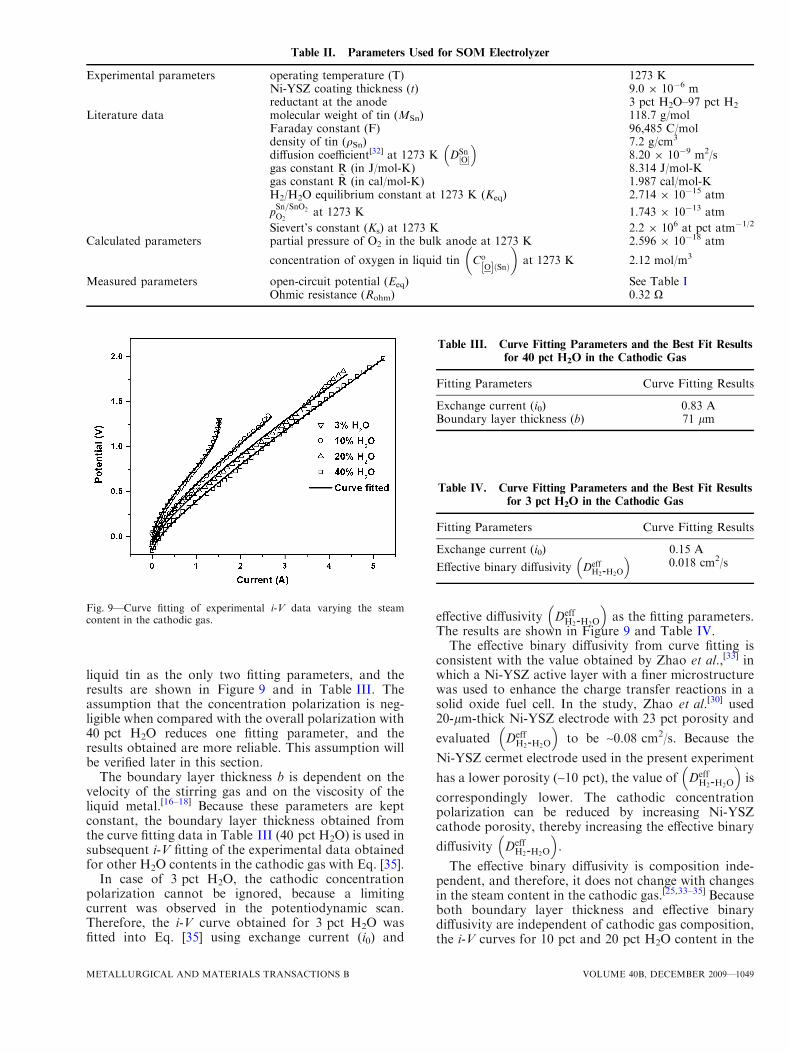
liquid tin as the only two fitting parameters, and theresults are shown in Figure 9 and in Table III. Theassumption that the concentration polarization is neg-ligible when compared with the overall polarization with40 pct H2O reduces one fitting parameter, and theresults obtained are more reliable. This assumption willbe verified later in this section.
The boundary layer thickness b is dependent on thevelocity of the stirring gas and on the viscosity of theliquid metal.[16–18] Because these parameters are keptconstant, the boundary layer thickness obtained fromthe curve fitting data in Table III (40 pct H2O) is used insubsequent i-V fitting of the experimental data obtainedfor other H2O contents in the cathodic gas with Eq. [35].
In case of 3 pct H2O, the cathodic concentrationpolarization cannot be ignored, because a limitingcurrent was observed in the potentiodynamic scan.Therefore, the i-V curve obtained for 3 pct H2O wasfitted into Eq. [35] using exchange current (i0) and
effective diffusivity DeffH2-H2O
� �as the fitting parameters.
The results are shown in Figure 9 and Table IV.The effective binary diffusivity from curve fitting is
consistent with the value obtained by Zhao et al.,[33] inwhich a Ni-YSZ active layer with a finer microstructurewas used to enhance the charge transfer reactions in asolid oxide fuel cell. In the study, Zhao et al.[30] used20-lm-thick Ni-YSZ electrode with 23 pct porosity and
evaluated DeffH2-H2O
� �to be ~0.08 cm2/s. Because the
Ni-YSZ cermet electrode used in the present experiment
has a lower porosity (~10 pct), the value of DeffH2-H2O
� �is
correspondingly lower. The cathodic concentrationpolarization can be reduced by increasing Ni-YSZcathode porosity, thereby increasing the effective binary
diffusivity DeffH2-H2O
� �.
The effective binary diffusivity is composition inde-pendent, and therefore, it does not change with changesin the steam content in the cathodic gas.[25,33–35] Becauseboth boundary layer thickness and effective binarydiffusivity are independent of cathodic gas composition,the i-V curves for 10 pct and 20 pct H2O content in the
Table II. Parameters Used for SOM Electrolyzer
Experimental parameters operating temperature (T) 1273 KNi-YSZ coating thickness (t) 9.0 9 10�6 mreductant at the anode 3 pct H2O–97 pct H2
Literature data molecular weight of tin (MSn) 118.7 g/molFaraday constant (F) 96,485 C/moldensity of tin (qSn) 7.2 g/cm3
diffusion coefficient[32] at 1273 K DSn½O�
� �8.20 9 10�9 m2/s
gas constant R (in J/mol-K) 8.314 J/mol-Kgas constant ~R (in cal/mol-K) 1.987 cal/mol-KH2/H2O equilibrium constant at 1273 K (Keq) 2.714 9 10�15 atm
pSn=SnO2
O2at 1273 K 1.743 9 10�13 atm
Sievert’s constant (Ks) at 1273 K 2.2 9 106 at pct atm�1/2
Calculated parameters partial pressure of O2 in the bulk anode at 1273 K 2.596 9 10�18 atm
concentration of oxygen in liquid tin CoO½ � Snð Þ
� �at 1273 K 2.12 mol/m3
Measured parameters open-circuit potential (Eeq) See Table IOhmic resistance (Rohm) 0.32 X
Fig. 9—Curve fitting of experimental i-V data varying the steamcontent in the cathodic gas.
Table III. Curve Fitting Parameters and the Best Fit Resultsfor 40 pct H2O in the Cathodic Gas
Fitting Parameters Curve Fitting Results
Exchange current (i0) 0.83 ABoundary layer thickness (b) 71 lm
Table IV. Curve Fitting Parameters and the Best Fit Resultsfor 3 pct H2O in the Cathodic Gas
Fitting Parameters Curve Fitting Results
Exchange current (i0) 0.15 A
Effective binary diffusivity DeffH2-H2O
� �0.018 cm2/s
METALLURGICAL AND MATERIALS TRANSACTIONS B VOLUME 40B, DECEMBER 2009—1049
cathodic gas were curve fitted using only exchangecurrent (i0) as the fitting parameter as shown in Figure 9and Table V.
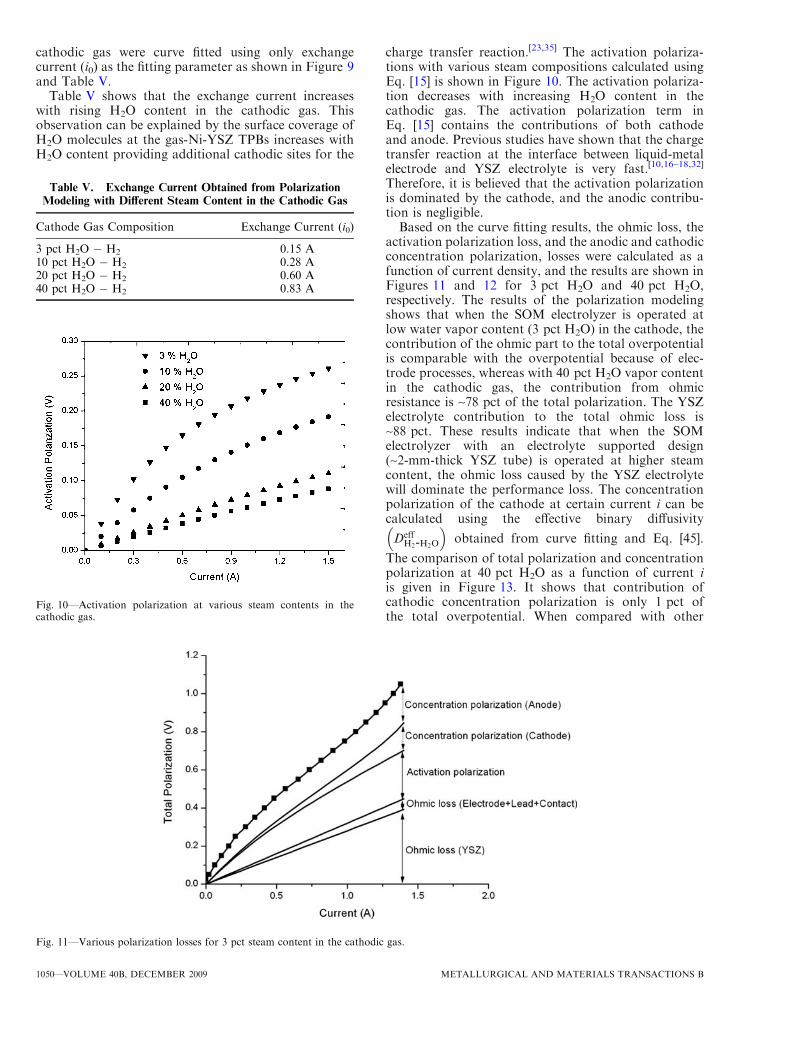
Table V shows that the exchange current increaseswith rising H2O content in the cathodic gas. Thisobservation can be explained by the surface coverage ofH2O molecules at the gas-Ni-YSZ TPBs increases withH2O content providing additional cathodic sites for the
charge transfer reaction.[23,35] The activation polariza-tions with various steam compositions calculated usingEq. [15] is shown in Figure 10. The activation polariza-tion decreases with increasing H2O content in thecathodic gas. The activation polarization term inEq. [15] contains the contributions of both cathodeand anode. Previous studies have shown that the chargetransfer reaction at the interface between liquid-metalelectrode and YSZ electrolyte is very fast.[10,16–18,32]
Therefore, it is believed that the activation polarizationis dominated by the cathode, and the anodic contribu-tion is negligible.Based on the curve fitting results, the ohmic loss, the
activation polarization loss, and the anodic and cathodicconcentration polarization, losses were calculated as afunction of current density, and the results are shown inFigures 11 and 12 for 3 pct H2O and 40 pct H2O,respectively. The results of the polarization modelingshows that when the SOM electrolyzer is operated atlow water vapor content (3 pct H2O) in the cathode, thecontribution of the ohmic part to the total overpotentialis comparable with the overpotential because of elec-trode processes, whereas with 40 pct H2O vapor contentin the cathodic gas, the contribution from ohmicresistance is ~78 pct of the total polarization. The YSZelectrolyte contribution to the total ohmic loss is~88 pct. These results indicate that when the SOMelectrolyzer with an electrolyte supported design(~2-mm-thick YSZ tube) is operated at higher steamcontent, the ohmic loss caused by the YSZ electrolytewill dominate the performance loss. The concentrationpolarization of the cathode at certain current i can becalculated using the effective binary diffusivity
DeffH2-H2O
� �obtained from curve fitting and Eq. [45].
The comparison of total polarization and concentrationpolarization at 40 pct H2O as a function of current iis given in Figure 13. It shows that contribution ofcathodic concentration polarization is only 1 pct ofthe total overpotential. When compared with other
Table V. Exchange Current Obtained from PolarizationModeling with Different Steam Content in the Cathodic Gas
Cathode Gas Composition Exchange Current (i0)
3 pct H2O � H2 0.15 A10 pct H2O � H2 0.28 A20 pct H2O � H2 0.60 A40 pct H2O � H2 0.83 A
Fig. 10—Activation polarization at various steam contents in thecathodic gas.
Fig. 11—Various polarization losses for 3 pct steam content in the cathodic gas.
1050—VOLUME 40B, DECEMBER 2009 METALLURGICAL AND MATERIALS TRANSACTIONS B
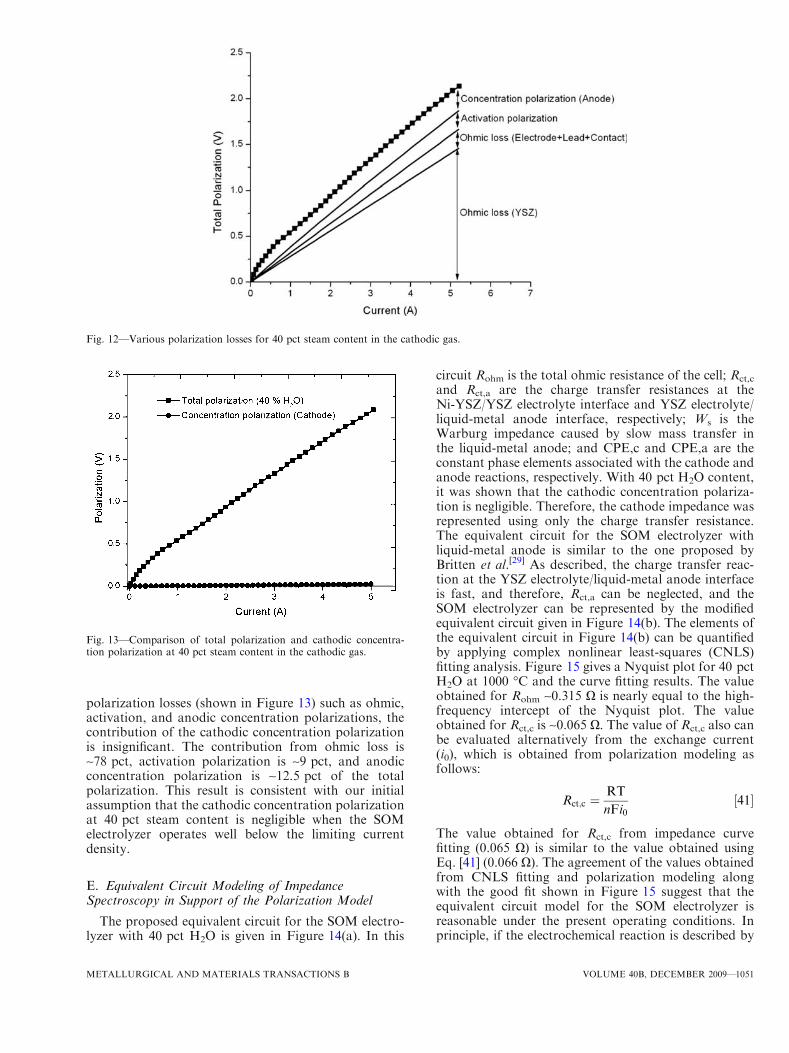
polarization losses (shown in Figure 13) such as ohmic,activation, and anodic concentration polarizations, thecontribution of the cathodic concentration polarizationis insignificant. The contribution from ohmic loss is~78 pct, activation polarization is ~9 pct, and anodicconcentration polarization is ~12.5 pct of the totalpolarization. This result is consistent with our initialassumption that the cathodic concentration polarizationat 40 pct steam content is negligible when the SOMelectrolyzer operates well below the limiting currentdensity.
E. Equivalent Circuit Modeling of ImpedanceSpectroscopy in Support of the Polarization Model
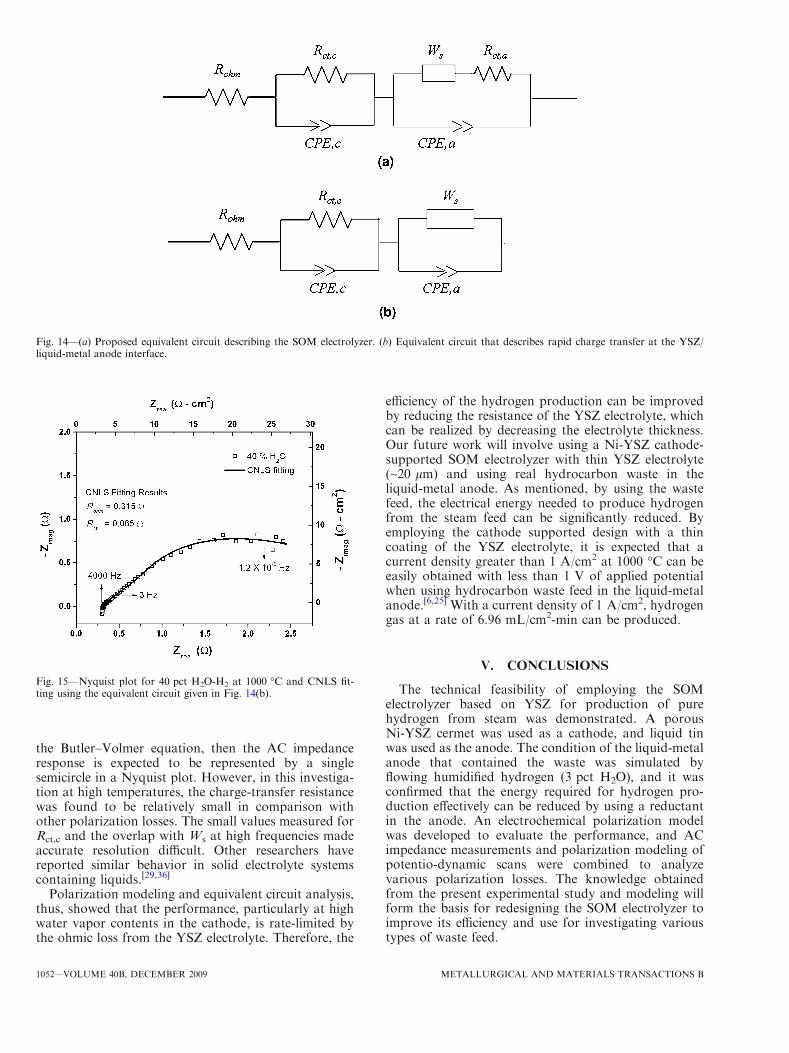
The proposed equivalent circuit for the SOM electro-lyzer with 40 pct H2O is given in Figure 14(a). In this
circuit Rohm is the total ohmic resistance of the cell; Rct,c
and Rct,a are the charge transfer resistances at theNi-YSZ/YSZ electrolyte interface and YSZ electrolyte/liquid-metal anode interface, respectively; Ws is theWarburg impedance caused by slow mass transfer inthe liquid-metal anode; and CPE,c and CPE,a are theconstant phase elements associated with the cathode andanode reactions, respectively. With 40 pct H2O content,it was shown that the cathodic concentration polariza-tion is negligible. Therefore, the cathode impedance wasrepresented using only the charge transfer resistance.The equivalent circuit for the SOM electrolyzer withliquid-metal anode is similar to the one proposed byBritten et al.[29] As described, the charge transfer reac-tion at the YSZ electrolyte/liquid-metal anode interfaceis fast, and therefore, Rct,a can be neglected, and theSOM electrolyzer can be represented by the modifiedequivalent circuit given in Figure 14(b). The elements ofthe equivalent circuit in Figure 14(b) can be quantifiedby applying complex nonlinear least-squares (CNLS)fitting analysis. Figure 15 gives a Nyquist plot for 40 pctH2O at 1000 �C and the curve fitting results. The valueobtained for Rohm ~0.315 X is nearly equal to the high-frequency intercept of the Nyquist plot. The valueobtained for Rct,c is ~0.065 X. The value of Rct,c also canbe evaluated alternatively from the exchange current(i0), which is obtained from polarization modeling asfollows:
Rct;c ¼RT
nFi0½41�
The value obtained for Rct,c from impedance curvefitting (0.065 X) is similar to the value obtained usingEq. [41] (0.066 X). The agreement of the values obtainedfrom CNLS fitting and polarization modeling alongwith the good fit shown in Figure 15 suggest that theequivalent circuit model for the SOM electrolyzer isreasonable under the present operating conditions. Inprinciple, if the electrochemical reaction is described by
Fig. 12—Various polarization losses for 40 pct steam content in the cathodic gas.
Fig. 13—Comparison of total polarization and cathodic concentra-tion polarization at 40 pct steam content in the cathodic gas.
METALLURGICAL AND MATERIALS TRANSACTIONS B VOLUME 40B, DECEMBER 2009—1051
the Butler–Volmer equation, then the AC impedanceresponse is expected to be represented by a singlesemicircle in a Nyquist plot. However, in this investiga-tion at high temperatures, the charge-transfer resistancewas found to be relatively small in comparison withother polarization losses. The small values measured forRct,c and the overlap with Ws at high frequencies madeaccurate resolution difficult. Other researchers havereported similar behavior in solid electrolyte systemscontaining liquids.[29,36]
Polarization modeling and equivalent circuit analysis,thus, showed that the performance, particularly at highwater vapor contents in the cathode, is rate-limited bythe ohmic loss from the YSZ electrolyte. Therefore, the
efficiency of the hydrogen production can be improvedby reducing the resistance of the YSZ electrolyte, whichcan be realized by decreasing the electrolyte thickness.Our future work will involve using a Ni-YSZ cathode-supported SOM electrolyzer with thin YSZ electrolyte(~20 lm) and using real hydrocarbon waste in theliquid-metal anode. As mentioned, by using the wastefeed, the electrical energy needed to produce hydrogenfrom the steam feed can be significantly reduced. Byemploying the cathode supported design with a thincoating of the YSZ electrolyte, it is expected that acurrent density greater than 1 A/cm2 at 1000 �C can beeasily obtained with less than 1 V of applied potentialwhen using hydrocarbon waste feed in the liquid-metalanode.[6,25] With a current density of 1 A/cm2, hydrogengas at a rate of 6.96 mL/cm2-min can be produced.
V. CONCLUSIONS
The technical feasibility of employing the SOMelectrolyzer based on YSZ for production of purehydrogen from steam was demonstrated. A porousNi-YSZ cermet was used as a cathode, and liquid tinwas used as the anode. The condition of the liquid-metalanode that contained the waste was simulated byflowing humidified hydrogen (3 pct H2O), and it wasconfirmed that the energy required for hydrogen pro-duction effectively can be reduced by using a reductantin the anode. An electrochemical polarization modelwas developed to evaluate the performance, and ACimpedance measurements and polarization modeling ofpotentio-dynamic scans were combined to analyzevarious polarization losses. The knowledge obtainedfrom the present experimental study and modeling willform the basis for redesigning the SOM electrolyzer toimprove its efficiency and use for investigating varioustypes of waste feed.
Fig. 14—(a) Proposed equivalent circuit describing the SOM electrolyzer. (b) Equivalent circuit that describes rapid charge transfer at the YSZ/liquid-metal anode interface.
Fig. 15—Nyquist plot for 40 pct H2O-H2 at 1000 �C and CNLS fit-ting using the equivalent circuit given in Fig. 14(b).
1052—VOLUME 40B, DECEMBER 2009 METALLURGICAL AND MATERIALS TRANSACTIONS B
ACKNOWLEDGMENTS
The financial support of Massachusetts TechnologyTransfer Centre (MMTC) is gratefully acknowledged.The assistance of Mr. Justin Chin with fabrication ofexperimental setups is greatly appreciated.
REFERENCES1. N.S. Lewis: MRS Bull., 2007, vol. 32, pp. 808–20.2. M. Zerta, P.R. Schmidt, C. Stiller, and H. Landinger: Int. J.
Hydrogen Energy, 2008, vol. 33, pp. 3021–25.3. A. Zuttel, A. Borgschulte, and L. Schlapbach: Hydrogen as Future
Energy Carrier, 1st ed., Wiley-VCH, Weinheim, Germany, 2008.4. W. Doenitz, R. Schmidberger, E. Steinheil, and R. Streicher: Int.
J. Hydrogen Energy, 1980, vol. 5, pp. 55–63.5. H.S. Spacil and C.S. Tedmon, Jr: J. Electrochem. Soc., 1969,
vol. 116, pp. 1618–26.6. J. Martinez-Frias, A.-Q. Pham, and S.M. Aceves: Int. J. Hydrogen
Energy, 2003, vol. 28, pp. 483–90.7. W. Wang, R.J. Gorte, and J.M. Vohs: Chem. Eng. Sci., 2008,
vol. 63, pp. 765–69.8. S. Gopalan, G. Ye, and U.B. Pal: J. Power Sources, 2006, vol. 162,
pp. 74–80.9. A. Momma, T. Kato, Y. Kaga, and S. Nagata: J. Ceram. Soc.
Jpn., 1997, vol. 105, pp. 369–73.10. T.H. Etsell and S.N. Flengas: Metall. Trans. B, 1971, vol. 2,
pp. 2829–31.11. M. Suput, R. Delucas, S. Pati, G. Ye, U. Pal, and A.C. Powell, IV:
Miner. Process. Extract. Metall., 2008, vol. 117, p. 118.12. T. Tao, L. Bateman, J. Bentley, and M. Slaney: ECS Trans., 2007,
vol. 5 (1), pp. 463–72.13. S. Pati, M. Suput, R. Delucas, and U. Pal: EPD Congress, S.M.
Howard, ed., TMS, Warrendale, PA, 2008, pp. 121–26.14. A. Krishnan, U. Pal, and X. Lu: Metall. Trans. B, 2005, vol. 36,
pp. 463–73.15. H.S. Spacil and C.S. Tedmon, Jr.: J. Electrochem. Soc., 1969,
vol. 116, pp. 1626–33.
16. K. Oberg, L.M. Friedman, W. Boorstein, and R.A. Rapp: Metall.Trans. B, 1973, vol. 4, pp. 75–82.
17. S. Yuan, K.C. Chou, and U. Pal: J. Electrochem. Soc., 1994,vol. 141, pp. 467–74.
18. P. Soral, U. Pal, H. Larson, and B. Schroeder: Metall. Trans. B,1999, vol. 30, pp. 307–21.
19. A. Bard and L. Faulkner: Electrochemical Methods: Fundamentalsand Applications, Wiley, New York, NY, 1980.
20. H. Chan and Z.T. Xia: J. Appl. Electrochem., 2002, vol. 32,pp. 339–47.
21. M. Ni, M.K.H. Leung, and D.Y.C. Leung: Int. J. HydrogenEnergy, 2007, vol. 32, pp. 2305–13.
22. P. Choi, D.G. Bessarabov, and R. Datta: Solid State Ionics, 2004,vol. 175, pp. 535–39.
23. H. Zhu and R.J. Kee: J. Power Sources, 2003, vol. 117, pp. 61–74.24. P.W. Li and M.K. Chyu: J. Heat Transfer, 2005, vol. 127,
pp. 1344–62.25. J.W. Kim, A.V. Virkar, K.Z. Fung, K. Mehta, and S.C. Singhal:
J. Electrochem. Soc., 1999, vol. 146, pp. 69–78.26. T. Kawada, N. Sakai, H. Yokokawa, and M Dokia: J. Electro-
chem. Soc., 1990, vol. 137, pp. 3042–47.27. T. Setoguchi, K. Okamoto, K. Eguchi, and H. Arai: J. Electro-
chem. Soc., 1992, vol. 139, pp. 2875–80.28. T. Iwata: J. Electrochem. Soc., 1996, vol. 143, pp. 1521–25.29. S.C. Britten and U.B. Pal: Metall. Trans. B, 2000, vol. 31,
pp. 733–53.30. A. Krishnan: Ph.D. Dissertation, Boston University, Boston, MA,
2006.31. N.Q. Minh and T. Takahashi: Science and Technology of Ceramic
FuelCells, Elsevier ScienceB.V.,Amsterdam,TheNetherlands, 1995.32. T. Ramanarayanan and R.A. Rapp:Metall. Trans. B, 1972, vol. 3,
pp. 3239–46.33. F. Zhao and A.V. Virkar: J. Power Sources, 2005, vol. 141,
pp. 79–95.34. R.B. Bird, W.E. Stewart, and E.N. Lightfoot: Transport Phe-
nomena, 2nd ed., Wiley, New York, NY, 2002.35. K.J. Yoon, S. Gopalan, and U.B. Pal: J. Electrochem. Soc., 2007,
vol. 154, pp. 1080–7.36. T. Emi:Electrochemistry, Physical Chemistry Series Two, Volume 6,
A. Buckingham and J. Bockris, eds., Butterworth and Co., London,UK, 1976.
METALLURGICAL AND MATERIALS TRANSACTIONS B VOLUME 40B, DECEMBER 2009—1053