Embed Size (px)
Citation preview
Improved classification of large imbalanced data sets using rationalized technique: Updated Class Purity Maximization Over_Sampling Technique (UCPMOT)Sachin S. Patil1* and Shefali P. Sonavane2
Imbalanced data sets classification: an introThe data in the form of massive volume, extreme velocity and varied variety has lead to today’s catchphrase ‘Big Data’. Challenges set by the Big Data analytics are to be addressed capably. Huge digital Big Data including its varied forms evolving per day has outdrawn the need of cutting-edge analytics. In addition there is a requirement to exploit the streaming data with the capable conduct of analysis.
The superior verdict prediction of the inferred information from the massive diverse data is a challenge [1]. The volume of data is estimated to increase by 20 times than the current date [2, 3]. To deal with the challenges evolved in Big Data management has set a
Abstract
The huge variety of NoSQL Big Data has tossed a need for new pathways to store, pro-cess and analyze it. The quantum of data created is inconceivable along with a mixed breath of unknown veracity and creative visualization. The new trials of frameworks help to find substantial unidentified values from massive data sets. They have added an exceptional dimension to the pre-processing and contextual conversion of the data sets for needful analysis. In addition, handling of ambitious imbalanced data sets has acknowledged an intimation of alarm. Traditional classifiers are unable to discourse the precise need of grouping for such data sets. Over_sampling of the minority classes help to improve the performance. Updated Class Purity Maximization Over_Sampling Technique (UCPMOT) is a rationalized technique proposed to handle imbalanced data sets using exclusive safe-level based synthetic sample creation. It addresses the multi-class problem in alignment to a newly induced method namely lowest versus highest. The projected technique experiments with several data sets from the UCI repository. The underlying bed of mapreduce environment encompasses the distributed process-ing approach on Apache Hadoop framework. Several classifiers help to authorize the classification results using parameters like F-measure and AUC values. The experimental conclusions quote the dominance of UCPMOT over the benchmarking techniques.
Keywords: Big Data, Imbalanced data sets, Multi-class, Over_Sampling Techniques, Lowest versus highest
Open Access
© The Author(s) 2017. This article is distributed under the terms of the Creative Commons Attribution 4.0 International License (http://creativecommons.org/licenses/by/4.0/), which permits unrestricted use, distribution, and reproduction in any medium, provided you give appropriate credit to the original author(s) and the source, provide a link to the Creative Commons license, and indicate if changes were made.
RESEARCH
Patil and Sonavane J Big Data (2017) 4:49 https://doi.org/10.1186/s40537-017-0108-1
*Correspondence: [email protected] 1 Computer Science and Engineering, R.I.T, Rajaramnagar, Islampur, Sangli, IndiaFull list of author information is available at the end of the article
Page 2 of 32Patil and Sonavane J Big Data (2017) 4:49
crucial inclination [3, 4]. Furthermore, the capability of the ecosystem to deal with usage, mobility and deployment of data has to be emphasized [5, 6].
Classification of the minority samples appropriately in imbalance scenario has become the main focus of study [7]. Generally the classifiers ignore the minority instances while forming rule sets. The numerous real-world applications are affected by class imbalance problem wherein the number of samples in one class is very marginal compared to other classes [8–11]. Issues in fields related to software defect detection [12], threat supervi-sion, medical judgment, web author identification [13] and similar have drawn attention towards concerns of multi-class imbalanced data sets. The representation of boundaries in imbalanced data sets is a difficult concern for learning algorithms. Skewed data parti-tion is an integral issue for learning of classifiers.
UCPMOT is a superior over_sampling technique presented in this paper. It acquaints the class imbalance problem. The basic over_sampling process using safe-level based displacement factor is carried out with the help of other four over_sampling techniques (non-cluster/cluster based). The experiments are conducted on Hadoop framework using the distributed mapreduce structure [14, 15]. Diverse classifiers viz. Random For-est, Naïve Bayes AdaBoostM1 and MultiLayer Perceptron [16, 17] are used to perform classification. The preciseness of techniques is assessed by using two measures: F-meas-ure and AUC values.
Related workClassification of imbalanced data sets is recognized by numerous available techniques working at dissimilar levels. They are broadly considered into three levels viz. data level, procedure level and cost-sensitive level [7, 14]. Data level works with updating the size of the data sets. The predominant techniques at procedure level work with the processes to manage imbalanced Big Data sets. The cost-sensitive technique is a mixer of both tech-niques viz. data level and procedure level. The techniques discussed in this paper deal with the data level technique. The data level technique is categorized into three types: Undersampling, Over_sampling and Hybrid technique [7, 14]. Over_sampling may incline to reproduce noisy data whereas undersampling might lose the useful data. The easiest way to deal with under_over sampling is random approach [18]. Over_sampling results show extra advantages than the results of undersampling techniques. The recom-mended techniques work basically with over_sampling approach.
Synthetic Minority Oversampling Technique (SMOTE) algorithm [19] is one of the basic over_sampling techniques. It works on the class imbalance issue by synthesizing the minority class examples. ‘KNN’ nearest neighbors (KNN) are selected randomly to satisfy the over_sampling rate. SMOTE encounters some drawbacks including over-gen-eralization and lack of systematizing disjuncts. Enhanced techniques such as Borderline-SMOTE [20], SafeLevel-SMOTE [21] and adaptive synthetic sampling (ADASYN) [22] help to overcome these drawbacks. The proposed technique follows the same baseline while leveraging the disjuncts and generalization issue. Evolutionary algorithms resolve the imbalanced Big Data sets issue using the technique belonging to nested generalized model, considering objects in Euclidean n-space [23]. Boundary based oversampling technique used in SMOTE + GLMBoost and NRBoundary-SMOTE [24] are engaged to resolve imbalance data set problems. The UCPMOT + NF_N + MOT technique assists
Page 3 of 32Patil and Sonavane J Big Data (2017) 4:49
to engage farthest borderline neighbors and their mean, involving the nearest samples. The ensemble techniques viz. SMOTEBoost [25], AdaBoost [26] and RUSBoost are tan-gled with SMOTE to work over the problems of the imbalanced data set. In [27], fuzzy rule classification is anticipated as a solution for the multi-class dilemma by merging the pairwise learning with preprocessing. Ultimately the LVH method clamps merito-riously the issues of over_sampling in multi-class imbalanced data sets. The ensemble based techniques (Random Forest) helps to effectually discourse classification analy-sis [28, 29]. They are validated as scalable, durable and capable of handling categorical data. In [30], an incremental clustering based fault detection approach is studied. This includes extreme class distributions of Gaussian/non-Gaussian types and process drifts. The ordinal classification of imbalanced Big Data sets in [31], approximates the class probability distribution using the weighted KNN technique. Competent string based procedure to detect class in data streams is reflected in [32]. It includes attributes of infinite-length, concept-evolution and data drift. The procedure to aid the valuation of domain samples methodically is proposed as Mega-Trend-Diffusion Technique (MTDF) in [33] to address the class imbalance problem. A recent imbalanced data set handling technique i.e. Majority Weighted Minority Oversampling Technique (MWMOTE) [34] efficiently recognizes those minority instances which are difficult in terms of learning. It assigns the weight to each of them based on Euclidean distance from the nearest major-ity class samples. The artificial samples are created from these samples using a clustering approach. The use of the immune network [35] coordinates the immune centroids as synthetic instances, based on high data density clusters which help to handle the imbal-anced data sets. It implicitly encourages the broadening of the minority class decision space.
Organization of workArchitecture
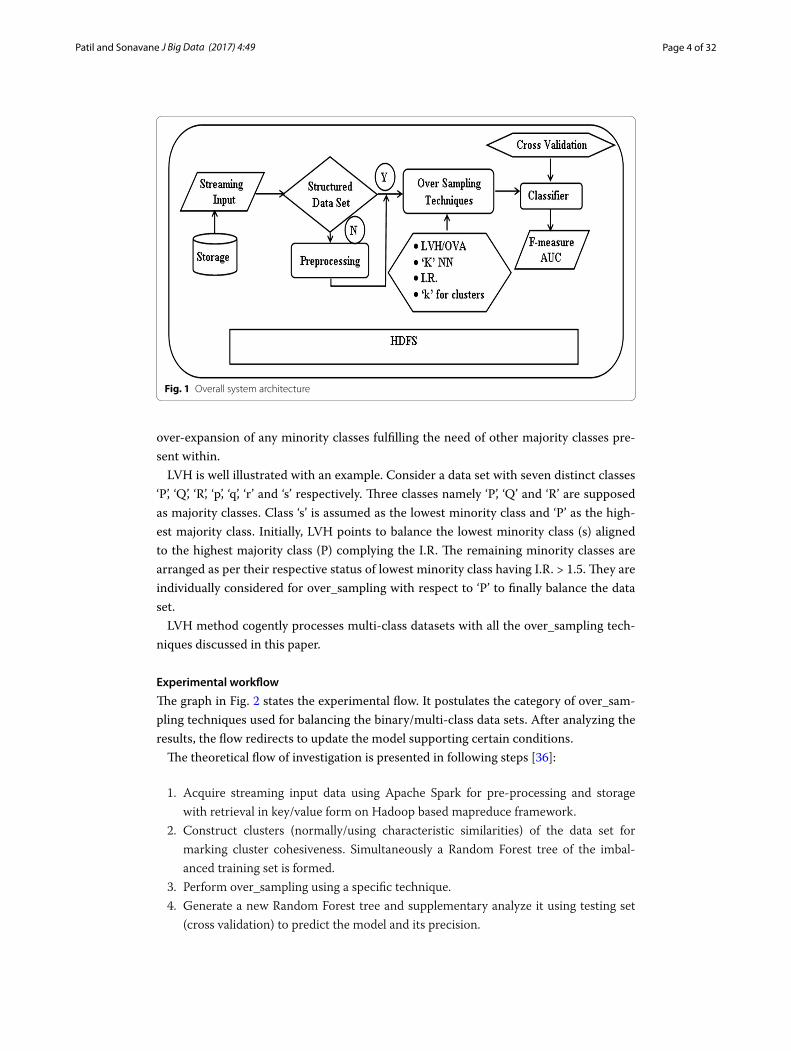
The overall architecture in Fig. 1 demonstrates the organization of work structure to apprise imbalanced Big Data sets [36]. The work involves the investigational analysis of over sampled data set to improve classification. It leads to store and process input data in a suitable format for needful interpretation of final results. The data sets are processed with over_sampling techniques to generate balanced data set for required analysis.
The study is carried out using mapreduce based distributed framework functioning with heterogeneity and runtime scale-up. Inputs such as a number of clusters and clus-tering type are provided for cluster based techniques. Required imbalance ratio (I.R.) is required to attain the given over_sampling rate along with the precondition value of KNN for finding nearest neighbors.
Scheduled over_sampling techniques are classified into two types: non-cluster and cluster based. They deal with both types of data sets viz. binary and nonbinary-class. The nonbinary-class data sets are pre-processed using either traditional method (One versus One (OVO) and One versus All (OVA)) or the suggested LVH method. LVH [36] overcomes the disadvantages of traditional methods improving classification results. This method considers only the highest majority class versus each of the minor-ity class satisfying I.R. for the over_sampling process. It helps to reduce computation including precise over_sampling submissive to avoid duplication. Additionally, it avoids
Page 4 of 32Patil and Sonavane J Big Data (2017) 4:49
over-expansion of any minority classes fulfilling the need of other majority classes pre-sent within.
LVH is well illustrated with an example. Consider a data set with seven distinct classes ‘P’, ‘Q’, ‘R’, ‘p’, ‘q’, ‘r’ and ‘s’ respectively. Three classes namely ‘P’, ‘Q’ and ‘R’ are supposed as majority classes. Class ‘s’ is assumed as the lowest minority class and ‘P’ as the high-est majority class. Initially, LVH points to balance the lowest minority class (s) aligned to the highest majority class (P) complying the I.R. The remaining minority classes are arranged as per their respective status of lowest minority class having I.R. > 1.5. They are individually considered for over_sampling with respect to ‘P’ to finally balance the data set.
LVH method cogently processes multi-class datasets with all the over_sampling tech-niques discussed in this paper.
Experimental workflow
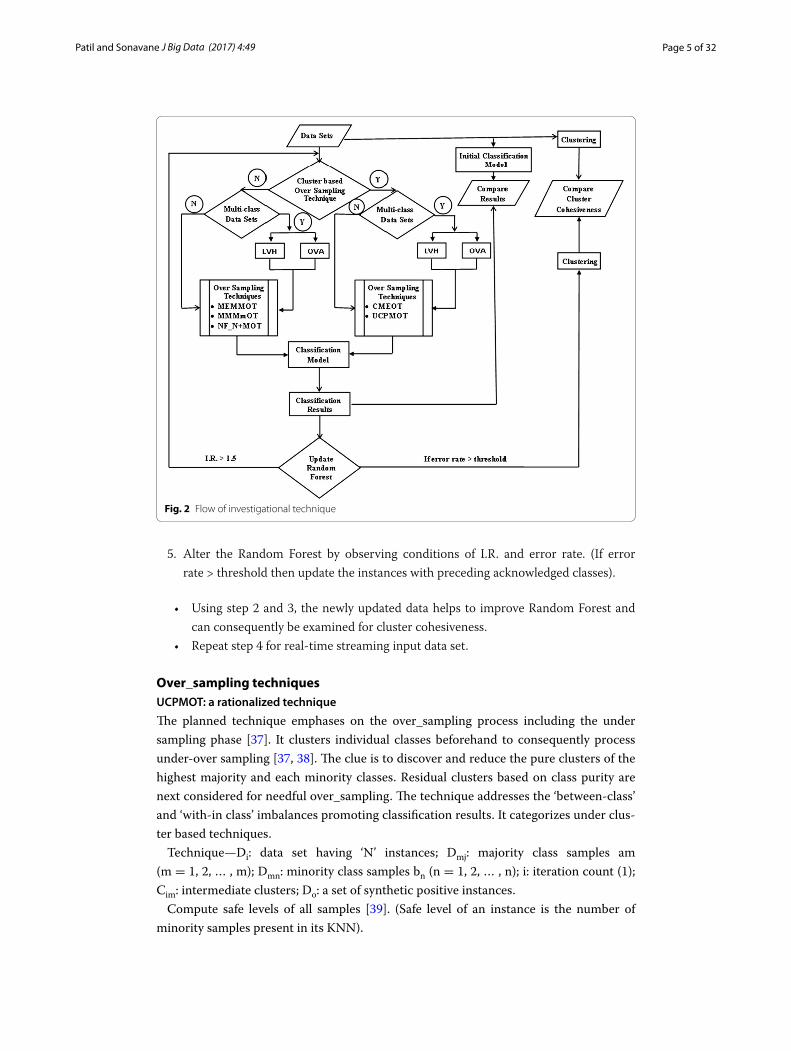
The graph in Fig. 2 states the experimental flow. It postulates the category of over_sam-pling techniques used for balancing the binary/multi-class data sets. After analyzing the results, the flow redirects to update the model supporting certain conditions.
The theoretical flow of investigation is presented in following steps [36]:
1. Acquire streaming input data using Apache Spark for pre-processing and storage with retrieval in key/value form on Hadoop based mapreduce framework.
2. Construct clusters (normally/using characteristic similarities) of the data set for marking cluster cohesiveness. Simultaneously a Random Forest tree of the imbal-anced training set is formed.
3. Perform over_sampling using a specific technique.4. Generate a new Random Forest tree and supplementary analyze it using testing set
(cross validation) to predict the model and its precision.
Fig. 1 Overall system architecture
Page 5 of 32Patil and Sonavane J Big Data (2017) 4:49
5. Alter the Random Forest by observing conditions of I.R. and error rate. (If error rate > threshold then update the instances with preceding acknowledged classes).
• Using step 2 and 3, the newly updated data helps to improve Random Forest and can consequently be examined for cluster cohesiveness.
• Repeat step 4 for real-time streaming input data set.
Over_sampling techniquesUCPMOT: a rationalized technique
The planned technique emphases on the over_sampling process including the under sampling phase [37]. It clusters individual classes beforehand to consequently process under-over sampling [37, 38]. The clue is to discover and reduce the pure clusters of the highest majority and each minority classes. Residual clusters based on class purity are next considered for needful over_sampling. The technique addresses the ‘between-class’ and ‘with-in class’ imbalances promoting classification results. It categorizes under clus-ter based techniques.
Technique—Di: data set having ‘N’ instances; Dmj: majority class samples am (m = 1, 2, … , m); Dmn: minority class samples bn (n = 1, 2, … , n); i: iteration count (1); Cim: intermediate clusters; Do: a set of synthetic positive instances.
Compute safe levels of all samples [39]. (Safe level of an instance is the number of minority samples present in its KNN).
Fig. 2 Flow of investigational technique

Page 6 of 32Patil and Sonavane J Big Data (2017) 4:49
1. UCPMOT (Di)
2. repeat
3. if Di = = binary-class data set
4. Mn = minority mediod instance from Dmn or respective clusters in-hand
5. Mj = majority mediod instance from Dmj or respective clusters in-hand
6. else
7. Mn = minority mediod instance from highest majority class
8. Mj = majority mediod instance from lowest minority class
9. CA = cluster of remaining instances around Mn
10. CB = cluster of remaining instances around Mj
11. if i == 1
12. if CA | CB = impure clusters
13. goto step 4 // for each impure clusters
14. else
15. goto step 24 // stop processing
16. else
17. if CA || CB = impure clusters
18. if degree of class purity CA || CB > degree of parent class purity
19. goto step 4 // for each impure clusters
20. else
21. Cim = CA && CB
22. else
23. discard CA and CB // from further processing
24. Do = OVER_SAMPLING (Cim) //append Do using MEre Mean Minority Over_Sampling Technique
(MEMMOT)/ Minority Majority Mix mean Over_Sampling Technique (MMMmOT)/ Nearest Farthest
Neighbor_Mid Over_Sampling Technique (NF_N+MOT) as non-cluster based techniques or apply Clustering
Minority Examples Over_Sampling Technique (CMEOT) (by considering collective minority class samples) as
cluster based techniques
25. until (minority classes having I.R. > 1.5 as per step 6)
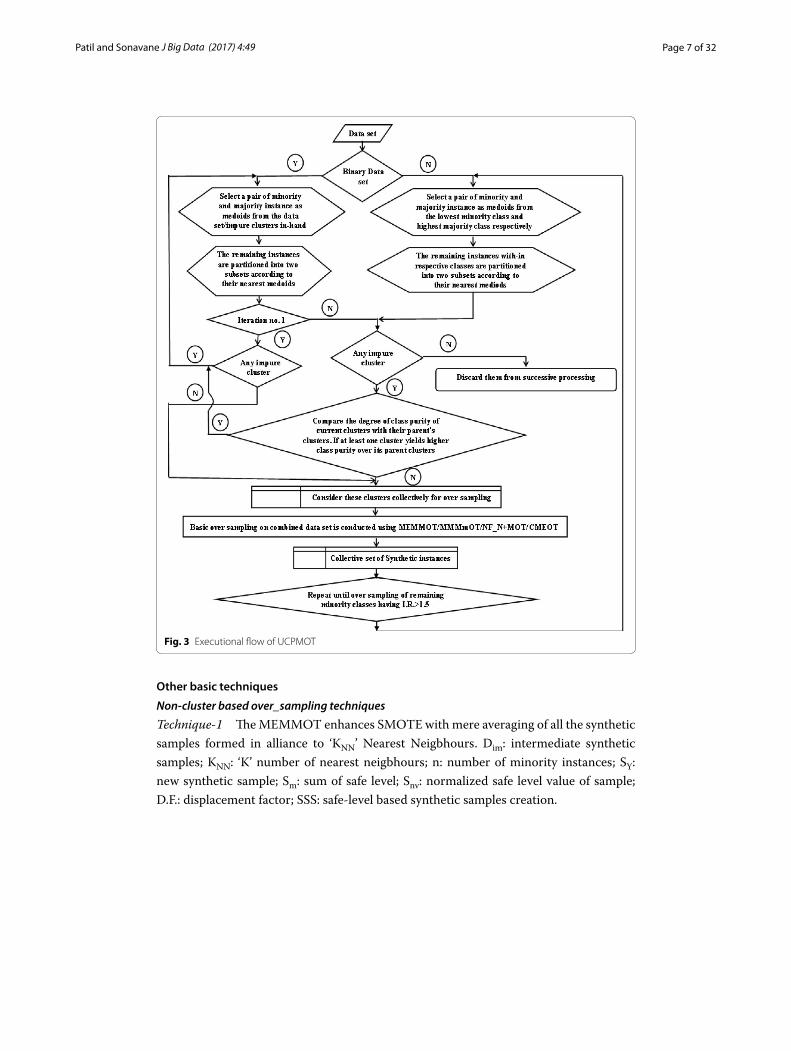
The chart in Fig. 3 positions the executional flow of UCPMOT. The chart helps to trace the logical flow of over_sampling process over given imbalanced Big Data sets set using UCPMOT.
The stated technique (UCPMOT) works with either of the four basic techniques speci-fied below, for elementary over_sampling process [36]. They are classified into two cat-egories viz. non-cluster (3 techniques) and cluster based technique (1 technique).
Page 7 of 32Patil and Sonavane J Big Data (2017) 4:49
Other basic techniques
Non‑cluster based over_sampling techniques
Technique‑1 The MEMMOT enhances SMOTE with mere averaging of all the synthetic samples formed in alliance to ‘KNN’ Nearest Neigbhours. Dim: intermediate synthetic samples; KNN: ‘K’ number of nearest neigbhours; n: number of minority instances; SY: new synthetic sample; Sm: sum of safe level; Snv: normalized safe level value of sample; D.F.: displacement factor; SSS: safe-level based synthetic samples creation.
Fig. 3 Executional flow of UCPMOT

Page 8 of 32Patil and Sonavane J Big Data (2017) 4:49
Compute safe levels of all samples [39].
1. MEMMOT (Di) // For 100% over_sampling rate
2. for Dmn, i = 1 to n
3. for j =1 to KNN
4. Dmn[i].KNN[j] = ‘KNN’ Nearest Neigbhour (KNN)
5. for m = 1 to KNN and j =1 to KNN
6. Dim[m] = SSS[Dmn[i].KNN[j] and Dmn[i]]
7. SY = average (Dim[m])
8. if SY = duplicate
9. goto step 7 //delete the NN having a lowest safe level from the KNN including the
interpolated instance from that instance
10. Do= SY
For over_sampling rate > 100%:Repeatedly use the current over sampled set in-hand for over_sampling.
Choose (randomly or on safe level basis) an equal sample ratio from each over_sam-pling instance sets per iteration. Combine it with the base set of instances forming a new data set for the next over_sampling process.
Reiteration of step 2 to 4.For over_sampling rate < 100%:Remove (randomly or considering highest safe levels) the interpolated samples satisfy-
ing the over_sampling rate.
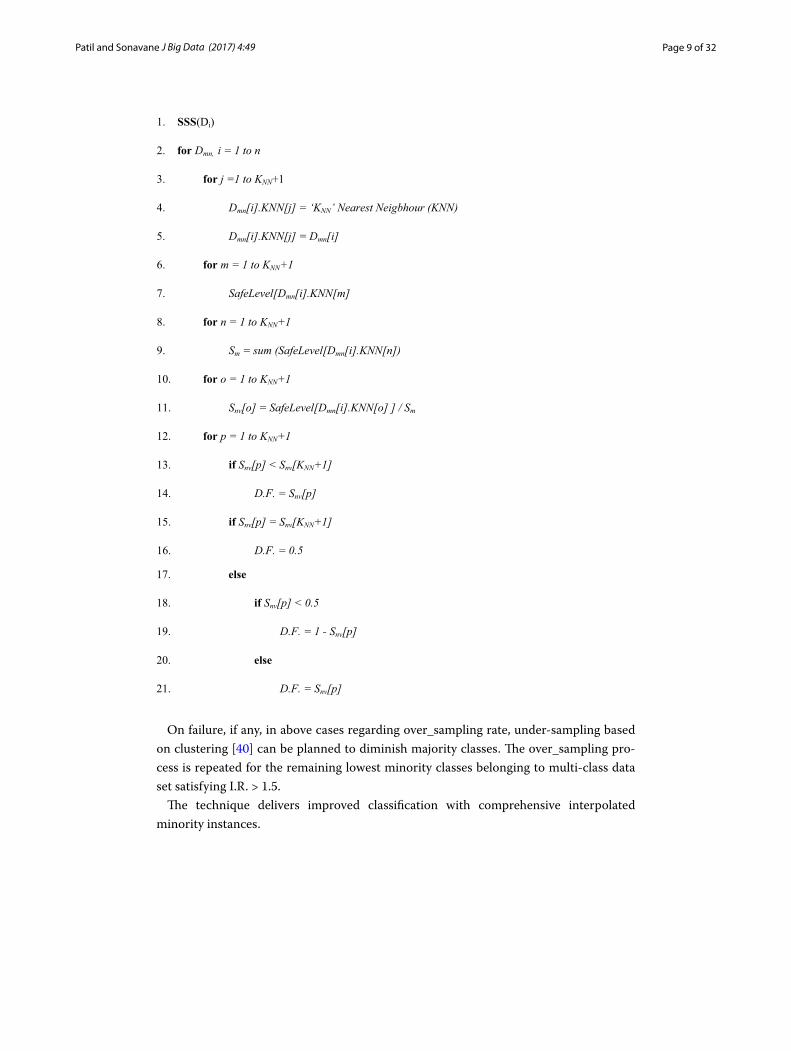
Safe‑level based synthetic samples creation (SSS)
The idea is to mathematically justify the displacement factor in SMOTE process. It enhances the quality of synthetic minority instances, although achieving the balance of the data set. The process involved is as follows:
OR
OR
Page 9 of 32Patil and Sonavane J Big Data (2017) 4:49
1. SSS(Di)
2. for Dmn, i = 1 to n
3. for j =1 to KNN+1
4. Dmn[i].KNN[j] = ‘KNN’ Nearest Neigbhour (KNN)
5. Dmn[i].KNN[j] = Dmn[i]
6. for m = 1 to KNN+1
7. SafeLevel[Dmn[i].KNN[m]
8. for n = 1 to KNN+1
9. Sm = sum (SafeLevel[Dmn[i].KNN[n])
10. for o = 1 to KNN+1
11. Snv[o] = SafeLevel[Dmn[i].KNN[o] ] / Sm
12. for p = 1 to KNN+1
13. if Snv[p] < Snv[KNN+1]
14. D.F. = Snv[p]
15. if Snv[p] = Snv[KNN+1]
16. D.F. = 0.5
17. else
18. if Snv[p] < 0.5
19. D.F. = 1 - Snv[p]
20. else
21. D.F. = Snv[p]
On failure, if any, in above cases regarding over_sampling rate, under-sampling based on clustering [40] can be planned to diminish majority classes. The over_sampling pro-cess is repeated for the remaining lowest minority classes belonging to multi-class data set satisfying I.R. > 1.5.
The technique delivers improved classification with comprehensive interpolated minority instances.

Page 10 of 32Patil and Sonavane J Big Data (2017) 4:49
Technique‑2 The MMMmOT is an exclusive progression of prevalent technique (SMOTE). It considers both types of samples (minority and majority samples) in KNN for over_sampling. It releaves from low replicas and evades the problem of overlapping samples.
Compute safe levels of all cases [39].
1. MMMmOT (Di) // For 100% over_sampling rate
2. for Dmn, i = 1 to n
3. for j =1 to KNN
4. Dmn[i].KNN[j] = ‘KNN’ Nearest Neigbhour (KNN)
5. if KNN set = all minority instances
6. for m = 1 to KNN and j =1 to KNN
7. Dim[m] = SSS[Dmn[i].KNN[j] and Dmn[i]]
8. SY = average (Dim[m])
9. if SY = duplicate
10. goto step 7 //delete the NN having a lowest safe level from the KNN including the
interpolated instance from that instance
11. Do= SY
12. if KNN set = all majority instances
13. Dim = random (KNN set)
14. Dimk = minority NN (Dim)
15. SY1 = SSS[Dmn and Dim]

Page 11 of 32Patil and Sonavane J Big Data (2017) 4:49
16. SY2 = SSS[Dmn and Dimk]
17. SY = average (SY1 and SY2)
18. if SY = duplicate
19. goto step 15 //search for the next NN from the data set
20. Do= SY
21. else
22. Dim = random (KNN set)
23. if Dim = minority instance
24. SY = SSS[Dmn and Dim]
25. if SY = duplicate
26. goto step 23 //search for the next NN from the KNN set or data set
27. Do= SY
28. else
29. Dimk = max. safelevel minority instance (KNN set or data set)
30. SY1 = SSS[Dmn and Dim]
31. SY2 = SSS[Dmn and Dimk]
32. SY = average (SY1 and SY2)
33. if SY = duplicate
34. goto step 30 //search for the next minority NN from the KKN or data set
35. Do= SY
For required over_sampling rate > or < 100% the same strategy discussed in MEMOT based over_sampling is conducted.
Technique‑3 Technique (NF_N + MOT) intends to study the effect of an equal mix-ture of nearest, farthest and the middle element for forming synthetic instances. It helps to provide a wide range of inputs outwitting overlapping and replication, in addition to improve classification.
Compute safe levels of all cases [39].
1. NF_N+MOT (Di) // For 100% over_sampling rate
2. for Dmn, i = 1 to n
3. search (P instances) such that
4. P/2 nearest, P/2 farthest and midpoint element (except for the even value of ‘P’)
5. where n>1 and P<= n
6. Follow MMMmOT from step 1 to 34

Page 12 of 32Patil and Sonavane J Big Data (2017) 4:49
For required over_sampling rate > or < 100% the same strategy discussed in MEM-MOT based over_sampling is conducted.
Clustering based over_sampling techniques
An unsupervised methodology of clustering is considered to over sample the minority class. Several clustering algorithms can be used for the basic clustering purpose.
Technique‑4 The technique involves only minority instances and is a wholesome cluster based technique. The computed cluster means are considered as new synthetic instances. It helps to address the data features of small disjuncts and lack of density. Moreover it compiles the objectives [41] of elevating centroids based over_sampling.
Compute safe levels of all cases [39].
1. CMEOT (Di) // For 100% over_sampling rate
2. for i = 1 to c // For c number of minority classes
3. Cm[c] = clustering of each minority classes // KNN<c using any clustering algorithm
4. new synthetic instances ‘SYset’ = computed medians of Cm
5. if SYset= duplicate
6. delete the respective instances
For attaining over_sampling rate:
a. Repeat step 1 to 6 by adding the obtained medoids in-hand to current minority set.
b. Deletion of lowest safelevel minority instance (maintaining original data sets num-bers) and reiterate step 1 to 6 (size_of_data set > KNN and change in initial seeds).
The over_sampling process is repeated for the remaining lowest minority classes belonging to multi-class data set satisfying I.R. > 1.5.
Experimental contextThe objective of the trial work is to validate the efficiency of planned techniques for dealing with the class imbalance problem in Big Data sets. The projected techniques are investigated and evaluated against benchmarking techniques.
Details of the data set under experimentation
Based on varied characteristics viz. a number of instances, attributes and I.R.; the chosen data sets are grouped into three categories (binary-class structured/multi-class struc-tured/multi-class semi-structured_unstructured data sets). Out of ten data sets, eight are from the standard UCI repository [42], one from the causality workbench under pharmacology base [43] and remaining one from ProgrammableWeb [44, 45] respec-tively. The details of data sets are given in Table 1.
OR
Page 13 of 32Patil and Sonavane J Big Data (2017) 4:49
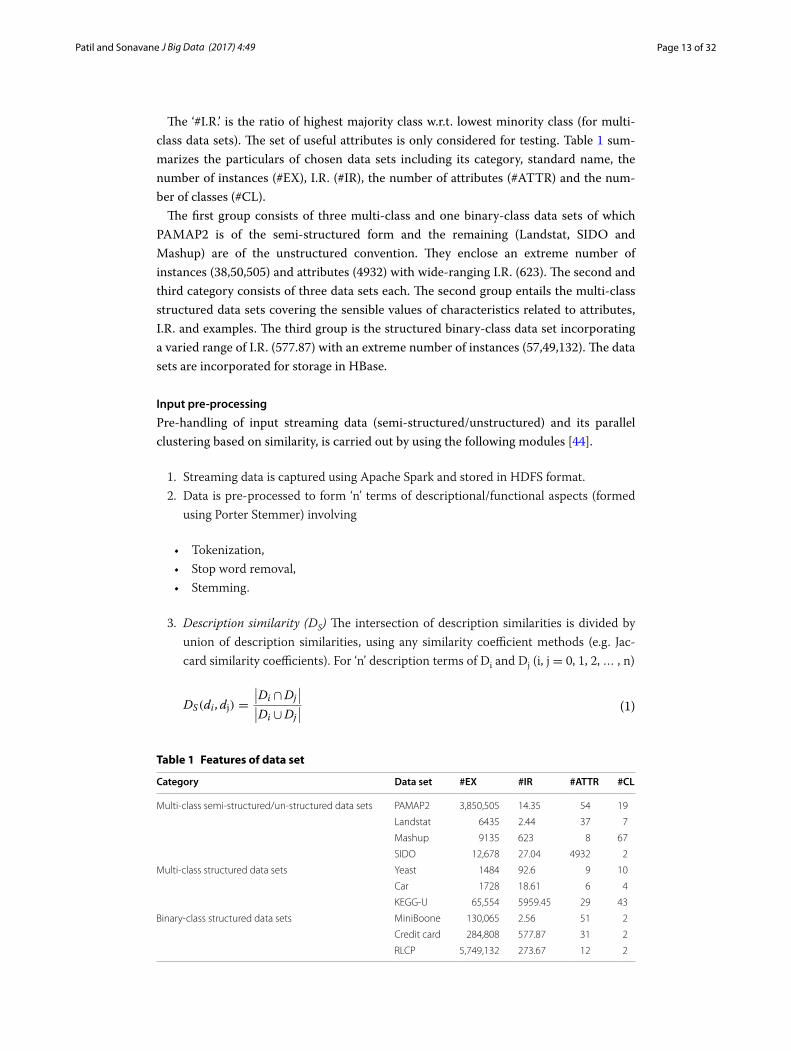
The ‘#I.R.’ is the ratio of highest majority class w.r.t. lowest minority class (for multi-class data sets). The set of useful attributes is only considered for testing. Table 1 sum-marizes the particulars of chosen data sets including its category, standard name, the number of instances (#EX), I.R. (#IR), the number of attributes (#ATTR) and the num-ber of classes (#CL).
The first group consists of three multi-class and one binary-class data sets of which PAMAP2 is of the semi-structured form and the remaining (Landstat, SIDO and Mashup) are of the unstructured convention. They enclose an extreme number of instances (38,50,505) and attributes (4932) with wide-ranging I.R. (623). The second and third category consists of three data sets each. The second group entails the multi-class structured data sets covering the sensible values of characteristics related to attributes, I.R. and examples. The third group is the structured binary-class data set incorporating a varied range of I.R. (577.87) with an extreme number of instances (57,49,132). The data sets are incorporated for storage in HBase.
Input pre‑processing
Pre-handling of input streaming data (semi-structured/unstructured) and its parallel clustering based on similarity, is carried out by using the following modules [44].
1. Streaming data is captured using Apache Spark and stored in HDFS format.2. Data is pre-processed to form ‘n’ terms of descriptional/functional aspects (formed
using Porter Stemmer) involving
• Tokenization,• Stop word removal,• Stemming.
3. Description similarity (DS) The intersection of description similarities is divided by union of description similarities, using any similarity coefficient methods (e.g. Jac-card similarity coefficients). For ‘n’ description terms of Di and Dj (i, j = 0, 1, 2, … , n)
(1)DS(di, dj) =
∣
∣Di ∩Dj
∣
∣
∣
∣Di ∪Dj
∣
∣
Table 1 Features of data set
Category Data set #EX #IR #ATTR #CL
Multi-class semi-structured/un-structured data sets PAMAP2 3,850,505 14.35 54 19
Landstat 6435 2.44 37 7
Mashup 9135 623 8 67
SIDO 12,678 27.04 4932 2
Multi-class structured data sets Yeast 1484 92.6 9 10
Car 1728 18.61 6 4
KEGG-U 65,554 5959.45 29 43
Binary-class structured data sets MiniBoone 130,065 2.56 51 2
Credit card 284,808 577.87 31 2
RLCP 5,749,132 273.67 12 2

Page 14 of 32Patil and Sonavane J Big Data (2017) 4:49
4. Functional similarity (DF) The intersection of functional similarities is divided by union of functional similarities, using any similarity coefficient methods (e.g. Jaccard similarity coefficients). For ‘n’ functional terms of Fi and Fj (i, j = 0, 1, 2, … , n),
For Eqs. 1 and 2, greater the intersection directs towards superior similarity. Denomi-nator ensures similarity (between 0 and 1) by playing a role of scaling factor.
5. Compute the characteristic similarity (DC) A weighted sum of DS and DF provides the required characteristic similarity.
where: α ϵ [0,1]: weight of DS; β ϵ [0,1]: weight of DF and α + β = 1.6. Formation of clusters using either partitional/hierarchical algometric clustering tech-
niquea. Partition clustering (e.g. k-means)
Step 1. Map phase
• For each map (k1,v1).• Clustering in respect to update Cc (k-means).• Output (ci,ni).
Step 2. Reduce phase
• Reduce (Cc,ci,ni).• Merge (mci,mni).• Check for new Cc, k1, v1.• Output (Cc,k1,v1,mci,mni).
where, Cc: centralized cluster medoids; k1: cluster seed indexes; v1: seed values; ci: clusters per map process; ni: number of instances per cluster; mci: merged respective clusters per mappers; mni: number of instances per merged clusters.
b. Hierarchical algometric clustering (HAC) Consider data set containing ‘n’ number of instances. For each data item assume initial cluster. The two most similar clusters are combined as per reduction stage complying the given ‘k’ value for a number of clus-ters (k < n). Reduction stages are as follows:
1. Merge the pair of clusters, having a maximum characteristic similarity (DC) by reducing the cluster count.
2. Calculate the new averaged similarity score between merged pairs and other remaining clusters.
3. Repeat step 1 and 2 satisfying ‘k’.
(2)DF (di, dj) =
∣
∣Fi ∩ Fj∣
∣
∣
∣Fi ∪ Fj∣
∣
(3)DC
(
di, dj)
= α ∗ DS
(
di, dj)
+ β ∗ DF (di, dj)
Page 15 of 32Patil and Sonavane J Big Data (2017) 4:49
Assumptions and environmental pre‑settings
1. The data sets are contextually converted into numeric/symbolic structured forms for analysis.
2. The number of map/reduce tasks is maintained in ratio to some multiple of mapper/reduce slots.
3. The ‘noatime’ option is enabled for mounting DFS and mapreduce storage.4. The compression techniques are used for intermediary data (e.g. Lempel–Ziv–Ober-
humer-LZO).5. The appropriate data types are used for non-textual and textual contents.
Performance evaluation parameters
The evaluation of techniques to handle imbalanced classification is planned using two measures viz. F-measure and area under the curve. The brief details are as:
a. F-measure This measure provides to assess the quality of the classifier in the imbal-anced domain.
• Pi: precision of ith class = True Positive/(True Positive + False Positive)• Ri: recall of ith class = Sensitivity(Recall) = True Positive/(True Positive + False
Negative)b. Area under the curve (AUC) It is produced by calculating the true positive rate (TPR,
sensitivity or recall) versus the false positive rate (FPR, 1-specificity). It helps to illus-trate the performance of a classifier system and correspondingly assists to choose the optimal models.
Notations
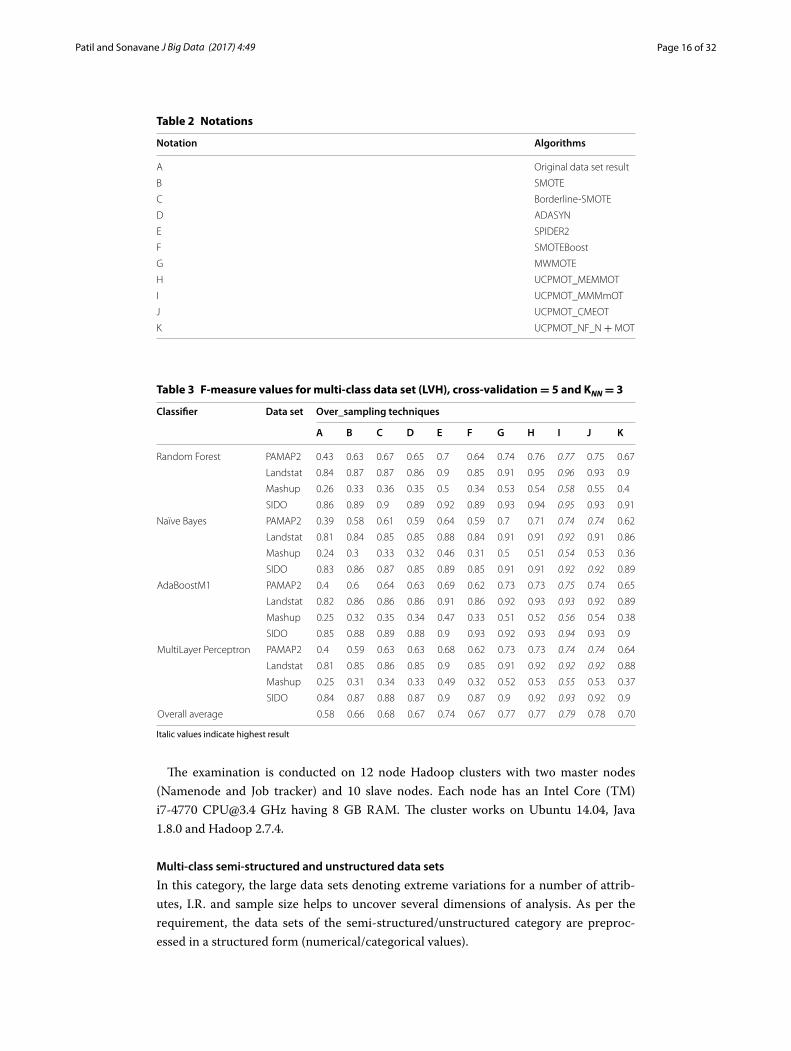
Table 2 denote the symbolizations used henceforth in the experimental analysis of algo-rithms. The notations used in Tables 3, 4, 5, 6, 7, 8, 9, 10, 11, 12 and 13 and Figs. 4, 5, 6, 7, 8, 9, 10, 11 and 12 are given as:
Experimental evaluationThe projected technique works on binary-class/multi-class imbalanced Big Data sets in the organization to recommended LVH. Four basic classifiers viz. Random Forest (-P 100-I 100-num-slots 1-K 0-M 1.0-V 0.001-S 1), Naïve Bayes, AdaBoostM1 (-P 100-S 1-I 10-W weka.classifiers.trees.DecisionStump) and MultiLayer Perceptron (-L 0.3-M 0.2-N 500-V 0-S 0-E 20-H a) are applied to over_sampled data sets using dissimilar values of cross-validation and KNN. Lastly the results, based on the F-measure and AUC values are used to compare between benchmarking (SMOTE/Borderline-SMOTE/ADASYN/SPI-DER2/SMOTEBoost/MWMOTE) and planned technique (UCPMOT). Tables 3, 4, 5, 6, 7, 8, 9, 10, 11, 12 and 13 describe the results in detail. The analysis of results validates the superiority of UCPMOT for enhancing the classification.
F-measure =2RiPi
Ri + Pifor all i = 1, 2, . . . k
Page 16 of 32Patil and Sonavane J Big Data (2017) 4:49
The examination is conducted on 12 node Hadoop clusters with two master nodes (Namenode and Job tracker) and 10 slave nodes. Each node has an Intel Core (TM) i7-4770 [email protected] GHz having 8 GB RAM. The cluster works on Ubuntu 14.04, Java 1.8.0 and Hadoop 2.7.4.
Multi‑class semi‑structured and unstructured data sets
In this category, the large data sets denoting extreme variations for a number of attrib-utes, I.R. and sample size helps to uncover several dimensions of analysis. As per the requirement, the data sets of the semi-structured/unstructured category are preproc-essed in a structured form (numerical/categorical values).
Table 2 Notations
Notation Algorithms
A Original data set result
B SMOTE
C Borderline-SMOTE
D ADASYN
E SPIDER2
F SMOTEBoost
G MWMOTE
H UCPMOT_MEMMOT
I UCPMOT_MMMmOT
J UCPMOT_CMEOT
K UCPMOT_NF_N + MOT
Table 3 F-measure values for multi-class data set (LVH), cross-validation = 5 and KNN = 3
Italic values indicate highest result
Classifier Data set Over_sampling techniques
A B C D E F G H I J K
Random Forest PAMAP2 0.43 0.63 0.67 0.65 0.7 0.64 0.74 0.76 0.77 0.75 0.67
Landstat 0.84 0.87 0.87 0.86 0.9 0.85 0.91 0.95 0.96 0.93 0.9
Mashup 0.26 0.33 0.36 0.35 0.5 0.34 0.53 0.54 0.58 0.55 0.4
SIDO 0.86 0.89 0.9 0.89 0.92 0.89 0.93 0.94 0.95 0.93 0.91
Naïve Bayes PAMAP2 0.39 0.58 0.61 0.59 0.64 0.59 0.7 0.71 0.74 0.74 0.62
Landstat 0.81 0.84 0.85 0.85 0.88 0.84 0.91 0.91 0.92 0.91 0.86
Mashup 0.24 0.3 0.33 0.32 0.46 0.31 0.5 0.51 0.54 0.53 0.36
SIDO 0.83 0.86 0.87 0.85 0.89 0.85 0.91 0.91 0.92 0.92 0.89
AdaBoostM1 PAMAP2 0.4 0.6 0.64 0.63 0.69 0.62 0.73 0.73 0.75 0.74 0.65
Landstat 0.82 0.86 0.86 0.86 0.91 0.86 0.92 0.93 0.93 0.92 0.89
Mashup 0.25 0.32 0.35 0.34 0.47 0.33 0.51 0.52 0.56 0.54 0.38
SIDO 0.85 0.88 0.89 0.88 0.9 0.93 0.92 0.93 0.94 0.93 0.9
MultiLayer Perceptron PAMAP2 0.4 0.59 0.63 0.63 0.68 0.62 0.73 0.73 0.74 0.74 0.64
Landstat 0.81 0.85 0.86 0.85 0.9 0.85 0.91 0.92 0.92 0.92 0.88
Mashup 0.25 0.31 0.34 0.33 0.49 0.32 0.52 0.53 0.55 0.53 0.37
SIDO 0.84 0.87 0.88 0.87 0.9 0.87 0.9 0.92 0.93 0.92 0.9
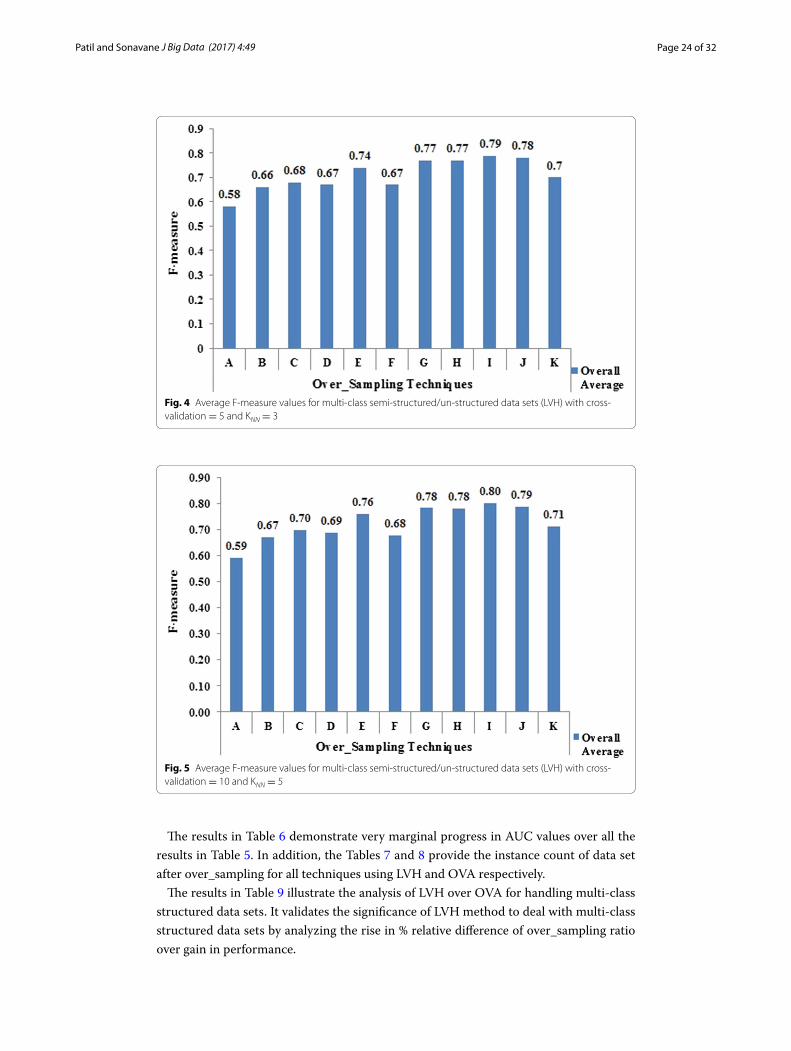
Overall average 0.58 0.66 0.68 0.67 0.74 0.67 0.77 0.77 0.79 0.78 0.70
Page 17 of 32Patil and Sonavane J Big Data (2017) 4:49
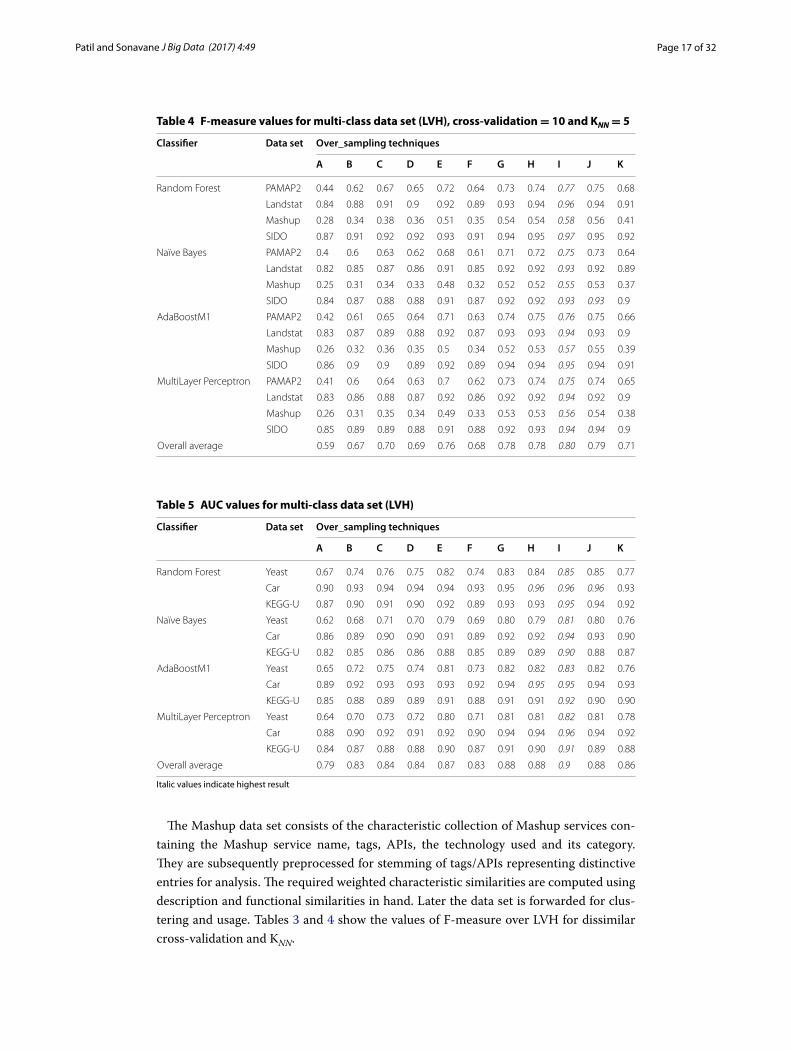
Table 4 F-measure values for multi-class data set (LVH), cross-validation = 10 and KNN = 5
Classifier Data set Over_sampling techniques
A B C D E F G H I J K
Random Forest PAMAP2 0.44 0.62 0.67 0.65 0.72 0.64 0.73 0.74 0.77 0.75 0.68
Landstat 0.84 0.88 0.91 0.9 0.92 0.89 0.93 0.94 0.96 0.94 0.91
Mashup 0.28 0.34 0.38 0.36 0.51 0.35 0.54 0.54 0.58 0.56 0.41
SIDO 0.87 0.91 0.92 0.92 0.93 0.91 0.94 0.95 0.97 0.95 0.92
Naïve Bayes PAMAP2 0.4 0.6 0.63 0.62 0.68 0.61 0.71 0.72 0.75 0.73 0.64
Landstat 0.82 0.85 0.87 0.86 0.91 0.85 0.92 0.92 0.93 0.92 0.89
Mashup 0.25 0.31 0.34 0.33 0.48 0.32 0.52 0.52 0.55 0.53 0.37
SIDO 0.84 0.87 0.88 0.88 0.91 0.87 0.92 0.92 0.93 0.93 0.9
AdaBoostM1 PAMAP2 0.42 0.61 0.65 0.64 0.71 0.63 0.74 0.75 0.76 0.75 0.66
Landstat 0.83 0.87 0.89 0.88 0.92 0.87 0.93 0.93 0.94 0.93 0.9
Mashup 0.26 0.32 0.36 0.35 0.5 0.34 0.52 0.53 0.57 0.55 0.39
SIDO 0.86 0.9 0.9 0.89 0.92 0.89 0.94 0.94 0.95 0.94 0.91
MultiLayer Perceptron PAMAP2 0.41 0.6 0.64 0.63 0.7 0.62 0.73 0.74 0.75 0.74 0.65
Landstat 0.83 0.86 0.88 0.87 0.92 0.86 0.92 0.92 0.94 0.92 0.9
Mashup 0.26 0.31 0.35 0.34 0.49 0.33 0.53 0.53 0.56 0.54 0.38
SIDO 0.85 0.89 0.89 0.88 0.91 0.88 0.92 0.93 0.94 0.94 0.9
Overall average 0.59 0.67 0.70 0.69 0.76 0.68 0.78 0.78 0.80 0.79 0.71
Table 5 AUC values for multi-class data set (LVH)
Italic values indicate highest result
Classifier Data set Over_sampling techniques
A B C D E F G H I J K
Random Forest Yeast 0.67 0.74 0.76 0.75 0.82 0.74 0.83 0.84 0.85 0.85 0.77
Car 0.90 0.93 0.94 0.94 0.94 0.93 0.95 0.96 0.96 0.96 0.93
KEGG-U 0.87 0.90 0.91 0.90 0.92 0.89 0.93 0.93 0.95 0.94 0.92
Naïve Bayes Yeast 0.62 0.68 0.71 0.70 0.79 0.69 0.80 0.79 0.81 0.80 0.76
Car 0.86 0.89 0.90 0.90 0.91 0.89 0.92 0.92 0.94 0.93 0.90
KEGG-U 0.82 0.85 0.86 0.86 0.88 0.85 0.89 0.89 0.90 0.88 0.87
AdaBoostM1 Yeast 0.65 0.72 0.75 0.74 0.81 0.73 0.82 0.82 0.83 0.82 0.76
Car 0.89 0.92 0.93 0.93 0.93 0.92 0.94 0.95 0.95 0.94 0.93
KEGG-U 0.85 0.88 0.89 0.89 0.91 0.88 0.91 0.91 0.92 0.90 0.90
MultiLayer Perceptron Yeast 0.64 0.70 0.73 0.72 0.80 0.71 0.81 0.81 0.82 0.81 0.78
Car 0.88 0.90 0.92 0.91 0.92 0.90 0.94 0.94 0.96 0.94 0.92
KEGG-U 0.84 0.87 0.88 0.88 0.90 0.87 0.91 0.90 0.91 0.89 0.88
Overall average 0.79 0.83 0.84 0.84 0.87 0.83 0.88 0.88 0.9 0.88 0.86
The Mashup data set consists of the characteristic collection of Mashup services con-taining the Mashup service name, tags, APIs, the technology used and its category. They are subsequently preprocessed for stemming of tags/APIs representing distinctive entries for analysis. The required weighted characteristic similarities are computed using description and functional similarities in hand. Later the data set is forwarded for clus-tering and usage. Tables 3 and 4 show the values of F-measure over LVH for dissimilar cross-validation and KNN.
Page 18 of 32Patil and Sonavane J Big Data (2017) 4:49
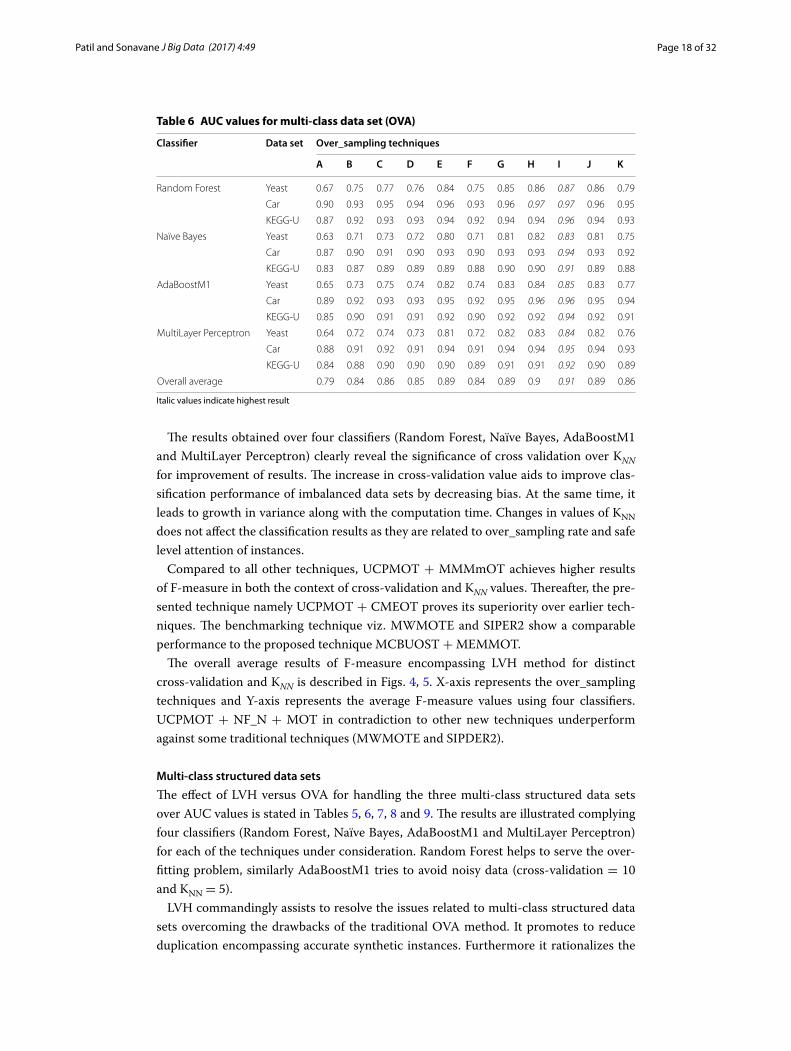
Table 6 AUC values for multi-class data set (OVA)
Italic values indicate highest result
Classifier Data set Over_sampling techniques
A B C D E F G H I J K
Random Forest Yeast 0.67 0.75 0.77 0.76 0.84 0.75 0.85 0.86 0.87 0.86 0.79
Car 0.90 0.93 0.95 0.94 0.96 0.93 0.96 0.97 0.97 0.96 0.95
KEGG-U 0.87 0.92 0.93 0.93 0.94 0.92 0.94 0.94 0.96 0.94 0.93
Naïve Bayes Yeast 0.63 0.71 0.73 0.72 0.80 0.71 0.81 0.82 0.83 0.81 0.75
Car 0.87 0.90 0.91 0.90 0.93 0.90 0.93 0.93 0.94 0.93 0.92
KEGG-U 0.83 0.87 0.89 0.89 0.89 0.88 0.90 0.90 0.91 0.89 0.88
AdaBoostM1 Yeast 0.65 0.73 0.75 0.74 0.82 0.74 0.83 0.84 0.85 0.83 0.77
Car 0.89 0.92 0.93 0.93 0.95 0.92 0.95 0.96 0.96 0.95 0.94
KEGG-U 0.85 0.90 0.91 0.91 0.92 0.90 0.92 0.92 0.94 0.92 0.91
MultiLayer Perceptron Yeast 0.64 0.72 0.74 0.73 0.81 0.72 0.82 0.83 0.84 0.82 0.76
Car 0.88 0.91 0.92 0.91 0.94 0.91 0.94 0.94 0.95 0.94 0.93
KEGG-U 0.84 0.88 0.90 0.90 0.90 0.89 0.91 0.91 0.92 0.90 0.89
Overall average 0.79 0.84 0.86 0.85 0.89 0.84 0.89 0.9 0.91 0.89 0.86
The results obtained over four classifiers (Random Forest, Naïve Bayes, AdaBoostM1 and MultiLayer Perceptron) clearly reveal the significance of cross validation over KNN for improvement of results. The increase in cross-validation value aids to improve clas-sification performance of imbalanced data sets by decreasing bias. At the same time, it leads to growth in variance along with the computation time. Changes in values of KNN does not affect the classification results as they are related to over_sampling rate and safe level attention of instances.
Compared to all other techniques, UCPMOT + MMMmOT achieves higher results of F-measure in both the context of cross-validation and KNN values. Thereafter, the pre-sented technique namely UCPMOT + CMEOT proves its superiority over earlier tech-niques. The benchmarking technique viz. MWMOTE and SIPER2 show a comparable performance to the proposed technique MCBUOST + MEMMOT.
The overall average results of F-measure encompassing LVH method for distinct cross-validation and KNN is described in Figs. 4, 5. X-axis represents the over_sampling techniques and Y-axis represents the average F-measure values using four classifiers. UCPMOT + NF_N + MOT in contradiction to other new techniques underperform against some traditional techniques (MWMOTE and SIPDER2).
Multi‑class structured data sets
The effect of LVH versus OVA for handling the three multi-class structured data sets over AUC values is stated in Tables 5, 6, 7, 8 and 9. The results are illustrated complying four classifiers (Random Forest, Naïve Bayes, AdaBoostM1 and MultiLayer Perceptron) for each of the techniques under consideration. Random Forest helps to serve the over-fitting problem, similarly AdaBoostM1 tries to avoid noisy data (cross-validation = 10 and KNN = 5).
LVH commandingly assists to resolve the issues related to multi-class structured data sets overcoming the drawbacks of the traditional OVA method. It promotes to reduce duplication encompassing accurate synthetic instances. Furthermore it rationalizes the

Page 19 of 32Patil and Sonavane J Big Data (2017) 4:49
Tab
le 7
In
stan
ce c
ou
nt a
fter
ove
r_sa
mp
ling
for
mu
lti-
clas
s st
ruct
ure
d d
ata
set (
LVH
)
Dat
a se
tO
ver_
sam
plin
g te
chn
ique
s
AB
CD
EF
GH
IJ
K
Yeas
t14
8432
9230
9234
7633
4531
8930
6927
2524
6329
9128
88
Car
1728
4326
4289
4716
4489
4167
4174
3525
3154
4089
3711
KEG
G-U
65,5
5418
9,65
117
7,65
119
4,51
119
2,48
917
1,55
117
5,16
712
3,54
411
7,62
915
6,23
314
0,01
3
Page 20 of 32Patil and Sonavane J Big Data (2017) 4:49
Tab
le 8
In
stan
ce c
ou
nt a
fter
ove
r_sa
mp
ling
for
mu
lti-
clas
s st
ruct
ure
d d
ata
set (
OV
A)
Dat
a se
tO
ver_
sam
plin
g te
chn
ique
s
AB
CD
EF
GH
IJ
K
Yeas
t14
8484
1079
2186
4385
5082
2377
0346
1431
0676
1570
23
Car
1728
4867
4699
5003
4980
4421
4609
3589
3472
4581
3947
KEG
G-U
65,5
5419
9,32
618
4,55
920
1,00
420
0,66
519
5,43
818
6,59
812
8,45
112
3,48
616
4,87
814
9,53
2
Page 21 of 32Patil and Sonavane J Big Data (2017) 4:49
Tab
le 9
An
alys
is o
f LV
H v
ersu
s O
VA
%RD
D: %
rela
tive
diff
eren
ce in
dat
a se
t ins
tanc
es u
sing
OVA
ove
r LVH
met
hod
in c
omp
aris
on to
initi
al d
ata
set
%RD
A: %
rela
tive
diff
eren
ce in
AU
C v
alue
s (R
ando
m F
ores
t–cl
assi
fier)
of O
VA o
ver L
VH m
etho
d in
com
par
ison
to b
ase
AU
C v
alue
s
Dat
a se
tO
ver_
sam
plin
g te
chn
ique
s
BC
DE
FG
HI
JK
%RD
D%
RDA
%RD
D%
RDA
%RD
D%
RDA
%RD
D%
RDA
%RD
D%
RDA
%RD
D%
RDA
%RD
D%
RDA
%RD
D%
RDA
%RD
D%
RDA
%RD
D%
RDA
Yeas
t84
.41.
3487
.69
1.3
85.2
71.
3287
.51
2.41
88.2
21.
3486
.03
2.38
51.4
72.
3523
.09
2.32
87.1
91.
1683
.44
2.56
Car
11.7
62.
129.
121.
055.
910
10.3
72.
115.
910
9.91
1.04
1.79
1.03
9.59
1.03
11.3
40
6.16
2.12
KEG
G-U
4.97
2.19
3.81
2.17
3.28
3.27
4.15
2.15
13.0
13.
316.
311.
073.
891.
064.
851.
045.
381.
056.
571.
08
Ave
rage
34.7
31.
8833
.54
1.13
31.4
81.
5334
.01
2.22
35.7
11.
5534
.08
1.49
19.0
51.
1112
.51
1.1
34.6
40.
5532
.61.
44
Page 22 of 32Patil and Sonavane J Big Data (2017) 4:49
overshooting issue of the minority classes after the over_sampling process. The OVA method exhibit the overshooting issue in addition to amplified computation. It fails to fulfill the real need of over_sampling.
Table 10 F-measure values for binary-class data set
Italic values indicate highest result
Classifier Data set Over_sampling techniques
A B C D E F G H I J K
Random Forest MiniBoone 0.82 0.84 0.84 0.84 0.87 0.84 0.90 0.89 0.91 0.90 0.85
Credit card 0.72 0.75 0.78 0.77 0.85 0.76 0.87 0.87 0.89 0.88 0.79
RLCP 0.24 0.27 0.28 0.28 0.69 0.27 0.73 0.73 0.74 0.72 0.42
Naïve Bayes MiniBoone 0.79 0.83 0.83 0.83 0.85 0.83 0.86 0.86 0.89 0.87 0.83
Credit card 0.69 0.74 0.75 0.75 0.82 0.74 0.84 0.84 0.85 0.84 0.76
RLCP 0.23 0.25 0.26 0.26 0.66 0.25 0.68 0.70 0.70 0.70 0.40
AdaBoostM1 MiniBoone 0.80 0.83 0.84 0.84 0.86 0.83 0.88 0.87 0.90 0.88 0.84
Credit card 0.70 0.74 0.76 0.75 0.82 0.75 0.85 0.86 0.86 0.86 0.78
RLCP 0.23 0.26 0.27 0.27 0.68 0.26 0.71 0.71 0.72 0.70 0.41
MultiLayer Perceptron MiniBoone 0.79 0.83 0.83 0.83 0.85 0.83 0.87 0.87 0.89 0.87 0.83
Credit card 0.69 0.74 0.76 0.75 0.82 0.75 0.85 0.85 0.86 0.85 0.77
RLCP 0.23 0.25 0.26 0.26 0.67 0.25 0.70 0.71 0.71 0.70 0.40
Overall average 0.58 0.61 0.62 0.62 0.79 0.61 0.81 0.81 0.83 0.81 0.67
Table 11 AUC values for binary-class data set
Italic values indicate highest result
Classifier Data set Over_sampling techniques
A B C D E F G H I J K
Random Forest MiniBoone 0.86 0.90 0.92 0.92 0.93 0.91 0.94 0.94 0.96 0.95 0.92
Credit card 0.78 0.83 0.86 0.85 0.88 0.84 0.91 0.89 0.92 0.91 0.85
RLCP 0.40 0.48 0.50 0.49 0.77 0.48 0.79 0.79 0.81 0.80 0.51
Naïve Bayes MiniBoone 0.85 0.87 0.90 0.91 0.91 0.90 0.92 0.92 0.93 0.92 0.90
credit card 0.76 0.80 0.82 0.82 0.87 0.81 0.89 0.87 0.90 0.90 0.83
RLCP 0.37 0.46 0.47 0.47 0.71 0.46 0.76 0.76 0.78 0.77 0.48
AdaBoostM1 MiniBoone 0.85 0.89 0.91 0.90 0.92 0.89 0.93 0.93 0.94 0.94 0.91
Credit card 0.77 0.81 0.84 0.83 0.89 0.82 0.90 0.88 0.91 0.90 0.85
RLCP 0.39 0.47 0.48 0.48 0.73 0.47 0.77 0.78 0.80 0.80 0.50
MultiLayer Perceptron MiniBoone 0.85 0.88 0.91 0.90 0.91 0.89 0.92 0.92 0.93 0.93 0.91
Credit card 0.76 0.81 0.83 0.83 0.86 0.82 0.88 0.88 0.90 0.90 0.84
RLCP 0.38 0.47 0.47 0.47 0.73 0.47 0.77 0.77 0.79 0.79 0.49
Overall average 0.66 0.72 0.74 0.73 0.84 0.73 0.86 0.86 0.88 0.87 0.74
Table 12 F-measure value for UCPMOT_MEMMOT
Classifier—AdaBooost, Cross-validation—tenfold, KNN = 5
Data set Number of mappers
8 16 32 64
KEGG-U 0.85 0.84 0.82 0.81
PAMAP2 0.76 0.74 0.73 0.72
Mashup 0.54 0.53 0.52 0.50
Page 23 of 32Patil and Sonavane J Big Data (2017) 4:49
Tab
le 1
3 R
un
tim
e (D
D:H
H:M
M) f
or
F-m
easu
re v
alu
es o
f KEG
G-U
dat
a se
t (LV
H)
Num
ber
of m
app
ers
Ove
r_sa
mp
ling
tech
niq
ues
BC
DE
FG
HI
JK
82:
21:3
73:
09:4
43:
04:5
34:
11:2
64:
02:4
23:
21:0
83:
11:4
23:
19:0
73:
22:2
13:
23:0
3
162:
10:3
22:
16:3
92:
14:3
83:
10:4
93:
07:5
52:
23:0
72:
18:0
92:
22:5
63:
01:4
83:
03:3
8
321:
23:2
02:
04:2
12:
02:1
62:
20:1
12:
17:2
32:
06:1
72:
03:3
22:
04:5
12:
12:3
42:
15:0
2
641:
17:5
61:
22:4
71:
21:3
82:
12:5
32:
09:4
32:
02:3
41:
23:2
12:
01:1
42:
05:4
12:
07:2
9
Page 24 of 32Patil and Sonavane J Big Data (2017) 4:49
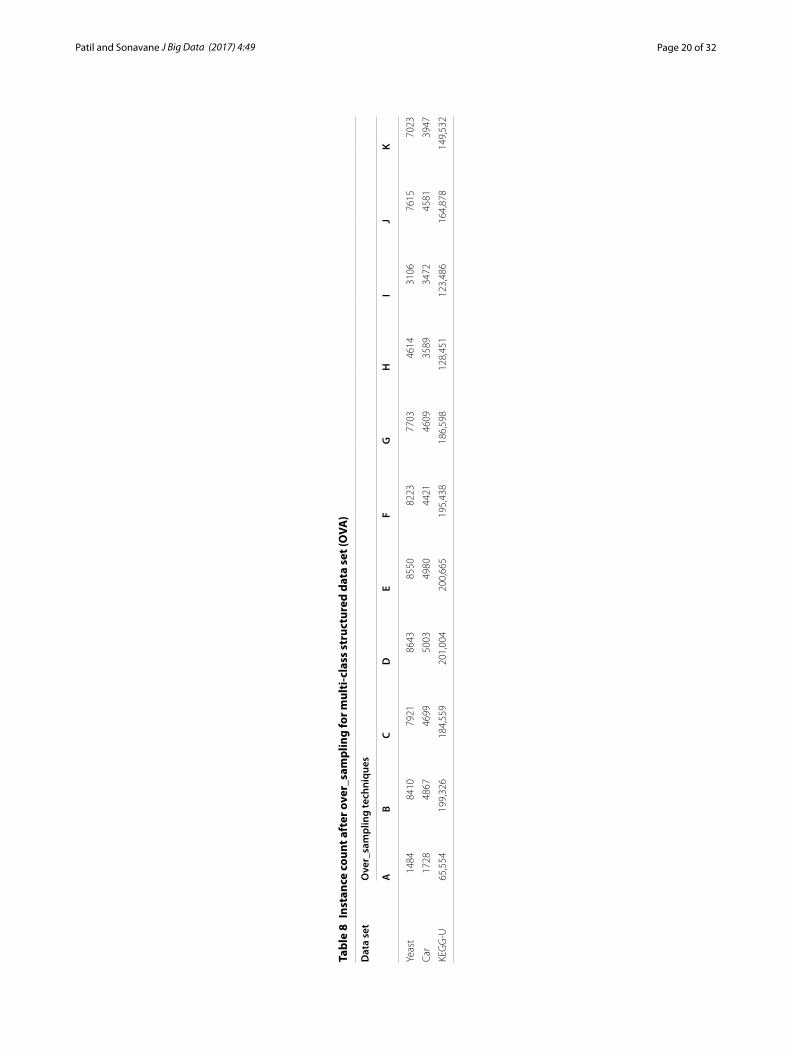
The results in Table 6 demonstrate very marginal progress in AUC values over all the results in Table 5. In addition, the Tables 7 and 8 provide the instance count of data set after over_sampling for all techniques using LVH and OVA respectively.
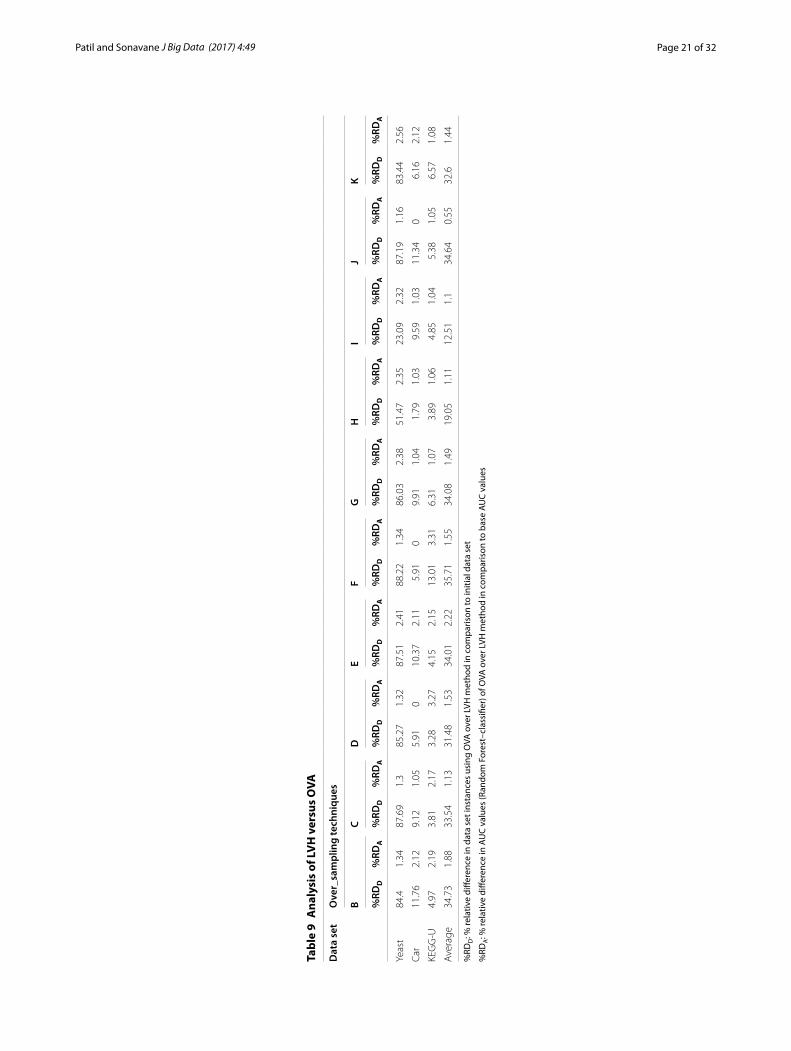
The results in Table 9 illustrate the analysis of LVH over OVA for handling multi-class structured data sets. It validates the significance of LVH method to deal with multi-class structured data sets by analyzing the rise in % relative difference of over_sampling ratio over gain in performance.
Fig. 4 Average F-measure values for multi-class semi-structured/un-structured data sets (LVH) with cross-validation = 5 and KNN = 3
Fig. 5 Average F-measure values for multi-class semi-structured/un-structured data sets (LVH) with cross-validation = 10 and KNN = 5
Page 25 of 32Patil and Sonavane J Big Data (2017) 4:49
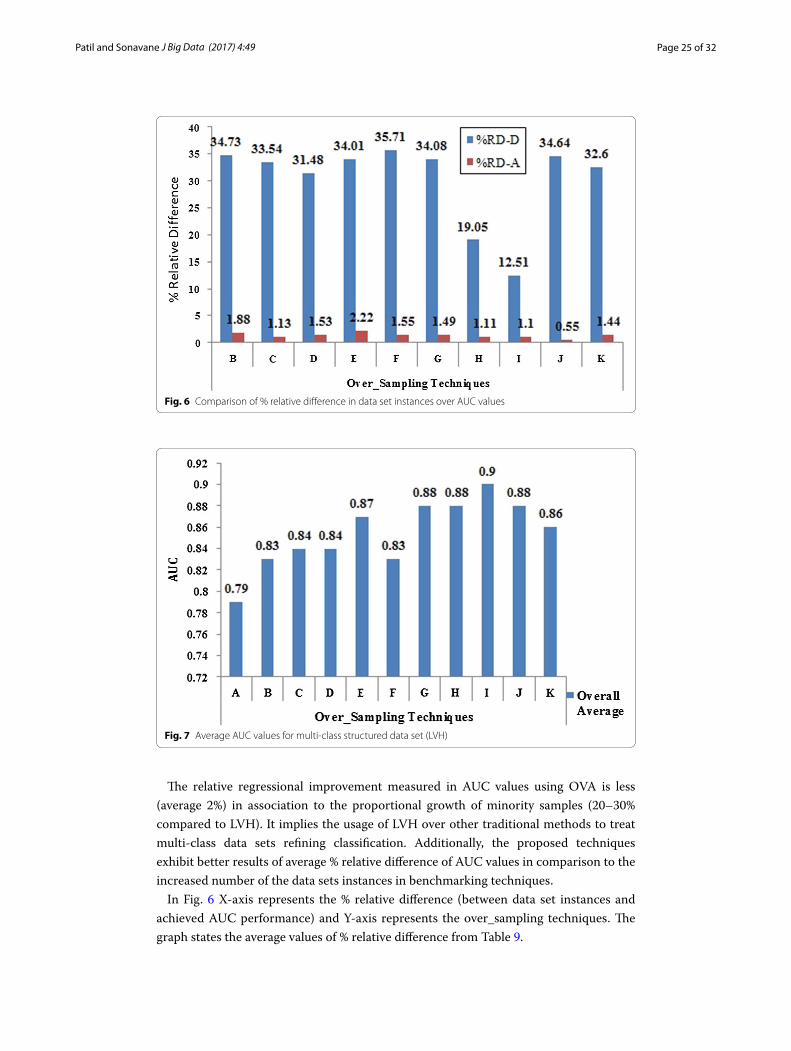
The relative regressional improvement measured in AUC values using OVA is less (average 2%) in association to the proportional growth of minority samples (20–30% compared to LVH). It implies the usage of LVH over other traditional methods to treat multi-class data sets refining classification. Additionally, the proposed techniques exhibit better results of average % relative difference of AUC values in comparison to the increased number of the data sets instances in benchmarking techniques.
In Fig. 6 X-axis represents the % relative difference (between data set instances and achieved AUC performance) and Y-axis represents the over_sampling techniques. The graph states the average values of % relative difference from Table 9.
Fig. 6 Comparison of % relative difference in data set instances over AUC values
Fig. 7 Average AUC values for multi-class structured data set (LVH)
Page 26 of 32Patil and Sonavane J Big Data (2017) 4:49
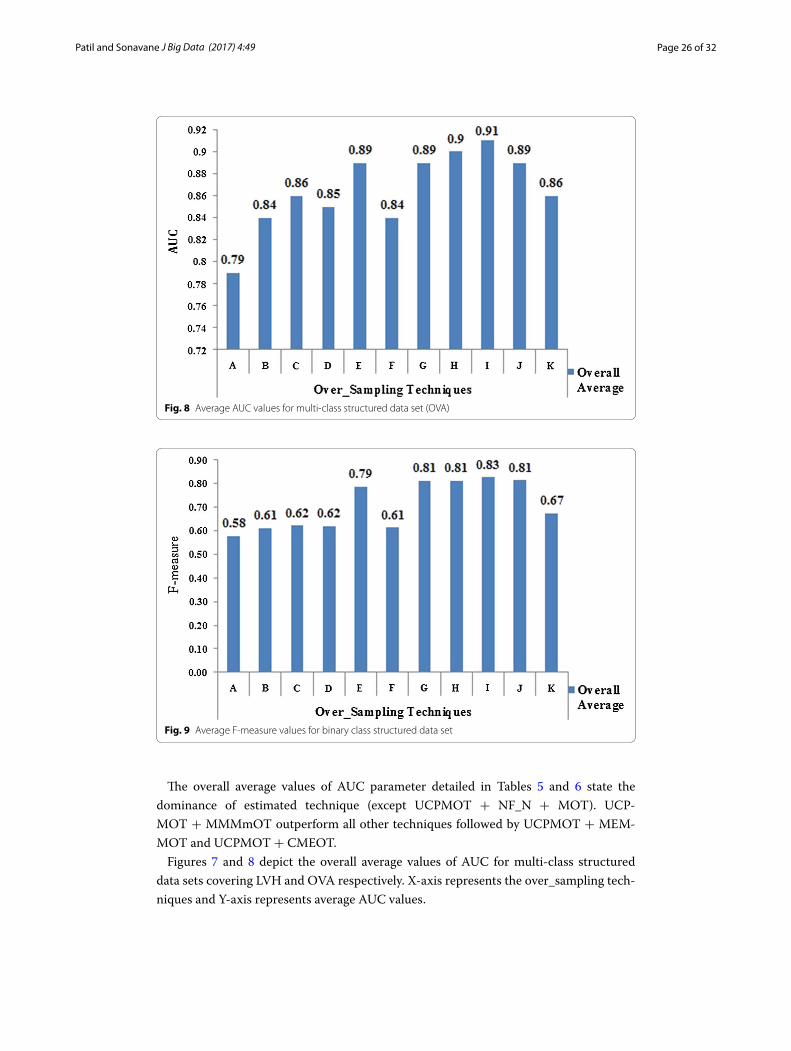
The overall average values of AUC parameter detailed in Tables 5 and 6 state the dominance of estimated technique (except UCPMOT + NF_N + MOT). UCP-MOT + MMMmOT outperform all other techniques followed by UCPMOT + MEM-MOT and UCPMOT + CMEOT.
Figures 7 and 8 depict the overall average values of AUC for multi-class structured data sets covering LVH and OVA respectively. X-axis represents the over_sampling tech-niques and Y-axis represents average AUC values.
Fig. 8 Average AUC values for multi-class structured data set (OVA)
Fig. 9 Average F-measure values for binary class structured data set
Page 27 of 32Patil and Sonavane J Big Data (2017) 4:49
Binary‑class structured data sets
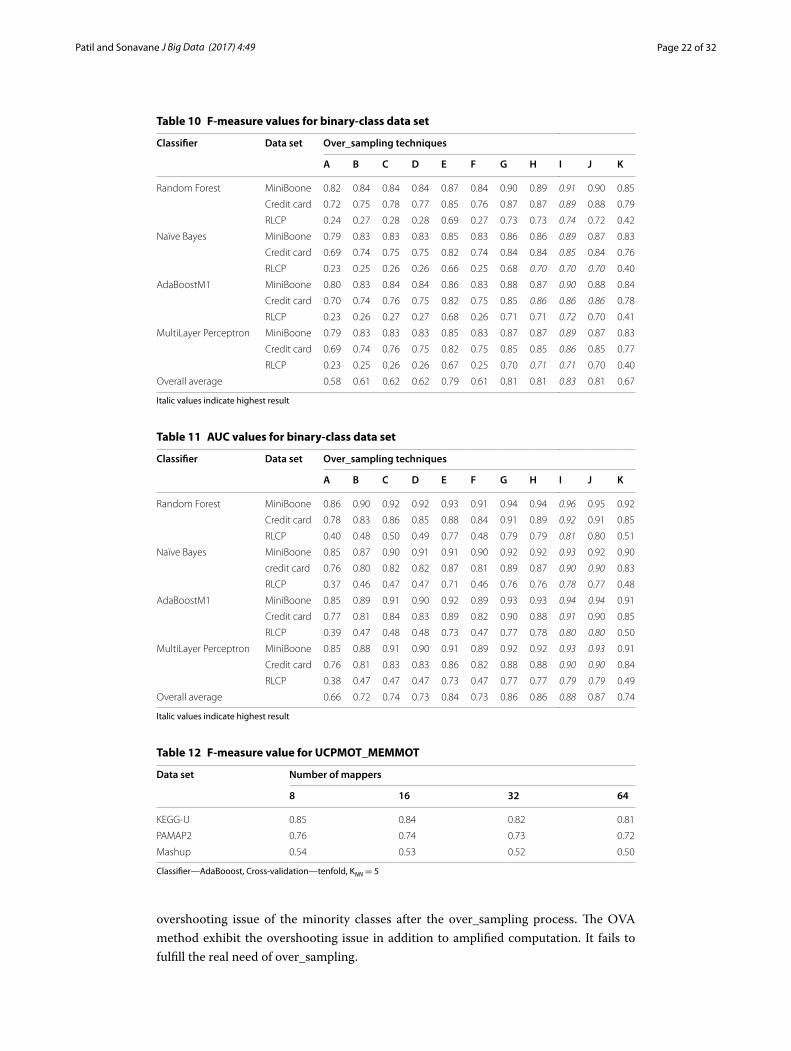
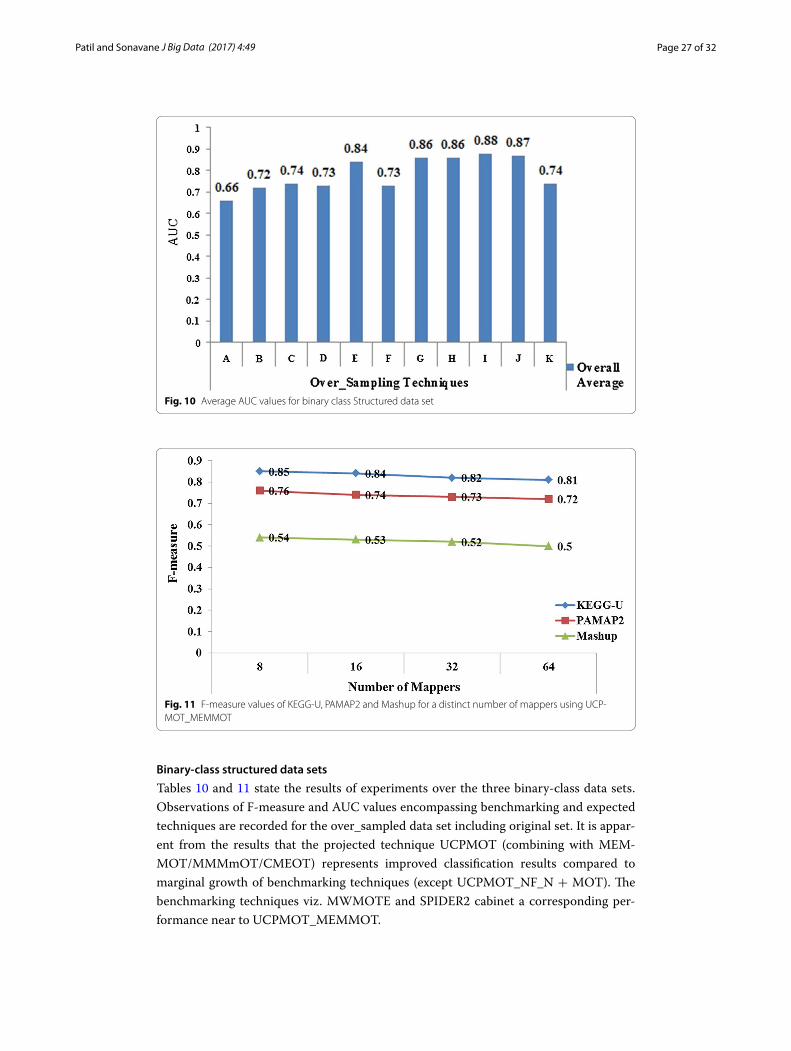
Tables 10 and 11 state the results of experiments over the three binary-class data sets. Observations of F-measure and AUC values encompassing benchmarking and expected techniques are recorded for the over_sampled data set including original set. It is appar-ent from the results that the projected technique UCPMOT (combining with MEM-MOT/MMMmOT/CMEOT) represents improved classification results compared to marginal growth of benchmarking techniques (except UCPMOT_NF_N + MOT). The benchmarking techniques viz. MWMOTE and SPIDER2 cabinet a corresponding per-formance near to UCPMOT_MEMMOT.
Fig. 10 Average AUC values for binary class Structured data set
Fig. 11 F-measure values of KEGG-U, PAMAP2 and Mashup for a distinct number of mappers using UCP-MOT_MEMMOT
Page 28 of 32Patil and Sonavane J Big Data (2017) 4:49
The graphs in Figs. 9 and 10 demonstrate the average values of F-measure and AUC values respectively, over four classifiers for the binary-class data sets under considera-tion (cross-validation = 10 and KNN = 5).
In Figs. 9 and 10, the over_sampling techniques (B to K) including initial results (A) are represented as X-axis and the values for F-measure and AUC values as Y-axis respec-tively. The graphs entail the superiority of UCPMOT + MMMmOT over all other tech-niques for almost all classifiers. UCPMOT + NF_N + MOT show specific bordering enhancement compared to the benchmarking techniques (SMOTE, Borderline-SMOTE, ADASYN and SMOTEBoost). Random Forest indicates promising results over other classifiers for almost all techniques.
The effect of choosing the number of mappers
Table 12 deliver the classification performance by using diverse numbers of mappers. It states at a glance, the rise in a number of mappers from 8 to 64 leads to a very mar-ginal decline in classification accuracy. The results are summarized over three data sets namely KEGG-U, PAMAP2 and Mashup using the UCPMOT_MEMMOT technique (LVH based). The results are detailed on F-measure values with AdaBoost classifier (cross-validation = 10 and KNN = 5).
The less availability of over_sampled minority instances per mapper decreases the F-measure value. The analysis shown in Fig. 11 states the dependency of final classifica-tion model w.r.t. the number of instances that exist in the mapper.
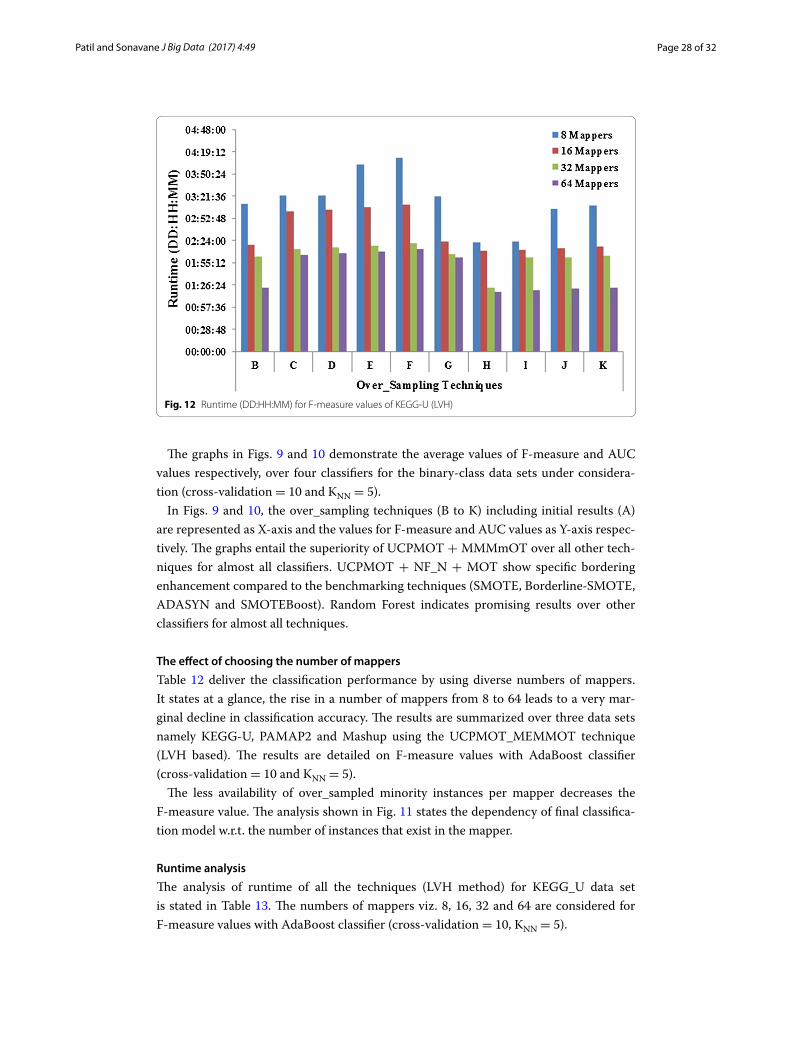
Runtime analysis
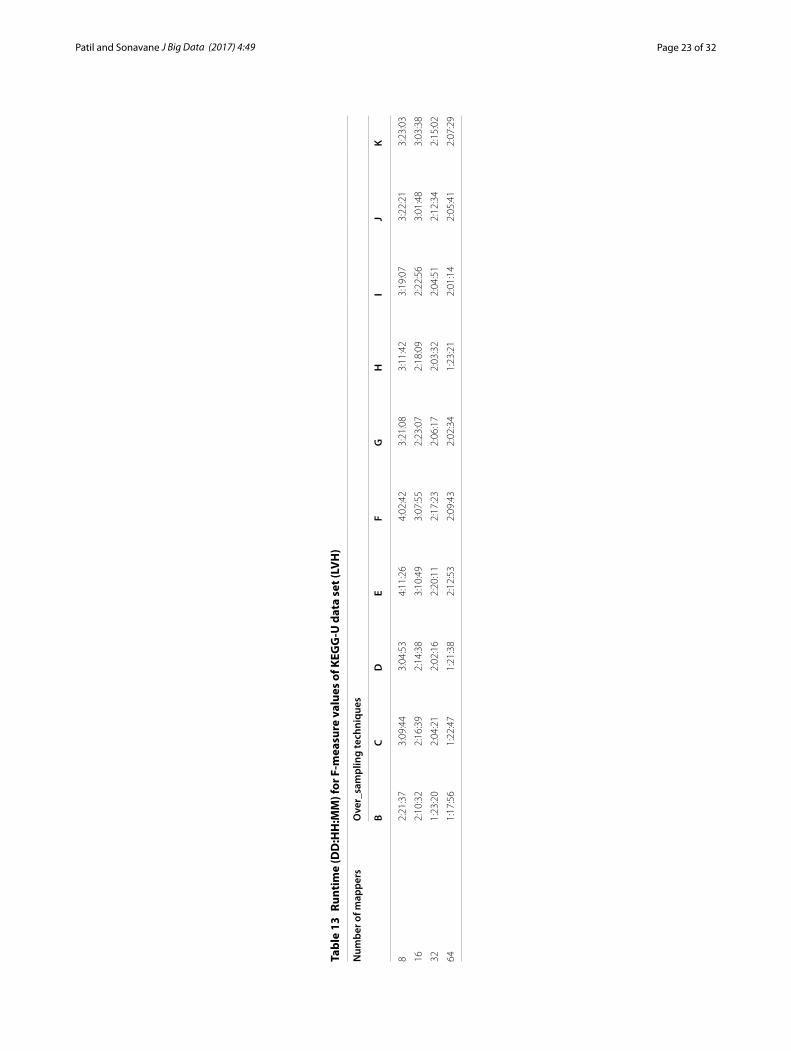
The analysis of runtime of all the techniques (LVH method) for KEGG_U data set is stated in Table 13. The numbers of mappers viz. 8, 16, 32 and 64 are considered for F-measure values with AdaBoost classifier (cross-validation = 10, KNN = 5).
Fig. 12 Runtime (DD:HH:MM) for F-measure values of KEGG-U (LVH)
Page 29 of 32Patil and Sonavane J Big Data (2017) 4:49
The runtime analysis presents the reduction in computation time with respect to the increase in the number of mappers of almost all techniques. Table 13 informally asserts the comparative runtimes for proposed techniques. The data distribution/collection in Hadoop environment induces a processing time overhead which nullifies its effect on treating small data sets. Sometimes it leads to unused slots and implicitly infers that the speed is irrational to the number of mappers.
Figure 12 represents the analysis of runtimes over KEGG_U data set, aimed at all the techniques for a varied number of mappers. In proposed techniques, the UCP-MOT + MEMMOT comparatively consumes a less amount of time for non-trivial oper-ations in the over_sampling process.
DiscussionsThe training sets affected with class imbalance, high overlapping and low disjuncts lead to decrease in classification performance. As shown in the graphs of Figs. 4, 5, 6, 7, 8, 9, 10, 11 and 12, the planned technique helps to effectively cope with the imbal-ance problem in large data sets. They overcome the drawbacks related to several data characteristics. Ensemble based learning techniques help to discourse vigorous learn-ing. Table 9 emphasizes the distress of classification performance contrasted with the obtained over_sampling rate of the imbalanced data set using OVA method. It clarifies the supremacy of LVH method over OVA for handling multi-class data sets. The exami-nation of the performance as stated in Fig. 11 with respect to the distinct numbers of mappers over varied data size is carried out. Table 13 has conferred the runtime require-ments of all techniques in association to the different numbers of mappers. The reduc-tion in the number of tasks to slots is basically dependent on the planned block size of data sets. The enabling of JVM-reuse can help to reuse the unused slots. The effect of absolute imbalance in a data set over more precise over_sampling has to be emphasized in detail. Moreover the significance of noise needs a directed supervision in the mapre-duce framework.
ConclusionAn advanced cluster based technique (UCPMOT) dealing with binary-class/multi-class imbalanced Big Data sets is presented in this paper. The UCPMOT works with MEMMOT/MMMmOT/NF_N + MOT/CMEOT using SSS to achieve the improved F-measure and AUC values. The learning from imbalanced Big Data sets demonstrates an average 6–8% rise in the results of the proposed technique over benchmarking tech-niques. The issues raised due to overlapping and borderline instances, lack of density, increased bias and small disjuncts are articulated effectively by SSS. Experiments are carried out on standard data sets exhibiting distinctive degrees of I.R., data size and a number of attributes. They are selected mostly from UCI repository and one each from causality workbench and ProgrammableWeb respectively. The LVH method attempts to assist better for over_sampling of multi-class data sets in alignment to improve clas-sification performance. The renowned classifiers namely Random Forest, Naïve Bayes, AdaBoostM1 and Multilayer Perceptron are used for model building and analysis. The Random Forest classification (Tables 3, 4, 5, 6, 9, 10, 11) signifies an encouraging growth by 2–4% in the result compared to other classifiers including all techniques. The
Page 30 of 32Patil and Sonavane J Big Data (2017) 4:49
mapreduce based framework is used as an experimental test-bed. The increase in the number of mappers from 8, 16, 32 to 64 (Table 12) shows an almost stationary value for F-measure. The gradual decrease of runtime (Table 13) is cabinet for the increased number of mappers over techniques, stating the prudent runtimes for proposed tech-niques. The performance of efficiency is recorded reasonably uneven for the increase in the number of mappers. The results in-hand, determine to further investigate some of the overturned trials, related to the dataset shift problem in a distributed environment maintaining the number of map/reduce slots.
AbbreviationsUCPMOT: Updated Class Purity Maximization Over_Sampling Technique; LVH: lowest versus highest; IR: imbalance ratio; OVA: one versus all; MEMMOT: MEre Mean Minority Over_Sampling Technique; MMMmOT: Minority Majority Mix mean Over_Sampling Technique; NF_N + MOT: Nearest Farthest Neighbor_Mid Over_Sampling Technique; CMEOT: Clustering Minority Examples Over_Sampling Technique; KNN: KNN nearest neighbors; SSS: safe-level based synthetic samples.
Authors’ contributionsThe proposed Updated Class Purity Maximization Over_Sampling Technique (UCPMOT) is an enhanced cluster based technique to efficiently handle the issues related to learning from imbalanced data sets. It works with binary-class and multi-class data sets. The results show the superiority of the proposed technique over benchmarking techniques. The issues related to other data characteristics involved in imbalanced data sets learning as like overlapping instances, lack of density and small disjuncts are effectively addressed. Both authors read and approved the final manuscript.
An explanation of why my manuscript is to be published in Journal of Big Data: Reviews from broad research com-munal in the allied area to my practical work & its analysis may help to refine the work further. It will help to deliver a reference to a broad, multidisciplinary community.
Authors’ informationSachin S. Patil was born in Mumbai, India, in 1981. He received the B.E. degree in computer science and engineering and M. Tech. in computer science and technology from the Shivaji University, Kolhapur in 2003 and 2011 respectively. He is pursuing a Ph.D. degree in computer science and engineering under A.I.C.T.E. Q.I.P. scheme at Walchand College of Engineering (Govt. aided and an Autonomous Institute) affiliated to Shivaji University, Kolhapur, MH India.
Since 2010, he has been an Assistant Professor in the Computer Science and Engineering Department, Rajaram-bapu Institute of Technology, Rajaramnagar, MH—India. He has worked as head of Computer Science and Engineering department at Rajarambapu Institute of Technology, Rajaramnagar, MH—India. He is the author of a book chapter at Springer-Verlag and has more than 15 research papers. His research interests include Database Engineering and Big Data analytics. He has received a “Distinguished Facilitator” award at Inspire faculty contest organized by Infosys, Pune. He is a member of the IEEE.
Shefali Sonavane was born in townplace Pandharpur, Maharashtra, India in 1970. She received her Bachlor Engineer-ing (B.E.) and Masters (M.E.) degree in Computer Science and Engineering from Shivaji University, Kolhapur in 1992 and 2001 respectively. She has received a Ph.D. degree in 2010 in Computer Science and Engineering at Walchand College of Engineering (Govt. Aided_Autonomous Institute) affiliated to Shivaji University, Kolhapur, MH India. With 2 years of industry experience, she opted Teaching as a career profession.
Her Ph.D. work is supported under Young Scientist, research scheme by Department of Science and Technology, New Delhi, India. Dr. Shefali received Best Teacher Award in 2008 and is a member of many professional organisations.
Currently, she is working as an Associate Professor and heading Department of Information Technology at Walchand College of Engineering Sangli. She has received research funds from DST and AICTE for various technical projects pro-moting work in the area of Computer Vision and Information Security. She has a good number of publications in journals and participation in conferences with few IPR credentials at her account. She has extended her research interest further in the fields of Machine Learning and Big Data. She is an active member towards the implementation of Outcome Based Education (OBE) in engineering with special efforts in revamping the teaching methodology and its assessment.
Author details1 Computer Science and Engineering, R.I.T, Rajaramnagar, Islampur, Sangli, India. 2 Information Technology, W.C.E., Vish-rambag, Sangli, India.
AcknowledgementsNot applicable.
Competing interestsThe authors declare that they have no competing interests.
Availability of data and materialsThe datasets supporting the conclusions of this article are available in the UCI repository, the causality workbench under pharmacology base and at ProgrammableWeb. https://archive.ics.uci.edu/ml/datasets.html, http://www.causality.inf.ethx.ch/data/SDIO.html, http://www.programmableweb.com.
Consent for publicationNot applicable.
Page 31 of 32Patil and Sonavane J Big Data (2017) 4:49
Ethics approval and consent to participateNot applicable.
FundingNot applicable.
Publisher’s NoteSpringer Nature remains neutral with regard to jurisdictional claims in published maps and institutional affiliations.
Received: 9 September 2017 Accepted: 6 December 2017
References 1. Wu X, et al. Data mining with big data. IEEE Trans Knowl Data Eng. 2014;26:97–107. 2. Gandomi A, Haider M. Beyond the hype: big data concepts, methods, and analytics. Int J Inform Manag.
2015;35:137–44. 3. Agrawal D, et al. Challenges and opportunity with big data. A community white paper developed by leading
researchers across the United States; 2012. p. 1–17. 4. Zhao W, Ma H, He Q. Parallel K-means clustering based on mapreduce. CloudCom LNCS. 2009;5931:674–9. 5. Chen X, Lin X. Big data deep learning: challenges and perspectives. IEEE Access. 2014;2:514–25. https://doi.
org/10.1109/ACCESS.2014.2325029. 6. Dandawate Y, et al. Big Data: challenges and opportunities, Infosys Labs Briefings—Infosys Labs. DIALOG. 2013.
http://www.infosys.com/infosys-labs/publications/Documents/bigdata-challenges-opportunities.pdf. Accessed Dec 2014.
7. López V, et al. An insight into classification with imbalanced data: empirical results and current trends on using data intrinsic characteristics. J Inform Sci. 2013;250:113–41. https://doi.org/10.1016/j.ins.2013.07.007.
8. Japkowicz N, Stephen S. The class imbalance problem: a systematic study. ACM J Intell Data Anal. 2002;6:429–49. 9. He H, Garcia E. Learning from imbalanced data. IEEE Trans Knowl Data Eng. 2009;21:1263–84. 10. Sun Y, Wong A, Kamel M. Classification of imbalanced data: a review. Int J Pattern Recog A I. 2009;23:687–719.
https://doi.org/10.1142/S0218001409007326. 11. Guo H, et al. Learning from class-imbalanced data: review of methods and applications. Elsevier Exp Syst Appl.
2017;73:220–39. 12. Park B, Oh S, Pedrycz W. The design of polynomial function-based neural network predictors for detection of soft-
ware defects. J Inform Sci. 2013;229:40–57. https://doi.org/10.1016/j.ins.2011.01.026. 13. Vorobeva A. Examining the performance of classification algorithms for imbalanced data sets in web author iden-
tification. In: IEEE open innovations association and seminar on information security and protection of information technology: FRUCT-ISPIT. 2016. p. 385–390. https://doi.org/10.1109/fruct-ispit.2016.7561554.
14. Rio S, Lopez V, Benitez J, Herrera F. On the use of MapReduce for imbalanced big data using Random Forest. J Inform Sci. 2014;285:112–37. https://doi.org/10.1016/j.ins.2013.07.007.
15. Jiang H, ChenY Qiao Z. Scaling up MapReduce-based Big Data processing on multi-GPU systems. SpingerLink Clu Comp. 2015;18:369–83. https://doi.org/10.1007/s10586-014-0400-1.
16. Nadaf M, Patil S. Performance evaluation of categorizing technical support requests using advanced K-means algo-rithm. IEEE Int Adv Com Conf. 2015. https://doi.org/10.1109/iadcc.2015.7154740.
17. Bhagat R, Patil S. Enhanced SMOTE algorithm for classification of imbalanced BigData using Random Forest. IEEE Int Adv Com Conf. 2015. https://doi.org/10.1109/iadcc.2015.7154739.
18. Batista G, Prati R, Monard M. A study of the behaviour of several methods for balancing machine learning training data. ACM Sigkdd Expl Newslett. 2004;6:20–9. https://doi.org/10.1145/1007730.1007735.
19. Chawla N, Bowyer K, Hall L, Kegelmeyer W. SMOTE: synthetic minority over-sampling technique. J Artif Intell Res. 2002;16:321–57.
20. Han H, Wang W, Mao B. Borderline-SMOTE: a new over-sampling method in imbalanced data sets learning. In: Proceeding of the 2005 international conference on intelligence computing. 2005. p. 878–87.
21. Bunkhumpornpat C, Sinapiromsaran K. Lursinsap C (2009) Safe-Level-Smote: safe-level-synthetic minority over-sampling technique for handling the class imbalanced problem. In: Theeramunkong T, Kijsirikul B, Cercone N, Ho TB, editors. Advances in knowledge discovery and data mining. PAKDD, vol. 5476. Berlin: Springer; 2009. p. 475–82. https://doi.org/10.1007/978-3-642-01307-2_43.
22. He H, Bai Y, Garcia E, Li S. ADASYN: adaptive synthetic sampling approach for imbalanced learning. In: Proceed-ings of the 2008 IEEE international joint conference on neural networks. 2008. p. 1322–8. https://doi.org/10.1109/ijcnn.2008.4633969.
23. Garcia S, Derrac J, Triguero I, Carmona C, Herrera F. Evolutionary-based selection of generalized instances for imbal-anced classification. J Knowl Syst. 2012;25:3–12. https://doi.org/10.1016/j.knosys.2011.01.012.
24. Hu F, Li H. A novel boundary oversampling algorithm based on neighborhood rough set model: NRSBoundary-SMOTE. Math Probl Eng. 2013. https://doi.org/10.1155/2013/694809.
25. Chawla N, Lazarevic A, Hall L, Bowyer K. SMOTEBoost: improving prediction of the minority class in boosting. Berlin: PKDD Springer; 2003. p. 107–19.
26. Xiong H, Yang Y, Zhao S. Local clustering ensemble learning method based on improved AdaBoost for rare class analysis. J Comput Inform Syst. 2012;8:1783–90.
Page 32 of 32Patil and Sonavane J Big Data (2017) 4:49
27. Alberto F, Jesus M, Herrera F. Multi-class imbalanced data-sets with linguistic fuzzy rule based classification systems based on pairwise learning. In: International conference on information processing and management of uncer-tainty in knowledge-based systems. Berlin: Springer; 2010. p. 89–98.
28. Han J, Liu Y, Sun X. A scalable random forest algorithm based on MapReduce. In: 4th IEEE international conference software engineering and service science (ICSESS); 2013. p. 849–52. https://doi.org/10.1109/icsess.2013.6615438.
29. Zhang Z, et al. Empowering one-vs-one decomposition with ensemble learning for multi-class imbalanced data. Elsevier Knowl Syst. 2016;106:251–63.
30. Kwak J, Lee T, Kim C. An incremental clustering-based fault detection algorithm for class-imbalanced process data. IEEE Trans Semicond Manuf. 2015;28:318–28. https://doi.org/10.1109/TSM.2015.2445380.
31. Kim S, Kim H, Namkoong Y. Ordinal classification of imbalanced data with application in emergency and disaster information services. IEEE Intell Syst. 2016;31:50–6. https://doi.org/10.1109/MIS.2016.27.
32. Chandak M. Role of big-data in classification and novel class detection in data streams. J Big Data. 2016;3:1–9. https://doi.org/10.1186/s40537-016-0040-9.
33. Li D, Wu C, Tsai I, Lina Y. Using mega-trend-diffusion and artificial samples in small data set learning for early flexible manufacturing system scheduling knowledge. J Comput Oper Res. 2007;34:966–82. https://doi.org/10.1016/j.cor.2005.05.019.
34. Barua S, Islam M, Yao X, Murase K. MWMOTE—majority weighted minority oversampling technique for imbalanced data set learning. IEEE Trans Knowl Data Eng. 2014;26:405–25. https://doi.org/10.1109/tkde.2012.232.
35. Ai X, Wu J, Sheng V, Zhao P, Yao Y, Cui Z. Immune centroids over-sampling method for multi-class classification. In: Cao T, Lim EP, Zhou ZH, Ho TB, Cheung D, Motoda H, editors. Advances in knowledge discovery and data mining, PAKDD 2015, vol. 9077. Berlin: Springer; 2015. p. 251–63. https://doi.org/10.1007/978-3-319-18038-0_20.
36. Patil S, Sonavane S. Enhanced over_sampling techniques for handling imbalanced big data set classification. In: Data science and big data: an environment of computational intelligence (studies in big data). Berlin: Springer International Publishing; 2017. 24: 49–81. https://doi.org/10.1007/978-3-319-53474-9_3.
37. Yoon K, Kwek S. An unsupervised learning approach to resolving the data imbalanced issue in supervised learning problems in functional genomics. In: IEEEHybrid Intelligent Systems, 2005. HIS’05. Fifth International Conference. 2005. p. 1–6. https://doi.org/10.1109/ichis.2005.23.
38. Bach M, Werner A, Żywiec J, Pluskiewicz W. The study of under- and over-sampling methods’ utility in analysis of highly imbalanced data on osteoporosis. Inform Sci. 2017;384:174–90.
39. Rivera W, Asparouhov O. Safe level OUPS for improving target concept learning in imbalanced data sets. In: Proceed-ing of the IEEE SoutheastCon. 2015. p. 1–8. https://doi.org/10.1109/secon.2015.7132940.
40. Yen S, Lee Y. Under-sampling approaches for improving prediction of the minority class in an imbalanced dataset. In: Huang DS, Li K, Irwin GW, editors. Intelligent control and automation. Lecture Notes in Control and Information Sciences, vol. 344. Berlin: Springer; 2006. p. 731–40. https://doi.org/10.1007/978-3-540-37256-1_89.
41. Bunkhumpornpat C, Sinapiromsaran K, Lursinsap C. DBSMOTE: density-based synthetic minority over-sampling technique. J Appl Intell. 2012;36:664–84. https://doi.org/10.1007/s10489-011-0287-y.
42. Machine Learning Repository, Center for Machine Learning and Intelligent Systems, US (NFS). https://archive.ics.uci.edu/ml/datasets.html. Accessed 28 Oct 2017.
43. SImple Drug Operation mechanisms. Cauality Workbench, US (NSF under Grant N0 ECCS-0725746). 2008. http://www.causality.inf.ethz.ch/data/SIDO.html. Accessed 28 Oct 2017.
44. Rong H, Wanchun D, Jianxun L. ClubCF: a clustering-based collaborative filtering approach for big data application. IEEE Trans Emerg Topics Comput. 2014;2:302–13.
45. Weiss M, Sari S, Noori N. Niche formation in the Mashup ecosystem. Tech Innov Manag Rev. 2013;3:1–6.