Embed Size (px)
Citation preview

This content has been downloaded from IOPscience. Please scroll down to see the full text.
Download details:
IP Address: 14.139.119.174
This content was downloaded on 09/04/2015 at 04:14
Please note that terms and conditions apply.
Electron beam induced and microemulsion templated synthesis of CdSe quantum dots:
tunable broadband emission and charge carrier recombination dynamics
View the table of contents for this issue, or go to the journal homepage for more
2015 Mater. Res. Express 2 045006
(http://iopscience.iop.org/2053-1591/2/4/045006)
Home Search Collections Journals About Contact us My IOPscience

Mater. Res. Express 2 (2015) 045006 doi:10.1088/2053-1591/2/4/045006
PAPER
Electron beam induced andmicroemulsion templated synthesis ofCdSe quantum dots: tunable broadband emission and chargecarrier recombination dynamics
ApuravGuleria, AjayK Singh,MadhabCRath and Soumyakanti AdhikariRadiation&PhotochemistryDivision, BhabhaAtomic ResearchCentre,Mumbai 400 085, India
E-mail: [email protected]
Keywords: ultrasmall quantumdots, electron beam irradiation,microemulsion
Supplementarymaterial for this article is available online
AbstractCdSe quantumdots (QDs)were synthesized by a rapid and one step templated approach inside thewater pool of AOT (sodiumbis(2-ethylhexyl) sulfosuccinate) basedwater-in-oilmicroemulsions(MEs) via electron beam (EB) irradiation techniquewith high dose rate, which favours highnucleation rate. The interplay of different experimental parameters such as precursor concentration,absorbed dose andW0 values (aqueous phase to surfactantmolar ratio) ofMEswere found to haveinteresting consequences on themorphology, photoluminescence (PL), surface composition andcarrier recombination dynamics of as-grownQDs. For instance, highly stable ultrasmall (∼1.7 nm)bluish-white light emittingQDswere obtainedwith quantum efficiency (η) of∼9%. Furthermore,QDswere found to exhibit tunable broadband light emission extending from450 to 750 nm(maximumFWHM∼180 nm). This could be realized from theCIE (Commission Internationaled’Eclairage) chromaticity co-ordinates, which varied across the blue region to the orange regionthereby, conferring their potential application inwhite light emitting diodes. Additionally, the averagePL lifetime τ( )values could be varied from18 ns to as high as 74 ns, which reflect the role of surfacestates in terms of their density and distribution. Another interesting revelationwas the self-assemblingof the initially formedQDs into nanorodswith high aspect ratios ranging from7 to 20, incorrespondence with theW0 values. Besides, the fundamental roles of the chemical nature of waterpool and the interfacial fluidity of AOTMEs in influencing the photophysical properties ofQDswereinvestigated by carrying out a similar study inCTAB (cetyltrimethylammoniumbromide; cationicsurfactant) basedMEs. Surprisingly, very profound and contrasting results were observedwherein τand η of theQDs in case of CTABMEswere found to be at least three times lower as compared to thatin AOTMEs.
1. Introduction
Colloidal semiconductor quantumdots (QDs) have invoked extensive research interest across the scientificcommunity in recent years, due to theirmorphology dependent optoelectronic properties [1, 2].While dealingwith these nanomaterials, two aspects draw attention, one being the facile and environment friendlymethod ofsynthesis, the other is the control over size, shape and surface composition.Most of the synthetic techniques ofthese nanomaterials involve stringent conditions such as high temperature, pressure, inert atmosphere and toxicreducing agents.
In this perspective, radiation induced synthesis of nanoparticles (NPs) is a very powerful technique havingadvantages such as fast, efficient, clean, use of ambient conditions and potential for industrial scale production[3]. It does not require any external reducing agents as the electron is itself a very strong reducing species(Ered =−2.9 V) and the electron beam (EB) can be used for tailoring the size ofNPs by controlling the dose as
RECEIVED
5 January 2015
REVISED
25 February 2015
ACCEPTED FOR PUBLICATION
9March 2015
PUBLISHED
8April 2015
© 2015 IOPPublishing Ltd

well as the dose rate. Basically, the synthesis of theNPs proceeds through the reaction of the solvated electron,esolv− with the precursor ions. This process differs from themechanism in routine chemicalmethods for thesynthesis of colloidal NPs. Besides, the yield of esolv
− depends on the nature of the hostmatrix and plays animportant role in the growth kinetics of NPs [3]. CdSe andmany other nanomaterials have recently beensynthesized using gamma and electron beam radiations in both aqueous and non-aqueousmedia [4]. Our grouphas earlier reported the synthesis of CdSeNPs in aqueousmediumby using various radiation assistedmethods(e-beam and γ-ray) and further investigated their dynamics of formation by employing the pulse radiolysistechnique [5].
Microemulsions (MEs) have been proven to be an excellent hostmatrix for the synthesis and simultaneouslyachieving a precise control over themorphology of various nanomaterials by employing differentmethods [6–20].MEs are generally characterized byW0 values, which is themolar ratio of water to surfactant.Water poolsinside theMEs can be considered as nanoreactors for the nucleation and controlled growth ofNPs [11]. Thus, bycontrolling not only thewater pool size, but also thefluidity of the interface of theMEs, onemay expect aneffective control over the nanomorphology of the particles.
Herein, we have combined the advantageous features of EB irradiation techniquewith the templatedmatrixofME (AOT-basedwater-in-oilMEs). Of course, reports regarding the synthesis of semiconductorNPs/nanorods (NRs) inAOTMEs by the application of conventional chemical routes are available in literature [12–15].However, the formationmechanism ofCdSeQDs involving nucleation and growth processes in the presentstudy are entirely different from the earlier reports.Moreover, currentmethodology rendered some unique andinteresting aspects regarding themorphology and the photophysical properties of theQDs by simply varying theexperimental parameters such as precursor concentration, absorbed dose andW0 values. For instance,ultrasmall CdSeQDs emitting bluish-white light were obtained in a one-step approachwithout employing anyexternal toxic reducing or stabilizing agents or other stringent conditions (e.g. high temperatures >300 °C) andthat toowithin a few seconds. Further, the photoluminescence (PL) of theQDs could be tuned across the visiblespectrum and it could be realized from the fact that themaximumFWHM(full width at halfmaximum) of theemission spectrawas∼180 nm in one of the set of experiments. Similarly, the carrier recombination dynamics oftheQDswas considerably varied by the controlled induction of the surface/trap states and the average PLlifetime values ranged from18 ns to as high as 74 ns.We have previously reported the synthesis of CdSeNPs byemploying the similarmethodology (as in the present work)where, cationic surfactant(cetyltrimethylammoniumbromide, CTAB) basedwater-in-oilMEwas used as a template [4]. It is to bementioned here that the CTABbasedMEs comprise co-surfactant and therefore, are quaternary in structuralcompositionwhile, AOT-basedMEs are ternary as they do not require any co-surfactant (shown in scheme 1). Itis therefore reasonable that the structural dynamics for the two systems is significantly different. In fact, theCTABbasedMEs possess flexible interfacial film and therefore, exhibit a greater amount of dynamism [11, 16]as compared toAOT-basedMEswhere, interfacial film is quite rigid [17–19]. Consequently, the fundamentaldifferences in the two systemswere reflected in the contrasting results displayed by theCdSeQDswith respect totheirmorphology, photoluminescent behaviour and the charge carrier recombination dynamics. These resultsare discussed and explained in the paper.
Scheme 1.Diagrammatic representation ofwater-in-oil AOT-based ternary (a) andCTABbased quaternary (b)MEs. Themolecularstructures of AOT andCTABhave been shown below their respectiveMEs.
2
Mater. Res. Express 2 (2015) 045006 AGuleria et al

2. Experimental
2.1. ChemicalsHigh purity chemicals, AOT (Aerosol OTor sodiumbis(2-ethylhexyl) sulfosuccinate), CTAB, cadmiumsulphate (CdSO4), selenium (Se) powder and sodium sulphite (Na2SO3) were obtained fromSigma-Aldrich.The organic solvents such as n-hexane, n-butanol, cyclohexane, acetone, ethanol and tert-butanol werepurchasedwith the highest purity available (99.5%) fromSDFine-ChemLtd,Mumbai andwere usedwithoutfurther purification.Nanopure water (conductivity, 0.06 μS cm−1) used for the preparation of precursorsolutionswas obtained from theMillipore water purifying system.
2.2. Synthesis of precursor solutions andMEsThe stock solution of the cadmiumprecursor, i.e., ammoniated cadmium sulphate ([Cd(NH3)4]SO4)with aconcentration of 20 mMwas prepared as follows. 0.0416 g of CdSO4was taken in a 10 ml flask and dissolved in3–4 ml of nanopurewater. Subsequently, 25% ammonia solutionwas added to it with the appearance ofmilkywhite colour till the solution turned colourless and transparent. Further, 1 ml of tert-butanol was added to thissolution and the total volumewasmade to 10 ml using nanopure water, which could be labelled as SolutionA.tert-butanol was added to the solution for scavenging theOH• radicals generated in thewater pool of theMEduring the irradiation of the sample solution. Likewise, stock precursor solution of cadmiumwith theconcentration of 10 mMand 30 mMcould be prepared. The stock precursor solution for Se, i.e., sodiumselenosulphate (Na2SeSO3) was prepared by refluxing the solution containing 1 g Se powder and 10 gNa2SO3 in50 ml nanopurewater at 70 °C for 7 h. Aliquots of as-prepared solutionwere taken and 1 ml of tert-butanol wasaddedwith the subsequent dilutionwith nanopurewater tomake the concentration equimolar to that ofcadmiumprecursor solution. This solution could be labelled as solution B.
For preparing theMEs, 0.1 MAOTwas added to hexane followed by the addition of aqueous solutionscontaining equimolar precursors of Cd and Se, i.e., solutions A andB, respectively. Different volumes ofrequired aqueous solutions were added to this system to obtainMEswith variousW0 values. The procedure forpreparingCTABbasedMEs have been reported in our earlier work [4, 20]. The concentration effect of theprecursors was investigatedmaintaining theW0 value of theME and the absorbed dose fixed at 10 and 25 kGy,respectively. The precursor concentrations were varied from10 to 30 mM.TheMEs containing the precursorswere freshly prepared and de-aerated by purgingwithN2 just before electron beam irradiation in each case.
2.3. Radiolytic synthesis of CdSeQDsTheMEs containing the equimolar precursors for Cd and Sewere continuously irradiatedwith 7 MeV electronbeam (FWHM=2 μs) obtained from a linear electron accelerator (LINAC). The absorbed dosewasmeasuredusing an air-saturated solution containing 0.05 MKSCNassumingGε for (SCN)2
−= 2.6 × 10⁻⁴ m2 J−1 at 475 nm[21].The absorbed dose per pulse was kept at 140 Gy and the samples were irradiatedwith repetitive electronpulses at 12 Hz. The colourlessME solutions immediately transformed into light green/or orange colour afterthe irradiation depending on the experimental parameters, which indicated the formation of CdSeQDs and thissol was used for carrying out the optical studies. It is to bementioned here that theQDswere extracted from theMEby breaking its structure on adding 5–10 drops of ethanol. Subsequently, the solution became turbid andwascentrifuged to 9000 rpm (rotations perminute). The precipitates were collected andwashed at least three timeswith nanopurewater and ethanol, whichwere then utilized for carrying out other characterization studiesmentioned below.
2.4. CharacterizationThe optical absorption spectra were recorded at room temperature using a JASCOV-650 absorptionspectrophotometer. PLmeasurements were carried out using aHitachi F-4500 spectrofluorimeter at roomtemperature. Camera ready photos of the vial containingCdSeQDs inMEswere taken in aUV chamber. Thehigh-resolution transmission electronmicroscopy (HRTEM)measurements were carried out onmodel numberFEI, TECNAI-F30. Samples for thesemeasurements were prepared by depositing a drop of the as-prepared solon thin carbon coated copper grid and allowed the solvent to evaporate. The scanning electronmicroscope(SEM) images were recorded in an SEMmodel number AIS2100, SERONTechnology, Korea. X-ray diffraction(XRD)measurements were recorded on a Phillips x-ray diffractometer,model PW1710 system, using amonochromatic CuKα source (λ= 0.154 nm). Emission lifetimemeasurements were conducted on a time-correlated single photon counting (TCSPC) instrument (model: IBH,UK). The instrument response function(IRF) of the setupwasmeasured by collecting the scattered light from aTiO2 suspension inwater. The sampleswere excited by diode lasers of output at 374 nmwith an IRF of less than 100 ps (FWHM). The optical pathlength of the cell in all the spectral studies was 10 mm. It is to be noted that theMEs are highly complex and
3
Mater. Res. Express 2 (2015) 045006 AGuleria et al

dynamic systems, so all the opticalmeasurements reported hereinwere carried out after 15 min andwithin1–2 h of the irradiation to facilitate better consistency and reliability in the results of various set of experiments.The PL quantum efficiency (QE) of theQDswas determined based on the comparativemethod by usingequation (1). The standard reference employedwas Rhodamine 6G (Φ= 0.95) dissolved in ethanol.
Φ Φ=A
A
OD
OD
n
n* * (1)S R
S
R
R
S
s
R
2⎛⎝⎜
⎞⎠⎟
Where,Φ is the quantumyield,A is the integrated PL intensity,OD is the optical density, and n is the refractiveindex. The subscripts S andR refer to the sample and reference, respectively. The excitationwavelengthwaschosen on the basis, where theOD values of both the sample and the referencematchedwith each other.
3. Results and discussion
3.1. Characterization and formationmechanismFigure 1(A) shows the typical XRDpatterns of as-synthesized CdSeQDs, immediately and at a time interval of24 h after EB irradiation. The spectrum recorded immediately after the irradiation shows a broad and noisyspectrum,whichmakes it difficult to identify the phase of theQDs.However, diffraction peaks consistent withthe hexagonal structure (JCPDS file no. 08-0459) of CdSe could be seen in theXRD spectrum recorded at timeduration of 24 h after the irradiation. The lattice planes corresponding to the respective peaks have beenmarkedin the spectrum.
HRTEM image showing the lattice fringes of as-grownQDs have been shown in figure1(B). The interplanardistancewas found to be 0.25 nm,whichmatches well with the standard value of the interplanar distance of0.255 nm for (102) plane of the hexagonal phase of CdSe. Furthermore, the appearance of rings in the SAED(selected area electron diffraction) pattern (inset of image B) clearly indicates the polycrystalline nature of as-grownQDs.
The probablemechanism for the formation of CdSeQDs in the hostmatrix of AOTMEs has been discussedas follows. Thewater pool of theME acts as a nanoreactor comprising Cd and Se precursors. It is to be noted thatthe formation of CdSeQDs took place only when theMEs containing the precursors were irradiatedwith theelectron beam. Essentially, radiation-induced synthesis of nanomaterials in the aqueous phase ismainlypreceded by the radiolysis of water [3–5]. It is well known that the radiolysis of water generates threemajorprimary radical species such as eaq
− (aquated electron), OH• andH•. Amongst these eaq− andH• are reducing,
whileOH• is oxidizing in nature. Since, theH• andOH• are scavenged by adding tert-butanol(CH3(CH3)2COH) to the aqueous phase, the eaq
− with a high redox potential (Ered =−2.9 V) reduces theprecursor ions, thereby resulting in the formation ofNPs. The radiolytic synthesis of CdSeNPs in pure aqueoussolutions has been previously reported by our group [5]. The probable radiolytic reactions taking place duringthe formation of CdSeNPs arementioned below.
Figure 1. (A) XRDpatterns of CdSeQDs immediately (a) and 24 h (b) after the irradiation; (B)HRTEM image of theQDs showingthe lattice fringe patternwith the interplanar distance of 0.25 nm. Inset of figure 1(B) depicts the SAEDpattern of the correspondingQDs.
4
Mater. Res. Express 2 (2015) 045006 AGuleria et al

The radiolysis of oil phase (hexane in the present case) also generates electrons, which are scavenged by thewater pool to form eaq
− [22–24].
+ → +( ) ( ) ( ) ( )OH H CH CH COH CH CH COH H O H• •3 3
2
•2 3
22 2
+ →−+
+( )e Cd NH Cdaq 34
2•⎡
⎣⎢⎤⎦⎥
+ → +− − − −e SeSO SO Seaq 32
32 •⎡⎣ ⎤⎦ ⎡⎣ ⎤⎦
+ → →+Cd Se CdSe (CdSe)•NPs
Such reactions taking place in thewater pool of theMEs eventually lead to the formation of CdSeNPs.Subsequently, theME itself acts as a shell for stabilizing theNPs, which are formed inside its core.
3.2.Optical studiesParametric investigations were carried tofix the optimumdose of irradiation for the synthesis and it wasobserved that an absorbed dose of∼25 kGy is sufficient for a complete transformation of precursor reactantsintoCdSeQDs (see figure S1 in the supplementary data, available at stacks.iop.org/MRX/2/045006/mmedia).However, samples were irradiatedwith different absorbed doses to investigate its effect on themorphology andoptical properties of as-grownCdSeQDs.
3.2.1. Dose effectWhile investigating the dose effect, theW0 value of theMEs and the precursor concentrationwere kept constantat 10 and 20 mM, respectively, and the imparted dosewas varied from10 to 50 kGy. Figure 2(a) shows theabsorption spectra of the sols irradiated at different absorbed doses. No absorptionwas observed in the case ofunirradiated sols in the region 400–700 nm,which rules out the formation of CdSeQDs, whereas appearance ofexcitonic peaks can be clearly seen in the absorption spectra of irradiated sols.
The blue-shift in the excitonic peakwith the increase in the absorbed dose indicates the decrease in the size ofQDs. The band gap (Eg) values (listed in table 1)were determined from the Tauc plot of (α′hν)2 versus hν (insetoffigure 2(a)), as CdSe is a direct band gap semiconductor. The symbol ‘α′’ represents the termαcwhere α is theabsorption coefficient and c is the concentration of theCdSeQDs. The values ofα′were determined from theabsorbance values, by using the relation,αc= (2.303A)/ℓ , whereA is the absorbance value and ‘ℓ’ is the opticalpath length (10 mm). The term hν represents the photon energy. The average size of theQDswas determinedfrom these Eg values using equation (2), which is the representation of themodified effectivemassapproximationmodel, as proposed by Brus [25]. Since, the excitonic peak is widely blue-shifted from the bulkband gap value of CdSe (1.74 eV implies λ= 714 nm), which is an indication of strong confinement and hencethe coulomb interaction between the electron and hole is neglected [26–28].
Figure 2.Absorption spectra (a) and normalized room temperature PL spectra (b) of CdSeQDs synthesized inwater-in-oil AOTMEsvia EB irradiationwith variable absorbed doses atfixed precursor concentration (20 mM) andW0 value (10). Inset offigure 2(a): Taucplot of (α′hν)2 versus hν for the determination of band gap values (Eg). Inset of figure 2(b): plot showing the excitationwavelengthindependent PL spectra of CdSeQDs synthesized at an absorbed dose of 25 kGy.
5
Mater. Res. Express 2 (2015) 045006 AGuleria et al

Table 1.Variousmeasurements i.e. band gap values (Eg, eV), size (d, nm), FWHM(nm), emissionmaxima (λmax, nm),QE (η,%) and average lifetime ( τ , ns) values of CdSeQDs synthesized via EB irradiationwith different combinationofW0 values, precursor concentrations and absorbed radiation dose.
S. No Sample Absorbed dose, kGy Precursor conc.,mM Band gap value, Eg (eV) Estimated size, nm Emissionmax., λmax (nm) FWHM, nm Quantum efficiency, η Average lifetime, τ ns
1 W = 5,0 AOTME 25 20 2.96 1.74 501 145 ∼9% 44.1 (χ2 = 1.1)
2 W = 10,0 AOTME 10 20 2.32 2.52 548 122 ∼6% 18.5 (χ2 = 1.2)
25 10 2.48 2.23 535 126 — —
25 20 2.36 2.44 542 147 ∼8% 37.7 (χ2 = 1.1)
25 30 2.18 2.89 580 179 - -
50 20 2.54 2.15 569 169 ∼2% 73.7 (χ2 = 1.2)
3 W = 15,0 AOTME 25 20 2.15 3.00 583 155 ∼4% 25.6 (χ2 = 1.1)
4 W = 5,0 CTABME 25 20 2.75 1.91 522 154 ∼0.2% 2.7 (χ2 = 1.3)
5 W = 10,0 CTABME 25 20 2.62 2.05 584 192 ∼0.8% 6.8 (χ2 = 1.2)
6 W = 15,0 CTABME 25 20 2.58 2.09 573 190 ∼1.1% 8.2 (χ2 = 1.1)
6
Mater.R
es.Express2
(2015)045006
AGuleria
etal
= + +E Eh
d m m8
1 1(2)g b 2
e h
⎛⎝⎜
⎞⎠⎟
Where, Eb = 1.74 eV is the band gap of bulkCdSe, h= 6.626 × 10⁻³⁴ Js is the Planck’s constant, d is the particlesize (nm),me = 0.13 m0 is the effectivemass of electron andmh = 0.40 m0 is the effectivemass of hole [29],m0 isthe free electronmass (9.1 × 10⁻³¹ kg). Equation (2) has been simplified and represented as equation (3). The as-determined average sizes of theQDs synthesized at different absorbed doses are listed in table 1.
= +E Ed
3.7(3)g b 2
It is to be noted that theseQD size values are only the estimated ones considering the dynamic nature of theMEs (discussed already in the introduction part). Essentially, the droplets ofMEs are kinetically unstable andinvolve continuous inter-droplet collisions followed by themass transfer/or exchange in between them [16, 30].This dynamic exchange ofmaterial on one hand facilitates the growth process to take place after the nucleationstage induced by the EB irradiation; while on the other hand, itmay lead to the changes in the particle size atdifferent intervals of time.Nevertheless, the estimated sizes (listed in table 1) unambiguously illustrate the trendin their sizes and band gap energy values, as all themeasurements were carried out within the particular timeframe (mentioned in the experimental section) to ensure the reproducibility and the reliability of the results. Itcan be clearly seen from table 1 that the size of theQDs decreases with the increase in the absorbed dose. Theobserved trend can be explained on the basis that at higher absorbed doses, a greater number of nucleationcentres are formed, which leads to the retardation of growth process. Similar results regarding the effect of doseon the size of theNPs have been observed by various researchers [31, 32].
The corresponding PL spectra of theCdSeQDs reflecting the effect of absorbed dose have been shown infigure 2(b). Interestingly, contrary to the absorption spectra, the usual blue shift in the peak (with the decrease inthe size of theQDs) is not emulated in the PL spectra. Although, there is a slight blue shift in the peak (seeemissionmaxima values provided in table 1) on increasing the dose from10 to 25 kGy. But, there is a significantred shift in the peak position of the PL spectra on further increasing the dose to 50 kGy. This clearly indicates thatthe emission is predominantly originated from the defects/trap states as the surface states-assisted emission isindependent (or has poor correlation) of the size ofQDs [33, 34]. Furthermore, it is to be noted here that the PLspectra are quite broad and extend from450–800 nm region. The FWHMvalues were determined and have beenlisted in table 1.
Such broadening in the PL spectra ofQDs in general can be rationalized by: (i) polydispersity in the sizedistribution [35] or (ii) polydispersity in the density and the nature of distribution of trap/defect states leading tovarious recombination paths for the photogenerated carriers in theQDs [34, 36]. Even though the contributionof the first factor cannot be completely ruled out, the as-grownCdSeQDs exhibits emission spectrawith peakshifts independent of the excitationwavelength (shown in the inset offigure 2(b)). Also, the polydispersity in theparticular case was found to be only∼15% (fromTEMmeasurements, discussed later), which further suggeststhemajor role of trap/defect states in the broadening of the PL spectra.
The quantum efficiencies of theQDs synthesizedwith different absorbed doses were calculated and are listedin table 1. As can be observed, theQDs synthesizedwith the optimumdose of 25 kGy exhibited highest QE of∼8% followed by those synthesizedwith an absorbed dose of 10 kGy (∼6%). This decline in theQE could be dueto the insufficient amount of absorbed dose employed for the synthesis ofQDs, which can be realized fromfigure S1. Further, the least QE (∼2%)was obtained in the case ofQDs synthesizedwith the highest absorbeddose of 50 kGy. This could be due to the enhancement in the participation of non-radiative relaxation processesowing to the rise in density of the trap/defects of theQDs synthesized at higher absorbed doses. Therefore, it isimperative to optimize the absorbed dose for the synthesis of good quality nanomaterials.
The charge carrier dynamics of the CdSeQDs synthesizedwith different absorbed doses was investigated bymeasuring the time resolved PL decay using TCSPC at room temperature. The excitation and emissionwavelengths werefixed at 374 and 550 nm, respectively. The PL decay curves of as-synthesized CdSeQDsexhibitedmulti-exponential (tri-exponential) behaviour (shown infigure 3), whichwere analyzed and fittedusing equation (4):
= + + τ τ τ− − −I t a e a e a e( ) (4)t t t1 2 3
1 2 3
Where, I (t) is the time-dependent emission intensity, a is the amplitude, and τ is the lifetime. The average PLlifetime τ( ) values were deduced using equation (5) and have been listed in table 1. The corresponding χ
2
(represents the goodness offit) values have been providedwithin the parentheses.
7
Mater. Res. Express 2 (2015) 045006 AGuleria et al

ττ τ τ
=+ ++ +
a a a
a a a(5)1 1 2 2 3 3
1 2 3
Suchmulti-exponential behaviour of theCdSeQDs is widely known and has been reported by variousresearchers earlier [37–39]. Butmost of these reports generally attribute such behaviour to the diverserecombination paths owing to the varying degree of size, shape, surface defects/energy traps between theindividual nanocrystals. However, the origin and the explanation for thismulti-exponential behaviour stillremain unclear and is currently a subject of debate.
Nevertheless, the average lifetime values τ( ) listed in table 1 does provide an assessment about theexcitonic dynamics and the nature of distribution of surface/trap states of as-grownCdSeQDs at variousabsorbed doses. The average lifetime representing the excitonic recombination increases with the enhancementin the absorbed dose, which further substantiates the predominant contribution of trap/defect states in thephotoluminescent behaviour of theQDs (broadening of the PL spectra aswell as the decline in the quantumefficiency) at higher absorbed doses. Indeed, this can be realized on deconvoluting the PL spectra of theQDssynthesized at different doses. Figure S2 shows the deconvoluted emission spectra at various doses. It can benoticed that at higher absorbed dose (25 kGy), the emission spectra in addition to the band gap emission (peak at513 nm) comprises contributions fromdefect/trap states. The nature of these trap states can be appraised fromthe appearance of peaks at 569 and 638 nm,which are widely shifted from the excitonic peak position and havebeen assigned to be originated from the shallow and deep trap states, respectively. Similarly, the broadening inthe PL spectra obtained at dose of 50 kGy can be attributed to the principal contribution from the trap states.These observations support themulti-exponential behaviour of theCdSeQDs as well as the slower chargecarrier recombination dynamics accompanied by low quantumyields at higher absorbed doses. Nevertheless, itis being emphasized here that this aspect of the controlled induction of the surface/trap can contribute to thebetter understanding of the role of trapping sites on the dynamics of charge recombination processes, whicheventually governs the efficiency of solar cell devices [39].
3.2.2. Concentration effectFigure 4(a) shows the absorption spectra of irradiated sols with different precursor concentrations. Theexcitonic peak position red shiftedwith the increase in precursor concentration, which indicates an increase inthe size ofQDs. The band gap (Eg) values were determined from the Tauc plot (inset offigure 4(a)) and theaverage sizes (listed in table 1) of theQDswere estimated by using equation (3).However, it is to be noted that asimilar type of experiment (precursor concentrationwas varied keeping other parameters constant) wasperformed in our earlier work [4], wherein theCdSeQDswere synthesized inCTABbasedwater-in-oilMEs. Itwas found that the excitonic peak shift was nominal with an increase in the precursor concentration and thesamewas correspondingly reflected in the size values ofQDs. Such contrasting observations in the two casescould be explained on the basis of the interfacial rigidity/orfluidity. It has beenmentioned earlier (in theintroduction section) that contrary to the AOTMEs, the CTABMEs aremore dynamic and flexible in nature,which leads to the distribution of the primaryNPs, therebyminimizing the effect of precursor concentration inthe latter case. This can be realized from the fact that only∼1 in 1000 inter-droplet collisions result in an
Figure 3.Emission decay curve (λex = 374 nm) alongwith the IRF and the bestfitted curve forCdSeQDs synthesized via EB irradiationwith variable absorbed doses atfixed precursor concentration (20 mM), andW0 value (10).
8
Mater. Res. Express 2 (2015) 045006 AGuleria et al

exchange of reactants in the case of AOTMEs, whereas∼1 in 10 collisions can give rise tomicellar contentexchange in the case of CTABMEs [18, 40].
The PL spectra of theQDs demonstrating the effect of precursor concentration have been shown infigure 4(b). It could be seen that the PL peak position shifts to the red sidewith an increase in the precursorconcentration, which is in agreementwith theQDs size variation, as was indicated by the absorption spectralstudies.However, this increase in the average size of theQDswas also accompaniedwith higher FWHMvalues(listed in table 1). The peak positionwas found to be independent of the excitationwavelength. Unlike othersyntheticmethodologies, a large amount of energy is dumpedwithin a small fraction of time in the EBirradiation technique (e.g. only a time duration of 15 s is required for imparting a dose of 25 kGy).Consequently, it could lead to the formation of a large amount of nuclei instantaneously. The small nuclei at thisjuncture possess high surface energy (involving unsatisfied valencies/or dangling bonds and surface defects) andsubsequently leading to aggregation followed by the growth process.Moreover, higher precursor concentrationswould be accompanied by a correspondingly higher amount of nucleation in the present scenario. Apparently,the growth process would lead to various amounts and types of defects including surface aswell as deep trapstates. This is indicated by deconvoluting the PL spectrumofQDs (synthesized by employing precursorconcentration of 30 mM) shown in the inset offigure 4(b). Peak 1 (535 nm) represents band gap emission, whilepeaks 2 (590 nm) and 3 (667 nm) could be attributed due to the defects involving surface aswell as deep trapstates. Therefore, the broadening in the PL spectra (with increase in the precursor concentration) could beattributed to the differences in the density and distribution of trap states accompanied by a possible contributionfrom the polydispersity in the particle size.
3.2.3.W0 effectIt is one of themost important parameters to characterize andmanipulate thewater pool size as well as thefluidity of the interface ofMEs, as has been already described in the introduction section. Considering this, theW0 values of theMEwere varied from5 to 15while keeping the precursor concentration and the absorbed doseconstant at 20 mMand 25 kGy, respectively. Figure 5(a) shows the absorption spectra of the irradiated solsrepresenting the significant red shift in the excitonic peak position (of CdSeQDs)with the subsequent increasein theW0 values of theMEs.
This categorically indicates an increase in the average size ofQDswhichwas determined by using the Brusequation (3). The band gap (Eg) values were determined from the Tauc plot (inset offigure 5(a)) and the averagesize values of theQDs are listed in table 1. It is to bementioned here that theQDs synthesized inMEwithW = 50 were found to be ultrasmall (i.e., d∼ 1.7 nm).Moreover, the excitonic peak in this particular caseappeared at∼400 nm,which is very close to the band-edge absorption peak (408 nm) of ultrasmall CdSenanocrystals reported byDukes et al [33]. Generally, ultrasmall nanocrystals are defined as thosewhich have adiameter of less than 2 nm [33, 34, 41]. Such nanomaterials have recently become an active area of research asthey possess very interesting properties (that differ considerably from those of larger nanocrystals) such asquantized (sequential) growth [42], size-independent emission spectrum [33, 34, 41] andwhite light emission[43]. In analogywith the absorption spectralmeasurements, the PL peak positions also red shiftedwith the
Figure 4.Absorption spectra (a) and normalized room temperature PL spectra (b) of CdSeQDs synthesized inwater-in-oil AOTMEsvia EB irradiationwith variable precursor concentrations atfixed absorbed dose (25 kGy) andW0 value (10). Inset of figure 4(a): Taucplot of (α′hν)2 versus hν for the determination of band gap values (Eg). Inset offigure 4(b): a representative deconvoluted PL spectrumof CdSeQDs synthesized inMEofW = 100 @25 kGy and precursor concentration = 30 mM.
9
Mater. Res. Express 2 (2015) 045006 AGuleria et al

subsequent variation in theW0 values of theMEs (see figure 5(b)). In fact, the observed tunability in the PLspectra can be realized from the periodic variation of∼40 nm in themaximumpeak positions (listed in table 1)with the step-wise increase in theW0 values from5 to 15. This can be clearly visualized from the photos of theCdSeQDs snapped in aUV chamber, as shown infigure 6.
Indeed, the as displayed tunability in the photoluminescent behaviour (accompanied by the broad andpredominantly trap state emission) of theseQDs clearly signifies their potential applications in light emittingdevices (especially, white light emitting diodes i.e.WLEDs). The nature of the light emitted by as-grownCdSeQDs under various conditions has been listed in table 2 alongwith their respective CIE (CommissionInternationale d’Eclairage) x, y co-ordinates.
The EBmediated synthesis of CdSeQDs has been represented in scheme 2 alongwith the chromaticitydiagram illustrating the optical tunability achieved by varying the different experimental parameters.
However, theQEof CdSeQDswas found to decreasewith the increase in theW0 values, (see table 1) and thehighest QE of∼9%was obtained forQDs synthesized inMEwithW = 5,0 while it decreases to∼4% in case ofMEwithW = 15.0 The polydispersity in size distributionwas found to be∼12% forW = 5,0 which slightlyincreased to ~15%and∼16% for higherW0 values of 10 and 15, respectively (size distribution plots shown inthe inset offigure S3). Thus, themain reason for the above decline inQE (with increase in theW0 values) hasbeen attributed to the increase in the number of trap/defects states. In fact, the rise in the amount of defects (athigherW0 values) comprising energetically distributed trap states (i.e. shallow and deep) could be substantiatedfrom the appearance of several peaks in the deconvoluted PL spectra (shown in figure S4) at higher wavelengthregions. Basically, at higherW0 values, the rigidity of the interface decreases, thereby resulting in the increasedinter-droplet exchange ofmaterial [16, 30]. Under such conditions, the augmented amount of trap/defects and
Figure 5.Absorption spectra (a) and normalized PL spectra (b) of CdSeQDs synthesized inwater-in-oil AOTMEs via EB irradiationwith variableW0 values atfixed absorbed dose (25 kGy) and precursor concentration (20 mM). Inset offigure 5(a): Tauc plot of (α′hν)2 versus hν for the determination of band gap values (Eg).
Figure 6.Camera ready picture of vials containingCdSeQDs synthesized inAOTMEswith variableW0 values (W = 5,0 Bluish-white colour (a);W = 10,0 greenish-yellow colour (b);W = 15,0 reddish-orange colour (c)) via EB irradiation atfixed absorbed dose(25 kGy) and precursor concentration (20 mM).
10
Mater. Res. Express 2 (2015) 045006 AGuleria et al

the polydispersity in the size distribution of theQDs could be anticipated. This is further evidenced from theincreasing trend of the FWHMvalues (obtained from the PL spectra and have been listed in table 1) for theQDssynthesized inMEswith higherW0 values. However, contrary to the AOTMEs, theQDs size (aswell as thephotoluminescent properties) and theW0 valuewas poorly correlated in the case of CTABbased quaternarywater-in-oilMEs, as reported earlier [4, 20]. Similar results were observed byCurri et al [6] and others [10] inwhich the size of semiconductor could not be correlatedwith the aqueous droplet dimension (represented bytheW0 value) in the case of quaternaryMEs. Figure S5(a) clearly shows themarginal changes in the excitonicpeak positionswith the subsequent increase in theW0 values (of CTABMEs), especially aboveW = 5.0 This canbe further realized from the band gap energy values (determined from the Tauc plot, shown in the inset offigureS5(a)) and the estimated average size (using equation (3)) of theQDs listed in table 1. Analogous to theabsorption behaviour, aminor shift was observed in the peak positions of the PL spectra (shown infigure S5(b))with variation in theW0 values of CTABMEs. These observations clearly reflect the difference in the interfacialrigidities of the twoME systems.
On comparing the sameW0 values, the FWHMvalues (see table 1) determined from the PL spectra of theQDs synthesized inCTABMEs are higher than that in case of AOTMEs. Considering the negligible excitonicpeak shifts with the increase in theW0 values, the polydispersity in the size distribution cannot be thepredominant factor behind the higher FWHMvalues (obtained in case of CTABMEs) as has also been explainedearlier [4]. However, polydispersity in the density and distribution of the trap/defect states inCdSeQDssynthesized inCTABMEsmight be assigned as themain rationale behind the broadening of the PL spectra.Keeping aside the case ofW = 5,0 the estimated average size of theQDs grown inCTABMEswas found to beless than the average size ofQDs synthesized inAOTMEs. Therefore, the amount of surface states would bemore in the former case. Further, it was observed that after 24 h, agglomeration of theQDs (synthesized via EBirradiation) takes place inCTABMEs rendering them less stable. On the other hand, no such phenomenonwasnoticed in the case of CdSeQDs grown inAOTMEs.One of themost striking differences between theCdSeQDssynthesized inCTAB andAOTMEs is their quantum efficiencies. TheQDs synthesized in the former case showpoor quantum efficiency, as can be seen from table 1. At this stage, it is important to point out the twomajordifferences between theCTAB andAOT surfactants, i.e., head group charges and themolecular structures(shown in scheme 1). CTAB (cationic surfactant) has a positively charged head group, while AOTpossess anegatively charged head group. Apparently, in thewater pool, the interaction of themetal ionswith theCTAB
Table 2.CIE chromaticity co-ordinates alongwith the nature of the light emitted byCdSeQDs synthesized inAOTMEs via EB irradiationunder various experimental conditions.
S. No Sample Absorbed dose, kGy Precursor conc.,mM CIE x, y co-ordinates Remarks
1 W = 5,0 AOTME 25 20 0.20, 0.27 Blue-white light
25 10 0.25, 0.38 Cyan light
25 20 0.34, 0.44 Green-yellow light
25 30 0.37, 0.46 Yellow-green light
2 W = 10,0 AOTME 10 20 0.44, 0.49 Yellow-orange light
50 20 0.43, 0.45 Orange-yellow light
3 W = 15,0 AOTME 25 20 0.42, 0.46 Yellow light
Scheme 2.Diagrammatic representation of the EB assisted synthesis of CdSeQDs in the hostmatrix of AOTMEs and the PL tunabilitydisplayed by theQDs as shown in the chromaticity diagram at various experimental conditions.
11
Mater. Res. Express 2 (2015) 045006 AGuleria et al
andAOThead groupswould be different. Considering this, the surface composition of the as-grownQDs in therespectiveMEs can be anticipated to be different. However, due to the broad PL spectra (predominantlyoriginated from trap/defect states) displayed by theQDs (synthesized in either of theMEs), it is difficult tointerpret the effect of the head group charge differences (on the surfactants) on the photophysical properties oftheQDs.Nevertheless, the difference in themolecular structures of AOT and theCTAB leading to thecontrasting effects on the dynamics and the interfacial properties of their respectiveMEs have been noticed tostrongly affect the photophysical properties of theQDs. CTABhas linear chain structure and requires a co-surfactant to formMEs, while AOThas a branched double-chained structure which facilitatesmolecules to packtogether to formMEswithout involvement of any co-surfactant. Taking into account the obtained quantumefficiencies, it can be anticipated that the nanosized templating cages present in AOTMEs provide betterencapsulation for theQDs as compared to those of CTABbasedMEs. Furthermore, it is to bementioned thatunlike the case of AOTMEs, theQEof theQDs grown inCTABMEs increases with increase in theW0 values.This indicates towards the difference in compositions (or the chemical nature) of thewater pool environmentsprevailing in theCTAB and the AOTMEs. InCTABMEs, the bromide ion (Br–) being the counter ion residesinside thewater pool with highmolar concentrations [23] thereby, acting as a quencher. This is also regarded asheavy ion effect and usually results in lower quantum yields [44, 45]. Therefore, the observed increase in thequantum efficiencies of theQDs (synthesized inCTABMEs)with theW0 values could be explained by the factthat the concentration of bromide ions and their proximity from theQDswould be relatively lower at largerwater pool sizes.
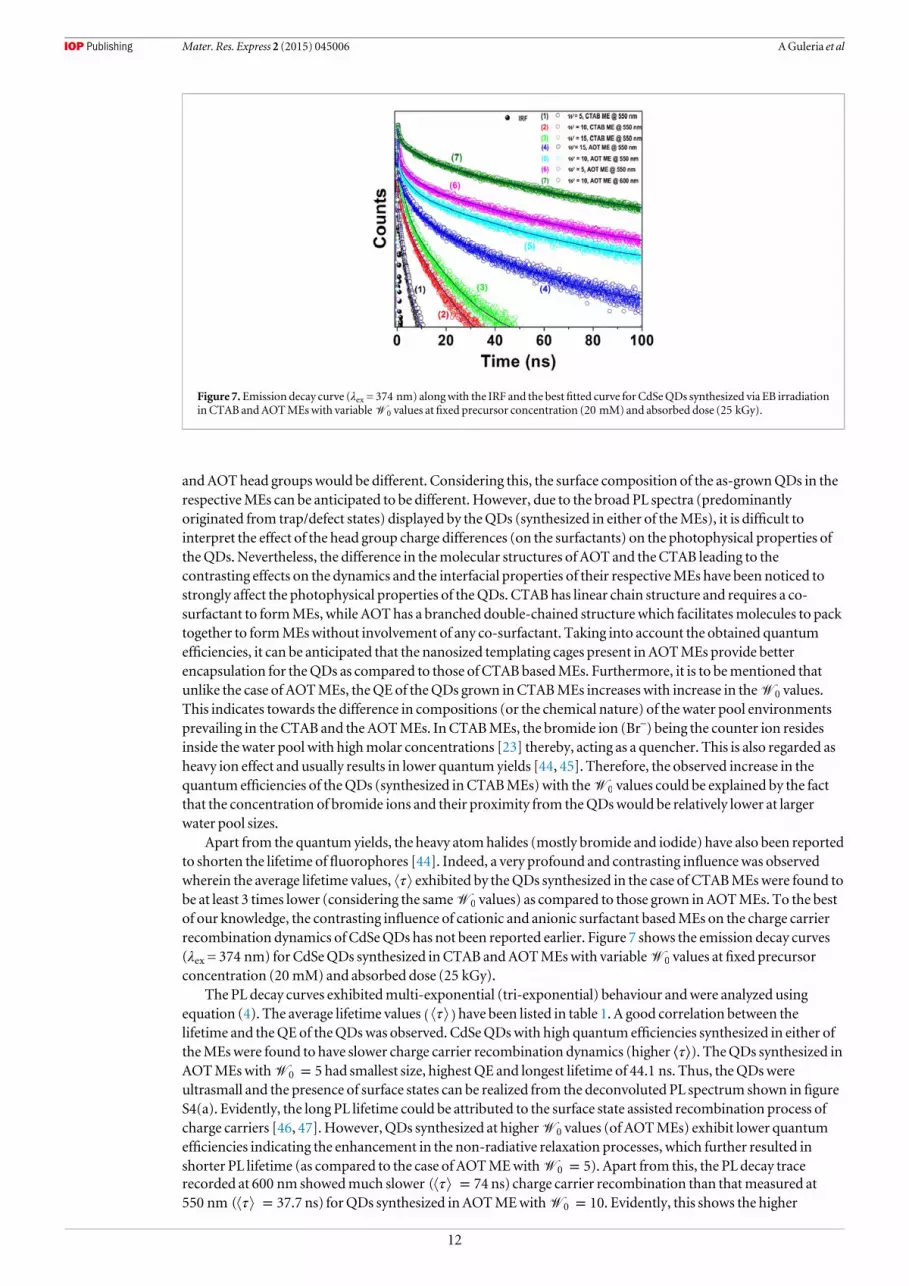
Apart from the quantum yields, the heavy atomhalides (mostly bromide and iodide) have also been reportedto shorten the lifetime offluorophores [44]. Indeed, a very profound and contrasting influencewas observedwherein the average lifetime values, τ exhibited by theQDs synthesized in the case of CTABMEswere found tobe at least 3 times lower (considering the sameW0 values) as compared to those grown in AOTMEs. To the bestof our knowledge, the contrasting influence of cationic and anionic surfactant basedMEs on the charge carrierrecombination dynamics of CdSeQDs has not been reported earlier. Figure 7 shows the emission decay curves(λex = 374 nm) for CdSeQDs synthesized inCTAB andAOTMEswith variableW0 values at fixed precursorconcentration (20 mM) and absorbed dose (25 kGy).
The PL decay curves exhibitedmulti-exponential (tri-exponential) behaviour andwere analyzed usingequation (4). The average lifetime values τ( )have been listed in table 1. A good correlation between thelifetime and theQEof theQDswas observed. CdSeQDswith high quantum efficiencies synthesized in either oftheMEswere found to have slower charge carrier recombination dynamics (higher ⟨τ⟩). TheQDs synthesized inAOTMEswithW = 50 had smallest size, highest QE and longest lifetime of 44.1 ns. Thus, theQDswereultrasmall and the presence of surface states can be realized from the deconvoluted PL spectrum shown infigureS4(a). Evidently, the long PL lifetime could be attributed to the surface state assisted recombination process ofcharge carriers [46, 47]. However, QDs synthesized at higherW0 values (of AOTMEs) exhibit lower quantumefficiencies indicating the enhancement in the non-radiative relaxation processes, which further resulted inshorter PL lifetime (as compared to the case of AOTMEwithW = 5).0 Apart from this, the PL decay tracerecorded at 600 nm showedmuch slower ( τ = 74 ns) charge carrier recombination than thatmeasured at550 nm ( τ = 37.7 ns) forQDs synthesized inAOTMEwithW = 10.0 Evidently, this shows the higher
Figure 7.Emission decay curve (λex = 374 nm) alongwith the IRF and the bestfitted curve forCdSeQDs synthesized via EB irradiationinCTAB andAOTMEswith variableW0 values atfixed precursor concentration (20 mM) and absorbed dose (25 kGy).
12
Mater. Res. Express 2 (2015) 045006 AGuleria et al

contribution of surface states in the relaxation dynamics, since the band edge charge carrier recombination rateis faster than that taking place at surface states [46, 48]. Nevertheless, the fastest radiative carrier relaxation(shortest PL lifetime, τ = 2.7 ns)was observed in the case ofQDs grown inCTABMEswithW = 5.0 Onincreasing theW0 values, the exciton lifetimewas found to increase (figure 7) and the values are listed in table 1.Similar to the trends of quantum efficiencies (for theQDs grown inCTABMEs), the charge carrierrecombination dynamics can be explained primarily on the basis of the halide ion effect which has beendiscussed earlier.
Furthermore, as indicated from the absorption spectra, the influence of variation in theW0 values of AOTMEswas found to have substantial influence on themorphology of theCdSeQDs. TEM images recorded at laterstages of the growth process revealed the formation ofNRs, as shown infigure 8.
The aspect ratio of the rodswas determined and has been listed in table 3. It is to bementioned here that thevalues presented represents the average aspect ratio ofmany such rods examined during the TEMmeasurements. So, theNRs shown infigure 8may appear to have different aspect ratios. Nonetheless, the aspectratio of theNRs decreases with increase in theW0 values of AOTMEs. The reason for this observation isprobably the following.MEs formed of ionic surfactants undergo structural transitions from rod-to-sphere as afunction of water content and thus, thewater pool size [19, 40, 49–52]. At lowerW0 values (generally forW0
values⩽10), the amount of free water is negligible ormuch less, which enables the ionic surfactants to re-orientthemselves into cylindrical or rod shapes in order to acquiremaximum contact with the aqueous polar phase.Thus, cylindrical (or rod) to spherical shape transition takes place for higherW0 values (generally forW0 values⩾10) as the amount of free water in thewater pool increases, which is further accompanied by the subsequentrise in the bulkwater characteristics. A similar type of shape tuning from rods-to-cubes-to-spheres has beenreported [20] by our group during the synthesis of CdSeQDs inCTABbasedMEs on increasing theW0 values(from10 to 40).
Another interesting aspect to bementioned here is the initial formation of quasi-spherical QDswhich self-assemble under the templating influence of the employedMEs intoNRs. This was evidenced from the TEMandSEM images of theQDs recorded at different time intervals. The TEM image shown infigure S3(a) illustrates theformation of quasi-spherical shapedCdSeQDs (synthesized in AOTMEswithW = ) 5;0
(precursor)) = 20 mM@25 kGy) andwas recorded immediately after EB irradiation.While the image shown infigure S3(b) was recorded after∼12 h of irradiation and represents the self-assembling of primaryQDs into rodlike anisotropic structures. A similar growthmechanismwas observed in the case of otherW0 values. Figure 9shows the TEM images at differentmagnifications and regions of the grid demonstrating the self-assembling ofCdSeQDs (synthesized inAOTMEswithW = ) 10,0 (precursor)) = 20 mM@25 kGy) into rod-shapedstructures. These particular images were recorded at time intervals of∼6 h after EB irradiation.
Figure 8.TEM images showingCdSeNRs synthesized inAOTMEswith variableW0 values of 5 (a); 10 (b); 15(c) via EB irradiation atfixed absorbed dose (25 kGy) and precursor concentration of 20 mM. The images were taken at time duration of∼12 h afterirradiation of the sols.
Table 3.Aspect ratio of CdSeNRs grown inAOTMEswith variableW0 values via EB irradiation atfixed absorbed dose (25 kGy) and stock precursorconcentration of 20 mM.
S.No Sample Aspect ratio
1 W = 5,0 AOTME 20± 2
2 W = 10,0 AOTME 13± 1
3 W = 15,0 AOTME 7± 1
13
Mater. Res. Express 2 (2015) 045006 AGuleria et al
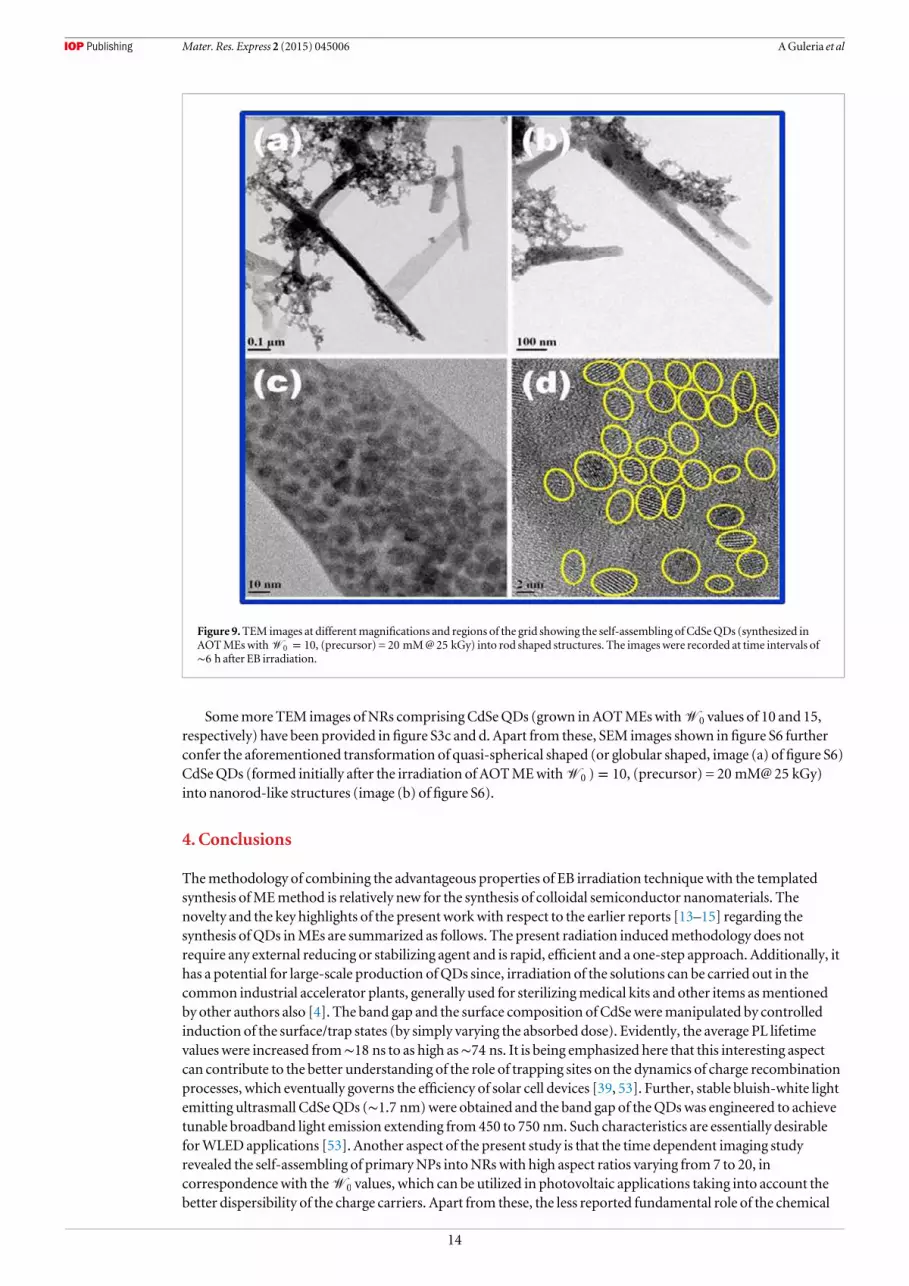
Somemore TEM images ofNRs comprising CdSeQDs (grown inAOTMEswithW0 values of 10 and 15,respectively) have been provided infigure S3c and d. Apart from these, SEM images shown infigure S6 furtherconfer the aforementioned transformation of quasi-spherical shaped (or globular shaped, image (a) of figure S6)CdSeQDs (formed initially after the irradiation of AOTMEwithW = ) 10,0 (precursor) = 20 mM@25 kGy)into nanorod-like structures (image (b) offigure S6).
4. Conclusions
Themethodology of combining the advantageous properties of EB irradiation techniquewith the templatedsynthesis ofMEmethod is relatively new for the synthesis of colloidal semiconductor nanomaterials. Thenovelty and the key highlights of the present workwith respect to the earlier reports [13–15] regarding thesynthesis ofQDs inMEs are summarized as follows. The present radiation inducedmethodology does notrequire any external reducing or stabilizing agent and is rapid, efficient and a one-step approach. Additionally, ithas a potential for large-scale production ofQDs since, irradiation of the solutions can be carried out in thecommon industrial accelerator plants, generally used for sterilizingmedical kits and other items asmentionedby other authors also [4]. The band gap and the surface composition of CdSeweremanipulated by controlledinduction of the surface/trap states (by simply varying the absorbed dose). Evidently, the average PL lifetimevalueswere increased from∼18 ns to as high as∼74 ns. It is being emphasized here that this interesting aspectcan contribute to the better understanding of the role of trapping sites on the dynamics of charge recombinationprocesses, which eventually governs the efficiency of solar cell devices [39, 53]. Further, stable bluish-white lightemitting ultrasmall CdSeQDs (∼1.7 nm)were obtained and the band gap of theQDswas engineered to achievetunable broadband light emission extending from450 to 750 nm. Such characteristics are essentially desirableforWLED applications [53]. Another aspect of the present study is that the time dependent imaging studyrevealed the self-assembling of primaryNPs intoNRswith high aspect ratios varying from7 to 20, incorrespondencewith theW0 values, which can be utilized in photovoltaic applications taking into account thebetter dispersibility of the charge carriers. Apart from these, the less reported fundamental role of the chemical
Figure 9.TEM images at differentmagnifications and regions of the grid showing the self-assembling of CdSeQDs (synthesized inAOTMEswithW = 10,0 (precursor) = 20 mM@25 kGy) into rod shaped structures. The images were recorded at time intervals of∼6 h after EB irradiation.
14
Mater. Res. Express 2 (2015) 045006 AGuleria et al

nature of water pools (i.e., nature of surfactant and its counter ions) and the interfacialfluidity ofMEs ininfluencing the photophysical properties ofQDs has been illustrated in the present work. These resultsemphasize the judicial selection of the hostmatrix (or the template) in the synthesis ofQDs.
Acknowledgments
The authors are grateful to themembers of the RPCDLINAC facility for their help in the irradiationwork.WethankMs Shalini Singh for her help and assistance during the experiments. The authors acknowledge SAIF andCRNTS, IITBombay,Mumbai for the TEMand theHRTEM, andMr JitendraNuwad of ChemistryDivision,BARC for the SEMmeasurements. The authors thankDrDKPalit, Head, RPCD for his support andencouragement.
References
[1] Grieve K,Mulvaney P andGrieser F 2000 Synthesis and electronic properties of semiconductor nanoparticles/quantumdotsCurr.Opin. Colloid Interface Sci. 5 168–72Ray PC 2010 Size and shape dependent second order nonlinear optical properties of nanomaterials and its application in biological andchemical sensingChemRev. 110 5332–65SmithAMandNie S 2010 Semiconductor nanocrystals: structure, properties, and band gap engineeringAcc. Chem. Res. 43 190–200
[2] BurdaC, ChenX,NarayananR and El-SayedMA2005Chemistry and properties of nanocrystals of different shapesChem. Rev. 1051025–102El-sayedMA2004 Small is different: shape-, size-, and composition-dependent properties of some colloidal semiconductornanocrystalsAcc. Chem. Res. 37 326–33KongkanandA, TvrdyK, Takechi K, KunoMandKamat PV 2008Quantumdot solar cells. Tuning photoresponse through size andshape control of CdSe-TiO2 architecture J. Am.Chem. Soc. 130 4007–15
[3] DelcourtM-O, Belloni J,Marigner J-L,MoryC andColliex C 1984Metalmicroaggregates prepared by radiolytic reduction in liquidsRadiat. Phys. Chem. 23 485–7HayesD,MicicO I,NenadovicMT, SwayambunathanV andMeisel D 1989Radiolytic production and properties of ultrasmallcadmium sulfide particles J. Phys. Chem. 93 4603–8Belloni J,MostafaviM, RemitaH,Marignier J-L andDelcourtM-O1998Radiation-induced synthesis ofmono- andmulti-metallicclusters and nanocolloidsNew J. Chem. 22 1239–55ChenQ, ShenX andGaoH2010Radiolytic syntheses of nanoparticles in supramolecular assembliesAdv. Colloid Interface Sci. 15932–44
[4] Hai Z, ZhuC,Huang J, LiuH andChen J 2010Controllable synthesis of CuOnanowires andCu2O crystals with shape evolution viagamma-irradiation Inorg. Chem. 49 7217–9HuY andChen J-F 2007 Synthesis and characterization of semiconductor nanomaterials andmicromaterials viaGamma-irradiationroute J. Clust. Sci. 18 371–87Biswal J, Ramnani S P, Tewari R, DeyGK and Sabharwal S 2010 Short aspect ratio gold nanorods prepared using gamma radiation inthe presence of cetyltrimethyl ammoniumbromide (CTAB) as a directing agentRadiat. Phys. Chem. 79 441–5Belloni J 2006Nucleation, growth and properties of nanoclusters studied by radiation chemistry Application to catalysisCatal. Today113 141–56MostafaviM, Liu Y, Pernot P andBelloni J 2000Dose rate effect on size of CdS clusters induced by irradiationRadiat. Phys. Chem. 5949–59Singh S, Guleria A, SinghAK, RathMC,Adhikari S and Sarkar S K 2013Radiolytic synthesis and spectroscopic investigations ofCadmiumSelenide quantumdots grown in cationic surfactant based quaternarywater-in-oilmicroemulsions J. Colloid Interface Sci.398 112–9Guleria A, SinghAK, RathMC,Adhikari S and Sarkar SK 2013 Islands of CdSe nanoparticles within Se nanofibers: a roomtemperature ionic liquid templated synthesisDalton Trans. 42 15159–68Singh S, Guleria A, RathMC, SinghAK,Adhikari S and Sarkar S K 2013 Shape evolution of CdSe nanomaterials inmicroheterogenousmediaAdv.Mat. Lett. 4 449–53Tsuda T, Seino S andKuwabata S 2009Gold nanoparticles preparedwith a room-temperature ionic liquid-radiation irradiationmethodChem. Commun. 44 6792–4TreguerM,Cointet C, de, RemitaH, Khatouri J,MostafaviM,Amblard J, Belloni J andKeyzer R d 1998Dose rate effects on radiolyticsynthesis of gold−silver bimetallic clusters in solution J. Phys. Chem.B 102 4310–21
[5] Singh S, RathMCand Sarkar SK 2011 Investigation of dynamics of radiolytic formation of CdSe nanoparticles in aqueous solutionsJ. Phys. Chem.A 115 13251–8Singh S, Guleria A, RathMC, SinghAK,Adhikari S and Sarkar S K 2013 SeaUrchin like shapedCdSe nanoparticles grown in aqueoussolutions via electron beam irradiation J. Nanosci. Nanotechnol. 13 5365–73Singh S, RathMC, SinghAK,Mukherjee T, JayakumarOD, Tyagi AK and Sarkar SK 2011CdSe nanoparticles grown via radiolyticmethods in aqueous solutionsRadiat. Phys. Chem. 80 736–41Singh S, RathMC, SinghAK, Sarkar SK andMukherjee T 2010Reversible formation of CdSe nanoparticles in aqueous solutions byhigh-energy electron beam irradiationMater. Chem. Phys. 124 6–9
[6] CurriML, Agostiano A,Manna L,MonicaMD,CatalanoM,Chiavarone L, Spagnolo V and LugaraM2000 Synthesis andcharacterization of CdS nanoclusters in a quaternarymicroemulsion: the role of the cosurfactant J. Phys. Chem.B 104 8391–7
[7] Yang XH,WuQS, Li L,Ding YP andZhangGX2005Controlled synthesis of the semiconductor CdS quasi-nanospheres,nanoshuttles, nanowires and nanotubes by the reversemicelle systemswith different surfactantsColloids Surf.A 264 172–8
[8] Eastoe J, HollambyM J andHudson L 2006Recent advances in nanoparticle synthesis with reversedmicellesAdv. Colloid Interface Sci.128 5–15
15
Mater. Res. Express 2 (2015) 045006 AGuleria et al

[9] Calandra P, LongoA and Liveri VT 2003 Synthesis of ultra-small ZnS nanoparticles by solid-solid reaction in the confined space ofAOT reversedmicelles J. Phys. Chem.B 107 25–30
[10] Agostiano A,CatalanoM,CurriML,MonicaMD,Manna L andVasanelli L 2000 Synthesis and structural characterisation of CdSnanoparticles prepared in a four-components ‘water-in-oil’microemulsionMicron 31 253–8
[11] PileniMP1993Reversemicelles asmicroreactors J. Phys. Chem. 97 6961–73[12] SaranAD andBellare J R 2010Green engineering for large-scale synthesis of water-soluble and bio-taggable CdSe andCdSe-CdS
quantumdots frommicroemulsion by double-cappingColloids Surf.A 369 165–75[13] Xi L F and LamYM2007 Synthesis and characterization of CdSe nanorods using a novelmicroemulsionmethod atmoderate
temperature J. Colloid Interface Sci. 316 771–8[14] Xi L, LamYM,XuYP and Li L J 2008 Synthesis and characterization of one-dimensional CdSe by a novel reversemicelle assisted
hydrothermalmethod J. Colloid Interface Sci. 320 491–500[15] ChandrasekharanN andKamat PV 2002Tuning the properties of CdSe nanoparticles in reversemicellesRes. Chem. Intermed. 28
847–56[16] Moulik S P and Paul BK 1998 Structure, dynamics and transport properties ofmicroemulsionsAdv. Colloid Interface Sci. 78 99–195[17] López-QuintelaM,Rivas J, BlancoMandTojoC 2003 Synthesis of nanoparticles inmicroemulsionsNanoscaleMaterials ed
LMLiz-Marzán and PVKamat (Berlin: Springer) pp 135–55[18] López-QuintelaM, TojoC, BlancoMC,Garcıa Rio L and Leis J R 2004Microemulsion dynamics and reactions inmicroemulsions
Curr. Opin. Colloid Interface Sci. 9 264–78[19] Ganguli AK,Ganguly A andVaidya S 2010Microemulsion-based synthesis of nanocrystallinematerialsChem. Soc. Rev. 39 474–85
RamanathanM, Shrestha LK,Mori T, Ji Q,Hill J P andAriga K 2013Amphiphile nanoarchitectonics: frombasic physical chemistry toadvanced applications Phys. Chem. Chem. Phys. 15 10580–611Chevalier Y andBolzingerMA2013 Emulsions stabilizedwith solid nanoparticles: pickering emulsionsColloids Surf.A 439 23–34
[20] Guleria A, Singh S, RathMC, SinghAK,Adhikari S and Sarkar S K 2012Tuning of photoluminescence in cadmium selenidenanoparticles grown inCTABbased quaternarywater-in-oilmicroemulsions J. Lumin. 132 652–8
[21] BuxtonGV and Stuart CR 1995Re-evaluation of the thiocyanate dosimeter for pulse radiolysis J. Chem. Soc. Faraday Trans. 91 279–81[22] Gebicki J L andBednarek P 2000 Electron processes inAOT reversemicelles: 2. Influence of oil phase. Pulse radiolysis study J.Mol.
Struct. 555 227–34[23] Guleria A, SinghAK, Sarkar SK,Mukherjee T andAdhikari S 2011Generation of counter ion radical (Br2(•-)) and its reactions in
water-in-oil (CTAB orCPB)/n-butanol/cyclohexane/water)microemulsion J. Phys. Chem.B 115 10615–21[24] Gbicki J L, Gbicka L andKroh J 1994 Electron processes inAOT reversemicelles: 1. Absorption spectra and lifetimes of hydrated
electrons as studied by pulse radiolysis J. Chem. Soc. Faraday Trans. 90 3411–4[25] Brus L 1986 Electronic wave functions in semiconductor clusters: experiment and theory J. Phys. Chem. 90 2555–60[26] Norris D J andBawendiMG1996Measurement and assignment of the size-dependent optical spectrum inCdSe quantumdots Phys.
Rev.B 53 16338–46[27] HuYZ, LindbergMandKoch SW1990Theory of optically excited intrinsic semiconductor quantumdotsPhys. Rev.B 42 1713–23[28] QueW1992 Excitons in quantumdots with parabolic confinement Phys. Rev.B 45 11036–41[29] Colvin VL, CunninghamKL andAlivisatos A P 1994 Electricfieldmodulation studies of optical absorptionDipolar character of the
excited state inCdSe nanocrystals: Dipolar character of the excited state J. Chem. Phys. 101 7122–38[30] Qi L 2006 Synthesis of inorganic nanostructures in reversemicellesEncyclopedia of Surface andColloid Science (NewYork: Taylor and
Francis) p 6183[31] Gharibshahi E and Saion E 2012 Influence of dose on particle size and optical properties of colloidal platinumnanoparticles Int. J.Mol.
Sci. 13 14723–41[32] Saion E, Gharibshahi E andNaghavi K 2013 Size-controlled and optical properties ofmonodispersed silver nanoparticles synthesized
by the radiolytic reductionmethod Int. J.Mol. Sci. 14 7880–96[33] Dukes AD III, SchreuderMA, Sammons J A,McBride J R, SmithN J andRosenthal S J 2008 Pinned emission fromultrasmall
cadmium selenide nanocrystals J. Chem. Phys. 129 121102–4[34] Dukes AD III, Samson PC,Keene JD,Davis LM,Wikswo J P andRosenthal S J 2011 Single-nanocrystal spectroscopy of white-light-
emitting CdSe nanocrystals J. Phys. Chem.A 115 4076–81[35] Ravindran TR, Arora AK, Balamurugan B andMehta BR 1999 Inhomogeneous broadening in the photoluminescence spectrumof
CdS nanoparticlesNanoStructuredMater. 11 603–9Chan EM,XuC,MaoAW,HanG,Owen J S, CohenBE andMillironD J 2010Reproducible, high-throughput synthesis of colloidalnanocrystals for optimization inmultidimensional parameter spaceNano Lett. 10 1874–85Choi J,WangN S andReipaV 2007 Photoassisted tuning of silicon nanocrystal photoluminescence Langmuir 23 3388–94
[36] Katsaba AV, Ambrozevich SA, VitukhnovskyAG, FedyaninVV, LobanovAN,KrivobokV S, Vasiliev RB and Samatov IG 2013Surface states effect on photoluminescence of CdS colloidal nanocrystals J. Appl. Phys. 113 184306
[37] Fisher BR, EislerH-J, StottN E andBawendiMG2004 Emission intensity dependence and single-exponential behavior in singlecolloidal quantumdotfluorescence lifetimes J. Phys. Chem.B 108 143–8
[38] Al SalmanA, Tortschanoff A, van der ZwanG, vanMourik F andCherguiM2009Amodel for themulti-exponential excited-statedecay of CdSe nanocrystalsChem. Phys. 357 96–101
[39] VanDriel A,Nikolaev I, Vergeer P, Lodahl P, VanmaekelberghD andVosWL2007 Statistical analysis of time-resolved emission fromensembles of semiconductor quantumdots: Interpretation of exponential decaymodels Phys. Rev. 75 035329Barnard E S et al 2013 Probing carrier lifetimes in photovoltaicmaterials using subsurface two-photonmicroscopy Sci. Rep. 3 2098
[40] UskokovićVandDrofenikM2005 Synthesis ofmaterials within reversemicelles Surf. Rev. Lett. 12 239–77[41] SchreuderMA,Mcbride J R, Dukes AD III, Sammons J A andRosenthal S J 2009Control of surface state emission via phosphonic acid
modulation in ultrasmall CdSe nanocrystals: the role of ligand electronegativity J. Phys. Chem.C 113 8169–76[42] Kudera S, ZanellaM,Giannini C, Rizzo A, Li Y, Gigli G, Cingolani R, Ciccarella G, SpahlW, ParakW J andManna L 2007 Sequential
growth ofmagic-size CdSe nanocrystalsAdv.Mater. 19 548–52ZanellaM,Abbasi AZ, Schaper AK and ParakW J 2010Discontinuous growth of II–VI semiconductor nanocrystals fromdifferentmaterials J. Phys. Chem.C 114 6205–15
[43] BowersM J,McBride J R, GarrettMD, Sammons J A,Dukes AD, SchreuderMA,Watt T L, Lupini AR, Pennycook S J andRosenthal S J 2009 Structure and ultrafast dynamics of white-light-emitting CdSe nanocrystals J. Am. Chem. Soc. 131 5730–1BowersM J,McBride J R andRosenthal S J 2005White-light emission frommagic-sized cadmium selenide nanocrystals J. Am.Chem.Soc. 127 15378–9
16
Mater. Res. Express 2 (2015) 045006 AGuleria et al

Qian L, BeraD andHolloway PH2008Temporal evolution ofwhite light emission fromCdSe quantumdotsNanotechnology 19285702
[44] Lakowicz J R 2006Principles of Fluorescence Spectroscopy (NewYork: Springer)[45] ZhangX F, Zhang I and Liu L 2010 Photophysics of halogenated fluoresceins: Involvement of both intramolecular electron transfer and
heavy atom effect in the deactivation of excited states Photochem. Photobiol. 86 492–8[46] WangX,QuL, Zhang J, PengX andXiaoM2003 Surface-related emission in highly luminescent CdSe quantumdotsNano Lett. 3
1103–6[47] BijuV, KanemotoR,Matsumoto Y, Ishii S, Nakanishi S, ItohT, Baba Y and IshikawaM2007 Photoinduced photoluminescence
variations of CdSe quantumdots in polymer solutions J. Phys. Chem.C 111 7924–32[48] LeeWZ, ShuGW,Wang J S, Shen J L, Lin CA, ChangWH,RuaanRC, ChouWC, LuCHand Lee YC2005Recombination dynamics
of luminescence in colloidal CdSe/ZnS quantumdotsNanotechnology 16 1517–21[49] HatzopoulosMH, Eastoe J, Dowding P J andGrillo I 2013Cylinder to sphere transition in reversemicroemulsions: the effect of
hydrotropes J. Colloid Interface Sci. 392 304–10[50] LawrenceM J andReesGD2000Microemulsion-basedmedia as novel drug delivery systemsAdv.DrugDeliv. Rev. 45 89–121[51] PileniM-P 2003The role of soft colloidal templates in controlling the size and shape of inorganic nanocrystalsNat.Mater. 2 145–50[52] Angelico R, PalazzoG,ColafemminaG,Cirkel PA, GiustiniM andCeglie A 1998Water diffusion and headgroupmobility in polymer-
like reversemicelles: evidence of a sphere-to-rod-to-sphere transition J. Phys. Chem.B 102 2883–9[53] GraetzelM, JanssenRA J,MitziDB and Sargent EH 2012Materials interface engineering for solution-processed photovoltaicsNature
488 304–12Chandramohan S, RyuBD,KimHK,HongC-H and Suh E-K 2011Trap-state-assistedwhite light emission from aCdSe nanocrystalintegrated hybrid light-emitting diodeOpt. Lett. 36 802–4
17
Mater. Res. Express 2 (2015) 045006 AGuleria et al


![Viologen-Templated Arrays of Cucurbit[7]uril-Modified Iron-Oxide Nanoparticles](https://img.pdfslide.net/doc/110x75/635dd0ee1b1c1ace26093ae3/viologen-templated-arrays-of-cucurbit7uril-modified-iron-oxide-nanoparticles.jpg)


![Icosahedron [Cl12 ] Templated Gigantic Gd158 Co38](https://img.pdfslide.net/doc/110x75/6332e2a3a6138719eb0a6062/icosahedron-cl12-templated-gigantic-gd158-co38-.jpg)

