Embed Size (px)
Citation preview
Electrospun antimicrobial and antibiofouling nanofibres
by
Nonjabulo Prudence Gule
December 2011
Supervisor: Prof. Bert Klumperman
Co-supervisor: Prof. Thomas Eugene Cloete
Faculty of Science
Department of Chemistry and Polymer Science
Dissertation presented in fulfilment of the requirements for the degree
Doctor of Philosophy in Polymer Science at Stellenbosch University

Stellenbosch University http://scholar.sun.ac.za
i
Declaration
By submitting this dissertation electronically, I declare that the entirety of the work contained therein
is my own, original work, that I am the sole author thereof (save to the extent explicitly otherwise
stated), that reproduction and publication thereof by Stellenbosch University will not infringe any third
party rights and that I have not previously in its entirety or in part submitted it for obtaining any
qualification.
December 2011
Copyright © 2011 University of Stellenbosch
All rights reserved
Stellenbosch University http://scholar.sun.ac.za
ii
Abstract
The main objective of this study was to develop electrospun nanofibres with both antimicrobial and
antibiofouling properties for possible application in water filtration. To do this, two routes were
investigated: firstly, the use of biocides and bactericidal copper salts to introduce bactericidal
properties on electrospun nanofibres. Secondly, the modification of polymers using furanone
compounds to obtain nanofibres with the ability to repel microbial attachment.
Fabrication of biocide-containing PVA nanofibres was successful. This was achieved through direct
doping of PVA solutions with AquaQure which is an aqueous biocide comprising of mainly Cu2+
and
Zn2+
, prior to the electrospinning process coupled with chemical crosslinking using glyoxal. The
conventional needle based electrospinning technique was used to fabricate these nanofibrous mats.
The presence of the constituents of AquaQure on surfaces of PVA/AquaQure nanofibrous mats was
confirmed using energy dispersive x-ray analysis (EDX). ATR/FTIR, XRD, TGA, DSC and SEM
techniques were used to do chemical and thermal analysis of the nanofibres in comparison with
pristine PVA nanofibres. These nanofibres demonstrated antimicrobial activity of up to 5 log against
the Gram-positive strain S. aureus Xen 36 and Gram-negative strains E. coli Xen 14, S. typhimurium
Xen 26, P. aeruginosa Xen 5 and K. pneumoniae Xen 39. Because of crosslinking, these fibres also
demonstrated good water stability. Leaching of the ions constituting AquaQure was limited and
compared with South African national standards for drinking water, the water filtered through these
nanofibress was deemed safe for human consumption. Bioluminescence imaging and fluorescence
microscopy were used to confirm antimicrobial activity results obtained from plate counting. These
nanofibres demonstrated satisfactory antimicrobial efficiency but did not repel microbial attachment.
The second part of this study entailed the investigation of copper-doped PVA and SMA nanofibres for
antimicrobial activity. Although bactericidal properties of copper are well documented, its selection
was based on the fact that it is the main constituent of the AquaQure. Bubble electrospinning was used
instead of needle electrospinning to upscale nanofibre production. Similar techniques as those used in
PVA/AquaQure nanofibres were used to characterize the copper functionalized nanofibres. Even
though these nanofibres demonstrated exceptional antimicrobial efficacy (up to 5 log) for all the
strains, bioluminescence imaging indicated a trend for these cells to enter a dormant state on contact
with the copper containing-nanofibres.
The last part of this project involved testing of free furanone compounds as well as surface-tethered
furanone-modified nanofibres for their antibiofouling potentials. To do this, blends of 2,5-dimethyl-4-
hydroxy-3(2H)furanone (DMHF) (5% wt/vol) with PVA (10% wt/vol) were prepared and electrospun
to produce PVA/DMHF nanofibres. The free furanones and furanone-modified nanofibres
Stellenbosch University http://scholar.sun.ac.za
iii
demonstrated not only antibiofouling properties but also antimicrobial activity. Other furanone
compounds with 3(2H) and 2(5H) cores were synthesized. The synthesis of these furanone compounds
(5-(2-(2-aminoethoxy)ethoxy)methyl)-2(5H)furanone and 4-(2-(2-aminoethoxy)-2,5-dimethyl-3(2H)-
furanone) was successful. Their structures and molar masses were confirmed using 1H NMR and ES
mass spectroscopy. These furanones were then covalently immobilized on the SMA backbone. To test
their antimicrobial and antibiofouling activity, the furanone-modified polymer was dissolved in an
ethanol and methanol mixture (1:1) and electrospun to produce nanofibres. The free furanone and
furanone-modified SMA nanofibres derived from 4-(2-(2-aminoethoxy)-2,5-dimethyl-3(2H)-furanone
demonstrated high antibiofouling and antimicrobial efficiency against the Gram-positive strain S.
aureus Xen 36 and Gram-negative strains E. coli Xen 14, S. typhimurium Xen 26, P. aeruginosa Xen
5 and K. pneumoniae Xen 39. The 2(5H) furanone on the other hand had limited activity against the
strains. These nanofibres were also characterized and compared with their pristine polymer
counterparts and leaching experiments were conducted using GC-MS.
Stellenbosch University http://scholar.sun.ac.za
iv
Opsomming
Die hoofdoel van hierdie studie was om nanovesel filtrasie nanofibre met beide antimikrobiese en
aanpakwerende eienskappe te ontwikkel. Twee verskillende metodes is ondersoek. Eerstens is
biosiede en bakteriee-dodende koper soute gebruik om antimikrobiese nanovesels te lewer. Tweedens
is nanovesels met furanoon samestellings gemodifiseer om nanovesels te lewer wat mikrobiese
aanhegting voorkom.
Die fabrisering van biosied-bevattende PVA nanovesel nanofibre was suksesvol.
AquaQure, ‟n biosied wat hoofsaaklik uit Cu2+
en Zn2+
bestaan, is direk by PVA oplossings gevoeg
voor die elektrospin proses, en is gevolg deur chemiese kruisbinding deur middel van “glyoxal”. Die
nanovesels is neergele in ‟n ongeweefde mat deur middel van die konvensionele naald-gebasseerde
elektrospin proses. Verspreidings X-staal analises (EDX) is gebruik om die teenwoordigheid van
AquaQure komponente in en op die oppervlakte van die PVA/aquaqure nanovesel matte te bevestig.
ATR/FTIR, UV-Vis, XRD, TGA, DSC en SEM tegnieke is gebruik vir chemiese en termiese analises
om sodoende PVA/aquacure nanovesels met ongemodifiseerde PVA nanovesels te vergelyk.
PVA/aquacure nanovesels het ‟n antimikrobiese aktiwiteit van tot 5 log reduksie getoon teen Gram-
positiewe S. aureus Xen 36 en Gram-negatiewe E. coli Xen 14, S. typhimurium Xen 26, P. aeruginosa
Xen 5 en K. pneumoniae Xen 39. Die vesels was stabiel in water na kruisbinding. Slegs beperkte
uitloging van Aquaqure Cu2+
en Zn2+
ione is waargeneem, en water wat deur die PVA/aquacure
nanovesels gefiltreer is, is volgens Suid Afrikaanse Nasionale Standaarde vir drinkwater steeds veilig
vir menslike gebruik. Behalwe vir die plaat-tellingsmetode het bio-lumiserende fotos en fluoroserende
mikroskopie ook die antimikrobiese aktiwiteit van die vesels bevestig. Die vesels het bevredigende
antimikrobiese efektiwiteit getoon, maar kon nie mikrobiese aanhegting voorkom nie.
In die tweede gedeelte van die werk is die antimikrobiese aktiwiteit van PVA en SMA vesels wat met
koper verreik is, ondersoek. Alhoewel die bakteriee dodende eienskappe van koper reeds goed
gedokumenteer is, is hierdie ondersoek gedoen op grond van die feit dat koper een van die hoof
komponente van aquaqure is. Nanovesels is uit koper-verreikte oplossings van PVA en SMA deur
middel van die borrel-gebasseerde elektrospin tegniek gefabriseer, ten einde die opbrengs van
nanovesels te verhoog. Fisiese kruisbinding deur middel van hitte behandeling is toegepas ten einde
die stabiliteit van die vesels in water te verbeter. Dieselfde karakteriseringstegnieke wat gebruik is vir
die PVA/aquacure vesels is op hierdie vesels toegepas. Alhoewel die vesels uitstekende
antimikrobiese aktiwiteit van tot 5 log reduksie gedemonstreer het, het bio-lumiserende beeldvorming
getoon dat die selle ‟n dormante stadium binnegaan na kontak met hierdie vesels.
Stellenbosch University http://scholar.sun.ac.za
v
In die laaste gedeelte van die projek is vrye furanoon samestellings en nanofibre met oppervlak-
gehegde furanone getoets vir aanpakwerende potensiaal. Om dit te bewerkstellig was „n mengsel van
2,5 – dimethyl-4-hydroxy-3(2H) furanone (DMHF) (5% wt/vol) en PVA (10% wt/vol) voorberei en
gebruik om PVA/DMHF nanovesel filtrasie nanofibre te produseer deur middel van die elektrospin
proses. Die vrye furanone en furanoon-gemodifiseerde nanofibre het nie alleen aanpak
weerstandbiedende einskappe gedemonstreer nie maar ook antimikrobiese eienskappe. DMHF was
gebruik as die begin material om furanoon samestellings te produseer met 3(2H) en 2(5H) kerne. Die
sintesis van hierdie furanone se samestellings (5-(2-(2-aminoethoxy)ethoxy)methyl)-2(5H)furanone en
4-(2-(2-aminoethoxy)-2,5-dimethyl-3(2H)-furanone) was suksesvol. Hulle strukture en molere massas
was bevestig met 1H NMR en ES massa spektrometrie. Hierdie furanone is daarna kovalent ge-
immobiliseer op die SMA rugbeen. Om hulle antimikrobiese en aanpakwerende aktiwitiet te toets, is
die furanoon-gemodifiseerde polimeer opgelos in „n etanol en metanol mengsel (1:1) en ge-elektrospin
om nanovesel filtrasie nanofibre te produseer. Die furanone en furanoon-gemodifiseerde nanovesel
filtrasie nanofibre afkomstig van 4-(2-(2-aminoethoxy)-2,5-dimethyl-3(2H)-furanone het hoe
aanpakwerende en antimibrobiese effektiewitiet getoon teenoor die Gram-positiewe S. aureus Xen 36
en Gram-negatiewe E. coli Xen 14, S. typhimurium Xen 26, P. aeruginosa Xen 5 and K. pneumoniae
Xen 39. Hierdie nanovesel filstrasie nanofibre is ook gekarakteriseer en vergelyk met die
ongemodifiseerde polimeer. „n Uitlogings eksperiment is uitgevoer deur gebruik te maak van GC-MS.
Stellenbosch University http://scholar.sun.ac.za
vi
List of Publications and Patents
Parts of this thesis have been patented, published, submitted to be published or presented at
international conferences.
Patent
[1] Patent number: 2010/2091ZA00
Reference: Water filter assembly and filter element
Authors: Thomas Eugene Cloete, Marelize Botes, Michéle de Kwaadsteniet, Danielle
Marguerite du Plessis, Nonjabulo Prudence Dlamini, Leon Milner Dicks
Publications (published; submitted or in preparation)
[1] An investigation into electrospun poly(vinyl alcohol) nanofibres with biocidal aditives for
application in filter media. Part 1: Properties affecting electrospun fibre morphology and
characterisation.
N.P. Dlamini, M. de Kwaadsteniet, T.E. Cloete, B. Klumperman (submitted)
[2] An investigation into electrospun poly(vinyl alcohol) nanofibres with biocidal additives for
application in filter media. Part 2: Antimicrobial activity, reusability, leaching and water
stability
N.P. Dlamini, M. de Kwaadsteniet, T.E. Cloete, B. Klumperman (submitted)
[3] Synthesis, characterization and antibiofouling efficacy of furanone compounds with the 3(2H)
and 2(5H) furanone cores.
N.P. Dlamini, O. Bshena, M. de Kwaadsteniet, T.E. Cloete, B. Klumperman (in preparation)
[4] Antimicrobial and antibiofouling nanofibres derived from electrospun furanone modified
poly(vinyl alcohol)
N.P. Dlamini, M. de Kwaadsteniet, T.E. Cloete, B. Klumperman (in preparation)
[5] Characterization and antimicrobial potential of electrospun nanofibres from copper doped
polymer blends
N.P. Dlamini, M. de Kwaadsteniet, T.E. Cloete, B. Klumperman (in preparation)
Oral presentations
[1] Fabrication, characterization and antimicrobial efficacy of Cu+ functionalized polyacrylonitrile
nanofibres. South African Microbiology Society Conference, November 2011
[2] Biofouling control using nanofibre containing furanone derivatives. IWA nano and water
conference, Ascona, Zurich, Switzerland. 15-18 May 2011.
Stellenbosch University http://scholar.sun.ac.za
vii
Poster presentations
[1] Fabrication and testing of the antimicrobial efficacy of PVA/Cu2+
nanofibres: 11th
UNESCO/IUPAC Conference on Functional Polymeric Materials and Composites.
April 2011.
Stellenbosch University http://scholar.sun.ac.za
viii
Acknowledgements
I sincerely wish to thank the following people who contributed towards the success of this project:
My supervisors Prof. Klumperman and Prof. Cloete for the opportunity to conduct this study
under their leadership. Their experience, skill, determination and passion for research have
made it an honour to study under their supervision. I would also like to thank them for their
unswerving patience, encouragement and for always having time to give guidance when
needed.
My husband for being amazing through and through. For always being excited about my work
even at times when I wasn‟t and for just seeing the best in me…I wouldn‟t have asked for a
better person to share my life with.…Thank you for that reassuring smile my love!
The Dlamini and Gule families for their prayers and support.
My collegues from the Department of Microbiology Michele, Marelize, Danielle… You ladies
are the best! Baie dankie. Michele, thank you for proof reading my work and for keeping me
motivated.
The Free Radical group and Ahson, you guys are just amazing.
Welmarie, you are great my friend…you really helped me keep it together… Thank you for
being who you are!
Prof. L.M.T. Dicks and his group for welcoming me and for guidance during the time I spent
in their laboratory.
The central analytical facilities staff; for helping with sample analysis.
The Andrew Mellon Foundation, Eskom and the National Research Foundation for funding
this work.
And to sum it all “TO GOD BE THE GLORY”…I wouldn‟t have done this without the Lord.
Stellenbosch University http://scholar.sun.ac.za
ix
Clean, safe drinking water is scarce. It is the foundation of life, a basic human need. Yet today, all
around the world, far too many people spend their entire day searching for it [United Nations, 2005].
Stellenbosch University http://scholar.sun.ac.za
Table of contents
x
Table of Contents
Declaration ........................................................................................................... i
Abstract ............................................................................................................... ii
Opsomming ........................................................................................................ iv
List of Publications and Patents ....................................................................... vi
Acknowledgements .......................................................................................... viii
Chapter 1 : Introduction .................................................................................... 1
1.1 Background information ................................................................................................................ 1
1.2 Motivation ..................................................................................................................................... 2
1.3 Problem statement ......................................................................................................................... 3
1.4 Objectives ...................................................................................................................................... 3
1.5 Methodology ................................................................................................................................. 4
1.6 Structure of thesis .......................................................................................................................... 4
1.7 References ..................................................................................................................................... 7
Chapter 2 : Literature review ......................................................................... 10
2.1 Chapter summary ........................................................................................................................ 10
2.2 Introduction ................................................................................................................................. 10
2.2.1 Historical development of membranes ................................................................................. 11
2.2.2 Membrane technology in water treatment ............................................................................ 12
2.3 Membrane filtration processes .................................................................................................... 12
2.3.1 Microfiltration (MF) ............................................................................................................. 14
2.3.2 Ultrafiltration (UF) ............................................................................................................... 14
2.3.3 Nanofiltration (NF) ............................................................................................................... 14
2.3.4 Reverse osmosis (RO) .......................................................................................................... 15
2.4 Membrane materials .................................................................................................................... 15
2.5 Membrane systems ...................................................................................................................... 16
2.6 Membrane modules ..................................................................................................................... 16
2.6.1 Plate and frame ..................................................................................................................... 17
2.6.2 Spiral wound......................................................................................................................... 17
2.6.3 Tubular ................................................................................................................................. 18
2.6.4 The capillary membrane module .......................................................................................... 19
2.6.5 The hollow fibre membrane module .................................................................................... 20
2.7 Membrane fouling ....................................................................................................................... 21
2.7.1 Membrane biofouling ........................................................................................................... 22
Stellenbosch University http://scholar.sun.ac.za
Table of contents
xi
2.7.2 The process of biofouling ..................................................................................................... 22
2.7.3 Problems caused by biofouling ............................................................................................ 23
2.8 Biofouling control and cleaning .................................................................................................. 25
2.8.1 Biofilm control ..................................................................................................................... 26
2.8.2 Cleaning................................................................................................................................ 32
2.9 Advances in membrane technology through nanotechnology ..................................................... 32
2.9.1 Production of nanofibres ...................................................................................................... 33
2.9.2 Electrospinning ..................................................................................................................... 33
2.9.3 Uses of electrospun nanofibres ............................................................................................. 36
2.9.4 Nanofibres for filter media ................................................................................................... 38
2.9.5 Functionalization of nanofibres ............................................................................................ 39
2.10 References ................................................................................................................................. 43
Chapter 3 : Fabrication and characterization of antimicrobial biocide
containing poly(vinyl alcohol) nanofibres for application in filter media .. 51
3.1 Chapter summary ........................................................................................................................ 51
3.2 Background information .............................................................................................................. 51
3.2.1 Poly(vinyl alcohol) (PVA) ................................................................................................... 51
3.2.2 Development of antimicrobial nanofibres ............................................................................ 54
3.2.3 Impact of PVA/AquaQurenanofibres and possible drawbacks in filter applications ........... 55
3.3 Objective ..................................................................................................................................... 55
3.4 Experimental materials and methods........................................................................................... 55
3.4.1 Electrospinning ..................................................................................................................... 56
3.4.2 Scanning electron microscopy (SEM) .................................................................................. 57
3.4.3 X-ray diffraction (XRD) ....................................................................................................... 58
3.4.4 Attenuated total reflectance-Fourier transform infra-red spectroscopy (ATR/FTIR) .......... 58
3.4.5 Thermogravimetric analysis (TGA) .................................................................................... 58
3.4.6 Differential scanning calorimetry (DSC) ............................................................................. 58
3.4.7 Antimicrobial characterization ............................................................................................. 58
3.4.8 Fluorescence experiments .................................................................................................... 60
3.4.9 Testing of water stability ...................................................................................................... 61
3.4.10 Leaching experiments ......................................................................................................... 62
3.4.11 The effect of electrospinning variables .............................................................................. 63
3.5 Results and discussion ................................................................................................................. 64
3.5.1 Morphology of the fibres ...................................................................................................... 64
3.5.2 The effect of spinning variables ........................................................................................... 65
3.5.3 Chemical analysis and stability of the electrospun fibres ..................................................... 69
Stellenbosch University http://scholar.sun.ac.za
Table of contents
xii
3.5.4 Antimicrobial characterization ............................................................................................. 73
3.5.5 Scanning electron microscopy (SEM) .................................................................................. 76
3.5.6 Regeneration studies ............................................................................................................. 77
3.5.7 Water Stability ...................................................................................................................... 78
3.5.8 Leaching experiments ........................................................................................................... 79
3.6 Conclusions ................................................................................................................................. 81
Chapter 4 : The fabrication and characterization of antimicrobial copper
functionalized nanofibres from poly(vinyl alcohol) and poly(styrene-co-
maleic anhydride) via bubble electrospinning ............................................... 84
4.1 Chapter Summary ........................................................................................................................ 84
4.2 Introduction ................................................................................................................................. 84
4.2.1 Antimicrobial properties of Copper ...................................................................................... 85
4.2.2 Metal ion blends with polymers ........................................................................................... 86
4.2.3 Metal ion attachment to polymers ........................................................................................ 87
4.2.4 Impact of Cu-doped nanofibres ............................................................................................ 87
4.3 Objective ..................................................................................................................................... 87
4.4 Polymers used in this study ......................................................................................................... 88
4.4.1 Poly(vinyl alcohol) (PVA) ................................................................................................... 88
4.5 Experimental materials and methods........................................................................................... 89
4.5.1 Materials ............................................................................................................................... 89
4.5.2 Electrospun solution parameters ........................................................................................... 90
4.5.3 Electrospinning ..................................................................................................................... 90
4.6 Results and discussion ................................................................................................................. 92
4.6.1 Properties of electrospun PVA/Cu and SMA/Cu solutions .................................................. 92
4.6.2 Morphology studies of electrospun PVA/Cu and SMA/Cu nanofibre mats ......................... 92
4.6.3 Energy dispersive x-ray analysis (EDX) .............................................................................. 94
4.6.4 Thermogravimetric analysis ................................................................................................. 95
4.6.5 Differential scanning calorimetry (DSC) ............................................................................. 96
4.6.6 Attenuated Total Reflectance Infra Red spectroscopy (ATR-IR) ........................................ 97
4.6.7 Antimicrobial characterization results .................................................................................. 99
4.6.8 Regeneration studies ........................................................................................................... 104
4.6.9 Leaching experiments ......................................................................................................... 105
4.6.10 Water stability tests .......................................................................................................... 106
4.7 Conclusions ............................................................................................................................... 108
4.8 References ................................................................................................................................. 109
Stellenbosch University http://scholar.sun.ac.za
Table of contents
xiii
Chapter 5 : An investigation into the use of furanone derivatives as
antibiofouling agents in filter media ............................................................. 112
5.1 Chapter summary ...................................................................................................................... 112
5.2 Introduction ............................................................................................................................... 112
5.3 Quorum sensing (QS) ................................................................................................................ 113
5.3.1 The role of QS in biofilm formation ................................................................................... 113
5.3.2 Quorum Sensing Inhibitors (QSI) ...................................................................................... 114
5.4 Furanones .................................................................................................................................. 114
5.5 How furanones inhibit QS ......................................................................................................... 114
5.5.1 Naturally occurring furanones ............................................................................................ 115
5.5.2 Synthetic furanones ............................................................................................................ 115
5.6 Objectives .................................................................................................................................. 116
5.7 Impact of furanone-modified nanofibres ................................................................................... 116
5.8 Experimental materials and methods......................................................................................... 116
5.8.1 Materials ............................................................................................................................. 116
5.8.2 Antibiofouling characterization .......................................................................................... 117
5.8.3 Synthesis of furanone derivatives ....................................................................................... 118
5.8.4 Immobilization of furanone derivatives on SMA ............................................................... 120
5.8.5 Characterization of synthesized furanones ......................................................................... 121
5.8.6 Preparation of electrospinning solutions and electrospinning conditions .......................... 122
5.9 Results and discussions ............................................................................................................. 123
5.9.1 Nuclear Magnetic Resonance (NMR) ................................................................................ 123
5.9.2 Electron Spray Mass spectroscopy (ES-MS) ..................................................................... 124
5.9.3 Morphology of the nanofibres ............................................................................................ 125
5.9.4 Attenuated total reflectance –infra red spectroscopy (ATR-FTIR) .................................... 128
5.9.5 Thermogravimetric analysis (TGA) ................................................................................... 129
5.9.6 Differential scanning calorimetry (DSC) ........................................................................... 130
5.9.7 Antimicrobial and antibiofouling determination ................................................................ 132
5.9.8 Bioluminescence Imaging .................................................................................................. 138
5.9.9 Fluorescence microscopy ................................................................................................... 139
5.9.10 Regeneration ..................................................................................................................... 140
5.9.11 Leaching experiments ....................................................................................................... 142
5.10 Conclusions ............................................................................................................................. 143
5.10.1 PVA/DMHF ..................................................................................................................... 143
5.10.2 SMA-Furanone ................................................................................................................. 143
5.11 References ............................................................................................................................... 146
Stellenbosch University http://scholar.sun.ac.za
Table of contents
xiv
Chapter 6 : Conclusions and recommendations .......................................... 148
6.1 Introduction ............................................................................................................................... 148
6.2 Studied nanofibres ..................................................................................................................... 148
6.2.1 Biocide-doped nanofibres ................................................................................................... 148
6.2.2 Copper doped nanofibres .................................................................................................... 149
6.2.3 Furanone modified nanofibres ............................................................................................ 150
6.3 Concluding remarks .................................................................................................................. 152
6.4 Recommendations ..................................................................................................................... 152
Appendix A ..................................................................................................... 153
Stellenbosch University http://scholar.sun.ac.za
List of figures
xv
List of Figures
Figure 1.1: Thesis layout ......................................................................................................................... 6
Figure 2.1: Principle of membrane operation. ....................................................................................... 11
Figure 2.2: Membrane processes. .......................................................................................................... 13
Figure 2.3: Separation capabilities of MF, UF, NF and RO for water and waste water treatment ....... 13
Figure 2.4: Dead end (A) and cross-flow (B) filtration systems. .......................................................... 16
Figure 2.5: Schematic drawing illustrating the concept of a plate-and-frame membrane. .................... 17
Figure 2.6: Spiral wound membrane module ........................................................................................ 18
Figure 2.7: Schematic of the tubular module. ...................................................................................... 19
Figure 2.8: Schematic diagram showing a capillary membrane module. .............................................. 20
Figure 2.9: Schematic drawing illustrating the hollow fibre module .................................................... 21
Figure 2.10: Sequential stages in biofilm formation. ............................................................................ 23
Figure 2.11: Basic ES set-up. ................................................................................................................ 35
Figure 2.12: Taylor cone formation (A) Surface charges induced in the polymer solution due to the
electric field. (B) Elongation of the pendant drop. (C) Deformation of the pendant drop to the form the
Taylor cone due to the charge-charge repulsion. A fine jet initiates from the cone. ............................. 36
Figure 2.13: Application fields targeted by US patents on electrospun nanofibres. ............................. 37
Figure 2.14: Potential applications of electrospun polymer nanofibres. ............................................... 37
Figure 2.16: Schematic of the grafting to and grafting from approaches. ............................................. 41
Figure 1.1: Experimental methods ........................................................................................................ 56
Figure 1.2: Flow through filtration set-up for determining pathogen removal with electrospun
nanofibres. ............................................................................................................................................. 60
Figure 1.3: Fibre diameters (A) and pore size distribution (B) on PVA/AquaQure nanofibrous mats
............................................................................................................................................................... 65
Figure 1.4: Plots of viscosity of PVA/AquaQure electrospinning solutions ......................................... 66
Figure 1.5: Effect of different spinning parameters on fibre diameter. ................................................. 67
Figure 1.6: PVA/AquaQure fibres electrospun at 10 kV (A), 15 kV (B) and 20 kV (C). ..................... 67
Figure 1.7: Effect of varying the amount of crosslinking agent on the fibre diameter .......................... 68
Figure 1.8: Effect of glyoxal on viscosity of PVA/AquaQure mixtures. .............................................. 69
Figure 1.9: Effect of crosslinking; A: non-crosslinked fibres, B: non crosslinked fibres after
submerging in water, C: crosslinked fibres and D: crosslinked fibres after submersion in water......... 70
Figure 1.10: EDX spectrum of PVA/AquaQure fibres.......................................................................... 70
Figure 1.11: ATR-IR spectra of PVA only and PVA/AquaQure nanofibres. ....................................... 71
Figure 1.12: TGA (A) and DSC (B) thermograms comparing stability of PVA only and
PVA/AquaQure nanofibres. .................................................................................................................. 72
Figure 1.13: XRD spectrum of PVA/AquaQure fibres ......................................................................... 73
Stellenbosch University http://scholar.sun.ac.za
List of figures
xvi
Figure 1.14: Pathogen viability (expressed in CFU/mL) on treated (PVA/AquaQure) and non-treated
(controls) fibres for individual strains. .................................................................................................. 74
Figure 1.15: Cell viability (expressed in CFU/mL) on treated (PVA/AquaQure) and control (Pristine
PVA) fibres for strain cocktail. ............................................................................................................. 74
Figure 1.16: Fluorescence Microscopy images showing (A) total number of colonies in control fibres
(PVA only); (B) Dead colonies (none) in control fibres; (C) total number of colonies in AquaQure
treated fibres and (D) Dead colonies (almost all dead) in AquaQure treated fibres. ............................. 76
Figure 1.17: SEM image showing intact (A) cells in contact with pristine PVA fibres and damaged
bacterial cell walls (B) in contact with AquaQure treated fibres. ......................................................... 77
Figure 1.18: Antimicrobial effectiveness of PVA/AquaQure nanofibres over six cycles. .................... 77
Figure 1.19: Morphology of nanofibres before (A) and after (B) antimicrobial tests. .......................... 78
Figure 1.20: SEM images of the fibres: A, PVA only before water absorption; B, PVA only after water
absorption; C. PVA/AquaQure before water absorption D, PVA/AquaQure after water absorption. .. 79
Figure 1.21: Leaching intensities of ions. ............................................................................................. 80
Figure 1.22: UV-VIS Spectra of leachates. ........................................................................................... 80
Figure 4.1: Current and future potential applications of copper and copper compounds in different
areas, which are based on copper‟s biocidal properties (Modified from 2). .......................................... 86
Figure 4.2: Orientations of metal ion attachment to nanofibres. ........................................................... 87
Figure 4.3: Structure of poly(vinyl alcohol). ......................................................................................... 88
Figure 4.4: Structure of poly(styrene-co-maleic anhydride) copolymer. .............................................. 89
Figure 4.5: Bubble spinning set-up. ...................................................................................................... 91
Figure 4.6: Changes in viscosity of PVA/Cu (A) and SMA/Cu (B) electrospinning solutions
monitored over 15 minutes .................................................................................................................... 92
Figure 4.7: PVA/Cu (A) and SMA/Cu (B) nanofibre pore sizes........................................................... 93
Figure 4.8: PVA/Cu (A) and SMA/Cu (B) nanofibre diameters. .......................................................... 94
Figure 4.9: EDX traces of PVA/Cu (A) and SMA/Cu (B). ................................................................... 95
Figure 4.10: TGA thermograms of PVA, PVA/Cu (A) and SMA, SMA/Cu (B).................................. 96
Figure 4.11: PVA/Cu (A) and SMA/Cu DSC (B) thermograms ........................................................... 97
Figure 4.12: ATR-FTIR spectra of PVA, PVA/Cu (A) and SMA, SMA/Cu (B).................................. 98
Figure 4.13: Pathogen viability (expressed in log CFU/mL) over 30 minutes of direct contact with
PVA/Cu (A) and SMA/Cu nanofibres. ................................................................................................ 100
Figure 4.14: Antimicrobial activity demonstrated by PVA/Cu and SMA/Cu on mixed-culture cells. 101
Figure 4.15: Fluorescence Microscopy images showing bacteria on pristine PVA nanofibres (A),
pristine SMA nanofibres, PVA/Cu nanofibres (B) and SMA/Cu nanofibres. ..................................... 104
Figure 4.16: Antimicrobial effectiveness of PVA/Cu and SMA/Cu over six cycles .......................... 105
Figure 4.17: Morphological changes on PVA/Cu (A) and SMA/Cu nanofibre mats after six cycles. 105
Figure 4.18: Leaching of Cu2+
ions from PVA/Cu and SMA/Cu nanofibres over 24 hours. .............. 106
Stellenbosch University http://scholar.sun.ac.za
List of figures
xvii
Figure 4.19: PVA/Cu nanofibres before (A) and after (B) water immersion. SMA/Cu nanofibres
before (C) and after (D) water immersion. .......................................................................................... 107
Figure 5.1: Basic structures of furan and 3(2H)-furanone................................................................... 114
Figure 5.2: Antibiofouling characterization outline ............................................................................ 117
Figure 5.3: 1HNMR spectra for the synthesis of 5-(2-(2-aminoethoxy)ethoxy)methyl)-2(5H)furanone.
............................................................................................................................................................. 123
Figure 5.4: 1HNMR spectra for the synthesis of 4-(2-(2-aminoethoxy)-2,5-dimethyl-3(2H)-furanone
............................................................................................................................................................. 124
Figure 5.5: Electron spray-mass spectra of 5-(2-(2-aminoethoxy)ethoxy)methyl)-2(5H)furanone (A)
and 4-(2-(2-aminoethoxy)-2,5-dimethyl-3(2H)-furanone (B). ............................................................ 125
Figure 5.6: Nanofibre diameters of PVA/DMHF (A), SMA/Furanone 1 (B) and SMA/Furanone 2 (C).
............................................................................................................................................................. 126
Figure 5.7: Pore sizes on PVA/DMHF (A), SMA/Furanone 1 (B) and SMA/Furanone 2 (C) nanofibre
mats. .................................................................................................................................................... 127
Figure 5.8: ATR-FTIR spectra of PVA/DMHF nanofibres. ............................................................... 128
Figure 5.9: ATR-FTIR of SMA/Furanone. ......................................................................................... 129
Figure 5.10: TGA thermograms of PVA/DMHF (A) and SMA/Furanone (B). .................................. 130
Figure 5.11:DSC themograms of PVA/DMHF (A), SMA/Furanone 1 (B) and SMA/Furanone 2 (C)131
Figure 5.12: Antimicrobial (A) and antifouling (B) potential of free 2,5-dimethyl-4-hydroxy-3(2H)-
furanone over 30 minutes and 36 hours respectively. ......................................................................... 133
Figure 5.13: Antimicrobial (A) and antifouling (B) potential of free 5-(2-(2-
aminoethoxy)ethoxy)methyl)-2(5H)furanone over 30 minutes and 36 hours respectively. ................ 134
Figure 5.14: Antimicrobial (A) and antifouling (B) potential of free 4-(2-(2-aminoethoxy)-2,5-
dimethyl-3(2H)-furanone over 30 minutes and 36 hours respectively. ............................................... 134
Figure 5.15: Antimicrobial and antifouling potential of free furanones on mixed cultures ................ 134
Figure 5.16: Antimicrobial (A) and antifouling (B) potential of PVA/DMHF nanofibres over 30
minutes and 36 hours respectively. ..................................................................................................... 135
Figure 5.17: Antimicrobial (A) and antifouling (B) potential of PVA/DMHF nanofibres on mixed
cultures over 30 minutes and 36 hours respectively. ........................................................................... 136
Figure 5.18: Antimicrobial (A) and antifouling (B) potential of SMA/Furanone 1 nanofibres over 30
minutes and 36 hours respectively. ..................................................................................................... 137
Figure 5.19: Antimicrobial (A) and antifouling (B) potential of SMA/Furanone 2 nanofibres over 30
minutes and 36 hours respectively. ..................................................................................................... 137
Figure 5.20: Antimicrobial (A) and inhibition (B) tests of immobilized furanones. ........................... 138
Figure 5.21: In vivo images ................................................................................................................. 139
Figure 5.22: Fluorescent microscopy images. ..................................................................................... 140
Stellenbosch University http://scholar.sun.ac.za
List of figures
xviii
Figure 5.23: Antimicrobial (A) and colonization inhibition (B) of mixed strains on furanone containing
nanofibres. ........................................................................................................................................... 141
Figure 5.24: PVA/DMHF (A), SMA/Furanone 1 (B) and SMA/furanone 2 (C) nanofibres after
regeneration tests. ................................................................................................................................ 141
Figure 5.25: GC-MS spectra to ascertain leaching intensity of furanone compounds. ....................... 142
Stellenbosch University http://scholar.sun.ac.za
List of tables
xix
List of Tables
Table 2.1: Membrane separation processes based on driving force. ..................................................... 10
Table 2.2: Developments in membrane technology .............................................................................. 12
Table 2.3: Types of fouling ................................................................................................................... 21
Table 2.4: Biofouling occurrences in different industrial systems. ....................................................... 24
Table 2.5: Major milestones in water treatment. ................................................................................... 25
Table 2.6: Damaging effects of biocides ............................................................................................... 27
Table 2.7: Different methods of producing nanofibres. ........................................................................ 33
Table 2.8: Parameters affecting the process of electrospinning ............................................................ 35
Table 2.9: Specialty filtration applications of nanofibrous media. ........................................................ 39
Table 3.1: Concentrations of individual ions in leachates from three nanofibres with different
AquaQure concentration........................................................................................................................ 62
Table 3.2: Recommended limits for the constituents AquaQure in drinking water .............................. 62
Table 3.3: Antimicrobial activity of PVA/AquaQure fibres demonstrated by IVIS imaging. .............. 75
Table 3.4: Properties of unmodified PVA and PVA/AquaQure nanofibres after water immersion. .... 78
Table 4.1: Electrospinning conditions for the polymers ....................................................................... 91
Table 4.2A: In vivo images to illustrate antimicrobial activity of PVA/Cu nanofibres. ..................... 102
Table 4.3b: In vivo images to illustrate antimicrobial activity of SMA/Cu nanofibres. ...................... 103
Table 4.4: Properties of pristine and Cu2+
modified PVA and SMA nanofibres after water immersion.
............................................................................................................................................................. 107
Table 5.1: Electrospinning conditions ................................................................................................. 122
Stellenbosch University http://scholar.sun.ac.za
List of schemes
xx
List of Schemes
Scheme 6.1: Crosslinking of PVA with glyoxal.
Scheme 6.2: Synthesis of 5-(2-(2-aminoethoxy)ethoxy)methyl)-2(5H)furanone.
Scheme 6.3: Synthesis of 4-(2-(2-aminoethoxy)-2,5-dimethyl-3(2H)-furanone
Scheme 6.4: Immobilization of furanone derivatives on SMA copolymer backbone.
Stellenbosch University http://scholar.sun.ac.za
List of abbreviations
xxi
List of Abbreviations
AA Acrylic acid
AHL N-Acyl homoserine lactone
ATP Adenosine triphosphate
ATR-FTIR Attenuated total reflectance-Fourier transform Infra red spectroscopy
BC Before Christ
BLI Bioluminescence imaging
CA Cellulose acetate
CFU colony forming units
DCM Dichloromethane
DMF Dimethylformamide
DMHF 2,5 dimethyl-4-hydroxy-3(2H)-furanone
DMSO dimethylsulfooxide
DSC Differential scanning calorimetry
EDCs Endocrine disrupting compounds
EDTA Ethylenediamine-N,N,N',N'-tetraacetic Acid
EPS Extra polymeric substances
ES Electrospinning
ES-MS Electron spray-mass spectroscopy
EU European Union
FRP Free radical polymerization
GC-MS Gas chromatograph coupled mass spectroscopy
HEMA 2-hydroxyethyl methacrylate
ICP-AES Inductive coupled plasma-atomic emission spectroscopy
IR Infrared spectroscopy
IVIS in vivo imaging system
MeOH Methanol
MF Microfiltration
MIC Minimum inhibitory concentration
Na2S2O3 Sodium thiosulfate
NaOH Sodium hydroxide
NF Nanofiltration
NMR Nuclear magnetic resonance spectroscopy
PA Polyamide
PAAm Polyacrylamide
Stellenbosch University http://scholar.sun.ac.za
List of abbreviations
xxii
PAN Polyacrylonitrile
PCL Polycaprolactone
PE Polyethylene
PEG Polyethylene glycol
PEI Polyether imide
PP Polypropylene
PPCPs Pharmaceuticals and personal care products
PTFE Polytetrafluoroethylene
PVA Poly(vinyl alcohol)
PVC Polyvinylchloride
PVDF Poly(vinylidene fluoride)
PVP Poly(vinyl pyrolidine)
QQ Quorum quenching
QS Quorum sensing
QSI Quorum sensing inhibitors
RO Reverse Osmosis
SANS South African National Standards
SEM Scanning electron microscopy
SMA Poly(styrene-co-maleic anhydride)
SPIP Scanning Probe Image Processor
SPME Solid phase micro extraction
SRB Sulphate reducing bacteria
TGA Thermogravimetric analysis
THF Tetrahydrofuran
UF Ultrafiltration
UN United Nations
UV Ultra violet
UV-Vis Ultra violet-visible
VNBC viable but non-culturable
WHO World health organization
XRD X-ray diffraction
Stellenbosch University http://scholar.sun.ac.za
Chapter 1
1
Chapter 1: Introduction
1.1 Background information
As the world population continues to grow, water resources are increasingly strained. Many areas
around the world are turning to water reuse to augment their potable water supply. Modern biological
wastewater treatment technologies are capable of removing suspended solids, organic constituents and
nutrients. However, they do not completely remove many constituents of concern such as pathogenic
bacteria and viruses, and traces of pharmaceuticals and personal care products (PPCPs) as well as
endocrine disrupting compounds (EDCs). Membrane technology offers the water industry a simple
and „cost effective‟ treatment technique which can remove not only viruses, but also pharmaceuticals,
personal care products and EDCs. Despite its wide use and promising applicability, membrane
filtration technology remains limited due to fouling.1, 2
Fouling is a term used to describe the loss of throughput of a membrane device as it becomes
chemically or physically changed by the process fluid. In membrane filtration applications, fouling
emanates from the attachment or adherence of solutes onto the membrane surface or internal structure
of the membrane. There are numerous reasons for a molecule, a colloid or a particle to settle on the
membrane surface or inside the pores and to stay there. The main consequence is a change in flux, but
also a change in the apparent porous structure of the membrane. The general trend reported is an
increase of retention in fouled membranes compared to clean ones.3 Based on the conditions causing
membrane fouling, it can be divided into four types namely: inorganic, organic, silting and biofouling.
Of all the types of fouling, biofouling which is caused by the growth of biofilms on membrane
surfaces is the hardest to control.
In the last few years, significant milestones have been achieved in the area of membrane technology
and realization of new organic and inorganic membranes and many academic and industrial research
projects in this area are underway.4 The production of nanofibres is one of the greatest breakthroughs
in the water treatment industry because of the structural properties that these fibres have.5 These
properties include, a high surface to volume ratio which allows a higher adsorption rate of various
trace organics and bacteria for improving water quality, a higher temperature and acid/base tolerance,
longer membrane life span and flexibility which enables the membrane to be formed into various
membrane modules for larger commercial application.6
Several techniques to fabricate nanofibres have been reported and electrostatic spinning or
electrospinning is the most widely used. Electrospinning is a mechanical and electrical technique of
producing ultrafine fibres in the submicron diameter range using high voltage.6 This technique results
Stellenbosch University http://scholar.sun.ac.za
Chapter 1
2
in continuous nanofibres which can be formed into various modules and can be produced on a large
scale.7 Various polymers can be electrospun into fibres using this process. Electrospinning is a well-
established process for fabrication of nanofibre mats with high surface areas, large volume-to-mass
ratios, and high porosities.7-10
This process has been demonstrated to be suitable for scaling up
nanofibre production at a relatively low cost.11
Even though membrane filtration is a promising technology, its large scale industrial applicability is
limited partly due to poor intrinsic membrane properties but largely because of fouling of the
membranes. The use of chemical biocides such as chlorine to control biofouling of membranes is
widespread.12-16
However, most of these chemical biocides are not very effective at higher pH values
and they react with dissolved chemicals to produce harmful byproducts.17
Physical means like pigging,
brushing, swabbing and jetting have been reported, but only work best as secondary methods to other
removal methods.18
The use of bacteriophages,19
electrical current20
and nutrient control 21
have also
been explored but these methods are either host specific or can take a long time to work and are not
very cost effective.
The focus is now moving to modification of membrane surfaces to control fouling. Noble metal
elements such as silver, copper, zinc, nickel, manganese, iron and lithium have been reported to be
having antimicrobial properties.22, 23
Some of these metals have been blended with polymers and made
into fibres for use in filter media, wound dressing and other applications. Silver, has been extensively
studied especially for wound dressing applications due to its antimicrobial nature.24
The use of furanone derivatives which inhibit quorum sensing in microorganisms is an area which has
not been significantly explored in filtration systems. Furanones are analogs of homoserine lactones
that appear to interfere with the development of typical biofilm structure, leaving these organisms
more susceptible to treatment with biocides.25
Targeting QS is also advantageous compared to the use
of antibiotics since there is no risk of the bacteria developing resistance which causes serious control
problems. Many natural products contain the core 3(2H)-furanone structure classified as a lactone.26
Because of the high synthetic and biological importance of furanone compounds, their chemistry has
received considerable attention over the past two decades.27
Furanone moieties have been found to
have various medicinal properties, such as anticancer, cardiotonic, analgesic, antimicrobial, antiviral,
antifungal, and anti-inflammatory properties.28-33
34
Research on clinical applications is widespread but
not much has been reported on filtration applications.
1.2 Motivation
Microbiologically safe drinking water is a scarce resource and many countries do not have sufficient
water supplies to support their populations. With the changes in global climate and population growth,
water will become an even scarcer resource especially in the developing world. Statistics released by
Stellenbosch University http://scholar.sun.ac.za
Chapter 1
3
the World Health Organisation (WHO) on water shortage and the consequences associated with it
indicate that almost a billion people in sub-Saharan Africa and the rest of the developing world lack
access to safe water supplies. An estimate of 3.6 million people in the developing world die each year
from water-related diseases and these are mostly children under the age of 15 years.35
As Diallo said,
“there is little doubt that satisfying humankind‟s demand for water in a sustainable manner requires
visionary new approaches to management and conservation of water resources augmented by new
technologies capable of dramatically reducing the cost of supplying clean fresh water-technologies
that can best be derived from tightly coupled basic and applied research.”36
The application of
conventional water treatment systems in the developing world is in most cases a daunting task due to
lack of infrastructure and skills.37, 38
Furthermore, dwellings of rural communities in the developing
world are scattered over wide areas which makes it almost impossible to pipe water from centralized
purification systems.39-41
The application of membrane nanotechnology especially in point of use
systems could be a viable alternative to providing safe drinking water for these areas. In this particular
study, antimicrobial and antibiofouling nanofibres were fabricated and investigated for possible
application in water filtration media with a possibility of further improvements to achieve industrial
scalability.
1.3 Problem statement
Conventional water purification techniques involve the use of chemicals to clean water and these
practices introduce harmful chemicals to the environment. These techniques also require skilled labour
to operate the infrastructure and high energy is necessary to run the processes involved. This is in most
cases not possible in remote rural areas where there is no electricity and skills. The trend in filtration
plants is now moving towards membrane filtration technologies. Membrane water filtration is a cost
effective and environmentally acceptable method of purifying large volumes of water. Due to these
attributes, it is a viable method to meet the water demands of the growing population. The limitation to
membrane filtration technology is the fouling of membranes which escalates maintenance costs and
compromises water quality. Of all the types of membrane fouling, biological fouling which is fouling
caused by biofilm attachment on membrane surfaces, is the most difficult to control. Researchers have
come up with many solutions to the biofouling problem and most strategies are centred on either
killing the bacteria before they form biofilms (inactivating them) or modifying membrane surfaces to
produce membranes which will not allow biofilm attachment.
1.4 Objectives
The main goal of this study was to develop nanofibres with both antibacterial and anti-biofouling
properties for possible application in filtration media. This means that the fabricated nanofibres should
not only have surfaces which will repel microbial attachment, but also inactivate any bacteria which
Stellenbosch University http://scholar.sun.ac.za
Chapter 1
4
may come into contact with it. The use of biocides containing transition metal elements which have
widely demonstrated antimicrobial activity as well as furanone derivatives which inhibit (prevent)
biofilm formation were explored in this study. The objectives of this study were therefore:
To surface functionalize or modify polymers.
To generate polymer nanofibres using the process of electrospinning.
To determine antimicrobial potential of polymer nanofibres.
To characterize nanofibres.
To assess application in filter media
The dissertation is structured in such a way that, each of the major chapters has its own objective on
how antimicrobial or antibiofouling activity was introduced to pristine polymers that otherwise do not
possess any activity against microorganisms.
1.5 Methodology
This study focused on developing membranes using various durable, non-toxic and water-insoluble
polymers (crosslinked) poly(vinyl alcohol) (PVA) and poly(styrene-co-maleic anhydride) (SMA).
Electrospinnable solutions of the polymers with either a biocide (AquaQure) and/or copper salts to
introduce antimicrobial functionality were prepared and electrospun using conventional needle
electrospinning or bubble electrospinning. Post polymerization crosslinking of PVA using heat
treatment and chemical crosslinking were explored. The nanofibres‟ antimicrobial efficiencies as well
as water stability and leaching degree were tested. In the second part of this project free furanone
compounds as well as nanofibres with immobilized furanone compounds were investigated for their
antimicrobial and antibiofouling activities. Commercially available and synthesized furanone
compounds were investigated.
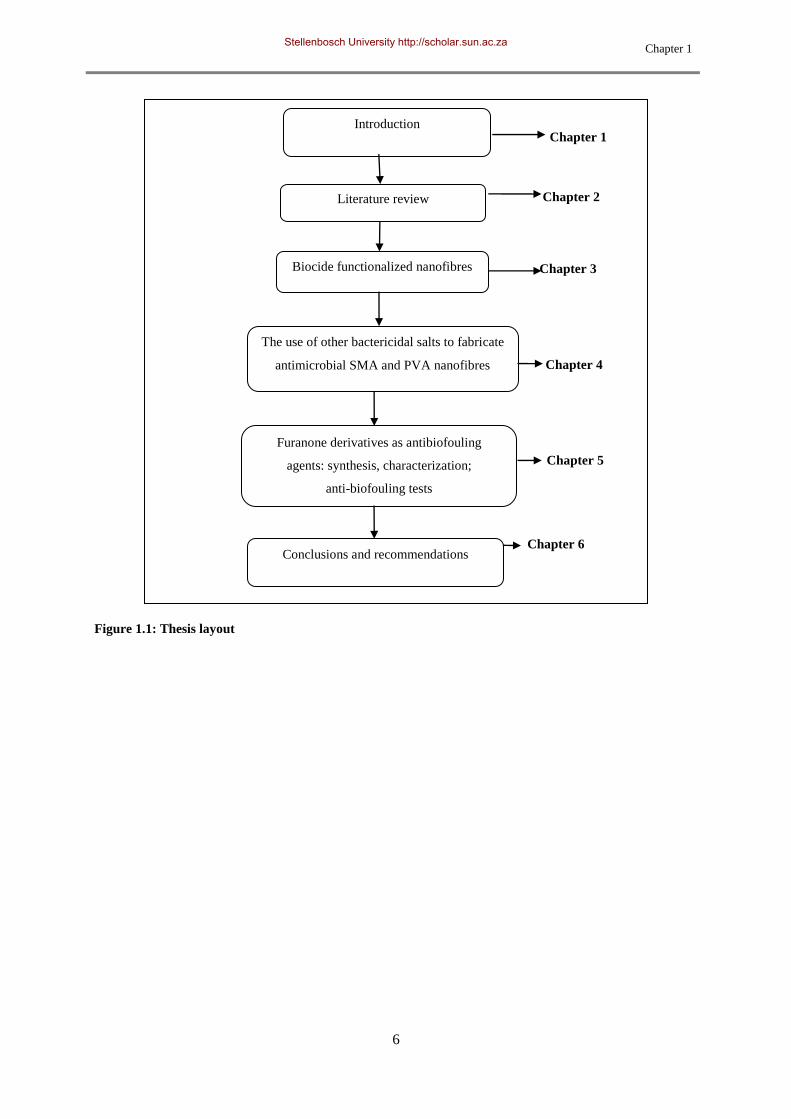
1.6 Structure of thesis
The thesis comprises of six chapters as outlined in Figure 1.1. In Chapter 1 a brief introduction into
membrane technology in water treatment is given. This chapter also highlights the motivation for this
study. The problem statement puts forth the objective of developing antifouling nanofibres to solve the
biofouling problem associated with current membrane filtration. Finally, the research methods adopted
in this study are summarized.
An overall review on the fundamental theory of this study is given in Chapter 2. It describes
membrane technology and then gives a detailed description on how membrane fouling limits its
Stellenbosch University http://scholar.sun.ac.za
Chapter 1
5
application. The second part of this chapter focuses on electrospinning which is the technique used in
this study for producing nanofibres.
In Chapter 3, functionalization of poly (vinyl alcohol) (PVA) with a known Cu containing biocide is
reported. Factors affecting electrospinning of the polymeric solutions are investigated and
characterization of the fibres is reported. The stability of the fibres in water and their antimicrobial
efficiency are also reported.
Chapter 4 reports the fabrication and functionalization of nanofibre mats from PVA and SMA.
Bactericidal copper salts were blended to spinning solutions and electrospun using bubble
electrospinning to produce fibres in the nanometer range. PVA nanofibres were crosslinked through
heat treatment to achieve stability in liquid filter media. Chemical and antimicrobial characterization
of the nanofibres is also reported.
Furanones are known to inhibit quorum sensing and thus inhibit surface colonisation by biofilms. In
chapter 5, a known furanone derivative was incorporated into PVA and electrospun to form fibres with
the furanone functionality. Other furanone derivatives were also synthesized and covalently
immobilised on poly(styrene-co-maleic anhydride) (SMA). The fibres resulting from both
PVA/furanone blend and the synthesized furanone covalently immobilised to SMA were tested for
their antibiofouling efficiencies.
Chapter 6 comprises of general conclusions from the study, a summary of the contribution as well as
recommendations for future research in this field.
Stellenbosch University http://scholar.sun.ac.za
Chapter 1
6
Figure 1.1: Thesis layout
Chapter 1
Chapter 2
Chapter 3
Chapter 6
Chapter 5
Chapter 4
Conclusions and recommendations
Furanone derivatives as antibiofouling
agents: synthesis, characterization;
anti-biofouling tests
The use of other bactericidal salts to fabricate
antimicrobial SMA and PVA nanofibres
Biocide functionalized nanofibres
Introduction
Literature review
Stellenbosch University http://scholar.sun.ac.za
Chapter 1
7
1.7 References
1. Su T.J.; Lu J.R.; Cui Z.F. Membrane Science 2000, 173, 167-178.
2. Cloete TE, V. S., Brozel S, Van Holy A. International Biodeterioration and Biodegradation
1992, 29, 299-341.
3. Noble R.D.; Stern S.A., Membrane Separations Technology: Principles and applications.
1995.
4. Vrouwenvelder JS, W. L., Cornelissen ER, Heijman D, Van Der Kooij SG. Viallefont XD.
Journal of Membrane Science 2007, 287, 94-101.
5. Barker R.W., Membrane Technology and Applicaions. Wiley: 2004.
6. Huang Z-M.; Zhang Y-Z.; Kotaki M.; Ramakrishna S. Composites Science and Technology
2003, 63, 2223-2253.
7. Ramakrishna S.; Fujihara K.; Teo W-E.; Lim T-C.; Ma Z., An Introduction to Electrospinning
and Nanofibres. World Scientific Publishing Co. Pte. Ltd.: Toh Tuck Link, Singapore, 2005.
8. Baji A.; Mai Y-W.; Wong S-C.; Abtahi M.; Chen P. Composites Science and Technology
2010, 70, 703-718.
9. Li D.; Xia Y. Advanced Materials 2004, 16, 1151-1170.
10. Reneker D.H.; Yarin A.L.; Fong H.; Sureeporn K. Journal of Applied Physics 2000, 87, 4531-
4547.
11. Greiner A.; Wendorff J.H. Angew Chem Int Edit 2007, 46, 5670-5703.
12. Chen X.; Stewart P.S. Environmental Science and Technology 1996, 30, 2078-2083.
13. Kramer J.F., Biofilm control with bromo-chloro-dimethylhydantion. In Corrosion NACE
International. Paper number 1277, Houston, Texas, 2001.
14. Vidella H.A. International Biodeterioration and Biodegradation 2002, 49, 259-270.
15. Stewart P.; Roe F.; Rayner J.; Elkins F.G.; Lewandowski Z.; Ochsner U.A.; Hassett D.J.
Applied and Environmental Microbiology 2000, 66, 836-838.
16. Presterl E.; Suchomel M.; Eder M.; Reichmann S.; Lassnigg A.; Graninger W.; Rotter M.
Journal of Antimicrobial Chemotherapy 2007, 60, 417-420.
17. Richards M. Self immobilization of single and combinations of enzymes in spherical particles
and evaluation of their anti-biofouling potential. University of Pretoria, Pretoria, South Africa,
2010.
18. Meyer B. International Biodeterioration and Biodegradation 2003, 51, 249-253.
19. Curtin J.J.; Donlan R.M. Antimicrobial Agents and Chemotherapy 2006, 50, 1268-1275.
20. Van der Borden A.J.; Van der Mei H.C.; Busscher H.J. Journal of Biomedical Material
Research 2004, 68B, 160-164.
Stellenbosch University http://scholar.sun.ac.za
Chapter 1
8
21. Allison DG; Ruiz B; SanJose C; Jaspe A; Gilbert P. FEMS Microbiology Letters 1998, 167,
179-184.
22. Al-Sha‟alan N. Molecules 2007, 12, 1080-1091.
23. Revanasiddappa H.D.; Vijaya B.; Kumar S.L.; Prasad K.S. World Journal of Chemistry 2010,
5, 18-25.
24. Zhuang X.; Cheng B.; Kanga W.; Xua X. Carbohydrate Polymers 2010, 82, 524-527.
25. Baveja J.K.; Willcox M.D.P.; Hume E.B.H.; Kumar N.; Odell R.; Poole-Warren L.A.
Biomaterials 2004, 25, 5003-5012.
26. Pe´rez A.G.; Olı´as R.; Olı´as J.M.; Sanz C. Journal of Agricultural Food Chemistry 1999, 47,
655-658.
27. Mahajan V.A.; Borate H.B.; Wakharkar R.D. Tetrahedron 2006, 62, 1258-1272.
28. Lattmann E.; Ayuko W.O.; Kinchinaton D.; Langley C.A.; Singh H.; Tisdale M.J. Journal of
Pharmacy and Pharmacology 2010, 55, 1259-1265.
29. Khan M.S.; Husain A. Pharmazie 2002, 57, 448-452.
30. Leite L.; Jansone M.; Veveris M.; Cirule H.; Popelis Y.; Melikyan G.; Avetisyan A.; Lukevics
E. European Journal of Medical chemistry 1999, 34, 859-865.
31. Klunk W.E.; Covey D.F.; Ferrendelli J.A. Molecular Pharmacology 1982, 22, 438-443.
32. Ali A.M.; Shahram H.; Jamshid C.; Ghadam Ali K.; Farshid H.; Fen-Tair L.; Tai W.L.; Kak-
Shan S.; Chi-Feng Y.; Moti L.J.; Ramasamy K.; Cuihua X.; Manijeh P.; Gholam H.
Bioorganic & Medicinal Chemistry Letters 2003, 11, 4303-4313.
33. Wu H.; Song Z.; Hentzer M.; Andersen J.B.; Molin S.; Givskov M.; Høiby N. Journal of
Antimicrobial Chemotherapy 2004, 53, 1054-1061.
34. Gottesdiener K.; Mehlisch D.R.; Huntington M; Yuan W.; Brouwn P.; Gertz B.; Mills S.
Clinical therapeutics 1999, 21, 1301-1312.
35. Prüss-Üstün A.; Bos R.; Gore F. Safer water, better health: Costs, benefits and sustainability
of interventions to protect and promote health; World Health Organization: Geneva, 2008.
36. Savage N.; Diallo M.; Duncan J.; Street A.; Rustich R., Nanotechnology applications for
clean water. William Andrew Inc.: Norwich, NY, 2009.
37. Yu X.; Zhang S.; Zhang H. The Status and Challenges of Water Infrastructure Development
in China; Institute of Urban Environment, Chinese Academy of Sciences: Xiamen, China,
2008.
38. Sengupta B.; Kumar P.; Ansari P.M.; Basu D.D.; Thirumurthy G.; Sharma A.; Gayithri H.V.
Status of water treatment plants in india; Central Pollution Control Board (Ministry of
Environment and Forests): India, 2009.
39. Swartz C.D. A planning framework to position Rural water treatment in south Africa for the
future Water Research Commission: WRC Report No. TT 419/09: South Africa, 2009.
40. Momba MNB.; Tyafa Z.; Makala N.; Brouckaert B.M.; Obi C.L. Water SA 2006, 32, 715-720.
Stellenbosch University http://scholar.sun.ac.za
Chapter 1
9
41. Mandri-Perrott C. OBA Aproaches 2008, 21.
Stellenbosch University http://scholar.sun.ac.za
Chapter 3
10
Chapter 2: Literature review
2.1 Chapter summary
In this chapter, a review on the fundamental theory and historical milestones related to this study are
given. Membrane technology and its application in water treatment are described as well as a detailed
description on how membrane biofouling limits its application. Current strategies to control fouling
are also discussed. New advancements in membrane technology have seen the rise in the use of
nanotechnology to produce ultrafine fibres known as nanofibres through the electrospinning process
for use in filter media. The second part of this chapter focuses on the production of nanofibres through
electrospinning giving advantages of this process over other techniques which have been reported to
fabricate nanofibres. It also gives an overview on how this process and resultant fibres can be
manipulated to produce fibres with beneficial properties which the original polymers did not have.
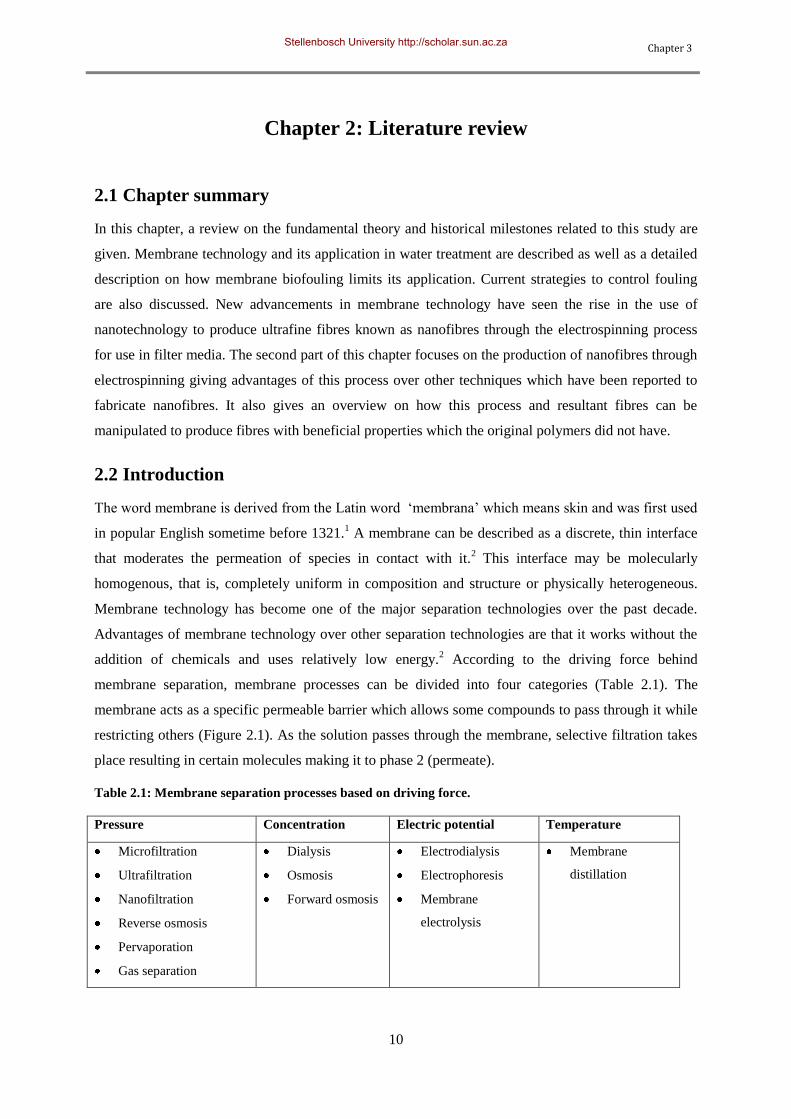
2.2 Introduction
The word membrane is derived from the Latin word „membrana‟ which means skin and was first used
in popular English sometime before 1321.1 A membrane can be described as a discrete, thin interface
that moderates the permeation of species in contact with it.2 This interface may be molecularly
homogenous, that is, completely uniform in composition and structure or physically heterogeneous.
Membrane technology has become one of the major separation technologies over the past decade.
Advantages of membrane technology over other separation technologies are that it works without the
addition of chemicals and uses relatively low energy.2 According to the driving force behind
membrane separation, membrane processes can be divided into four categories (Table 2.1). The
membrane acts as a specific permeable barrier which allows some compounds to pass through it while
restricting others (Figure 2.1). As the solution passes through the membrane, selective filtration takes
place resulting in certain molecules making it to phase 2 (permeate).
Table 2.1: Membrane separation processes based on driving force.
Pressure Concentration Electric potential Temperature
Microfiltration
Ultrafiltration
Nanofiltration
Reverse osmosis
Pervaporation
Gas separation
Dialysis
Osmosis
Forward osmosis
Electrodialysis
Electrophoresis
Membrane
electrolysis
Membrane
distillation
Stellenbosch University http://scholar.sun.ac.za
Chapter 3
11
Phase 1 Phase 2Membrane
Feed
Large molecule
Small molecule
……………….
.
Permeate
Driving force
Phase 1 Phase 2 Membrane
Feed
Large molecules
Small molecule
……………….
.
Permeate
Driving force
∆C, ∆P, ∆T, ∆E
Figure 2.1: Principle of membrane operation.2
2.2.1 Historical development of membranes
Although membranes have existed and functioned in nature as long as life has existed on earth, there
are no references to their applications until the middle of the eighteenth century. Thus, systematic
studies on membranes can be dated back to the eighteenth century. In 1748 Jean-Antoine Nollet
described the word „osmosis‟ as the permeation of water through a diaphragm. Through research in the
nineteenth and early twentieth centuries, membranes were used as laboratory tools to develop
physical/chemical theories, but did not have any industrial or commercial uses. Since the first
synthetic membranes became available approximately 50 years ago, the industry has grown
enormously.2, 3
The historical milestones in membrane technology are highlighted in Table 2.2. A
breakthrough as far as industrial membrane applications are concerned was achieved by the
development of cellulose acetate (CA) membranes by the Dreyfus brothers, which later made reverse
osmosis (RO) a commercial reality. By the early 1980‟s, large plants based on a range of technologies
were in operation around the world.2
Stellenbosch University http://scholar.sun.ac.za
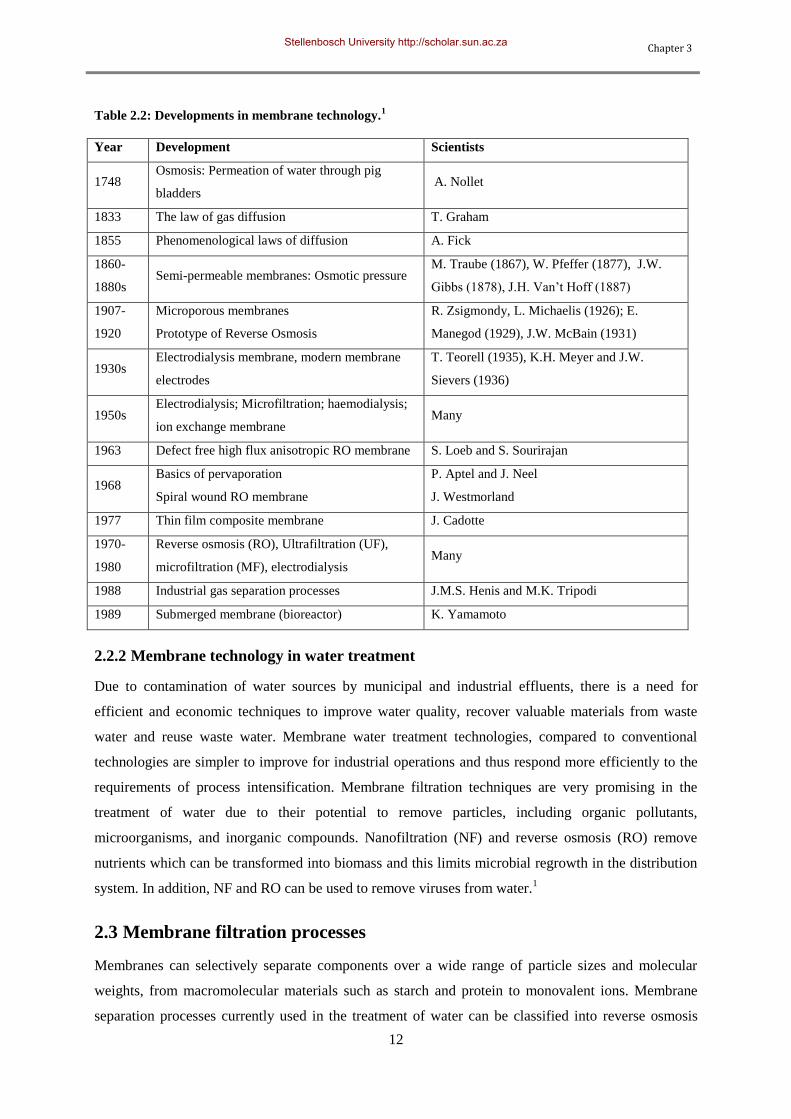
Chapter 3
12
Table 2.2: Developments in membrane technology.1
Year Development Scientists
1748 Osmosis: Permeation of water through pig
bladders A. Nollet
1833 The law of gas diffusion T. Graham
1855 Phenomenological laws of diffusion A. Fick
1860-
1880s Semi-permeable membranes: Osmotic pressure
M. Traube (1867), W. Pfeffer (1877), J.W.
Gibbs (1878), J.H. Van‟t Hoff (1887)
1907-
1920
Microporous membranes
Prototype of Reverse Osmosis
R. Zsigmondy, L. Michaelis (1926); E.
Manegod (1929), J.W. McBain (1931)
1930s Electrodialysis membrane, modern membrane
electrodes
T. Teorell (1935), K.H. Meyer and J.W.
Sievers (1936)
1950s Electrodialysis; Microfiltration; haemodialysis;
ion exchange membrane Many
1963 Defect free high flux anisotropic RO membrane S. Loeb and S. Sourirajan
1968 Basics of pervaporation
Spiral wound RO membrane
P. Aptel and J. Neel
J. Westmorland
1977 Thin film composite membrane J. Cadotte
1970-
1980
Reverse osmosis (RO), Ultrafiltration (UF),
microfiltration (MF), electrodialysis Many
1988 Industrial gas separation processes J.M.S. Henis and M.K. Tripodi
1989 Submerged membrane (bioreactor) K. Yamamoto
2.2.2 Membrane technology in water treatment
Due to contamination of water sources by municipal and industrial effluents, there is a need for
efficient and economic techniques to improve water quality, recover valuable materials from waste
water and reuse waste water. Membrane water treatment technologies, compared to conventional
technologies are simpler to improve for industrial operations and thus respond more efficiently to the
requirements of process intensification. Membrane filtration techniques are very promising in the
treatment of water due to their potential to remove particles, including organic pollutants,
microorganisms, and inorganic compounds. Nanofiltration (NF) and reverse osmosis (RO) remove
nutrients which can be transformed into biomass and this limits microbial regrowth in the distribution
system. In addition, NF and RO can be used to remove viruses from water.1
2.3 Membrane filtration processes
Membranes can selectively separate components over a wide range of particle sizes and molecular
weights, from macromolecular materials such as starch and protein to monovalent ions. Membrane
separation processes currently used in the treatment of water can be classified into reverse osmosis
Stellenbosch University http://scholar.sun.ac.za
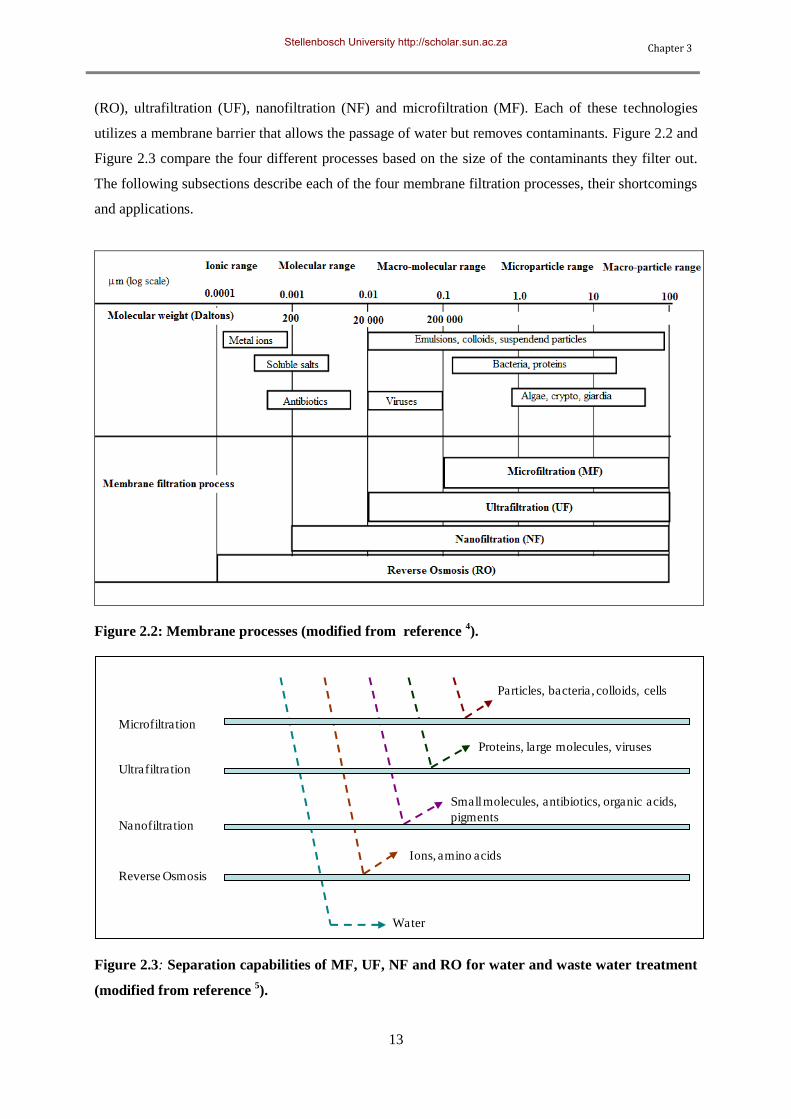
Chapter 3
13
(RO), ultrafiltration (UF), nanofiltration (NF) and microfiltration (MF). Each of these technologies
utilizes a membrane barrier that allows the passage of water but removes contaminants. Figure 2.2 and
Figure 2.3 compare the four different processes based on the size of the contaminants they filter out.
The following subsections describe each of the four membrane filtration processes, their shortcomings
and applications.
Figure 2.2: Membrane processes (modified from reference 4).
Particles, bacteria, colloids, cells
Proteins, large molecules, viruses
Small molecules, antibiotics, organic acids,
pigments
Ions, amino acids
Water
Microfiltration
Ultrafiltration
Nanofiltration
Reverse Osmosis
Figure 2.3: Separation capabilities of MF, UF, NF and RO for water and waste water treatment
(modified from reference 5).
Stellenbosch University http://scholar.sun.ac.za
Chapter 3
14
2.3.1 Microfiltration (MF)
Microfiltration (MF) membranes have the largest pore sizes compared to the other pressure driven
membrane filtration processes outlined in Table 2.1. A low pressure of between 1 and 2 bars is applied
to the feed during the process.6 MF is used for separating colloidal and suspended particles in the
range of 0.1-5 microns. MF has also been considered as a pretreatment method for RO systems instead
of existing physical and chemical treatment methods such as lime clarification and multimedia
filtration.7 MF can be implemented in many different water treatment and industrial processes where
particles with a diameter greater than 0.1 mm need to be removed from a liquid.8 Applications of MF
in industry include: clarification of fermentation broth and biomass recovery. In the beverage industry
MF membranes are used to sterilize beer and wines and also to clear fruit juices. MF is also used in
separation of bacteria from water (biological wastewater treatment), separation of oil/ water
emulsions, pre-treatment of water for NF or RO. MF removes micron-sized entities like cells, colloids,
some bacteria and suspended solids. It however does not remove ions, viruses and low molecular
weight organics (Figure 2.2).
2.3.2 Ultrafiltration (UF)
Ultrafiltration (UF) is a selective fractionation process utilizing pressures up to 1 bar. In UF,
suspended solids and solutes of molecular weight greater than 1,000 are concentrated. The UF
membrane pore diameters are in the range 10-3
-10 μm. The permeate contains low-molecular-weight
organic solutes and salts. UF is widely used in the fractionation of milk and whey, and also finds
application in protein fractionation. It is also used in the textile 9 and metal industry (oil/ water
emulsions separation and paint treatment).10-13 These membranes are usually made from cellulose
acetate (CA) and crosslinked polyamide. CA ultrafiltration membranes are resistant to chlorine and
oxidation.1 They are also inexpensive when compared to those made from polyamide. CA
ultrafiltration membranes are however limited due to their susceptibility to hydrolysis and biological
attachment. The advantages of polyamide on the other hand include high fluxes and salt rejections.
Polyamide UF membranes also have a wide temperature and pH tolerance compared to CA
membranes. The major drawbacks of polyamide membranes include their reduced resistance to
chlorine and increased susceptibility to oxidation.1
2.3.3 Nanofiltration (NF)
Nanofiltration (NF), which emerged in the mid-1980s, is a pressure driven process that represents the
transition between ultrafiltration (UF) and reverse osmosis (RO).14
Many separation problems can be
solved economically by nanofiltration alone or in combination with other separation processes. For
this reason, NF has been widely applied in many industrial fields, such as food and pharmaceutical
industries,15
textile wastewater reuse16
and the regeneration of pulp and paper wastewater.17
NF has
also demonstrated efficient removal of dyes and colour 18-20
Nanofiltration can also be used to perform
Stellenbosch University http://scholar.sun.ac.za
Chapter 3
15
separation applications that are not otherwise economically feasible for NF and RO, such as
demineralization, colour removal, softening and desalination.21
As illustrated in Figure 2.2, on top of
the molecules which can be removed by MF and UF, NF membranes remove all multivalent ions and
amino acids.22, 23
However, the permeate in NF membranes contains monovalent ions and low-
molecular-weight organic solutes like alcohols. One of the major drawbacks in NF membranes is the
lack of reproducibility of the membrane pore size and pore size distribution.1
2.3.4 Reverse osmosis (RO)
The first membrane to be discovered was an osmosis membrane by Nollet in the 16th century. This
then shows that the concepts of osmosis and reverse osmosis (RO) have been around for centuries. A
lot of research was done on these membranes over the following centuries.1From these studies came
what can be referred to as one of the largest milestones in membrane technology to date, which is the
development of cellulose acetate (CA) membranes in the 1950‟s. CA membranes later made RO a
commercial reality and also grew the membrane filtration industry enormously over the past 60 years.
RO is a high-pressure technique and has been used in the concentration of low-molecular-weight
substances in solution and in the purification of wastewater. Another major application of RO is in the
desalination of seawater.24-27
It has the capability to remove almost all water pollutants including
monovalent ions (Figure 2.2).
RO systems can be used to remove both organic and inorganic pollutants simultaneously.28
They also
allow recovery of waste process streams without affecting the material being recovered.28
As
illustrated in Figure 2.2, RO removes not only particulate matter but also mineral ions from water.5
This becomes a drawback in cases where people do not have access to adequate diets and depend on
water to get necessary minerals like calcium.
2.4 Membrane materials
Membranes may be composed of natural, e.g. cellulose acetate (CA) or synthetic materials. Synthetic
membrane materials include organic and inorganic materials such as organic and homogenous films,
homogenous films (polymers), heterogeneous solids (polymeric mixes and mixed glasses) and liquids.
Currently most commercial membranes are made from polymeric materials.29
To be used as
membrane materials, these polymers should demonstrate thermal stability over a wide range of
temperatures and chemical stability over a wide pH range.29, 30
They should also possess good
mechanical strength, be good film formers, manage high permeate flows, have high selectivity, have
good chemical and bacteriological resistance, be resistant to detergents and disinfectants and also be
inexpensive. Early commercial membranes were based on cellulose acetate (CA) and polysulfone.2, 29,
31 Nowadays, the number of polymers being used in membrane materials has increased considerably.
Stellenbosch University http://scholar.sun.ac.za
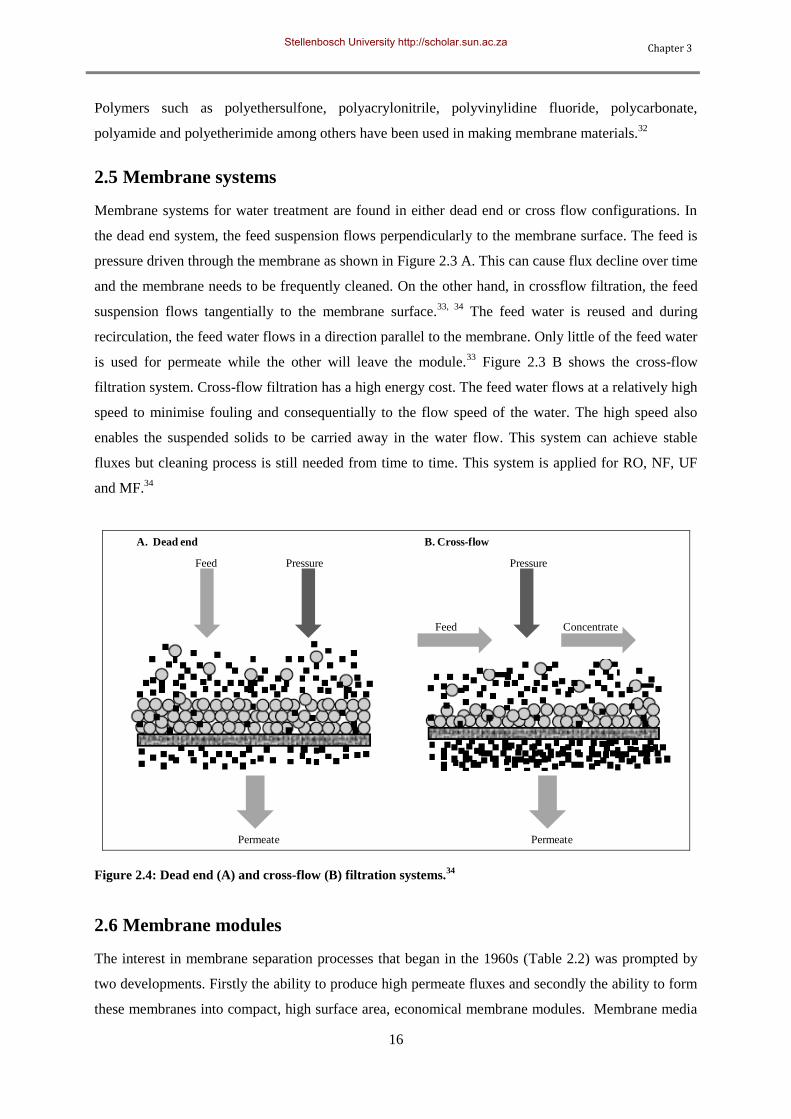
Chapter 3
16
Polymers such as polyethersulfone, polyacrylonitrile, polyvinylidine fluoride, polycarbonate,
polyamide and polyetherimide among others have been used in making membrane materials.32
2.5 Membrane systems
Membrane systems for water treatment are found in either dead end or cross flow configurations. In
the dead end system, the feed suspension flows perpendicularly to the membrane surface. The feed is
pressure driven through the membrane as shown in Figure 2.3 A. This can cause flux decline over time
and the membrane needs to be frequently cleaned. On the other hand, in crossflow filtration, the feed
suspension flows tangentially to the membrane surface.33, 34
The feed water is reused and during
recirculation, the feed water flows in a direction parallel to the membrane. Only little of the feed water
is used for permeate while the other will leave the module.33
Figure 2.3 B shows the cross-flow
filtration system. Cross-flow filtration has a high energy cost. The feed water flows at a relatively high
speed to minimise fouling and consequentially to the flow speed of the water. The high speed also
enables the suspended solids to be carried away in the water flow. This system can achieve stable
fluxes but cleaning process is still needed from time to time. This system is applied for RO, NF, UF
and MF.34
Permeate Permeate
Pressure PressureFeed
Feed Concentrate
A. Dead end B. Cross-flow
Figure 2.4: Dead end (A) and cross-flow (B) filtration systems.34
2.6 Membrane modules
The interest in membrane separation processes that began in the 1960s (Table 2.2) was prompted by
two developments. Firstly the ability to produce high permeate fluxes and secondly the ability to form
these membranes into compact, high surface area, economical membrane modules. Membrane media
Stellenbosch University http://scholar.sun.ac.za
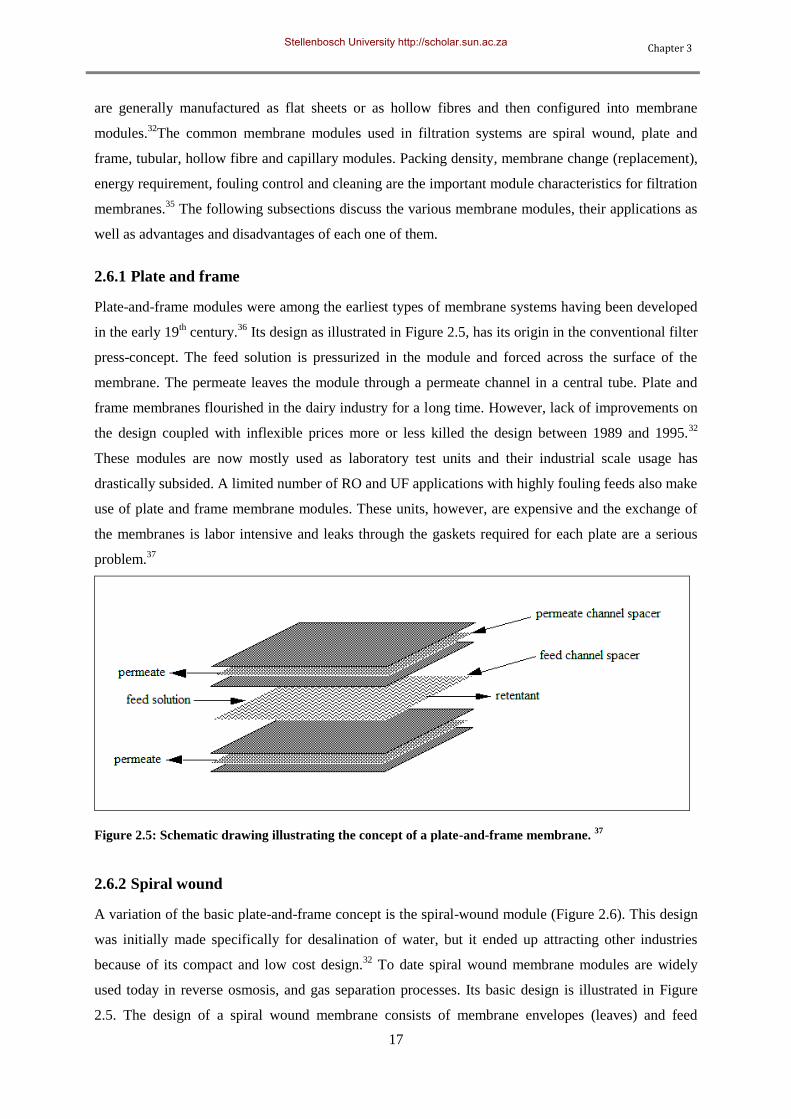
Chapter 3
17
are generally manufactured as flat sheets or as hollow fibres and then configured into membrane
modules.32
The common membrane modules used in filtration systems are spiral wound, plate and
frame, tubular, hollow fibre and capillary modules. Packing density, membrane change (replacement),
energy requirement, fouling control and cleaning are the important module characteristics for filtration
membranes.35
The following subsections discuss the various membrane modules, their applications as
well as advantages and disadvantages of each one of them.
2.6.1 Plate and frame
Plate-and-frame modules were among the earliest types of membrane systems having been developed
in the early 19th century.
36 Its design as illustrated in Figure 2.5, has its origin in the conventional filter
press-concept. The feed solution is pressurized in the module and forced across the surface of the
membrane. The permeate leaves the module through a permeate channel in a central tube. Plate and
frame membranes flourished in the dairy industry for a long time. However, lack of improvements on
the design coupled with inflexible prices more or less killed the design between 1989 and 1995.32
These modules are now mostly used as laboratory test units and their industrial scale usage has
drastically subsided. A limited number of RO and UF applications with highly fouling feeds also make
use of plate and frame membrane modules. These units, however, are expensive and the exchange of
the membranes is labor intensive and leaks through the gaskets required for each plate are a serious
problem.37
Figure 2.5: Schematic drawing illustrating the concept of a plate-and-frame membrane. 37
2.6.2 Spiral wound
A variation of the basic plate-and-frame concept is the spiral-wound module (Figure 2.6). This design
was initially made specifically for desalination of water, but it ended up attracting other industries
because of its compact and low cost design.32
To date spiral wound membrane modules are widely
used today in reverse osmosis, and gas separation processes. Its basic design is illustrated in Figure
2.5. The design of a spiral wound membrane consists of membrane envelopes (leaves) and feed
Stellenbosch University http://scholar.sun.ac.za
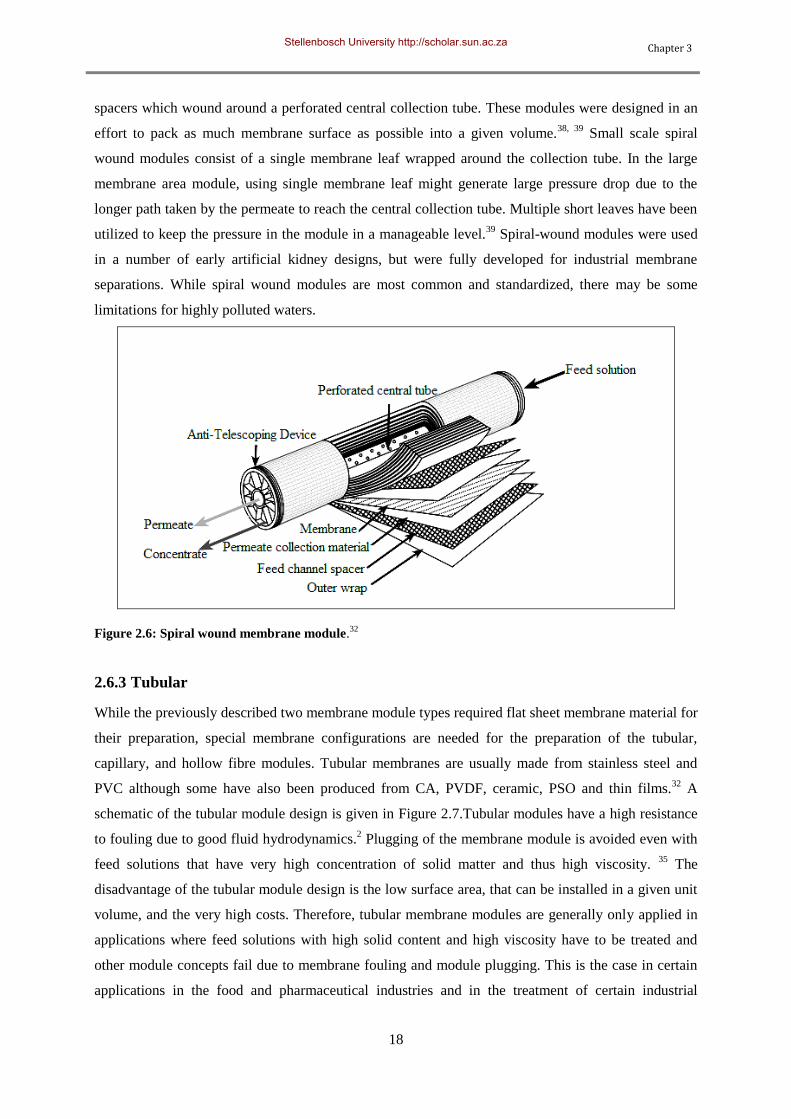
Chapter 3
18
spacers which wound around a perforated central collection tube. These modules were designed in an
effort to pack as much membrane surface as possible into a given volume.38, 39
Small scale spiral
wound modules consist of a single membrane leaf wrapped around the collection tube. In the large
membrane area module, using single membrane leaf might generate large pressure drop due to the
longer path taken by the permeate to reach the central collection tube. Multiple short leaves have been
utilized to keep the pressure in the module in a manageable level.39
Spiral-wound modules were used
in a number of early artificial kidney designs, but were fully developed for industrial membrane
separations. While spiral wound modules are most common and standardized, there may be some
limitations for highly polluted waters.
Figure 2.6: Spiral wound membrane module.32
2.6.3 Tubular
While the previously described two membrane module types required flat sheet membrane material for
their preparation, special membrane configurations are needed for the preparation of the tubular,
capillary, and hollow fibre modules. Tubular membranes are usually made from stainless steel and
PVC although some have also been produced from CA, PVDF, ceramic, PSO and thin films.32
A
schematic of the tubular module design is given in Figure 2.7.Tubular modules have a high resistance
to fouling due to good fluid hydrodynamics.2 Plugging of the membrane module is avoided even with
feed solutions that have very high concentration of solid matter and thus high viscosity. 35
The
disadvantage of the tubular module design is the low surface area, that can be installed in a given unit
volume, and the very high costs. Therefore, tubular membrane modules are generally only applied in
applications where feed solutions with high solid content and high viscosity have to be treated and
other module concepts fail due to membrane fouling and module plugging. This is the case in certain
applications in the food and pharmaceutical industries and in the treatment of certain industrial
Stellenbosch University http://scholar.sun.ac.za
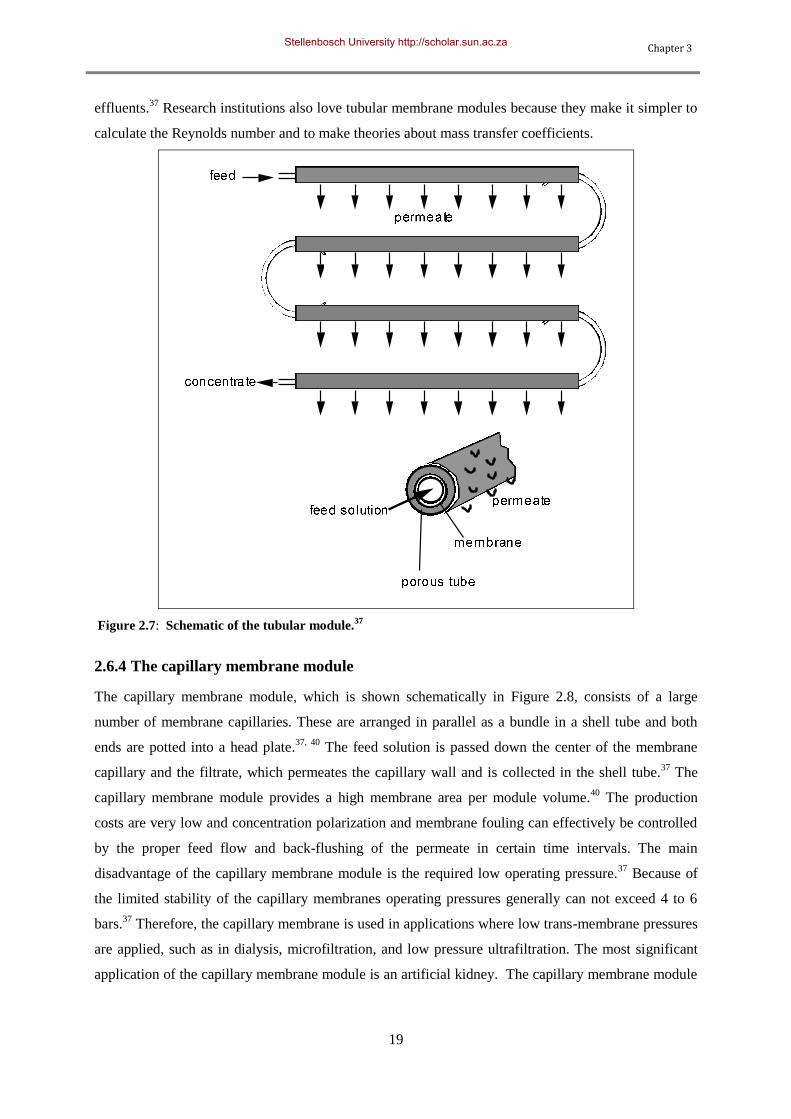
Chapter 3
19
effluents.37
Research institutions also love tubular membrane modules because they make it simpler to
calculate the Reynolds number and to make theories about mass transfer coefficients.
Figure 2.7: Schematic of the tubular module.37
2.6.4 The capillary membrane module
The capillary membrane module, which is shown schematically in Figure 2.8, consists of a large
number of membrane capillaries. These are arranged in parallel as a bundle in a shell tube and both
ends are potted into a head plate.37, 40
The feed solution is passed down the center of the membrane
capillary and the filtrate, which permeates the capillary wall and is collected in the shell tube.37
The
capillary membrane module provides a high membrane area per module volume.40
The production
costs are very low and concentration polarization and membrane fouling can effectively be controlled
by the proper feed flow and back-flushing of the permeate in certain time intervals. The main
disadvantage of the capillary membrane module is the required low operating pressure.37
Because of
the limited stability of the capillary membranes operating pressures generally can not exceed 4 to 6
bars.37
Therefore, the capillary membrane is used in applications where low trans-membrane pressures
are applied, such as in dialysis, microfiltration, and low pressure ultrafiltration. The most significant
application of the capillary membrane module is an artificial kidney. The capillary membrane module
Stellenbosch University http://scholar.sun.ac.za
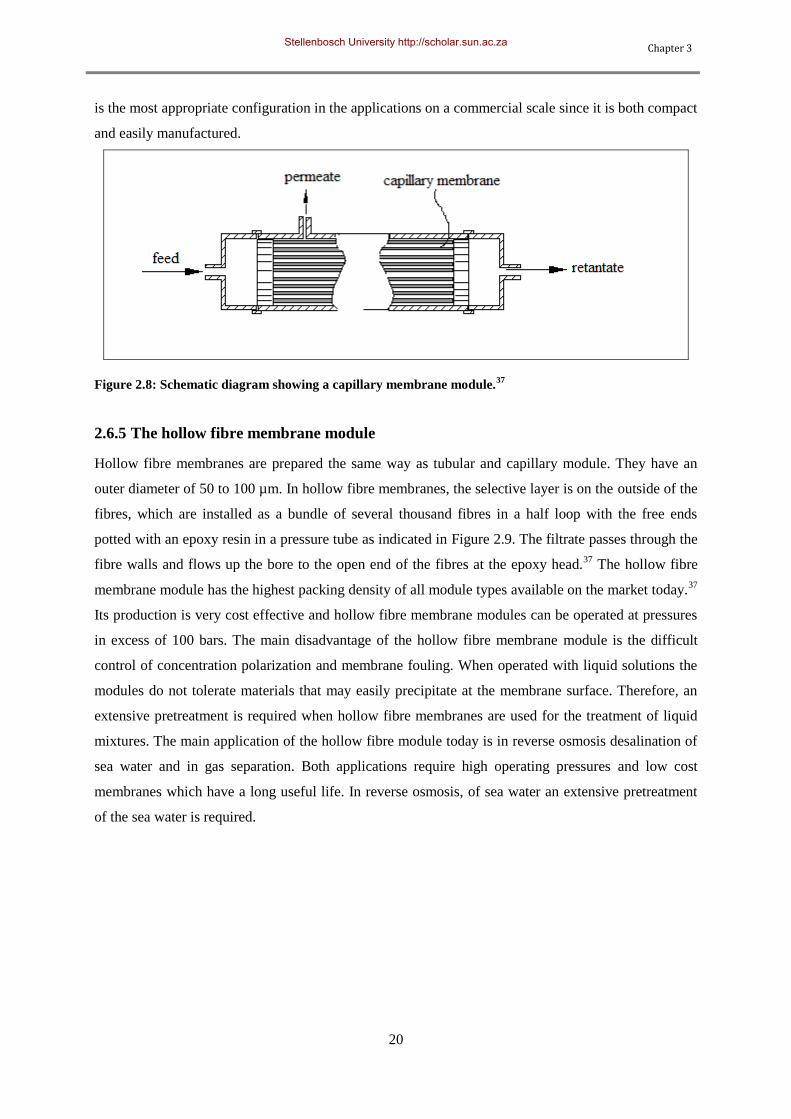
Chapter 3
20
is the most appropriate configuration in the applications on a commercial scale since it is both compact
and easily manufactured.
Figure 2.8: Schematic diagram showing a capillary membrane module.37
2.6.5 The hollow fibre membrane module
Hollow fibre membranes are prepared the same way as tubular and capillary module. They have an
outer diameter of 50 to 100 µm. In hollow fibre membranes, the selective layer is on the outside of the
fibres, which are installed as a bundle of several thousand fibres in a half loop with the free ends
potted with an epoxy resin in a pressure tube as indicated in Figure 2.9. The filtrate passes through the
fibre walls and flows up the bore to the open end of the fibres at the epoxy head.37
The hollow fibre
membrane module has the highest packing density of all module types available on the market today.37
Its production is very cost effective and hollow fibre membrane modules can be operated at pressures
in excess of 100 bars. The main disadvantage of the hollow fibre membrane module is the difficult
control of concentration polarization and membrane fouling. When operated with liquid solutions the
modules do not tolerate materials that may easily precipitate at the membrane surface. Therefore, an
extensive pretreatment is required when hollow fibre membranes are used for the treatment of liquid
mixtures. The main application of the hollow fibre module today is in reverse osmosis desalination of
sea water and in gas separation. Both applications require high operating pressures and low cost
membranes which have a long useful life. In reverse osmosis, of sea water an extensive pretreatment
of the sea water is required.
Stellenbosch University http://scholar.sun.ac.za
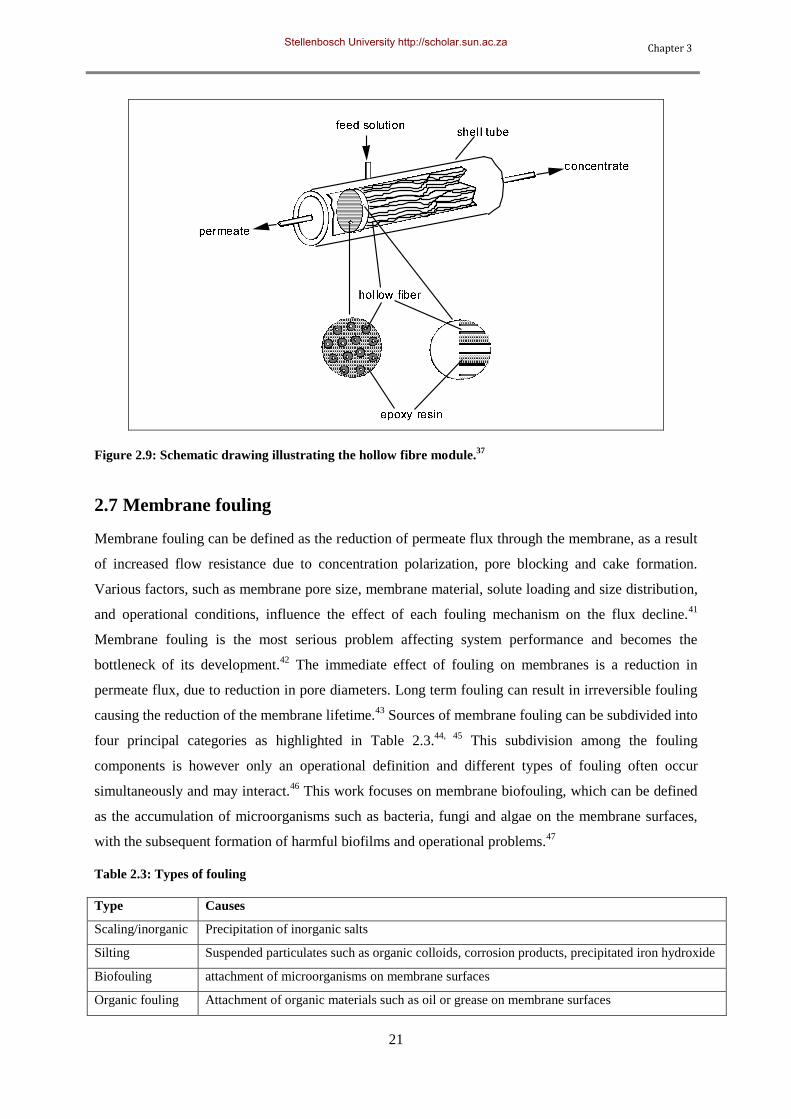
Chapter 3
21
Figure 2.9: Schematic drawing illustrating the hollow fibre module.37
2.7 Membrane fouling
Membrane fouling can be defined as the reduction of permeate flux through the membrane, as a result
of increased flow resistance due to concentration polarization, pore blocking and cake formation.
Various factors, such as membrane pore size, membrane material, solute loading and size distribution,
and operational conditions, influence the effect of each fouling mechanism on the flux decline.41
Membrane fouling is the most serious problem affecting system performance and becomes the
bottleneck of its development.42
The immediate effect of fouling on membranes is a reduction in
permeate flux, due to reduction in pore diameters. Long term fouling can result in irreversible fouling
causing the reduction of the membrane lifetime.43
Sources of membrane fouling can be subdivided into
four principal categories as highlighted in Table 2.3.44, 45
This subdivision among the fouling
components is however only an operational definition and different types of fouling often occur
simultaneously and may interact.46
This work focuses on membrane biofouling, which can be defined
as the accumulation of microorganisms such as bacteria, fungi and algae on the membrane surfaces,
with the subsequent formation of harmful biofilms and operational problems.47
Table 2.3: Types of fouling
Type Causes
Scaling/inorganic Precipitation of inorganic salts
Silting Suspended particulates such as organic colloids, corrosion products, precipitated iron hydroxide
Biofouling attachment of microorganisms on membrane surfaces
Organic fouling Attachment of organic materials such as oil or grease on membrane surfaces
Stellenbosch University http://scholar.sun.ac.za
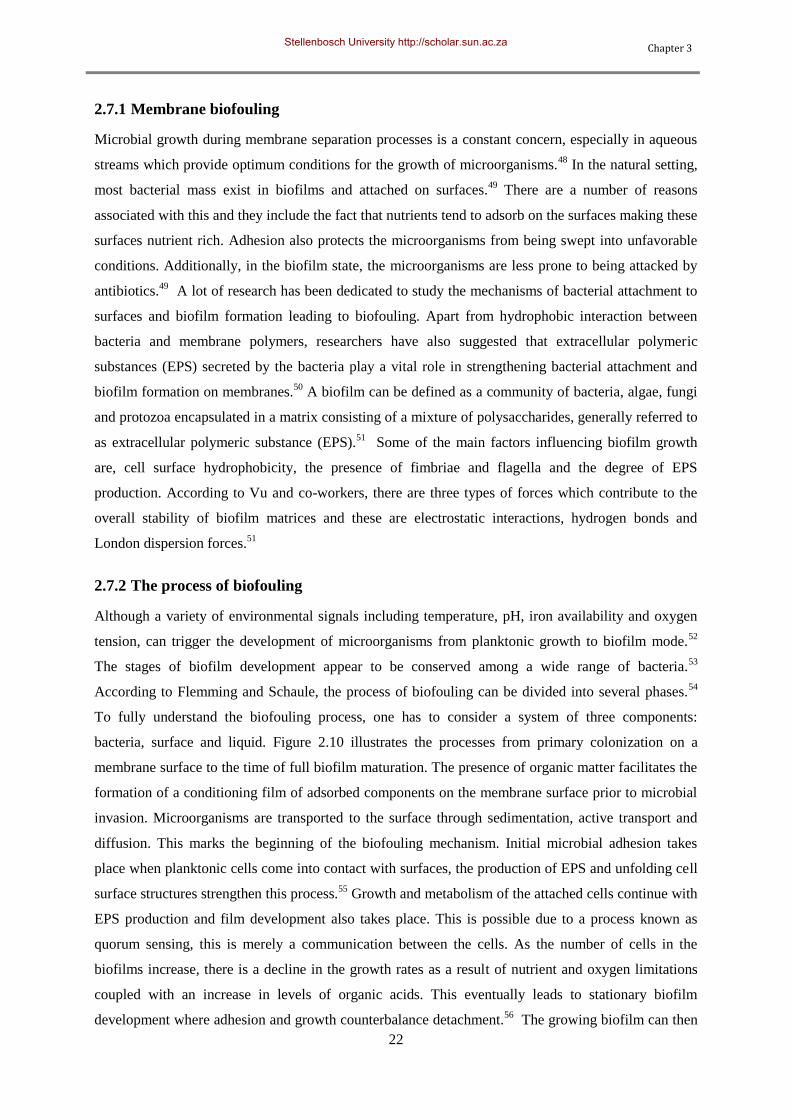
Chapter 3
22
2.7.1 Membrane biofouling
Microbial growth during membrane separation processes is a constant concern, especially in aqueous
streams which provide optimum conditions for the growth of microorganisms.48
In the natural setting,
most bacterial mass exist in biofilms and attached on surfaces.49
There are a number of reasons
associated with this and they include the fact that nutrients tend to adsorb on the surfaces making these
surfaces nutrient rich. Adhesion also protects the microorganisms from being swept into unfavorable
conditions. Additionally, in the biofilm state, the microorganisms are less prone to being attacked by
antibiotics.49
A lot of research has been dedicated to study the mechanisms of bacterial attachment to
surfaces and biofilm formation leading to biofouling. Apart from hydrophobic interaction between
bacteria and membrane polymers, researchers have also suggested that extracellular polymeric
substances (EPS) secreted by the bacteria play a vital role in strengthening bacterial attachment and
biofilm formation on membranes.50
A biofilm can be defined as a community of bacteria, algae, fungi
and protozoa encapsulated in a matrix consisting of a mixture of polysaccharides, generally referred to
as extracellular polymeric substance (EPS).51
Some of the main factors influencing biofilm growth
are, cell surface hydrophobicity, the presence of fimbriae and flagella and the degree of EPS
production. According to Vu and co-workers, there are three types of forces which contribute to the
overall stability of biofilm matrices and these are electrostatic interactions, hydrogen bonds and
London dispersion forces.51
2.7.2 The process of biofouling
Although a variety of environmental signals including temperature, pH, iron availability and oxygen
tension, can trigger the development of microorganisms from planktonic growth to biofilm mode.52
The stages of biofilm development appear to be conserved among a wide range of bacteria.53
According to Flemming and Schaule, the process of biofouling can be divided into several phases.54
To fully understand the biofouling process, one has to consider a system of three components:
bacteria, surface and liquid. Figure 2.10 illustrates the processes from primary colonization on a
membrane surface to the time of full biofilm maturation. The presence of organic matter facilitates the
formation of a conditioning film of adsorbed components on the membrane surface prior to microbial
invasion. Microorganisms are transported to the surface through sedimentation, active transport and
diffusion. This marks the beginning of the biofouling mechanism. Initial microbial adhesion takes
place when planktonic cells come into contact with surfaces, the production of EPS and unfolding cell
surface structures strengthen this process.55
Growth and metabolism of the attached cells continue with
EPS production and film development also takes place. This is possible due to a process known as
quorum sensing, this is merely a communication between the cells. As the number of cells in the
biofilms increase, there is a decline in the growth rates as a result of nutrient and oxygen limitations
coupled with an increase in levels of organic acids. This eventually leads to stationary biofilm
development where adhesion and growth counterbalance detachment.56
The growing biofilm can then
Stellenbosch University http://scholar.sun.ac.za
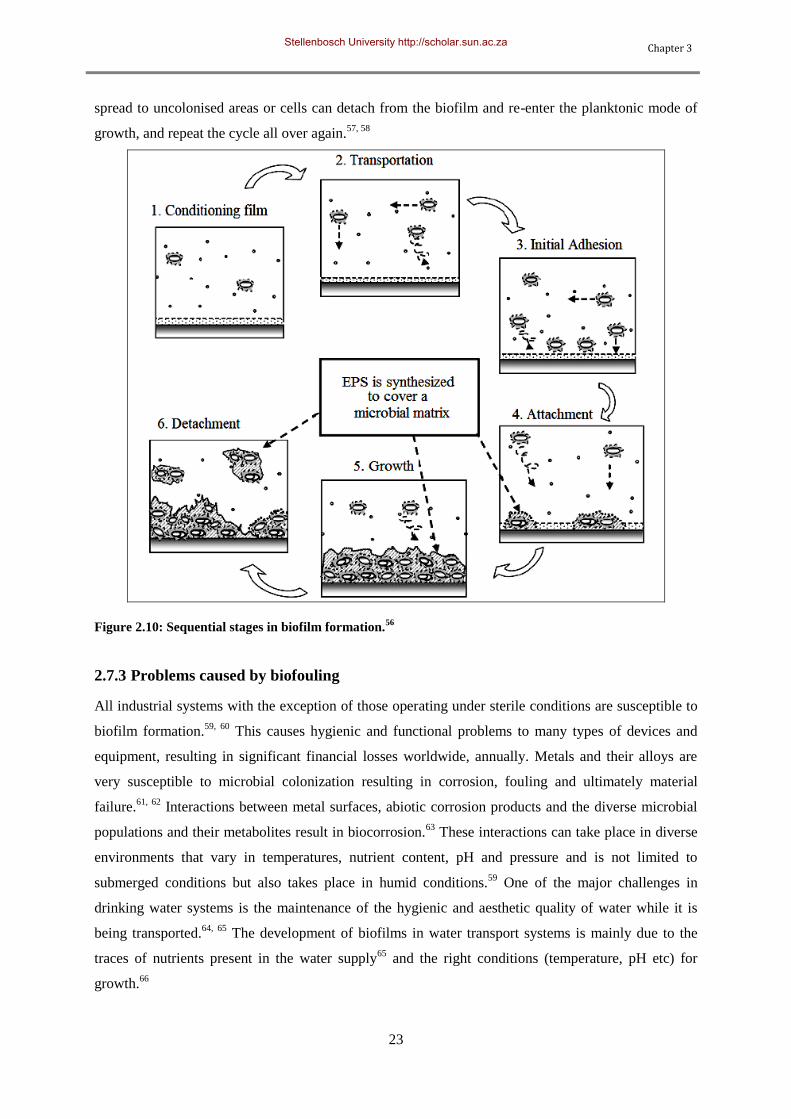
Chapter 3
23
spread to uncolonised areas or cells can detach from the biofilm and re-enter the planktonic mode of
growth, and repeat the cycle all over again.57, 58
Figure 2.10: Sequential stages in biofilm formation.56
2.7.3 Problems caused by biofouling
All industrial systems with the exception of those operating under sterile conditions are susceptible to
biofilm formation.59, 60
This causes hygienic and functional problems to many types of devices and
equipment, resulting in significant financial losses worldwide, annually. Metals and their alloys are
very susceptible to microbial colonization resulting in corrosion, fouling and ultimately material
failure.61, 62
Interactions between metal surfaces, abiotic corrosion products and the diverse microbial
populations and their metabolites result in biocorrosion.63
These interactions can take place in diverse
environments that vary in temperatures, nutrient content, pH and pressure and is not limited to
submerged conditions but also takes place in humid conditions.59
One of the major challenges in
drinking water systems is the maintenance of the hygienic and aesthetic quality of water while it is
being transported.64, 65
The development of biofilms in water transport systems is mainly due to the
traces of nutrients present in the water supply65
and the right conditions (temperature, pH etc) for
growth.66
Stellenbosch University http://scholar.sun.ac.za
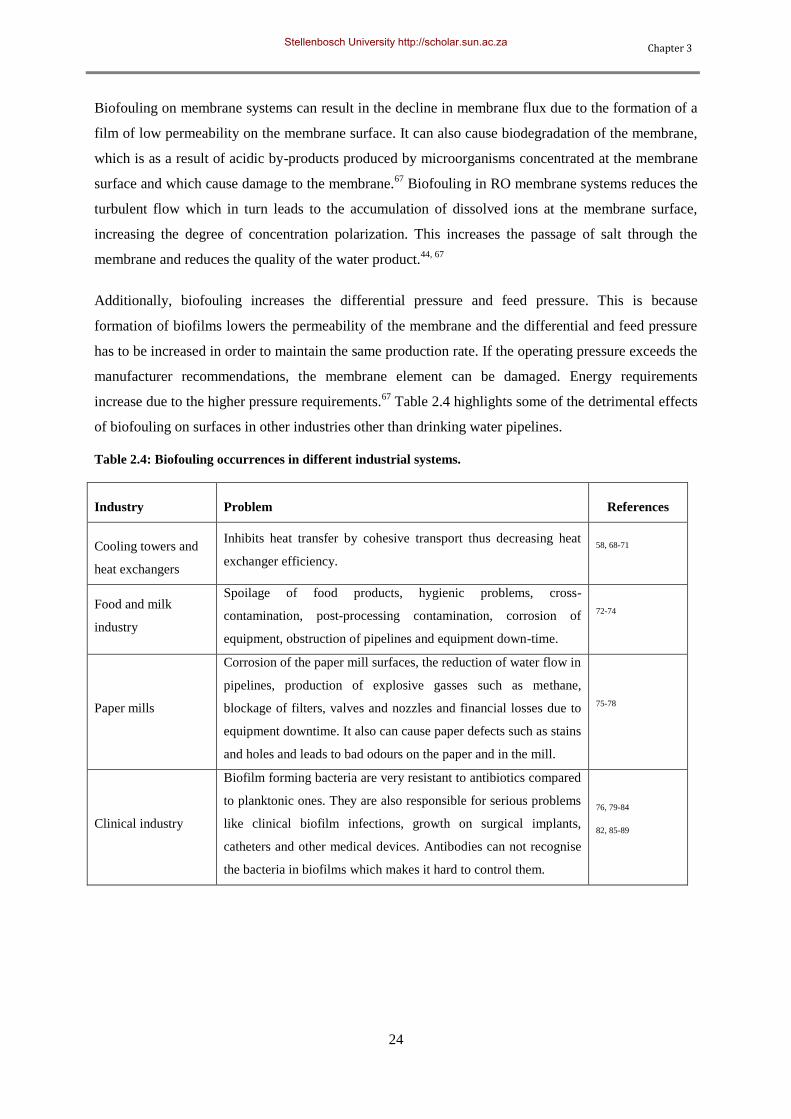
Chapter 3
24
Biofouling on membrane systems can result in the decline in membrane flux due to the formation of a
film of low permeability on the membrane surface. It can also cause biodegradation of the membrane,
which is as a result of acidic by-products produced by microorganisms concentrated at the membrane
surface and which cause damage to the membrane.67
Biofouling in RO membrane systems reduces the
turbulent flow which in turn leads to the accumulation of dissolved ions at the membrane surface,
increasing the degree of concentration polarization. This increases the passage of salt through the
membrane and reduces the quality of the water product.44, 67
Additionally, biofouling increases the differential pressure and feed pressure. This is because
formation of biofilms lowers the permeability of the membrane and the differential and feed pressure
has to be increased in order to maintain the same production rate. If the operating pressure exceeds the
manufacturer recommendations, the membrane element can be damaged. Energy requirements
increase due to the higher pressure requirements.67
Table 2.4 highlights some of the detrimental effects
of biofouling on surfaces in other industries other than drinking water pipelines.
Table 2.4: Biofouling occurrences in different industrial systems.
Industry Problem References
Cooling towers and
heat exchangers
Inhibits heat transfer by cohesive transport thus decreasing heat
exchanger efficiency.
58, 68-71
Food and milk
industry
Spoilage of food products, hygienic problems, cross-
contamination, post-processing contamination, corrosion of
equipment, obstruction of pipelines and equipment down-time.
72-74
Paper mills
Corrosion of the paper mill surfaces, the reduction of water flow in
pipelines, production of explosive gasses such as methane,
blockage of filters, valves and nozzles and financial losses due to
equipment downtime. It also can cause paper defects such as stains
and holes and leads to bad odours on the paper and in the mill.
75-78
Clinical industry
Biofilm forming bacteria are very resistant to antibiotics compared
to planktonic ones. They are also responsible for serious problems
like clinical biofilm infections, growth on surgical implants,
catheters and other medical devices. Antibodies can not recognise
the bacteria in biofilms which makes it hard to control them.
76, 79-84
82, 85-89
Stellenbosch University http://scholar.sun.ac.za
Chapter 3
25
2.8 Biofouling control and cleaning
To start with, it is necessary to state that there is some confusion in the literature between the words
„clean‟ and „control‟. In general, the former refers to off-line removal of deposits, whereas „control‟
refers to attempts to prevent or restrict deposit formation.58
Evidence of biofilm control technologies
has been available for centuries with the most significant ones being, the discovery of chlorine as a
disinfectant in 1810 and its application in water treatment in 1902 (Belgium).90
Important milestones
in water treatment are outlined in Table 2.5.
Table 2.5: Major milestones in water treatment.90
Year Milestone (s)
1804 First municipal water treatment plant (Scotland, sand filtering technology)
1810 Discovery of chlorine as a disinfectant (H. Davy)
1852 Formulation of the metropolis water act (London)
1879 Formulation of the germ theory (L. Pasteur)
1902 Use of chlorine (calcium hypochlorite) as a disinfectant in water (Belgium)
1906 Use of ozone as disinfectant (France)
1908 Use of chlorine (calcium hypochlorite) as a disinfectant in municipal water supply ( New Jersey, USA)
1914 Federal regulation of drinking water supply
1916 Use of UV in municipal water supply
1935 Discovery of synthetic ion exchange resin (B.A. Adams, E.L. Holmes)
1965 World's first reverse osmosis plant launched
1974
First reports on role of carcinogenic by-products of water disinfection with chlorine
Formulation of the Safe Drinking Water Act ( United States Environmental Protection Agency)
1975 Development of carbon black for drinking water purification
1998 Drinking water directive applied in EU
2000 Adoption of the Millennium Declaration during the UN millennium summit
2007 Launch of noble metal nanoparticle-based domestic water purifier. (T. Pradeep, A.S. Nair, Eureka
Forbes)
Stellenbosch University http://scholar.sun.ac.za
Chapter 3
26
2.8.1 Biofilm control
Due to economic losses associated with the deleterious effects of biofouling, different methods have
been used for minimizing the accumulation of biofilms on surfaces. Biofilm control agents typically
include oxidizing biocides which inactivate or inhibit biofilm forming bacteria, mechanical methods
that displace the biofilm biomass and use of dispersing agents, surfactants or chelating agents that are
aimed at destabilizing the biofilm structure.61, 91-93
The sequence of events that leads to the
accumulation of biofilm may influence the method of control that is adopted. For example, if
deposition of microorganisms is the primary factor in the development of a biofilm, it would be
important to concentrate the control technology in the liquid phase. On the other hand, if it is
reproduction and growth of the biofilm itself that is the essence of the problem, it would be imperative
that this is where the control technique should be applied. Thus, biofouling control can be done either
chemically or physically.58
2.8.1.1 Chemical control of biofouling
The use of chemicals to control microbial activity has been employed for many years but particularly
over the recent past, considerable research has been carried out in the development of improved
techniques to meet the changing needs of industry and society at large.58, 69
The term biocide is often
loosely used to include all chemicals that are employed to control biofilm formation and growth. The
word „biocide‟ is derived from the Latin „bio‟ (which means life) and „cida‟ (which means killer). In
strict terms therefore, „biocide‟ refers to a substance that is toxic to microbial life forms.58
Chemical control technology may be grouped into three broad sectors, i.e. biocides that kill
microorganisms, biostats that interfere with metabolism and surface active agents that restrict adhesion
to surfaces. The interactions of biocides with microorganisms can also be considered to be as a result
of a sequence of three events which are; (i) absorption on the cell wall; (ii) penetration of the biocide
into the cell and ultimately (iii) damage to the cell structure and its functions leading to cell lysis.
Chemical biocides can be divided into oxidising and non-oxidizing. The different ways in which
biocides can affect microorganisms are summarized in Table 2.6.
Stellenbosch University http://scholar.sun.ac.za
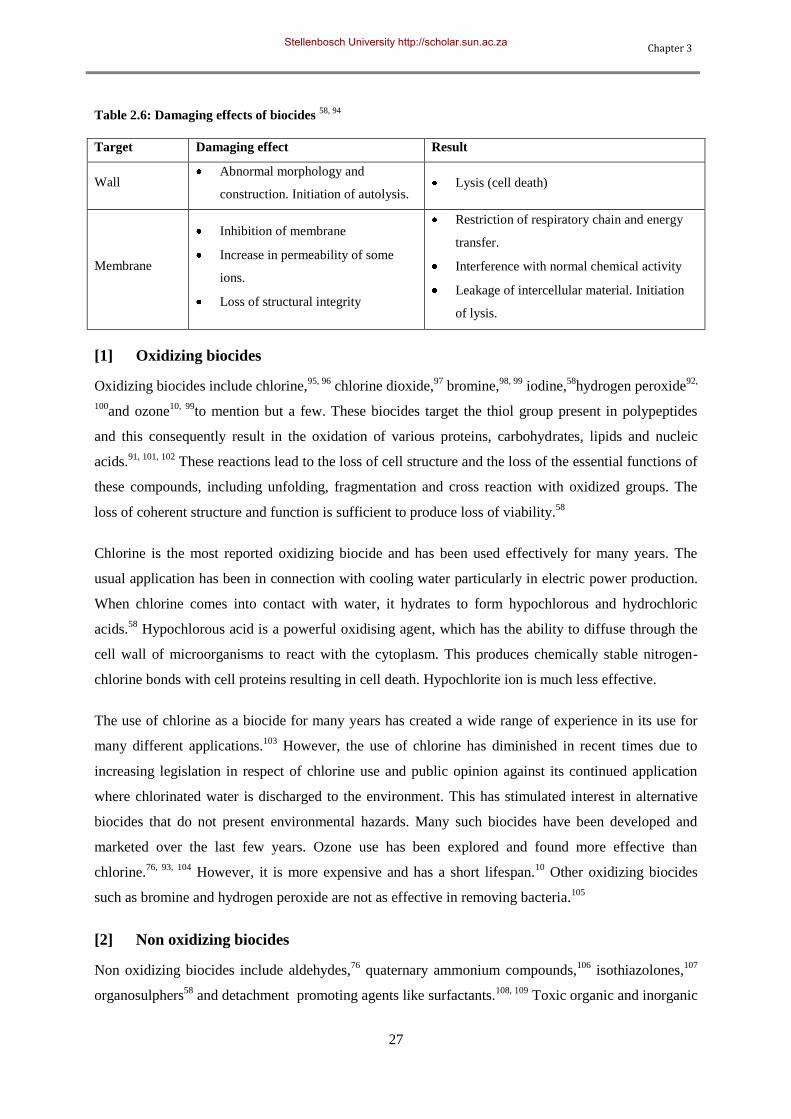
Chapter 3
27
Table 2.6: Damaging effects of biocides 58, 94
Target Damaging effect Result
Wall Abnormal morphology and
construction. Initiation of autolysis. Lysis (cell death)
Membrane
Inhibition of membrane
Increase in permeability of some
ions.
Loss of structural integrity
Restriction of respiratory chain and energy
transfer.
Interference with normal chemical activity
Leakage of intercellular material. Initiation
of lysis.
[1] Oxidizing biocides
Oxidizing biocides include chlorine,95, 96
chlorine dioxide,97
bromine,98, 99
iodine,58
hydrogen peroxide92,
100and ozone
10, 99to mention but a few. These biocides target the thiol group present in polypeptides
and this consequently result in the oxidation of various proteins, carbohydrates, lipids and nucleic
acids.91, 101, 102
These reactions lead to the loss of cell structure and the loss of the essential functions of
these compounds, including unfolding, fragmentation and cross reaction with oxidized groups. The
loss of coherent structure and function is sufficient to produce loss of viability.58
Chlorine is the most reported oxidizing biocide and has been used effectively for many years. The
usual application has been in connection with cooling water particularly in electric power production.
When chlorine comes into contact with water, it hydrates to form hypochlorous and hydrochloric
acids.58
Hypochlorous acid is a powerful oxidising agent, which has the ability to diffuse through the
cell wall of microorganisms to react with the cytoplasm. This produces chemically stable nitrogen-
chlorine bonds with cell proteins resulting in cell death. Hypochlorite ion is much less effective.
The use of chlorine as a biocide for many years has created a wide range of experience in its use for
many different applications.103
However, the use of chlorine has diminished in recent times due to
increasing legislation in respect of chlorine use and public opinion against its continued application
where chlorinated water is discharged to the environment. This has stimulated interest in alternative
biocides that do not present environmental hazards. Many such biocides have been developed and
marketed over the last few years. Ozone use has been explored and found more effective than
chlorine.76, 93, 104
However, it is more expensive and has a short lifespan.10
Other oxidizing biocides
such as bromine and hydrogen peroxide are not as effective in removing bacteria.105
[2] Non oxidizing biocides
Non oxidizing biocides include aldehydes,76
quaternary ammonium compounds,106
isothiazolones,107
organosulphers58
and detachment promoting agents like surfactants.108, 109
Toxic organic and inorganic
Stellenbosch University http://scholar.sun.ac.za
Chapter 3
28
metal compounds may also be classified as non-oxidising biocides.58
These disturb bacterial cell wall
permeability and interfere with the respiration and metabolic activity in bacterial cells.110
Of these,
isothiazolones have been used in a number of industrial water treatment systems for biofilm control.107
Non oxidising biocides are usually not manufactured with the aim of biofilm removal and there are
several problems associated with their use.96
Bacteria also develop some resistance against them which
reduces biocidal efficiency with every subsequent treatment.111
The use of coagulants and surfactants has been reported largely in literature. AlMalack and Anderson
reported that the addition of coagulants can cause the molecules or particles to form larger particles
which are readily swept off the membrane surface.112
They explored the effect of using alum,
polyaluminium silicate sulphate and lime as coagulants. Using these coagulants enhanced the
crossflow of domestic wastewater through a woven polyester membrane.112
A 1.5 fold initial and a 2
fold long term flux increase were obtained with coagulant over those without coagulant. The
improvement of crossflow microfiltration with addition of coagulants was also reported by other
researchers.113-116
Jonsson investigated the effect of different surfactants on ultrafiltration membranes.117
Triton X-100,
potassium oleate and hexadecyltrimethylammonium bromide which are nonionic, anionic and cationic
surfactants respectively were used in these experiments. The membranes polysulfone (PSF) and
poly(vinylidene) fluoride (PVDF) were used. The flux reductions of the hydrophobic membranes were
higher than the flux variations of the hydrophilic membranes. Styrene divinyl benzene based ion
exchange membranes were also modified for electrodialysis of aqueous solutions with high molecular
mass surfactants. The filtration results showed that no membrane fouling occurred in the presence of
humic acid and dodecylbenzenesulphonate.118
2.8.1.2 Physical methods of controlling biofouling
The use of physical methods in controlling biofouling eliminate the use of chemicals and thus
avoiding potential problems associated with their use, such as cost and environmental hazards. An
additional incentive to investigate the opportunities of physical control is the possibility of increased
and stricter legislation concerning the development and use of biocides.
[1] Backflushing and backwashing
One of the earliest techniques to combat the accumulation of microorganisms on the surfaces of
industrial process equipment is reversal of flow.58
Backflushing, which is also referred to as periodic
reverse filtration back through the membrane, has been widely applied in the control of membrane
fouling. Backflushing in a crossflow microfiltration unit recorded up to 3-fold higher fluxes than in a
case where there was no backflushing.119
A combination of backflushing and relaxation was also used
to mitigate fouling in a membrane bioreactor, this resulted in even improved flux increases.120
Stellenbosch University http://scholar.sun.ac.za
Chapter 3
29
[2] Pulsing
Pulsed flow is another relatively simple method used to control biofouling.58
The associated rapid
changes in velocity impose removal forces on the biofilm. A difficulty however, is to ensure that the
changes in velocity are rapid enough to be effective. Over relatively long distances therefore, the
effectiveness is likely to be reduced. Backpulsing has also attracted a lot of interest among researchers
in recent years. 121-124
Backpulsing can be defined as a variation of backflushing in which the back
pressure is applied in an extremely rapid pulse (pulse duration generally less than a second) every few
seconds throughout the process.125
This reversal results in hydraulic cleaning of the membrane by
forcing permeate back through the membrane in the reverse direction. Foulants are lifted off the
membrane by the backpulses and then swept to the filter exit by crossflow. Crossflow filtration with
rapid backpulsing has been studied extensively and has been reported as an effective technology for
controlling fouling and improving permeate flux for non adhesive foulants exhibiting reversible
fouling.121-124
Up to 25 times permeate flux improvement was reported by Ramirez and Davis for
filtration of dilute oil-in-water dispersions.126
Periodic gas backpulsing, also known by other researchers as gas injection is another method that has
been extensively explored by researchers in the past two decades.127-130
This technique combines
backpulsing with periodic gas injection into the feed stream to enhance membrane flux in crossflow
microfiltration experiments. The injected gas forms complex hydrodynamic conditions inside the MF
module which increases the wall shear stress. This then prevents membrane fouling and enhances MF
mass transfer.58
Using this technique has been reported to result in up to 5-fold improvements in
permeate flux. Periodic gas backpulsing however, can not work in the case of a membrane whose
fouling is not exclusively on the surface of the membrane.128, 131
[3] Ultrasonic waves
The use of ultrasonic waves has been reported to reduce fouling caused by natural organic matter and
subsequently by bacteria. Studies carried out using an ultrasonic probe system to prevent fouling of
ceramic membranes with polypropylene support rings reported an increased permeate flux by up to 4-
fold when compared to the system without the ultrasound.132
The ultrasound process also had no
negative impact on the membrane in the sense that even after several repetitions of the process, the
membrane surface was not damaged. Matsumoto obtained four to six times higher steady state flux
than that without ultrasonic waves.133
[4] Crossflushing
Crossflushing is another method of reducing/ removing foulants in membrane systems. It is however a
much weaker cleaning technique than backpulsing or backflushing. It involves periodic stoppage of
permeate flow while maintaining crossflow over the membrane surface. In the absence of permeate
Stellenbosch University http://scholar.sun.ac.za
Chapter 3
30
flow, the cake layer may be partially removed by the crossflow. This removal increases the subsequent
permeate flux .125, 134
Crossflushing to increase permeate flux in crossflow microfiltration experiments
using yeast as a foulant was reported.134, 135
Crossflushing was accomplished by maintaining flow over
the membrane while periodically stopping the permeate flow, thereby eliminating the pressure drop
across the membrane and allowing the shear exerted by the crossflow to erode the foulant layer.
Crossflushing has also been reported to improve the effectiveness of backwashing.136
[5] Coating of Surfaces
The adhesion of microorganisms to surfaces is affected by the quality of the surface both in terms of
its physicochemical properties and the roughness of the surface. Both these characteristics can be
modified by the application of a suitable coating but surface modification by coating is a relatively
modern technology. It is particularly relevant to the control of biofouling. The use of polymer based
antimicrobial coatings e.g. polytetrafluoroethylene (PTFE), to control biofilms in industrial settings is
on the rise. Permeation studies reveal an increase in hydrophilicity and hence flux which then
decreases fouling in coated membranes.137
Although most of the research in this area especially for
application in the water industry is still in the developmental stage, major milestones on its effectivity
have been reached. Most researchers have introduced antimicrobial properties either by direct
sputtering of antimicrobial agents on surfaces or by surface-tethering.138, 139
Titanium and silver-based
coatings have been largely explored and in most cases resulted in massive decrease in fouling
intensities.138, 140
Surface-tethering using coatings has also been explored and satisfactory reductions in
biofouling on membranes has been achieved.140
The use of polymer based coatings, e.g. could
facilitate application of the technology. It has to be appreciated however, that a surface treatment may
be vulnerable to mechanical off-line cleaning procedures. Dickson developed an interfacial
polymerization technique to coat the internal surface of a polypropylene (PP) membrane.137
[6] Surface modification
Microfiltration and ultrafiltration membranes are usually made from structurally rigid polymers in
order to withstand chemical treatment and elevated temperatures during cleaning, but their pronounced
hydrophobicity typically encourages solute adsorption.141
Moreover, the interfacial characteristics of
membranes can rarely be achieved by bulk modifications of the membrane forming polymer without
complicating the membrane fabrication processes. It is generally acknowledged that hydrophilic
surfaces do not adsorb proteins and other foulants to the same degree as do hydrophobic surfaces.142-144
According to Norde, at constant temperature and pressure, irrespective of the mechanism, particle-
surface interactions are determined by changes in the Gibbs energy, ∆ad G, of the system i.e. particles
will adhere spontaneously if ∆ad G < 0. Factors which contribute to ∆ad G include electrostatic,
hydrophobic and dispersion forces. Steric forces also become contributers to ∆ad G if the surfaces are
soft and not rigid.49
A lot of research has been done in this area and several functional groups with the
Stellenbosch University http://scholar.sun.ac.za
Chapter 3
31
ability to inhibit non-specific adsorption of proteins from solutions can be grafted or incorporated into
surfaces. These functional groups as reported by Ostuni exhibit the following characteristics; they are
hydrophilic and include hydrogen-bond acceptors (no hydrogen-bond donors).145
They also have a
neutral overall electrical charge. A few studies where surfaces have been successfully modified by
changing the membrane surface chemistry are discussed in the subsequent sections.
[i] Covalent binding of hydrophilic polymers on the membrane using heat curing; an example of
this technique was a type of ultrafiltration membrane consisting of a polyethersulfone support
membrane and a thin polyurea/polyurethane was prepared by surface coating of hydrophilic
phase inversion membranes. It was found that the surface hydrophilicity of the membranes as
well as flux were significantly enhanced.146
[ii] Grafting monomers to the membrane using electron-beam irradiation is another well referenced
method for reducing fouling on membrane systems. Kim and co-workers introduced an
alcoholic hydroxyl or diol group into a porous PE hollow fibre membrane by electron beam
radiation-induced grafting of vinyl acetate followed by saponification or acid hydrolysis.147
This
hydrophilization significantly reduced fouling of the PE membrane. Another electron beam
induced membrane surface modification was reported by Keszler and his team who prepared
asymmetric polyethersulfone ultrafiltration membranes and modified them using beam
irradiation in various environments. Significant changes were observed in the modified
membranes at certain combinations of experimental parameters, both water flux and solute
retention were improved compared with the untreated membrane.148
Grafting of surfaces using
oligomers and polymer brushes also demonstrated protein inhibition on a study carried out by
Norde.49
[iii] Lithiation chemistry has also been reported as an effective method for increasing the
hydrophilicity of membrane systems and subsequently improving permeation flux.b In a study
carried out by Guiver, PSF membranes were activated with a lithiating reagent and the lithiated
intermediates were covered by the addition of suitable electrophiles. The introduction of
hydrophilic groups enhanced water flux and decreased fouling.149
[iv] Photografting monomers onto the membrane using ultra violet irradiation has been reported by
many researchers. 150-157
An example is a study whereby cellulose acetate (CA) membranes and
polyamide membranes were modified using acrylamide and acrylic monomers respectively,
followed by UV irradiation.158
Ulbricht and co- workers also used a simultaneous UV grafting
method for grafting acrylic acid (AA) onto polyacrylonitrile (PAN) ultrafiltration membranes
and for grafting AA and 2-hydroxyethyl methacrylate (HEMA) onto PAN membranes.157, 159, 160
Stellenbosch University http://scholar.sun.ac.za
Chapter 3
32
Hydrophobic PSF ultrafiltration membranes were also modified with UV irradiation and
hydrophilicity increasing agents which resulted in flux increases of up to 400%.161
2.8.2 Cleaning
Cleaning as defined in Section 0 refers to off-line removal of biofilms deposits. Available cleaning
techniques include manual cleaning, which may be carried out „dry‟ or „wet‟. Manual cleaning is a
relatively simple and familiar technique involving wiping, brushing, and scraping.58
Because of its
labour-intensive nature the cost of manual cleaning could be high. Another method used in cleaning
biofouled membranes is jetting that may involve the use of high pressure water, air or steam lances.
Access may be a difficulty with this method. Drilling and rodding is a possibility for tenacious
deposits but this is not usually the case with biofouling. The drilling may be accompanied by the
inclusion of compressed air or a water supply to take away the deposit. The technique is particularly
relevant to the inside of tubular equipment, such as shell and tube heat exchangers.58
High temperature sterilisation or heat shock often referred to as „steam soaking‟ is another method
used in biofilm removal. It involves the admission of steam into the membrane to be cleaned which
results in killing of the microorganisms and subsequent removal by water flushing. However, there is
the possibility that large volumes of dead material and other debris may present difficulties of
removal, thereby causing blockage, partial or complete, that may necessitate a shutdown of the
process. Increased frequency of cleaning is most likely the best solution to overcome this particular
problem. Osmotic shock that upsets the metabolic processes of the microorganisms and results in lysis
of the cells, is a means of controlling biofouling but it may also be employed for cleaning purposes.58
2.9 Advances in membrane technology through nanotechnology
Nanotechnology is the discipline of manipulating matter at the nanoscale (1-100 nm), yielding
nanoparticles or materials that often possess novel biological, physical or chemical properties.162
Over
the last two decades, a lot of progress progress has been made in the study and discovery of new
organic and inorganic membranes. Many academic and industrial research projects in this area are
underway. The use of nanostructured materials, such as mesoporous media, nanoparticles, carbon
nanotubes and nanofibres in membrane systems has also increased.163
Among these materials,
nanofibres offer a number of attractive features compared to the other nanostructures.164
Research and
development of nanofibres has gained significant prominence in recent years due to the increased
awareness of their ability to enhance performance of various filter media. Nanofibres have a high
surface area which favous higher adsorption rate of various trace organics and bacteria for improving
water quality. They also have higher acid/basic and temperature resistance. Additionally, nanofibres
are environmentally friendly and have longer membrane life spans as well as possess a flexible
Stellenbosch University http://scholar.sun.ac.za
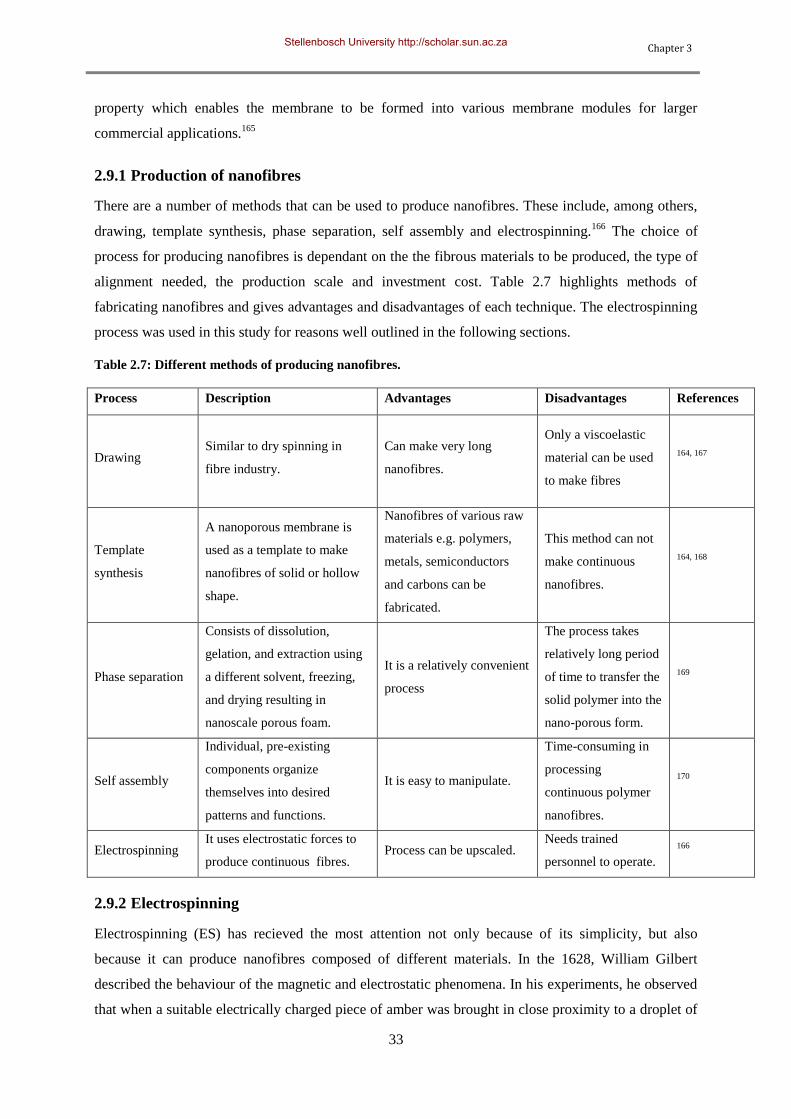
Chapter 3
33
property which enables the membrane to be formed into various membrane modules for larger
commercial applications.165
2.9.1 Production of nanofibres
There are a number of methods that can be used to produce nanofibres. These include, among others,
drawing, template synthesis, phase separation, self assembly and electrospinning.166
The choice of
process for producing nanofibres is dependant on the the fibrous materials to be produced, the type of
alignment needed, the production scale and investment cost. Table 2.7 highlights methods of
fabricating nanofibres and gives advantages and disadvantages of each technique. The electrospinning
process was used in this study for reasons well outlined in the following sections.
Table 2.7: Different methods of producing nanofibres.
Process Description Advantages Disadvantages References
Drawing
Similar to dry spinning in
fibre industry.
Can make very long
nanofibres.
Only a viscoelastic
material can be used
to make fibres
164, 167
Template
synthesis
A nanoporous membrane is
used as a template to make
nanofibres of solid or hollow
shape.
Nanofibres of various raw
materials e.g. polymers,
metals, semiconductors
and carbons can be
fabricated.
This method can not
make continuous
nanofibres.
164, 168
Phase separation
Consists of dissolution,
gelation, and extraction using
a different solvent, freezing,
and drying resulting in
nanoscale porous foam.
It is a relatively convenient
process
The process takes
relatively long period
of time to transfer the
solid polymer into the
nano-porous form.
169
Self assembly
Individual, pre-existing
components organize
themselves into desired
patterns and functions.
It is easy to manipulate.
Time-consuming in
processing
continuous polymer
nanofibres.
170
Electrospinning It uses electrostatic forces to
produce continuous fibres. Process can be upscaled.
Needs trained
personnel to operate.
166
2.9.2 Electrospinning
Electrospinning (ES) has recieved the most attention not only because of its simplicity, but also
because it can produce nanofibres composed of different materials. In the 1628, William Gilbert
described the behaviour of the magnetic and electrostatic phenomena. In his experiments, he observed
that when a suitable electrically charged piece of amber was brought in close proximity to a droplet of
Stellenbosch University http://scholar.sun.ac.za
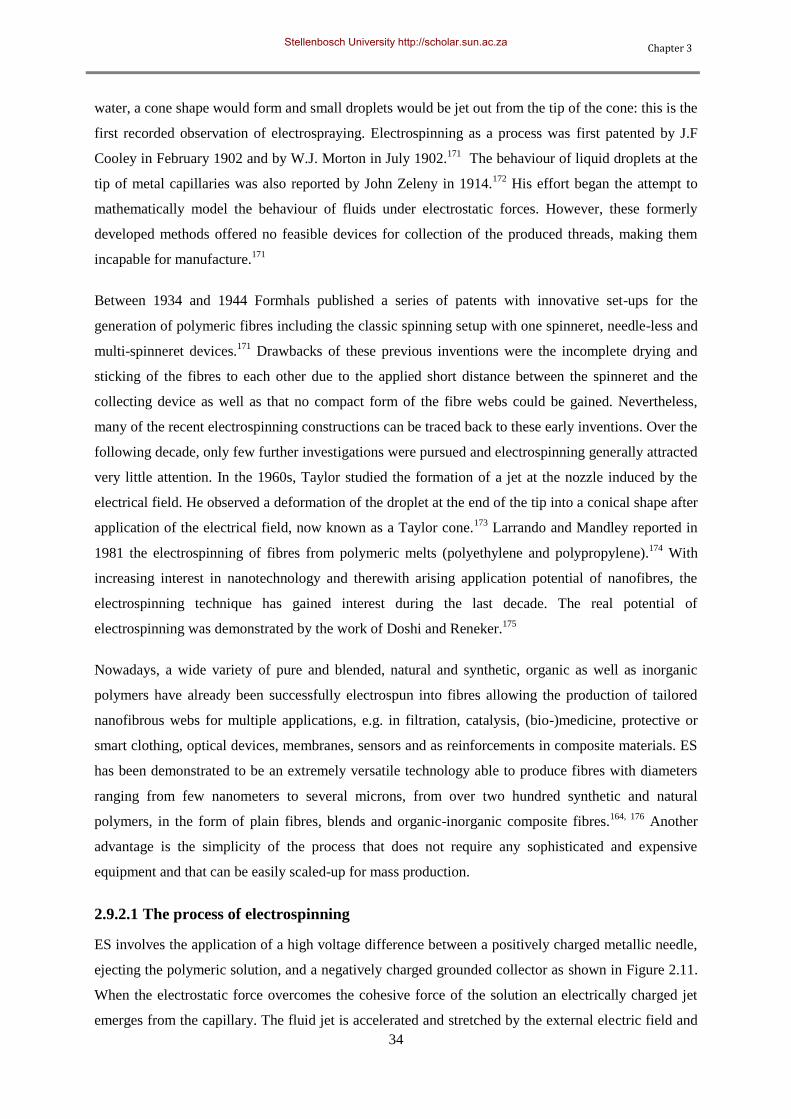
Chapter 3
34
water, a cone shape would form and small droplets would be jet out from the tip of the cone: this is the
first recorded observation of electrospraying. Electrospinning as a process was first patented by J.F
Cooley in February 1902 and by W.J. Morton in July 1902.171
The behaviour of liquid droplets at the
tip of metal capillaries was also reported by John Zeleny in 1914.172
His effort began the attempt to
mathematically model the behaviour of fluids under electrostatic forces. However, these formerly
developed methods offered no feasible devices for collection of the produced threads, making them
incapable for manufacture.171
Between 1934 and 1944 Formhals published a series of patents with innovative set-ups for the
generation of polymeric fibres including the classic spinning setup with one spinneret, needle-less and
multi-spinneret devices.171
Drawbacks of these previous inventions were the incomplete drying and
sticking of the fibres to each other due to the applied short distance between the spinneret and the
collecting device as well as that no compact form of the fibre webs could be gained. Nevertheless,
many of the recent electrospinning constructions can be traced back to these early inventions. Over the
following decade, only few further investigations were pursued and electrospinning generally attracted
very little attention. In the 1960s, Taylor studied the formation of a jet at the nozzle induced by the
electrical field. He observed a deformation of the droplet at the end of the tip into a conical shape after
application of the electrical field, now known as a Taylor cone.173
Larrando and Mandley reported in
1981 the electrospinning of fibres from polymeric melts (polyethylene and polypropylene).174
With
increasing interest in nanotechnology and therewith arising application potential of nanofibres, the
electrospinning technique has gained interest during the last decade. The real potential of
electrospinning was demonstrated by the work of Doshi and Reneker.175
Nowadays, a wide variety of pure and blended, natural and synthetic, organic as well as inorganic
polymers have already been successfully electrospun into fibres allowing the production of tailored
nanofibrous webs for multiple applications, e.g. in filtration, catalysis, (bio-)medicine, protective or
smart clothing, optical devices, membranes, sensors and as reinforcements in composite materials. ES
has been demonstrated to be an extremely versatile technology able to produce fibres with diameters
ranging from few nanometers to several microns, from over two hundred synthetic and natural
polymers, in the form of plain fibres, blends and organic-inorganic composite fibres.164, 176
Another
advantage is the simplicity of the process that does not require any sophisticated and expensive
equipment and that can be easily scaled-up for mass production.
2.9.2.1 The process of electrospinning
ES involves the application of a high voltage difference between a positively charged metallic needle,
ejecting the polymeric solution, and a negatively charged grounded collector as shown in Figure 2.11.
When the electrostatic force overcomes the cohesive force of the solution an electrically charged jet
emerges from the capillary. The fluid jet is accelerated and stretched by the external electric field and
Stellenbosch University http://scholar.sun.ac.za
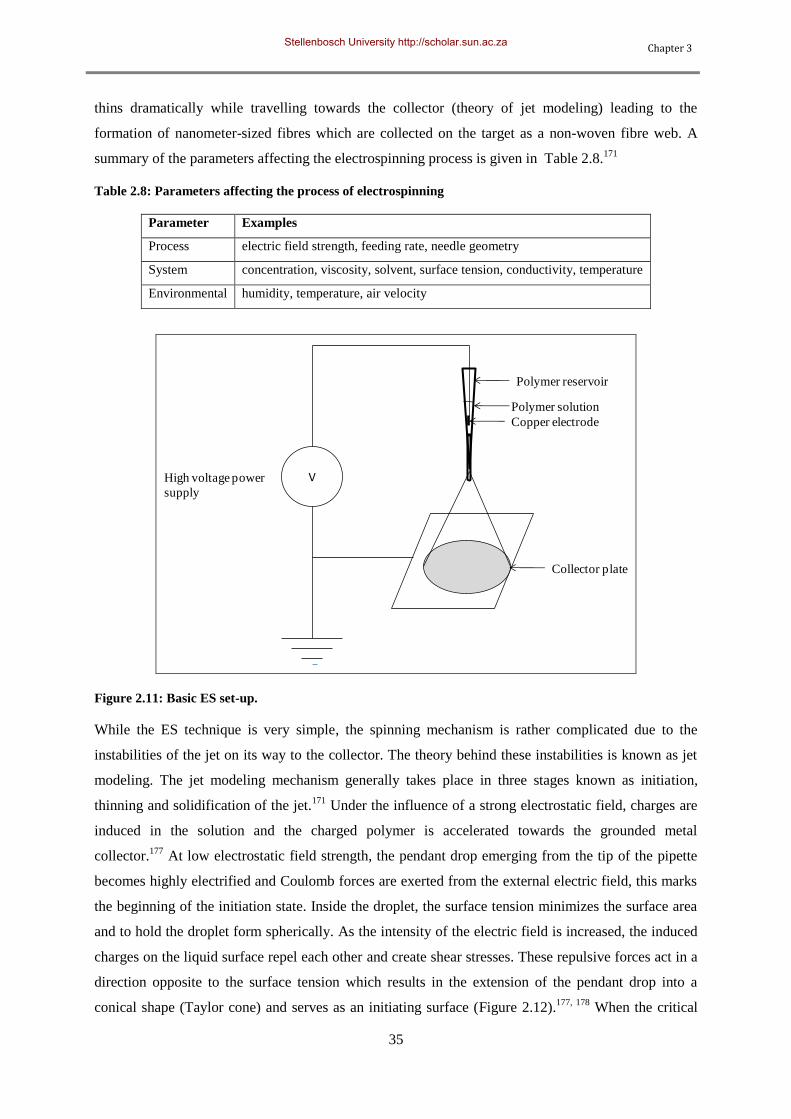
Chapter 3
35
thins dramatically while travelling towards the collector (theory of jet modeling) leading to the
formation of nanometer-sized fibres which are collected on the target as a non-woven fibre web. A
summary of the parameters affecting the electrospinning process is given in Table 2.8.171
Table 2.8: Parameters affecting the process of electrospinning
Parameter Examples
Process electric field strength, feeding rate, needle geometry
System concentration, viscosity, solvent, surface tension, conductivity, temperature
Environmental humidity, temperature, air velocity
V
Polymer solution
High voltage power
supply
Copper electrode
Polymer reservoir
Collector plate
Figure 2.11: Basic ES set-up.
While the ES technique is very simple, the spinning mechanism is rather complicated due to the
instabilities of the jet on its way to the collector. The theory behind these instabilities is known as jet
modeling. The jet modeling mechanism generally takes place in three stages known as initiation,
thinning and solidification of the jet.171
Under the influence of a strong electrostatic field, charges are
induced in the solution and the charged polymer is accelerated towards the grounded metal
collector.177
At low electrostatic field strength, the pendant drop emerging from the tip of the pipette
becomes highly electrified and Coulomb forces are exerted from the external electric field, this marks
the beginning of the initiation state. Inside the droplet, the surface tension minimizes the surface area
and to hold the droplet form spherically. As the intensity of the electric field is increased, the induced
charges on the liquid surface repel each other and create shear stresses. These repulsive forces act in a
direction opposite to the surface tension which results in the extension of the pendant drop into a
conical shape (Taylor cone) and serves as an initiating surface (Figure 2.12).177, 178
When the critical
Stellenbosch University http://scholar.sun.ac.za
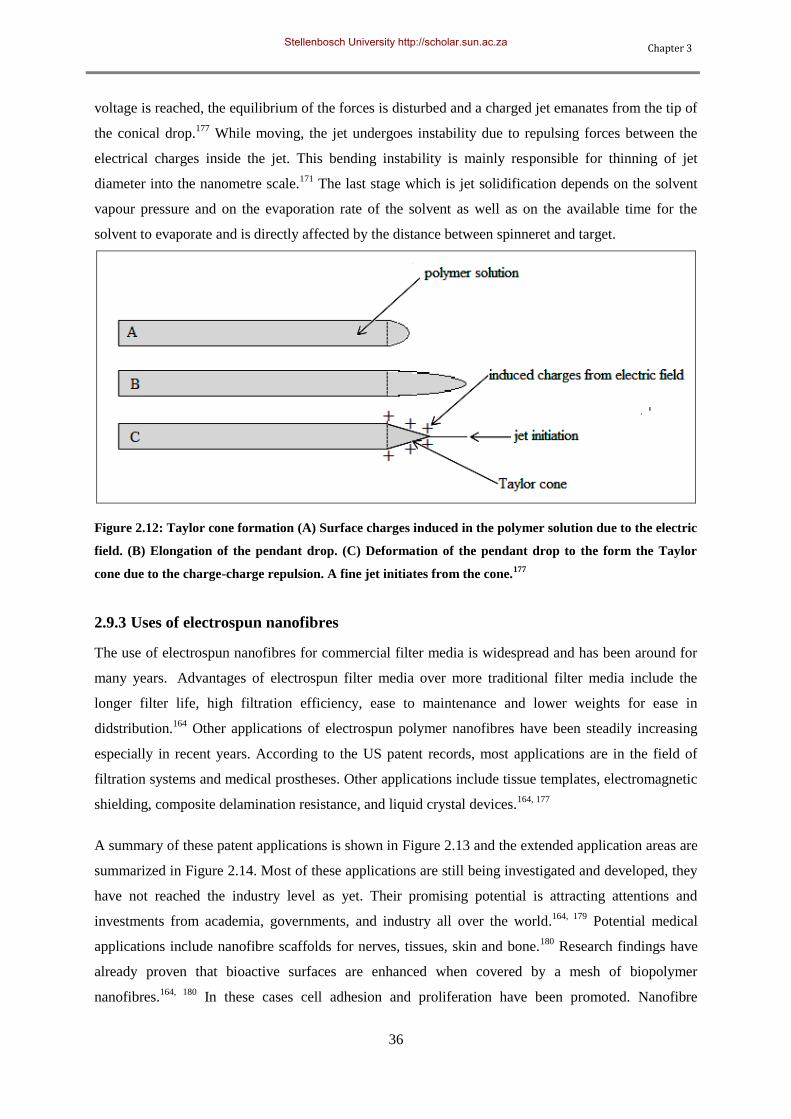
Chapter 3
36
voltage is reached, the equilibrium of the forces is disturbed and a charged jet emanates from the tip of
the conical drop.177
While moving, the jet undergoes instability due to repulsing forces between the
electrical charges inside the jet. This bending instability is mainly responsible for thinning of jet
diameter into the nanometre scale.171
The last stage which is jet solidification depends on the solvent
vapour pressure and on the evaporation rate of the solvent as well as on the available time for the
solvent to evaporate and is directly affected by the distance between spinneret and target.
Figure 2.12: Taylor cone formation (A) Surface charges induced in the polymer solution due to the electric
field. (B) Elongation of the pendant drop. (C) Deformation of the pendant drop to the form the Taylor
cone due to the charge-charge repulsion. A fine jet initiates from the cone.177
2.9.3 Uses of electrospun nanofibres
The use of electrospun nanofibres for commercial filter media is widespread and has been around for
many years. Advantages of electrospun filter media over more traditional filter media include the
longer filter life, high filtration efficiency, ease to maintenance and lower weights for ease in
didstribution.164
Other applications of electrospun polymer nanofibres have been steadily increasing
especially in recent years. According to the US patent records, most applications are in the field of
filtration systems and medical prostheses. Other applications include tissue templates, electromagnetic
shielding, composite delamination resistance, and liquid crystal devices.164, 177
A summary of these patent applications is shown in Figure 2.13 and the extended application areas are
summarized in Figure 2.14. Most of these applications are still being investigated and developed, they
have not reached the industry level as yet. Their promising potential is attracting attentions and
investments from academia, governments, and industry all over the world.164, 179
Potential medical
applications include nanofibre scaffolds for nerves, tissues, skin and bone.180
Research findings have
already proven that bioactive surfaces are enhanced when covered by a mesh of biopolymer
nanofibres.164, 180
In these cases cell adhesion and proliferation have been promoted. Nanofibre
Stellenbosch University http://scholar.sun.ac.za
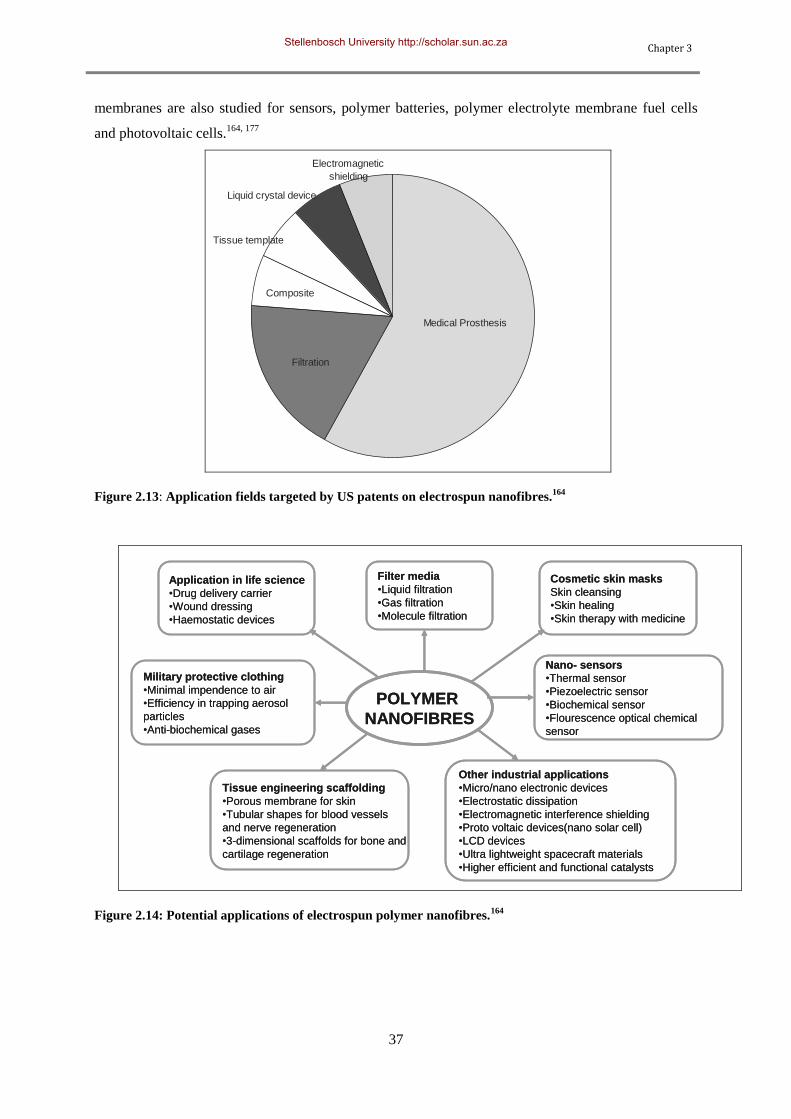
Chapter 3
37
membranes are also studied for sensors, polymer batteries, polymer electrolyte membrane fuel cells
and photovoltaic cells.164, 177
Liquid crystal device
Tissue template
Composite
Filtration
Electromagnetic
shielding
Medical Prosthesis
Figure 2.13: Application fields targeted by US patents on electrospun nanofibres.164
Cosmetic skin masks
Skin cleansing
•Skin healing
•Skin therapy with medicine
Military protective clothing
•Minimal impendence to air
•Efficiency in trapping aerosol
particles
•Anti-biochemical gases
Filter media
•Liquid filtration
•Gas filtration
•Molecule filtration
Application in life science
•Drug delivery carrier
•Wound dressing
•Haemostatic devices
Tissue engineering scaffolding
•Porous membrane for skin
•Tubular shapes for blood vessels
and nerve regeneration
•3-dimensional scaffolds for bone and
cartilage regeneration
Nano- sensors
•Thermal sensor
•Piezoelectric sensor
•Biochemical sensor
•Flourescence optical chemical
sensor
Other industrial applications
•Micro/nano electronic devices
•Electrostatic dissipation
•Electromagnetic interference shielding
•Proto voltaic devices(nano solar cell)
•LCD devices
•Ultra lightweight spacecraft materials
•Higher efficient and functional catalysts
POLYMER
NANOFIBRES
Figure 2.14: Potential applications of electrospun polymer nanofibres.164
Stellenbosch University http://scholar.sun.ac.za
Chapter 3
38
2.9.4 Nanofibres for filter media
Recent times have seen an increase in the use of nanostructured materials, such as mesoporous media,
nanoparticles, carbon nanotubes and nanofibres in filter media.163
Among these materials, electrospun
nanofibres offer a number of attractive features compared to the other nanostructures in filter media
applications.164
Electrospun nanofibres have an advantage over mesoporous media by relieving the
mass transfer limitation of substrates/products due to their reduced thickness. Additionally, it is easier
to recover and reuse nanofibres than nanoparticles or carbon nanotubes since electrospinning can
generate long nanofibres, which can also be further processed into various structures such as non-
woven mats, well aligned arrays, or membranes.163
Nanofibres also posses high surface to volume
ratios, high acid/basic and temperature resistance, light weight, longer membrane life spans as well as
high flexibility which enables nanofibre membranes to be formed into various membrane modules for
larger commercial applications.164
The use of nanofibres in filter media has received a lot of attention
from researchers wordwide.181
Research on the use of nanofibre membranes in filter media has given
rise to a new era of high technology and efficient media for filtering various compounds in all the
three states of matter. A few prototype applications of nanofibrous filter media were summarized by
Barhate and Ramakrishna (Table 2.9)
Stellenbosch University http://scholar.sun.ac.za
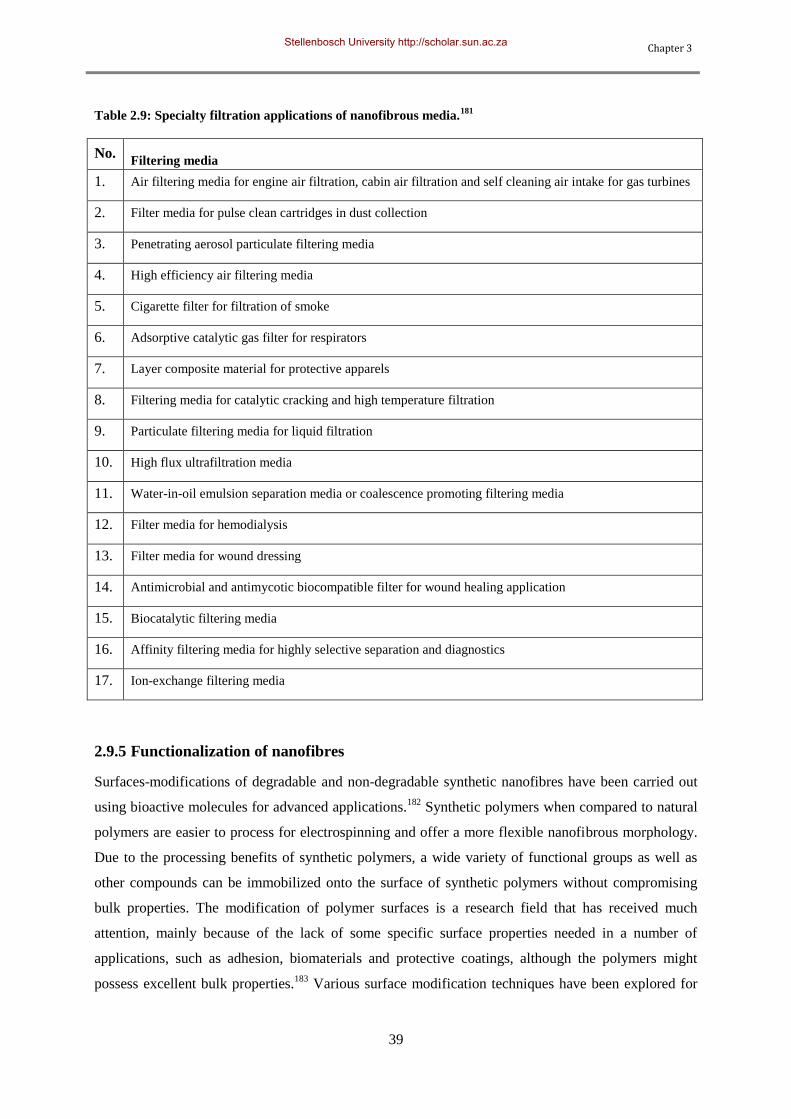
Chapter 3
39
Table 2.9: Specialty filtration applications of nanofibrous media.181
No. Filtering media
1. Air filtering media for engine air filtration, cabin air filtration and self cleaning air intake for gas turbines
2. Filter media for pulse clean cartridges in dust collection
3. Penetrating aerosol particulate filtering media
4. High efficiency air filtering media
5. Cigarette filter for filtration of smoke
6. Adsorptive catalytic gas filter for respirators
7. Layer composite material for protective apparels
8. Filtering media for catalytic cracking and high temperature filtration
9. Particulate filtering media for liquid filtration
10. High flux ultrafiltration media
11. Water-in-oil emulsion separation media or coalescence promoting filtering media
12. Filter media for hemodialysis
13. Filter media for wound dressing
14. Antimicrobial and antimycotic biocompatible filter for wound healing application
15. Biocatalytic filtering media
16. Affinity filtering media for highly selective separation and diagnostics
17. Ion-exchange filtering media
2.9.5 Functionalization of nanofibres
Surfaces-modifications of degradable and non-degradable synthetic nanofibres have been carried out
using bioactive molecules for advanced applications.182
Synthetic polymers when compared to natural
polymers are easier to process for electrospinning and offer a more flexible nanofibrous morphology.
Due to the processing benefits of synthetic polymers, a wide variety of functional groups as well as
other compounds can be immobilized onto the surface of synthetic polymers without compromising
bulk properties. The modification of polymer surfaces is a research field that has received much
attention, mainly because of the lack of some specific surface properties needed in a number of
applications, such as adhesion, biomaterials and protective coatings, although the polymers might
possess excellent bulk properties.183
Various surface modification techniques have been explored for
Stellenbosch University http://scholar.sun.ac.za
Chapter 3
40
functionalizing nanofibres and these include physical coating, plasma treatment, chemical
modifications using wet treatment, surface grafting polymerization and co-electrospinning.
2.9.5.1 Physical coating
Buldum and co-workers demonstrated physical coating of nanofibres through sputtering or
deposition.184
They successfully coated fibres with films of copper, aluminum, titanium, zirconium,
and aluminum nitride by using a plasma-enhanced physical vapor deposition sputtering process.185
Kim also covalently bound enzymes to poly (styrene-co-maleic anhydride) nanofibres through coating
and these fibres were stable and highly active.163
2.9.5.2 Plasma treatment
Plasma treatment of polymer substrates has been commonly used to achieve surface adhesion and
wetting properties by modification of the surface chemical composition. The selection of an
appropriate plasma source enables the introduction of various functional groups on the targeted
surface. This is usually done to improve biocompatibility or to permit subsequent covalent
immobilization of other molecules. Plasma treatments with oxygen, ammonia, or air can generate
carboxyl groups or amine groups on the nanofibre surfaces.182
Höcker reported the use of this
technique to produce shrink resistant fibres while Ladizesky and Ward plasma-treated polyethylene
fibres to reinforce them for clinical applications. In plasma treatment of nanofibrous mats,
modification of nanofibres located inside thick mats is impossible due to the limited penetration depth
of plasma within the nanopores.186, 187
2.9.5.3 Wet chemical method
A popular wet chemical method involves random chemical scission of ester linkages on the polymer
backbones located on nanofibre surfaces. This results in the generation of carboxylic and hydroxyl
groups from degraded water-insoluble polymer fragments.182
Wet chemical etching methods offers
flexibility for the modification of thick nanofibrous meshes. An example of this method was reported
by Sun and Onebby who investigated surface modification of biodegradable polycaprolactone films
via base catalysed hydrolysis in sodium hydroxide solution.183
2.9.5.4 Surface graft polymerization
Most synthetic polymers have hydrophobic surfaces and often require hydrophilic surface
modification to achieve antifouling properties. The introduction of surface graft polymerization does
not only confer surface hydrophilicity, but is also used to introduce multi-functional groups on
nanofibrous mesh surfaces.182
To initiate surface graft polymerization, Redox, plasma and UV
radiation treatments are often employed to generate free radicals for the polymerization.188
In a study
by Bernstein and co-workers, redox-initiated graft polymerization of vinyl monomers resulted in RO
Stellenbosch University http://scholar.sun.ac.za
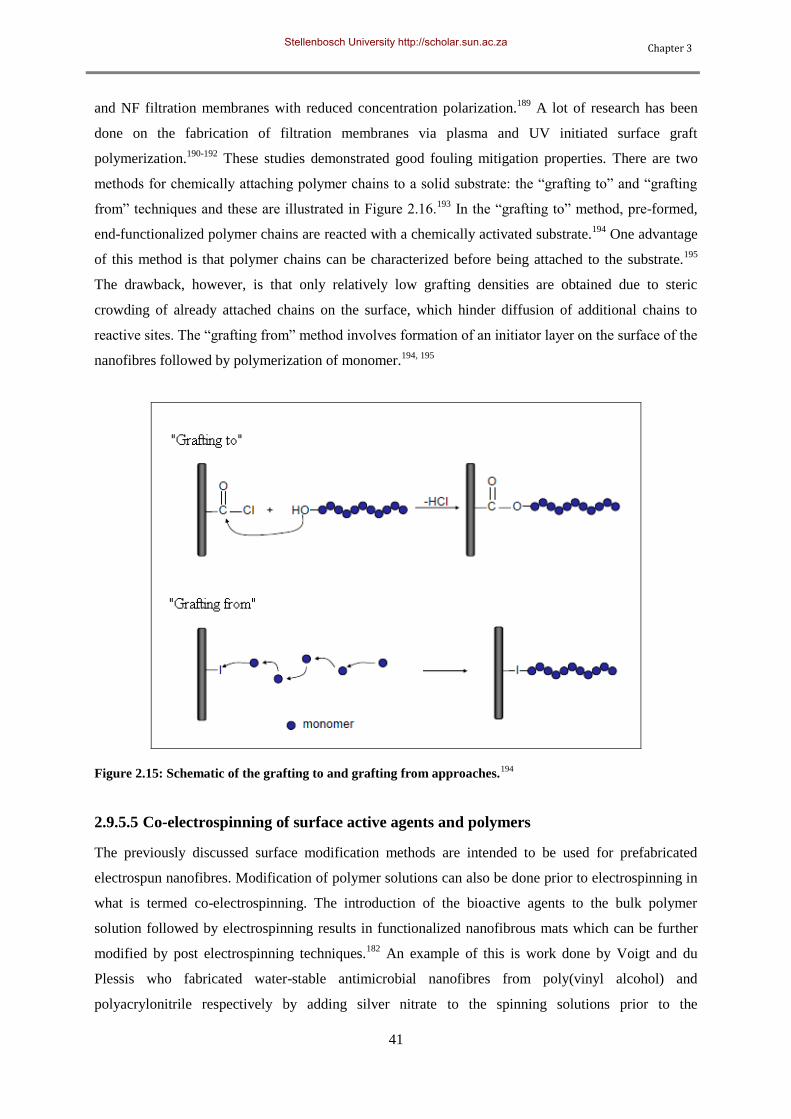
Chapter 3
41
and NF filtration membranes with reduced concentration polarization.189
A lot of research has been
done on the fabrication of filtration membranes via plasma and UV initiated surface graft
polymerization.190-192
These studies demonstrated good fouling mitigation properties. There are two
methods for chemically attaching polymer chains to a solid substrate: the “grafting to” and “grafting
from” techniques and these are illustrated in Figure 2.16.193
In the “grafting to” method, pre-formed,
end-functionalized polymer chains are reacted with a chemically activated substrate.194
One advantage
of this method is that polymer chains can be characterized before being attached to the substrate.195
The drawback, however, is that only relatively low grafting densities are obtained due to steric
crowding of already attached chains on the surface, which hinder diffusion of additional chains to
reactive sites. The “grafting from” method involves formation of an initiator layer on the surface of the
nanofibres followed by polymerization of monomer.194, 195
Figure 2.15: Schematic of the grafting to and grafting from approaches.194
2.9.5.5 Co-electrospinning of surface active agents and polymers
The previously discussed surface modification methods are intended to be used for prefabricated
electrospun nanofibres. Modification of polymer solutions can also be done prior to electrospinning in
what is termed co-electrospinning. The introduction of the bioactive agents to the bulk polymer
solution followed by electrospinning results in functionalized nanofibrous mats which can be further
modified by post electrospinning techniques.182
An example of this is work done by Voigt and du
Plessis who fabricated water-stable antimicrobial nanofibres from poly(vinyl alcohol) and
polyacrylonitrile respectively by adding silver nitrate to the spinning solutions prior to the
Stellenbosch University http://scholar.sun.ac.za
Chapter 3
42
electrospinning process.162, 171
As mentioned earlier, new research in membrane technology focuses on
surface modification of nanofibres to achieve increased hydrophobicity and improve bacterial
resistance of existing nanofibre membranes. Some of the techniques discussed in this chapter were
used in this study to fabricate different antimicrobial and antibiofouling membranes.
The theories and techniques discussed in this chapter will be used in subsequent chapters to meet the
objectives of this study.
Stellenbosch University http://scholar.sun.ac.za
Chapter 3
43
2.10 References
1. Wang L.K.; Chen J.P.; Hung Y-T.; Shammas N.K., Membrane and Desalination
Technologies. Humana Press: 2011.
2. Barker RW, Membrane Technology and Applicaions. Wiley: 2004.
3. Ma H.; Bowman C.N.; Davis R.H. Journal of Membrane Science 2000, 173, 191-200.
4. Allgeier S., Membrane filtration guidance manual. In Allgeier S., Ed. United States
Environmental Protection Agency (Office of Water): 2005; Vol. EPA 815-R-06-009.
5. Vrouwenvelder H. Biofouling of spiral wound membrane systems. Delft University of
Technology Delft , The Netherlands 2009.
6. Satinderpal K. Surface modification of electrospun poly(vinylidene fluoride) nanofibrous
microfiltration membrane. National University of Singapore, Singapore, 2007.
7. Kang S-K; Choo K-H. Journal of Membrane Science 2003, 223, 89-103.
8. Liu Q-F; Kim S-H. Separation Science and Technology 2008, 43, 45-58.
9. Harrelkas F.; Azizi A.; Yaacoubi A.; Benhammou A.; Pons M.N. Desalination 2009, 235,
330-339.
10. Vieira M.; Tavares C.R.; Bergamasco R.; Petrus J.C. Journal of Membrane Science 2001, 194,
273–276.
11. Tavares CR, M. V. M., Petru JCC, Bortoletto EC, Ceravollo F. Desa lination 2002, 144, 261-
265.
12. Molinari R.; Gallo S.; Argurio P. Water Research 2004, 38, 593–600.
13. Bodzek M.; Konieczny K. Waste Management 1992, 12, 75-82.
14. Miao J.; Li N.; Chen G.; Gao C.; Dong S. Chinese Journal of Chemical Engineering 2008, 16,
(2), 209-213.
15. Chmiel H.; Kaschek M.; Blocher C.; Noronha M.; Mavrov V. Desalination 2002, 152, 307–
314.
16. Koyuncu I. Desalination 2003, 155, 263–275.
17. Ahn KH; Song KG; Cha HY; Park ES; Yeom IT. Desalination 1998, 119, 169–176.
18. Nataraj SK; Hosamani KM; Aminabhavi TM. Desalination 2009, 249, 12-17.
19. Ku Y.; Lee P-L.; Wang W-Y. Journal of Membrane Science 2005, 250, 159-165.
20. Satyawali Y.; Balakrishnan M. Journal of Environmental Management 2008, 86, (3), 481-497.
21. Luo J.; Ding L.; Chen X.; Wan Y. Separation and Purification Technology 2009, 66, 429–
437.
22. Lastra A.; Gómeza D.; Romero J.; Francisco J.L.; Luque S.; Álvarez J.R. Journal of
Membrane Science 2004, 242, (97-105).
Stellenbosch University http://scholar.sun.ac.za
Chapter 3
44
23. Rautenbach R.; Groschl A. Desalination 1990, 77, 73-84.
24. Abdulhussain A.A.; Guo J., L. Z. P.; Pan Y.Y.; Wisaam S.A. American journal of Applied
sciences 2009, April.
25. Potts DE; Ahlert RC; Wang SS. Desalination 1981, 36, 235-264.
26. Fritzmann C.; Löwenberg J.; Wintgens T.; Melin T. Desalination 2007, 216, 1–76.
27. Cadotte JE; Petersen RJ; Larson RE; Erickson EE. Desalination 1980, 32, 25-31.
28. Williams M.E. A Review of Wastewater Treatment by Reverse Osmosis; EET Corporation and
Williams Engineering Services Company: New York, USA, 2003.
29. Wang LK; Chen JP; Hung Y-T; Shammas NK, Membrane and Desalination Technologies.
Humana Press: 2011.
30. Savage N.; Diallo M.; Duncan J.; Street A.; Rustich R., Nanotechnology applications for
clean water. William Andrew Inc.: Norwich, NY, 2009.
31. Kislik VS, Liquid Membranes:Principles and Applications in Chemical Separations and
Wastewater Treatment. 1 ed.; Elsevier Great Britain, 2010.
32. Wagner J., Membrane Filtration Handbook: Practical Tips and Hints. Osmonics: 2001; p 129.
33. Ní Mhurchú B.E.J. Dead-end and crossflow Microfiltration of yeast and Bentonite
suspensions: Experimental and modelling Studies incorporating the use of Artificial neural
networks. Dublin City University, , Dublin, 2008.
34. Kwannate (Manoonpong) S. Membrane fouling studies in suspended and attached growth
membrane bioreactor systems. Asian Institute of Technology School of Environment,
Resources and Development, Thailand, 2007.
35. Schafer AI; Fane AG; Waite TD, Module design and operation. In Nanofiltration: Principles
and Applications. Elsevier: Oxford, 2005.
36. Osada Y.; Nakagawa T., Membrane Science and Technology. Marcel Dekker, Inc: New York,
1992.
37. Strathmann H. Introduction to Membrane Science and Technology.
www.colorado.edu/che/courses/chen4838 (30 June),
38. Senthilmurugan S.; Ahluwalia A.; Gupta S.K. Desalination 2005, 173, 269-286.
39. Lau KK. Feed Spacer of Spiral Wound Membrane Module for Nanofiltration and Reverse
Osmosis: Modelling, Simulation and Design. Universiti Sains Malaysia, Nibong Tebal,
Penang, 2007.
40. van der Meer WGJ; van Dijk JC. Desalination 1997, 113, (2-3), 129-146.
41. Bai R.; Leow H.F. Seperation Purification Technology 2002, 29, 189-198.
42. Qiu S. Nanofibre as Flocculant or Modifier in Membrane Bioreactors for Wastewater
Treatment. University of Akron, Akron, 2005.
43. Lim AL; Renbi B. Journal of Membrane Science 2003, 216, 279-290.
44. Herzberg M.; Elimelech M. Journal of Membrane Science 2007, 295, 11-20.
Stellenbosch University http://scholar.sun.ac.za
Chapter 3
45
45. Van Paassen JA; Kruithof J; Bakker SM; Kegel FS. Desa lination 1998, 118, 239-248.
46. Persson F.; Långmark J.; Heinicke G.; Hedberg T.; Tobiason J.; Stenström T.; Hermansson M.
Water Research 2005, 39, (16), 3791-3800.
47. Al-Ahmad M.; Aleem F.A.A.; Mutiri A.; Ubaisy A. Desalination 2000, 132, 173-179.
48. Ridgway HF; Flemming HC, Membrane Biofouling in Water Treatment Membrane Processes.
In Water Treatment Membrane Processes, Ridgway HF, F. H., Ed. McGraw-Hill: New York,
1996.
49. Norde W. Z. Phys. Chem 2007, 221, 47-63.
50. Leslie GL; Schneider RP; Fane AG; Marshall KC; Fell CDJ. Collodial Surfaces A:
Physicochemical Engineering Aspects 1993, 73, 165-178.
51. Vu B.; Chen M.; Crawford R.J.; Ivanova E.P. Molecules 2009, 14, 2535-2554.
52. Stanely NR; Lazazzera BA. Molecular Microbiology 2004, 52, 917-924.
53. O'toole GA; Kaplan HB; Kolter R. Annual Reviews in Microbiology 2000, 54, (49-79).
54. Flemming HC; Schaule G. Desalination 1988, 70, 95-119.
55. Davey ME; O'Toole GA. Microbiology and Molecular Biology Reviews 2000, 64, 847-867.
56. Tiranuntakul M. Evaluation of fouling in a pilot scale membrane bioreactor. James Cook
University, Qeensland, Australia, 2011.
57. Monroe D. PLoS Biology 2007, 5, 307.
58. Bott TR, Industrial biofouling. Elsevier: The Boulevard, Langford Lane, Kidlington, Oxford,
UK, 2011.
59. Coester S.E.; Cloete T.E. Clinical Reviews in Microbiology 2005, 31, 1466-1477.
60. Bishop PL. Water Science Technology 2007, 55, 19-26.
61. Vidella HA. International Biodeterioration and Biodegradation 2002, 49, 259-270.
62. deCarvallo CC. Recent Patents in Biotechnology 2007, 1, 49-57.
63. Beech I.B.; Sunner J.A. Current Opinions in Biotechnology 2004, 15, 181-186.
64. Flemming H.C. Applied Microbiology and Biotechnology 2002, 59, 629-640.
65. Hu J.Y.; Yu B.; Feng Y.Y.; Tan X.L.; Ong S.L.; Zeng W.J.; Hoe W.C. Biofilms 2005, 2, 19-
25.
66. Momba M.N.B.; Kfir R.; Venter S.N.; Cloete T.E. Water SA 2000, 26, 59-66.
67. Abd El Aleem FA, A.-S. K. a. A. M. International Biodeterioration and Biodegradation 1998,
41, (19-23).
68. Rao TS; Kora AJ; Chandrzmohan P; Panigrahi BS; Narasimhan SV. Biocatalysis 2009, 25,
581-591.
69. Bott TR. International Journal of Chemical Engineering 2009, 29, 1-4.
70. Melo L.F.; Bott T.R. Experimental Thermal and Fluid Science 1997, 14, 375-381.
71. Pu H.; Ding G-I.; Ma X-K.; Hu H-T.; Gao Y-F. International Journal of Refrigeration 2009,
34, 1032-1040.
Stellenbosch University http://scholar.sun.ac.za
Chapter 3
46
72. Kumar CG; Anand SK. International Journal of Food Microbiology 1998, 42, 9-27.
73. Chmielewski R.A.N.; Frank J.F. Comprehensive Reviews in Food Science and Food Safety
2003, 2, 22-32.
74. Sharma M.; Anand S.K. Food Control 2002, 13, 469-477.
75. Vaïsänen O.M.; Weber A.; Bennasar A.; Rainey F.A.; Busse H-J.; Salkinoja-Salonen M.S.
Journal of Applied Microbiology 1998, 84, 1069-1084.
76. Richards M. Self immobilization of single and combinations of enzymes in spherical particles
and evaluation of their anti-biofouling potential. University of Pretoria, Pretoria, South Africa,
2010.
77. Blanco M.A.; Negro C.; Gaspar I.; Tijero J. Applied Microbiology and Biotechnology 1996,
46, (203-208).
78. Ludensky M. International Biodeterioration and Biodegradation 2003, 51, 255-263.
79. Gilbert P.; Foley I. Advances in Dental Research 1997, 11, 160-167.
80. Costerton J.W.; Veeh R.; Shirtliff M.; Pasmore M.; Post C.; Ehrlich G. Journal of Clinical
Investigation 2003, 112, 1466-1477.
81. Del Pozo JL; Patel P. Clinical Pharmacology and Therapeutics 2007, 82, 204-209.
82. Hall-Stoodley L.; Costerton J.W.; Stoodley P. Nature Reviews: Microbiology 2004, 2, 95-108.
83. Vuong C.; Kocianova S.; Voyich J.M.; Yao Y.; Fischer E.R.; DeLeo F.R.; Otto M. Journal of
Biological Chemistry 2004, 279, 54881-54886.
84. Costerton JW; Stewart PS; Greenberg EP. Science 1999, 284, 1318-1322.
85. Cohen N.; Morisset J.; Emilie D. Journal of Dental Research 2004, 83, 429-433.
86. Sun D.; Accavitti M.A.; Bryers J.D. Clinical Diagnostic Laboratory Immunology 2005, 12,
93-100.
87. Van Delden C.; Inglewski B.H. Emerging Infectious disease 1998, 4, 551-560.
88. Gotz F. Molecular Microbiology 2002, 48, 1367-1378.
89. Donlan RM; Costerton JW. Clinical Microbiology Reveiws 2002, 15, 167-193.
90. Pradeep T.; Anshup P. Thin Solid Films 2009, 517, 6441-6478.
91. Chen X.; Stewart P. Water Research 2000, 34, 4229-4233.
92. Stewart P.; Roe F.; Rayner J.; Elkins F.G.; Lewandowski Z.; Ochsner U.A.; Hassett D.J.
Applied and Environmental Microbiology 2000, 66, 836-838.
93. Meyer B. International Biodeterioration and Biodegradation 2003, 51, 249-253.
94. Denyer S.P. International Biodeterioration and Biodegradation 1990, 26, 89.
95. Chen X.; Stewart P.S. Environmental Science and Technology 1996, 30, 2078-2083.
96. Keevil C.W.; Godfree A.; Holt D.; Dow C., Biofilms in the aquatic environment. The Royal
Society of Chemistry: United Kingdom, 1999.
97. Veschetti E.; Cittadini B.; Maresca D.; Citti G.; Ottaviani M. Microchemical Journal 2005,
79, 165-170.
Stellenbosch University http://scholar.sun.ac.za
Chapter 3
47
98. Kramer J.F., Biofilm control with bromo-chloro-dimethylhydantion. In Corrosion NACE
International. Paper number 1277, Houston, Texas, 2001.
99. Vidella H.A. International Biodeterioration and Biodegradation 2002, 49, 259-270.
100. Presterl E.; Suchomel M.; Eder M.; Reichmann S.; Lassnigg A.; Graninger W.; Rotter M.
Journal of Antimicrobial Chemotherapy 2007, 60, 417-420.
101. McDonnell G.; Russell A.D. Clinical Microbiology Reviews 1999, 12, 147-179.
102. Wiencek K.M.; Chapman J.S., Biocides: how do they work and should you care. In Corrosion
99. Paper number 99308, San Antonio, Texas, USA, 1999.
103. Freese S.D.; Noziac D.J. Water SA 2004, 30, 18-24.
104. Wang Y.; Kim J-H.; Choo K-H.; Lee Y-S.; Lee C-H. Journal of Membrane Science 2000, 169
269-276.
105. Mah T-F.; O'Toole G.A. Trends in Microbiology 2001, 9, 34-39.
106. Langsrud S.; Sundheim G.; Borgmann-Strahsen R. Journal of Applied Microbiology 2003, 95,
874-882.
107. Williams T.M., Isothiazole biocides in water treatment applications. In Corrosion 2004, Paper
number 04083, New Orleans, Los Angeles, U.S.A., 2004.
108. Cloete TE, V. S., Brozel S, Van Holy A. International Biodeterioration and Biodegradation
1992, 29, 299-341.
109. Splendidani A.; Livingston A.G.; Nicolella C. Biotechnology and Bioengineering 2006, 94,
15-23.
110. Cloete TE. International Biodeterioration and Biodegradation 2003, 51, 277-283.
111. Ludensky M. Journal of Industrial Microbiology and Biotechnology 1998, 20, 109-115.
112. Al-Malack M.H.; Anderson G.K. Journal of Membrane Science 1996, 112, 287-296.
113. Milisik V. Filtration and separation 1986, 23, 347-349.
114. Peuchot MM; Ben Aim R. Journal of Membrane Science 1992, 68, 241-248.
115. Zhang J.; Sun Y.; Chang Q.; Liu X.; Meng G. Desalination 2006, 194, 182-191.
116. Katayon S.; Megat Mohd Noor M.J.; Kien Tat W.; Abdul Halim G.; Thamer A.M.; Badronisa
Y. Desalination 2007, 204, 204-212.
117. Jonsson B.; Jonsson B. Journal of Membrane Science 1991, 56, 49-76.
118. Grebenyuk VD, C. R., Peters S and Linkov V. Desa lination 1988, 115, 313-329.
119. Cakl J.; Bauer I.; Doleček P.; Mikulášek P. Desalination 2000, 127 189-198.
120. Wu J.; Le-Clech P.; Stuetz R.M.; Fane A.G.; Chen V. Journal of Membrane Science 2008,
324, 26-32.
121. Matsumoto K.; Kawahar M.; Ohya H. Journal of fermentation technology 1988, 66, 199-205.
122. Nipkow JG; Zeikus P; Gephardt P. Biotechnol. Bioeng. 1989, 34, 1075-1084.
123. Redkar S.; Davis R.H. A.I.Ch.E. Journal 1995, 41, (3), 501-508.
124. Wenten IG. Filtration and Separation 1995, 252-254.
Stellenbosch University http://scholar.sun.ac.za
Chapter 3
48
125. Kuberkar VT; Davis RH. Biotechnology Progress 1999, 15 472.
126. Ramirez JA; Davis RH. Journal of Hazardous Materials 1998, 63, 179-197.
127. Cabassud A.; Laborie S.; Laine J.M. Journal of Membrane Science 1997, 128, 93-101.
128. Si-Hassen D.; Ould-Dris A.; Jaffrin M.Y.; Benkahla Y.K. Journal of Membrane Science
1996, 118, 185-198.
129. Su SK; Liu JC; Wiley RC. Journal of Food Science 1993, 58, (3), 638-641.
130. Czekaj P.; López F.; Güell C. Journal Food Engineering 2001, 49, 25-36.
131. Vera L.; Villarroel R.; Delgado S.; Elmaleh S. Journal of Membrane Science 2000, 165, 47.
132. Chen D.; Weavers L.K.; Walker H.W.; Lenhart J.J. Journal of Membrane Science 2006, 276,
135-144.
133. Matsumoto Y.; Miwa T.; Nakao S; Kimura S. Journal of chemical engineering of Japan 1996,
29, 561-567.
134. Kuruzovich JN; Piergiovanni PR. Journal of Membrane Science 1996, 112, 241-247.
135. Tanaka S.; Numata K.; Kuzumoto H.; Sekino M. Desalination 1994, 96, 191-199.
136. Kennedy M.; Kim S-M.; Mutenyo I.; Broens L.; Schippers J. Desalination 1998, 118, 175-
187.
137. Dickson J.M.; Childs R.F.; McCarry B.E.; Gragnon D.R. Journal of Membrane Science 1998,
148, 25-46.
138. Kelly P.J.; Li H.; Whitehead K.A.; Verran J.; Arnell R.D.; Iordanova I. Surface & Coatings
Technology 2009, 204, 1137-1140.
139. Gao G.; Lange D.; Hilpert K.; Kindrachuk J.; Zou Y.; Cheng J.T.J.; Kazemzadeh-Narbat M.;
Yu K.; Wang R.; Straus S.K.; Brooks D.E.; Chew B.H.; Hancock R.E.W.; Kizhakkedathu J.N.
Biomaterials 2011, 32, 3899-3909.
140. Mauter M.S.; Wang Y.; Okemgbo K.C.; Osuji C.O.; Giannelis E.P.; Elimelech M. ACS
Applied Materials & Interfaces 2011, 3, 2861-2868.
141. Brash J.L.; Horbett T.A. In Proteins at interfaces: current issues and future prospects,
Proteins at Interfaces II, ACS Symposium Series 602, Washington DC, 1995; Brash J L, H. T.
A., Ed. American Chemical Society: Washington DC, 1995; pp 1-23.
142. Fane AG; Fell CD. Desalination 1987, 62, 117-136.
143. Nystrom M. Journal of Membrane Science 1989, 44, 183-186.
144. Hanemaaijer J.H.; Robbertsen T.; van den Boomgaard T.H.; Gunnink J.W. Journal of
Membrane Science 1989, 40, 199-217.
145. Ostuni E.; Chapman R.G.; Holmlin R.E.; Takayama S.; Whitesides G.M. Langmuir 2001, 17,
5605-5620.
146. Stengaard F.F. Desalination 1988, 70, 207-224.
147. Kim K.J.; Fane A.G.; Fell C.J.D. Desalination 1988, 70, 229-249.
Stellenbosch University http://scholar.sun.ac.za
Chapter 3
49
148. Keszler G.; Kovacs A.; Toth I.; Bertoti M.; Hegyi. Journal of Membrane Science 1991, 62,
201- 210.
149. Guiver M.D; Black P.; Tam C.M.; Deslandes Y. Journal of Applied Polymer Science 1993,
48, 1597-1606.
150. Uchida E.; Uyama Y.; Ikada Y. Journal of Applied Polymer Science 1993, 47, 417-424.
151. Yamagishi H.; Crivello J.V.; Belfort G. Journal of Membrane Science 1995, 105, 237-247.
152. Oster G.; Shibata O. Journal of Membrane Science 1957, 26, 233.
153. Ranby B.; Gao Z.M.; Zhang P.Y. Polym Am Prep Chem Soc 1988, 27, 38.
154. Zhang P.; Ranby B. Journal of Applied Polymer Science 1990, 41, 1469-1478.
155. Yang W.; Ranby B. Journal of Applied Polymer Science 1996, 62, 533-543.
156. Ogiwara Y.; Kanda M.; Takumi M.; Kubota H. Journal of Membrane Science, Polymer letter
edition 1981, 19, 457-462.
157. Ulbricht M; Matuschewski H; Oechel A; Hicke HG. Journal of Membrane Science 1996, 115,
31-47.
158. Yan W.; Yang P.; Wang Y. Shuichuli Jishu 1988, 14, 213-222.
159. Ulbricht M.; Belfort G. Journal of Applied Polymer Science 1995, 56, 325-343.
160. Ulbricht M; Belfort G. Journal of Membrane Science 1995, 111, 193-215.
161. Nystrom M; Jarvinen P. Journal of Membrane Science 1991, 60 275-296.
162. du Plessis D.M. Fabrication and characterization of anti-microbial and biofouling resistant
nanofibers with silver nanoparticles and immobilized enzymes for application in water
filtration. University of Stellenbosh, Stellenbosch, South Africa, 2011.
163. Kim B.J.; Nair S.; Kim J.; Kwak J.H.; Grate J.W.; Kim S.H.; M.B., G. Nanotechnology 2005,
16, S382-S388.
164. Huang Z-M.; Zhang Y-Z.; Kotaki M.; Ramakrishna S. Composites Science and Technology
2003, 63, 2223-2253.
165. Wertz J.; Schneiders I. Filtration and Separation 2009, July/ August.
166. Ramakrishna S.; Fujihara K.; Teo W-E.; Lim T-C.; Ma Z., An Introduction to Electrospinning
and Nanofibres. World Scientific Publishing Co. Pte. Ltd.: Toh Tuck Link, Singapore, 2005.
167. Ondarcuhu T.; Joachim C. Europhysics Letters 1998, 42, 215-220.
168. Feng L.; Li S.; Li H.; Zhai J.; Song Y.; Jiang L. Angew Chem Int Ed 2002, 41, 1221-1223.
169. Ma P.X.; Zhang R. J Biomed Mat Res 1999, 46, 60-72.
170. Li W.J.; Laurencin C.T.; Caterson E.J.; Tuan R.S.; Ko F.K. Jounal of Biomedical Materials
Research 2002, (60), 613-621.
171. Voigt W.V. Water stable, antimicrobial active nanofibres generated by electrospinning from
aqueous spinning solutions. RWTH Aachen University, Munich, 2009.
172. Zeleny J. Physical Review 1914, 3, 69-91.
173. Taylor B., Electrically driven jets. Proc. Roy. Soc: London 1969.
Stellenbosch University http://scholar.sun.ac.za
Chapter 3
50
174. Subbiah T.; Bhat G.S.; Tock R.W.; Parameswaran S.; Ramkumar S.S. Journal of Applied
Polymer Science 2005, 96, 557-569.
175. Doshi J.; Reneker D.H. J Electrostat 1995, 35, 151-160.
176. Theron A.; Zussman E.; Yarin A.L. Nanotechnology 2001, 12, 384-390.
177. Baji A.; Mai Y-W.; Wong S-C.; Abtahi M.; Chen P. Composites Science and Technology
2010, 70, 703-718.
178. Taylor G.I., Disintegration of water drops in an electric field. Proc Roy Soc Lond Ser A:
1969; p 313:453.
179. Teo W.E.; Ramakrishna S. Nanotechnology 2006, 17, 89-106.
180. Koyal Garg K.; Bowlin G.L. Biomicrofluidics 2011, doi: 10.1063/1.3567097.
181. Barhate R.S.; Ramakrishna S. Nanofibrous filtering media: Filtration problems and solutions
from tiny materials 2007, 296, 1-8.
182. Yoo H.S.; Kim T.G.; Park T.G. Advanced Drug Delivery Reviews 2009, 61, 1033-1042.
183. Sun H.; Onebby S. Polymer International 2006, 55, 1336–1340.
184. Buldum A.; Clemons C.B.; Dill L.H.; Kreider K.L.; Young G.W.; Zheng X.; Evans E.A.;
Zhang G.; Hariharan S.I. Journal of Applied Physics 2005, 98, 044304.
185. Buldum A.; Busuladzic I.; Clemons C.B.; Dill L.H.; Kreider K.L.; Young G.W.; Evans E.A.;
Zhang G.; Hariharan S.I.; Kiefer W. Journal of Applied Physics 2005, 98, 044303.
186. Höcker H. Pure Applied Chemistry 2002, 74, 423-427.
187. Ladizesky N.H.; Ward I.M. Journal of Materials Science: Materials in Medicine 1995 6, 497-
504.
188. Deng J.; Wang L.; Liu L.; Yang W. Progress in Polymer Science 2009, 34, 156-193.
189. Bernstein R.; Belfer R.; Freger V. Langmuir 2010, 26, 12358-12365.
190. Abu Semana M.N.; Khayet M.; Bin Ali Z.I.; Hilal N. Journal of Membrane Science 2010,
355, 133-141.
191. Taniguchi M.; Kilduff J.E.; Belfort G. Journal of Membrane Science 2003, 22, 59-70.
192. Chang Y.; Ko C-Y.; Shih Y-J.; Quémener D.; Deratani A.; Wei T-C.; Wang D-M.; Lai J-Y.
Journal of Membrane Science 2009, 345, 160-169.
193. He D.; Susanto H.; Ulbricht M. Progress in Polymer Science 2009, 34, 62-98.
194. Rhodes S.M. Electrically conductive polymer composites. University of Akron, Akron, United
States of America., 2007.
195. Ranjan R. Surface Modification of silica nanoparticles. University of Akron, Akron, United
States of America, 2008.
Stellenbosch University http://scholar.sun.ac.za
Chapter 3
51
Chapter 3: Fabrication and characterization of antimicrobial
biocide containing poly(vinyl alcohol) nanofibres for application
in filter media
3.1 Chapter summary
This chapter explores the introduction of a biocide called AquaQure as an additive to poly(vinyl
alcohol) to obtain nanofibres with antimicrobial properties. The addition of the AquaQure biocide to
PVA nanofibres, testing of the antimicrobial activity as well as leaching of PVA nanofibres modified
with the AquaQure biocide were investigated in this study. Antimicrobial activity of the AquaQure
containing PVA fibres against bioluminescent strains of Klebsiella pneumoniae Xen 39,
Staphylococcus aureus Xen 36, Escherichia coli Xen 14, Pseudomonas aeruginosa Xen 5 and
Salmonella typhimurium Xen 26 were tested using plate counting. The antimicrobial tests were
confirmed with non-culture-based techniques namely bioluminescent imaging and LIVE/DEAD
Baclight to determine the antimicrobial efficiency against viable but non-culturable (VNBC) cells.
This was done to quantify the cells that enter a dormant state during contact with the antimicrobial
fibres and to eliminate the chances of overestimating the antimicrobial efficiency of the nanofibres.
The nanofibrous mats were also chemically characterized using ATR-FTIR and EDX. Thermal
characterization was done usin DSC, TGA and XRD. Since leaching out of metal ions to water
supplies is as much a health hazard as it is an environmental hazard, leaching experiments were
conducted to ascertain the amounts of the constituents of the biocide from the fibres. Because of the
intended drinking water purification application, these figures were then compared with the South
African national standards (SANS) for drinking water.
3.2 Background information
In this section, historical aspects and the chemical properties of polyvinyl alcohol qualifying it for use
in liquid filter media are discussed. A brief review on antimicrobial metal nanoparticles and
nanofibrenanofibres looking into their development and possible drawbacks is also given.
3.2.1 Poly(vinyl alcohol) (PVA)
Poly(vinyl alcohol) (PVA) was first prepared by Herrmann and Haehnel in 1924 via the base catalyzed
alcoholysis of poly(vinyl esters). The reactions were not commercially viable as large amounts of heat
were evolved, which made the reactions hazardous.1 In 1925, the duo developed new and safe methods
for the large scale production of poly(vinyl acetate), resulting in vinyl acetate (VAc) becoming the
Stellenbosch University http://scholar.sun.ac.za
Chapter 3
52
most widely used monomer for the preparation of PVA precursor. Preparation of the first PVA fibre
was proposed in 1931.1, 2
3.2.1.1 Properties and applications
Poly(vinyl alcohol) (PVA) is a water-soluble polymer produced industrially by hydrolysis of
poly(vinyl acetate). A number of grades of PVA are commercially available, these can be divided into
two types: the fully hydrolysed and the partially hydrolysed PVA depending on the fraction of acetate
groups left in the backbone.3-5
PVA also has excellent mechanical and thermal properties, excellent
oxygen barrier properties, oil, grease and organic solvent resistance, low moisture permeability, high
heat resistance and ultra violet and infra-red radiation stability and is non-toxic. In addition, PVA
fibres have high tensile and compressive strengths; high modulus and abrasion resistance. The high
chemical stability of PVA at normal temperature along with its excellent physical and mechanical
properties has led to its broad practical applications.6
PVA has been mainly used in fibre and film products for many years.7-9
It has also been used as paper
coating, adhesives and colloid stabilizer.2, 10, 11
In recent years, much attention has been focused on the
biomedical applications of PVA hydrogels including contact lenses, artificial organs and drug delivery
systems.12, 13
Electrospinning is a highly versatile method that can produce fibres with diameters in the
range of 100 nm to a few m.14
Ultrafine PVA fibres, which may have potential applications in
filtration and biomedical engineering, can be produced through the process of electrospinning.
Electrospun fibre mats have a large surface-to-volume ratio, tunable porosity, and relatively high
production rates, and possess the potential for use in many technological areas.14
3.2.1.2 Crosslinking of PVA
Poly(vinyl alcohol) (PVA) is generally soluble in water which would compromise its use in filtration
systems. However, crosslinking has provided one of the techniques to improve physical properties of
PVA. Crosslinking of PVA can be done using various techniques which include irradiation, chemical
and physical techniques.
i. Radiation crosslinking
Gamma rays produced by the decomposition of 60
Co have been used to carry out radiation crosslinking
of PVA. Through radiation crosslinking, polymer networks which are not harmful when used in
biomedical applications are produced because no catalysts or additives are used. The disadvantage of
this technique however, is that crosslinking is often accompanied by polymer degradation.
Stellenbosch University http://scholar.sun.ac.za
Chapter 3
53
ii.Physical crosslinking
Physical crosslinking is commonly carried out though freezing and thawing. Repeating freeze-thaw
cycles of PVA solutions results in the formation of crystalline regions which remain intact in water,
rendering the PVA insoluble. This technique can however be only used for crosslinking PVA solutions
and not other forms like solid PVA and PVA fibrils. Another well reported physical technique is the
heat treatment of PVA at temperatures above 100 °C. This method has been used to crosslink PVA
nanofibres. Crosslinking using heat treatment takes short periods of time e.g. Voigt reported the
crosslinking of PVA nanofibres in 10 minutes at 140 °C. This method is also environmentally friendly
since no harmful catalysts or additives are used in the crosslinking.15
iii. Chemical crosslinking
Chemical crosslinking using multifunctional compounds is however the most commonly reported
technique for crosslinking PVA. The general mechanism involves the reaction of the complimentary
functional group of the crosslinking agent with the O-H group of PVA. Commonly used crosslinking
agents include dialdehydes, dicarboxylic acids, dianhydrides and diisocyanates. PVA undergoes
esterification with dicarboxylic acids and dianhydrides, acetalization with dialdehydes (in the presence
of Lewis or Brønsted acid catalysts) and carbamate (urethane) linkages are formed with
diisocyanates.6 This renders the fibres insoluble in water and also significantly preserves fibre
structure and properties. An example of this type of crosslinking which was used in this study is
crosslinking using glyoxal.
The general mechanism for crosslinking of PVA with dialdehydes involves hemiacetal and acetal
formation, as illustrated in Scheme 3.1. In the presence of a Brønsted acid catalyst the carbonyl
oxygen of the glyoxal (step 1) is first protonated. This is then followed by nucleophilic attack of the
electron deficient carbonyl carbon atom by the PVA hydroxyl group, resulting in a hemiacetal as
shown in step 3. In the presence of excess acid the hemiacetal undergoes an intramolecular
nucleophilic addition reaction with a second hydroxyl group resulting in an acetal (step 4). The
unreacted carbonyl group in step 3 can also undergo an intermolecular nucleophilic addition reaction
with an hydroxyl group of PVA resulting in a dihemiacetal as shown in step 5. The unreacted carbonyl
group in step 4 and the hemiacetal groups in step 5 can then undergo a series of protonations, followed
by nucleophilic addition reactions with PVA hydroxyl groups, resulting in a diacetal (step 7) as the
final product. Acetalization was important as it minimized the solubility of the PVA fibres in the
aqueous media in which they were modified.
Stellenbosch University http://scholar.sun.ac.za
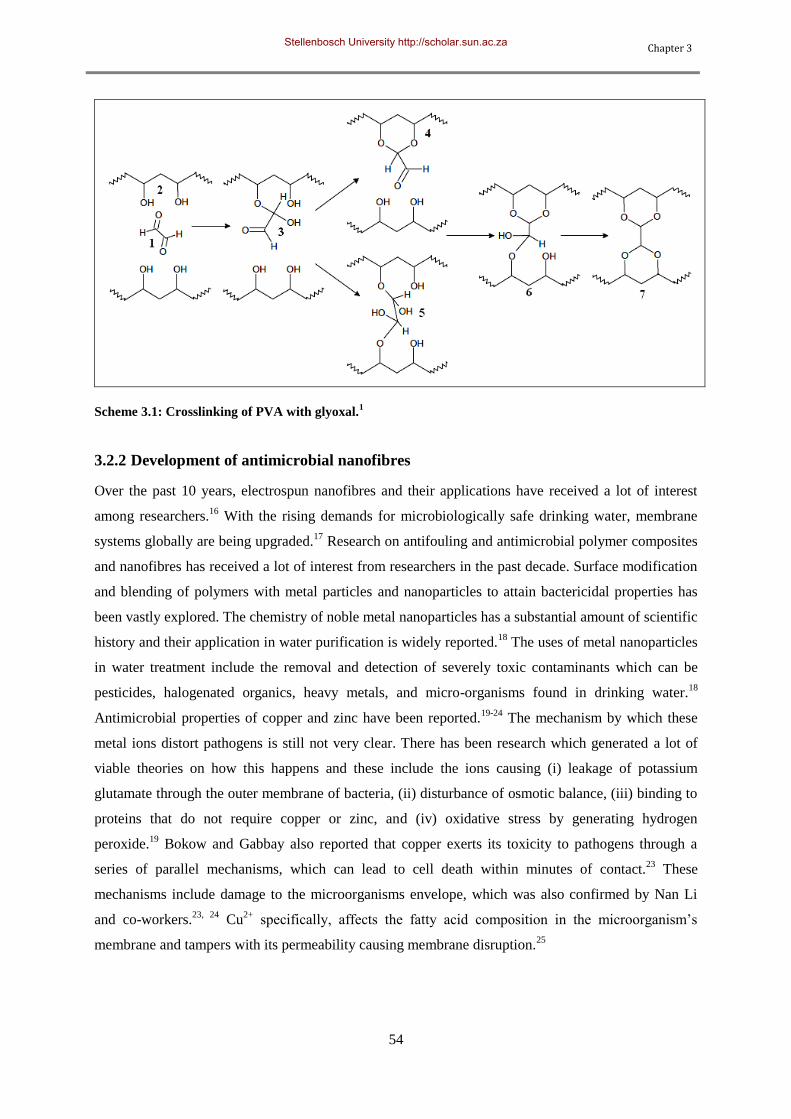
Chapter 3
54
Scheme 3.1: Crosslinking of PVA with glyoxal.1
3.2.2 Development of antimicrobial nanofibres
Over the past 10 years, electrospun nanofibres and their applications have received a lot of interest
among researchers.16
With the rising demands for microbiologically safe drinking water, membrane
systems globally are being upgraded.17
Research on antifouling and antimicrobial polymer composites
and nanofibres has received a lot of interest from researchers in the past decade. Surface modification
and blending of polymers with metal particles and nanoparticles to attain bactericidal properties has
been vastly explored. The chemistry of noble metal nanoparticles has a substantial amount of scientific
history and their application in water purification is widely reported.18
The uses of metal nanoparticles
in water treatment include the removal and detection of severely toxic contaminants which can be
pesticides, halogenated organics, heavy metals, and micro-organisms found in drinking water.18
Antimicrobial properties of copper and zinc have been reported.19-24
The mechanism by which these
metal ions distort pathogens is still not very clear. There has been research which generated a lot of
viable theories on how this happens and these include the ions causing (i) leakage of potassium
glutamate through the outer membrane of bacteria, (ii) disturbance of osmotic balance, (iii) binding to
proteins that do not require copper or zinc, and (iv) oxidative stress by generating hydrogen
peroxide.19
Bokow and Gabbay also reported that copper exerts its toxicity to pathogens through a
series of parallel mechanisms, which can lead to cell death within minutes of contact.23
These
mechanisms include damage to the microorganisms envelope, which was also confirmed by Nan Li
and co-workers.23, 24
Cu2+
specifically, affects the fatty acid composition in the microorganism‟s
membrane and tampers with its permeability causing membrane disruption.25
Stellenbosch University http://scholar.sun.ac.za
Chapter 3
55
3.2.3 Impact of PVA/AquaQurenanofibres and possible drawbacks in filter applications
The development of biocide-containing nanofibres has great potential in filter media especially in
point of use water filtration systems to provide safe drinking water for the world‟s developing regions
and other air filtration applications for controlling airborne infections. This development however, also
poses serious health risks should the biocide leach into the filtered water. Health hazards associated
with copper in drinking water include cirrhoses, gastrointestinal illnesses and liver failure.26
The
tendency of bacteria to become resistant to current antibiotics is a serious problem in industrial and
clinical settings.27
The introduction of any antimicrobial material therefore needs to be investigated
and weighed against this drawback. The use of the multi-ion biocidal system, however could mitigate
the problem of resistance since different metal ions use different pathways for distorting different
strains of bacteria.28
3.3 Objective
This study focused on the fabrication of antimicrobial PVA nanofibres through the electrospinning
process, which provides a simple and versatile method for generation of nanofibres as described in
Section 2.9.2. This was done by directly doping the spinning solution with AquaQure which is an
aqueous biocide prior to electrospinning. AquaQure is a biocide containing mainly Cu2+
and Zn2+
among other metal ions and is commercially available from AquaQure Water Solutions, South Africa.
It is used for killing bacteria to provide safe drinking water to people without access to safe water
supplies i.e. 2 drops of AquaQure per liter of water kills up to 99.999 % of all bacteria. It has also been
successfully used to eliminate algal blooms in dams as well as kill mosquito larvae that cause malaria.
3.4 Experimental materials and methods
For the experiments, poly(vinyl alcohol) (PVA), (Mw 146000-186000, 87-89% hydrolyzed) was
obtained from Sigma Aldrich, South Africa and used without further purification. Distilled water was
used as the solvent. AquaQure biocide was obtained from AquaQure water solutions, South Africa.
The crosslinking agent glyoxal and concentrated hydrochloric acid were also obtained from Sigma
Aldrich, South Africa. The experimental methods are summarized in the chart in Figure 3.1.
Stellenbosch University http://scholar.sun.ac.za
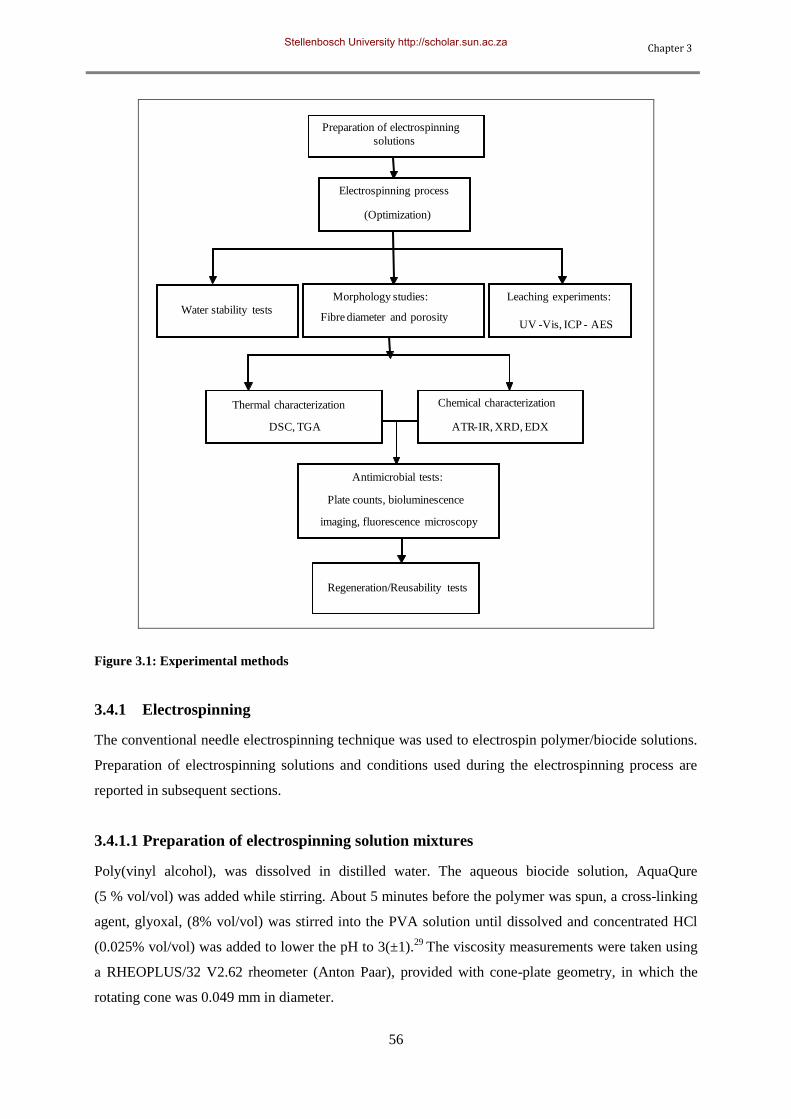
Chapter 3
56
Preparation of electrospinning
solutions
Electrospinning process
(Optimization)
Morphology studies:
Fibre diameter and porosityWater stability tests
Leaching experiments:
UV -Vis, ICP -
Antimicrobial tests:
Plate counts, bioluminescence
imaging, fluorescence microscopy
Chemical characterization
ATR-IR, XRD, EDX
Thermal characterization
DSC, TGA
Regeneration/Reusability tests
AES
Figure 3.1: Experimental methods
3.4.1 Electrospinning
The conventional needle electrospinning technique was used to electrospin polymer/biocide solutions.
Preparation of electrospinning solutions and conditions used during the electrospinning process are
reported in subsequent sections.
3.4.1.1 Preparation of electrospinning solution mixtures
Poly(vinyl alcohol), was dissolved in distilled water. The aqueous biocide solution, AquaQure
(5 % vol/vol) was added while stirring. About 5 minutes before the polymer was spun, a cross-linking
agent, glyoxal, (8% vol/vol) was stirred into the PVA solution until dissolved and concentrated HCl
(0.025% vol/vol) was added to lower the pH to 3(±1).29
The viscosity measurements were taken using
a RHEOPLUS/32 V2.62 rheometer (Anton Paar), provided with cone-plate geometry, in which the
rotating cone was 0.049 mm in diameter.
Stellenbosch University http://scholar.sun.ac.za
Chapter 3
57
3.4.1.2 The electrospinning process
The basic needle electrospinning process was adopted for fabricating nanofibres from polymer
solutions. The setup consisted of a high voltage positive DC power supply between two electrodes (one
of which acts as a grounded electrode) and a pipette with a capillary tip opening of approximately 0.1
mm which was the polymer reservoir.30
A copper wire electrode was inserted into the nose of the
pipette to about 5 mm from the end. All spinning was conducted inside a fume-hood (without the
extraction fan operating) and both temperature and relative humidity were monitored. All fibres were
spun from a 45 angle to prevent droplets on the spun mat and to minimize wastage through dripping.
The grounded electrode was attached to an aluminium foil which acted as the collector plate.
Another crucial factor influencing the electrospinning process is the field created as a result of the high
applied voltage. Conducting materials such as stands, clamps etc. used during electrospinning
influence the electromagnetic field and hence the morphology of the produced nanofibres.
Furthermore, these conductors build up static electricity that can be very dangerous. For this reason,
great care was taken to ensure safety and non-conductors were used as far as possible. PVC piping was
used to build a rig to hold the glass pipette that acted as the solution reservoir and polystyrene was also
used to insulate all other conducting material. All samples were then heat treated in an oven at 60°C for
72 hours to enhance crosslinking and to remove any residual solvent prior to any analysis.
3.4.2 Scanning electron microscopy (SEM)
The morphology of crosslinked electrospun PVA/AquaQure fibres was observed with scanning
electron microscopy (SEM). Analyses were performed at the University of Stellenbosch Microscopy
Unit on a Leo® 1430VP and a Cambridge S200 scanning electron microscope after gold sputter
coating was applied. The conditions for image acquisition were an accelerating voltage of 7 kV and a
probe current of 150 pico amperes (pA) for the former and an accelerating voltage of 10 kV and a
probe current of 50 pA for the latter. For determination of fibre diameters the SEM-Img-studio
software which runs using the National Instruments LVRunTime Engine, version 1.1.0 was used.
Energy dispersive X-ray spectroscopy (EDX) which is a chemical microanalysis technique used in
conjunction with SEM was also performed to confirm the incorporation of AquaQure in the fibres.
3.4.2.1 Fibre diameter
For purposes of fibre diameter measurements, electrospun PVA and PVA/AquaQure fibre mats were
viewed under the SEM at a magnification of between 1000 to 5000X depending on the spinning
conditions and thus fibre diameters. This magnification range was chosen such that up to 50 fibres
were included in the image. Each image was then processed using SEM_Img_Studio Software. A
minimum of 15 measurements was taken and the highest and lowest values discarded prior to
calculating the average. Solvent beaded and clumped fibres were ignored.
Stellenbosch University http://scholar.sun.ac.za
Chapter 3
58
3.4.2.2 Fibre roughness and porosity
The porosity of nanofibre mats is a very important parameter especially because it determines the air
and water permeability through the fibre mat.31
To measure pore sizes, area light intensity scans were
performed using the Scanning Probe Image Processor (SPIP) Image Metrology A/S, version 5.1.3
software. This software uses SEM images to calculate fibre mat porosity.
3.4.3 X-ray diffraction (XRD)
The chemical composition of the electrospun material was also determined using X-ray diffraction
(XRD). The XRD measurements were performed on a PANalytical X‟Pert PRO MPD diffractometer
with X‟Celerator detector and fixed divergence slits using filtered CuKα radiation. The diffraction
patterns were recorded at a pulse count rate of 1000 cps in an angular interval of 5°–40°.
3.4.4 Attenuated total reflectance-Fourier transform infra-red spectroscopy
(ATR/FTIR)
A Nexus FT-IR provided by Nicolet Thermo equipped with a FTIR gas analyser was used for ATR-
FTIR studies. The spectrometer was fitted with a diamond crystal and measurements were taken in the
600 cm-1
to 4000 cm-1
infra-red range at a resolution of 6 cm-1
. The spectra were based on a total of 32
scans per sample. The ATR-IR spectra were used to compare the molecular finger prints of PVA
only and PVA/AquaQure nanofibres.
3.4.5 Thermogravimetric analysis (TGA)
Thermogravimetric analysis of the crosslinked PVA and PVA/AquaQure nanofibres was performed on
a Q500 thermogravimetric analyser in air at 10°C.min-1
to determine their stability as well as to
establish the effect of AquaQure on the stability of the fibres. This instrument determines changes in
weight in relation to change in temperature, which translates to the ability of the material to withstand
high temperatures. Weight loss in % was used over the temperature range 0-900°C.
3.4.6 Differential scanning calorimetry (DSC)
To investigate the crystallinity of the fibres, differential scanning calorimetry studies were carried out.
All DSC thermograms were recorded on Q100 thermogravimetric analyser in nitrogen gas at a heating
rate of 10°C.min-1
. Heat flow over a temperature range of 0-300°C was recorded.
3.4.7 Antimicrobial characterization
To determine the antimicrobial efficiency of the nanofibres, the basic plate counting technique was
adopted. The antimicrobial tests were confirmed with bioluminescent imaging and LIVE/DEAD
Baclight to determine the antimicrobial efficiency against viable but non-culturable (VNBC) cells.
Stellenbosch University http://scholar.sun.ac.za
Chapter 3
59
This was done to quantify the cells that enter a dormant state during contact with the antimicrobial
fibres and to eliminate the changes of overestimating the antimicrobial efficiency of the nanofibres.
3.4.7.1 Plate counts
Klebsiella pneumoniae Xen 39, Staphylococcus aureus Xen 36, Escherichia coli Xen 14,
Pseudomonas aeruginosa Xen 5 and Salmonella typhimurium Xen 26 (Caliper Life Sciences,
Hopkinton, MA) are pathogenic bacterial strains genetically modified with the luxABCDE operon so
that they bioluminesce when metabolically active. Each pathogen was cultured in 10 mL Brain Heart
Infusion (BHI) broth (Biolab Diagnostics) along with the appropriate antibiotics overnight on a
rotating wheel at 37˚C. For each strain, cells were pelleted by 10 min centrifugation at 3000 rpm, and
washed 3 times with physiological water. Spiked water samples were prepared by inoculating 106
CFU/mL of each strain into 500 mL sterile physiological water. Several control (cell viability)
experiments (not reported here) were carried out to determine if osmotic lysing which is common
when cells (especially gram negative) are removed from rich media into physiological water did not
occur. The CFU/ml were measured using a Biorad smart spec™ plus spectrophotometer.
The spiked water was then filtered through pristine PVA (control) or PVA/AquaQure fibre coated 0.22
µm nanofibres as illustrated in Figure 3.2. Thenanofibres were then rinsed several times using 10 mL
physiological water to wash off all remaining bacterial cells and the wash-off water was plated out on
BHI agar plates to determine living cells. This was done after specific contact periods to determine
cell death as a function of time. After incubating the plates overnight at 37˚C, colony counting was
used to determine the antimicrobial effect of the filters. The experiment was performed for each
pathogen and each specific contact period in triplicate. In order to mimic a real life scenario where
bacteria species co-exist, 20µL of each pathogen was inoculated into the same tube containing 10mL
BHI broth to make a cocktail of the strains and antimicrobial tests were conducted as described
previously. Immediately following filtration, some of the samples were fixed in 2.5% (v/v)
gluteraldehyde in PBS at 4°C for 4 hours and followed by air drying in preparation for SEM
imaging
Stellenbosch University http://scholar.sun.ac.za
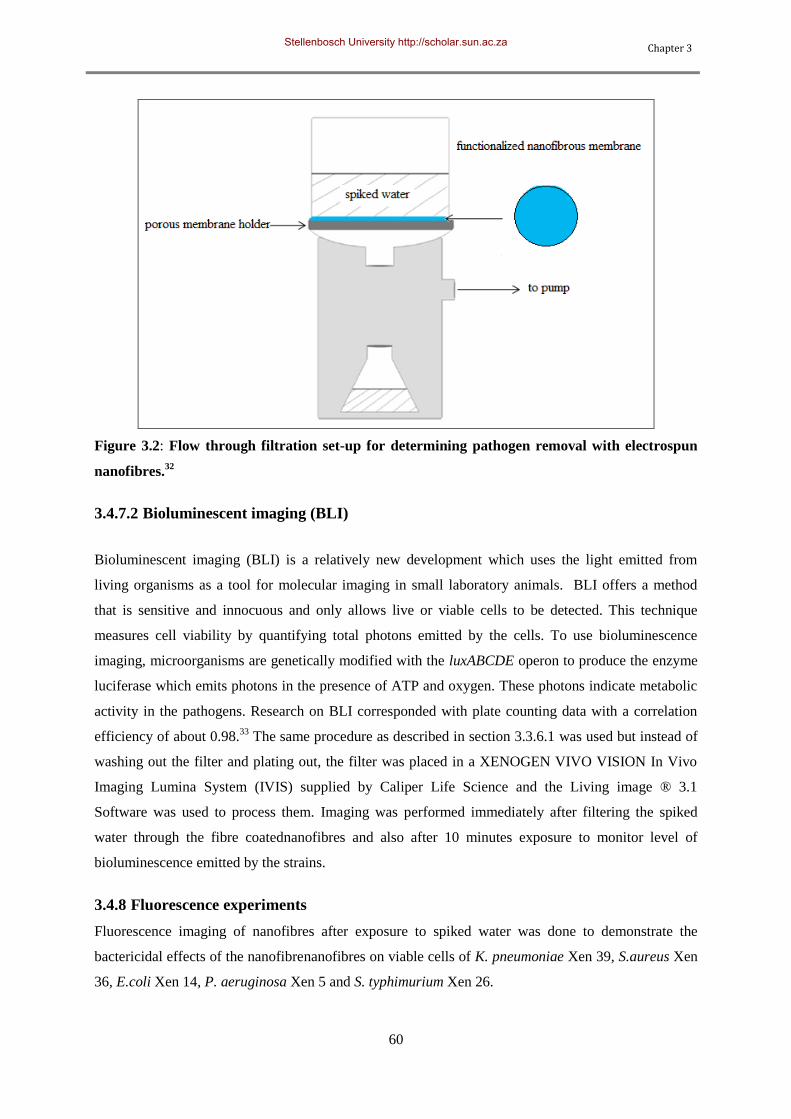
Chapter 3
60
Figure 3.2: Flow through filtration set-up for determining pathogen removal with electrospun
nanofibres.32
3.4.7.2 Bioluminescent imaging (BLI)
Bioluminescent imaging (BLI) is a relatively new development which uses the light emitted from
living organisms as a tool for molecular imaging in small laboratory animals. BLI offers a method
that is sensitive and innocuous and only allows live or viable cells to be detected. This technique
measures cell viability by quantifying total photons emitted by the cells. To use bioluminescence
imaging, microorganisms are genetically modified with the luxABCDE operon to produce the enzyme
luciferase which emits photons in the presence of ATP and oxygen. These photons indicate metabolic
activity in the pathogens. Research on BLI corresponded with plate counting data with a correlation
efficiency of about 0.98.33
The same procedure as described in section 3.3.6.1 was used but instead of
washing out the filter and plating out, the filter was placed in a XENOGEN VIVO VISION In Vivo
Imaging Lumina System (IVIS) supplied by Caliper Life Science and the Living image ® 3.1
Software was used to process them. Imaging was performed immediately after filtering the spiked
water through the fibre coatednanofibres and also after 10 minutes exposure to monitor level of
bioluminescence emitted by the strains.
3.4.8 Fluorescence experiments
Fluorescence imaging of nanofibres after exposure to spiked water was done to demonstrate the
bactericidal effects of the nanofibrenanofibres on viable cells of K. pneumoniae Xen 39, S.aureus Xen
36, E.coli Xen 14, P. aeruginosa Xen 5 and S. typhimurium Xen 26.
Stellenbosch University http://scholar.sun.ac.za
Chapter 3
61
3.4.8.1 Sample preparation
Fibres (10 mg) were exposed to the pathogen cocktail described in section 2.4 along with the
appropriate antibiotics overnight on a rotating wheel at 37˚C. After that the fibres were taken out of
the media using forceps and rinsed lightly using physiological water.
3.4.8.2 Fluorescent staining
The LIVE/DEAD BacLight kit with SYTO 9 and propidium iodide fluorescent dyes were used
(Molecular Probes Inc.). SYTO 9 stains all cells green, while propidium iodide penetrates cells whose
cell membrane has been damaged and stains them red. Both reagents are contained in a solution of
anhydrous dimethylsulfoxide (DMSO). Viable and total counts can be obtained in one staining step.
The intensity of fluorescence is high, with a strong contrast between the red and green cells and
background fluorescence is minimal. Staining was done by incubation of samples with 6.5 μM dye at
room temperature for 10 min.
3.4.8.3 Microscopy
These samples were then observed on an Olympus Cell^R system attached to an IX-81 inverted
fluorescence microscope equipped with a F-view-II cooled CCD camera (Soft Imaging Systems).
Using a Xenon-Arc burner (Olympus Biosystems GMBH) as light source, images were excited with
the 472 nm or 572 nm excitation filter. Emission was collected using a UBG triple- bandpass emission
filter cube. For the image frame acquisition, an Olympus Plan Apo N 60x/1.4 Oil objective and the
Cell^R imaging software were used. Images were processed and background-subtracted using the
Cell^R software.
3.4.8.4 Regeneration tests
The reusability of a membrane prior to it being replaced is a very important factor in filtration systems.
To establish the number of times PVA/AquaQure nanofibres could be used before losing their
antimicrobial efficiency, regeneration tests were conducted. This was done by rinsing the fibres with
sterile de-mineralised water three times followed by rinsing with physiological water and irradiation
with ultra violet light. Thesenanofibres were then reused to filter spiked water as described in previous
sections and their antimicrobial effectiveness was measured over six cycles. Morphological changes
on the nanofibres were monitored using SEM imaging.
3.4.9 Testing of water stability
In order to determine stability of the electrospun fibres in liquid media, weighed quantities (0.025 g) of
the PVA and PVA/AquaQure nanofibre mats were immersed in distilled water at room temperature for
4 hours. These fibres were then blotted dry with tissue paper and weighed to obtain the wet weight
Stellenbosch University http://scholar.sun.ac.za
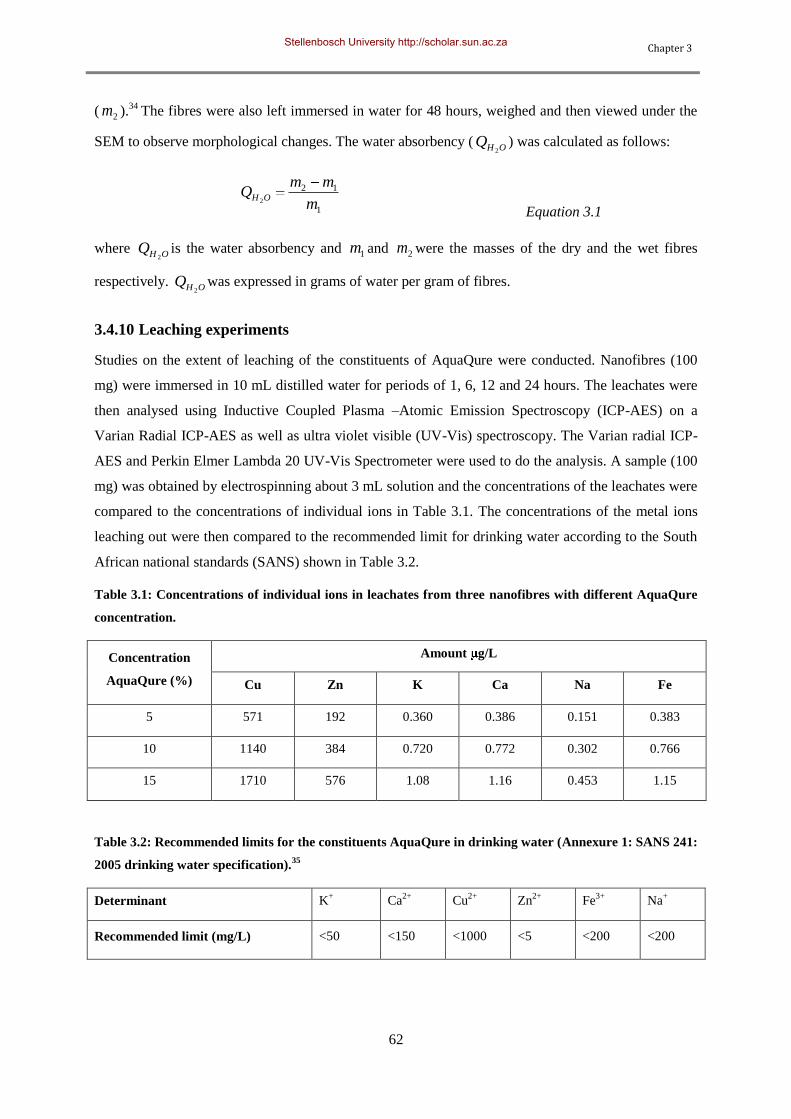
Chapter 3
62
( 2m ).34
The fibres were also left immersed in water for 48 hours, weighed and then viewed under the
SEM to observe morphological changes. The water absorbency (OHQ
2) was calculated as follows:
1
12
2 m
mmQ OH
Equation 3.1
where OHQ
2is the water absorbency and 1m and 2m were the masses of the dry and the wet fibres
respectively. OHQ
2was expressed in grams of water per gram of fibres.
3.4.10 Leaching experiments
Studies on the extent of leaching of the constituents of AquaQure were conducted. Nanofibres (100
mg) were immersed in 10 mL distilled water for periods of 1, 6, 12 and 24 hours. The leachates were
then analysed using Inductive Coupled Plasma –Atomic Emission Spectroscopy (ICP-AES) on a
Varian Radial ICP-AES as well as ultra violet visible (UV-Vis) spectroscopy. The Varian radial ICP-
AES and Perkin Elmer Lambda 20 UV-Vis Spectrometer were used to do the analysis. A sample (100
mg) was obtained by electrospinning about 3 mL solution and the concentrations of the leachates were
compared to the concentrations of individual ions in Table 3.1. The concentrations of the metal ions
leaching out were then compared to the recommended limit for drinking water according to the South
African national standards (SANS) shown in Table 3.2.
Table 3.1: Concentrations of individual ions in leachates from three nanofibres with different AquaQure
concentration.
Concentration
AquaQure (%)
Amount g/L
Cu Zn K Ca Na Fe
5 571 192 0.360 0.386 0.151 0.383
10 1140 384 0.720 0.772 0.302 0.766
15 1710 576 1.08 1.16 0.453 1.15
Table 3.2: Recommended limits for the constituents AquaQure in drinking water (Annexure 1: SANS 241:
2005 drinking water specification).35
Determinant K+ Ca
2+ Cu
2+ Zn
2+ Fe
3+ Na
+
Recommended limit (mg/L) <50 <150 <1000 <5 <200 <200
Stellenbosch University http://scholar.sun.ac.za
Chapter 3
63
3.4.11 The effect of electrospinning variables
To establish the right conditions for the electrospinning process, several parameters which have an
effect on the electrospinning process and resultant nanofibre webs were investigated. The following
sections describe how each of the parameters were investigated.
3.4.11.1 The effect of biocide concentration
Addition of the biocide solution made the PVA solution visibly less viscous compared to the
unmodified control. This triggered an interest to study the effect of the AquaQure ions on the viscosity
of the PVA/AquaQure electrospinning mixtures. Therefore, different concentrations (5-15% vol/vol)
of AquaQure were added to PVA samples. The viscosity of the samples was then monitored over a
period of 15 minutes.
3.4.11.2 The effect of tip-collector distance
The effect of the distance between the tip of the needle and the collector was studied using fibres
electrospun from 5% v/v AquaQure, 8% vol/vol glyoxal and 10% wt/v PVA solution. The distances
investigated were 10, 15 and 20 cm.
3.4.11.3 The effect of applied voltage
A series of experiments were also carried out to establish whether changing the voltage had any
impact on fibre diameter. The electrospun solution had 10% w/w PVA with 8% v/v glyoxal and 5 %
v/v AquaQure spun at a distance of 15 cm. The applied voltage was varied from 10 to 20 kV and the
tip to target distance was maintained at 15 cm.
3.4.11.4 The effect of crosslinking agent
The concentration of the crosslinking agent present in a polymer is the major parameter of the degree
of crosslinking in the resultant polymer matrix. Over crosslinked polymer nanofibres give a smudgy
morphology and this has an effect on the surface area and thus the filtration efficiency of the nanofibre
mat. The effect of the amount of crosslinking agent (glyoxal) on the fibre diameter and morphology
was studied. The time between the addition of glyoxal and the start of electrospinning was varied (1, 3
and 5 minutes) and the resultant fibres were compared. There was no significant difference in the
morphology of the fibres and the intermediate time (3 minute) was used for further experiments.
Solutions of PVA/AquaQure with different amounts of glyoxal (0.04M PVA/AquaQure: 0.01M
glyoxal; 0.04M PVA/AquaQure: 0.002M glyoxal and 0.04M PVA/AquaQure: 0.004M glyoxal) were
prepared and electrospun to investigate the effect of varying the OH groups available for crosslinking
with glyoxal. The polymer concentrations were in excess to the crosslinking agent and this resulted in
ease of the crosslinking reaction between the PVA hydroxyl group and the carbonyl oxygen in the
glyoxal.
Stellenbosch University http://scholar.sun.ac.za
Chapter 3
64
3.4.11.5 The effect of crosslinking on fibre stability and strength
The effect of crosslinking on the morphological stability of PVA/AquaQure fibres was investigated.
The fibre mat was immersed in distilled water for an hour, it was then removed from the water using
forceps and pat dried using a paper wipe to remove just enough water to stop dripping (no squashing
of fibre mat). The fibre mat was then oven dried for 2 hours at 60°C and gold coated to enhance
viewing under the SEM.
3.5 Results and discussion
This section outlines findings of the study and either supports or refutes them based on relevant
literature. Results on the optimization of the electrospinning process, morphology of the fibres are
discussed in this section. Additionally, chemical, antimicrobial and mechanical results are reported
and discussed. Findings on the stability of the fibres in liquid media and their extent of leaching are
also reported.
3.5.1 Morphology of the fibres
In this section, findings on the surface morphology of the fibres are reported. This was investigated
using SEM and the SEM_Img_Studio and SPIS softwares.
3.5.1.1 Fibre diameter
Fibre diameter was measured from SEM images using the SEM_Img_Studio software. From Figure
3.3A, it is noted that PVA/AquaQure nanofibrous mats had fibres in the 100 to 300 nm diameter
range. Although there is no specific diameter range for nanofibrous materials in filter applications,
according to the filtration theory, smaller fibre sizes give better filtration efficiency.36
The smaller
fibre result in high surface to volume ratios which are advantageous for filtration application. This was
a good property since it increased the surface area for water filtration.
3.5.1.2 Mat porosity
SEM images were also analysed using the SPIS software to determine the pore sizes between the
fibres. The average distribution was taken from 10 images for four different ranges (5-50, 51-100, 101-
150 and 151-200 nm2) as illustrated in Figure 3.3B. As shown by this figure, about 70% of the pores
were in the 5-50 nm2 range. The sizes of the mat pores were very important for this study since, for
accuracy in measuring antimicrobial efficacy, the pores had to be smaller than the sizes of the studied
bacteria strains. The recorded pore sizes were all less than 250 nm2 and therefore appropriate for
further tests.
Stellenbosch University http://scholar.sun.ac.za
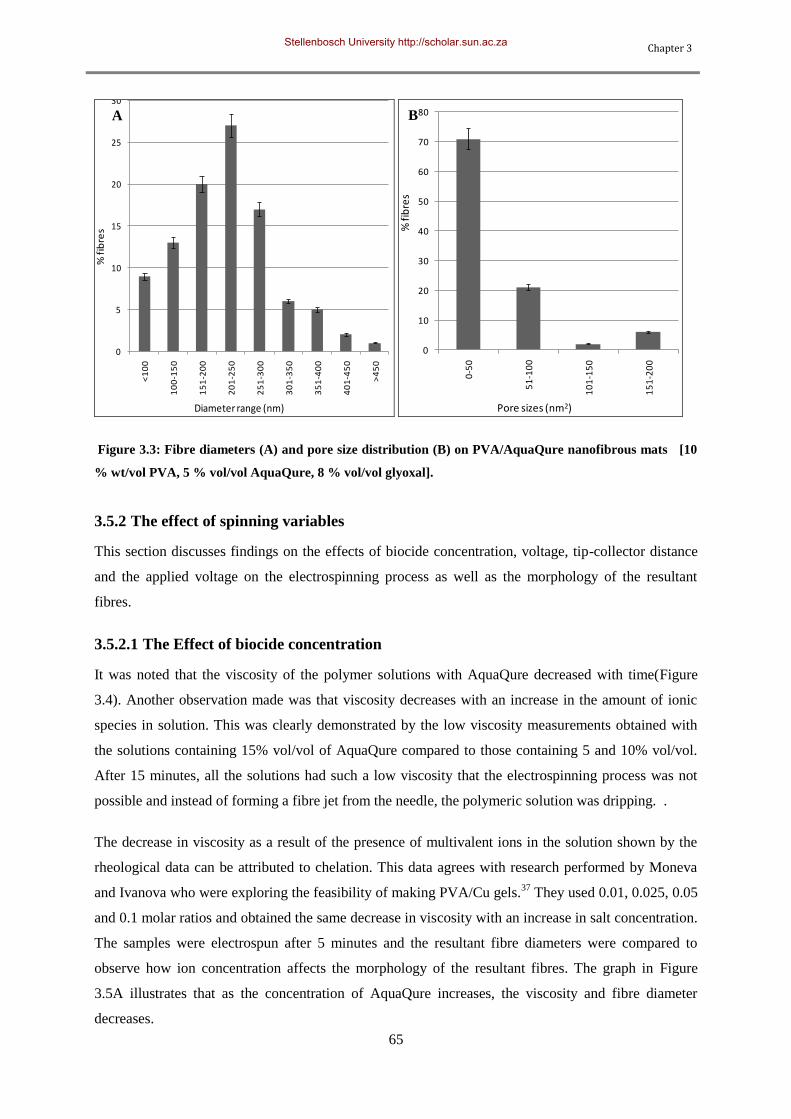
Chapter 3
65
0
5
10
15
20
25
30
<1
00
10
0-1
50
15
1-2
00
20
1-2
50
25
1-3
00
30
1-3
50
35
1-4
00
40
1-4
50
>4
50
Diameter range (nm)
% fi
bre
s
0
10
20
30
40
50
60
70
80
0-5
0
51
-10
0
10
1-1
50
15
1-2
00
Pore sizes (nm2)%
fib
res
Figure 3.3: Fibre diameters (A) and pore size distribution (B) on PVA/AquaQure nanofibrous mats [10
% wt/vol PVA, 5 % vol/vol AquaQure, 8 % vol/vol glyoxal].
3.5.2 The effect of spinning variables
This section discusses findings on the effects of biocide concentration, voltage, tip-collector distance
and the applied voltage on the electrospinning process as well as the morphology of the resultant
fibres.
3.5.2.1 The Effect of biocide concentration
It was noted that the viscosity of the polymer solutions with AquaQure decreased with time(Figure
3.4). Another observation made was that viscosity decreases with an increase in the amount of ionic
species in solution. This was clearly demonstrated by the low viscosity measurements obtained with
the solutions containing 15% vol/vol of AquaQure compared to those containing 5 and 10% vol/vol.
After 15 minutes, all the solutions had such a low viscosity that the electrospinning process was not
possible and instead of forming a fibre jet from the needle, the polymeric solution was dripping. .
The decrease in viscosity as a result of the presence of multivalent ions in the solution shown by the
rheological data can be attributed to chelation. This data agrees with research performed by Moneva
and Ivanova who were exploring the feasibility of making PVA/Cu gels.37
They used 0.01, 0.025, 0.05
and 0.1 molar ratios and obtained the same decrease in viscosity with an increase in salt concentration.
The samples were electrospun after 5 minutes and the resultant fibre diameters were compared to
observe how ion concentration affects the morphology of the resultant fibres. The graph in Figure
3.5A illustrates that as the concentration of AquaQure increases, the viscosity and fibre diameter
decreases.
A B
A
Stellenbosch University http://scholar.sun.ac.za
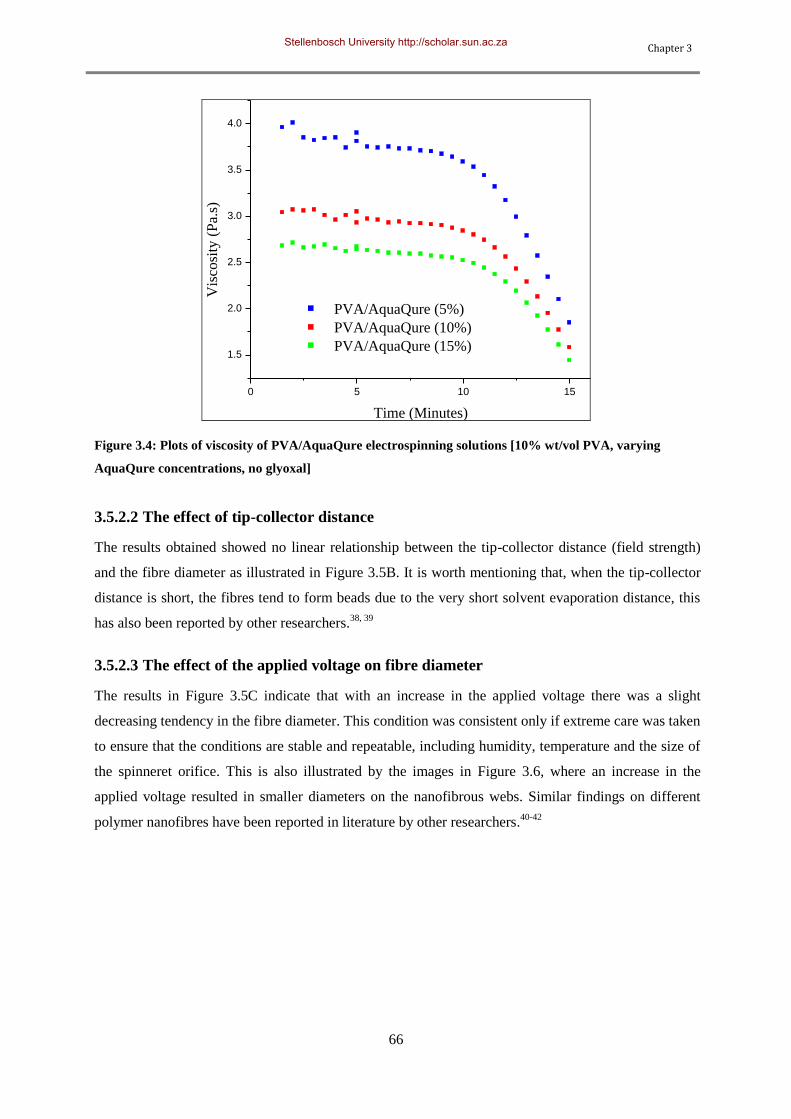
Chapter 3
66
0 5 10 15
1.5
2.0
2.5
3.0
3.5
4.0
Vis
cosi
ty (
Pa.
s)
Time (Minutes)
PVA/AquaQure (5%)
PVA/AquaQure (10%)
PVA/AquaQure (15%)
Figure 3.4: Plots of viscosity of PVA/AquaQure electrospinning solutions [10% wt/vol PVA, varying
AquaQure concentrations, no glyoxal]
3.5.2.2 The effect of tip-collector distance
The results obtained showed no linear relationship between the tip-collector distance (field strength)
and the fibre diameter as illustrated in Figure 3.5B. It is worth mentioning that, when the tip-collector
distance is short, the fibres tend to form beads due to the very short solvent evaporation distance, this
has also been reported by other researchers.38, 39
3.5.2.3 The effect of the applied voltage on fibre diameter
The results in Figure 3.5C indicate that with an increase in the applied voltage there was a slight
decreasing tendency in the fibre diameter. This condition was consistent only if extreme care was taken
to ensure that the conditions are stable and repeatable, including humidity, temperature and the size of
the spinneret orifice. This is also illustrated by the images in Figure 3.6, where an increase in the
applied voltage resulted in smaller diameters on the nanofibrous webs. Similar findings on different
polymer nanofibres have been reported in literature by other researchers.40-42
Stellenbosch University http://scholar.sun.ac.za
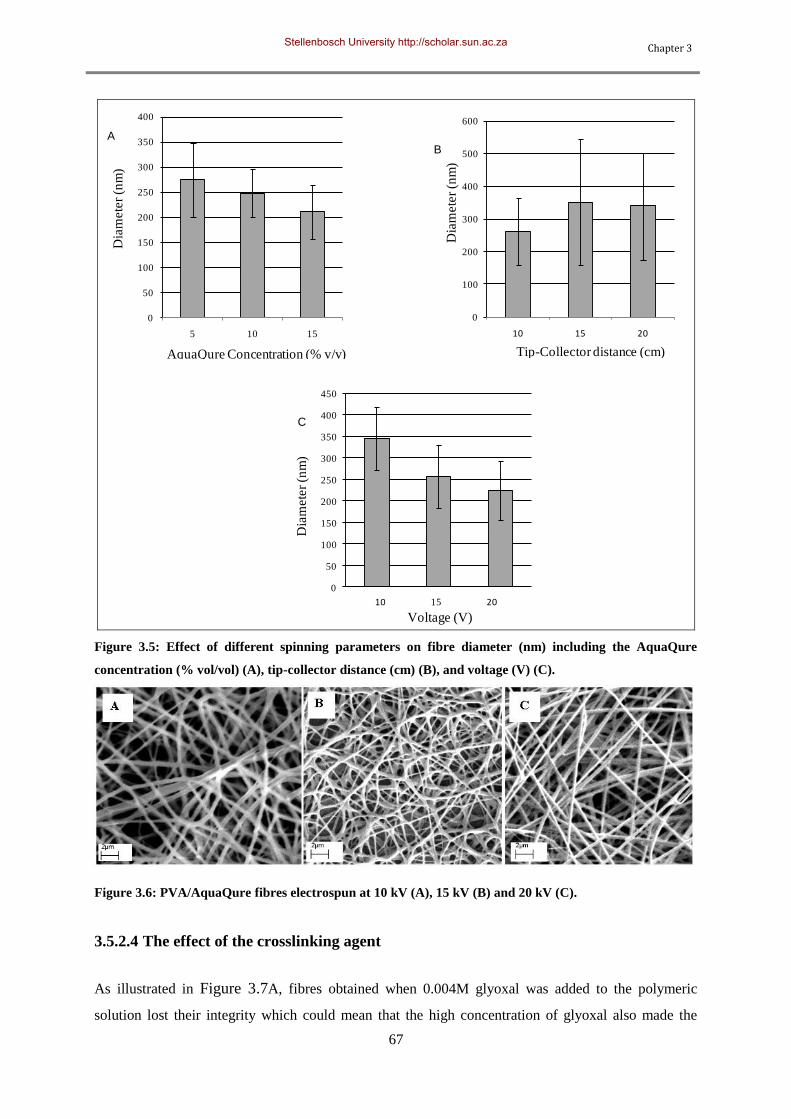
Chapter 3
67
0
50
100
150
200
250
300
350
400
5 10 15
AquaQure Concentration (% v/v)
Dia
mete
r (n
m)
0
100
200
300
400
500
600
10 15 20
Tip-Collector distance (cm)
Dia
mete
r (n
m)
0
50
100
150
200
250
300
350
400
450
Voltage (V)
10 15 20
Dia
mete
r (n
m)
AB
C
Figure 3.5: Effect of different spinning parameters on fibre diameter (nm) including the AquaQure
concentration (% vol/vol) (A), tip-collector distance (cm) (B), and voltage (V) (C).
Figure 3.6: PVA/AquaQure fibres electrospun at 10 kV (A), 15 kV (B) and 20 kV (C).
3.5.2.4 The effect of the crosslinking agent
As illustrated in Figure 3.7A, fibres obtained when 0.004M glyoxal was added to the polymeric
solution lost their integrity which could mean that the high concentration of glyoxal also made the
Stellenbosch University http://scholar.sun.ac.za
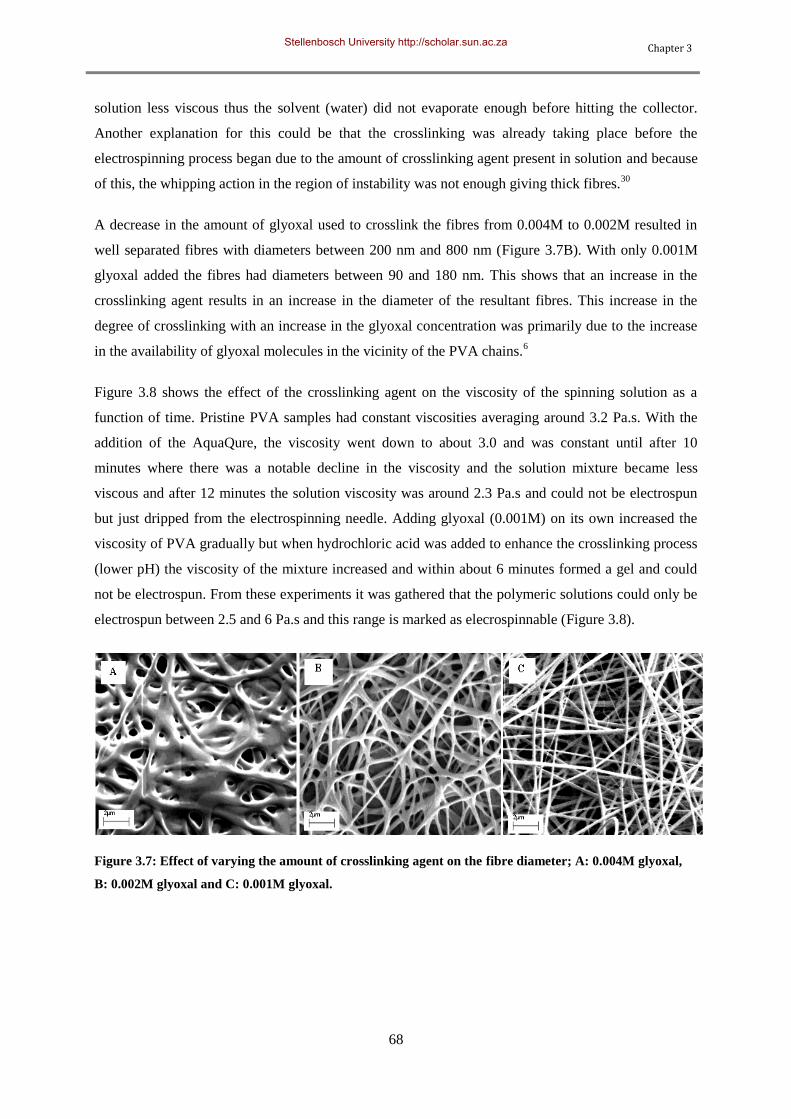
Chapter 3
68
solution less viscous thus the solvent (water) did not evaporate enough before hitting the collector.
Another explanation for this could be that the crosslinking was already taking place before the
electrospinning process began due to the amount of crosslinking agent present in solution and because
of this, the whipping action in the region of instability was not enough giving thick fibres.30
A decrease in the amount of glyoxal used to crosslink the fibres from 0.004M to 0.002M resulted in
well separated fibres with diameters between 200 nm and 800 nm (Figure 3.7B). With only 0.001M
glyoxal added the fibres had diameters between 90 and 180 nm. This shows that an increase in the
crosslinking agent results in an increase in the diameter of the resultant fibres. This increase in the
degree of crosslinking with an increase in the glyoxal concentration was primarily due to the increase
in the availability of glyoxal molecules in the vicinity of the PVA chains.6
Figure 3.8 shows the effect of the crosslinking agent on the viscosity of the spinning solution as a
function of time. Pristine PVA samples had constant viscosities averaging around 3.2 Pa.s. With the
addition of the AquaQure, the viscosity went down to about 3.0 and was constant until after 10
minutes where there was a notable decline in the viscosity and the solution mixture became less
viscous and after 12 minutes the solution viscosity was around 2.3 Pa.s and could not be electrospun
but just dripped from the electrospinning needle. Adding glyoxal (0.001M) on its own increased the
viscosity of PVA gradually but when hydrochloric acid was added to enhance the crosslinking process
(lower pH) the viscosity of the mixture increased and within about 6 minutes formed a gel and could
not be electrospun. From these experiments it was gathered that the polymeric solutions could only be
electrospun between 2.5 and 6 Pa.s and this range is marked as elecrospinnable (Figure 3.8).
Figure 3.7: Effect of varying the amount of crosslinking agent on the fibre diameter; A: 0.004M glyoxal,
B: 0.002M glyoxal and C: 0.001M glyoxal.
Stellenbosch University http://scholar.sun.ac.za
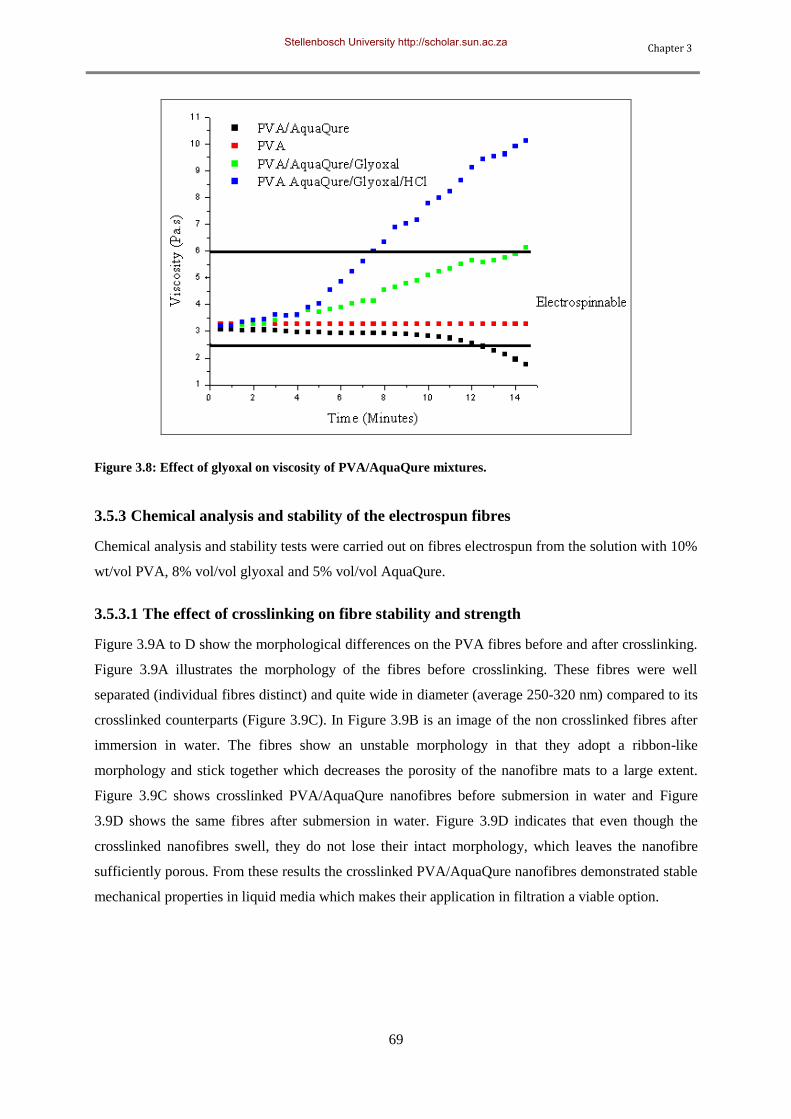
Chapter 3
69
Figure 3.8: Effect of glyoxal on viscosity of PVA/AquaQure mixtures.
3.5.3 Chemical analysis and stability of the electrospun fibres
Chemical analysis and stability tests were carried out on fibres electrospun from the solution with 10%
wt/vol PVA, 8% vol/vol glyoxal and 5% vol/vol AquaQure.
3.5.3.1 The effect of crosslinking on fibre stability and strength
Figure 3.9A to D show the morphological differences on the PVA fibres before and after crosslinking.
Figure 3.9A illustrates the morphology of the fibres before crosslinking. These fibres were well
separated (individual fibres distinct) and quite wide in diameter (average 250-320 nm) compared to its
crosslinked counterparts (Figure 3.9C). In Figure 3.9B is an image of the non crosslinked fibres after
immersion in water. The fibres show an unstable morphology in that they adopt a ribbon-like
morphology and stick together which decreases the porosity of the nanofibre mats to a large extent.
Figure 3.9C shows crosslinked PVA/AquaQure nanofibres before submersion in water and Figure
3.9D shows the same fibres after submersion in water. Figure 3.9D indicates that even though the
crosslinked nanofibres swell, they do not lose their intact morphology, which leaves the nanofibre
sufficiently porous. From these results the crosslinked PVA/AquaQure nanofibres demonstrated stable
mechanical properties in liquid media which makes their application in filtration a viable option.
Stellenbosch University http://scholar.sun.ac.za
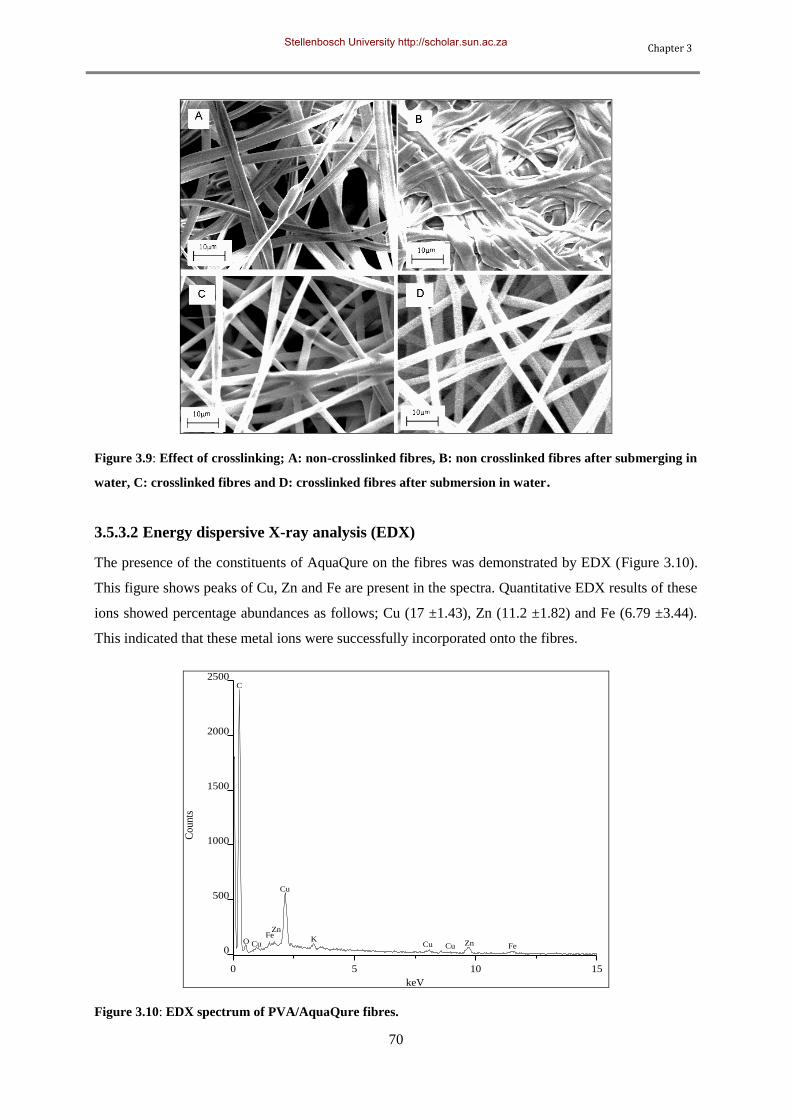
Chapter 3
70
Figure 3.9: Effect of crosslinking; A: non-crosslinked fibres, B: non crosslinked fibres after submerging in
water, C: crosslinked fibres and D: crosslinked fibres after submersion in water.
3.5.3.2 Energy dispersive X-ray analysis (EDX)
The presence of the constituents of AquaQure on the fibres was demonstrated by EDX (Figure 3.10).
This figure shows peaks of Cu, Zn and Fe are present in the spectra. Quantitative EDX results of these
ions showed percentage abundances as follows; Cu (17 ±1.43), Zn (11.2 ±1.82) and Fe (6.79 ±3.44).
This indicated that these metal ions were successfully incorporated onto the fibres.
0 5 10 15
0
500
1000
1500
2000
2500
ZnCu CuCu Fe
ZnFe
K
Cu
O
C
Counts
keV
Figure 3.10: EDX spectrum of PVA/AquaQure fibres.
Stellenbosch University http://scholar.sun.ac.za
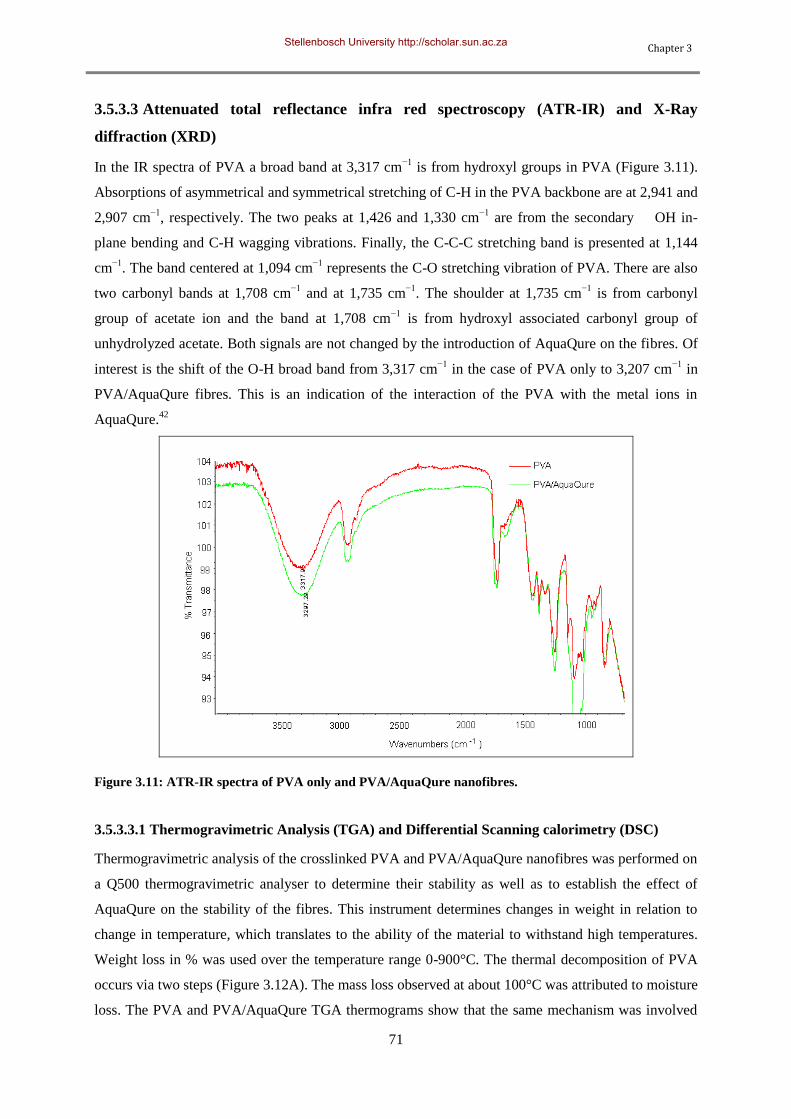
Chapter 3
71
3.5.3.3 Attenuated total reflectance infra red spectroscopy (ATR-IR) and X-Ray
diffraction (XRD)
In the IR spectra of PVA a broad band at 3,317 cm−1
is from hydroxyl groups in PVA (Figure 3.11).
Absorptions of asymmetrical and symmetrical stretching of C-H in the PVA backbone are at 2,941 and
2,907 cm−1
, respectively. The two peaks at 1,426 and 1,330 cm−1
are from the secondary OH in-
plane bending and C-H wagging vibrations. Finally, the C-C-C stretching band is presented at 1,144
cm−1
. The band centered at 1,094 cm−1
represents the C-O stretching vibration of PVA. There are also
two carbonyl bands at 1,708 cm−1
and at 1,735 cm−1
. The shoulder at 1,735 cm−1
is from carbonyl
group of acetate ion and the band at 1,708 cm−1
is from hydroxyl associated carbonyl group of
unhydrolyzed acetate. Both signals are not changed by the introduction of AquaQure on the fibres. Of
interest is the shift of the O-H broad band from 3,317 cm−1
in the case of PVA only to 3,207 cm−1
in
PVA/AquaQure fibres. This is an indication of the interaction of the PVA with the metal ions in
AquaQure.42
Figure 3.11: ATR-IR spectra of PVA only and PVA/AquaQure nanofibres.
3.5.3.3.1 Thermogravimetric Analysis (TGA) and Differential Scanning calorimetry (DSC)
Thermogravimetric analysis of the crosslinked PVA and PVA/AquaQure nanofibres was performed on
a Q500 thermogravimetric analyser to determine their stability as well as to establish the effect of
AquaQure on the stability of the fibres. This instrument determines changes in weight in relation to
change in temperature, which translates to the ability of the material to withstand high temperatures.
Weight loss in % was used over the temperature range 0-900°C. The thermal decomposition of PVA
occurs via two steps (Figure 3.12A). The mass loss observed at about 100°C was attributed to moisture
loss. The PVA and PVA/AquaQure TGA thermograms show that the same mechanism was involved
Stellenbosch University http://scholar.sun.ac.za
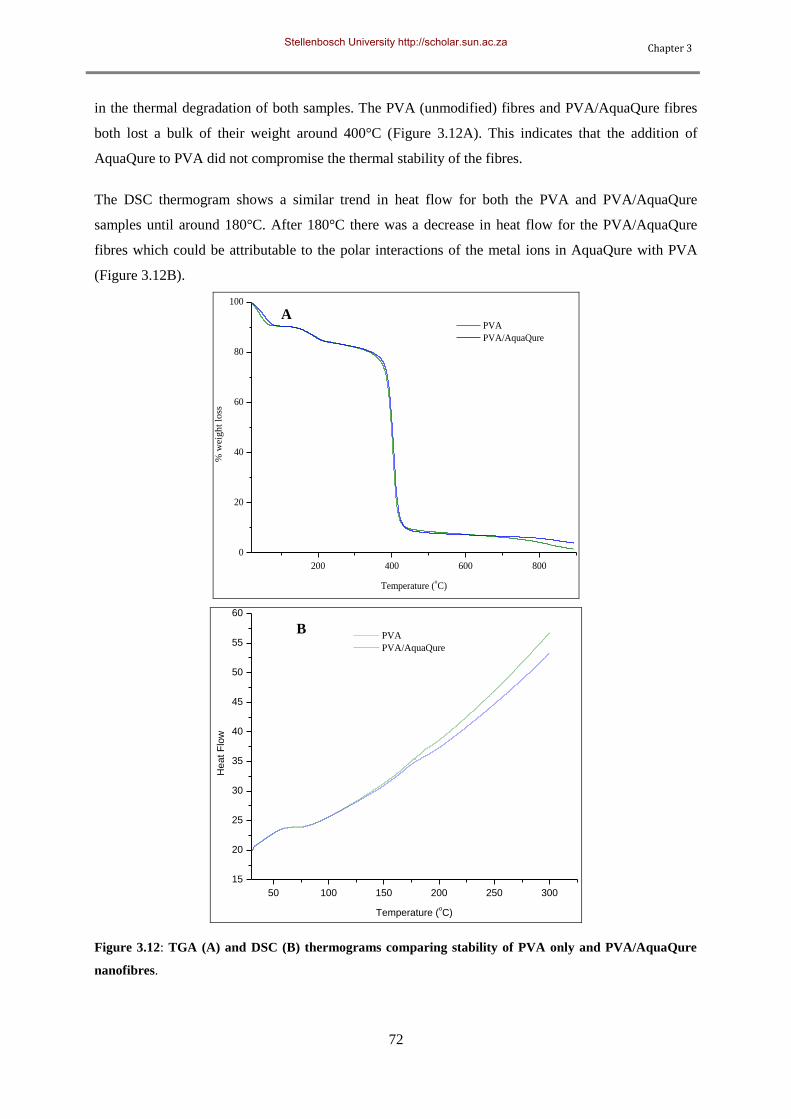
Chapter 3
72
in the thermal degradation of both samples. The PVA (unmodified) fibres and PVA/AquaQure fibres
both lost a bulk of their weight around 400°C (Figure 3.12A). This indicates that the addition of
AquaQure to PVA did not compromise the thermal stability of the fibres.
The DSC thermogram shows a similar trend in heat flow for both the PVA and PVA/AquaQure
samples until around 180°C. After 180°C there was a decrease in heat flow for the PVA/AquaQure
fibres which could be attributable to the polar interactions of the metal ions in AquaQure with PVA
(Figure 3.12B).
200 400 600 800
0
20
40
60
80
100
% w
eig
ht
loss
Temperature (oC)
PVA
PVA/AquaQure
50 100 150 200 250 300
15
20
25
30
35
40
45
50
55
60
He
at F
low
Temperature (oC)
PVA
PVA/AquaQure
Figure 3.12: TGA (A) and DSC (B) thermograms comparing stability of PVA only and PVA/AquaQure
nanofibres.
B
A
Stellenbosch University http://scholar.sun.ac.za
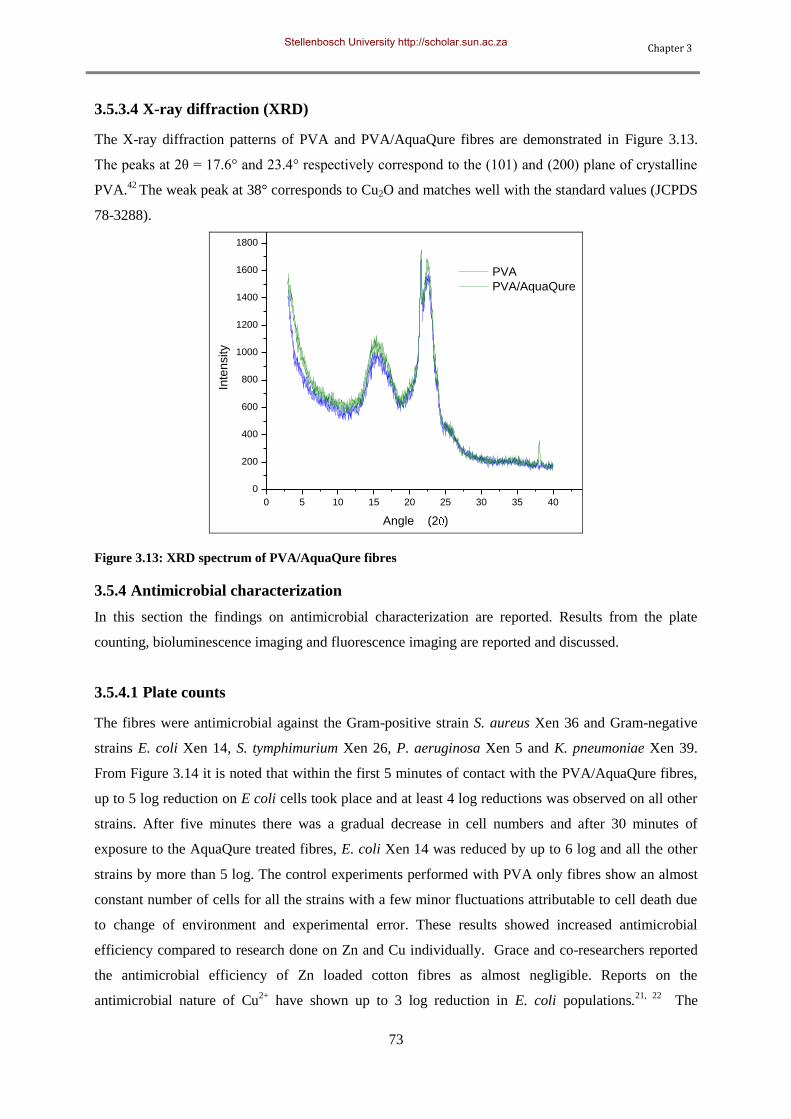
Chapter 3
73
3.5.3.4 X-ray diffraction (XRD)
The X-ray diffraction patterns of PVA and PVA/AquaQure fibres are demonstrated in Figure 3.13.
The peaks at 2θ = 17.6° and 23.4° respectively correspond to the (101) and (200) plane of crystalline
PVA.42
The weak peak at 38° corresponds to Cu2O and matches well with the standard values (JCPDS
78-3288).
0 5 10 15 20 25 30 35 40 45
0
200
400
600
800
1000
1200
1400
1600
1800
Inte
nsity
Angle (2 )
PVA
PVA/AquaQure
Figure 3.13: XRD spectrum of PVA/AquaQure fibres
3.5.4 Antimicrobial characterization
In this section the findings on antimicrobial characterization are reported. Results from the plate
counting, bioluminescence imaging and fluorescence imaging are reported and discussed.
3.5.4.1 Plate counts
The fibres were antimicrobial against the Gram-positive strain S. aureus Xen 36 and Gram-negative
strains E. coli Xen 14, S. tymphimurium Xen 26, P. aeruginosa Xen 5 and K. pneumoniae Xen 39.
From Figure 3.14 it is noted that within the first 5 minutes of contact with the PVA/AquaQure fibres,
up to 5 log reduction on E coli cells took place and at least 4 log reductions was observed on all other
strains. After five minutes there was a gradual decrease in cell numbers and after 30 minutes of
exposure to the AquaQure treated fibres, E. coli Xen 14 was reduced by up to 6 log and all the other
strains by more than 5 log. The control experiments performed with PVA only fibres show an almost
constant number of cells for all the strains with a few minor fluctuations attributable to cell death due
to change of environment and experimental error. These results showed increased antimicrobial
efficiency compared to research done on Zn and Cu individually. Grace and co-researchers reported
the antimicrobial efficiency of Zn loaded cotton fibres as almost negligible. Reports on the
antimicrobial nature of Cu2+
have shown up to 3 log reduction in E. coli populations.21, 22
The
Stellenbosch University http://scholar.sun.ac.za
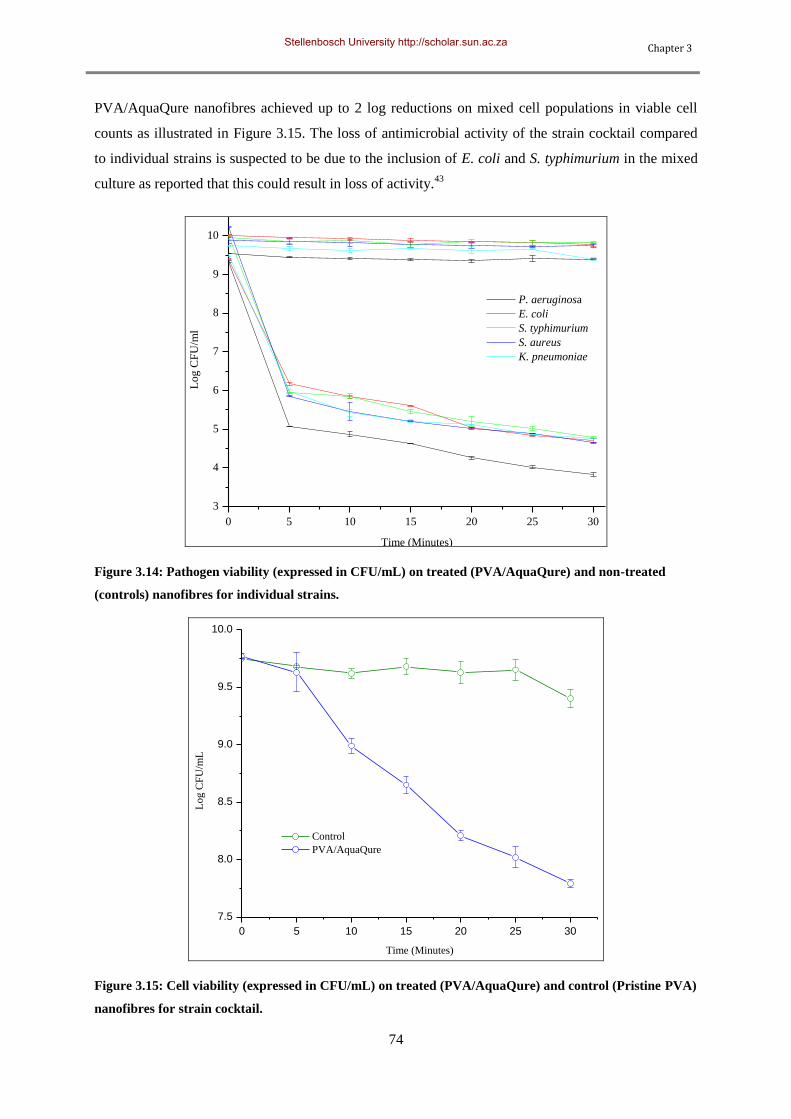
Chapter 3
74
PVA/AquaQure nanofibres achieved up to 2 log reductions on mixed cell populations in viable cell
counts as illustrated in Figure 3.15. The loss of antimicrobial activity of the strain cocktail compared
to individual strains is suspected to be due to the inclusion of E. coli and S. typhimurium in the mixed
culture as reported that this could result in loss of activity.43
0 5 10 15 20 25 30
3
4
5
6
7
8
9
10
11L
og
CF
U/m
l
Time (Minutes)
P. aeruginosa
E. coli
S. typhimurium
S. aureus
K. pneumoniae
Figure 3.14: Pathogen viability (expressed in CFU/mL) on treated (PVA/AquaQure) and non-treated
(controls) nanofibres for individual strains.
0 5 10 15 20 25 30
7.5
8.0
8.5
9.0
9.5
10.0
Lo
g C
FU
/mL
Time (Minutes)
Control
PVA/AquaQure
Figure 3.15: Cell viability (expressed in CFU/mL) on treated (PVA/AquaQure) and control (Pristine PVA)
nanofibres for strain cocktail.
Stellenbosch University http://scholar.sun.ac.za
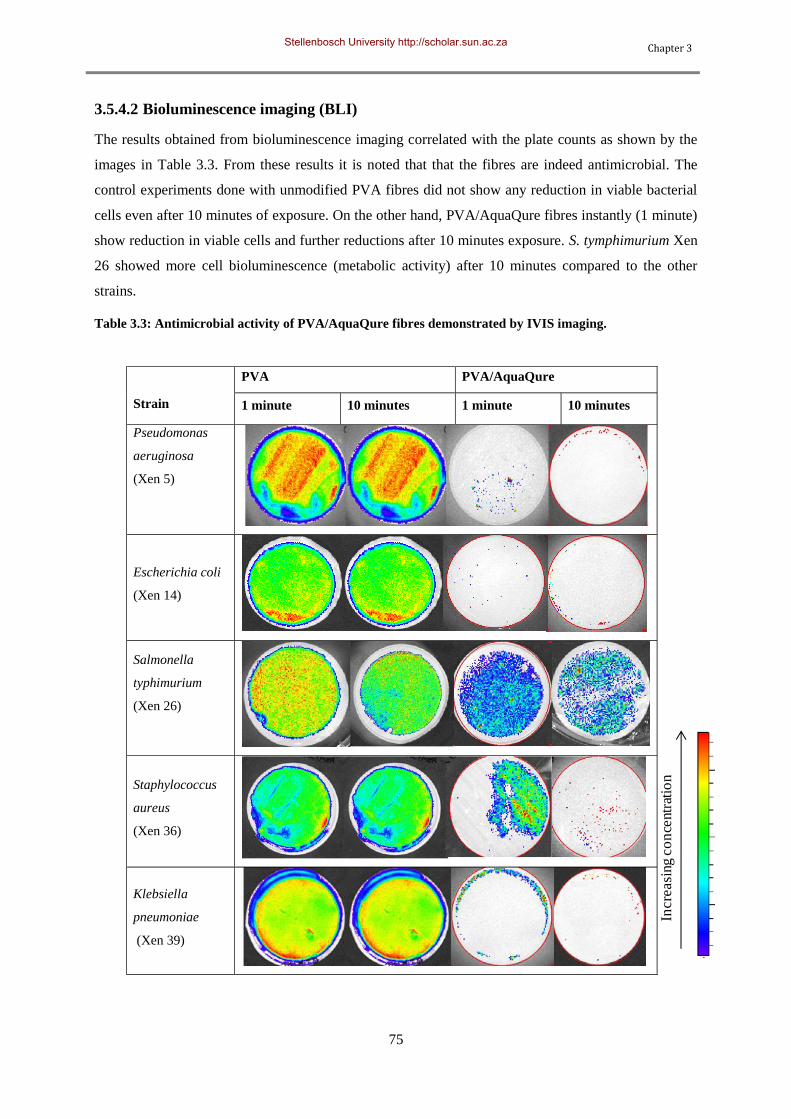
Chapter 3
75
3.5.4.2 Bioluminescence imaging (BLI)
The results obtained from bioluminescence imaging correlated with the plate counts as shown by the
images in Table 3.3. From these results it is noted that that the fibres are indeed antimicrobial. The
control experiments done with unmodified PVA fibres did not show any reduction in viable bacterial
cells even after 10 minutes of exposure. On the other hand, PVA/AquaQure fibres instantly (1 minute)
show reduction in viable cells and further reductions after 10 minutes exposure. S. tymphimurium Xen
26 showed more cell bioluminescence (metabolic activity) after 10 minutes compared to the other
strains.
Table 3.3: Antimicrobial activity of PVA/AquaQure fibres demonstrated by IVIS imaging.
Strain
PVA PVA/AquaQure
1 minute 10 minutes 1 minute 10 minutes
Pseudomonas
aeruginosa
(Xen 5)
Escherichia coli
(Xen 14)
Salmonella
typhimurium
(Xen 26)
Staphylococcus
aureus
(Xen 36)
Klebsiella
pneumoniae
(Xen 39)
Incre
asi
ng c
on
centr
atio
n
Stellenbosch University http://scholar.sun.ac.za
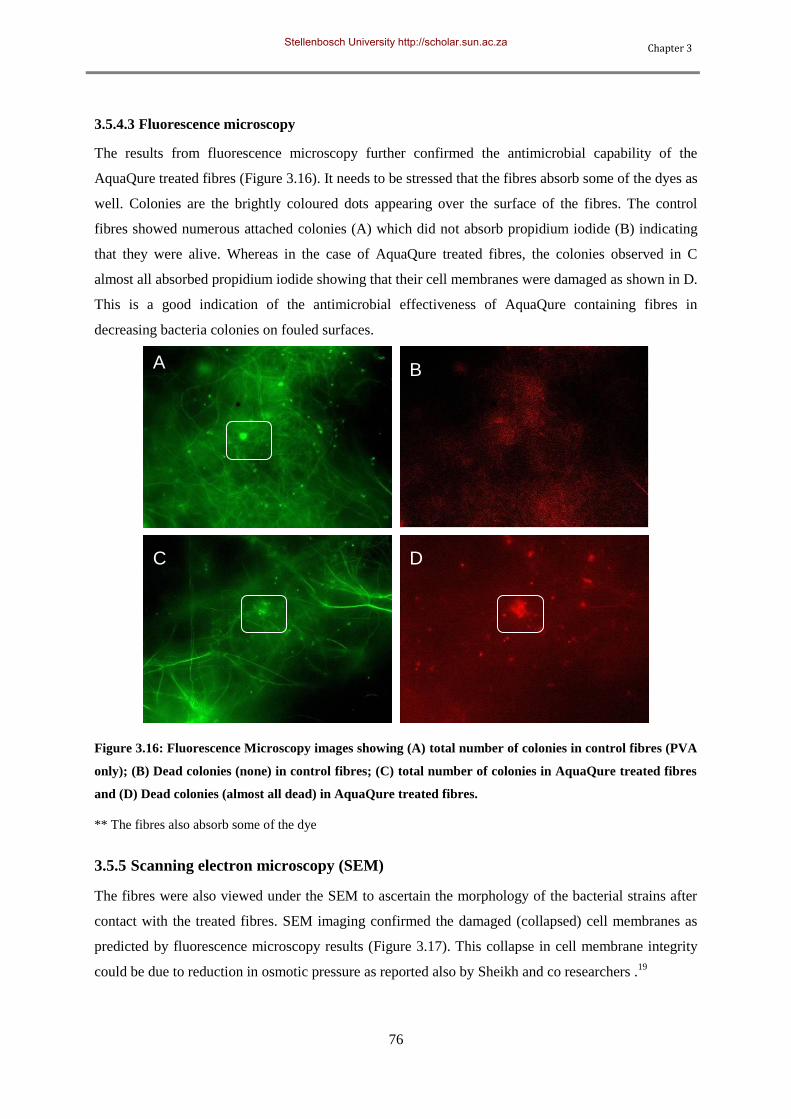
Chapter 3
76
3.5.4.3 Fluorescence microscopy
The results from fluorescence microscopy further confirmed the antimicrobial capability of the
AquaQure treated fibres (Figure 3.16). It needs to be stressed that the fibres absorb some of the dyes as
well. Colonies are the brightly coloured dots appearing over the surface of the fibres. The control
fibres showed numerous attached colonies (A) which did not absorb propidium iodide (B) indicating
that they were alive. Whereas in the case of AquaQure treated fibres, the colonies observed in C
almost all absorbed propidium iodide showing that their cell membranes were damaged as shown in D.
This is a good indication of the antimicrobial effectiveness of AquaQure containing fibres in
decreasing bacteria colonies on fouled surfaces.
Figure 3.16: Fluorescence Microscopy images showing (A) total number of colonies in control fibres (PVA
only); (B) Dead colonies (none) in control fibres; (C) total number of colonies in AquaQure treated fibres
and (D) Dead colonies (almost all dead) in AquaQure treated fibres.
** The fibres also absorb some of the dye
3.5.5 Scanning electron microscopy (SEM)
The fibres were also viewed under the SEM to ascertain the morphology of the bacterial strains after
contact with the treated fibres. SEM imaging confirmed the damaged (collapsed) cell membranes as
predicted by fluorescence microscopy results (Figure 3.17). This collapse in cell membrane integrity
could be due to reduction in osmotic pressure as reported also by Sheikh and co researchers .19
A B
C D
Stellenbosch University http://scholar.sun.ac.za
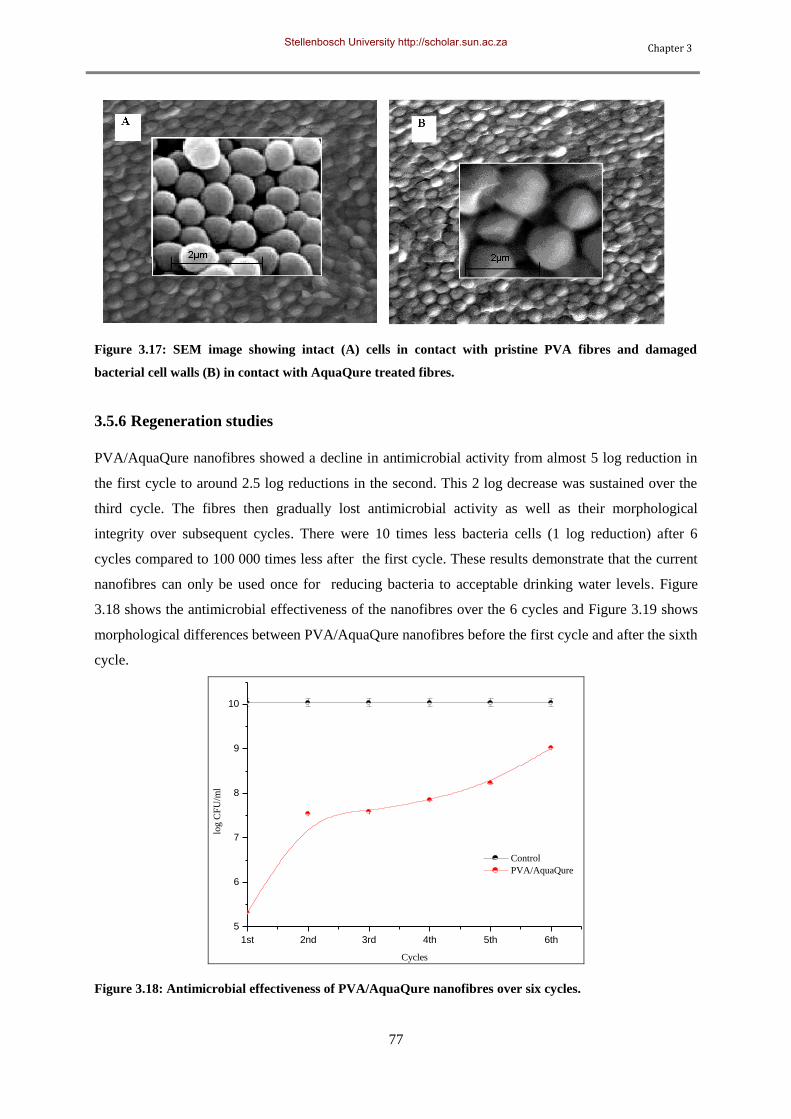
Chapter 3
77
Figure 3.17: SEM image showing intact (A) cells in contact with pristine PVA fibres and damaged
bacterial cell walls (B) in contact with AquaQure treated fibres.
3.5.6 Regeneration studies
PVA/AquaQure nanofibres showed a decline in antimicrobial activity from almost 5 log reduction in
the first cycle to around 2.5 log reductions in the second. This 2 log decrease was sustained over the
third cycle. The fibres then gradually lost antimicrobial activity as well as their morphological
integrity over subsequent cycles. There were 10 times less bacteria cells (1 log reduction) after 6
cycles compared to 100 000 times less after the first cycle. These results demonstrate that the current
nanofibres can only be used once for reducing bacteria to acceptable drinking water levels. Figure
3.18 shows the antimicrobial effectiveness of the nanofibres over the 6 cycles and Figure 3.19 shows
morphological differences between PVA/AquaQure nanofibres before the first cycle and after the sixth
cycle.
1st 2nd 3rd 4th 5th 6th
5
6
7
8
9
10
log C
FU
/ml
Cycles
Control
PVA/AquaQure
Figure 3.18: Antimicrobial effectiveness of PVA/AquaQure nanofibres over six cycles.
Stellenbosch University http://scholar.sun.ac.za
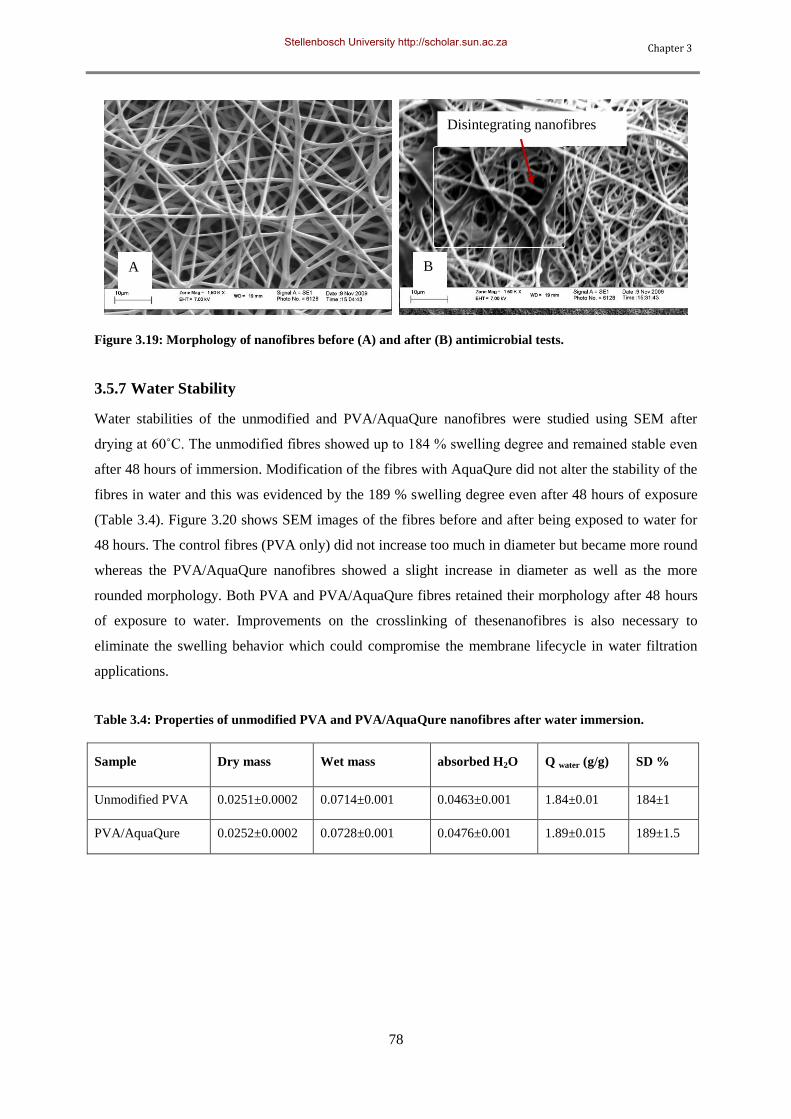
Chapter 3
78
Figure 3.19: Morphology of nanofibres before (A) and after (B) antimicrobial tests.
3.5.7 Water Stability
Water stabilities of the unmodified and PVA/AquaQure nanofibres were studied using SEM after
drying at 60˚C. The unmodified fibres showed up to 184 % swelling degree and remained stable even
after 48 hours of immersion. Modification of the fibres with AquaQure did not alter the stability of the
fibres in water and this was evidenced by the 189 % swelling degree even after 48 hours of exposure
(Table 3.4). Figure 3.20 shows SEM images of the fibres before and after being exposed to water for
48 hours. The control fibres (PVA only) did not increase too much in diameter but became more round
whereas the PVA/AquaQure nanofibres showed a slight increase in diameter as well as the more
rounded morphology. Both PVA and PVA/AquaQure fibres retained their morphology after 48 hours
of exposure to water. Improvements on the crosslinking of thesenanofibres is also necessary to
eliminate the swelling behavior which could compromise the membrane lifecycle in water filtration
applications.
Table 3.4: Properties of unmodified PVA and PVA/AquaQure nanofibres after water immersion.
Sample Dry mass Wet mass absorbed H2O Q water (g/g) SD %
Unmodified PVA 0.0251±0.0002 0.0714±0.001 0.0463±0.001 1.84±0.01 184±1
PVA/AquaQure 0.0252±0.0002 0.0728±0.001 0.0476±0.001 1.89±0.015 189±1.5
Disintegrating nanofibres
A B
Stellenbosch University http://scholar.sun.ac.za
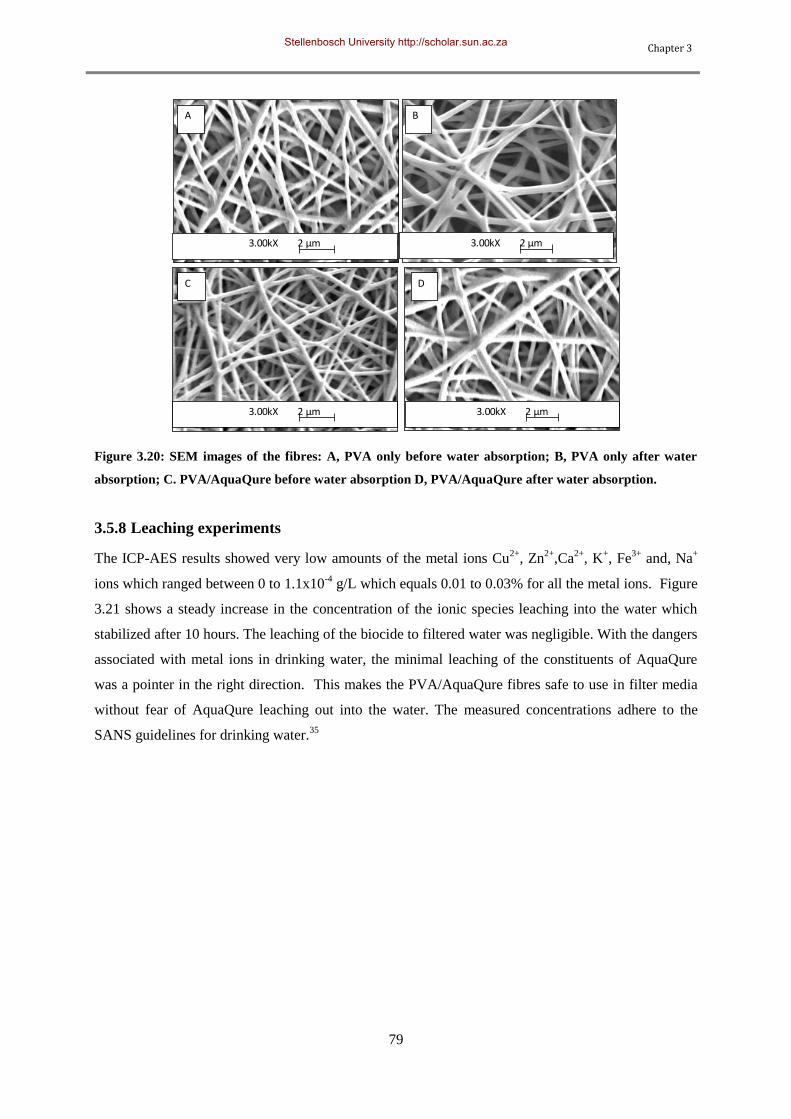
Chapter 3
79
A B
C D
3.00kX 2 μm
3.00kX 2 μm
3.00kX 2 μm
3.00kX 2 μm
Figure 3.20: SEM images of the fibres: A, PVA only before water absorption; B, PVA only after water
absorption; C. PVA/AquaQure before water absorption D, PVA/AquaQure after water absorption.
3.5.8 Leaching experiments
The ICP-AES results showed very low amounts of the metal ions Cu2+
, Zn2+
,Ca2+
, K+, Fe
3+ and, Na
+
ions which ranged between 0 to 1.1x10⁻⁴
g/L which equals 0.01 to 0.03% for all the metal ions. Figure
3.21 shows a steady increase in the concentration of the ionic species leaching into the water which
stabilized after 10 hours. The leaching of the biocide to filtered water was negligible. With the dangers
associated with metal ions in drinking water, the minimal leaching of the constituents of AquaQure
was a pointer in the right direction. This makes the PVA/AquaQure fibres safe to use in filter media
without fear of AquaQure leaching out into the water. The measured concentrations adhere to the
SANS guidelines for drinking water.35
Stellenbosch University http://scholar.sun.ac.za
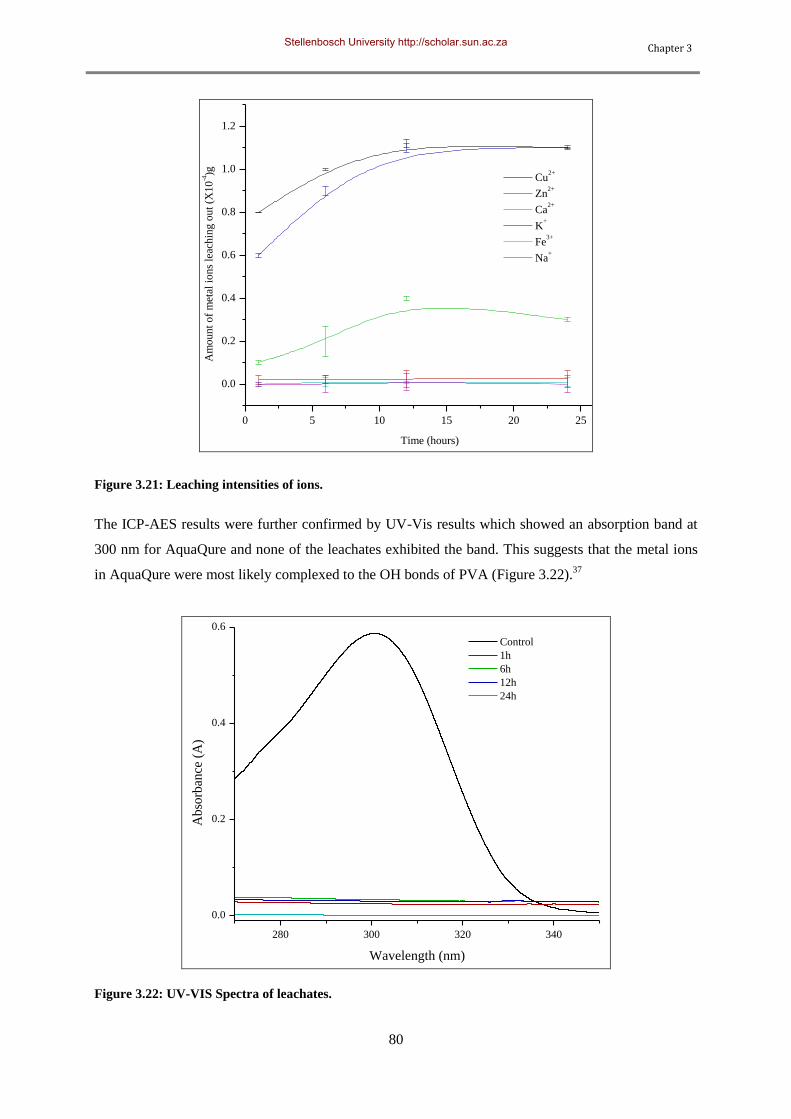
Chapter 3
80
0 5 10 15 20 25
0.0
0.2
0.4
0.6
0.8
1.0
1.2
Cu2+
Zn2+
Ca2+
K+
Fe3+
Na+
Am
ount
of
met
al i
ons
leac
hin
g o
ut
(X10
-4)g
Time (hours)
Figure 3.21: Leaching intensities of ions.
The ICP-AES results were further confirmed by UV-Vis results which showed an absorption band at
300 nm for AquaQure and none of the leachates exhibited the band. This suggests that the metal ions
in AquaQure were most likely complexed to the OH bonds of PVA (Figure 3.22).37
280 300 320 340
0.0
0.2
0.4
0.6
Ab
sorb
ance
(A
)
Wavelength (nm)
Control
1h
6h
12h
24h
Figure 3.22: UV-VIS Spectra of leachates.
Stellenbosch University http://scholar.sun.ac.za
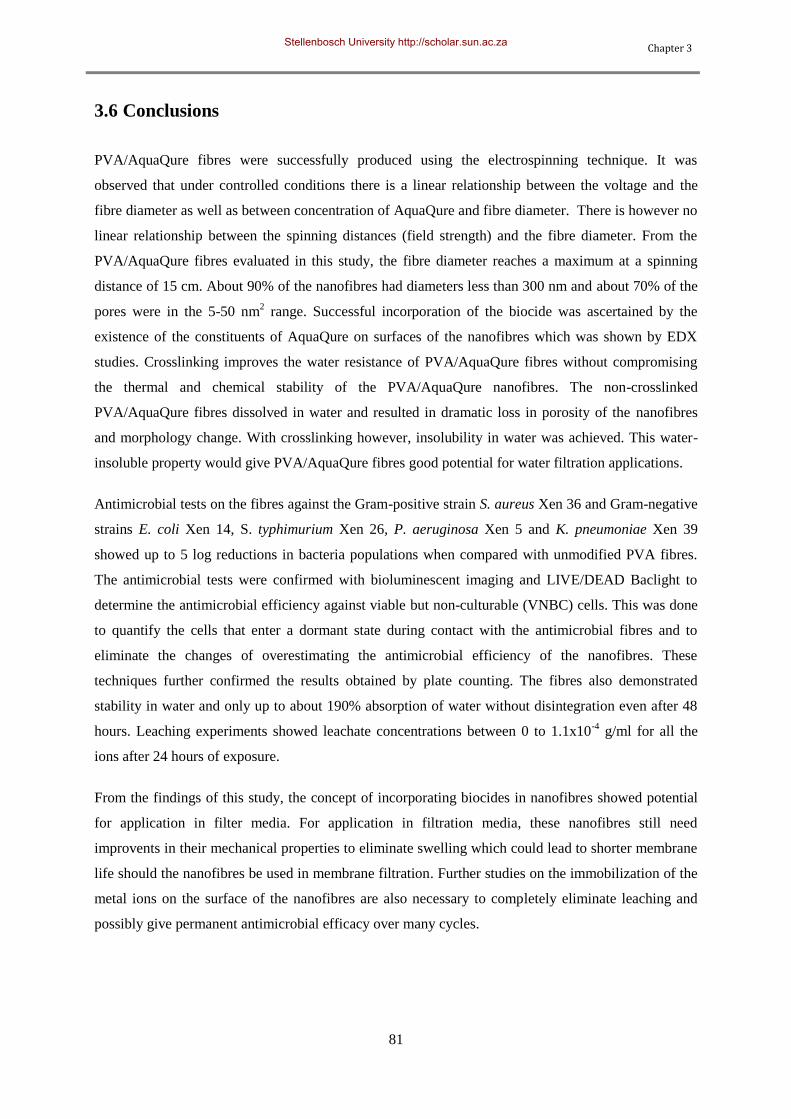
Chapter 3
81
3.6 Conclusions
PVA/AquaQure fibres were successfully produced using the electrospinning technique. It was
observed that under controlled conditions there is a linear relationship between the voltage and the
fibre diameter as well as between concentration of AquaQure and fibre diameter. There is however no
linear relationship between the spinning distances (field strength) and the fibre diameter. From the
PVA/AquaQure fibres evaluated in this study, the fibre diameter reaches a maximum at a spinning
distance of 15 cm. About 90% of the nanofibres had diameters less than 300 nm and about 70% of the
pores were in the 5-50 nm2 range. Successful incorporation of the biocide was ascertained by the
existence of the constituents of AquaQure on surfaces of the nanofibres which was shown by EDX
studies. Crosslinking improves the water resistance of PVA/AquaQure fibres without compromising
the thermal and chemical stability of the PVA/AquaQure nanofibres. The non-crosslinked
PVA/AquaQure fibres dissolved in water and resulted in dramatic loss in porosity of the nanofibres
and morphology change. With crosslinking however, insolubility in water was achieved. This water-
insoluble property would give PVA/AquaQure fibres good potential for water filtration applications.
Antimicrobial tests on the fibres against the Gram-positive strain S. aureus Xen 36 and Gram-negative
strains E. coli Xen 14, S. typhimurium Xen 26, P. aeruginosa Xen 5 and K. pneumoniae Xen 39
showed up to 5 log reductions in bacteria populations when compared with unmodified PVA fibres.
The antimicrobial tests were confirmed with bioluminescent imaging and LIVE/DEAD Baclight to
determine the antimicrobial efficiency against viable but non-culturable (VNBC) cells. This was done
to quantify the cells that enter a dormant state during contact with the antimicrobial fibres and to
eliminate the changes of overestimating the antimicrobial efficiency of the nanofibres. These
techniques further confirmed the results obtained by plate counting. The fibres also demonstrated
stability in water and only up to about 190% absorption of water without disintegration even after 48
hours. Leaching experiments showed leachate concentrations between 0 to 1.1x10⁻⁴
g/ml for all the
ions after 24 hours of exposure.
From the findings of this study, the concept of incorporating biocides in nanofibres showed potential
for application in filter media. For application in filtration media, these nanofibres still need
improvents in their mechanical properties to eliminate swelling which could lead to shorter membrane
life should the nanofibres be used in membrane filtration. Further studies on the immobilization of the
metal ions on the surface of the nanofibres are also necessary to completely eliminate leaching and
possibly give permanent antimicrobial efficacy over many cycles.
Stellenbosch University http://scholar.sun.ac.za
Chapter 3
82
References
1. Chirowodza H. Synthesis and characterization of cationically and anionically modified
poly(vinyl alcohol) microfibrils. Stellenbosch University, Stellenbosch, 2009.
2. Finch C.A., Polyvinyl Alcohol: Properties and applications. John Willey and Sons: London
1973.
3. Liou E.J.; Wang Y.J. Journal of Applied Polymer Science 1996, 59, 1395-1403.
4. Choi J.H.; Cho Y.W.; Ha W.S.; Lyoo W.S.; Lee C.J.; Ji B.C.; Han S.S.; Yoon W.S. Polymer
International 1998, 47, 237-242.
5. Chen C.; Wang F.; Mao C. Journal of Applied Polymer Science 2007, 105, 1086-1092.
6. Chirowodza H.; Sanderson R.D. Macromolecular Materials and Engineering 2010, 295,
1009-1016.
7. Garrett P.D.; Grubb D.T. Polymer Communications 1988, 29, 60.
8. Su J.; Wang Q.; Wang K.; Zhang Q.; Fu Q. Journal of Applied Polymer Science 2008, 107,
4070-4075.
9. Lee Y.J.; Shin D.S.; Kwon O.W.; Park W.H.; Choi H.G.; Lee Y.R.; Han S.S; Noh S.K.; Lyoo
W.S. Journal of Applied Polymer Science 2007, 106, 1337-1342.
10. Reisa E.F.; Campmposa F.S.; Lagea A.P.; Leitea R.C.; Heneineb L.G.; Vasconcelosc W.L.;
Lobatoa Z.I.; Mansurc H.S. Materials Research Bulletin 2005, 9, 185-191.
11. Finch C.A., Polyvinyl Alcohol: Developments. John Willey and Sons: London 1992.
12. Ruiz J.; Mantecón A.; Cádiz V. Polymer 2001, 42, 6347- 6354.
13. Kumeta K.; Nagashima I.; Matsui S.; Mizoguchi K. Journal of Applied Polymer Science 2003,
90, 2420-2427.
14. Liu S.; Sun G. Carbohydrate Polymers 2008, 71, 614-625.
15. Voigt W.V. Water stable, antimicrobial active nanofibres generated by electrospinning from
aqueous spinning solutions. RWTH Aachen University, Munich, 2009.
16. Ramakrishna S.; Fujihara K.; Teo T.; Yong Z.; Ma R.R. Materials Today 2006, 9, 40-50.
17. Lufrano G.; Brown J. Total Environment 2010, 408, 5254-5264.
18. Anshup T.P. Thin Solid Films 2009, 517, 6441-6478.
19. Sheikh F.A.; Kanjwal M.A.; Saran S.; Chung W-J.; Kim H. Applied Surface Science 2011,
257, 3020-3026.
20. Wang H.; Lu X.; Zhao Y.; Wang C. Materials Letters 2006, 60, 2253-2253.
21. Grace M.; Chand N.; Bajpai S.K. Journal of Macromolecular Science Part A 2008, 45, 795-
803.
22. Grace M.; Chand N.; Bajpai S.K. Journal of Engineered Fibers and Fabrics 2009, 4, 24-35.
23. Borkow G.; Gabbay J. Current Chemical Biology 2009, 3, 272-278.
Stellenbosch University http://scholar.sun.ac.za
Chapter 3
83
24. Nan L.; Liu Y.; Lu M.; Yang K. Journal of Materials Science: Materials in Medicine 2008,
19, 3057-3062.
25. Ohsumi Y.; Kitamoto K.; Anraku Y. Journal of Bacteriology 1988, 170, 2676-2682.
26. Potera C. Environmental Health Perspectives 2004, 112, A568-A569.
27. Singh M.; Singh S.; Gambhir P.S. Digest Journal of Nanomaterials and Biostructures 2008,
3, 115 - 122.
28. Osman D.; Cavet J.S. Advances in Microbial Physiology 2011, 58, 175-232.
29. Zhang Y.; Zhu P.C.; Edgren D. Journal of Polymer Research 2009, 1-6.
30. Ramakrishna S.; Fujihara K.; Teo W-E.; Lim T-C.; Ma Z., An Introduction to Electrospinning
and Nanofibres. World Scientific Publishing Co. Pte. Ltd.: Toh Tuck Link, Singapore, 2005.
31. Aydilek A. Journal of Computation in Civil Engineering 2002, 280-290.
32. Daels N.; De Vrieze S.; Sampers I.; Decostere B.; Westbroek P.; Dumoulin A.; Dejans P.; De
Clerck K.; Van Hulle S.W.H. Desalination 2011.
33. Francis D.L.; Visvikis D.; Costa D.C. European Journal of Nuclea and Medical Molecular
Imaging 2003, 30, 988-994.
34. Liu Z.X.; Miao Y.G.; Wang Z.Y.; Yin G.H. Polymer 2009, 77, 131-135.
35. SANS 241, South African National Standards-Drinking Water. 6th ed.; ISBN 0-626-17752-9:
South Africa, 2005.
36. Yun K.M.; Suryamas A.B.; Iskandara F.; Bao F.L.; Niinuma H.; Okuyama K. Separation and
Purification Technology 2010, 75, 340-345.
37. Moneva L.I.; Ivanova K.H. Polymer Science USSR 1990, 32, 2054-206.
38. Bölgen N.; Menceloglu Y.Z.; Acatay K.; Vargel I.; Piskin E. Journal of Biomaterial Science
2005, 16, 1537-1555.
39. Deitzel J.M.; Kleinmeyer J.; Harris D.; Beck Tan N. Polymer 2001, 42, 261-272.
40. Demir M.M.; Yilgor I.; Yilgor E.; Erman B. Polymer 2002, 43, 3303-309.
41. Ding B.; Kim H.Y.; Lee S.C.; Shao C.L. Journal of Poymer Science. Part B: Polymer Physics
2004, 40, 1261-268.
42. Xu J.; Cui X-J.; Zhang J.; Liang H-W.; Wang H-Y.; Li J-F. Bulletin of Materials Science
2008, 31, 189-192.
43. Fukuda T.; Yamamo S.; Morita H. World Journal of Microbiological Biotechnology 2008,
241, 893-1899.
Stellenbosch University http://scholar.sun.ac.za
Chapter 4
84
Chapter 4: The fabrication and characterization of antimicrobial
copper functionalized nanofibres from poly(vinyl alcohol) and
poly(styrene-co-maleic anhydride) via bubble electrospinning
4.1 Chapter Summary
The bactericidal effects of copper and its compounds have been known for centuries and the
incorporation of copper compounds on various materials has been widely reported.1-3
Most of these
works however focused on the use of copper in wound dressing and other medical applications as well
as its use in agricultural settings.4-6
However, very few reports are available on the immobilization of
copper compounds on surfaces with the aim of the purification of water supplies.7 In this chapter, the
fabrication and functionalization of nanofibre mats from poly(vinyl alcohol) (PVA) and poly(styrene-
co-maleic anhydride) (SMA) are reported. These nanofibre mats were fabricated through blending of
bactericidal copper salts to spinning solutions and electrospinning them to produce fibres in the
nanometer range using bubble electrospinning. Bubble electrospinning is a high-throughput version of
the conventional needle based electrospinning technique.
The effects of the modification of the polymers, electrospinning, antimicrobial tests as well as leaching
of copper ions are presented in this chapter. The antimicrobial activities of copper containing PVA and
SMA against bioluminescent strains of Klebsiella pneumoniae Xen 39, Staphylococcus aureus Xen
36, Escherichia coli Xen 14, Pseudomonas aeruginosa Xen 5 and Salmonella typhimurium Xen 26
were obtained through plate counting. To determine the antimicrobial efficiency against viable but
non-culturable (VNBC) cells (that enter a dormant state during contact with the antimicrobial fibres),
bioluminescent imaging and LIVE/DEAD Baclight were used in order to eliminate the chances of
overestimating the antimicrobial efficiency of the nanofibres. Leaching experiments were conducted to
ascertain the amounts of the constituents of the biocide from the fibres. For purposes of the intended
application of these nanofibres (drinking water), these figures were then compared with the South
African national standards (SANS) for drinking water.
4.2 Introduction
Preparation of metal ions and nanoparticles dispersed in polymer nanofibres has drawn great attention
because these kinds of nanocomposites combine the unique properties of metal particles with the
outstanding characteristics of polymer nanofibres which include among others, the high specific
surface area and high interpenetrating capacity available to other materials.8 The metal/polymer
nanocomposites are expected to provide potential applications as catalysts, photonic and electronic
Stellenbosch University http://scholar.sun.ac.za
Chapter 4
85
sensors, filters, and artificial tissue.9 The inclusion of metal salts in electrospun fibres has been
reported by a number of researchers.10-22
The antimicrobial nature of transition element metal salts is
well researched. 9 Modification of nanofibres using metal salts like silver, copper, zinc has received a
lot of attention over the past decade due to their bactericidal properties. The focus on these studies
however has been directed towards medical applications. In this study, the bactericidal nature of
copper was evaluated for applicability in filter media. The following subsections discuss historical
background, antimicrobial properties of copper and its compounds as well as some theory on the
blending of polymers with copper ions.
4.2.1 Antimicrobial properties of Copper
The antimicrobial nature of copper is not a new phenomenon, copper has been used as a biocide for
centuries.2, 4
In ancient Egypt (2000 BC), copper was used to sterilize water and wounds. The ancient
Greeks in the time of Hippocrates (400 BC) prescribed copper for pulmonary diseases and for
purifying drinking water.2 The antifungal properties of copper are also well documented and date back
to 1761, when it was discovered that copper sulphate inhibited seed-borne fungi.2 These attributes
have triggered the interest of many researchers around the globe to come up with copper-based
polymeric materials applicable in various applications such as antibacterial and antifungal agents.
Copper and its compounds have also been coated onto or incorporated into various materials for
various applications including filter media (Figure 4.1).1, 2, 23-26
Stellenbosch University http://scholar.sun.ac.za
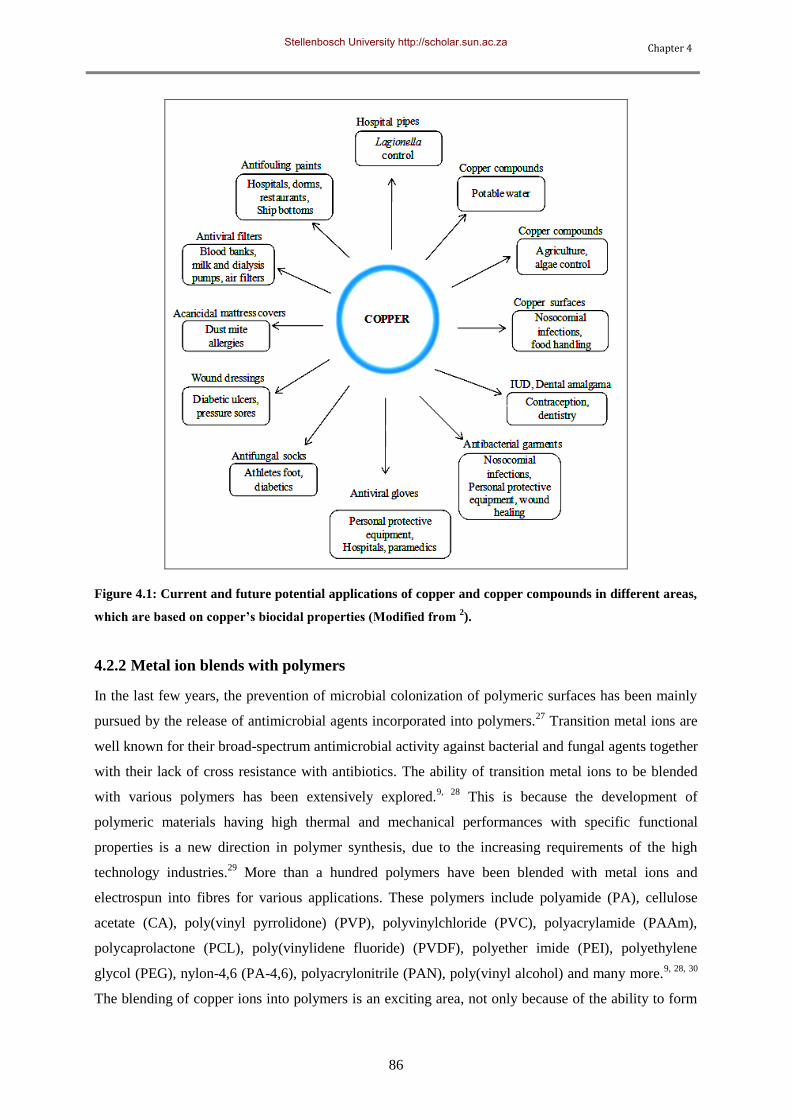
Chapter 4
86
Figure 4.1: Current and future potential applications of copper and copper compounds in different areas,
which are based on copper’s biocidal properties (Modified from 2).
4.2.2 Metal ion blends with polymers
In the last few years, the prevention of microbial colonization of polymeric surfaces has been mainly
pursued by the release of antimicrobial agents incorporated into polymers.27
Transition metal ions are
well known for their broad-spectrum antimicrobial activity against bacterial and fungal agents together
with their lack of cross resistance with antibiotics. The ability of transition metal ions to be blended
with various polymers has been extensively explored.9, 28
This is because the development of
polymeric materials having high thermal and mechanical performances with specific functional
properties is a new direction in polymer synthesis, due to the increasing requirements of the high
technology industries.29
More than a hundred polymers have been blended with metal ions and
electrospun into fibres for various applications. These polymers include polyamide (PA), cellulose
acetate (CA), poly(vinyl pyrrolidone) (PVP), polyvinylchloride (PVC), polyacrylamide (PAAm),
polycaprolactone (PCL), poly(vinylidene fluoride) (PVDF), polyether imide (PEI), polyethylene
glycol (PEG), nylon-4,6 (PA-4,6), polyacrylonitrile (PAN), poly(vinyl alcohol) and many more.9, 28, 30
The blending of copper ions into polymers is an exciting area, not only because of the ability to form
Stellenbosch University http://scholar.sun.ac.za
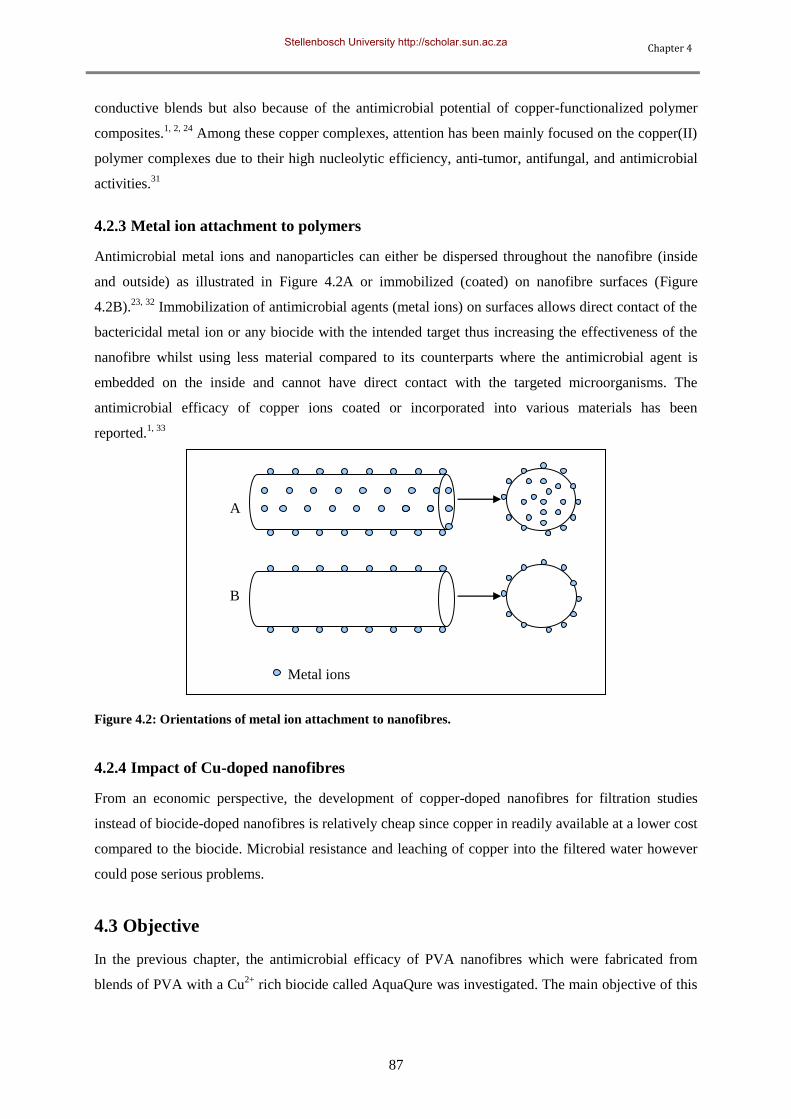
Chapter 4
87
conductive blends but also because of the antimicrobial potential of copper-functionalized polymer
composites.1, 2, 24
Among these copper complexes, attention has been mainly focused on the copper(II)
polymer complexes due to their high nucleolytic efficiency, anti-tumor, antifungal, and antimicrobial
activities.31
4.2.3 Metal ion attachment to polymers
Antimicrobial metal ions and nanoparticles can either be dispersed throughout the nanofibre (inside
and outside) as illustrated in Figure 4.2A or immobilized (coated) on nanofibre surfaces (Figure
4.2B).23, 32
Immobilization of antimicrobial agents (metal ions) on surfaces allows direct contact of the
bactericidal metal ion or any biocide with the intended target thus increasing the effectiveness of the
nanofibre whilst using less material compared to its counterparts where the antimicrobial agent is
embedded on the inside and cannot have direct contact with the targeted microorganisms. The
antimicrobial efficacy of copper ions coated or incorporated into various materials has been
reported.1, 33
Figure 4.2: Orientations of metal ion attachment to nanofibres.
4.2.4 Impact of Cu-doped nanofibres
From an economic perspective, the development of copper-doped nanofibres for filtration studies
instead of biocide-doped nanofibres is relatively cheap since copper in readily available at a lower cost
compared to the biocide. Microbial resistance and leaching of copper into the filtered water however
could pose serious problems.
4.3 Objective
In the previous chapter, the antimicrobial efficacy of PVA nanofibres which were fabricated from
blends of PVA with a Cu2+
rich biocide called AquaQure was investigated. The main objective of this
Metal ions
A
B
Stellenbosch University http://scholar.sun.ac.za
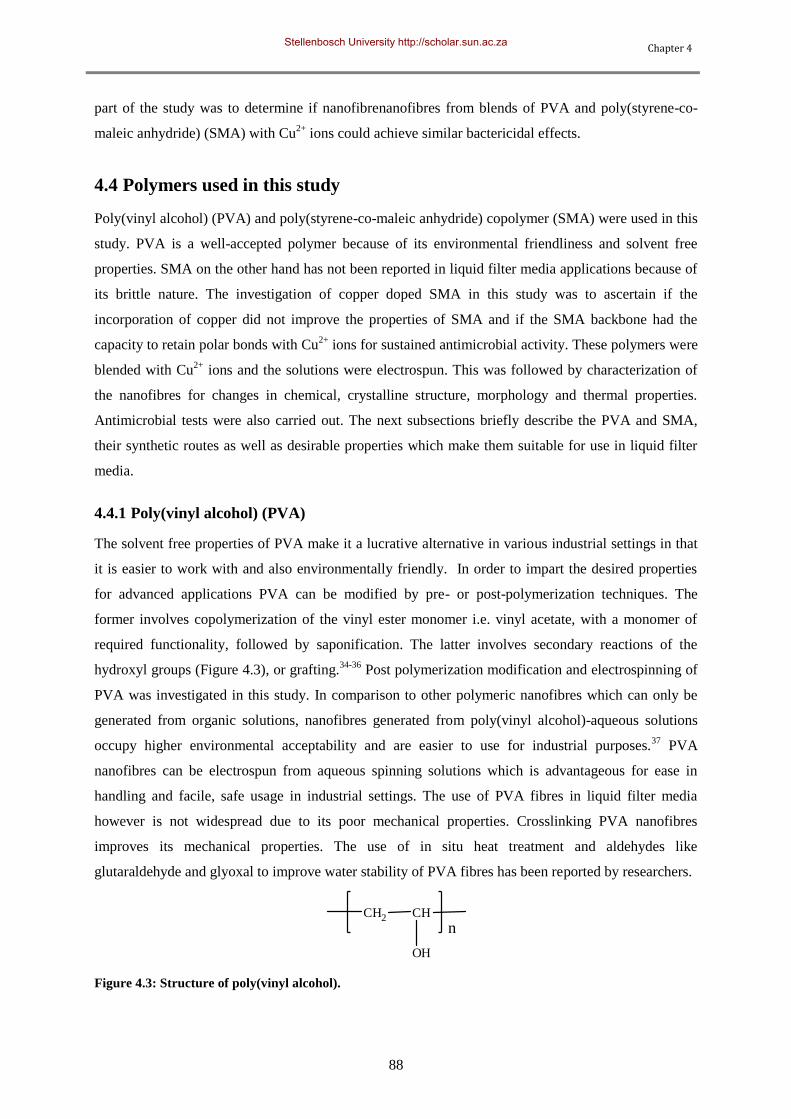
Chapter 4
88
part of the study was to determine if nanofibrenanofibres from blends of PVA and poly(styrene-co-
maleic anhydride) (SMA) with Cu2+
ions could achieve similar bactericidal effects.
4.4 Polymers used in this study
Poly(vinyl alcohol) (PVA) and poly(styrene-co-maleic anhydride) copolymer (SMA) were used in this
study. PVA is a well-accepted polymer because of its environmental friendliness and solvent free
properties. SMA on the other hand has not been reported in liquid filter media applications because of
its brittle nature. The investigation of copper doped SMA in this study was to ascertain if the
incorporation of copper did not improve the properties of SMA and if the SMA backbone had the
capacity to retain polar bonds with Cu2+
ions for sustained antimicrobial activity. These polymers were
blended with Cu2+
ions and the solutions were electrospun. This was followed by characterization of
the nanofibres for changes in chemical, crystalline structure, morphology and thermal properties.
Antimicrobial tests were also carried out. The next subsections briefly describe the PVA and SMA,
their synthetic routes as well as desirable properties which make them suitable for use in liquid filter
media.
4.4.1 Poly(vinyl alcohol) (PVA)
The solvent free properties of PVA make it a lucrative alternative in various industrial settings in that
it is easier to work with and also environmentally friendly. In order to impart the desired properties
for advanced applications PVA can be modified by pre- or post-polymerization techniques. The
former involves copolymerization of the vinyl ester monomer i.e. vinyl acetate, with a monomer of
required functionality, followed by saponification. The latter involves secondary reactions of the
hydroxyl groups (Figure 4.3), or grafting.34-36
Post polymerization modification and electrospinning of
PVA was investigated in this study. In comparison to other polymeric nanofibres which can only be
generated from organic solutions, nanofibres generated from poly(vinyl alcohol)-aqueous solutions
occupy higher environmental acceptability and are easier to use for industrial purposes.37
PVA
nanofibres can be electrospun from aqueous spinning solutions which is advantageous for ease in
handling and facile, safe usage in industrial settings. The use of PVA fibres in liquid filter media
however is not widespread due to its poor mechanical properties. Crosslinking PVA nanofibres
improves its mechanical properties. The use of in situ heat treatment and aldehydes like
glutaraldehyde and glyoxal to improve water stability of PVA fibres has been reported by researchers.
CH2 CH
OH
n
Figure 4.3: Structure of poly(vinyl alcohol).
Stellenbosch University http://scholar.sun.ac.za
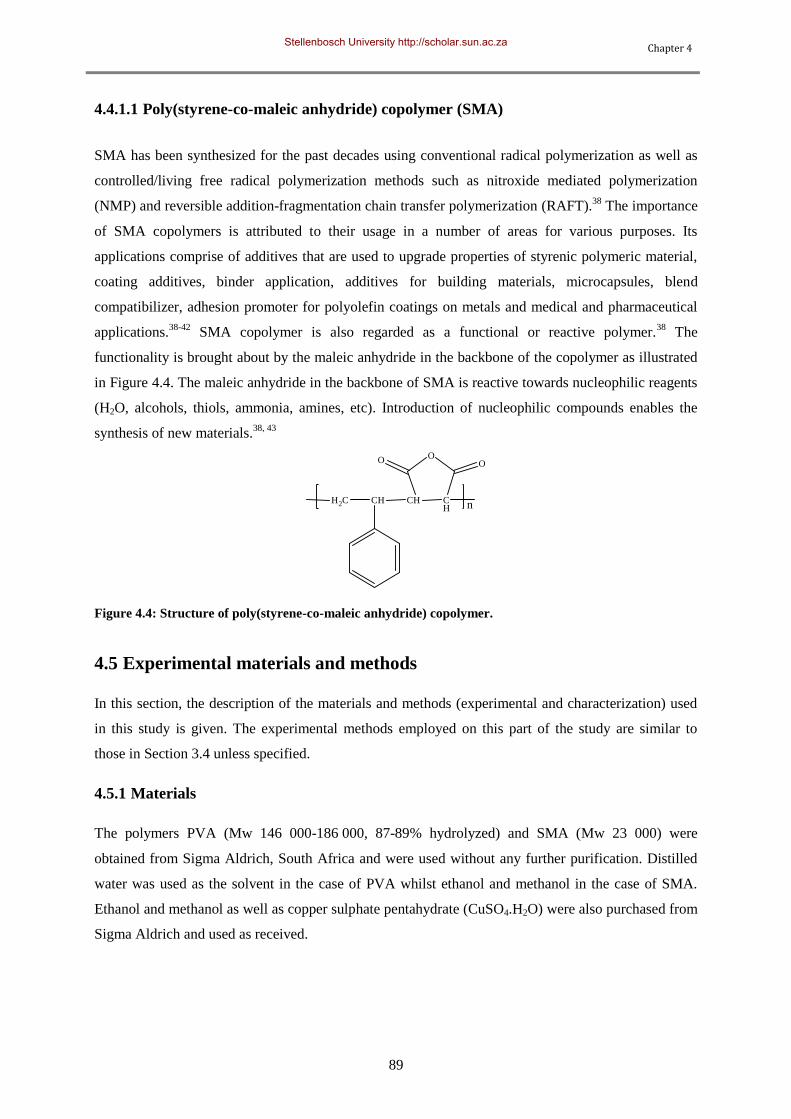
Chapter 4
89
4.4.1.1 Poly(styrene-co-maleic anhydride) copolymer (SMA)
SMA has been synthesized for the past decades using conventional radical polymerization as well as
controlled/living free radical polymerization methods such as nitroxide mediated polymerization
(NMP) and reversible addition-fragmentation chain transfer polymerization (RAFT).38
The importance
of SMA copolymers is attributed to their usage in a number of areas for various purposes. Its
applications comprise of additives that are used to upgrade properties of styrenic polymeric material,
coating additives, binder application, additives for building materials, microcapsules, blend
compatibilizer, adhesion promoter for polyolefin coatings on metals and medical and pharmaceutical
applications.38-42
SMA copolymer is also regarded as a functional or reactive polymer.38
The
functionality is brought about by the maleic anhydride in the backbone of the copolymer as illustrated
in Figure 4.4. The maleic anhydride in the backbone of SMA is reactive towards nucleophilic reagents
(H2O, alcohols, thiols, ammonia, amines, etc). Introduction of nucleophilic compounds enables the
synthesis of new materials.38, 43
CH CHH2C CH
OOO
n
Figure 4.4: Structure of poly(styrene-co-maleic anhydride) copolymer.
4.5 Experimental materials and methods
In this section, the description of the materials and methods (experimental and characterization) used
in this study is given. The experimental methods employed on this part of the study are similar to
those in Section 3.4 unless specified.
4.5.1 Materials
The polymers PVA (Mw 146 000-186 000, 87-89% hydrolyzed) and SMA (Mw 23 000) were
obtained from Sigma Aldrich, South Africa and were used without any further purification. Distilled
water was used as the solvent in the case of PVA whilst ethanol and methanol in the case of SMA.
Ethanol and methanol as well as copper sulphate pentahydrate (CuSO4.H2O) were also purchased from
Sigma Aldrich and used as received.
Stellenbosch University http://scholar.sun.ac.za
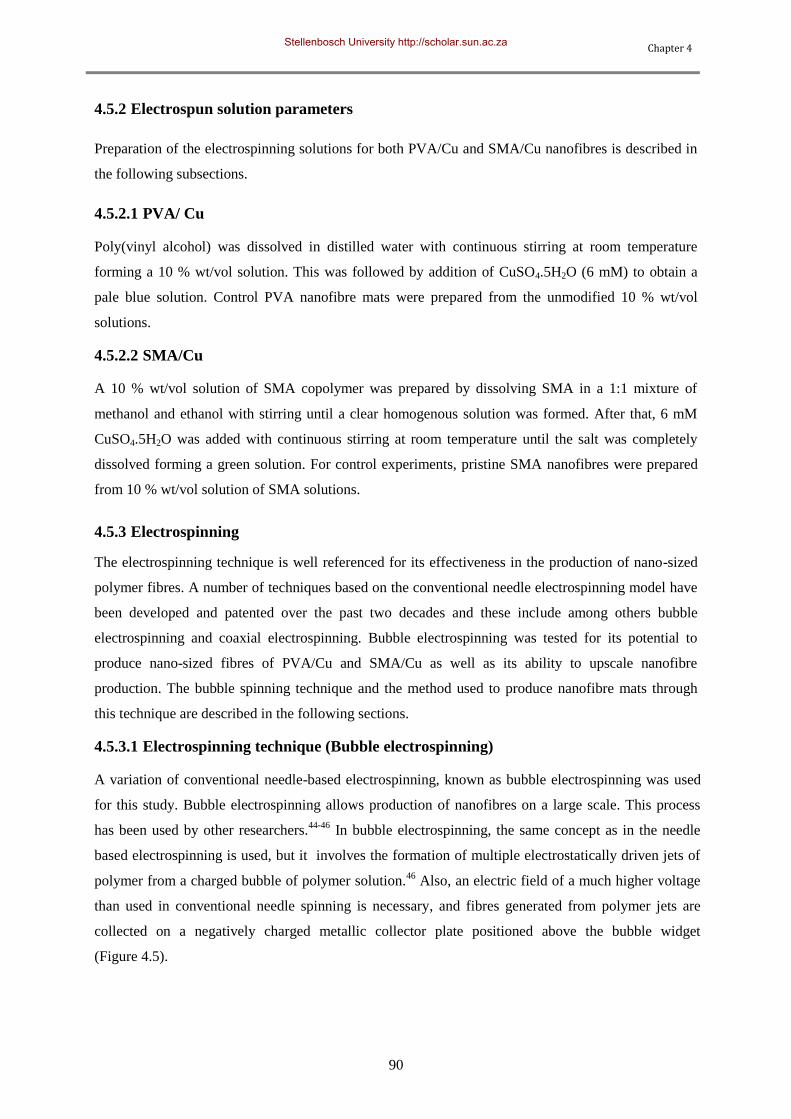
Chapter 4
90
4.5.2 Electrospun solution parameters
Preparation of the electrospinning solutions for both PVA/Cu and SMA/Cu nanofibres is described in
the following subsections.
4.5.2.1 PVA/ Cu
Poly(vinyl alcohol) was dissolved in distilled water with continuous stirring at room temperature
forming a 10 % wt/vol solution. This was followed by addition of CuSO4.5H2O (6 mM) to obtain a
pale blue solution. Control PVA nanofibre mats were prepared from the unmodified 10 % wt/vol
solutions.
4.5.2.2 SMA/Cu
A 10 % wt/vol solution of SMA copolymer was prepared by dissolving SMA in a 1:1 mixture of
methanol and ethanol with stirring until a clear homogenous solution was formed. After that, 6 mM
CuSO4.5H2O was added with continuous stirring at room temperature until the salt was completely
dissolved forming a green solution. For control experiments, pristine SMA nanofibres were prepared
from 10 % wt/vol solution of SMA solutions.
4.5.3 Electrospinning
The electrospinning technique is well referenced for its effectiveness in the production of nano-sized
polymer fibres. A number of techniques based on the conventional needle electrospinning model have
been developed and patented over the past two decades and these include among others bubble
electrospinning and coaxial electrospinning. Bubble electrospinning was tested for its potential to
produce nano-sized fibres of PVA/Cu and SMA/Cu as well as its ability to upscale nanofibre
production. The bubble spinning technique and the method used to produce nanofibre mats through
this technique are described in the following sections.
4.5.3.1 Electrospinning technique (Bubble electrospinning)
A variation of conventional needle-based electrospinning, known as bubble electrospinning was used
for this study. Bubble electrospinning allows production of nanofibres on a large scale. This process
has been used by other researchers.44-46
In bubble electrospinning, the same concept as in the needle
based electrospinning is used, but it involves the formation of multiple electrostatically driven jets of
polymer from a charged bubble of polymer solution.46
Also, an electric field of a much higher voltage
than used in conventional needle spinning is necessary, and fibres generated from polymer jets are
collected on a negatively charged metallic collector plate positioned above the bubble widget
(Figure 4.5).
Stellenbosch University http://scholar.sun.ac.za
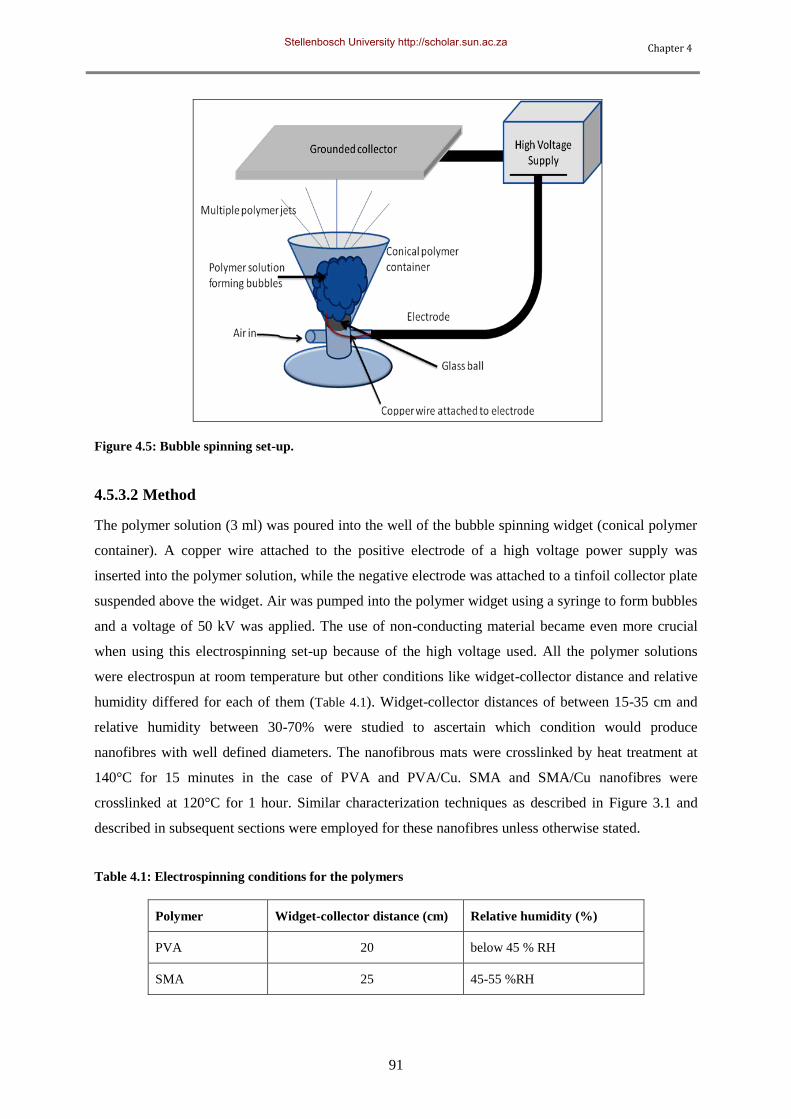
Chapter 4
91
Figure 4.5: Bubble spinning set-up.
4.5.3.2 Method
The polymer solution (3 ml) was poured into the well of the bubble spinning widget (conical polymer
container). A copper wire attached to the positive electrode of a high voltage power supply was
inserted into the polymer solution, while the negative electrode was attached to a tinfoil collector plate
suspended above the widget. Air was pumped into the polymer widget using a syringe to form bubbles
and a voltage of 50 kV was applied. The use of non-conducting material became even more crucial
when using this electrospinning set-up because of the high voltage used. All the polymer solutions
were electrospun at room temperature but other conditions like widget-collector distance and relative
humidity differed for each of them (Table 4.1). Widget-collector distances of between 15-35 cm and
relative humidity between 30-70% were studied to ascertain which condition would produce
nanofibres with well defined diameters. The nanofibrous mats were crosslinked by heat treatment at
140°C for 15 minutes in the case of PVA and PVA/Cu. SMA and SMA/Cu nanofibres were
crosslinked at 120°C for 1 hour. Similar characterization techniques as described in Figure 3.1 and
described in subsequent sections were employed for these nanofibres unless otherwise stated.
Table 4.1: Electrospinning conditions for the polymers
Polymer Widget-collector distance (cm) Relative humidity (%)
PVA 20 below 45 % RH
SMA 25 45-55 %RH
Stellenbosch University http://scholar.sun.ac.za
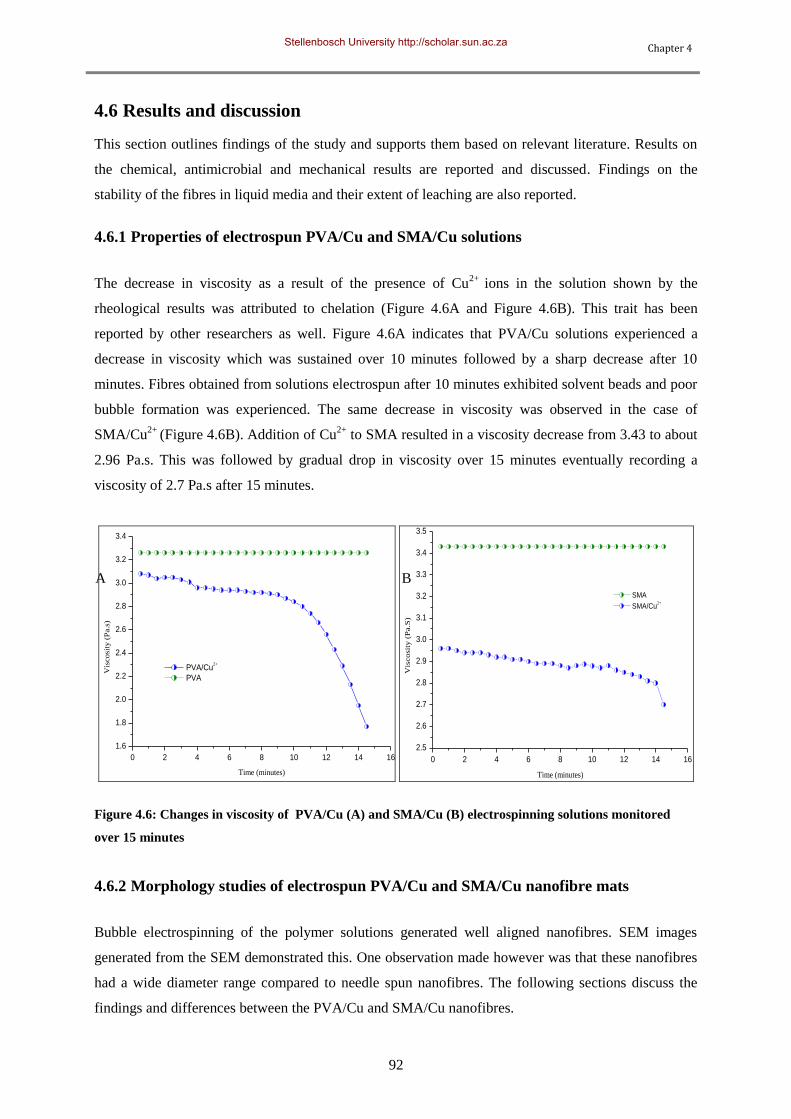
Chapter 4
92
4.6 Results and discussion
This section outlines findings of the study and supports them based on relevant literature. Results on
the chemical, antimicrobial and mechanical results are reported and discussed. Findings on the
stability of the fibres in liquid media and their extent of leaching are also reported.
4.6.1 Properties of electrospun PVA/Cu and SMA/Cu solutions
The decrease in viscosity as a result of the presence of Cu2+
ions in the solution shown by the
rheological results was attributed to chelation (Figure 4.6A and Figure 4.6B). This trait has been
reported by other researchers as well. Figure 4.6A indicates that PVA/Cu solutions experienced a
decrease in viscosity which was sustained over 10 minutes followed by a sharp decrease after 10
minutes. Fibres obtained from solutions electrospun after 10 minutes exhibited solvent beads and poor
bubble formation was experienced. The same decrease in viscosity was observed in the case of
SMA/Cu2+
(Figure 4.6B). Addition of Cu2+
to SMA resulted in a viscosity decrease from 3.43 to about
2.96 Pa.s. This was followed by gradual drop in viscosity over 15 minutes eventually recording a
viscosity of 2.7 Pa.s after 15 minutes.
0 2 4 6 8 10 12 14 16
1.6
1.8
2.0
2.2
2.4
2.6
2.8
3.0
3.2
3.4
Vis
co
sity
(P
a.s
)
Time (minutes)
PVA/Cu2+
PVA
0 2 4 6 8 10 12 14 16
2.5
2.6
2.7
2.8
2.9
3.0
3.1
3.2
3.3
3.4
3.5
Vis
cosi
ty (
Pa.S
)
Time (minutes)
SMA
SMA/Cu2+
Figure 4.6: Changes in viscosity of PVA/Cu (A) and SMA/Cu (B) electrospinning solutions monitored
over 15 minutes
4.6.2 Morphology studies of electrospun PVA/Cu and SMA/Cu nanofibre mats
Bubble electrospinning of the polymer solutions generated well aligned nanofibres. SEM images
generated from the SEM demonstrated this. One observation made however was that these nanofibres
had a wide diameter range compared to needle spun nanofibres. The following sections discuss the
findings and differences between the PVA/Cu and SMA/Cu nanofibres.
A B
Stellenbosch University http://scholar.sun.ac.za
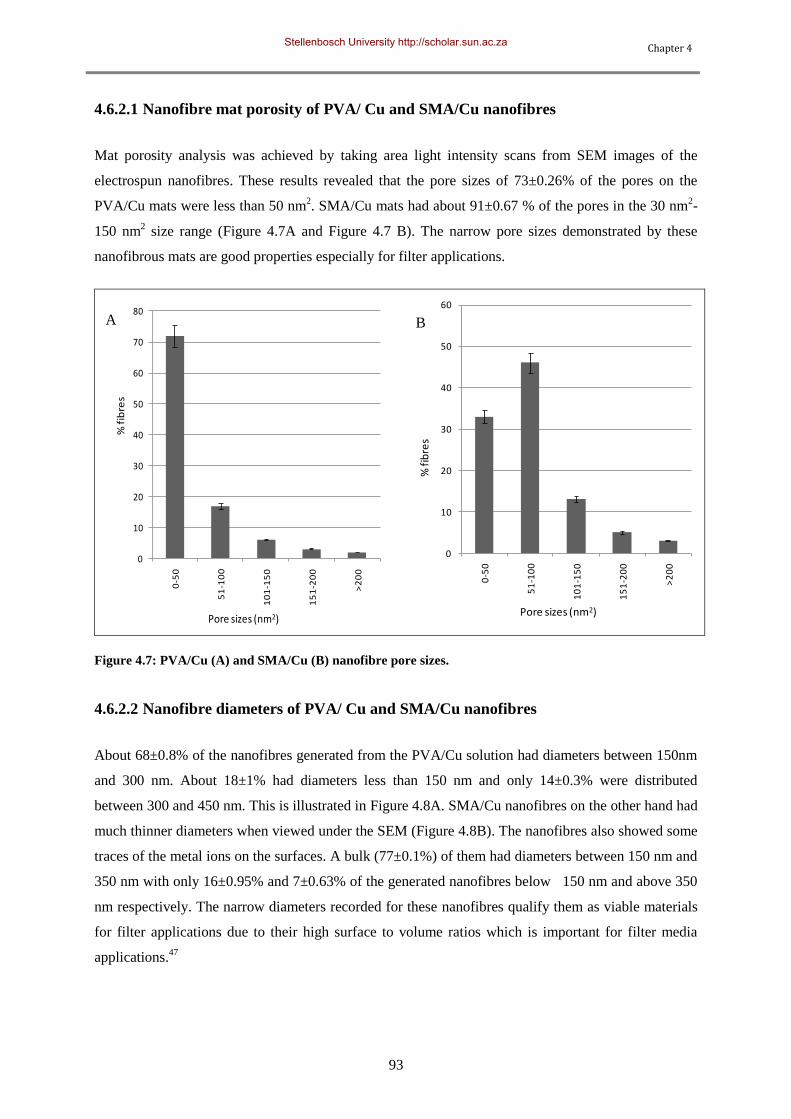
Chapter 4
93
4.6.2.1 Nanofibre mat porosity of PVA/ Cu and SMA/Cu nanofibres
Mat porosity analysis was achieved by taking area light intensity scans from SEM images of the
electrospun nanofibres. These results revealed that the pore sizes of 73±0.26% of the pores on the
PVA/Cu mats were less than 50 nm2. SMA/Cu mats had about 91±0.67 % of the pores in the 30 nm
2-
150 nm2 size range (Figure 4.7A and Figure 4.7 B). The narrow pore sizes demonstrated by these
nanofibrous mats are good properties especially for filter applications.
0
10
20
30
40
50
60
70
80
0-5
0
51
-10
0
10
1-1
50
15
1-2
00
>2
00
Pore sizes (nm2)
% f
ibre
s
0
10
20
30
40
50
60
0-5
0
51
-10
0
10
1-1
50
15
1-2
00
>2
00
% fi
bre
s
Pore sizes (nm2)
A B
Figure 4.7: PVA/Cu (A) and SMA/Cu (B) nanofibre pore sizes.
4.6.2.2 Nanofibre diameters of PVA/ Cu and SMA/Cu nanofibres
About 68±0.8% of the nanofibres generated from the PVA/Cu solution had diameters between 150nm
and 300 nm. About 18±1% had diameters less than 150 nm and only 14±0.3% were distributed
between 300 and 450 nm. This is illustrated in Figure 4.8A. SMA/Cu nanofibres on the other hand had
much thinner diameters when viewed under the SEM (Figure 4.8B). The nanofibres also showed some
traces of the metal ions on the surfaces. A bulk (77±0.1%) of them had diameters between 150 nm and
350 nm with only 16±0.95% and 7±0.63% of the generated nanofibres below 150 nm and above 350
nm respectively. The narrow diameters recorded for these nanofibres qualify them as viable materials
for filter applications due to their high surface to volume ratios which is important for filter media
applications.47
Stellenbosch University http://scholar.sun.ac.za
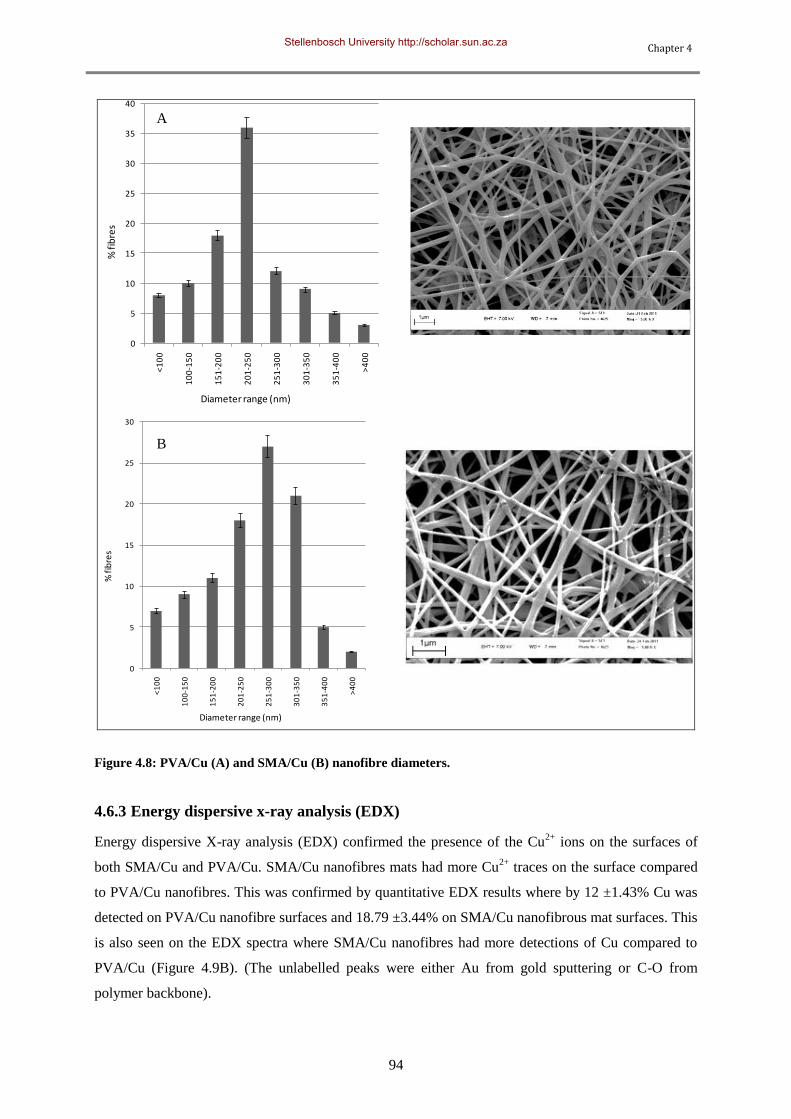
Chapter 4
94
0
5
10
15
20
25
30
<1
00
10
0-1
50
15
1-2
00
20
1-2
50
25
1-3
00
30
1-3
50
35
1-4
00
>4
00
Diameter range (nm)
% fi
bre
s
0
5
10
15
20
25
30
35
40
<1
00
10
0-1
50
15
1-2
00
20
1-2
50
25
1-3
00
30
1-3
50
35
1-4
00
>4
00
% fi
bre
s
Diameter range (nm)
Figure 4.8: PVA/Cu (A) and SMA/Cu (B) nanofibre diameters.
4.6.3 Energy dispersive x-ray analysis (EDX)
Energy dispersive X-ray analysis (EDX) confirmed the presence of the Cu2+
ions on the surfaces of
both SMA/Cu and PVA/Cu. SMA/Cu nanofibres mats had more Cu2+
traces on the surface compared
to PVA/Cu nanofibres. This was confirmed by quantitative EDX results where by 12 ±1.43% Cu was
detected on PVA/Cu nanofibre surfaces and 18.79 ±3.44% on SMA/Cu nanofibrous mat surfaces. This
is also seen on the EDX spectra where SMA/Cu nanofibres had more detections of Cu compared to
PVA/Cu (Figure 4.9B). (The unlabelled peaks were either Au from gold sputtering or C-O from
polymer backbone).
A
A
B
Stellenbosch University http://scholar.sun.ac.za
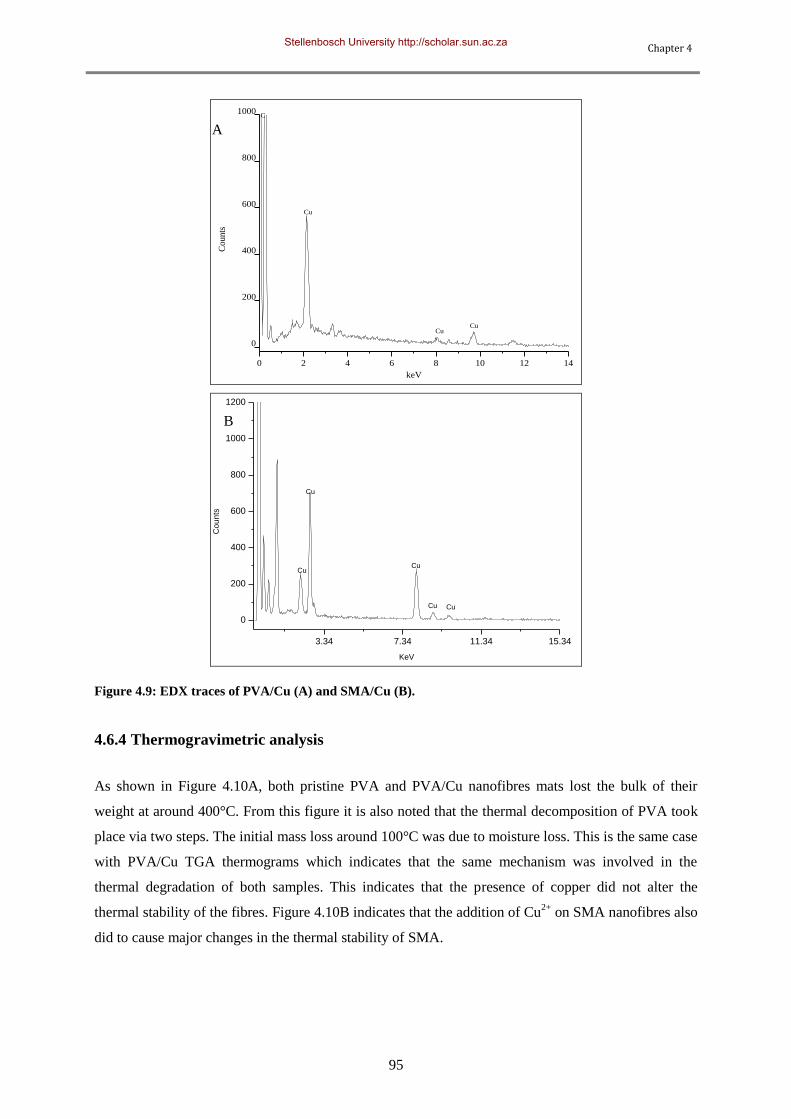
Chapter 4
95
0 2 4 6 8 10 12 14
0
200
400
600
800
1000
CuCu
Cu
C
Co
un
ts
keV
3.34 7.34 11.34 15.34
0
200
400
600
800
1000
1200
Cu
Cu
Cu
CuCu
Cou
nts
KeV
Figure 4.9: EDX traces of PVA/Cu (A) and SMA/Cu (B).
4.6.4 Thermogravimetric analysis
As shown in Figure 4.10A, both pristine PVA and PVA/Cu nanofibres mats lost the bulk of their
weight at around 400°C. From this figure it is also noted that the thermal decomposition of PVA took
place via two steps. The initial mass loss around 100°C was due to moisture loss. This is the same case
with PVA/Cu TGA thermograms which indicates that the same mechanism was involved in the
thermal degradation of both samples. This indicates that the presence of copper did not alter the
thermal stability of the fibres. Figure 4.10B indicates that the addition of Cu2+
on SMA nanofibres also
did to cause major changes in the thermal stability of SMA.
A
B
Stellenbosch University http://scholar.sun.ac.za
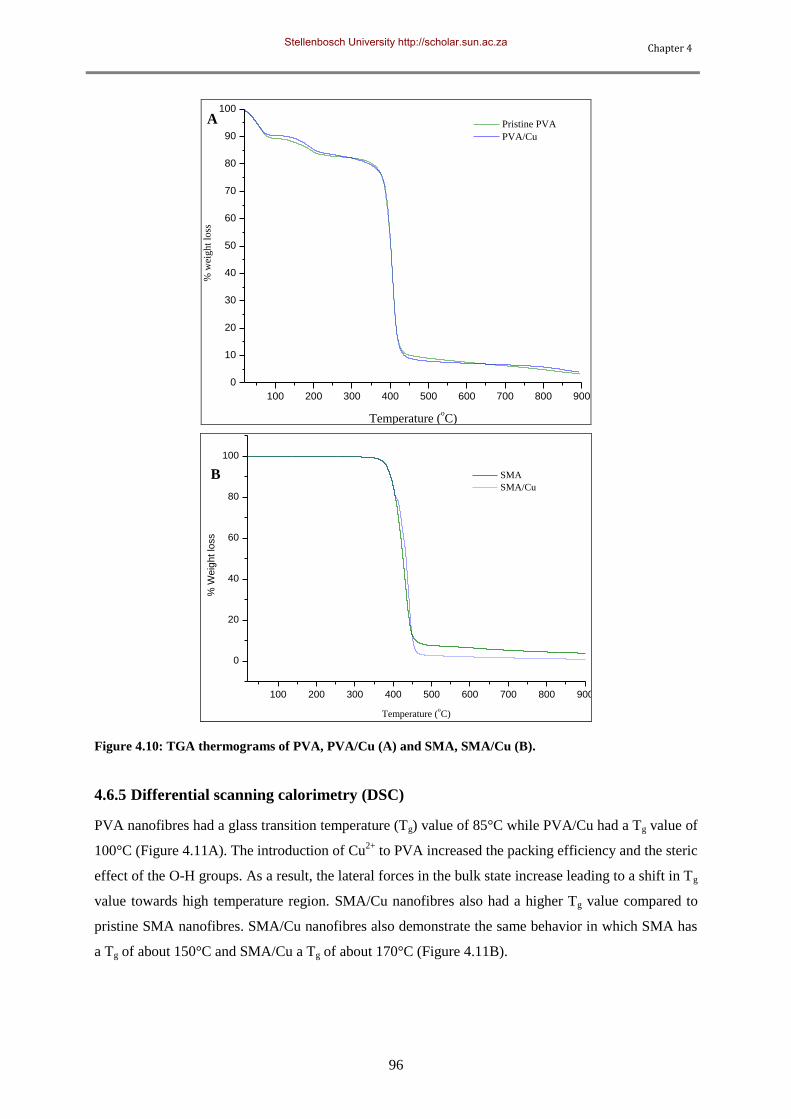
Chapter 4
96
100 200 300 400 500 600 700 800 900
0
10
20
30
40
50
60
70
80
90
100
% w
eig
ht
loss
Temperature (oC)
Pristine PVA
PVA/Cu
100 200 300 400 500 600 700 800 900
0
20
40
60
80
100
% W
eig
ht lo
ss
Temperature (oC)
SMA
SMA/Cu
Figure 4.10: TGA thermograms of PVA, PVA/Cu (A) and SMA, SMA/Cu (B).
4.6.5 Differential scanning calorimetry (DSC)
PVA nanofibres had a glass transition temperature (Tg) value of 85°C while PVA/Cu had a Tg value of
100°C (Figure 4.11A). The introduction of Cu2+
to PVA increased the packing efficiency and the steric
effect of the O-H groups. As a result, the lateral forces in the bulk state increase leading to a shift in Tg
value towards high temperature region. SMA/Cu nanofibres also had a higher Tg value compared to
pristine SMA nanofibres. SMA/Cu nanofibres also demonstrate the same behavior in which SMA has
a Tg of about 150°C and SMA/Cu a Tg of about 170°C (Figure 4.11B).
A
B
Stellenbosch University http://scholar.sun.ac.za
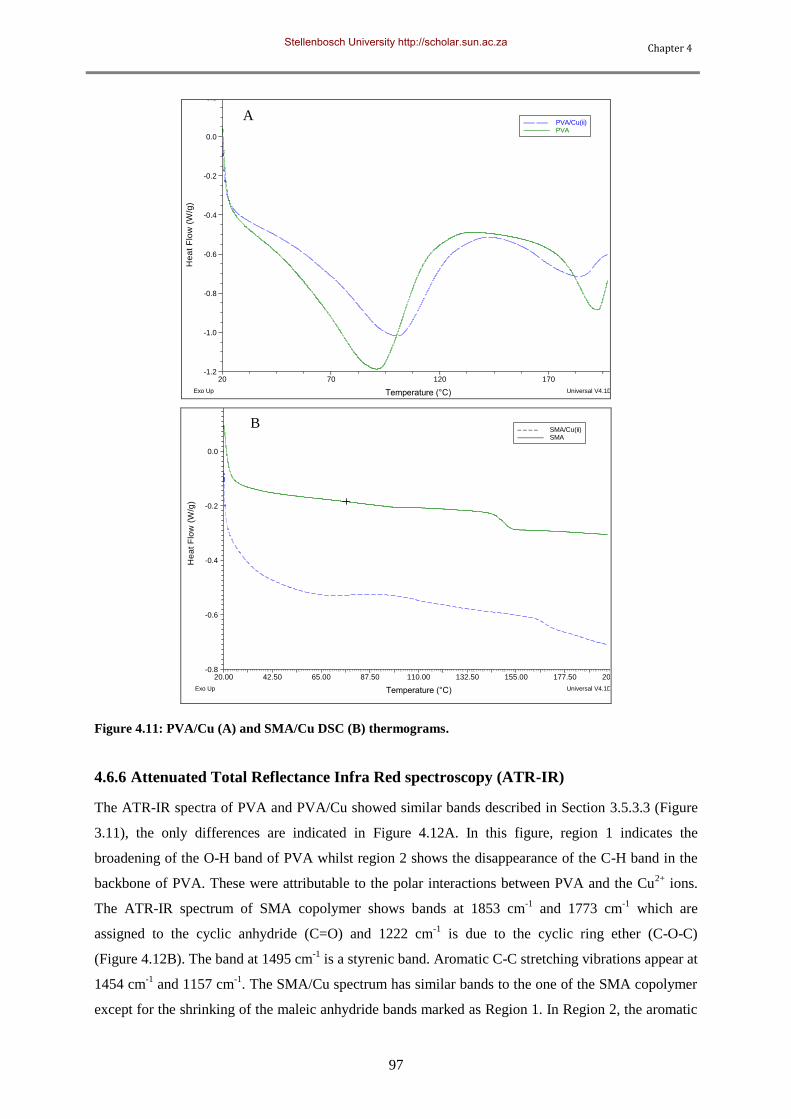
Chapter 4
97
-1.2
-1.0
-0.8
-0.6
-0.4
-0.2
0.0
0.2
He
at
Flo
w (
W/g
)
20 70 120 170
Temperature (°C)
PVA/Cu(ii)––– ––– PVA–––––––
Exo Up Universal V4.1D TA Instruments
-0.8
-0.6
-0.4
-0.2
0.0
0.2
He
at
Flo
w (
W/g
)
20.00 42.50 65.00 87.50 110.00 132.50 155.00 177.50 200.00
Temperature (°C)
SMA/Cu(ii)– – – – SMA–––––––
Exo Up Universal V4.1D TA Instruments
Figure 4.11: PVA/Cu (A) and SMA/Cu DSC (B) thermograms.
4.6.6 Attenuated Total Reflectance Infra Red spectroscopy (ATR-IR)
The ATR-IR spectra of PVA and PVA/Cu showed similar bands described in Section 3.5.3.3 (Figure
3.11), the only differences are indicated in Figure 4.12A. In this figure, region 1 indicates the
broadening of the O-H band of PVA whilst region 2 shows the disappearance of the C-H band in the
backbone of PVA. These were attributable to the polar interactions between PVA and the Cu2+
ions.
The ATR-IR spectrum of SMA copolymer shows bands at 1853 cm-1
and 1773 cm-1
which are
assigned to the cyclic anhydride (C=O) and 1222 cm-1
is due to the cyclic ring ether (C-O-C)
(Figure 4.12B). The band at 1495 cm-1
is a styrenic band. Aromatic C-C stretching vibrations appear at
1454 cm-1
and 1157 cm-1
. The SMA/Cu spectrum has similar bands to the one of the SMA copolymer
except for the shrinking of the maleic anhydride bands marked as Region 1. In Region 2, the aromatic
A
B
Stellenbosch University http://scholar.sun.ac.za
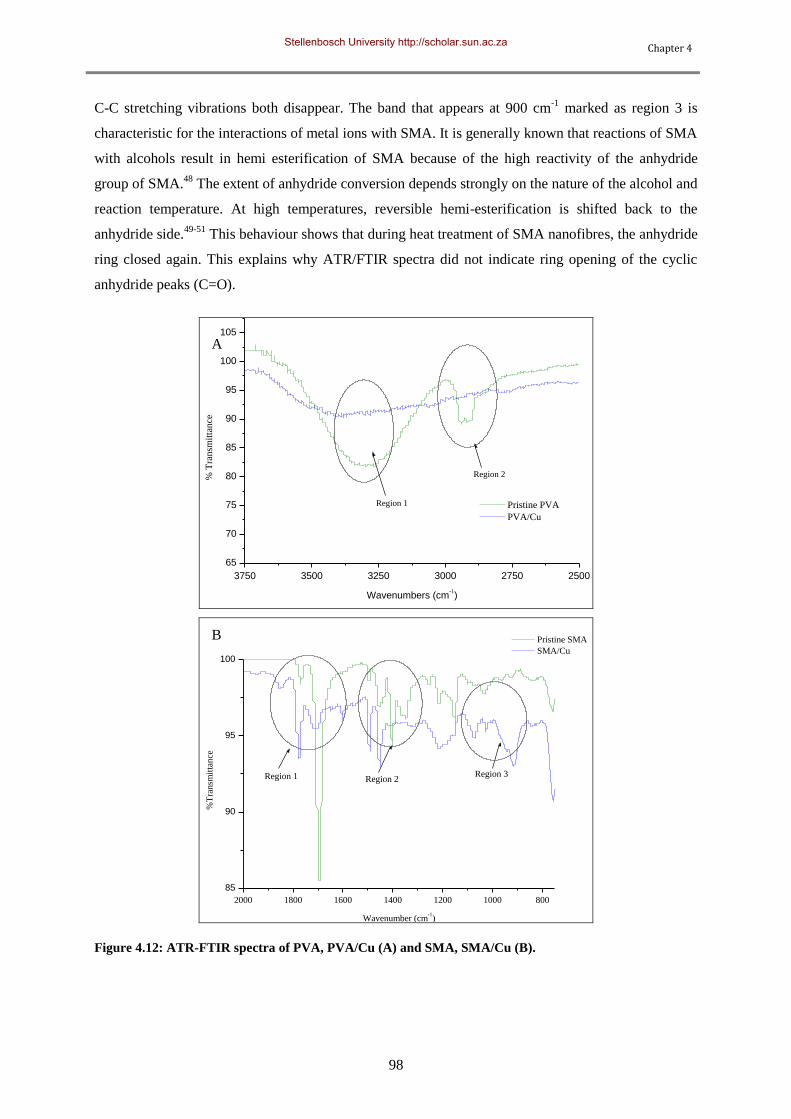
Chapter 4
98
C-C stretching vibrations both disappear. The band that appears at 900 cm-1
marked as region 3 is
characteristic for the interactions of metal ions with SMA. It is generally known that reactions of SMA
with alcohols result in hemi esterification of SMA because of the high reactivity of the anhydride
group of SMA.48
The extent of anhydride conversion depends strongly on the nature of the alcohol and
reaction temperature. At high temperatures, reversible hemi-esterification is shifted back to the
anhydride side.49-51
This behaviour shows that during heat treatment of SMA nanofibres, the anhydride
ring closed again. This explains why ATR/FTIR spectra did not indicate ring opening of the cyclic
anhydride peaks (C=O).
3750 3500 3250 3000 2750 2500
65
70
75
80
85
90
95
100
105
Region 2
Region 1
% T
ran
smit
tan
ce
Wavenumbers (cm-1)
Pristine PVA
PVA/Cu
2000 1800 1600 1400 1200 1000 800
85
90
95
100
Region 3Region 2Region 1
%T
ran
smit
tan
ce
Wavenumber (cm-1)
Pristine SMA
SMA/Cu
Figure 4.12: ATR-FTIR spectra of PVA, PVA/Cu (A) and SMA, SMA/Cu (B).
A
B
Stellenbosch University http://scholar.sun.ac.za
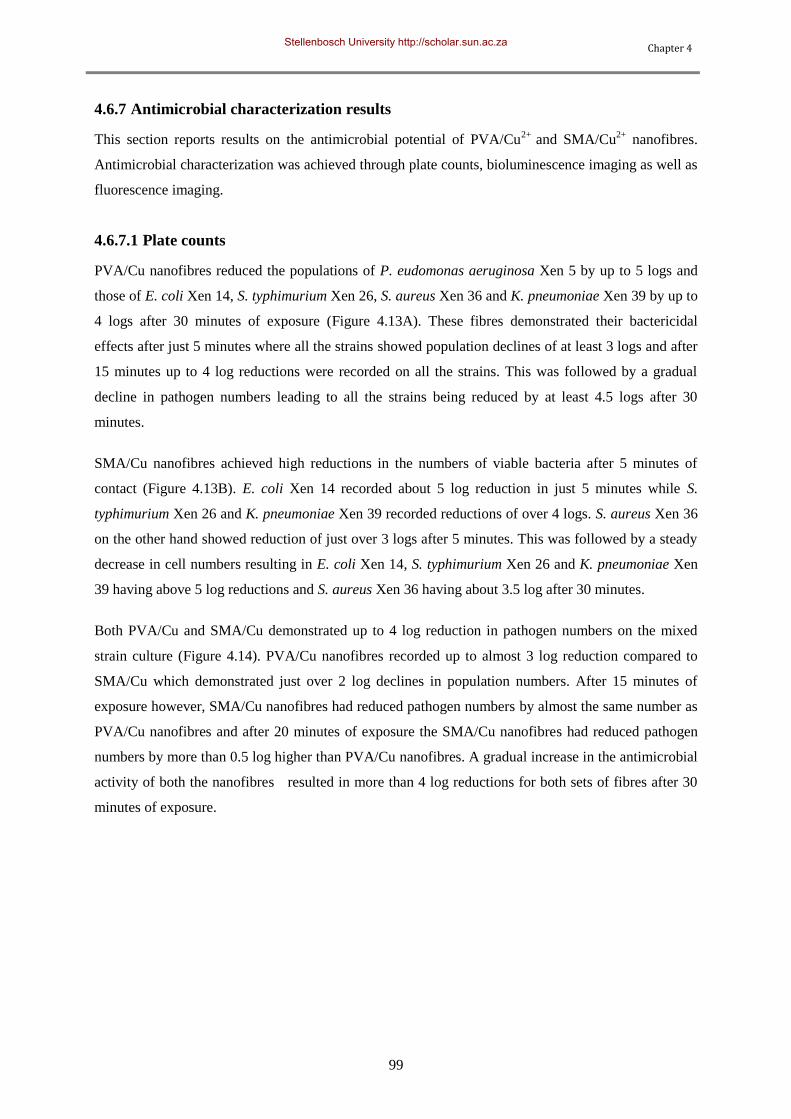
Chapter 4
99
4.6.7 Antimicrobial characterization results
This section reports results on the antimicrobial potential of PVA/Cu2+
and SMA/Cu2+
nanofibres.
Antimicrobial characterization was achieved through plate counts, bioluminescence imaging as well as
fluorescence imaging.
4.6.7.1 Plate counts
PVA/Cu nanofibres reduced the populations of P. eudomonas aeruginosa Xen 5 by up to 5 logs and
those of E. coli Xen 14, S. typhimurium Xen 26, S. aureus Xen 36 and K. pneumoniae Xen 39 by up to
4 logs after 30 minutes of exposure (Figure 4.13A). These fibres demonstrated their bactericidal
effects after just 5 minutes where all the strains showed population declines of at least 3 logs and after
15 minutes up to 4 log reductions were recorded on all the strains. This was followed by a gradual
decline in pathogen numbers leading to all the strains being reduced by at least 4.5 logs after 30
minutes.
SMA/Cu nanofibres achieved high reductions in the numbers of viable bacteria after 5 minutes of
contact (Figure 4.13B). E. coli Xen 14 recorded about 5 log reduction in just 5 minutes while S.
typhimurium Xen 26 and K. pneumoniae Xen 39 recorded reductions of over 4 logs. S. aureus Xen 36
on the other hand showed reduction of just over 3 logs after 5 minutes. This was followed by a steady
decrease in cell numbers resulting in E. coli Xen 14, S. typhimurium Xen 26 and K. pneumoniae Xen
39 having above 5 log reductions and S. aureus Xen 36 having about 3.5 log after 30 minutes.
Both PVA/Cu and SMA/Cu demonstrated up to 4 log reduction in pathogen numbers on the mixed
strain culture (Figure 4.14). PVA/Cu nanofibres recorded up to almost 3 log reduction compared to
SMA/Cu which demonstrated just over 2 log declines in population numbers. After 15 minutes of
exposure however, SMA/Cu nanofibres had reduced pathogen numbers by almost the same number as
PVA/Cu nanofibres and after 20 minutes of exposure the SMA/Cu nanofibres had reduced pathogen
numbers by more than 0.5 log higher than PVA/Cu nanofibres. A gradual increase in the antimicrobial
activity of both the nanofibres resulted in more than 4 log reductions for both sets of fibres after 30
minutes of exposure.
Stellenbosch University http://scholar.sun.ac.za
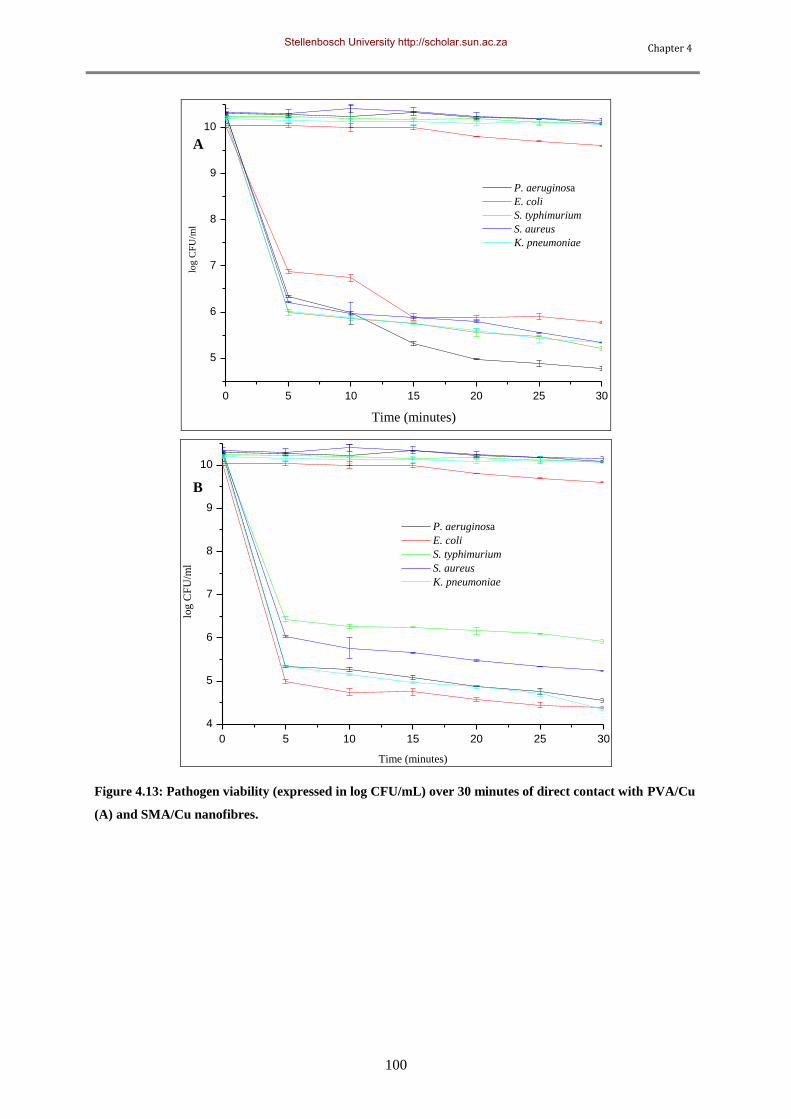
Chapter 4
100
0 5 10 15 20 25 30
5
6
7
8
9
10
P. aeruginosa
E. coli
S. typhimurium
S. aureus
K. pneumoniae
log
CF
U/m
l
Time (minutes)
0 5 10 15 20 25 30
4
5
6
7
8
9
10
P. aeruginosa
E. coli
S. typhimurium
S. aureus
K. pneumoniae
log C
FU
/ml
Time (minutes)
Figure 4.13: Pathogen viability (expressed in log CFU/mL) over 30 minutes of direct contact with PVA/Cu
(A) and SMA/Cu nanofibres.
A
B
Stellenbosch University http://scholar.sun.ac.za
Chapter 4
101
5 10 15 20 25 30
6
7
8
9
10
log
CF
U/m
l
Time (minutes)
Control
PVA/Cu
SMA/Cu
Figure 4.14: Antimicrobial activity demonstrated by PVA/Cu and SMA/Cu on mixed-culture cells.
4.6.7.2 Bioluminescence Imaging
In vivo imaging Pseudomonas aeruginosa Xen 5, Escherichia coli Xen 14, Salmonella typhimurium
Xen 26, Staphylococcus aureus Xen 36 and Klebsiella pneumoniae Xen 39 on PVA/Cu and SMA/Cu
nanofibres confirmed some of the results obtained from plate counting. PVA/Cu demonstrated high
inactivation of Pseudomonas aeruginosa Xen 5, Staphylococcus aureus Xen 36 and Salmonella
typhimurium Xen 26 (Table 4.2), this is indicated by the decrease in the number of photons emitted by
these strains especially after 10 minutes of being exposed to the nanofibres. Escherichia coli Xen 14
and Klebsiella pneumoniae Xen 39 on the other hand showed some resistance to the bactericidal Cu2+
.
These findings were in agreement with those obtained from the plate counting technique (Figure 4.13
A).
SMA/Cu nanofibres also showed reduction in the number of photon emissions by the bacteria
(Table 4.2). An instant reduction in metabolically active Escherichia coli Xen 14 cells was observed.
Pseudomonas aeruginosa Xen 5 cells were also significantly reduced after 10 minutes of exposure to
the SMA/Cu nanofibres. Salmonella typhimurium Xen 26, Staphylococcus aureus Xen 36 and
Klebsiella pneumoniae Xen 39 all had their numbers reduced as depicted from the photon emissions.
The results from in vivo imaging suggest that Escherichia coli Xen 14 and Klebsiella pneumoniae Xen
39 develop some dormancy on getting into contact with PVA/Cu nanofibres. This assumption comes
about as a result of the amount of metabolically active (photon emitting) cells observed on the in vivo
images compared to the high (up to 4 log) reductions obtained from plate counting. The same
assumption goes for the case of Salmonella typhimurium Xen 26, Staphylococcus aureus Xen 36 and
Klebsiella pneumoniae Xen 39 in SMA/Cu nanofibre nanofibres.
Stellenbosch University http://scholar.sun.ac.za
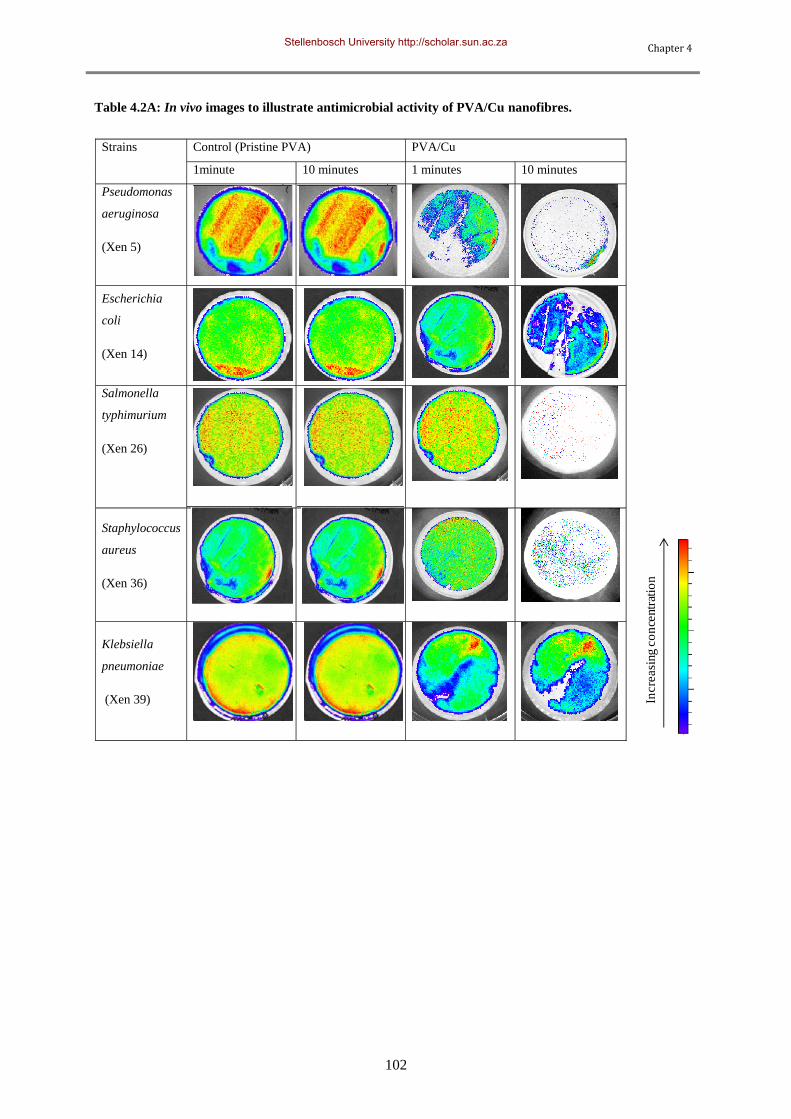
Chapter 4
102
Table 4.2A: In vivo images to illustrate antimicrobial activity of PVA/Cu nanofibres.
Strains Control (Pristine PVA) PVA/Cu
1minute 10 minutes 1 minutes 10 minutes
Pseudomonas
aeruginosa
(Xen 5)
Escherichia
coli
(Xen 14)
Salmonella
typhimurium
(Xen 26)
Staphylococcus
aureus
(Xen 36)
Klebsiella
pneumoniae
(Xen 39)
Incre
asi
ng c
on
centr
atio
n
Strain
PVA PVA/AquaQure
1 minute 10 minutes 1 minute 10 minutes
Pseudomonas
aeruginosa
(Xen 5)
Escherichia coli
(Xen 14)
Salmonella
typhimurium
(Xen 26)
Staphylococcus
aureus
(Xen 36)
Klebsiella
pneumoniae
(Xen 39)
Strain
PVA PVA/AquaQure
1 minute 10 minutes 1 minute 10 minutes
Pseudomonas
aeruginosa
(Xen 5)
Escherichia coli
(Xen 14)
Salmonella
typhimurium
(Xen 26)
Staphylococcus
aureus
(Xen 36)
Klebsiella
pneumoniae
(Xen 39)
Strain
PVA PVA/AquaQure
1 minute 10 minutes 1 minute 10 minutes
Pseudomonas
aeruginosa
(Xen 5)
Escherichia coli
(Xen 14)
Salmonella
typhimurium
(Xen 26)
Staphylococcus
aureus
(Xen 36)
Klebsiella
pneumoniae
(Xen 39)
Strain
PVA PVA/AquaQure
1 minute 10 minutes 1 minute 10 minutes
Pseudomonas
aeruginosa
(Xen 5)
Escherichia coli
(Xen 14)
Salmonella
typhimurium
(Xen 26)
Staphylococcus
aureus
(Xen 36)
Klebsiella
pneumoniae
(Xen 39)
Strain
PVA PVA/AquaQure
1 minute 10 minutes 1 minute 10 minutes
Pseudomonas
aeruginosa
(Xen 5)
Escherichia coli
(Xen 14)
Salmonella
typhimurium
(Xen 26)
Staphylococcus
aureus
(Xen 36)
Klebsiella
pneumoniae
(Xen 39)
Strain
PVA PVA/AquaQure
1 minute 10 minutes 1 minute 10 minutes
Pseudomonas
aeruginosa
(Xen 5)
Escherichia coli
(Xen 14)
Salmonella
typhimurium
(Xen 26)
Staphylococcus
aureus
(Xen 36)
Klebsiella
pneumoniae
(Xen 39)
Strain
PVA PVA/AquaQure
1 minute 10 minutes 1 minute 10 minutes
Pseudomonas
aeruginosa
(Xen 5)
Escherichia coli
(Xen 14)
Salmonella
typhimurium
(Xen 26)
Staphylococcus
aureus
(Xen 36)
Klebsiella
pneumoniae
(Xen 39)
Strain
PVA PVA/AquaQure
1 minute 10 minutes 1 minute 10 minutes
Pseudomonas
aeruginosa
(Xen 5)
Escherichia coli
(Xen 14)
Salmonella
typhimurium
(Xen 26)
Staphylococcus
aureus
(Xen 36)
Klebsiella
pneumoniae
(Xen 39)
Strain
PVA PVA/AquaQure
1 minute 10 minutes 1 minute 10 minutes
Pseudomonas
aeruginosa
(Xen 5)
Escherichia coli
(Xen 14)
Salmonella
typhimurium
(Xen 26)
Staphylococcus
aureus
(Xen 36)
Klebsiella
pneumoniae
(Xen 39)
Strain
PVA PVA/AquaQure
1 minute 10 minutes 1 minute 10 minutes
Pseudomonas
aeruginosa
(Xen 5)
Escherichia coli
(Xen 14)
Salmonella
typhimurium
(Xen 26)
Staphylococcus
aureus
(Xen 36)
Klebsiella
pneumoniae
(Xen 39)
Stellenbosch University http://scholar.sun.ac.za
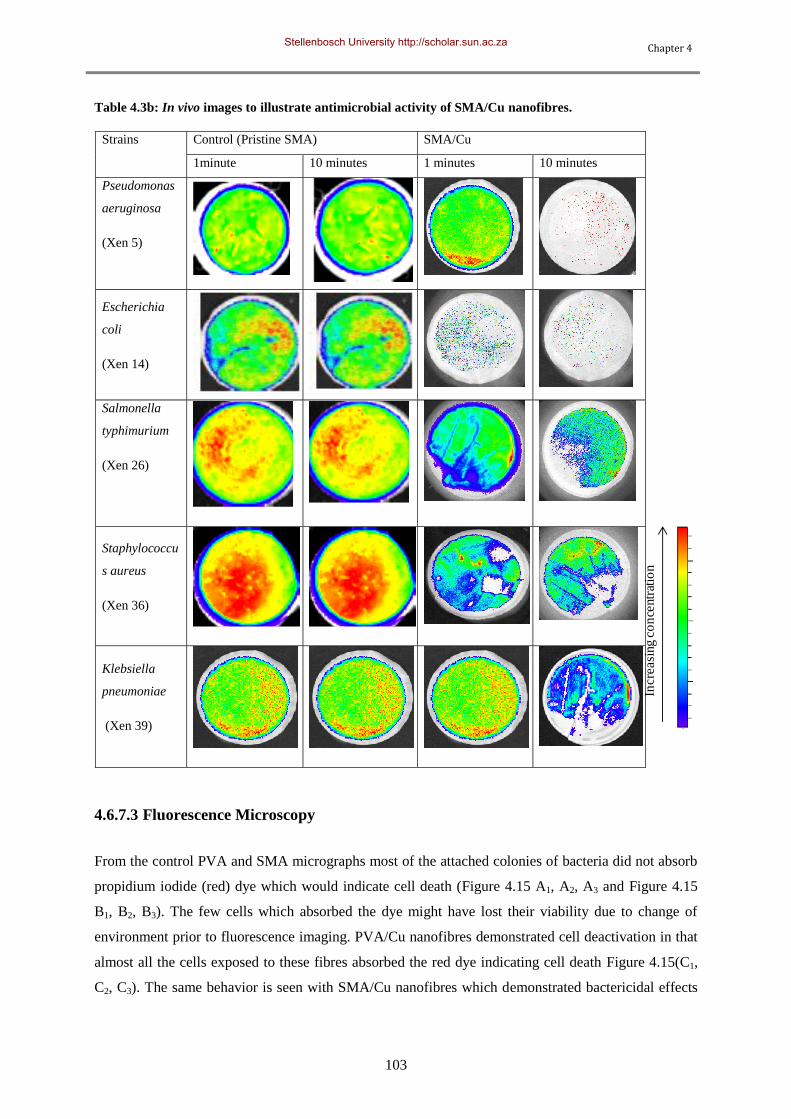
Chapter 4
103
Table 4.3b: In vivo images to illustrate antimicrobial activity of SMA/Cu nanofibres.
Incre
asi
ng c
on
centr
atio
n
Strains Control (Pristine SMA) SMA/Cu
1minute 10 minutes 1 minutes 10 minutes
Pseudomonas
aeruginosa
(Xen 5)
Escherichia
coli
(Xen 14)
Salmonella
typhimurium
(Xen 26)
Staphylococcu
s aureus
(Xen 36)
Klebsiella
pneumoniae
(Xen 39)
4.6.7.3 Fluorescence Microscopy
From the control PVA and SMA micrographs most of the attached colonies of bacteria did not absorb
propidium iodide (red) dye which would indicate cell death (Figure 4.15 A1, A2, A3 and Figure 4.15
B1, B2, B3). The few cells which absorbed the dye might have lost their viability due to change of
environment prior to fluorescence imaging. PVA/Cu nanofibres demonstrated cell deactivation in that
almost all the cells exposed to these fibres absorbed the red dye indicating cell death Figure 4.15(C1,
C2, C3). The same behavior is seen with SMA/Cu nanofibres which demonstrated bactericidal effects
Stellenbosch University http://scholar.sun.ac.za
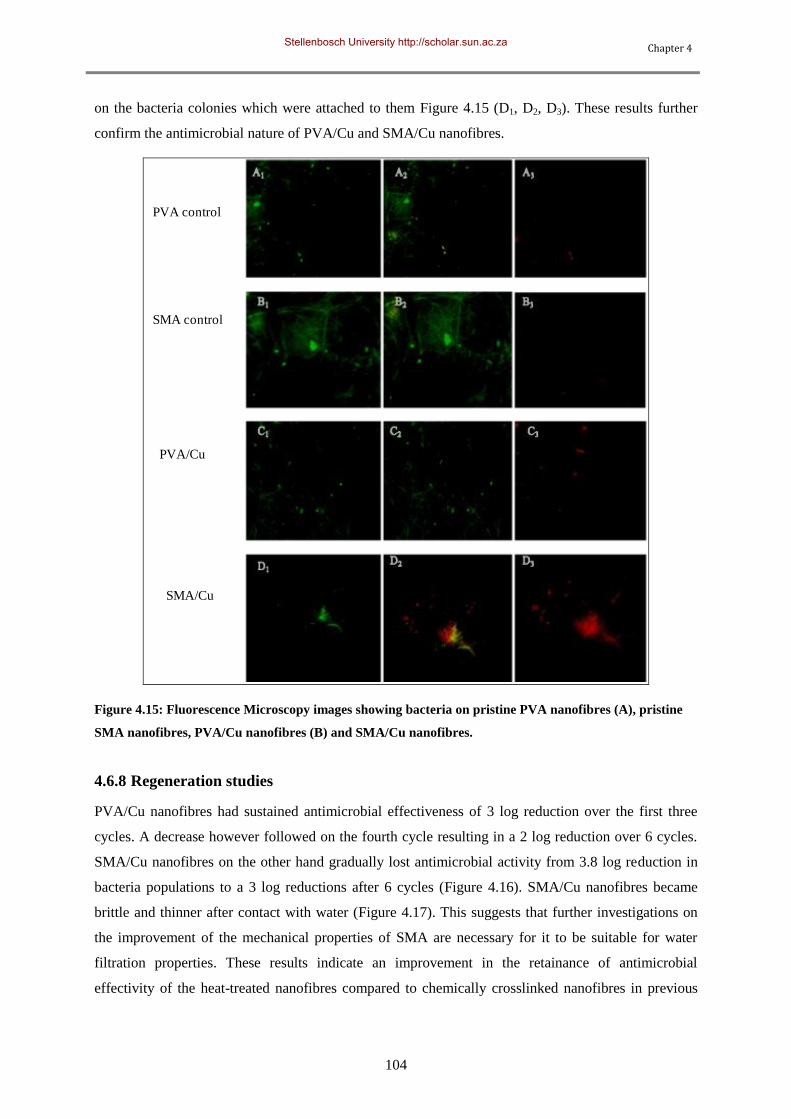
Chapter 4
104
on the bacteria colonies which were attached to them Figure 4.15 (D1, D2, D3). These results further
confirm the antimicrobial nature of PVA/Cu and SMA/Cu nanofibres.
PVA control
SMA control
PVA/Cu
SMA/Cu
Figure 4.15: Fluorescence Microscopy images showing bacteria on pristine PVA nanofibres (A), pristine
SMA nanofibres, PVA/Cu nanofibres (B) and SMA/Cu nanofibres.
4.6.8 Regeneration studies
PVA/Cu nanofibres had sustained antimicrobial effectiveness of 3 log reduction over the first three
cycles. A decrease however followed on the fourth cycle resulting in a 2 log reduction over 6 cycles.
SMA/Cu nanofibres on the other hand gradually lost antimicrobial activity from 3.8 log reduction in
bacteria populations to a 3 log reductions after 6 cycles (Figure 4.16). SMA/Cu nanofibres became
brittle and thinner after contact with water (Figure 4.17). This suggests that further investigations on
the improvement of the mechanical properties of SMA are necessary for it to be suitable for water
filtration properties. These results indicate an improvement in the retainance of antimicrobial
effectivity of the heat-treated nanofibres compared to chemically crosslinked nanofibres in previous
Stellenbosch University http://scholar.sun.ac.za
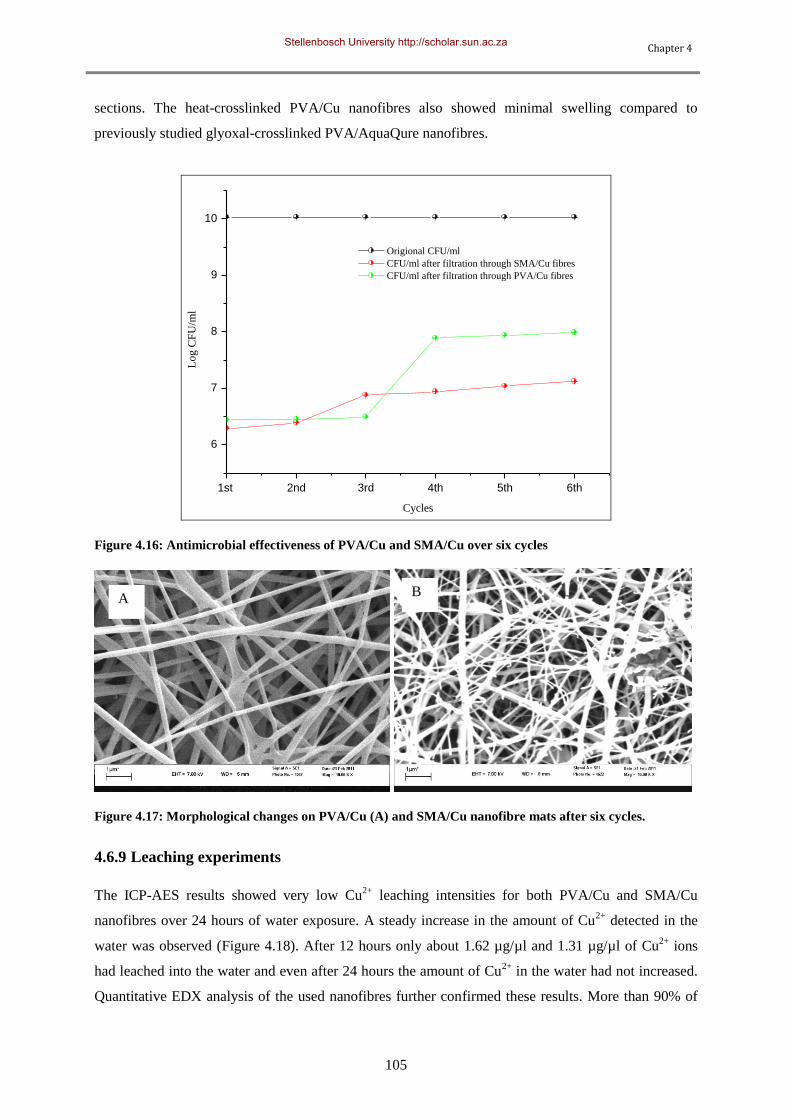
Chapter 4
105
sections. The heat-crosslinked PVA/Cu nanofibres also showed minimal swelling compared to
previously studied glyoxal-crosslinked PVA/AquaQure nanofibres.
1st 2nd 3rd 4th 5th 6th
6
7
8
9
10
Lo
g C
FU
/ml
Cycles
Origional CFU/ml
CFU/ml after filtration through SMA/Cu fibres
CFU/ml after filtration through PVA/Cu fibres
Figure 4.16: Antimicrobial effectiveness of PVA/Cu and SMA/Cu over six cycles
Figure 4.17: Morphological changes on PVA/Cu (A) and SMA/Cu nanofibre mats after six cycles.
4.6.9 Leaching experiments
The ICP-AES results showed very low Cu2+
leaching intensities for both PVA/Cu and SMA/Cu
nanofibres over 24 hours of water exposure. A steady increase in the amount of Cu2+
detected in the
water was observed (Figure 4.18). After 12 hours only about 1.62 µg/µl and 1.31 µg/µl of Cu2+
ions
had leached into the water and even after 24 hours the amount of Cu2+
in the water had not increased.
Quantitative EDX analysis of the used nanofibres further confirmed these results. More than 90% of
A B
Stellenbosch University http://scholar.sun.ac.za
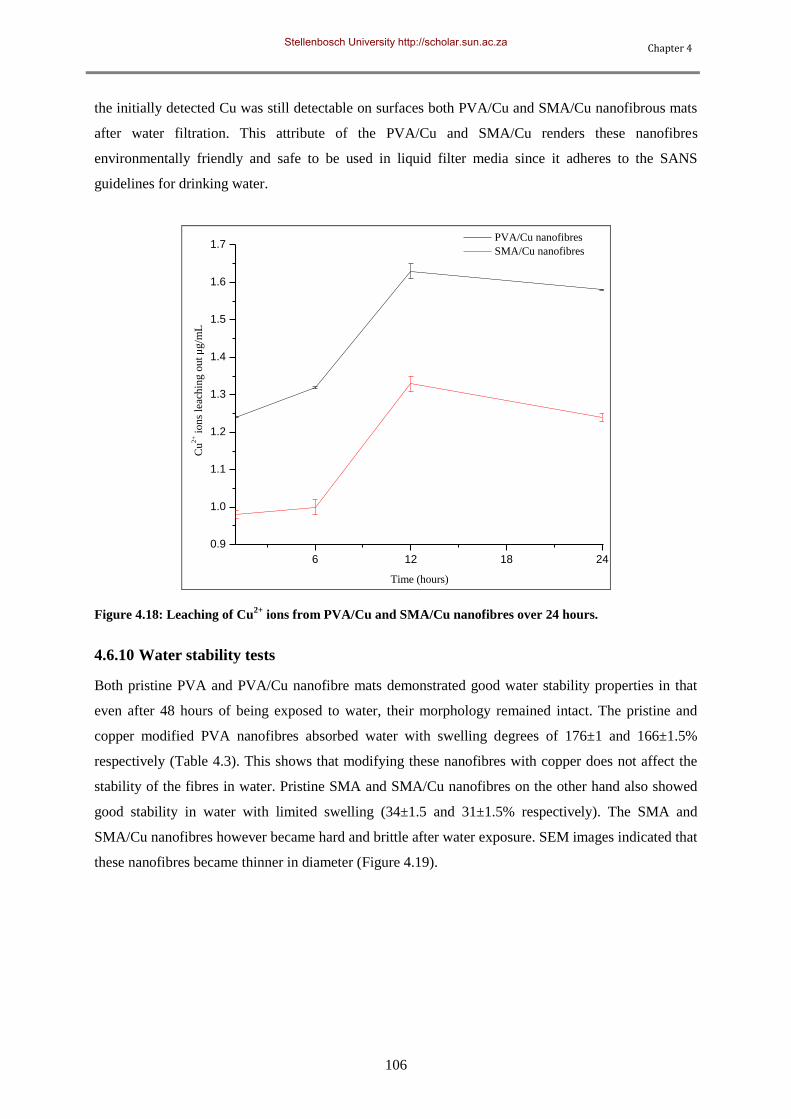
Chapter 4
106
the initially detected Cu was still detectable on surfaces both PVA/Cu and SMA/Cu nanofibrous mats
after water filtration. This attribute of the PVA/Cu and SMA/Cu renders these nanofibres
environmentally friendly and safe to be used in liquid filter media since it adheres to the SANS
guidelines for drinking water.
6 12 18 24
0.9
1.0
1.1
1.2
1.3
1.4
1.5
1.6
1.7
Cu
2+ i
on
s le
ach
ing
ou
t g/m
L
Time (hours)
PVA/Cu nanofibres
SMA/Cu nanofibres
Figure 4.18: Leaching of Cu2+
ions from PVA/Cu and SMA/Cu nanofibres over 24 hours.
4.6.10 Water stability tests
Both pristine PVA and PVA/Cu nanofibre mats demonstrated good water stability properties in that
even after 48 hours of being exposed to water, their morphology remained intact. The pristine and
copper modified PVA nanofibres absorbed water with swelling degrees of 176±1 and 166±1.5%
respectively (Table 4.3). This shows that modifying these nanofibres with copper does not affect the
stability of the fibres in water. Pristine SMA and SMA/Cu nanofibres on the other hand also showed
good stability in water with limited swelling (34±1.5 and 31±1.5% respectively). The SMA and
SMA/Cu nanofibres however became hard and brittle after water exposure. SEM images indicated that
these nanofibres became thinner in diameter (Figure 4.19).
Stellenbosch University http://scholar.sun.ac.za
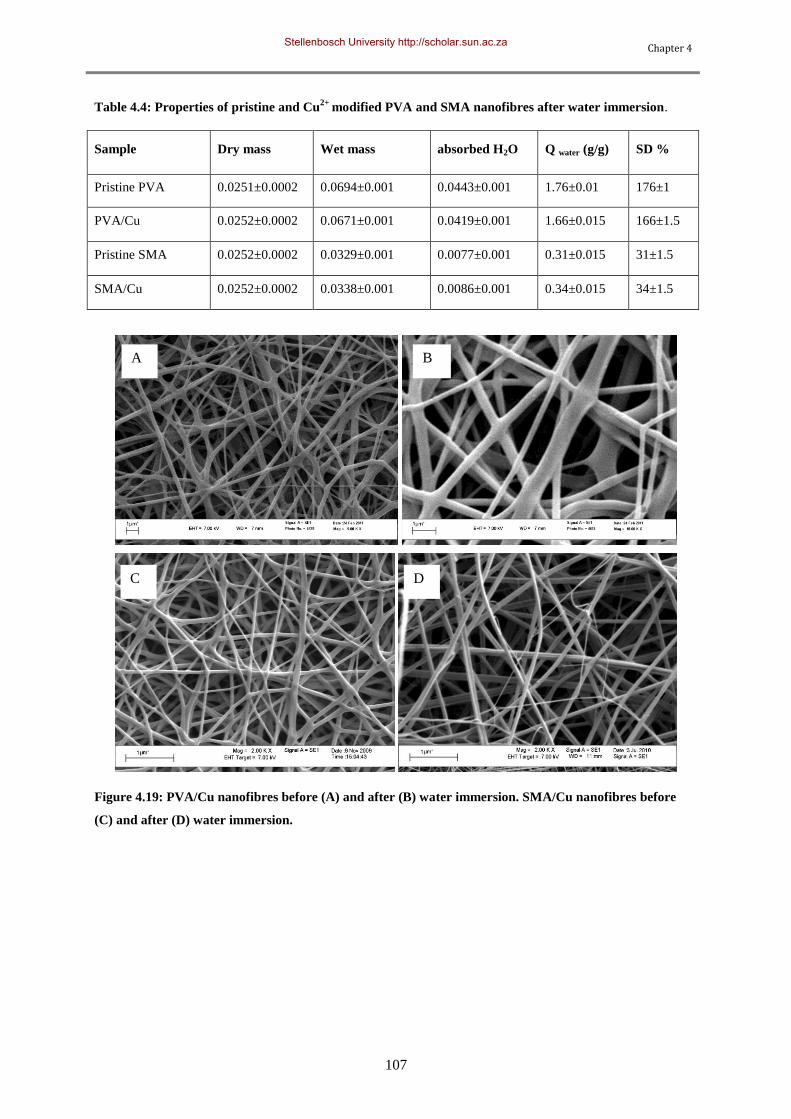
Chapter 4
107
Table 4.4: Properties of pristine and Cu2+
modified PVA and SMA nanofibres after water immersion.
Sample Dry mass Wet mass absorbed H2O Q water (g/g) SD %
Pristine PVA 0.0251±0.0002 0.0694±0.001 0.0443±0.001 1.76±0.01 176±1
PVA/Cu 0.0252±0.0002 0.0671±0.001 0.0419±0.001 1.66±0.015 166±1.5
Pristine SMA 0.0252±0.0002 0.0329±0.001 0.0077±0.001 0.31±0.015 31±1.5
SMA/Cu 0.0252±0.0002 0.0338±0.001 0.0086±0.001 0.34±0.015 34±1.5
Figure 4.19: PVA/Cu nanofibres before (A) and after (B) water immersion. SMA/Cu nanofibres before
(C) and after (D) water immersion.
A B
C D
Stellenbosch University http://scholar.sun.ac.za
Chapter 4
108
4.7 Conclusions
PVA/Cu and SMA/Cu nanofibres were fabricated from Cu2+
-polymer blends using the bubble
electrospinning technique. The presence of Cu2+
in the nanofibres was confirmed using EDX.
Thermogravimetric analysis indicated that the inclusion of Cu2+
to both PVA/Cu2+
and SMA/Cu2+
nanofibres did not affect the thermal stability of the nanofibres. Increases in the Tg values from 85°C
in pristine PVA nanofibres to about 100°C in the case of PVA/Cu2+
and 150°C (pristine SMA
nanofibres) to 170°C for SMA/Cu2+
were recorded through differential scanning calorimetry.
PVA/Cu nanofibres reduced the populations of P. aeruginosa Xen 5 by up to 5 logs and those of E.
coli Xen 14, S. typhimurium Xen 26, S. aureus Xen 36 and K. pneumoniae Xen 39 by up to 4 logs
after 30 minutes of exposure. SMA/Cu nanofibres on the other hand, achieved high reductions in the
numbers of viable bacteria after 30 minutes of contact. E. coli Xen 14, S. typhimurium Xen 26 and K.
pneumoniae Xen 39 were reduced by more than 5 log and S. aureus Xen 36 by about 3.5 log. Both
PVA/Cu and SMA/Cu demonstrated up to 4 log reduction in pathogen numbers on the mixed strain
culture.
Bioluminescence imaging confirmed some of the results obtained through plate counting for both
PVA/Cu2+
and SMA/Cu2+
nanofibres. The in vivo images also suggested some metabolic activity
(photon emissions) in more cells than revealed by plate counting suggesting that some of the strains
develop dormancy on contact with Cu2+
containing nanofibres. The antimicrobial activity of copper
containing PVA and SMA nanofibres was also confirmed through fluorescence microscopy.
Regeneration results indicated that PVA/Cu2+
had sustained activity with more than 3 log reductions
over 3 cycles followed by loss in activity but still exhibited more than 2 log reductions after 6 cycles.
SMA/Cu2+
nanofibres on the other hand showed minor losses in antimicrobial effectiveness after 6
cycles and still achieved up to 3.8 log reductions in populations of the mixed strain culture (P.
aeruginosa Xen 5, E. coli Xen 14, S. typhimurium Xen 26, S.aureus Xen 36 and K. pneumoniae Xen
39).
SMA/Cu nanofibres however became brittle and thin after contact with liquid media. This led to the
assumption that the gradual loss of activity could be due to some fibres breaking thus increasing the
pores on the nanofibre mat allowing some bacteria to pass through. From the leaching experiments
PVA/Cu and SMA/Cu nanofibres showed leaching of 1.62 and 1.31 µg/ml of Cu2+
respectively and
further quantitalive EDX confirmed these results. Further improvements on the mechanical properties
of SMA in order for it to be usable in filtration media especially liquid media.
Stellenbosch University http://scholar.sun.ac.za
Chapter 4
109
4.8 References
1. Sheikh F.A.; Kanjwal M.A.; Saran S.; Chung W-J.; Kim H. Applied Surface Science 2011,
257, 3020-3026.
2. Borkow G.; Gabbay J. Current Chemical Biology 2009, 3, 272-278.
3. Borkow G.; Gabbay J. FASEB Journal 2004, 18, 1728-1730.
4. Dollwet H.H.A.; Sorenson J.R.J. Trace Elements Medicine 2001, 2, 80-87.
5. Scigliano J.A.; Grubb T.C.; Shay D.E. Journal of American Pharmeutical Association 1950,
39, 673-676.
6. Belli N.; Marin S.; Sanchis V.; Ramos A.J. Food Addition: Contamination 2006, 23, 1021-
1029.
7. Botes M.; Cloete T.E. Critical Reviews in Microbiology 2010, 36, 68-81.
8. Ramakrishna S.; Fujihara K.; Teo W-E.; Lim T-C.; Ma Z., An Introduction to Electrospinning
and Nanofibres. World Scientific Publishing Co. Pte. Ltd.: Toh Tuck Link, Singapore, 2005.
9. Greyling C.J. Electrospinning of polyacrylonitrile nanofibres with additive: Study of
orientation and crystalinity. Stellenbosch University, Stellenbosch, 2010.
10. Wang Y.; Aponte M.; Leon N.; Ramos I.; Furlan R.; Evoy S.; Santiago-Avil´e J. Materials
Letters 2005, 59, 3046-3049.
11. Melaiye A. Journal of the American Chemical Society 2005, 127, 2285-2291.
12. Patel A.C.; Li S.; Wang C.; Zhang W.; Wei Y. Chemical Materials 2007, 19, 1231-1238.
13. Yuh J. Materials Letters 2005, 59, 3645-3647.
14. Guan H.; Shao X.; Chen B.; Gong J.; Yang X. Inorganic Chemistry Communications 2003, 6,
(1409-1411).
15. Guan H. Gaodeng Xuexiao Huaxue Xuebao 2004, 25, 1413-1415.
16. Guan H. Inorganic Chemistry Communications 2003, 6, 1302-1303.
17. Ma J. Journal of Physical Chemistry B 2001, 105, 11994-12002.
18. Viswanathamurthi P. Nanotechnology 2004, 15, 320-323.
19. Viswanathamurthi P.; Bhattarai N.; Kim H.; Lee D. Scripta Materialia 2003, 49, 577-581.
20. Viswanathamurthi P.; Bhattarai N.; Kim H.; Lee D.R.; Kim S.; Morris M.A. Chemical Physics
Letters 2003, 374, 79-84.
21. Demir M.M. Macromolecules 2004, 37, 1787-1792.
22. Choi B.K. Materials Science and Engineering B 2005, 119, 177-181.
23. Ruparelia J.P.; Chatterjee A.K.; Duttagupta S.P.; Mukherji S. Acta Biomaterials 2008, 4 707-
716.
24. Grace M.; Chand N.; Bajpai S.K. Journal of Macromolecular Science Part A 2008, 45, 795-
803.
25. Grace M.; Chand N.; Bajpai S.K. Journal of Engineered Fibers and Fabrics 2009, 4, 24-35.
Stellenbosch University http://scholar.sun.ac.za
Chapter 4
110
26. Daels N.; De Vrieze S.; Sampers I.; Decostere B.; Westbroek P.; Dumoulin A.; Dejans P.; De
Clerck K.; Van Hulle S.W.H. Desalination 2011.
27. Francolini I.; Ruggeri V.; Martinelli A.; D‟Ilario L.; Piozzi A. Macromolecular Rapid
Communications 2006, 27, 233-237.
28. Voigt W.V. Water stable, antimicrobial active nanofibres generated by electrospinning from
aqueous spinning solutions. RWTH Aachen University, Munich, 2009.
29. Hulubei C.; Hamciuc E.; Bruma M.; Ignat M. IEEE 2008, 275-278.
30. Lu X.; Wang C.; Wei Y. Small 2009, 5, 2349-2370.
31. Chatzinikolaou I.; Hanna H.; Graviss L.; Chaiban G.; Perego C.; Arbuckle R.; Champlin R.;
Darouiche R.; Samonis G.; Raad I. Infect. Control Hosp. Epidemiol. 2003, 24, 961-963.
32. Xing X.; Lu D.; Wang X.; Liu Z. Journal of Macromolecular Science Part A: Pure and
Applied Chemistry 2009, 46, 560-565.
33. Staniìc V.; Dimitrijeviˇıc S.; Antiˇıc-Stankoviˇıc J.; Mitriˇıc M., J. ı. B.; Pleˇıcaˇs I.B.;
Raìceviìc S. Applied Surface Science 2010, 256, 6083-6089.
34. Moritani T.; Yamauchi J. Polymer 1998, 39, 559-572.
35. Mukherjee G.S.; Shukla N.; Singh R.K.; Mathur G.N. Journal of Scientific Industrial
Research 2004, 63, 596-602.
36. Chirowodza H. Synthesis and characterization of cationically and anionically modified
poly(vinyl alcohol) microfibrils. Stellenbosch University, Stellenbosch, 2009.
37. Chirowodza H.; Sanderson R.D. Macromolecular Materials and Engineering 2010, 295,
1009-1016.
38. Mpitso K. Synthesis and characterization of styrene – maleic anhydride copolymer
derivatives. Stellenbosch University, Stellenbosch, 2009.
39. Brouwer H.D.; Schellekens M.A.J.; Klumperman B.; Monteiro M.J.; German A.L. Journal of
Polymer Science Part A: Polymer Chemistry 2000, 38, 3596-3603.
40. Edgren D.; Wong P.S.L.; Theeuwes F. US Patent 4587117. 1986.
41. Guha S.K. US Patent 5488075 1996.
42. Bellettini A.G.; Bellettini R.J. US Patent 6210653. 2001.
43. Saad G.R.; Morsi R.E.; Mohammady S.Z.; Elsabee M.Z.J. Polymer Research 2008, 15, 115-
123.
44. Varabhas J.S.; Tripatanasuwan S.; Chase G.G.; Reneker D.H. Journal of Engineered Fibers
and Fabrics 2009, 4, 46-50.
45. Liu Y.; He J-H. International Journal of Nonlinear Sciences and Numerical Simulation 2007,
8, 393-396.
46. Liu Y.; He J-H.; Yu J-Y. Journal of Physics: Conference Series 012001 2008, 96, 1-4.
47. Yun K.M.; Suryamas A.B.; Iskandara F.; Bao F.L.; Niinuma H.; Okuyama K. Separation and
Purification Technology 2010, 75, 340-345.
Stellenbosch University http://scholar.sun.ac.za
Chapter 4
111
48. Bruch M.; Mader D.; Bauers F.; Loontjens T.; Mulhaupt R. Journal of Polymer Science: Part
A: Polymer Chemistry 2000, 38, 1222-1231.
49. Lambla M.; Druz J.; Mazeres F. Plastic and Rubber Process Applications 1990, 13, 75-79.
50. Hu G.H.; Lindt J.T. Journal of Polymer Science Part A: Polymer Chemistry 1993, 31, 691-
700.
51. Aoyagi J.; Shinohara I. Journal of Applied Polymer Science 1972, 16, 449-460.
Stellenbosch University http://scholar.sun.ac.za
Chapter 5
112
Chapter 5: An investigation into the use of furanone derivatives as
antibiofouling agents in filter media
5.1 Chapter summary
The 3(2H) furanone derivative 2,5-dimethyl-4-hydroxy-3(2H)-furanone (DMHF) was investigated for
its biofilm-inhibiting properties against biofilms of Klebsiella pneumoniae Xen 39, Staphylococcus
aureus Xen 36, Escherichia coli Xen 14, Pseudomonas aeruginosa Xen 5 and Salmonella
typhimurium Xen 26. The free furanone as well as nanofibres emanating from blends of 2,5-dimethyl-
4-hydroxy-3(2H)-furanone and PVA which were electrospun to produce PVA/DMHF nanofibres were
tested for their ability to inhibit adherence of bacteria on their surfaces.
This furanone was also used to synthesize two other furanone derivatives (5(2H) and 3(2H)) which
were also tested for their ability to inhibit surface colonization by the above mentioned strains. The
two synthesized furanones were covalently immobilized onto poly(styrene-co-maleic anhydride)
(SMA) and electrospun into nanofibres which were also tested for inhibition of biofilm formation.
Nuclear magnetic resonance, electron spray (ES) mass spectroscopy and attenuated total reflectance-
infrared spectroscopy were used to confirm the structures of the synthesized furanones as well as their
successful immobilization on SMA. To ascertain if the compounds leach into filtered water, samples
of filtered water were analyzed using gas chromatography coupled with mass spectroscopy (GC-MS).
Various techniques were also used to characterize the electrospun nanofibres and these include SEM,
ATR-IR, TGA and DSC.
5.2 Introduction
The therapeutic efficacy of antibiotics collates closely with their bactericidal and bacteriostatic
effects. Bacteria can however adapt to the selective pressure from antibiotics through genetic
alteration leading to the development of antibiotic resistance.1 Other means of controlling biofilms
and their consequences thereof can be environmentally hazardous and costly especially in membrane
systems. This has led to a need to develop other means of controlling or destroying biofilms apart
from using chemical orientated measures.
As discussed in previous sections, membrane filtration is a promising technology in water purification.
This technology is however limited as a result of biofilm attachment to membranes which is also
referred to as biofouling. Biofouling of membranes demands costly periodic cleaning and membrane
replacement. A sustainable and environmentally friendly solution for which inhibits attachment of
biofilms on membrane surfaces is currently not available and would be of great interest for many
Stellenbosch University http://scholar.sun.ac.za
Chapter 5
113
purposes. In this chapter, surface functionalization of nanofibres using furanone derivatives as well as
coating surfaces with free (unimmobilized) furanones was investigated as a solution to prevent
bacteria attachment. Complex biofilm formation by environmental strains which is the major cause of
biofouling and biofilm formation is in most cases controlled by N-acyl homoserine lactone (AHL)-
mediated Quorum Sensing (QS). A brief review of existing literature on QS, which is a language
bacteria use to assess their population densities, is given. The role of quorum sensing in biofilm
formation was discussed as well as mechanisms which inhibit QS. Furthermore, furanones which are
derivatives of homoserine lactones and appear to interfere with QS and subsequently biofilm
formation are reviewed using relevant literature. A discussion on naturally occurring and synthetic
furanones which have shown effectiveness against bacteria is given.
5.3 Quorum sensing (QS)
Bacteria use the language of low-molecular weight ligands to communicate amongst each other and to
assess their population sizes in a process called quorum sensing (QS). The first evidence of
cooperative behaviour among bacteria was reported by Tomasz in 1965.2 The biology of light
producing organelles, through a cell-density-dependent reaction was then studied by Nealson and
coresearchers.3 Over the following decades this population-dependent phenomenon was termed
“quorum-sensing”.4, 5
Over the past few years, large amounts of literature and data have been available
on bacterial QS and interest among researchers in modulating quorum sensing using different
approaches has increased. QS is not necessary for bacterial survival but helps in coordinating the
community-based bacterial behaviour, therefore, the inhibition of QS only interrupts the desired
phenotype. Therefore, interference with QS may not bring about a universally beneficial effect but
makes the bacteria more susceptible to control/destruction by traditional means.
5.3.1 The role of QS in biofilm formation
Microorganisms prefer living in surface-attached colonies rather than in the planktonic state and as
individual cells.6 These communities of bacterial cells referred to as a biofilms are almost always
enclosed in self-produced polymeric matrix and adherent to either inert or living surfaces.6 Cell to cell
signaling between the bacteria, which results in changes in gene and protein expression is necessary
for biofilm formation and this is known as quorum sensing.7 Biofilms are highly resistant to antibiotics
and disinfection treatments and this results in persistent human infections and detrimental corrosion
and equipment failure in industrial settings.8 Modification of surfaces and new inhibitor designs have
been investigated for the control of biofilm formation in industrial settings. 9-12
Biofilm formation in
filtration membranes is one of the major limitations associated with membrane technology. 13
This
reduces the quality and quantity of water in water purification systems and consequently results in
higher treatment costs.
Stellenbosch University http://scholar.sun.ac.za
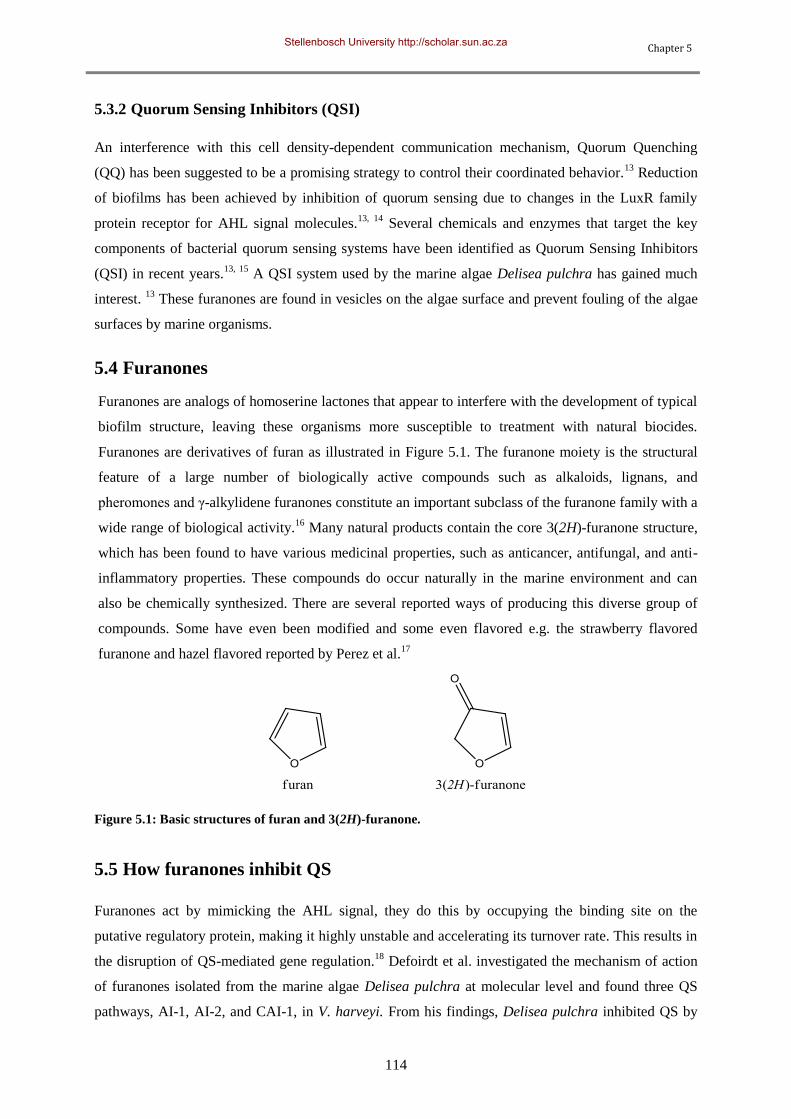
Chapter 5
114
5.3.2 Quorum Sensing Inhibitors (QSI)
An interference with this cell density-dependent communication mechanism, Quorum Quenching
(QQ) has been suggested to be a promising strategy to control their coordinated behavior.13
Reduction
of biofilms has been achieved by inhibition of quorum sensing due to changes in the LuxR family
protein receptor for AHL signal molecules.13, 14
Several chemicals and enzymes that target the key
components of bacterial quorum sensing systems have been identified as Quorum Sensing Inhibitors
(QSI) in recent years.13, 15
A QSI system used by the marine algae Delisea pulchra has gained much
interest. 13
These furanones are found in vesicles on the algae surface and prevent fouling of the algae
surfaces by marine organisms.
5.4 Furanones
Furanones are analogs of homoserine lactones that appear to interfere with the development of typical
biofilm structure, leaving these organisms more susceptible to treatment with natural biocides.
Furanones are derivatives of furan as illustrated in Figure 5.1. The furanone moiety is the structural
feature of a large number of biologically active compounds such as alkaloids, lignans, and
pheromones and γ-alkylidene furanones constitute an important subclass of the furanone family with a
wide range of biological activity.16
Many natural products contain the core 3(2H)-furanone structure,
which has been found to have various medicinal properties, such as anticancer, antifungal, and anti-
inflammatory properties. These compounds do occur naturally in the marine environment and can
also be chemically synthesized. There are several reported ways of producing this diverse group of
compounds. Some have even been modified and some even flavored e.g. the strawberry flavored
furanone and hazel flavored reported by Perez et al.17
Figure 5.1: Basic structures of furan and 3(2H)-furanone.
5.5 How furanones inhibit QS
Furanones act by mimicking the AHL signal, they do this by occupying the binding site on the
putative regulatory protein, making it highly unstable and accelerating its turnover rate. This results in
the disruption of QS-mediated gene regulation.18
Defoirdt et al. investigated the mechanism of action
of furanones isolated from the marine algae Delisea pulchra at molecular level and found three QS
pathways, AI-1, AI-2, and CAI-1, in V. harveyi. From his findings, Delisea pulchra inhibited QS by
Stellenbosch University http://scholar.sun.ac.za
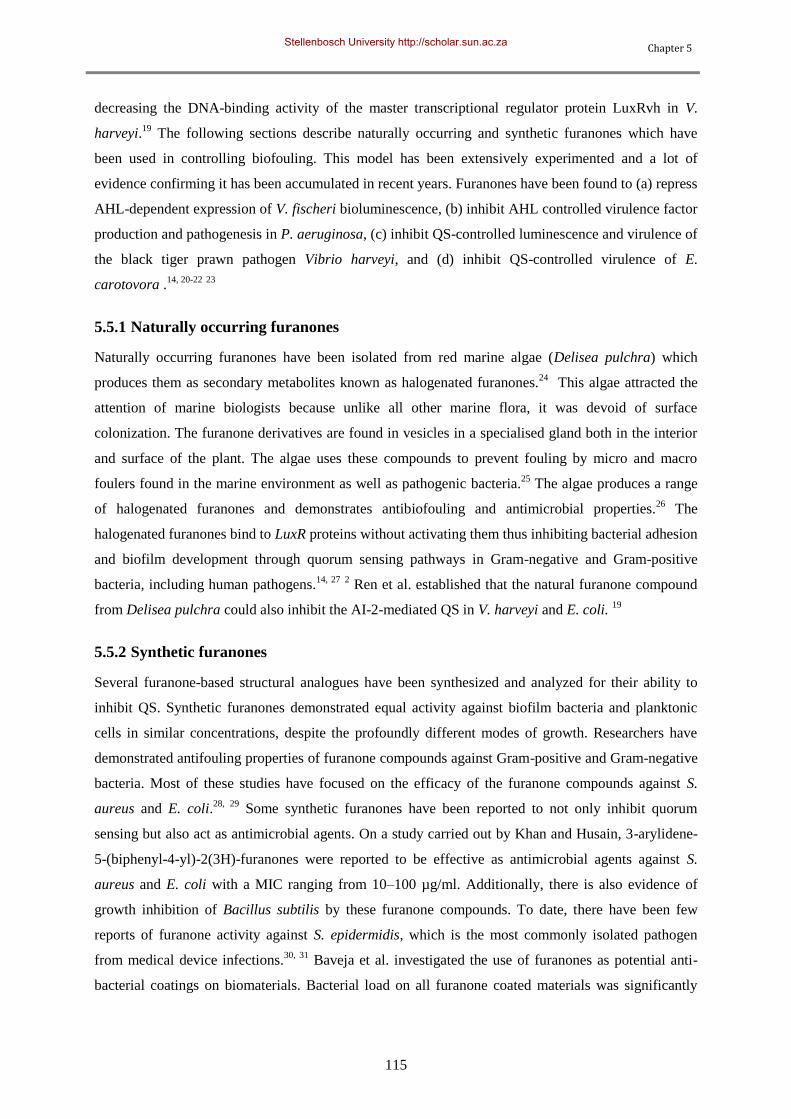
Chapter 5
115
decreasing the DNA-binding activity of the master transcriptional regulator protein LuxRvh in V.
harveyi.19
The following sections describe naturally occurring and synthetic furanones which have
been used in controlling biofouling. This model has been extensively experimented and a lot of
evidence confirming it has been accumulated in recent years. Furanones have been found to (a) repress
AHL-dependent expression of V. fischeri bioluminescence, (b) inhibit AHL controlled virulence factor
production and pathogenesis in P. aeruginosa, (c) inhibit QS-controlled luminescence and virulence of
the black tiger prawn pathogen Vibrio harveyi, and (d) inhibit QS-controlled virulence of E.
carotovora .14, 20-22
23
5.5.1 Naturally occurring furanones
Naturally occurring furanones have been isolated from red marine algae (Delisea pulchra) which
produces them as secondary metabolites known as halogenated furanones.24
This algae attracted the
attention of marine biologists because unlike all other marine flora, it was devoid of surface
colonization. The furanone derivatives are found in vesicles in a specialised gland both in the interior
and surface of the plant. The algae uses these compounds to prevent fouling by micro and macro
foulers found in the marine environment as well as pathogenic bacteria.25
The algae produces a range
of halogenated furanones and demonstrates antibiofouling and antimicrobial properties.26
The
halogenated furanones bind to LuxR proteins without activating them thus inhibiting bacterial adhesion
and biofilm development through quorum sensing pathways in Gram-negative and Gram-positive
bacteria, including human pathogens.14, 27
2 Ren et al. established that the natural furanone compound
from Delisea pulchra could also inhibit the AI-2-mediated QS in V. harveyi and E. coli. 19
5.5.2 Synthetic furanones
Several furanone-based structural analogues have been synthesized and analyzed for their ability to
inhibit QS. Synthetic furanones demonstrated equal activity against biofilm bacteria and planktonic
cells in similar concentrations, despite the profoundly different modes of growth. Researchers have
demonstrated antifouling properties of furanone compounds against Gram-positive and Gram-negative
bacteria. Most of these studies have focused on the efficacy of the furanone compounds against S.
aureus and E. coli.28, 29
Some synthetic furanones have been reported to not only inhibit quorum
sensing but also act as antimicrobial agents. On a study carried out by Khan and Husain, 3-arylidene-
5-(biphenyl-4-yl)-2(3H)-furanones were reported to be effective as antimicrobial agents against S.
aureus and E. coli with a MIC ranging from 10–100 µg/ml. Additionally, there is also evidence of
growth inhibition of Bacillus subtilis by these furanone compounds. To date, there have been few
reports of furanone activity against S. epidermidis, which is the most commonly isolated pathogen
from medical device infections.30, 31
Baveja et al. investigated the use of furanones as potential anti-
bacterial coatings on biomaterials. Bacterial load on all furanone coated materials was significantly
Stellenbosch University http://scholar.sun.ac.za
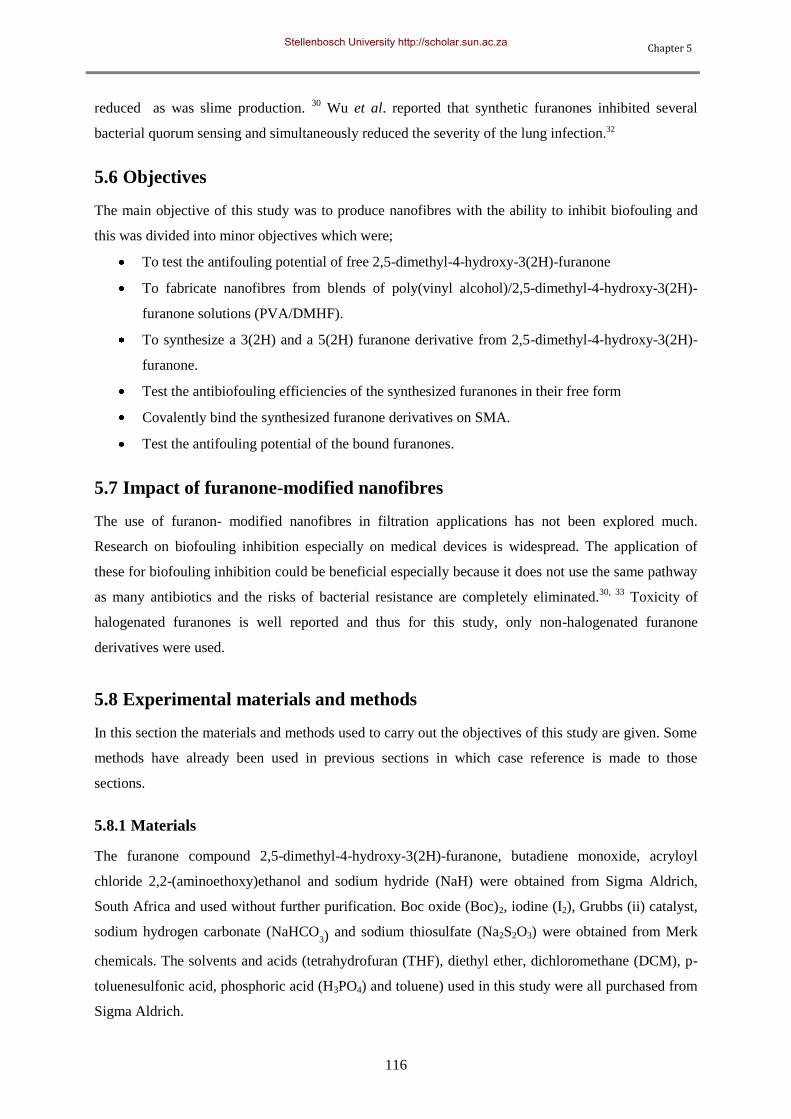
Chapter 5
116
reduced as was slime production. 30
Wu et al. reported that synthetic furanones inhibited several
bacterial quorum sensing and simultaneously reduced the severity of the lung infection.32
5.6 Objectives
The main objective of this study was to produce nanofibres with the ability to inhibit biofouling and
this was divided into minor objectives which were;
To test the antifouling potential of free 2,5-dimethyl-4-hydroxy-3(2H)-furanone
To fabricate nanofibres from blends of poly(vinyl alcohol)/2,5-dimethyl-4-hydroxy-3(2H)-
furanone solutions (PVA/DMHF).
To synthesize a 3(2H) and a 5(2H) furanone derivative from 2,5-dimethyl-4-hydroxy-3(2H)-
furanone.
Test the antibiofouling efficiencies of the synthesized furanones in their free form
Covalently bind the synthesized furanone derivatives on SMA.
Test the antifouling potential of the bound furanones.
5.7 Impact of furanone-modified nanofibres
The use of furanon- modified nanofibres in filtration applications has not been explored much.
Research on biofouling inhibition especially on medical devices is widespread. The application of
these for biofouling inhibition could be beneficial especially because it does not use the same pathway
as many antibiotics and the risks of bacterial resistance are completely eliminated.30, 33
Toxicity of
halogenated furanones is well reported and thus for this study, only non-halogenated furanone
derivatives were used.
5.8 Experimental materials and methods
In this section the materials and methods used to carry out the objectives of this study are given. Some
methods have already been used in previous sections in which case reference is made to those
sections.
5.8.1 Materials
The furanone compound 2,5-dimethyl-4-hydroxy-3(2H)-furanone, butadiene monoxide, acryloyl
chloride 2,2-(aminoethoxy)ethanol and sodium hydride (NaH) were obtained from Sigma Aldrich,
South Africa and used without further purification. Boc oxide (Boc)2, iodine (I2), Grubbs (ii) catalyst,
sodium hydrogen carbonate (NaHCO3) and sodium thiosulfate (Na2S2O3) were obtained from Merk
chemicals. The solvents and acids (tetrahydrofuran (THF), diethyl ether, dichloromethane (DCM), p-
toluenesulfonic acid, phosphoric acid (H3PO4) and toluene) used in this study were all purchased from
Sigma Aldrich.
Stellenbosch University http://scholar.sun.ac.za
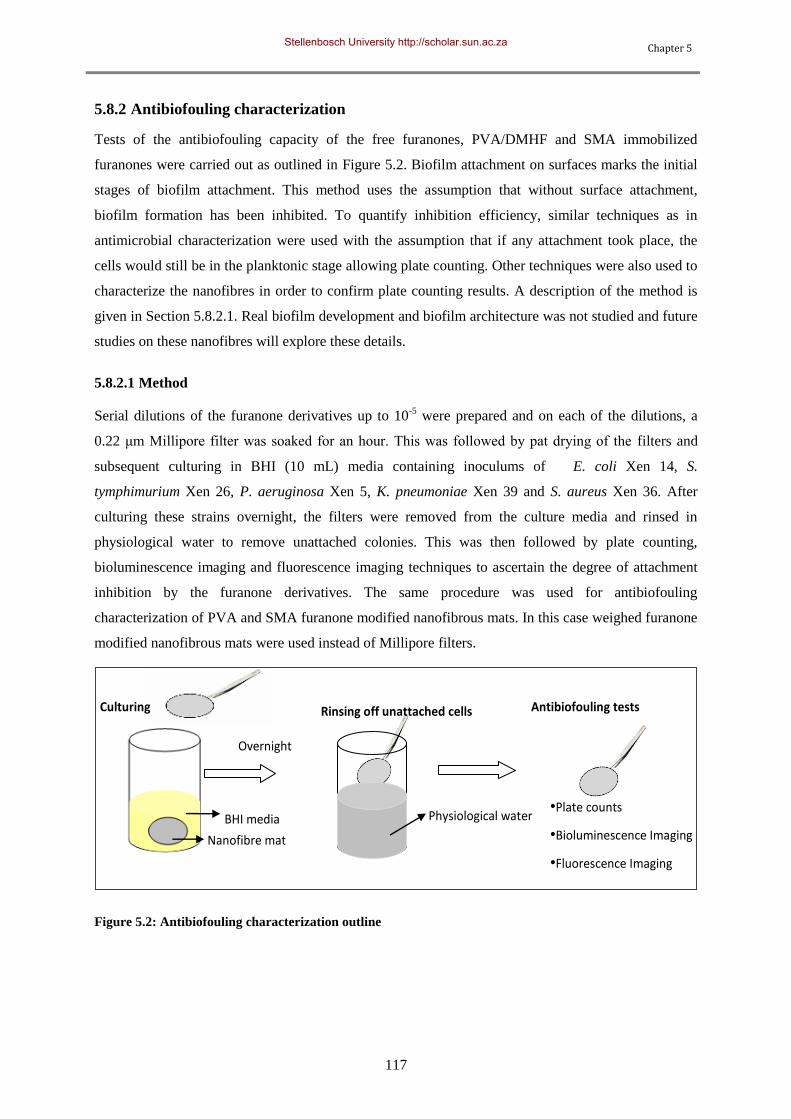
Chapter 5
117
5.8.2 Antibiofouling characterization
Tests of the antibiofouling capacity of the free furanones, PVA/DMHF and SMA immobilized
furanones were carried out as outlined in Figure 5.2. Biofilm attachment on surfaces marks the initial
stages of biofilm attachment. This method uses the assumption that without surface attachment,
biofilm formation has been inhibited. To quantify inhibition efficiency, similar techniques as in
antimicrobial characterization were used with the assumption that if any attachment took place, the
cells would still be in the planktonic stage allowing plate counting. Other techniques were also used to
characterize the nanofibres in order to confirm plate counting results. A description of the method is
given in Section 5.8.2.1. Real biofilm development and biofilm architecture was not studied and future
studies on these nanofibres will explore these details.
5.8.2.1 Method
Serial dilutions of the furanone derivatives up to 10-5
were prepared and on each of the dilutions, a
0.22 μm Millipore filter was soaked for an hour. This was followed by pat drying of the filters and
subsequent culturing in BHI (10 mL) media containing inoculums of E. coli Xen 14, S.
tymphimurium Xen 26, P. aeruginosa Xen 5, K. pneumoniae Xen 39 and S. aureus Xen 36. After
culturing these strains overnight, the filters were removed from the culture media and rinsed in
physiological water to remove unattached colonies. This was then followed by plate counting,
bioluminescence imaging and fluorescence imaging techniques to ascertain the degree of attachment
inhibition by the furanone derivatives. The same procedure was used for antibiofouling
characterization of PVA and SMA furanone modified nanofibrous mats. In this case weighed furanone
modified nanofibrous mats were used instead of Millipore filters.
•Plate counts
•Bioluminescence Imaging
•Fluorescence Imaging
Nanofibre mat
BHI media
Overnight
Physiological water
Rinsing off unattached cells Culturing Antibiofouling tests
Figure 5.2: Antibiofouling characterization outline
Stellenbosch University http://scholar.sun.ac.za
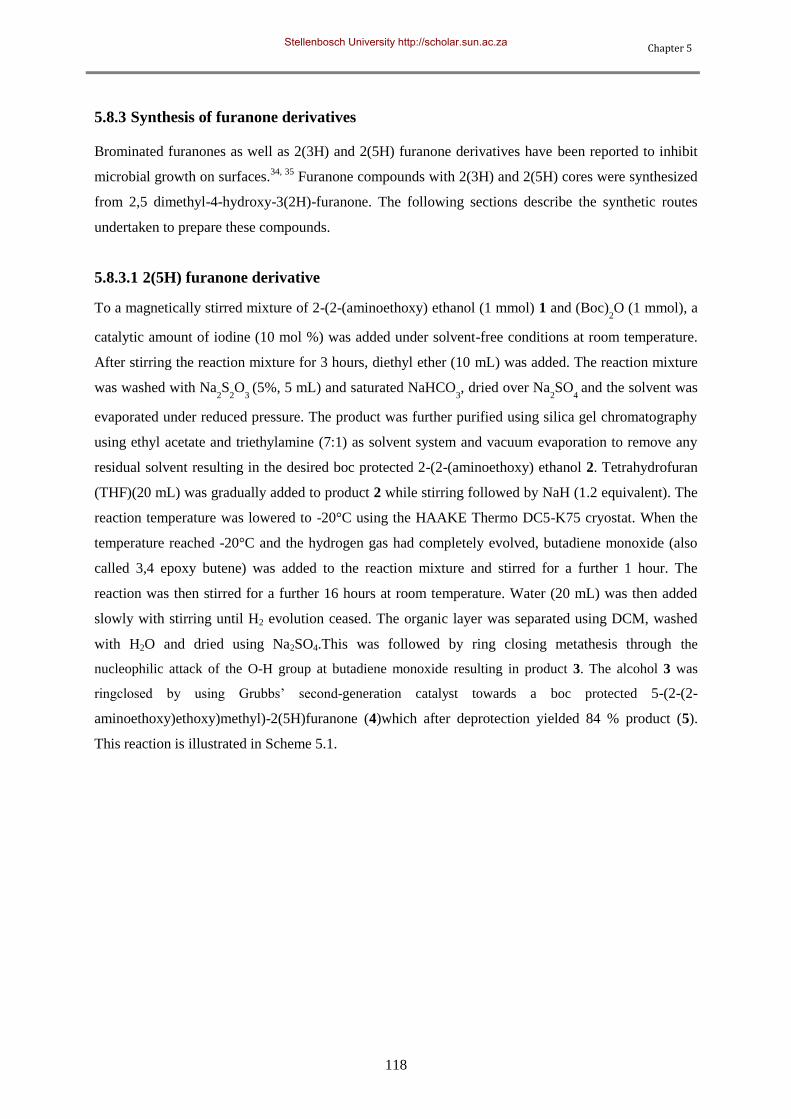
Chapter 5
118
5.8.3 Synthesis of furanone derivatives
Brominated furanones as well as 2(3H) and 2(5H) furanone derivatives have been reported to inhibit
microbial growth on surfaces.34, 35
Furanone compounds with 2(3H) and 2(5H) cores were synthesized
from 2,5 dimethyl-4-hydroxy-3(2H)-furanone. The following sections describe the synthetic routes
undertaken to prepare these compounds.
5.8.3.1 2(5H) furanone derivative
To a magnetically stirred mixture of 2-(2-(aminoethoxy) ethanol (1 mmol) 1 and (Boc)2O (1 mmol), a
catalytic amount of iodine (10 mol %) was added under solvent-free conditions at room temperature.
After stirring the reaction mixture for 3 hours, diethyl ether (10 mL) was added. The reaction mixture
was washed with Na2S
2O
3 (5%, 5 mL) and saturated NaHCO
3, dried over Na
2SO
4 and the solvent was
evaporated under reduced pressure. The product was further purified using silica gel chromatography
using ethyl acetate and triethylamine (7:1) as solvent system and vacuum evaporation to remove any
residual solvent resulting in the desired boc protected 2-(2-(aminoethoxy) ethanol 2. Tetrahydrofuran
(THF)(20 mL) was gradually added to product 2 while stirring followed by NaH (1.2 equivalent). The
reaction temperature was lowered to -20°C using the HAAKE Thermo DC5-K75 cryostat. When the
temperature reached -20°C and the hydrogen gas had completely evolved, butadiene monoxide (also
called 3,4 epoxy butene) was added to the reaction mixture and stirred for a further 1 hour. The
reaction was then stirred for a further 16 hours at room temperature. Water (20 mL) was then added
slowly with stirring until H2 evolution ceased. The organic layer was separated using DCM, washed
with H2O and dried using Na2SO4.This was followed by ring closing metathesis through the
nucleophilic attack of the O-H group at butadiene monoxide resulting in product 3. The alcohol 3 was
ringclosed by using Grubbs‟ second-generation catalyst towards a boc protected 5-(2-(2-
aminoethoxy)ethoxy)methyl)-2(5H)furanone (4)which after deprotection yielded 84 % product (5).
This reaction is illustrated in Scheme 5.1.
Stellenbosch University http://scholar.sun.ac.za
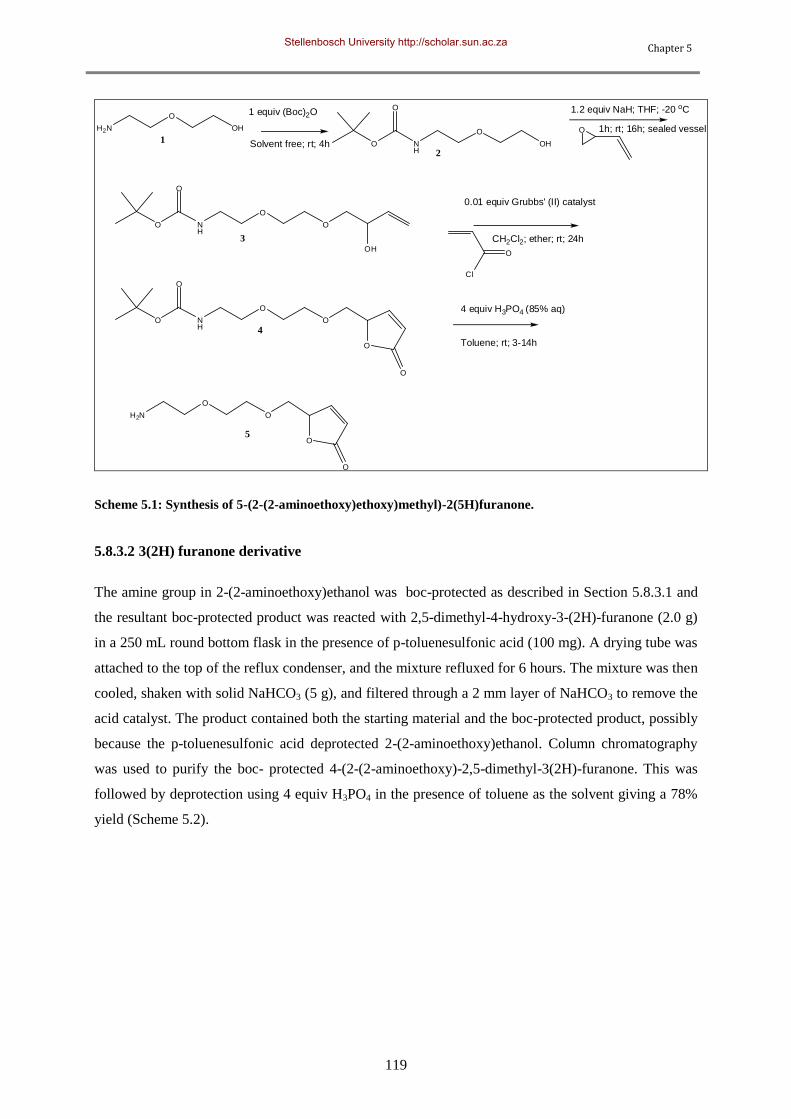
Chapter 5
119
H2N
O
OH
O NH
O
OH
O
O NH
O
O
O
1.2 equiv NaH; THF; -20 oC
1h; rt; 16h; sealed vessel
1 equiv (Boc)2O
Solvent free; rt; 4h
O
OHO
Cl
0.01 equiv Grubbs' (II) catalyst
CH2Cl2; ether; rt; 24h
O NH
O
O
O
O
O
4 equiv H3PO4 (85% aq)
Toluene; rt; 3-14h
H2N
O
O
O
O
1
2
3
4
5
Scheme 5.1: Synthesis of 5-(2-(2-aminoethoxy)ethoxy)methyl)-2(5H)furanone.
5.8.3.2 3(2H) furanone derivative
The amine group in 2-(2-aminoethoxy)ethanol was boc-protected as described in Section 5.8.3.1 and
the resultant boc-protected product was reacted with 2,5-dimethyl-4-hydroxy-3-(2H)-furanone (2.0 g)
in a 250 mL round bottom flask in the presence of p-toluenesulfonic acid (100 mg). A drying tube was
attached to the top of the reflux condenser, and the mixture refluxed for 6 hours. The mixture was then
cooled, shaken with solid NaHCO3 (5 g), and filtered through a 2 mm layer of NaHCO3 to remove the
acid catalyst. The product contained both the starting material and the boc-protected product, possibly
because the p-toluenesulfonic acid deprotected 2-(2-aminoethoxy)ethanol. Column chromatography
was used to purify the boc- protected 4-(2-(2-aminoethoxy)-2,5-dimethyl-3(2H)-furanone. This was
followed by deprotection using 4 equiv H3PO4 in the presence of toluene as the solvent giving a 78%
yield (Scheme 5.2).
Stellenbosch University http://scholar.sun.ac.za
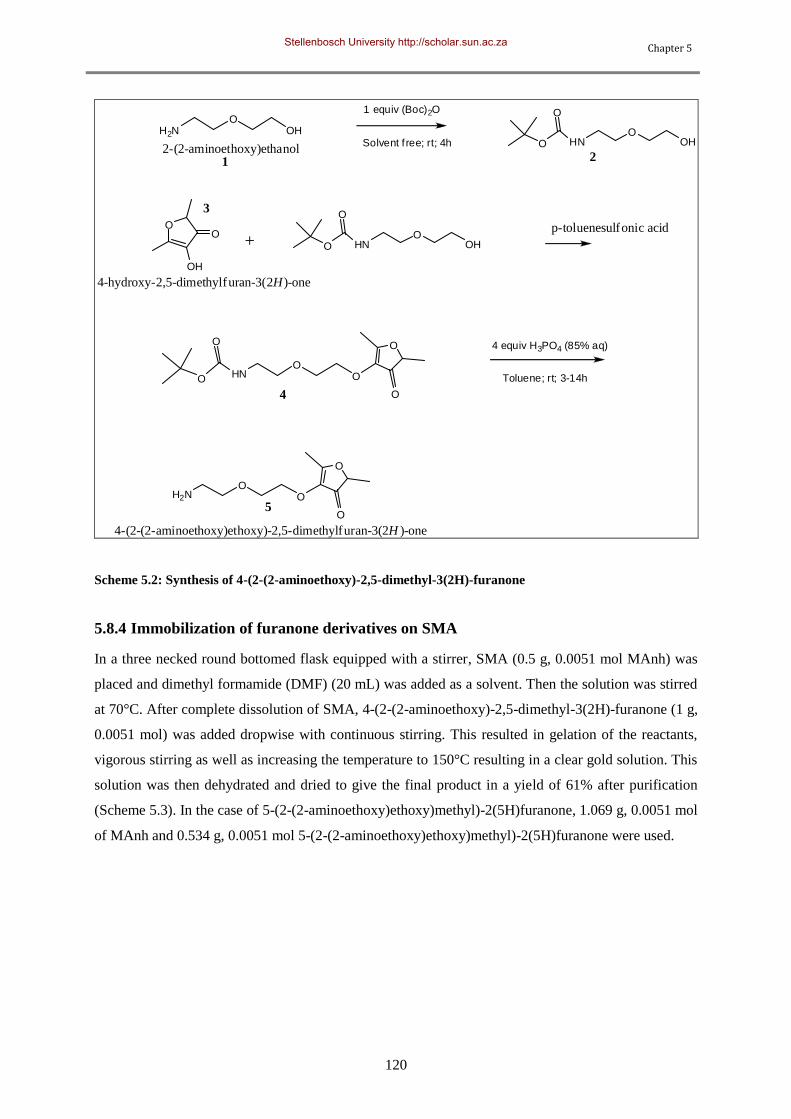
Chapter 5
120
H2NO
OH
HNO
OH
O
O
OO
OH
+
O
O
OO
HNO
O
O
O
OO
H2N
4 equiv H3PO4 (85% aq)
Toluene; rt; 3-14h
p-toluenesulfonic acid
1 equiv (Boc)2O
Solvent f ree; rt; 4h HNO
OH
O
O
4-(2-(2-aminoethoxy)ethoxy)-2,5-dimethylfuran-3(2H )-one
4-hydroxy-2,5-dimethylfuran-3(2H)-one
2-(2-aminoethoxy)ethanol1 2
3
4
5
Scheme 5.2: Synthesis of 4-(2-(2-aminoethoxy)-2,5-dimethyl-3(2H)-furanone
5.8.4 Immobilization of furanone derivatives on SMA
In a three necked round bottomed flask equipped with a stirrer, SMA (0.5 g, 0.0051 mol MAnh) was
placed and dimethyl formamide (DMF) (20 mL) was added as a solvent. Then the solution was stirred
at 70°C. After complete dissolution of SMA, 4-(2-(2-aminoethoxy)-2,5-dimethyl-3(2H)-furanone (1 g,
0.0051 mol) was added dropwise with continuous stirring. This resulted in gelation of the reactants,
vigorous stirring as well as increasing the temperature to 150°C resulting in a clear gold solution. This
solution was then dehydrated and dried to give the final product in a yield of 61% after purification
(Scheme 5.3). In the case of 5-(2-(2-aminoethoxy)ethoxy)methyl)-2(5H)furanone, 1.069 g, 0.0051 mol
of MAnh and 0.534 g, 0.0051 mol 5-(2-(2-aminoethoxy)ethoxy)methyl)-2(5H)furanone were used.
Stellenbosch University http://scholar.sun.ac.za
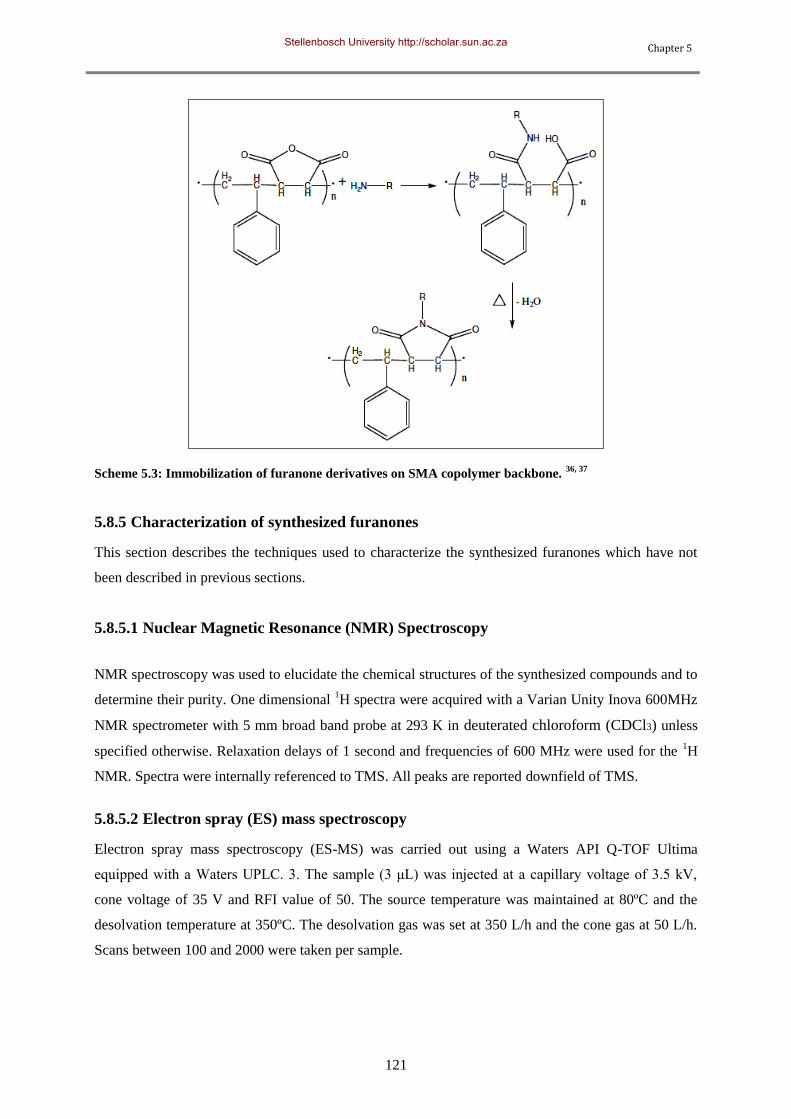
Chapter 5
121
Scheme 5.3: Immobilization of furanone derivatives on SMA copolymer backbone. 36, 37
5.8.5 Characterization of synthesized furanones
This section describes the techniques used to characterize the synthesized furanones which have not
been described in previous sections.
5.8.5.1 Nuclear Magnetic Resonance (NMR) Spectroscopy
NMR spectroscopy was used to elucidate the chemical structures of the synthesized compounds and to
determine their purity. One dimensional 1H spectra were acquired with a Varian Unity Inova 600MHz
NMR spectrometer with 5 mm broad band probe at 293 K in deuterated chloroform (CDCl3) unless
specified otherwise. Relaxation delays of 1 second and frequencies of 600 MHz were used for the 1H
NMR. Spectra were internally referenced to TMS. All peaks are reported downfield of TMS.
5.8.5.2 Electron spray (ES) mass spectroscopy
Electron spray mass spectroscopy (ES-MS) was carried out using a Waters API Q-TOF Ultima
equipped with a Waters UPLC. 3. The sample (3 μL) was injected at a capillary voltage of 3.5 kV,
cone voltage of 35 V and RFI value of 50. The source temperature was maintained at 80ºC and the
desolvation temperature at 350ºC. The desolvation gas was set at 350 L/h and the cone gas at 50 L/h.
Scans between 100 and 2000 were taken per sample.
Stellenbosch University http://scholar.sun.ac.za
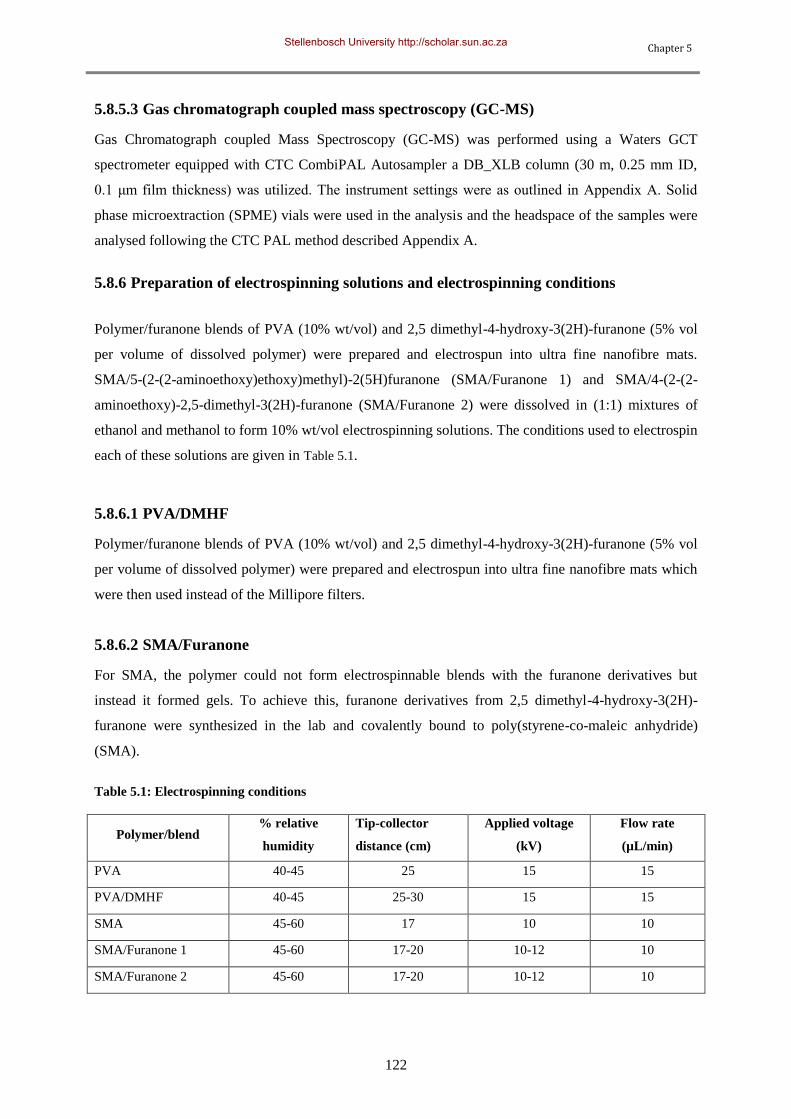
Chapter 5
122
5.8.5.3 Gas chromatograph coupled mass spectroscopy (GC-MS)
Gas Chromatograph coupled Mass Spectroscopy (GC-MS) was performed using a Waters GCT
spectrometer equipped with CTC CombiPAL Autosampler a DB_XLB column (30 m, 0.25 mm ID,
0.1 μm film thickness) was utilized. The instrument settings were as outlined in Appendix A. Solid
phase microextraction (SPME) vials were used in the analysis and the headspace of the samples were
analysed following the CTC PAL method described Appendix A.
5.8.6 Preparation of electrospinning solutions and electrospinning conditions
Polymer/furanone blends of PVA (10% wt/vol) and 2,5 dimethyl-4-hydroxy-3(2H)-furanone (5% vol
per volume of dissolved polymer) were prepared and electrospun into ultra fine nanofibre mats.
SMA/5-(2-(2-aminoethoxy)ethoxy)methyl)-2(5H)furanone (SMA/Furanone 1) and SMA/4-(2-(2-
aminoethoxy)-2,5-dimethyl-3(2H)-furanone (SMA/Furanone 2) were dissolved in (1:1) mixtures of
ethanol and methanol to form 10% wt/vol electrospinning solutions. The conditions used to electrospin
each of these solutions are given in Table 5.1.
5.8.6.1 PVA/DMHF
Polymer/furanone blends of PVA (10% wt/vol) and 2,5 dimethyl-4-hydroxy-3(2H)-furanone (5% vol
per volume of dissolved polymer) were prepared and electrospun into ultra fine nanofibre mats which
were then used instead of the Millipore filters.
5.8.6.2 SMA/Furanone
For SMA, the polymer could not form electrospinnable blends with the furanone derivatives but
instead it formed gels. To achieve this, furanone derivatives from 2,5 dimethyl-4-hydroxy-3(2H)-
furanone were synthesized in the lab and covalently bound to poly(styrene-co-maleic anhydride)
(SMA).
Table 5.1: Electrospinning conditions
Polymer/blend % relative
humidity
Tip-collector
distance (cm)
Applied voltage
(kV)
Flow rate
(µL/min)
PVA 40-45 25 15 15
PVA/DMHF 40-45 25-30 15 15
SMA 45-60 17 10 10
SMA/Furanone 1 45-60 17-20 10-12 10
SMA/Furanone 2 45-60 17-20 10-12 10
Stellenbosch University http://scholar.sun.ac.za
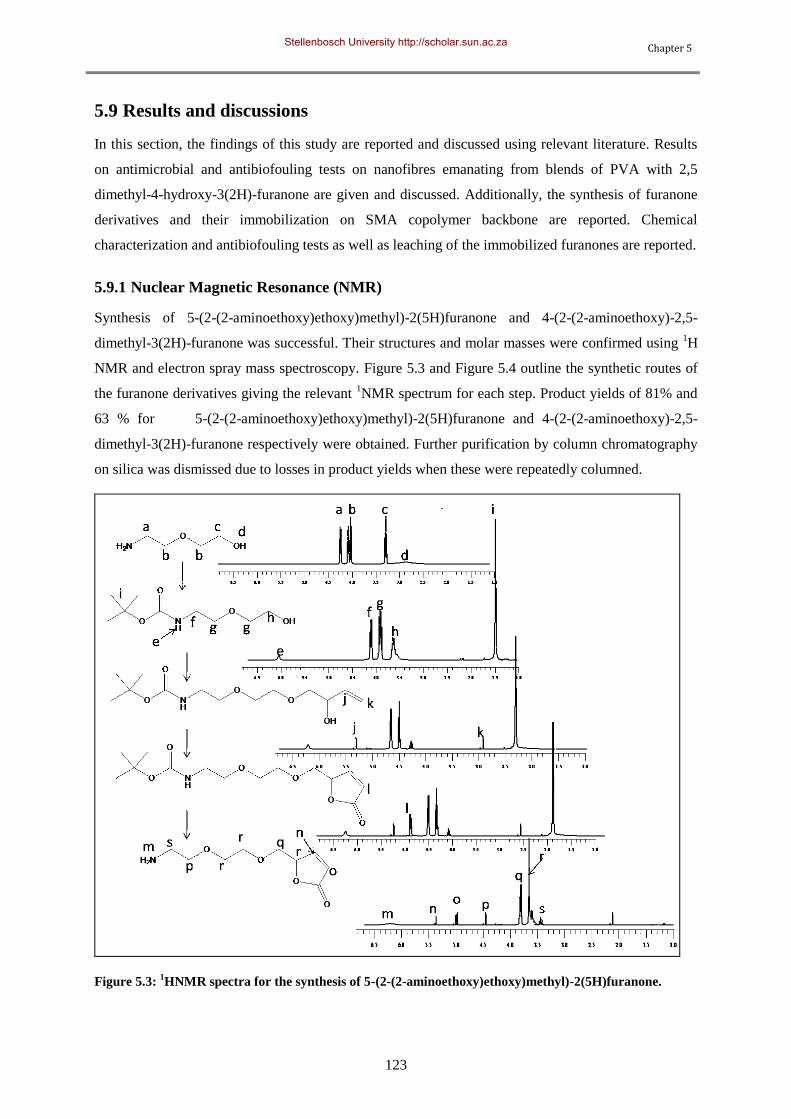
Chapter 5
123
5.9 Results and discussions
In this section, the findings of this study are reported and discussed using relevant literature. Results
on antimicrobial and antibiofouling tests on nanofibres emanating from blends of PVA with 2,5
dimethyl-4-hydroxy-3(2H)-furanone are given and discussed. Additionally, the synthesis of furanone
derivatives and their immobilization on SMA copolymer backbone are reported. Chemical
characterization and antibiofouling tests as well as leaching of the immobilized furanones are reported.
5.9.1 Nuclear Magnetic Resonance (NMR)
Synthesis of 5-(2-(2-aminoethoxy)ethoxy)methyl)-2(5H)furanone and 4-(2-(2-aminoethoxy)-2,5-
dimethyl-3(2H)-furanone was successful. Their structures and molar masses were confirmed using 1H
NMR and electron spray mass spectroscopy. Figure 5.3 and Figure 5.4 outline the synthetic routes of
the furanone derivatives giving the relevant 1NMR spectrum for each step. Product yields of 81% and
63 % for 5-(2-(2-aminoethoxy)ethoxy)methyl)-2(5H)furanone and 4-(2-(2-aminoethoxy)-2,5-
dimethyl-3(2H)-furanone respectively were obtained. Further purification by column chromatography
on silica was dismissed due to losses in product yields when these were repeatedly columned.
Figure 5.3: 1HNMR spectra for the synthesis of 5-(2-(2-aminoethoxy)ethoxy)methyl)-2(5H)furanone.
Stellenbosch University http://scholar.sun.ac.za
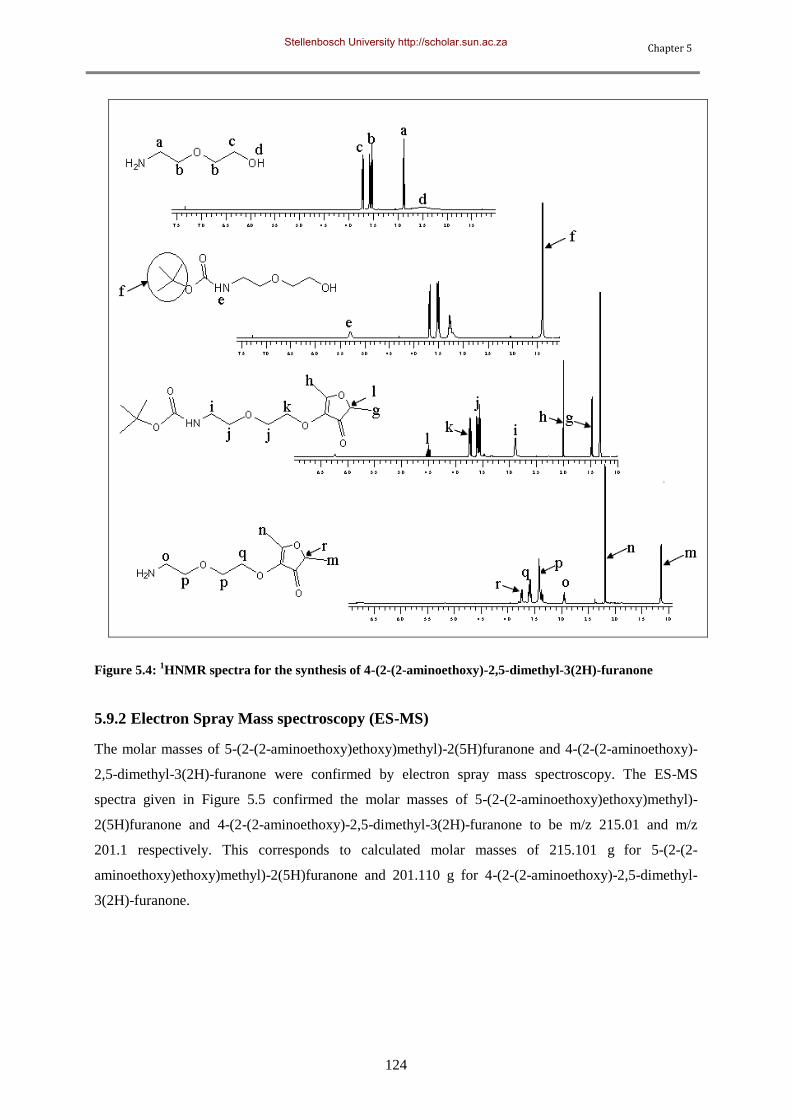
Chapter 5
124
Figure 5.4: 1HNMR spectra for the synthesis of 4-(2-(2-aminoethoxy)-2,5-dimethyl-3(2H)-furanone
5.9.2 Electron Spray Mass spectroscopy (ES-MS)
The molar masses of 5-(2-(2-aminoethoxy)ethoxy)methyl)-2(5H)furanone and 4-(2-(2-aminoethoxy)-
2,5-dimethyl-3(2H)-furanone were confirmed by electron spray mass spectroscopy. The ES-MS
spectra given in Figure 5.5 confirmed the molar masses of 5-(2-(2-aminoethoxy)ethoxy)methyl)-
2(5H)furanone and 4-(2-(2-aminoethoxy)-2,5-dimethyl-3(2H)-furanone to be m/z 215.01 and m/z
201.1 respectively. This corresponds to calculated molar masses of 215.101 g
for 5-(2-(2-
aminoethoxy)ethoxy)methyl)-2(5H)furanone and 201.110 g for 4-(2-(2-aminoethoxy)-2,5-dimethyl-
3(2H)-furanone.
Stellenbosch University http://scholar.sun.ac.za
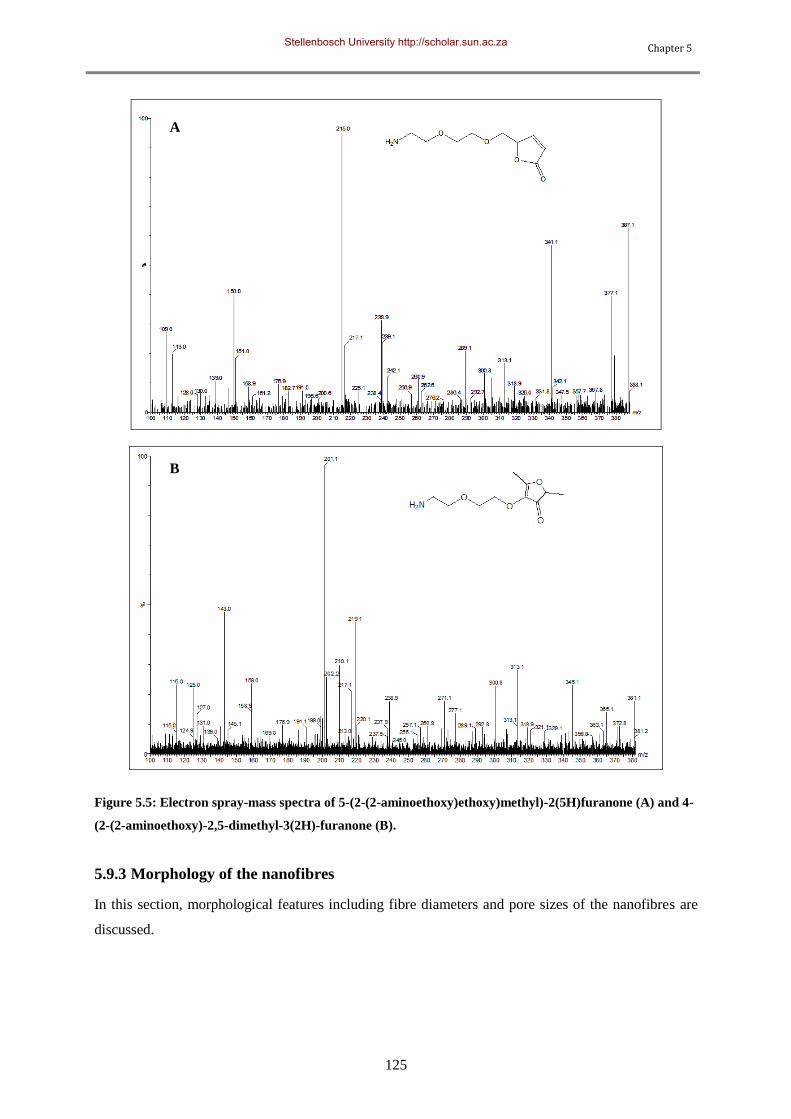
Chapter 5
125
Figure 5.5: Electron spray-mass spectra of 5-(2-(2-aminoethoxy)ethoxy)methyl)-2(5H)furanone (A) and 4-
(2-(2-aminoethoxy)-2,5-dimethyl-3(2H)-furanone (B).
5.9.3 Morphology of the nanofibres
In this section, morphological features including fibre diameters and pore sizes of the nanofibres are
discussed.
A
B
A
Stellenbosch University http://scholar.sun.ac.za
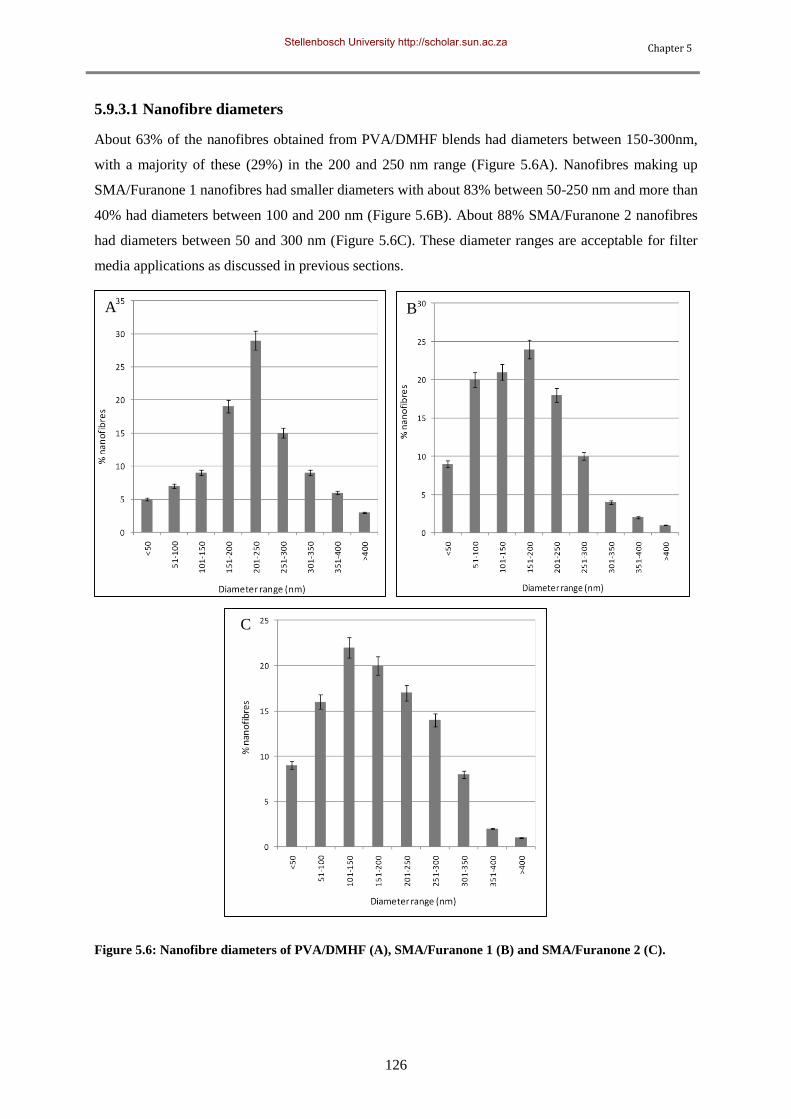
Chapter 5
126
5.9.3.1 Nanofibre diameters
About 63% of the nanofibres obtained from PVA/DMHF blends had diameters between 150-300nm,
with a majority of these (29%) in the 200 and 250 nm range (Figure 5.6A). Nanofibres making up
SMA/Furanone 1 nanofibres had smaller diameters with about 83% between 50-250 nm and more than
40% had diameters between 100 and 200 nm (Figure 5.6B). About 88% SMA/Furanone 2 nanofibres
had diameters between 50 and 300 nm (Figure 5.6C). These diameter ranges are acceptable for filter
media applications as discussed in previous sections.
A B
C
Figure 5.6: Nanofibre diameters of PVA/DMHF (A), SMA/Furanone 1 (B) and SMA/Furanone 2 (C).
Stellenbosch University http://scholar.sun.ac.za
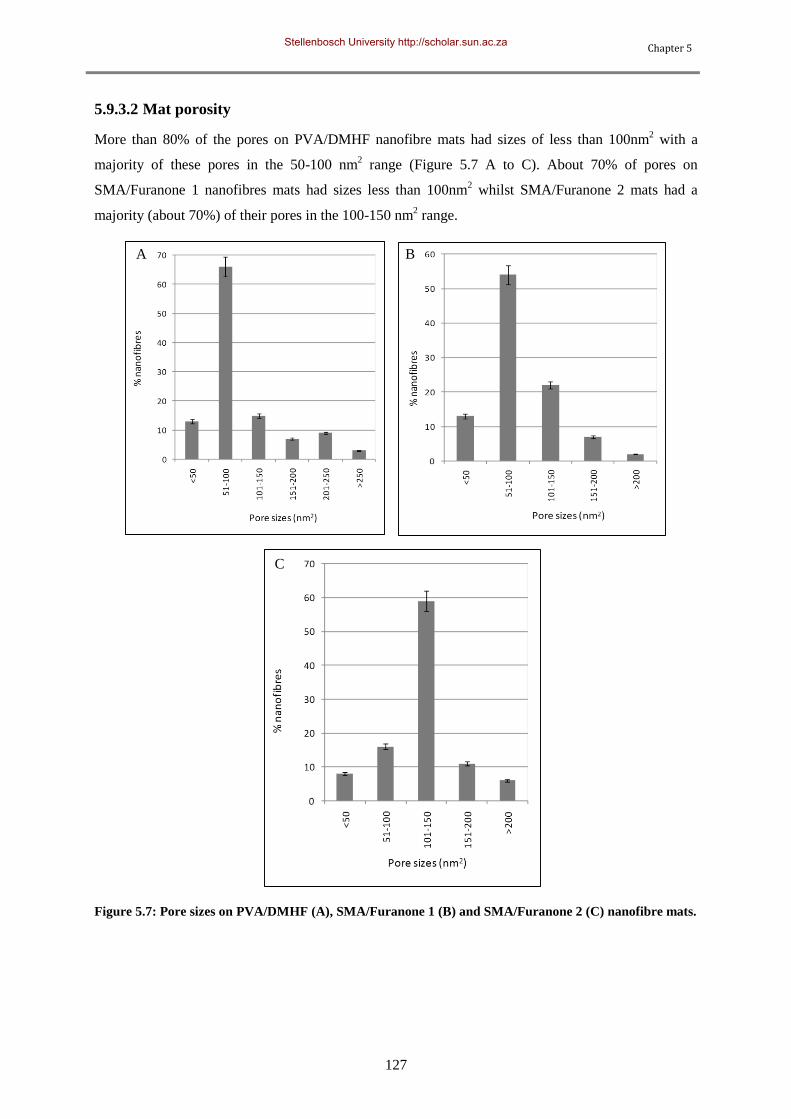
Chapter 5
127
5.9.3.2 Mat porosity
More than 80% of the pores on PVA/DMHF nanofibre mats had sizes of less than 100nm2 with a
majority of these pores in the 50-100 nm2 range (Figure 5.7 A to C). About 70% of pores on
SMA/Furanone 1 nanofibres mats had sizes less than 100nm2 whilst SMA/Furanone 2 mats had a
majority (about 70%) of their pores in the 100-150 nm2 range.
A B
C
Figure 5.7: Pore sizes on PVA/DMHF (A), SMA/Furanone 1 (B) and SMA/Furanone 2 (C) nanofibre mats.
Stellenbosch University http://scholar.sun.ac.za
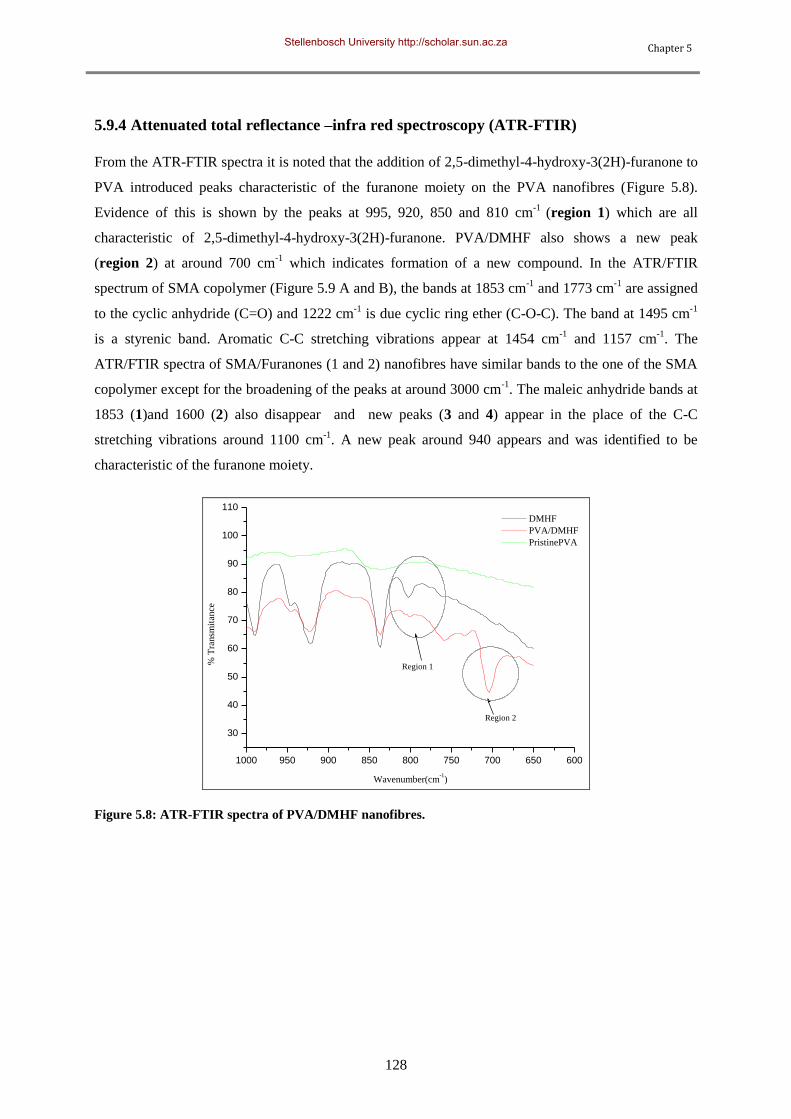
Chapter 5
128
5.9.4 Attenuated total reflectance –infra red spectroscopy (ATR-FTIR)
From the ATR-FTIR spectra it is noted that the addition of 2,5-dimethyl-4-hydroxy-3(2H)-furanone to
PVA introduced peaks characteristic of the furanone moiety on the PVA nanofibres (Figure 5.8).
Evidence of this is shown by the peaks at 995, 920, 850 and 810 cm-1
(region 1) which are all
characteristic of 2,5-dimethyl-4-hydroxy-3(2H)-furanone. PVA/DMHF also shows a new peak
(region 2) at around 700 cm-1
which indicates formation of a new compound. In the ATR/FTIR
spectrum of SMA copolymer (Figure 5.9 A and B), the bands at 1853 cm-1
and 1773 cm-1
are assigned
to the cyclic anhydride (C=O) and 1222 cm-1
is due cyclic ring ether (C-O-C). The band at 1495 cm-1
is a styrenic band. Aromatic C-C stretching vibrations appear at 1454 cm-1
and 1157 cm-1
. The
ATR/FTIR spectra of SMA/Furanones (1 and 2) nanofibres have similar bands to the one of the SMA
copolymer except for the broadening of the peaks at around 3000 cm-1
. The maleic anhydride bands at
1853 (1)and 1600 (2) also disappear and new peaks (3 and 4) appear in the place of the C-C
stretching vibrations around 1100 cm-1
. A new peak around 940 appears and was identified to be
characteristic of the furanone moiety.
1000 950 900 850 800 750 700 650 600
30
40
50
60
70
80
90
100
110
Region 2
Region 1
% T
ran
smit
ance
Wavenumber(cm-1)
DMHF
PVA/DMHF
PristinePVA
Figure 5.8: ATR-FTIR spectra of PVA/DMHF nanofibres.
Stellenbosch University http://scholar.sun.ac.za
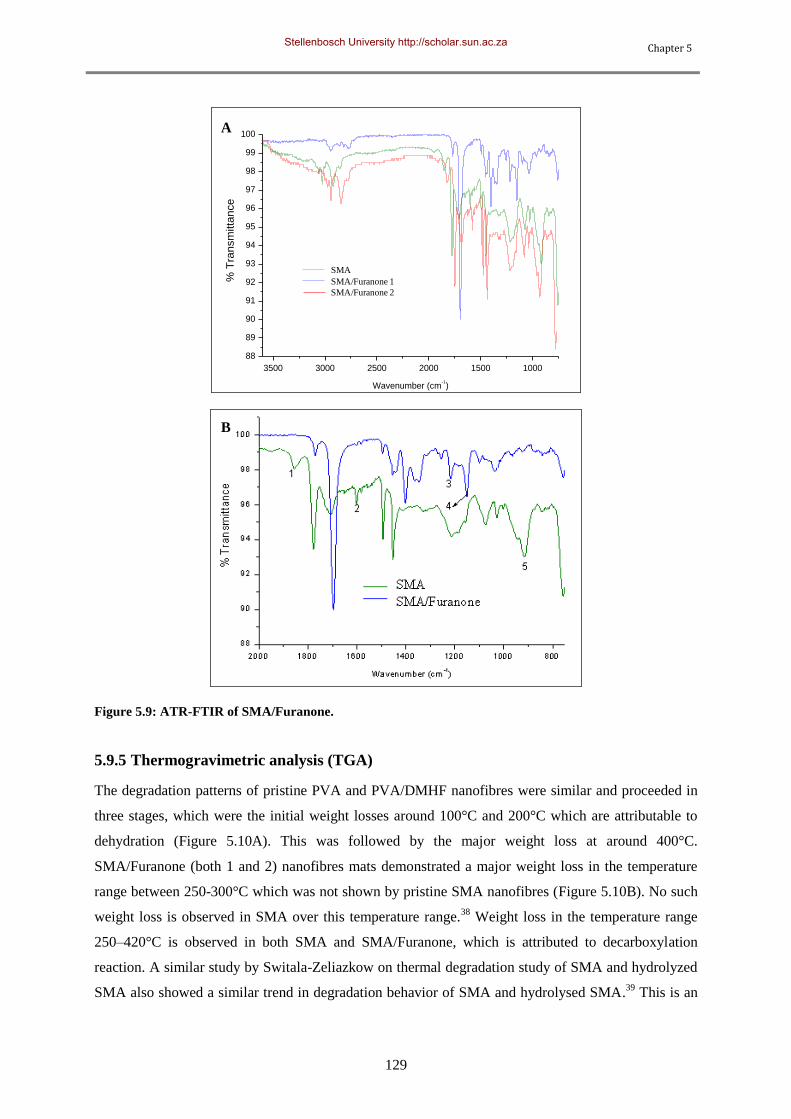
Chapter 5
129
3500 3000 2500 2000 1500 1000
88
89
90
91
92
93
94
95
96
97
98
99
100
% T
ransm
itta
nce
Wavenumber (cm-1)
SMA
SMA/AF1
3500 3000 2500 2000 1500 1000
88
89
90
91
92
93
94
95
96
97
98
99
100
% T
ran
sm
itta
nce
Wavenumber (cm-1)
SMA
SMA/AF1
SMA
SMA/Furanone 1
SMA/Furanone 2
Figure 5.9: ATR-FTIR of SMA/Furanone.
5.9.5 Thermogravimetric analysis (TGA)
The degradation patterns of pristine PVA and PVA/DMHF nanofibres were similar and proceeded in
three stages, which were the initial weight losses around 100°C and 200°C which are attributable to
dehydration (Figure 5.10A). This was followed by the major weight loss at around 400°C.
SMA/Furanone (both 1 and 2) nanofibres mats demonstrated a major weight loss in the temperature
range between 250-300°C which was not shown by pristine SMA nanofibres (Figure 5.10B). No such
weight loss is observed in SMA over this temperature range.38
Weight loss in the temperature range
250–420°C is observed in both SMA and SMA/Furanone, which is attributed to decarboxylation
reaction. A similar study by Switala-Zeliazkow on thermal degradation study of SMA and hydrolyzed
SMA also showed a similar trend in degradation behavior of SMA and hydrolysed SMA.39
This is an
A
B
Stellenbosch University http://scholar.sun.ac.za
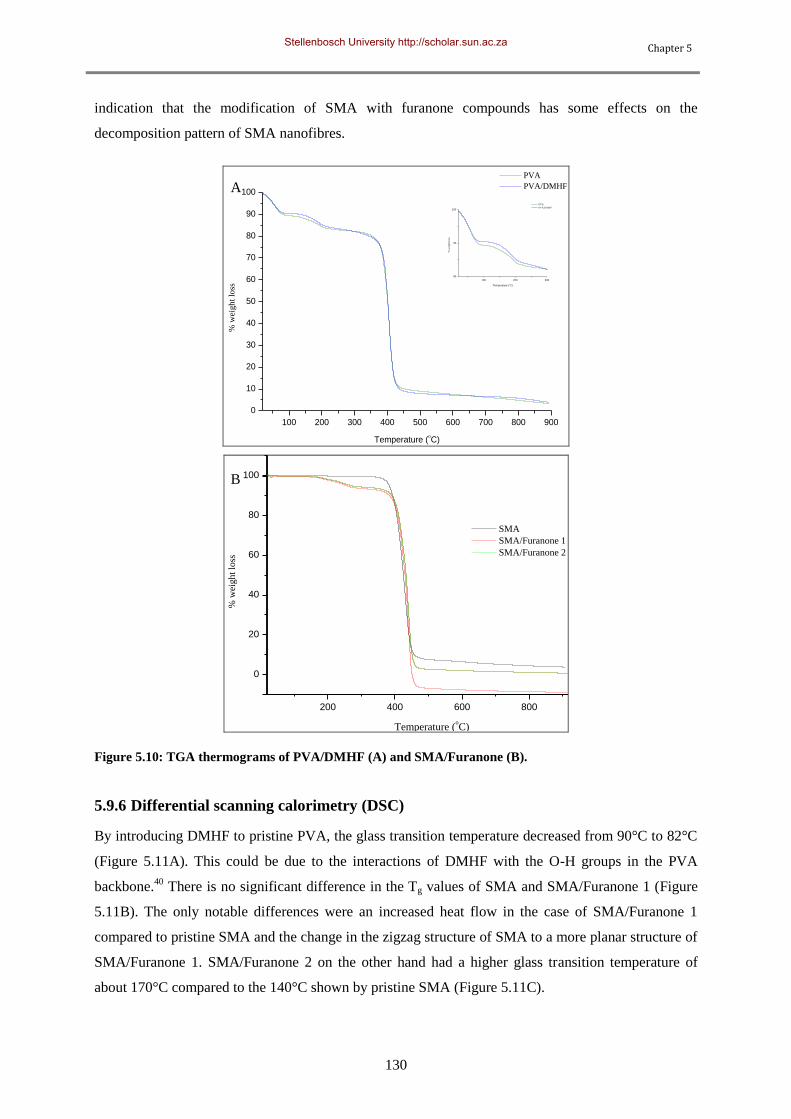
Chapter 5
130
indication that the modification of SMA with furanone compounds has some effects on the
decomposition pattern of SMA nanofibres.
100 200 300 400 500 600 700 800 900
0
10
20
30
40
50
60
70
80
90
100
100 200 300
80
90
100
% w
eig
ht
loss
Temperature (oC)
PVA
PVA/DMHF
% w
eight
loss
Temperature (oC)
PVA
PVA/DMHF
200 400 600 800 1000
0
20
40
60
80
100
% w
eight
loss
Temperature (oC)
SMA
SMA/Furanone 1
SMA/Furanone 2
Figure 5.10: TGA thermograms of PVA/DMHF (A) and SMA/Furanone (B).
5.9.6 Differential scanning calorimetry (DSC)
By introducing DMHF to pristine PVA, the glass transition temperature decreased from 90°C to 82°C
(Figure 5.11A). This could be due to the interactions of DMHF with the O-H groups in the PVA
backbone.40
There is no significant difference in the Tg values of SMA and SMA/Furanone 1 (Figure
5.11B). The only notable differences were an increased heat flow in the case of SMA/Furanone 1
compared to pristine SMA and the change in the zigzag structure of SMA to a more planar structure of
SMA/Furanone 1. SMA/Furanone 2 on the other hand had a higher glass transition temperature of
about 170°C compared to the 140°C shown by pristine SMA (Figure 5.11C).
A
B
Stellenbosch University http://scholar.sun.ac.za
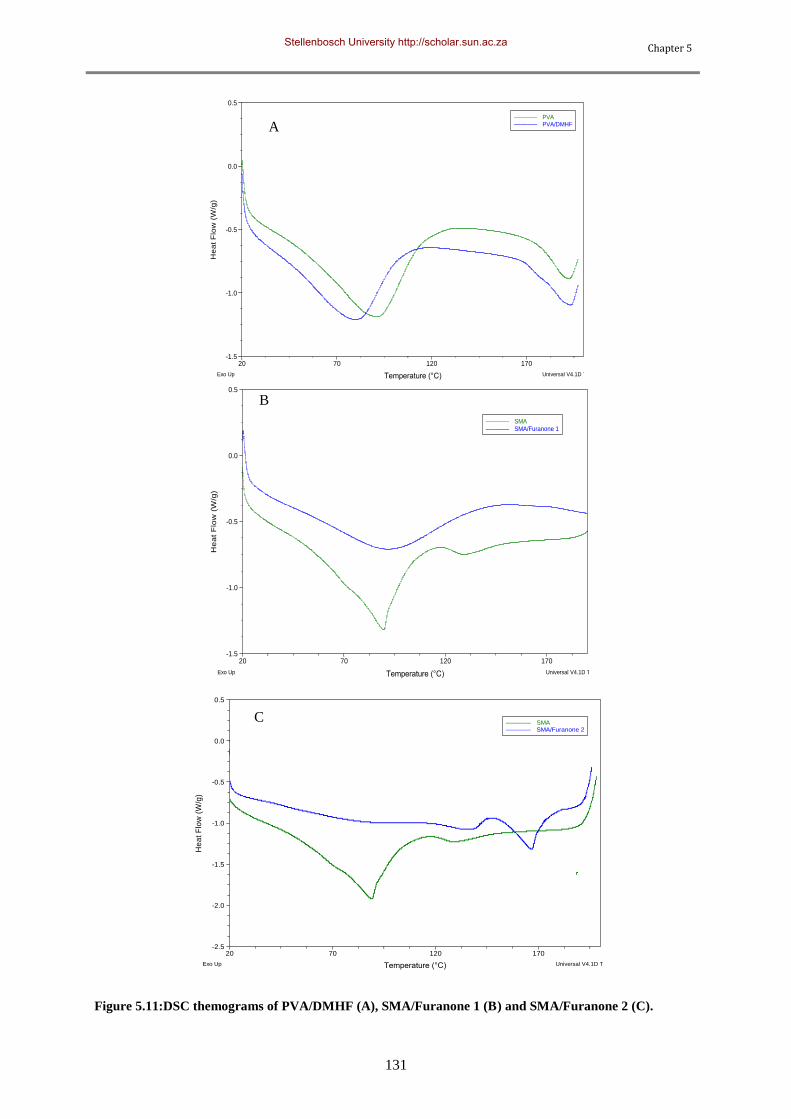
Chapter 5
131
-1.5
-1.0
-0.5
0.0
0.5
He
at
Flo
w (
W/g
)
20 70 120 170
Temperature (°C)
PVA––––––– PVA/DMHF–––––––
Exo Up Universal V4.1D TA Instruments
-1.5
-1.0
-0.5
0.0
0.5
He
at
Flo
w (
W/g
)
20 70 120 170
Temperature (°C)
SMA––––––– SMA/Furanone 1–––––––
Exo Up Universal V4.1D TA Instruments
-2.5
-2.0
-1.5
-1.0
-0.5
0.0
0.5
He
at
Flo
w (
W/g
)
20 70 120 170
Temperature (°C)
SMA––––––– SMA/Furanone 2–––––––
Exo Up Universal V4.1D TA Instruments
Figure 5.11:DSC themograms of PVA/DMHF (A), SMA/Furanone 1 (B) and SMA/Furanone 2 (C).
A
B
C
Stellenbosch University http://scholar.sun.ac.za
Chapter 5
132
5.9.7 Antimicrobial and antibiofouling determination
In this section the antimicrobial and antibiofouling potentials of the free furanone compounds coated
on Millipore filters as well as immobilized on polymer nanofibres is reported. Results on plate
counting, bioluminescence imaging and fluorescence microscopy are discussed and supported using
relevant literature. Control experiments were conducted on uncoated Millipore filters in the case of
free furanones and unmodified nanofibres (pristine PVA and pristine SMA) in the case of furanone-
modified nanofibres.
5.9.7.1 Free furanones
Millipore filters (0.22 μm sized) coated with 2,5 dimethyl-4-hydroxy-3-(2H)-furanones (DMHF)
demonstrated up to 4 log reductions in populations of S. aureus Xen 36 cells and 2 log reductions on
cells of P. aeruginosa Xen 5, E. coli Xen 14, S. typhimurium Xen 26, and K. pneumoniae Xen 39 after
30 minutes (Figure 5.12A). Almost 3 log reductions in S. aureus Xen 36 cells were achieved within 5
minutes of contact with the coated filters. These coated filters also inhibited biofilm formation by
more than 3 log for all the strains (Figure 5.12B). P. aeruginosa Xen 5, E. coli Xen 14 and S. aureus
Xen 36 recorded almost 5 log biofilm inhibitions after 36 hours.
Filters coated with 5-(2-(2-aminoethoxy)ethoxy)methyl)-2(5H)furanone achieved up to 2 log
reductions in populations of P. aeruginosa Xen 5, E. coli Xen 14, S. typhimurium Xen 26, S. aureus
Xen 36 and K. pneumoniae Xen 39 after 30 minutes of exposure. The antimicrobial activity exhibited
by this furanone compound was low after the first 5 minutes for all the strains and gradually increased
thus achieving up to 2 log after 30 minutes of exposure (Figure 5.13A). This furanone also inhibited
biofilm formation by strains of P. aeruginosa Xen 5, E. coli Xen 14, S. typhimurium Xen 26, S. aureus
Xen 36 and K. pneumoniae Xen 39 by at least 1.5 log after 36 hours (Figure 5.13B).
Filters coated with 4-(2-(2-aminoethoxy)-2,5-dimethyl-3(2H)-furanone on the other hand
demonstrated up to 5.5 log reductions in populations of P. aeruginosa Xen 5 and S.typhimurium Xen
26 after 30 minutes of exposure (Figure 5.14A). Up to 4.5 log reductions were achieved for E. coli
Xen 14, S. aureus Xen 36 and K. pneumoniae Xen 39. All the strains were reduced by more than 4 log
after the first 5 minutes of exposure. These 4-(2-(2-aminoethoxy)-2,5-dimethyl-3(2H)-furanone coated
filterss also inhibited surface colonization by biofilms of P.aeruginosa Xen 5, E. coli Xen 14, S.
typhimurium Xen 26, S. aureus Xen 36 and K. pneumoniae Xen 39 by almost 3 log after 36 hours
(Figure 5.14B).
Sung and co-workers also obtained satisfactory antimicrobial efficacy of DMHF on strains of
P.aeruginosa, S. aureus, E coli and Enterococci. The antimicrobial efficacy and quorum sensing
Stellenbosch University http://scholar.sun.ac.za
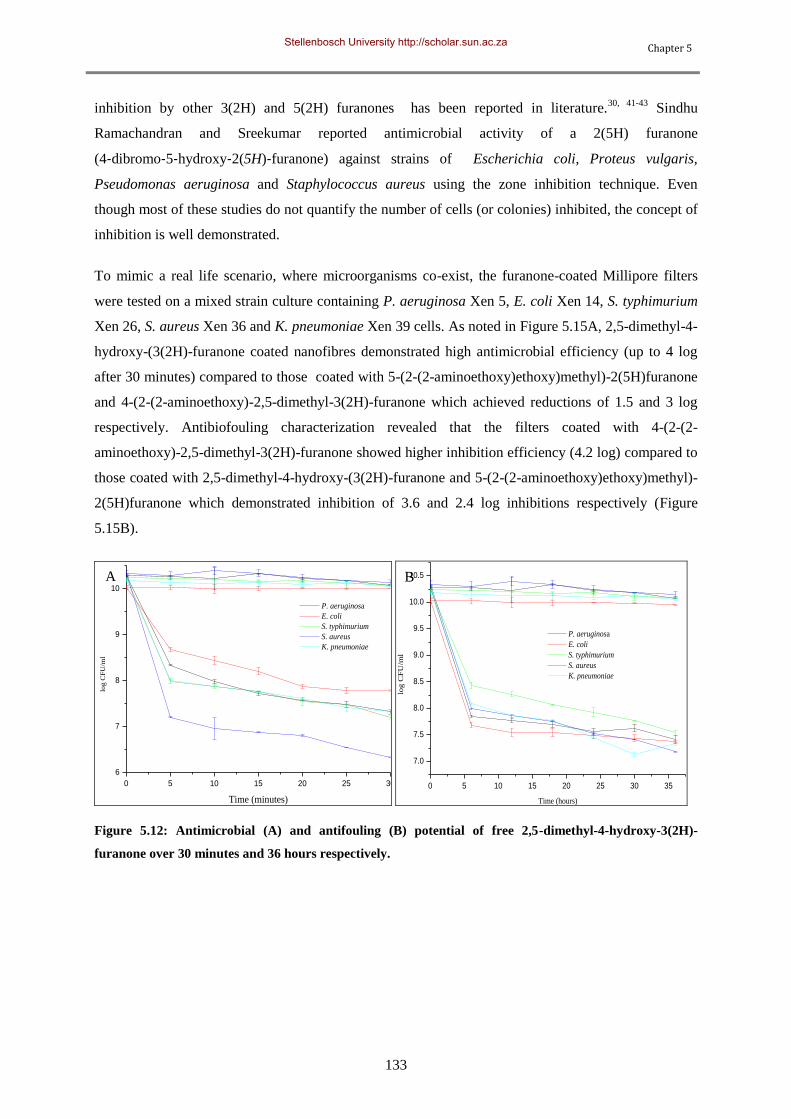
Chapter 5
133
inhibition by other 3(2H) and 5(2H) furanones has been reported in literature.30, 41-43
Sindhu
Ramachandran and Sreekumar reported antimicrobial activity of a 2(5H) furanone
(4‐dibromo‐5‐hydroxy‐2(5H)‐furanone) against strains of Escherichia coli, Proteus vulgaris,
Pseudomonas aeruginosa and Staphylococcus aureus using the zone inhibition technique. Even
though most of these studies do not quantify the number of cells (or colonies) inhibited, the concept of
inhibition is well demonstrated.
To mimic a real life scenario, where microorganisms co-exist, the furanone-coated Millipore filters
were tested on a mixed strain culture containing P. aeruginosa Xen 5, E. coli Xen 14, S. typhimurium
Xen 26, S. aureus Xen 36 and K. pneumoniae Xen 39 cells. As noted in Figure 5.15A, 2,5-dimethyl-4-
hydroxy-(3(2H)-furanone coated nanofibres demonstrated high antimicrobial efficiency (up to 4 log
after 30 minutes) compared to those coated with 5-(2-(2-aminoethoxy)ethoxy)methyl)-2(5H)furanone
and 4-(2-(2-aminoethoxy)-2,5-dimethyl-3(2H)-furanone which achieved reductions of 1.5 and 3 log
respectively. Antibiofouling characterization revealed that the filters coated with 4-(2-(2-
aminoethoxy)-2,5-dimethyl-3(2H)-furanone showed higher inhibition efficiency (4.2 log) compared to
those coated with 2,5-dimethyl-4-hydroxy-(3(2H)-furanone and 5-(2-(2-aminoethoxy)ethoxy)methyl)-
2(5H)furanone which demonstrated inhibition of 3.6 and 2.4 log inhibitions respectively (Figure
5.15B).
0 5 10 15 20 25 30
6
7
8
9
10
P. aeruginosa
E. coli
S. typhimurium
S. aureus
K. pneumoniae
log
CF
U/m
l
Time (minutes)
0 5 10 15 20 25 30 35
7.0
7.5
8.0
8.5
9.0
9.5
10.0
10.5
P. aeruginosa
E. coli
S. typhimurium
S. aureus
K. pneumoniae
log C
FU
/ml
Time (hours)
Figure 5.12: Antimicrobial (A) and antifouling (B) potential of free 2,5-dimethyl-4-hydroxy-3(2H)-
furanone over 30 minutes and 36 hours respectively.
A B
Stellenbosch University http://scholar.sun.ac.za
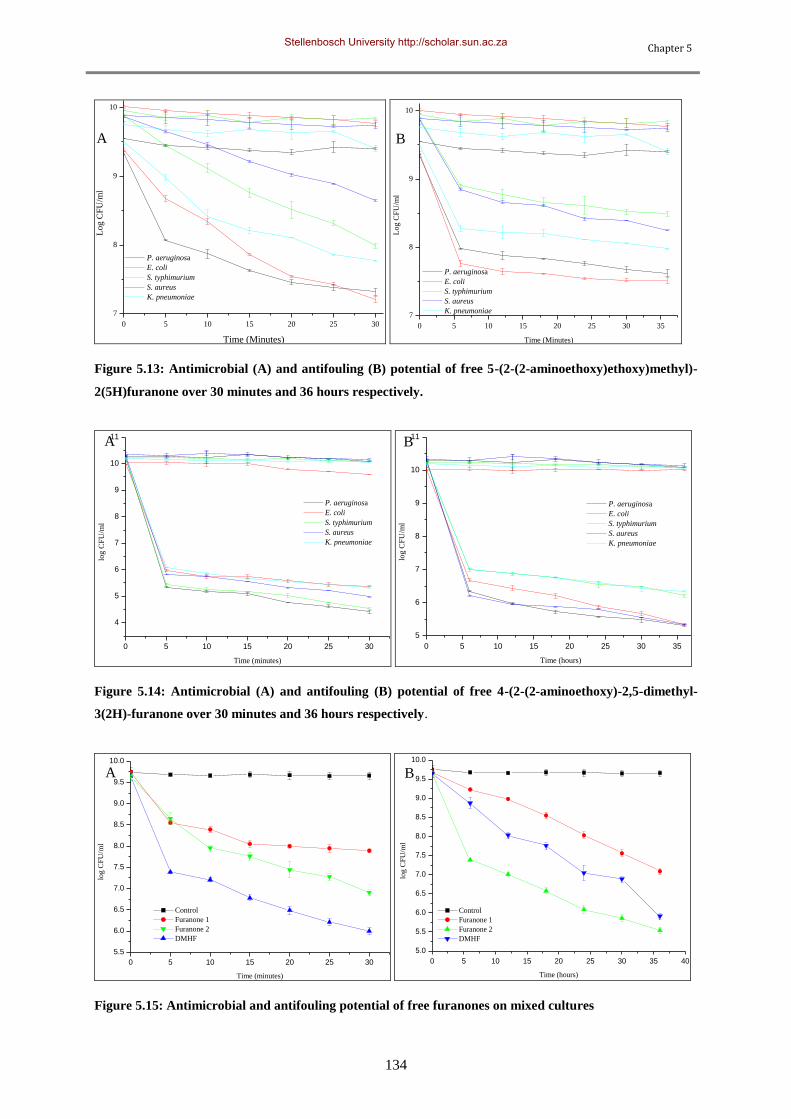
Chapter 5
134
0 5 10 15 20 25 30
7
8
9
10L
og C
FU
/ml
Time (Minutes)
P. aeruginosa
E. coli
S. typhimurium
S. aureus
K. pneumoniae
0 5 10 15 20 25 30 35
7
8
9
10
Lo
g C
FU
/ml
Time (Minutes)
P. aeruginosa
E. coli
S. typhimurium
S. aureus
K. pneumoniae
Figure 5.13: Antimicrobial (A) and antifouling (B) potential of free 5-(2-(2-aminoethoxy)ethoxy)methyl)-
2(5H)furanone over 30 minutes and 36 hours respectively.
0 5 10 15 20 25 30
4
5
6
7
8
9
10
11
P. aeruginosa
E. coli
S. typhimurium
S. aureus
K. pneumoniae
log C
FU
/ml
Time (minutes)
0 5 10 15 20 25 30 35
5
6
7
8
9
10
11
P. aeruginosa
E. coli
S. typhimurium
S. aureus
K. pneumoniae
log C
FU
/ml
Time (hours)
Figure 5.14: Antimicrobial (A) and antifouling (B) potential of free 4-(2-(2-aminoethoxy)-2,5-dimethyl-
3(2H)-furanone over 30 minutes and 36 hours respectively.
0 5 10 15 20 25 30
5.5
6.0
6.5
7.0
7.5
8.0
8.5
9.0
9.5
10.0
Control
Furanone 1
Furanone 2
DMHF
log
CF
U/m
l
Time (minutes)
0 5 10 15 20 25 30 35 40
5.0
5.5
6.0
6.5
7.0
7.5
8.0
8.5
9.0
9.5
10.0
log
CF
U/m
l
Time (hours)
Control
Furanone 1
Furanone 2
DMHF
Figure 5.15: Antimicrobial and antifouling potential of free furanones on mixed cultures
A B
A B
A B
Stellenbosch University http://scholar.sun.ac.za
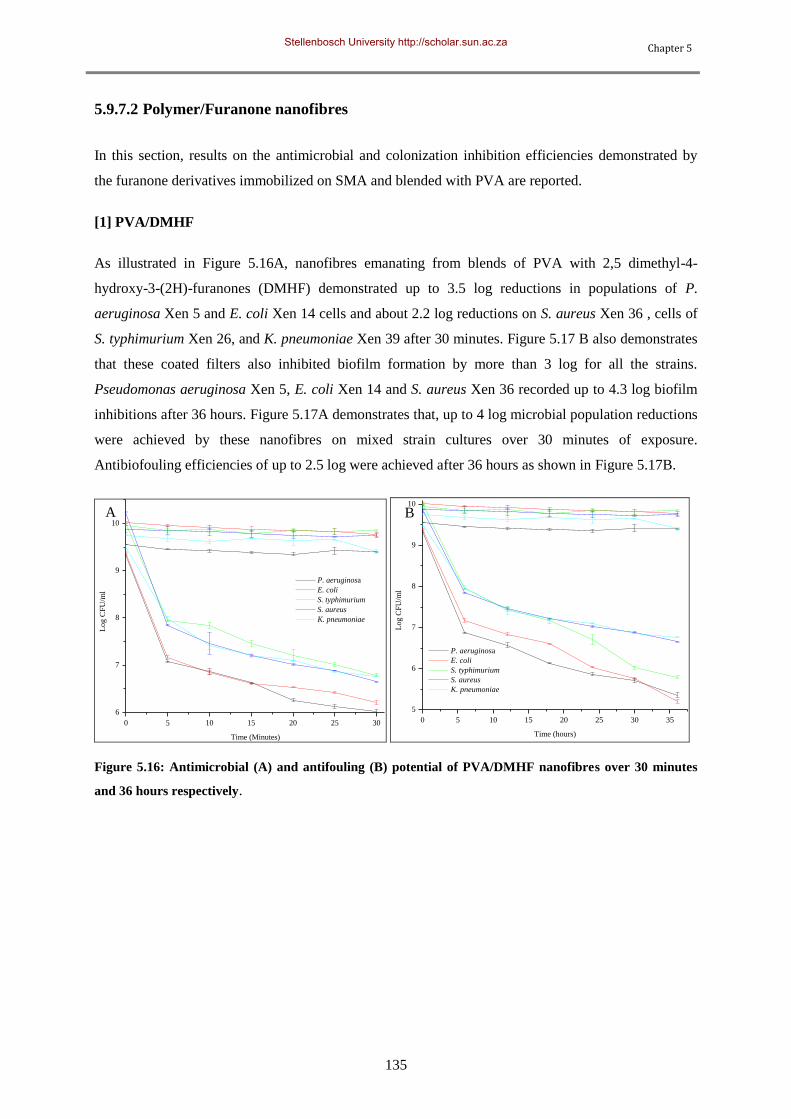
Chapter 5
135
5.9.7.2 Polymer/Furanone nanofibres
In this section, results on the antimicrobial and colonization inhibition efficiencies demonstrated by
the furanone derivatives immobilized on SMA and blended with PVA are reported.
[1] PVA/DMHF
As illustrated in Figure 5.16A, nanofibres emanating from blends of PVA with 2,5 dimethyl-4-
hydroxy-3-(2H)-furanones (DMHF) demonstrated up to 3.5 log reductions in populations of P.
aeruginosa Xen 5 and E. coli Xen 14 cells and about 2.2 log reductions on S. aureus Xen 36 , cells of
S. typhimurium Xen 26, and K. pneumoniae Xen 39 after 30 minutes. Figure 5.17 B also demonstrates
that these coated filters also inhibited biofilm formation by more than 3 log for all the strains.
Pseudomonas aeruginosa Xen 5, E. coli Xen 14 and S. aureus Xen 36 recorded up to 4.3 log biofilm
inhibitions after 36 hours. Figure 5.17A demonstrates that, up to 4 log microbial population reductions
were achieved by these nanofibres on mixed strain cultures over 30 minutes of exposure.
Antibiofouling efficiencies of up to 2.5 log were achieved after 36 hours as shown in Figure 5.17B.
0 5 10 15 20 25 30
6
7
8
9
10
Lo
g C
FU
/ml
Time (Minutes)
P. aeruginosa
E. coli
S. typhimurium
S. aureus
K. pneumoniae
0 5 10 15 20 25 30 35
5
6
7
8
9
10
Lo
g C
FU
/ml
Time (hours)
P. aeruginosa
E. coli
S. typhimurium
S. aureus
K. pneumoniae
Figure 5.16: Antimicrobial (A) and antifouling (B) potential of PVA/DMHF nanofibres over 30 minutes
and 36 hours respectively.
A B
Stellenbosch University http://scholar.sun.ac.za
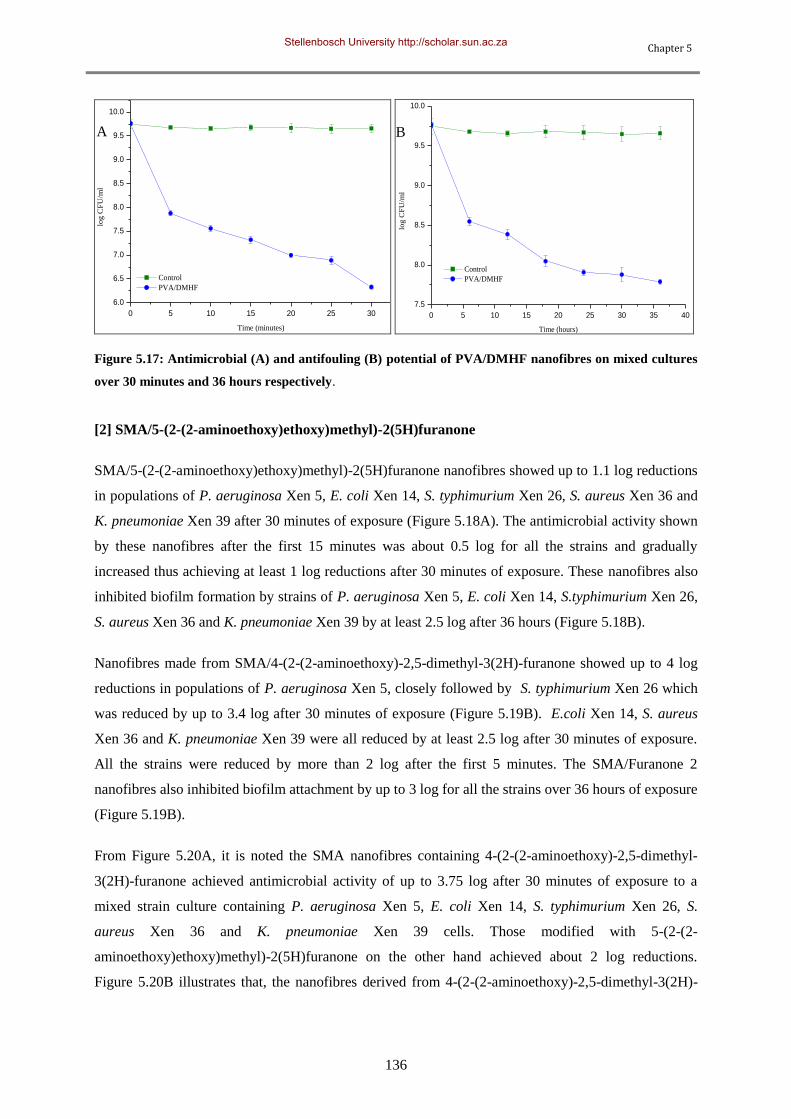
Chapter 5
136
0 5 10 15 20 25 30
6.0
6.5
7.0
7.5
8.0
8.5
9.0
9.5
10.0
Control
PVA/DMHF
log C
FU
/ml
Time (minutes) 0 5 10 15 20 25 30 35 40
7.5
8.0
8.5
9.0
9.5
10.0
Control
PVA/DMHF
log
CF
U/m
l
Time (hours)
Figure 5.17: Antimicrobial (A) and antifouling (B) potential of PVA/DMHF nanofibres on mixed cultures
over 30 minutes and 36 hours respectively.
[2] SMA/5-(2-(2-aminoethoxy)ethoxy)methyl)-2(5H)furanone
SMA/5-(2-(2-aminoethoxy)ethoxy)methyl)-2(5H)furanone nanofibres showed up to 1.1 log reductions
in populations of P. aeruginosa Xen 5, E. coli Xen 14, S. typhimurium Xen 26, S. aureus Xen 36 and
K. pneumoniae Xen 39 after 30 minutes of exposure (Figure 5.18A). The antimicrobial activity shown
by these nanofibres after the first 15 minutes was about 0.5 log for all the strains and gradually
increased thus achieving at least 1 log reductions after 30 minutes of exposure. These nanofibres also
inhibited biofilm formation by strains of P. aeruginosa Xen 5, E. coli Xen 14, S.typhimurium Xen 26,
S. aureus Xen 36 and K. pneumoniae Xen 39 by at least 2.5 log after 36 hours (Figure 5.18B).
Nanofibres made from SMA/4-(2-(2-aminoethoxy)-2,5-dimethyl-3(2H)-furanone showed up to 4 log
reductions in populations of P. aeruginosa Xen 5, closely followed by S. typhimurium Xen 26 which
was reduced by up to 3.4 log after 30 minutes of exposure (Figure 5.19B). E.coli Xen 14, S. aureus
Xen 36 and K. pneumoniae Xen 39 were all reduced by at least 2.5 log after 30 minutes of exposure.
All the strains were reduced by more than 2 log after the first 5 minutes. The SMA/Furanone 2
nanofibres also inhibited biofilm attachment by up to 3 log for all the strains over 36 hours of exposure
(Figure 5.19B).
From Figure 5.20A, it is noted the SMA nanofibres containing 4-(2-(2-aminoethoxy)-2,5-dimethyl-
3(2H)-furanone achieved antimicrobial activity of up to 3.75 log after 30 minutes of exposure to a
mixed strain culture containing P. aeruginosa Xen 5, E. coli Xen 14, S. typhimurium Xen 26, S.
aureus Xen 36 and K. pneumoniae Xen 39 cells. Those modified with 5-(2-(2-
aminoethoxy)ethoxy)methyl)-2(5H)furanone on the other hand achieved about 2 log reductions.
Figure 5.20B illustrates that, the nanofibres derived from 4-(2-(2-aminoethoxy)-2,5-dimethyl-3(2H)-
A B
Stellenbosch University http://scholar.sun.ac.za
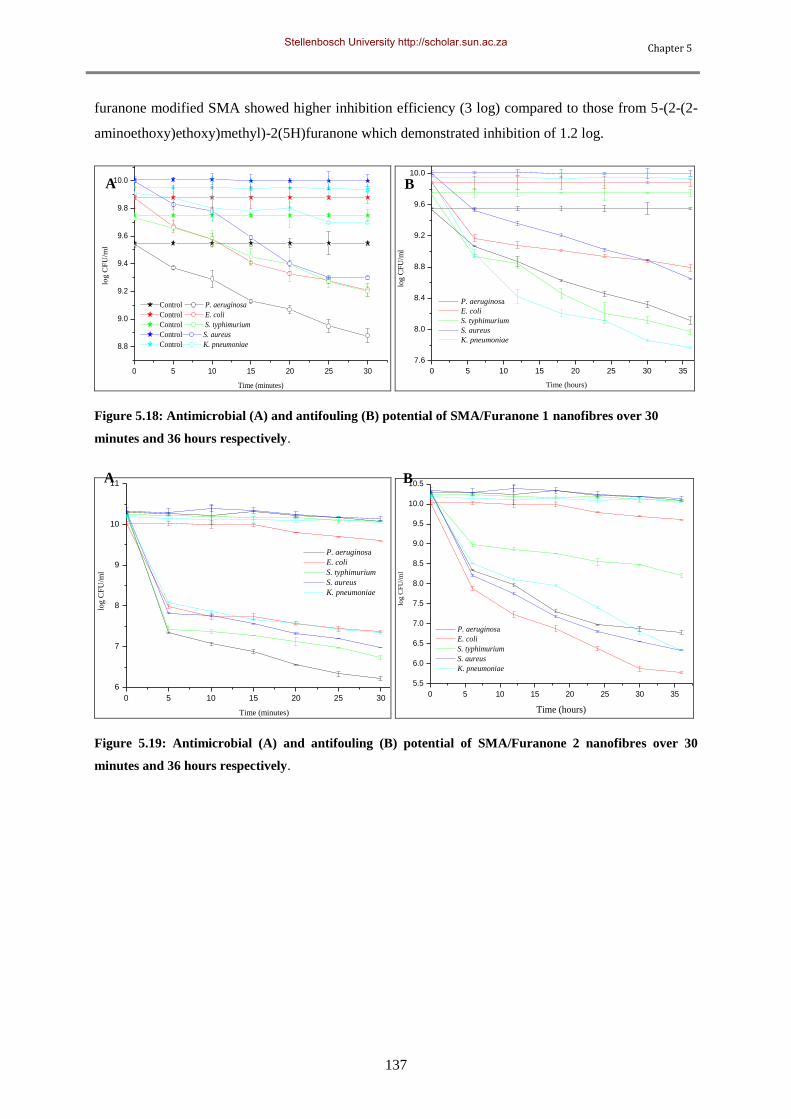
Chapter 5
137
furanone modified SMA showed higher inhibition efficiency (3 log) compared to those from 5-(2-(2-
aminoethoxy)ethoxy)methyl)-2(5H)furanone which demonstrated inhibition of 1.2 log.
0 5 10 15 20 25 30
8.8
9.0
9.2
9.4
9.6
9.8
10.0
log
CF
U/m
l
Time (minutes)
Control P. aeruginosa
Control E. coli
Control S. typhimurium
Control S. aureus
Control K. pneumoniae
0 5 10 15 20 25 30 35
7.6
8.0
8.4
8.8
9.2
9.6
10.0
P. aeruginosa
E. coli
S. typhimurium
S. aureus
K. pneumoniae
log
CF
U/m
l
Time (hours)
Figure 5.18: Antimicrobial (A) and antifouling (B) potential of SMA/Furanone 1 nanofibres over 30
minutes and 36 hours respectively.
0 5 10 15 20 25 30
6
7
8
9
10
11
P. aeruginosa
E. coli
S. typhimurium
S. aureus
K. pneumoniae
log C
FU
/ml
Time (minutes)
0 5 10 15 20 25 30 35
5.5
6.0
6.5
7.0
7.5
8.0
8.5
9.0
9.5
10.0
10.5
P. aeruginosa
E. coli
S. typhimurium
S. aureus
K. pneumoniae
log
CF
U/m
l
Time (hours)
Figure 5.19: Antimicrobial (A) and antifouling (B) potential of SMA/Furanone 2 nanofibres over 30
minutes and 36 hours respectively.
A B
A B
Stellenbosch University http://scholar.sun.ac.za
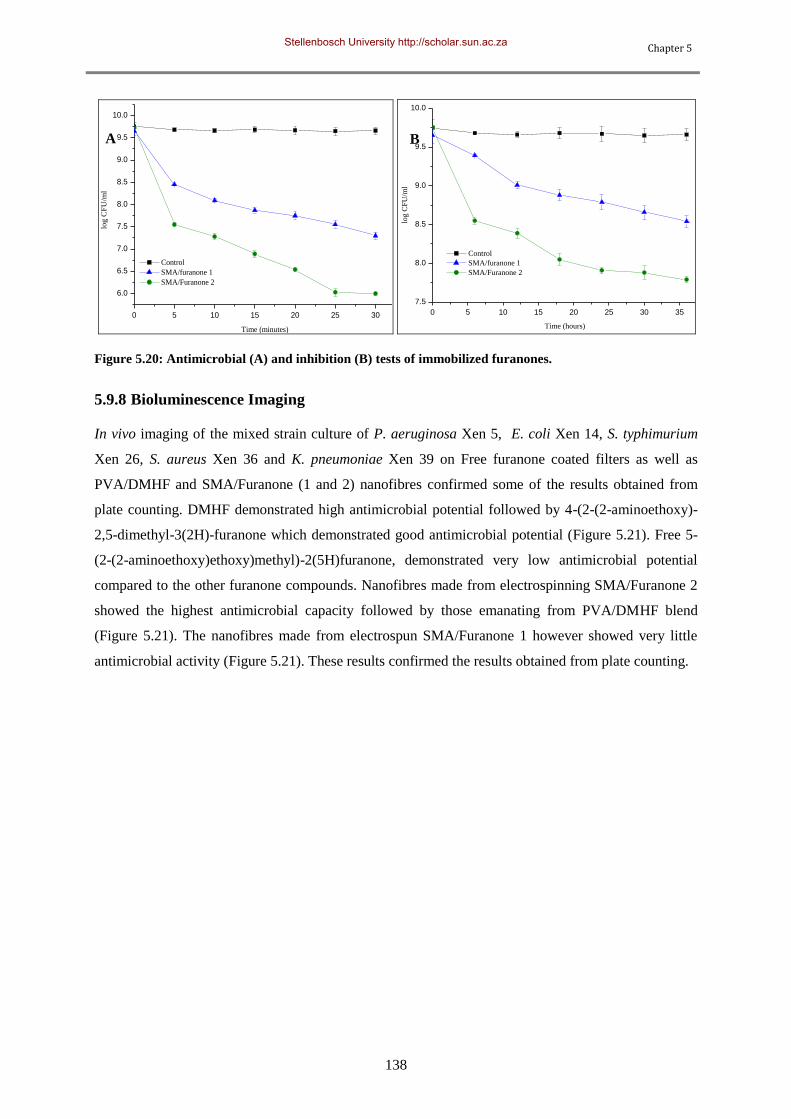
Chapter 5
138
0 5 10 15 20 25 30
6.0
6.5
7.0
7.5
8.0
8.5
9.0
9.5
10.0
Control
SMA/furanone 1
SMA/Furanone 2
log
CF
U/m
l
Time (minutes)
0 5 10 15 20 25 30 35
7.5
8.0
8.5
9.0
9.5
10.0
log
CF
U/m
l
Control
SMA/furanone 1
SMA/Furanone 2
Time (hours)
Figure 5.20: Antimicrobial (A) and inhibition (B) tests of immobilized furanones.
5.9.8 Bioluminescence Imaging
In vivo imaging of the mixed strain culture of P. aeruginosa Xen 5, E. coli Xen 14, S. typhimurium
Xen 26, S. aureus Xen 36 and K. pneumoniae Xen 39 on Free furanone coated filters as well as
PVA/DMHF and SMA/Furanone (1 and 2) nanofibres confirmed some of the results obtained from
plate counting. DMHF demonstrated high antimicrobial potential followed by 4-(2-(2-aminoethoxy)-
2,5-dimethyl-3(2H)-furanone which demonstrated good antimicrobial potential (Figure 5.21). Free 5-
(2-(2-aminoethoxy)ethoxy)methyl)-2(5H)furanone, demonstrated very low antimicrobial potential
compared to the other furanone compounds. Nanofibres made from electrospinning SMA/Furanone 2
showed the highest antimicrobial capacity followed by those emanating from PVA/DMHF blend
(Figure 5.21). The nanofibres made from electrospun SMA/Furanone 1 however showed very little
antimicrobial activity (Figure 5.21). These results confirmed the results obtained from plate counting.
A B
Stellenbosch University http://scholar.sun.ac.za
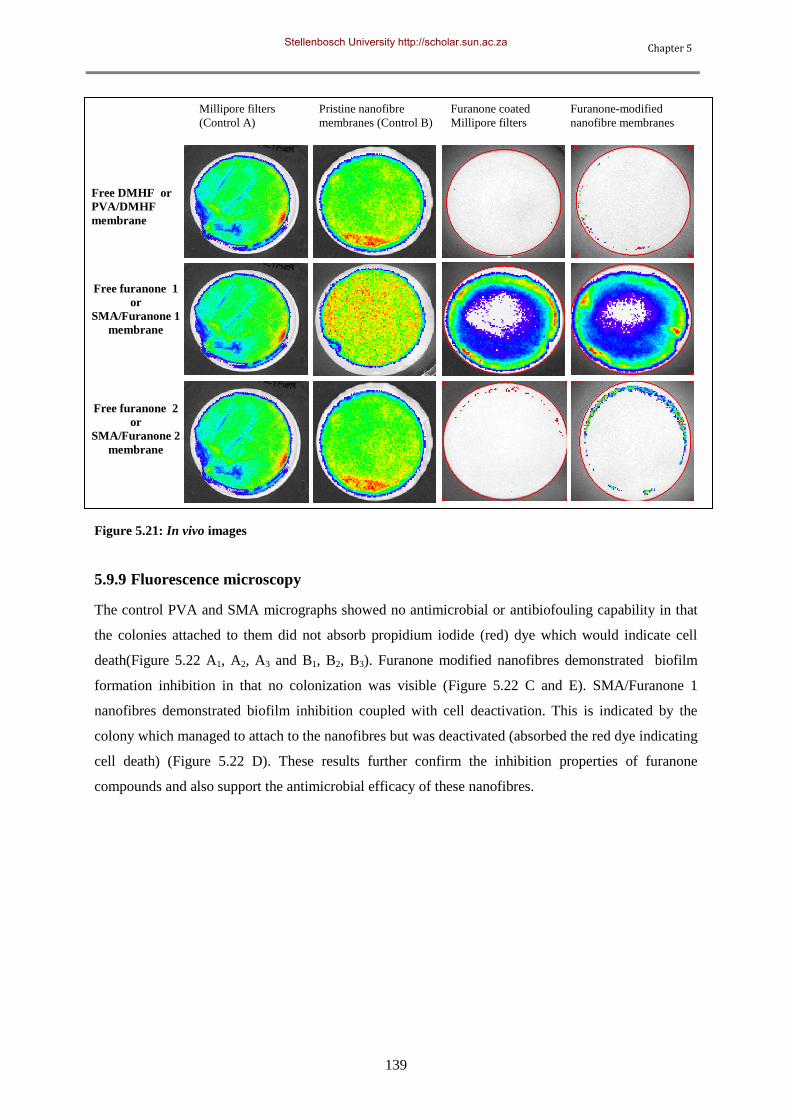
Chapter 5
139
Figure 5.21: In vivo images
5.9.9 Fluorescence microscopy
The control PVA and SMA micrographs showed no antimicrobial or antibiofouling capability in that
the colonies attached to them did not absorb propidium iodide (red) dye which would indicate cell
death(Figure 5.22 A1, A2, A3 and B1, B2, B3). Furanone modified nanofibres demonstrated biofilm
formation inhibition in that no colonization was visible (Figure 5.22 C and E). SMA/Furanone 1
nanofibres demonstrated biofilm inhibition coupled with cell deactivation. This is indicated by the
colony which managed to attach to the nanofibres but was deactivated (absorbed the red dye indicating
cell death) (Figure 5.22 D). These results further confirm the inhibition properties of furanone
compounds and also support the antimicrobial efficacy of these nanofibres.
Millipore filters
(Control A)
Pristine nanofibre
membranes (Control B)
Furanone coated
Millipore filters
Furanone-modified
nanofibre membranes
Free DMHF or
PVA/DMHF
membrane
Free furanone 1
or
SMA/Furanone 1
membrane
Free furanone 2
or
SMA/Furanone 2
membrane
Stellenbosch University http://scholar.sun.ac.za
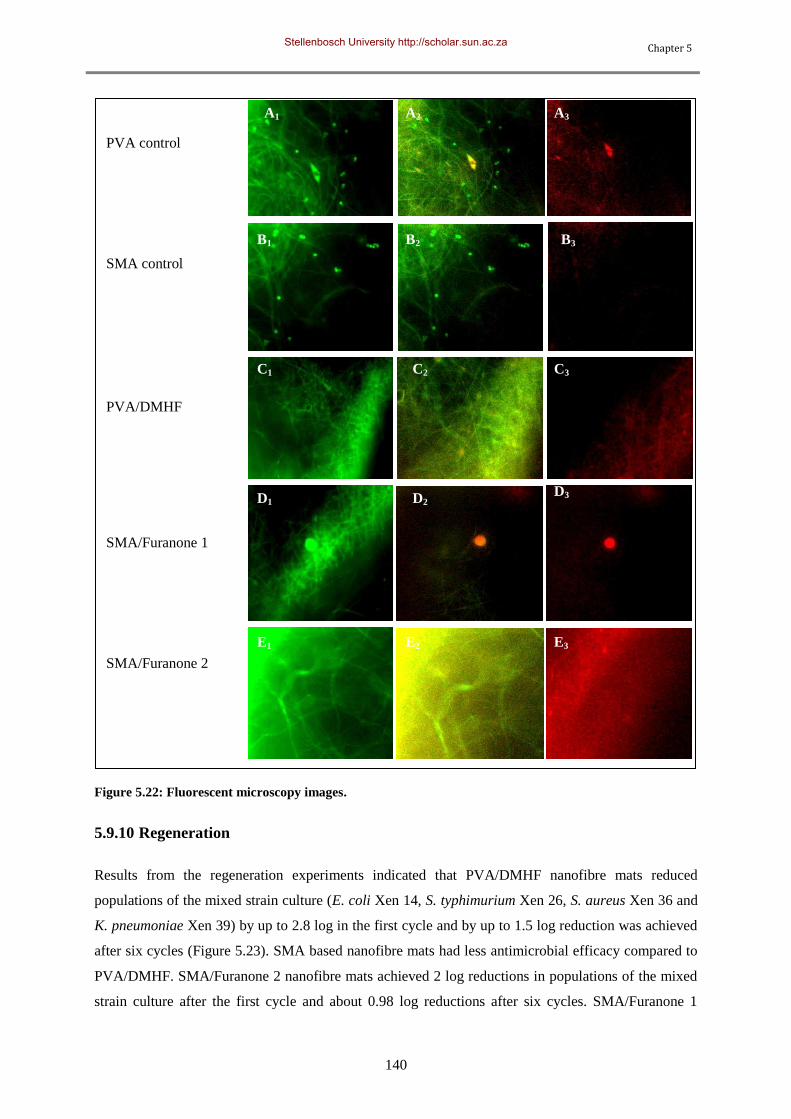
Chapter 5
140
Figure 5.22: Fluorescent microscopy images.
5.9.10 Regeneration
Results from the regeneration experiments indicated that PVA/DMHF nanofibre mats reduced
populations of the mixed strain culture (E. coli Xen 14, S. typhimurium Xen 26, S. aureus Xen 36 and
K. pneumoniae Xen 39) by up to 2.8 log in the first cycle and by up to 1.5 log reduction was achieved
after six cycles (Figure 5.23). SMA based nanofibre mats had less antimicrobial efficacy compared to
PVA/DMHF. SMA/Furanone 2 nanofibre mats achieved 2 log reductions in populations of the mixed
strain culture after the first cycle and about 0.98 log reductions after six cycles. SMA/Furanone 1
A1 A2 A3
B1 B3 B2
C3 C2 C1
D1 D3 D2
E3 E2 E1
PVA control
SMA control
PVA/DMHF
SMA/Furanone 1
SMA/Furanone 2
Stellenbosch University http://scholar.sun.ac.za
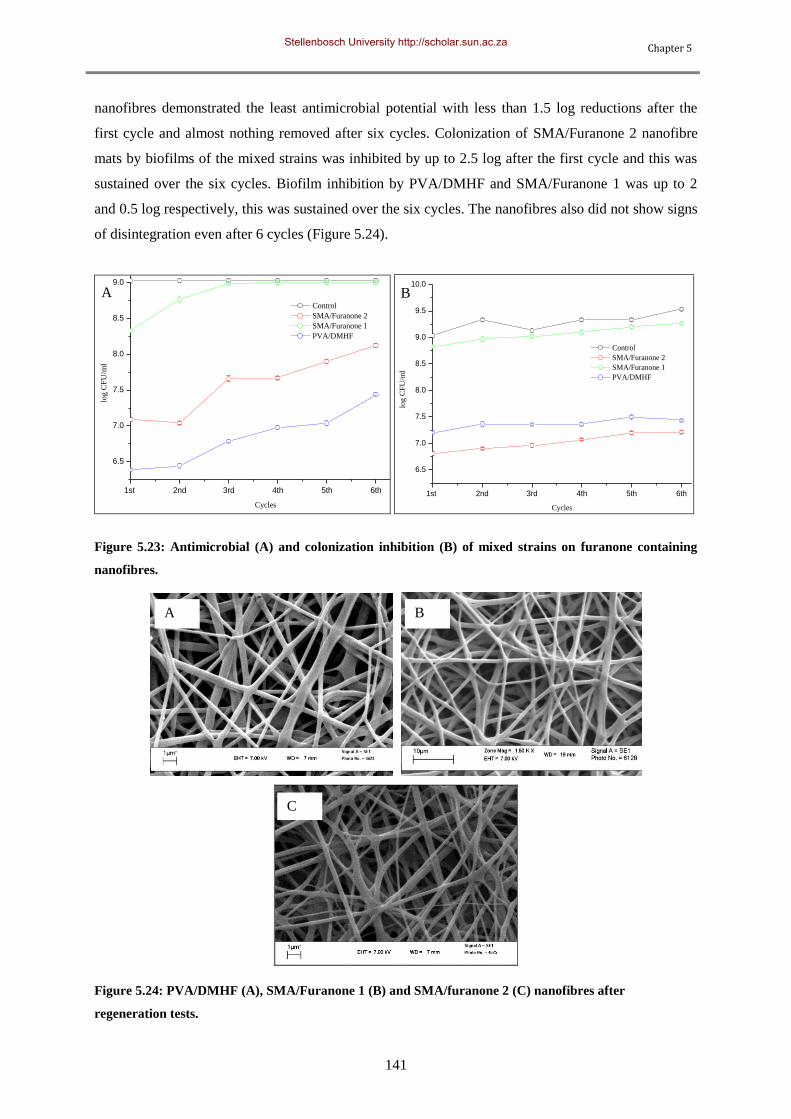
Chapter 5
141
nanofibres demonstrated the least antimicrobial potential with less than 1.5 log reductions after the
first cycle and almost nothing removed after six cycles. Colonization of SMA/Furanone 2 nanofibre
mats by biofilms of the mixed strains was inhibited by up to 2.5 log after the first cycle and this was
sustained over the six cycles. Biofilm inhibition by PVA/DMHF and SMA/Furanone 1 was up to 2
and 0.5 log respectively, this was sustained over the six cycles. The nanofibres also did not show signs
of disintegration even after 6 cycles (Figure 5.24).
1st 2nd 3rd 4th 5th 6th
6.5
7.0
7.5
8.0
8.5
9.0
log
CF
U/m
l
Cycles
Control
SMA/Furanone 2
SMA/Furanone 1
PVA/DMHF
1st 2nd 3rd 4th 5th 6th
6.5
7.0
7.5
8.0
8.5
9.0
9.5
10.0
log C
FU
/ml
Cycles
Control
SMA/Furanone 2
SMA/Furanone 1
PVA/DMHF
Figure 5.23: Antimicrobial (A) and colonization inhibition (B) of mixed strains on furanone containing
nanofibres.
Figure 5.24: PVA/DMHF (A), SMA/Furanone 1 (B) and SMA/furanone 2 (C) nanofibres after
regeneration tests.
A B
A B
C
Stellenbosch University http://scholar.sun.ac.za

Chapter 5
142
5.9.11 Leaching experiments
The GC-MS results as illustrated by Figure 5.25 indicated that the leachates from PVA/DMHF and
SMA/Furanone (1 and 2) did not contain any furanone compounds. This is because all the samples did
not contain the peak at 11.59 which was only present in the furanone containing control (positive
control).This indicates that the furanone compounds from both PVA/Furanone blends and
immobilized on polymers did not leach into the filtered water.
Figure 5.25: GC-MS spectra to ascertain leaching intensity of furanone compounds.
Stellenbosch University http://scholar.sun.ac.za
Chapter 5
143
5.10 Conclusions
5.10.1 PVA/DMHF
Blends of PVA with 2,5 dimethyl-4-hydroxy-3(2H)-furanone were successfully prepared and
electrospun using the electrospinning process. The nanofibres obtained had diameters between 150-
300 nm, with a majority of these (29%) in the 200 and 250nm range. More than 80% of the pores on
PVA/DMHF nanofibre mats had sizes of less than 100 nm2 with a majority of these pores in the 50-
100 nm2 range. ATR-FTIR revealed that the addition of 2,5-dimethyl-4-hydroxy-3(2H)-furanone to
PVA introduced peaks characteristic of the furanone moiety on the PVA nanofibres.
Thermogravimetric studies indicated that there was no significant difference in the degradation
patterns of PVA and PVA/DMHF nanofibres. This was further confirmed by the slight drop from 90
to 82°C in the Tg of PVA/DMHF compared to that of PVA.
Free 2,5 dimethyl-4-hydroxy-3(2H)-furanone demonstrated up to 4 log reductions in populations of S.
aureus Xen 36 cells and about 2 log reductions on cells of P. aeruginosa Xen 5, E. coli Xen 14, S.
typhimurium Xen 26, and K. pneumoniae Xen 39 after 30 minutes. This furanone also inhibited
biofilm formation by up to 5 log over 36 hours of exposure. This furanone also demonstrated the
highest antimicrobial efficiency on mixed-strain cultures of P. aeruginosa Xen 5, E. coli Xen 14, S.
aureus Xen 36, S. typhimurium Xen 26 and K. pneumoniae Xen 39 when compared to the other
synthesized furanone compounds.
PVA/DMHF nanofibres on the other hand achieved up to 3.5 log reductions in populations of P.
aeruginosa Xen 5 and E. coli Xen 14 cells and about 2.2 log reductions on S. aureus Xen 36, cells of
S. typhimurium Xen 26, and K. pneumoniae Xen 39 after 30 minutes. These nanofibres also
demonstrated antibiofouling efficiencies of up to 2.5 log were achieved after 36 hours on all the
strains. PVA/DMHF nanofibres also achieved up to 4 log microbial population reductions on mixed
strain cultures over 30 minutes of exposure.
5.10.2 SMA-Furanone
Synthesis of 5-(2-(2-aminoethoxy)ethoxy)methyl)-2(5H)furanone and 4-(2-(2-aminoethoxy)-2,5-
dimethyl-3(2H)-furanone from 2,5 dimethyl-4-hydroxy-3(2H)-furanone was successful. Their
structures and molar masses were confirmed using 1H NMR and ES mass spectroscopy. Product yields
of 84% and 78% for 5-(2-(2-aminoethoxy)ethoxy)methyl)-2(5H)furanone and 4-(2-(2-aminoethoxy)-
2,5-dimethyl-3(2H)-furanone respectively were obtained. These furanone compounds were
successfully immobilized into SMA copolymer backbone. The furanone-modified SMA was
electrospun to obtain nanofibres. About 83% of the nanofibres derived from 5-(2-(2-
aminoethoxy)ethoxy)methyl)-2(5H)furanone modified SMA had diameters between 50-250 nm and
pore sizes of less than 100 nm2 (about 70%). About 88% of nanofibres from 4-(2-(2-aminoethoxy)-
Stellenbosch University http://scholar.sun.ac.za
Chapter 5
144
2,5-dimethyl-3(2H)-furanone modified SMA had diameters between 50 and 300 nm and about 70% of
the nanofibrous mat pores between 100-150 nm2 in size.
SMA copolymers modified with 5-(2-(2-aminoethoxy)ethoxy)methyl)-2(5H)furanone and 4-(2-(2-
aminoethoxy)-2,5-dimethyl-3(2H)-furanone demonstrated a major weight loss in the temperature
range between 250-300°C which was not shown by pristine SMA nanofibres. This indicated that the
modification of SMA with furanone compounds has some effects on the decomposition pattern of
SMA nanofibres. There was no significant change in the Tg value of 5-(2-(2-
aminoethoxy)ethoxy)methyl)-2(5H)furanone modified SMA nanofibres compared to pristine SMA
copolymer. Structural changes from the zigzag structure of SMA to a more planar structure of the
furanone SMA were however noted. The 4-(2-(2-aminoethoxy)-2,5-dimethyl-3(2H)-furanone
modified SMA on the other hand had a higher glass transition temperature of about 170°C compared
to the 140°C shown by pristine SMA.
Free 5-(2-(2-aminoethoxy)ethoxy)methyl)-2(5H)furanone achieved up to 2 log reductions in
populations of P. aeruginosa Xen 5, E. coli Xen 14, S. typhimurium Xen 26, S. aureus Xen 36 and K.
pneumoniae Xen 39 after 30 minutes of exposure. This furanone compound also inhibited biofilm
formation by strains of P. aeruginosa Xen 5, E. coli Xen 14, S. typhimurium Xen 26, S.aureus Xen 36
and K. pneumoniae Xen 39 by at least 1.5 log after 36 hours. Reduction in viable cell populations of
up to 1.5 log was achieved by this furanone in mixed-strain cultures.
Nanofibres derived from 5-(2-(2-aminoethoxy)ethoxy)methyl)-2(5H)furanone modified SMA
furanone coated filters achieved up to 1.1 log reductions in populations of P. aeruginosa Xen 5, E. coli
Xen 14, S. typhimurium Xen 26, S. aureus Xen 36 and K.pneumoniae Xen 39 after 30 minutes of
exposure. This furanone also inhibited biofilm formation by strains of P. aeruginosa Xen 5, E. coli
Xen 14, S. typhimurium Xen 26, S. aureus Xen 36 and K. pneumoniae Xen 39 at least 2.5 log after 36
hours and almost the same in mixed-strain cultures (2.4 log inhibition).
Free 4-(2-(2-aminoethoxy)-2,5-dimethyl-3(2H)-furanones recorded reductions of up to 5.5 log in
populations of P. aeruginosa Xen 5 and S. typhimurium Xen 26 after 30 minutes of exposure. Up to
4.5 log reductions were achieved for E. coli Xen 14, S. aureus Xen 36 and K. pneumoniae Xen 39.
The 4-(2-(2-aminoethoxy)-2,5-dimethyl-3(2H)-furanone also inhibited surface colonization by
biofilms of P. aeruginosa Xen 5, E. coli Xen 14, S. typhimurium Xen 26, S. aureus Xen 36 and K.
pneumoniae Xen 39 by almost 3 log after 36 hours. Antibiofouling characterization revealed that the
free 4-(2-(2-aminoethoxy)-2,5-dimethyl-3(2H)-furanone showed higher inhibition efficiency (4.2 log)
compared to free 2,5-dimethyl-4-hydroxy-(3(2H)-furanone and 5-(2-(2-aminoethoxy)ethoxy)methyl)-
2(5H)furanone.
Stellenbosch University http://scholar.sun.ac.za
Chapter 5
145
Nanofibres made from 4-(2-(2-aminoethoxy)-2,5-dimethyl-3(2H)-furanone modified SMA on the
other hand achieved up to 4 log reductions in populations of P. aeruginosa Xen 5, followed by S.
typhimurium Xen 26 which was reduced by up to 3.4 log after 30 minutes of exposure. E. coli Xen 14,
S. aureus Xen 36 and K. pneumoniae Xen 39 were all reduced by at least 2.5 log after 30 minutes of
exposure. These nanofibres also inhibited biofilm formation by up to 3 log over 36 hours of exposure
to the strains. These nanofibres also showed antimicrobial activity of up to 3.75 log after 30 minutes of
exposure to the mixed strain culture.
Stellenbosch University http://scholar.sun.ac.za
Chapter 5
146
5.11 References
1. Rappai J.P.; Raman V.; Unikrishnan P.A.; Pathapan S.; Thomas S.K.; Paulose C.S. Bioorganic
and Medicinal Chemistry Letters 2009, 19, 764-765.
2. Ahmad A.; Ahmad F.; Pichtel J., Microbes and Microbial Technology: Agricultural and
Environmental Applications. Springer New York Dordrecht Heidelberg London, 2011.
3. Nealson K.H.; Eberhard A.; Hastings J.W. Proc Natl Acad Sci USA 1972, 69, 1073-1076.
4. Fuqua C.; Winans S.C. Journal of Bacteriology 1996, 178, 435-440.
5. Fuqua W.C.; Winans S.C.; Greenberg E.P. Journal of Bacteriology 1994, 176, 269-275.
6. Dunne W.M. Jr. Clinical Microbiology Reviews 2002, 15, 155-166.
7. Han Y.; Hou S.; Simon K.A.; Ren D.; Luk Y-Y. Bioorganic and Medicinal Chemistry Letters
2008, 18, 1006-1010.
8. Hall-Stoodley L.; Costerton J.W.; Stoodley P. Nature Reviews: Microbiology 2004, 2, 95-99.
9. Alfaro J.F.; Zhang T.; Wynn D.P.; Karschner E.L.; Zhou Z.S. Organic Letters 2004, 6, 3043.
10. Cheng G.; Zhang Z.; Chen S.; Bryers J.D.; Jiang S. Biomaterials 2007, 28, 4192-4199.
11. Morohoshi T.; Shiono T.; Takidouchi K.; Kato M.; Kato N.; Kato J.; Ikeda T. Applied and
Environmental Microbiology 2007, 73, 6339-6342.
12. Hjelmgaard T.; Persson T.; Rasmussen T.B.; Givskov M.; Nielsen J. Bioorganic and
Medicinal Chemistry Letters 2003, 11, 3261.
13. Ponnusamy K.; Paul D.; Kim Y.S.; Kweon J.H. Brazilian Journal of Microbiology 2010, 41,
227-234.
14. Manefield M.; de Nys R.; Kumar N.; Read R.; Givskov M.; Steinberg P.; Kjelleberg S.
Microbiology 1999, 145, 283-291.
15. Dong Y.H.; Zhang L.H. Journal of Microbiology 2005, 43, 101-109.
16. Mahajan V.A.; Borate H.B.; Wakharkar R.D. Tetrahedron 2006, 62, 1258-1272.
17. Pe´rez A.G.; Olı´as R.; Olı´as J.M.; Sanz C. Journal of Agricultural Food Chemistry 1999, 47,
655-658.
18. Eberl L.; Molin S.; Givskov M. 1999, 181, 1703-1712.
19. Defoirdt T.; Miyamoto C.M.; Wood T.K.; Meighen E.A.; Sorgeloos P.; Verstraete W.; Bossier
P. Environmental Microbiology 2007, 9, 2486-2495.
20. Manefield M.; Harris L.; Rice S.A.; De Nys R.; Kjelleberg S. Applied Environmental
Microbiology 2000, 66, 2079-2084.
21. Hentzer M.; Wu H.; Andersen J.B.; Riedel K.; Rasmussen T.B.; Bagge N.; Kumar N.;
Schembri M.A. EMBO J 2003, 22, 3803-3815.
22. Manefield M.; Rasmussen T.B.; Henzter M.; Andersen J.B.; Steinberg P.; KjellebergS.;
Givskov M. Microbiology 2002, 148, 1119-1127.
23. Ren D.; Sims J.J.; Wood T.K. Environmental Microbiology 2001, 3, 731-736.
Stellenbosch University http://scholar.sun.ac.za
Chapter 5
147
24. de Nys R.; Wright A.D.; Konig G.M.; Sticher O. Tetrahedron 1993, 49, 11213-11220.
25. Givskov M.; de Nys R.; Manefield M.; Gram L.; Maximilien R.; Eberl L.; Molin S.; Steinberg
P.D.; Kejelleberg S. Journal of Bacteriology 1996, 178, 6618-6622.
26. de Nys R.; Steinberg P.; Rogers C.N.; Charlton T.S.; Duncan M.W. Mar. Ecol. Prog. Ser.
1996, 130, 135-146.
27. Rasmussen T.B.; Manefield M.; Andersen J.B.; Eberl L.; Anthoni U.; Christophersen C.;
Steinberg P.; Kejelleberg S.; Givskov M. Microbiology 2000, 146, (3237-3244).
28. Kozminykh V.O.; Igidov N.M.; Kozminykh E.N.; Aliev ZG. Pharmazie 1993, 48, 99-106.
29. Gein V.L.; Gein L.F.; Bezmaternykh E.N.; Voronina E.V. Pharmaceutical Chemistry Journal
2000, 34, 254-256.
30. Baveja J.K.; Willcox M.D.P.; Hume E.B.H.; Kumar N.; Odell R.; Poole-Warren L.A.
Biomaterials 2004, 25, 5003-5012.
31. Khan M.S.; Husain A. Pharmazie 2002, 57, 448-452.
32. Wu H.; Song Z.; Hentzer M.; Andersen J.B.; Molin S.; Givskov M.; Høiby N. Journal of
Antimicrobial Chemotherapy 2004, 53, 1054-1061.
33. Hume E.B.H.; Baveja J.K.; Muirf B.; Schubert T.L.; Kumar N.; Kjelleberg S.; Griesser H.J.;
Thissen H.; Read R.; Poole-Warren L.A.; Schindhelm K.; M.D.P., W. Biomaterials 2004, 25,
5023-5030.
34. Weber V.; Coudert P.; Rubat C.; Duroux E.; Valle´e-Goyet D.; Gardette D.; Bria M.;
Albuisson E.; Leal F.; Gramain J-C.; Couqueleta J.; Madesclaire M. Bioorganic and
Medicinal Chemistry 2002, 10, 1647-1658.
35. Hauck T.; Bru¨hlmann F.; Schwab W. Applied and Environmental Microbiology 2003, 69,
3911-3918.
36. Zschoche S.; David R.; Tavana H.; P¨oschel K.; Petong N.; Dutschk V.; Grundke K.;
Neumannb A.W. Colloids Surf.A 2007, 307, 53-61.
37. Mpitso K. Synthesis and characterization of styrene – maleic anhydride copolymer
derivatives. Stellenbosch University, Stellenbosch, 2009.
38. Pal J.; Singh H.; Ghosh A.K. Journal of Applied Polymer Science 2004, 92, 102-108.
39. S´witala-Zeliazkow M. Polymer Degradation and Stability 2001, 74, 579-584.
40. Sreedhar B.; Sairam M.; Chattopadhyay D.K.; Syamala Rathnam P.A.; Mohan Rao D.V.
Journal of Applied Polymer Science 2005, 96, 1313-1322.
41. Winzer K.; Hardie K.R.; Burgess N.; Doherty N.; Kirke D.; Holden M.T.G.; Linforth R.;
Cornell K.A.; Taylor A.J.; Hill P.J.; Williams P. Microbiology 2002, 148, 909-922.
42. Kozminykh V.O.; Igidov N.M.; Kozminykh E.N.; Semenova Z.N.; Andreichikov YuS.
Pharmazie 1992, 47, 261-263.
43. Sindhu Ramachandran C.V.; Sreekumar P.K. International Journal of Pharmacy and
Pharmaceutical Sciences 2011, 3, 225-228.
Stellenbosch University http://scholar.sun.ac.za
Chapter 6
148
Chapter 6: Conclusions and recommendations
6.1 Introduction
The main objective of this study was to develop nanofibres, with surfaces having the ability to repel
microbial attachment and also inactivate any bacteria which may come into contact with it, i.e. (both
antibacterial (antimicrobial) and anti-biofouling properties) for possible use in filtration media. To
achieve this, the authors focused on modifying existing polymers to introduce antimicrobial properties
in otherwise non-antimicrobial polymers. This was explored in two ways using different polymers.
Firstly, polymer blends with biocides and or bactericidal copper ions were prepared and electrospun to
fabricate nanofibres with antimicrobial properties. Secondly, blending and immobilization of furanone
compounds which inhibit biofilm formation on surfaces was explored. The following sections
summarize the findings of the study and also give recommendations for future studies related to the
same subject.
6.2 Studied nanofibres
In this section, the main conclusions from the different nanofibres investigated in this study are given.
6.2.1 Biocide-doped nanofibres
Solutions of PVA (Mw 146000-186000, 87-89% hydrolyzed) were prepared and doped with
AquaQure which is a biocide containing amongst other metal ions Cu2+
and Zn2+
. These solutions
were then electrospun using the conventional needle spinning technique. The nanofibres were
crosslinked using glyoxal to attain water stability of the nanofibrous mats. Various conditions which
affect nanofibre stability were investigated to obtain optimal conditions for the electrospinning
process. These investigations led to the following conditions: PVA (10 % wt/vol), glyoxa (8%
vol/vol), AquaQure (5% vol/vol), tip-collector distance (15 cm), voltage (10-12 kV), relative humidity
(40-60%) and room temperature.
About 90% of the nanofibres had diameters less than 300 nm and about 70% of the pores were in the
5-50 nm2 range. Successful incorporation of the biocide was confirmed by the existence of the
constituents of AquaQure on surfaces of the nanofibres which was shown by EDX studies.
Crosslinked nanofibrous mats demonstrated good water stability. The addition of the biocide did not
compromise thermal properties of the pristine nanofibres and this was proven by TGA and DSC
studies. This water-insoluble property would give PVA/AquaQure fibres good potential for water
filtration applications. The fibres also demonstrated stability in water and up to about 190% absorption
of water without disintegration even after 48 hours of submersion.
Stellenbosch University http://scholar.sun.ac.za
Chapter 6
149
Antimicrobial tests on the fibres against the Gram-positive strain S. aureus Xen 36 and Gram-negative
strains E. coli Xen 14, S. typhimurium Xen 26, P. aeruginosa Xen 5 and K. pneumoniae Xen 39
showed up to 5 log reductions in bacteria populations when compared with unmodified PVA fibres.
The antimicrobial tests were confirmed with bioluminescent imaging and LIVE/DEAD Baclight
fluorescence imaging. Leaching experiments showed leachate concentrations of less than 1.1x10⁻⁴
µg/ml for all the ions after 24 hours of exposure. When compared to the SANS guidelines for drinking
water, water filtered through these nanofibres met the requirements deeming these nanofibres safe for
water filtration application.
6.2.2 Copper doped nanofibres
The antimicrobial efficacy of the nanofibres obtained from biocide doping of PVA solutions roused
the interest to study the antimicrobial efficiency of metal-ion containing nanofibrous mats. Cu2+
was
chosen because it was the main constituent of the biocide. Poly(styrene-co-maleic anhydride)
copolymer (SMA) and PVA were investigated for their ability to produce antimicrobial nanofibrous
mats via electrospinning of solution blends containing Cu2+
ions. Bubble electrospinning was
evaluated to increase the production scale of nanofibres through the electrospinning process. The
presence of Cu2+
in the nanofibres was confirmed using EDX. Thermogravimetric analysis indicated
that the inclusion of Cu2+
to both PVA/Cu2+
and SMA/Cu2+
nanofibres did not affect the thermal
stability of the nanofibres. Increases in the Tg values from 85°C in pristine PVA nanofibres to about
100°C in the case of PVA/Cu2+
and 150°C (pristine SMA nanofibres) to 170°C for SMA/Cu2+
were
recorded through differential scanning calorimetry.
PVA/Cu nanofibres reduced the populations of P. aeruginosa Xen 5 by up to 5 logs and those of E.
coli Xen 14, S. typhimurium Xen 26, S. aureus Xen 36 and K. pneumoniae Xen 39 by up to 4 logs
after 30 minutes of exposure. SMA/Cu nanofibres on the other hand, achieved high reductions in the
numbers of viable bacteria after 30 minutes of contact. E. coli Xen 14, S. typhimurium Xen 26 and K.
pneumoniae Xen 39 were reduced by more than 5 log and S. aureus Xen 36 by about 3.5 log. Both
PVA/Cu and SMA/Cu demonstrated up to 4 log reduction in pathogen numbers on the mixed strain
cultures. The in vivo images also suggested some metabolic activity (photon emissions) in more cells
than revealed by plate counting, suggesting that some of the strains develop some dormancy on
contact with Cu2+
containing nanofibres. This led to the conclusion that even though Cu2+
exhibits
antimicrobial efficiency, there is a tendency on the bacteria cells to develop some resistance after
contact with it. This could suggest that the presence of the other ions in the biocide prevented any
chances of the bacteria becoming dormant after contact with the nanofibres. The antimicrobial activity
of copper containing PVA and SMA nanofibres was also confirmed through fluorescence microscopy.
Stellenbosch University http://scholar.sun.ac.za
Chapter 6
150
Regeneration results indicated that PVA/Cu2+
had sustained activity over 3 cycles and SMA/Cu2+
nanofibres had sustained antimicrobial activity with gradual minor losses over 6 cycles. SMA/Cu
nanofibres however became brittle and thin after contact with liquid media. This led to the assumption
that the gradual loss of activity could be due to some fibres breaking thus increasing the pores on the
nanofibre mat allowing some bacteria to pass through. From the leaching experiments PVA/Cu and
SMA/Cu nanofibres showed leaching of 1.62 and 1.31 µg/ml of Cu2+
respectively. These figures
deemed the nanofibres environmentally friendly and met the SANS standards for drinking water.
6.2.3 Furanone modified nanofibres
6.2.3.1 PVA/DMHF
Blends of PVA with 2,5 dimethyl-4-hydroxy-3(2H)-furanone were successfully prepared and
electrospun using electrospinning process. The nanofibres obtained had diameters between 150-300
nm and pore sizes of less than 100 nm2. The introduction of the furanone moiety on the nanofibres was
revealed by ATR-FTIR. Thermal degradation and X-ray diffraction studies indicated that there was
no significant difference in the degradation patterns of PVA and PVA/DMHF nanofibres.
The furanone compound (2,5 dimethyl-4-hydroxy-3(2H)-furanone) in its free form demonstrated up to
4 log reductions in populations of S. aureus Xen 36 cells and about 2 log reductions on cells of P.
aeruginosa Xen 5, E. coli Xen 14, S. typhimurium Xen 26, and K. pneumoniae Xen 39 after 30
minutes. This furanone also inhibited biofilm formation by up to 5 log over 36 hours of exposure. It
also demonstrated good antimicrobial efficiency on mixed-strain cultures of Pseudomonas aeruginosa
Xen 5, E. coli Xen 14, S. aureus Xen 36, S. typhimurium Xen 26 and K. pneumoniae Xen 39.
PVA/DMHF nanofibres on the other hand achieved up to 3.5 log reductions in populations of P.
aeruginosa Xen 5 and E. coli Xen 14 cells and about 2.2 log reductions on S.aureus Xen 36, cells of S.
typhimurium Xen 26, and K. pneumoniae Xen 39 after 30 minutes. These nanofibres also inhibited
biofilm formation of all the strains by up to 2.5 log after 36 hours. PVA/DMHF nanofibres also
achieved up to 4 log microbial population reductions on mixed strain cultures over 30 minutes of
exposure.
6.2.3.2 SMA-Furanone
Synthesis of 5-(2-(2-aminoethoxy)ethoxy)methyl)-2(5H)furanone and 4-(2-(2-aminoethoxy)-2,5-
dimethyl-3(2H)-furanone from 2,5 dimethyl-4-hydroxy-3(2H)-furanone was successful. Their
structures and molar masses were confirmed using 1H NMR and ES mass spectroscopy. These
furanone compounds were successfully immobilized onto SMA copolymer backbone. The furanone
modified SMA was electrospun to obtain nanofibres. SMA copolymers modified with 5-(2-(2-
aminoethoxy)ethoxy)methyl)-2(5H)furanone and 4-(2-(2-aminoethoxy)-2,5-dimethyl-3(2H)-furanone
Stellenbosch University http://scholar.sun.ac.za
Chapter 6
151
demonstrated a major weight loss in the temperature range between 250-300°C which was not shown
by pristine SMA nanofibres. This indicated that the modification of SMA with furanone compounds
decreased the thermal stability of SMA nanofibres. Differential scanning calorimetry of SMA
copolymers modified with 5-(2-(2-aminoethoxy)ethoxy)methyl)-2(5H)furanone demonstrated
structural changes from the zig-zag structure of SMA to a more planar structure. The 4-(2-(2-
aminoethoxy)-2,5-dimethyl-3(2H)-furanone modified SMA on the other hand had a higher glass
transition temperature of about 170°C compared to the 140°C shown by pristine SMA.
Free 5-(2-(2-aminoethoxy)ethoxy)methyl)-2(5H)furanone achieved up to 2 log reductions in
populations of P. aeruginosa Xen 5, E. coli Xen 14, S. typhimurium Xen 26, S. aureus Xen 36 and K.
pneumoniae Xen 39 after 30 minutes of exposure. This furanone compound also inhibited biofilm
formation by strains of P. aeruginosa Xen 5, E. coli Xen 14, S. typhimurium Xen 26, S.aureus Xen 36
and K. pneumoniae Xen 39 by at least 1.5 log after 36 hours. Reduction in viable cell populations of
up to 1.5 log was achieved by this furanone in mixed-strain cultures. Nanofibres derived from 5-(2-(2-
aminoethoxy)ethoxy)methyl)-2(5H)furanone modified SMA furanone coated filters achieved up to 1.1
log reductions in populations of P. aeruginosa Xen 5, E.coli Xen 14, S. typhimurium Xen 26, S.
aureus Xen 36 and K. pneumoniae Xen 39 after 30 minutes of exposure. These nanofibres also
inhibited biofilm formation by strains of P. aeruginosa Xen 5, E. coli Xen 14, S. typhimurium Xen 26,
S. aureus Xen 36 and K. pneumoniae Xen 39 at least 2.5 log after 36 hours and almost the same in
mixed-strain cultures (2.4 log inhibition).
Free 4-(2-(2-aminoethoxy)-2,5-dimethyl-3(2H)-furanone recorded reductions of up to 5.5 log in
populations of P. aeruginosa Xen 5 and S. typhimurium Xen 26 after 30 minutes of exposure. Up to
4.5 log reductions were achieved for Escherichia coli Xen 14, S. aureus Xen 36 and K.pneumoniae
Xen 39. This furanone also inhibited surface colonization by biofilms of P. aeruginosa Xen 5, E. coli
Xen 14, S. typhimurium Xen 26, S. aureus Xen 36 and K. pneumoniae Xen 39 by almost 3 log after 36
hours. Antibiofouling characterization revealed that the free 4-(2-(2-aminoethoxy)-2,5-dimethyl-
3(2H)-furanone showed higher inhibition efficiency (4.2 log) compared to free 2,5-dimethyl-4-
hydroxy-(3(2H)-furanone and 5-(2-(2-aminoethoxy)ethoxy)methyl)-2(5H)furanone. Nanofibres made
from 4-(2-(2-aminoethoxy)-2,5-dimethyl-3(2H)-furanone modified SMA on the other hand achieved
up to 4 log reductions in populations of P. aeruginosa Xen 5, followed by S.typhimurium Xen 26
which was reduced by up to 3.4 log after 30 minutes of exposure. Escherichia coli Xen 14, S. aureus
Xen 36 and K. pneumoniae Xen 39 were all reduced by at least 2.5 log after 30 minutes of exposure.
These nanofibres also inhibited biofilm formation by up to 3 log over 36 hours of exposure to the
strains. These nanofibres also showed antimicrobial activity of up to 3.75 log after 30 minutes of
exposure to the mixed strain culture.
Stellenbosch University http://scholar.sun.ac.za
Chapter 6
152
6.3 Concluding remarks
The findings from this study suggest that the main objective of this study which was to fabricate
nanofibres with both antibiofouling and antimicrobial properties was met. Further investigations on
the mechanical properties of the nanofibres and possible reduction in the amount of leached metal ions
would be recommended for future studies especially with the drinking water filtration applications in
mind.
Biocide-doped nanofibres reduced bacteria populations of all the tested strains to levels acceptable in
drinking water. Copper-doped nanofibres indicated excellent antimicrobial properties when the plate
counting technique was employed. Bioluminescence imaging, which quantifies all metabolically
active cells (even those which are unculturable), indicated a tendency of the bacteria to enter a stage of
dormancy on contact with Cu2+
functionalized nanofibres. Biocide-doped and Cu2+
containing
nanofibres did not show any tendency to inhibit biofilm attachment on surfaces but demonstrated good
antimicrobial properties.
Nanofibrous mats emanating from PVA and SMA modified with furanone compounds demonstrated
promising results for water treatment applications. These nanofibres demonstrated their potential to
not only inactivate (kill) bacteria which come into contact with it, but also repel (inhibit) surface
attachment of the strains. Furanone compounds with the core 3(2H)-furanone structure demonstrated
high activity compared to the 2(5H)-furanone structure.
6.4 Recommendations
Recommendations for further studies include:
Synthesis of more furanone compounds with the 3(2H) structure.
Immobilization of the furanone compounds on other polymers like polyacrylonitrile and
cellulose acetate which are already used in the water purification industry.
DNA sequence studies on the specific quorum sensing pathways of the synthesized furanone
compounds.
Post electrospinning functionalization of the nanofibres.
Improvements on mechanical properties of SMA e.g.co-axial electrospinning with nylon.
Stellenbosch University http://scholar.sun.ac.za
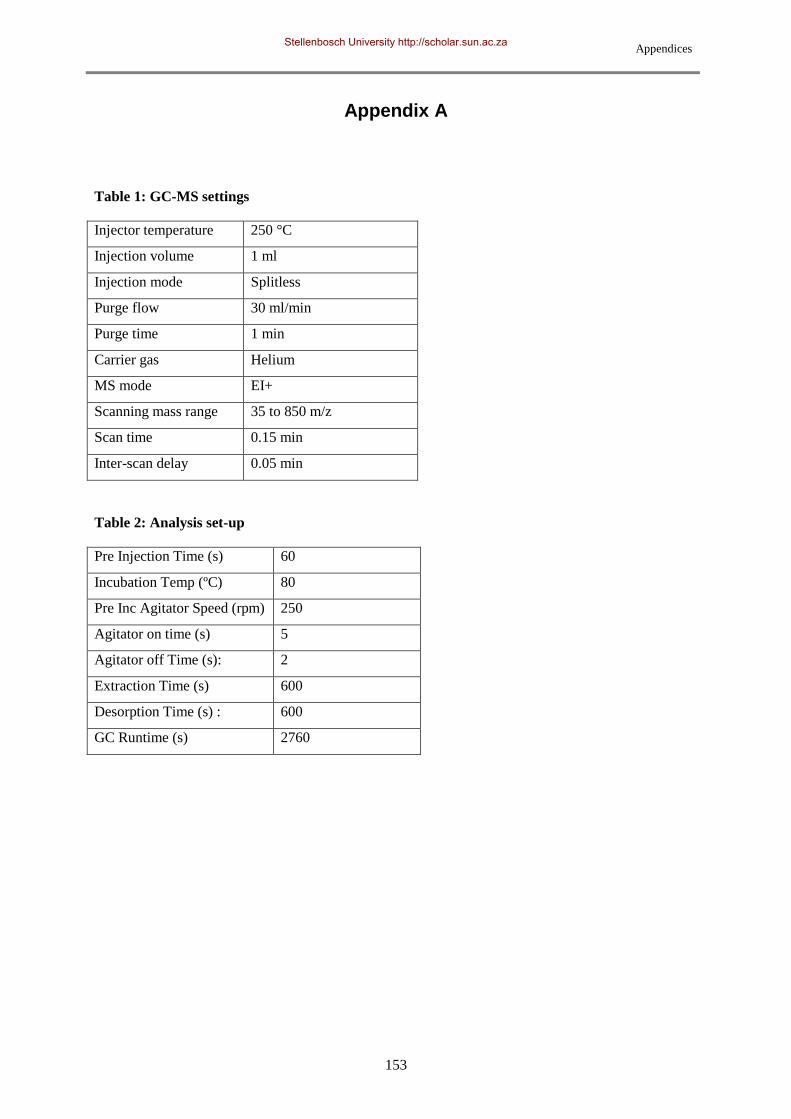
Appendices
153
Appendix A
Table 1: GC-MS settings
Injector temperature 250 °C
Injection volume 1 ml
Injection mode Splitless
Purge flow 30 ml/min
Purge time 1 min
Carrier gas Helium
MS mode EI+
Scanning mass range 35 to 850 m/z
Scan time 0.15 min
Inter-scan delay 0.05 min
Table 2: Analysis set-up
Pre Injection Time (s) 60
Incubation Temp (ºC) 80
Pre Inc Agitator Speed (rpm) 250
Agitator on time (s) 5
Agitator off Time (s): 2
Extraction Time (s) 600
Desorption Time (s) : 600
GC Runtime (s) 2760
Stellenbosch University http://scholar.sun.ac.za


