Embed Size (px)
Citation preview
NANOCOMPOSITE SORBENTS AND ELECTROSPUN NANOFIBRES FOR
THE REMOVAL OF METALS, ORGANICS AND BACTERIA FROM
WATER
Report
to the Water Research Commission
by
JC Ngila1, RM Nthumbi1, M Onditi1, AA Adelodun1, PN Nomngongo1, SM Musyoka1, TG Barnard2 and HK Okoro1
1Department of Applied Chemistry 2Water and Health Research Centre
University of Johannesburg, South Africa
Report No. 2365/1/20 ISBN 978-0-6392-0185-6
August 2020
Obtainable from: Water Research Commission Private Bag X03 Gezina, 0031 South Africa [email protected] or download from www.wrc.org.za This report emanates from the Water Research Commission project K5/2365//3, entitled: Functionalised electrospun fibres containing immobilised nanoparticles in nanocomposite sorbents or the removal of metals, organic pollutants and bacteria from surface water.
DISCLAIMER
This report has been reviewed by the Water Research Commission (WRC) and approved for
publication. Approval does not signify that the contents necessarily reflect the views and policies of the WRC, nor does mention of trade names or commercial products constitute endorsement or
recommendation for use.
Nanocomposite sorbents and electrospun nanofibres
iii
EXECUTIVE SUMMARY Water for domestic use comes from rivers, dams and lakes in natural form. The water usually contains pollutants such as inorganic matter, organic matter and microorganisms. Some of these pollutants may occur at levels beyond the acceptable limits of water quality standards. In addition, the treated effluents are usually discharged into natural water systems, adding to the high levels of contaminants. Methods for effective water treatment are therefore required. This project thus focused on the development of adsorbents for the treatment of water, mainly surface water and treated effluents that are ultimately discharged into the natural water bodies.
The aims of the study were as follows:
• Synthesise and characterise intercalated metal oxide support for catalysts and loading; anchor and immobilise photocatalytic nanoparticles on the intercalated metal oxide support
• Functionalise and modify the inert polymer backbone by grafting and anchoring nanoparticles or catalysts
• Design and prepare a nanocomposite filter material that has a hydrodechlorination temperature at ambient conditions
• Fabricate a multi-layered filter via layer-by-layer electrospinning and cast solutions of the catalyst-anchored composites
• Electrospin nanofilters, cast membranes and test the performance of nanocomposite material in the removal of bacteria and degradation or removal of organic matter from a model solution as the main focus
• Test the materials to establish their capability for removing heavy metals; and investigate if the nanoparticles leach out of the nanocomposite materials so as to revise the immobilisation strategies
• Apply the filters in different surface water systems and water supplies
• Conduct filter regeneration studies to investigate the re-usability of the nanofibre or nanocomposite materials.
The methodologies adopted involved synthesysing nanoparticles, electrospinning nanofibres, immobilising the nanoparticles on nanofibres, and conducting adsorption studies for the removal of the different types of pollutants (inorganic matter, organic matter and microbes). The techniques used to characterise the synthesised nanocatalysts, electrospun nanofibres and nanocomposites, and the quantitative determination of inorganic, organic and microbial pollutants, include the following:
• Scanning electron microscopy (SEM) or transmission electron microscopy (TEM) to determine the surface morphology and internal structure of the nanocomposites, as well as the dimensions of the synthesised nanoparticles and nanofibres
• Fourier transform infrared spectroscopy to characterise the functional groups incorporated in the polymers and nanocomposites
• Nitrogen physisorption at 77 K with Brunauer-Emmett-Teller (BET) techniques to determine the surface area, pore sizes and pore volumes of the fibres, as well as the nanocatalysts
Nanocomposite sorbents and electrospun nanofibres
iv
• X-ray diffraction to determine the different phases and crystallinity of the nanocatalysts and composites
• Energy-dispersive X-ray (EDX) spectroscopic techniques to characterise and analyse elements in the catalyst and composite
• Thermogravimetric analysis (TGA) to assess the thermal stability and decomposition of the composite
• Inductively coupled plasma-optical emission spectrometry (ICP-OES) to determine the concentrations of elements and metals
• Gas chromatography mass spectrometry (GC-MS) to analyse organic compounds
• Microbial analysis to determine the bactericidal effect of nanoparticles on gram-negative or gram-positive bacteria, using agar plates
The discussion in this report is presented according to the type of nanocatalyst support used in the development of a multi-layered filter fabricated by electrospinning and the casting of nanocomposites using metal oxide catalysts, and organic and natural polymers functionalised with nanoparticles. The nanocatalysts contained metals or metal oxides such as iron (Fe), silver (Ag), ferric oxide (Fe2O3), magnesium oxide (MgO), titanium dioxide (TiO2), silicon dioxide (SiO2) and boehmite aluminium hydroxide (AlOOH). The organic polymers investigated as support include polyvinylidene fluoride (PVDF), polyacrylonitrile (PAN), polyacrylic acid (PAA) and polyvinyl alcohol (PVA), whereas the natural polymers studied were hemicellulose and pectin, both extracted from the cactus plant. The nanosorbents contain either nanoparticles or just nanofibres obtained through electrospinning. The polymer materials and nanomaterial support include the following:
• Magnesium-aluminium oxide (MgAlO) support for iron-palladium (Fe-Pd) nanoparticles used for the dechlorination of chlorpyrifos and dieldrin in water.
• Composite of PVDF and PAN grafted to PAA (PAN/PVDF-g-PAA) as support for Ag, TiO2 and Fe-Pd nanoparticles where the nanocomposite was used for the dechlorination and photodegradation of pesticides such as dieldrin, diuron, chlorpyrifos and fipronil. The support material without immobilised nanoparticles was also used for the removal of toxic trace metals, namely lead (Pb2+) and cadmium (Cd2+) ions.
• Polyacrylic acid grafted to mesoporous silica (MS) as inert support (MS-g-PAA) for Fe-Pd nanoparticles.
The performance of the nanocomposite was evaluated by the dechlorination of a mixture of dieldrin, chlorpyrifos, diuron and fipronil pesticide compounds. The performance characteristics of sorbents, such as fouling, metal catalyst leaching, catalyst thermal stability and type of degradation products were investigated. The fabricated nanocomposite materials were applied for the removal of water pollutants. The water pollutants include metals, pesticides, dyes and microbes.
The highlights from this study can be summarised as follows:
• Synthesis of MgAlO, PAN/PVDF-g-PAA, and MS-g-PAA as inert supports and Fe-Pd, TiO2 and Ag as catalytic nanoparticles and their subsequent anchoring or immobilisation and dispersal was achieved. In addition, the research further showed the anchoring sites on the inert support matrix, including the nanoparticle size distributions using TEM micrographs.
Nanocomposite sorbents and electrospun nanofibres
v
• Simultaneous dechlorination and catalytic photodegradation of mixed pesticides (diuron, fipronil dieldrin and chlorpyrifos) and their mineralisation to 99% in a one-step process. Mineralisation was evidenced by the transformation products where carbon dioxide (CO2) and ammonia (NH3) formed. In addition, the sequestration of any leaching metal by the PAN/PVDF-g-PAA has been addressed. This is supported by kinetic and adsorption thermodynamic data, confirming a one-step process. This is not only novel, but adds to the body of new knowledge.
• Using simultaneous dechlorination and catalytic photodegradation, the researchers were able to degrade pesticides (diuron, fipronil dieldrin and chlorpyrifos) to mineralise them to 99%. Furthermore, they demonstrated the kinetics and suggested a reaction pathway. This study shows a reaction pathway that is equally supported by literature. This explains why reductive dechlorination may take place at ambient temperature, while hydrodechlorination would require a temperature of about 400 °C.
• Two polysaccharides, pectin and hemicellulose sugar monomers, were successfully isolated from cactus pads. Both polysaccharide extracts were applied in water treatment in powdered form, as well as in nanofibres. The constituents of the polysaccharide extract (rich in hemicellulose) were used as adsorbents to remove Pb2+ and Cd2+ from water. The maximum adsorption capacities of polysaccharides for the removal of Pb2+ and Cd2+ as 256 and 151 mg/ℓ, respectively, were obtained. These values are relatively high compared to the literature report on natural biosorbents.
• The capability of the hemicellulose/pectin nanofibres to remove natural organic matter fractions from wastewater was carried out. Using relatively novel technologies, namely liquid chromatography organic carbon detection (LC-OCD) and fluorescence excitation and emission matrices (FEEM), together with modelling, the distributions of natural organic matter in the raw water and after filtration were assessed. Silver nanoparticles immobilised on nanofibres were applied to remove bacteria from raw wastewater. The silver nanocatalyst polymer composites obtained in this study showed antibacterial properties towards gram-positive and gram-negative bacteria.
The novelty and new knowledge in this study is in the simultaneous one-step process of dechlorination and catalytic photodegradation, which was non-selective to the compounds in the sample. The mineralisation was also evidenced by some of the transformation products identified by the gas chromatography x gas chromatography time-of flight mass spectrometry (GC-TOF-MS) analysis. The costly post-treatment processes and filtration associated with the use of powdered nanocatalysts, such as TiO2 powder, can be eliminated. In addition, any metal ions leaching from the system can be trapped by the carboxylate brush in the PAN/PVDF-g-PAA. This can be achieved in one step as shown and supported by the thermodynamic parameters discussed.
Nanocomposite sorbents and electrospun nanofibres
vi
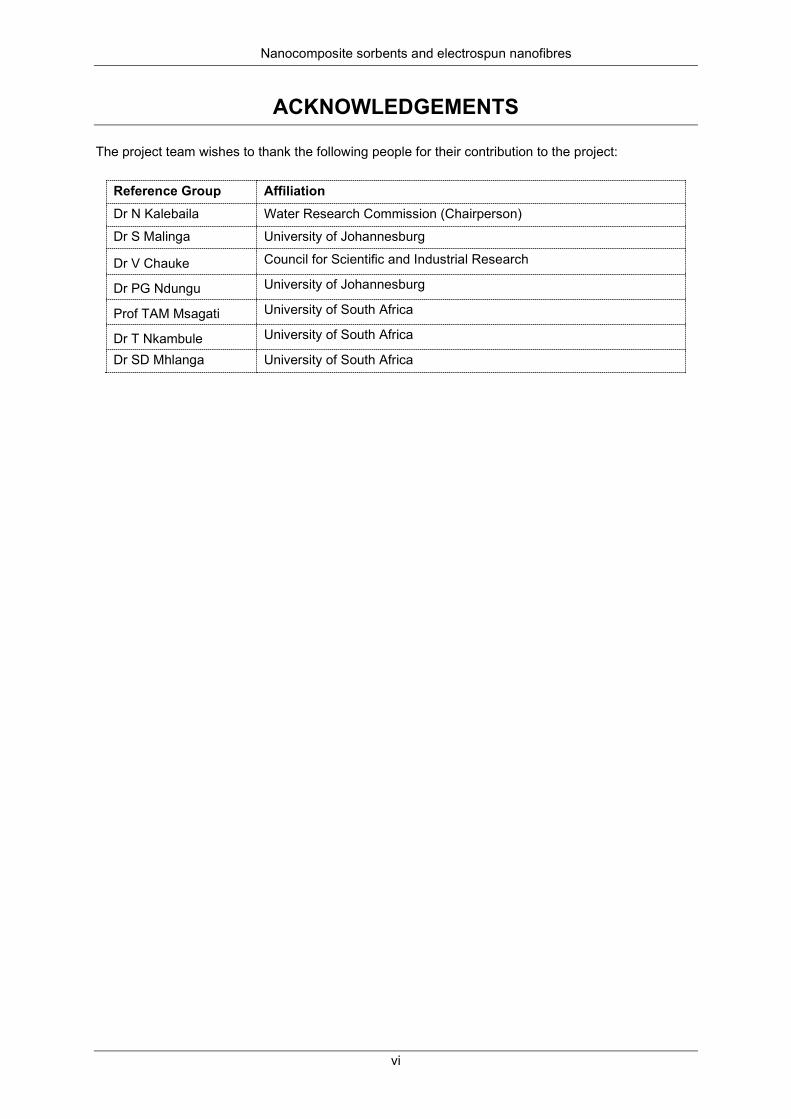
ACKNOWLEDGEMENTS The project team wishes to thank the following people for their contribution to the project:
Reference Group Affiliation Dr N Kalebaila Water Research Commission (Chairperson)
Dr S Malinga University of Johannesburg
Dr V Chauke Council for Scientific and Industrial Research
Dr PG Ndungu University of Johannesburg
Prof TAM Msagati University of South Africa
Dr T Nkambule University of South Africa
Dr SD Mhlanga University of South Africa
Nanocomposite sorbents and electrospun nanofibres
vii
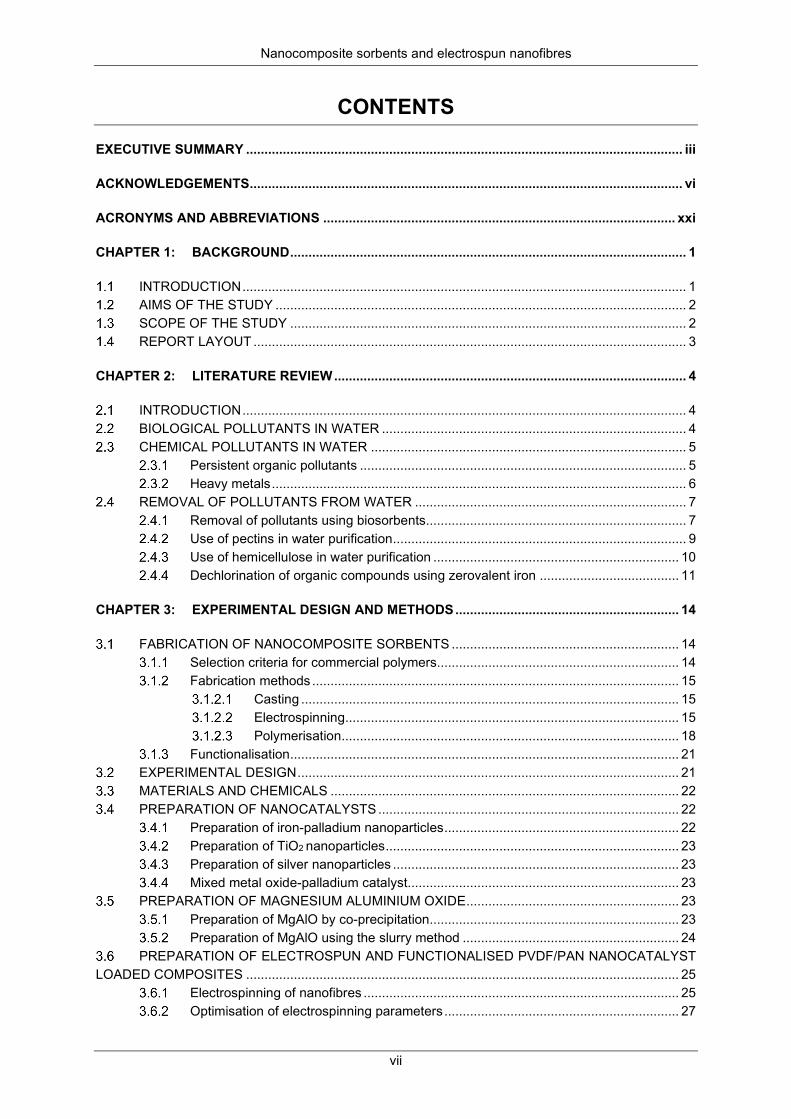
CONTENTS
EXECUTIVE SUMMARY ....................................................................................................................... iii
ACKNOWLEDGEMENTS ...................................................................................................................... vi
ACRONYMS AND ABBREVIATIONS ................................................................................................ xxi
CHAPTER 1: BACKGROUND ............................................................................................................ 1
INTRODUCTION ......................................................................................................................... 1 AIMS OF THE STUDY ................................................................................................................ 2 SCOPE OF THE STUDY ............................................................................................................ 2 REPORT LAYOUT ...................................................................................................................... 3
CHAPTER 2: LITERATURE REVIEW ................................................................................................ 4
INTRODUCTION ......................................................................................................................... 4 BIOLOGICAL POLLUTANTS IN WATER ................................................................................... 4 CHEMICAL POLLUTANTS IN WATER ...................................................................................... 5
Persistent organic pollutants ......................................................................................... 5 Heavy metals ................................................................................................................. 6
REMOVAL OF POLLUTANTS FROM WATER .......................................................................... 7 Removal of pollutants using biosorbents....................................................................... 7 Use of pectins in water purification ................................................................................ 9 Use of hemicellulose in water purification ................................................................... 10 Dechlorination of organic compounds using zerovalent iron ...................................... 11
CHAPTER 3: EXPERIMENTAL DESIGN AND METHODS ............................................................. 14
FABRICATION OF NANOCOMPOSITE SORBENTS .............................................................. 14 Selection criteria for commercial polymers.................................................................. 14 Fabrication methods .................................................................................................... 15
Casting ....................................................................................................... 15 Electrospinning........................................................................................... 15 Polymerisation............................................................................................ 18
Functionalisation .......................................................................................................... 21 EXPERIMENTAL DESIGN ........................................................................................................ 21 MATERIALS AND CHEMICALS ............................................................................................... 22 PREPARATION OF NANOCATALYSTS .................................................................................. 22
Preparation of iron-palladium nanoparticles ................................................................ 22 Preparation of TiO2 nanoparticles ................................................................................ 23 Preparation of silver nanoparticles .............................................................................. 23 Mixed metal oxide-palladium catalyst.......................................................................... 23
PREPARATION OF MAGNESIUM ALUMINIUM OXIDE .......................................................... 23 Preparation of MgAlO by co-precipitation.................................................................... 23 Preparation of MgAlO using the slurry method ........................................................... 24
PREPARATION OF ELECTROSPUN AND FUNCTIONALISED PVDF/PAN NANOCATALYST LOADED COMPOSITES ...................................................................................................................... 25
Electrospinning of nanofibres ...................................................................................... 25 Optimisation of electrospinning parameters ................................................................ 27
Nanocomposite sorbents and electrospun nanofibres
viii
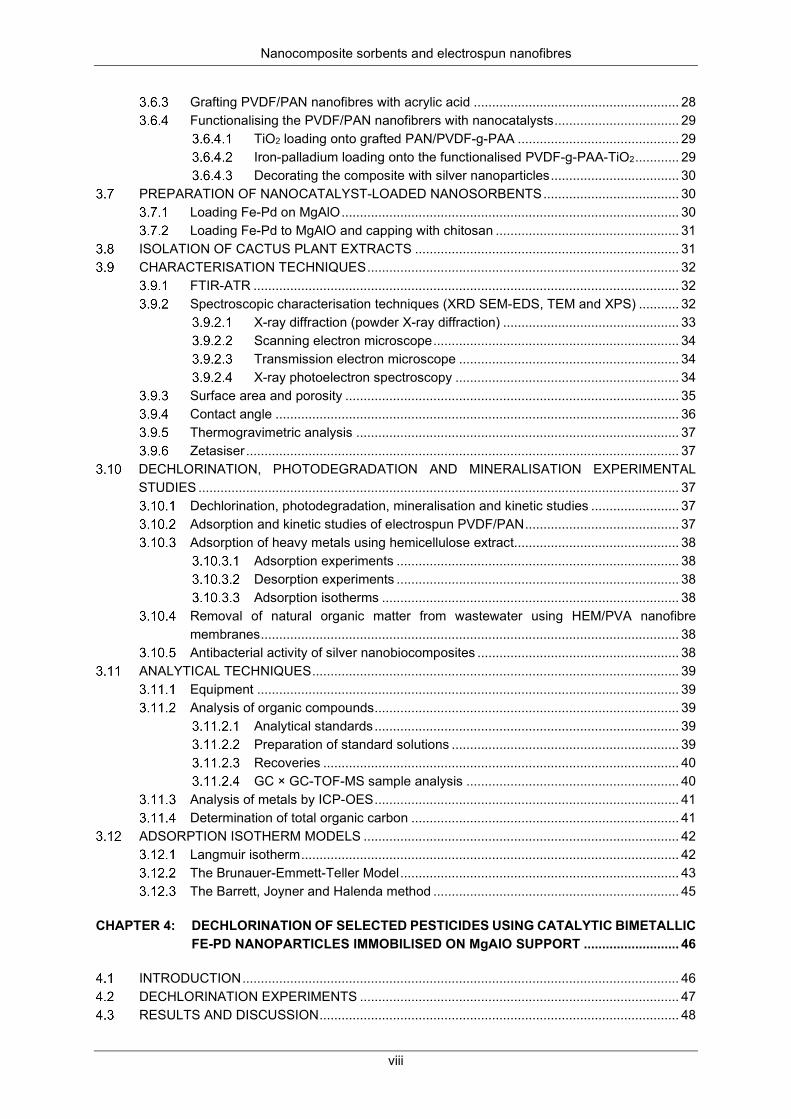
Grafting PVDF/PAN nanofibres with acrylic acid ........................................................ 28 Functionalising the PVDF/PAN nanofibrers with nanocatalysts .................................. 29
TiO2 loading onto grafted PAN/PVDF-g-PAA ............................................ 29 Iron-palladium loading onto the functionalised PVDF-g-PAA-TiO2 ............ 29 Decorating the composite with silver nanoparticles ................................... 30
PREPARATION OF NANOCATALYST-LOADED NANOSORBENTS ..................................... 30 Loading Fe-Pd on MgAlO ............................................................................................ 30 Loading Fe-Pd to MgAlO and capping with chitosan .................................................. 31
ISOLATION OF CACTUS PLANT EXTRACTS ........................................................................ 31 CHARACTERISATION TECHNIQUES ..................................................................................... 32
FTIR-ATR .................................................................................................................... 32 Spectroscopic characterisation techniques (XRD SEM-EDS, TEM and XPS) ........... 32
X-ray diffraction (powder X-ray diffraction) ................................................ 33 Scanning electron microscope ................................................................... 34 Transmission electron microscope ............................................................ 34 X-ray photoelectron spectroscopy ............................................................. 34
Surface area and porosity ........................................................................................... 35 Contact angle .............................................................................................................. 36 Thermogravimetric analysis ........................................................................................ 37 Zetasiser ...................................................................................................................... 37
DECHLORINATION, PHOTODEGRADATION AND MINERALISATION EXPERIMENTAL STUDIES ................................................................................................................................... 37
Dechlorination, photodegradation, mineralisation and kinetic studies ........................ 37 Adsorption and kinetic studies of electrospun PVDF/PAN .......................................... 37 Adsorption of heavy metals using hemicellulose extract............................................. 38
Adsorption experiments ............................................................................. 38 Desorption experiments ............................................................................. 38 Adsorption isotherms ................................................................................. 38
Removal of natural organic matter from wastewater using HEM/PVA nanofibre membranes .................................................................................................................. 38
Antibacterial activity of silver nanobiocomposites ....................................................... 38 ANALYTICAL TECHNIQUES .................................................................................................... 39
Equipment ................................................................................................................... 39 Analysis of organic compounds ................................................................................... 39
Analytical standards ................................................................................... 39 Preparation of standard solutions .............................................................. 39 Recoveries ................................................................................................. 40 GC × GC-TOF-MS sample analysis .......................................................... 40
Analysis of metals by ICP-OES ................................................................................... 41 Determination of total organic carbon ......................................................................... 41
ADSORPTION ISOTHERM MODELS ...................................................................................... 42 Langmuir isotherm ....................................................................................................... 42 The Brunauer-Emmett-Teller Model ............................................................................ 43 The Barrett, Joyner and Halenda method ................................................................... 45
CHAPTER 4: DECHLORINATION OF SELECTED PESTICIDES USING CATALYTIC BIMETALLIC FE-PD NANOPARTICLES IMMOBILISED ON MgAlO SUPPORT .......................... 46
INTRODUCTION ....................................................................................................................... 46 DECHLORINATION EXPERIMENTS ....................................................................................... 47 RESULTS AND DISCUSSION .................................................................................................. 48
Nanocomposite sorbents and electrospun nanofibres
ix
Loading of Fe-Pd on MgAlO support ........................................................................... 48 Leaching studies .......................................................................................................... 49 Characterisation studies .............................................................................................. 50
Nitrogen physisorption at 77 K ................................................................... 50 X-ray diffraction analysis ............................................................................ 50 SEM and EDS analysis .............................................................................. 53 TEM analysis .............................................................................................. 56 Particle size distribution ............................................................................. 62 A TGA decomposition profile for sample P3 (Mg6Al2(CO3)(OH)16.4H2O) . 63 The FTIR spectra for the calcination of P2*, P3*and P4*
(Mg6Al2(CO3)(OH)16.4H2O to form P2c, P3c and P4c (i.e MgAlO) ............................. 64 Dechlorination studies ................................................................................................. 65
Optimisation studies ................................................................................... 65 Kinetics of chlorpyrifos dechlorination ....................................................... 66 Kinetics of dieldrin dechlorination .............................................................. 69 Kinetic parameters and mechanisms for chlorpyrifos and dieldrin
dechlorination .............................................................................................................. 71 Activation energy........................................................................................ 73 Recoveries ................................................................................................. 75
Mineralisation and transformation products during dechlorination .............................. 75 SUMMARY ................................................................................................................................ 76
CHAPTER 5: ELECTROSPUN AND FUNCTIONALISED PVDF/PAN NANOCATALYST-LOADED COMPOSITE FOR THE DECHLORINATION AND PHOTODEGRADATION OF PESTICIDES ............................................................................................................... 78
INTRODUCTION ....................................................................................................................... 78 SYNTHESIS AND CHARACTERISATION ............................................................................... 81 RESULTS AND DISCUSSION .................................................................................................. 81
Electrospinning ............................................................................................................ 81 Optimisation of low molecular weight wt % (100,000 Da by GPC) ............ 81 Optimisation of high molecular weight wt % (534,000 Da by GPC) .......... 84 Optimisation of needle bore size ................................................................ 87 Optimisation of flow rate ............................................................................ 87 Optimisation of electric field strength (kV cm-1) ......................................... 89 Electrospinning layer by layer .................................................................... 91
The XRD analysis for calcined TiO2 nanofibres .......................................................... 92 The FTIR spectra ......................................................................................................... 93 A TEM analysis ............................................................................................................ 94 X-ray photoelectron spectroscopy analysis ................................................................. 94
X-ray photoelectron spectroscopy chemical analysis .............................. 100 Density function theory calculations......................................................... 101
Nitrogen sorption at 77 K ........................................................................................... 102 Graft density .............................................................................................................. 102 Dechlorination of pesticides ...................................................................................... 103 Simulated photocatalytic degradation of pesticides .................................................. 104
Recombination ......................................................................................... 105 Formation of hydroxyl radicals from H2O and photo-generated holes ..... 105 Formation of superoxide radicals ............................................................. 106 Oxidation of pollutants ............................................................................. 106 Mechanism of photocatalysis by TiO2/PAN-doped PVDF ....................... 106
Nanocomposite sorbents and electrospun nanofibres
x
Limitations of using TiO2 in powder form and countermeasures ............. 106 Transformation products .......................................................................... 107
SUMMARY .............................................................................................................................. 112
CHAPTER 6: DECHLORINATION OF MIXED PESTICIDES IN CONTAMINATED WATER USING IRON-PALLADIUM NANOPARTICLES IMMOBILISED ON FUNCTIONALISED MESOPOROUS SILICA ........................................................................................... 113
INTRODUCTION ..................................................................................................................... 113 SYNTHESIS AND CHARACTERISATION STUDIES ............................................................. 115
MS-g-PAA/Fe-Pd: synthesis, grafting with acrylic acid, and anchoring Fe-Pd ......... 115 Loading iron and palladium onto acrylic acid-grafted mesoporous silica .................. 116
RESULTS AND DISCUSSION ................................................................................................ 116 Characterisation studies ............................................................................................ 116
Analysis of loading of iron and palladium on mesoporous silica and MS-g-PAA 116
Leaching of iron and palladium from Fe-Pd/MS-g-PAA ........................... 116 Brunauer-Emmett-Teller surface area and porosity ................................. 117
6.3.1.4 119 TEM analysis ............................................................................................................ 119
An XRD analysis of unmodified silica and MS-g-PAA/Fe-Pd .................. 122 An FTIR analysis ...................................................................................... 123
Pesticides dichlorination studies ............................................................................... 125 Analysis of pesticides using GC × GC-TOF-MS ...................................... 125 Dechlorination kinetics ............................................................................. 125 Transformation products .......................................................................... 128 Mineralisation ........................................................................................... 129
SUMMARY .............................................................................................................................. 130
CHAPTER 7: ELECTROSPUN AND FUNCTIONALISED PVDF/PAN COMPOSITES FOR THE REMOVAL OF TRACE METALS ............................................................................ 131
INTRODUCTION ..................................................................................................................... 131 SYNTHESIS AND CHARACTERISATION STUDIES ............................................................. 132 METAL ADSORPTION EXPERIMENTS ................................................................................. 132
Experimental setup .................................................................................................... 132 Batch adsorption of target trace metals .................................................................... 133 Determination of adsorption optimum pH .................................................................. 134 Effect of contact time and concentration ................................................................... 134 Effect of temperature on adsorption .......................................................................... 134 Adsorption properties ................................................................................................ 134
RESULTS AND DISCUSSION ................................................................................................ 135 Characterisation of nanofibres .................................................................................. 135
SEM imaging ............................................................................................ 135 The FTIR result of grafted PVDF/PAN-g-PAA ......................................... 135 Textural and porosity analysis ................................................................. 137 Contact angle ........................................................................................... 137
Metal adsorption studies ........................................................................................... 138 Removal, regeneration and re-use .......................................................... 138 Effect of pH on adsorption ....................................................................... 140 The effect of contact time on adsorption .................................................. 141
Nanocomposite sorbents and electrospun nanofibres
xi
The effect of temperature on adsorption .................................................. 141 The effect of concentration on adsorption ................................................ 143
Metal adsorption modelling ....................................................................................... 144 Isotherm study.......................................................................................... 144 Kinetics study ........................................................................................... 146 Adsorption thermodynamics .................................................................... 149
Application to real water samples .............................................................................. 151 Flow (dynamic) adsorption and application in real water samples .......... 151 Removal efficiency and recovery efficiency ............................................. 151
Proposed design for a water purification system using nanocomposites ................. 152 SUMMARY .............................................................................................................................. 152
CHAPTER 8: REMOVAL OF LEAD AND CADMIUM FROM DRINKING WATER USING POLYSACCHARIDE EXTRACT ISOLATED FROM CACTUS PADS .................... 154
INTRODUCTION ..................................................................................................................... 154 PREPARATION AND CHARACTERISATION OF THE POLYSACCHARIDE EXTRACT ..... 155
Preparation ................................................................................................................ 155 Characterisation methods ......................................................................................... 155
Determination of pHpzc ............................................................................. 155 Specific surface area and porosity analysis ............................................. 155 Determination of moisture content ........................................................... 155 Ash and volatile solids ............................................................................. 156 Solubility studies of the hemicellulose extract in water ............................ 156
METAL UPTAKE EXPERIMENTS .......................................................................................... 156 Determination of adsorption capacity ........................................................................ 156 Effect of the initial pH of the solution on the metal ion uptake .................................. 157 The effect of dosage on the sorption process ........................................................... 157 The effect of contact time on the sorption process ................................................... 157 The effect of initial metal concentration on adsorption of metal ions ........................ 157 Adsorption isotherm study ......................................................................................... 157 Desorption studies ..................................................................................................... 158
RESULTS AND DISCUSSIONS ............................................................................................. 158 Characterisation ........................................................................................................ 158
The pHpzc property of the polysaccharide extract .................................... 158 Textural analysis ...................................................................................... 159 Proximate properties of the sorbent ......................................................... 159 Solubility studies of the polysaccharide extract in water ......................... 160
Metal uptake studies.................................................................................................. 160 The pH variation ....................................................................................... 160 The effect of dosage ................................................................................ 161 The effect of contact time on adsorption .................................................. 161 The effect of initial metal ion concentration on adsorption ...................... 162 Adsorption isotherm studies ..................................................................... 163
Desorption test .......................................................................................................... 167 SUMMARY .............................................................................................................................. 168
CHAPTER 9: ANTI-BACTERIAL ACTIVITY OF HEMICELLULOSE AND PECTIN-BASED SILVER NANOCOMPOSITES................................................................................................ 169
INTRODUCTION ..................................................................................................................... 169
Nanocomposite sorbents and electrospun nanofibres
xii
SYNTHESIS AND CHARACTERISATION OF THE NANOCOMPOSITES ........................... 169 Materials .................................................................................................................... 169 Immobilisation of silver nanoparticles on the crosslinked HEM/PVA nanofibres ...... 170 Synthesis of pectin-based nanocomposite ................................................................ 170 Characterisation of nanocomposites ......................................................................... 170
TESTING THE ANTIBACTERIAL ACTIVITY OF THE NANOCOMPOSITES ........................ 171 RESULTS AND DISCUSSION ................................................................................................ 171
Characterisation of nanocomposites ......................................................................... 171 Antimicrobial activity of HEM-PVA/Ag nanocomposites ............................................ 174 Microbial activity of pectin extract-Ag nanocomposites ............................................. 175
SUMMARY .............................................................................................................................. 177
CHAPTER 10: REMOVAL OF NATURAL ORGANIC MATTER IN WASTEWATER USING ELECTROSPUN HEMICELLULOSE/PVA NANOFIBRES ...................................... 178
INTRODUCTION ..................................................................................................................... 178 METHODS .............................................................................................................................. 179
Sampling and sample-pre-treatment ......................................................................... 179 Solid-phase extraction ............................................................................................... 179 The LC-OCD characterisation ................................................................................... 180 Fluorescence excitation emission matrices ............................................................... 180 Modelling NOM fluorescent data using principal content analysis and PARAFAC
models 181 RESULTS AND DISCUSSION ................................................................................................ 181
The LC-OCD-OND fractionation analysis ................................................................. 181 Fluorescent NOM fraction filtration ............................................................................ 183
SUMMARY .............................................................................................................................. 185
CHAPTER 11: CONCLUSIONS AND RECOMMENDATIONS ................................................... 186
GENERAL CONCLUSIONS .................................................................................................... 186 Commercial electrospun synthetic polymers ............................................................. 186 Natural electrosupn biopolymers ............................................................................... 187
RECOMMENDATIONS FOR FURTHER STUDIES ............................................................... 187
REFERENCES .................................................................................................................................... 188
Nanocomposite sorbents and electrospun nanofibres
xiii
LIST OF FIGURES
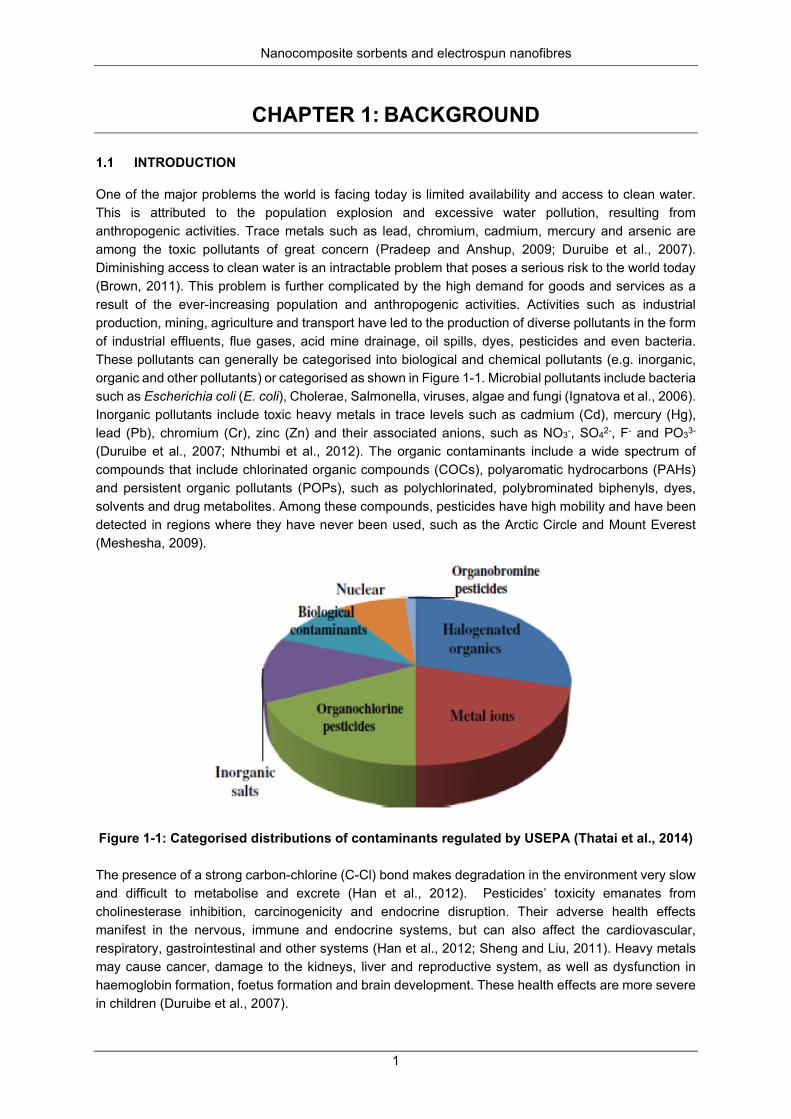
Figure 1-1: Categorised distributions of contaminants regulated by USEPA (Thatai et al., 2014) ......... 1
Figure 2-1: Schematic representation of the different processes and compartments that need to be monitored to characterise the fate and transport of POPs in water (adopted from Campbell et al., 2006) ................................................................................................................................................................ 6
Figure 2-2: The primary structure of homogalacturonan. Some of the carboxylates of the galactopyranose residues are esterified with methanol (Mohnen, 2008). ............................................ 10
Figure 2-3: Sugar units in hemicellulose ............................................................................................... 11
Figure 2-4: Fe-Pd bimetallic system (Guan et al., 2015) ...................................................................... 12
Figure 3-1: Electrospinning and electrospraying set-up (Jaworek et al., 2009) .................................... 18
Figure 3-2: Synthesis using grafting (Kango et al., 2013) ..................................................................... 19
Figure 3-3: A 2,2'-azobisisobutyronitrile reaction .................................................................................. 20
Figure 3-4: A benzoyl peroxide reaction ............................................................................................... 20
Figure 3-5: Research approach for electrospinning composites, grafting, loading, dechlorination, catalytic photodegradation and adsorption of Cd and Pb ..................................................................... 21
Figure 3-6: Slurry LDH synthesis scheme (Valente et al., 2009) .......................................................... 25
Figure 3-7: Set-up used for electrospinning, showing design and fabrication ...................................... 26
Figure 3-8: Flow chart for the electrospinning and optimisation process ............................................. 28
Figure 3-9: Set-up for grafting PAN/ PVDF AA under nitrogen (Zubrick, 1997) ................................... 28
Figure 3-10: Synthesis of PVDF/PAN-g-PAA nanofiber brushes ......................................................... 29
Figure 3-11: Flow chart showing a summary of polysaccharide isolation procedures ......................... 32
Figure 3-12: Different radiation emitted from a solid sample surface (Meshesha, 2011) ..................... 33
Figure 3-13: Powder X-ray diffraction, lattice planes ............................................................................ 34
Figure 3-14: IUPAC classifications of isotherms (Singh et al., 1985) for adsorptions under different conditions: I – monolayer formed on the microporous surface; II – multilayer on non-porous (microporous); III – heat of adsorption < heat of liquefaction; IV – mesoporous solids where the pore widths are 2-50 nm; V – little interaction between the adsorbent and the adsorbate; VI – non-uniform in size and energetics; B – turning point of adsorption behaviour. ........................................................... 36
Figure 3-15: Calibration curve for chlorpyrifos ...................................................................................... 41
Figure 3-16: A Type IV isotherm: typical of that of an LDH .................................................................. 44
Figure 4-1: Flow diagram for the synthesis of MgAlO ........................................................................... 48
Figure 4-2: Bar chart for the metal loading (mg/ℓ) on Fe-Pd/MgAlO ..................................................... 49
Figure 4-3: Leaching of Pd, Mg, Al and Fe at a pH of 7 at 21 °C ......................................................... 49
Figure 4-4: XRD diffractograms for MgAlO (P3c) ................................................................................. 51
Figure 4-5: (a) NaNO3 obtained from literature (Griffiths, 2012) and (b) MgAlO obtained from literature .............................................................................................................................................................. 51
Figure 4-6: XRD diffractograms for MgAlO (P3c) ................................................................................. 52
Nanocomposite sorbents and electrospun nanofibres
xiv
Figure 4-7: XRD diffractograms for MgAlO from XRD instrument plot ................................................. 53
Figure 4-8: The EDS and SEM images of calcined Mg:Al prepared by the co-precipitation method at a ratio of 2:1 (P2) and 3:1 (P3). The letters a and b refer to the elemental composition of the SEM image and EDS, respectively. .......................................................................................................................... 54
Figure 4-9: The EDS and SEM images of calcined Mg:Al prepared by the slurry method in the ratio 3:1 (S3) and 4:1 (S4), 5:1 (S5). The letters a and b refer to the elemental composition of the SEM image and EDS, respectively. .......................................................................................................................... 55
Figure 4-10: TEM images: neat Fe-Pd nanoparticles (a, b, c) and agglomerated Fe-Pd capped with CH (d) .................................................................................................................................................... 56
Figure 4-11: TEM images of agglomerated Fe-Pd capped with CH (e-n) ............................................ 57
Figure 4-12: High-resolution TEM size distribution graphs for neat, and CH-capped Fe-Pd nanoparticles .............................................................................................................................................................. 58
Figure 4-13: Illustrative diagram for Ostwald’s ripening (the aggregated nanocrystals, where the larger cluster grows larger in size, but decreases in number, and the smaller cluster decreases in size and the number of particles ................................................................................................................................ 59
Figure 4-14: The TEM micrographs of calcined MgAlO prepared using the slurry method at a ratio of 4:1 (S4) .................................................................................................................................................. 59
Figure 4-15: The TEM micrographs of calcined MgAlO prepared using the precipitation method at a ratio of 3:1 (P3) ..................................................................................................................................... 60
Figure 4-16: The TEM micrographs of calcined MgAlO prepared using the precipitation method at a ratio of 3:1 (P3) and loaded with Fe-Pd ................................................................................................ 61
Figure 4-17: Particle size analysis using nanosiser: (a) calcined MgAlO (P3) with an average diameter of 221.4 nm in the range 78.8 nm to 615.1 nm; (b) calcined MgAlO (P3)/Fe-Pd/ CH with an average diameter of 568.3 nm in the range 458.7 to 715.4 nm; (c) calcined MgAlO (P3)/Fe-Pd without CH, with an average diameter of 1,406 nm in the range 955.4 nm to 1999 nm. ................................................. 62
Figure 4-18: A TGA for sample (a): P3; and (b): literature profile ( Xu et al., 2010) ............................. 63
Figure 4-19: The FTIR spectra for uncalcined Mg6Al2(CO3)(OH)16.4H2O samples annotated with asterisk (*) as P2*, P3*and P4* ; Calcined MgAlO samples annotated with c as P2c, P3c and P4c ... 64
Figure 4-20: Concentration chlorpyrifos versus the dosage Fe-Pd loaded P3c (Fe-Pd/MgAlO) for a fixed dechlorination time of 60 minutes ......................................................................................................... 65
Figure 4-21: Calibration curve for chlorpyrifos ...................................................................................... 65
Figure 4-22: GC × GC-TOF-MS spectra for chlorpyrifos compared to library spectra: (A): one of the triple replicates of the sample; (B): GC-MS library match; (C): reference standard of the sample ...... 66
Figure 4-23: Chlorpyrifos concentration during dechlorination at 25 °C ............................................... 67
Figure 4-24: Chlorpyrifos concentration during dechlorination at 35 °C ............................................... 67
Figure 4-25: First- and second-order kinetic plots for chlorpyrifos at 25 °C ......................................... 68
Figure 4-26: First- and second-order kinetic plots for chlorpyrifos at 35 °C ......................................... 69
Figure 4-27: Dieldrin concentration during dechlorination at 35 °C ...................................................... 69
Figure 4-28: Obtained GC × GC-TOF-MS sample spectra for dieldrin compared to reference spectra from the instrument library .................................................................................................................... 70
Figure 4-29: Kinetic plots for dieldrin dechlorination: (A) first order: and (B) second order .................. 71
Nanocomposite sorbents and electrospun nanofibres
xv
Figure 4-30: Mineralisation of chlorpyrifos and dieldrin at 35 °C .......................................................... 76
Figure 5-1: Dispersion of nanoparticles on polymeric nanofibers (a) unmodified (b) modified ............ 80
Figure 5-2: SEM micrographs of electrospun fibers using 20 wt% PVDF ............................................ 81
Figure 5-3: SEM micrographs of electrospun fibers using 22.5 wt% PVDF ......................................... 82
Figure 5-4: SEM micrographs of electrospun fibers using 25 wt% PVDF ............................................ 83
Figure 5-5: SEM micrographs of electrospun fibers using 25 wt% PVDF with PVP ............................. 84
Figure 5-6:SEM images of electrospun fibers containing 7.5% high molecular weight PVDF ............. 84
Figure 5-7: SEM images of electrospun fibers containing 10% high molecular weight PVDF ............. 85
Figure 5-8: SEM images of electrospun fibers containing 12.5% high molecular weight PVDF .......... 85
Figure 5-9: SEM images of electrospun fibers containing high molecular weight PVDF (7.5% wt) and PAN (2%) .............................................................................................................................................. 85
Figure 5-10: SEM images of electrospun fibers containing 12.5% high molecular weight PVDF ........ 86
Figure 5-11: SEM images of electrospun fibers containing high molecular weight PVDF (12% wt) and PAN (2%) .............................................................................................................................................. 86
Figure 5-12: SEM images of electrospun fibers containing high molecular weight PVDF (12% wt), PAN (2%) and loaded with NP ...................................................................................................................... 86
Figure 5-13: SEM of nanofiber images obtained with different dimensions of internal needle diameter (bore) optimisation. ............................................................................................................................... 87
Figure 5-14: SEM images showing trend obtained with increase in flow rate. ..................................... 88
Figure 5-15: TEM images for optimisation of electric field strength (0.8 kV/cm) .................................. 89
Figure 5-16: TEM images for optimisation of electric field strength (1 - 2 kV/cm) ................................ 90
Figure 5-17: TEM micrographs for LBL electrospun composites .......................................................... 91
Figure 5-18: XRD diffractograms for PVP/TiO2 nanofibers calcined at 500 °C .................................... 92
Figure 5-19: XRD diffractograms for PVP/TiO2 nanofibers, calcined at 500 °C ................................... 93
Figure 5-20: FTIR spectra for grafted PVDF Grafted powder ............................................................... 93
Figure 5-21: TEM micrographs (A and B) MgAlO; Fe-Pd on MgAlO (C and D) TiO2 nanofibers and TiO2 nanoparticles ......................................................................................................................................... 94
Figure 5-22: High resolution C 1s peak for (a) PAN/PVDF-g-PAA, (b) PAN/PVDF-g-PAA-Fe-Pd and (c) PAN/PVDF-g-PAA/TiO2 ........................................................................................................................ 96
Figure 5-23: High resolution Ti 2p peak for the PAN/PVDF-g-PAA/TiO2 composite nanofibers .......... 97
Figure 5-24: High resolution Fe 2p peak for the PAN/PVDF-g-PAA-Fe-Pd composite nanofibers ...... 97
Figure 5-25: High resolution Ag 3d peak for the PAN/PVDF-g-PAA-Fe-Pd/Ag silver-decorated composite nanofibers. ........................................................................................................................... 98
Figure 5-26: Separated high-resolution XPS C 1s peak for (a) PAN/PVDF-g-PAA; (b) PAN/PVDF-g-PAA-Fe-Pd and (c) PAN/PVDF-g-PAA/TiO2 ......................................................................................... 99
Figure 5-27: Titanium coordination modes with PAA brush carboxylate group .................................. 101
Figure 5-28: SUN simulator set up ...................................................................................................... 104
Nanocomposite sorbents and electrospun nanofibres
xvi
Figure 5-29: SUN simulated photocatalytic degradation mechanism of pesticides adopted/redrawn (Singh et al., 2013). ............................................................................................................................. 105
Figure 5-30: Parent GC spectra for some transformation ................................................................... 108
Figure 5-31: Represents the spectral data obtained from the GC × GC-TOF-MS for some selected transformation products ...................................................................................................................... 108
Figure 6-1: Examples of pesticides ..................................................................................................... 114
Figure 6-2: Synthesis of Fe-Pd loaded mesoporous silica acrylic acid grafted (MS-g-PAA-g-Fe-Pd) ............................................................................................................................................................ 115
Figure 6-3: Nitrogen adsorption and desorption isotherms at 77K (using BET techniques) .............. 118
Figure 6-4: HRTEM images: unmodified, grafted and loaded MS-g-PAA-Fe-Pd ............................... 119
Figure 6-5: HRTEM graphs: unmodified, grafted and loaded MS-g-PAA-Fe-Pd ................................ 120
Figure 6-6: Dispersion, anchoring and immobilisation Fe-Pd nanoparticles on MS-g-PAA polymer network ................................................................................................................................................ 121
Figure 6-7: HRTEM images: MS-g-PAA/Fe-Pd, and Selected area electron diffraction (SAED) diffraction ............................................................................................................................................................ 122
Figure 6-8: Shows the XRD spectra for un-modified silica (SiO2) ...................................................... 122
Figure 6-9: XRD diffractogram for MS-g-PAA/Fe-Pd silica ................................................................. 123
Figure 6-10: FTIR spectra (a) acrylic acid functionalised mesoporous silica ..................................... 124
Figure 6-11: FTIR spectra (b) unmodified mesoporous silica ............................................................. 124
Figure 6-12: GC × GC-TOF-MS spectra for diuron, chlorpyrifos, dieldrin and fipronil ........................ 125
Figure 6-13: (a) Exponential decay curves for the dechlorination mixed pesticides using Fe-Pd anchored on mesoporous silica Fe-Pd /MS-g-PAA; (b) “best fit” decay curves. ............................................... 126
Figure 6-14: Plot of natural log of [pesticide] against time for Fe-Pd/MS-g-PAA ................................ 127
Figure 6-15: A plot of 1/[C] against time, t. Second order kinetics for Fe-Pd /MS-g-PAA .................. 128
Figure 6-16: Dechlorination mechanism of diuron .............................................................................. 129
Figure 7-1: Schematic representation for the adsorption process ...................................................... 133
Figure 7-2: A typical experimental set up for Pb2+ and Cd2+ adsorption and regeneration (Jeff Dahn, 2011) ................................................................................................................................................... 133
Figure 7-3: Scanning electron micrographs for PVDF and PVDF/PAN nanofibers ............................ 135
Figure 7-4: FTIR spectra of PVDF/PAN-g-PAA (grafted NF) (Huang et al., 2010) ............................. 136
Figure 7-5: FTIR spectra of PVDF-g-PAA (NF) (Huang et al., 2010) ................................................. 136
Figure 7-6: (a) Data and images for contact angle determination.(b) Contact angle images for PAN/PVDF membranes from literature (Li et al., 2013) ...................................................................... 138
Figure 7-7: Removal and regeneration efficiencies of Cd2+ and Pb2+ ................................................. 139
Figure 7-8: Effect of pH on adsorption (mass adsorbed, qe, in (mg g-1) ........................................... 140
Figure 7-9: Determination of contact time for maximum adsorption: Pb2+ and Cd2+ .......................... 141
Figure 7-10: Adsorption of 10 mg/L (a) Cd2+ and (b) Pb2+ at 25, 35 and 45 °C .................................. 143
Figure 7-11: Effect of concentration on adsorption of Cd2+ and Pb2+ .................................................. 144
Nanocomposite sorbents and electrospun nanofibres
xvii
Figure 7-12: Langmuir (a) and Freundlich (b) adsorption isotherm plots for Pb2+ at 25, 35 and 45 °C ............................................................................................................................................................ 145
Figure 7-13: (c). Langmuir and (d) Freundlich isotherms for Cd2+ at 25, 35 and 45°C ....................... 146
Figure 7-14: (a) Pb2+ and (b) Cd2+ -First order kinetic model plots for at 25 °C. ................................. 147
Figure 7-15: (c) Pb2+ and (d) Cd2+ - Pseudo second-order kinetic plots for at 25 °C .......................... 148
Figure 7-16: Plot for determination of adsorption thermodynamics of (a) Cd and (b) Pb: by grafted polymer composite. ............................................................................................................................. 150
Figure 7-17: Removal and recovery efficiency of metals .................................................................... 151
Figure 7-18: Designed standalone photocatalytic water purification system ...................................... 152
Figure 8-1: Plot showing the pHpzc of the polysaccharide extract from cactus ................................. 158
Figure 8-2: Effect of pH on the sorption process ................................................................................ 160
Figure 8-3: Effect of sorbent dose on metal ion removal .................................................................... 161
Figure 8-4: Effect of contact time on adsorption of metal ions............................................................ 162
Figure 8-5: Impact of initial concentration on the removal efficiency .................................................. 163
Figure 8-6: Non-linearised fitting of selected isotherm of (a) Pb2+ and (b) Cd2+ ................................. 164
Figure 8-7: Investigation into the reliability of desorption test ............................................................. 167
Figure 9-1: The synthesis of PE-Ag nanocomposites at 90 °C for (a) 0 h, (b) 10 h, (c) 20 h, (d) 24 h ............................................................................................................................................................ 170
Figure 9-2: The SEM/EDS micrographs of (a) surface of vapour cross-linked, (b) EDS image of PVA/hemicellulose nanofiber membrane (c) EDS peaks of elements present in the nanofiber membrane ............................................................................................................................................................ 172
Figure 9-3: Schematic illustration of (a) the reaction of PVA/hemicellulose-nanofiber membranes with glutaraldehyde and its intermolecular and intramolecular cross-linking and the unreacted end of the aldehyde, (b) Reduction of silver nitrate by the unreacted end of aldehyde in the glutaraldehyde cross-linked PVA/hemicellulose membranes ................................................................................................ 172
Figure 9-4: The SEM/EDS micrographs of (a) pristine pectins (b) SEM image of PE-Ag nanocomposite (c) EDS peaks of elements present PE-Ag nanocomposites ............................................................. 173
Figure 9-5: (a) TEM images of silver nanoparticles formed as a result of reduction of AgNO3 (b) Particle size distribution histogram of silver nanoparticles determined from TEM micrograph using ImageJ . 174
Figure 9-6: Schematic representation of the in situ preparation of pectin– Ag nanocomposites composite ............................................................................................................................................................ 174
Figure 9-7: Bacterial lawn plates with hemicellulose based nanofiber biocomposite membrane visualised with INT dye (a) Control plate nanofibers without bacteria, (b) Enterococci, (c) Klebsiela, (d) S. Aures , (e) pseudomonas (f) E. coli ........................................................................................... 175
Figure 9-8: The MICs of PE-Ag nanomcomposites using the 96-wells method ................................. 176
Figure 9-9: The mode of action of the silver nano composites on the bacteria cell wall (Alenius et al., 2014). .................................................................................................................................................. 176
Figure 10-1: SPE column apparatus ................................................................................................... 179
Figure 10-2: The FEEM regions for different types of fluorescent NOM fractions (Horiba scientific) . 180
Nanocomposite sorbents and electrospun nanofibres
xviii
Figure 10-3: Percentage removal of NOM fractions before and after filtration ................................... 183
Figure 10-4: Plots of relative intensities of NOM fractions at different emission wavelengths measured from 240-650 nm. The graphs show humic-like and tryptophan-like profiles in (a) unfiltered water, (b) silica filtered water, (c) NH2-SPE filtered water and (d) nanofiber filtered ......................................... 184
Figure 10-5: Loading intensities resulting from fitting a four-component PARAFAC model to the filtered and unfiltered wastewater data ........................................................................................................... 185
Nanocomposite sorbents and electrospun nanofibres
xix
LIST OF TABLES
Table 2-1: Typical examples of bacterial, biopolymer and agricultural wastes used to accumulate heavy metals in water (Wang and Chen, 2009) ................................................................................................ 8
Table 3-1: List of some commercial polymers ...................................................................................... 14
Table 3-2: Mass used in co-precipitation solutions and sample codes ................................................ 24
Table 3-3: PVDF wt % and polymer mass calculated for dissolution in 5 mℓ DMAc ............................ 27
Table 3-4: List of analytical standards, assay/purity and the source/supplier ...................................... 39
Table 3-5: Preparation of analytical standards from 100 mg/ℓ stock solution ....................................... 39
Table 3-6: Preparation of ICP-OES analytical standards from 100 mg/ℓ stock solution ....................... 41
Table 3-7: TOC analysis parameters .................................................................................................... 42
Table 4-1: MgAlO surface area (BET equation) and porosity (BJH method) ....................................... 50
Table 4-2: Comparison of Mg:Al ratios in the starting materials, against the co-precipitated products (MgAlO) ................................................................................................................................................. 53
Table 4-3: Rate constant, k, and correlation coefficient, R2, at 25 °C................................................... 72
Table 4-4: Calculation of activation energy for the dechlorination of chlorpyrifos ................................ 74
Table 4-5: Recovery data obtained using GC × GC-TOF-MS for chlorpyrifos and dieldrin .................. 75
Table 4-6: Mineralisation results calculated from TOC data ................................................................. 76
Table 5-1: Optimisation of electric field strength ................................................................................... 89
Table 5-2: High resolution C 1s peak for the bare and composite nanofibers ...................................... 95
Table 5-3: Chemical composition of pristine PAN/PVDF-g-PAA nanofibers ...................................... 100
Table 5-4: Summary for the results from XPS chemical analysis ....................................................... 101
Table 5-5: Surface area (BET equation) and porosity data (BJH method) ......................................... 102
Table 5-6: Graft density ....................................................................................................................... 102
Table 5-7: Rate constants k and correlation coefficient, R2, at 25 °C ................................................. 103
Table 5-8: The TPs and their structures 1-8 obtained from the GC library are listed below .............. 109
Table 6-1: Relative pressure, P/P0 and amount of nitrogen adsorbed /desorbed in cm3/g at 77K ... 117
Table 6-2: BET surface area and porosity (BJH method) ................................................................... 118
Table 6-3: XRD data for MS-g-PAA/Fe-Pd silica ................................................................................ 123
Table 6-4: Rate constant k, R2 and dechlorination kinetics using Fe-Pd/MS-g-PAA .......................... 127
Table 6-5: First and second order kinetics using mesoporous silica MS/Fe-Pd ................................. 128
Table 7-1: Structural and porous properties of nanofiber samples ..................................................... 137
Table 7-2: Data for effect of pH on concentration ............................................................................... 140
Table 7-3: Adsorption isotherm data for Cd ........................................................................................ 142
Table 7-4: Adsorption isotherm data for Pb ........................................................................................ 142
Nanocomposite sorbents and electrospun nanofibres
xx
Table 7-5: Adsorption parameters from Langmuir and Freundlich isotherm models.......................... 145
Table 7-6: Kinetic parameters for first and pseudo-second order models .......................................... 148
Table 7-7: Summary of thermodynamic data, , , and Kc obtained ........................... 150
Table 7-8: Removal efficiency (%E) and Recovery efficiency (% R) .................................................. 151
Table 8-1: Values obtained from proximate analysis .......................................................................... 159
Table 8-2: Adsorption parameters of Pb2+ and Cd2+ on polysaccharide extract ................................. 165
Table 10-1: Water characteristics of wastewater ................................................................................ 181
Table 10-2: Fluorescence profiles of the 4 components analysed by PARAFAC .............................. 183
0G∆ 0H∆ 0S∆
Nanocomposite sorbents and electrospun nanofibres
xxi
ACRONYMS AND ABBREVIATIONS AA Acrylic acid
Ag Silver
AgI Silver iodide
AgNO3 Silver nitrate
Al Aluminium
Al2O3 Aluminium oxide
Al(NO3)3.9H2O Aluminium nitrate nonahydrate
AIBN Azobisisobutyronitrile
AIOOH Boehmite aluminium hydroxide
AO Advanced oxidation
AOP Advanced oxidation processes
APCVD Atmospheric pressure chemical vapour deposition
As Arsenic
ASTM American Society for Testing and Materials
ATR Attentuated total reflectance
Au Gold
Be Berry’s number
BE Binding energy
BET Brunauer-Emmett-Teller
BJH Barrett-Joyner-Halenda
BP Benzophenone
BPO Benzoyl peroxide
BSA Bovine serum albumin
BSE Backscattered electrons
C Carbon
C-Cl Carbon-chlorine
C2H5OH Ethanol
Nanocomposite sorbents and electrospun nanofibres
xxii
C6H14 Hexane
Ca Calcium
CA Cellulose acetate
CB Conductance band
Cd Cadmium
CdSO4.H2O Cadmium sulphate
Ce Cerium
CH Chitosan CH2 Methylene CH₂(CH₂CHO)₂ Glutaraldehyde
CMA Cylindrical mirror analyser
Co Cobalt
CO2 Carbon dioxide
COC Chlorinated organic compounds
COOH Carboxylic acid (carboxylate)
Cr Chromium
CTAB Cetyltrimethylammonium bromide
CTMS Chlorotrimethylsilane (C3H9CiSi)
Cu Copper
CVD Chemical vapour deposition
DBP Disinfection by-products
DCM Dichloromethane
DDT Dichlorodiphenyltrichloroethane
DEPT Diethylthiophosphate
DFT Dry function theory
dH2O Distilled water
DLS Dynamic light scattering
DMAc Dimethylacetamide
DMF Dimethylformamide
Nanocomposite sorbents and electrospun nanofibres
xxiii
DMSO Dimethyl sulfoxide
DOC Dissolved organic carbon
DON Dissolved organic nitrogen
DOM Dissolved organic matter
EBSD Electron backscattered diffraction
E. coli Escherichia coli
EDS Energy-dispersive system
EDX Energy-dispersive X-ray
F Fluorine
Fe Iron
Fe2+ Ferrous ion
Fe2O3 Ferric oxide
Fe3O4 Ferrimagnetic iron oxide magnetite
FEC Fluoroethylene carbonate
Fe-Pd Iron-palladium
FeSO4.7H2O Sulphate heptahydrate
FEEM Fluorescence excitation and emission matrices
FTIR Fourier-transform infrared spectroscopy
FWHM Full width at half maximum
GAA Glacial acetic acid
GC Gas chromatography
GC-MS Gas chromatography-mass spectrometry
GC-TOF-MS Gas chromatography time-of flight mass spectrometry
GD Graft density
GPC Gel permeation chromatography
H Hydrogen
H2O Water
H2O2 Hydrogen peroxide
HAA Haloacetic acid
Nanocomposite sorbents and electrospun nanofibres
xxiv
HCl Hydrochloric acid
HCOOH Formic acid
HCOONa Sodium formate
HEM Hemicellulose
HF Hydrogen fluoride
HFP Hexafluoropropylene
HG Homogalacturonan
Hg Mercury
HMDS Hexamethyldisilazane
HNO3 Nitric acid
HOMO Highest occupied molecular orbital
HPCVD Hybrid physical chemical vapour deposition
HT Hydrotalcite
ICP Inductively coupled plasma
ICP-OES Inductively coupled plasma-optical emission spectroscopy
INT Iodonitrotetrazolium chloride
IUPAC International Union of Pure and Applied Chemistry
KOH Potassium hydroxide
LBL Layer by layer
LC-OCD Liquid chromatography organic carbon detection
LDH Layered double hydroxide
LN Natural log
Mg Magnesium
MgAl2O4 Spinel
Mg(NO3)2.6H2O Magnesium nitrate hexahydrate
MgAIO Magnesium aluminium oxide
MgAlCO3 Anion clay hydrotalcite
MgO Magnesium oxide
Mg(OH)2 Magnesium hydroxide
Nanocomposite sorbents and electrospun nanofibres
xxv
Mo Molybdenum
MOCVD Metal-organic chemical vapour deposition
Mn Manganese
MS Mass spectrometry
MS Mesoporous silica
MS-g-PAA Mesoporous silica grafted to polyacrylic acid
N2 Nitrogen
Na2CO3 Sodium carbonate
NaBH4 Sodium borohydride
NaCl Sodium chloride
NaNO3 Sodium nitrate
NaOH Sodium hydroxide
NDMA N,N-dimethylnitrosoamine
Ni Nickel
NH2 Azanide
NH3 Ammonia
(NH4) 2C2O4 Ammonium oxalate
NMP N-Methyl-2-pyrrolidone
NMR Nuclear magnetic resonance
NOx Nitrogen oxide
NOM Natural organic matter
O2 Oxygen
OCD Organic carbon detector
OH- Hydroxide (hydroxyl)
OND Organic nitrogen detector
PAA Polyacrylic acid
PAH Polyaromatic hydrocarbons
PAN Polyacrylonitrile
PARAFAC Parallel factor analysis
Nanocomposite sorbents and electrospun nanofibres
xxvi
Pb Lead
Pb(NO3)2 Lead nitrate
PCA Principal content analysis
PCB Polychlorinated biphenyl
PCS Photon correlation spectroscopy
Pd Palladium
Pd (OAc) Palladium acetate
PE Polyethylene
PE Pectin extract
PECVD Plasma-enhanced chemical vapour deposition
PES Polyether sulfone
PET Polypthalate
pHpzc pH at point of zero charge
POP Persistent organic pollutant
PP Polypropylene
PS Polystyrene
PSf Polysulfone
Pt Platinum
PVA Polyvinyl alcohol
PVC Polyvinyl chloride
PVDF Polyvinylidene fluoride
PVP Polyvinylpyrrolidone
p-XRD Powder X-ray diffraction
R2 Coefficient of determination
RG Rhamnogalacturonan
RhB Rhodamine B (C28H31ClN2O3)
RO Reverse osmosis
SAC Spectral absorption coefficient
SAED Selected area electron diffaction
Nanocomposite sorbents and electrospun nanofibres
xxvii
SEM Scanning electron microscopy
SH Sulphhydryl functional group
SiC Silicon carbide
SiO2 Silicon dioxide
SPE Solid phase extraction
Sr Strontium
SSE Sum of squared errors
STP Standard temperature and pressure
SUVA Specific UV absorbance
TAE Tris-acetate-EDTA (C24H33N5O12)
TCP 3,5,6-trichloro-2-pyridinol
TEM Transmission electron microscopy
TFA Trifluoroacetic acid (C2HF3O2)
TGA Thermogravimetric analysis
THM Trihalomethane
Ti Titanium
TIIP Titanium isopropoxide
TiO2 Titanium dioxide
TOC Total organic carbon
U Uranium
USEPA United States Environmental Protection Agency
UV Ultraviolet
UVD Ultraviolet detector
VB Valence band
WHO World Health Organisation
XPS X-ray photoelectron spectroscopy
XRD X-ray diffraction
Zn Zinc
ZVI Zero valiant iron
Nanocomposite sorbents and electrospun nanofibres
1
CHAPTER 1: BACKGROUND
INTRODUCTION
One of the major problems the world is facing today is limited availability and access to clean water. This is attributed to the population explosion and excessive water pollution, resulting from anthropogenic activities. Trace metals such as lead, chromium, cadmium, mercury and arsenic are among the toxic pollutants of great concern (Pradeep and Anshup, 2009; Duruibe et al., 2007). Diminishing access to clean water is an intractable problem that poses a serious risk to the world today (Brown, 2011). This problem is further complicated by the high demand for goods and services as a result of the ever-increasing population and anthropogenic activities. Activities such as industrial production, mining, agriculture and transport have led to the production of diverse pollutants in the form of industrial effluents, flue gases, acid mine drainage, oil spills, dyes, pesticides and even bacteria. These pollutants can generally be categorised into biological and chemical pollutants (e.g. inorganic, organic and other pollutants) or categorised as shown in Figure 1-1. Microbial pollutants include bacteria such as Escherichia coli (E. coli), Cholerae, Salmonella, viruses, algae and fungi (Ignatova et al., 2006). Inorganic pollutants include toxic heavy metals in trace levels such as cadmium (Cd), mercury (Hg), lead (Pb), chromium (Cr), zinc (Zn) and their associated anions, such as NO3-, SO42-, F- and PO33- (Duruibe et al., 2007; Nthumbi et al., 2012). The organic contaminants include a wide spectrum of compounds that include chlorinated organic compounds (COCs), polyaromatic hydrocarbons (PAHs) and persistent organic pollutants (POPs), such as polychlorinated, polybrominated biphenyls, dyes, solvents and drug metabolites. Among these compounds, pesticides have high mobility and have been detected in regions where they have never been used, such as the Arctic Circle and Mount Everest (Meshesha, 2009).
Figure 1-1: Categorised distributions of contaminants regulated by USEPA (Thatai et al., 2014) The presence of a strong carbon-chlorine (C-Cl) bond makes degradation in the environment very slow and difficult to metabolise and excrete (Han et al., 2012). Pesticides’ toxicity emanates from cholinesterase inhibition, carcinogenicity and endocrine disruption. Their adverse health effects manifest in the nervous, immune and endocrine systems, but can also affect the cardiovascular, respiratory, gastrointestinal and other systems (Han et al., 2012; Sheng and Liu, 2011). Heavy metals may cause cancer, damage to the kidneys, liver and reproductive system, as well as dysfunction in haemoglobin formation, foetus formation and brain development. These health effects are more severe in children (Duruibe et al., 2007).
Nanocomposite sorbents and electrospun nanofibres
2
Conventional water treatment methods, which include coagulation, flocculation, precipitation, sand filtration and membrane filtration (reverse osmosis, ultrafiltration and forward osmosis), do not remove trace levels of these pollutants. Membrane filtration is not only wasteful, but also suffers flux decline and poor selectivity due to fouling and concentration polarisation, respectively, besides being expensive due to high energy inputs (Van der Bruggen et al., 2003; Geise et al., 2010). Furthermore, small pollutant molecules can easily pass through the filters and membranes. In view of this challenge, the use of nanotechnology for water purification has attracted considerable interest. This study aimed to develop nanocomposites that can remove organic contaminants, such as, pesticides, by dechlorination mechanisms, followed by photodegradation using advanced oxidation processes (AOP), toxic trace metals ions such as Pb2+ and Cd2+ by adsorption, preferably in a one-step process, and bacteria in contaminated water through the fabrication of stable nanofibres made from polysaccharide extracts that are rich in hemicellulose and pectins.
AIMS OF THE STUDY
The project set out to achieve the following:
• Synthesise and characterise intercalated metal oxide support for catalysts and loading; anchor and immobilise photocatalytic nanoparticles, as well as metal oxide catalysts, on the intercalated metal oxide support
• Functionalise and modify the inert polymer backbone by grafting and anchoring nanoparticles or catalysts
• Design and prepare a nanocomposite filter material that has a hydrodechlorination temperature at ambient conditions
• Fabricate multi-layered filter via layer-by-layer electrospinning and cast solutions of the catalyst-anchored composites
• Electrospin nanofilters, cast membranes and test the performance of nanocomposite material in the removal of bacteria and degradation or removal of organic matter from a model solution as the main focus
• Test the materials and establish their capability for removing heavy metals; and investigate if the nanoparticles leach out of the nanocomposite materials so as to revise the immobilisation strategies
• Apply the filters in different surface water systems and water supplies • Conduct filter regeneration studies and investigate the re-usability of the nanofibre or
nanocomposite materials
SCOPE OF THE STUDY
The focus of this study lies in the removal of halogenated organic compounds and heavy metals using electrospun nanocomposite fibres, PAN and PVDF. The nanocomposites were functionalised, coated and electrospun with nanoparticles or mats that are target specific, and then evaluated for performance. Characterisation of the materials was done using SEM, energy-dispersive systems (EDS), Fourier-transform infrared spectroscopy (FTIR), BET techniques, X-ray diffraction (XRD), X-ray photoelectron spectroscopy (XPS) and TEM. A cartridge or packed column using the nanocomposite was used for the removal or degradation of the contaminants and analysis done by GC × GC-TOF-MS and ICP-OES. Synthetic model solutions and real water samples were used for batch and flow (dynamic) systems.
Nanocomposite sorbents and electrospun nanofibres
3
REPORT LAYOUT
This report is divided into 11 chapters.
• Chapter 1 presents a general introduction with a problem statement, background, and the aims and objectives of the project.
• Chapter 2 is a review of relevant literature. • Chapter 3 presents the general methodology, highlighting major fabrication, characterisation and
analytical techniques, as well as procedures adopted in the experimental work. • Chapter 4 discusses dechlorination of pesticides using an electrospun nanofibre composite of
PVDF and PAN, and its applications in water. • Chapter 5 presents the photodegradation of pesticides using nanocomposite decorated with
TiO2/Fe-Pd nanoparticles, anchored on PAA, to produce an Fe-Pd/MS-g-PAA nanosorbent for the dechlorination of pesticides in water. The chapter also discusses the regeneration studies done to investigate the leaching of metal nanoparticles from the nanocomposite.
• Chapter 6 reports the degradation of pesticides using mesoporous silica. • Chapter 7 discusses the removal of metals using electrospun nanofibres of PVDF and PAN. • Chapter 8 reports the results obtained on antibacterial studies based on silver nanoparticles
encapsulated within the polymer chains of pectin extract and hemicellulose (HEM)/PVA nanofibre sorbents for antimicrobial activity against gram-negative and gram-positive bacteria.
• Chapter 9 presents antibacterial studies using silver nanoparticles encapsulated within the polymer chains of pectin extract and HEM/PVA nanofibre membranes. Antimicrobial activity of silver nanoparticles against gram-negative bacteria (E. coli, Klebsiella and Psuednomous) and gram-positive bacteria (Staphylococcus aureus and Enterococci) was carried out.
• Chapter 10 discusses the removal of natural organic matter in wastewater using electrospun HEM/PVA nanofibres.
• Chapter 11 gives the general conclusion of all the findings of chapters 4 to 10. • The references are placed at the end of the report.
Nanocomposite sorbents and electrospun nanofibres
4
CHAPTER 2: LITERATURE REVIEW
INTRODUCTION
Water plays an important role in various human activities. These include agriculture, sanitation, industrial production (electronics, pharmaceuticals and food), energy and transportation. Furthermore, it plays a vital role in sustainable development, supporting ecosystems that provide important services to both the environment and humans (Xie, 2006; Nomngongo et al., 2013; Sivakumar et al., 2012). Therefore, clean water (i.e. water free of toxic pollutants) is essential to human health. In recent years, the world has been facing dreadful challenges in meeting rising demands for clean water as the available supplies of freshwater are decreasing due to extended droughts, population growth, more stringent health-based regulations, unregulated water pollution, thus compromising water quality, and competing demands from a variety of users (Savage and Diallo, 2005; Xie, 2006; Nomngongo et al., 2013). There are two key terms that need to be defined before proceeding with the review: pollution and pollutants.
The term pollution is defined as a change in the natural system as a result of anthropogenic activities. As a result, the introduction of foreign substances or energy – directly or indirectly – into the environment may have deleterious effects that are hazardous to human health, hinder marine activities, including fishing, and impair the quality of seawater for use (Elliot, 2003). Pollutants, on the other hand, are defined as substances introduced into the natural environment as a result of anthropogenic activities and in sufficient quantities to produce undesirable effects (Elliot, 2003). The adverse impacts imposed by biological and chemical pollutants (toxic metals, POPs) are a source of great concern for environmental chemists. Therefore, this report reviews the occurrence of two different types of pollutants that contribute to water pollution. Their effects on living organisms and how they are transported into water bodies are also discussed. Furthermore, literature studies that report on their occurrence in water systems are included.
BIOLOGICAL POLLUTANTS IN WATER
Biological pollutants are microorganisms that are harmful to humans and other forms of life. Infectious diseases such as typhoid and cholera are caused by biological pollutants and are the most common and widespread public health risks associated with drinking water (LabSpace, 2014). Biological pollutants constitute a large portion of drinking water contaminants, both in number and in the probability of occurrence in the treatment plant (Upadhyayula et al., 2009). These pollutants can be classified into three categories: microbial (e.g. bacteria, viruses and protozoa), substances such as natural organic matter that provide a source of carbon and aggravate the growth of microorganisms, and biological toxins, such as cyanobacterial toxins (Upadhyayula et al., 2009).
The microbial contaminants can be further classified into smaller groups: human pathogens (E. coli, cholera and rotavirus, among others), which normally come from influent water due to the discharge of untreated sewerage into the source (Berry et al., 2006; Escobar et al., 2001), free living microbes native to the natural habitat of the source (e.g. Legionella pneumophila, Microcystis aeruginos) (Dugan and Williams, 2006; Majsterek et al., 2004), nuisance organisms (e.g. iron and sulphur-reducing bacteria) (Upadhyayula et al., 2009) and microorganisms causing taste and odour problems (e.g. Vannella, Saccamoeba and Ripidomyxa) (Upadhyayula et al., 2009).
Natural organic matter occurs in natural waters due to the decomposition of plant and animal residues and constitutes a diverse group of organic compounds with varying molecular weights (Upadhyayula et al., 2009; Cheng et al., 2005). The group of organic compounds in natural organic matter is divided into hydrophobic and hydrophilic fractions (Cheng et al., 2005).
Nanocomposite sorbents and electrospun nanofibres
5
The hydrophilic fraction includes carboxylic acids, carbohydrates and proteins, whereas the hydrophobic fractions consist of humic substances such as humic and fulvic acids (Matilainen et al., 2006).
The third category of biological pollutants, which includes cyanobacterial toxins, is produced from toxic species of cyanobacteria commonly referred as harmful algal blooms (Upadhyayula et al., 2009). The latter occur mostly in non-turbulent and nutrient-rich freshwater sources (e.g. lakes and rivers) (Upadhyayula et al., 2009; Delgado et al., 2012).
The presence of biological contaminants in water supplies and recreational waters poses a potentially significant risk to human health. Therefore, researchers have developed sensitive and accurate techniques for assessing the microbial contamination of water. Zhang et al. (2012) developed a method to determine low-density E. coli and Helicobacter pylori suspensions in water. This led to new efforts to concentrate and detect low-density bacteria suspensions in water with larger volumes and mixed microbial species. Other methods used to monitor biological contaminant levels are reported by Aw et al. (2012), Holvoet et al. (2014), Figueira et al. (2011) and Blaak et al. (2014), among others.
CHEMICAL POLLUTANTS IN WATER
Chemical pollutants have been and are still released into the environment through different anthropogenic processes, such as coal conversion, petroleum refining, mining, and textile, pharmaceutical and paper and pulp manufacturing. The large-scale use of herbicides, insecticides and pesticides in agriculture (Clark et al., 2003; Doong et al., 2008) have also contributed as pollutants. Industrial discharge contaminates water, air and land, thus putting flora and fauna at risk. Chemical pollutants can have toxic, mutagenic and carcinogenic characteristics. Therefore, they are considered to be hazardous to the environment (Clark et al., 2003; Doong et al., 2008). Chemical pollutants include persistent organic and inorganic (heavy metals) pollutants. The latter are of concern because they tend to bioaccumulate in the food chain and show adverse health effects, ranging from acute to chronic toxicity (Chrysikou et al., 2008). Over the past years, several studies have been conducted to determine levels of pollutants in water samples (Lim et al., 2008; Huang et al., 2007; Nguyen et al., 2005; Zhang et al., 2003; Chrysikou et al., 2008). The results show that the environment contains relatively high levels of chemical pollutants.
Persistent organic pollutants
Persistent organic pollutants are a group of organic compounds that are known to be persistent in the environment. To date, a number of studies have been carried out to investigate the levels of POPs in water samples (Prieto et al., 2007; Sánchez-Avila et al., 2010). Due to their lipophilic properties, they tend to bioaccumulate through the food web (Chrysikou et al., 2008). This leads to the risk of undesirable effects to human health and the environment. The increase of POPs in the environment poses concern because of their reproductive, developmental, immunologic and carcinogenic effects (Abelsohn et al., 2002; USEPA, 2002).
A number of POPs disrupt the normal functioning of the endocrine system. They are known as endocrine disruptors. Endocrine-disrupting properties are found in several classes of chemicals released into the environment. These include flame retardants such as polybrominated diphenyl ethers, pesticides, e.g. dichlorodiphenyltrichloroethane (DDT), metals such as tributyltin, pharmaceuticals, e.g. ethynyl estradiol, plasticisers such as phthalates, phenols, e.g. bisphenol A, polyaromatic compounds such as polychlorinated biphenyls, and surfactants, e.g. alkylphenol ethoxylates (Colborn et al., 1996; Wu et al., 2008).
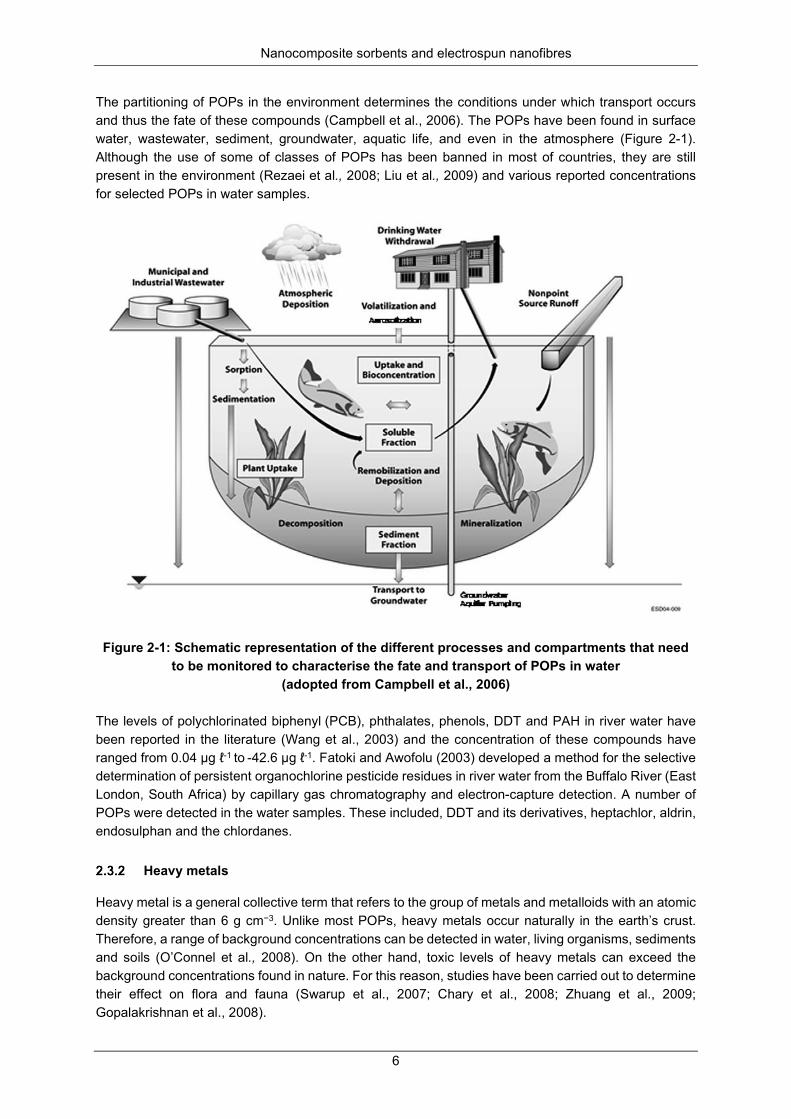
Nanocomposite sorbents and electrospun nanofibres
6
The partitioning of POPs in the environment determines the conditions under which transport occurs and thus the fate of these compounds (Campbell et al., 2006). The POPs have been found in surface water, wastewater, sediment, groundwater, aquatic life, and even in the atmosphere (Figure 2-1). Although the use of some of classes of POPs has been banned in most of countries, they are still present in the environment (Rezaei et al., 2008; Liu et al., 2009) and various reported concentrations for selected POPs in water samples.
Figure 2-1: Schematic representation of the different processes and compartments that need to be monitored to characterise the fate and transport of POPs in water
(adopted from Campbell et al., 2006) The levels of polychlorinated biphenyl (PCB), phthalates, phenols, DDT and PAH in river water have been reported in the literature (Wang et al., 2003) and the concentration of these compounds have ranged from 0.04 µg ℓ-1 to -42.6 µg ℓ-1. Fatoki and Awofolu (2003) developed a method for the selective determination of persistent organochlorine pesticide residues in river water from the Buffalo River (East London, South Africa) by capillary gas chromatography and electron-capture detection. A number of POPs were detected in the water samples. These included, DDT and its derivatives, heptachlor, aldrin, endosulphan and the chlordanes.
Heavy metals
Heavy metal is a general collective term that refers to the group of metals and metalloids with an atomic density greater than 6 g cm−3. Unlike most POPs, heavy metals occur naturally in the earth’s crust. Therefore, a range of background concentrations can be detected in water, living organisms, sediments and soils (O’Connel et al., 2008). On the other hand, toxic levels of heavy metals can exceed the background concentrations found in nature. For this reason, studies have been carried out to determine their effect on flora and fauna (Swarup et al., 2007; Chary et al., 2008; Zhuang et al., 2009; Gopalakrishnan et al., 2008).
Nanocomposite sorbents and electrospun nanofibres
7
Heavy metals can also enter the environment through anthropogenic activities (industrial activities and domestic processes). These include burning or mining fossil fuels, the incineration of waste, automobile exhausts, smelting processes, refining ores, fertilizer industries, tanneries, batteries, paper industries and pesticides (Sud et al., 2008). These sources increase the risk of the exposure of living organisms to heavy metals. Hence, their toxicity, bio-accumulation and persistency in the environment are cause for concern (Meena et al., 2005).
Heavy metals are toxic to plants and animals, even in relatively low concentrations (Mohan and Singh, 2002; Mohan et al., 2006). They tend to accumulate in the food chain through uptake at the primary producer level and then through consumption at the consumer level (Chary et al., 2008). Metals enter the human body through inhalation, ingestion (food and water) and absorption by the skin (Yantasee et al., 2007). Exposure to heavy metals can result in damaged or reduced mental and central nervous system functioning, lower energy levels, and damage to blood composition, lungs, kidneys, liver and other vital organs (Amarasinghe and Williams, 2007). Heavy metals include chromium, arsenic, copper, lead, mercury, manganese, cadmium, nickel, zinc and iron (Raikwar et al., 2008; Meena et al., 2005).
In view of the human health impacts, each metal has different effects and symptoms (Lesmana et al., 2009). For instance, cadmium and zinc have similar physiochemical properties, while cadmium tends to displace zinc in some important biological functioning of the human body (enzymatic and organ functions). In this way, cadmium derives its toxicological properties. Cadmium exposure may cause kidney damage, lung cancer and bone defects (Jarup, 2003; Godt et al., 2006). Cadmium can contaminate the environment through natural (volcanic eruption) and anthropogenic activities. Therefore, the latter increases the chances of occurrence of cadmium in the biosphere, hydrosphere and atmosphere (Jarup, 2003; Godt et al., 2006; Staessen et al., 1999; Min et al., 2008).
Lead is a type of heavy metal that has specific toxicity and cumulative effects. Depending on the level and duration of exposure, lead poisoning is common. The health problems of lead include malfunction in the synthesis of haemoglobin, problems in the gastrointestinal tract, joints and reproductive system, acute or chronic damage of the nervous system, and anaemia (Jarup, 2003). The major sources of lead in the environment are industrial discharges from batteries, insecticides and from the plastic water pipe industries, among others (Meena et al., 2005; Jarup, 2003).
Copper is an essential element to humans. However, when it is taken in excess quantities, it causes anaemia, liver and kidney damage, jaundice, stomach and intestinal irritation and lung cancer (Meena et al., 2005). Copper enters the environment through industrial emissions and agricultural fertilizers (Fischer et al., 2008).
Chromium, on the other hand, can cause cancer in the digestive tract and lungs, while manganese (Mn) triggers neurotoxicity, low haemoglobin levels and gastrointestinal accumulation (Lesmana et al., 2009).
Furthermore, the presence of nickel exceeding its critical level might bring about serious lung and kidney problems, aside from gastrointestinal distress, pulmonary fibrosis and skin dermatitis. Mercury has been identified as causing nervous system deterioration, including protoplasm poisoning (Lesmana et al., 2009).
REMOVAL OF POLLUTANTS FROM WATER
Removal of pollutants using biosorbents
Numerous studies have been undertaken on developing cheaper, more effective adsorbents from natural polymers (Barakat, 2011). One interesting approach is the use of biosorbents, which can concentrate and bind contaminants.
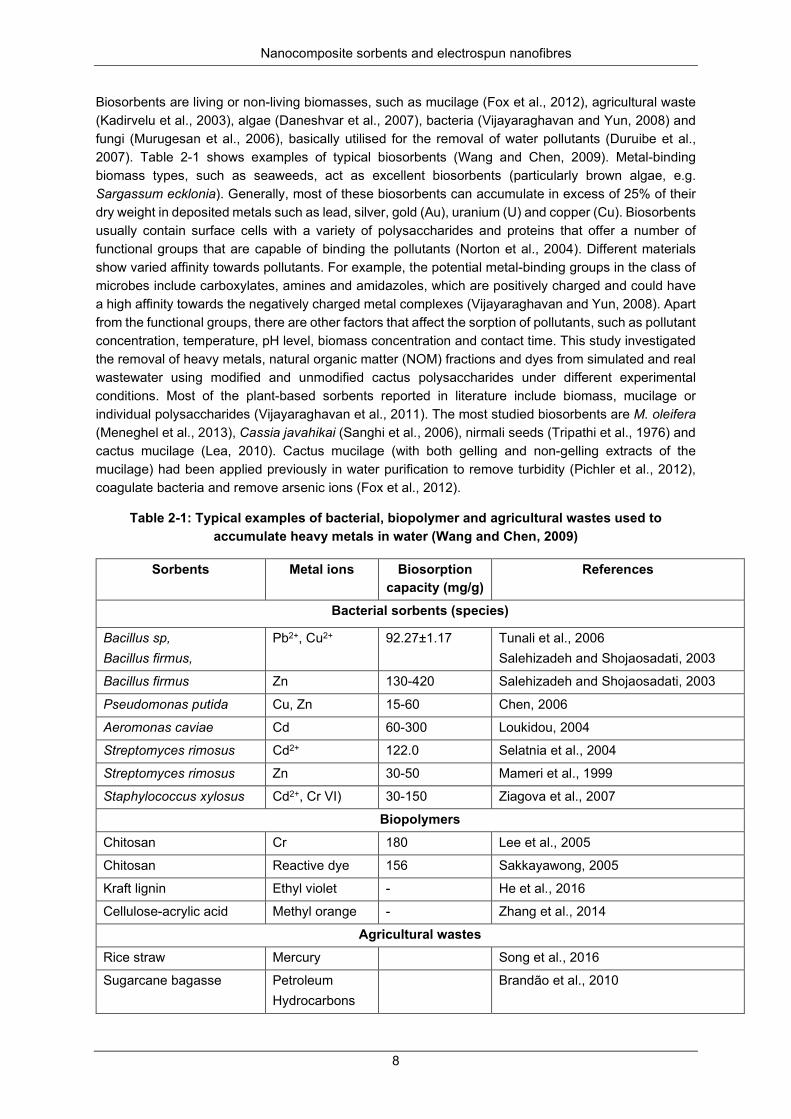
Nanocomposite sorbents and electrospun nanofibres
8
Biosorbents are living or non-living biomasses, such as mucilage (Fox et al., 2012), agricultural waste (Kadirvelu et al., 2003), algae (Daneshvar et al., 2007), bacteria (Vijayaraghavan and Yun, 2008) and fungi (Murugesan et al., 2006), basically utilised for the removal of water pollutants (Duruibe et al., 2007). Table 2-1 shows examples of typical biosorbents (Wang and Chen, 2009). Metal-binding biomass types, such as seaweeds, act as excellent biosorbents (particularly brown algae, e.g. Sargassum ecklonia). Generally, most of these biosorbents can accumulate in excess of 25% of their dry weight in deposited metals such as lead, silver, gold (Au), uranium (U) and copper (Cu). Biosorbents usually contain surface cells with a variety of polysaccharides and proteins that offer a number of functional groups that are capable of binding the pollutants (Norton et al., 2004). Different materials show varied affinity towards pollutants. For example, the potential metal-binding groups in the class of microbes include carboxylates, amines and amidazoles, which are positively charged and could have a high affinity towards the negatively charged metal complexes (Vijayaraghavan and Yun, 2008). Apart from the functional groups, there are other factors that affect the sorption of pollutants, such as pollutant concentration, temperature, pH level, biomass concentration and contact time. This study investigated the removal of heavy metals, natural organic matter (NOM) fractions and dyes from simulated and real wastewater using modified and unmodified cactus polysaccharides under different experimental conditions. Most of the plant-based sorbents reported in literature include biomass, mucilage or individual polysaccharides (Vijayaraghavan et al., 2011). The most studied biosorbents are M. oleifera (Meneghel et al., 2013), Cassia javahikai (Sanghi et al., 2006), nirmali seeds (Tripathi et al., 1976) and cactus mucilage (Lea, 2010). Cactus mucilage (with both gelling and non-gelling extracts of the mucilage) had been applied previously in water purification to remove turbidity (Pichler et al., 2012), coagulate bacteria and remove arsenic ions (Fox et al., 2012).
Table 2-1: Typical examples of bacterial, biopolymer and agricultural wastes used to accumulate heavy metals in water (Wang and Chen, 2009)
Sorbents Metal ions Biosorption capacity (mg/g)
References
Bacterial sorbents (species)
Bacillus sp, Bacillus firmus,
Pb2+, Cu2+ 92.27±1.17 Tunali et al., 2006 Salehizadeh and Shojaosadati, 2003
Bacillus firmus Zn 130-420 Salehizadeh and Shojaosadati, 2003
Pseudomonas putida Cu, Zn 15-60 Chen, 2006
Aeromonas caviae Cd 60-300 Loukidou, 2004
Streptomyces rimosus Cd2+ 122.0 Selatnia et al., 2004
Streptomyces rimosus Zn 30-50 Mameri et al., 1999
Staphylococcus xylosus Cd2+, Cr VI) 30-150 Ziagova et al., 2007
Biopolymers Chitosan Cr 180 Lee et al., 2005
Chitosan Reactive dye 156 Sakkayawong, 2005
Kraft lignin Ethyl violet - He et al., 2016
Cellulose-acrylic acid Methyl orange - Zhang et al., 2014
Agricultural wastes Rice straw Mercury Song et al., 2016
Sugarcane bagasse Petroleum Hydrocarbons
Brandão et al., 2010
Nanocomposite sorbents and electrospun nanofibres
9
This gummy substance is produced in cells found in both the chlorenchyma and parenchyma in cactus plant (Fedala et al., 2015). It is a neutral, complex carbohydrate composed of several sugar residues, including arabinose, galactose, rhamnose and xylose, and a galacturonic acid (Cárdenas et al., 2008). Among the challenges encountered in an attempt to use mucilage for water treatment as a natural coagulant is that it can increase the organic load in water that can lead to secondary pollution (Ghebremichael et al., 2005). Thus, isolating the active components is important to minimise the addition of unnecessary organic material, as well as to maximise its application towards the target pollutant(s). In this study, the major polysaccharides (pectic and hemicellulosic) were carefully isolated from cactus (mucilage) pads and were converted into nanofibres and nanocomposites, and subsequently applied in wastewater treatment. Besides, the increasing number of publications on the adsorption of toxic compounds by polysaccharides, it is evident that there is a recent interest in the synthesis of new adsorbent-containing polysaccharides (Chauhan et al., 2007). Various modification strategies have been developed as a way of improving their potential for various targets. By anchoring a new functional group or derivatising the existing groups, polysaccharides are rendered insoluble in water, thereby increasing their efficiency in aqueous media (Crini, 2005). Specific chemical modifications also offer polysaccharide-attractive qualities, e.g. gels and hydrogels networks (Delval et al., 2000), polymeric resins (Chen et al., 2002), beads (Juang and Shao, 2002), membranes (Krajewska, 2001) and composite materials (Gupta et al., 2013). There are few reports in the literature on the utilisation of either modified or unmodified polysaccharides (such as pectins and hemicellulose) for the removal of pollutants from wastewater.
Use of pectins in water purification
Pectins represent an outstanding group of cell wall polysaccharides with special versatile structures and functions (Ochoa-Villarreal et al., 2012). They are complex heterogeneous polysaccharides composed of a linear chain of (1, 4)-linked-d-galacturonic acid (Caffall and Mohnen, 2009; Mohnen, 2008). The structural classification of the pectic polysaccharides include homogalacturonan (HG) (Figure 2-2), rhamnogalacturonan I (RG-I) and RG-II (Mohnen, 2008).
Numerous processes have been employed in the extraction of pectins, depending on their eventual applications (Schols and Voragen, 1994; Bagherian et al., 2011; Schieber et al., 2003). Apart from the use of chemicals, pectins could be isolated from the tissues using enzymes (Mandalari et al., 2006) or by the use of microwave-assisted extraction (Wang et al., 2007). Among the classic ones is chemical hydrolysis extraction, whereby wet or dry chopped plant material is exposed to hot water, organic or inorganic acid solutions or salt solutions, alkali or their mixtures as extracting solutions (Wu et al., 2007). It should be noted that parameters such as choice of base material, pre-processing technique, temperature, extraction duration, pH level and precipitator affect their isolation process.
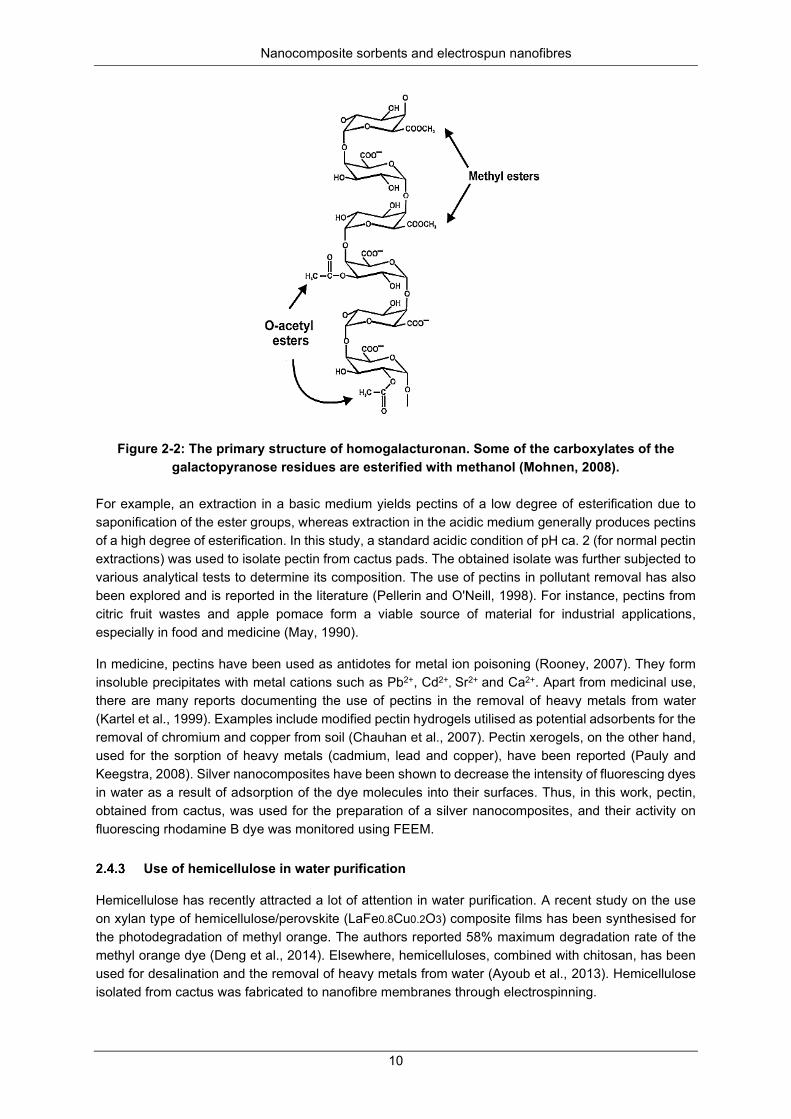
Nanocomposite sorbents and electrospun nanofibres
10
Figure 2-2: The primary structure of homogalacturonan. Some of the carboxylates of the galactopyranose residues are esterified with methanol (Mohnen, 2008).
For example, an extraction in a basic medium yields pectins of a low degree of esterification due to saponification of the ester groups, whereas extraction in the acidic medium generally produces pectins of a high degree of esterification. In this study, a standard acidic condition of pH ca. 2 (for normal pectin extractions) was used to isolate pectin from cactus pads. The obtained isolate was further subjected to various analytical tests to determine its composition. The use of pectins in pollutant removal has also been explored and is reported in the literature (Pellerin and O'Neill, 1998). For instance, pectins from citric fruit wastes and apple pomace form a viable source of material for industrial applications, especially in food and medicine (May, 1990).
In medicine, pectins have been used as antidotes for metal ion poisoning (Rooney, 2007). They form insoluble precipitates with metal cations such as Pb2+, Cd2+, Sr2+ and Ca2+. Apart from medicinal use, there are many reports documenting the use of pectins in the removal of heavy metals from water (Kartel et al., 1999). Examples include modified pectin hydrogels utilised as potential adsorbents for the removal of chromium and copper from soil (Chauhan et al., 2007). Pectin xerogels, on the other hand, used for the sorption of heavy metals (cadmium, lead and copper), have been reported (Pauly and Keegstra, 2008). Silver nanocomposites have been shown to decrease the intensity of fluorescing dyes in water as a result of adsorption of the dye molecules into their surfaces. Thus, in this work, pectin, obtained from cactus, was used for the preparation of a silver nanocomposites, and their activity on fluorescing rhodamine B dye was monitored using FEEM.
Use of hemicellulose in water purification
Hemicellulose has recently attracted a lot of attention in water purification. A recent study on the use on xylan type of hemicellulose/perovskite (LaFe0.8Cu0.2O3) composite films has been synthesised for the photodegradation of methyl orange. The authors reported 58% maximum degradation rate of the methyl orange dye (Deng et al., 2014). Elsewhere, hemicelluloses, combined with chitosan, has been used for desalination and the removal of heavy metals from water (Ayoub et al., 2013). Hemicellulose isolated from cactus was fabricated to nanofibre membranes through electrospinning.
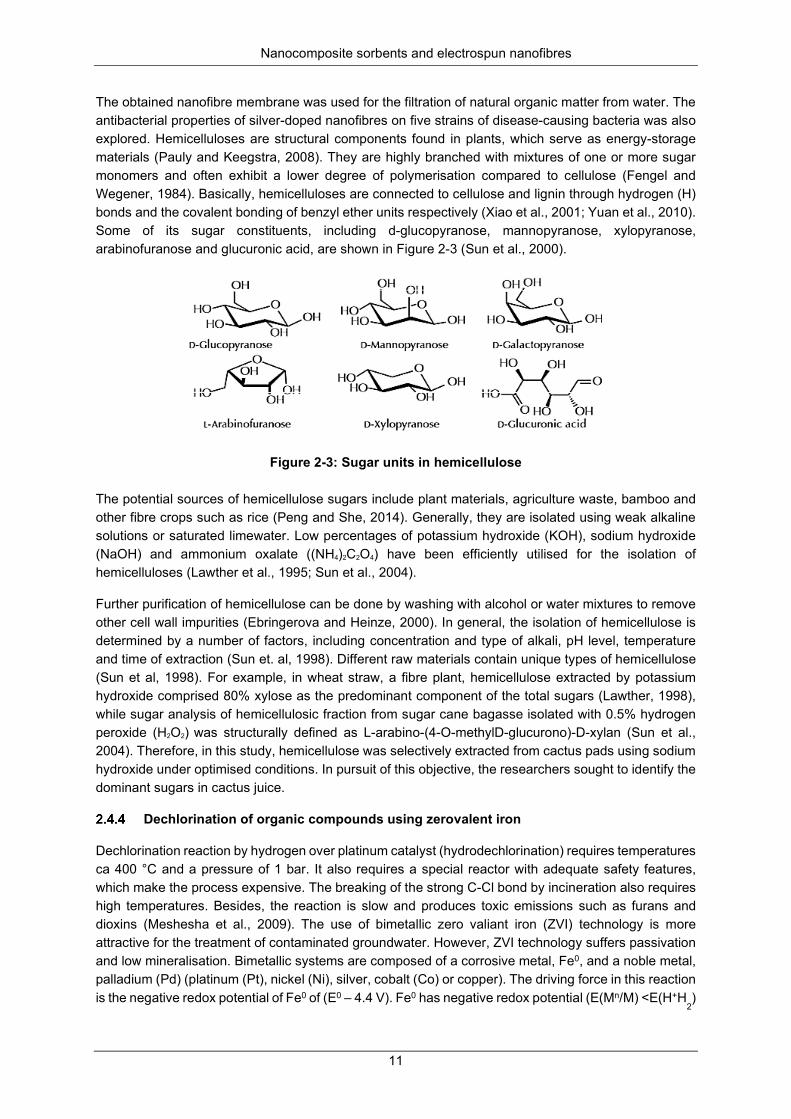
Nanocomposite sorbents and electrospun nanofibres
11
The obtained nanofibre membrane was used for the filtration of natural organic matter from water. The antibacterial properties of silver-doped nanofibres on five strains of disease-causing bacteria was also explored. Hemicelluloses are structural components found in plants, which serve as energy-storage materials (Pauly and Keegstra, 2008). They are highly branched with mixtures of one or more sugar monomers and often exhibit a lower degree of polymerisation compared to cellulose (Fengel and Wegener, 1984). Basically, hemicelluloses are connected to cellulose and lignin through hydrogen (H) bonds and the covalent bonding of benzyl ether units respectively (Xiao et al., 2001; Yuan et al., 2010). Some of its sugar constituents, including d-glucopyranose, mannopyranose, xylopyranose, arabinofuranose and glucuronic acid, are shown in Figure 2-3 (Sun et al., 2000).
Figure 2-3: Sugar units in hemicellulose The potential sources of hemicellulose sugars include plant materials, agriculture waste, bamboo and other fibre crops such as rice (Peng and She, 2014). Generally, they are isolated using weak alkaline solutions or saturated limewater. Low percentages of potassium hydroxide (KOH), sodium hydroxide (NaOH) and ammonium oxalate ((NH4)2C2O4) have been efficiently utilised for the isolation of hemicelluloses (Lawther et al., 1995; Sun et al., 2004).
Further purification of hemicellulose can be done by washing with alcohol or water mixtures to remove other cell wall impurities (Ebringerova and Heinze, 2000). In general, the isolation of hemicellulose is determined by a number of factors, including concentration and type of alkali, pH level, temperature and time of extraction (Sun et. al, 1998). Different raw materials contain unique types of hemicellulose (Sun et al, 1998). For example, in wheat straw, a fibre plant, hemicellulose extracted by potassium hydroxide comprised 80% xylose as the predominant component of the total sugars (Lawther, 1998), while sugar analysis of hemicellulosic fraction from sugar cane bagasse isolated with 0.5% hydrogen peroxide (H2O2) was structurally defined as L-arabino-(4-O-methylD-glucurono)-D-xylan (Sun et al., 2004). Therefore, in this study, hemicellulose was selectively extracted from cactus pads using sodium hydroxide under optimised conditions. In pursuit of this objective, the researchers sought to identify the dominant sugars in cactus juice.
Dechlorination of organic compounds using zerovalent iron
Dechlorination reaction by hydrogen over platinum catalyst (hydrodechlorination) requires temperatures ca 400 °C and a pressure of 1 bar. It also requires a special reactor with adequate safety features, which make the process expensive. The breaking of the strong C-Cl bond by incineration also requires high temperatures. Besides, the reaction is slow and produces toxic emissions such as furans and dioxins (Meshesha et al., 2009). The use of bimetallic zero valiant iron (ZVI) technology is more attractive for the treatment of contaminated groundwater. However, ZVI technology suffers passivation and low mineralisation. Bimetallic systems are composed of a corrosive metal, Fe0, and a noble metal, palladium (Pd) (platinum (Pt), nickel (Ni), silver, cobalt (Co) or copper). The driving force in this reaction is the negative redox potential of Fe0 of (E0 – 4.4 V). Fe0 has negative redox potential (E(Mn/M) <E(H+H
2)
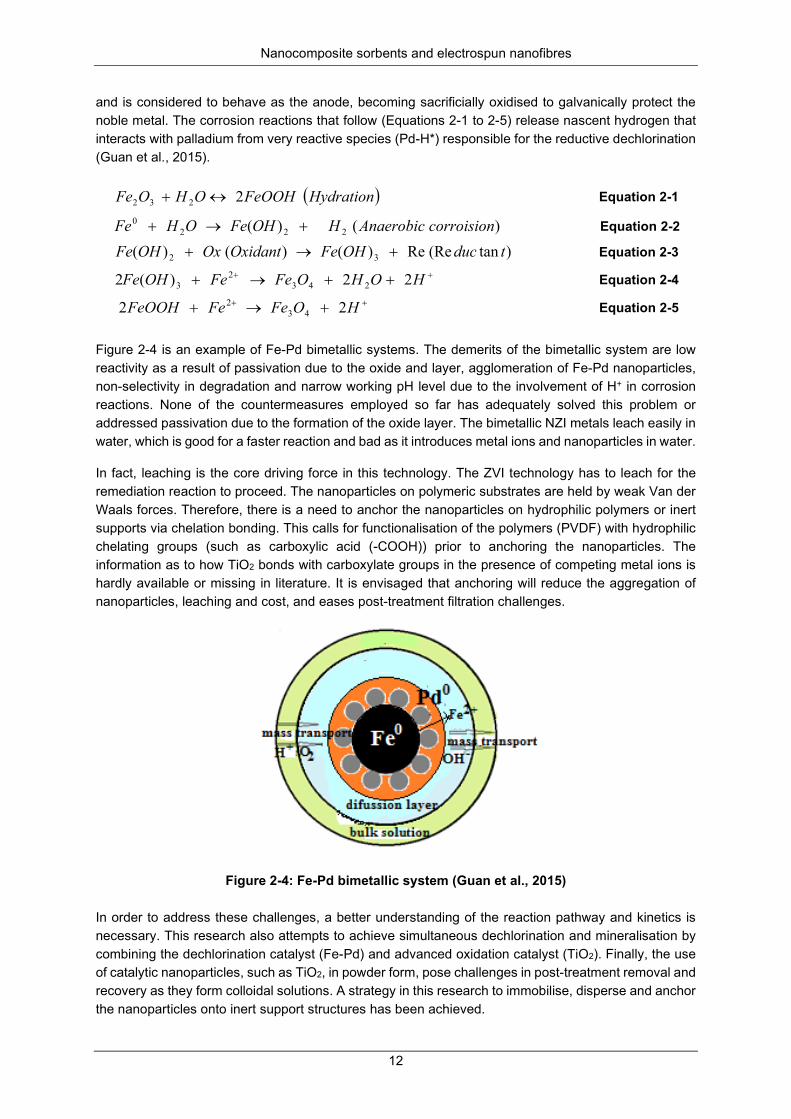
Nanocomposite sorbents and electrospun nanofibres
12
and is considered to behave as the anode, becoming sacrificially oxidised to galvanically protect the noble metal. The corrosion reactions that follow (Equations 2-1 to 2-5) release nascent hydrogen that interacts with palladium from very reactive species (Pd-H*) responsible for the reductive dechlorination (Guan et al., 2015).
( )HydrationFeOOHOHOFe 2232 ↔+ Equation 2-1
)()( 2220 corroisionAnaerobicHOHFeOHFe +→+ Equation 2-2
)tan(ReRe)()()( 32 tducOHFeOxidantOxOHFe +→+ Equation 2-3 ++ ++→+ HOHOFeFeOHFe 22)(2 243
23 Equation 2-4
++ +→+ HOFeFeFeOOH 22 432 Equation 2-5
Figure 2-4 is an example of Fe-Pd bimetallic systems. The demerits of the bimetallic system are low reactivity as a result of passivation due to the oxide and layer, agglomeration of Fe-Pd nanoparticles, non-selectivity in degradation and narrow working pH level due to the involvement of H+ in corrosion reactions. None of the countermeasures employed so far has adequately solved this problem or addressed passivation due to the formation of the oxide layer. The bimetallic NZI metals leach easily in water, which is good for a faster reaction and bad as it introduces metal ions and nanoparticles in water.
In fact, leaching is the core driving force in this technology. The ZVI technology has to leach for the remediation reaction to proceed. The nanoparticles on polymeric substrates are held by weak Van der Waals forces. Therefore, there is a need to anchor the nanoparticles on hydrophilic polymers or inert supports via chelation bonding. This calls for functionalisation of the polymers (PVDF) with hydrophilic chelating groups (such as carboxylic acid (-COOH)) prior to anchoring the nanoparticles. The information as to how TiO2 bonds with carboxylate groups in the presence of competing metal ions is hardly available or missing in literature. It is envisaged that anchoring will reduce the aggregation of nanoparticles, leaching and cost, and eases post-treatment filtration challenges.
Figure 2-4: Fe-Pd bimetallic system (Guan et al., 2015) In order to address these challenges, a better understanding of the reaction pathway and kinetics is necessary. This research also attempts to achieve simultaneous dechlorination and mineralisation by combining the dechlorination catalyst (Fe-Pd) and advanced oxidation catalyst (TiO2). Finally, the use of catalytic nanoparticles, such as TiO2, in powder form, pose challenges in post-treatment removal and recovery as they form colloidal solutions. A strategy in this research to immobilise, disperse and anchor the nanoparticles onto inert support structures has been achieved.
Nanocomposite sorbents and electrospun nanofibres
13
Although immobilisation may reduce the active surface area for photocatalytic efficiency, the reduced agglomeration of nanoparticles and the benefits of post-filtration and recovery of the catalysts outweigh this drawback. Although the preparation of nanofibres decorated with nanoparticles may not be new, a polymeric nitrogen-doped TiO2 nanofibre with reduced band gap and loaded with Fe-Pd nanoparticles for the simultaneous dechlorination and catalytic photodegradation of mixed pesticides in the visible light, all in one step, is novel. This is the justification of the chosen methods of anchoring and immobilising the catalytic dechlorination and photodegradation nanoparticles on inert supports.
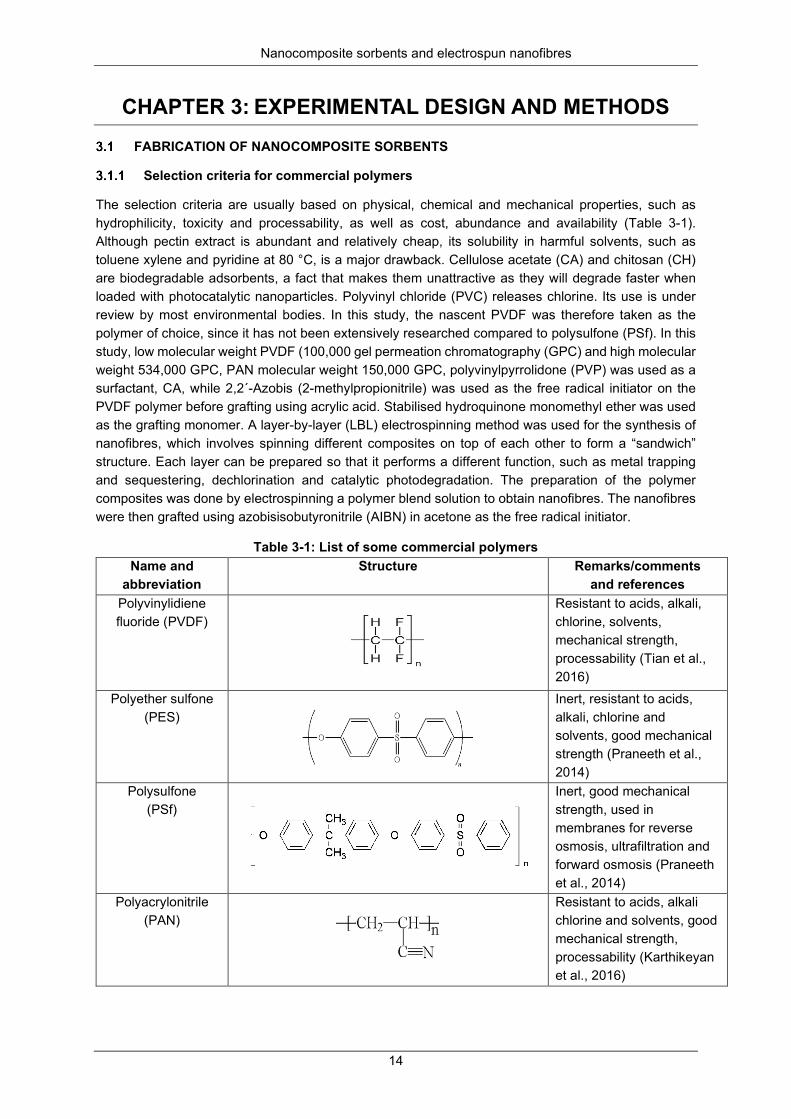
Nanocomposite sorbents and electrospun nanofibres
14
CHAPTER 3: EXPERIMENTAL DESIGN AND METHODS FABRICATION OF NANOCOMPOSITE SORBENTS
Selection criteria for commercial polymers
The selection criteria are usually based on physical, chemical and mechanical properties, such as hydrophilicity, toxicity and processability, as well as cost, abundance and availability (Table 3-1). Although pectin extract is abundant and relatively cheap, its solubility in harmful solvents, such as toluene xylene and pyridine at 80 °C, is a major drawback. Cellulose acetate (CA) and chitosan (CH) are biodegradable adsorbents, a fact that makes them unattractive as they will degrade faster when loaded with photocatalytic nanoparticles. Polyvinyl chloride (PVC) releases chlorine. Its use is under review by most environmental bodies. In this study, the nascent PVDF was therefore taken as the polymer of choice, since it has not been extensively researched compared to polysulfone (PSf). In this study, low molecular weight PVDF (100,000 gel permeation chromatography (GPC) and high molecular weight 534,000 GPC, PAN molecular weight 150,000 GPC, polyvinylpyrrolidone (PVP) was used as a surfactant, CA, while 2,2´-Azobis (2-methylpropionitrile) was used as the free radical initiator on the PVDF polymer before grafting using acrylic acid. Stabilised hydroquinone monomethyl ether was used as the grafting monomer. A layer-by-layer (LBL) electrospinning method was used for the synthesis of nanofibres, which involves spinning different composites on top of each other to form a “sandwich” structure. Each layer can be prepared so that it performs a different function, such as metal trapping and sequestering, dechlorination and catalytic photodegradation. The preparation of the polymer composites was done by electrospinning a polymer blend solution to obtain nanofibres. The nanofibres were then grafted using azobisisobutyronitrile (AIBN) in acetone as the free radical initiator.
Table 3-1: List of some commercial polymers Name and
abbreviation Structure Remarks/comments
and references Polyvinylidiene fluoride (PVDF)
Resistant to acids, alkali, chlorine, solvents, mechanical strength, processability (Tian et al., 2016)
Polyether sulfone (PES)
Inert, resistant to acids, alkali, chlorine and solvents, good mechanical strength (Praneeth et al., 2014)
Polysulfone (PSf)
Inert, good mechanical strength, used in membranes for reverse osmosis, ultrafiltration and forward osmosis (Praneeth et al., 2014)
Polyacrylonitrile (PAN)
Resistant to acids, alkali chlorine and solvents, good mechanical strength, processability (Karthikeyan et al., 2016)
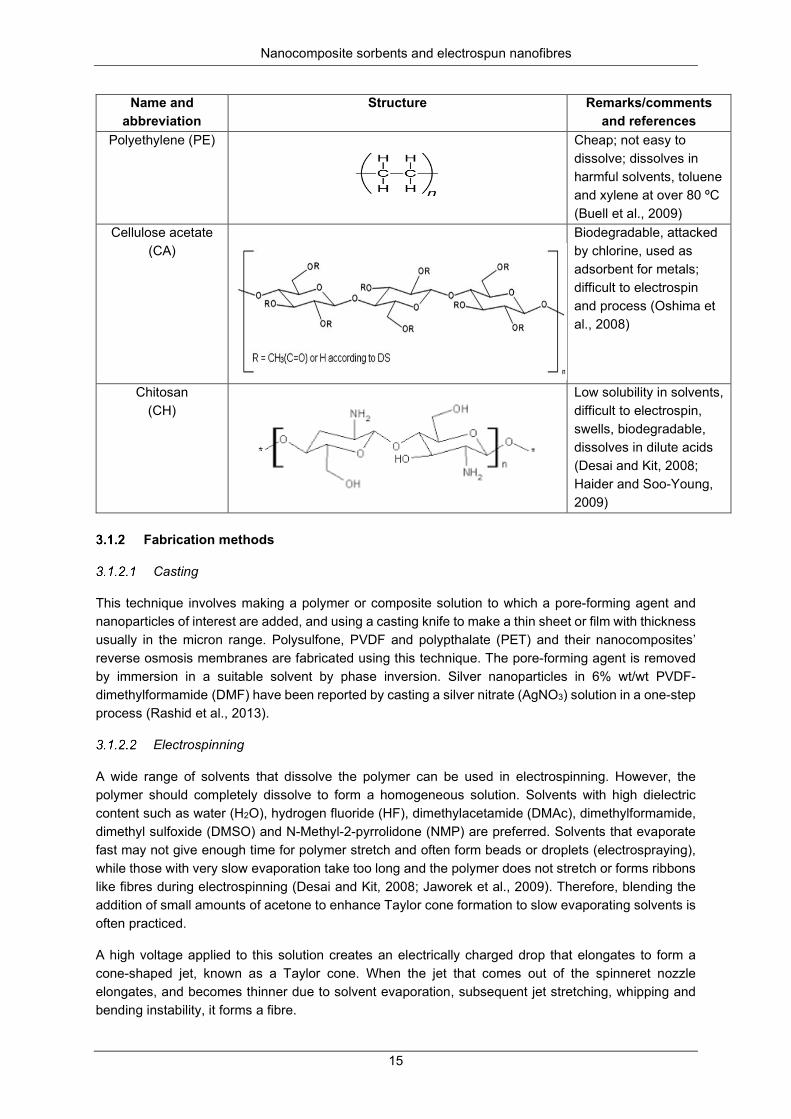
Nanocomposite sorbents and electrospun nanofibres
15
Name and abbreviation
Structure Remarks/comments and references
Polyethylene (PE)
Cheap; not easy to dissolve; dissolves in harmful solvents, toluene and xylene at over 80 ºC (Buell et al., 2009)
Cellulose acetate (CA)
Biodegradable, attacked by chlorine, used as adsorbent for metals; difficult to electrospin and process (Oshima et al., 2008)
Chitosan (CH)
Low solubility in solvents, difficult to electrospin, swells, biodegradable, dissolves in dilute acids (Desai and Kit, 2008; Haider and Soo-Young, 2009)
Fabrication methods
Casting
This technique involves making a polymer or composite solution to which a pore-forming agent and nanoparticles of interest are added, and using a casting knife to make a thin sheet or film with thickness usually in the micron range. Polysulfone, PVDF and polypthalate (PET) and their nanocomposites’ reverse osmosis membranes are fabricated using this technique. The pore-forming agent is removed by immersion in a suitable solvent by phase inversion. Silver nanoparticles in 6% wt/wt PVDF- dimethylformamide (DMF) have been reported by casting a silver nitrate (AgNO3) solution in a one-step process (Rashid et al., 2013).
Electrospinning
A wide range of solvents that dissolve the polymer can be used in electrospinning. However, the polymer should completely dissolve to form a homogeneous solution. Solvents with high dielectric content such as water (H2O), hydrogen fluoride (HF), dimethylacetamide (DMAc), dimethylformamide, dimethyl sulfoxide (DMSO) and N-Methyl-2-pyrrolidone (NMP) are preferred. Solvents that evaporate fast may not give enough time for polymer stretch and often form beads or droplets (electrospraying), while those with very slow evaporation take too long and the polymer does not stretch or forms ribbons like fibres during electrospinning (Desai and Kit, 2008; Jaworek et al., 2009). Therefore, blending the addition of small amounts of acetone to enhance Taylor cone formation to slow evaporating solvents is often practiced.
A high voltage applied to this solution creates an electrically charged drop that elongates to form a cone-shaped jet, known as a Taylor cone. When the jet that comes out of the spinneret nozzle elongates, and becomes thinner due to solvent evaporation, subsequent jet stretching, whipping and bending instability, it forms a fibre.

Nanocomposite sorbents and electrospun nanofibres
16
This process is called electrospinning (Jaworek et al., 2009; Rodde et al., 2008). However, when the polymer drops that pass thorough the same nozzle break to form a microfine jet of droplet spray, the process is known as electrospraying. By controlling the polymer molecular weight, the viscosity of the solution, temperature, humidity, pressure electric field strength, flow rates and manipulating the rate of evaporation of the solvent, blend ratios and nozzle bore size, the desired fibre parameters, such as diameters and pore sizes, may be achieved (Desai and Kit, 2008). These requisite conditions, such as viscosity, depend on polymer concentration (weight percentage) and also temperature, which in turn depends on the molecular weight of the polymer. Environmental effects can be fixed after careful consideration. Therefore, these many variables can be reduced to four main parameters: polymer solution covers, concentration, viscosity and surface tension. Electric field strength is derived from applied voltage and distance. Atmospheric conditions (humidity, temperature and pressure) can be fixed or ambient conditions can be used. Finally, the flow rate of the polymer solution is optimised. These conditions, which are necessary for electrospinning optimisation, are well covered in literature and also in earlier work of the researchers (Rodde et al., 2008; Min et al., 2004; Nthumbi et al., 2011). Rather than start with optimising for the viscosity in order to electrospin smooth fibres, a new practical approach is to start optimising for the weight percentage of a polymer solution that would electrospin well and produce fibres. This protocol involves making polymer solutions with a range of weight percentages and then optimising it to obtain the optimum concentration. The specific viscosity of a polymer solution is determined as the ratio in Equation 3-1, where ηo is zero shear rate viscosity of the solution at concentration c, and ηs is the solvent viscosity. From this equation, the intrinsic viscosity [η] of a polymer is determined as the linear extrapolation of the specific viscosity ηsp measured from concentration c to the concentration at C = 0.
Equation 3-1
Equation 3-2
The intrinsic viscosity [η] is also related to the molecular weight by the Mark Houwick equation:
Equation 3-3 where the constants K and α depend on polymer, solvent and temperature (Khan et al., 2000; Jaworek et al., 2009; Kurita, 2001; Min et al., 2004). Obaid et al. (2015) electrospun effective and reusable oil/water separation membranes based on modified PSf electrospun nanofibre mats. In the preparation of PSf support layers, the PSf nanofibre mats were fabricated using solutions containing different amounts of PSf (15, 18 and 20 wt %), and different loadings of NaOH powder (0, 1.5, 1.7 and 2.5 wt %) as the prepared membranes. Polysulfone and NaOH solutions (in DMF) have been prepared separately and mixed together. Typically, the desired amount of NaOH was added to 3 ml of DMF, and then the mixture was stirred at 20 °C for 24 hours. The obtained NaOH solution was mixed with a pre-prepared PSf solution. The stirring was carried out for another 24 hours. Navarro et al. (2016) used the bubble electrospinning technique and electrospun PVDF nanofibres. This work reported, for the first time, the electrospinning of the piezoelectric and ferroelectric PVDF by means of the bubble electrospinning technique. An important finding highlighted by the researchers was the high production rate of the obtained PVDF nanofibres, which was higher than that of the reported traditional electrospinning technique.
0
s
ss p η
ηηη −=
[ ] l i m0
=
→ cs p
c
ηη
[ ] αη WK M=
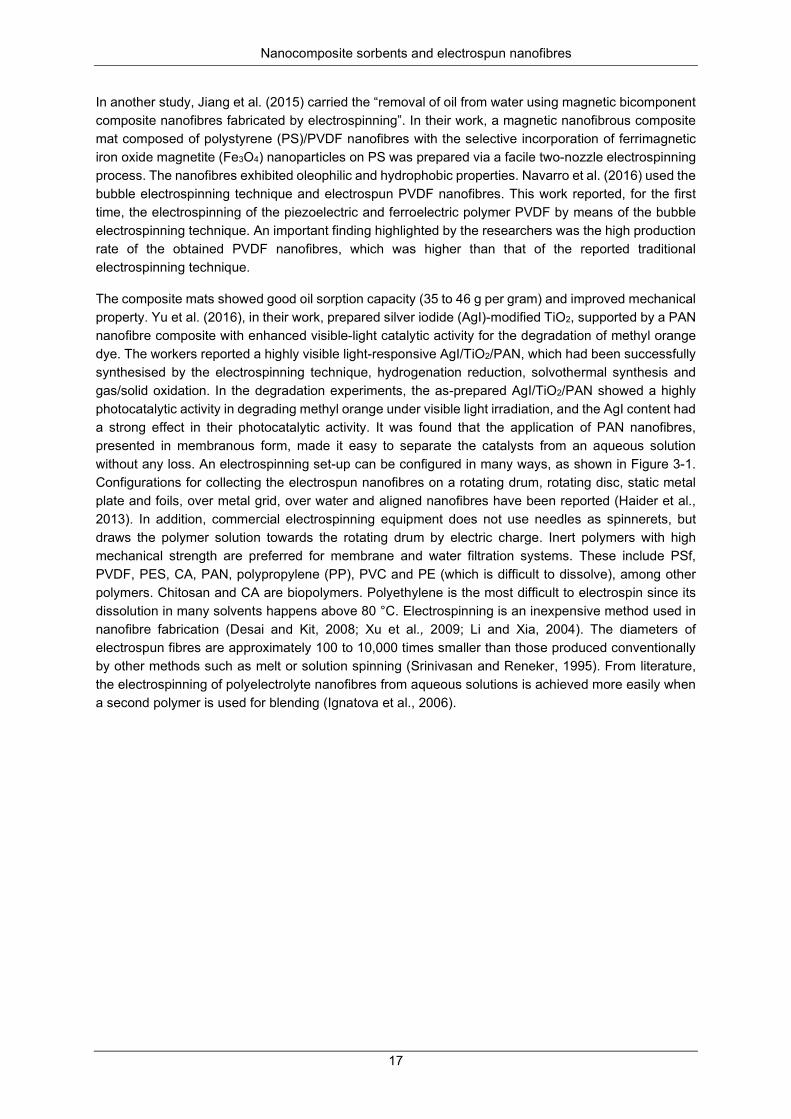
Nanocomposite sorbents and electrospun nanofibres
17
In another study, Jiang et al. (2015) carried the “removal of oil from water using magnetic bicomponent composite nanofibres fabricated by electrospinning”. In their work, a magnetic nanofibrous composite mat composed of polystyrene (PS)/PVDF nanofibres with the selective incorporation of ferrimagnetic iron oxide magnetite (Fe3O4) nanoparticles on PS was prepared via a facile two-nozzle electrospinning process. The nanofibres exhibited oleophilic and hydrophobic properties. Navarro et al. (2016) used the bubble electrospinning technique and electrospun PVDF nanofibres. This work reported, for the first time, the electrospinning of the piezoelectric and ferroelectric polymer PVDF by means of the bubble electrospinning technique. An important finding highlighted by the researchers was the high production rate of the obtained PVDF nanofibres, which was higher than that of the reported traditional electrospinning technique.
The composite mats showed good oil sorption capacity (35 to 46 g per gram) and improved mechanical property. Yu et al. (2016), in their work, prepared silver iodide (AgI)-modified TiO2, supported by a PAN nanofibre composite with enhanced visible-light catalytic activity for the degradation of methyl orange dye. The workers reported a highly visible light-responsive AgI/TiO2/PAN, which had been successfully synthesised by the electrospinning technique, hydrogenation reduction, solvothermal synthesis and gas/solid oxidation. In the degradation experiments, the as-prepared AgI/TiO2/PAN showed a highly photocatalytic activity in degrading methyl orange under visible light irradiation, and the AgI content had a strong effect in their photocatalytic activity. It was found that the application of PAN nanofibres, presented in membranous form, made it easy to separate the catalysts from an aqueous solution without any loss. An electrospinning set-up can be configured in many ways, as shown in Figure 3-1. Configurations for collecting the electrospun nanofibres on a rotating drum, rotating disc, static metal plate and foils, over metal grid, over water and aligned nanofibres have been reported (Haider et al., 2013). In addition, commercial electrospinning equipment does not use needles as spinnerets, but draws the polymer solution towards the rotating drum by electric charge. Inert polymers with high mechanical strength are preferred for membrane and water filtration systems. These include PSf, PVDF, PES, CA, PAN, polypropylene (PP), PVC and PE (which is difficult to dissolve), among other polymers. Chitosan and CA are biopolymers. Polyethylene is the most difficult to electrospin since its dissolution in many solvents happens above 80 °C. Electrospinning is an inexpensive method used in nanofibre fabrication (Desai and Kit, 2008; Xu et al., 2009; Li and Xia, 2004). The diameters of electrospun fibres are approximately 100 to 10,000 times smaller than those produced conventionally by other methods such as melt or solution spinning (Srinivasan and Reneker, 1995). From literature, the electrospinning of polyelectrolyte nanofibres from aqueous solutions is achieved more easily when a second polymer is used for blending (Ignatova et al., 2006).
Nanocomposite sorbents and electrospun nanofibres
18
Figure 3-1: Electrospinning and electrospraying set-up (Jaworek et al., 2009)
The electrospinning process can be configured to produce nanofibre mats, aligned nanofibres, multi-layered mats and “sandwich” multi-layered composites containing nanoparticles. This is achieved by using a rotating disc, rotating drum or rotating metal plate (Haider et al., 2013). Pure CH has been electrospun from aqueous acetic acid and 1,1,1,3,3,3-hexafluoro-2-propanol (HFP). However, the fibres formed were soluble in water and had to be cross-linked. Again, these fibres were of submicron level (Xu et al., 2009; Musyoka et al., 2013). Desai and Kit (2008) have extensively studied electrospinning of CH, CH/polyacrylamide and CH polyethylene oxide using 1,1,1-trifluoroacetic acid (TFA) as solvent. They obtained fibres with diameters of 307 ±67 nm. The researchers also reported electrospun CH polyacrylamide blends with the resultant submicron fibre diameters of 250 to 300 nm (Desai and Kit, 2008). Byung-Moo Min et al. (2004) also reported electrospun fibres from chitin and CH with average fibre diameters in the 110 nm range (40-640 nm with most below 100 nm), but also using HFP (Min et al., 2004). Chen et al. (2008) reported electrospinning collagen/CH blends dissolved in (HFP/TFA). Ignatova et al. (2006) reported electrospun quaternised CH in PVA. The obtained fibre diameters were 60-200 nm. The fibres obtained had diameters that varied up to 300 nm.
Polymerisation
Polymerisation has been used as a technique to introduce functionality in nanomaterials. One of the routes to introduce functionality is free radical polymerisation. The outcomes depend on the choice of co-polymers used (Bhattacharya et al., 2009). The polymerisation can be achieved in-situ or can be initiated ex-situ using suitable reagents or by thermal or ultraviolet (UV) activation (Samart et al., 2014). The resultant co-polymer has characteristics for both monomers. Co-polymerisation also changes the physical and chemical properties, such as melt temperature and crystallinity (Bhattacharya et al., 2009). In their study, Li et al. (2013) prepared a PVDF membrane using the phase inversion method. A mixture of PVDF (4.0 g) and PVP (0.8 g) in 23 mℓ of DMAc was heated to 60 °C to obtain a homogeneous polymer solution. The PVP acts as a surfactant, as well as the pore-forming agent. The solution was degassed and cast with the knife set at 200 microns and the membrane was dipped in a coagulation water bath consisting of DMAc with a water volume ratio of 5:5. The PVP goes into solution leaving a PVDF membrane with pores. The membrane was grafted through a free radical polymerisation mechanism using AIBN as the initiator. Another approach is the grafting of organic and inorganic surfaces with synthetic polymers in order to alter the surface functionality and topology.
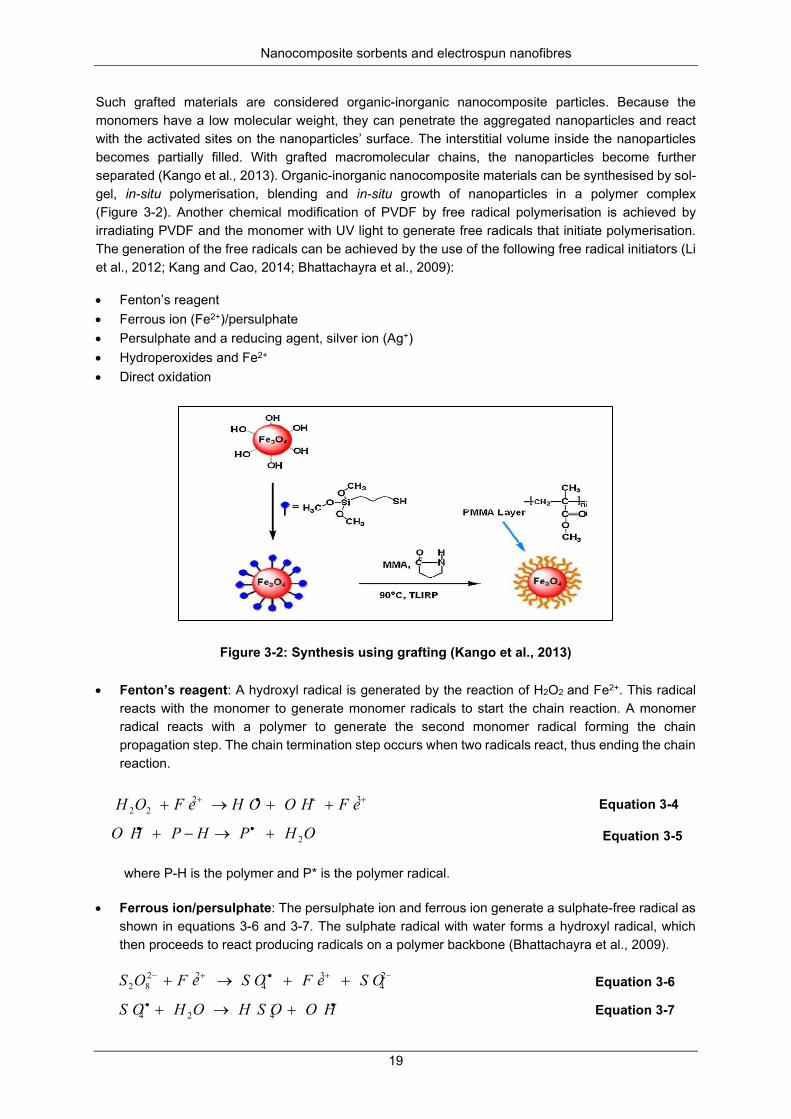
Nanocomposite sorbents and electrospun nanofibres
19
Such grafted materials are considered organic-inorganic nanocomposite particles. Because the monomers have a low molecular weight, they can penetrate the aggregated nanoparticles and react with the activated sites on the nanoparticles’ surface. The interstitial volume inside the nanoparticles becomes partially filled. With grafted macromolecular chains, the nanoparticles become further separated (Kango et al., 2013). Organic-inorganic nanocomposite materials can be synthesised by sol- gel, in-situ polymerisation, blending and in-situ growth of nanoparticles in a polymer complex (Figure 3-2). Another chemical modification of PVDF by free radical polymerisation is achieved by irradiating PVDF and the monomer with UV light to generate free radicals that initiate polymerisation. The generation of the free radicals can be achieved by the use of the following free radical initiators (Li et al., 2012; Kang and Cao, 2014; Bhattachayra et al., 2009):
• Fenton’s reagent • Ferrous ion (Fe2+)/persulphate • Persulphate and a reducing agent, silver ion (Ag+) • Hydroperoxides and Fe2+ • Direct oxidation
Figure 3-2: Synthesis using grafting (Kango et al., 2013) • Fenton’s reagent: A hydroxyl radical is generated by the reaction of H2O2 and Fe2+. This radical
reacts with the monomer to generate monomer radicals to start the chain reaction. A monomer radical reacts with a polymer to generate the second monomer radical forming the chain propagation step. The chain termination step occurs when two radicals react, thus ending the chain reaction.
Equation 3-4
Equation 3-5 where P-H is the polymer and P* is the polymer radical. • Ferrous ion/persulphate: The persulphate ion and ferrous ion generate a sulphate-free radical as
shown in equations 3-6 and 3-7. The sulphate radical with water forms a hydroxyl radical, which then proceeds to react producing radicals on a polymer backbone (Bhattachayra et al., 2009).
Equation 3-6
Equation 3-7
3222
+=•+ ++→+ F eO HH OF eOH
2OHPHPO H +→−+ ••
24
34
2282
−+•−+− ++→+ S OF eS OF eOS
424•−•− +→+ O HH S OOHS O
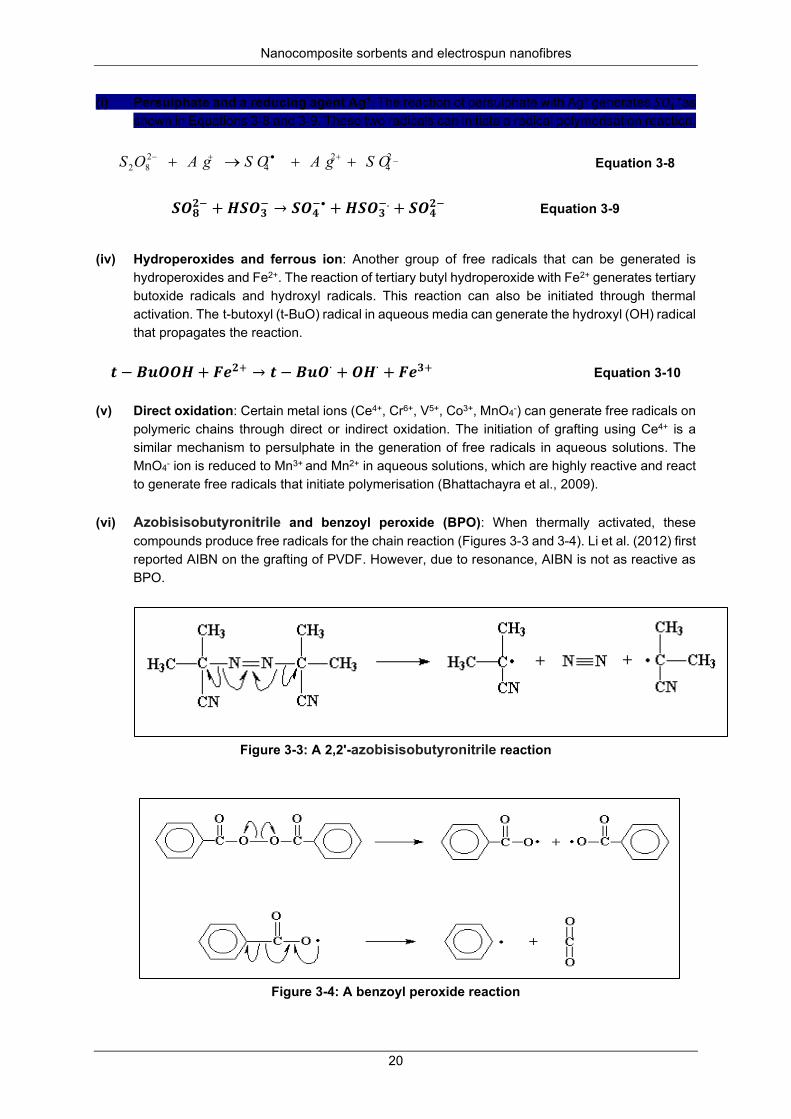
Nanocomposite sorbents and electrospun nanofibres
20
(i) Persulphate and a reducing agent Ag+: The reaction of persulphate with Ag+ generates 𝑆𝑆𝑂𝑂4−•as shown in Equations 3-8 and 3-9. These two radicals can initiate a radical polymerisation reaction.
Equation 3-8
𝑺𝑺𝑺𝑺𝟖𝟖𝟐𝟐− + 𝑯𝑯𝑺𝑺𝑺𝑺𝟑𝟑
− → 𝑺𝑺𝑺𝑺𝟒𝟒−• + 𝑯𝑯𝑺𝑺𝑺𝑺𝟑𝟑
−. + 𝑺𝑺𝑺𝑺𝟒𝟒𝟐𝟐− Equation 3-9
(iv) Hydroperoxides and ferrous ion: Another group of free radicals that can be generated is hydroperoxides and Fe2+. The reaction of tertiary butyl hydroperoxide with Fe2+ generates tertiary butoxide radicals and hydroxyl radicals. This reaction can also be initiated through thermal activation. The t-butoxyl (t-BuO) radical in aqueous media can generate the hydroxyl (OH) radical that propagates the reaction.
𝒕𝒕 − 𝑩𝑩𝑩𝑩𝑺𝑺𝑺𝑺𝑯𝑯 + 𝑭𝑭𝑭𝑭𝟐𝟐+ → 𝒕𝒕 − 𝑩𝑩𝑩𝑩𝑺𝑺∙ + 𝑺𝑺𝑯𝑯∙ + 𝑭𝑭𝑭𝑭𝟑𝟑+ Equation 3-10
(v) Direct oxidation: Certain metal ions (Ce4+, Cr6+, V5+, Co3+, MnO4-) can generate free radicals on
polymeric chains through direct or indirect oxidation. The initiation of grafting using Ce4+ is a similar mechanism to persulphate in the generation of free radicals in aqueous solutions. The MnO4- ion is reduced to Mn3+ and Mn2+ in aqueous solutions, which are highly reactive and react to generate free radicals that initiate polymerisation (Bhattachayra et al., 2009).
(vi) Azobisisobutyronitrile and benzoyl peroxide (BPO): When thermally activated, these
compounds produce free radicals for the chain reaction (Figures 3-3 and 3-4). Li et al. (2012) first reported AIBN on the grafting of PVDF. However, due to resonance, AIBN is not as reactive as BPO.
Figure 3-3: A 2,2'-azobisisobutyronitrile reaction
Figure 3-4: A benzoyl peroxide reaction
_24
24
282 S OA gS OA gOS ++→+ +•−+−
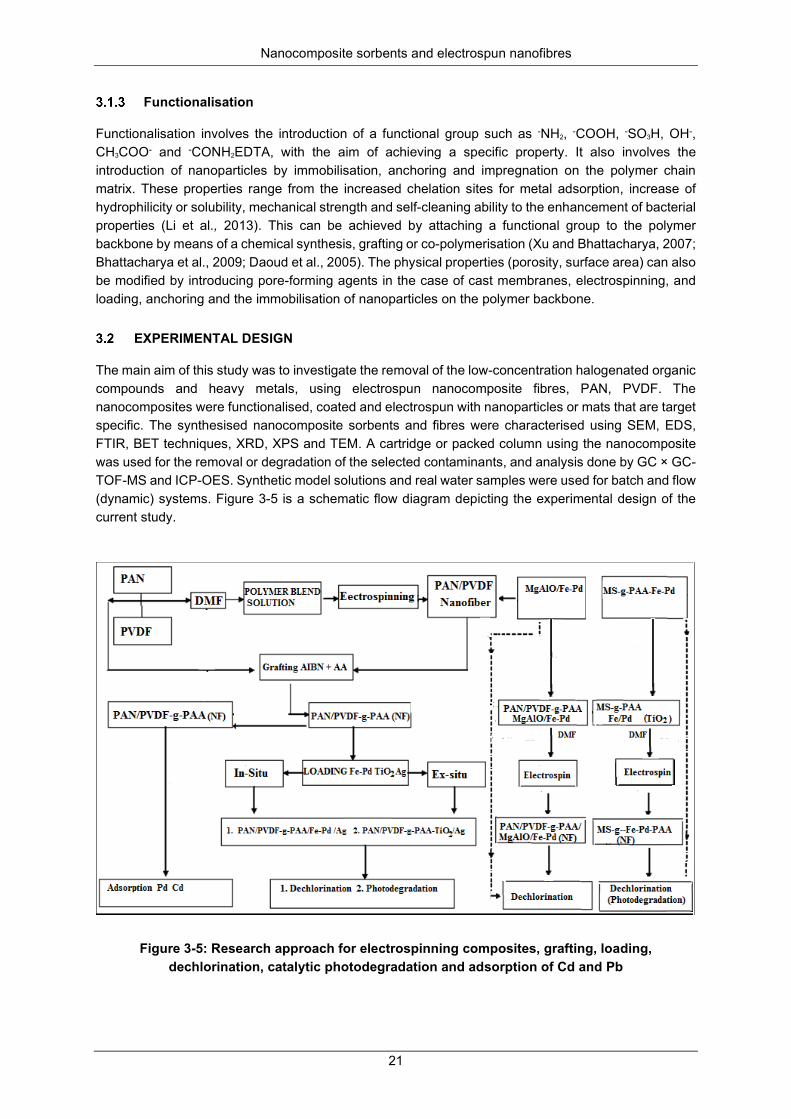
Nanocomposite sorbents and electrospun nanofibres
21
Functionalisation
Functionalisation involves the introduction of a functional group such as -NH2, -COOH, -SO3H, OH-, CH3COO- and -CONH2EDTA, with the aim of achieving a specific property. It also involves the introduction of nanoparticles by immobilisation, anchoring and impregnation on the polymer chain matrix. These properties range from the increased chelation sites for metal adsorption, increase of hydrophilicity or solubility, mechanical strength and self-cleaning ability to the enhancement of bacterial properties (Li et al., 2013). This can be achieved by attaching a functional group to the polymer backbone by means of a chemical synthesis, grafting or co-polymerisation (Xu and Bhattacharya, 2007; Bhattacharya et al., 2009; Daoud et al., 2005). The physical properties (porosity, surface area) can also be modified by introducing pore-forming agents in the case of cast membranes, electrospinning, and loading, anchoring and the immobilisation of nanoparticles on the polymer backbone.
EXPERIMENTAL DESIGN
The main aim of this study was to investigate the removal of the low-concentration halogenated organic compounds and heavy metals, using electrospun nanocomposite fibres, PAN, PVDF. The nanocomposites were functionalised, coated and electrospun with nanoparticles or mats that are target specific. The synthesised nanocomposite sorbents and fibres were characterised using SEM, EDS, FTIR, BET techniques, XRD, XPS and TEM. A cartridge or packed column using the nanocomposite was used for the removal or degradation of the selected contaminants, and analysis done by GC × GC-TOF-MS and ICP-OES. Synthetic model solutions and real water samples were used for batch and flow (dynamic) systems. Figure 3-5 is a schematic flow diagram depicting the experimental design of the current study.
Figure 3-5: Research approach for electrospinning composites, grafting, loading, dechlorination, catalytic photodegradation and adsorption of Cd and Pb
Nanocomposite sorbents and electrospun nanofibres
22
MATERIALS AND CHEMICALS
All reagents purchased were of analytical grade. The chemicals magnesium nitrate hexahydrate (Mg(NO3)2.6H2O), aluminium nitrate nonahydrate (Al(NO3)3.9H2O), sodium hydroxide, and sodium carbonate (Na2CO3) (obtained from Sigma Aldrich, South Africa) were used to co-precipitate on the inert support, MgAlO. Iron (II) sulphate heptahydrate (FeSO4.7H2O), sodium borohydride (NaBH4) (Sigma Aldrich) and palladium acetate Pd (OAc)2 were used for the synthesis of Fe0, Pd0 and Fe-Pd nanoparticles. Hexane (GC grade), ethanol and acetone were used for sample extraction, clean up and reconstitution for GC × GC-TOF-MS analysis. Polyvinylidene fluoride low molecular weight 100,000 GPC and high molecular weight 534,000 GPC, PAN molecular weight 150,000 GPC and PVP were used as a surfactant, CA, while 2,2´Azobis(2-methylpropionitrile) was used as the free radical initiator on the PVDF polymer before acrylic acid, stabilised with hydroquinone monomethyl ether, was used as the grafting monomer. Dichloromethane (DCM), DMAc, DMF, titanium isopropoxide (TIIP) and nitric acid were used in the sol-gel synthesis of TiO2 nanoparticles, Silver nitrate was added to the anchored Fe-Pd and TiO2, to induce bactericidal and self- cleaning properties. Mesoporous silica, benzophenone, hydrochloric acid (HCl), ethanol, acetone and acrylic acid, were used in the functionalisation of the silanol groups in UV light. Sodium hydroxide, sodium persulphate, ICP-OES multi-element standard (Spectroscan SS-028226, Lot E2-MEB366049) and phosphoric acid were used in the determination of total organic carbon. The chemicals used in the cactus plant extracts of hemicellulose/pectin studies were as follows: PVA ((C2H4O)x), glacial acetic acid (CH3COOH) (GAA), 69.0% nitric acid (HNO3), ethanol (C2H5OH), sodium hydroxide, hexane (C6H14) for gas chromatography (GC) analysis, glutaraldehyde (CH₂(CH₂CHO)₂) (25% aqueous solution), 99.0% hexamethyldisilazane (C6H19NSi2) (HMDS), 98.0% chlorotrimethylsilane (C3H9CiSi) (CTMS), TFA (C2HF3O2), rhodamine B (C28H31ClN2O3) (RhB), AgNO3, HCl, standard solution Cd, standard solution Pb, tris-acetate-EDTA (C24H33N5O12) (TAE) were of analytical reagent grade and were mainly procured from Sigma Aldrich (Deisenhofen, Germany) and Merck. Ultrapure water (Milli-Q type 1, <5 µg/ℓ organic impurities) was used in all experiments. Cactus pads (Opuntia ficus indica) were collected from a field near the University of Johannesburg (Auckland Park and Doornfontein campuses), South Africa, located at 1,767 m above sea level (latitude: 26° 12′ 08″ S and longitude: 28° 02′ 37″ E). Bacteria cultures were prepared in a buffer solution (50 mM, pH = 4.8). Bovine serum albumin (BSA, lyophilised powder), cefepime antibiotic and neomycin antibiotic were purchased from Sigma-Aldrich and used as received. Accessories included clean glassware (cleaned by immersion in a 10% nitric acid for at least 24 hours, rinsed in Milli-Q type 1 water, dried and stored), 96 well plates, a water bath (Labex labcon), a centrifuge (Eppedorf, model 5702), a freeze drier (model 2k BTES, USA), a sonicator and a pH meter.
PREPARATION OF NANOCATALYSTS
Preparation of iron-palladium nanoparticles
For the preparation of Fe0 nanoparticles, saturated solution containing 1 g of Fe2+ was made by dissolving 5 g of FeSO4.7H2O in 70 mℓ of Millipore water. The pH was adjusted to 6.8 by using 4 M NaOH. The Fe2+ was reduced to Fe0 by adding 2.3 M NaBH4 drop wise, as shown in Equation 3-1. The Fe nanoparticles were filtered and washed with deoxygenated water, and then with acetone.
Equation 3-11
Equation 3-12
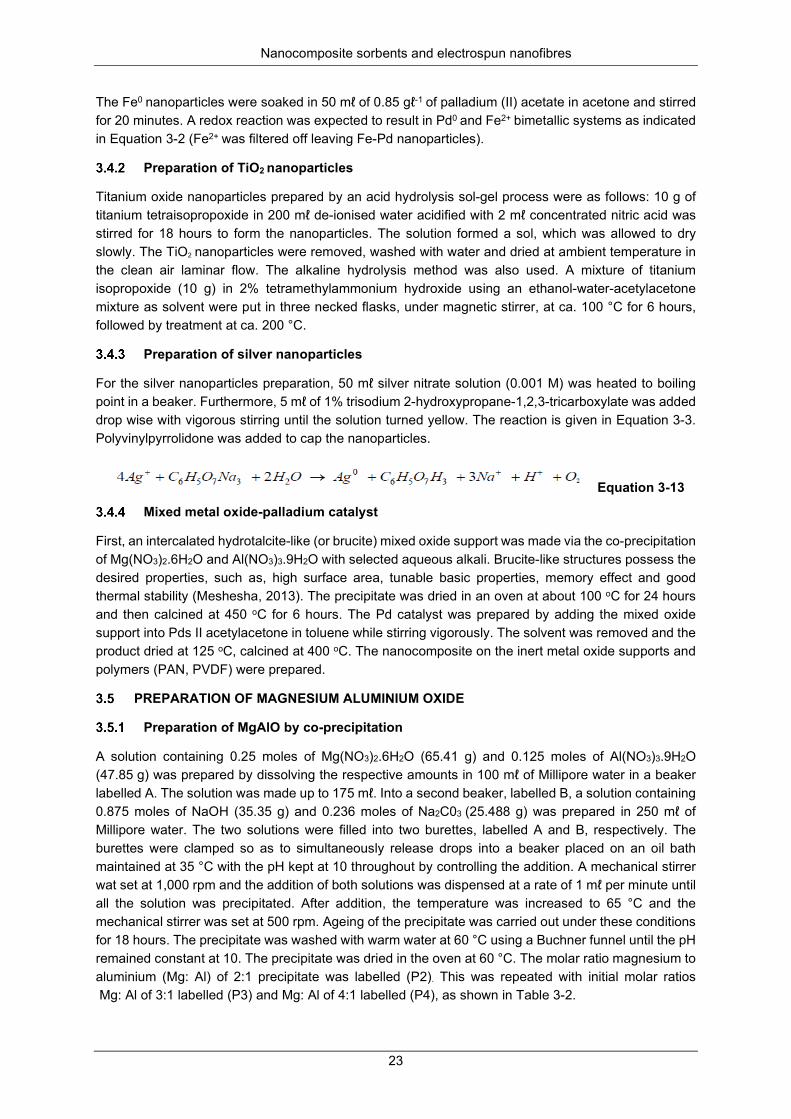
Nanocomposite sorbents and electrospun nanofibres
23
The Fe0 nanoparticles were soaked in 50 mℓ of 0.85 gℓ-1 of palladium (II) acetate in acetone and stirred for 20 minutes. A redox reaction was expected to result in Pd0 and Fe2+ bimetallic systems as indicated in Equation 3-2 (Fe2+ was filtered off leaving Fe-Pd nanoparticles).
Preparation of TiO2 nanoparticles
Titanium oxide nanoparticles prepared by an acid hydrolysis sol-gel process were as follows: 10 g of titanium tetraisopropoxide in 200 mℓ de-ionised water acidified with 2 mℓ concentrated nitric acid was stirred for 18 hours to form the nanoparticles. The solution formed a sol, which was allowed to dry slowly. The TiO2 nanoparticles were removed, washed with water and dried at ambient temperature in the clean air laminar flow. The alkaline hydrolysis method was also used. A mixture of titanium isopropoxide (10 g) in 2% tetramethylammonium hydroxide using an ethanol-water-acetylacetone mixture as solvent were put in three necked flasks, under magnetic stirrer, at ca. 100 °C for 6 hours, followed by treatment at ca. 200 °C.
Preparation of silver nanoparticles
For the silver nanoparticles preparation, 50 mℓ silver nitrate solution (0.001 M) was heated to boiling point in a beaker. Furthermore, 5 mℓ of 1% trisodium 2-hydroxypropane-1,2,3-tricarboxylate was added drop wise with vigorous stirring until the solution turned yellow. The reaction is given in Equation 3-3. Polyvinylpyrrolidone was added to cap the nanoparticles.
Equation 3-13
Mixed metal oxide-palladium catalyst
First, an intercalated hydrotalcite-like (or brucite) mixed oxide support was made via the co-precipitation of Mg(NO3)2.6H2O and Al(NO3)3.9H2O with selected aqueous alkali. Brucite-like structures possess the desired properties, such as, high surface area, tunable basic properties, memory effect and good thermal stability (Meshesha, 2013). The precipitate was dried in an oven at about 100 oC for 24 hours and then calcined at 450 oC for 6 hours. The Pd catalyst was prepared by adding the mixed oxide support into Pds II acetylacetone in toluene while stirring vigorously. The solvent was removed and the product dried at 125 oC, calcined at 400 oC. The nanocomposite on the inert metal oxide supports and polymers (PAN, PVDF) were prepared.
PREPARATION OF MAGNESIUM ALUMINIUM OXIDE
Preparation of MgAlO by co-precipitation
A solution containing 0.25 moles of Mg(NO3)2.6H2O (65.41 g) and 0.125 moles of Al(NO3)3.9H2O (47.85 g) was prepared by dissolving the respective amounts in 100 mℓ of Millipore water in a beaker labelled A. The solution was made up to 175 mℓ. Into a second beaker, labelled B, a solution containing 0.875 moles of NaOH (35.35 g) and 0.236 moles of Na2C03 (25.488 g) was prepared in 250 mℓ of Millipore water. The two solutions were filled into two burettes, labelled A and B, respectively. The burettes were clamped so as to simultaneously release drops into a beaker placed on an oil bath maintained at 35 °C with the pH kept at 10 throughout by controlling the addition. A mechanical stirrer wat set at 1,000 rpm and the addition of both solutions was dispensed at a rate of 1 mℓ per minute until all the solution was precipitated. After addition, the temperature was increased to 65 °C and the mechanical stirrer was set at 500 rpm. Ageing of the precipitate was carried out under these conditions for 18 hours. The precipitate was washed with warm water at 60 °C using a Buchner funnel until the pH remained constant at 10. The precipitate was dried in the oven at 60 °C. The molar ratio magnesium to aluminium (Mg: Al) of 2:1 precipitate was labelled (P2). This was repeated with initial molar ratios Mg: Al of 3:1 labelled (P3) and Mg: Al of 4:1 labelled (P4), as shown in Table 3-2.
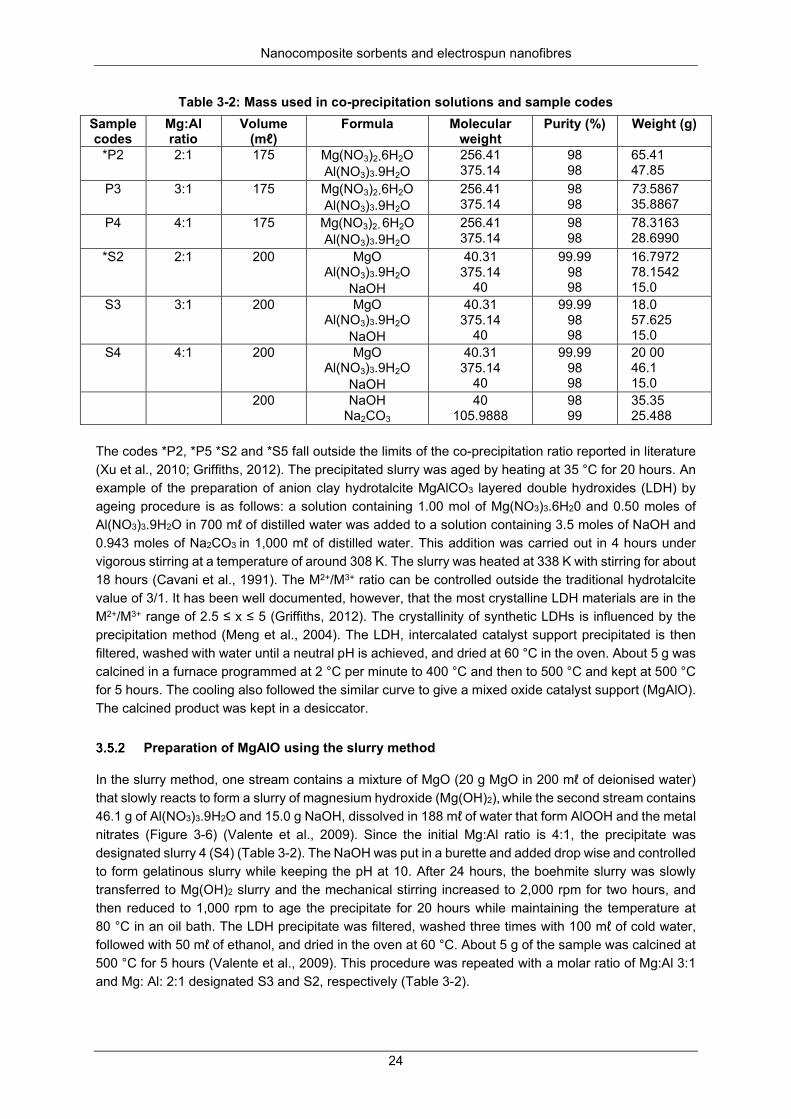
Nanocomposite sorbents and electrospun nanofibres
24
Table 3-2: Mass used in co-precipitation solutions and sample codes
Sample codes
Mg:Al ratio
Volume (mℓ)
Formula Molecular weight
Purity (%) Weight (g)
*P2 2:1 175 Mg(NO3)2.6H2O Al(NO3)3.9H2O
256.41 375.14
98 98
65.41 47.85
P3 3:1 175 Mg(NO3)2.6H2O Al(NO3)3.9H2O
256.41 375.14
98 98
73.5867 35.8867
P4 4:1 175 Mg(NO3)2.6H2O Al(NO3)3.9H2O
256.41 375.14
98 98
78.3163 28.6990
*S2 2:1 200 MgO Al(NO3)3.9H2O
NaOH
40.31 375.14
40
99.99 98 98
16.7972 78.1542 15.0
S3 3:1 200 MgO Al(NO3)3.9H2O
NaOH
40.31 375.14
40
99.99 98 98
18.0 57.625 15.0
S4 4:1 200 MgO Al(NO3)3.9H2O
NaOH
40.31 375.14
40
99.99 98 98
20 00 46.1 15.0
200 NaOH Na2CO3
40 105.9888
98 99
35.35 25.488
The codes *P2, *P5 *S2 and *S5 fall outside the limits of the co-precipitation ratio reported in literature (Xu et al., 2010; Griffiths, 2012). The precipitated slurry was aged by heating at 35 °C for 20 hours. An example of the preparation of anion clay hydrotalcite MgAlCO3 layered double hydroxides (LDH) by ageing procedure is as follows: a solution containing 1.00 mol of Mg(NO3)3.6H20 and 0.50 moles of Al(NO3)3.9H2O in 700 mℓ of distilled water was added to a solution containing 3.5 moles of NaOH and 0.943 moles of Na2CO3 in 1,000 mℓ of distilled water. This addition was carried out in 4 hours under vigorous stirring at a temperature of around 308 K. The slurry was heated at 338 K with stirring for about 18 hours (Cavani et al., 1991). The M2+/M3+ ratio can be controlled outside the traditional hydrotalcite value of 3/1. It has been well documented, however, that the most crystalline LDH materials are in the M2+/M3+ range of 2.5 ≤ x ≤ 5 (Griffiths, 2012). The crystallinity of synthetic LDHs is influenced by the precipitation method (Meng et al., 2004). The LDH, intercalated catalyst support precipitated is then filtered, washed with water until a neutral pH is achieved, and dried at 60 °C in the oven. About 5 g was calcined in a furnace programmed at 2 °C per minute to 400 °C and then to 500 °C and kept at 500 °C for 5 hours. The cooling also followed the similar curve to give a mixed oxide catalyst support (MgAlO). The calcined product was kept in a desiccator.
Preparation of MgAlO using the slurry method
In the slurry method, one stream contains a mixture of MgO (20 g MgO in 200 mℓ of deionised water) that slowly reacts to form a slurry of magnesium hydroxide (Mg(OH)2), while the second stream contains 46.1 g of Al(NO3)3.9H2O and 15.0 g NaOH, dissolved in 188 mℓ of water that form AlOOH and the metal nitrates (Figure 3-6) (Valente et al., 2009). Since the initial Mg:Al ratio is 4:1, the precipitate was designated slurry 4 (S4) (Table 3-2). The NaOH was put in a burette and added drop wise and controlled to form gelatinous slurry while keeping the pH at 10. After 24 hours, the boehmite slurry was slowly transferred to Mg(OH)2 slurry and the mechanical stirring increased to 2,000 rpm for two hours, and then reduced to 1,000 rpm to age the precipitate for 20 hours while maintaining the temperature at 80 °C in an oil bath. The LDH precipitate was filtered, washed three times with 100 mℓ of cold water, followed with 50 mℓ of ethanol, and dried in the oven at 60 °C. About 5 g of the sample was calcined at 500 °C for 5 hours (Valente et al., 2009). This procedure was repeated with a molar ratio of Mg:Al 3:1 and Mg: Al: 2:1 designated S3 and S2, respectively (Table 3-2).
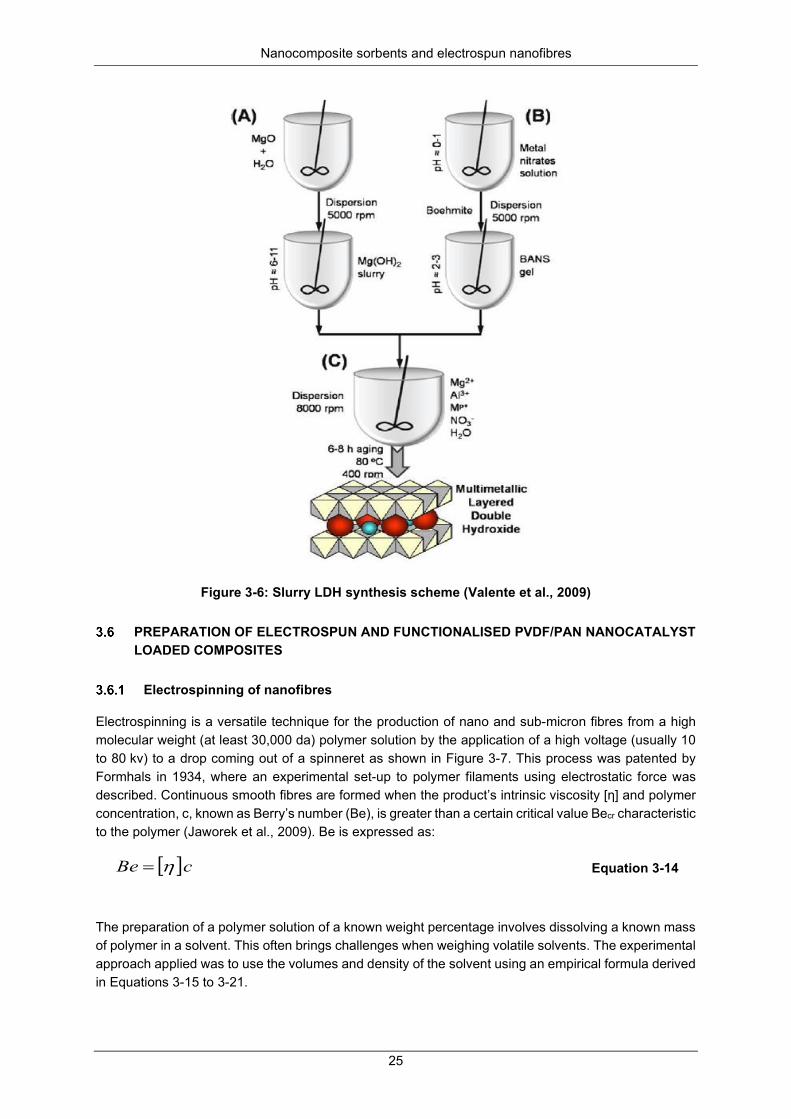
Nanocomposite sorbents and electrospun nanofibres
25
Figure 3-6: Slurry LDH synthesis scheme (Valente et al., 2009)
PREPARATION OF ELECTROSPUN AND FUNCTIONALISED PVDF/PAN NANOCATALYST LOADED COMPOSITES
Electrospinning of nanofibres
Electrospinning is a versatile technique for the production of nano and sub-micron fibres from a high molecular weight (at least 30,000 da) polymer solution by the application of a high voltage (usually 10 to 80 kv) to a drop coming out of a spinneret as shown in Figure 3-7. This process was patented by Formhals in 1934, where an experimental set-up to polymer filaments using electrostatic force was described. Continuous smooth fibres are formed when the product’s intrinsic viscosity [η] and polymer concentration, c, known as Berry’s number (Be), is greater than a certain critical value Becr characteristic to the polymer (Jaworek et al., 2009). Be is expressed as:
Equation 3-14 The preparation of a polymer solution of a known weight percentage involves dissolving a known mass of polymer in a solvent. This often brings challenges when weighing volatile solvents. The experimental approach applied was to use the volumes and density of the solvent using an empirical formula derived in Equations 3-15 to 3-21.
[ ]cBe η=
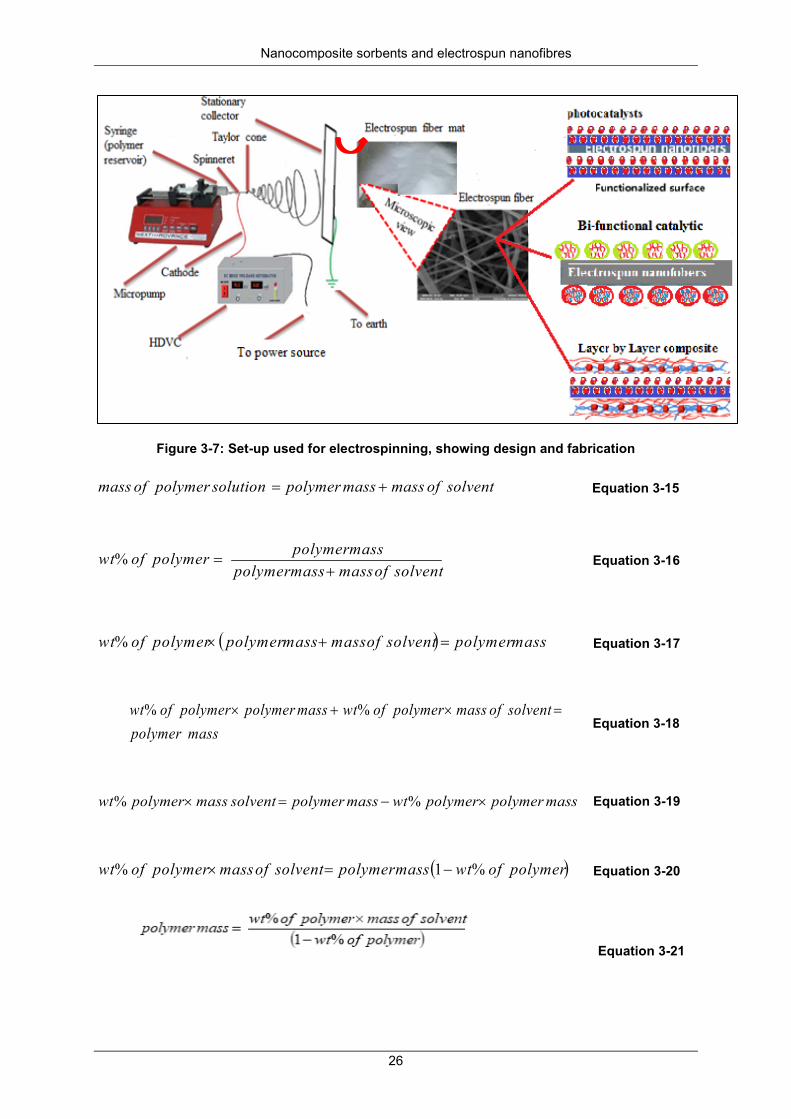
Nanocomposite sorbents and electrospun nanofibres
26
Figure 3-7: Set-up used for electrospinning, showing design and fabrication
Equation 3-15
Equation 3-16
Equation 3-17
Equation 3-18
Equation 3-19
Equation 3-20
Equation 3-21
solventofmassmasspolymersolutionpolymerofmass +=
%solventofmassmasspolymer
masspolymerpolymerofwt+
=
( )% masspolymersolventofmassmasspolymerpolymerofwt =+×
%%masspolymer
solventofmasspolymerofwtmasspolymerpolymerofwt =×+×
(%% masspolymerpolymerwtmasspolymersolventmasspolymerwt ×−=×
( )%1% polymerofwtmasspolymersolventofmasspolymerofwt −=×
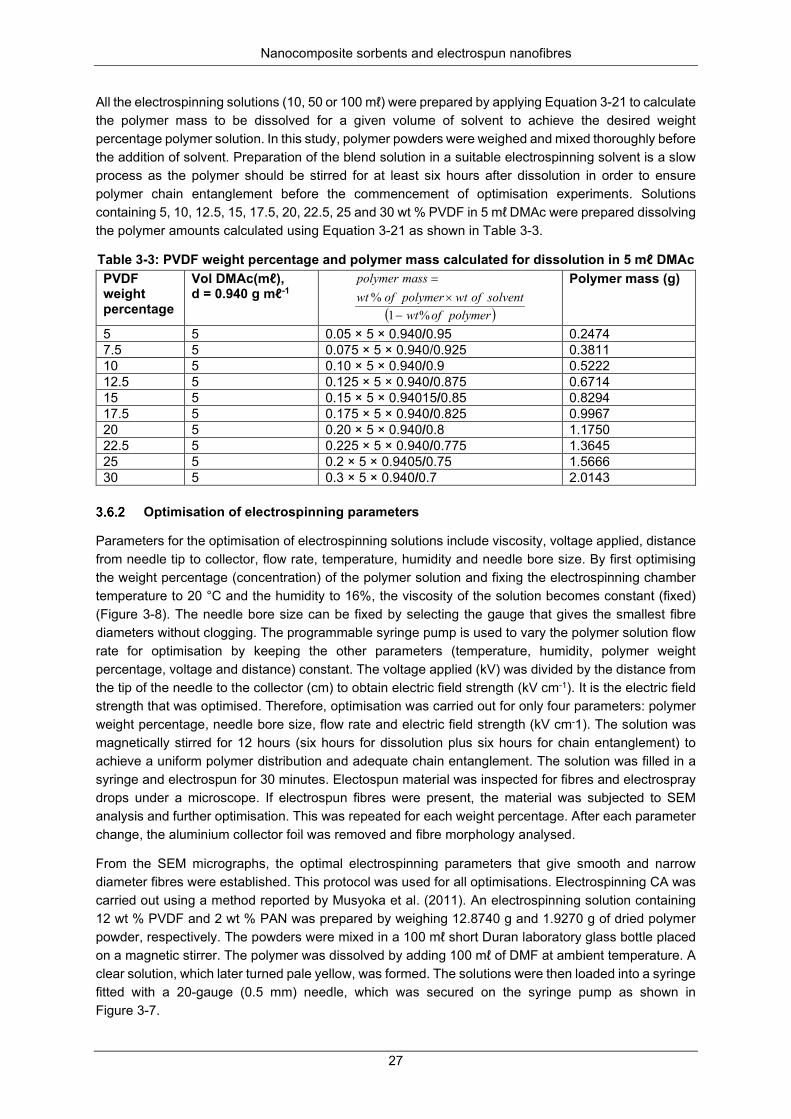
Nanocomposite sorbents and electrospun nanofibres
27
All the electrospinning solutions (10, 50 or 100 mℓ) were prepared by applying Equation 3-21 to calculate the polymer mass to be dissolved for a given volume of solvent to achieve the desired weight percentage polymer solution. In this study, polymer powders were weighed and mixed thoroughly before the addition of solvent. Preparation of the blend solution in a suitable electrospinning solvent is a slow process as the polymer should be stirred for at least six hours after dissolution in order to ensure polymer chain entanglement before the commencement of optimisation experiments. Solutions containing 5, 10, 12.5, 15, 17.5, 20, 22.5, 25 and 30 wt % PVDF in 5 mℓ DMAc were prepared dissolving the polymer amounts calculated using Equation 3-21 as shown in Table 3-3.
Table 3-3: PVDF weight percentage and polymer mass calculated for dissolution in 5 mℓ DMAc PVDF weight percentage
Vol DMAc(mℓ), d = 0.940 g mℓ-1
Polymer mass (g)
5 5 0.05 × 5 × 0.940/0.95 0.2474 7.5 5 0.075 × 5 × 0.940/0.925 0.3811 10 5 0.10 × 5 × 0.940/0.9 0.5222 12.5 5 0.125 × 5 × 0.940/0.875 0.6714 15 5 0.15 × 5 × 0.94015/0.85 0.8294 17.5 5 0.175 × 5 × 0.940/0.825 0.9967 20 5 0.20 × 5 × 0.940/0.8 1.1750 22.5 5 0.225 × 5 × 0.940/0.775 1.3645 25 5 0.2 × 5 × 0.9405/0.75 1.5666 30 5 0.3 × 5 × 0.940/0.7 2.0143
Optimisation of electrospinning parameters
Parameters for the optimisation of electrospinning solutions include viscosity, voltage applied, distance from needle tip to collector, flow rate, temperature, humidity and needle bore size. By first optimising the weight percentage (concentration) of the polymer solution and fixing the electrospinning chamber temperature to 20 °C and the humidity to 16%, the viscosity of the solution becomes constant (fixed) (Figure 3-8). The needle bore size can be fixed by selecting the gauge that gives the smallest fibre diameters without clogging. The programmable syringe pump is used to vary the polymer solution flow rate for optimisation by keeping the other parameters (temperature, humidity, polymer weight percentage, voltage and distance) constant. The voltage applied (kV) was divided by the distance from the tip of the needle to the collector (cm) to obtain electric field strength (kV cm-1). It is the electric field strength that was optimised. Therefore, optimisation was carried out for only four parameters: polymer weight percentage, needle bore size, flow rate and electric field strength (kV cm-1). The solution was magnetically stirred for 12 hours (six hours for dissolution plus six hours for chain entanglement) to achieve a uniform polymer distribution and adequate chain entanglement. The solution was filled in a syringe and electrospun for 30 minutes. Electospun material was inspected for fibres and electrospray drops under a microscope. If electrospun fibres were present, the material was subjected to SEM analysis and further optimisation. This was repeated for each weight percentage. After each parameter change, the aluminium collector foil was removed and fibre morphology analysed.
From the SEM micrographs, the optimal electrospinning parameters that give smooth and narrow diameter fibres were established. This protocol was used for all optimisations. Electrospinning CA was carried out using a method reported by Musyoka et al. (2011). An electrospinning solution containing 12 wt % PVDF and 2 wt % PAN was prepared by weighing 12.8740 g and 1.9270 g of dried polymer powder, respectively. The powders were mixed in a 100 mℓ short Duran laboratory glass bottle placed on a magnetic stirrer. The polymer was dissolved by adding 100 mℓ of DMF at ambient temperature. A clear solution, which later turned pale yellow, was formed. The solutions were then loaded into a syringe fitted with a 20-gauge (0.5 mm) needle, which was secured on the syringe pump as shown in Figure 3-7.
( )polymerofwtsolventofwtpolymerofwt
masspolymer
%1%
−×
=
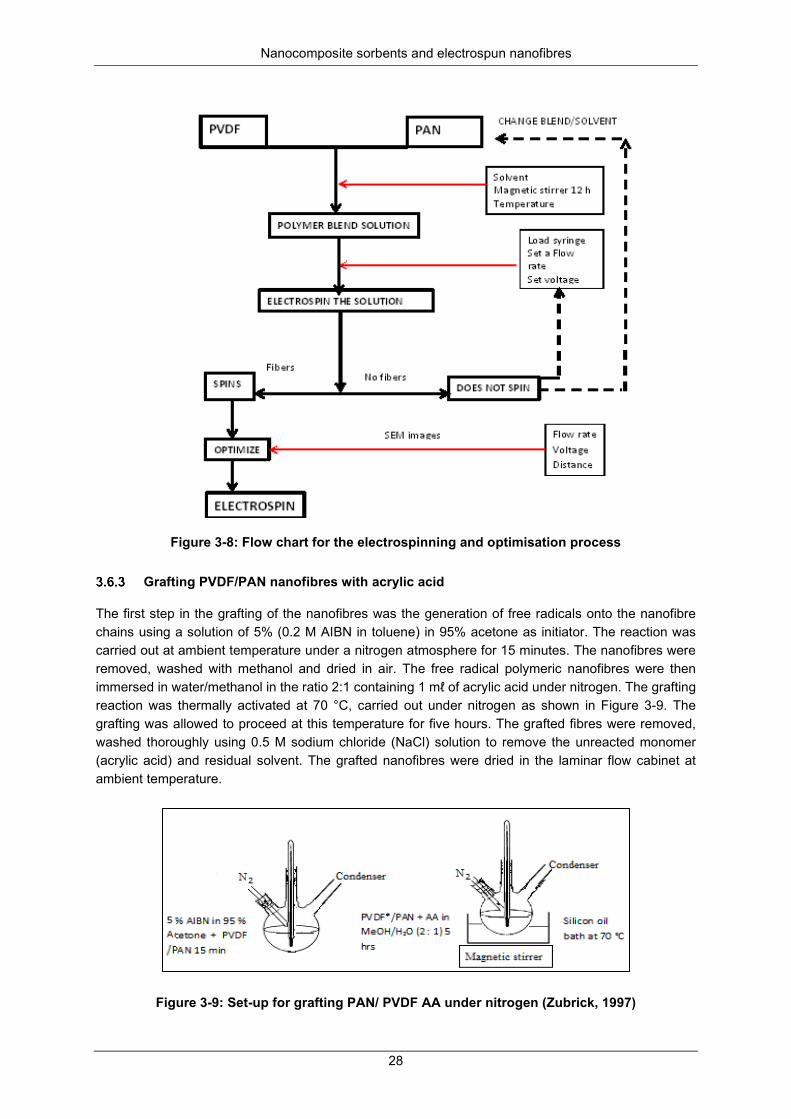
Nanocomposite sorbents and electrospun nanofibres
28
Figure 3-8: Flow chart for the electrospinning and optimisation process
Grafting PVDF/PAN nanofibres with acrylic acid
The first step in the grafting of the nanofibres was the generation of free radicals onto the nanofibre chains using a solution of 5% (0.2 M AIBN in toluene) in 95% acetone as initiator. The reaction was carried out at ambient temperature under a nitrogen atmosphere for 15 minutes. The nanofibres were removed, washed with methanol and dried in air. The free radical polymeric nanofibres were then immersed in water/methanol in the ratio 2:1 containing 1 mℓ of acrylic acid under nitrogen. The grafting reaction was thermally activated at 70 °C, carried out under nitrogen as shown in Figure 3-9. The grafting was allowed to proceed at this temperature for five hours. The grafted fibres were removed, washed thoroughly using 0.5 M sodium chloride (NaCl) solution to remove the unreacted monomer (acrylic acid) and residual solvent. The grafted nanofibres were dried in the laminar flow cabinet at ambient temperature.
Figure 3-9: Set-up for grafting PAN/ PVDF AA under nitrogen (Zubrick, 1997)
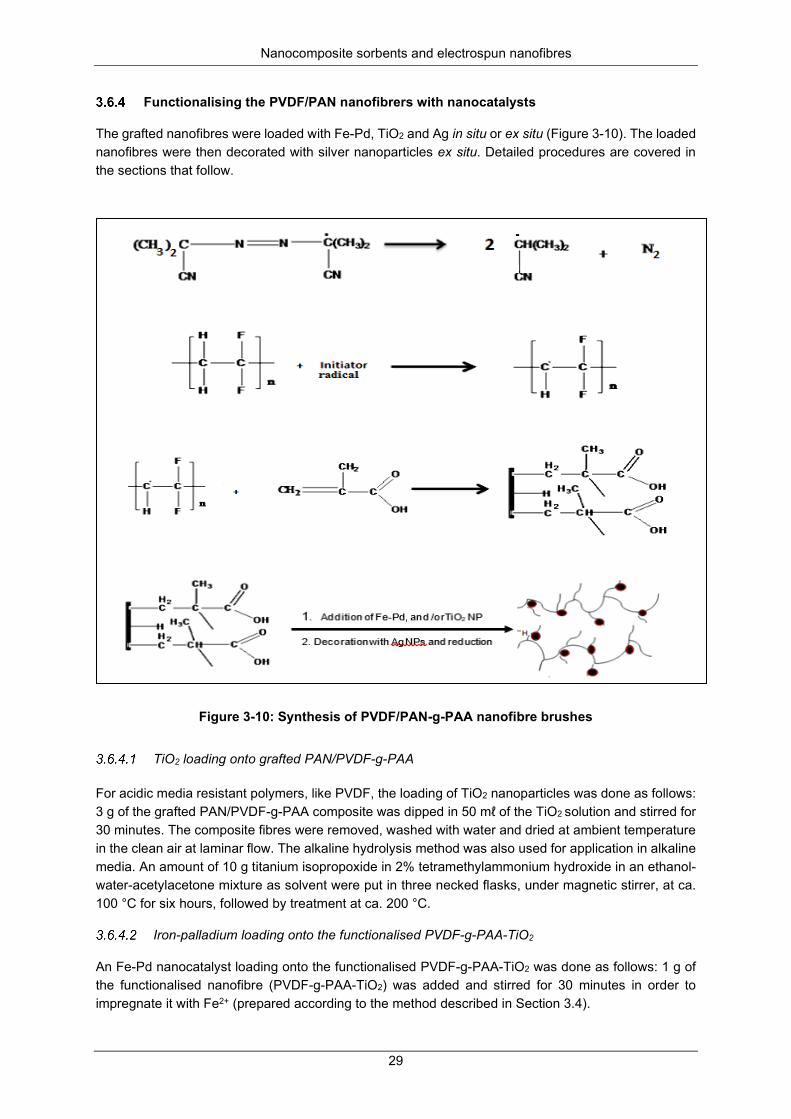
Nanocomposite sorbents and electrospun nanofibres
29
Functionalising the PVDF/PAN nanofibrers with nanocatalysts
The grafted nanofibres were loaded with Fe-Pd, TiO2 and Ag in situ or ex situ (Figure 3-10). The loaded nanofibres were then decorated with silver nanoparticles ex situ. Detailed procedures are covered in the sections that follow.
Figure 3-10: Synthesis of PVDF/PAN-g-PAA nanofibre brushes
TiO2 loading onto grafted PAN/PVDF-g-PAA
For acidic media resistant polymers, like PVDF, the loading of TiO2 nanoparticles was done as follows: 3 g of the grafted PAN/PVDF-g-PAA composite was dipped in 50 mℓ of the TiO2 solution and stirred for 30 minutes. The composite fibres were removed, washed with water and dried at ambient temperature in the clean air at laminar flow. The alkaline hydrolysis method was also used for application in alkaline media. An amount of 10 g titanium isopropoxide in 2% tetramethylammonium hydroxide in an ethanol-water-acetylacetone mixture as solvent were put in three necked flasks, under magnetic stirrer, at ca. 100 °C for six hours, followed by treatment at ca. 200 °C.
Iron-palladium loading onto the functionalised PVDF-g-PAA-TiO2
An Fe-Pd nanocatalyst loading onto the functionalised PVDF-g-PAA-TiO2 was done as follows: 1 g of the functionalised nanofibre (PVDF-g-PAA-TiO2) was added and stirred for 30 minutes in order to impregnate it with Fe2+ (prepared according to the method described in Section 3.4).
Nanocomposite sorbents and electrospun nanofibres
30
The pH was adjusted to 6.8 by using 1.0 M NaOH. The iron-loaded composite was filtered, washed with deoxygenated Millipore water and then with acetone. The Fe0 loaded nanofibres were soaked in 50 mℓ containing 0.85 gℓ-1 of Pd II acetate in acetone and stirred for 20 minutes. A redox reaction occurred and resulted in a Pd0 and Fe0 bimetallic system.
Decorating the composite with silver nanoparticles
Reduction method
An amount of 3 g of PAN/PVDF-g-PAA-TiO2-Fe-Pd was dipped in 50 mℓ of 0.001 M AgNO3 and stirred. After 30 minutes, 30 mℓ of 0.002 M NaBH4 (0.076 g in 100 mℓ) chilled in an ice bath was added for reduction as shown in Equation 3-22. The composite fibres were removed, washed with Millipore water and dried at ambient temperature in the clean air laminar flow.
Equation 3-22
In-situ preparation of Ag/PAN/PVDF-g-PAA-Fe-Pd/TiO2 composite
• Step 1: In-situ preparation of the Ag/PAN/PVDF-g-PAA-TiO2-Fe-Pd composite involves two stages. The first step involves the preparation of a polymer solution by dissolving the grafted PVDF-g-PAA and PAN (12.8740 g PVDF and 1.9270 g PAN in 100 mℓ DMF) and stirring it until all the polymer dissolves into a clear solution and at least for a further six hours thereafter to achieve polymer chain entanglement.
• Step 2: The second step was the sequential addition of TIIP, Fe-Pd nanoparticles and AgNO3,
respectively. It involves the sequential addition of 0.989 g TIIP, T 0.474 g Fe-Pd followed by decoration with 0.0949 g silver nanoparticles. The polymer solution is stirred for a further 12 hours and centrifuged to remove the suspended particles before electrospinning.
Ex-situ preparation of Ag/PAN/PVDF-g- PAA-Fe-Pd/TiO2 composite
• Step 1: The first step is the preparation of the polymer solution by dissolving the grafted PVDF-g-PAA and PAN (12.8740 g PVDF and 1.9270 g PAN in 100 mℓ DMF) using a magnetic stirrer for dissolution, followed by a further six hours to achieve polymer chain entanglement.
• Step 2: The second step involves the sequential addition of TiO2 nanoparticles (anatase) to the
PAN/PVDF electrospining solution. The order of addition to the polymer solution was TiO2,
(anatase), followed by the addition of Fe-Pd and finally silver nanoparticles. The anatase TiO2 was obtained by electrospinning 10 g TIIP in 100 mℓ DMF using 10 g PVP as template, as well as the surfactant. The electrospun PVP/TiO2 nanofibres were then calcined at 500 °C to drive out the template (PVP) leaving TiO2 (anatase) nanofibres. The TiO2 nanoparticles were also prepared by sol-gel acid hydrolysis, where 10 g titanium (IV) isopropoxide was added drop wise to 200 mℓ nitric acid solution (containing 2 mℓ concentrated nitric acid in 200 mℓ Millipore water). The solution was placed on a magnetic stirrer and kept at 80 °C for 18 hours. This was followed by evaporation to dryness at 60 °C, followed by further drying at 120 °C before calcination at 500 °C for five hours.
PREPARATION OF NANOCATALYST-LOADED NANOSORBENTS
Loading Fe-Pd on MgAlO
Iron (II) was loaded on the catalyst support, MgAlO, and reduced to Fe0 using NaBH4. A saturated solution containing 1 g of Fe2+ was made by dissolving 5 g of FeSO4.7H2O in 70 mℓ of Millipore water.
2222 362243 N a N OHBHA gN a B HA g N O +++→+
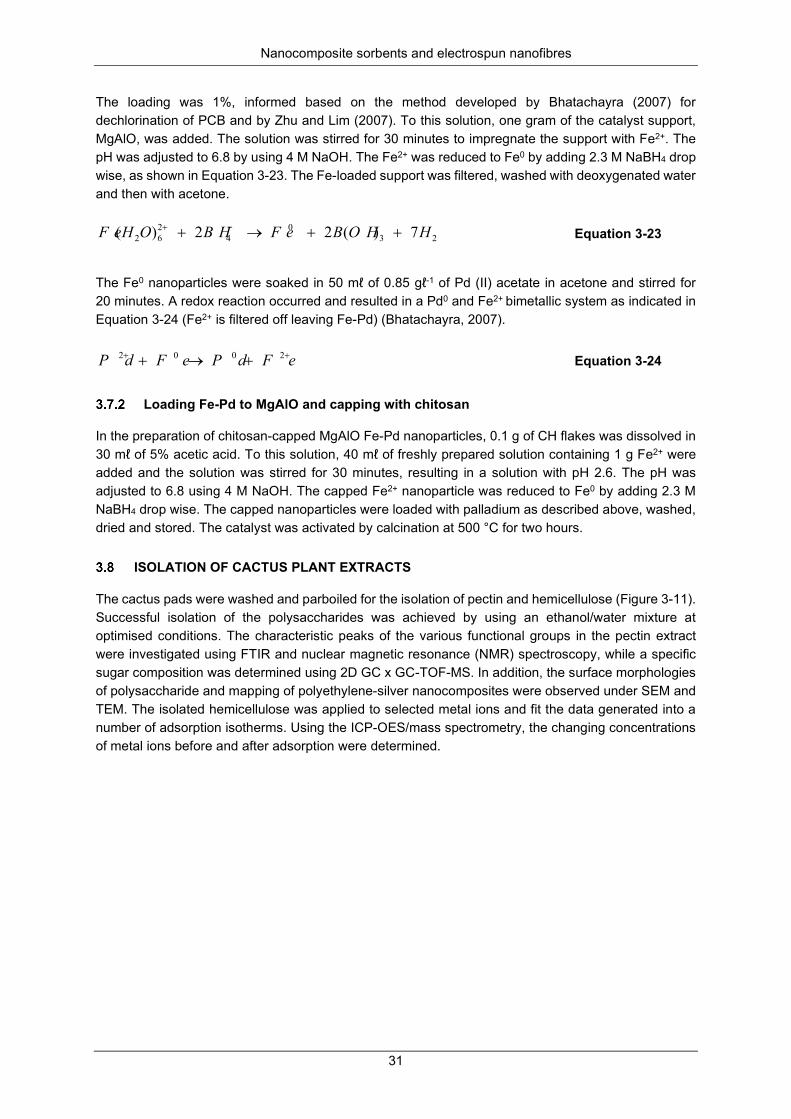
Nanocomposite sorbents and electrospun nanofibres
31
The loading was 1%, informed based on the method developed by Bhatachayra (2007) for dechlorination of PCB and by Zhu and Lim (2007). To this solution, one gram of the catalyst support, MgAlO, was added. The solution was stirred for 30 minutes to impregnate the support with Fe2+. The pH was adjusted to 6.8 by using 4 M NaOH. The Fe2+ was reduced to Fe0 by adding 2.3 M NaBH4 drop wise, as shown in Equation 3-23. The Fe-loaded support was filtered, washed with deoxygenated water and then with acetone.
Equation 3-23
The Fe0 nanoparticles were soaked in 50 mℓ of 0.85 gℓ-1 of Pd (II) acetate in acetone and stirred for 20 minutes. A redox reaction occurred and resulted in a Pd0 and Fe2+ bimetallic system as indicated in Equation 3-24 (Fe2+ is filtered off leaving Fe-Pd) (Bhatachayra, 2007).
Equation 3-24
Loading Fe-Pd to MgAlO and capping with chitosan
In the preparation of chitosan-capped MgAlO Fe-Pd nanoparticles, 0.1 g of CH flakes was dissolved in 30 mℓ of 5% acetic acid. To this solution, 40 mℓ of freshly prepared solution containing 1 g Fe2+ were added and the solution was stirred for 30 minutes, resulting in a solution with pH 2.6. The pH was adjusted to 6.8 using 4 M NaOH. The capped Fe2+ nanoparticle was reduced to Fe0 by adding 2.3 M NaBH4 drop wise. The capped nanoparticles were loaded with palladium as described above, washed, dried and stored. The catalyst was activated by calcination at 500 °C for two hours.
ISOLATION OF CACTUS PLANT EXTRACTS
The cactus pads were washed and parboiled for the isolation of pectin and hemicellulose (Figure 3-11). Successful isolation of the polysaccharides was achieved by using an ethanol/water mixture at optimised conditions. The characteristic peaks of the various functional groups in the pectin extract were investigated using FTIR and nuclear magnetic resonance (NMR) spectroscopy, while a specific sugar composition was determined using 2D GC x GC-TOF-MS. In addition, the surface morphologies of polysaccharide and mapping of polyethylene-silver nanocomposites were observed under SEM and TEM. The isolated hemicellulose was applied to selected metal ions and fit the data generated into a number of adsorption isotherms. Using the ICP-OES/mass spectrometry, the changing concentrations of metal ions before and after adsorption were determined.
7)(22)( 230
4262 HO HBF eB HOHF e ++→+ −+
2002 ++ +→+ F eP dF eP d
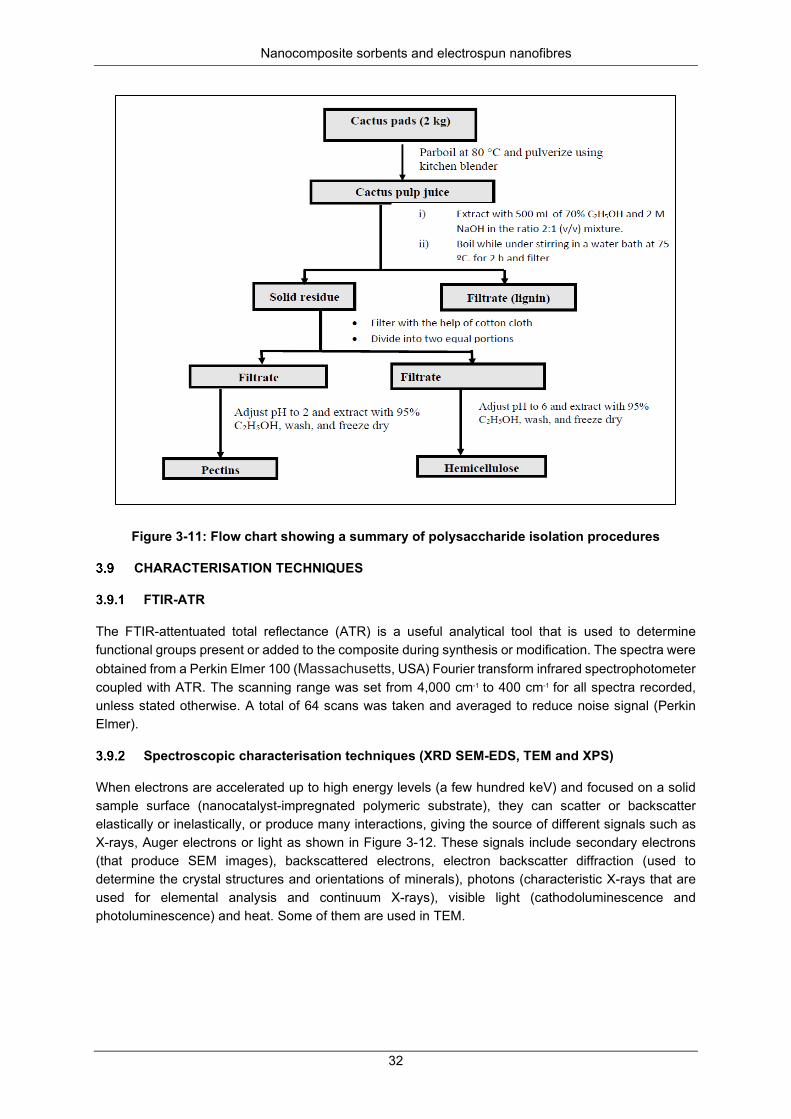
Nanocomposite sorbents and electrospun nanofibres
32
Figure 3-11: Flow chart showing a summary of polysaccharide isolation procedures
CHARACTERISATION TECHNIQUES
FTIR-ATR
The FTIR-attentuated total reflectance (ATR) is a useful analytical tool that is used to determine functional groups present or added to the composite during synthesis or modification. The spectra were obtained from a Perkin Elmer 100 (Massachusetts, USA) Fourier transform infrared spectrophotometer coupled with ATR. The scanning range was set from 4,000 cm-1 to 400 cm-1 for all spectra recorded, unless stated otherwise. A total of 64 scans was taken and averaged to reduce noise signal (Perkin Elmer).
Spectroscopic characterisation techniques (XRD SEM-EDS, TEM and XPS)
When electrons are accelerated up to high energy levels (a few hundred keV) and focused on a solid sample surface (nanocatalyst-impregnated polymeric substrate), they can scatter or backscatter elastically or inelastically, or produce many interactions, giving the source of different signals such as X-rays, Auger electrons or light as shown in Figure 3-12. These signals include secondary electrons (that produce SEM images), backscattered electrons, electron backscatter diffraction (used to determine the crystal structures and orientations of minerals), photons (characteristic X-rays that are used for elemental analysis and continuum X-rays), visible light (cathodoluminescence and photoluminescence) and heat. Some of them are used in TEM.
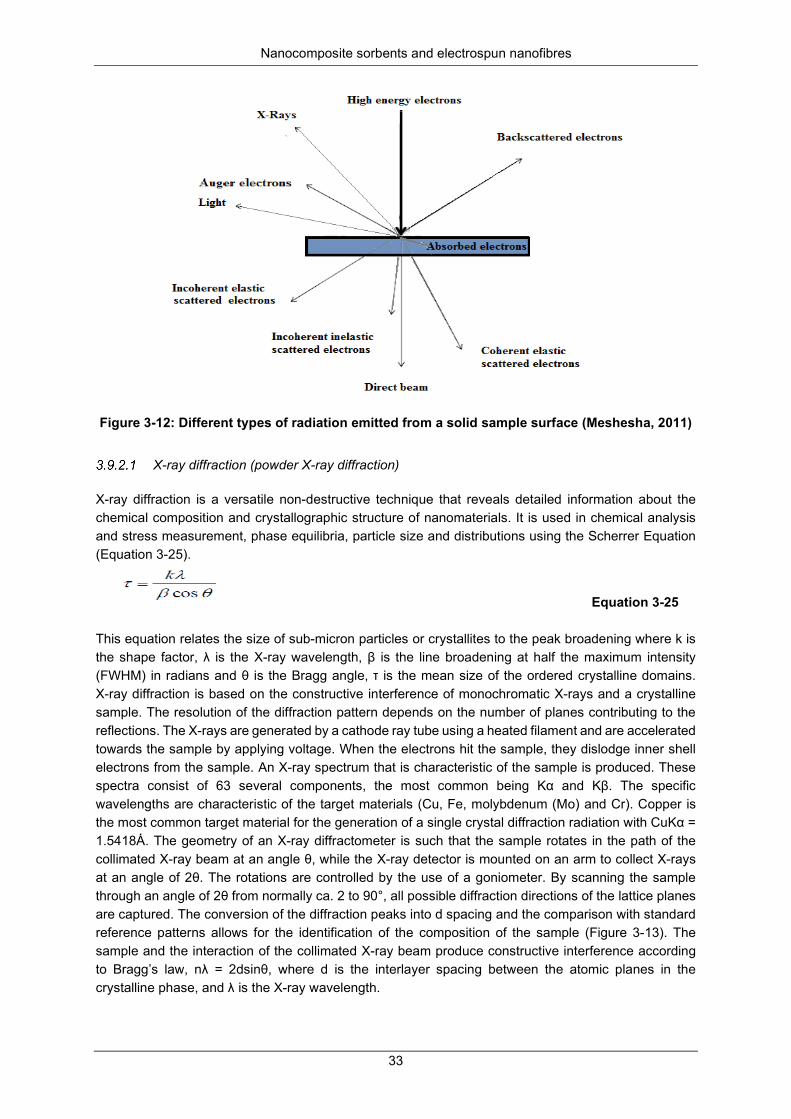
Nanocomposite sorbents and electrospun nanofibres
33
Figure 3-12: Different types of radiation emitted from a solid sample surface (Meshesha, 2011)
X-ray diffraction (powder X-ray diffraction)
X-ray diffraction is a versatile non-destructive technique that reveals detailed information about the chemical composition and crystallographic structure of nanomaterials. It is used in chemical analysis and stress measurement, phase equilibria, particle size and distributions using the Scherrer Equation (Equation 3-25).
Equation 3-25 This equation relates the size of sub-micron particles or crystallites to the peak broadening where k is the shape factor, λ is the X-ray wavelength, β is the line broadening at half the maximum intensity (FWHM) in radians and θ is the Bragg angle, τ is the mean size of the ordered crystalline domains. X-ray diffraction is based on the constructive interference of monochromatic X-rays and a crystalline sample. The resolution of the diffraction pattern depends on the number of planes contributing to the reflections. The X-rays are generated by a cathode ray tube using a heated filament and are accelerated towards the sample by applying voltage. When the electrons hit the sample, they dislodge inner shell electrons from the sample. An X-ray spectrum that is characteristic of the sample is produced. These spectra consist of 63 several components, the most common being Kα and Kβ. The specific wavelengths are characteristic of the target materials (Cu, Fe, molybdenum (Mo) and Cr). Copper is the most common target material for the generation of a single crystal diffraction radiation with CuKα = 1.5418Ȧ. The geometry of an X-ray diffractometer is such that the sample rotates in the path of the collimated X-ray beam at an angle θ, while the X-ray detector is mounted on an arm to collect X-rays at an angle of 2θ. The rotations are controlled by the use of a goniometer. By scanning the sample through an angle of 2θ from normally ca. 2 to 90°, all possible diffraction directions of the lattice planes are captured. The conversion of the diffraction peaks into d spacing and the comparison with standard reference patterns allows for the identification of the composition of the sample (Figure 3-13). The sample and the interaction of the collimated X-ray beam produce constructive interference according to Bragg’s law, nλ = 2dsinθ, where d is the interlayer spacing between the atomic planes in the crystalline phase, and λ is the X-ray wavelength.
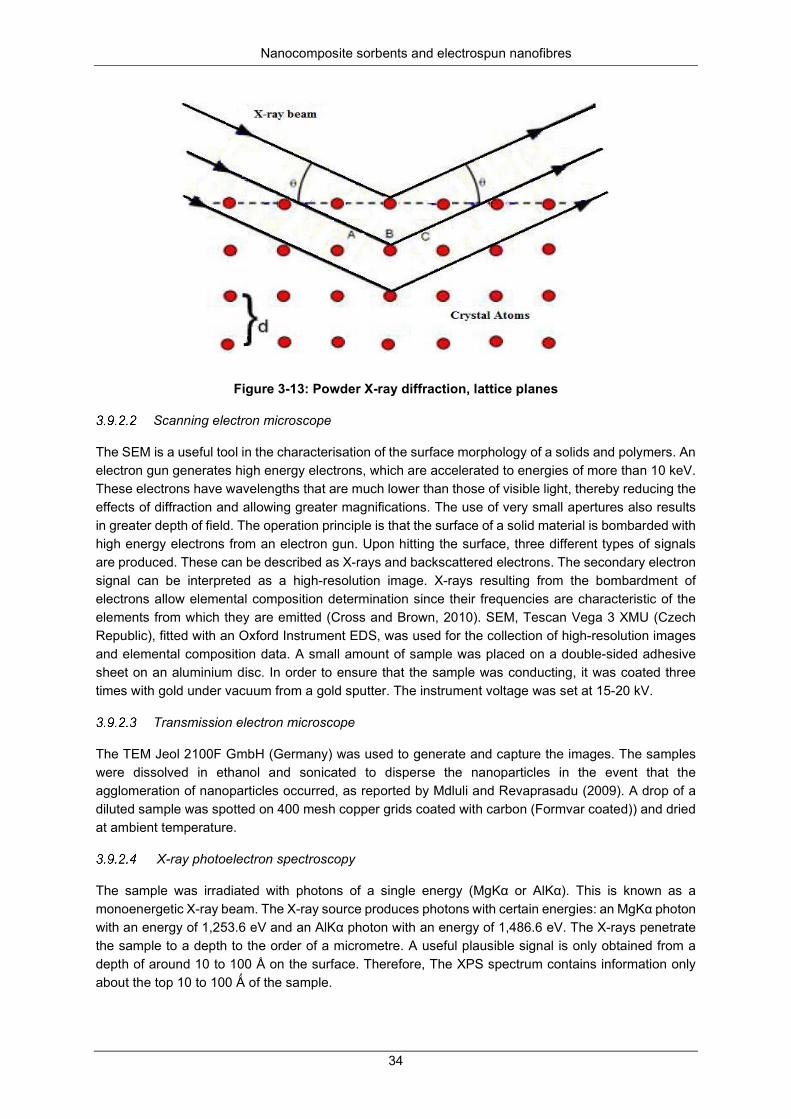
Nanocomposite sorbents and electrospun nanofibres
34
Figure 3-13: Powder X-ray diffraction, lattice planes
Scanning electron microscope
The SEM is a useful tool in the characterisation of the surface morphology of a solids and polymers. An electron gun generates high energy electrons, which are accelerated to energies of more than 10 keV. These electrons have wavelengths that are much lower than those of visible light, thereby reducing the effects of diffraction and allowing greater magnifications. The use of very small apertures also results in greater depth of field. The operation principle is that the surface of a solid material is bombarded with high energy electrons from an electron gun. Upon hitting the surface, three different types of signals are produced. These can be described as X-rays and backscattered electrons. The secondary electron signal can be interpreted as a high-resolution image. X-rays resulting from the bombardment of electrons allow elemental composition determination since their frequencies are characteristic of the elements from which they are emitted (Cross and Brown, 2010). SEM, Tescan Vega 3 XMU (Czech Republic), fitted with an Oxford Instrument EDS, was used for the collection of high-resolution images and elemental composition data. A small amount of sample was placed on a double-sided adhesive sheet on an aluminium disc. In order to ensure that the sample was conducting, it was coated three times with gold under vacuum from a gold sputter. The instrument voltage was set at 15-20 kV.
Transmission electron microscope
The TEM Jeol 2100F GmbH (Germany) was used to generate and capture the images. The samples were dissolved in ethanol and sonicated to disperse the nanoparticles in the event that the agglomeration of nanoparticles occurred, as reported by Mdluli and Revaprasadu (2009). A drop of a diluted sample was spotted on 400 mesh copper grids coated with carbon (Formvar coated)) and dried at ambient temperature.
X-ray photoelectron spectroscopy
The sample was irradiated with photons of a single energy (MgKα or AlKα). This is known as a monoenergetic X-ray beam. The X-ray source produces photons with certain energies: an MgKα photon with an energy of 1,253.6 eV and an AlKα photon with an energy of 1,486.6 eV. The X-rays penetrate the sample to a depth to the order of a micrometre. A useful plausible signal is only obtained from a depth of around 10 to 100 Å on the surface. Therefore, The XPS spectrum contains information only about the top 10 to 100 Ǻ of the sample.
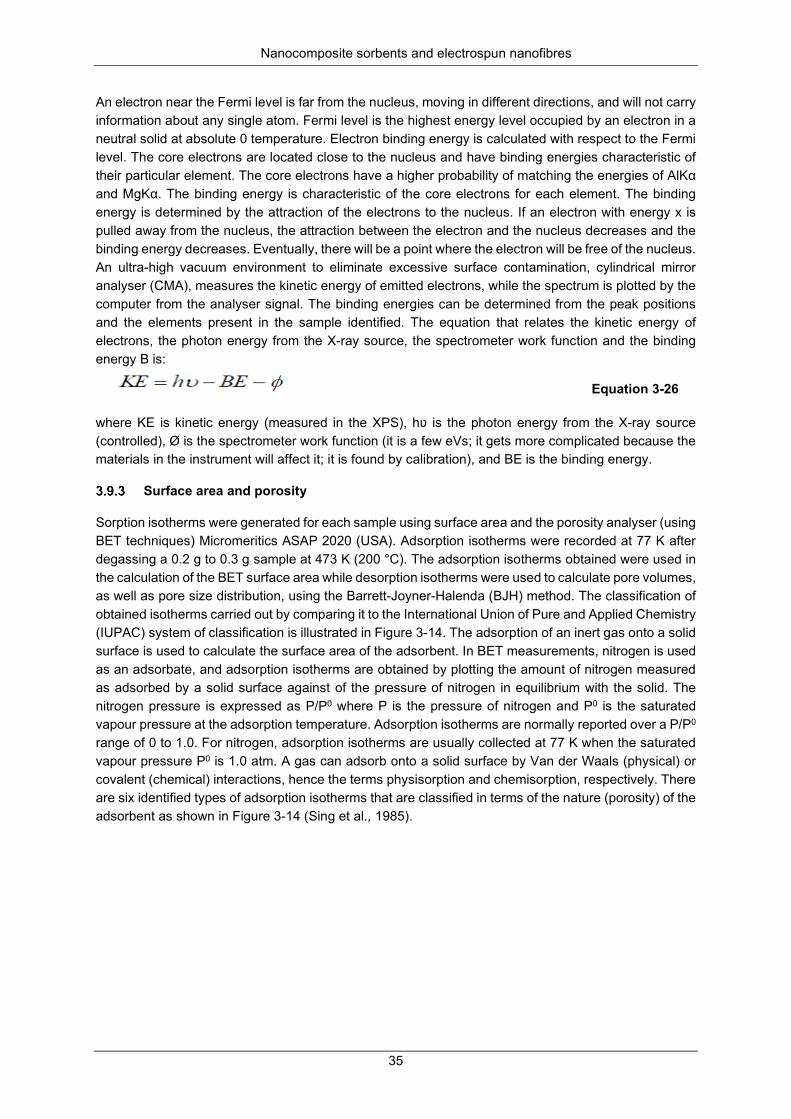
Nanocomposite sorbents and electrospun nanofibres
35
An electron near the Fermi level is far from the nucleus, moving in different directions, and will not carry information about any single atom. Fermi level is the highest energy level occupied by an electron in a neutral solid at absolute 0 temperature. Electron binding energy is calculated with respect to the Fermi level. The core electrons are located close to the nucleus and have binding energies characteristic of their particular element. The core electrons have a higher probability of matching the energies of AlKα and MgKα. The binding energy is characteristic of the core electrons for each element. The binding energy is determined by the attraction of the electrons to the nucleus. If an electron with energy x is pulled away from the nucleus, the attraction between the electron and the nucleus decreases and the binding energy decreases. Eventually, there will be a point where the electron will be free of the nucleus. An ultra-high vacuum environment to eliminate excessive surface contamination, cylindrical mirror analyser (CMA), measures the kinetic energy of emitted electrons, while the spectrum is plotted by the computer from the analyser signal. The binding energies can be determined from the peak positions and the elements present in the sample identified. The equation that relates the kinetic energy of electrons, the photon energy from the X-ray source, the spectrometer work function and the binding energy B is:
Equation 3-26 where KE is kinetic energy (measured in the XPS), hʋ is the photon energy from the X-ray source (controlled), Ø is the spectrometer work function (it is a few eVs; it gets more complicated because the materials in the instrument will affect it; it is found by calibration), and BE is the binding energy.
Surface area and porosity
Sorption isotherms were generated for each sample using surface area and the porosity analyser (using BET techniques) Micromeritics ASAP 2020 (USA). Adsorption isotherms were recorded at 77 K after degassing a 0.2 g to 0.3 g sample at 473 K (200 °C). The adsorption isotherms obtained were used in the calculation of the BET surface area while desorption isotherms were used to calculate pore volumes, as well as pore size distribution, using the Barrett-Joyner-Halenda (BJH) method. The classification of obtained isotherms carried out by comparing it to the International Union of Pure and Applied Chemistry (IUPAC) system of classification is illustrated in Figure 3-14. The adsorption of an inert gas onto a solid surface is used to calculate the surface area of the adsorbent. In BET measurements, nitrogen is used as an adsorbate, and adsorption isotherms are obtained by plotting the amount of nitrogen measured as adsorbed by a solid surface against of the pressure of nitrogen in equilibrium with the solid. The nitrogen pressure is expressed as P/P0 where P is the pressure of nitrogen and P0 is the saturated vapour pressure at the adsorption temperature. Adsorption isotherms are normally reported over a P/P0 range of 0 to 1.0. For nitrogen, adsorption isotherms are usually collected at 77 K when the saturated vapour pressure P0 is 1.0 atm. A gas can adsorb onto a solid surface by Van der Waals (physical) or covalent (chemical) interactions, hence the terms physisorption and chemisorption, respectively. There are six identified types of adsorption isotherms that are classified in terms of the nature (porosity) of the adsorbent as shown in Figure 3-14 (Sing et al., 1985).
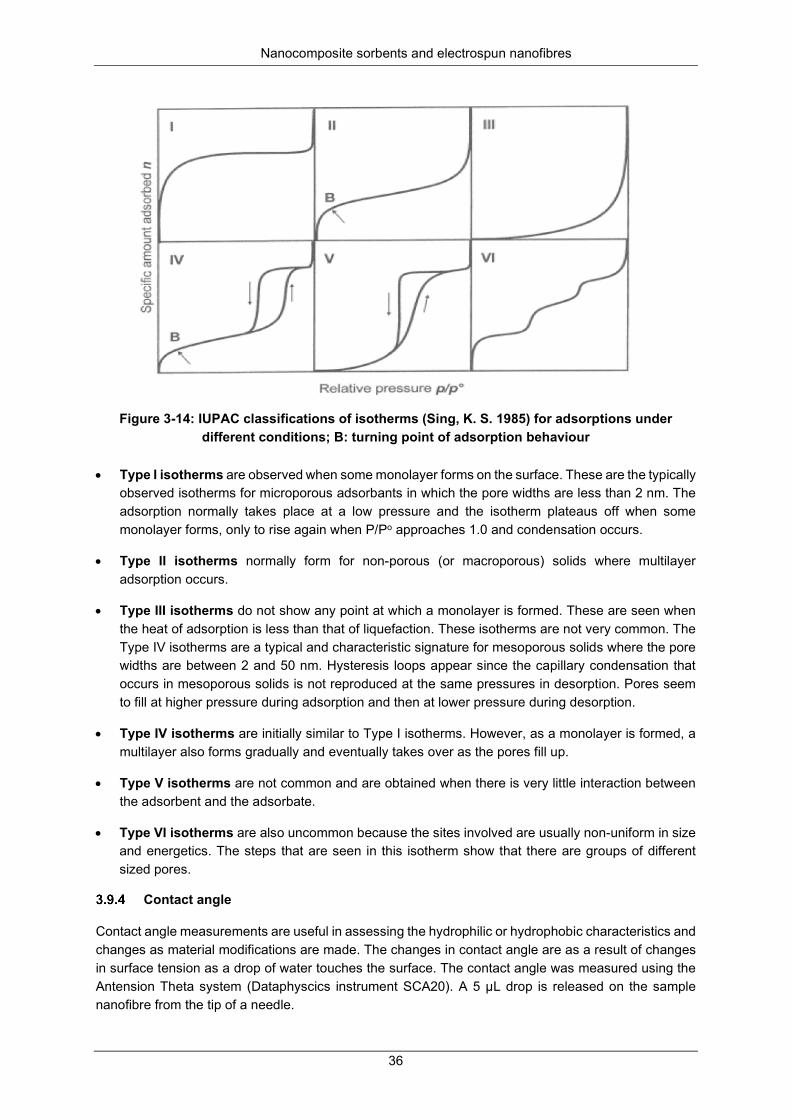
Nanocomposite sorbents and electrospun nanofibres
36
Figure 3-14: IUPAC classifications of isotherms (Sing, K. S. 1985) for adsorptions under
different conditions; B: turning point of adsorption behaviour • Type I isotherms are observed when some monolayer forms on the surface. These are the typically
observed isotherms for microporous adsorbants in which the pore widths are less than 2 nm. The adsorption normally takes place at a low pressure and the isotherm plateaus off when some monolayer forms, only to rise again when P/Po approaches 1.0 and condensation occurs.
• Type II isotherms normally form for non-porous (or macroporous) solids where multilayer adsorption occurs.
• Type III isotherms do not show any point at which a monolayer is formed. These are seen when the heat of adsorption is less than that of liquefaction. These isotherms are not very common. The Type IV isotherms are a typical and characteristic signature for mesoporous solids where the pore widths are between 2 and 50 nm. Hysteresis loops appear since the capillary condensation that occurs in mesoporous solids is not reproduced at the same pressures in desorption. Pores seem to fill at higher pressure during adsorption and then at lower pressure during desorption.
• Type IV isotherms are initially similar to Type I isotherms. However, as a monolayer is formed, a multilayer also forms gradually and eventually takes over as the pores fill up.
• Type V isotherms are not common and are obtained when there is very little interaction between the adsorbent and the adsorbate.
• Type VI isotherms are also uncommon because the sites involved are usually non-uniform in size and energetics. The steps that are seen in this isotherm show that there are groups of different sized pores.
Contact angle
Contact angle measurements are useful in assessing the hydrophilic or hydrophobic characteristics and changes as material modifications are made. The changes in contact angle are as a result of changes in surface tension as a drop of water touches the surface. The contact angle was measured using the Antension Theta system (Dataphyscics instrument SCA20). A 5 µL drop is released on the sample nanofibre from the tip of a needle.
Nanocomposite sorbents and electrospun nanofibres
37
The image of the drop is focused, and is taken and captured by a digital camera. The contact angle is measured and calculated automatically by sessile drop method as the average of five readings (Mittal, 2006; Good, 1992)
Thermogravimetric analysis
Thermogravimetric analysis (TGA) involves the thermal decomposition of a sample by gradually heating and recording the weight loss. It can also be hyphenated with the FTIR to give the FTIR spectra of the products during decomposition. The isothermal TGA was carried out by decomposition. A 10-15 mg sample was weighed and placed in the sample chamber. Nitrogen gas at 2.4 bar that was kept at a flow rate of 20 mℓ min-1 was used during the analysis. The temperature program was set to start at 30 °C and held for 1 minute. After stabilisation, the temperature was programmed to increase from 30 °C with a ramp rate of 10 °C min-1 to 600 °C. The loss in weight was recorded and the data plotted to give a thermograph.
Zetasiser
Zetasiser Nano ZS, Malvern Instruments (UK) dynamic light scattering (DLS) was used to measure the particle sizes and their distribution. An amount of 0.1 g of the sample was transferred into a 20 mℓ glass bottle fitted with a Teflon stopper and 10 mℓ water/ethanol in the ratio 2:1 was added. The mixture was agitated in the vortex for 10 minutes and sonicated for 20 minutes. The solution was used to fill a cuvette for analysis using DLS. Photon correlation spectroscopy (PCS) can be used for larger particles. Static light scattering (laser diffraction) was used. In this study, DLS was used for particle size measurements.
DECHLORINATION, PHOTODEGRADATION AND MINERALISATION EXPERIMENTAL STUDIES
Dechlorination, photodegradation, mineralisation and kinetic studies
The methods for the degradation of halogenated compounds involve the breaking of the strong C-Cl bond by harsh conditions such as incineration, pyrolysis, biological treatment and catalytic oxidation. These methods are expensive and face several serious challenges, such as toxic emissions like dioxin generated by incineration and the slow kinetics of the catalytic degradation reactions due to catalyst deactivation (Meshesha, 2009; Meshesha, 2011; Han et al., 2012). The use of bimetallic catalytic dechlorination systems and the subsequent advanced oxidation by photofenton of TiO2 at room temperature offers an attractive alternative. Dechlorination was conducted using dosages of 5, 10, 20, 30, 40, 50, 70 and 80 mg of Fe-Pd/MgAlO chlorpyrifos and dieldrin to determine the optimal dosage. This was done by dosing triplicate 10 mℓ aliquots of 5 mg/ℓ solution on dieldrin and chlorpyrifos with 5, 10, 20, 30, 40, 50, 70 and 80 mg of P3c (MgAlO/Fe-Pd) and agitating it in an orbital shaker at 160 rpm at 25 °C. Thereafter, samples serially labelled 1-10 in triplicates a, b and c, each containing 10 mℓ aliquots of 10 mg/ℓ model pesticide solution and 30 mg of P3c, were agitated in a shaker at 160 rpm for predetermined intervals. The pesticides were then extracted with four portions of 4 mℓ hexane, removing the pesticide layer each time. The extract was dried using anhydrous sodium sulphate, and the solvent was allowed to evaporate before reconstituting it into 1 mℓ with hexane and filtering it into a GC vial. The samples were then analysed with GC x GC-TOF-MS.
Adsorption and kinetic studies of electrospun PVDF/PAN
Adsorption studies are critical tools when adsorption capacity, efficiency and mechanisms are needed. They are also used in the determination of rate-controlling steps and mass transport. Rate of adsorption influences the overall system design, including reactor dimensions (Ho, 2002). The pseudo-first and second-order kinetic models of Lagergren (1898) are widely applied models, while for isothermal studies, the Langmuir and Freundlich isotherm models are most used.
Nanocomposite sorbents and electrospun nanofibres
38
Adsorption of heavy metals using hemicellulose extract
Adsorption experiments
Adsorption experiments were performed using Cd2+ and Pb2+ solutions of concentrations varying from 100-450 mg/ℓ. The adsorption experiments were carried out in a thermostated water bath shaker at 25 °C, unless otherwise specified. In the batch experiments, 0.01 g of the polysaccharide extract was added to 50 mℓ of the single metal standard solutions, homogenised in a shaker at room temperature and left to equilibrate for two hours. The equilibrated solution was centrifuged and filtered through a 0.45 μm PES filter disk. The residual metal ion concentration (in the filtrate) was determined using ICP-OES. The effect of operating factors, including solution pH, dosage, initial metal ion concentration and contact time, were studied. To distinguish between possible metal precipitation and actual metal sorption, as a means of quality control, control solutions were used.
Desorption experiments
Desorption studies were carried out to determine the feasibility of the regeneration of the adsorbent. The Cd2+ and Pb2+ can easily be eluted from a hemicellulose biosorbent loaded with metal ions with acids. This was performed by agitating the mixture of the metal ion-loaded adsorbent in 25 mℓ of 0.1 HNO3 at 25 °C in a water bath shaker for 30 minutes at 180 rpm, after which it was left to equilibrate for two hours and then filtered off. The concentration of the desorbed metal ions in the filtrate was determined by ICP-EOS.
Adsorption isotherms
Adsorption equilibrium isotherms usually provide information on the mechanism and strength of the interaction between metal ions and the polysaccharide extract. The experiments were carried out under optimised conditions and the adsorption isotherms were used to determine the maximum adsorption capacities. Both two-parameter (Langmuir, Freundlich) and three-parameter (Redlich-Peterson, Sips, Dubinin-Radushkevich and Toth) adsorption isotherm models were selected to determine the adsorption mechanisms (Foo and Hameed, 2010). A non-linearised dynamic fitting was applied with the aid of Sigmaplot 10.0 software (Systat Software). The level of fitness of each was adjudged by corresponding estimations of error with the coefficient of determination (R2) and sum of squared errors (SSE).
Removal of natural organic matter from wastewater using HEM/PVA nanofibre membranes
The nanofibres (0.05 g) were carefully packed in the empty solid phase extraction columns. The nanofibre-packed columns were then fixed on the manifold connected to a vacuum pump. Experiments were conducted at an appropriate pressure atmosphere of 0.5 bar (15 mm mercury). Changes occurring in natural organic matter after filtration using nanofibres were analysed using LC-OCD and the FEEM technique. The results obtained for nanofibres were compared with silica, Strata-X and NH2 solid phase extraction (SPE cartridges). All soluble organics were identified by the LC-OCD system.
Antibacterial activity of silver nanobiocomposites
The antimicrobial activity of the polyethylene silver nanocomposites and silver-doped HEM/PVA nanofibres was tested against various pathogens, including gram negative (E. coli, Pseudomonas aeruginosa and Klebsella) and gram positive (Staphylococcus aureus and Enterococcus) bacteria, as follows: Mueller Hinton broth was weighed and dissolved in 200 mℓ distilled water (dH2O) and autoclaved at 121 °C and 15 PSI for one hour; 0.21 g bacteria agar was dissolved in 15 mℓ dH2O and placed in a water bath at 50 °C; Muller Hinton agar was also prepared by weighing 7.6 g in 200 mℓ of
Nanocomposite sorbents and electrospun nanofibres
39
dH2O and then autoclaved at 121 °C and 15 PSI for one hour and poured into petri dishes; 1% (w/v) agarose gel was prepared by dissolving 1 g in 100 mℓ of TAE buffer. The bacteria were incubated overnight and diluted in saline to a 0.5 McFarland concentration. The colonies of freshly cultured microbial cells were evenly spread on Muller-Hinton agar plates (Dickert, 1981). All studies were carried out in triplicate and the results are reported as an average diameter of the inhibition zone (An et al., 2009). The antimicrobial efficiency of the silver nano biocomposites was related to the clear zone free of bacteria (Rai et al., 2009).
ANALYTICAL TECHNIQUES
Equipment
Accessories included clean glassware (cleaned by immersion in a 10% nitric acid for at least 24 hours, rinsed in Milli-Q Type 1 water, dried and stored), 96 well plates, a water bath (Labex labcon), a centrifuge (Eppedorf, model 5702), a freeze-drier (model 2k BTES, USA), a sonicator and a pH meter.
Analysis of organic compounds
Analytical standards
The details for the analytical standards used, assay, expiry date, lot number and suppliers used are given in Table 3-4.
Table 3-4: List of analytical standards, assay/purity and the source/supplier Standard Supplier Lot number Assay
percentage Expiry date
Diuron Fluka 45463 Lot SZBB265XV 99.6 September 2016 Chlorpyrifos Fluka 45395 Lot SZBA141XV 99.9 May 2015 Dieldrin Fluka 33491 Lot SZB7232XV 97.9 August 2014 Fipronil Sigma Aldrich 41865 Lot BCBBG 5133V 99.9 June 2016 d-10 phenanthrene Sigma Aldrich 4427533 Lot LC 01192V 99.4 July 2016
Preparation of standard solutions
Analytical standard solutions containing 1,000 ppm (mg/mℓ) of standard were prepared by weighing 10 mg into an amber glass bottle fitted with a Teflon seal. The 10 mg of d-10-phenanthrene, diuron, chlorpyrifos, dieldrin and fipronil were dissolved with the addition of 10, 9.96, 9.99, 9.97 and 9.98 mℓ of hexane respectively, using a micropipette and agitated using a vortex mixer, to give 1,000 mg/ℓ. To make 100 mg/ℓ, 1 mℓ of 1 000 mg/ℓ was diluted to 10 mℓ to give 100 mg/ℓ. Working solutions with 1 mg/ℓ, 5 mg/ℓ and 10 mg/ℓ were prepared by serial dilution in a similar manner. A 100 mg/ℓ mixed standard solution was also prepared for the GC × GC-TOF-MS analysis by pipetting 10 mℓ of each standard into a 100 mℓ glass volumetric flask and topping the flask to the 100 mℓ mark with hexane. GC standards were then prepared from 100 mg/ℓ mixed standard in 2 mℓ amber vials using GC grade hexane as solvent (Table 3-5). Working solutions of 5 mg/ℓ and 10 mg/ℓ for the dechlorination experiments were prepared from the analytical standards using the same procedure. The only difference was that the solvent used was an analytical reagent, while the reconstitution solvents were GC grade (chromatographic grade).
Table 3-5: Preparation of analytical standards from 100 mg/ℓ stock solution Volume hexane (µℓ) Volume (µℓ) Concentration (mg/ℓ)
900 100 10 950 50 5 970 30 3
Nanocomposite sorbents and electrospun nanofibres
40
Volume hexane (µℓ) Volume (µℓ) Concentration (mg/ℓ) 990 10 1 995 5 0.5 998 2 0.2
The GC standards were analysed using GC x GC-TOF-MS fitted with a Restek column Rxi 5 sil MS 30 m × 0.25 mm (id) × 0.25 µm film thickness. The injection volume was 1 µℓ. The analysis temperature was set as 90-310 °C with a ramp rate of 20 °C min-1 splitless injection. (This was a method developed and modified based on the Quencher method for pesticide analysis.) The temperature program was changed from a ramp-up of 5 °C min-1 to 20 °C min-1. This optimisation was carried out through pilot runs until well separated peaks with no peak tailing were obtained. The injection volume was also optimised, 1 µℓ split injection gave a pesticide low signal within the noise levels; therefore 1 µℓ splitless injection was adopted. A calibration curve was plotted using the instrument software. This protocol was used for all the pesticide analyses in this study.
Recoveries
Chlorpyrifos and dieldrin recoveries were carried out in triplicate by extracting 10 mℓ of 5 mg/ℓ chlorpyrifos solution using an orbital shaker for a predetermined time in the same manner in which the dechlorination samples were treated. The pesticides were extracted using four portions of hexane, each 4 mℓ, dried with anhydrous sodium sulphate before reconstituting it to 1 mℓ with hexane. The samples were filtered into GC vials using 2.2 µm disc filters. The recoveries were calculated from the results using Equation 3-27.
Equation 3-27
GC × GC-TOF-MS sample analysis
The samples were analysed using GC × GC-TOF-MS in a one-dimensional mode. The calibration curves for all the pesticides were linear over the concentration range of 0.2-10 mg/ℓ (R2 > 0.99; regressions were based on a five-point calibration) (Figure 3-15). The approximate detection limit for all pesticides was 0.33 µg/ℓ. According to known sample analysis each time, the maximum error was determined to be less than 13%. The column used was Rxi 5 Sil MS (30 m × 0.25 mm (id) × 0.25 µm). The carrier gas was helium, while the injection volume used in splitless mode was 1 µℓ. A flow rate of 1.0 mℓ min-1 was used. The oven temperature started at an initial temperature of 90 °C, which was held for one minute, before increasing it to 310 °C by a rate of 20 °C min-1 for a total run time of 25 minutes. Three 10 mg/ℓ samples were taken through the same procedure and analysed to evaluate the recoveries in order to validate the extraction process.
1 0 0c o vc o vR e% ×=i o nc o n c e n t r a ti n i t i a l
i o nc o n c e n t r a te r yr ee r y
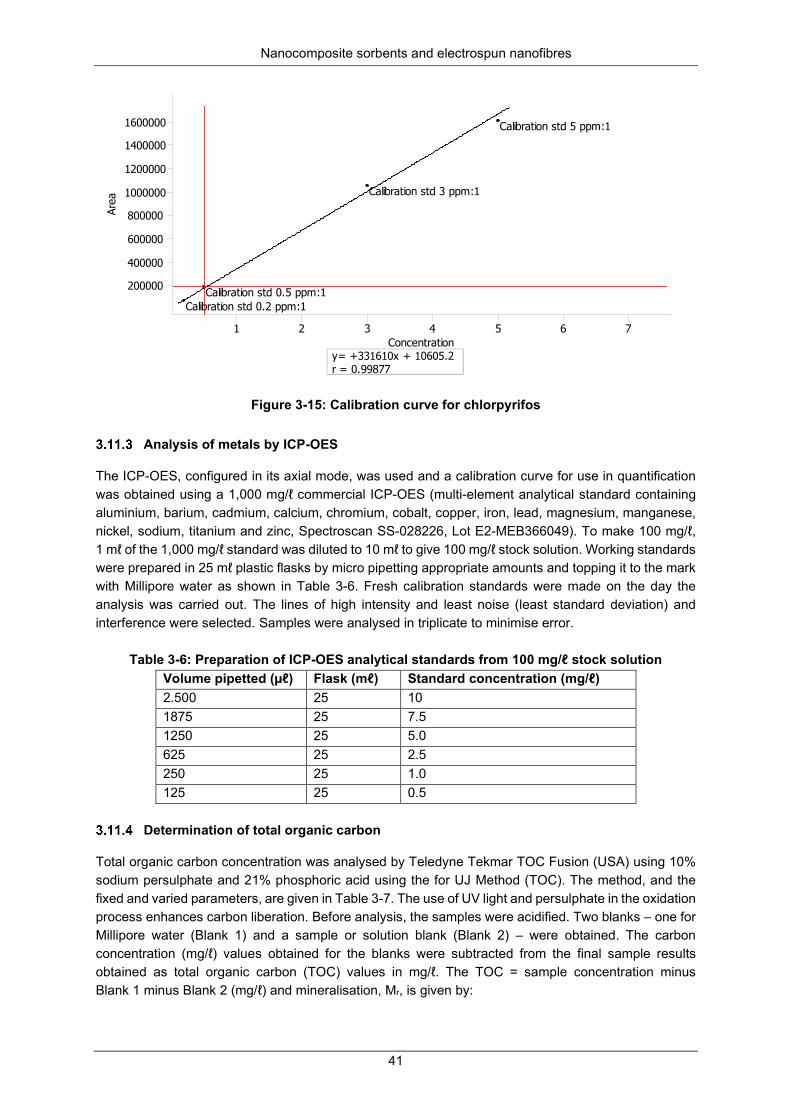
Nanocomposite sorbents and electrospun nanofibres
41
Figure 3-15: Calibration curve for chlorpyrifos
Analysis of metals by ICP-OES
The ICP-OES, configured in its axial mode, was used and a calibration curve for use in quantification was obtained using a 1,000 mg/ℓ commercial ICP-OES (multi-element analytical standard containing aluminium, barium, cadmium, calcium, chromium, cobalt, copper, iron, lead, magnesium, manganese, nickel, sodium, titanium and zinc, Spectroscan SS-028226, Lot E2-MEB366049). To make 100 mg/ℓ, 1 mℓ of the 1,000 mg/ℓ standard was diluted to 10 mℓ to give 100 mg/ℓ stock solution. Working standards were prepared in 25 mℓ plastic flasks by micro pipetting appropriate amounts and topping it to the mark with Millipore water as shown in Table 3-6. Fresh calibration standards were made on the day the analysis was carried out. The lines of high intensity and least noise (least standard deviation) and interference were selected. Samples were analysed in triplicate to minimise error.
Table 3-6: Preparation of ICP-OES analytical standards from 100 mg/ℓ stock solution
Volume pipetted (µℓ) Flask (mℓ) Standard concentration (mg/ℓ) 2.500 25 10 1875 25 7.5 1250 25 5.0 625 25 2.5 250 25 1.0 125 25 0.5
Determination of total organic carbon
Total organic carbon concentration was analysed by Teledyne Tekmar TOC Fusion (USA) using 10% sodium persulphate and 21% phosphoric acid using the for UJ Method (TOC). The method, and the fixed and varied parameters, are given in Table 3-7. The use of UV light and persulphate in the oxidation process enhances carbon liberation. Before analysis, the samples were acidified. Two blanks – one for Millipore water (Blank 1) and a sample or solution blank (Blank 2) – were obtained. The carbon concentration (mg/ℓ) values obtained for the blanks were subtracted from the final sample results obtained as total organic carbon (TOC) values in mg/ℓ. The TOC = sample concentration minus Blank 1 minus Blank 2 (mg/ℓ) and mineralisation, Mr, is given by:
1 2 3 4 5 6 7
200000
400000
600000
800000
1000000
1200000
1400000
1600000
Concentration
Area
Calibration std 0.2 ppm:1Calibration std 0.5 ppm:1
Calibration std 3 ppm:1
Calibration std 5 ppm:1
y= +331610x + 10605.2r = 0.99877
Nanocomposite sorbents and electrospun nanofibres
42
Equation 3-28 where, Mr is mineralisation, t = 0 is time at the start (0 minutes), and t = t is time at t minutes.
Table 3-7: TOC analysis parameters
Parameter Value Sample volume 4.0 mℓ Dilution 1:2 Acid volume 1.0 mℓ Reagent volume 1.0 mℓ UV reactor pre-rinse On UV reactor pre-rinse volume 5.0 Number of UV reactor pre-rinses 1 IC sparge time 1.00 minutes Detector sweep flow 500 mℓ/minute Pre-sparge time 0.00 minutes System flow 200 mℓ/minute
ADSORPTION ISOTHERM MODELS
Langmuir isotherm
The simplest model for the adsorption process of gas molecules onto a surface was derived by Langmuir in 1918. The assumptions for the Langmuir isotherm model are as follows:
i. Adsorption cannot form more than one molecular layer on the surface. ii. All adsorption sites are uniform and equivalent. iii. The probability of a site adsorbing a molecule is the same, irrespective of whether the adjacent
sites are vacant or not. iv. Every adsorption site can accommodate only one molecule of adsorbate. v. Molecules of the adsorbate do not interact with one another. vi. Equilibrium is achieved between the rate at which species adsorb and desorb from the surface.
Hence, adsorption is a dynamic process. vii. The Langmuir isotherm equation can be derived by looking at the processes of adsorption and
desorption of a gas on a uniform solid surface.
At equilibrium, the rate of adsorption is equal to the rate of desorption. The rate of adsorption of Gas A on the surface is proportional to the pressure of gas and the concentration of vacant sites, expressed as the fraction of sites on the surface that are available for adsorption (when θ = the fraction of surface sites occupied by Gas A) (Equation 3-29).
Equation 3-29
The rate of desorption of Gas A is proportional to the concentration of sites occupied by Gas A on the surface and is expressed as the fraction that Gas A covers on the surface θ:
Equation 3-30
( )( ) 0
0
0
100100=
=×−=t
ttr TOC
TOCM
( )1 θ−= Aa d sa d s Pkra te
θd e sd e s kr a t e=
Nanocomposite sorbents and electrospun nanofibres
43
At equilibrium,
Equation 3-31
Therefore,
Equation 3-32
If we defined b as kads/kdes, then, from Equation 2-30, it can be shown that:
Equation 3-33
Equation 3-34
where V is the volume of A (at standard temperature and pressure (STP)) adsorbed at equilibrium, and Vm is the volume of the gas required to complete the monolayer of A on the surface of the adsorbent; so Equation 3-35:
Equation 3-35
When Equation 3-35 is rearranged, we get Equation 3-36:
Equation 3-36
Therefore, if Langmuir’s model isotherm is obeyed, a plot of P/V against P over the equilibrium pressure range studied will give a straight line. The intercept will be 1/bVm and the gradient 1/Vm. If the surface area occupied by one molecule of the adsorbate is known, then the volume Vm can be used to calculate the surface area of the solid. The value of b gives an indication of the “strength” of the adsorption of Gas A on the surface. If Vm is the volume of gas at standard temperature and pressure required to form a monolayer on the sample used (of known weight), NA is Avogadro’s number, and sigma (σ) is the cross-sectional area of one molecule of adsorbant, in this case N2. The surface area of the surface sample (S) is given by Equation 3-37:
Equation 3-37
The Brunauer-Emmett-Teller Model
The assumptions made by Langmuir are not appropriate for many porous materials and there have been several attempts to develop a model that does not rely so heavily on them; one of which is the BET model (Serio et al., 2006) The BET equation is based on the Langmuir model, but with the following additional assumptions:
( ))1 θθ d e sAa d s kPk =−
( )1θ
θ−= A
a d s
d e s Pkk
bPbP+
=1
θ
mVV
=θ
1 b Pb P
VV
m +=
mm VP
bVVP
+=1
2 9 83 1 4.81 0 1 3 2 5 σ××
×= Am NVS
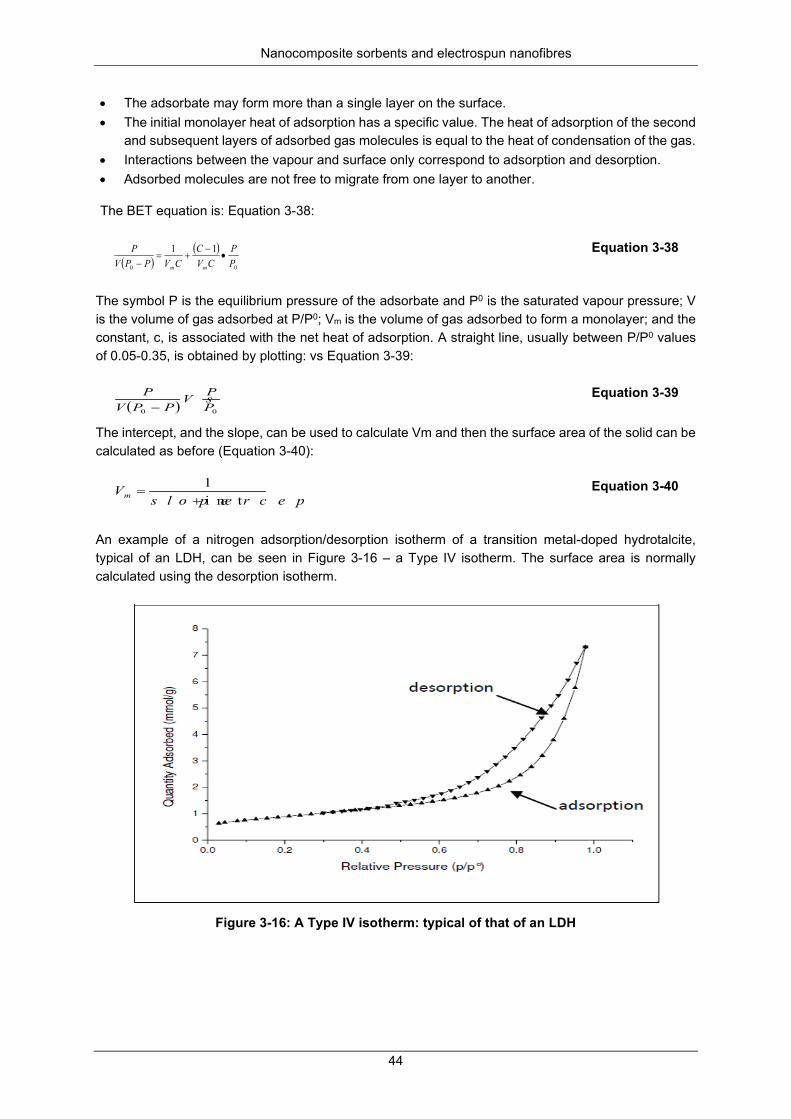
Nanocomposite sorbents and electrospun nanofibres
44
• The adsorbate may form more than a single layer on the surface. • The initial monolayer heat of adsorption has a specific value. The heat of adsorption of the second
and subsequent layers of adsorbed gas molecules is equal to the heat of condensation of the gas. • Interactions between the vapour and surface only correspond to adsorption and desorption. • Adsorbed molecules are not free to migrate from one layer to another.
The BET equation is: Equation 3-38:
Equation 3-38
The symbol P is the equilibrium pressure of the adsorbate and P0 is the saturated vapour pressure; V is the volume of gas adsorbed at P/P0; Vm is the volume of gas adsorbed to form a monolayer; and the constant, c, is associated with the net heat of adsorption. A straight line, usually between P/P0 values of 0.05-0.35, is obtained by plotting: vs Equation 3-39:
Equation 3-39
The intercept, and the slope, can be used to calculate Vm and then the surface area of the solid can be calculated as before (Equation 3-40):
Equation 3-40
An example of a nitrogen adsorption/desorption isotherm of a transition metal-doped hydrotalcite, typical of an LDH, can be seen in Figure 3-16 – a Type IV isotherm. The surface area is normally calculated using the desorption isotherm.
Figure 3-16: A Type IV isotherm: typical of that of an LDH
( )( )11
00 PP
CVC
CVPPVP
mm
•−
+=−
( ) 00 PPV s
PPVP−
i n t1
e r c e ps l o p eVm +
=
Nanocomposite sorbents and electrospun nanofibres
45
The Barrett, Joyner and Halenda method
In this publication, the BJH method is used to calculate the pore size distribution of porous solid samples (Brunauer et al., 1938). This method is used conventionally to analyse mesoporous materials and is based on the Kelvin equation. The following assumptions are made:
• The pores are of a uniform shape. • All pores are in the mesoporous range (pore widths between 2 nm and 50 nm).
The presence of pores in an adsorbent solid can affect the shape of an adsorption/desorption isotherm because the equilibrium vapour pressure above condensed liquid in a (cylindrical) pore, in which the surface of the liquid is curved, is lower than that above a liquid with a flat surface. The Kelvin equation relates to the equilibrium vapour pressure of a liquid in a small cylindrical pore where the surface of the liquid takes up a regular curvature. The Kelvin equation describes the dependence of the equilibrium vapour pressure of a liquid in the pore on the radius of the pore, and the contact angle. Because the equilibrium vapour pressure above a curved surface is lower than above a flat surface, vapour condenses in pores at lower P/P0 values than on a flat surface, with narrow pores filling at lower pressures than wide pores. From the pressure at which condensation occurs, the radius of the pores can be calculated. The Kelvin equation is given below. In the equation, P/P0 is the relative vapour pressure at which condensation occurs in pores of radius r with the contact angle of the condensed liquid with the pore walls (it is assumed to be zero for pores in the size range studied here). Other constants are: the surface tension of the condensed liquid, Vmolar, the molar volume of the liquid, R and T (Equation 3-41):
Equation 3-41
The BJH method involves a correction of the pore radius given by the Kelvin equation to allow for a film of condensed vapour on the pore walls, which means that the pore radius is slightly larger than the radius of curvature of the meniscus.
c o s......2
0 θγ
TRrV
PPI n m o l a r−
=
Nanocomposite sorbents and electrospun nanofibres
46
CHAPTER 4: DECHLORINATION OF SELECTED PESTICIDES USING CATALYTIC BIMETALLIC FE-PD
NANOPARTICLES IMMOBILISED ON MgAlO SUPPORT
INTRODUCTION
Water pollution is a persistent global problem due to increased anthropogenic activities. South Africa has water per capita (volume of water per person per year) of 1,136 m3 – just above the threshold of 1,000 m3 – and is classified as a water-scarce nation by the World Health Organisation (WHO). For this reason, the Rand Water Corporation in Johannesburg, South Africa, has been tasked to provide water and monitor pollutants at source in the respective water catchment areas. These pollutants include pesticides, chlorinated methanes, chlorinated benzenes, chlorinated phenols, chlorinated ethers, trihalomethanes and dioxins, among many other categories of pollutants.
Most of these chlorinated compounds are very stable. They accumulate in body tissue and are highly toxic, carcinogenic, and damage the endocrine system and nervous system, as well as the environment (Sheng and Liu, 2011). Conventional methods employed in the degradation of pollutants, such as incineration at a high temperature, may lead to the production of dioxins, furans and biphenyls that are even more toxic (Meshesha, 2009), while water treatment methods do not remove very low concentrations of these contaminants. Therefore, interventions for their recovery or removal and degradation are necessary (Cieszynska and Wisniewsski, 2011). Their degradation requires harsh conditions, such as high reaction temperatures or the use of a catalyst to break the strong C-Cl bond. Remediation methods using ZVI-reductive dechlorination have been reported (Zhang, 2004). The ZVI catalyst is easily deactivated due to the presence of other metals and oxidation to iron (III). Iron is preferred because it is non-toxic, abundant and cheap. These reactions result in incomplete degradation and have limited reactivity on chlorinated aromatics. Another method is the use of Fe2+ in the presence of peroxide, which produces non-toxic acids and chloride ions. Unfortunately, this reaction proceeds in acidic medium and is, therefore, of little use. The catalytic hydrodechlorination generates HCl as shown in Equation 4-1 (Meshesha, 2009). It involves the use of hydrogen over a Pd catalyst. However, this reaction requires a hydrogen reactor at elevated temperatures around 400 ºC and also at a pressure of 1 bar, which requires stringent safety precautions, making the process costly and unattainable.
Equation 4-1
A new approach is the use of reductive dichlorination, which uses catalytic bimetallic nanoparticle systems such as M-Pd where M is one of the following metal ions, (Fe2+, Ni2+, Cu2+, Zn2+ and Co2+) that can form a redox couple (Su and Puls, 1999; Muftikian et al., 1996; Wei et al., 2006). For example, in ethylene conversion, the reaction rate increased 100 times when a nanocatalyst was used and 100,000 times when a second metal such as 1 wt % Fe-Pd was introduced (Xu and Bhattacharya, 2007; Orellana et al., 2005; Han et al., 2012). Although the use of nanocatalysts has many advantages, such as effective degradation, faster reaction times and low dosage due to high surface energy, there are also a number of serious challenges associated with their use. These challenges include aggregation, their removal after use, their inherent toxicity, sintering and leaching; all of which are associated with their small sizes and high surface energy. Leaching also deactivates the catalyst simply by removing it. Leaching is a serious secondary pollution challenge due to the release of nanoparticles into drinking water.
HClRHHRCl +→+ 2
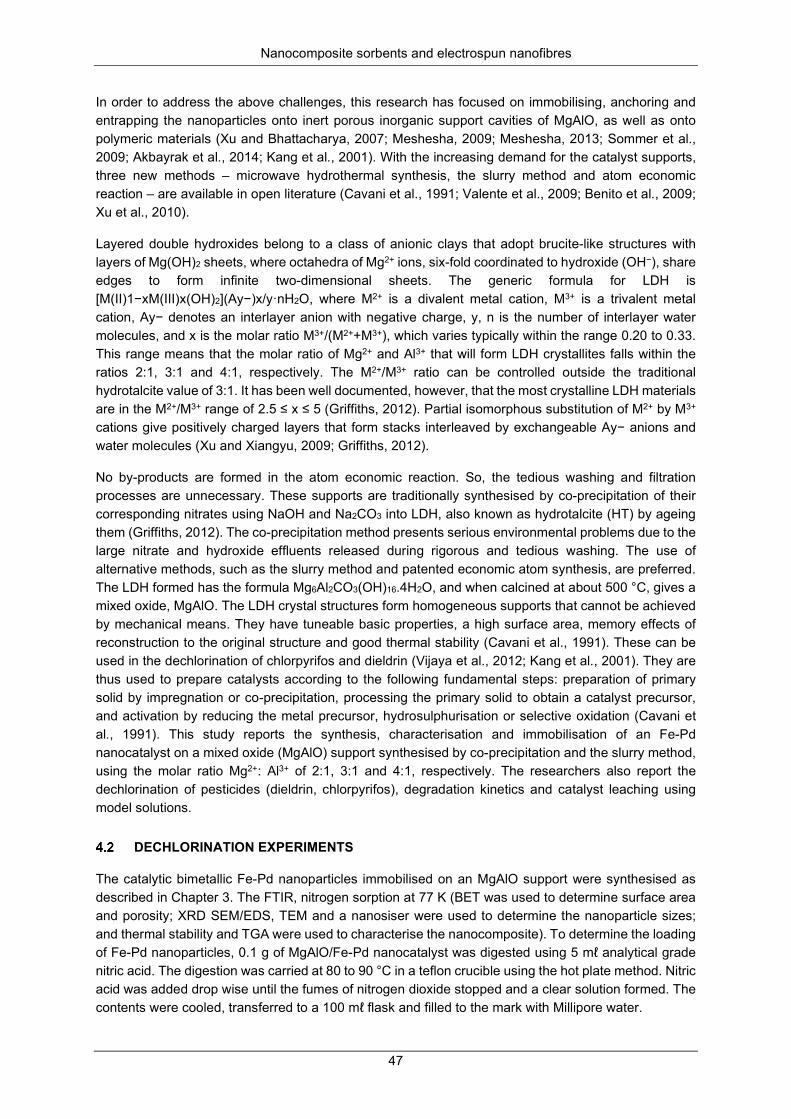
Nanocomposite sorbents and electrospun nanofibres
47
In order to address the above challenges, this research has focused on immobilising, anchoring and entrapping the nanoparticles onto inert porous inorganic support cavities of MgAlO, as well as onto polymeric materials (Xu and Bhattacharya, 2007; Meshesha, 2009; Meshesha, 2013; Sommer et al., 2009; Akbayrak et al., 2014; Kang et al., 2001). With the increasing demand for the catalyst supports, three new methods – microwave hydrothermal synthesis, the slurry method and atom economic reaction – are available in open literature (Cavani et al., 1991; Valente et al., 2009; Benito et al., 2009; Xu et al., 2010).
Layered double hydroxides belong to a class of anionic clays that adopt brucite-like structures with layers of Mg(OH)2 sheets, where octahedra of Mg2+ ions, six-fold coordinated to hydroxide (OH−), share edges to form infinite two-dimensional sheets. The generic formula for LDH is [M(II)1−xM(III)x(OH)2](Ay−)x/y·nH2O, where M2+ is a divalent metal cation, M3+ is a trivalent metal cation, Ay− denotes an interlayer anion with negative charge, y, n is the number of interlayer water molecules, and x is the molar ratio M3+/(M2++M3+), which varies typically within the range 0.20 to 0.33. This range means that the molar ratio of Mg2+ and Al3+ that will form LDH crystallites falls within the ratios 2:1, 3:1 and 4:1, respectively. The M2+/M3+ ratio can be controlled outside the traditional hydrotalcite value of 3:1. It has been well documented, however, that the most crystalline LDH materials are in the M2+/M3+ range of 2.5 ≤ x ≤ 5 (Griffiths, 2012). Partial isomorphous substitution of M2+ by M3+ cations give positively charged layers that form stacks interleaved by exchangeable Ay− anions and water molecules (Xu and Xiangyu, 2009; Griffiths, 2012).
No by-products are formed in the atom economic reaction. So, the tedious washing and filtration processes are unnecessary. These supports are traditionally synthesised by co-precipitation of their corresponding nitrates using NaOH and Na2CO3 into LDH, also known as hydrotalcite (HT) by ageing them (Griffiths, 2012). The co-precipitation method presents serious environmental problems due to the large nitrate and hydroxide effluents released during rigorous and tedious washing. The use of alternative methods, such as the slurry method and patented economic atom synthesis, are preferred. The LDH formed has the formula Mg6Al2CO3(OH)16.4H2O, and when calcined at about 500 °C, gives a mixed oxide, MgAlO. The LDH crystal structures form homogeneous supports that cannot be achieved by mechanical means. They have tuneable basic properties, a high surface area, memory effects of reconstruction to the original structure and good thermal stability (Cavani et al., 1991). These can be used in the dechlorination of chlorpyrifos and dieldrin (Vijaya et al., 2012; Kang et al., 2001). They are thus used to prepare catalysts according to the following fundamental steps: preparation of primary solid by impregnation or co-precipitation, processing the primary solid to obtain a catalyst precursor, and activation by reducing the metal precursor, hydrosulphurisation or selective oxidation (Cavani et al., 1991). This study reports the synthesis, characterisation and immobilisation of an Fe-Pd nanocatalyst on a mixed oxide (MgAlO) support synthesised by co-precipitation and the slurry method, using the molar ratio Mg2+: Al3+ of 2:1, 3:1 and 4:1, respectively. The researchers also report the dechlorination of pesticides (dieldrin, chlorpyrifos), degradation kinetics and catalyst leaching using model solutions.
DECHLORINATION EXPERIMENTS
The catalytic bimetallic Fe-Pd nanoparticles immobilised on an MgAlO support were synthesised as described in Chapter 3. The FTIR, nitrogen sorption at 77 K (BET was used to determine surface area and porosity; XRD SEM/EDS, TEM and a nanosiser were used to determine the nanoparticle sizes; and thermal stability and TGA were used to characterise the nanocomposite). To determine the loading of Fe-Pd nanoparticles, 0.1 g of MgAlO/Fe-Pd nanocatalyst was digested using 5 mℓ analytical grade nitric acid. The digestion was carried at 80 to 90 °C in a teflon crucible using the hot plate method. Nitric acid was added drop wise until the fumes of nitrogen dioxide stopped and a clear solution formed. The contents were cooled, transferred to a 100 mℓ flask and filled to the mark with Millipore water.
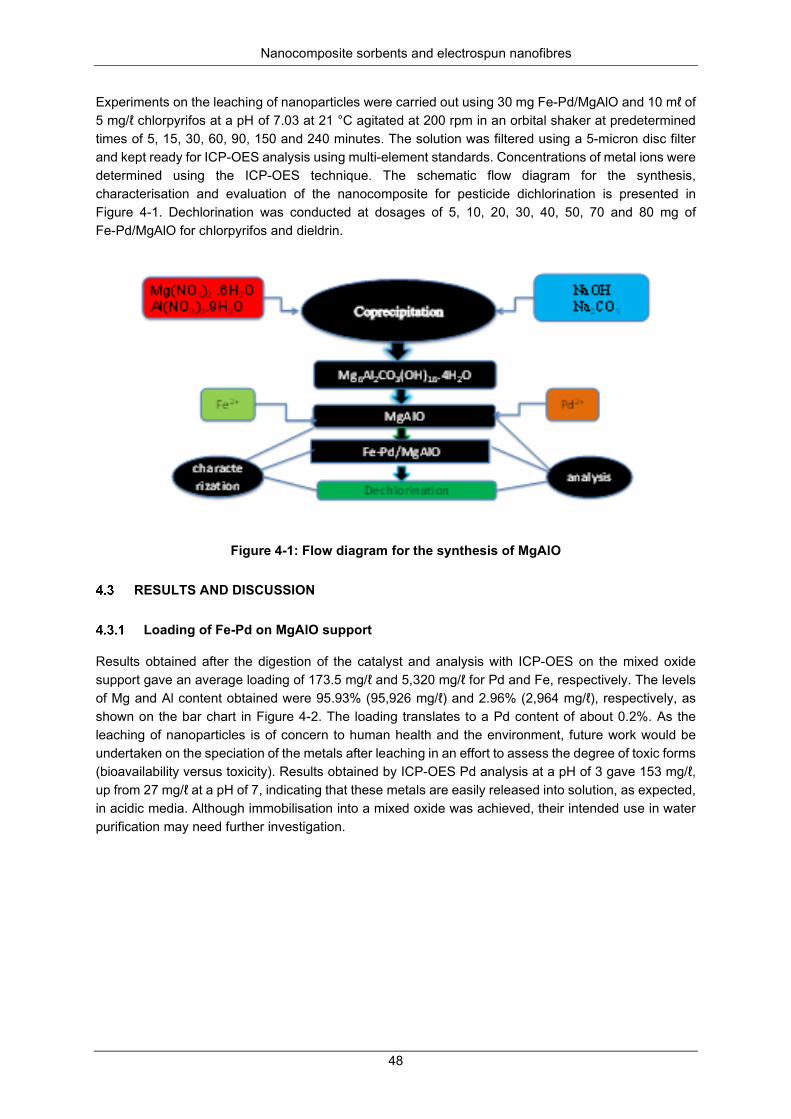
Nanocomposite sorbents and electrospun nanofibres
48
Experiments on the leaching of nanoparticles were carried out using 30 mg Fe-Pd/MgAlO and 10 mℓ of 5 mg/ℓ chlorpyrifos at a pH of 7.03 at 21 °C agitated at 200 rpm in an orbital shaker at predetermined times of 5, 15, 30, 60, 90, 150 and 240 minutes. The solution was filtered using a 5-micron disc filter and kept ready for ICP-OES analysis using multi-element standards. Concentrations of metal ions were determined using the ICP-OES technique. The schematic flow diagram for the synthesis, characterisation and evaluation of the nanocomposite for pesticide dichlorination is presented in Figure 4-1. Dechlorination was conducted at dosages of 5, 10, 20, 30, 40, 50, 70 and 80 mg of Fe-Pd/MgAlO for chlorpyrifos and dieldrin.
Figure 4-1: Flow diagram for the synthesis of MgAlO
RESULTS AND DISCUSSION
Loading of Fe-Pd on MgAlO support
Results obtained after the digestion of the catalyst and analysis with ICP-OES on the mixed oxide support gave an average loading of 173.5 mg/ℓ and 5,320 mg/ℓ for Pd and Fe, respectively. The levels of Mg and Al content obtained were 95.93% (95,926 mg/ℓ) and 2.96% (2,964 mg/ℓ), respectively, as shown on the bar chart in Figure 4-2. The loading translates to a Pd content of about 0.2%. As the leaching of nanoparticles is of concern to human health and the environment, future work would be undertaken on the speciation of the metals after leaching in an effort to assess the degree of toxic forms (bioavailability versus toxicity). Results obtained by ICP-OES Pd analysis at a pH of 3 gave 153 mg/ℓ, up from 27 mg/ℓ at a pH of 7, indicating that these metals are easily released into solution, as expected, in acidic media. Although immobilisation into a mixed oxide was achieved, their intended use in water purification may need further investigation.
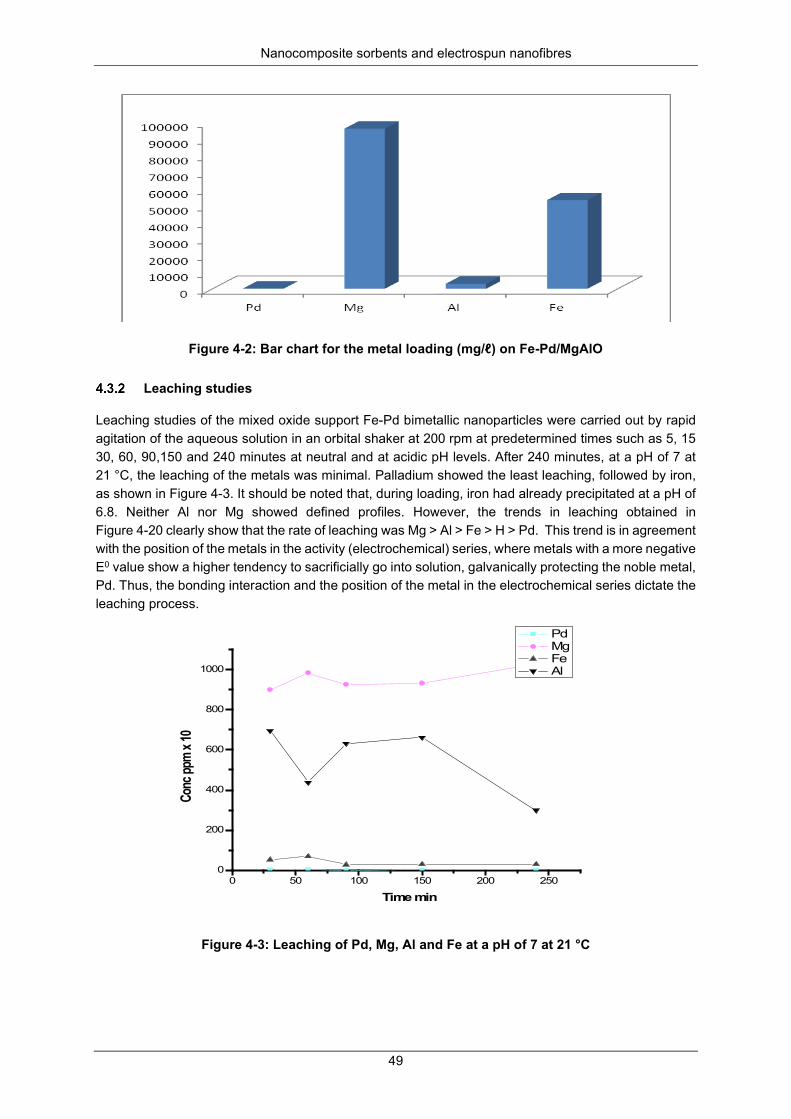
Nanocomposite sorbents and electrospun nanofibres
49
Figure 4-2: Bar chart for the metal loading (mg/ℓ) on Fe-Pd/MgAlO
Leaching studies
Leaching studies of the mixed oxide support Fe-Pd bimetallic nanoparticles were carried out by rapid agitation of the aqueous solution in an orbital shaker at 200 rpm at predetermined times such as 5, 15 30, 60, 90,150 and 240 minutes at neutral and at acidic pH levels. After 240 minutes, at a pH of 7 at 21 °C, the leaching of the metals was minimal. Palladium showed the least leaching, followed by iron, as shown in Figure 4-3. It should be noted that, during loading, iron had already precipitated at a pH of 6.8. Neither Al nor Mg showed defined profiles. However, the trends in leaching obtained in Figure 4-20 clearly show that the rate of leaching was Mg > Al > Fe > H > Pd. This trend is in agreement with the position of the metals in the activity (electrochemical) series, where metals with a more negative E0 value show a higher tendency to sacrificially go into solution, galvanically protecting the noble metal, Pd. Thus, the bonding interaction and the position of the metal in the electrochemical series dictate the leaching process.
Figure 4-3: Leaching of Pd, Mg, Al and Fe at a pH of 7 at 21 °C
0 50 100 150 200 2500
200
400
600
800
1000
Conc
ppm
x 10
Time min
Pd Mg Fe Al
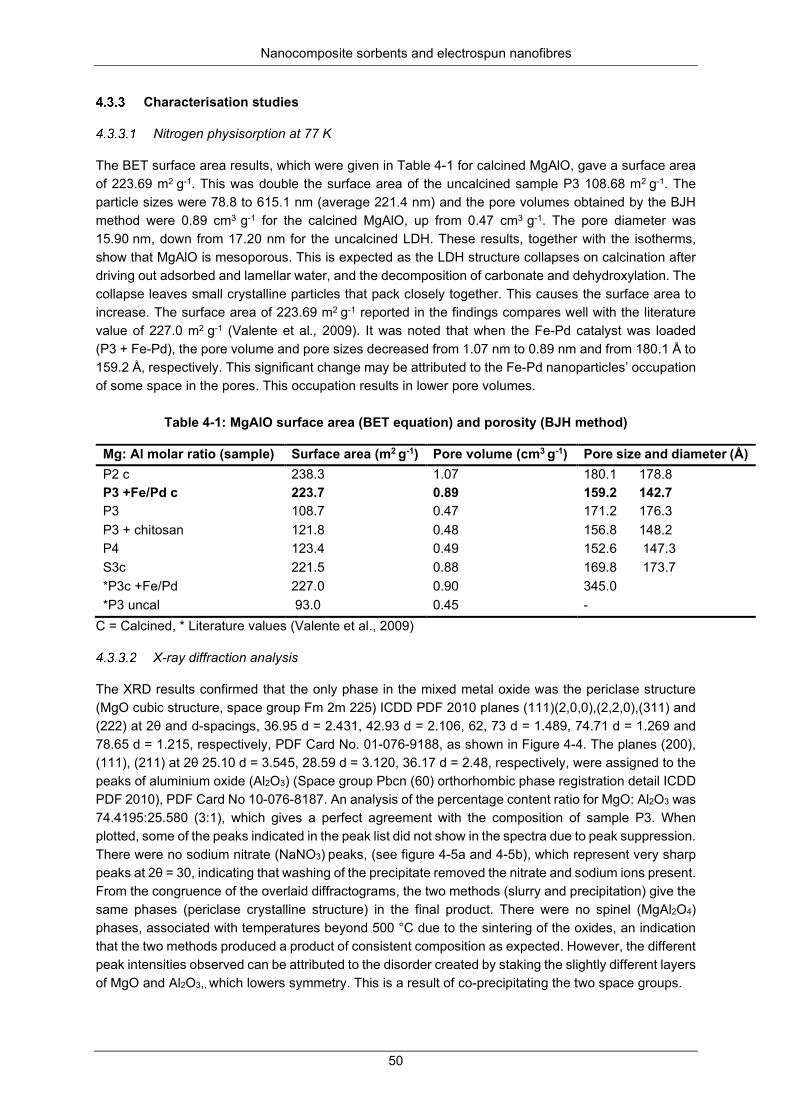
Nanocomposite sorbents and electrospun nanofibres
50
Characterisation studies
Nitrogen physisorption at 77 K
The BET surface area results, which were given in Table 4-1 for calcined MgAlO, gave a surface area of 223.69 m2 g-1. This was double the surface area of the uncalcined sample P3 108.68 m2 g-1. The particle sizes were 78.8 to 615.1 nm (average 221.4 nm) and the pore volumes obtained by the BJH method were 0.89 cm3 g-1 for the calcined MgAlO, up from 0.47 cm3 g-1. The pore diameter was 15.90 nm, down from 17.20 nm for the uncalcined LDH. These results, together with the isotherms, show that MgAlO is mesoporous. This is expected as the LDH structure collapses on calcination after driving out adsorbed and lamellar water, and the decomposition of carbonate and dehydroxylation. The collapse leaves small crystalline particles that pack closely together. This causes the surface area to increase. The surface area of 223.69 m2 g-1 reported in the findings compares well with the literature value of 227.0 m2 g-1 (Valente et al., 2009). It was noted that when the Fe-Pd catalyst was loaded (P3 + Fe-Pd), the pore volume and pore sizes decreased from 1.07 nm to 0.89 nm and from 180.1 Å to 159.2 Å, respectively. This significant change may be attributed to the Fe-Pd nanoparticles’ occupation of some space in the pores. This occupation results in lower pore volumes.
Table 4-1: MgAlO surface area (BET equation) and porosity (BJH method)
C = Calcined, * Literature values (Valente et al., 2009)
X-ray diffraction analysis
The XRD results confirmed that the only phase in the mixed metal oxide was the periclase structure (MgO cubic structure, space group Fm 2m 225) ICDD PDF 2010 planes (111)(2,0,0),(2,2,0),(311) and (222) at 2θ and d-spacings, 36.95 d = 2.431, 42.93 d = 2.106, 62, 73 d = 1.489, 74.71 d = 1.269 and 78.65 d = 1.215, respectively, PDF Card No. 01-076-9188, as shown in Figure 4-4. The planes (200), (111), (211) at 2θ 25.10 d = 3.545, 28.59 d = 3.120, 36.17 d = 2.48, respectively, were assigned to the peaks of aluminium oxide (Al2O3) (Space group Pbcn (60) orthorhombic phase registration detail ICDD PDF 2010), PDF Card No 10-076-8187. An analysis of the percentage content ratio for MgO: Al2O3 was 74.4195:25.580 (3:1), which gives a perfect agreement with the composition of sample P3. When plotted, some of the peaks indicated in the peak list did not show in the spectra due to peak suppression. There were no sodium nitrate (NaNO3) peaks, (see figure 4-5a and 4-5b), which represent very sharp peaks at 2θ = 30, indicating that washing of the precipitate removed the nitrate and sodium ions present. From the congruence of the overlaid diffractograms, the two methods (slurry and precipitation) give the same phases (periclase crystalline structure) in the final product. There were no spinel (MgAl2O4) phases, associated with temperatures beyond 500 °C due to the sintering of the oxides, an indication that the two methods produced a product of consistent composition as expected. However, the different peak intensities observed can be attributed to the disorder created by staking the slightly different layers of MgO and Al2O3,, which lowers symmetry. This is a result of co-precipitating the two space groups.
Mg: Al molar ratio (sample) Surface area (m2 g-1) Pore volume (cm3 g-1) Pore size and diameter (Å) P2 c 238.3 1.07 180.1 178.8 P3 +Fe/Pd c 223.7 0.89 159.2 142.7 P3 108.7 0.47 171.2 176.3 P3 + chitosan 121.8 0.48 156.8 148.2 P4 123.4 0.49 152.6 147.3 S3c 221.5 0.88 169.8 173.7 *P3c +Fe/Pd 227.0 0.90 345.0 *P3 uncal 93.0 0.45 -
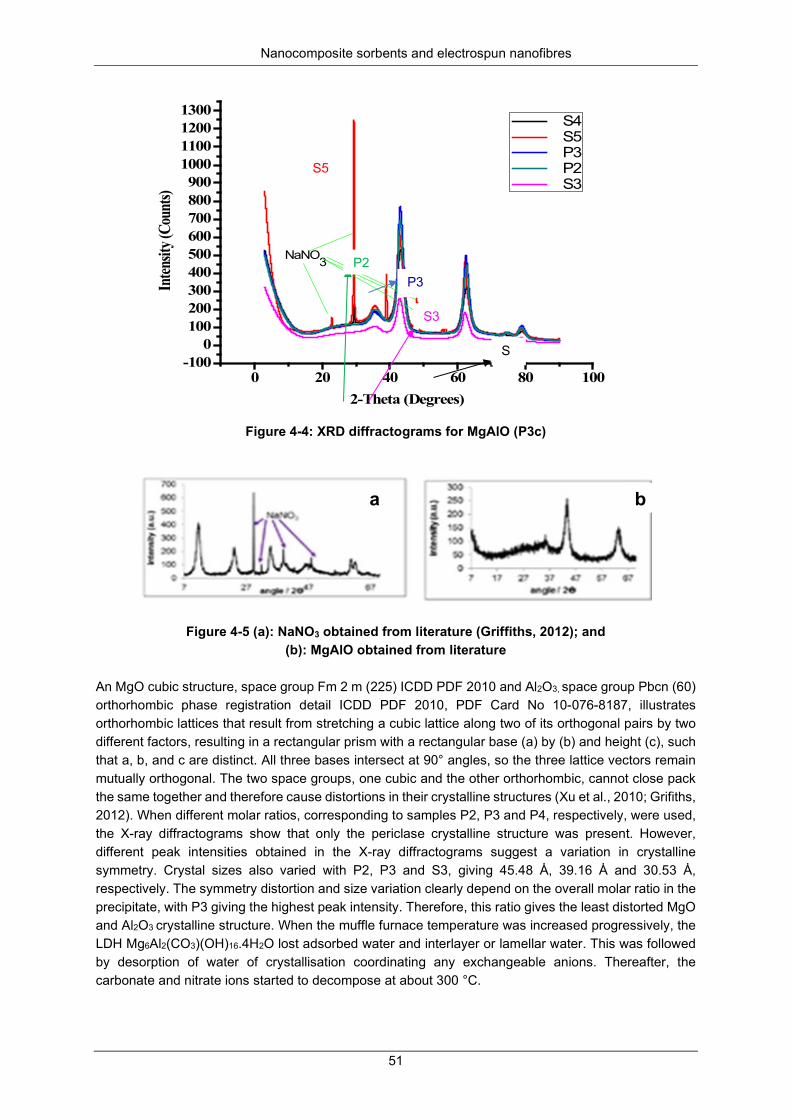
Nanocomposite sorbents and electrospun nanofibres
51
0 20 40 60 80 100-100
0100200300400500600700800900
1000110012001300
Inten
sity (
Coun
ts)
2-Theta (Degrees)
S4 S5 P3 P2 S3
NaNO3
Figure 4-4: XRD diffractograms for MgAlO (P3c)
Figure 4-5 (a): NaNO3 obtained from literature (Griffiths, 2012); and (b): MgAlO obtained from literature
An MgO cubic structure, space group Fm 2 m (225) ICDD PDF 2010 and Al2O3, space group Pbcn (60) orthorhombic phase registration detail ICDD PDF 2010, PDF Card No 10-076-8187, illustrates orthorhombic lattices that result from stretching a cubic lattice along two of its orthogonal pairs by two different factors, resulting in a rectangular prism with a rectangular base (a) by (b) and height (c), such that a, b, and c are distinct. All three bases intersect at 90° angles, so the three lattice vectors remain mutually orthogonal. The two space groups, one cubic and the other orthorhombic, cannot close pack the same together and therefore cause distortions in their crystalline structures (Xu et al., 2010; Grifiths, 2012). When different molar ratios, corresponding to samples P2, P3 and P4, respectively, were used, the X-ray diffractograms show that only the periclase crystalline structure was present. However, different peak intensities obtained in the X-ray diffractograms suggest a variation in crystalline symmetry. Crystal sizes also varied with P2, P3 and S3, giving 45.48 Ȧ, 39.16 Ȧ and 30.53 Ȧ, respectively. The symmetry distortion and size variation clearly depend on the overall molar ratio in the precipitate, with P3 giving the highest peak intensity. Therefore, this ratio gives the least distorted MgO and Al2O3 crystalline structure. When the muffle furnace temperature was increased progressively, the LDH Mg6Al2(CO3)(OH)16.4H2O lost adsorbed water and interlayer or lamellar water. This was followed by desorption of water of crystallisation coordinating any exchangeable anions. Thereafter, the carbonate and nitrate ions started to decompose at about 300 °C.
S5
S
P3
S3
P2
a b
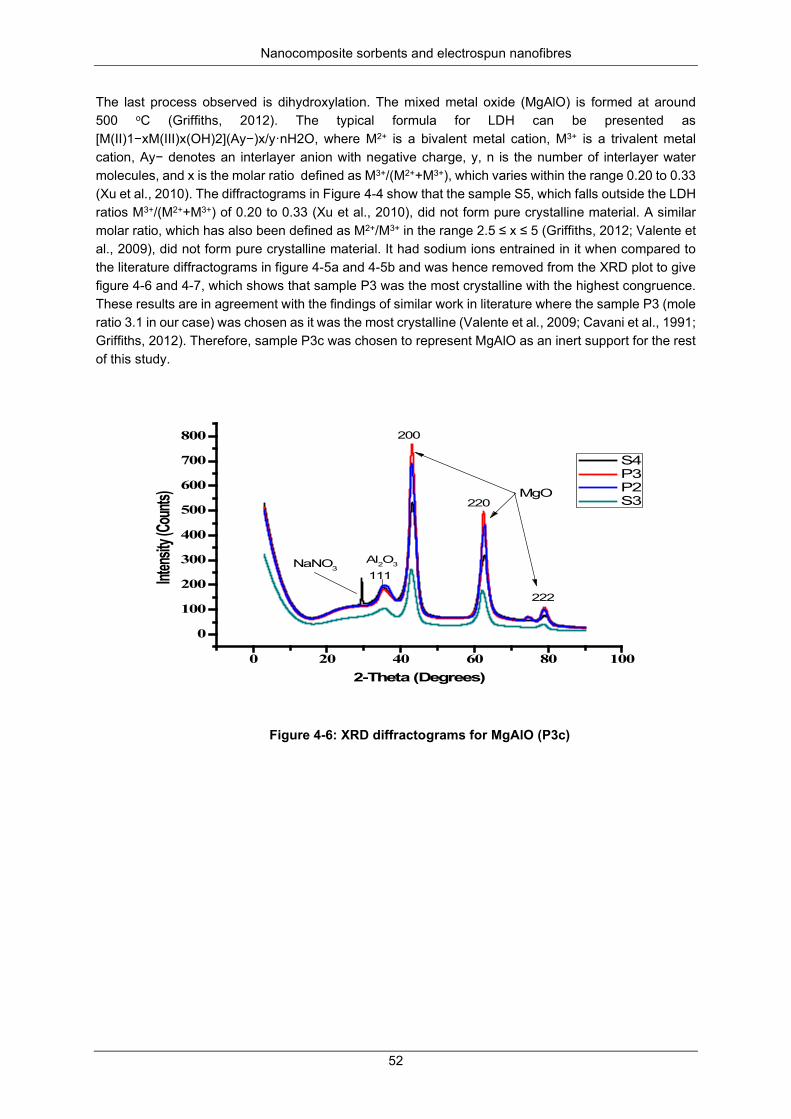
Nanocomposite sorbents and electrospun nanofibres
52
The last process observed is dihydroxylation. The mixed metal oxide (MgAlO) is formed at around 500 oC (Griffiths, 2012). The typical formula for LDH can be presented as [M(II)1−xM(III)x(OH)2](Ay−)x/y·nH2O, where M2+ is a bivalent metal cation, M3+ is a trivalent metal cation, Ay− denotes an interlayer anion with negative charge, y, n is the number of interlayer water molecules, and x is the molar ratio defined as M3+/(M2++M3+), which varies within the range 0.20 to 0.33 (Xu et al., 2010). The diffractograms in Figure 4-4 show that the sample S5, which falls outside the LDH ratios M3+/(M2++M3+) of 0.20 to 0.33 (Xu et al., 2010), did not form pure crystalline material. A similar molar ratio, which has also been defined as M2+/M3+ in the range 2.5 ≤ x ≤ 5 (Griffiths, 2012; Valente et al., 2009), did not form pure crystalline material. It had sodium ions entrained in it when compared to the literature diffractograms in figure 4-5a and 4-5b and was hence removed from the XRD plot to give figure 4-6 and 4-7, which shows that sample P3 was the most crystalline with the highest congruence. These results are in agreement with the findings of similar work in literature where the sample P3 (mole ratio 3.1 in our case) was chosen as it was the most crystalline (Valente et al., 2009; Cavani et al., 1991; Griffiths, 2012). Therefore, sample P3c was chosen to represent MgAlO as an inert support for the rest of this study.
0 20 40 60 80 100
0
100
200
300
400
500
600
700
800
Intens
ity (Co
unts)
2-Theta (Degrees)
S4 P3 P2 S3
222
200
220
111
MgO
NaNO3Al2O3
Figure 4-6: XRD diffractograms for MgAlO (P3c)
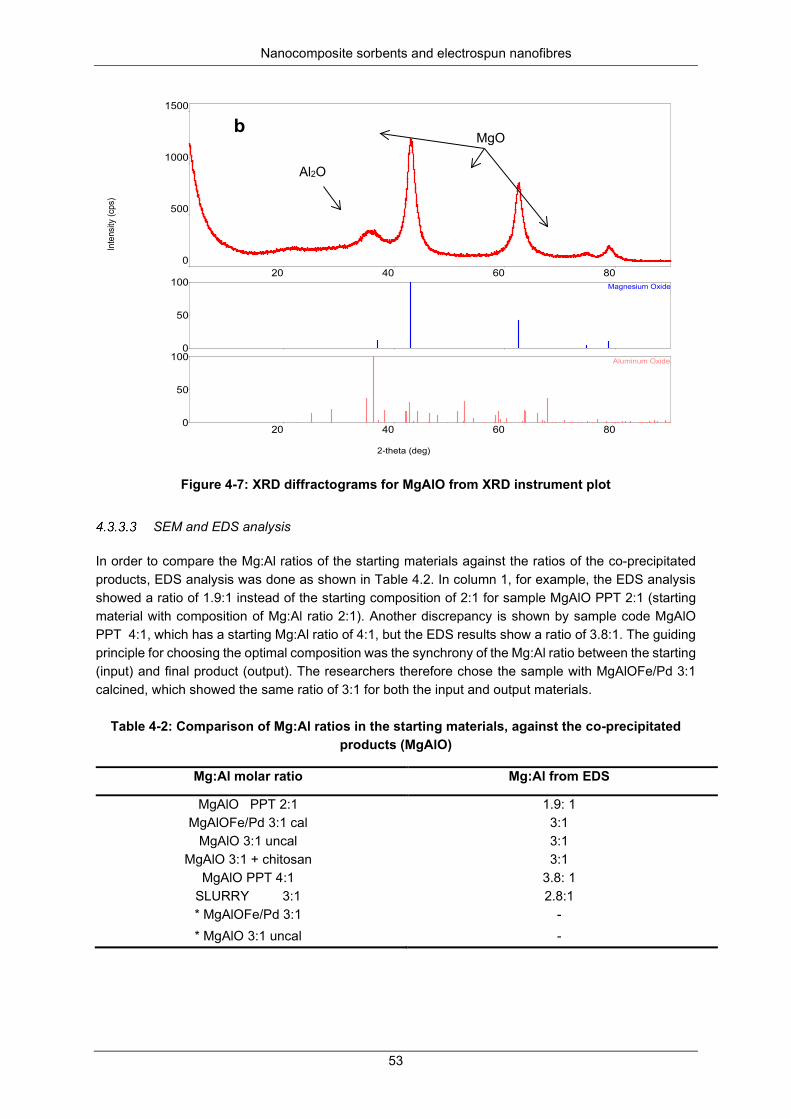
Nanocomposite sorbents and electrospun nanofibres
53
Figure 4-7: XRD diffractograms for MgAlO from XRD instrument plot
SEM and EDS analysis
In order to compare the Mg:Al ratios of the starting materials against the ratios of the co-precipitated products, EDS analysis was done as shown in Table 4.2. In column 1, for example, the EDS analysis showed a ratio of 1.9:1 instead of the starting composition of 2:1 for sample MgAlO PPT 2:1 (starting material with composition of Mg:Al ratio 2:1). Another discrepancy is shown by sample code MgAlO PPT 4:1, which has a starting Mg:Al ratio of 4:1, but the EDS results show a ratio of 3.8:1. The guiding principle for choosing the optimal composition was the synchrony of the Mg:Al ratio between the starting (input) and final product (output). The researchers therefore chose the sample with MgAlOFe/Pd 3:1 calcined, which showed the same ratio of 3:1 for both the input and output materials.
Table 4-2: Comparison of Mg:Al ratios in the starting materials, against the co-precipitated
products (MgAlO)
20 40 60 80 0
500
1000
1500
0
50
100 Magnesium Oxide
20 40 60 80 0
50
100 Aluminum Oxide
2-theta (deg)
Inte
nsity
(cps
)
Mg:Al molar ratio Mg:Al from EDS
MgAlO PPT 2:1 1.9: 1 MgAlOFe/Pd 3:1 cal 3:1
MgAlO 3:1 uncal 3:1 MgAlO 3:1 + chitosan 3:1
MgAlO PPT 4:1 3.8: 1 SLURRY 3:1 2.8:1 * MgAlOFe/Pd 3:1 - * MgAlO 3:1 uncal -
MgO
Al2O
b
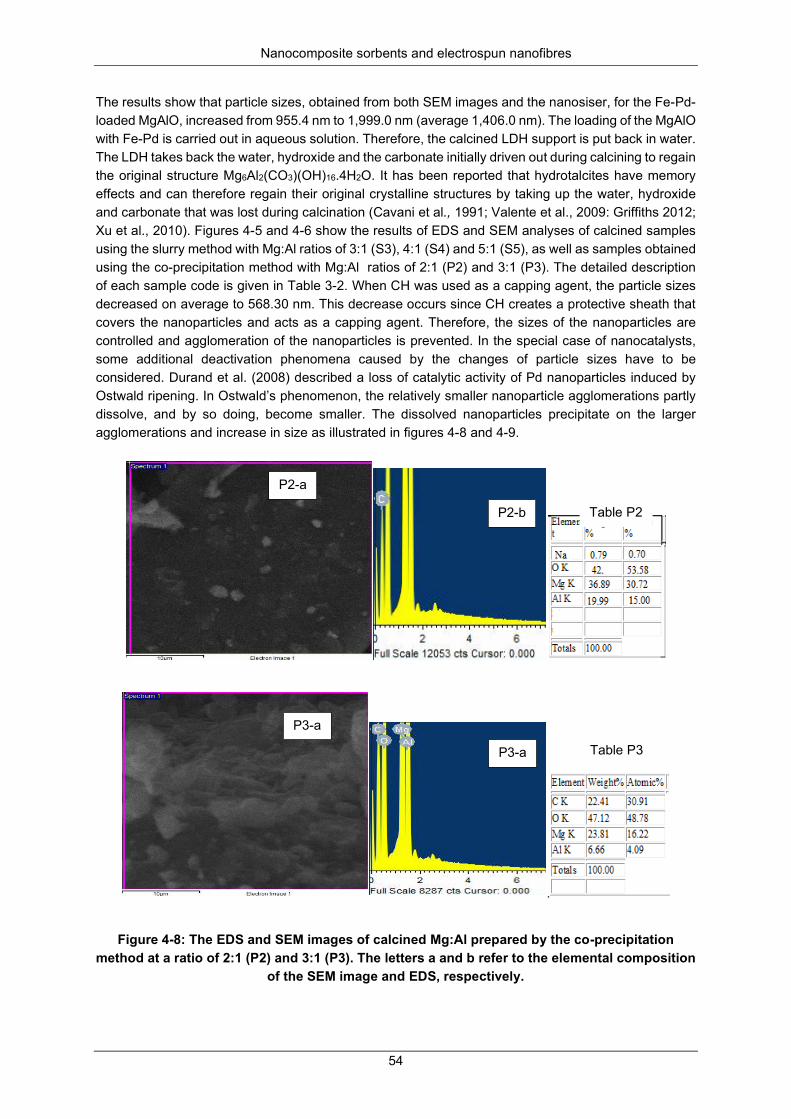
Nanocomposite sorbents and electrospun nanofibres
54
The results show that particle sizes, obtained from both SEM images and the nanosiser, for the Fe-Pd-loaded MgAlO, increased from 955.4 nm to 1,999.0 nm (average 1,406.0 nm). The loading of the MgAlO with Fe-Pd is carried out in aqueous solution. Therefore, the calcined LDH support is put back in water. The LDH takes back the water, hydroxide and the carbonate initially driven out during calcining to regain the original structure Mg6Al2(CO3)(OH)16.4H2O. It has been reported that hydrotalcites have memory effects and can therefore regain their original crystalline structures by taking up the water, hydroxide and carbonate that was lost during calcination (Cavani et al., 1991; Valente et al., 2009: Griffiths 2012; Xu et al., 2010). Figures 4-5 and 4-6 show the results of EDS and SEM analyses of calcined samples using the slurry method with Mg:Al ratios of 3:1 (S3), 4:1 (S4) and 5:1 (S5), as well as samples obtained using the co-precipitation method with Mg:Al ratios of 2:1 (P2) and 3:1 (P3). The detailed description of each sample code is given in Table 3-2. When CH was used as a capping agent, the particle sizes decreased on average to 568.30 nm. This decrease occurs since CH creates a protective sheath that covers the nanoparticles and acts as a capping agent. Therefore, the sizes of the nanoparticles are controlled and agglomeration of the nanoparticles is prevented. In the special case of nanocatalysts, some additional deactivation phenomena caused by the changes of particle sizes have to be considered. Durand et al. (2008) described a loss of catalytic activity of Pd nanoparticles induced by Ostwald ripening. In Ostwald’s phenomenon, the relatively smaller nanoparticle agglomerations partly dissolve, and by so doing, become smaller. The dissolved nanoparticles precipitate on the larger agglomerations and increase in size as illustrated in figures 4-8 and 4-9.
.
Figure 4-8: The EDS and SEM images of calcined Mg:Al prepared by the co-precipitation method at a ratio of 2:1 (P2) and 3:1 (P3). The letters a and b refer to the elemental composition
of the SEM image and EDS, respectively.
P3-a
P2-a
Table P3
Table P2
P2-b
P3-a
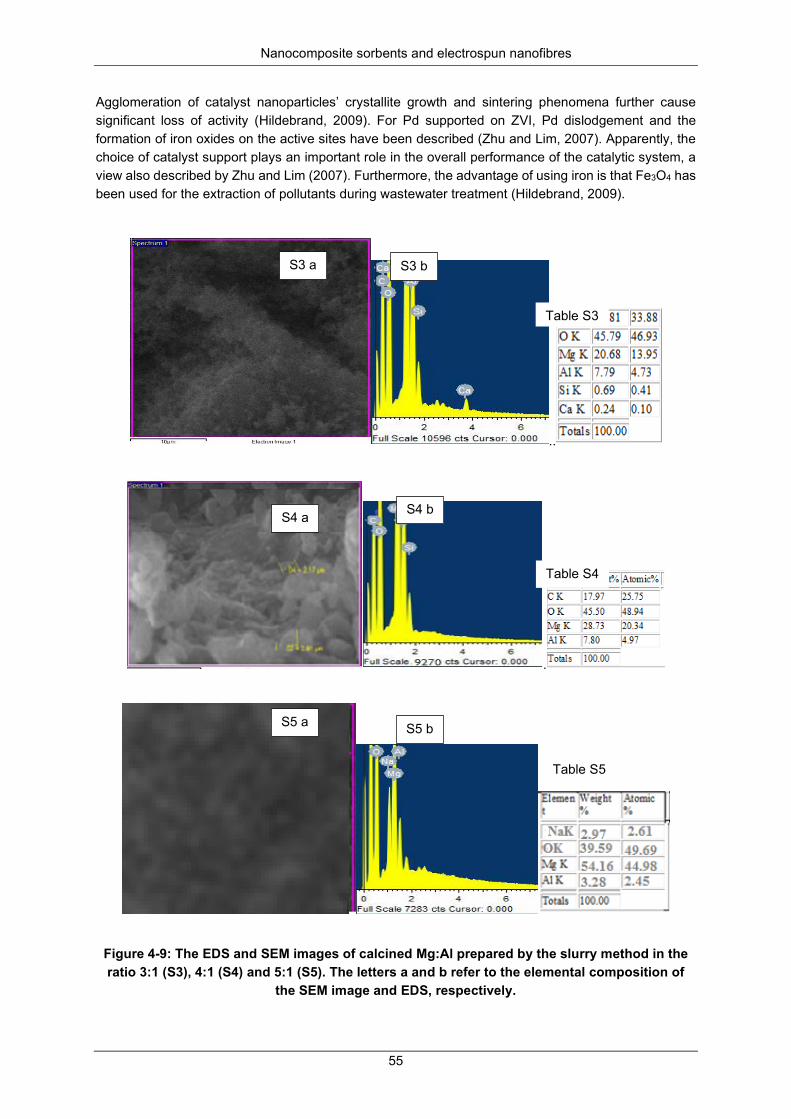
Nanocomposite sorbents and electrospun nanofibres
55
Agglomeration of catalyst nanoparticles’ crystallite growth and sintering phenomena further cause significant loss of activity (Hildebrand, 2009). For Pd supported on ZVI, Pd dislodgement and the formation of iron oxides on the active sites have been described (Zhu and Lim, 2007). Apparently, the choice of catalyst support plays an important role in the overall performance of the catalytic system, a view also described by Zhu and Lim (2007). Furthermore, the advantage of using iron is that Fe3O4 has been used for the extraction of pollutants during wastewater treatment (Hildebrand, 2009).
..
.
Figure 4-9: The EDS and SEM images of calcined Mg:Al prepared by the slurry method in the ratio 3:1 (S3), 4:1 (S4) and 5:1 (S5). The letters a and b refer to the elemental composition of
the SEM image and EDS, respectively.
S3 a
S4 a
S5 a
Table S5
Table S4
Table S3
S4 b
S5 b
S3 b
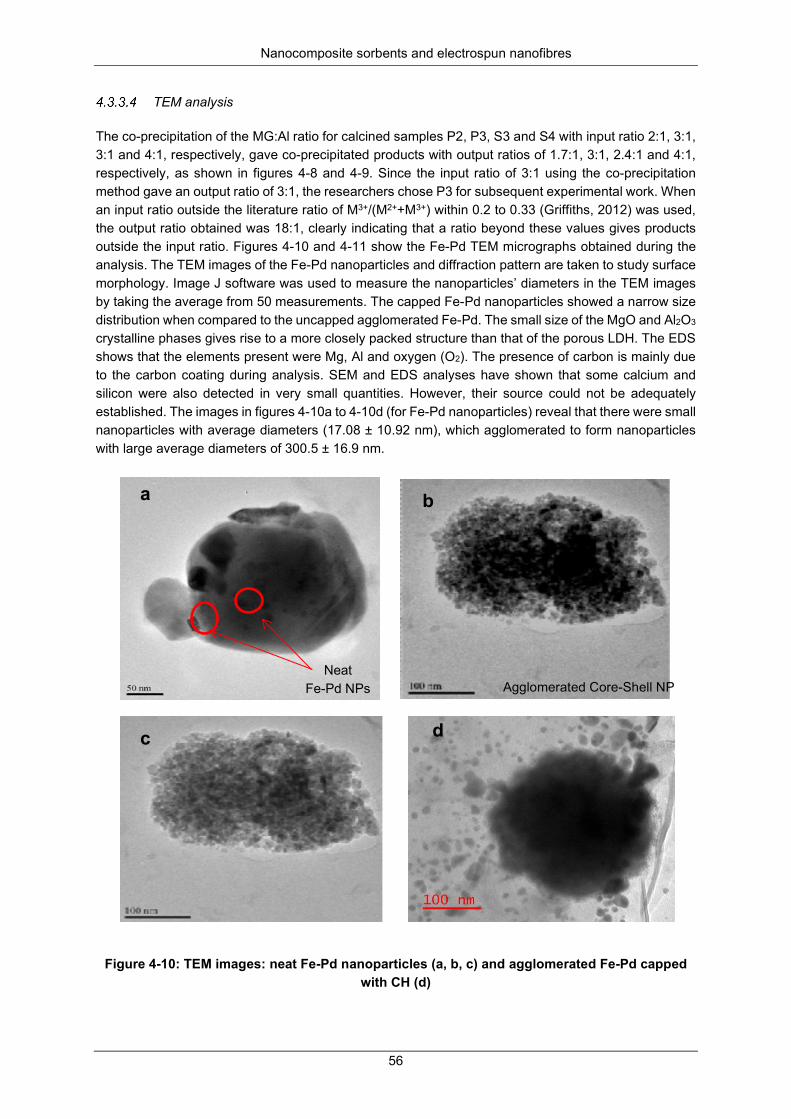
Nanocomposite sorbents and electrospun nanofibres
56
TEM analysis
The co-precipitation of the MG:Al ratio for calcined samples P2, P3, S3 and S4 with input ratio 2:1, 3:1, 3:1 and 4:1, respectively, gave co-precipitated products with output ratios of 1.7:1, 3:1, 2.4:1 and 4:1, respectively, as shown in figures 4-8 and 4-9. Since the input ratio of 3:1 using the co-precipitation method gave an output ratio of 3:1, the researchers chose P3 for subsequent experimental work. When an input ratio outside the literature ratio of M3+/(M2++M3+) within 0.2 to 0.33 (Griffiths, 2012) was used, the output ratio obtained was 18:1, clearly indicating that a ratio beyond these values gives products outside the input ratio. Figures 4-10 and 4-11 show the Fe-Pd TEM micrographs obtained during the analysis. The TEM images of the Fe-Pd nanoparticles and diffraction pattern are taken to study surface morphology. Image J software was used to measure the nanoparticles’ diameters in the TEM images by taking the average from 50 measurements. The capped Fe-Pd nanoparticles showed a narrow size distribution when compared to the uncapped agglomerated Fe-Pd. The small size of the MgO and Al2O3 crystalline phases gives rise to a more closely packed structure than that of the porous LDH. The EDS shows that the elements present were Mg, Al and oxygen (O2). The presence of carbon is mainly due to the carbon coating during analysis. SEM and EDS analyses have shown that some calcium and silicon were also detected in very small quantities. However, their source could not be adequately established. The images in figures 4-10a to 4-10d (for Fe-Pd nanoparticles) reveal that there were small nanoparticles with average diameters (17.08 ± 10.92 nm), which agglomerated to form nanoparticles with large average diameters of 300.5 ± 16.9 nm.
Figure 4-10: TEM images: neat Fe-Pd nanoparticles (a, b, c) and agglomerated Fe-Pd capped
with CH (d)
c
d
Neat Fe-Pd NPs
Agglomerated Core-Shell NP
a
b
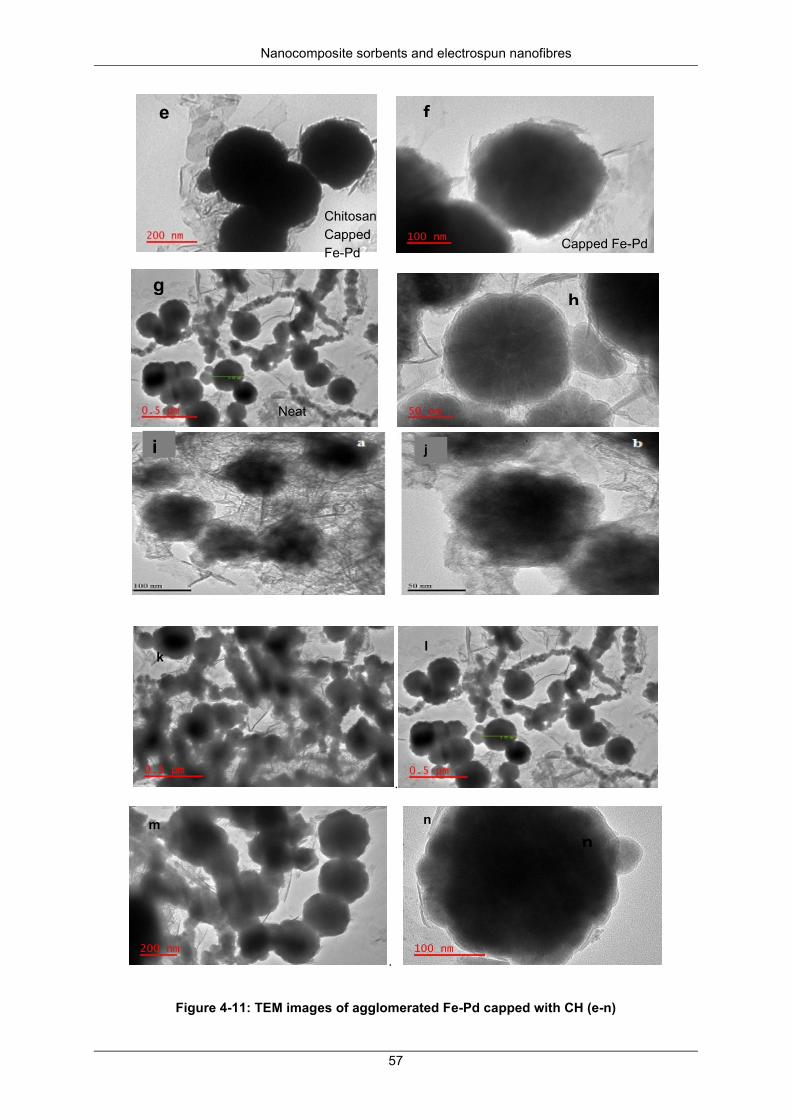
Nanocomposite sorbents and electrospun nanofibres
57
.
.
Figure 4-11: TEM images of agglomerated Fe-Pd capped with CH (e-n)
l k
m
Chitosan Capped Fe-Pd
Capped Fe-Pd
Neat
e
f
j
h
n
i
g
n
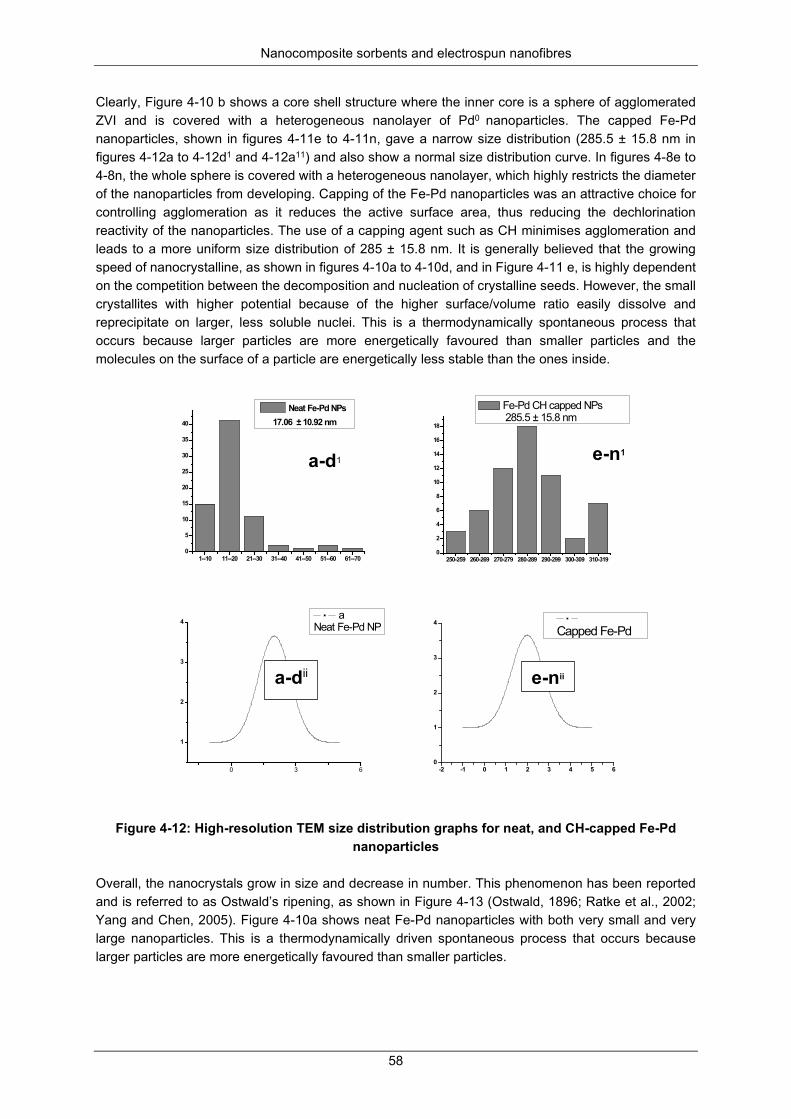
Nanocomposite sorbents and electrospun nanofibres
58
Clearly, Figure 4-10 b shows a core shell structure where the inner core is a sphere of agglomerated ZVI and is covered with a heterogeneous nanolayer of Pd0 nanoparticles. The capped Fe-Pd nanoparticles, shown in figures 4-11e to 4-11n, gave a narrow size distribution (285.5 ± 15.8 nm in figures 4-12a to 4-12d1 and 4-12a11) and also show a normal size distribution curve. In figures 4-8e to 4-8n, the whole sphere is covered with a heterogeneous nanolayer, which highly restricts the diameter of the nanoparticles from developing. Capping of the Fe-Pd nanoparticles was an attractive choice for controlling agglomeration as it reduces the active surface area, thus reducing the dechlorination reactivity of the nanoparticles. The use of a capping agent such as CH minimises agglomeration and leads to a more uniform size distribution of 285 ± 15.8 nm. It is generally believed that the growing speed of nanocrystalline, as shown in figures 4-10a to 4-10d, and in Figure 4-11 e, is highly dependent on the competition between the decomposition and nucleation of crystalline seeds. However, the small crystallites with higher potential because of the higher surface/volume ratio easily dissolve and reprecipitate on larger, less soluble nuclei. This is a thermodynamically spontaneous process that occurs because larger particles are more energetically favoured than smaller particles and the molecules on the surface of a particle are energetically less stable than the ones inside.
Figure 4-12: High-resolution TEM size distribution graphs for neat, and CH-capped Fe-Pd nanoparticles
Overall, the nanocrystals grow in size and decrease in number. This phenomenon has been reported and is referred to as Ostwald’s ripening, as shown in Figure 4-13 (Ostwald, 1896; Ratke et al., 2002; Yang and Chen, 2005). Figure 4-10a shows neat Fe-Pd nanoparticles with both very small and very large nanoparticles. This is a thermodynamically driven spontaneous process that occurs because larger particles are more energetically favoured than smaller particles.
1--10 11--20 21--30 31--40 41--50 51--60 61--700
5
10
15
20
25
30
35
40
Neat Fe-Pd NPs 17.06 ± 10.92 nm
250-259 260-269 270-279 280-289 290-299 300-309 310-3190
2
4
6
8
10
12
14
16
18
Fe-Pd CH capped NPs 285.5 ± 15.8 nm
0 3 6
1
2
3
4 a
Neat Fe-Pd NP
-2 -1 0 1 2 3 4 5 60
1
2
3
4 Capped Fe-Pd
a-d1
e-n1
a-dii e-nii
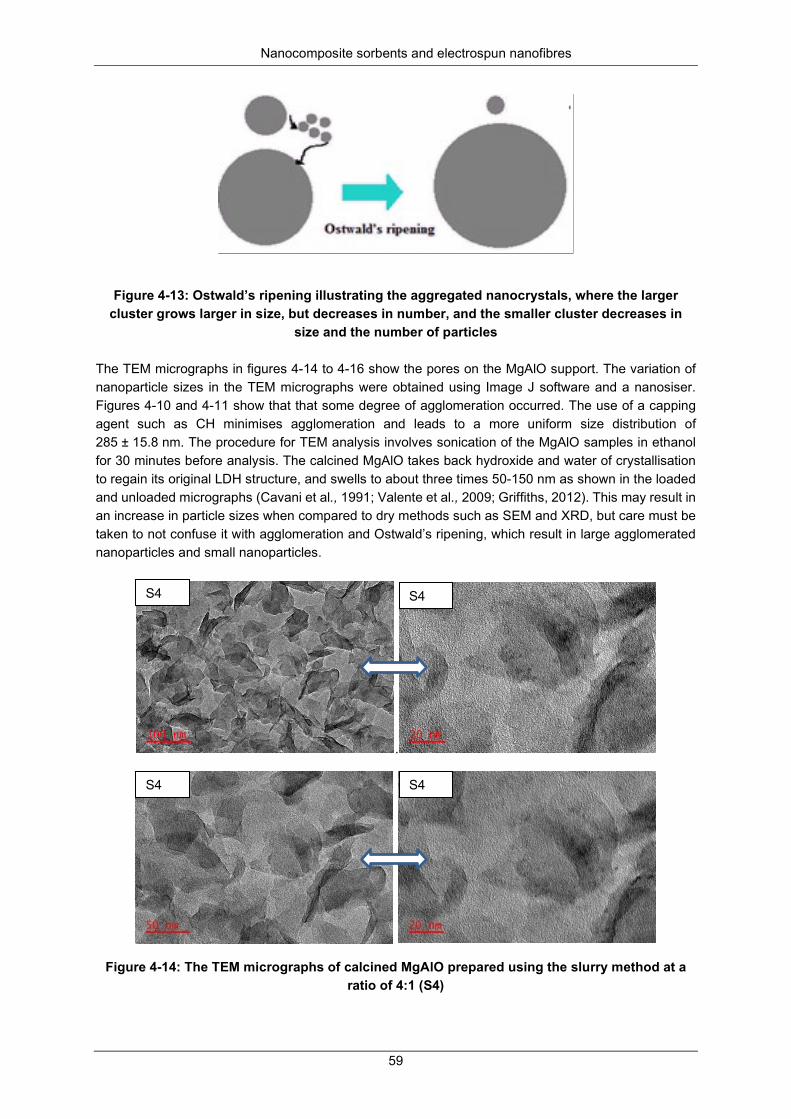
Nanocomposite sorbents and electrospun nanofibres
59
Figure 4-13: Ostwald’s ripening illustrating the aggregated nanocrystals, where the larger
cluster grows larger in size, but decreases in number, and the smaller cluster decreases in size and the number of particles
The TEM micrographs in figures 4-14 to 4-16 show the pores on the MgAlO support. The variation of nanoparticle sizes in the TEM micrographs were obtained using Image J software and a nanosiser. Figures 4-10 and 4-11 show that that some degree of agglomeration occurred. The use of a capping agent such as CH minimises agglomeration and leads to a more uniform size distribution of 285 ± 15.8 nm. The procedure for TEM analysis involves sonication of the MgAlO samples in ethanol for 30 minutes before analysis. The calcined MgAlO takes back hydroxide and water of crystallisation to regain its original LDH structure, and swells to about three times 50-150 nm as shown in the loaded and unloaded micrographs (Cavani et al., 1991; Valente et al., 2009; Griffiths, 2012). This may result in an increase in particle sizes when compared to dry methods such as SEM and XRD, but care must be taken to not confuse it with agglomeration and Ostwald’s ripening, which result in large agglomerated nanoparticles and small nanoparticles.
.
Figure 4-14: The TEM micrographs of calcined MgAlO prepared using the slurry method at a ratio of 4:1 (S4)
S4
S4
S4
S4
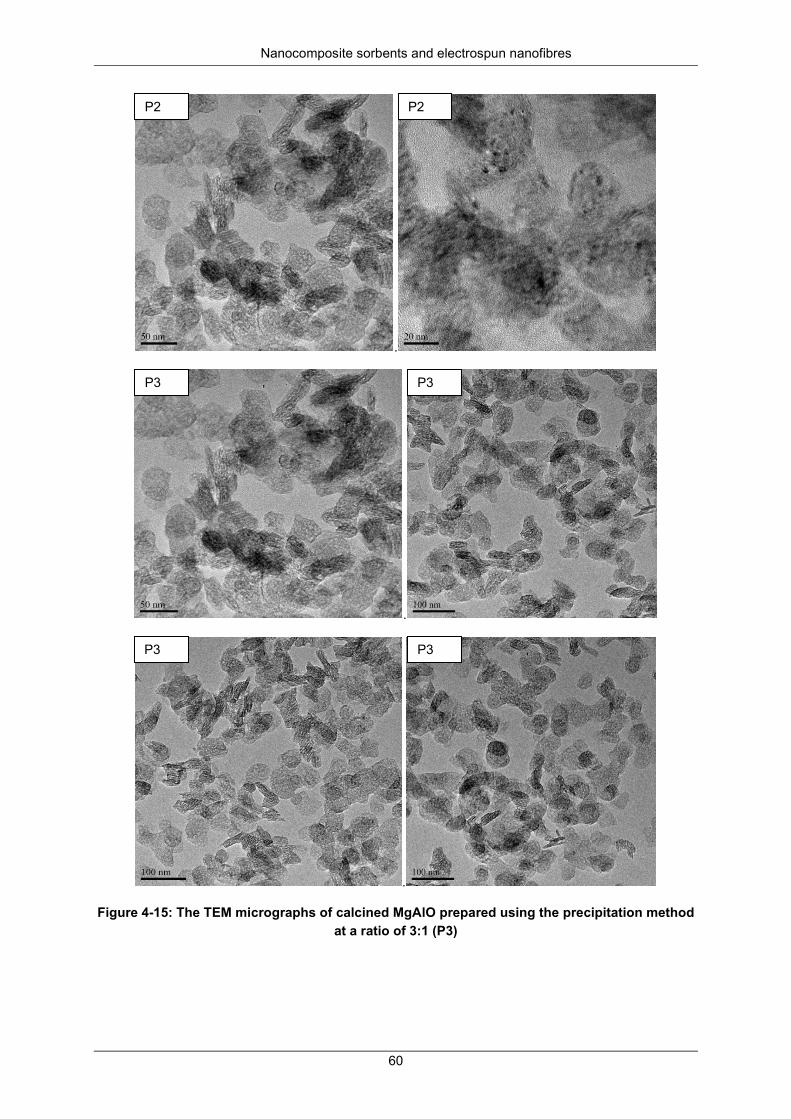
Nanocomposite sorbents and electrospun nanofibres
60
.
.
.
Figure 4-15: The TEM micrographs of calcined MgAlO prepared using the precipitation method at a ratio of 3:1 (P3)
P2
P2
P3
P3
P3
P3
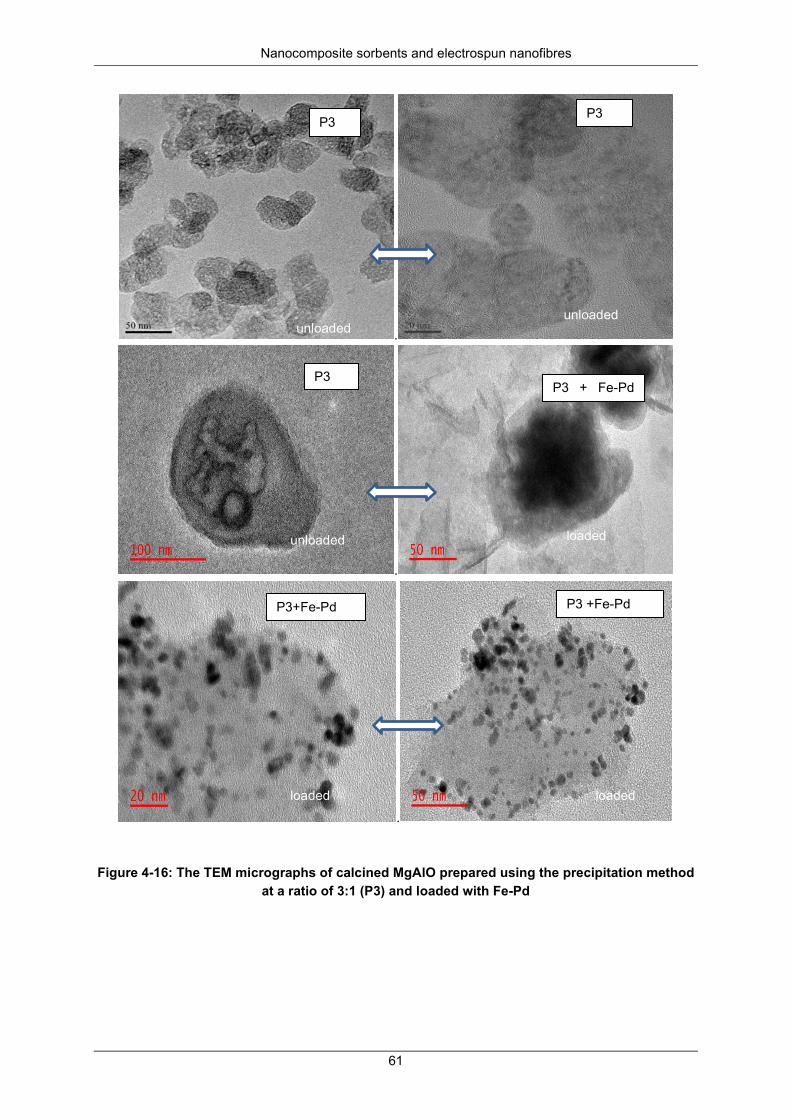
Nanocomposite sorbents and electrospun nanofibres
61
.
.
.
Figure 4-16: The TEM micrographs of calcined MgAlO prepared using the precipitation method
at a ratio of 3:1 (P3) and loaded with Fe-Pd
unloaded
P3
P3
P3
P3 + Fe-Pd
P3 +Fe-Pd
P3+Fe-Pd
unloaded
unloaded loaded
loaded loaded
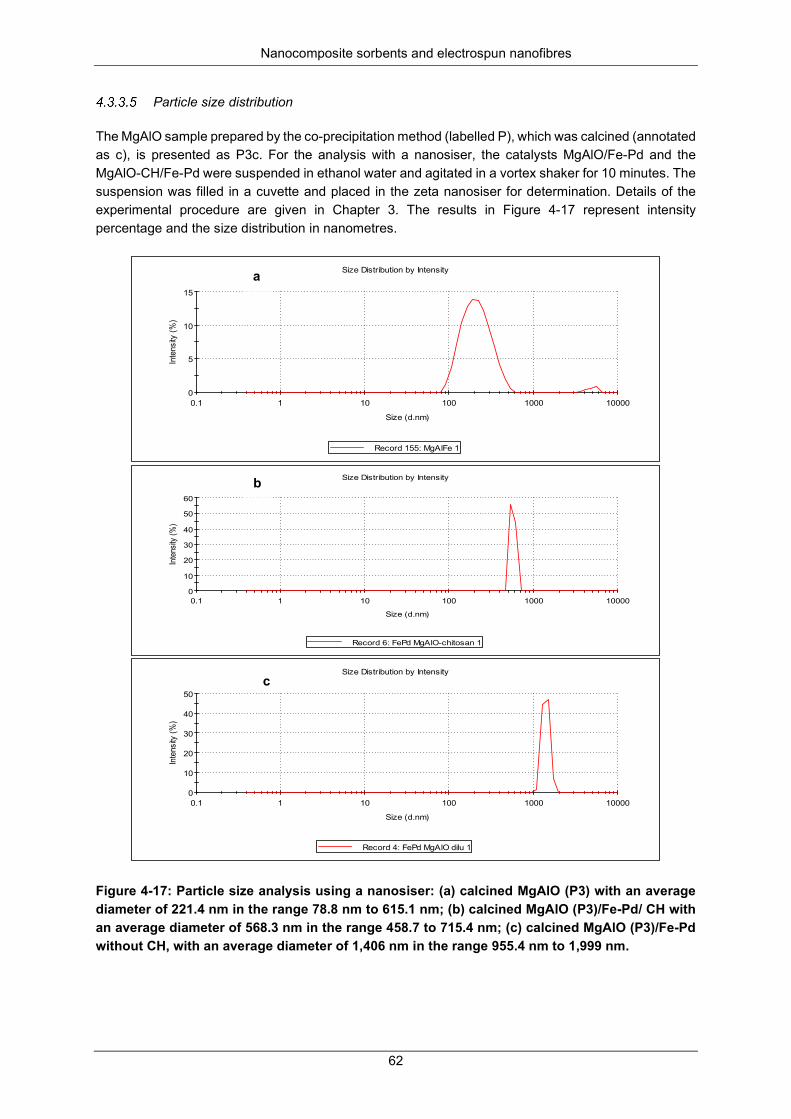
Nanocomposite sorbents and electrospun nanofibres
62
Particle size distribution
The MgAlO sample prepared by the co-precipitation method (labelled P), which was calcined (annotated as c), is presented as P3c. For the analysis with a nanosiser, the catalysts MgAlO/Fe-Pd and the MgAlO-CH/Fe-Pd were suspended in ethanol water and agitated in a vortex shaker for 10 minutes. The suspension was filled in a cuvette and placed in the zeta nanosiser for determination. Details of the experimental procedure are given in Chapter 3. The results in Figure 4-17 represent intensity percentage and the size distribution in nanometres.
Figure 4-17: Particle size analysis using a nanosiser: (a) calcined MgAlO (P3) with an average diameter of 221.4 nm in the range 78.8 nm to 615.1 nm; (b) calcined MgAlO (P3)/Fe-Pd/ CH with an average diameter of 568.3 nm in the range 458.7 to 715.4 nm; (c) calcined MgAlO (P3)/Fe-Pd without CH, with an average diameter of 1,406 nm in the range 955.4 nm to 1,999 nm.
0
5
10
15
0.1 1 10 100 1000 10000
Inte
nsity
(%)
Size (d.nm)
Size Distribution by Intensity
Record 155: MgAlFe 1
0
10
20
30
40
50
60
0.1 1 10 100 1000 10000
Inte
nsity
(%)
Size (d.nm)
Size Distribution by Intensity
Record 6: FePd MgAlO-chitosan 1
0
10
20
30
40
50
0.1 1 10 100 1000 10000
Inte
nsity
(%)
Size (d.nm)
Size Distribution by Intensity
Record 4: FePd MgAlO dilu 1
c
b
a
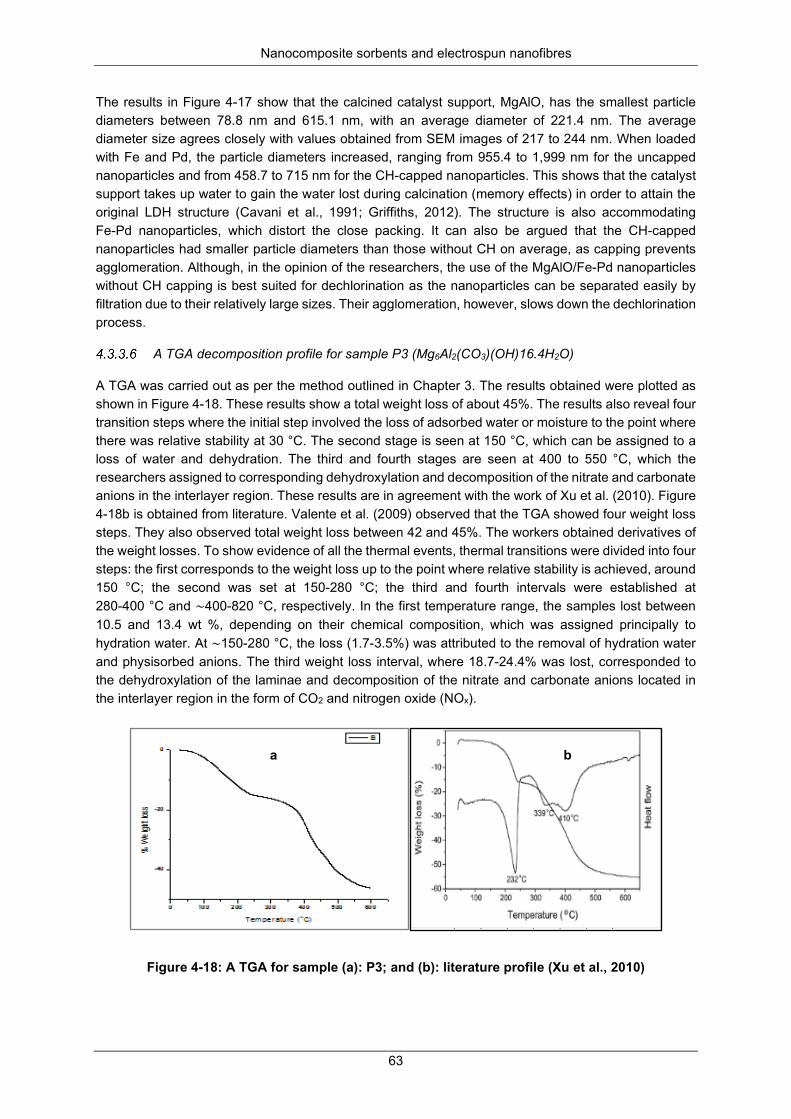
Nanocomposite sorbents and electrospun nanofibres
63
The results in Figure 4-17 show that the calcined catalyst support, MgAlO, has the smallest particle diameters between 78.8 nm and 615.1 nm, with an average diameter of 221.4 nm. The average diameter size agrees closely with values obtained from SEM images of 217 to 244 nm. When loaded with Fe and Pd, the particle diameters increased, ranging from 955.4 to 1,999 nm for the uncapped nanoparticles and from 458.7 to 715 nm for the CH-capped nanoparticles. This shows that the catalyst support takes up water to gain the water lost during calcination (memory effects) in order to attain the original LDH structure (Cavani et al., 1991; Griffiths, 2012). The structure is also accommodating Fe-Pd nanoparticles, which distort the close packing. It can also be argued that the CH-capped nanoparticles had smaller particle diameters than those without CH on average, as capping prevents agglomeration. Although, in the opinion of the researchers, the use of the MgAlO/Fe-Pd nanoparticles without CH capping is best suited for dechlorination as the nanoparticles can be separated easily by filtration due to their relatively large sizes. Their agglomeration, however, slows down the dechlorination process.
A TGA decomposition profile for sample P3 (Mg6Al2(CO3)(OH)16.4H2O)
A TGA was carried out as per the method outlined in Chapter 3. The results obtained were plotted as shown in Figure 4-18. These results show a total weight loss of about 45%. The results also reveal four transition steps where the initial step involved the loss of adsorbed water or moisture to the point where there was relative stability at 30 °C. The second stage is seen at 150 °C, which can be assigned to a loss of water and dehydration. The third and fourth stages are seen at 400 to 550 °C, which the researchers assigned to corresponding dehydroxylation and decomposition of the nitrate and carbonate anions in the interlayer region. These results are in agreement with the work of Xu et al. (2010). Figure 4-18b is obtained from literature. Valente et al. (2009) observed that the TGA showed four weight loss steps. They also observed total weight loss between 42 and 45%. The workers obtained derivatives of the weight losses. To show evidence of all the thermal events, thermal transitions were divided into four steps: the first corresponds to the weight loss up to the point where relative stability is achieved, around 150 °C; the second was set at 150-280 °C; the third and fourth intervals were established at 280-400 °C and ∼400-820 °C, respectively. In the first temperature range, the samples lost between 10.5 and 13.4 wt %, depending on their chemical composition, which was assigned principally to hydration water. At ∼150-280 °C, the loss (1.7-3.5%) was attributed to the removal of hydration water and physisorbed anions. The third weight loss interval, where 18.7-24.4% was lost, corresponded to the dehydroxylation of the laminae and decomposition of the nitrate and carbonate anions located in the interlayer region in the form of CO2 and nitrogen oxide (NOx).
Figure 4-18: A TGA for sample (a): P3; and (b): literature profile (Xu et al., 2010)
a b
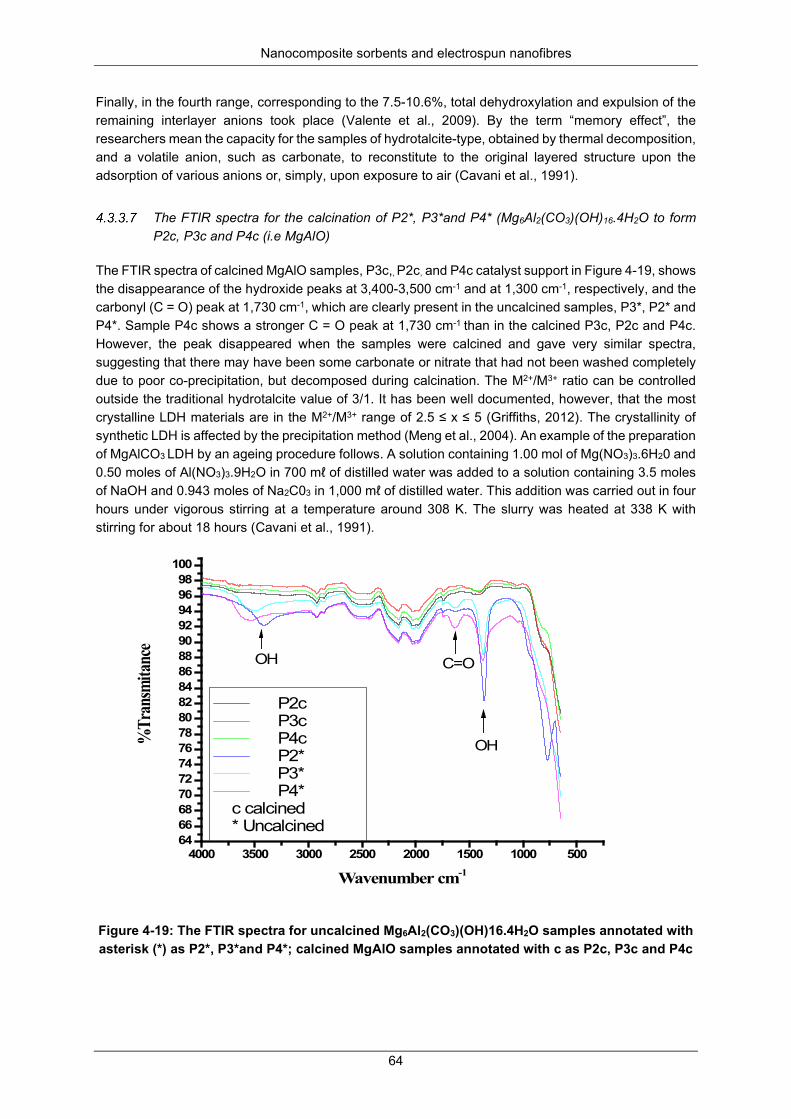
Nanocomposite sorbents and electrospun nanofibres
64
Finally, in the fourth range, corresponding to the 7.5-10.6%, total dehydroxylation and expulsion of the remaining interlayer anions took place (Valente et al., 2009). By the term “memory effect”, the researchers mean the capacity for the samples of hydrotalcite-type, obtained by thermal decomposition, and a volatile anion, such as carbonate, to reconstitute to the original layered structure upon the adsorption of various anions or, simply, upon exposure to air (Cavani et al., 1991).
The FTIR spectra for the calcination of P2*, P3*and P4* (Mg6Al2(CO3)(OH)16.4H2O to form P2c, P3c and P4c (i.e MgAlO)
The FTIR spectra of calcined MgAlO samples, P3c,, P2c, and P4c catalyst support in Figure 4-19, shows the disappearance of the hydroxide peaks at 3,400-3,500 cm-1 and at 1,300 cm-1, respectively, and the carbonyl (C = O) peak at 1,730 cm-1, which are clearly present in the uncalcined samples, P3*, P2* and P4*. Sample P4c shows a stronger C = O peak at 1,730 cm-1 than in the calcined P3c, P2c and P4c. However, the peak disappeared when the samples were calcined and gave very similar spectra, suggesting that there may have been some carbonate or nitrate that had not been washed completely due to poor co-precipitation, but decomposed during calcination. The M2+/M3+ ratio can be controlled outside the traditional hydrotalcite value of 3/1. It has been well documented, however, that the most crystalline LDH materials are in the M2+/M3+ range of 2.5 ≤ x ≤ 5 (Griffiths, 2012). The crystallinity of synthetic LDH is affected by the precipitation method (Meng et al., 2004). An example of the preparation of MgAlCO3 LDH by an ageing procedure follows. A solution containing 1.00 mol of Mg(NO3)3.6H20 and 0.50 moles of Al(NO3)3.9H2O in 700 mℓ of distilled water was added to a solution containing 3.5 moles of NaOH and 0.943 moles of Na2C03 in 1,000 mℓ of distilled water. This addition was carried out in four hours under vigorous stirring at a temperature around 308 K. The slurry was heated at 338 K with stirring for about 18 hours (Cavani et al., 1991).
Figure 4-19: The FTIR spectra for uncalcined Mg6Al2(CO3)(OH)16.4H2O samples annotated with asterisk (*) as P2*, P3*and P4*; calcined MgAlO samples annotated with c as P2c, P3c and P4c
4000 3500 3000 2500 2000 1500 1000 500646668707274767880828486889092949698
100
%Tr
ansm
itanc
e
Wavenumber cm-1
P2c P3c P4c P2* P3* P4*
c calcined * Uncalcined
OH
OH
C=O
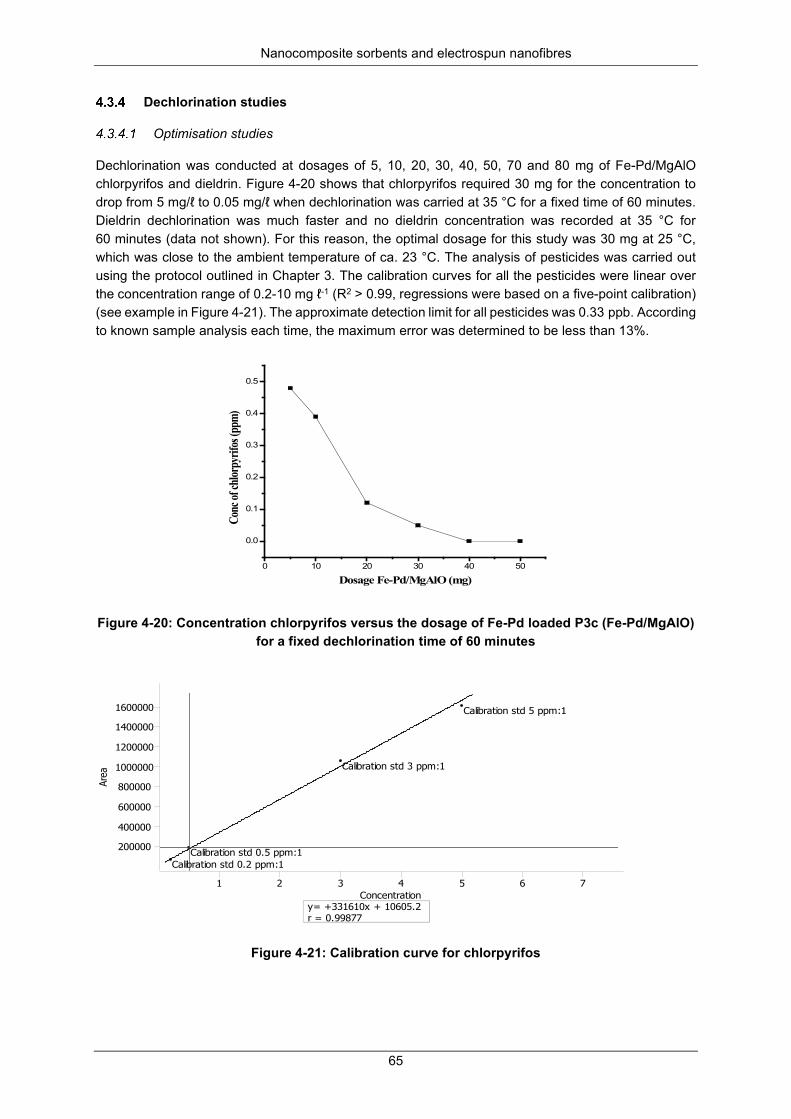
Nanocomposite sorbents and electrospun nanofibres
65
Dechlorination studies
Optimisation studies
Dechlorination was conducted at dosages of 5, 10, 20, 30, 40, 50, 70 and 80 mg of Fe-Pd/MgAlO chlorpyrifos and dieldrin. Figure 4-20 shows that chlorpyrifos required 30 mg for the concentration to drop from 5 mg/ℓ to 0.05 mg/ℓ when dechlorination was carried at 35 °C for a fixed time of 60 minutes. Dieldrin dechlorination was much faster and no dieldrin concentration was recorded at 35 °C for 60 minutes (data not shown). For this reason, the optimal dosage for this study was 30 mg at 25 °C, which was close to the ambient temperature of ca. 23 °C. The analysis of pesticides was carried out using the protocol outlined in Chapter 3. The calibration curves for all the pesticides were linear over the concentration range of 0.2-10 mg ℓ-1 (R2 > 0.99, regressions were based on a five-point calibration) (see example in Figure 4-21). The approximate detection limit for all pesticides was 0.33 ppb. According to known sample analysis each time, the maximum error was determined to be less than 13%.
Figure 4-20: Concentration chlorpyrifos versus the dosage of Fe-Pd loaded P3c (Fe-Pd/MgAlO) for a fixed dechlorination time of 60 minutes
Figure 4-21: Calibration curve for chlorpyrifos
1 2 3 4 5 6 7
200000
400000
600000
800000
1000000
1200000
1400000
1600000
Concentration
Area
Calibration std 0.2 ppm:1Calibration std 0.5 ppm:1
Calibration std 3 ppm:1
Calibration std 5 ppm:1
y= +331610x + 10605.2r = 0.99877
0 10 20 30 40 50
0.0
0.1
0.2
0.3
0.4
0.5
Conc
of ch
lorpy
rifos
(ppm
)
Dosage Fe-Pd/MgAlO (mg)
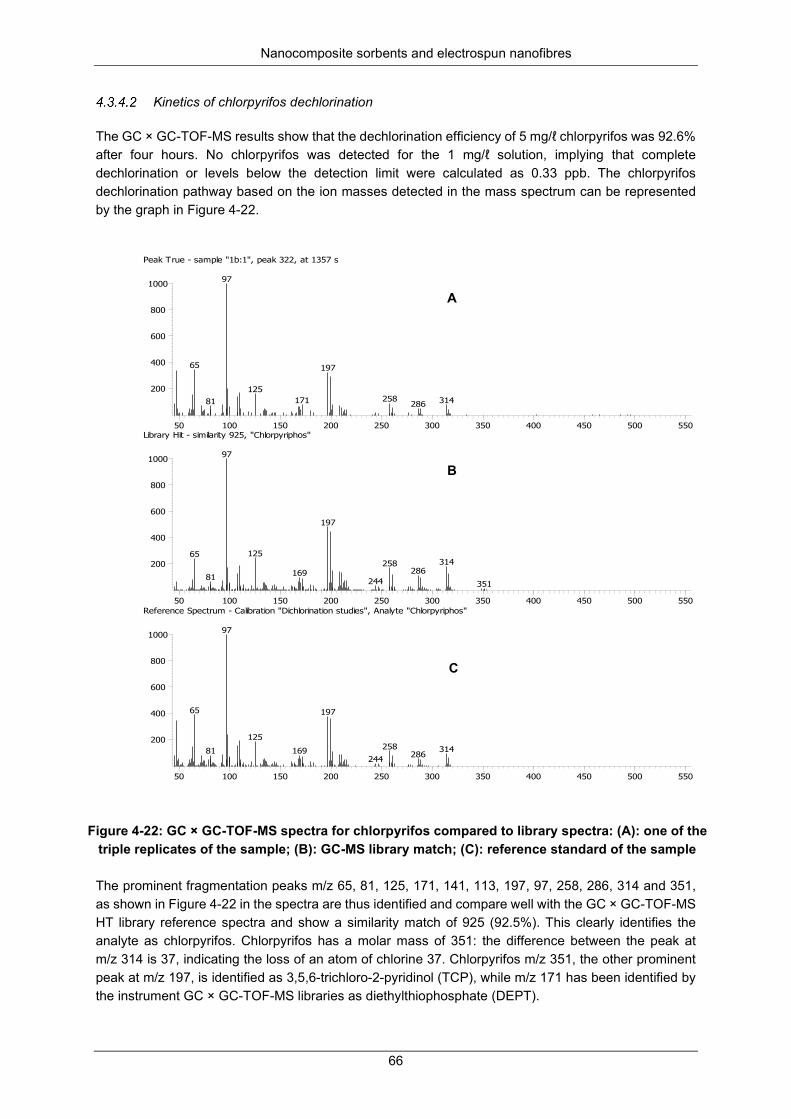
Nanocomposite sorbents and electrospun nanofibres
66
Kinetics of chlorpyrifos dechlorination
The GC × GC-TOF-MS results show that the dechlorination efficiency of 5 mg/ℓ chlorpyrifos was 92.6% after four hours. No chlorpyrifos was detected for the 1 mg/ℓ solution, implying that complete dechlorination or levels below the detection limit were calculated as 0.33 ppb. The chlorpyrifos dechlorination pathway based on the ion masses detected in the mass spectrum can be represented by the graph in Figure 4-22.
Figure 4-22: GC × GC-TOF-MS spectra for chlorpyrifos compared to library spectra: (A): one of the triple replicates of the sample; (B): GC-MS library match; (C): reference standard of the sample The prominent fragmentation peaks m/z 65, 81, 125, 171, 141, 113, 197, 97, 258, 286, 314 and 351, as shown in Figure 4-22 in the spectra are thus identified and compare well with the GC × GC-TOF-MS HT library reference spectra and show a similarity match of 925 (92.5%). This clearly identifies the analyte as chlorpyrifos. Chlorpyrifos has a molar mass of 351: the difference between the peak at m/z 314 is 37, indicating the loss of an atom of chlorine 37. Chlorpyrifos m/z 351, the other prominent peak at m/z 197, is identified as 3,5,6-trichloro-2-pyridinol (TCP), while m/z 171 has been identified by the instrument GC × GC-TOF-MS libraries as diethylthiophosphate (DEPT).
50 100 150 200 250 300 350 400 450 500 550
200
400
600
800
1000 97
65 197
125 258 314 171 81 286
Peak True - sample "1b:1", peak 322, at 1357 s
50 100 150 200 250 300 350 400 450 500 550
200
400
600
800
1000 97
197
125 65 314 258
286 169 81 244 351
Library Hit - similarity 925, "Chlorpyriphos"
50 100 150 200 250 300 350 400 450 500 550
200
400
600
800
1000 97
65 197
125 258 314 169 81 286 244
Reference Spectrum - Calibration "Dichlorination studies", Analyte "Chlorpyriphos"
A
B
C
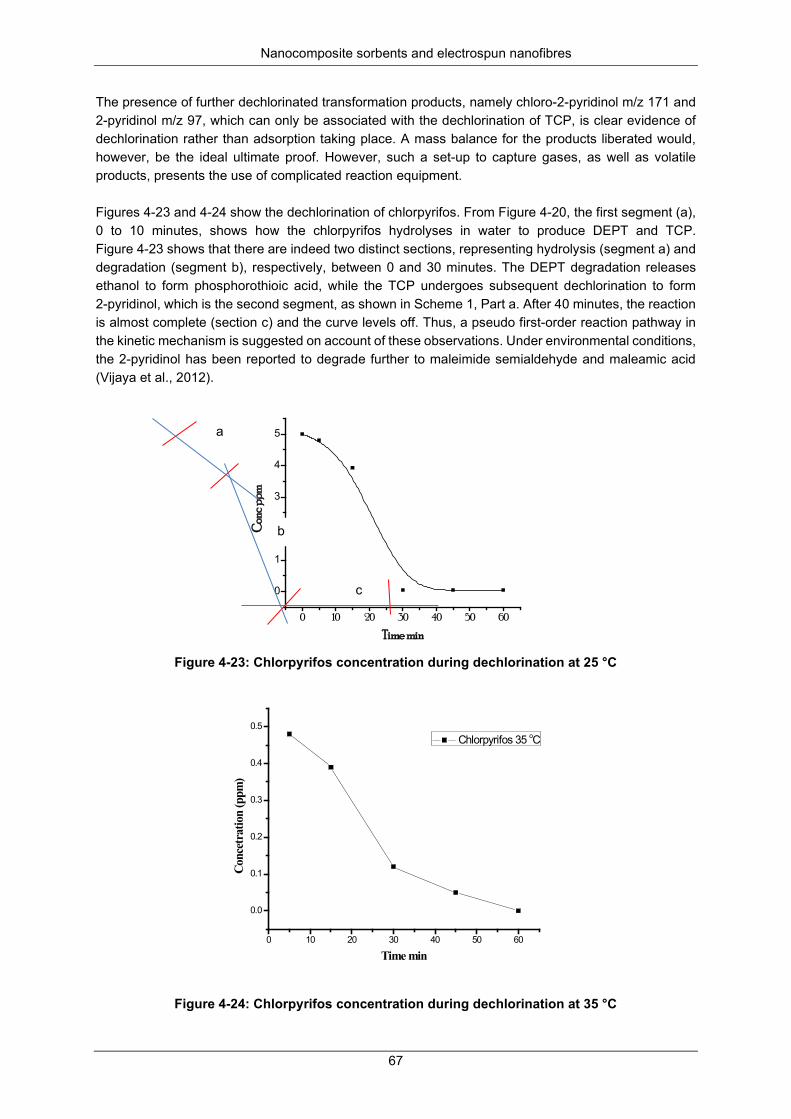
Nanocomposite sorbents and electrospun nanofibres
67
The presence of further dechlorinated transformation products, namely chloro-2-pyridinol m/z 171 and 2-pyridinol m/z 97, which can only be associated with the dechlorination of TCP, is clear evidence of dechlorination rather than adsorption taking place. A mass balance for the products liberated would, however, be the ideal ultimate proof. However, such a set-up to capture gases, as well as volatile products, presents the use of complicated reaction equipment. Figures 4-23 and 4-24 show the dechlorination of chlorpyrifos. From Figure 4-20, the first segment (a), 0 to 10 minutes, shows how the chlorpyrifos hydrolyses in water to produce DEPT and TCP. Figure 4-23 shows that there are indeed two distinct sections, representing hydrolysis (segment a) and degradation (segment b), respectively, between 0 and 30 minutes. The DEPT degradation releases ethanol to form phosphorothioic acid, while the TCP undergoes subsequent dechlorination to form 2-pyridinol, which is the second segment, as shown in Scheme 1, Part a. After 40 minutes, the reaction is almost complete (section c) and the curve levels off. Thus, a pseudo first-order reaction pathway in the kinetic mechanism is suggested on account of these observations. Under environmental conditions, the 2-pyridinol has been reported to degrade further to maleimide semialdehyde and maleamic acid (Vijaya et al., 2012).
Figure 4-23: Chlorpyrifos concentration during dechlorination at 25 °C
Figure 4-24: Chlorpyrifos concentration during dechlorination at 35 °C
0 10 20 30 40 50 60
0
1
2
3
4
5
Con
c ppm
Time min
0 10 20 30 40 50 60
0.0
0.1
0.2
0.3
0.4
0.5
Conc
etra
tion
(ppm
)
Time min
Chlorpyrifos 35 oC
a
b
c
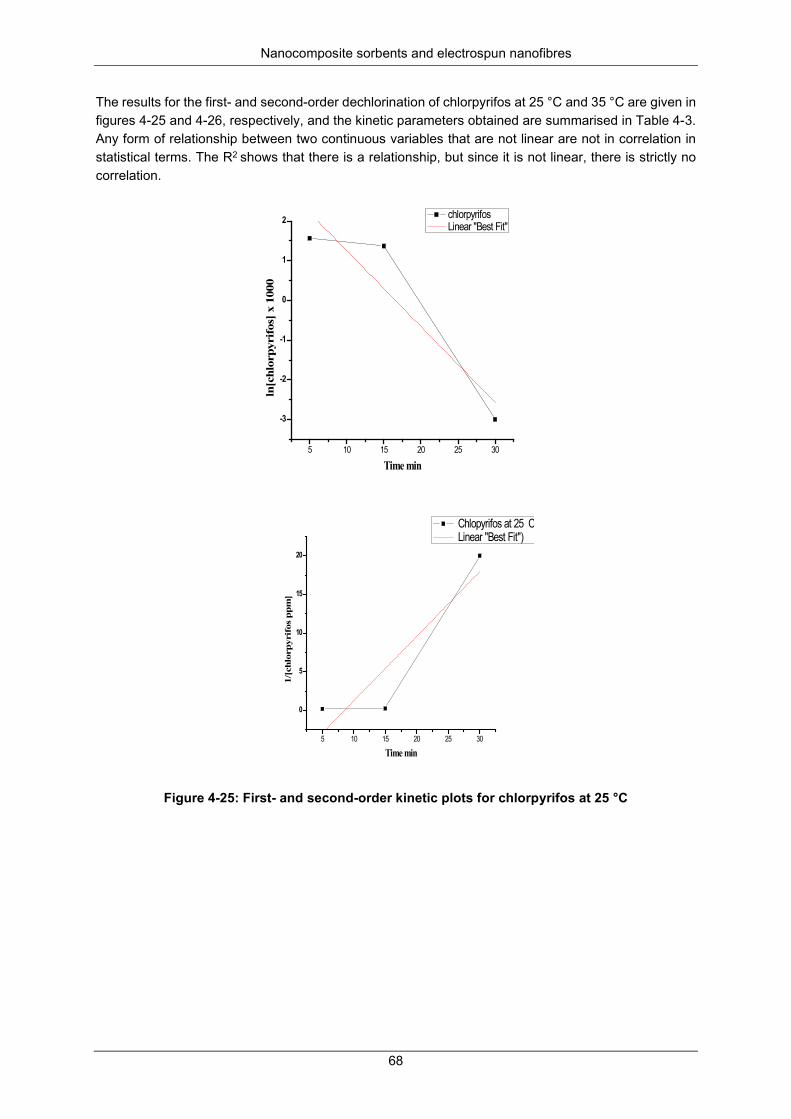
Nanocomposite sorbents and electrospun nanofibres
68
The results for the first- and second-order dechlorination of chlorpyrifos at 25 °C and 35 °C are given in figures 4-25 and 4-26, respectively, and the kinetic parameters obtained are summarised in Table 4-3. Any form of relationship between two continuous variables that are not linear are not in correlation in statistical terms. The R2 shows that there is a relationship, but since it is not linear, there is strictly no correlation.
Figure 4-25: First- and second-order kinetic plots for chlorpyrifos at 25 °C
5 10 15 20 25 30
-3
-2
-1
0
1
2
ln[c
hlor
pyri
fos]
x 1
000
Time min
chlorpyrifos Linear "Best Fit"
5 10 15 20 25 30
0
5
10
15
20
1/[c
hlor
pyri
fos
ppm
]
Time min
Chlopyrifos at 25 C Linear "Best Fit")
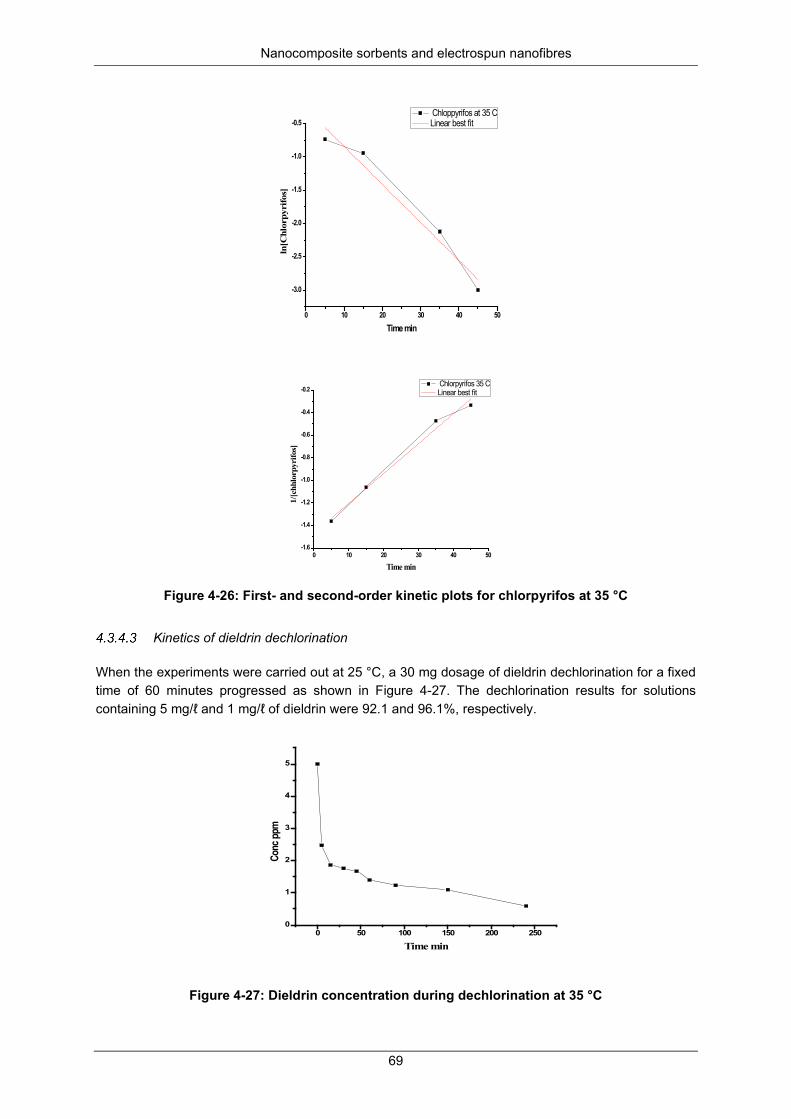
Nanocomposite sorbents and electrospun nanofibres
69
Figure 4-26: First- and second-order kinetic plots for chlorpyrifos at 35 °C
Kinetics of dieldrin dechlorination
When the experiments were carried out at 25 °C, a 30 mg dosage of dieldrin dechlorination for a fixed time of 60 minutes progressed as shown in Figure 4-27. The dechlorination results for solutions containing 5 mg/ℓ and 1 mg/ℓ of dieldrin were 92.1 and 96.1%, respectively.
Figure 4-27: Dieldrin concentration during dechlorination at 35 °C
0 10 20 30 40 50
-3.0
-2.5
-2.0
-1.5
-1.0
-0.5
ln[C
hlor
pyri
fos]
Time min
Chloppyrifos at 35 C Linear best fit
0 10 20 30 40 50-1.6
-1.4
-1.2
-1.0
-0.8
-0.6
-0.4
-0.2
1/[c
hhlo
rpyr
ifos]
Time min
Chlorpyrifos 35 C Linear best fit
0 50 100 150 200 2500
1
2
3
4
5
Conc
ppm
Time min
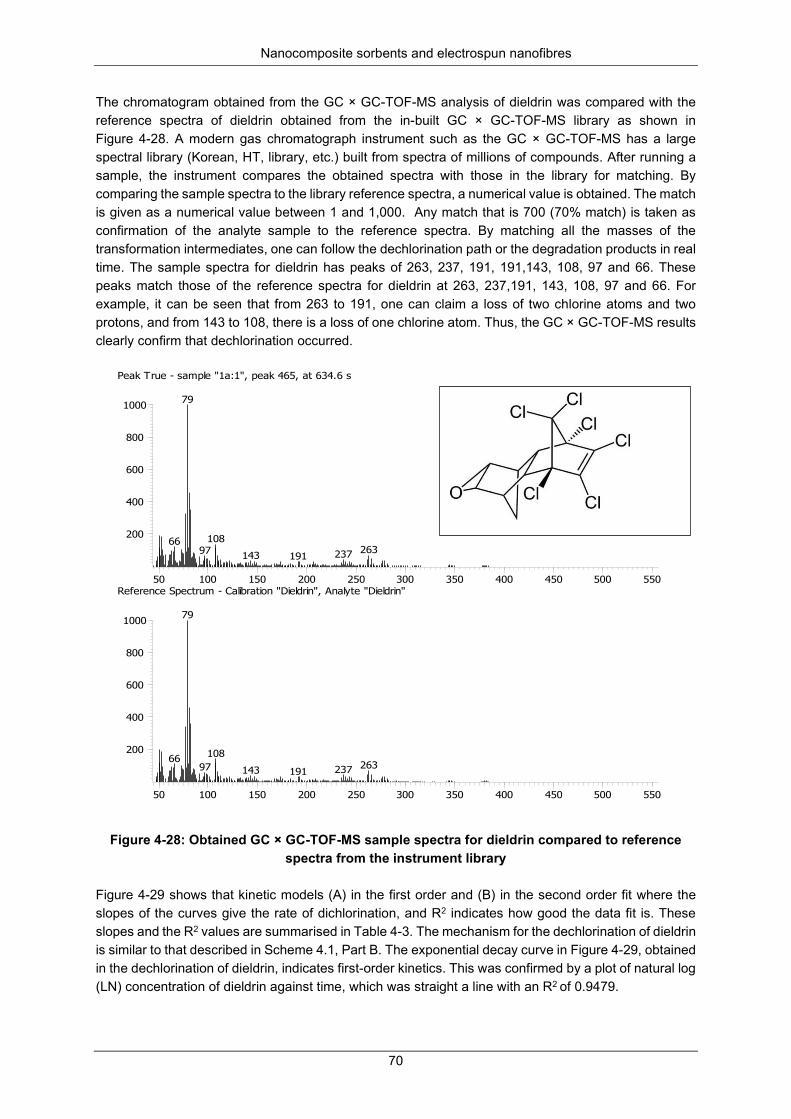
Nanocomposite sorbents and electrospun nanofibres
70
The chromatogram obtained from the GC × GC-TOF-MS analysis of dieldrin was compared with the reference spectra of dieldrin obtained from the in-built GC × GC-TOF-MS library as shown in Figure 4-28. A modern gas chromatograph instrument such as the GC × GC-TOF-MS has a large spectral library (Korean, HT, library, etc.) built from spectra of millions of compounds. After running a sample, the instrument compares the obtained spectra with those in the library for matching. By comparing the sample spectra to the library reference spectra, a numerical value is obtained. The match is given as a numerical value between 1 and 1,000. Any match that is 700 (70% match) is taken as confirmation of the analyte sample to the reference spectra. By matching all the masses of the transformation intermediates, one can follow the dechlorination path or the degradation products in real time. The sample spectra for dieldrin has peaks of 263, 237, 191, 191,143, 108, 97 and 66. These peaks match those of the reference spectra for dieldrin at 263, 237,191, 143, 108, 97 and 66. For example, it can be seen that from 263 to 191, one can claim a loss of two chlorine atoms and two protons, and from 143 to 108, there is a loss of one chlorine atom. Thus, the GC × GC-TOF-MS results clearly confirm that dechlorination occurred.
Figure 4-28: Obtained GC × GC-TOF-MS sample spectra for dieldrin compared to reference spectra from the instrument library
Figure 4-29 shows that kinetic models (A) in the first order and (B) in the second order fit where the slopes of the curves give the rate of dichlorination, and R2 indicates how good the data fit is. These slopes and the R2 values are summarised in Table 4-3. The mechanism for the dechlorination of dieldrin is similar to that described in Scheme 4.1, Part B. The exponential decay curve in Figure 4-29, obtained in the dechlorination of dieldrin, indicates first-order kinetics. This was confirmed by a plot of natural log (LN) concentration of dieldrin against time, which was straight a line with an R2 of 0.9479.
50 100 150 200 250 300 350 400 450 500 550
200
400
600
800
1000 79
108 66 263 97 237 143 191
Peak True - sample "1a:1", peak 465, at 634.6 s
50 100 150 200 250 300 350 400 450 500 550
200
400
600
800
1000 79
108 66 263 97 237 143 191
Reference Spectrum - Calibration "Dieldrin", Analyte "Dieldrin"
b l 9 " ld "
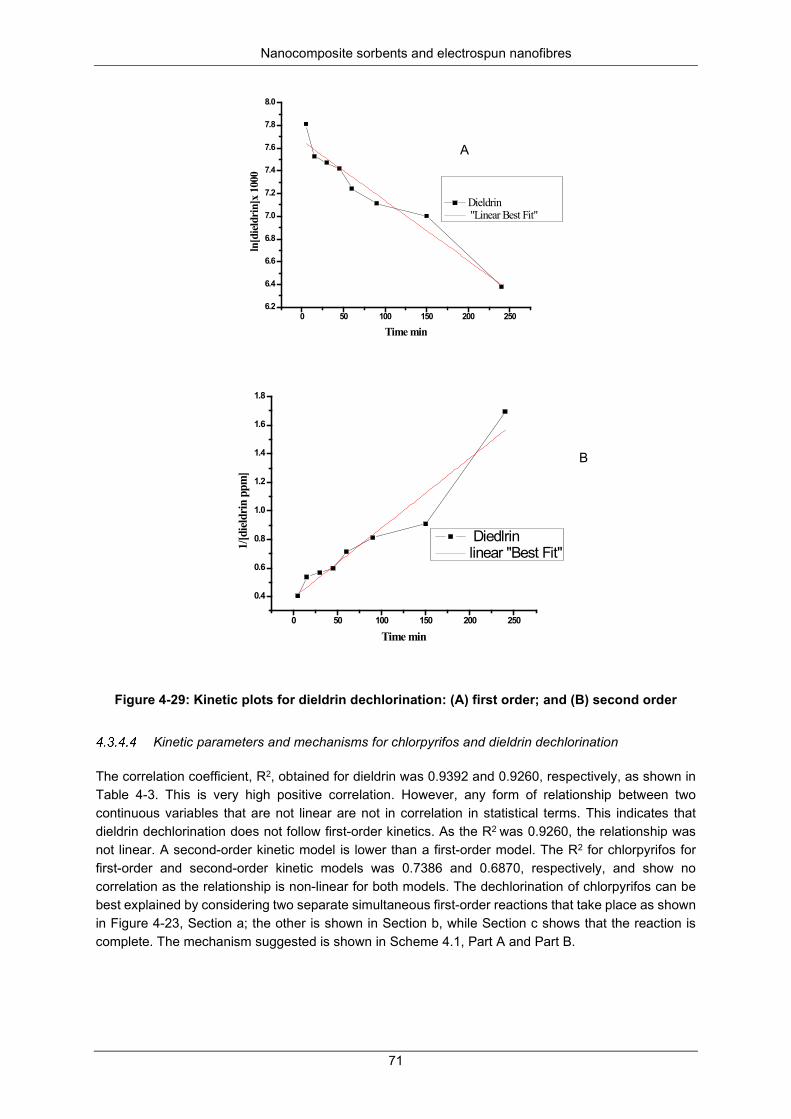
Nanocomposite sorbents and electrospun nanofibres
71
Figure 4-29: Kinetic plots for dieldrin dechlorination: (A) first order; and (B) second order
Kinetic parameters and mechanisms for chlorpyrifos and dieldrin dechlorination
The correlation coefficient, R2, obtained for dieldrin was 0.9392 and 0.9260, respectively, as shown in Table 4-3. This is very high positive correlation. However, any form of relationship between two continuous variables that are not linear are not in correlation in statistical terms. This indicates that dieldrin dechlorination does not follow first-order kinetics. As the R2 was 0.9260, the relationship was not linear. A second-order kinetic model is lower than a first-order model. The R2 for chlorpyrifos for first-order and second-order kinetic models was 0.7386 and 0.6870, respectively, and show no correlation as the relationship is non-linear for both models. The dechlorination of chlorpyrifos can be best explained by considering two separate simultaneous first-order reactions that take place as shown in Figure 4-23, Section a; the other is shown in Section b, while Section c shows that the reaction is complete. The mechanism suggested is shown in Scheme 4.1, Part A and Part B.
0 50 100 150 200 2506.2
6.4
6.6
6.8
7.0
7.2
7.4
7.6
7.8
8.0
ln[d
ieldr
in]x
100
0
Time min
Dieldrin "Linear Best Fit"
0 50 100 150 200 250
0.4
0.6
0.8
1.0
1.2
1.4
1.6
1.8
1/[d
ieldr
in p
pm]
Time min
Diedlrin linear "Best Fit"
A
B
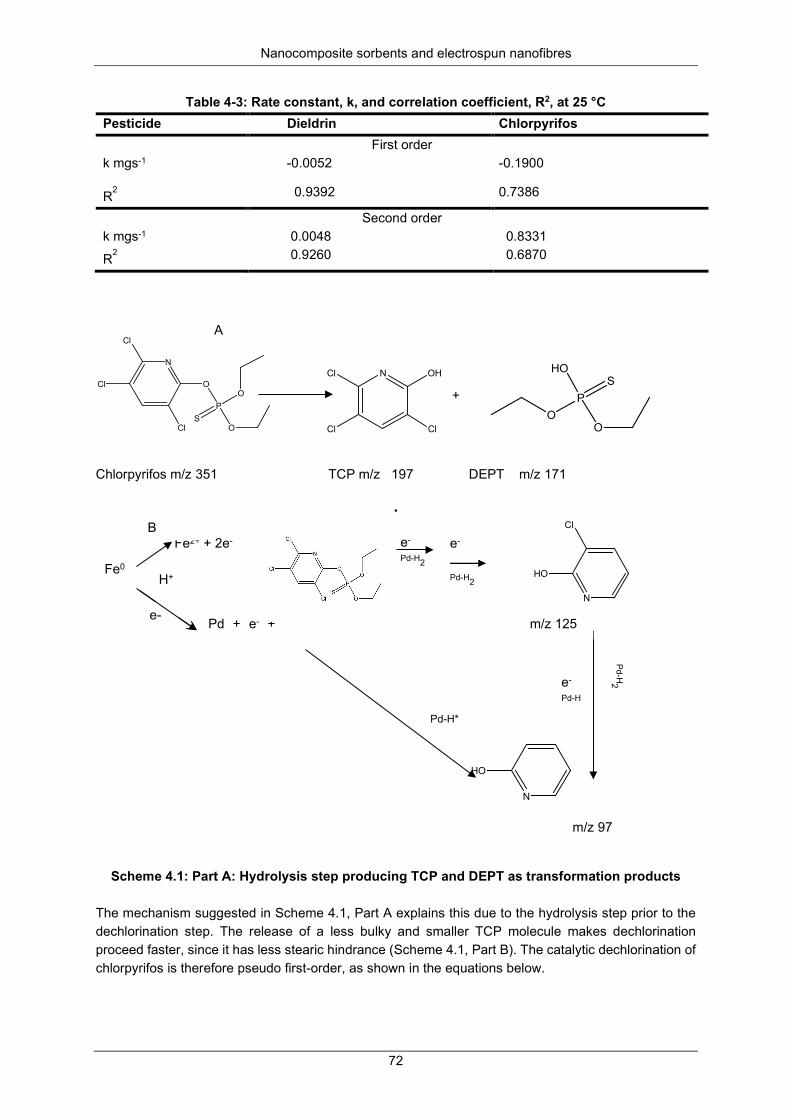
Nanocomposite sorbents and electrospun nanofibres
72
Table 4-3: Rate constant, k, and correlation coefficient, R2, at 25 °C Pesticide Dieldrin Chlorpyrifos
First order k mgs-1 -0.0052 -0.1900
R2 0.9392 0.7386
Second order k mgs-1 0.0048 0.8331
R2 0.9260 0.6870
Chlorpyrifos m/z 351 TCP m/z 197 DEPT m/z 171
.
m/z 97
Scheme 4.1: Part A: Hydrolysis step producing TCP and DEPT as transformation products
The mechanism suggested in Scheme 4.1, Part A explains this due to the hydrolysis step prior to the dechlorination step. The release of a less bulky and smaller TCP molecule makes dechlorination proceed faster, since it has less stearic hindrance (Scheme 4.1, Part B). The catalytic dechlorination of chlorpyrifos is therefore pseudo first-order, as shown in the equations below.
PO
O
O
S
N
Cl
Cl
Cl
N OHCl
Cl Cl
P
OO
HOS
N
HO
Cl
N
HO
Fe0
+
Fe2+ + 2e-
Pd + e- +
H+
e-
Pd-H2
e-
Pd-H2
e-
Pd-H
Pd-H*
m/z 125 e-
Pd-H2
A
B
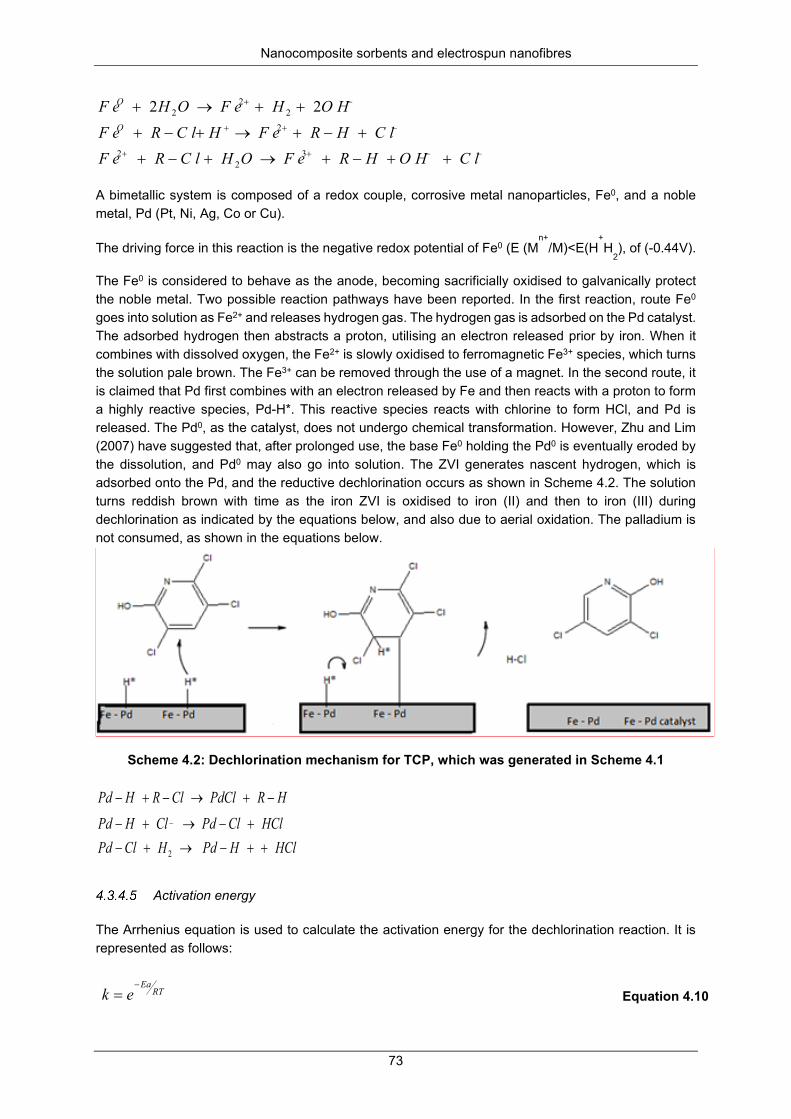
Nanocomposite sorbents and electrospun nanofibres
73
A bimetallic system is composed of a redox couple, corrosive metal nanoparticles, Fe0, and a noble metal, Pd (Pt, Ni, Ag, Co or Cu).
The driving force in this reaction is the negative redox potential of Fe0 (E (Mn+
/M)<E(H+H
2), of (-0.44V).
The Fe0 is considered to behave as the anode, becoming sacrificially oxidised to galvanically protect the noble metal. Two possible reaction pathways have been reported. In the first reaction, route Fe0 goes into solution as Fe2+ and releases hydrogen gas. The hydrogen gas is adsorbed on the Pd catalyst. The adsorbed hydrogen then abstracts a proton, utilising an electron released prior by iron. When it combines with dissolved oxygen, the Fe2+ is slowly oxidised to ferromagnetic Fe3+ species, which turns the solution pale brown. The Fe3+ can be removed through the use of a magnet. In the second route, it is claimed that Pd first combines with an electron released by Fe and then reacts with a proton to form a highly reactive species, Pd-H*. This reactive species reacts with chlorine to form HCl, and Pd is released. The Pd0, as the catalyst, does not undergo chemical transformation. However, Zhu and Lim (2007) have suggested that, after prolonged use, the base Fe0 holding the Pd0 is eventually eroded by the dissolution, and Pd0 may also go into solution. The ZVI generates nascent hydrogen, which is adsorbed onto the Pd, and the reductive dechlorination occurs as shown in Scheme 4.2. The solution turns reddish brown with time as the iron ZVI is oxidised to iron (II) and then to iron (III) during dechlorination as indicated by the equations below, and also due to aerial oxidation. The palladium is not consumed, as shown in the equations below.
Scheme 4.2: Dechlorination mechanism for TCP, which was generated in Scheme 4.1
Activation energy
The Arrhenius equation is used to calculate the activation energy for the dechlorination reaction. It is represented as follows:
Equation 4.10
22
32
2
22
22
−−++
−++
−+
++−+→+−+
+−+→+−+
++→+
C lO HHRF eOHC lRF eC lHRF eHC lRF e
O HHF eOHF eO
O
HClHPdHClPdHClClPdClHPd
HRPdClClRHPd
++−→+−+−→+−
−+→−+−
2
_
RTEa
ek−
=
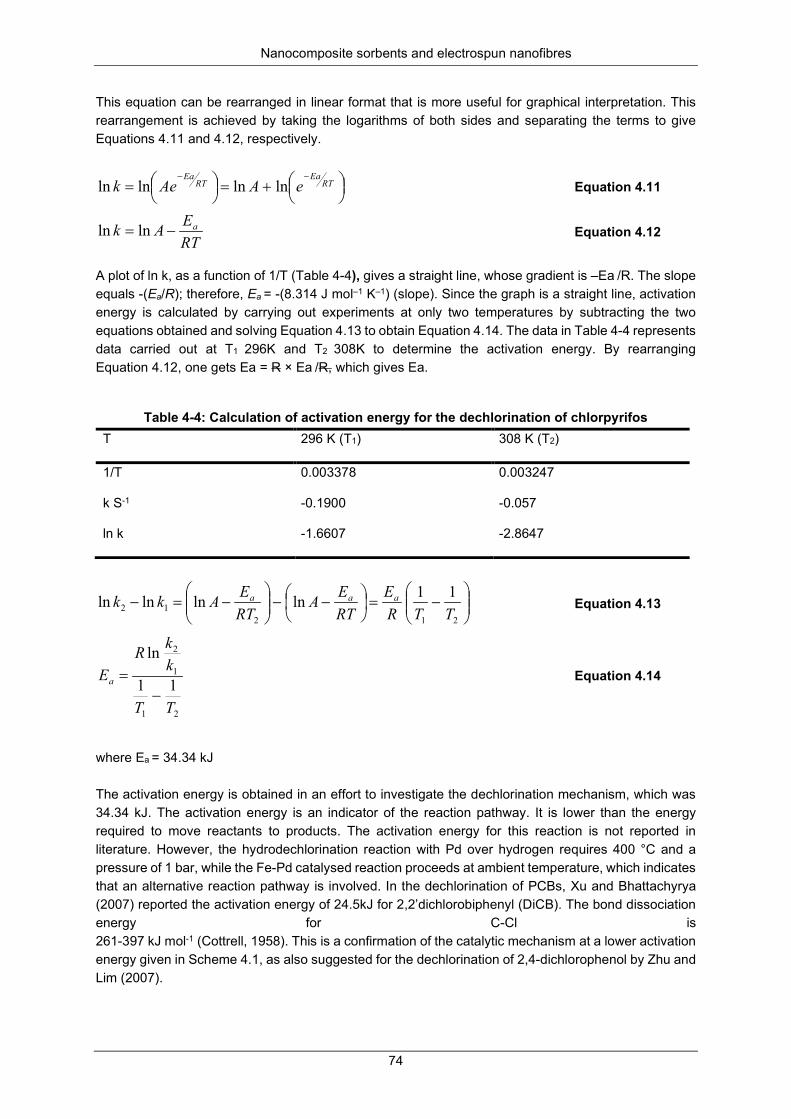
Nanocomposite sorbents and electrospun nanofibres
74
This equation can be rearranged in linear format that is more useful for graphical interpretation. This rearrangement is achieved by taking the logarithms of both sides and separating the terms to give Equations 4.11 and 4.12, respectively.
Equation 4.11
Equation 4.12
A plot of ln k, as a function of 1/T (Table 4-4), gives a straight line, whose gradient is –Ea /R. The slope equals -(Ea/R); therefore, Ea = -(8.314 J mol–1 K–1) (slope). Since the graph is a straight line, activation energy is calculated by carrying out experiments at only two temperatures by subtracting the two equations obtained and solving Equation 4.13 to obtain Equation 4.14. The data in Table 4-4 represents data carried out at T1 296K and T2 308K to determine the activation energy. By rearranging Equation 4.12, one gets Ea = R × Ea /R, which gives Ea.
Table 4-4: Calculation of activation energy for the dechlorination of chlorpyrifos
T 296 K (T1) 308 K (T2)
1/T 0.003378 0.003247
k S-1 -0.1900 -0.057
ln k -1.6607 -2.8647
Equation 4.13
Equation 4.14
where Ea = 34.34 kJ The activation energy is obtained in an effort to investigate the dechlorination mechanism, which was 34.34 kJ. The activation energy is an indicator of the reaction pathway. It is lower than the energy required to move reactants to products. The activation energy for this reaction is not reported in literature. However, the hydrodechlorination reaction with Pd over hydrogen requires 400 °C and a pressure of 1 bar, while the Fe-Pd catalysed reaction proceeds at ambient temperature, which indicates that an alternative reaction pathway is involved. In the dechlorination of PCBs, Xu and Bhattachyrya (2007) reported the activation energy of 24.5kJ for 2,2’dichlorobiphenyl (DiCB). The bond dissociation energy for C-Cl is 261-397 kJ mol-1 (Cottrell, 1958). This is a confirmation of the catalytic mechanism at a lower activation energy given in Scheme 4.1, as also suggested for the dechlorination of 2,4-dichlorophenol by Zhu and Lim (2007).
+=
=
−−RT
EaRT
EaeAAek lnlnlnln
RTEAk a−= lnln
−=
−−
−=−
21212
11lnlnlnlnTTR
ERTEA
RTEAkk aaa
21
1
2
11
ln
TT
kkR
Ea
−=
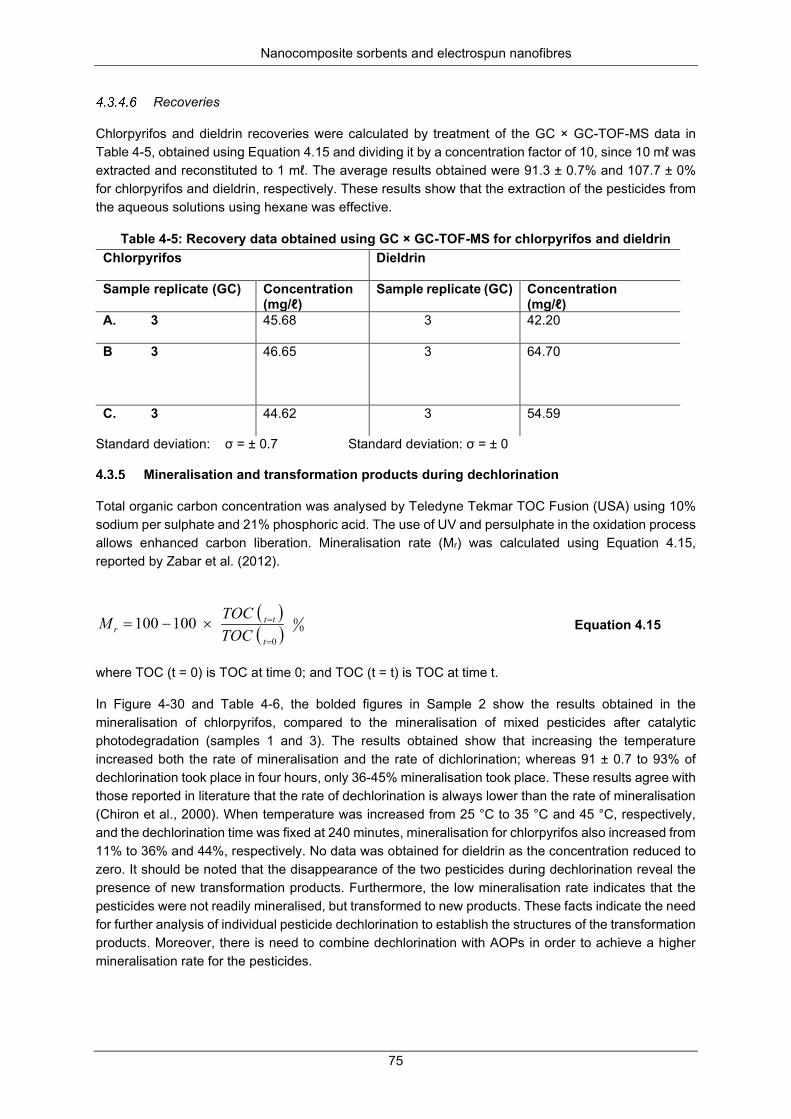
Nanocomposite sorbents and electrospun nanofibres
75
Recoveries
Chlorpyrifos and dieldrin recoveries were calculated by treatment of the GC × GC-TOF-MS data in Table 4-5, obtained using Equation 4.15 and dividing it by a concentration factor of 10, since 10 mℓ was extracted and reconstituted to 1 mℓ. The average results obtained were 91.3 ± 0.7% and 107.7 ± 0% for chlorpyrifos and dieldrin, respectively. These results show that the extraction of the pesticides from the aqueous solutions using hexane was effective.
Table 4-5: Recovery data obtained using GC × GC-TOF-MS for chlorpyrifos and dieldrin Chlorpyrifos Dieldrin
Sample replicate (GC) Concentration (mg/ℓ)
Sample replicate (GC) Concentration (mg/ℓ)
A. 3 45.68 3 42.20
B 3 46.65
3 64.70
C. 3 44.62 3 54.59
Standard deviation: σ = ± 0.7 Standard deviation: σ = ± 0
Mineralisation and transformation products during dechlorination
Total organic carbon concentration was analysed by Teledyne Tekmar TOC Fusion (USA) using 10% sodium per sulphate and 21% phosphoric acid. The use of UV and persulphate in the oxidation process allows enhanced carbon liberation. Mineralisation rate (Mr) was calculated using Equation 4.15, reported by Zabar et al. (2012).
Equation 4.15
where TOC (t = 0) is TOC at time 0; and TOC (t = t) is TOC at time t.
In Figure 4-30 and Table 4-6, the bolded figures in Sample 2 show the results obtained in the mineralisation of chlorpyrifos, compared to the mineralisation of mixed pesticides after catalytic photodegradation (samples 1 and 3). The results obtained show that increasing the temperature increased both the rate of mineralisation and the rate of dichlorination; whereas 91 ± 0.7 to 93% of dechlorination took place in four hours, only 36-45% mineralisation took place. These results agree with those reported in literature that the rate of dechlorination is always lower than the rate of mineralisation (Chiron et al., 2000). When temperature was increased from 25 °C to 35 °C and 45 °C, respectively, and the dechlorination time was fixed at 240 minutes, mineralisation for chlorpyrifos also increased from 11% to 36% and 44%, respectively. No data was obtained for dieldrin as the concentration reduced to zero. It should be noted that the disappearance of the two pesticides during dechlorination reveal the presence of new transformation products. Furthermore, the low mineralisation rate indicates that the pesticides were not readily mineralised, but transformed to new products. These facts indicate the need for further analysis of individual pesticide dechlorination to establish the structures of the transformation products. Moreover, there is need to combine dechlorination with AOPs in order to achieve a higher mineralisation rate for the pesticides.
( )( ) 0
0
0
100100=
=×−=t
ttr TOC
TOCM
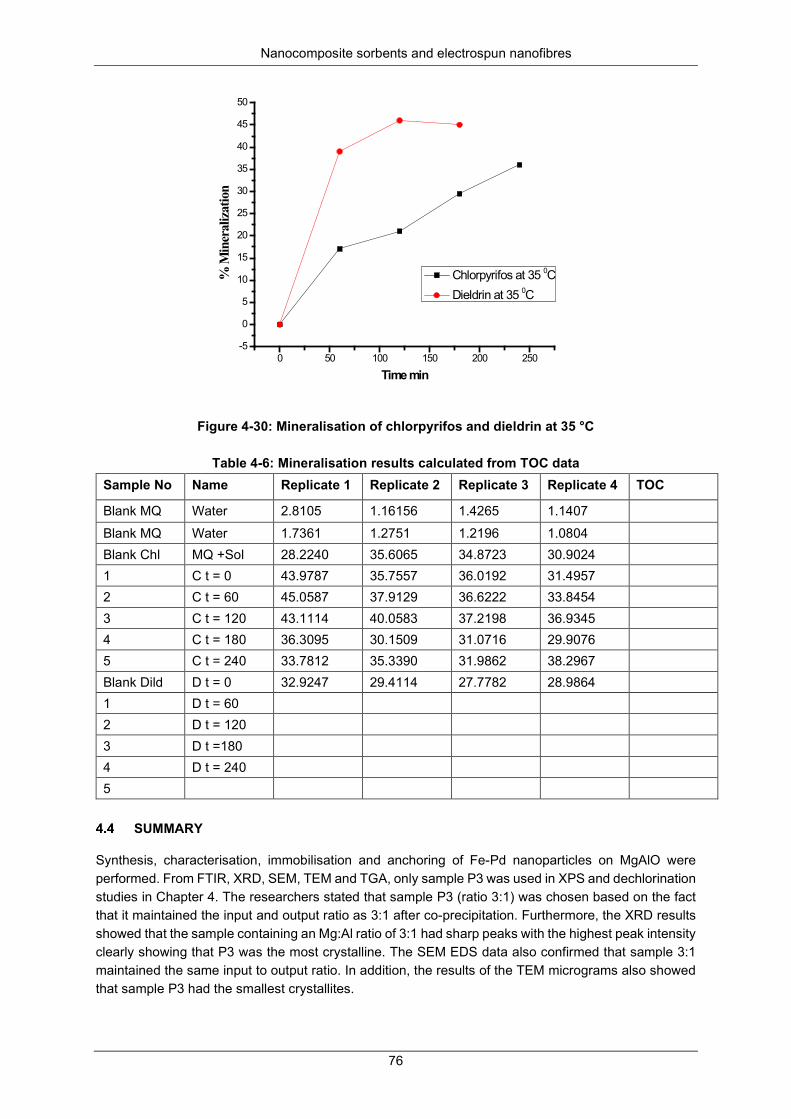
Nanocomposite sorbents and electrospun nanofibres
76
Figure 4-30: Mineralisation of chlorpyrifos and dieldrin at 35 °C
Table 4-6: Mineralisation results calculated from TOC data Sample No Name Replicate 1 Replicate 2 Replicate 3 Replicate 4 TOC
Blank MQ Water 2.8105 1.16156 1.4265 1.1407 Blank MQ Water 1.7361 1.2751 1.2196 1.0804 Blank Chl MQ +Sol 28.2240 35.6065 34.8723 30.9024 1 C t = 0 43.9787 35.7557 36.0192 31.4957 2 C t = 60 45.0587 37.9129 36.6222 33.8454 3 C t = 120 43.1114 40.0583 37.2198 36.9345 4 C t = 180 36.3095 30.1509 31.0716 29.9076 5 C t = 240 33.7812 35.3390 31.9862 38.2967 Blank Dild D t = 0 32.9247 29.4114 27.7782 28.9864 1 D t = 60 2 D t = 120 3 D t =180 4 D t = 240 5
SUMMARY
Synthesis, characterisation, immobilisation and anchoring of Fe-Pd nanoparticles on MgAlO were performed. From FTIR, XRD, SEM, TEM and TGA, only sample P3 was used in XPS and dechlorination studies in Chapter 4. The researchers stated that sample P3 (ratio 3:1) was chosen based on the fact that it maintained the input and output ratio as 3:1 after co-precipitation. Furthermore, the XRD results showed that the sample containing an Mg:Al ratio of 3:1 had sharp peaks with the highest peak intensity clearly showing that P3 was the most crystalline. The SEM EDS data also confirmed that sample 3:1 maintained the same input to output ratio. In addition, the results of the TEM micrograms also showed that sample P3 had the smallest crystallites.
0 50 100 150 200 250-5
0
5
10
15
20
25
30
35
40
45
50
% M
iner
aliza
tion
Time min
Chlorpyrifos at 35 0C Dieldrin at 35 0C
Nanocomposite sorbents and electrospun nanofibres
77
The materials have potential use in pollutant dechlorination in contaminated water at ambient temperature. Literature suggests that the slurry method is indeed a superior method for the industrial synthesis of MgAlO, since it is less tedious and requires less washing, besides, it releases far less toxic waste into the environment (Valente et al., 2009). However, in the laboratory, it was the co-precipitation method, sample P3, that gave consistent results, which were in agreement with the input quantities in the ratio 3:1. The FTIR confirmed that decomposition of the LDH structure was achieved and that water, hydroxide and carbonate groups were removed after calcining at 500 ºC. This was confirmed by TGA results that showed the degradation profile and were in agreement with data in the literature (Valente et al., 2009; Xu et al., 2010). Nitrogen physisorption clearly demonstrates that large surface areas are required to immobilise Fe-Pd. This was achieved and compares well with the literature values reported. From the TEM and BET results, one can draw the conclusion that Fe-Pd nanoparticles indeed occupied the interlayer spacing. This is suggested by the reduction of pore sizes and volume upon loading Fe-Pd nanoparticles. Anchoring and immobilisation catalyst nanoparticles on metal oxide support were achieved, which enhanced pollutant dechlorination and its subsequent filtration.
The dechlorination efficiency of dieldrin and chlorpyrifos of 92.0% and 96.0%, respectively, was achieved in four hours. However, mineralisation was achieved between 36 and 45%. This trend was also noted by Chiron et al. (2000). Zhu and Lim (2007), in their work on the dechlorination of chlorobenzenes, found that dechlorination did not result in high mineralisation, but when catalytic photodegradation was carried out prior to dichlorination, high mineralisation of 96% was achieved. However, when dechlorination was carried out prior to catalytic photodegradation, the resulting mineralisation was very low. This suggests that, to complete degradation, another process, such as advanced oxidation, is necessary. Further work is needed to investigate the degradation of stable intermediates of pesticides containing the benzene ring, which are sometimes more toxic than the original pollutant.
The percentage recovery results obtained for verification of the extraction process for chlorpyrifos and dieldrin was 91.3 ± 0.7% and 107.7 ± 0%, respectively, clearly indicating that the extraction of the pesticides was efficient. The dechlorination reaction suggests that hydrogen is first generated by iron corrosion and then adsorbed on the palladium as a catalyst. This bimetallic redox couple reaction, also known as reductive dichlorination, occurs at ambient temperature, unlike hydrodechlorination. Dieldrin shows first-order kinetics, while the chlorpyrifos profile shows two distinct sections (pseudo first-order) due to hydrolysis prior to dechlorination. The XRD diffractograms give a clear indication that differences in crystalline symmetry resulted due to distortions in layer staking of a cubic for MgO and orthorhombic geometry for Al2O3. In this case, a molar ratio 3:1 gave the highest peak intensity. Therefore, this ratio gives the least distorted MgAlO crystalline structure. The results of loading Fe-Pd on MgAlO analysed by ICP-OES after nitric acid digestion gave a loading of Pd between 0.2 and 0.3%. Leaching of Fe, Mg, Al and Pd results using ICP-OES analysis indicated that there was some leaching, even at a neutral pH. However, leaching increases as the pH decreases in the sample solution. The rate leaching shows that metals with high negative reduction potential (E0) leached faster with Mg > Al > Fe, which is in line with the electrochemical series. However, the reductive dechlorination by ZVI technology requires the corrosive metal to leach for the reaction to proceed. Thus, leaching is a prerequisite in the design of ZVI technology.
Further work using modified silica fused with support metal oxide supports is needed, as is the identification of transformation products during dechlorination. Mineralisation of 36 to 45% was achieved, suggesting the possibility of complete degradation, which could be achieved by AOPs. Further work is needed to investigate the dechlorination and catalytic photodegradation of stable pesticide intermediates and molecules containing the benzene ring. This is undertaken in Chapter 5.
Nanocomposite sorbents and electrospun nanofibres
78
CHAPTER 5: ELECTROSPUN AND FUNCTIONALISED PVDF/PAN NANOCATALYST-LOADED COMPOSITE FOR THE DECHLORINATION AND PHOTODEGRADATION OF
PESTICIDES
INTRODUCTION
This chapter reports on a novel method of electrospinning PVDF with the addition of 2 wt % PAN mw 150,000 to 12 wt % high mw (534,000) PVDF. The PAN acts as a TiO2 nitrogen dopant, as well as the second electrospinning polymer. The nanofibres were grafted with acrylic acid by free radical polymerisation using AIBN as initiator. The Fe-Pd and TiO2 nanoparticles were anchored on the carboxylic acid brushes through chelation. Bimetallic Fe-Pd and nitrogen-doped TiO2 nanoparticles were used for simultaneous dechlorination and photocatalytic degradation of the pesticides, respectively, to mineralised benign products. Similar studies have been reported (Wei et al., 2006; Han et al., 2012; Xu and Bhattacharya, 2007; Vijaya et al., 2012; Stefan and Williamson, 2004; Sheng and Liu, 2011; Huang et al., 2012; Muftikian et al., 1996; Kedziora et al., 2012; Zenilda et al., 2011). However, the researchers used electrospun PAN and TiO2 only. The PAN is easily degraded by TiO2, making it less suitable as a photocatalyst support material. Xu and Bhattachayra (2007) used Fe-Pd on cast membranes, and modified the pores. Cast membranes possess less surface area than nanofibres. In addition, they did not combine Fe-Pd (for dechlorination) with TiO2 for advanced oxidation or electrospun fibres. Therefore, this study is an attempt to fill this knowledge gap by using electrospun bifunctional composites. It also encompasses the removal of toxic trace metals, as well as leached catalyst nanoparticles. Electrospinning is an efficient preferred method for the production of nanofibres that have large surface areas, high porosity and very low volumes, and very small pore sizes (Desai and Kit, 2008; Xu et al., 2009; Ignatova et al., 2006). However, the electrospinning of nanofibres from polymer solutions is a very slow process (Li and Xia, 2004). This technique uses of very high voltage (10-80 kV) to charge, pull and stretch the surface of a polymer droplet. In the process of electrospinning, what helps in producing nanofibres is the electrostatic charge applied. Initially, the electrostatic force and the surface tension on the polymer drop are in equilibrium. As the applied external force starts to overcome the surface tension of the fluid, a cone-shaped droplet, known as the Tylor cone, forms at the tip of the spinneret. As the applied electric field increases, the drop erupts to form a stretched thread. The interaction between the applied external electric field and the internal repulsive charges stretches the fibre and makes it thinner by one to two orders of magnitude. A continuous nanofibre is formed during subsequent jet stretching due to whipping and bending instability caused by high charges on a thin fibre as the solvent quickly evaporates (Jaworek et al., 2009; Rodde et al., 2008: Nthumbi et al., 2011). A good polymer support must meet the following requirements: It must have a strong affinity between the photocatalyst and the support for stable anchoring. In addition, the catalytic activity must not be affected by the chosen attachment method. It must have a high specific surface area and must have strong affinity for adsorption of pollutants to be degraded. Furthermore, leaching of the photocatalyst from the support surface due to various reaction conditions must be minimal. The photocatalyst-substrate composite must be stable for long-term operations. Therefore, the polymer support should have stability against degradation by strong oxidative radicals generated by the photocatalyst (Singh et al., 2013). Synthetic polymers such as PSf, PVDF, PES, PP, PAN, PE and PVC are commercially available. In addition, biopolymers such as CA, CH and polylactic acid are also available.
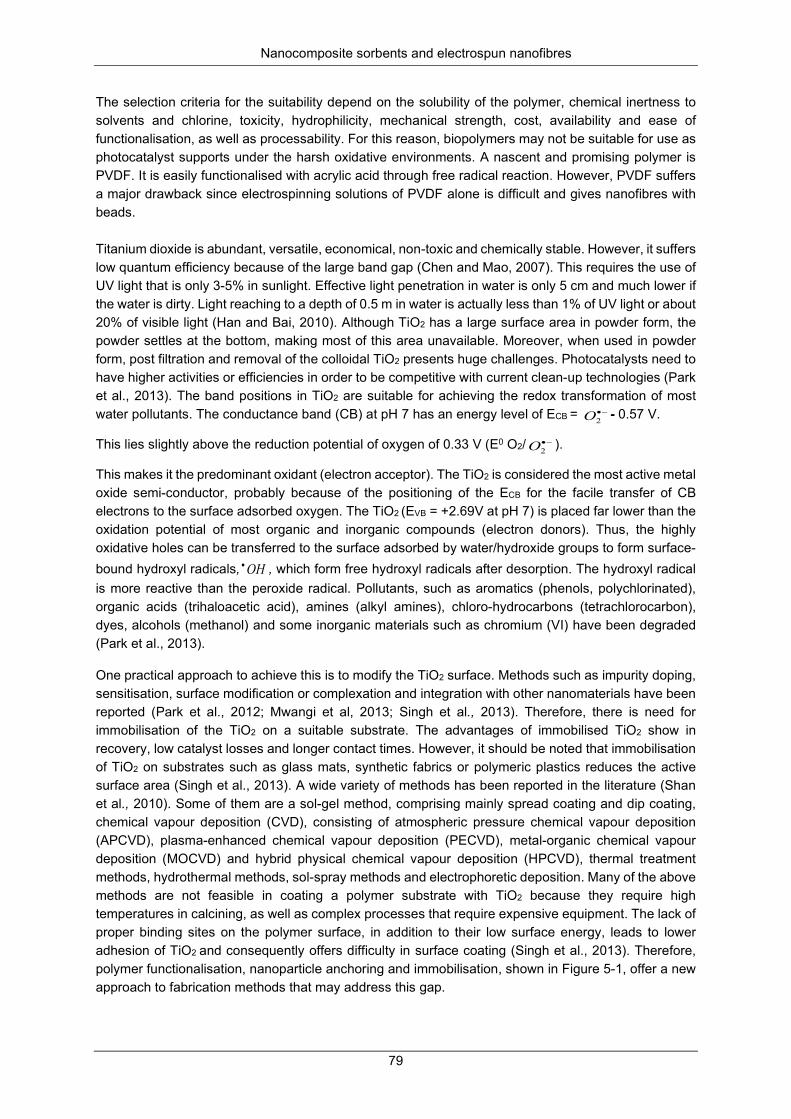
Nanocomposite sorbents and electrospun nanofibres
79
The selection criteria for the suitability depend on the solubility of the polymer, chemical inertness to solvents and chlorine, toxicity, hydrophilicity, mechanical strength, cost, availability and ease of functionalisation, as well as processability. For this reason, biopolymers may not be suitable for use as photocatalyst supports under the harsh oxidative environments. A nascent and promising polymer is PVDF. It is easily functionalised with acrylic acid through free radical reaction. However, PVDF suffers a major drawback since electrospinning solutions of PVDF alone is difficult and gives nanofibres with beads. Titanium dioxide is abundant, versatile, economical, non-toxic and chemically stable. However, it suffers low quantum efficiency because of the large band gap (Chen and Mao, 2007). This requires the use of UV light that is only 3-5% in sunlight. Effective light penetration in water is only 5 cm and much lower if the water is dirty. Light reaching to a depth of 0.5 m in water is actually less than 1% of UV light or about 20% of visible light (Han and Bai, 2010). Although TiO2 has a large surface area in powder form, the powder settles at the bottom, making most of this area unavailable. Moreover, when used in powder form, post filtration and removal of the colloidal TiO2 presents huge challenges. Photocatalysts need to have higher activities or efficiencies in order to be competitive with current clean-up technologies (Park et al., 2013). The band positions in TiO2 are suitable for achieving the redox transformation of most water pollutants. The conductance band (CB) at pH 7 has an energy level of ECB = −•
2O - 0.57 V.
This lies slightly above the reduction potential of oxygen of 0.33 V (E0 O2/ −•2O ).
This makes it the predominant oxidant (electron acceptor). The TiO2 is considered the most active metal oxide semi-conductor, probably because of the positioning of the ECB for the facile transfer of CB electrons to the surface adsorbed oxygen. The TiO2 (EVB = +2.69V at pH 7) is placed far lower than the oxidation potential of most organic and inorganic compounds (electron donors). Thus, the highly oxidative holes can be transferred to the surface adsorbed by water/hydroxide groups to form surface-bound hydroxyl radicals, OH• , which form free hydroxyl radicals after desorption. The hydroxyl radical is more reactive than the peroxide radical. Pollutants, such as aromatics (phenols, polychlorinated), organic acids (trihaloacetic acid), amines (alkyl amines), chloro-hydrocarbons (tetrachlorocarbon), dyes, alcohols (methanol) and some inorganic materials such as chromium (VI) have been degraded (Park et al., 2013).
One practical approach to achieve this is to modify the TiO2 surface. Methods such as impurity doping, sensitisation, surface modification or complexation and integration with other nanomaterials have been reported (Park et al., 2012; Mwangi et al, 2013; Singh et al., 2013). Therefore, there is need for immobilisation of the TiO2 on a suitable substrate. The advantages of immobilised TiO2 show in recovery, low catalyst losses and longer contact times. However, it should be noted that immobilisation of TiO2 on substrates such as glass mats, synthetic fabrics or polymeric plastics reduces the active surface area (Singh et al., 2013). A wide variety of methods has been reported in the literature (Shan et al., 2010). Some of them are a sol-gel method, comprising mainly spread coating and dip coating, chemical vapour deposition (CVD), consisting of atmospheric pressure chemical vapour deposition (APCVD), plasma-enhanced chemical vapour deposition (PECVD), metal-organic chemical vapour deposition (MOCVD) and hybrid physical chemical vapour deposition (HPCVD), thermal treatment methods, hydrothermal methods, sol-spray methods and electrophoretic deposition. Many of the above methods are not feasible in coating a polymer substrate with TiO2 because they require high temperatures in calcining, as well as complex processes that require expensive equipment. The lack of proper binding sites on the polymer surface, in addition to their low surface energy, leads to lower adhesion of TiO2 and consequently offers difficulty in surface coating (Singh et al., 2013). Therefore, polymer functionalisation, nanoparticle anchoring and immobilisation, shown in Figure 5-1, offer a new approach to fabrication methods that may address this gap.
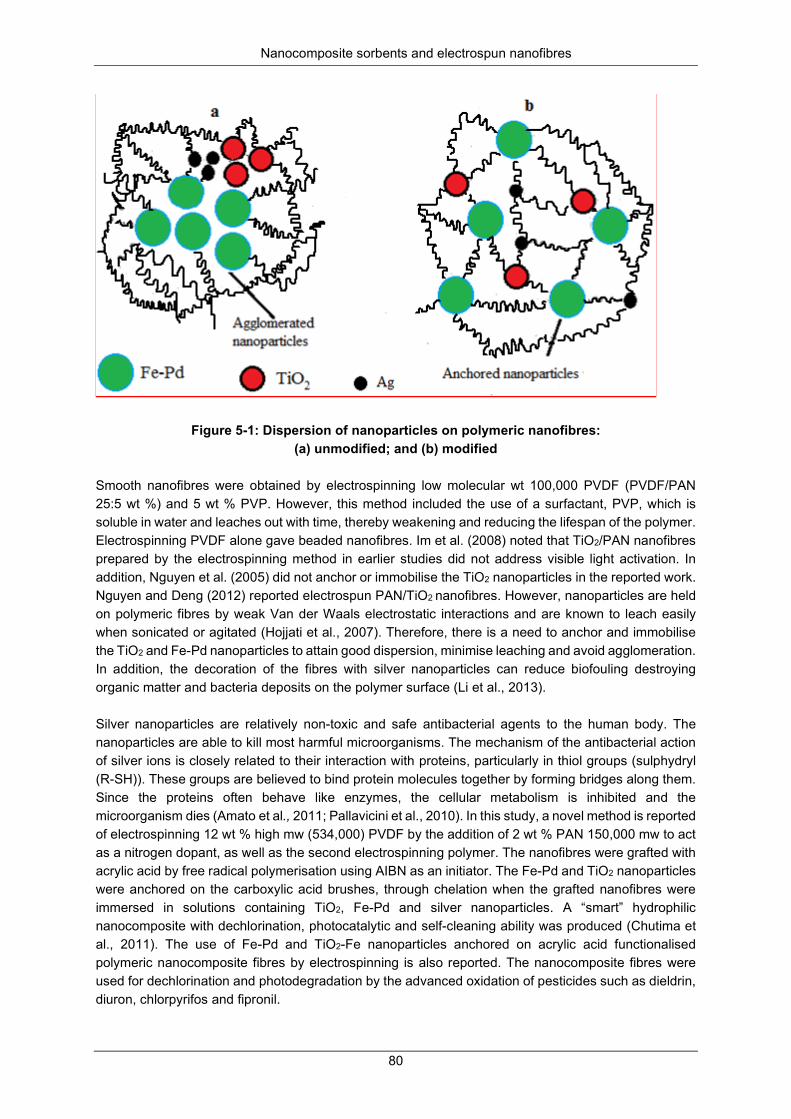
Nanocomposite sorbents and electrospun nanofibres
80
Figure 5-1: Dispersion of nanoparticles on polymeric nanofibres: (a) unmodified; and (b) modified
Smooth nanofibres were obtained by electrospinning low molecular wt 100,000 PVDF (PVDF/PAN 25:5 wt %) and 5 wt % PVP. However, this method included the use of a surfactant, PVP, which is soluble in water and leaches out with time, thereby weakening and reducing the lifespan of the polymer. Electrospinning PVDF alone gave beaded nanofibres. Im et al. (2008) noted that TiO2/PAN nanofibres prepared by the electrospinning method in earlier studies did not address visible light activation. In addition, Nguyen et al. (2005) did not anchor or immobilise the TiO2 nanoparticles in the reported work. Nguyen and Deng (2012) reported electrospun PAN/TiO2 nanofibres. However, nanoparticles are held on polymeric fibres by weak Van der Waals electrostatic interactions and are known to leach easily when sonicated or agitated (Hojjati et al., 2007). Therefore, there is a need to anchor and immobilise the TiO2 and Fe-Pd nanoparticles to attain good dispersion, minimise leaching and avoid agglomeration. In addition, the decoration of the fibres with silver nanoparticles can reduce biofouling destroying organic matter and bacteria deposits on the polymer surface (Li et al., 2013). Silver nanoparticles are relatively non-toxic and safe antibacterial agents to the human body. The nanoparticles are able to kill most harmful microorganisms. The mechanism of the antibacterial action of silver ions is closely related to their interaction with proteins, particularly in thiol groups (sulphydryl (R-SH)). These groups are believed to bind protein molecules together by forming bridges along them. Since the proteins often behave like enzymes, the cellular metabolism is inhibited and the microorganism dies (Amato et al., 2011; Pallavicini et al., 2010). In this study, a novel method is reported of electrospinning 12 wt % high mw (534,000) PVDF by the addition of 2 wt % PAN 150,000 mw to act as a nitrogen dopant, as well as the second electrospinning polymer. The nanofibres were grafted with acrylic acid by free radical polymerisation using AIBN as an initiator. The Fe-Pd and TiO2 nanoparticles were anchored on the carboxylic acid brushes, through chelation when the grafted nanofibres were immersed in solutions containing TiO2, Fe-Pd and silver nanoparticles. A “smart” hydrophilic nanocomposite with dechlorination, photocatalytic and self-cleaning ability was produced (Chutima et al., 2011). The use of Fe-Pd and TiO2-Fe nanoparticles anchored on acrylic acid functionalised polymeric nanocomposite fibres by electrospinning is also reported. The nanocomposite fibres were used for dechlorination and photodegradation by the advanced oxidation of pesticides such as dieldrin, diuron, chlorpyrifos and fipronil.
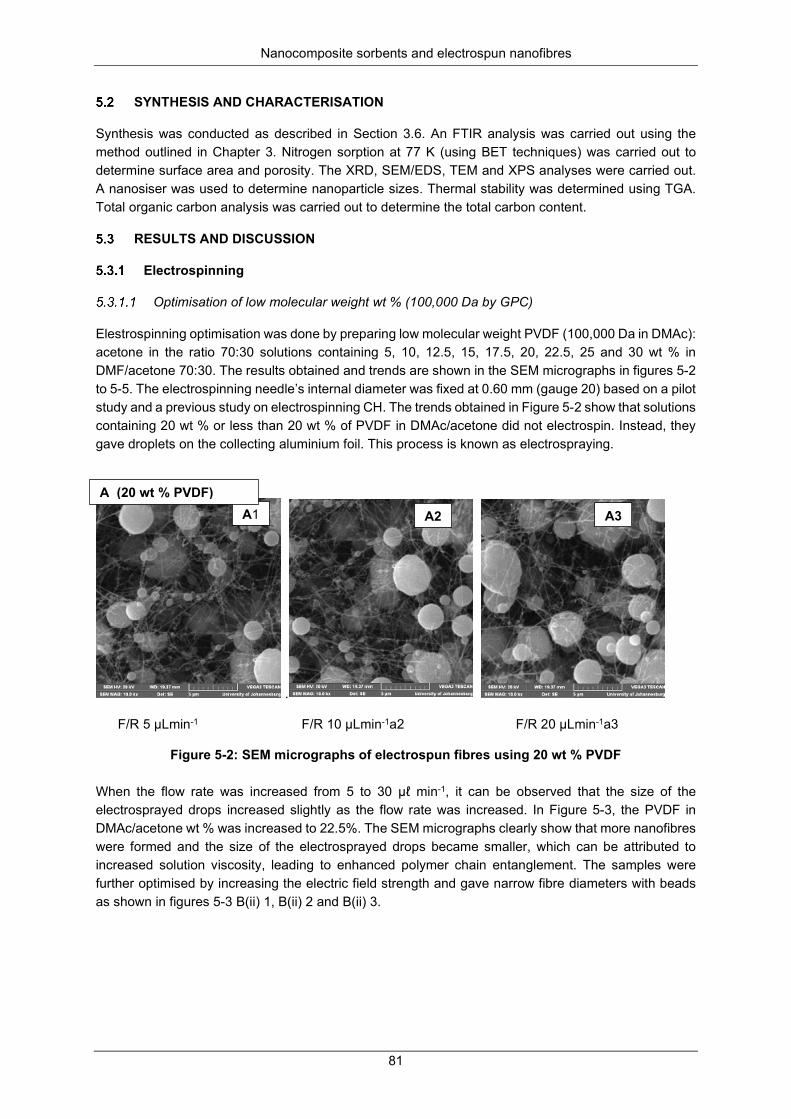
Nanocomposite sorbents and electrospun nanofibres
81
SYNTHESIS AND CHARACTERISATION
Synthesis was conducted as described in Section 3.6. An FTIR analysis was carried out using the method outlined in Chapter 3. Nitrogen sorption at 77 K (using BET techniques) was carried out to determine surface area and porosity. The XRD, SEM/EDS, TEM and XPS analyses were carried out. A nanosiser was used to determine nanoparticle sizes. Thermal stability was determined using TGA. Total organic carbon analysis was carried out to determine the total carbon content.
RESULTS AND DISCUSSION
Electrospinning
Optimisation of low molecular weight wt % (100,000 Da by GPC)
Elestrospinning optimisation was done by preparing low molecular weight PVDF (100,000 Da in DMAc): acetone in the ratio 70:30 solutions containing 5, 10, 12.5, 15, 17.5, 20, 22.5, 25 and 30 wt % in DMF/acetone 70:30. The results obtained and trends are shown in the SEM micrographs in figures 5-2 to 5-5. The electrospinning needle’s internal diameter was fixed at 0.60 mm (gauge 20) based on a pilot study and a previous study on electrospinning CH. The trends obtained in Figure 5-2 show that solutions containing 20 wt % or less than 20 wt % of PVDF in DMAc/acetone did not electrospin. Instead, they gave droplets on the collecting aluminium foil. This process is known as electrospraying.
.
F/R 5 µLmin-1 F/R 10 µLmin-1a2 F/R 20 µLmin-1a3
Figure 5-2: SEM micrographs of electrospun fibres using 20 wt % PVDF
When the flow rate was increased from 5 to 30 µℓ min-1, it can be observed that the size of the electrosprayed drops increased slightly as the flow rate was increased. In Figure 5-3, the PVDF in DMAc/acetone wt % was increased to 22.5%. The SEM micrographs clearly show that more nanofibres were formed and the size of the electrosprayed drops became smaller, which can be attributed to increased solution viscosity, leading to enhanced polymer chain entanglement. The samples were further optimised by increasing the electric field strength and gave narrow fibre diameters with beads as shown in figures 5-3 B(ii) 1, B(ii) 2 and B(ii) 3.
A1 A2 A3 A (20 wt % PVDF)
Nanocomposite sorbents and electrospun nanofibres
82
.
PVDF 22.5 wt % a1 PVDF 22.5 wt % a2 PVDF 22.5 wt % a3
.
PVDF 22.5 wt % a4 PVDF 22.5 wt % a5 PVDF 22.5 wt % a (measurements)
.
PVDF 22.5 wt % b1 PVDF 22.5 wt % b2 PVDF 22.5 wt % b3
Figure 5-3: SEM micrographs of electrospun fibres using 22.5 wt % PVDF The PVDF in DMAc/acetone wt % was increased to 25% and the electrospinning optimisation process repeated. The results obtained are shown in Figure 5-4 C1 and C2. The results obtained showed consistent nanofibres with fewer beads. However, the researchers were still unable to remove the beads by increasing the polymer wt %. Finally, increasing the polymer wt % to 30, the solution became too viscous to electrospin properly. To this point, the use of a surfactant in the solution was envisaged.
B1 B2 B3
B4 B5 B6
B(ii) 1 B(ii) 2 B(ii) 3
B(ii) 22.5 wt % electric field
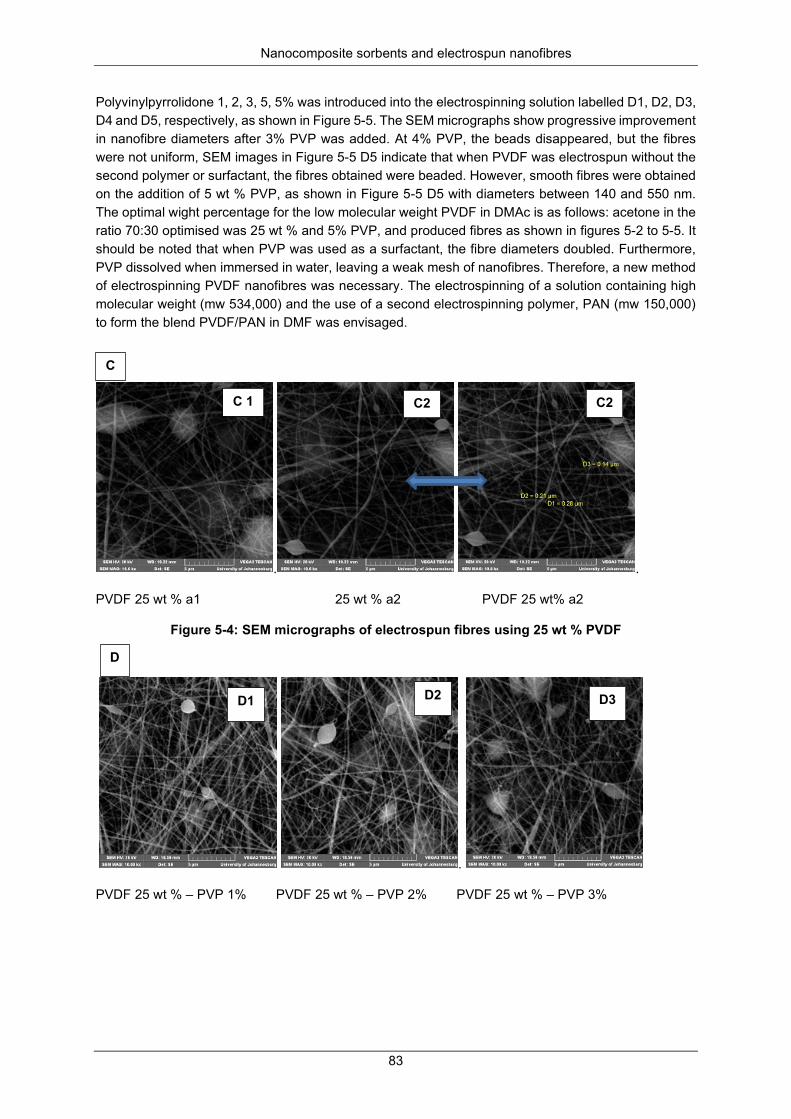
Nanocomposite sorbents and electrospun nanofibres
83
Polyvinylpyrrolidone 1, 2, 3, 5, 5% was introduced into the electrospinning solution labelled D1, D2, D3, D4 and D5, respectively, as shown in Figure 5-5. The SEM micrographs show progressive improvement in nanofibre diameters after 3% PVP was added. At 4% PVP, the beads disappeared, but the fibres were not uniform, SEM images in Figure 5-5 D5 indicate that when PVDF was electrospun without the second polymer or surfactant, the fibres obtained were beaded. However, smooth fibres were obtained on the addition of 5 wt % PVP, as shown in Figure 5-5 D5 with diameters between 140 and 550 nm. The optimal wight percentage for the low molecular weight PVDF in DMAc is as follows: acetone in the ratio 70:30 optimised was 25 wt % and 5% PVP, and produced fibres as shown in figures 5-2 to 5-5. It should be noted that when PVP was used as a surfactant, the fibre diameters doubled. Furthermore, PVP dissolved when immersed in water, leaving a weak mesh of nanofibres. Therefore, a new method of electrospinning PVDF nanofibres was necessary. The electrospinning of a solution containing high molecular weight (mw 534,000) and the use of a second electrospinning polymer, PAN (mw 150,000) to form the blend PVDF/PAN in DMF was envisaged.
. .
PVDF 25 wt % a1 25 wt % a2 PVDF 25 wt% a2
Figure 5-4: SEM micrographs of electrospun fibres using 25 wt % PVDF
.
PVDF 25 wt % – PVP 1% PVDF 25 wt % – PVP 2% PVDF 25 wt % – PVP 3%
D
C
C 1 C2 C2
D3 D2 D1
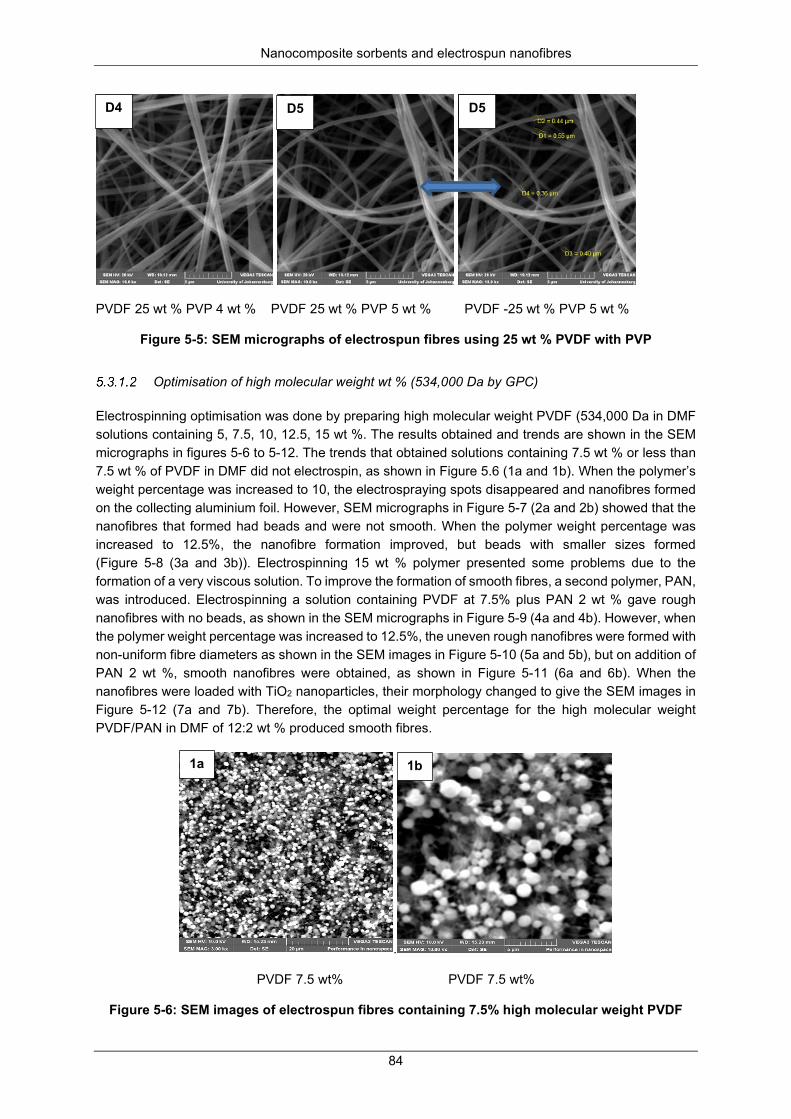
Nanocomposite sorbents and electrospun nanofibres
84
PVDF 25 wt % PVP 4 wt % PVDF 25 wt % PVP 5 wt % PVDF -25 wt % PVP 5 wt %
Figure 5-5: SEM micrographs of electrospun fibres using 25 wt % PVDF with PVP
Optimisation of high molecular weight wt % (534,000 Da by GPC)
Electrospinning optimisation was done by preparing high molecular weight PVDF (534,000 Da in DMF solutions containing 5, 7.5, 10, 12.5, 15 wt %. The results obtained and trends are shown in the SEM micrographs in figures 5-6 to 5-12. The trends that obtained solutions containing 7.5 wt % or less than 7.5 wt % of PVDF in DMF did not electrospin, as shown in Figure 5.6 (1a and 1b). When the polymer’s weight percentage was increased to 10, the electrospraying spots disappeared and nanofibres formed on the collecting aluminium foil. However, SEM micrographs in Figure 5-7 (2a and 2b) showed that the nanofibres that formed had beads and were not smooth. When the polymer weight percentage was increased to 12.5%, the nanofibre formation improved, but beads with smaller sizes formed (Figure 5-8 (3a and 3b)). Electrospinning 15 wt % polymer presented some problems due to the formation of a very viscous solution. To improve the formation of smooth fibres, a second polymer, PAN, was introduced. Electrospinning a solution containing PVDF at 7.5% plus PAN 2 wt % gave rough nanofibres with no beads, as shown in the SEM micrographs in Figure 5-9 (4a and 4b). However, when the polymer weight percentage was increased to 12.5%, the uneven rough nanofibres were formed with non-uniform fibre diameters as shown in the SEM images in Figure 5-10 (5a and 5b), but on addition of PAN 2 wt %, smooth nanofibres were obtained, as shown in Figure 5-11 (6a and 6b). When the nanofibres were loaded with TiO2 nanoparticles, their morphology changed to give the SEM images in Figure 5-12 (7a and 7b). Therefore, the optimal weight percentage for the high molecular weight PVDF/PAN in DMF of 12:2 wt % produced smooth fibres.
.
PVDF 7.5 wt% PVDF 7.5 wt%
Figure 5-6: SEM images of electrospun fibres containing 7.5% high molecular weight PVDF
1a 1b
D5 D5 D4
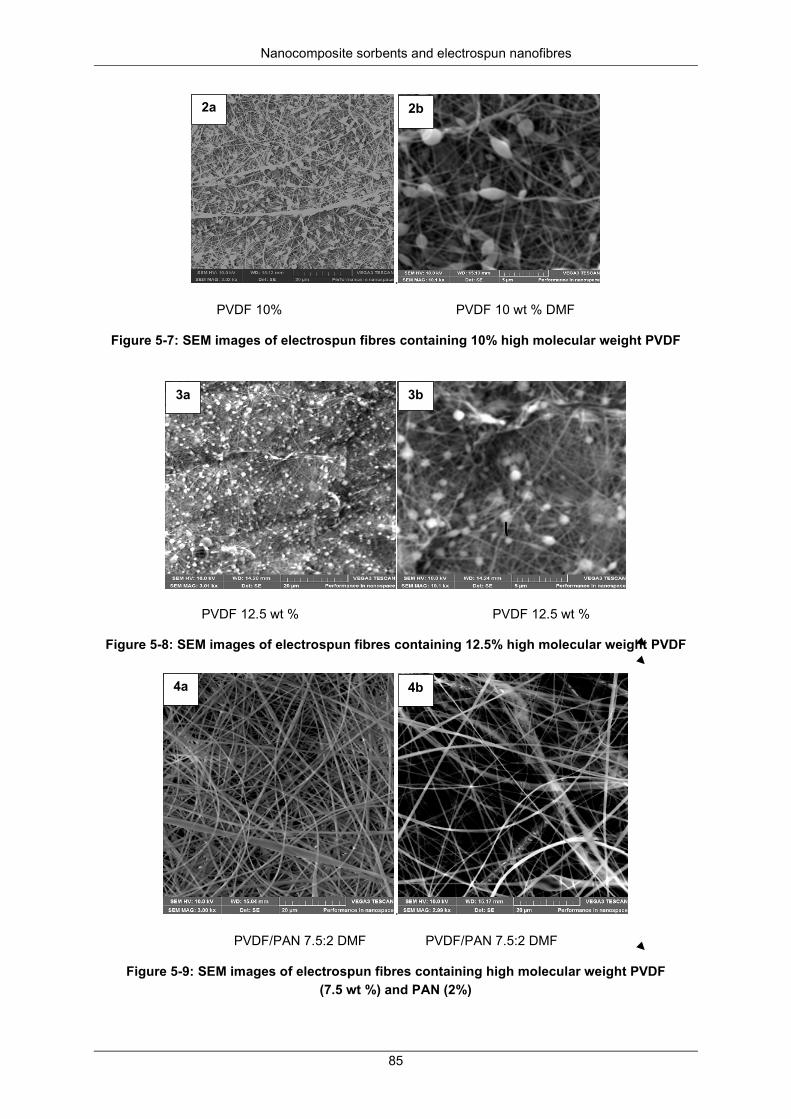
Nanocomposite sorbents and electrospun nanofibres
85
.
PVDF 10% PVDF 10 wt % DMF
Figure 5-7: SEM images of electrospun fibres containing 10% high molecular weight PVDF
PVDF 12.5 wt % PVDF 12.5 wt %
Figure 5-8: SEM images of electrospun fibres containing 12.5% high molecular weight PVDF
.
PVDF/PAN 7.5:2 DMF PVDF/PAN 7.5:2 DMF
Figure 5-9: SEM images of electrospun fibres containing high molecular weight PVDF (7.5 wt %) and PAN (2%)
2a 2b
3a 3b
4a 4b
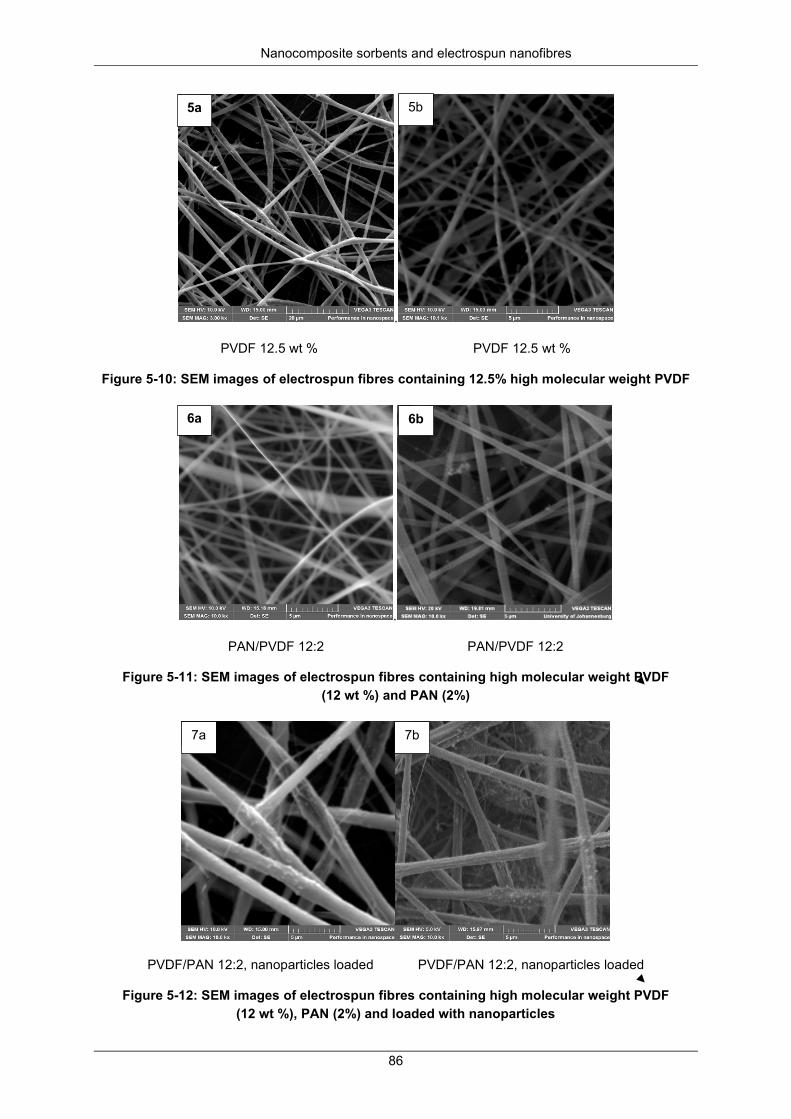
Nanocomposite sorbents and electrospun nanofibres
86
.
PVDF 12.5 wt % PVDF 12.5 wt %
Figure 5-10: SEM images of electrospun fibres containing 12.5% high molecular weight PVDF
.
PAN/PVDF 12:2 PAN/PVDF 12:2
Figure 5-11: SEM images of electrospun fibres containing high molecular weight PVDF (12 wt %) and PAN (2%)
PVDF/PAN 12:2, nanoparticles loaded PVDF/PAN 12:2, nanoparticles loaded
Figure 5-12: SEM images of electrospun fibres containing high molecular weight PVDF (12 wt %), PAN (2%) and loaded with nanoparticles
6a 6b
5b 5a
7a 7b
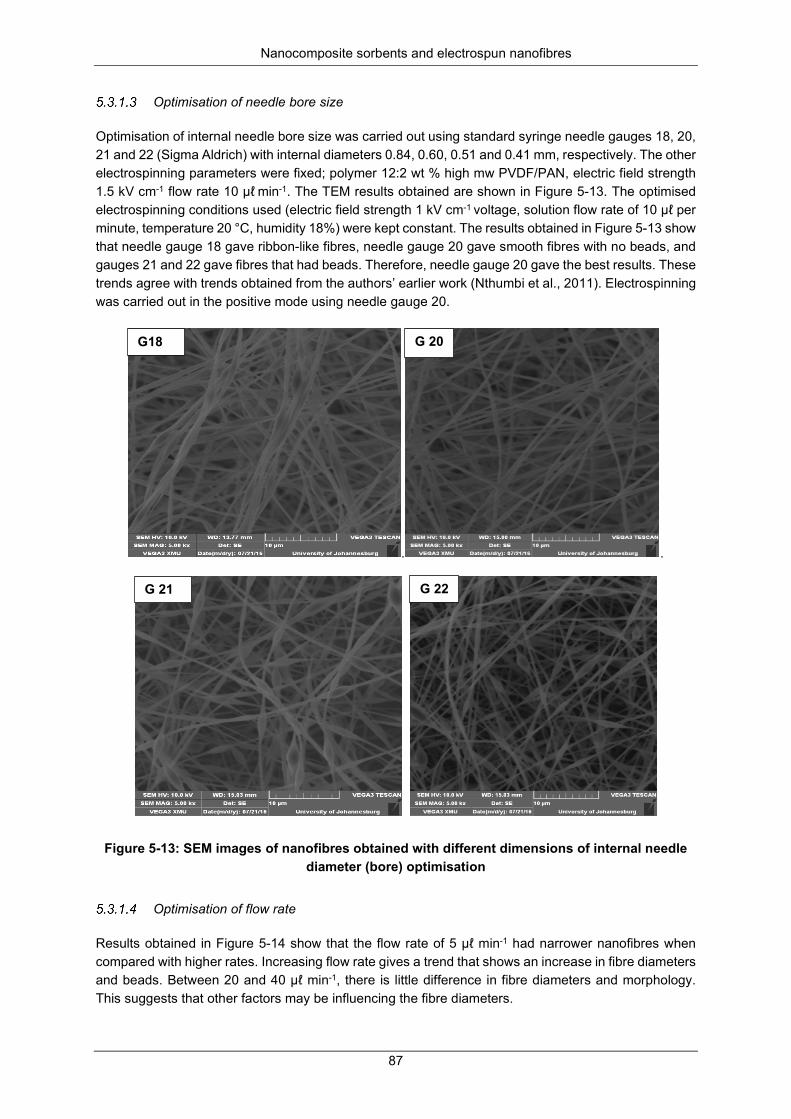
Nanocomposite sorbents and electrospun nanofibres
87
Optimisation of needle bore size
Optimisation of internal needle bore size was carried out using standard syringe needle gauges 18, 20, 21 and 22 (Sigma Aldrich) with internal diameters 0.84, 0.60, 0.51 and 0.41 mm, respectively. The other electrospinning parameters were fixed; polymer 12:2 wt % high mw PVDF/PAN, electric field strength 1.5 kV cm-1 flow rate 10 µℓ min-1. The TEM results obtained are shown in Figure 5-13. The optimised electrospinning conditions used (electric field strength 1 kV cm-1 voltage, solution flow rate of 10 µℓ per minute, temperature 20 °C, humidity 18%) were kept constant. The results obtained in Figure 5-13 show that needle gauge 18 gave ribbon-like fibres, needle gauge 20 gave smooth fibres with no beads, and gauges 21 and 22 gave fibres that had beads. Therefore, needle gauge 20 gave the best results. These trends agree with trends obtained from the authors’ earlier work (Nthumbi et al., 2011). Electrospinning was carried out in the positive mode using needle gauge 20.
. .
Figure 5-13: SEM images of nanofibres obtained with different dimensions of internal needle diameter (bore) optimisation
Optimisation of flow rate
Results obtained in Figure 5-14 show that the flow rate of 5 µℓ min-1 had narrower nanofibres when compared with higher rates. Increasing flow rate gives a trend that shows an increase in fibre diameters and beads. Between 20 and 40 µℓ min-1, there is little difference in fibre diameters and morphology. This suggests that other factors may be influencing the fibre diameters.
G18 G 20
G 21 G 22
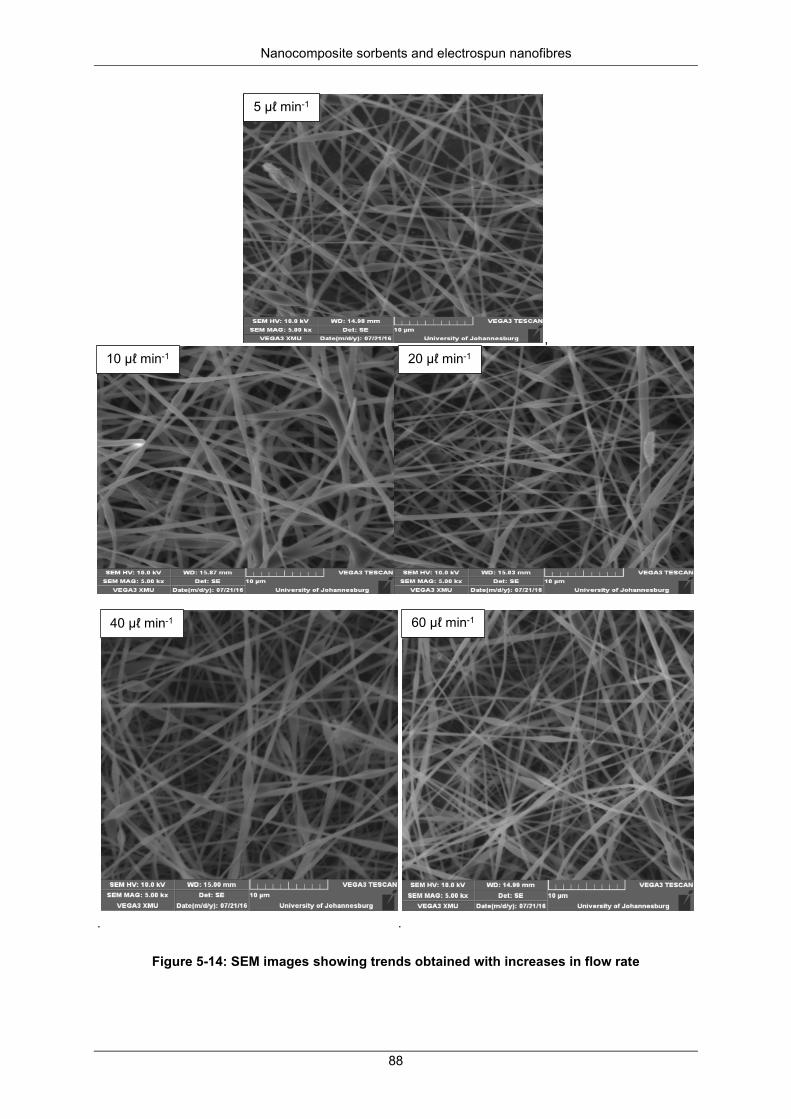
Nanocomposite sorbents and electrospun nanofibres
88
,
. .
Figure 5-14: SEM images showing trends obtained with increases in flow rate
5 µℓ min-1
10 µℓ min-1 20 µℓ min-1
40 µℓ min-1 60 µℓ min-1
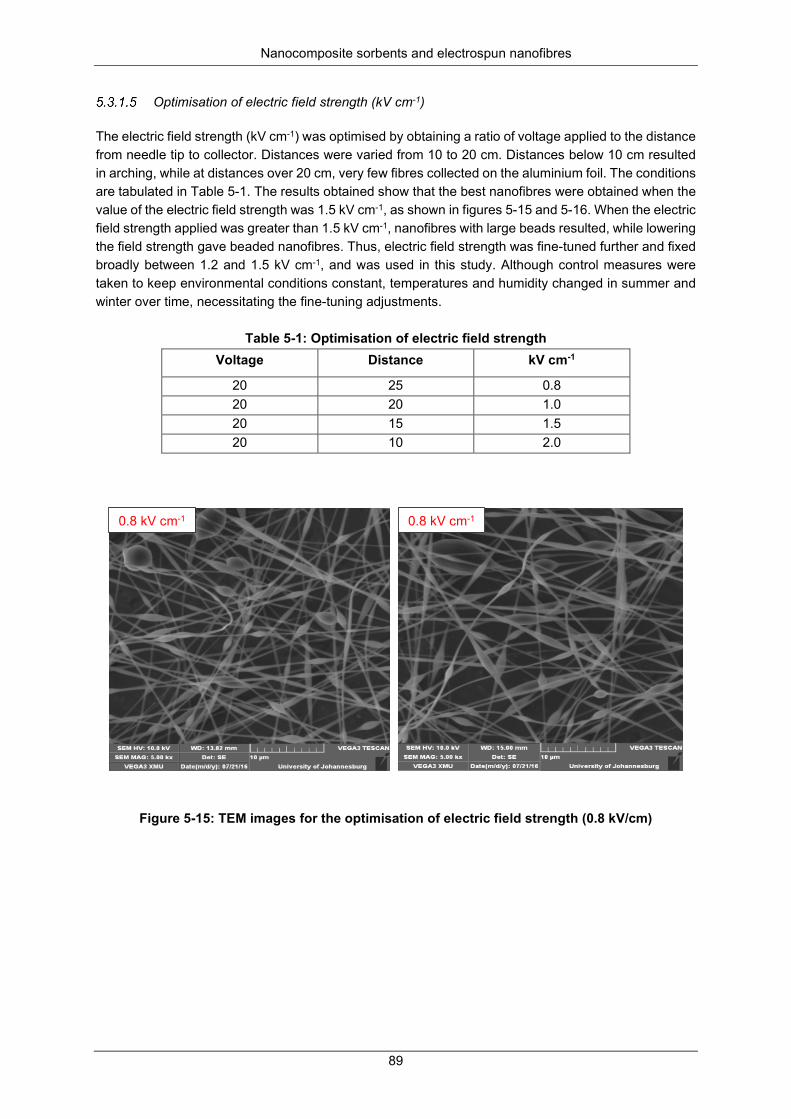
Nanocomposite sorbents and electrospun nanofibres
89
Optimisation of electric field strength (kV cm-1)
The electric field strength (kV cm-1) was optimised by obtaining a ratio of voltage applied to the distance from needle tip to collector. Distances were varied from 10 to 20 cm. Distances below 10 cm resulted in arching, while at distances over 20 cm, very few fibres collected on the aluminium foil. The conditions are tabulated in Table 5-1. The results obtained show that the best nanofibres were obtained when the value of the electric field strength was 1.5 kV cm-1, as shown in figures 5-15 and 5-16. When the electric field strength applied was greater than 1.5 kV cm-1, nanofibres with large beads resulted, while lowering the field strength gave beaded nanofibres. Thus, electric field strength was fine-tuned further and fixed broadly between 1.2 and 1.5 kV cm-1, and was used in this study. Although control measures were taken to keep environmental conditions constant, temperatures and humidity changed in summer and winter over time, necessitating the fine-tuning adjustments.
Table 5-1: Optimisation of electric field strength Voltage Distance kV cm-1
20 25 0.8 20 20 1.0 20 15 1.5 20 10 2.0
Figure 5-15: TEM images for the optimisation of electric field strength (0.8 kV/cm)
0.8 kV cm-1 0.8 kV cm-1
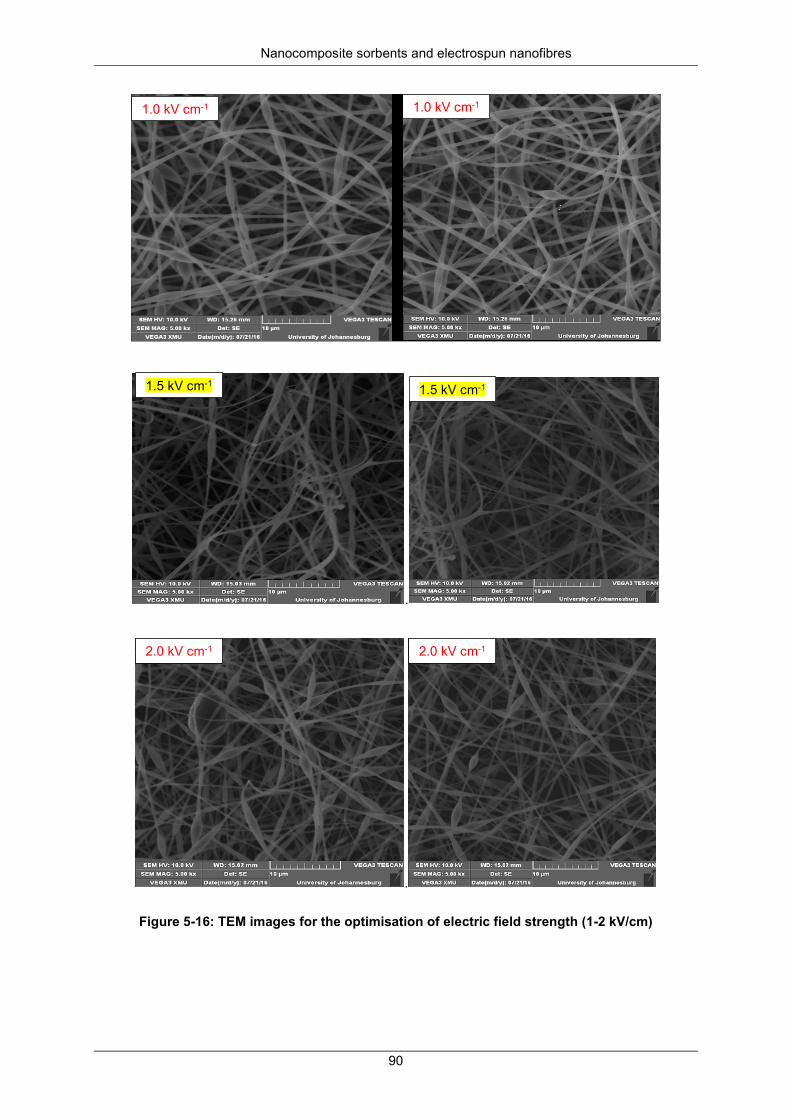
Nanocomposite sorbents and electrospun nanofibres
90
.
.
Figure 5-16: TEM images for the optimisation of electric field strength (1-2 kV/cm)
1.0 kV cm-1 1.0 kV cm-1
1.5 kV cm-1 1.5 kV cm-1
2.0 kV cm-1 2.0 kV cm-1
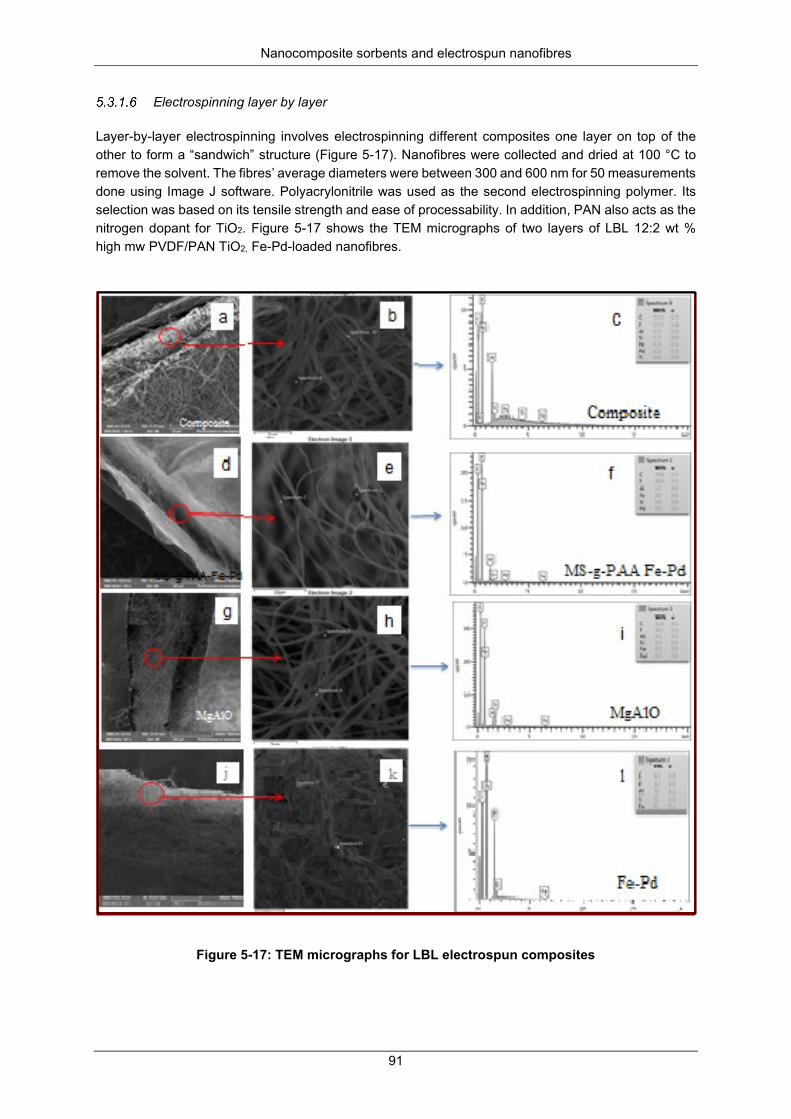
Nanocomposite sorbents and electrospun nanofibres
91
Electrospinning layer by layer
Layer-by-layer electrospinning involves electrospinning different composites one layer on top of the other to form a “sandwich” structure (Figure 5-17). Nanofibres were collected and dried at 100 °C to remove the solvent. The fibres’ average diameters were between 300 and 600 nm for 50 measurements done using Image J software. Polyacrylonitrile was used as the second electrospinning polymer. Its selection was based on its tensile strength and ease of processability. In addition, PAN also acts as the nitrogen dopant for TiO2. Figure 5-17 shows the TEM micrographs of two layers of LBL 12:2 wt % high mw PVDF/PAN TiO2, Fe-Pd-loaded nanofibres.
Figure 5-17: TEM micrographs for LBL electrospun composites
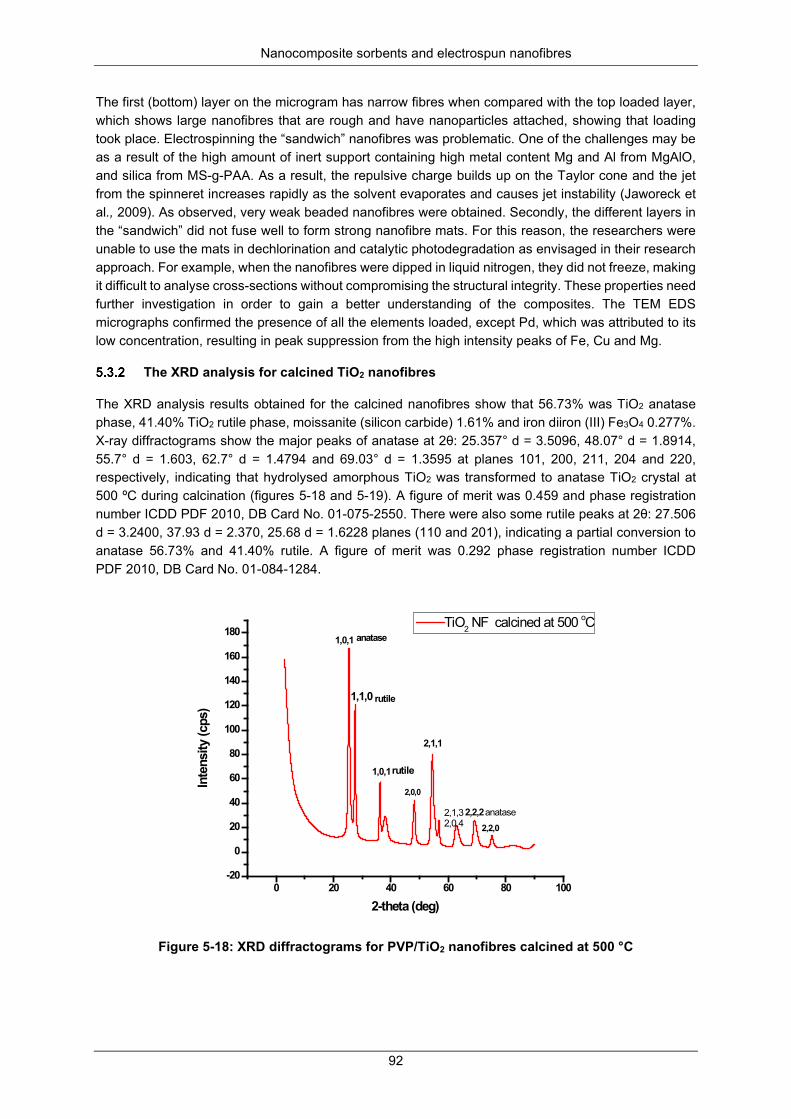
Nanocomposite sorbents and electrospun nanofibres
92
The first (bottom) layer on the microgram has narrow fibres when compared with the top loaded layer, which shows large nanofibres that are rough and have nanoparticles attached, showing that loading took place. Electrospinning the “sandwich” nanofibres was problematic. One of the challenges may be as a result of the high amount of inert support containing high metal content Mg and Al from MgAlO, and silica from MS-g-PAA. As a result, the repulsive charge builds up on the Taylor cone and the jet from the spinneret increases rapidly as the solvent evaporates and causes jet instability (Jaworeck et al., 2009). As observed, very weak beaded nanofibres were obtained. Secondly, the different layers in the “sandwich” did not fuse well to form strong nanofibre mats. For this reason, the researchers were unable to use the mats in dechlorination and catalytic photodegradation as envisaged in their research approach. For example, when the nanofibres were dipped in liquid nitrogen, they did not freeze, making it difficult to analyse cross-sections without compromising the structural integrity. These properties need further investigation in order to gain a better understanding of the composites. The TEM EDS micrographs confirmed the presence of all the elements loaded, except Pd, which was attributed to its low concentration, resulting in peak suppression from the high intensity peaks of Fe, Cu and Mg.
The XRD analysis for calcined TiO2 nanofibres
The XRD analysis results obtained for the calcined nanofibres show that 56.73% was TiO2 anatase phase, 41.40% TiO2 rutile phase, moissanite (silicon carbide) 1.61% and iron diiron (III) Fe3O4 0.277%. X-ray diffractograms show the major peaks of anatase at 2θ: 25.357° d = 3.5096, 48.07° d = 1.8914, 55.7° d = 1.603, 62.7° d = 1.4794 and 69.03° d = 1.3595 at planes 101, 200, 211, 204 and 220, respectively, indicating that hydrolysed amorphous TiO2 was transformed to anatase TiO2 crystal at 500 ºC during calcination (figures 5-18 and 5-19). A figure of merit was 0.459 and phase registration number ICDD PDF 2010, DB Card No. 01-075-2550. There were also some rutile peaks at 2θ: 27.506 d = 3.2400, 37.93 d = 2.370, 25.68 d = 1.6228 planes (110 and 201), indicating a partial conversion to anatase 56.73% and 41.40% rutile. A figure of merit was 0.292 phase registration number ICDD PDF 2010, DB Card No. 01-084-1284.
Figure 5-18: XRD diffractograms for PVP/TiO2 nanofibres calcined at 500 °C
0 20 40 60 80 100-20
0
20
40
60
80
100
120
140
160
180
Inte
nsity
(cps
)
2-theta (deg)
TiO2 NF calcined at 500 oC1,0,1
1,1,0
1,0,1
2,0,0
anatase
rutile
rutile
2,1,1
2,2,2anatase2,1,32,0,4 2,2,0
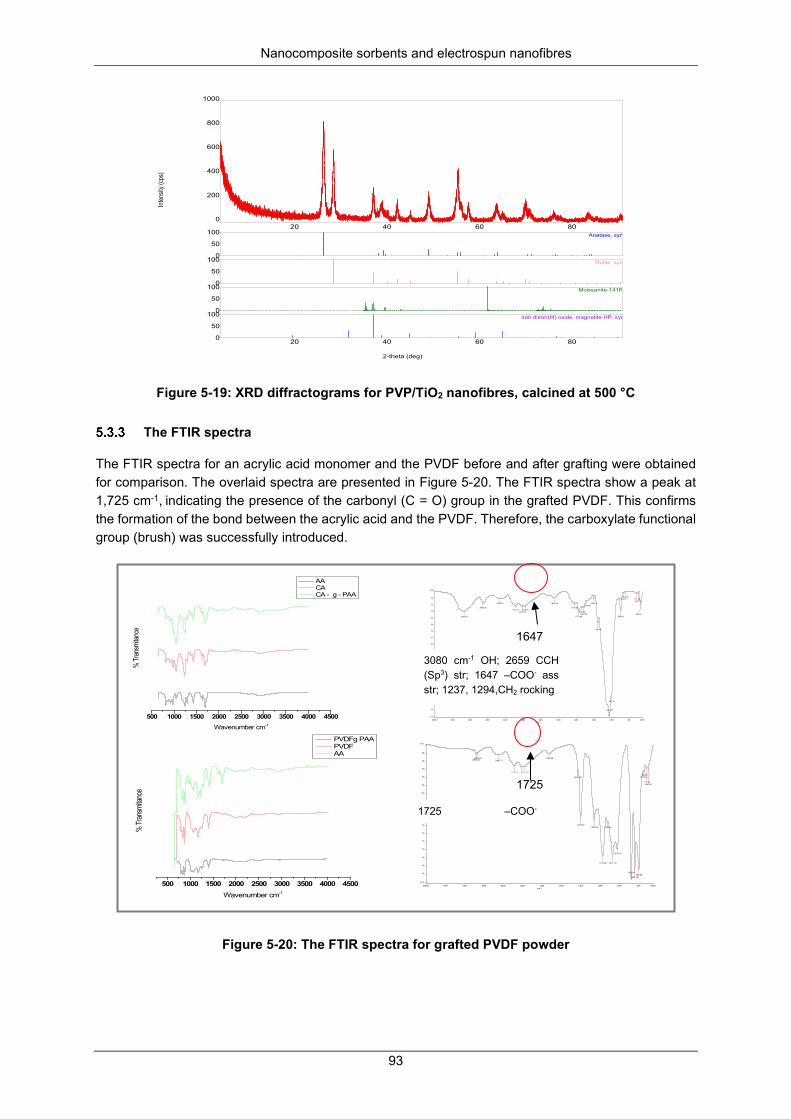
Nanocomposite sorbents and electrospun nanofibres
93
Figure 5-19: XRD diffractograms for PVP/TiO2 nanofibres, calcined at 500 °C
The FTIR spectra
The FTIR spectra for an acrylic acid monomer and the PVDF before and after grafting were obtained for comparison. The overlaid spectra are presented in Figure 5-20. The FTIR spectra show a peak at 1,725 cm-1, indicating the presence of the carbonyl (C = O) group in the grafted PVDF. This confirms the formation of the bond between the acrylic acid and the PVDF. Therefore, the carboxylate functional group (brush) was successfully introduced.
Figure 5-20: The FTIR spectra for grafted PVDF powder
20 40 60 80 0
200
400
600
800
1000
0
50
100 Anatase, syn
0
50
100 Rutile, syn
0
50
100 Moissanite-141R
20 40 60 80 0
50
100 iron diiron(III) oxide, magnetite HP, syn
2-theta (deg)
Inten
sity (
cps)
500 1000 1500 2000 2500 3000 3500 4000 4500
% Tr
ansm
itanc
e
Wavenumber cm-1
AA CA CA - g - PAA
4000.0 3600 3200 2800 2400 2000 1800 1600 1400 1200 1000 800 650.057.8
60
62
64
66
68
70
72
74
76
78
80
82
84
86
88
90
92
94
96.4
cm-1
%T
3335.76
2909.09
2525.27
2161.012010.78
1978.29
1647.39
1416.48
1371.42
1335.261315.78
1278.661200.14
1156.46
1022.77
997.61
895.46
863.35841.40
711.43697.70
669.24
500 1000 1500 2000 2500 3000 3500 4000 4500
% Tr
ansm
itanc
e
Wavenumber cm-1
PVDFg PAA PVDF AA
4000.0 3600 3200 2800 2400 2000 1800 1600 1400 1200 1000 800 650.061.8
64
66
68
70
72
74
76
78
80
82
84
86
88
90
92
94
96.3
cm-1
%T
2962.632928.03
2490.71
2161.652023.79
1977.64
1725.08
1430.60
1400.621259.23
1173.08
1125.84
1071.18
1019.70
876.64
839.78798.69
753.93743.45
717.93699.20
1647
1725
3080 cm-1 OH; 2659 CCH (Sp3) str; 1647 –COO- ass str; 1237, 1294,CH2 rocking
1725 –COO-
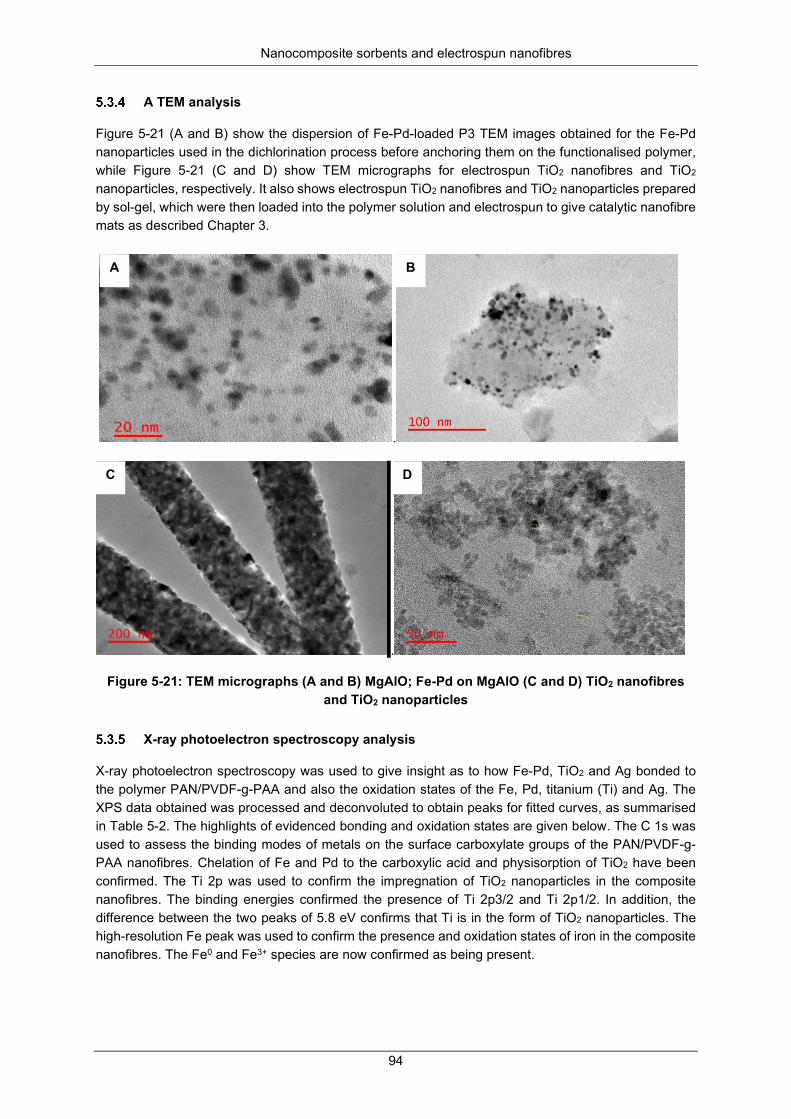
Nanocomposite sorbents and electrospun nanofibres
94
A TEM analysis
Figure 5-21 (A and B) show the dispersion of Fe-Pd-loaded P3 TEM images obtained for the Fe-Pd nanoparticles used in the dichlorination process before anchoring them on the functionalised polymer, while Figure 5-21 (C and D) show TEM micrographs for electrospun TiO2 nanofibres and TiO2 nanoparticles, respectively. It also shows electrospun TiO2 nanofibres and TiO2 nanoparticles prepared by sol-gel, which were then loaded into the polymer solution and electrospun to give catalytic nanofibre mats as described Chapter 3.
.
.
Figure 5-21: TEM micrographs (A and B) MgAlO; Fe-Pd on MgAlO (C and D) TiO2 nanofibres and TiO2 nanoparticles
X-ray photoelectron spectroscopy analysis
X-ray photoelectron spectroscopy was used to give insight as to how Fe-Pd, TiO2 and Ag bonded to the polymer PAN/PVDF-g-PAA and also the oxidation states of the Fe, Pd, titanium (Ti) and Ag. The XPS data obtained was processed and deconvoluted to obtain peaks for fitted curves, as summarised in Table 5-2. The highlights of evidenced bonding and oxidation states are given below. The C 1s was used to assess the binding modes of metals on the surface carboxylate groups of the PAN/PVDF-g-PAA nanofibres. Chelation of Fe and Pd to the carboxylic acid and physisorption of TiO2 have been confirmed. The Ti 2p was used to confirm the impregnation of TiO2 nanoparticles in the composite nanofibres. The binding energies confirmed the presence of Ti 2p3/2 and Ti 2p1/2. In addition, the difference between the two peaks of 5.8 eV confirms that Ti is in the form of TiO2 nanoparticles. The high-resolution Fe peak was used to confirm the presence and oxidation states of iron in the composite nanofibres. The Fe0 and Fe3+ species are now confirmed as being present.
A
C D
B
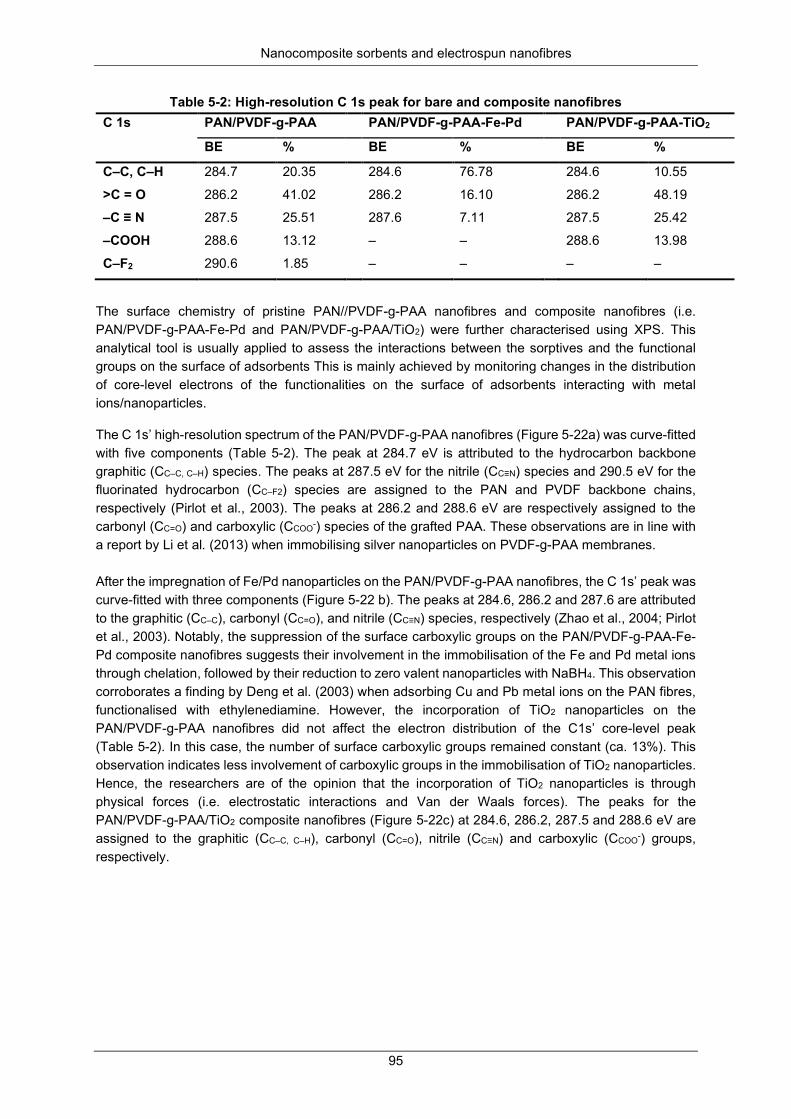
Nanocomposite sorbents and electrospun nanofibres
95
Table 5-2: High-resolution C 1s peak for bare and composite nanofibres C 1s PAN/PVDF-g-PAA PAN/PVDF-g-PAA-Fe-Pd PAN/PVDF-g-PAA-TiO2
BE % BE % BE %
C–C, C–H 284.7 20.35 284.6 76.78 284.6 10.55
>C = O 286.2 41.02 286.2 16.10 286.2 48.19
–C ≡ N 287.5 25.51 287.6 7.11 287.5 25.42
–COOH 288.6 13.12 – – 288.6 13.98
C–F2 290.6 1.85 – – – –
The surface chemistry of pristine PAN//PVDF-g-PAA nanofibres and composite nanofibres (i.e. PAN/PVDF-g-PAA-Fe-Pd and PAN/PVDF-g-PAA/TiO2) were further characterised using XPS. This analytical tool is usually applied to assess the interactions between the sorptives and the functional groups on the surface of adsorbents This is mainly achieved by monitoring changes in the distribution of core-level electrons of the functionalities on the surface of adsorbents interacting with metal ions/nanoparticles.
The C 1s’ high-resolution spectrum of the PAN/PVDF-g-PAA nanofibres (Figure 5-22a) was curve-fitted with five components (Table 5-2). The peak at 284.7 eV is attributed to the hydrocarbon backbone graphitic (CC–C, C–H) species. The peaks at 287.5 eV for the nitrile (CC≡N) species and 290.5 eV for the fluorinated hydrocarbon (CC–F2) species are assigned to the PAN and PVDF backbone chains, respectively (Pirlot et al., 2003). The peaks at 286.2 and 288.6 eV are respectively assigned to the carbonyl (CC=O) and carboxylic (CCOO-) species of the grafted PAA. These observations are in line with a report by Li et al. (2013) when immobilising silver nanoparticles on PVDF-g-PAA membranes. After the impregnation of Fe/Pd nanoparticles on the PAN/PVDF-g-PAA nanofibres, the C 1s’ peak was curve-fitted with three components (Figure 5-22 b). The peaks at 284.6, 286.2 and 287.6 are attributed to the graphitic (CC–C), carbonyl (CC=O), and nitrile (CC≡N) species, respectively (Zhao et al., 2004; Pirlot et al., 2003). Notably, the suppression of the surface carboxylic groups on the PAN/PVDF-g-PAA-Fe-Pd composite nanofibres suggests their involvement in the immobilisation of the Fe and Pd metal ions through chelation, followed by their reduction to zero valent nanoparticles with NaBH4. This observation corroborates a finding by Deng et al. (2003) when adsorbing Cu and Pb metal ions on the PAN fibres, functionalised with ethylenediamine. However, the incorporation of TiO2 nanoparticles on the PAN/PVDF-g-PAA nanofibres did not affect the electron distribution of the C1s’ core-level peak (Table 5-2). In this case, the number of surface carboxylic groups remained constant (ca. 13%). This observation indicates less involvement of carboxylic groups in the immobilisation of TiO2 nanoparticles. Hence, the researchers are of the opinion that the incorporation of TiO2 nanoparticles is through physical forces (i.e. electrostatic interactions and Van der Waals forces). The peaks for the PAN/PVDF-g-PAA/TiO2 composite nanofibres (Figure 5-22c) at 284.6, 286.2, 287.5 and 288.6 eV are assigned to the graphitic (CC–C, C–H), carbonyl (CC=O), nitrile (CC≡N) and carboxylic (CCOO-) groups, respectively.
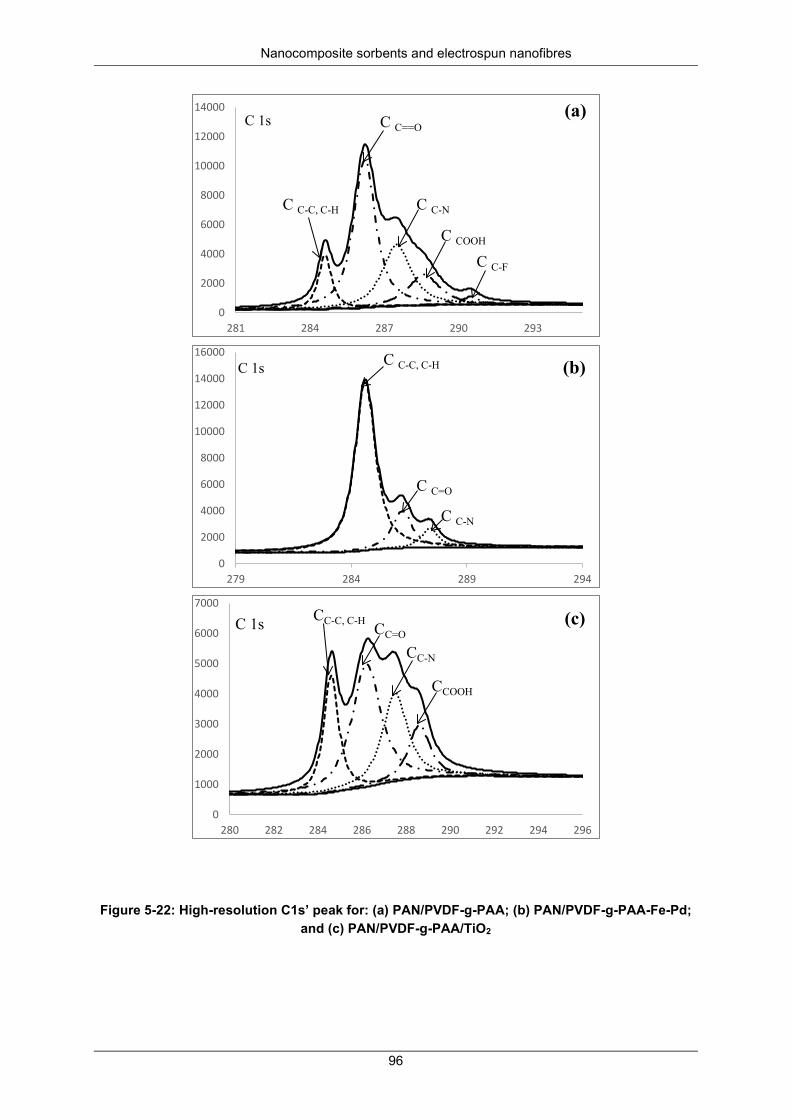
Nanocomposite sorbents and electrospun nanofibres
96
Figure 5-22: High-resolution C1s’ peak for: (a) PAN/PVDF-g-PAA; (b) PAN/PVDF-g-PAA-Fe-Pd;
and (c) PAN/PVDF-g-PAA/TiO2
0
2000
4000
6000
8000
10000
12000
14000
281 284 287 290 293
C 1s (a)
C C-C, C-H
C C==O
C C-N
C COOH
C C-F
0
2000
4000
6000
8000
10000
12000
14000
16000
279 284 289 294
C 1s (b)C C-C, C-H
C C=O
C C-N
0
1000
2000
3000
4000
5000
6000
7000
280 282 284 286 288 290 292 294 296
C 1s (c)CC-C, C-H CC=O
CC-N
CCOOH
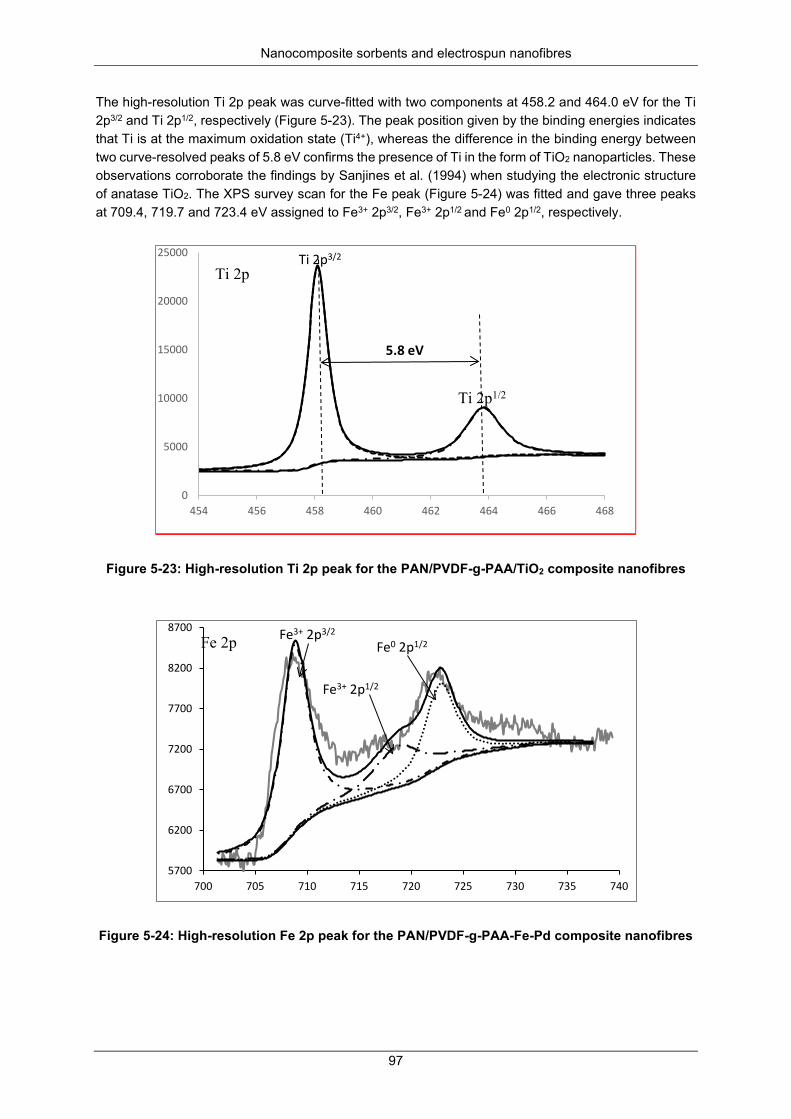
Nanocomposite sorbents and electrospun nanofibres
97
The high-resolution Ti 2p peak was curve-fitted with two components at 458.2 and 464.0 eV for the Ti 2p3/2 and Ti 2p1/2, respectively (Figure 5-23). The peak position given by the binding energies indicates that Ti is at the maximum oxidation state (Ti4+), whereas the difference in the binding energy between two curve-resolved peaks of 5.8 eV confirms the presence of Ti in the form of TiO2 nanoparticles. These observations corroborate the findings by Sanjines et al. (1994) when studying the electronic structure of anatase TiO2. The XPS survey scan for the Fe peak (Figure 5-24) was fitted and gave three peaks at 709.4, 719.7 and 723.4 eV assigned to Fe3+ 2p3/2, Fe3+ 2p1/2 and Fe0 2p1/2, respectively.
Figure 5-23: High-resolution Ti 2p peak for the PAN/PVDF-g-PAA/TiO2 composite nanofibres
Figure 5-24: High-resolution Fe 2p peak for the PAN/PVDF-g-PAA-Fe-Pd composite nanofibres
0
5000
10000
15000
20000
25000
454 456 458 460 462 464 466 468
Ti 2pTi 2p3/2
Ti 2p1/2
5.8 eV
5700
6200
6700
7200
7700
8200
8700
700 705 710 715 720 725 730 735 740
Fe 2p Fe3+ 2p3/2
Fe0 2p1/2
Fe3+ 2p1/2
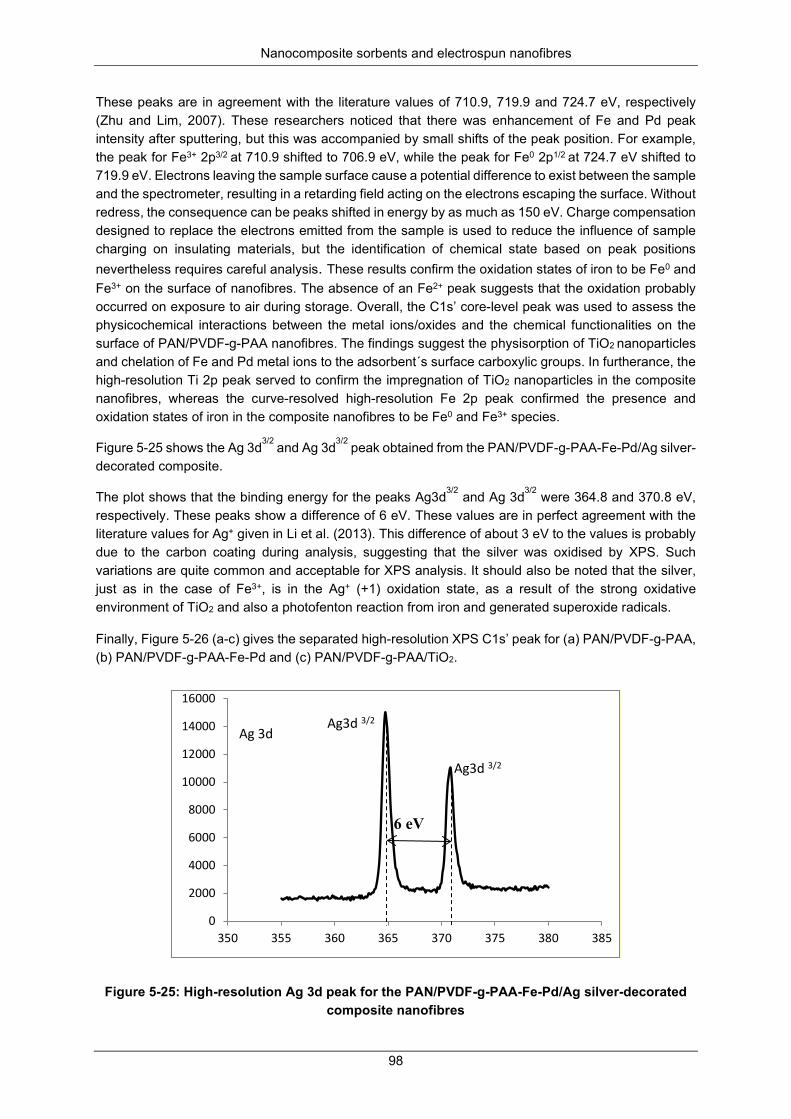
Nanocomposite sorbents and electrospun nanofibres
98
These peaks are in agreement with the literature values of 710.9, 719.9 and 724.7 eV, respectively (Zhu and Lim, 2007). These researchers noticed that there was enhancement of Fe and Pd peak intensity after sputtering, but this was accompanied by small shifts of the peak position. For example, the peak for Fe3+ 2p3/2 at 710.9 shifted to 706.9 eV, while the peak for Fe0 2p1/2 at 724.7 eV shifted to 719.9 eV. Electrons leaving the sample surface cause a potential difference to exist between the sample and the spectrometer, resulting in a retarding field acting on the electrons escaping the surface. Without redress, the consequence can be peaks shifted in energy by as much as 150 eV. Charge compensation designed to replace the electrons emitted from the sample is used to reduce the influence of sample charging on insulating materials, but the identification of chemical state based on peak positions nevertheless requires careful analysis. These results confirm the oxidation states of iron to be Fe0 and Fe3+ on the surface of nanofibres. The absence of an Fe2+ peak suggests that the oxidation probably occurred on exposure to air during storage. Overall, the C1s’ core-level peak was used to assess the physicochemical interactions between the metal ions/oxides and the chemical functionalities on the surface of PAN/PVDF-g-PAA nanofibres. The findings suggest the physisorption of TiO2 nanoparticles and chelation of Fe and Pd metal ions to the adsorbent´s surface carboxylic groups. In furtherance, the high-resolution Ti 2p peak served to confirm the impregnation of TiO2 nanoparticles in the composite nanofibres, whereas the curve-resolved high-resolution Fe 2p peak confirmed the presence and oxidation states of iron in the composite nanofibres to be Fe0 and Fe3+ species.
Figure 5-25 shows the Ag 3d3/2 and Ag 3d3/2 peak obtained from the PAN/PVDF-g-PAA-Fe-Pd/Ag silver-decorated composite.
The plot shows that the binding energy for the peaks Ag3d3/2 and Ag 3d3/2 were 364.8 and 370.8 eV, respectively. These peaks show a difference of 6 eV. These values are in perfect agreement with the literature values for Ag+ given in Li et al. (2013). This difference of about 3 eV to the values is probably due to the carbon coating during analysis, suggesting that the silver was oxidised by XPS. Such variations are quite common and acceptable for XPS analysis. It should also be noted that the silver, just as in the case of Fe3+, is in the Ag+ (+1) oxidation state, as a result of the strong oxidative environment of TiO2 and also a photofenton reaction from iron and generated superoxide radicals.
Finally, Figure 5-26 (a-c) gives the separated high-resolution XPS C1s’ peak for (a) PAN/PVDF-g-PAA, (b) PAN/PVDF-g-PAA-Fe-Pd and (c) PAN/PVDF-g-PAA/TiO2.
Figure 5-25: High-resolution Ag 3d peak for the PAN/PVDF-g-PAA-Fe-Pd/Ag silver-decorated composite nanofibres
0
2000
4000
6000
8000
10000
12000
14000
16000
350 355 360 365 370 375 380 385
Ag 3d
6 eV
Ag3d 3/2
Ag3d 3/2
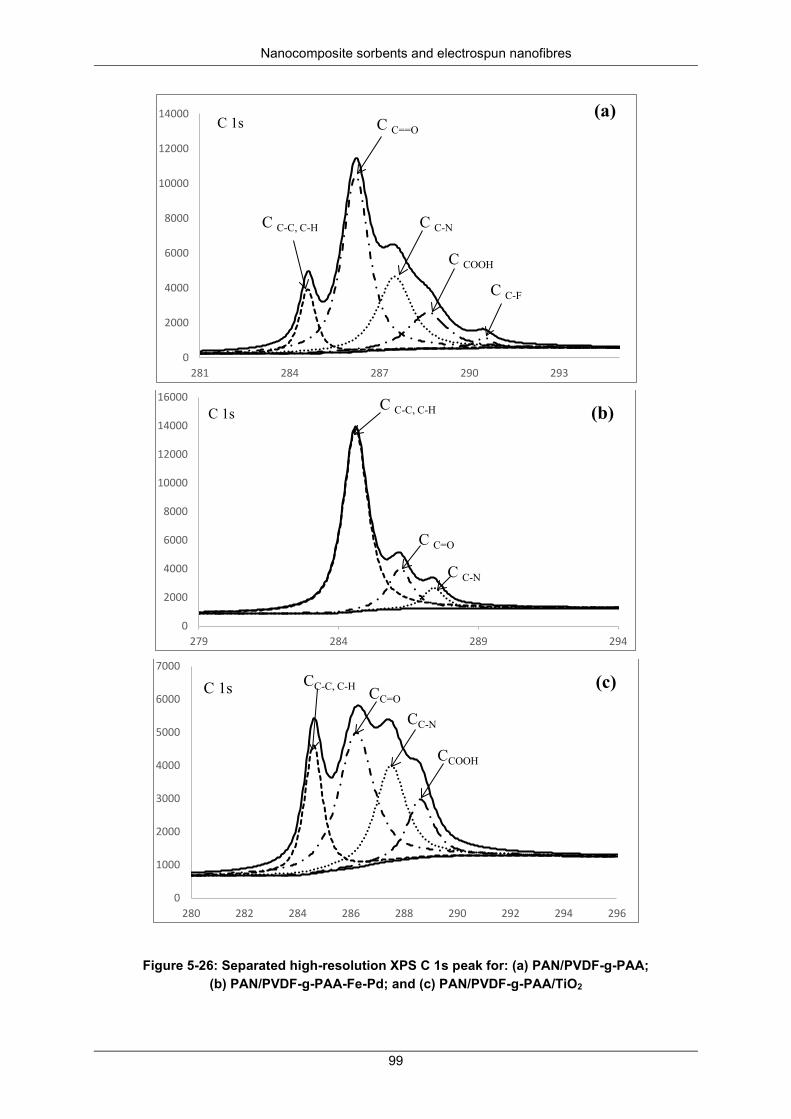
Nanocomposite sorbents and electrospun nanofibres
99
Figure 5-26: Separated high-resolution XPS C 1s peak for: (a) PAN/PVDF-g-PAA; (b) PAN/PVDF-g-PAA-Fe-Pd; and (c) PAN/PVDF-g-PAA/TiO2
0
2000
4000
6000
8000
10000
12000
14000
281 284 287 290 293
C 1s(a)
C C-C, C-H
C C==O
C C-N
C COOH
C C-F
0
2000
4000
6000
8000
10000
12000
14000
16000
279 284 289 294
C 1s (b)C C-C, C-H
C C=O
C C-N
0
1000
2000
3000
4000
5000
6000
7000
280 282 284 286 288 290 292 294 296
C 1s (c)CC-C, C-H CC=O
CC-N
CCOOH
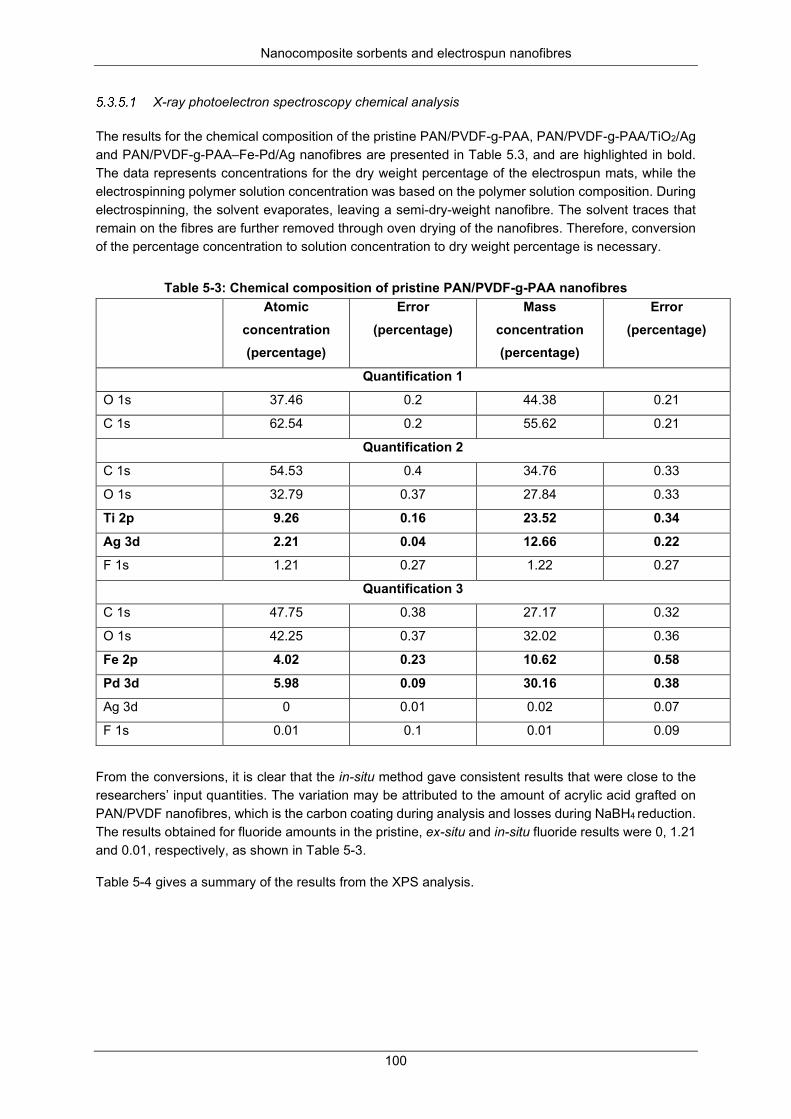
Nanocomposite sorbents and electrospun nanofibres
100
X-ray photoelectron spectroscopy chemical analysis
The results for the chemical composition of the pristine PAN/PVDF-g-PAA, PAN/PVDF-g-PAA/TiO2/Ag and PAN/PVDF-g-PAA–Fe-Pd/Ag nanofibres are presented in Table 5.3, and are highlighted in bold. The data represents concentrations for the dry weight percentage of the electrospun mats, while the electrospinning polymer solution concentration was based on the polymer solution composition. During electrospinning, the solvent evaporates, leaving a semi-dry-weight nanofibre. The solvent traces that remain on the fibres are further removed through oven drying of the nanofibres. Therefore, conversion of the percentage concentration to solution concentration to dry weight percentage is necessary.
Table 5-3: Chemical composition of pristine PAN/PVDF-g-PAA nanofibres Atomic
concentration (percentage)
Error (percentage)
Mass concentration (percentage)
Error (percentage)
Quantification 1
O 1s 37.46 0.2 44.38 0.21
C 1s 62.54 0.2 55.62 0.21
Quantification 2
C 1s 54.53 0.4 34.76 0.33
O 1s 32.79 0.37 27.84 0.33
Ti 2p 9.26 0.16 23.52 0.34 Ag 3d 2.21 0.04 12.66 0.22 F 1s 1.21 0.27 1.22 0.27
Quantification 3
C 1s 47.75 0.38 27.17 0.32
O 1s 42.25 0.37 32.02 0.36
Fe 2p 4.02 0.23 10.62 0.58 Pd 3d 5.98 0.09 30.16 0.38 Ag 3d 0 0.01 0.02 0.07
F 1s 0.01 0.1 0.01 0.09
From the conversions, it is clear that the in-situ method gave consistent results that were close to the researchers’ input quantities. The variation may be attributed to the amount of acrylic acid grafted on PAN/PVDF nanofibres, which is the carbon coating during analysis and losses during NaBH4 reduction. The results obtained for fluoride amounts in the pristine, ex-situ and in-situ fluoride results were 0, 1.21 and 0.01, respectively, as shown in Table 5-3.
Table 5-4 gives a summary of the results from the XPS analysis.
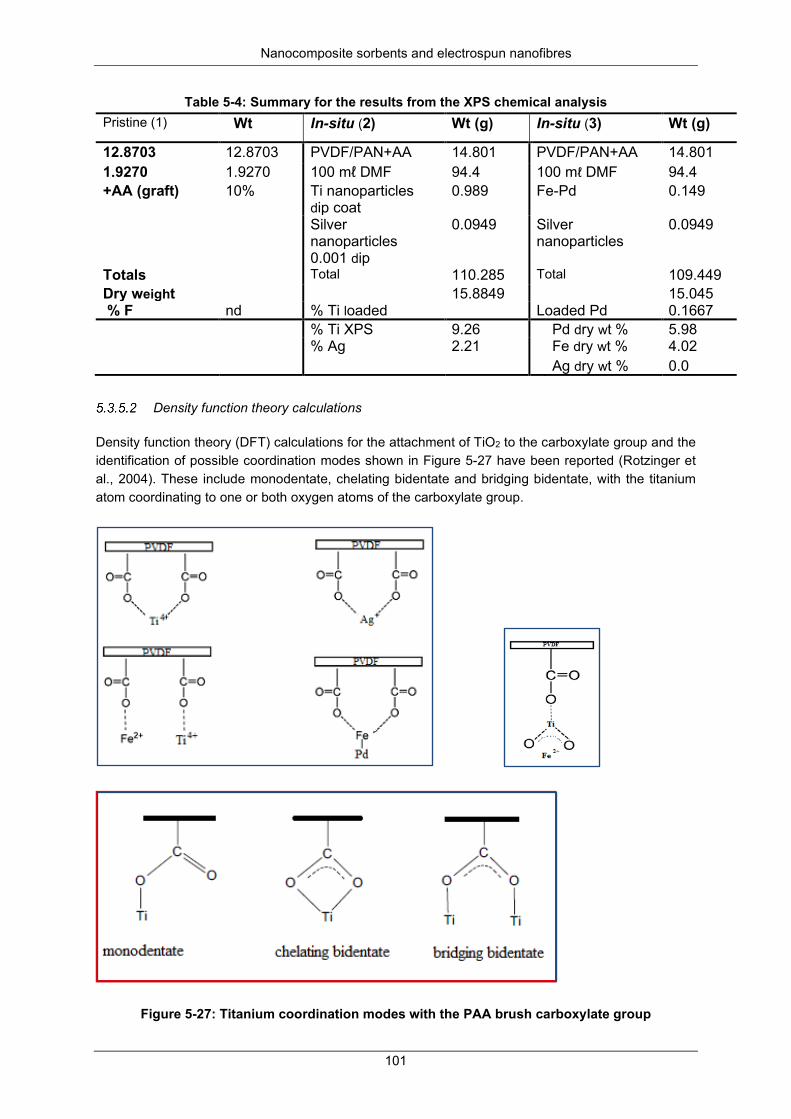
Nanocomposite sorbents and electrospun nanofibres
101
Table 5-4: Summary for the results from the XPS chemical analysis Pristine (1) Wt In-situ (2) Wt (g) In-situ (3) Wt (g)
12.8703 12.8703 PVDF/PAN+AA 14.801 PVDF/PAN+AA 14.801 1.9270 1.9270 100 mℓ DMF 94.4 100 mℓ DMF 94.4 +AA (graft) 10% Ti nanoparticles
dip coat 0.989 Fe-Pd 0.149
Silver nanoparticles 0.001 dip
0.0949 Silver nanoparticles
0.0949
Totals Total 110.285 Total 109.449 Dry weight 15.8849 15.045 % F nd % Ti loaded Loaded Pd 0.1667 % Ti XPS 9.26 Pd dry wt % 5.98 % Ag 2.21 Fe dry wt % 4.02 Ag dry wt % 0.0
Density function theory calculations
Density function theory (DFT) calculations for the attachment of TiO2 to the carboxylate group and the identification of possible coordination modes shown in Figure 5-27 have been reported (Rotzinger et al., 2004). These include monodentate, chelating bidentate and bridging bidentate, with the titanium atom coordinating to one or both oxygen atoms of the carboxylate group.
Figure 5-27: Titanium coordination modes with the PAA brush carboxylate group
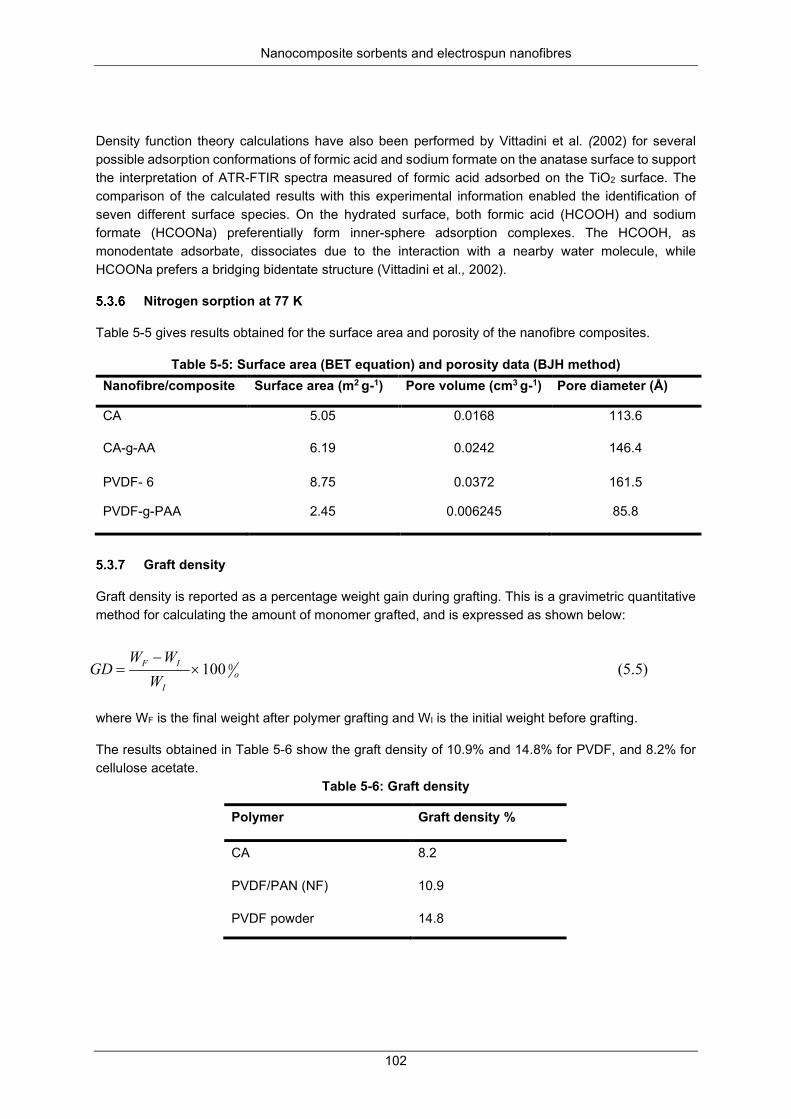
Nanocomposite sorbents and electrospun nanofibres
102
Density function theory calculations have also been performed by Vittadini et al. (2002) for several possible adsorption conformations of formic acid and sodium formate on the anatase surface to support the interpretation of ATR-FTIR spectra measured of formic acid adsorbed on the TiO2 surface. The comparison of the calculated results with this experimental information enabled the identification of seven different surface species. On the hydrated surface, both formic acid (HCOOH) and sodium formate (HCOONa) preferentially form inner-sphere adsorption complexes. The HCOOH, as monodentate adsorbate, dissociates due to the interaction with a nearby water molecule, while HCOONa prefers a bridging bidentate structure (Vittadini et al., 2002).
Nitrogen sorption at 77 K
Table 5-5 gives results obtained for the surface area and porosity of the nanofibre composites.
Table 5-5: Surface area (BET equation) and porosity data (BJH method) Nanofibre/composite Surface area (m2 g-1) Pore volume (cm3 g-1) Pore diameter (Å)
CA 5.05 0.0168 113.6
CA-g-AA 6.19 0.0242 146.4
PVDF- 6 8.75 0.0372 161.5
PVDF-g-PAA 2.45 0.006245 85.8
Graft density
Graft density is reported as a percentage weight gain during grafting. This is a gravimetric quantitative method for calculating the amount of monomer grafted, and is expressed as shown below:
where WF is the final weight after polymer grafting and WI is the initial weight before grafting.
The results obtained in Table 5-6 show the graft density of 10.9% and 14.8% for PVDF, and 8.2% for cellulose acetate.
Table 5-6: Graft density
Polymer Graft density %
CA 8.2
PVDF/PAN (NF) 10.9
PVDF powder 14.8
)5.5(100 0o
I
IF
WWW
GD ×−
=
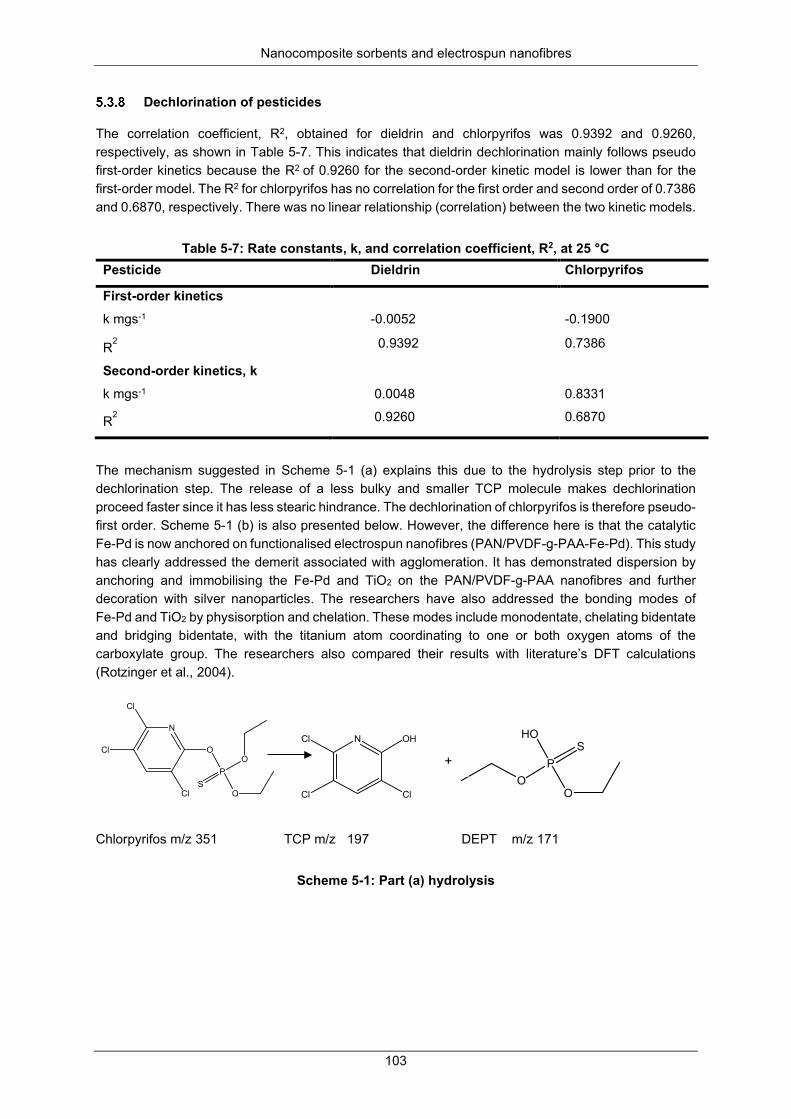
Nanocomposite sorbents and electrospun nanofibres
103
Dechlorination of pesticides
The correlation coefficient, R2, obtained for dieldrin and chlorpyrifos was 0.9392 and 0.9260, respectively, as shown in Table 5-7. This indicates that dieldrin dechlorination mainly follows pseudo first-order kinetics because the R2 of 0.9260 for the second-order kinetic model is lower than for the first-order model. The R2 for chlorpyrifos has no correlation for the first order and second order of 0.7386 and 0.6870, respectively. There was no linear relationship (correlation) between the two kinetic models.
Table 5-7: Rate constants, k, and correlation coefficient, R2, at 25 °C Pesticide Dieldrin Chlorpyrifos
First-order kinetics k mgs-1 -0.0052 -0.1900
R2 0.9392 0.7386
Second-order kinetics, k k mgs-1 0.0048 0.8331
R2 0.9260 0.6870
The mechanism suggested in Scheme 5-1 (a) explains this due to the hydrolysis step prior to the dechlorination step. The release of a less bulky and smaller TCP molecule makes dechlorination proceed faster since it has less stearic hindrance. The dechlorination of chlorpyrifos is therefore pseudo-first order. Scheme 5-1 (b) is also presented below. However, the difference here is that the catalytic Fe-Pd is now anchored on functionalised electrospun nanofibres (PAN/PVDF-g-PAA-Fe-Pd). This study has clearly addressed the demerit associated with agglomeration. It has demonstrated dispersion by anchoring and immobilising the Fe-Pd and TiO2 on the PAN/PVDF-g-PAA nanofibres and further decoration with silver nanoparticles. The researchers have also addressed the bonding modes of Fe-Pd and TiO2 by physisorption and chelation. These modes include monodentate, chelating bidentate and bridging bidentate, with the titanium atom coordinating to one or both oxygen atoms of the carboxylate group. The researchers also compared their results with literature’s DFT calculations (Rotzinger et al., 2004).
Chlorpyrifos m/z 351 TCP m/z 197 DEPT m/z 171
Scheme 5-1: Part (a) hydrolysis
PO
O
O
S
N
Cl
Cl
Cl
N OHCl
Cl Cl
P
OO
HOS
+
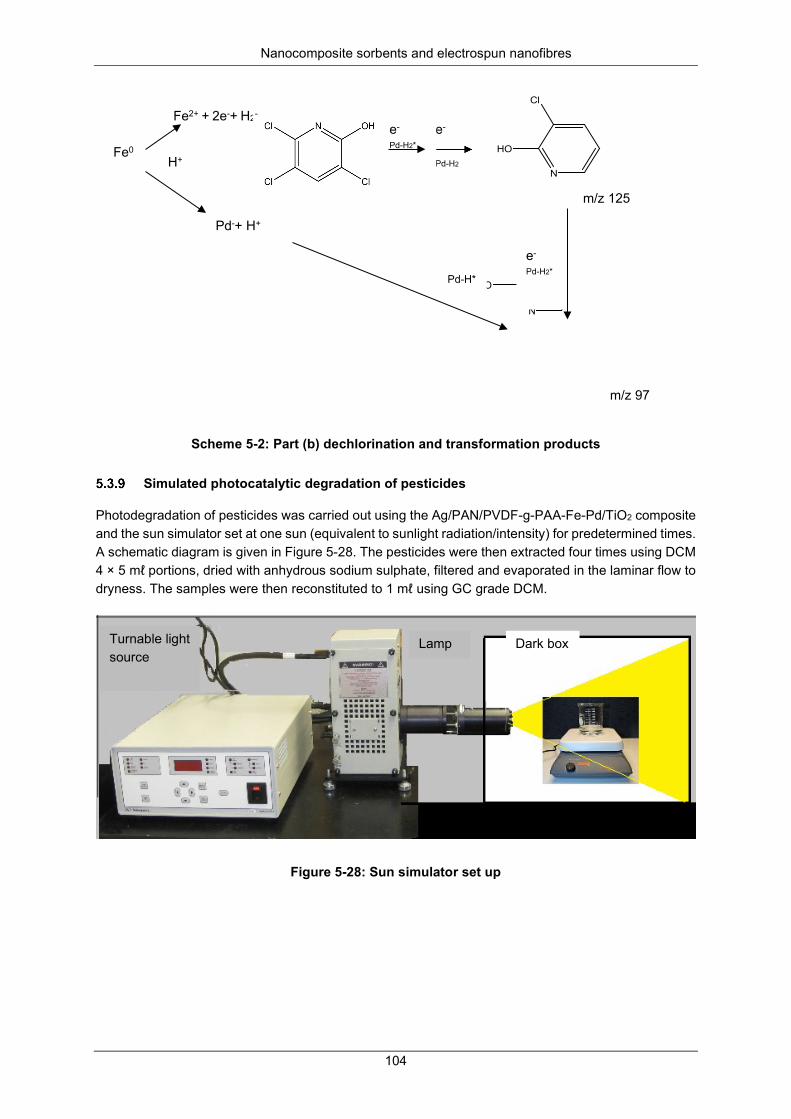
Nanocomposite sorbents and electrospun nanofibres
104
Scheme 5-2: Part (b) dechlorination and transformation products
Simulated photocatalytic degradation of pesticides
Photodegradation of pesticides was carried out using the Ag/PAN/PVDF-g-PAA-Fe-Pd/TiO2 composite and the sun simulator set at one sun (equivalent to sunlight radiation/intensity) for predetermined times. A schematic diagram is given in Figure 5-28. The pesticides were then extracted four times using DCM 4 × 5 mℓ portions, dried with anhydrous sodium sulphate, filtered and evaporated in the laminar flow to dryness. The samples were then reconstituted to 1 mℓ using GC grade DCM.
Figure 5-28: Sun simulator set up
N
HO
Cl
N
HO
m/z 97
e-
Pd-H2
Fe0
Fe2+ + 2e-+ H2-
Pd-+ H+
H+
e-
Pd-H2*
e-
Pd-H2*
Pd-H*
m/z 125
Turnable light source
Lamp Dark box
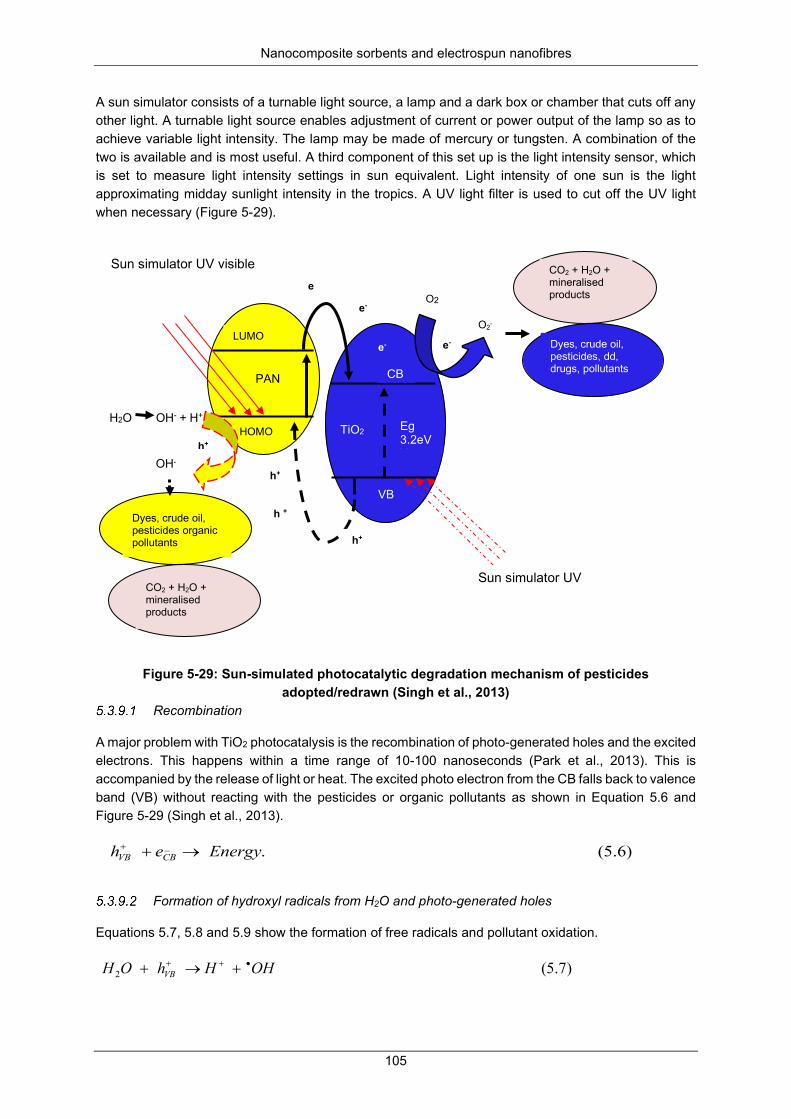
Nanocomposite sorbents and electrospun nanofibres
105
A sun simulator consists of a turnable light source, a lamp and a dark box or chamber that cuts off any other light. A turnable light source enables adjustment of current or power output of the lamp so as to achieve variable light intensity. The lamp may be made of mercury or tungsten. A combination of the two is available and is most useful. A third component of this set up is the light intensity sensor, which is set to measure light intensity settings in sun equivalent. Light intensity of one sun is the light approximating midday sunlight intensity in the tropics. A UV light filter is used to cut off the UV light when necessary (Figure 5-29).
Figure 5-29: Sun-simulated photocatalytic degradation mechanism of pesticides adopted/redrawn (Singh et al., 2013)
Recombination
A major problem with TiO2 photocatalysis is the recombination of photo-generated holes and the excited electrons. This happens within a time range of 10-100 nanoseconds (Park et al., 2013). This is accompanied by the release of light or heat. The excited photo electron from the CB falls back to valence band (VB) without reacting with the pesticides or organic pollutants as shown in Equation 5.6 and Figure 5-29 (Singh et al., 2013).
Formation of hydroxyl radicals from H2O and photo-generated holes
Equations 5.7, 5.8 and 5.9 show the formation of free radicals and pollutant oxidation.
)6.5(._ Energyeh CBVB →++
)7.5(2 OHHhOH VB•++ +→+
TiO2 Eg 3.2eVV
VB
Sun simulator UV
Dyes, crude oil, pesticides, dd, drugs, pollutants
Dyes, crude oil, pesticides organic pollutants
CO2 + H2O + mineralised products
e
e-
CB
h+
h +
h+
e-
O2
O2.
e-
OH. h+
H2O OH- + H+ HOMO
PAN
CO2 + H2O + mineralised products
LUMO
Sun simulator UV visible
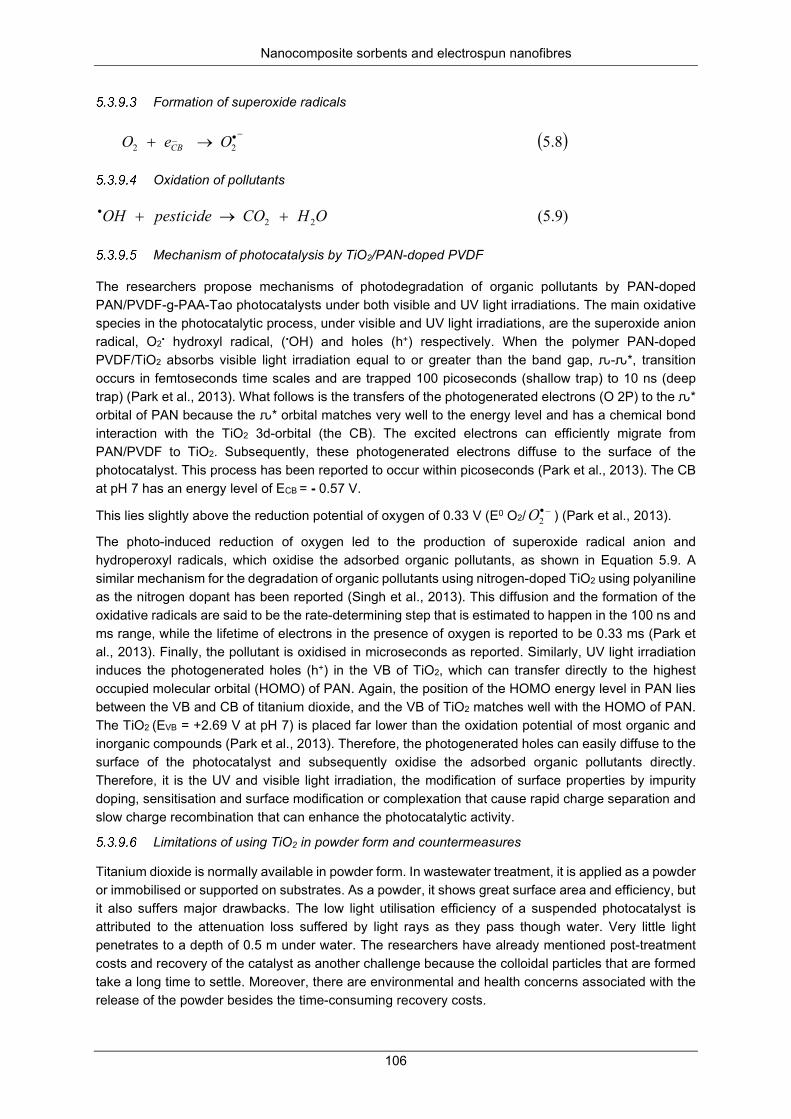
Nanocomposite sorbents and electrospun nanofibres
106
Formation of superoxide radicals
Oxidation of pollutants
Mechanism of photocatalysis by TiO2/PAN-doped PVDF
The researchers propose mechanisms of photodegradation of organic pollutants by PAN-doped PAN/PVDF-g-PAA-Tao photocatalysts under both visible and UV light irradiations. The main oxidative species in the photocatalytic process, under visible and UV light irradiations, are the superoxide anion radical, O2• hydroxyl radical, (•OH) and holes (h+) respectively. When the polymer PAN-doped PVDF/TiO2 absorbs visible light irradiation equal to or greater than the band gap, ԉ-ԉ*, transition occurs in femtoseconds time scales and are trapped 100 picoseconds (shallow trap) to 10 ns (deep trap) (Park et al., 2013). What follows is the transfers of the photogenerated electrons (O 2P) to the ԉ* orbital of PAN because the ԉ* orbital matches very well to the energy level and has a chemical bond interaction with the TiO2 3d-orbital (the CB). The excited electrons can efficiently migrate from PAN/PVDF to TiO2. Subsequently, these photogenerated electrons diffuse to the surface of the photocatalyst. This process has been reported to occur within picoseconds (Park et al., 2013). The CB at pH 7 has an energy level of ECB = - 0.57 V.
This lies slightly above the reduction potential of oxygen of 0.33 V (E0 O2/ ) (Park et al., 2013).
The photo-induced reduction of oxygen led to the production of superoxide radical anion and hydroperoxyl radicals, which oxidise the adsorbed organic pollutants, as shown in Equation 5.9. A similar mechanism for the degradation of organic pollutants using nitrogen-doped TiO2 using polyaniline as the nitrogen dopant has been reported (Singh et al., 2013). This diffusion and the formation of the oxidative radicals are said to be the rate-determining step that is estimated to happen in the 100 ns and ms range, while the lifetime of electrons in the presence of oxygen is reported to be 0.33 ms (Park et al., 2013). Finally, the pollutant is oxidised in microseconds as reported. Similarly, UV light irradiation induces the photogenerated holes (h+) in the VB of TiO2, which can transfer directly to the highest occupied molecular orbital (HOMO) of PAN. Again, the position of the HOMO energy level in PAN lies between the VB and CB of titanium dioxide, and the VB of TiO2 matches well with the HOMO of PAN. The TiO2 (EVB = +2.69 V at pH 7) is placed far lower than the oxidation potential of most organic and inorganic compounds (Park et al., 2013). Therefore, the photogenerated holes can easily diffuse to the surface of the photocatalyst and subsequently oxidise the adsorbed organic pollutants directly. Therefore, it is the UV and visible light irradiation, the modification of surface properties by impurity doping, sensitisation and surface modification or complexation that cause rapid charge separation and slow charge recombination that can enhance the photocatalytic activity.
Limitations of using TiO2 in powder form and countermeasures
Titanium dioxide is normally available in powder form. In wastewater treatment, it is applied as a powder or immobilised or supported on substrates. As a powder, it shows great surface area and efficiency, but it also suffers major drawbacks. The low light utilisation efficiency of a suspended photocatalyst is attributed to the attenuation loss suffered by light rays as they pass though water. Very little light penetrates to a depth of 0.5 m under water. The researchers have already mentioned post-treatment costs and recovery of the catalyst as another challenge because the colloidal particles that are formed take a long time to settle. Moreover, there are environmental and health concerns associated with the release of the powder besides the time-consuming recovery costs.
( )8.52_
2−•→+ OeO CB
)9.5(22 OHCOpesticideOH +→+•
_2•O
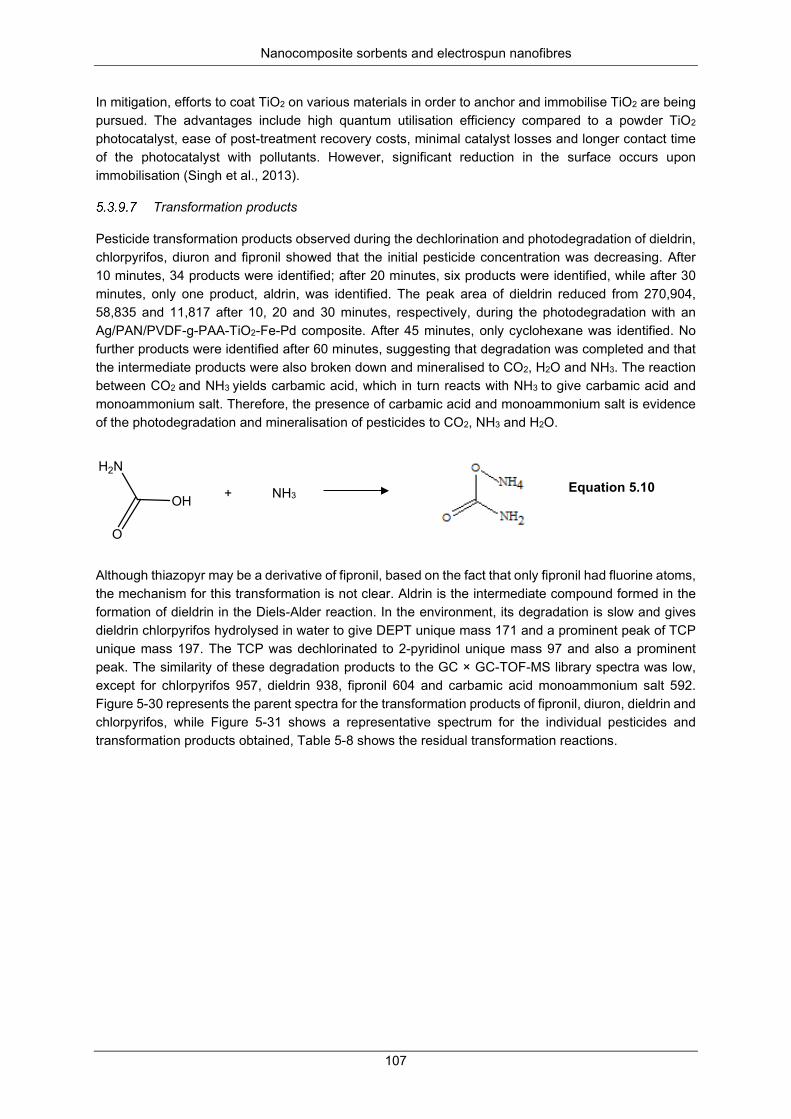
Nanocomposite sorbents and electrospun nanofibres
107
In mitigation, efforts to coat TiO2 on various materials in order to anchor and immobilise TiO2 are being pursued. The advantages include high quantum utilisation efficiency compared to a powder TiO2 photocatalyst, ease of post-treatment recovery costs, minimal catalyst losses and longer contact time of the photocatalyst with pollutants. However, significant reduction in the surface occurs upon immobilisation (Singh et al., 2013).
Transformation products
Pesticide transformation products observed during the dechlorination and photodegradation of dieldrin, chlorpyrifos, diuron and fipronil showed that the initial pesticide concentration was decreasing. After 10 minutes, 34 products were identified; after 20 minutes, six products were identified, while after 30 minutes, only one product, aldrin, was identified. The peak area of dieldrin reduced from 270,904, 58,835 and 11,817 after 10, 20 and 30 minutes, respectively, during the photodegradation with an Ag/PAN/PVDF-g-PAA-TiO2-Fe-Pd composite. After 45 minutes, only cyclohexane was identified. No further products were identified after 60 minutes, suggesting that degradation was completed and that the intermediate products were also broken down and mineralised to CO2, H2O and NH3. The reaction between CO2 and NH3 yields carbamic acid, which in turn reacts with NH3 to give carbamic acid and monoammonium salt. Therefore, the presence of carbamic acid and monoammonium salt is evidence of the photodegradation and mineralisation of pesticides to CO2, NH3 and H2O.
Although thiazopyr may be a derivative of fipronil, based on the fact that only fipronil had fluorine atoms, the mechanism for this transformation is not clear. Aldrin is the intermediate compound formed in the formation of dieldrin in the Diels-Alder reaction. In the environment, its degradation is slow and gives dieldrin chlorpyrifos hydrolysed in water to give DEPT unique mass 171 and a prominent peak of TCP unique mass 197. The TCP was dechlorinated to 2-pyridinol unique mass 97 and also a prominent peak. The similarity of these degradation products to the GC × GC-TOF-MS library spectra was low, except for chlorpyrifos 957, dieldrin 938, fipronil 604 and carbamic acid monoammonium salt 592. Figure 5-30 represents the parent spectra for the transformation products of fipronil, diuron, dieldrin and chlorpyrifos, while Figure 5-31 shows a representative spectrum for the individual pesticides and transformation products obtained, Table 5-8 shows the residual transformation reactions.
H2N
O
OH + NH3 Equation 5.10
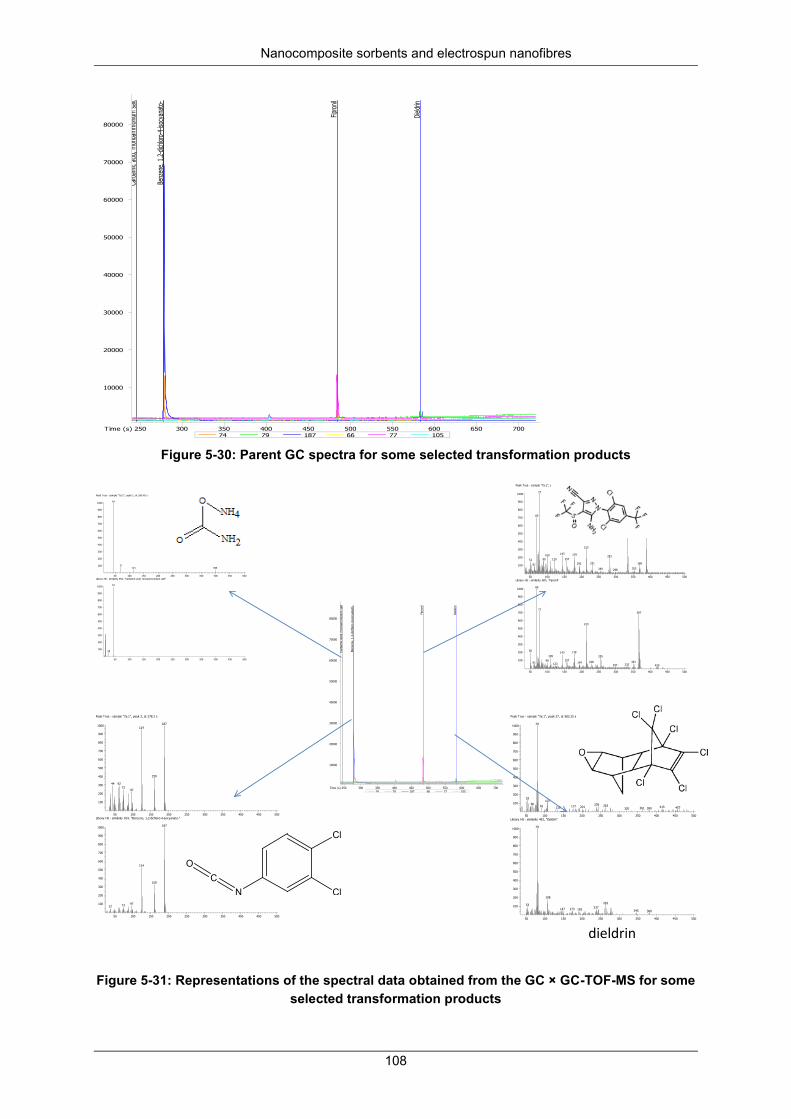
Nanocomposite sorbents and electrospun nanofibres
108
Figure 5-30: Parent GC spectra for some selected transformation products
Figure 5-31: Representations of the spectral data obtained from the GC × GC-TOF-MS for some selected transformation products
250 300 350 400 450 500 550 600 650 700
10000
20000
30000
40000
50000
60000
70000
80000
Time (s)
Carba
mic a
cid, m
onoa
mmon
ium sa
lt
Benze
ne, 1
,2-dic
hloro-
4-isoc
yana
to-
Fipron
il
Dieldr
in
74 79 187 66 77 105
50 100 150 200 250 300 350 400 450 500
100
200
300
400
500
600
700
800
900
1000 44
71 398 114
Peak True - sample "7a:1", peak 1, at 245.45 s
50 100 150 200 250 300 350 400 450 500
100
200
300
400
500
600
700
800
900
1000 44
28
Library Hit - similarity 592, "Carbamic acid, monoammonium salt"
250 300 350 400 450 500 550 600 650 700
10000
20000
30000
40000
50000
60000
70000
80000
Time (s)
Carb
amic
acid
, mon
oam
mon
ium
sal
t
Benz
ene,
1,2
-dich
loro
-4-is
ocya
nato
-
Fipr
onil
Diel
drin
74 79 187 66 77 105
50 100 150 200 250 300 350 400 450 500
100
200
300
400
500
600
700
800
900
1000 187 124
159
62 44 73
97
Peak True - sample "7a:1", peak 3, at 278.2 s
50 100 150 200 250 300 350 400 450 500
100
200
300
400
500
600
700
800
900
1000 187
124
159
97 73 37
Library Hit - similarity 914, "Benzene, 1,2-dichloro-4-isocyanato-"
50 100 150 200 250 300 350 400 450 500
100
200
300
400
500
600
700
800
900
1000 77
69 333
388
213
143 179 100 281 157 90 120 51
231 369 192 61 353 255 298
Peak True - sample "7a:1", peak 11, at 484.25 s
50 100 150 200 250 300 350 400 450 500
100
200
300
400
500
600
700
800
900
1000 69
77 367
213
50 178 143 109 255
157 99 228 351 194 61 123 332 297 420
Library Hit - similarity 604, "Fipronil"
50 100 150 200 250 300 350 400 450 500
100
200
300
400
500
600
700
800
900
1000 79
53 107
66 239 263 91 177 201 415 457 135 361 380 320
Peak True - sample "7a:1", peak 27, at 583.25 s
50 100 150 200 250 300 350 400 450 500
100
200
300
400
500
600
700
800
900
1000 79
108
263 53 237 173 147 193 345 380
Library Hit - similarity 493, "Dieldrin"
dieldrin
NC
O
Cl
Cl
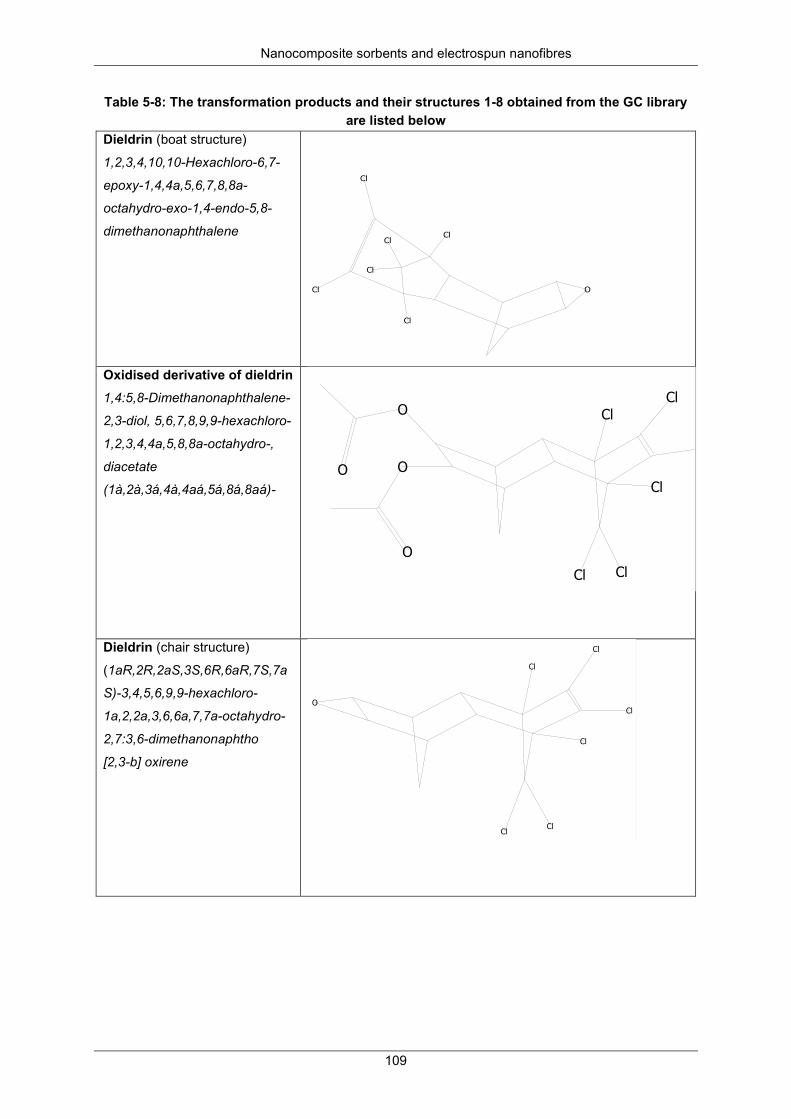
Nanocomposite sorbents and electrospun nanofibres
109
Table 5-8: The transformation products and their structures 1-8 obtained from the GC library are listed below
Dieldrin (boat structure)
1,2,3,4,10,10-Hexachloro-6,7-
epoxy-1,4,4a,5,6,7,8,8a-
octahydro-exo-1,4-endo-5,8-
dimethanonaphthalene
Oxidised derivative of dieldrin 1,4:5,8-Dimethanonaphthalene-
2,3-diol, 5,6,7,8,9,9-hexachloro-
1,2,3,4,4a,5,8,8a-octahydro-,
diacetate
(1à,2à,3á,4à,4aá,5á,8á,8aá)-
Dieldrin (chair structure)
(1aR,2R,2aS,3S,6R,6aR,7S,7a
S)-3,4,5,6,9,9-hexachloro-
1a,2,2a,3,6,6a,7,7a-octahydro-
2,7:3,6-dimethanonaphtho
[2,3-b] oxirene
Cl
ClCl
ClCl
O
O
O
O
Cl
ClCl
Cl
Cl
ClO
Cl
Cl
Cl
Cl
Cl
Cl
O
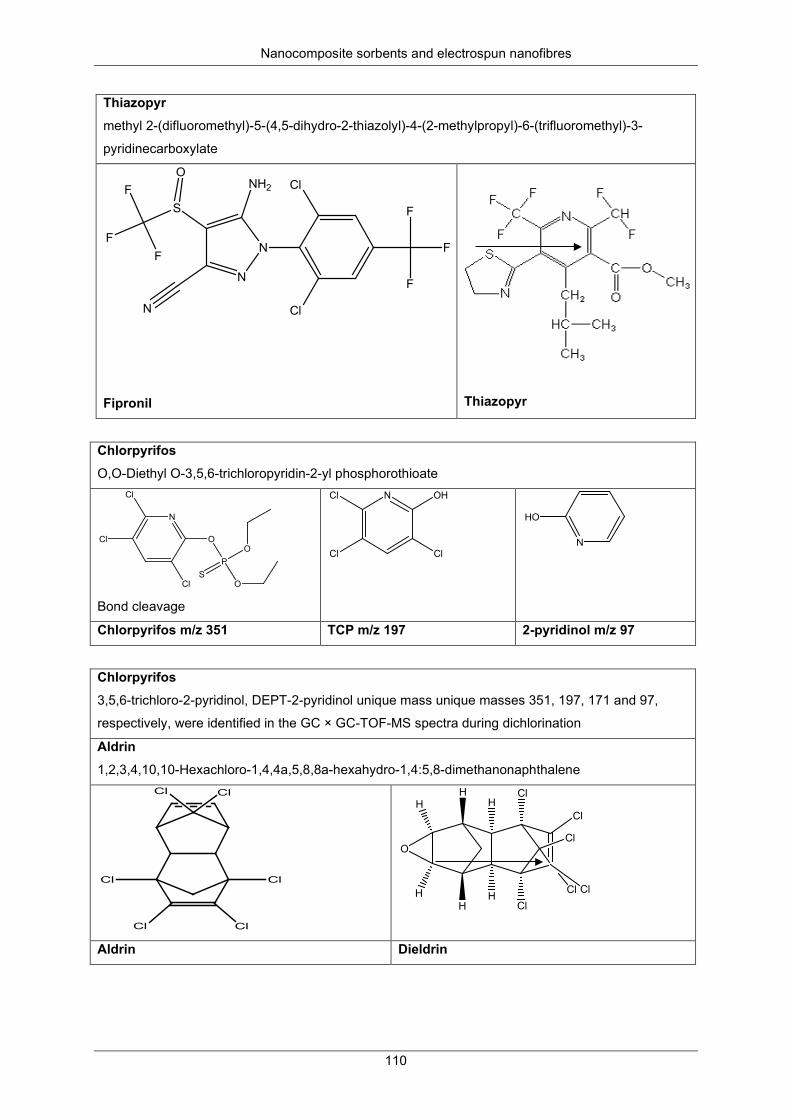
Nanocomposite sorbents and electrospun nanofibres
110
Thiazopyr methyl 2-(difluoromethyl)-5-(4,5-dihydro-2-thiazolyl)-4-(2-methylpropyl)-6-(trifluoromethyl)-3-
pyridinecarboxylate
Fipronil
Thiazopyr
Chlorpyrifos O,O-Diethyl O-3,5,6-trichloropyridin-2-yl phosphorothioate
Bond cleavage
Chlorpyrifos m/z 351 TCP m/z 197 2-pyridinol m/z 97
Chlorpyrifos
3,5,6-trichloro-2-pyridinol, DEPT-2-pyridinol unique mass unique masses 351, 197, 171 and 97,
respectively, were identified in the GC × GC-TOF-MS spectra during dichlorination
Aldrin
1,2,3,4,10,10-Hexachloro-1,4,4a,5,8,8a-hexahydro-1,4:5,8-dimethanonaphthalene
Aldrin Dieldrin
N
N
N
F
F
F
Cl
ClNH2
S
O
FF
F
PO
O
O
S
N
Cl
Cl
Cl
N OHCl
Cl ClN
HO
Cl Cl
Cl
Cl Cl
Cl
OCl
Cl
Cl
Cl
ClCl
HH
H
HH
H
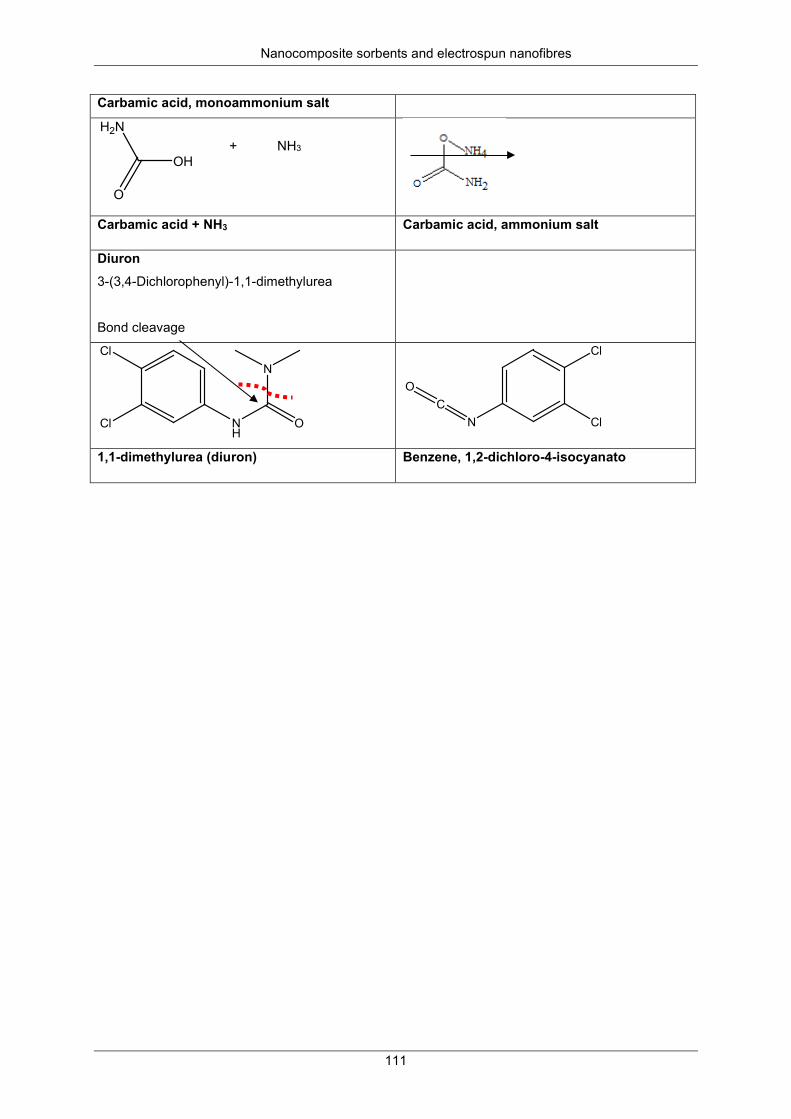
Nanocomposite sorbents and electrospun nanofibres
111
Carbamic acid, monoammonium salt
Carbamic acid + NH3 Carbamic acid, ammonium salt
Diuron
3-(3,4-Dichlorophenyl)-1,1-dimethylurea
Bond cleavage
1,1-dimethylurea (diuron) Benzene, 1,2-dichloro-4-isocyanato
H2N
O
OH
N
ONH
Cl
Cl NC
O
Cl
Cl
+ NH3
Nanocomposite sorbents and electrospun nanofibres
112
SUMMARY
Synthesis of PAN/PVDF-g-PAA and Fe-Pd, TiO2 and Ag catalytic nanoparticles and their subsequent anchoring/immobilisation and dispersal was achieved. In addition, the researchers showed the anchoring nanoparticles sites’ matrix, including the nanoparticle size distributions using TEM micrographs. They electrospun PAN/PVDF (2:12 wt %) loaded with catalytic nanoparticles into nanofibres using DMF as solvent. They also electrospun the PAN/PVDF when loading the nanoparticles that were anchored or immobilised and dispersed in the inert support. In addition, they electrospun these using LBL electrospinning to form multifunctional “sandwich” nanofibre mats. However, the mats were too fragile for use in dechlorination and photodegradation. They clearly demonstrated and motivated, using deconvoluted XPS spectral data and binding energy as evidence, that the oxidation states of the catalytic metals Fe0, Pd0 Ti4+ and Ag were indeed formed and present. Furthermore, the binding energy and the reduction of the percentage of the carboxylate group clearly showed that these catalytic metals bonded through chelation on the carboxylate group. The novelty of this study was in the simultaneous dechlorination and catalytic photodegradation of mixed pesticides (diuron, fipronil dieldrin and chlorpyrifos) and their mineralisation to 99% in a one-step process. The evidence of mineralisation was shown by the evidence in the transformation product such as carbamic acid and ammonium salt, which was formed by the combination of CO2 and NH3. This is not just novel, but a significant contribution to the body of new knowledge, as evidenced by the publications. A novel method for the electrospinning and functionalisation of a nanocatalyst-loaded PVDF/PAN composite (Ag/PAN/PVDF-g-PAA-TiO2/Fe-Pd) in-situ and ex-situ was established. The researchers believe this combination of a dechlorination agent Fe-Pd and nitrogen-doped photofenton TiO2-Fe in PVDF-g-PAA and its subsequent LBL electrospinning has been reported for the first time. They have shown that this composite dechlorinated mixed pesticide (dieldrin, chlorpyrifos, diuron and fipronil) was 90-99% and mineralised to 35-45%. Furthermore, these partially mineralised products were degraded by AOP using the nitrogen-doped photofenton TiO2-Fe to 99%. An attempt was made to study the transformation products. The researchers showed that CO2, NH3, benzene, 1,2-dichloro-4-isocyanato TCP, DEPT and 2-pyridinol were formed. However, the author could not establish the transformation pathway of some transformation products such as thiazopyr. Therefore, further work is recommended in the identification and quantification of transformation products. In addition, there were challenges in the regeneration of the nanofibres, especially the reduction stage with NaBH4, where the evolution of hydrogen dispersed the nanofibres in the solution, prompting the use of an ice-chilled NaBH4 solution
This catalytic composite shows great potential for the remediation of water contaminated with chlorinated pesticides, especially effluents from manufacturing agro-industries.
Nanocomposite sorbents and electrospun nanofibres
113
CHAPTER 6: DECHLORINATION OF MIXED PESTICIDES IN CONTAMINATED WATER USING IRON-PALLADIUM
NANOPARTICLES IMMOBILISED ON FUNCTIONALISED MESOPOROUS SILICA1
INTRODUCTION
The threat arising from lack of access to clean water is one of the major risks the world is facing today (Brown, 2011). This risk is a global challenge that is threatening economic sustenance, as well as human life. The demand for clean, safe drinking water is further aggravated by rapidly increasing industrialisation, population, pollution, agricultural and domestic activities, as well as global climate change. Pollutants include heavy metals such as palladium, arsenic (As), chromium and cadmium, inorganic anions like fluorine (F-), POPs, pesticides and bacteria, among others (Li et al., 2012). Of particular interest to this chapter is chlorinated pesticides that are manufactured in large quantities, primarily for use in agriculture, such as dieldrin, chlorpyrifos (dursban), diuron and fipronil, among others (Han Qu et al., 2014). They concentrate in our soils and water over time and reach toxic levels that present great concerns to human health. The presence of a strong C-Cl bond leads to their slow degradation in the environment. Due to their high mobility, these pesticides have been detected in regions where they have never even been used, such as the Arctic Circle and Mount Everest (Meshesha, 2011; Vorkamp and Riget, 2014). Chlorinated pesticides enter our bodies when we eat, drink or breathe contaminated air. Their lipophilic nature enables them to bioaccumulate in body fat (Han Qu et al., 2014). The human body is unable to eliminate them through metabolism and excretion. They are cholinesterase inhibitors and present adverse health effects that manifest in the nervous, immune and endocrine systems (Barnhoorn et al., 2015). They can also affect the cardiovascular, respiratory, gastrointestinal and other systems. Pollutants have increased in both volume and severity. In addition, improvement of analytical methods have led to the quick identification of pesticides and also emerging micro pollutants, such as drugs, their metabolites and pathogens from the pharmaceutical industry (Park et al., 2013). This further complicates the problem. Current water treatment methods, such as flocculation, coagulation, filtration, reverse osmosis and advanced oxidation (UV/H2O2 and photofenton) do not remove trace levels of toxic pollutants and are expensive (Nthumbi et al., 2012). In addition, they mainly rely on chlorine for disinfection. Chlorine has been reported to react with organic cations to produce harmful disinfection by-products such as N,N-dimethylnitrosoamine (NDMA) (Park et al., 2009). The membrane technology used in reverse osmosis (RO) systems and the desalination of sea water is expensive and wasteful, giving one litre for every three litres of saline used. It also has a low throughput. The membranes used are susceptible to fouling. In addition, the small toxic pesticide molecules pass through the membranes.
Reverse osmosis is not sustainable for the provision of clean water, especially to the large population in cities and municipalities. Therefore, there is a need for complementary methods and technologies to remove these pollutants, as well as to increase treatment capacity. In mitigation, the demand to recycle wastewater is on the rise; yet the challenge lies in the availability of effective methods and appropriate technology for the treatment and recycling of water to acceptable national standards.
1 This chapter has been to submitted to Journal of Applied Surface Science (Nthumbi, R.M and Ngila, J.C.).
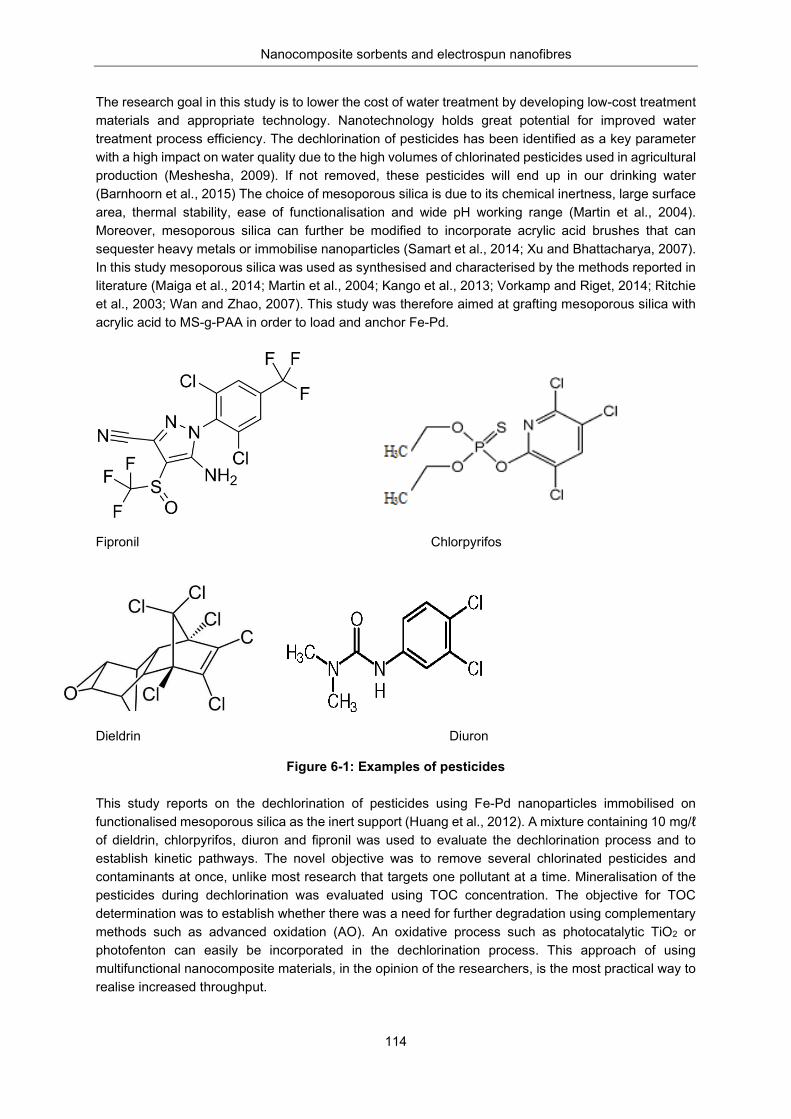
Nanocomposite sorbents and electrospun nanofibres
114
The research goal in this study is to lower the cost of water treatment by developing low-cost treatment materials and appropriate technology. Nanotechnology holds great potential for improved water treatment process efficiency. The dechlorination of pesticides has been identified as a key parameter with a high impact on water quality due to the high volumes of chlorinated pesticides used in agricultural production (Meshesha, 2009). If not removed, these pesticides will end up in our drinking water (Barnhoorn et al., 2015) The choice of mesoporous silica is due to its chemical inertness, large surface area, thermal stability, ease of functionalisation and wide pH working range (Martin et al., 2004). Moreover, mesoporous silica can further be modified to incorporate acrylic acid brushes that can sequester heavy metals or immobilise nanoparticles (Samart et al., 2014; Xu and Bhattacharya, 2007). In this study mesoporous silica was used as synthesised and characterised by the methods reported in literature (Maiga et al., 2014; Martin et al., 2004; Kango et al., 2013; Vorkamp and Riget, 2014; Ritchie et al., 2003; Wan and Zhao, 2007). This study was therefore aimed at grafting mesoporous silica with acrylic acid to MS-g-PAA in order to load and anchor Fe-Pd.
Fipronil Chlorpyrifos
Dieldrin Diuron
Figure 6-1: Examples of pesticides This study reports on the dechlorination of pesticides using Fe-Pd nanoparticles immobilised on functionalised mesoporous silica as the inert support (Huang et al., 2012). A mixture containing 10 mg/ℓ of dieldrin, chlorpyrifos, diuron and fipronil was used to evaluate the dechlorination process and to establish kinetic pathways. The novel objective was to remove several chlorinated pesticides and contaminants at once, unlike most research that targets one pollutant at a time. Mineralisation of the pesticides during dechlorination was evaluated using TOC concentration. The objective for TOC determination was to establish whether there was a need for further degradation using complementary methods such as advanced oxidation (AO). An oxidative process such as photocatalytic TiO2 or photofenton can easily be incorporated in the dechlorination process. This approach of using multifunctional nanocomposite materials, in the opinion of the researchers, is the most practical way to realise increased throughput.
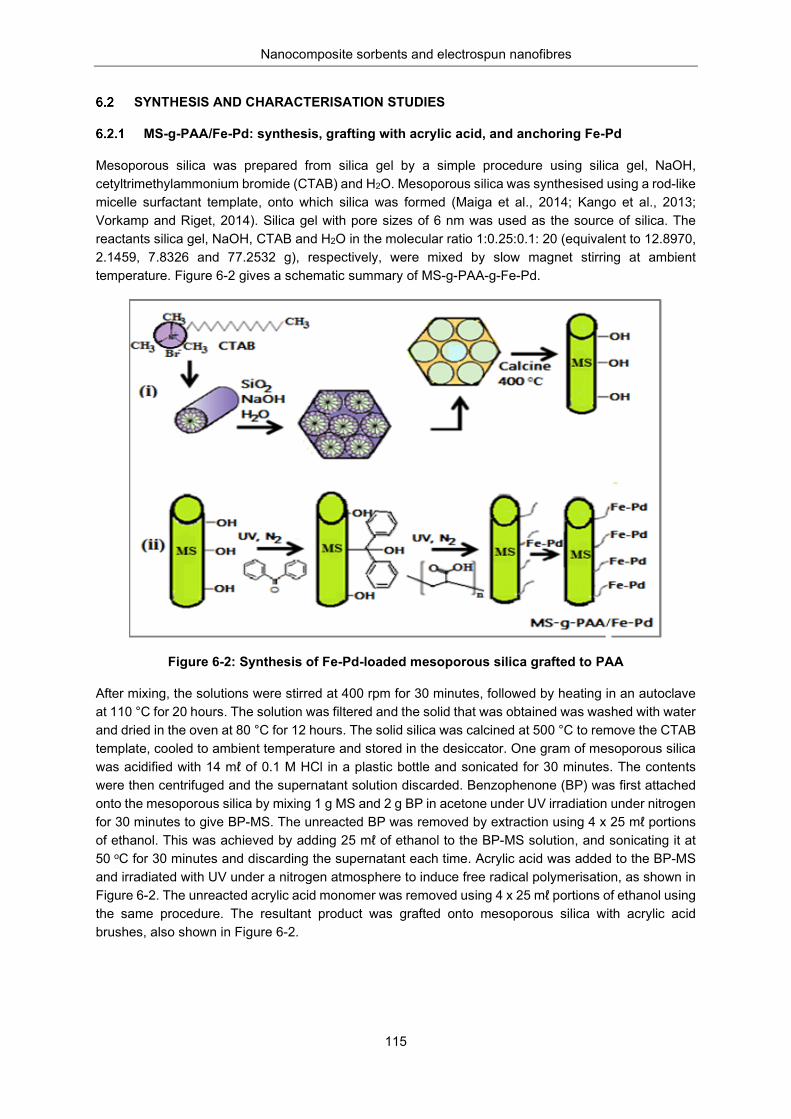
Nanocomposite sorbents and electrospun nanofibres
115
SYNTHESIS AND CHARACTERISATION STUDIES
MS-g-PAA/Fe-Pd: synthesis, grafting with acrylic acid, and anchoring Fe-Pd
Mesoporous silica was prepared from silica gel by a simple procedure using silica gel, NaOH, cetyltrimethylammonium bromide (CTAB) and H2O. Mesoporous silica was synthesised using a rod-like micelle surfactant template, onto which silica was formed (Maiga et al., 2014; Kango et al., 2013; Vorkamp and Riget, 2014). Silica gel with pore sizes of 6 nm was used as the source of silica. The reactants silica gel, NaOH, CTAB and H2O in the molecular ratio 1:0.25:0.1: 20 (equivalent to 12.8970, 2.1459, 7.8326 and 77.2532 g), respectively, were mixed by slow magnet stirring at ambient temperature. Figure 6-2 gives a schematic summary of MS-g-PAA-g-Fe-Pd.
Figure 6-2: Synthesis of Fe-Pd-loaded mesoporous silica grafted to PAA
After mixing, the solutions were stirred at 400 rpm for 30 minutes, followed by heating in an autoclave at 110 °C for 20 hours. The solution was filtered and the solid that was obtained was washed with water and dried in the oven at 80 °C for 12 hours. The solid silica was calcined at 500 °C to remove the CTAB template, cooled to ambient temperature and stored in the desiccator. One gram of mesoporous silica was acidified with 14 mℓ of 0.1 M HCl in a plastic bottle and sonicated for 30 minutes. The contents were then centrifuged and the supernatant solution discarded. Benzophenone (BP) was first attached onto the mesoporous silica by mixing 1 g MS and 2 g BP in acetone under UV irradiation under nitrogen for 30 minutes to give BP-MS. The unreacted BP was removed by extraction using 4 x 25 mℓ portions of ethanol. This was achieved by adding 25 mℓ of ethanol to the BP-MS solution, and sonicating it at 50 oC for 30 minutes and discarding the supernatant each time. Acrylic acid was added to the BP-MS and irradiated with UV under a nitrogen atmosphere to induce free radical polymerisation, as shown in Figure 6-2. The unreacted acrylic acid monomer was removed using 4 x 25 mℓ portions of ethanol using the same procedure. The resultant product was grafted onto mesoporous silica with acrylic acid brushes, also shown in Figure 6-2.
Nanocomposite sorbents and electrospun nanofibres
116
Loading iron and palladium onto acrylic acid-grafted mesoporous silica
Iron (II) was loaded onto 1 g of MS-g-PAA and reduced to Fe0 using NaBH4. A solution containing the equivalent of 1 g of Fe2+ was obtained by dissolving 5 g of FeSO4.7H2O in 70 mℓ of deionised water. The pH was adjusted to 6.8 using 4 M NaOH. To this solution, 1 g of MS-g-PAA was added and the Fe2+ solution stirred. The mesoporous silica that was saturated with Fe2+ was removed by filtration and the filtrate discarded. The Fe2+ adsorbed onto the MS-g-PAA was reduced to Fe0 by adding 2.3 M NaBH4 drop wise, as shown in Equation 6.1. The Fe0-loaded MS-g-PAA was filtered, washed with deoxygenated water and rinsed with acetone to give Fe0/MS-g-PAA.
Equation 6.1
The Fe0/MS-g-PAA nanoparticles were soaked in 50 mℓ of 0.85 gℓ-1 of Pd (II) acetate in acetone and stirred for 20 minutes. A redox reaction occurred and resulted in a Pd0 and Fe2+ bimetallic system, as indicated in Equation 6.2. In this reaction, it should be noted that Fe0 is in a large excess compared to Pd2+ and that all Pd (II) reacts to form Pd0. The aqueous Fe2+ is filtered off leaving Fe0-Pd0 anchored on MS-g-PAA, simply denoted as Fe-Pd/MS-g-PAA.
Equation 6.2
RESULTS AND DISCUSSION
Characterisation studies
Analysis of loading of iron and palladium on mesoporous silica and MS-g-PAA
Samples containing 0.01 g replicates were digested using concentrated nitric acid in a digiblock ED36S (LabTech) at 90 °C for 30 minutes. After digestion, the solution and the rinsing were quantitatively transferred into a 100 mℓ flask. After sonicating, the solution was filtered into ICP-OES sample tubes ready for analysis. Results obtained show that MS-g-PAA had a loading of 39.19 mg/ℓ, which was lower than that of mesoporous silica of 60.53 mg/ℓ. Although the grafted mesoporous silica anchored the Fe-Pd nanoparticles, the uptake was less than that of ungrafted material. It can be concluded that grafting uses some of the area and sites needed for anchoring. The free Fe-Pd has a high surface area and maintains better contact with the pesticide to be degraded, unlike the anchored Fe-Pd, where contact is reduced due to stearic effects and therefore has less mobility. However, anchoring ensures less release of pollutant, as well as reusability by regeneration, in addition to eliminating the need for post-treatment filtration.
Leaching of iron and palladium from Fe-Pd/MS-g-PAA
Leaching of Pd at a pH value of 7.05 for the first 30 minutes was 0.0025 mg/ℓ. This was higher than the subsequent 30 minutes when it reduced to 0.0015 mg/ℓ. At 90 minutes and beyond, no leaching of Pd was observed. A good reason for the quick reduction could be as a result of surface adsorbed or loosely attached metal at the surface. Therefore, after washing off, no further metal leaching of Pd was observed. The dissolution of iron increased very slowly as time increased. For the dechlorination reaction to proceed, Fe0 first has to go into solution and produce hydrogen. The nascent hydrogen is adsorbed onto the Pd0. Upon contact with the pesticide molecule, it abstracts a chlorine atom. Therefore, the leaching of iron cannot be confirmed because this reaction is designed to proceed through a mechanism that requires iron to go into solution.
7)(222)( 230
24242 HOHBFeOHBHOHFe ++→++ −+
2002 ++ +→+ FePdFePd
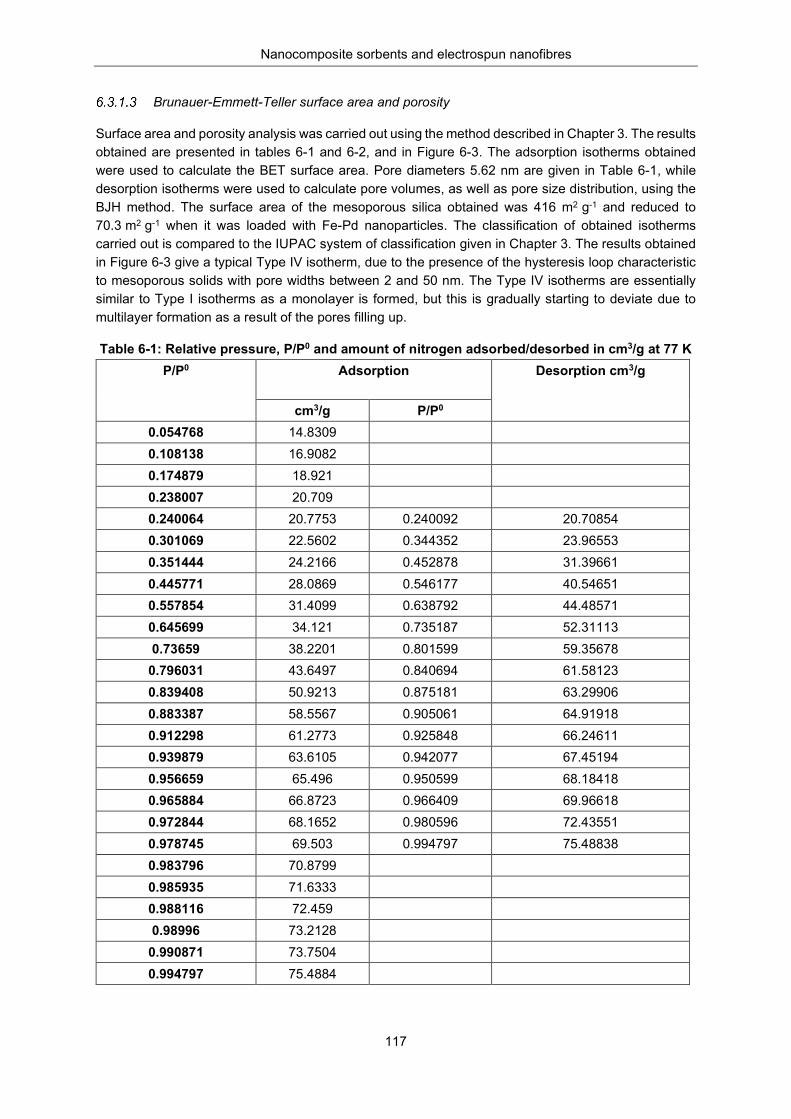
Nanocomposite sorbents and electrospun nanofibres
117
Brunauer-Emmett-Teller surface area and porosity
Surface area and porosity analysis was carried out using the method described in Chapter 3. The results obtained are presented in tables 6-1 and 6-2, and in Figure 6-3. The adsorption isotherms obtained were used to calculate the BET surface area. Pore diameters 5.62 nm are given in Table 6-1, while desorption isotherms were used to calculate pore volumes, as well as pore size distribution, using the BJH method. The surface area of the mesoporous silica obtained was 416 m2 g-1 and reduced to 70.3 m2 g-1 when it was loaded with Fe-Pd nanoparticles. The classification of obtained isotherms carried out is compared to the IUPAC system of classification given in Chapter 3. The results obtained in Figure 6-3 give a typical Type IV isotherm, due to the presence of the hysteresis loop characteristic to mesoporous solids with pore widths between 2 and 50 nm. The Type IV isotherms are essentially similar to Type I isotherms as a monolayer is formed, but this is gradually starting to deviate due to multilayer formation as a result of the pores filling up.
Table 6-1: Relative pressure, P/P0 and amount of nitrogen adsorbed/desorbed in cm3/g at 77 K P/P0 Adsorption
Desorption cm3/g
cm3/g P/P0 0.054768 14.8309 0.108138 16.9082 0.174879 18.921 0.238007 20.709 0.240064 20.7753 0.240092 20.70854 0.301069 22.5602 0.344352 23.96553 0.351444 24.2166 0.452878 31.39661 0.445771 28.0869 0.546177 40.54651 0.557854 31.4099 0.638792 44.48571 0.645699 34.121 0.735187 52.31113 0.73659 38.2201 0.801599 59.35678 0.796031 43.6497 0.840694 61.58123 0.839408 50.9213 0.875181 63.29906 0.883387 58.5567 0.905061 64.91918 0.912298 61.2773 0.925848 66.24611 0.939879 63.6105 0.942077 67.45194 0.956659 65.496 0.950599 68.18418 0.965884 66.8723 0.966409 69.96618 0.972844 68.1652 0.980596 72.43551 0.978745 69.503 0.994797 75.48838 0.983796 70.8799 0.985935 71.6333 0.988116 72.459 0.98996 73.2128 0.990871 73.7504 0.994797 75.4884
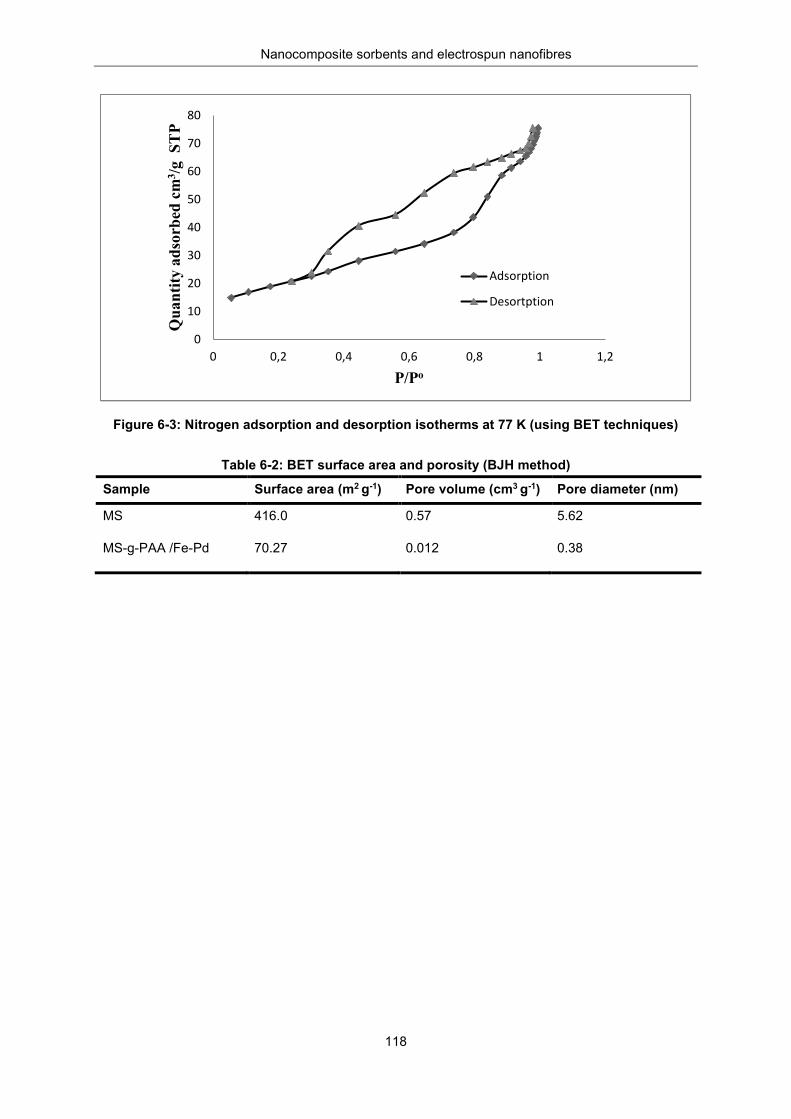
Nanocomposite sorbents and electrospun nanofibres
118
Figure 6-3: Nitrogen adsorption and desorption isotherms at 77 K (using BET techniques)
Table 6-2: BET surface area and porosity (BJH method)
Sample Surface area (m2 g-1) Pore volume (cm3 g-1) Pore diameter (nm)
MS 416.0 0.57 5.62
MS-g-PAA /Fe-Pd 70.27 0.012 0.38
0
10
20
30
40
50
60
70
80
0 0,2 0,4 0,6 0,8 1 1,2
Qua
ntity
ads
orbe
d cm
3 /g S
TP
P/Po
Adsorption
Desortption
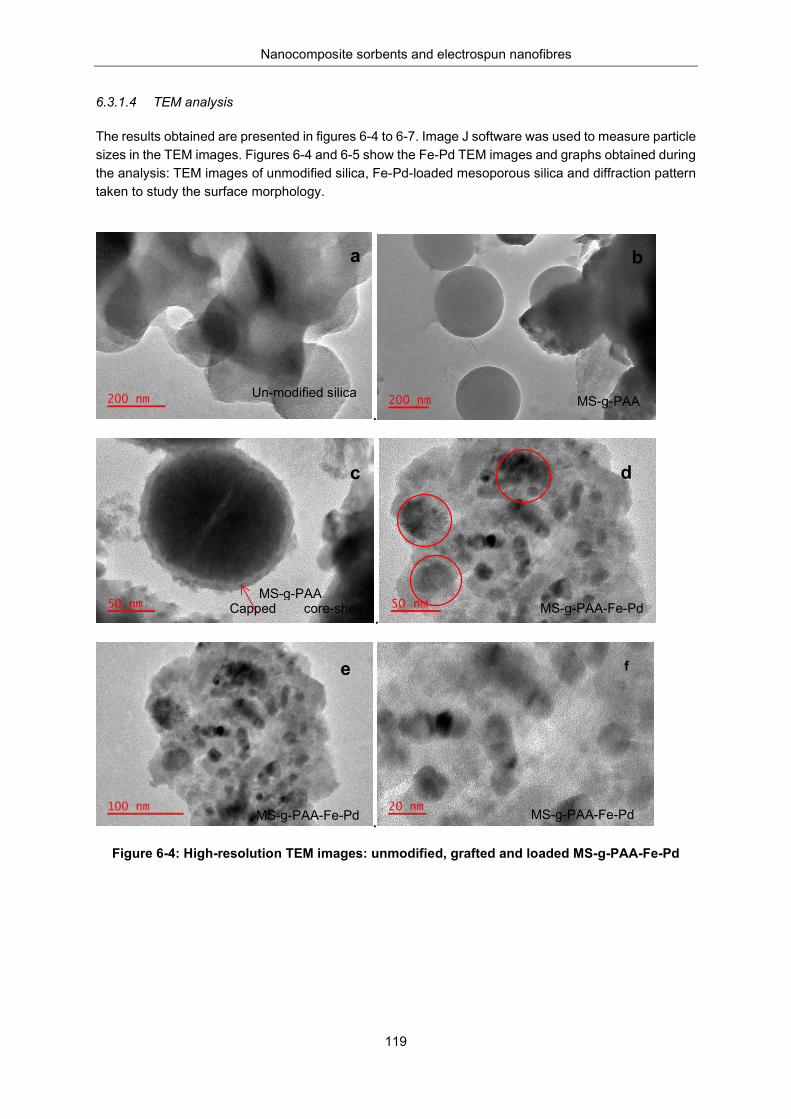
Nanocomposite sorbents and electrospun nanofibres
119
6.3.1.4 TEM analysis
The results obtained are presented in figures 6-4 to 6-7. Image J software was used to measure particle sizes in the TEM images. Figures 6-4 and 6-5 show the Fe-Pd TEM images and graphs obtained during the analysis: TEM images of unmodified silica, Fe-Pd-loaded mesoporous silica and diffraction pattern taken to study the surface morphology.
.
.
.
Figure 6-4: High-resolution TEM images: unmodified, grafted and loaded MS-g-PAA-Fe-Pd
Capped core-shell
c
a
e
d
b
MS-g-PAA Un-modified silica
MS-g-PAA-Fe-Pd MS-g-PAA
f
MS-g-PAA-Fe-Pd MS-g-PAA-Fe-Pd
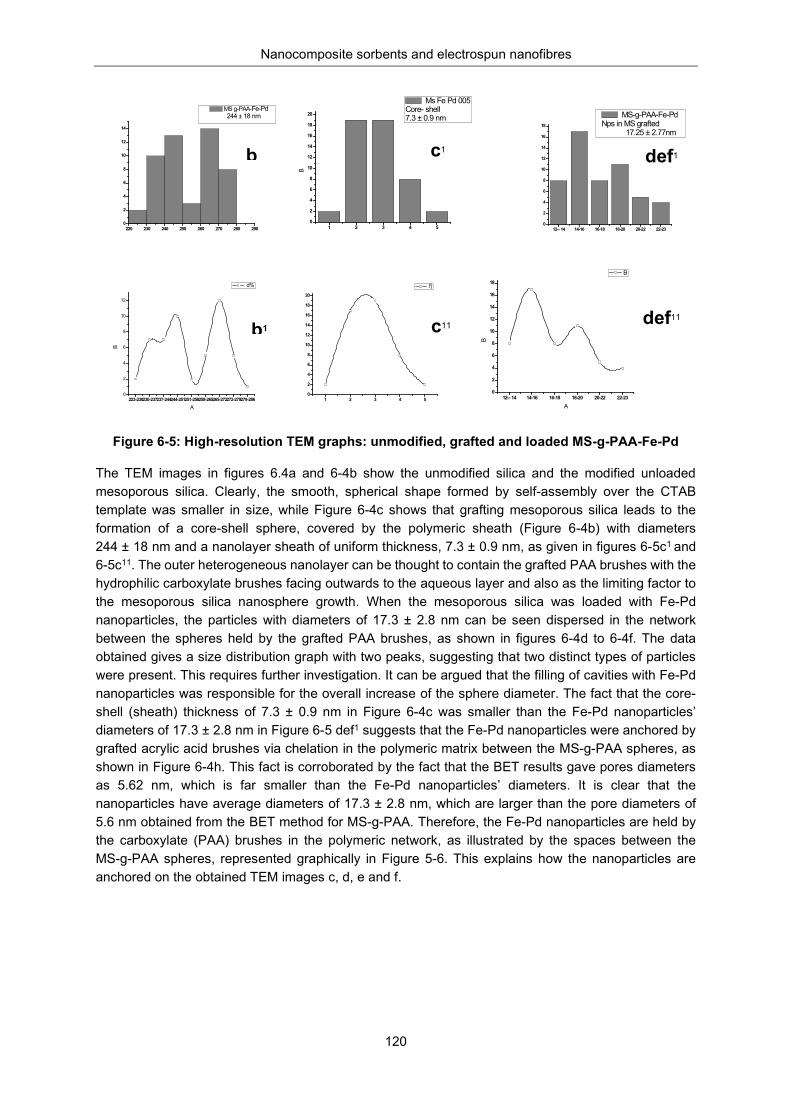
Nanocomposite sorbents and electrospun nanofibres
120
Figure 6-5: High-resolution TEM graphs: unmodified, grafted and loaded MS-g-PAA-Fe-Pd
The TEM images in figures 6.4a and 6-4b show the unmodified silica and the modified unloaded mesoporous silica. Clearly, the smooth, spherical shape formed by self-assembly over the CTAB template was smaller in size, while Figure 6-4c shows that grafting mesoporous silica leads to the formation of a core-shell sphere, covered by the polymeric sheath (Figure 6-4b) with diameters 244 ± 18 nm and a nanolayer sheath of uniform thickness, 7.3 ± 0.9 nm, as given in figures 6-5c1 and 6-5c11. The outer heterogeneous nanolayer can be thought to contain the grafted PAA brushes with the hydrophilic carboxylate brushes facing outwards to the aqueous layer and also as the limiting factor to the mesoporous silica nanosphere growth. When the mesoporous silica was loaded with Fe-Pd nanoparticles, the particles with diameters of 17.3 ± 2.8 nm can be seen dispersed in the network between the spheres held by the grafted PAA brushes, as shown in figures 6-4d to 6-4f. The data obtained gives a size distribution graph with two peaks, suggesting that two distinct types of particles were present. This requires further investigation. It can be argued that the filling of cavities with Fe-Pd nanoparticles was responsible for the overall increase of the sphere diameter. The fact that the core-shell (sheath) thickness of 7.3 ± 0.9 nm in Figure 6-4c was smaller than the Fe-Pd nanoparticles’ diameters of 17.3 ± 2.8 nm in Figure 6-5 def1 suggests that the Fe-Pd nanoparticles were anchored by grafted acrylic acid brushes via chelation in the polymeric matrix between the MS-g-PAA spheres, as shown in Figure 6-4h. This fact is corroborated by the fact that the BET results gave pores diameters as 5.62 nm, which is far smaller than the Fe-Pd nanoparticles’ diameters. It is clear that the nanoparticles have average diameters of 17.3 ± 2.8 nm, which are larger than the pore diameters of 5.6 nm obtained from the BET method for MS-g-PAA. Therefore, the Fe-Pd nanoparticles are held by the carboxylate (PAA) brushes in the polymeric network, as illustrated by the spaces between the MS-g-PAA spheres, represented graphically in Figure 5-6. This explains how the nanoparticles are anchored on the obtained TEM images c, d, e and f.
220 230 240 250 260 270 280 2900
2
4
6
8
10
12
14
MS g-PAA-Fe-Pd 244 ± 18 nm
1 2 3 4 50
2
4
6
8
10
12
14
16
18
20
B
Ms Fe Pd 005Core- shell 7.3 ± 0.9 nm
12-- 14 14-16 16-18 18-20 20-22 22-230
2
4
6
8
10
12
14
16
18
MS-g-PAA-Fe-PdNps in MS grafted 17.25 ± 2.77nm
223-230230-237237-244244-251251-258258-265265-272272-279279-2860
2
4
6
8
10
12
B
A
d%
1 2 3 4 50
2
4
6
8
10
12
14
16
18
20
f)
12-- 14 14-16 16-18 18-20 20-22 22-230
2
4
6
8
10
12
14
16
18
B
A
B
c1 def1
c11 def11
b
b1
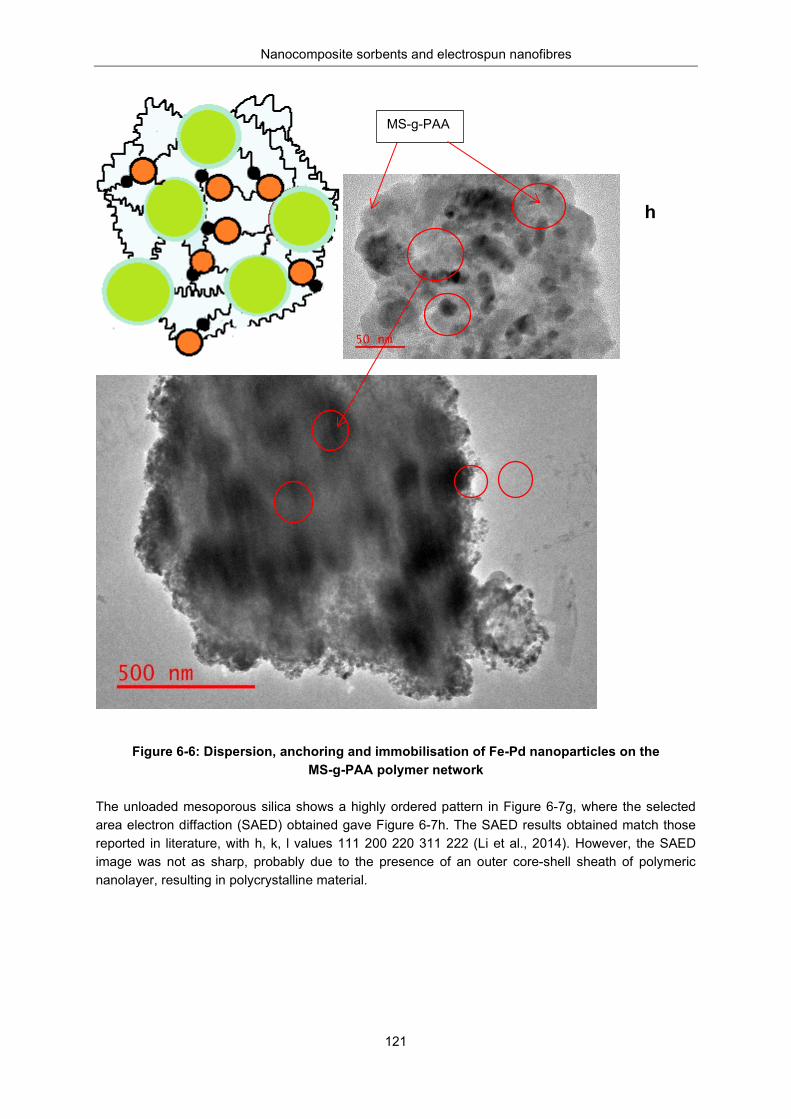
Nanocomposite sorbents and electrospun nanofibres
121
Figure 6-6: Dispersion, anchoring and immobilisation of Fe-Pd nanoparticles on the
MS-g-PAA polymer network The unloaded mesoporous silica shows a highly ordered pattern in Figure 6-7g, where the selected area electron diffaction (SAED) obtained gave Figure 6-7h. The SAED results obtained match those reported in literature, with h, k, l values 111 200 220 311 222 (Li et al., 2014). However, the SAED image was not as sharp, probably due to the presence of an outer core-shell sheath of polymeric nanolayer, resulting in polycrystalline material.
MS-g-PAA
h
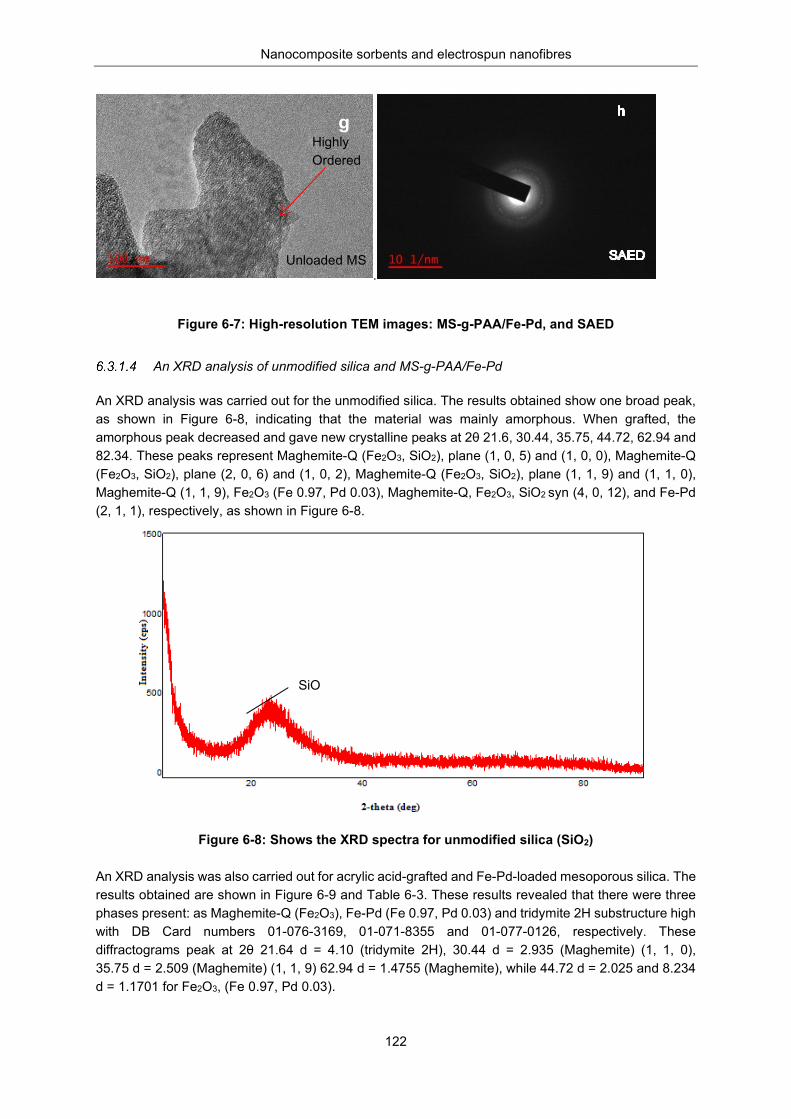
Nanocomposite sorbents and electrospun nanofibres
122
.
Figure 6-7: High-resolution TEM images: MS-g-PAA/Fe-Pd, and SAED
An XRD analysis of unmodified silica and MS-g-PAA/Fe-Pd
An XRD analysis was carried out for the unmodified silica. The results obtained show one broad peak, as shown in Figure 6-8, indicating that the material was mainly amorphous. When grafted, the amorphous peak decreased and gave new crystalline peaks at 2θ 21.6, 30.44, 35.75, 44.72, 62.94 and 82.34. These peaks represent Maghemite-Q (Fe2O3, SiO2), plane (1, 0, 5) and (1, 0, 0), Maghemite-Q (Fe2O3, SiO2), plane (2, 0, 6) and (1, 0, 2), Maghemite-Q (Fe2O3, SiO2), plane (1, 1, 9) and (1, 1, 0), Maghemite-Q (1, 1, 9), Fe2O3 (Fe 0.97, Pd 0.03), Maghemite-Q, Fe2O3, SiO2 syn (4, 0, 12), and Fe-Pd (2, 1, 1), respectively, as shown in Figure 6-8.
Figure 6-8: Shows the XRD spectra for unmodified silica (SiO2) An XRD analysis was also carried out for acrylic acid-grafted and Fe-Pd-loaded mesoporous silica. The results obtained are shown in Figure 6-9 and Table 6-3. These results revealed that there were three phases present: as Maghemite-Q (Fe2O3), Fe-Pd (Fe 0.97, Pd 0.03) and tridymite 2H substructure high with DB Card numbers 01-076-3169, 01-071-8355 and 01-077-0126, respectively. These diffractograms peak at 2θ 21.64 d = 4.10 (tridymite 2H), 30.44 d = 2.935 (Maghemite) (1, 1, 0), 35.75 d = 2.509 (Maghemite) (1, 1, 9) 62.94 d = 1.4755 (Maghemite), while 44.72 d = 2.025 and 8.234 d = 1.1701 for Fe2O3, (Fe 0.97, Pd 0.03).
g
L
Highly Ordered
Unloaded MS
SiO
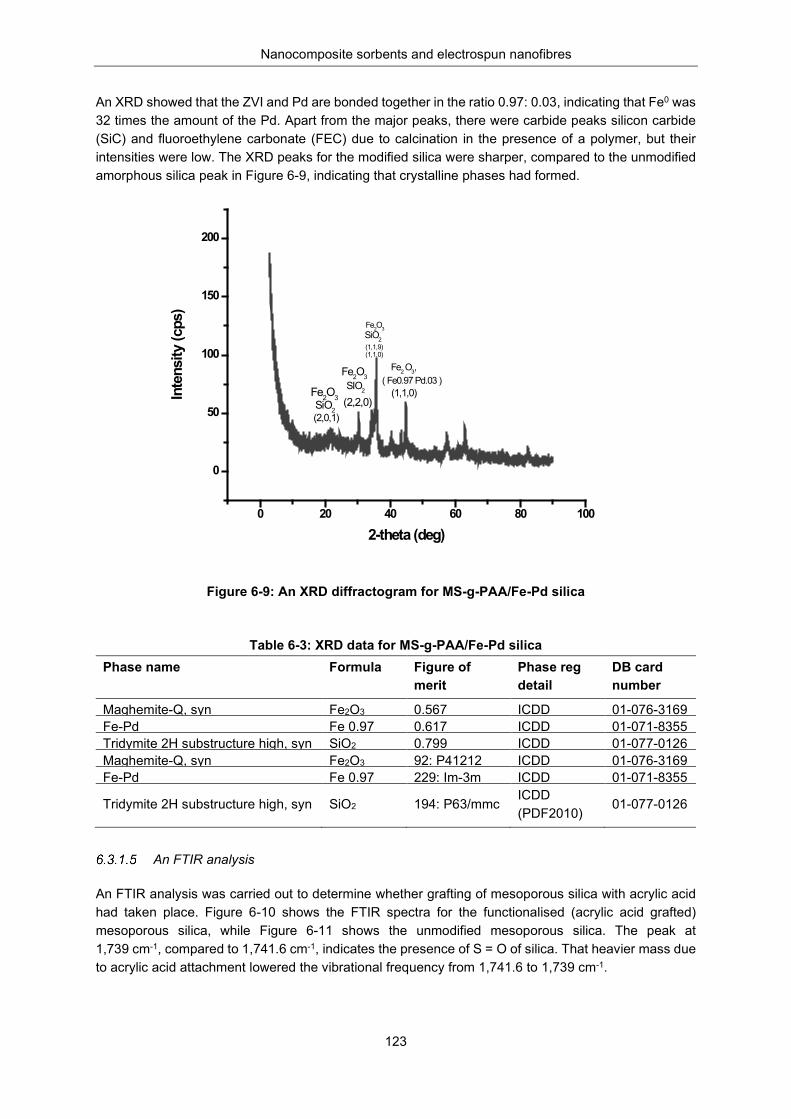
Nanocomposite sorbents and electrospun nanofibres
123
An XRD showed that the ZVI and Pd are bonded together in the ratio 0.97: 0.03, indicating that Fe0 was 32 times the amount of the Pd. Apart from the major peaks, there were carbide peaks silicon carbide (SiC) and fluoroethylene carbonate (FEC) due to calcination in the presence of a polymer, but their intensities were low. The XRD peaks for the modified silica were sharper, compared to the unmodified amorphous silica peak in Figure 6-9, indicating that crystalline phases had formed.
Figure 6-9: An XRD diffractogram for MS-g-PAA/Fe-Pd silica
Table 6-3: XRD data for MS-g-PAA/Fe-Pd silica
Phase name Formula Figure of merit
Phase reg detail
DB card number
Maghemite-Q, syn Fe2O3 0.567 ICDD
01-076-3169 Fe-Pd Fe 0.97
0.617 ICDD
01-071-8355
Tridymite 2H substructure high, syn SiO2 0.799 ICDD
01-077-0126 Maghemite-Q, syn Fe2O3 92: P41212 ICDD
01-076-3169
Fe-Pd Fe 0.97
229: Im-3m ICDD
01-071-8355
Tridymite 2H substructure high, syn SiO2 194: P63/mmc ICDD (PDF2010)
01-077-0126
An FTIR analysis
An FTIR analysis was carried out to determine whether grafting of mesoporous silica with acrylic acid had taken place. Figure 6-10 shows the FTIR spectra for the functionalised (acrylic acid grafted) mesoporous silica, while Figure 6-11 shows the unmodified mesoporous silica. The peak at 1,739 cm-1, compared to 1,741.6 cm-1, indicates the presence of S = O of silica. That heavier mass due to acrylic acid attachment lowered the vibrational frequency from 1,741.6 to 1,739 cm-1.
0 20 40 60 80 100
0
50
100
150
200
Inte
nsity
(cps
)
2-theta (deg)
(1,1,0)
(2,0,1)(2,2,0)
Fe2O3
Fe2O3
Fe2O3
SiO2
SIO2
SiO2
Fe2 O3,( Fe0.97 Pd.03 )
(1,1,9)(1,1,0)
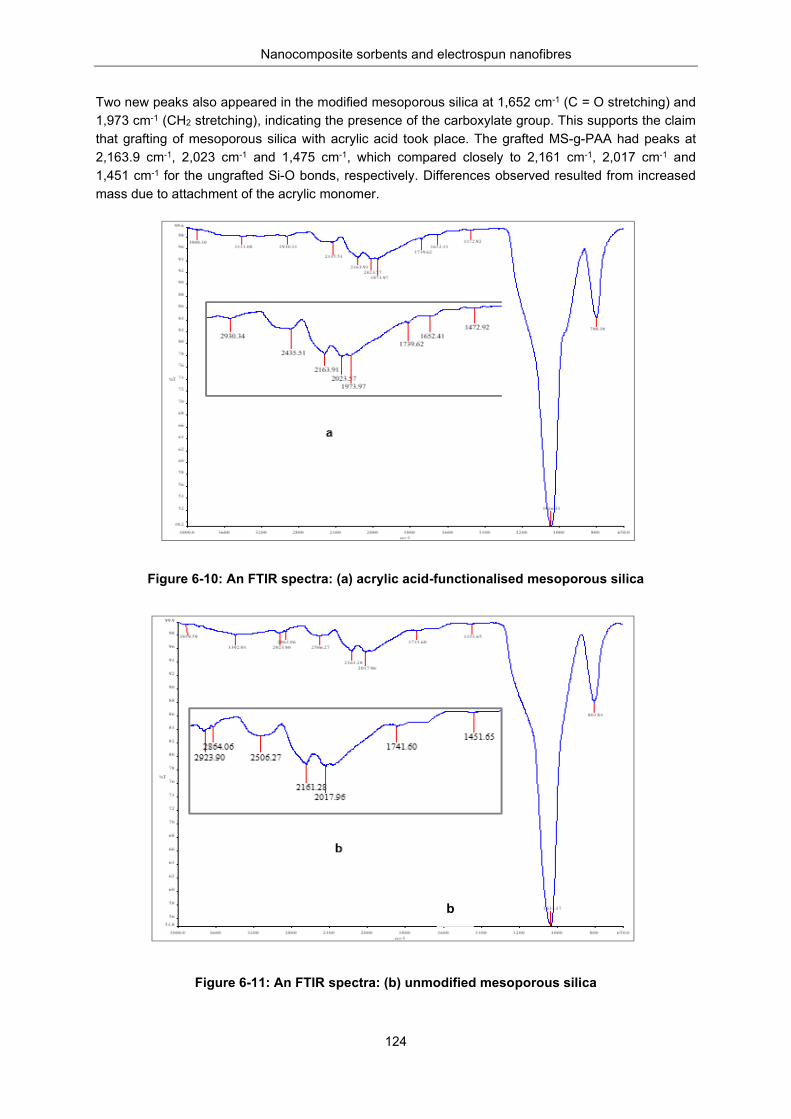
Nanocomposite sorbents and electrospun nanofibres
124
Two new peaks also appeared in the modified mesoporous silica at 1,652 cm-1 (C = O stretching) and 1,973 cm-1 (CH2 stretching), indicating the presence of the carboxylate group. This supports the claim that grafting of mesoporous silica with acrylic acid took place. The grafted MS-g-PAA had peaks at 2,163.9 cm-1, 2,023 cm-1 and 1,475 cm-1, which compared closely to 2,161 cm-1, 2,017 cm-1 and 1,451 cm-1 for the ungrafted Si-O bonds, respectively. Differences observed resulted from increased mass due to attachment of the acrylic monomer.
Figure 6-10: An FTIR spectra: (a) acrylic acid-functionalised mesoporous silica
Figure 6-11: An FTIR spectra: (b) unmodified mesoporous silica
b
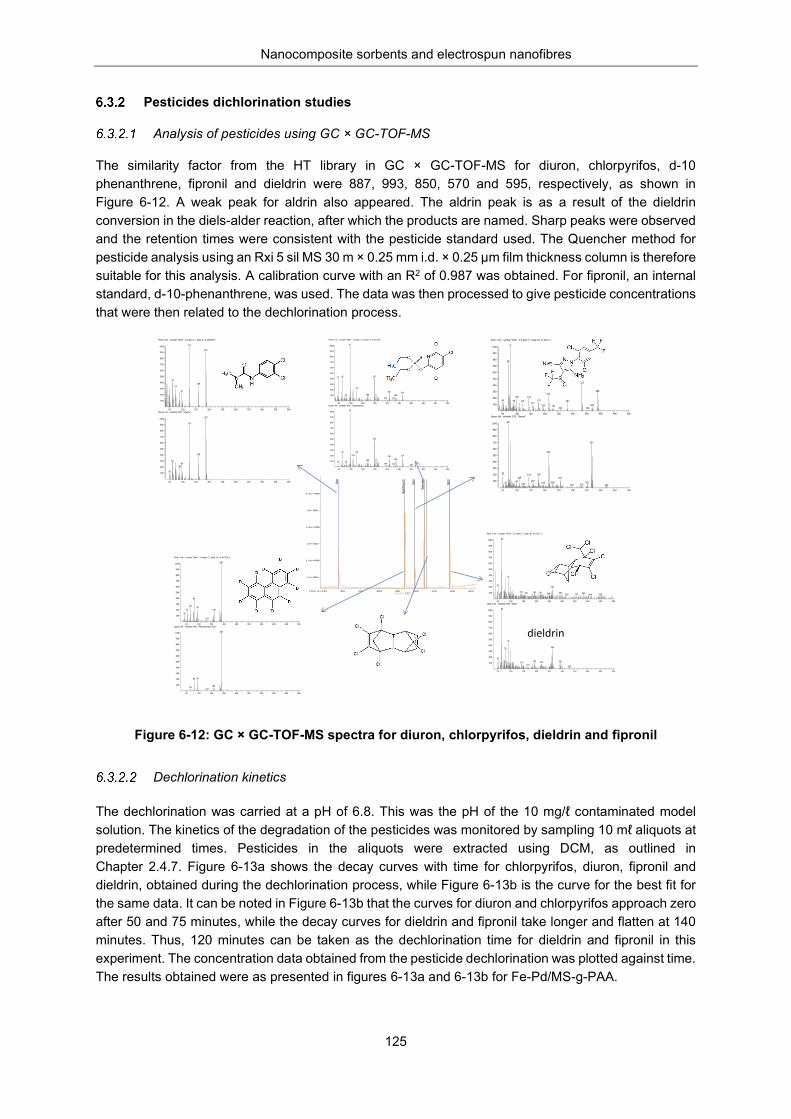
Nanocomposite sorbents and electrospun nanofibres
125
Pesticides dichlorination studies
Analysis of pesticides using GC × GC-TOF-MS
The similarity factor from the HT library in GC × GC-TOF-MS for diuron, chlorpyrifos, d-10 phenanthrene, fipronil and dieldrin were 887, 993, 850, 570 and 595, respectively, as shown in Figure 6-12. A weak peak for aldrin also appeared. The aldrin peak is as a result of the dieldrin conversion in the diels-alder reaction, after which the products are named. Sharp peaks were observed and the retention times were consistent with the pesticide standard used. The Quencher method for pesticide analysis using an Rxi 5 sil MS 30 m × 0.25 mm i.d. × 0.25 µm film thickness column is therefore suitable for this analysis. A calibration curve with an R2 of 0.987 was obtained. For fipronil, an internal standard, d-10-phenanthrene, was used. The data was then processed to give pesticide concentrations that were then related to the dechlorination process.
Figure 6-12: GC × GC-TOF-MS spectra for diuron, chlorpyrifos, dieldrin and fipronil
Dechlorination kinetics
The dechlorination was carried at a pH of 6.8. This was the pH of the 10 mg/ℓ contaminated model solution. The kinetics of the degradation of the pesticides was monitored by sampling 10 mℓ aliquots at predetermined times. Pesticides in the aliquots were extracted using DCM, as outlined in Chapter 2.4.7. Figure 6-13a shows the decay curves with time for chlorpyrifos, diuron, fipronil and dieldrin, obtained during the dechlorination process, while Figure 6-13b is the curve for the best fit for the same data. It can be noted in Figure 6-13b that the curves for diuron and chlorpyrifos approach zero after 50 and 75 minutes, while the decay curves for dieldrin and fipronil take longer and flatten at 140 minutes. Thus, 120 minutes can be taken as the dechlorination time for dieldrin and fipronil in this experiment. The concentration data obtained from the pesticide dechlorination was plotted against time. The results obtained were as presented in figures 6-13a and 6-13b for Fe-Pd/MS-g-PAA.
250 300 350 400 450 500 550 600 650
1e+006
1.5e+006
2e+006
2.5e+006
3e+006
3.5e+006
Time (s)
Diuron
Phenan
threne-
D10 Fipronil
Chlorp
yriphos
Dieldrin
TIC
50 100 150 200 250 300 350 400 450 500
100
200
300
400
500
600
700
800
900
1000 124
187
62 159
73
97
Peak True - sample "Std4 - 3.0 ppm:1", peak 4, at 289.85 s
50 100 150 200 250 300 350 400 450 500
100
200
300
400
500
600
700
800
900
1000 187
124
159
61 97
88
50
Library Hit - similarity 887, "Diuron"
50 100 150 200 250 300 350 400 450 500
100
200
300
400
500
600
700
800
900
1000 188
80
66 94
160 52 42
132
Peak True - sample "Std4 - 3.0 ppm:1", peak 19, at 470.35 s
50 100 150 200 250 300 350 400 450 500
100
200
300
400
500
600
700
800
900
1000 188
94 80
158 66 132
Library Hit - similarity 850, "Phenanthrene-D10"
50 100 150 200 250 300 350 400 450 500
100
200
300
400
500
600
700
800
900
1000 77
69
333
388 213
100 143 179 50 90 120 281
157 369 194 231
353 255
Peak True - sample "Std4 - 3.0 ppm:1", peak 24, at 497.5 s
50 100 150 200 250 300 350 400 450 500
100
200
300
400
500
600
700
800
900
1000 69
367
213
50 178 143 109 255
157 99 228 351 194 61 123 332 297 420
Library Hit - similarity 570, "Fipronil"
50 100 150 200 250 300 350 400 450 500
100
200
300
400
500
600
700
800
900
1000 97
197 65 47
125
258 314 169 81 286
244 276
Peak True - sample "Std4 - 3.0 ppm:1", peak 34, at 522.55 s
50 100 150 200 250 300 350 400 450 500
100
200
300
400
500
600
700
800
900
1000 97
197
125 65 109 314 258
286 169 81 47
244 276 351
Library Hit - similarity 933, "Chlorpyriphos"
50 100 150 200 250 300 350 400 450 500
100
200
300
400
500
600
700
800
900
1000 66
91
51 263
141 193 215 293 160 384 248 356 449 318 410
Peak True - sample "Std4 - 3.0 ppm:1", peak 36, at 529.7 s
50 100 150 200 250 300 350 400 450 500
100
200
300
400
500
600
700
800
900
1000 66
91
263 79
51 193 293 220 143
167 329
Library Hit - similarity 595, "Aldrin"
dieldrin
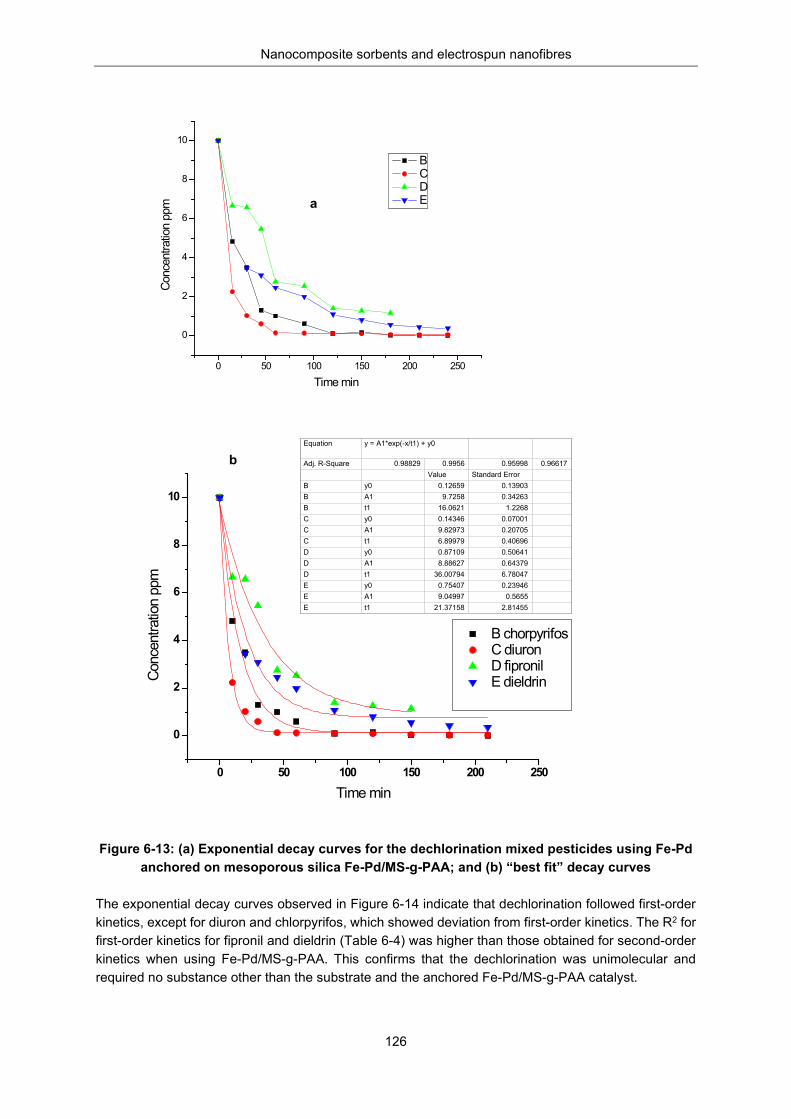
Nanocomposite sorbents and electrospun nanofibres
126
Figure 6-13: (a) Exponential decay curves for the dechlorination mixed pesticides using Fe-Pd anchored on mesoporous silica Fe-Pd/MS-g-PAA; and (b) “best fit” decay curves
The exponential decay curves observed in Figure 6-14 indicate that dechlorination followed first-order kinetics, except for diuron and chlorpyrifos, which showed deviation from first-order kinetics. The R2 for first-order kinetics for fipronil and dieldrin (Table 6-4) was higher than those obtained for second-order kinetics when using Fe-Pd/MS-g-PAA. This confirms that the dechlorination was unimolecular and required no substance other than the substrate and the anchored Fe-Pd/MS-g-PAA catalyst.
0 50 100 150 200 250
0
2
4
6
8
10
B chorpyrifos C diuron D fipronil E dieldrinCo
ncen
tratio
n pp
m
Time min
Equation y = A1*exp(-x/t1) + y0
Adj. R-Square 0.98829 0.9956 0.95998 0.96617Value Standard Error
B y0 0.12659 0.13903B A1 9.7258 0.34263B t1 16.0621 1.2268C y0 0.14346 0.07001C A1 9.82973 0.20705C t1 6.89979 0.40696D y0 0.87109 0.50641D A1 8.88627 0.64379D t1 36.00794 6.78047E y0 0.75407 0.23946E A1 9.04997 0.5655E t1 21.37158 2.81455
b
a
0 50 100 150 200 250
0
2
4
6
8
10
Conc
entra
tion
ppm
Time min
B C D E
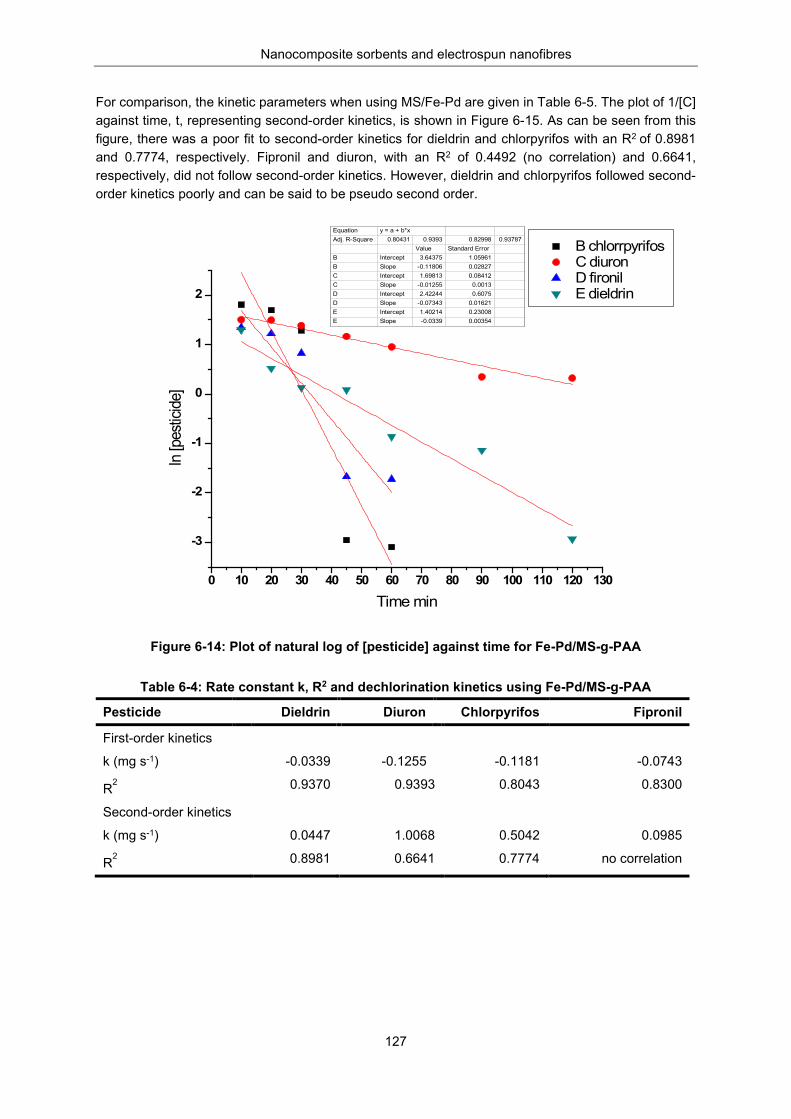
Nanocomposite sorbents and electrospun nanofibres
127
For comparison, the kinetic parameters when using MS/Fe-Pd are given in Table 6-5. The plot of 1/[C] against time, t, representing second-order kinetics, is shown in Figure 6-15. As can be seen from this figure, there was a poor fit to second-order kinetics for dieldrin and chlorpyrifos with an R2 of 0.8981 and 0.7774, respectively. Fipronil and diuron, with an R2 of 0.4492 (no correlation) and 0.6641, respectively, did not follow second-order kinetics. However, dieldrin and chlorpyrifos followed second-order kinetics poorly and can be said to be pseudo second order.
Figure 6-14: Plot of natural log of [pesticide] against time for Fe-Pd/MS-g-PAA
Table 6-4: Rate constant k, R2 and dechlorination kinetics using Fe-Pd/MS-g-PAA
Pesticide Dieldrin Diuron Chlorpyrifos Fipronil
First-order kinetics
k (mg s-1) -0.0339 -0.1255 -0.1181 -0.0743
R2 0.9370 0.9393 0.8043 0.8300
Second-order kinetics
k (mg s-1) 0.0447 1.0068 0.5042 0.0985
R2 0.8981 0.6641 0.7774 no correlation
0 10 20 30 40 50 60 70 80 90 100 110 120 130
-3
-2
-1
0
1
2
B chlorrpyrifos C diuron D fironil E dieldrin
ln [p
estic
ide]
Time min
Equation y = a + b*xAdj. R-Square 0.80431 0.9393 0.82998 0.93787
Value Standard ErrorB Intercept 3.64375 1.05961B Slope -0.11806 0.02827C Intercept 1.69813 0.08412C Slope -0.01255 0.0013D Intercept 2.42244 0.6075D Slope -0.07343 0.01621E Intercept 1.40214 0.23008E Slope -0.0339 0.00354
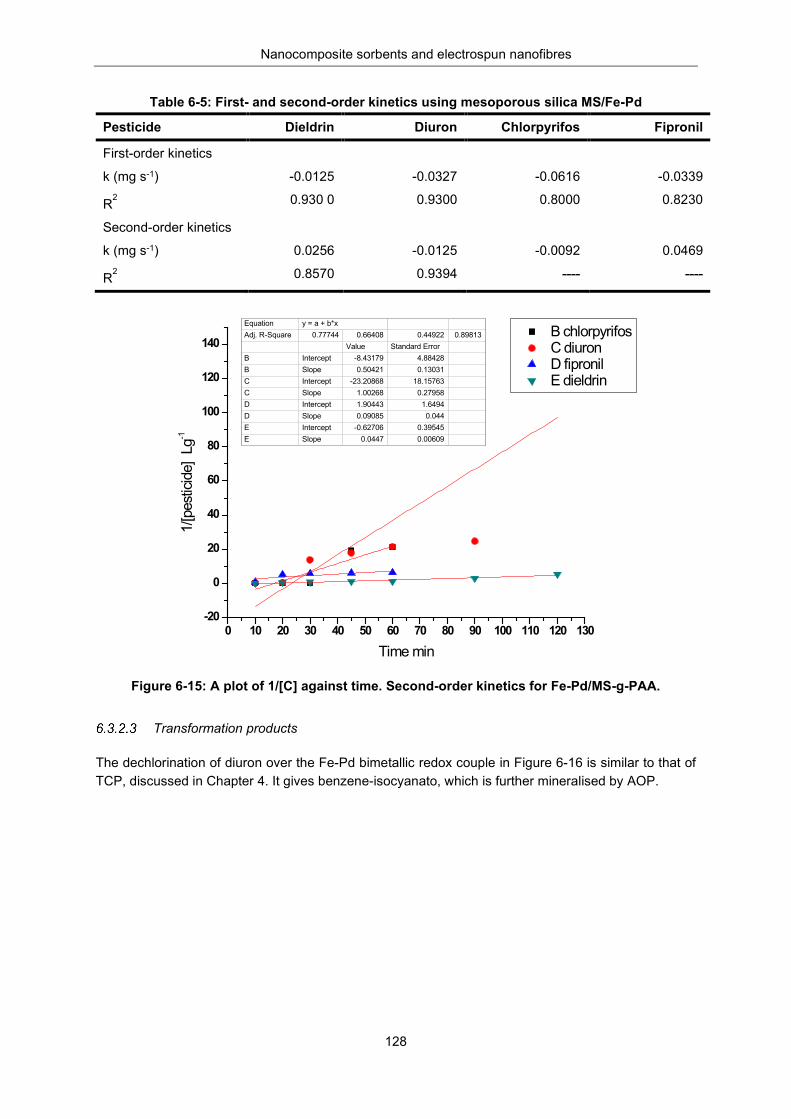
Nanocomposite sorbents and electrospun nanofibres
128
Table 6-5: First- and second-order kinetics using mesoporous silica MS/Fe-Pd
Pesticide Dieldrin Diuron Chlorpyrifos Fipronil
First-order kinetics
k (mg s-1) -0.0125 -0.0327 -0.0616 -0.0339
R2 0.930 0 0.9300 0.8000 0.8230
Second-order kinetics
k (mg s-1) 0.0256 -0.0125 -0.0092 0.0469
R2 0.8570 0.9394 ---- ----
Figure 6-15: A plot of 1/[C] against time. Second-order kinetics for Fe-Pd/MS-g-PAA.
Transformation products
The dechlorination of diuron over the Fe-Pd bimetallic redox couple in Figure 6-16 is similar to that of TCP, discussed in Chapter 4. It gives benzene-isocyanato, which is further mineralised by AOP.
0 10 20 30 40 50 60 70 80 90 100 110 120 130-20
0
20
40
60
80
100
120
140 B chlorpyrifos C diuron D fipronil E dieldrin
1/[p
estic
ide]
Lg-1
Time min
Equation y = a + b*xAdj. R-Square 0.77744 0.66408 0.44922 0.89813
Value Standard ErrorB Intercept -8.43179 4.88428B Slope 0.50421 0.13031C Intercept -23.20868 18.15763C Slope 1.00268 0.27958D Intercept 1.90443 1.6494D Slope 0.09085 0.044E Intercept -0.62706 0.39545E Slope 0.0447 0.00609
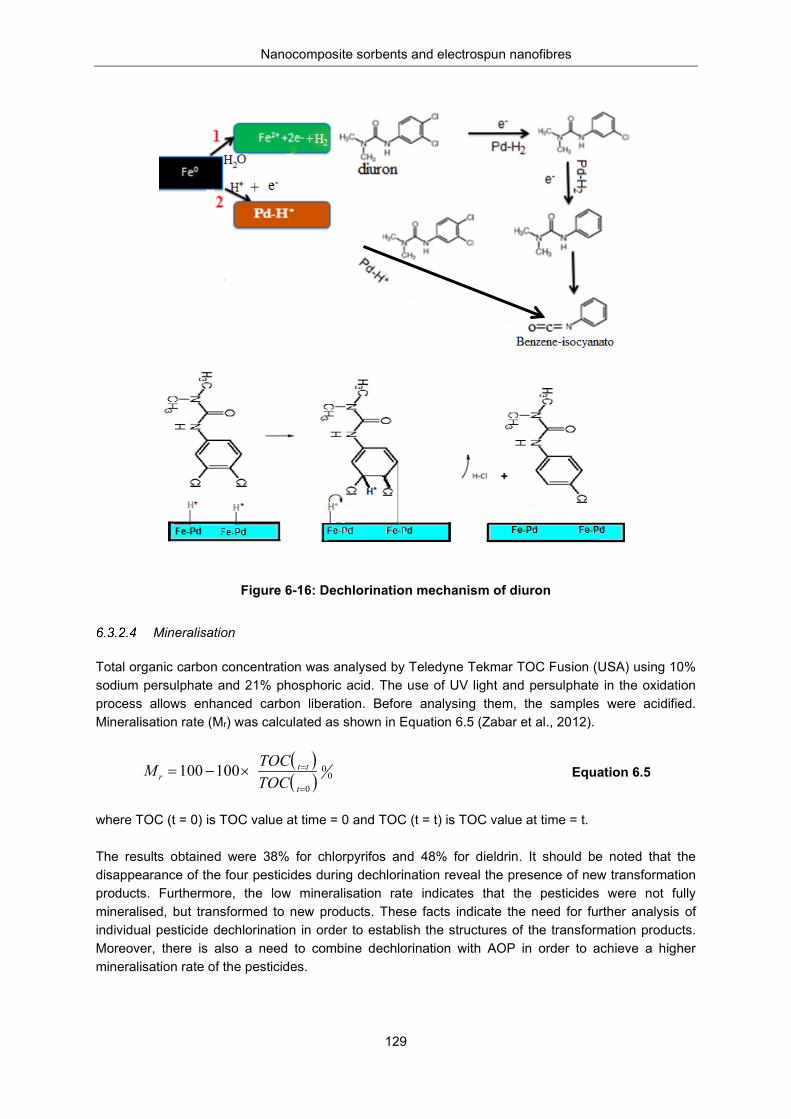
Nanocomposite sorbents and electrospun nanofibres
129
Figure 6-16: Dechlorination mechanism of diuron
Mineralisation
Total organic carbon concentration was analysed by Teledyne Tekmar TOC Fusion (USA) using 10% sodium persulphate and 21% phosphoric acid. The use of UV light and persulphate in the oxidation process allows enhanced carbon liberation. Before analysing them, the samples were acidified. Mineralisation rate (Mr) was calculated as shown in Equation 6.5 (Zabar et al., 2012).
Equation 6.5
where TOC (t = 0) is TOC value at time = 0 and TOC (t = t) is TOC value at time = t. The results obtained were 38% for chlorpyrifos and 48% for dieldrin. It should be noted that the disappearance of the four pesticides during dechlorination reveal the presence of new transformation products. Furthermore, the low mineralisation rate indicates that the pesticides were not fully mineralised, but transformed to new products. These facts indicate the need for further analysis of individual pesticide dechlorination in order to establish the structures of the transformation products. Moreover, there is also a need to combine dechlorination with AOP in order to achieve a higher mineralisation rate of the pesticides.
( )( ) 0
0
0
100100=
=×−=t
ttr TOC
TOCM
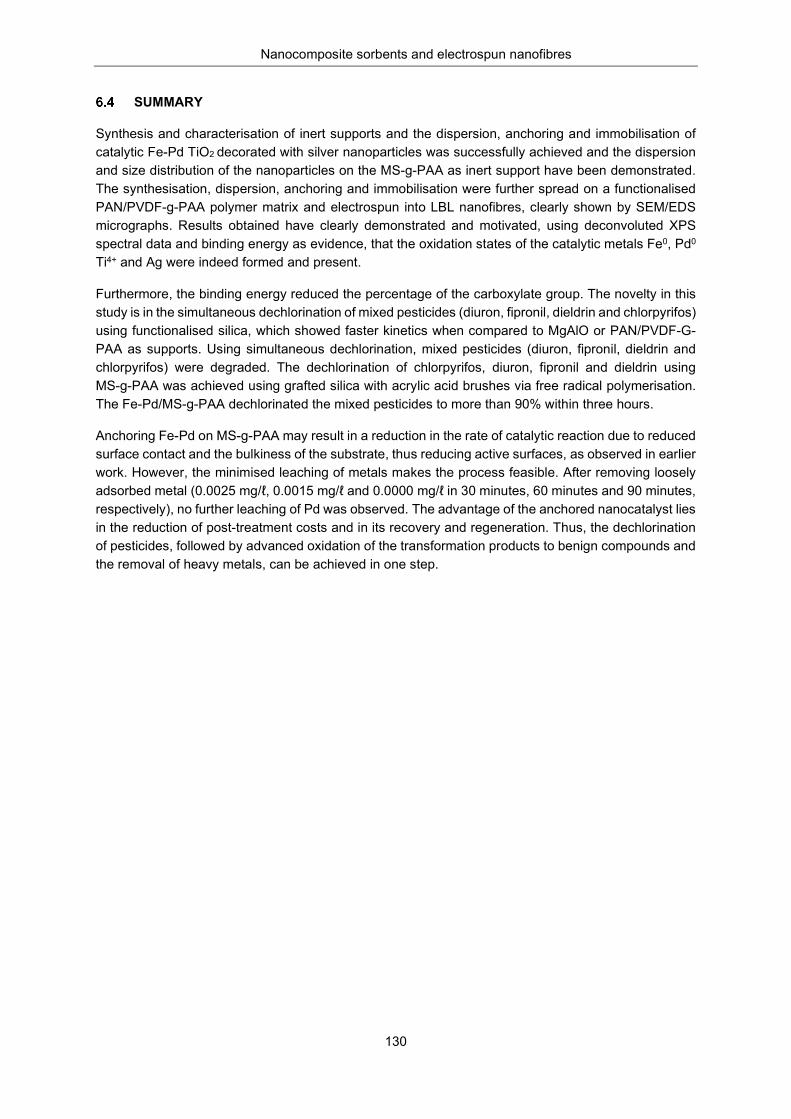
Nanocomposite sorbents and electrospun nanofibres
130
SUMMARY
Synthesis and characterisation of inert supports and the dispersion, anchoring and immobilisation of catalytic Fe-Pd TiO2 decorated with silver nanoparticles was successfully achieved and the dispersion and size distribution of the nanoparticles on the MS-g-PAA as inert support have been demonstrated. The synthesisation, dispersion, anchoring and immobilisation were further spread on a functionalised PAN/PVDF-g-PAA polymer matrix and electrospun into LBL nanofibres, clearly shown by SEM/EDS micrographs. Results obtained have clearly demonstrated and motivated, using deconvoluted XPS spectral data and binding energy as evidence, that the oxidation states of the catalytic metals Fe0, Pd0 Ti4+ and Ag were indeed formed and present.
Furthermore, the binding energy reduced the percentage of the carboxylate group. The novelty in this study is in the simultaneous dechlorination of mixed pesticides (diuron, fipronil, dieldrin and chlorpyrifos) using functionalised silica, which showed faster kinetics when compared to MgAlO or PAN/PVDF-G-PAA as supports. Using simultaneous dechlorination, mixed pesticides (diuron, fipronil, dieldrin and chlorpyrifos) were degraded. The dechlorination of chlorpyrifos, diuron, fipronil and dieldrin using MS-g-PAA was achieved using grafted silica with acrylic acid brushes via free radical polymerisation. The Fe-Pd/MS-g-PAA dechlorinated the mixed pesticides to more than 90% within three hours.
Anchoring Fe-Pd on MS-g-PAA may result in a reduction in the rate of catalytic reaction due to reduced surface contact and the bulkiness of the substrate, thus reducing active surfaces, as observed in earlier work. However, the minimised leaching of metals makes the process feasible. After removing loosely adsorbed metal (0.0025 mg/ℓ, 0.0015 mg/ℓ and 0.0000 mg/ℓ in 30 minutes, 60 minutes and 90 minutes, respectively), no further leaching of Pd was observed. The advantage of the anchored nanocatalyst lies in the reduction of post-treatment costs and in its recovery and regeneration. Thus, the dechlorination of pesticides, followed by advanced oxidation of the transformation products to benign compounds and the removal of heavy metals, can be achieved in one step.
Nanocomposite sorbents and electrospun nanofibres
131
CHAPTER 7: ELECTROSPUN AND FUNCTIONALISED PVDF/PAN COMPOSITES FOR THE REMOVAL OF
TRACE METALS2
INTRODUCTION
A major global problem today is the limited availability and access to clean water. This is attributed to the population explosion and excessive water pollution, resulting from anthropogenic activities. Trace metals (lead, chromium, cadmium, mercury and arsenic) are among the toxic pollutants of great concern (Pradeep and Anshup, 2009; Duruibe et al., 2007). Exposure to these pollutants via oral, olfactory or dermal routes may cause them to accumulate in the body and adversely affect human health. Unfortunately, the human body’s metabolic mechanisms are not capable of ejecting them adequately, leading to the occurrence of negative health effects such as stomach disorders, vomiting, diarrhoea, haemoglobinuria, ataxia, paralysis and convulsion, tremors, depression and pneumonia (in the event of the inhalation of volatile vapours or fumes) and death (Nomngongo et al., 2013). Several cases of lead and cadmium poisoning have been documented. Among others, these two pollutants exhibit extremely high levels of health and environmental risks due to their potent toxicity and easy availability, hence, they are of particular interest. Popular sources of lead in the environment include the storage of batteries, lead recycling, mining and smelting, the combustion of leaded gasoline, lead water pipes, ammunition solder, leaded paint, photographic materials, television picture tubes, obsolete insecticides (such as lead arsenate), atomic energy installations, petroleum and leatherworks (Singh et al., 2006). The WHO’s standard limit for lead in drinking water is 0.01 µg.ℓ-1 (WHO, 2008). However, this limit has been commonly exceeded in water bodies found at or near most industrial areas of the aforementioned sources, leading to reported cases of lead poisoning (plumbism) (Kokori et al., 1999; Tandon et al., 2001; Flora and Pachauri, 2010; Cao et al., 2015). In an effort to curb this menace, the use of lead additives in gasoline and in the paint industry has been banned in most countries. However, other potential sources still need close monitoring and strict regulation. The presence of cadmium in the environment often results from volcanic eruptions. Human exposure may result in kidney failure, lung cancer and bone defects (Godt et al., 2006). Due to its higher toxicity (compared to lead), the WHO standard for cadmium in drinking water is much lower: 0.003 µg ℓ-1 (WHO, 2008). The popular methods for the removal of these toxic metals from water include flocculation, precipitation, filtration, reverse osmosis, ion exchange, evaporation and electrodeposition (Ngah et al., 2002; Renault et al. 2009). However, these techniques are barely efficient for this purpose, owing to their multistep modes. Some also require high pressure to introduce water through small pore sizes, leading to shortcomings such as a high pressure drop and fouling (Desai and Kit, 2008). Another important problem that is commonly associated with these methods is the production of large quantities of highly toxic sludge, the disposal of which is challenging (Akkaya and Ulusoy, 2008).
Therefore, remediation using improved and cost-effective methods is required. In this respect, adsorption by functionalised polymers offers a viable solution, especially in the secondary stage of water purification (i.e. demineralisation and conditioning). The possibility of regeneration and reuse, which are characteristic of adsorbents, add to their merit over other materials.
2 This chapter has been published in Journal of Physics and Chemistry of the Earth: http://dx.doi.org/10.1016/j.pce.2016.08.007
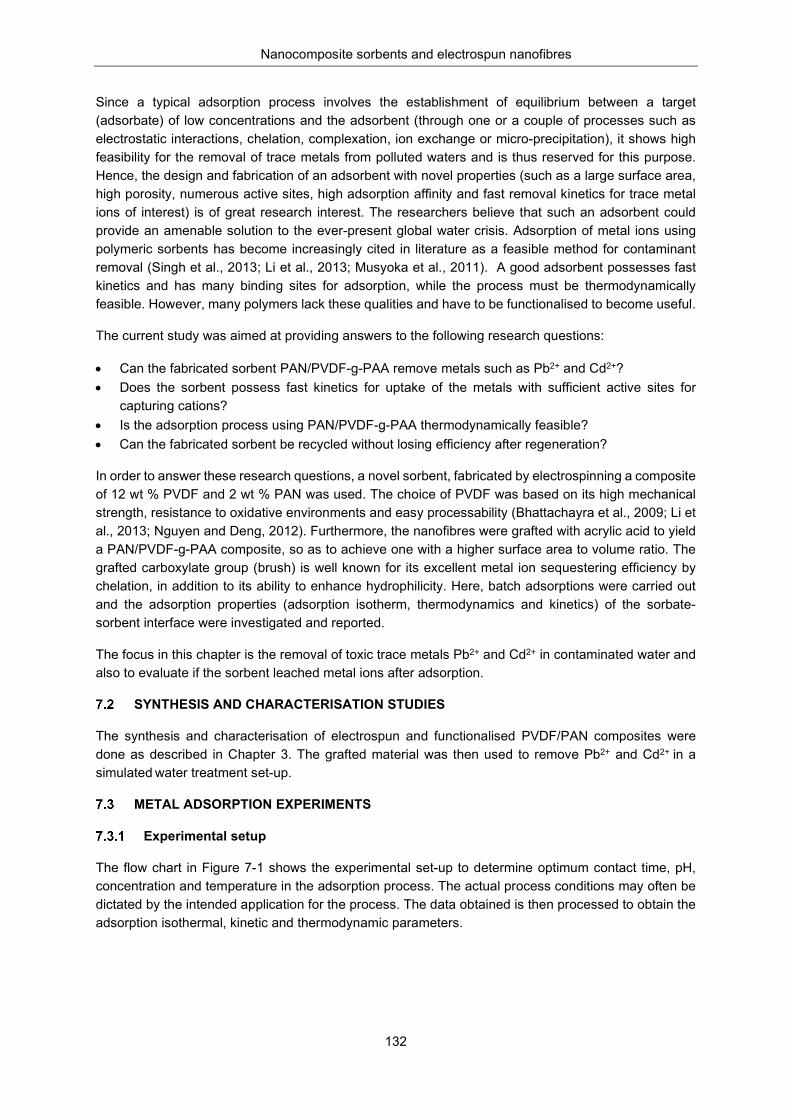
Nanocomposite sorbents and electrospun nanofibres
132
Since a typical adsorption process involves the establishment of equilibrium between a target (adsorbate) of low concentrations and the adsorbent (through one or a couple of processes such as electrostatic interactions, chelation, complexation, ion exchange or micro-precipitation), it shows high feasibility for the removal of trace metals from polluted waters and is thus reserved for this purpose. Hence, the design and fabrication of an adsorbent with novel properties (such as a large surface area, high porosity, numerous active sites, high adsorption affinity and fast removal kinetics for trace metal ions of interest) is of great research interest. The researchers believe that such an adsorbent could provide an amenable solution to the ever-present global water crisis. Adsorption of metal ions using polymeric sorbents has become increasingly cited in literature as a feasible method for contaminant removal (Singh et al., 2013; Li et al., 2013; Musyoka et al., 2011). A good adsorbent possesses fast kinetics and has many binding sites for adsorption, while the process must be thermodynamically feasible. However, many polymers lack these qualities and have to be functionalised to become useful.
The current study was aimed at providing answers to the following research questions:
• Can the fabricated sorbent PAN/PVDF-g-PAA remove metals such as Pb2+ and Cd2+? • Does the sorbent possess fast kinetics for uptake of the metals with sufficient active sites for
capturing cations? • Is the adsorption process using PAN/PVDF-g-PAA thermodynamically feasible? • Can the fabricated sorbent be recycled without losing efficiency after regeneration?
In order to answer these research questions, a novel sorbent, fabricated by electrospinning a composite of 12 wt % PVDF and 2 wt % PAN was used. The choice of PVDF was based on its high mechanical strength, resistance to oxidative environments and easy processability (Bhattachayra et al., 2009; Li et al., 2013; Nguyen and Deng, 2012). Furthermore, the nanofibres were grafted with acrylic acid to yield a PAN/PVDF-g-PAA composite, so as to achieve one with a higher surface area to volume ratio. The grafted carboxylate group (brush) is well known for its excellent metal ion sequestering efficiency by chelation, in addition to its ability to enhance hydrophilicity. Here, batch adsorptions were carried out and the adsorption properties (adsorption isotherm, thermodynamics and kinetics) of the sorbate-sorbent interface were investigated and reported.
The focus in this chapter is the removal of toxic trace metals Pb2+ and Cd2+ in contaminated water and also to evaluate if the sorbent leached metal ions after adsorption.
SYNTHESIS AND CHARACTERISATION STUDIES
The synthesis and characterisation of electrospun and functionalised PVDF/PAN composites were done as described in Chapter 3. The grafted material was then used to remove Pb2+ and Cd2+ in a simulated water treatment set-up.
METAL ADSORPTION EXPERIMENTS
Experimental setup
The flow chart in Figure 7-1 shows the experimental set-up to determine optimum contact time, pH, concentration and temperature in the adsorption process. The actual process conditions may often be dictated by the intended application for the process. The data obtained is then processed to obtain the adsorption isothermal, kinetic and thermodynamic parameters.
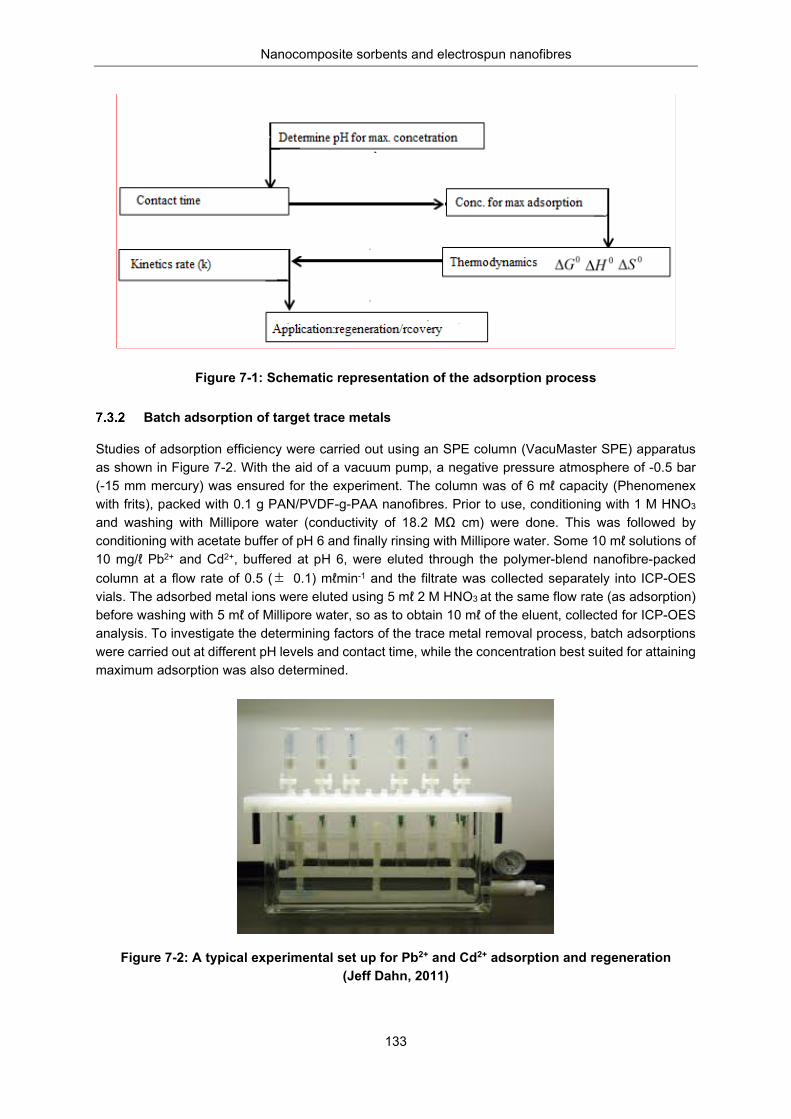
Nanocomposite sorbents and electrospun nanofibres
133
Figure 7-1: Schematic representation of the adsorption process
Batch adsorption of target trace metals
Studies of adsorption efficiency were carried out using an SPE column (VacuMaster SPE) apparatus as shown in Figure 7-2. With the aid of a vacuum pump, a negative pressure atmosphere of -0.5 bar (-15 mm mercury) was ensured for the experiment. The column was of 6 mℓ capacity (Phenomenex with frits), packed with 0.1 g PAN/PVDF-g-PAA nanofibres. Prior to use, conditioning with 1 M HNO3 and washing with Millipore water (conductivity of 18.2 MΩ cm) were done. This was followed by conditioning with acetate buffer of pH 6 and finally rinsing with Millipore water. Some 10 mℓ solutions of 10 mg/ℓ Pb2+ and Cd2+, buffered at pH 6, were eluted through the polymer-blend nanofibre-packed column at a flow rate of 0.5 ( 0.1) mℓmin-1 and the filtrate was collected separately into ICP-OES vials. The adsorbed metal ions were eluted using 5 mℓ 2 M HNO3 at the same flow rate (as adsorption) before washing with 5 mℓ of Millipore water, so as to obtain 10 mℓ of the eluent, collected for ICP-OES analysis. To investigate the determining factors of the trace metal removal process, batch adsorptions were carried out at different pH levels and contact time, while the concentration best suited for attaining maximum adsorption was also determined.
Figure 7-2: A typical experimental set up for Pb2+ and Cd2+ adsorption and regeneration (Jeff Dahn, 2011)
±
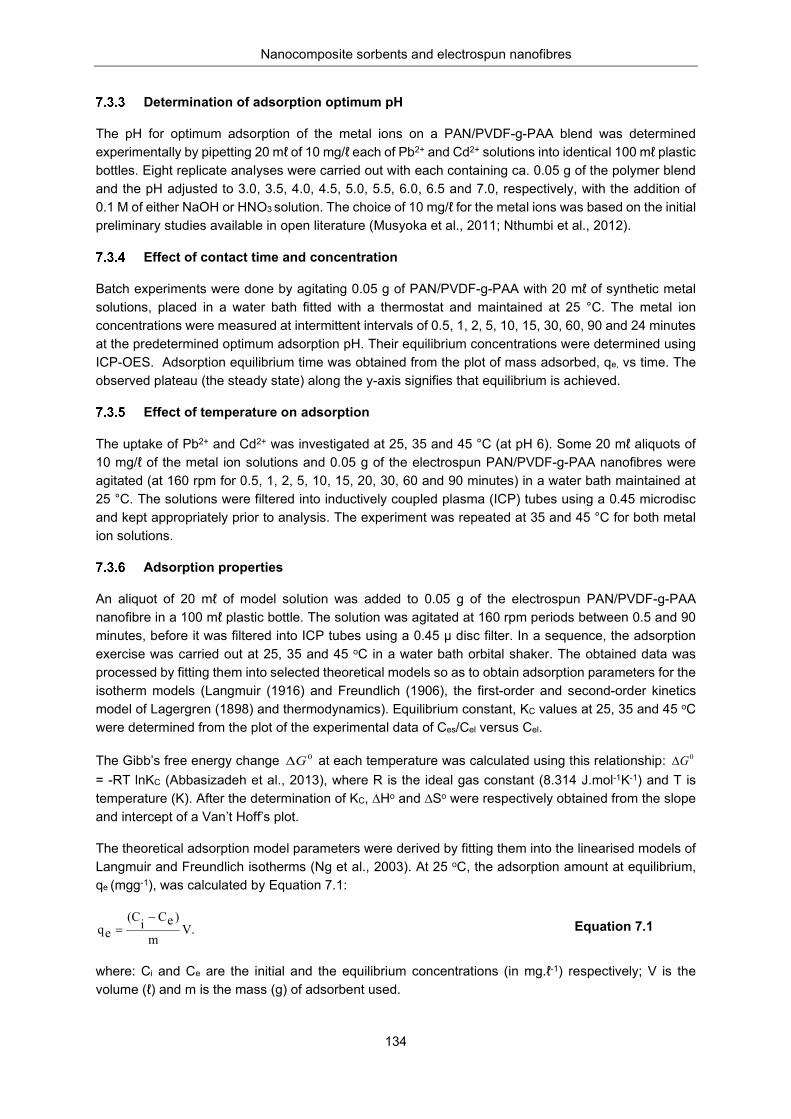
Nanocomposite sorbents and electrospun nanofibres
134
Determination of adsorption optimum pH
The pH for optimum adsorption of the metal ions on a PAN/PVDF-g-PAA blend was determined experimentally by pipetting 20 mℓ of 10 mg/ℓ each of Pb2+ and Cd2+ solutions into identical 100 mℓ plastic bottles. Eight replicate analyses were carried out with each containing ca. 0.05 g of the polymer blend and the pH adjusted to 3.0, 3.5, 4.0, 4.5, 5.0, 5.5, 6.0, 6.5 and 7.0, respectively, with the addition of 0.1 M of either NaOH or HNO3 solution. The choice of 10 mg/ℓ for the metal ions was based on the initial preliminary studies available in open literature (Musyoka et al., 2011; Nthumbi et al., 2012).
Effect of contact time and concentration
Batch experiments were done by agitating 0.05 g of PAN/PVDF-g-PAA with 20 mℓ of synthetic metal solutions, placed in a water bath fitted with a thermostat and maintained at 25 °C. The metal ion concentrations were measured at intermittent intervals of 0.5, 1, 2, 5, 10, 15, 30, 60, 90 and 24 minutes at the predetermined optimum adsorption pH. Their equilibrium concentrations were determined using ICP-OES. Adsorption equilibrium time was obtained from the plot of mass adsorbed, qe, vs time. The observed plateau (the steady state) along the y-axis signifies that equilibrium is achieved.
Effect of temperature on adsorption
The uptake of Pb2+ and Cd2+ was investigated at 25, 35 and 45 °C (at pH 6). Some 20 mℓ aliquots of 10 mg/ℓ of the metal ion solutions and 0.05 g of the electrospun PAN/PVDF-g-PAA nanofibres were agitated (at 160 rpm for 0.5, 1, 2, 5, 10, 15, 20, 30, 60 and 90 minutes) in a water bath maintained at 25 °C. The solutions were filtered into inductively coupled plasma (ICP) tubes using a 0.45 microdisc and kept appropriately prior to analysis. The experiment was repeated at 35 and 45 °C for both metal ion solutions.
Adsorption properties
An aliquot of 20 mℓ of model solution was added to 0.05 g of the electrospun PAN/PVDF-g-PAA nanofibre in a 100 mℓ plastic bottle. The solution was agitated at 160 rpm periods between 0.5 and 90 minutes, before it was filtered into ICP tubes using a 0.45 µ disc filter. In a sequence, the adsorption exercise was carried out at 25, 35 and 45 oC in a water bath orbital shaker. The obtained data was processed by fitting them into selected theoretical models so as to obtain adsorption parameters for the isotherm models (Langmuir (1916) and Freundlich (1906), the first-order and second-order kinetics model of Lagergren (1898) and thermodynamics). Equilibrium constant, KC values at 25, 35 and 45 oC were determined from the plot of the experimental data of Ces/Cel versus Cel.
The Gibb’s free energy change at each temperature was calculated using this relationship: = -RT lnKC (Abbasizadeh et al., 2013), where R is the ideal gas constant (8.314 J.mol-1K-1) and T is temperature (K). After the determination of KC, ∆Ho and ∆So were respectively obtained from the slope and intercept of a Van’t Hoff’s plot.
The theoretical adsorption model parameters were derived by fitting them into the linearised models of Langmuir and Freundlich isotherms (Ng et al., 2003). At 25 oC, the adsorption amount at equilibrium, qe (mgg-1), was calculated by Equation 7.1:
Equation 7.1
where: Ci and Ce are the initial and the equilibrium concentrations (in mg.ℓ-1) respectively; V is the volume (ℓ) and m is the mass (g) of adsorbent used.
0G∆ 0G∆
V.m
)eCi(Ceq
−=
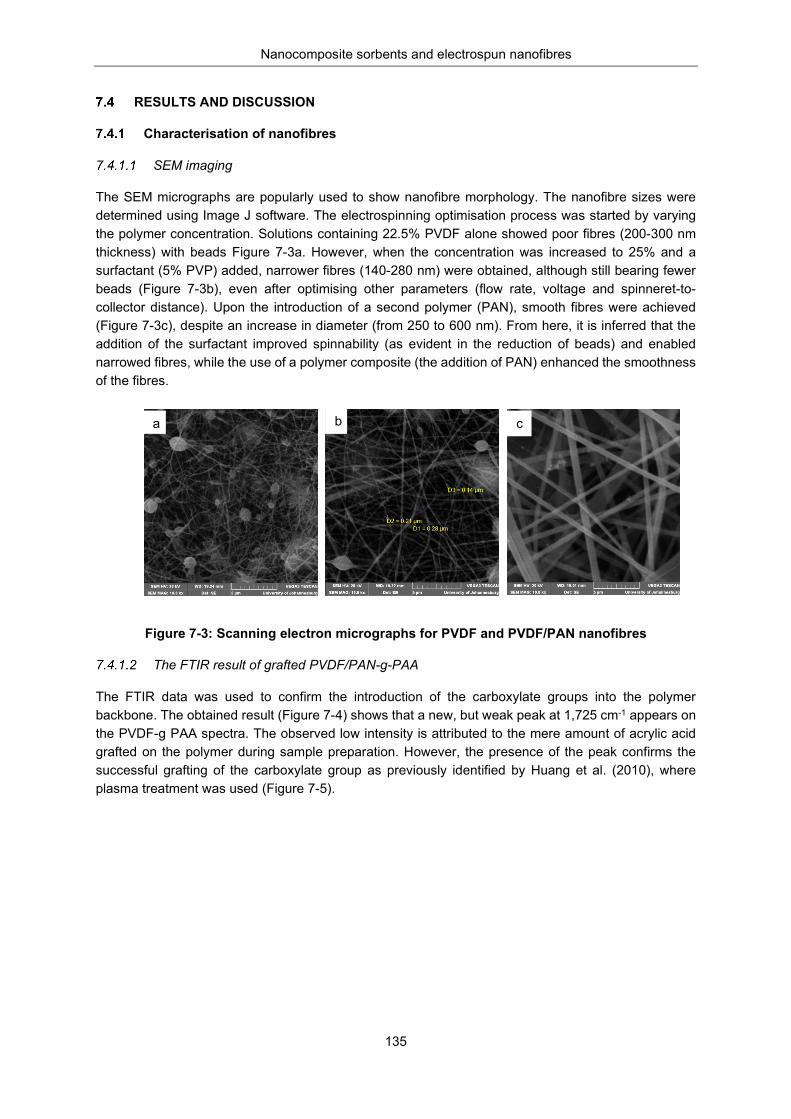
Nanocomposite sorbents and electrospun nanofibres
135
RESULTS AND DISCUSSION
Characterisation of nanofibres
SEM imaging
The SEM micrographs are popularly used to show nanofibre morphology. The nanofibre sizes were determined using Image J software. The electrospinning optimisation process was started by varying the polymer concentration. Solutions containing 22.5% PVDF alone showed poor fibres (200-300 nm thickness) with beads Figure 7-3a. However, when the concentration was increased to 25% and a surfactant (5% PVP) added, narrower fibres (140-280 nm) were obtained, although still bearing fewer beads (Figure 7-3b), even after optimising other parameters (flow rate, voltage and spinneret-to-collector distance). Upon the introduction of a second polymer (PAN), smooth fibres were achieved (Figure 7-3c), despite an increase in diameter (from 250 to 600 nm). From here, it is inferred that the addition of the surfactant improved spinnability (as evident in the reduction of beads) and enabled narrowed fibres, while the use of a polymer composite (the addition of PAN) enhanced the smoothness of the fibres.
Figure 7-3: Scanning electron micrographs for PVDF and PVDF/PAN nanofibres
The FTIR result of grafted PVDF/PAN-g-PAA
The FTIR data was used to confirm the introduction of the carboxylate groups into the polymer backbone. The obtained result (Figure 7-4) shows that a new, but weak peak at 1,725 cm-1 appears on the PVDF-g PAA spectra. The observed low intensity is attributed to the mere amount of acrylic acid grafted on the polymer during sample preparation. However, the presence of the peak confirms the successful grafting of the carboxylate group as previously identified by Huang et al. (2010), where plasma treatment was used (Figure 7-5).
a b c
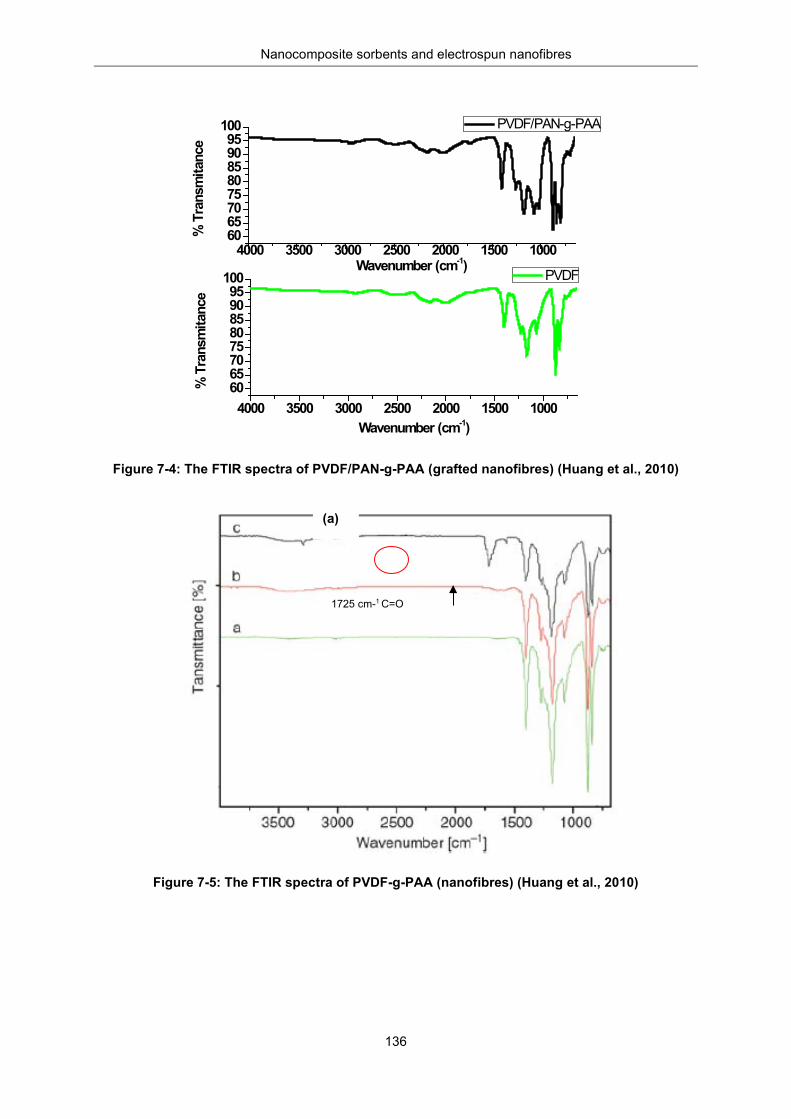
Nanocomposite sorbents and electrospun nanofibres
136
Figure 7-4: The FTIR spectra of PVDF/PAN-g-PAA (grafted nanofibres) (Huang et al., 2010)
Figure 7-5: The FTIR spectra of PVDF-g-PAA (nanofibres) (Huang et al., 2010)
4000 3500 3000 2500 2000 1500 10006065707580859095
100
4000 3500 3000 2500 2000 1500 10006065707580859095
100
% T
rans
mita
nce
Wavenumber (cm-1)
PVDF
% T
rans
mita
nce
Wavenumber (cm-1)
PVDF/PAN-g-PAA
(a)
1725 cm-1 C=O
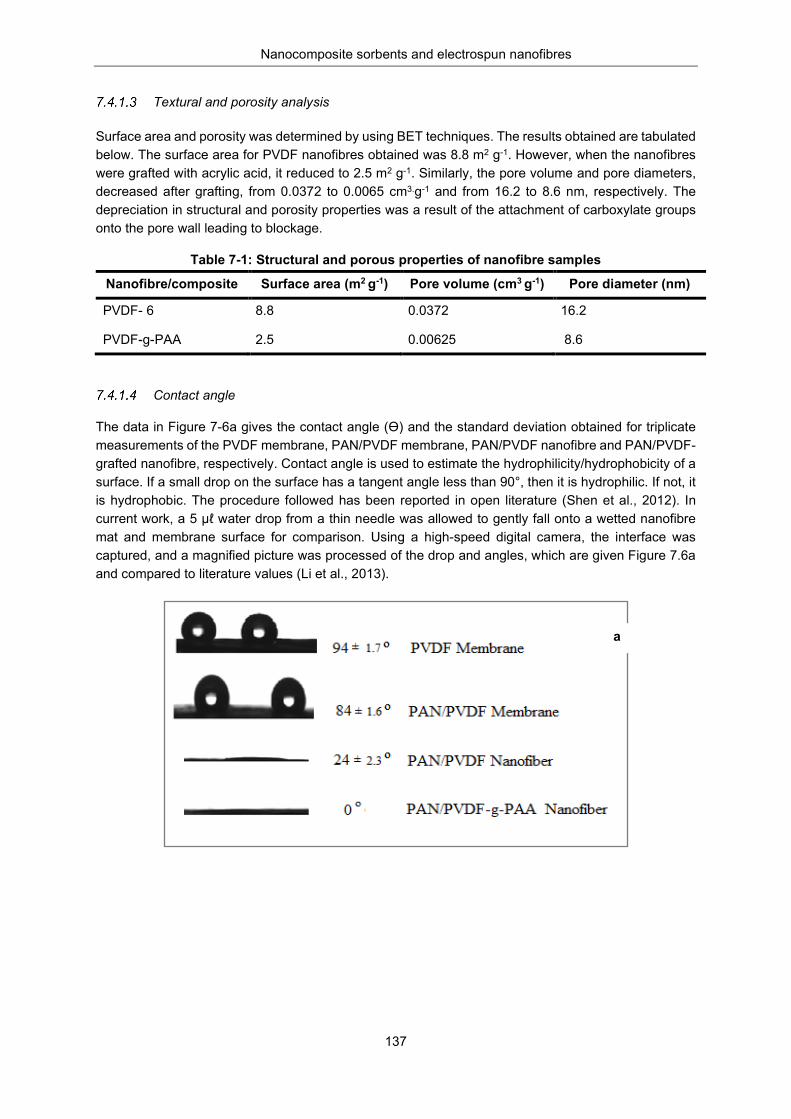
Nanocomposite sorbents and electrospun nanofibres
137
Textural and porosity analysis
Surface area and porosity was determined by using BET techniques. The results obtained are tabulated below. The surface area for PVDF nanofibres obtained was 8.8 m2 g-1. However, when the nanofibres were grafted with acrylic acid, it reduced to 2.5 m2 g-1. Similarly, the pore volume and pore diameters, decreased after grafting, from 0.0372 to 0.0065 cm3.g-1 and from 16.2 to 8.6 nm, respectively. The depreciation in structural and porosity properties was a result of the attachment of carboxylate groups onto the pore wall leading to blockage.
Table 7-1: Structural and porous properties of nanofibre samples
Nanofibre/composite Surface area (m2 g-1) Pore volume (cm3 g-1) Pore diameter (nm)
PVDF- 6 8.8 0.0372 16.2
PVDF-g-PAA 2.5 0.00625 8.6
Contact angle
The data in Figure 7-6a gives the contact angle (ϴ) and the standard deviation obtained for triplicate measurements of the PVDF membrane, PAN/PVDF membrane, PAN/PVDF nanofibre and PAN/PVDF-grafted nanofibre, respectively. Contact angle is used to estimate the hydrophilicity/hydrophobicity of a surface. If a small drop on the surface has a tangent angle less than 90°, then it is hydrophilic. If not, it is hydrophobic. The procedure followed has been reported in open literature (Shen et al., 2012). In current work, a 5 µℓ water drop from a thin needle was allowed to gently fall onto a wetted nanofibre mat and membrane surface for comparison. Using a high-speed digital camera, the interface was captured, and a magnified picture was processed of the drop and angles, which are given Figure 7.6a and compared to literature values (Li et al., 2013).
a
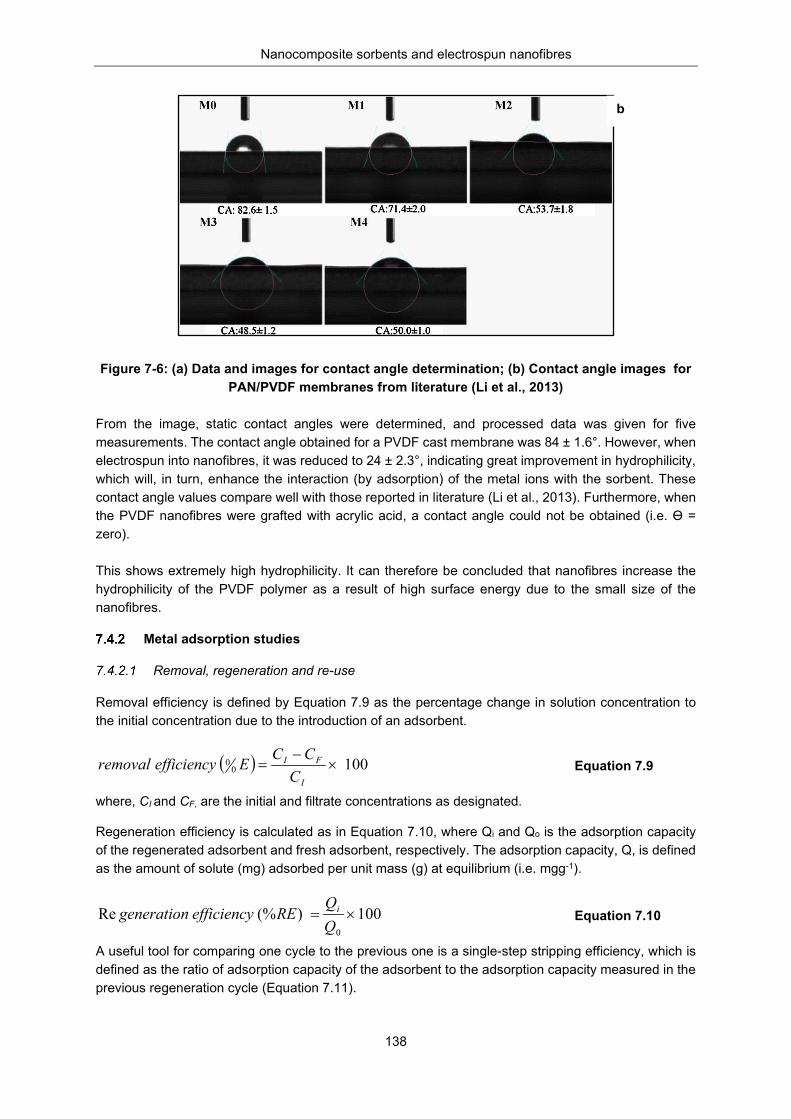
Nanocomposite sorbents and electrospun nanofibres
138
Figure 7-6: (a) Data and images for contact angle determination; (b) Contact angle images for PAN/PVDF membranes from literature (Li et al., 2013)
From the image, static contact angles were determined, and processed data was given for five measurements. The contact angle obtained for a PVDF cast membrane was 84 ± 1.6°. However, when electrospun into nanofibres, it was reduced to 24 ± 2.3°, indicating great improvement in hydrophilicity, which will, in turn, enhance the interaction (by adsorption) of the metal ions with the sorbent. These contact angle values compare well with those reported in literature (Li et al., 2013). Furthermore, when the PVDF nanofibres were grafted with acrylic acid, a contact angle could not be obtained (i.e. ϴ = zero). This shows extremely high hydrophilicity. It can therefore be concluded that nanofibres increase the hydrophilicity of the PVDF polymer as a result of high surface energy due to the small size of the nanofibres.
Metal adsorption studies
Removal, regeneration and re-use
Removal efficiency is defined by Equation 7.9 as the percentage change in solution concentration to the initial concentration due to the introduction of an adsorbent.
Equation 7.9
where, CI and CF, are the initial and filtrate concentrations as designated.
Regeneration efficiency is calculated as in Equation 7.10, where Qi and Qo is the adsorption capacity of the regenerated adsorbent and fresh adsorbent, respectively. The adsorption capacity, Q, is defined as the amount of solute (mg) adsorbed per unit mass (g) at equilibrium (i.e. mgg-1).
Equation 7.10
A useful tool for comparing one cycle to the previous one is a single-step stripping efficiency, which is defined as the ratio of adsorption capacity of the adsorbent to the adsorption capacity measured in the previous regeneration cycle (Equation 7.11).
( ) 10000 ×
−=
I
FI
CCCEefficiencyremoval
100)(%Re0
REefficiencygeneration i
b
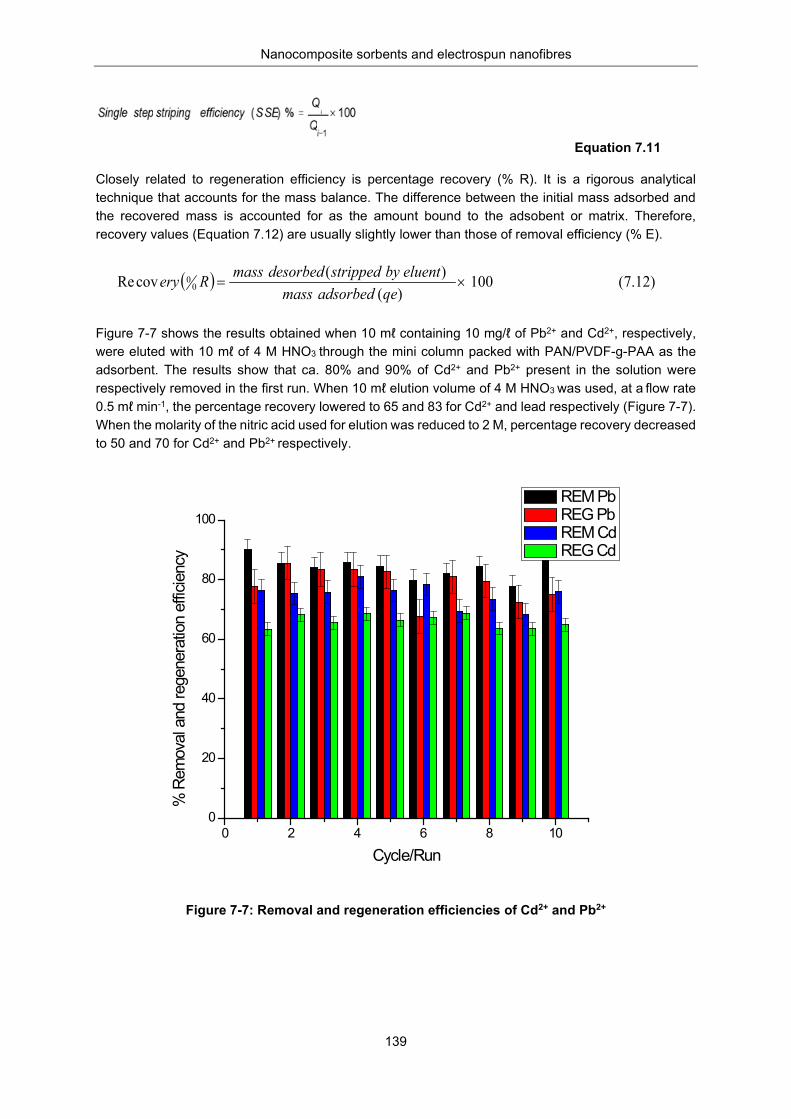
Nanocomposite sorbents and electrospun nanofibres
139
Equation 7.11
Closely related to regeneration efficiency is percentage recovery (% R). It is a rigorous analytical technique that accounts for the mass balance. The difference between the initial mass adsorbed and the recovered mass is accounted for as the amount bound to the adsobent or matrix. Therefore, recovery values (Equation 7.12) are usually slightly lower than those of removal efficiency (% E).
Figure 7-7 shows the results obtained when 10 mℓ containing 10 mg/ℓ of Pb2+ and Cd2+, respectively, were eluted with 10 mℓ of 4 M HNO3 through the mini column packed with PAN/PVDF-g-PAA as the adsorbent. The results show that ca. 80% and 90% of Cd2+ and Pb2+ present in the solution were respectively removed in the first run. When 10 mℓ elution volume of 4 M HNO3 was used, at a flow rate 0.5 mℓ min-1, the percentage recovery lowered to 65 and 83 for Cd2+ and lead respectively (Figure 7-7). When the molarity of the nitric acid used for elution was reduced to 2 M, percentage recovery decreased to 50 and 70 for Cd2+ and Pb2+ respectively.
Figure 7-7: Removal and regeneration efficiencies of Cd2+ and Pb2+
0 2 4 6 8 100
20
40
60
80
100
% R
emov
al a
nd re
gene
ratio
n ef
ficie
ncy
Cycle/Run
REM Pb REG Pb REM Cd REG Cd
( ) )12.7(100)(
)(covRe 00 ×=
qeadsorbedmasseluentbystrippeddesorbedmassRery
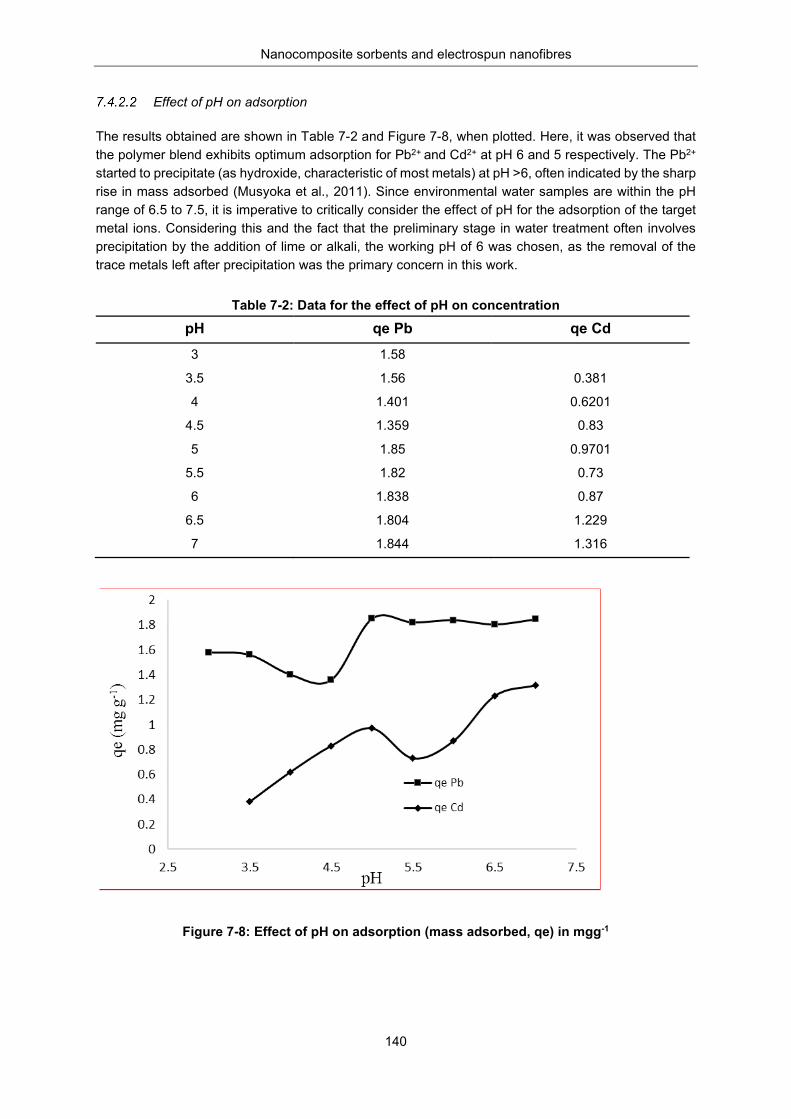
Nanocomposite sorbents and electrospun nanofibres
140
Effect of pH on adsorption
The results obtained are shown in Table 7-2 and Figure 7-8, when plotted. Here, it was observed that the polymer blend exhibits optimum adsorption for Pb2+ and Cd2+ at pH 6 and 5 respectively. The Pb2+ started to precipitate (as hydroxide, characteristic of most metals) at pH >6, often indicated by the sharp rise in mass adsorbed (Musyoka et al., 2011). Since environmental water samples are within the pH range of 6.5 to 7.5, it is imperative to critically consider the effect of pH for the adsorption of the target metal ions. Considering this and the fact that the preliminary stage in water treatment often involves precipitation by the addition of lime or alkali, the working pH of 6 was chosen, as the removal of the trace metals left after precipitation was the primary concern in this work.
Table 7-2: Data for the effect of pH on concentration pH qe Pb qe Cd
3 1.58
3.5 1.56 0.381
4 1.401 0.6201
4.5 1.359 0.83
5 1.85 0.9701
5.5 1.82 0.73
6 1.838 0.87
6.5 1.804 1.229
7 1.844 1.316
Figure 7-8: Effect of pH on adsorption (mass adsorbed, qe) in mgg-1
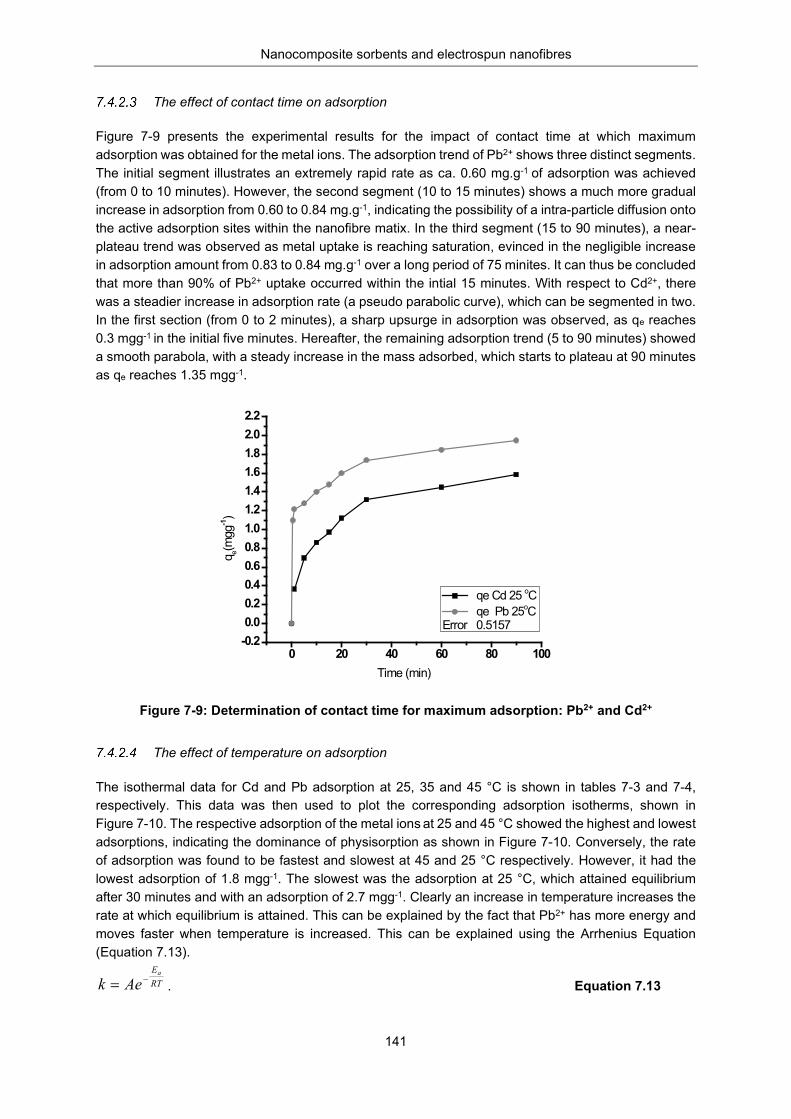
Nanocomposite sorbents and electrospun nanofibres
141
The effect of contact time on adsorption
Figure 7-9 presents the experimental results for the impact of contact time at which maximum adsorption was obtained for the metal ions. The adsorption trend of Pb2+ shows three distinct segments. The initial segment illustrates an extremely rapid rate as ca. 0.60 mg.g-1 of adsorption was achieved (from 0 to 10 minutes). However, the second segment (10 to 15 minutes) shows a much more gradual increase in adsorption from 0.60 to 0.84 mg.g-1, indicating the possibility of a intra-particle diffusion onto the active adsorption sites within the nanofibre matix. In the third segment (15 to 90 minutes), a near-plateau trend was observed as metal uptake is reaching saturation, evinced in the negligible increase in adsorption amount from 0.83 to 0.84 mg.g-1 over a long period of 75 minites. It can thus be concluded that more than 90% of Pb2+ uptake occurred within the intial 15 minutes. With respect to Cd2+, there was a steadier increase in adsorption rate (a pseudo parabolic curve), which can be segmented in two. In the first section (from 0 to 2 minutes), a sharp upsurge in adsorption was observed, as qe reaches 0.3 mgg-1 in the initial five minutes. Hereafter, the remaining adsorption trend (5 to 90 minutes) showed a smooth parabola, with a steady increase in the mass adsorbed, which starts to plateau at 90 minutes as qe reaches 1.35 mgg-1.
Figure 7-9: Determination of contact time for maximum adsorption: Pb2+ and Cd2+
The effect of temperature on adsorption
The isothermal data for Cd and Pb adsorption at 25, 35 and 45 °C is shown in tables 7-3 and 7-4, respectively. This data was then used to plot the corresponding adsorption isotherms, shown in Figure 7-10. The respective adsorption of the metal ions at 25 and 45 °C showed the highest and lowest adsorptions, indicating the dominance of physisorption as shown in Figure 7-10. Conversely, the rate of adsorption was found to be fastest and slowest at 45 and 25 °C respectively. However, it had the lowest adsorption of 1.8 mgg-1. The slowest was the adsorption at 25 °C, which attained equilibrium after 30 minutes and with an adsorption of 2.7 mgg-1. Clearly an increase in temperature increases the rate at which equilibrium is attained. This can be explained by the fact that Pb2+ has more energy and moves faster when temperature is increased. This can be explained using the Arrhenius Equation (Equation 7.13).
. Equation 7.13
0 20 40 60 80 100-0.20.00.20.40.60.81.01.21.41.61.82.02.2
q e(mgg
-1)
Time (min)
qe Cd 25 oC qe Pb 25oC
Error 0.5157
RTEa
Aek −=
Nanocomposite sorbents and electrospun nanofibres
142
where k is the rate constant, A is the frequency factor, Ea is the activation energy, R is the gas constant and T is temperature (K). The term RT represents the average kinetic energy. Therefore, increasing T increases the average kinetic energy, so the rate constant is k. However, the position of the equilibrium is dependent on thermodynamic parameters (ΔH, ΔG, ΔS), which also determine the direction and spontaneity of the adsorption and desorption reaction. The fast uptake of Pb2+ makes PAN/PVDF-g-PAA an excellent adsorbent for sequestering and removing heavy metals from contaminated water in less than one minute at 45 °C (Figure 7-10).
Table 7-3: Adsorption isotherm data for Cd
Table 7-4: Adsorption isotherm data for Pb
Time qe 25 oC Pb qe 35 oC Pb qe 45 oC Pb
0.5 1.55 1.5384 1.5026
1 1.486 1.66 1.516277
2 1.94 1.55712
5 1.95 2.011 1.64302
10 2.2161 2.103 1.820717
20 2.436653 1.766515
30 2.55796 2.196 1.745833
60 2.59817 2.288 1.846
90 2.636057 2.389 1.92
Time qe 25 oC Cd qe 35 oC Cd qe 45 oC Cd
0.5 0.33153 0.106263
1 0.366402 0.343497 0.340424
2 0.407952 0.419249 0.455421
5 0.698083 0.668731 0.439282
10 0.861486 0.660385
15 0.9713 0.808693 0.688091
20 1.1198 0.83008
30 1.31716 0.753968 0.959824
60 1.45 0.985811 1.289192
90 1.585 0.802692 1.43622
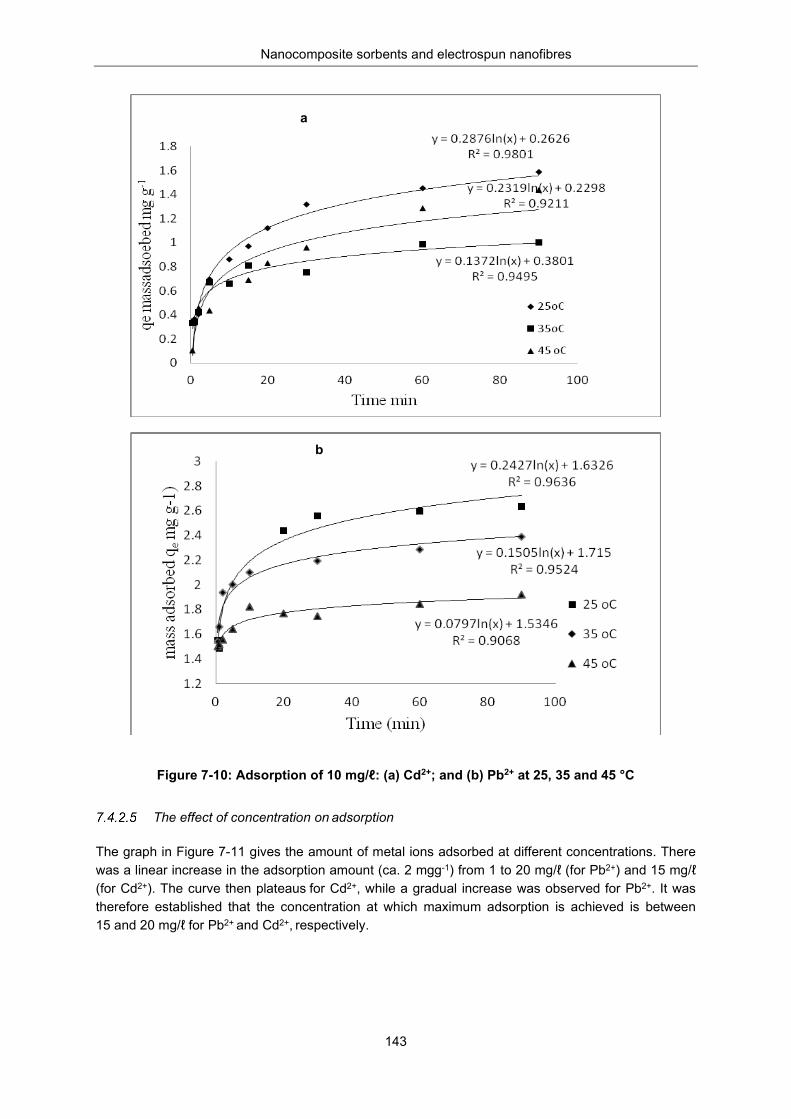
Nanocomposite sorbents and electrospun nanofibres
143
Figure 7-10: Adsorption of 10 mg/ℓ: (a) Cd2+; and (b) Pb2+ at 25, 35 and 45 °C
The effect of concentration on adsorption
The graph in Figure 7-11 gives the amount of metal ions adsorbed at different concentrations. There was a linear increase in the adsorption amount (ca. 2 mgg-1) from 1 to 20 mg/ℓ (for Pb2+) and 15 mg/ℓ (for Cd2+). The curve then plateaus for Cd2+, while a gradual increase was observed for Pb2+. It was therefore established that the concentration at which maximum adsorption is achieved is between 15 and 20 mg/ℓ for Pb2+ and Cd2+, respectively.
a
b
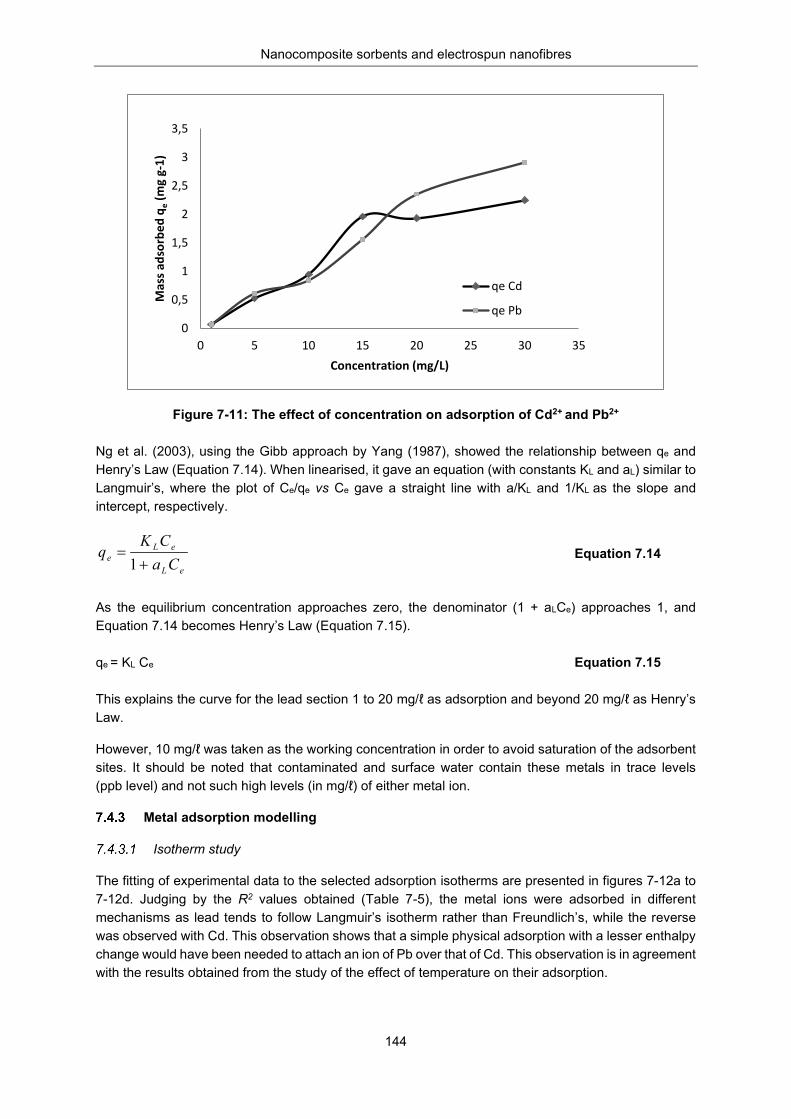
Nanocomposite sorbents and electrospun nanofibres
144
Figure 7-11: The effect of concentration on adsorption of Cd2+ and Pb2+
Ng et al. (2003), using the Gibb approach by Yang (1987), showed the relationship between qe and Henry’s Law (Equation 7.14). When linearised, it gave an equation (with constants KL and aL) similar to Langmuir’s, where the plot of Ce/qe vs Ce gave a straight line with a/KL and 1/KL as the slope and intercept, respectively.
Equation 7.14
As the equilibrium concentration approaches zero, the denominator (1 + aLCe) approaches 1, and Equation 7.14 becomes Henry’s Law (Equation 7.15). qe = KL Ce Equation 7.15 This explains the curve for the lead section 1 to 20 mg/ℓ as adsorption and beyond 20 mg/ℓ as Henry’s Law.
However, 10 mg/ℓ was taken as the working concentration in order to avoid saturation of the adsorbent sites. It should be noted that contaminated and surface water contain these metals in trace levels (ppb level) and not such high levels (in mg/ℓ) of either metal ion.
Metal adsorption modelling
Isotherm study
The fitting of experimental data to the selected adsorption isotherms are presented in figures 7-12a to 7-12d. Judging by the R2 values obtained (Table 7-5), the metal ions were adsorbed in different mechanisms as lead tends to follow Langmuir’s isotherm rather than Freundlich’s, while the reverse was observed with Cd. This observation shows that a simple physical adsorption with a lesser enthalpy change would have been needed to attach an ion of Pb over that of Cd. This observation is in agreement with the results obtained from the study of the effect of temperature on their adsorption.
0
0,5
1
1,5
2
2,5
3
3,5
0 5 10 15 20 25 30 35
Mas
s ads
orbe
d q e
(mg
g-1)
Concentration (mg/L)
qe Cd
qe Pb
eL
eLe Ca
CKq
+=
1
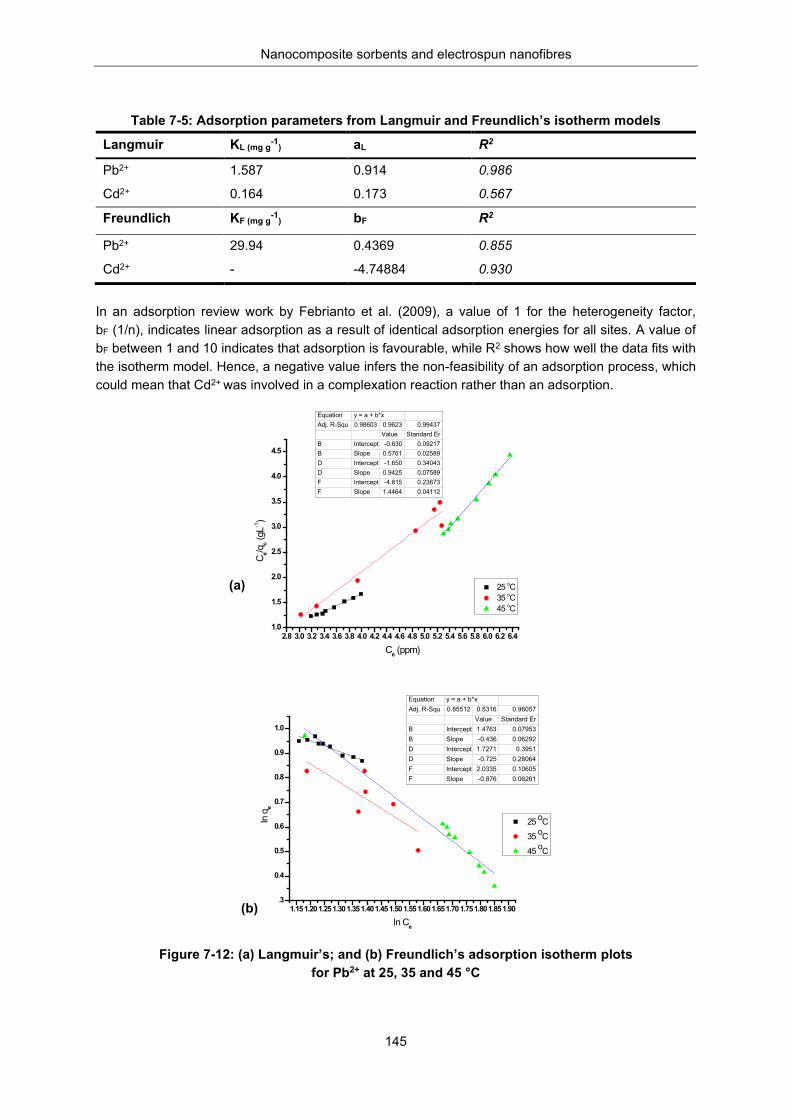
Nanocomposite sorbents and electrospun nanofibres
145
Table 7-5: Adsorption parameters from Langmuir and Freundlich’s isotherm models
Langmuir KL (mg g-1) aL R2
Pb2+ 1.587 0.914 0.986
Cd2+ 0.164 0.173 0.567
Freundlich KF (mg g-1) bF R2
Pb2+ 29.94 0.4369 0.855
Cd2+ - -4.74884 0.930
In an adsorption review work by Febrianto et al. (2009), a value of 1 for the heterogeneity factor, bF (1/n), indicates linear adsorption as a result of identical adsorption energies for all sites. A value of bF between 1 and 10 indicates that adsorption is favourable, while R2 shows how well the data fits with the isotherm model. Hence, a negative value infers the non-feasibility of an adsorption process, which could mean that Cd2+ was involved in a complexation reaction rather than an adsorption.
Figure 7-12: (a) Langmuir’s; and (b) Freundlich’s adsorption isotherm plots
for Pb2+ at 25, 35 and 45 °C
2.8 3.0 3.2 3.4 3.6 3.8 4.0 4.2 4.4 4.6 4.8 5.0 5.2 5.4 5.6 5.8 6.0 6.2 6.41.0
1.5
2.0
2.5
3.0
3.5
4.0
4.5
25 oC 35 oC 45 oC
C e/qe (
gL-1)
Ce (ppm)
Equation y = a + b*xAdj. R-Squ 0.98603 0.9623 0.99437
Value Standard ErB Intercept -0.630 0.09217B Slope 0.5761 0.02589D Intercept -1.650 0.34043D Slope 0.9425 0.07589F Intercept -4.815 0.23673F Slope 1.4464 0.04112
1.151.201.251.301.351.401.451.501.551.601.651.701.751.801.851.900.3
0.4
0.5
0.6
0.7
0.8
0.9
1.0
25 oC
35 oC
45 oC
ln q
e
ln Ce
Equation y = a + b*xAdj. R-Squ 0.85512 0.5316 0.96057
Value Standard ErB Intercept 1.4763 0.07953B Slope -0.436 0.06292D Intercept 1.7271 0.3951D Slope -0.725 0.28064F Intercept 2.0335 0.10605F Slope -0.876 0.06261
(a)
(b)
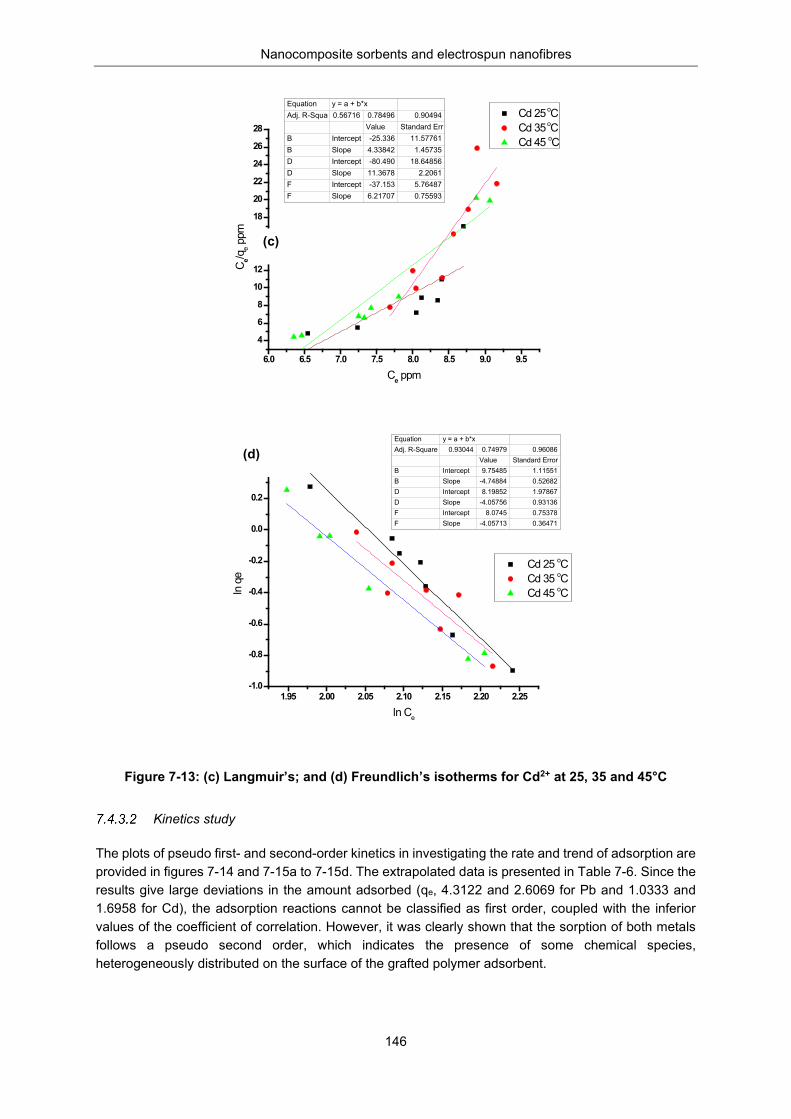
Nanocomposite sorbents and electrospun nanofibres
146
Figure 7-13: (c) Langmuir’s; and (d) Freundlich’s isotherms for Cd2+ at 25, 35 and 45°C
Kinetics study
The plots of pseudo first- and second-order kinetics in investigating the rate and trend of adsorption are provided in figures 7-14 and 7-15a to 7-15d. The extrapolated data is presented in Table 7-6. Since the results give large deviations in the amount adsorbed (qe, 4.3122 and 2.6069 for Pb and 1.0333 and 1.6958 for Cd), the adsorption reactions cannot be classified as first order, coupled with the inferior values of the coefficient of correlation. However, it was clearly shown that the sorption of both metals follows a pseudo second order, which indicates the presence of some chemical species, heterogeneously distributed on the surface of the grafted polymer adsorbent.
6.0 6.5 7.0 7.5 8.0 8.5 9.0 9.5
4
6
8
10
12
14
16
18
20
22
24
26
28
C e/qe p
pm
Ce ppm
Cd 25 oC Cd 35 oC Cd 45 oC
Equation y = a + b*xAdj. R-Squa 0.56716 0.78496 0.90494
Value Standard ErrB Intercept -25.336 11.57761B Slope 4.33842 1.45735D Intercept -80.490 18.64856D Slope 11.3678 2.2061F Intercept -37.153 5.76487F Slope 6.21707 0.75593
1.95 2.00 2.05 2.10 2.15 2.20 2.25-1.0
-0.8
-0.6
-0.4
-0.2
0.0
0.2
0.4
Cd 25 oC Cd 35 oC Cd 45 oCln
qe
ln Ce
Equation y = a + b*xAdj. R-Square 0.93044 0.74979 0.96086
Value Standard ErrorB Intercept 9.75485 1.11551B Slope -4.74884 0.52682D Intercept 8.19852 1.97867D Slope -4.05756 0.93136F Intercept 8.0745 0.75378F Slope -4.05713 0.36471
(d)
(c)
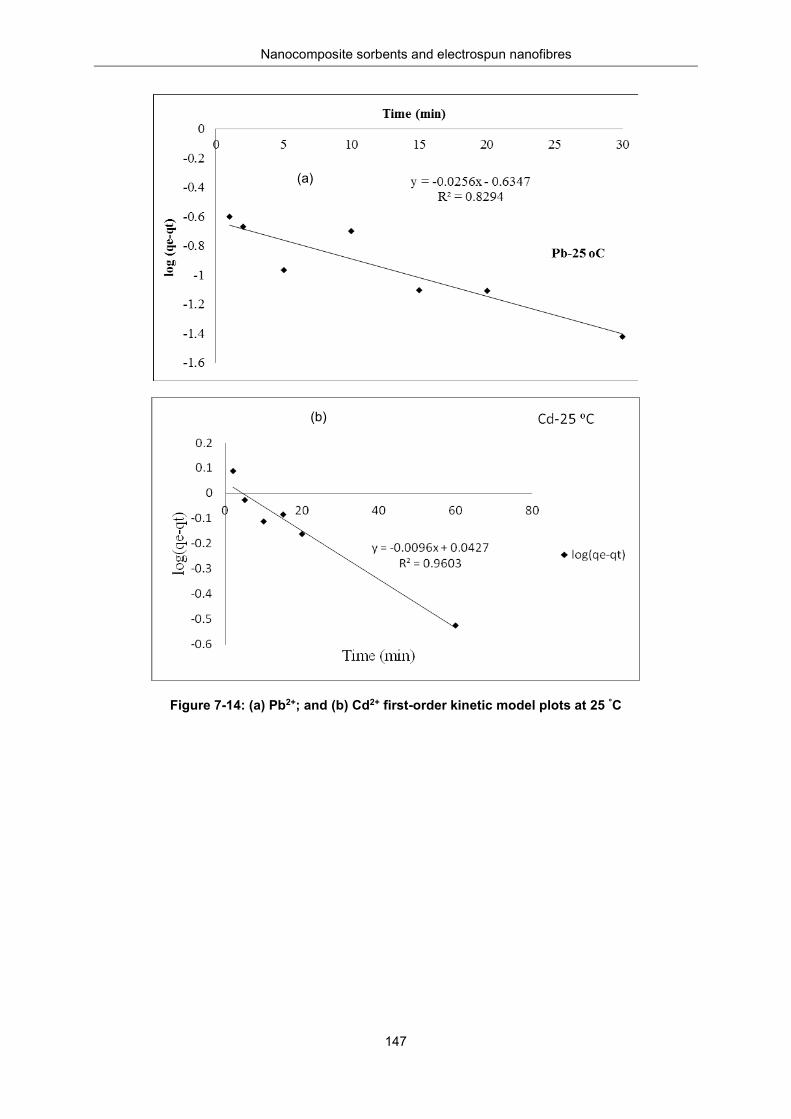
Nanocomposite sorbents and electrospun nanofibres
147
Figure 7-14: (a) Pb2+; and (b) Cd2+ first-order kinetic model plots at 25 °C
(a)
(b)
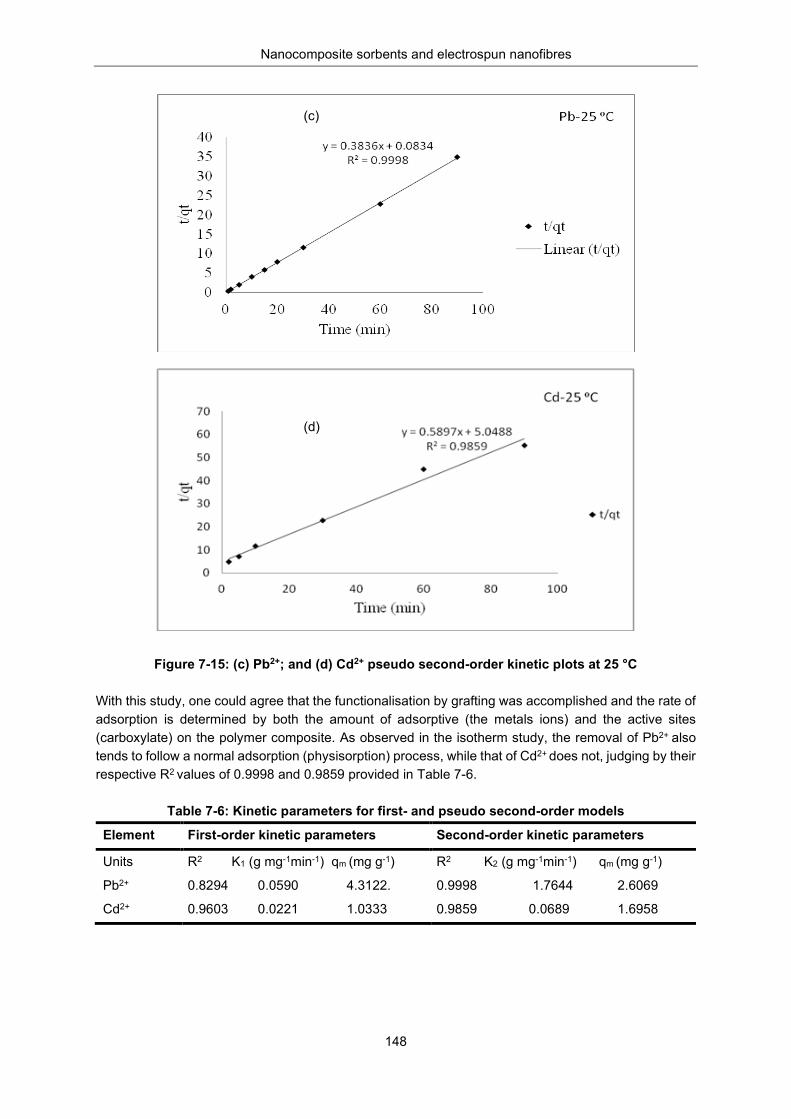
Nanocomposite sorbents and electrospun nanofibres
148
Figure 7-15: (c) Pb2+; and (d) Cd2+ pseudo second-order kinetic plots at 25 °C With this study, one could agree that the functionalisation by grafting was accomplished and the rate of adsorption is determined by both the amount of adsorptive (the metals ions) and the active sites (carboxylate) on the polymer composite. As observed in the isotherm study, the removal of Pb2+ also
tends to follow a normal adsorption (physisorption) process, while that of Cd2+ does not, judging by their respective R2 values of 0.9998 and 0.9859 provided in Table 7-6.
Table 7-6: Kinetic parameters for first- and pseudo second-order models
Element First-order kinetic parameters Second-order kinetic parameters
Units R2 K1 (g mg-1min-1) qm (mg g-1) R2 K2 (g mg-1min-1) qm (mg g-1)
Pb2+ 0.8294 0.0590 4.3122. 0.9998 1.7644 2.6069
Cd2+ 0.9603 0.0221 1.0333 0.9859 0.0689 1.6958
(c)
(d)
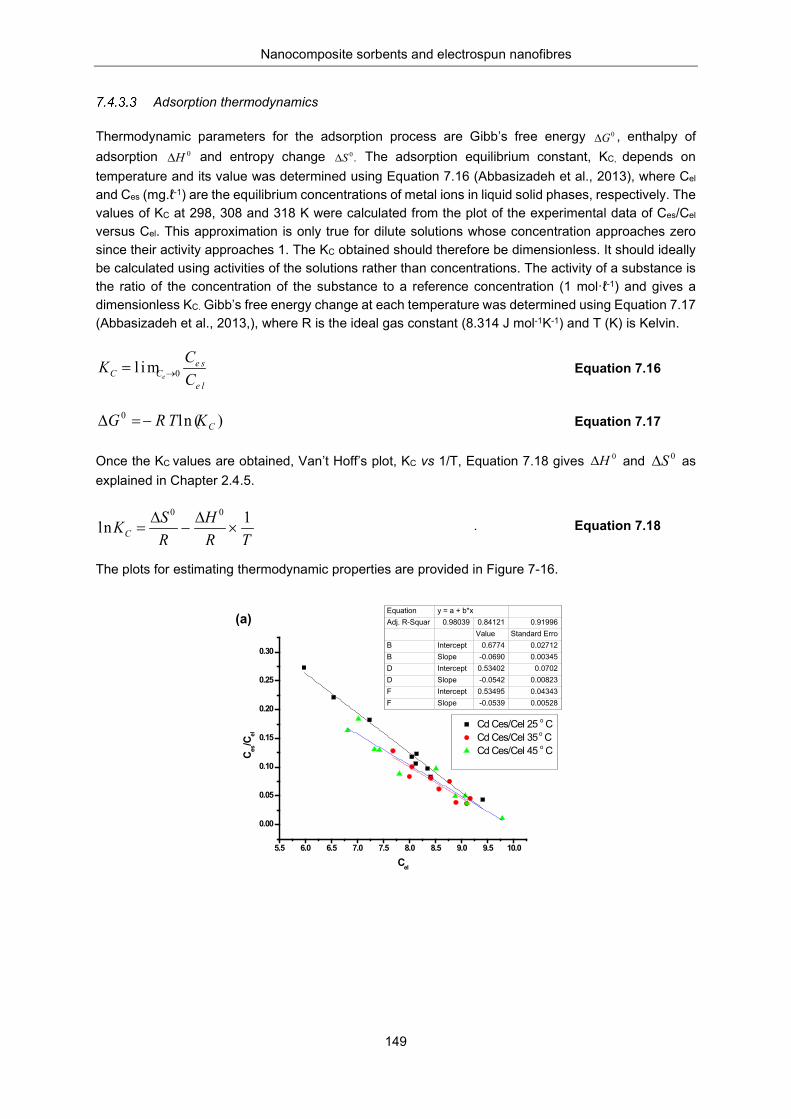
Nanocomposite sorbents and electrospun nanofibres
149
Adsorption thermodynamics
Thermodynamic parameters for the adsorption process are Gibb’s free energy , enthalpy of adsorption and entropy change The adsorption equilibrium constant, KC, depends on temperature and its value was determined using Equation 7.16 (Abbasizadeh et al., 2013), where Cel
and Ces (mg.ℓ-1) are the equilibrium concentrations of metal ions in liquid solid phases, respectively. The values of KC at 298, 308 and 318 K were calculated from the plot of the experimental data of Ces/Cel versus Cel. This approximation is only true for dilute solutions whose concentration approaches zero since their activity approaches 1. The KC obtained should therefore be dimensionless. It should ideally be calculated using activities of the solutions rather than concentrations. The activity of a substance is the ratio of the concentration of the substance to a reference concentration (1 mol·ℓ-1) and gives a dimensionless KC. Gibb’s free energy change at each temperature was determined using Equation 7.17 (Abbasizadeh et al., 2013,), where R is the ideal gas constant (8.314 J mol-1K-1) and T (K) is Kelvin.
Equation 7.16
Equation 7.17
Once the KC values are obtained, Van’t Hoff’s plot, KC vs 1/T, Equation 7.18 gives and as explained in Chapter 2.4.5.
. Equation 7.18
The plots for estimating thermodynamic properties are provided in Figure 7-16.
0G∆0H∆ .0S∆
l im 0e l
e sCC C
CKe→
=
)ln (0CKR TG −=∆
0H∆ 0S∆
1ln00
TRH
RSKC ×
∆−
∆=
5.5 6.0 6.5 7.0 7.5 8.0 8.5 9.0 9.5 10.0
0.00
0.05
0.10
0.15
0.20
0.25
0.30
Cd Ces/Cel 25 o CCd Ces/Cel 35 o C Cd Ces/Cel 45 o CC es
/Cel
Cel
Equation y = a + b*xAdj. R-Squar 0.98039 0.84121 0.91996
Value Standard ErroB Intercept 0.6774 0.02712B Slope -0.0690 0.00345D Intercept 0.53402 0.0702D Slope -0.0542 0.00823F Intercept 0.53495 0.04343F Slope -0.0539 0.00528
(a)
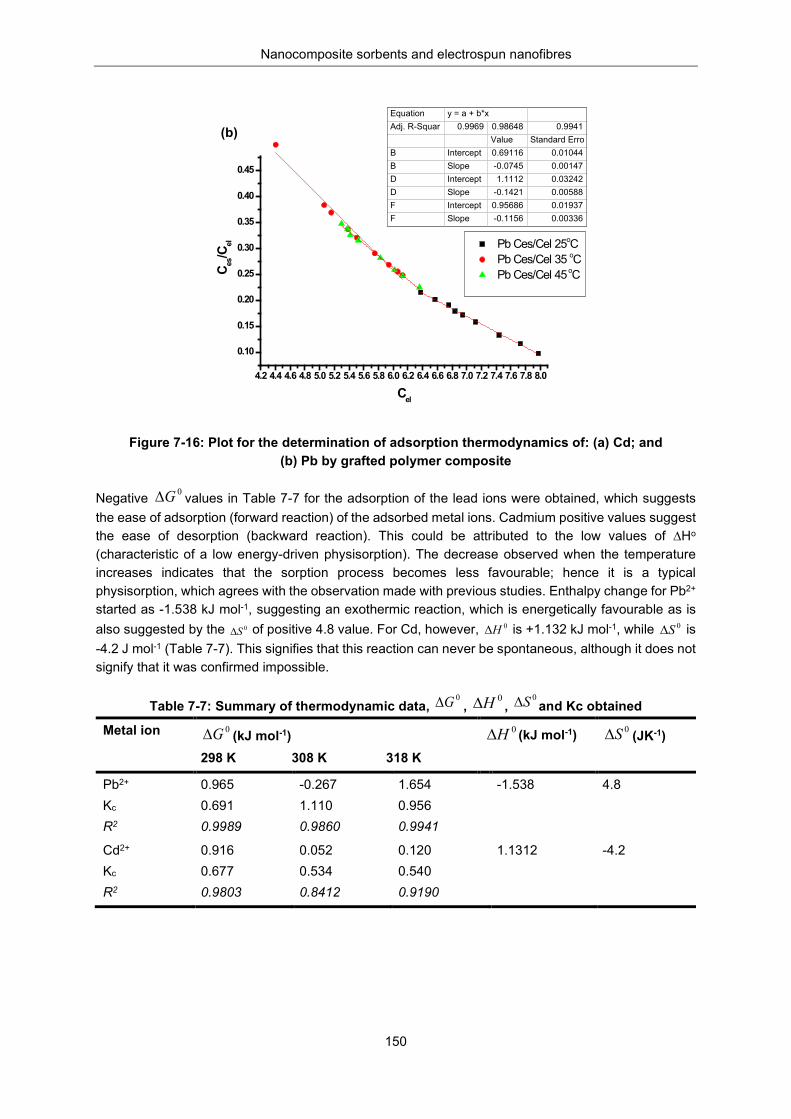
Nanocomposite sorbents and electrospun nanofibres
150
Figure 7-16: Plot for the determination of adsorption thermodynamics of: (a) Cd; and (b) Pb by grafted polymer composite
Negative values in Table 7-7 for the adsorption of the lead ions were obtained, which suggests the ease of adsorption (forward reaction) of the adsorbed metal ions. Cadmium positive values suggest the ease of desorption (backward reaction). This could be attributed to the low values of ∆Ho
(characteristic of a low energy-driven physisorption). The decrease observed when the temperature increases indicates that the sorption process becomes less favourable; hence it is a typical physisorption, which agrees with the observation made with previous studies. Enthalpy change for Pb2+ started as -1.538 kJ mol-1, suggesting an exothermic reaction, which is energetically favourable as is also suggested by the of positive 4.8 value. For Cd, however, is +1.132 kJ mol-1, while is -4.2 J mol-1 (Table 7-7). This signifies that this reaction can never be spontaneous, although it does not signify that it was confirmed impossible.
Table 7-7: Summary of thermodynamic data, , , and Kc obtained
Metal ion (kJ mol-1) 298 K 308 K 318 K
(kJ mol-1) (JK-1)
Pb2+
Kc
R2
0.965 0.691 0.9989
-0.267 1.110 0.9860
1.654 0.956 0.9941
-1.538 4.8
Cd2+
Kc
R2
0.916 0.677 0.9803
0.052 0.534 0.8412
0.120 0.540 0.9190
1.1312 -4.2
4.2 4.4 4.6 4.8 5.0 5.2 5.4 5.6 5.8 6.0 6.2 6.4 6.6 6.8 7.0 7.2 7.4 7.6 7.8 8.0
0.10
0.15
0.20
0.25
0.30
0.35
0.40
0.45
0.50
Pb Ces/Cel 25oC Pb Ces/Cel 35 oC Pb Ces/Cel 45 oCC es
/Cel
Cel
Equation y = a + b*xAdj. R-Squar 0.9969 0.98648 0.9941
Value Standard ErroB Intercept 0.69116 0.01044B Slope -0.0745 0.00147D Intercept 1.1112 0.03242D Slope -0.1421 0.00588F Intercept 0.95686 0.01937F Slope -0.1156 0.00336
0G∆
0S∆ 0H∆ 0S∆
0G∆ 0H∆ 0S∆
0G∆ 0H∆ 0S∆
(b)
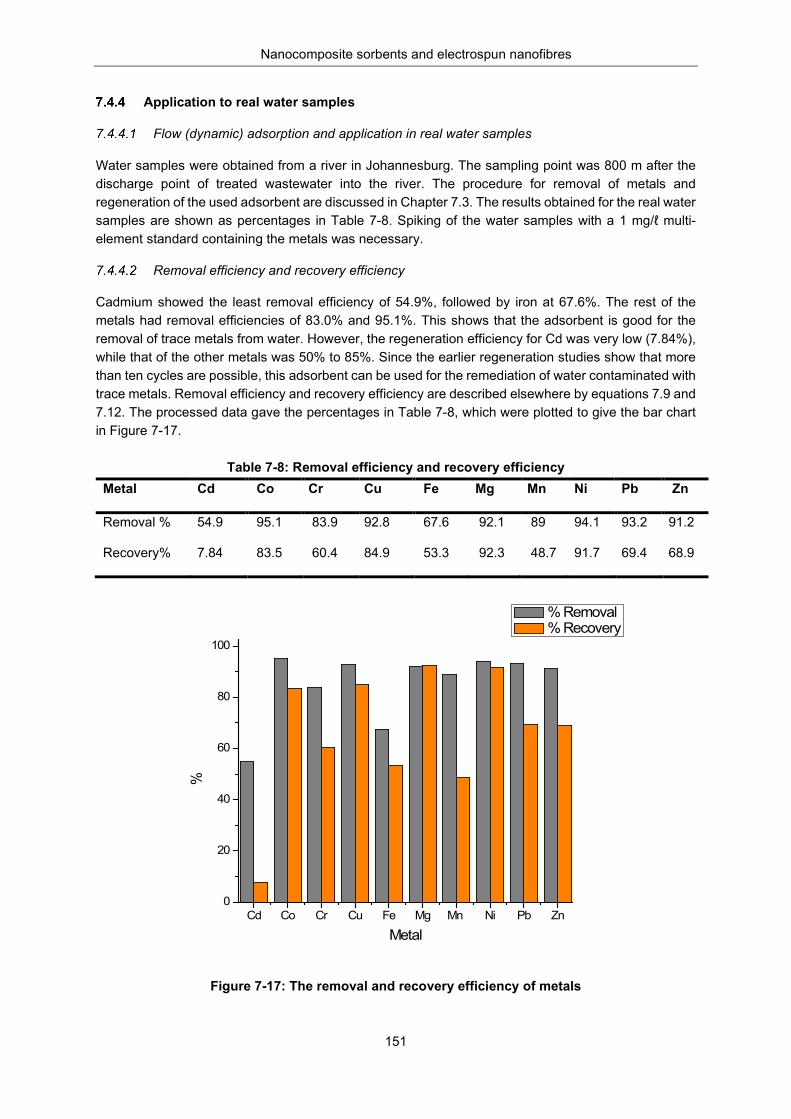
Nanocomposite sorbents and electrospun nanofibres
151
Application to real water samples
Flow (dynamic) adsorption and application in real water samples
Water samples were obtained from a river in Johannesburg. The sampling point was 800 m after the discharge point of treated wastewater into the river. The procedure for removal of metals and regeneration of the used adsorbent are discussed in Chapter 7.3. The results obtained for the real water samples are shown as percentages in Table 7-8. Spiking of the water samples with a 1 mg/ℓ multi-element standard containing the metals was necessary.
Removal efficiency and recovery efficiency
Cadmium showed the least removal efficiency of 54.9%, followed by iron at 67.6%. The rest of the metals had removal efficiencies of 83.0% and 95.1%. This shows that the adsorbent is good for the removal of trace metals from water. However, the regeneration efficiency for Cd was very low (7.84%), while that of the other metals was 50% to 85%. Since the earlier regeneration studies show that more than ten cycles are possible, this adsorbent can be used for the remediation of water contaminated with trace metals. Removal efficiency and recovery efficiency are described elsewhere by equations 7.9 and 7.12. The processed data gave the percentages in Table 7-8, which were plotted to give the bar chart in Figure 7-17.
Table 7-8: Removal efficiency and recovery efficiency Metal Cd Co Cr Cu Fe Mg Mn Ni Pb Zn
Removal % 54.9 95.1 83.9 92.8 67.6 92.1 89 94.1 93.2 91.2
Recovery% 7.84 83.5 60.4 84.9 53.3 92.3 48.7 91.7 69.4 68.9
Figure 7-17: The removal and recovery efficiency of metals
Cd Co Cr Cu Fe Mg Mn Ni Pb Zn0
20
40
60
80
100
%
Metal
% Removal % Recovery
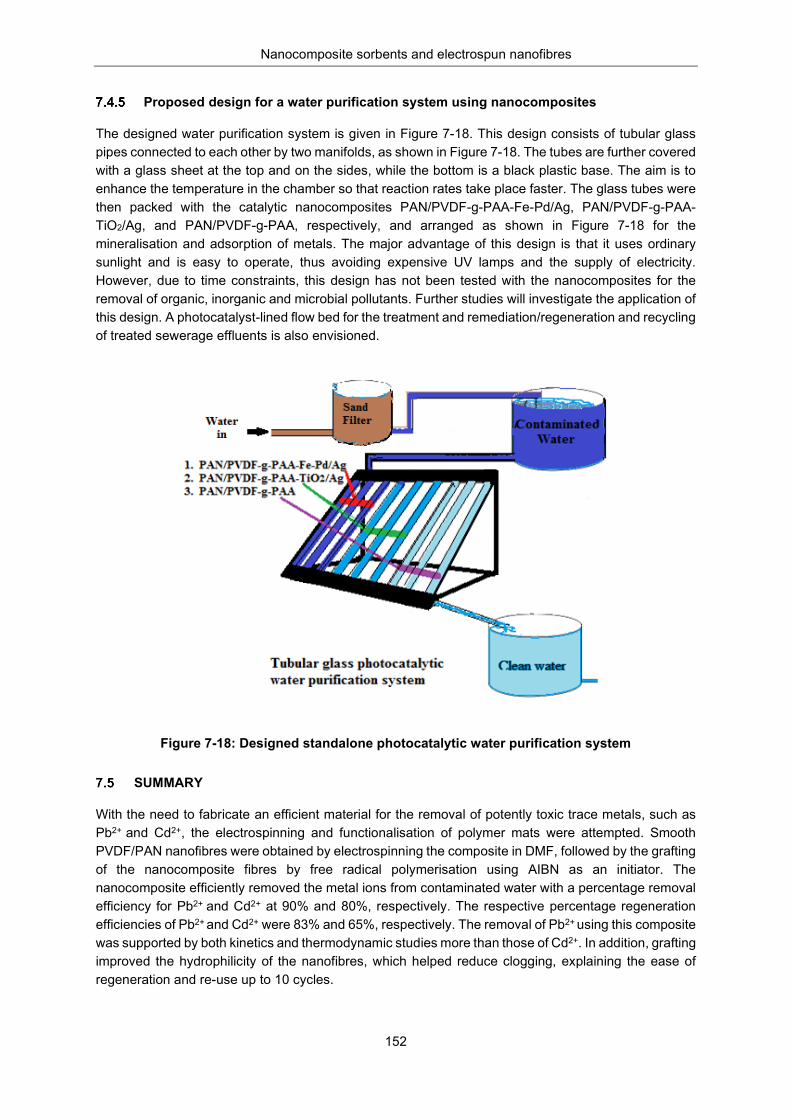
Nanocomposite sorbents and electrospun nanofibres
152
Proposed design for a water purification system using nanocomposites
The designed water purification system is given in Figure 7-18. This design consists of tubular glass pipes connected to each other by two manifolds, as shown in Figure 7-18. The tubes are further covered with a glass sheet at the top and on the sides, while the bottom is a black plastic base. The aim is to enhance the temperature in the chamber so that reaction rates take place faster. The glass tubes were then packed with the catalytic nanocomposites PAN/PVDF-g-PAA-Fe-Pd/Ag, PAN/PVDF-g-PAA-TiO2/Ag, and PAN/PVDF-g-PAA, respectively, and arranged as shown in Figure 7-18 for the mineralisation and adsorption of metals. The major advantage of this design is that it uses ordinary sunlight and is easy to operate, thus avoiding expensive UV lamps and the supply of electricity. However, due to time constraints, this design has not been tested with the nanocomposites for the removal of organic, inorganic and microbial pollutants. Further studies will investigate the application of this design. A photocatalyst-lined flow bed for the treatment and remediation/regeneration and recycling of treated sewerage effluents is also envisioned.
Figure 7-18: Designed standalone photocatalytic water purification system
SUMMARY
With the need to fabricate an efficient material for the removal of potently toxic trace metals, such as Pb2+ and Cd2+, the electrospinning and functionalisation of polymer mats were attempted. Smooth PVDF/PAN nanofibres were obtained by electrospinning the composite in DMF, followed by the grafting of the nanocomposite fibres by free radical polymerisation using AIBN as an initiator. The nanocomposite efficiently removed the metal ions from contaminated water with a percentage removal efficiency for Pb2+ and Cd2+ at 90% and 80%, respectively. The respective percentage regeneration efficiencies of Pb2+ and Cd2+ were 83% and 65%, respectively. The removal of Pb2+ using this composite was supported by both kinetics and thermodynamic studies more than those of Cd2+. In addition, grafting improved the hydrophilicity of the nanofibres, which helped reduce clogging, explaining the ease of regeneration and re-use up to 10 cycles.
Nanocomposite sorbents and electrospun nanofibres
153
From the study of adsorption properties, the researchers confirmed that the sorption process was physical adsorption, with very low enthalpy change and free Gibb’s energy. The rate constant, k2, values (for pseudo second-order) from the kinetic studies indicate that the adsorption favours the removal of Pb more than Cd. It was also gathered that the regeneration efficiency is dependent on the concentration and volume of the eluting acid. In addition, there was less than 10% loss in removal and regeneration efficiency for the 10 cycle runs carried out with a consistent performance. Another advantage of this composite is its applicability as a stand-alone, point-of-use, water purification device. Problems associated with spent adsorbents such as storage, disposal, the release of adsorbed pollutants and loss of the adsorbent can be mitigated by regeneration and re-use, as well as recovery of the metals (solute). Another benefit from recycling the adsorbent is its environmental friendliness due to minimised waste generated and material recovery. These composites reveal great potential for heavy metal remediation in contaminated water.
Nanocomposite sorbents and electrospun nanofibres
154
CHAPTER 8: REMOVAL OF LEAD AND CADMIUM FROM DRINKING WATER USING POLYSACCHARIDE EXTRACT
ISOLATED FROM CACTUS PADS3
INTRODUCTION
The contamination of water as a result of various toxic derivatives (such as trace metal ions, dyes, aromatic compounds and pesticides) is a serious environmental concern worldwide (Crini, 2005). Trace metal ions, particularly Pb2+ and Cd2+, are known to be among the most highly toxic, causing hormonal, nervous, muscular and skeletal anomalies in humans. Hence, their removal from water bodies has been a priority in water treatment plants (Mathur et al., 2006). Although several procedures (such as precipitation, membrane filtration and ion exchange) have been popularly employed for this purpose (Khan et al., 2004), the adsorption of metals on natural polymers is possibly one of the most natural procedures for water decontamination (Johns et al., 1998). Generally, adsorption involves the binding of molecules or particles (the adsorbate) to a surface (the adsorbent) (Sposito, 2004). Adsorbents (such as activated charcoal, silica gel and zeolites) are commonly used in industries for the removal of water pollutants, which include toxic metals (Volesky, 2001). Most of these adsorbents are synthetic and have been popularly used in water treatment processes. However, investigations into the use of biosorbents have recently gained momentum because of environmental and cost considerations (Gupta et al., 2009). Common biopolymers that are the chief constituents of plant cell walls (including cellulose, hemicellulose, pectins and lignin) are the most abundant renewable sorbents that can be chemically isolated from biomass (Sarkar et al., 2009). They are the most abundant renewable resources that can be isolated from biomass via chemical processes. Literature reveals that biopolymers are mainly made up of polysaccharides from the carboxylate (-COOH), hydroxide (-OH) and sulphhydryl (-SH) functional groups. These groups are capable of ionising in suitable solvents, thereby providing charged functionalities that could scavenge toxic metal ions through cation exchange (Krzesłowska, 2011).
It is worth noting that the ability to bind trace metal ions also depends on the chemical structures of these biopolymers (Dronnet et al., 1996, Pelloux et al., 2007). For this reason, the role of biopolymers in the removal of trace metal ions has inspired numerous research activities in the water treatment sector. For instance, a study on the simultaneous removal of Pb2+, Cu2+, Cd2+ and Zn2+ using polysaccharides such as HEM has shown preferential adsorption toward Pb2+ (Hu et al., 2010). It has been found that such adsorptions are driven by parameters such as the pH of the solution, the metal ion concentration, sorbent dosage, temperature and contact time. The cactus plant, in particular, has several species, and grows in almost all climatic regions of the world, especially the arid and semi-arid regions. The Opuntia ficus indica species is thought to be indigenous to Mexico and is now domesticated in many regions of the world (Garti, 1999). These various types of cactus have been subjected to chemical extractions to obtain natural sugars, which are functionalised and applied in various industries.
Previous extraction work on cactus pads by Young (2006) and Cárdenas et al. (2008) revealed the presence of mucilage and pectins. Their utilisation in the removal of trace metals and bacteria from water have also been reported by other researchers (Alcantar, 2007; Fox et al., 2012). However, the potential use of other constituent polysaccharides is not well detailed in literature.
3 The work in this chapter has been published in Journal of Applied Polymer Science: DOI: 10.1002/app.43913
Nanocomposite sorbents and electrospun nanofibres
155
In the present study, a polysaccharide (hemicellulose) sorbent previously isolated from wild cactus was applied for the removal of Pb2+ and Cd2+ from water. To identify the optimal conditions for the adsorption process, determining factors such as the pH at point of zero charge (pHpzc), sorbent dosage, contact time and metal ion concentration were investigated as variables. In addition, the adsorption isotherm study was carried out to understand the adsorption mechanism, as well as to determine the modelled adsorption capacity, of the polysaccharide extract. The adsorption equilibrium data was fitted into Langmuir, Freundlich, Toth, Dubinin-Radushkevich, Sips and Redlich-Peterson (selectively used based on literature review). Finally, desorption studies of these metal ions were performed to assess the regeneration of the sorbent material and therefore their possible reusability.
PREPARATION AND CHARACTERISATION OF THE POLYSACCHARIDE EXTRACT
Preparation
Reagents such as lead nitrate (Pb(NO3)2), cadmium sulphate (CdSO4.H2O), HNO3, KOH and NaOH were obtained from Merck and Sigma (Pty) Ltd. (South Africa). Ultrapure water (deionised) used for the preparation of all aqueous solutions was obtained from the Direct Q 3UV-R purification system. All chemicals were of an analytical grade. Isolated HEM extract (according to the procedures described in Chapter 3) was used as the adsorbent.
Characterisation methods
Determination of pHpzc
The pHpzc is the point at which the surface functional groups of the adsorbent do not affect the pH of the solution during adsorption. The pHpzc was determined using the solid addition method (Fiol and Villaescusa, 2009; Adelodun et al., 2014). Accordingly, molecular solutions of HNO3 and KOH were mixed in six different vials at varied proportions to adjust the initial pH (pHi) values to 2, 4, 6, 8, 10 and 12. Some 20 g of the polysaccharide extract was added to each solution in the ratio of 1:5 w/v and shaken on an orbital platform shaker at 1,300 rpm for 24 hours. The resulting solutions were left to settle for five minutes before the final pH (pHf) was measured. From a plot of pHf against pHi, pHpzc was obtained as the plateau along the pHi axis.
Specific surface area and porosity analysis
The BET surface area of the polysaccharide extract was obtained by nitrogen adsorption/desorption measurements using micrometrics ASAP 2020. Approximately 0.3 g of dry isolate was weighed and transferred into the sample tube. It was degassed under vacuum at 120 °C for 12 hours to eliminate residual moisture and contaminants adsorbed on the surface prior to the analysis. By automation, liquid nitrogen was passed through the surface until saturation was observed. The quantities of nitrogen adsorbed onto and desorbed from the solid surface at equilibrium were measured. The sample’s specific surface area, pore width and pore volume were obtained from the nitrogen adsorption/desorption curves using BET theory (Walton and Snurr, 2007). In addition, the adsorption and desorption cumulative volume and average pore diameter were determined using the BJH method (Jaguaribe et al., 2005)
Determination of moisture content
About 1.50 g of the dried sample was weighed (W1) on a pre-cleaned and dried crucible. It was then placed in an oven set at 105 oC for 24 hours. The sample was then transferred to a desiccator to cool to constant weight (W2). The percentage decrease in weight represents the moisture content (%MC) of the sample, obtained by Equation 8.1.
%𝑀𝑀𝑀𝑀 = [100(𝑊𝑊1 −𝑊𝑊2) 𝑊𝑊1⁄ ]% 𝐄𝐄𝐄𝐄𝐄𝐄𝐄𝐄𝐄𝐄𝐄𝐄𝐄𝐄𝐄𝐄 𝟖𝟖.𝟏𝟏
Nanocomposite sorbents and electrospun nanofibres
156
Ash and volatile solids
The quantification of stable inorganics was carried out as a measure of total impurities present in the material. The amount of volatile solids (% VS) and ash (% AS) were quantified according to the American Society for Testing and Materials (ASTM) standard procedures. A dried sample of 0.5 g was taken in a crucible and placed in a muffle furnace and the temperature was ramped to and kept at 600 °C for 5 hours. Afterwards, the oven was allowed to cool to 120 °C before retrieving the sample and transferring it into a desiccator where further cooling to a constant weight (W3) at room temperature was allowed. An aliquot of about 1 g of the polysaccharide extract obtained from the percentage MC procedure was used for the determination of volatile solids. The sample in a closed crucible was introduced into the pre-heated furnace (set at 920 °C) and maintained there for seven minutes, after which it was retrieved and cooled to a constant weight at room temperature. The % AS and % VS were calculated using equations 8.2 and 8.3:
%𝑉𝑉𝑆𝑆 = 100(𝑊𝑊1−𝑊𝑊2)𝑊𝑊1
% Equation 8.2
%𝐴𝐴𝑆𝑆 = 𝑤𝑤1 − 𝑤𝑤3𝑥𝑥100 Equation 8.3
Solubility studies of the hemicellulose extract in water
Approximately 0.02 g of the polysaccharide extract was added to 10 mℓ of deionised water and conditioned at the pH values of 2, 5, 7, 9 and 12 according to a method described by Hovarth (2006). Thorough mixing was ensured with the use of a vortex, followed by equilibration for 24 hours at ambient temperature. The resulting mixture settled down and, with careful suctioning, the remaining solid material obtained was oven dried at 40 °C to a constant mass. Solubility was determined as the difference between the initial mass of the extract (m1) and that of the residue (m2) given by Equation 8.4.
%𝑆𝑆 = 𝑚𝑚1−𝑚𝑚2𝑚𝑚1
𝑥𝑥 100 Equation 8.4
where, m1 is the initial dry mass (g) of the polysaccharide extract and m2 is the dry mass (g) of the residue.
METAL UPTAKE EXPERIMENTS
Determination of adsorption capacity
Adsorption experiments were performed using Cd2+ and Pb2+ solutions with concentrations in the range of 100 ~450 mg/ℓ. First, 0.01 g of polysaccharide extract was added to 50 mℓ of the single metal standard solutions. Each test mixture was homogenised in a shaker at room temperature and left to equilibrate for two hours. After equilibration, the solution was centrifuged and filtered through a 0.45 µm PES filter disk. The residual metal ion concentration (in the filtrate) was determined using ICP-OES. The adsorption experiment was repeated at varied concentration, contact time, temperature and initial pH. In order to distinguish between possible metal precipitation and actual metal sorption as a means of quality control, control solutions were used (i.e. solutions without contact with the biosorbent) and analysed, and blank corrections made. The percentage removal of the trace metals was estimated using Equation 8.4.
% metal ions removal = 𝐶𝐶𝑜𝑜−𝐶𝐶𝑒𝑒𝐶𝐶𝑜𝑜
𝑥𝑥100 Equation 8.4
where Co and Ce are initial and final metal ion concentrations, respectively.
Nanocomposite sorbents and electrospun nanofibres
157
Effect of the initial pH of the solution on the metal ion uptake
The initial pH of the metal solutions is considered to be a major parameter in the adsorption process. This is due to the fact that pH has an impact on the ionisation of the functional groups present on the surfaces of the adsorbent and the chemical speciation of the metal ions. In order to study the effect of pH on adsorption, standard solutions (100 mg/ℓ) of both Pb2+ and Cd2+ were prepared. Solutions with a pH range of 5 ~8 were prepared using 0.01 M NaOH and 0.01 M HNO3. This was to cover the range for normal drinking water, as well as to avoid the possible precipitation of target cations as hydroxides. Then, ca. 0.01 g of the extract was added to the 25 mℓ of each metal solution (in a stoppered 50 mℓ bottle). The solutions were then shaken at 160 rpm for one hour using an orbital platform shaker, after which they were left to equilibrate for two hours. This was followed by centrifugation to separate the bulk sorbent from the solution (before filtering) prior to subsequent analysis. Measurements were done in triplicate and the average values of metal concentrations were calculated using Equation 8.5.
𝑞𝑞𝑞𝑞 = (𝐶𝐶𝐶𝐶−𝐶𝐶𝐶𝐶)𝑚𝑚
𝑉𝑉 Equation 8.5
where qe is the equilibrium concentration; Co and Ce are initial and final metal ion concentrations (in mg/ℓ), respectively; V is the volume of metal ion solution adsorbing to the polysaccharide extract (in litres), while m is the mass of the sorbent (in grams).
The effect of dosage on the sorption process
A known amount of the adsorbent (between 0.01 and 0.05 g) was added to 50 mℓ of the metal ion solutions of known concentrations, usually 100 mg/ℓ. The mixture was agitated for one hour and left to equilibrate for another two hours before centrifuging at 7,500 rpm for 15 minutes. The suspension was then filtered and the metal ion concentration remaining in the solution was determined by ICP-OES.
The effect of contact time on the sorption process
The interaction of the polysaccharide with the metal ions was performed at an optimum pH of 6 and 7 for Pb2+ and Cd2+, respectively. Exactly 0.01 g of the sorbent was added to 50 mℓ of a standard metal ion solution (100 mg/ℓ) in a water bath shaker. The contact time for adsorption was varied from 10 to 240 minutes and immediately centrifuged for 15 minutes. Then, the concentrations of the metal cations in the supernatants were measured by ICP-OES.
The effect of initial metal concentration on adsorption of metal ions
The initial concentration of the metal ions was varied between 100 and 450 mg/ℓ. A known amount (0.01 g) of the polysaccharide extract was put into a 50 mℓ bottle containing Pb2+ or Cd2+ solution and the mixture shaken in a water bath for 150 minutes (optimised contact time) to ensure that removal equilibrium was reached. The adsorbent was removed after centrifugation (10 minutes) for easy filtration. Finally, the cations’ concentration was determined by ICP-OES. All the adsorption experiments were conducted in triplicate and the average results were reported.
Adsorption isotherm study
Adsorption equilibrium isotherms usually provide information on the mechanism and strength of the interaction between sorptives (such as metal ions) and a sorbent (polysaccharide extract in this case). The experiments were carried out under optimised contact time with metal concentrations ranging from 100 to 450 mg/ℓ−1. Therefore, adsorption isotherms at tested conditions were used to determine the maximum adsorption capacities of the polysaccharide extracts.
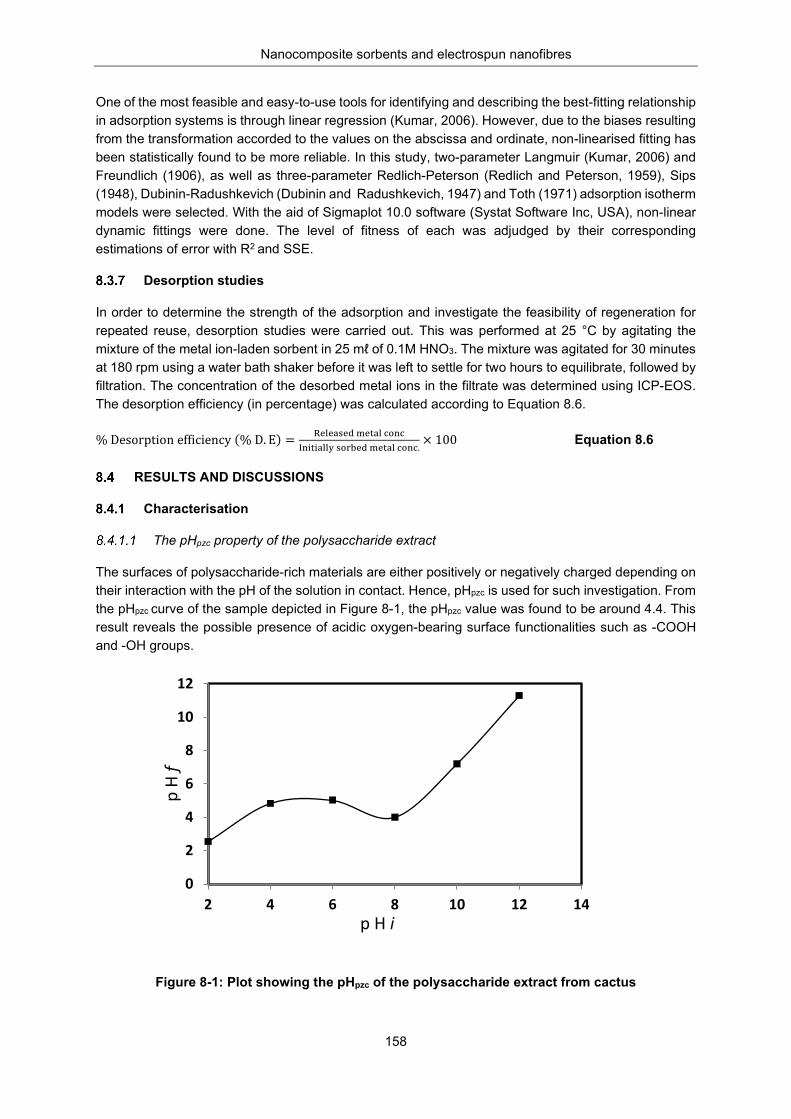
Nanocomposite sorbents and electrospun nanofibres
158
One of the most feasible and easy-to-use tools for identifying and describing the best-fitting relationship in adsorption systems is through linear regression (Kumar, 2006). However, due to the biases resulting from the transformation accorded to the values on the abscissa and ordinate, non-linearised fitting has been statistically found to be more reliable. In this study, two-parameter Langmuir (Kumar, 2006) and Freundlich (1906), as well as three-parameter Redlich-Peterson (Redlich and Peterson, 1959), Sips (1948), Dubinin-Radushkevich (Dubinin and Radushkevich, 1947) and Toth (1971) adsorption isotherm models were selected. With the aid of Sigmaplot 10.0 software (Systat Software Inc, USA), non-linear dynamic fittings were done. The level of fitness of each was adjudged by their corresponding estimations of error with R2 and SSE.
Desorption studies
In order to determine the strength of the adsorption and investigate the feasibility of regeneration for repeated reuse, desorption studies were carried out. This was performed at 25 °C by agitating the mixture of the metal ion-laden sorbent in 25 mℓ of 0.1M HNO3. The mixture was agitated for 30 minutes at 180 rpm using a water bath shaker before it was left to settle for two hours to equilibrate, followed by filtration. The concentration of the desorbed metal ions in the filtrate was determined using ICP-EOS. The desorption efficiency (in percentage) was calculated according to Equation 8.6.
% Desorption efficiency (% D. E) = Released metal concInitially sorbed metal conc.
× 100 Equation 8.6
RESULTS AND DISCUSSIONS
Characterisation
The pHpzc property of the polysaccharide extract
The surfaces of polysaccharide-rich materials are either positively or negatively charged depending on their interaction with the pH of the solution in contact. Hence, pHpzc is used for such investigation. From the pHpzc curve of the sample depicted in Figure 8-1, the pHpzc value was found to be around 4.4. This result reveals the possible presence of acidic oxygen-bearing surface functionalities such as -COOH and -OH groups.
Figure 8-1: Plot showing the pHpzc of the polysaccharide extract from cactus
0
2
4
6
8
10
12
2 4 6 8 10 12 14p H i
p H
f
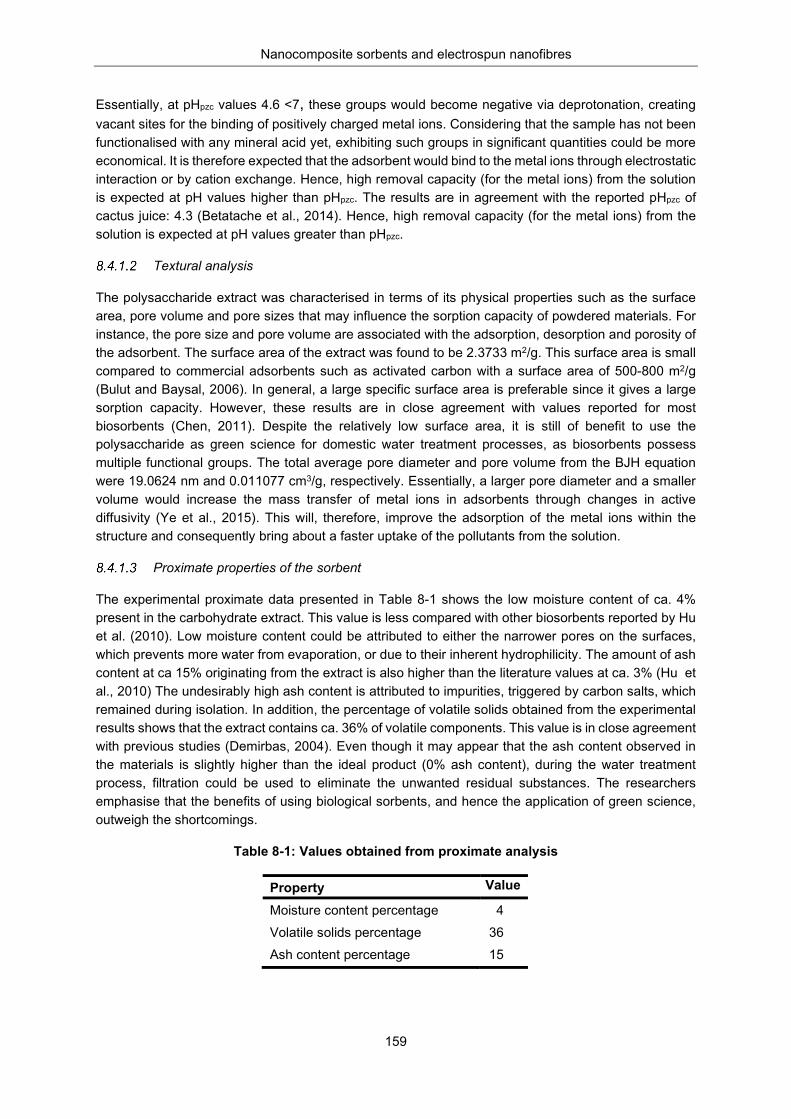
Nanocomposite sorbents and electrospun nanofibres
159
Essentially, at pHpzc values 4.6 <7, these groups would become negative via deprotonation, creating vacant sites for the binding of positively charged metal ions. Considering that the sample has not been functionalised with any mineral acid yet, exhibiting such groups in significant quantities could be more economical. It is therefore expected that the adsorbent would bind to the metal ions through electrostatic interaction or by cation exchange. Hence, high removal capacity (for the metal ions) from the solution is expected at pH values higher than pHpzc. The results are in agreement with the reported pHpzc of cactus juice: 4.3 (Betatache et al., 2014). Hence, high removal capacity (for the metal ions) from the solution is expected at pH values greater than pHpzc.
Textural analysis
The polysaccharide extract was characterised in terms of its physical properties such as the surface area, pore volume and pore sizes that may influence the sorption capacity of powdered materials. For instance, the pore size and pore volume are associated with the adsorption, desorption and porosity of the adsorbent. The surface area of the extract was found to be 2.3733 m2/g. This surface area is small compared to commercial adsorbents such as activated carbon with a surface area of 500-800 m2/g (Bulut and Baysal, 2006). In general, a large specific surface area is preferable since it gives a large sorption capacity. However, these results are in close agreement with values reported for most biosorbents (Chen, 2011). Despite the relatively low surface area, it is still of benefit to use the polysaccharide as green science for domestic water treatment processes, as biosorbents possess multiple functional groups. The total average pore diameter and pore volume from the BJH equation were 19.0624 nm and 0.011077 cm3/g, respectively. Essentially, a larger pore diameter and a smaller volume would increase the mass transfer of metal ions in adsorbents through changes in active diffusivity (Ye et al., 2015). This will, therefore, improve the adsorption of the metal ions within the structure and consequently bring about a faster uptake of the pollutants from the solution.
Proximate properties of the sorbent
The experimental proximate data presented in Table 8-1 shows the low moisture content of ca. 4% present in the carbohydrate extract. This value is less compared with other biosorbents reported by Hu et al. (2010). Low moisture content could be attributed to either the narrower pores on the surfaces, which prevents more water from evaporation, or due to their inherent hydrophilicity. The amount of ash content at ca 15% originating from the extract is also higher than the literature values at ca. 3% (Hu et al., 2010) The undesirably high ash content is attributed to impurities, triggered by carbon salts, which remained during isolation. In addition, the percentage of volatile solids obtained from the experimental results shows that the extract contains ca. 36% of volatile components. This value is in close agreement with previous studies (Demirbas, 2004). Even though it may appear that the ash content observed in the materials is slightly higher than the ideal product (0% ash content), during the water treatment process, filtration could be used to eliminate the unwanted residual substances. The researchers emphasise that the benefits of using biological sorbents, and hence the application of green science, outweigh the shortcomings.
Table 8-1: Values obtained from proximate analysis
Property Value
Moisture content percentage 4 Volatile solids percentage 36 Ash content percentage 15
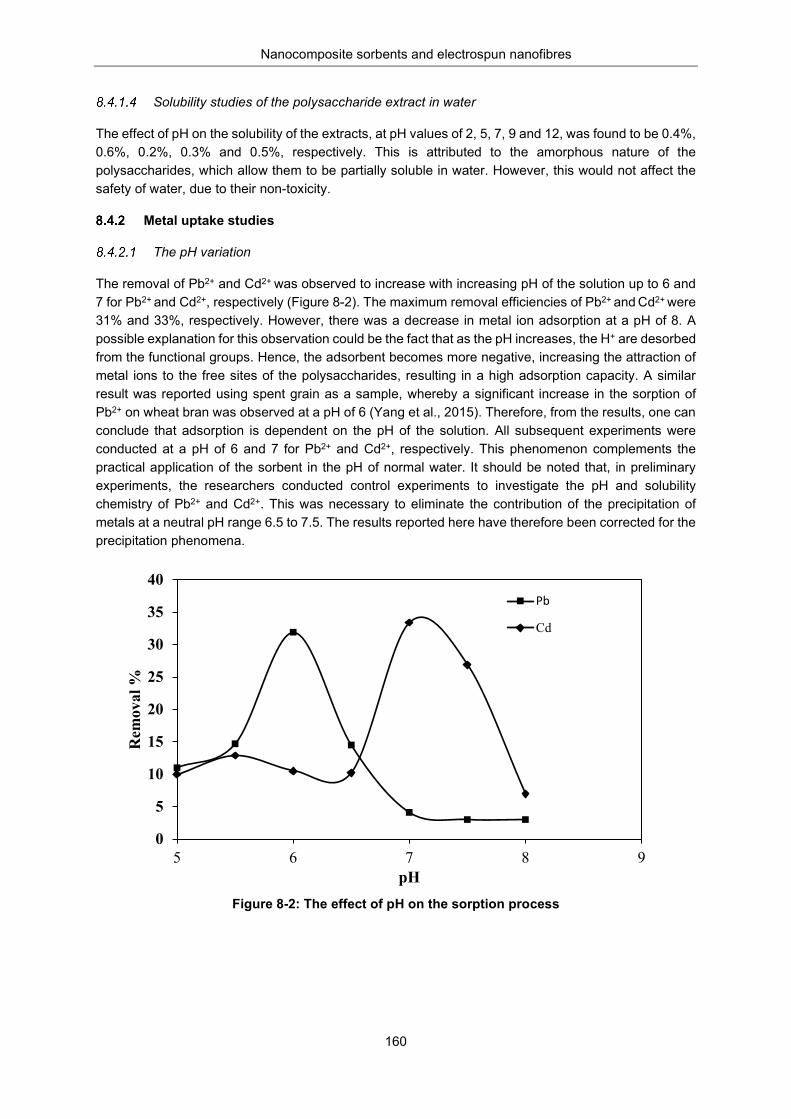
Nanocomposite sorbents and electrospun nanofibres
160
Solubility studies of the polysaccharide extract in water
The effect of pH on the solubility of the extracts, at pH values of 2, 5, 7, 9 and 12, was found to be 0.4%, 0.6%, 0.2%, 0.3% and 0.5%, respectively. This is attributed to the amorphous nature of the polysaccharides, which allow them to be partially soluble in water. However, this would not affect the safety of water, due to their non-toxicity.
Metal uptake studies
The pH variation
The removal of Pb2+ and Cd2+ was observed to increase with increasing pH of the solution up to 6 and 7 for Pb2+ and Cd2+, respectively (Figure 8-2). The maximum removal efficiencies of Pb2+ and Cd2+ were 31% and 33%, respectively. However, there was a decrease in metal ion adsorption at a pH of 8. A possible explanation for this observation could be the fact that as the pH increases, the H+ are desorbed from the functional groups. Hence, the adsorbent becomes more negative, increasing the attraction of metal ions to the free sites of the polysaccharides, resulting in a high adsorption capacity. A similar result was reported using spent grain as a sample, whereby a significant increase in the sorption of Pb2+ on wheat bran was observed at a pH of 6 (Yang et al., 2015). Therefore, from the results, one can conclude that adsorption is dependent on the pH of the solution. All subsequent experiments were conducted at a pH of 6 and 7 for Pb2+ and Cd2+, respectively. This phenomenon complements the practical application of the sorbent in the pH of normal water. It should be noted that, in preliminary experiments, the researchers conducted control experiments to investigate the pH and solubility chemistry of Pb2+ and Cd2+. This was necessary to eliminate the contribution of the precipitation of metals at a neutral pH range 6.5 to 7.5. The results reported here have therefore been corrected for the precipitation phenomena.
Figure 8-2: The effect of pH on the sorption process
0
5
10
15
20
25
30
35
40
5 6 7 8 9
Rem
oval
%
pH
Pb
Cd
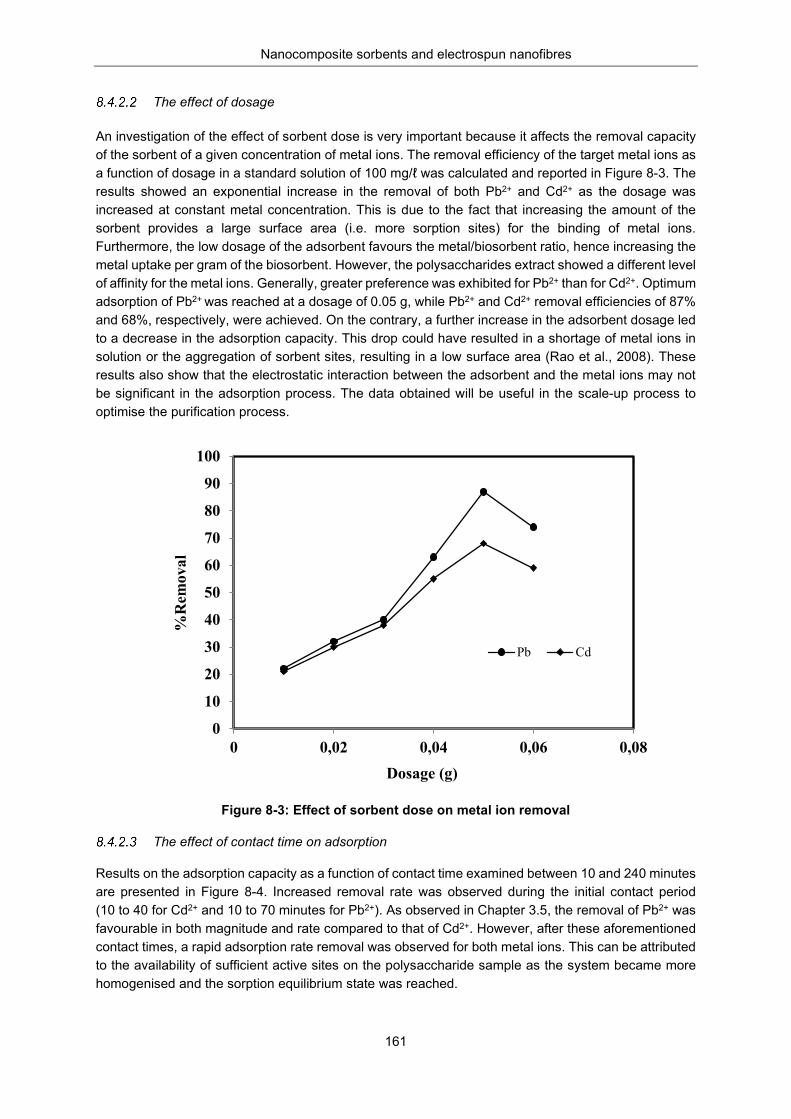
Nanocomposite sorbents and electrospun nanofibres
161
The effect of dosage
An investigation of the effect of sorbent dose is very important because it affects the removal capacity of the sorbent of a given concentration of metal ions. The removal efficiency of the target metal ions as a function of dosage in a standard solution of 100 mg/ℓ was calculated and reported in Figure 8-3. The results showed an exponential increase in the removal of both Pb2+ and Cd2+ as the dosage was increased at constant metal concentration. This is due to the fact that increasing the amount of the sorbent provides a large surface area (i.e. more sorption sites) for the binding of metal ions. Furthermore, the low dosage of the adsorbent favours the metal/biosorbent ratio, hence increasing the metal uptake per gram of the biosorbent. However, the polysaccharides extract showed a different level of affinity for the metal ions. Generally, greater preference was exhibited for Pb2+ than for Cd2+. Optimum adsorption of Pb2+ was reached at a dosage of 0.05 g, while Pb2+ and Cd2+ removal efficiencies of 87% and 68%, respectively, were achieved. On the contrary, a further increase in the adsorbent dosage led to a decrease in the adsorption capacity. This drop could have resulted in a shortage of metal ions in solution or the aggregation of sorbent sites, resulting in a low surface area (Rao et al., 2008). These results also show that the electrostatic interaction between the adsorbent and the metal ions may not be significant in the adsorption process. The data obtained will be useful in the scale-up process to optimise the purification process.
Figure 8-3: Effect of sorbent dose on metal ion removal
The effect of contact time on adsorption
Results on the adsorption capacity as a function of contact time examined between 10 and 240 minutes are presented in Figure 8-4. Increased removal rate was observed during the initial contact period (10 to 40 for Cd2+ and 10 to 70 minutes for Pb2+). As observed in Chapter 3.5, the removal of Pb2+ was favourable in both magnitude and rate compared to that of Cd2+. However, after these aforementioned contact times, a rapid adsorption rate removal was observed for both metal ions. This can be attributed to the availability of sufficient active sites on the polysaccharide sample as the system became more homogenised and the sorption equilibrium state was reached.
0
10
20
30
40
50
60
70
80
90
100
0 0,02 0,04 0,06 0,08
Pb Cd
%R
emov
al
Dosage (g)
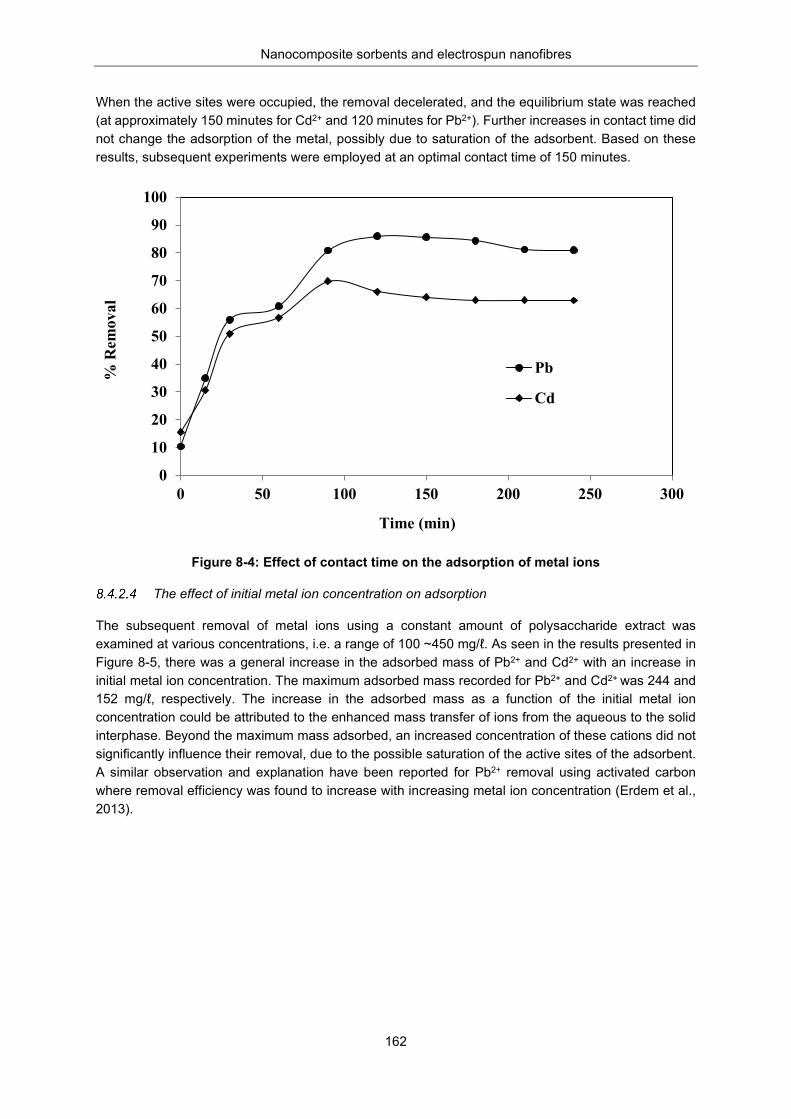
Nanocomposite sorbents and electrospun nanofibres
162
When the active sites were occupied, the removal decelerated, and the equilibrium state was reached (at approximately 150 minutes for Cd2+ and 120 minutes for Pb2+). Further increases in contact time did not change the adsorption of the metal, possibly due to saturation of the adsorbent. Based on these results, subsequent experiments were employed at an optimal contact time of 150 minutes.
Figure 8-4: Effect of contact time on the adsorption of metal ions
The effect of initial metal ion concentration on adsorption
The subsequent removal of metal ions using a constant amount of polysaccharide extract was examined at various concentrations, i.e. a range of 100 ~450 mg/ℓ. As seen in the results presented in Figure 8-5, there was a general increase in the adsorbed mass of Pb2+ and Cd2+ with an increase in initial metal ion concentration. The maximum adsorbed mass recorded for Pb2+ and Cd2+ was 244 and 152 mg/ℓ, respectively. The increase in the adsorbed mass as a function of the initial metal ion concentration could be attributed to the enhanced mass transfer of ions from the aqueous to the solid interphase. Beyond the maximum mass adsorbed, an increased concentration of these cations did not significantly influence their removal, due to the possible saturation of the active sites of the adsorbent. A similar observation and explanation have been reported for Pb2+ removal using activated carbon where removal efficiency was found to increase with increasing metal ion concentration (Erdem et al., 2013).
0
10
20
30
40
50
60
70
80
90
100
0 50 100 150 200 250 300
Pb
Cd
% R
emov
al
Time (min)
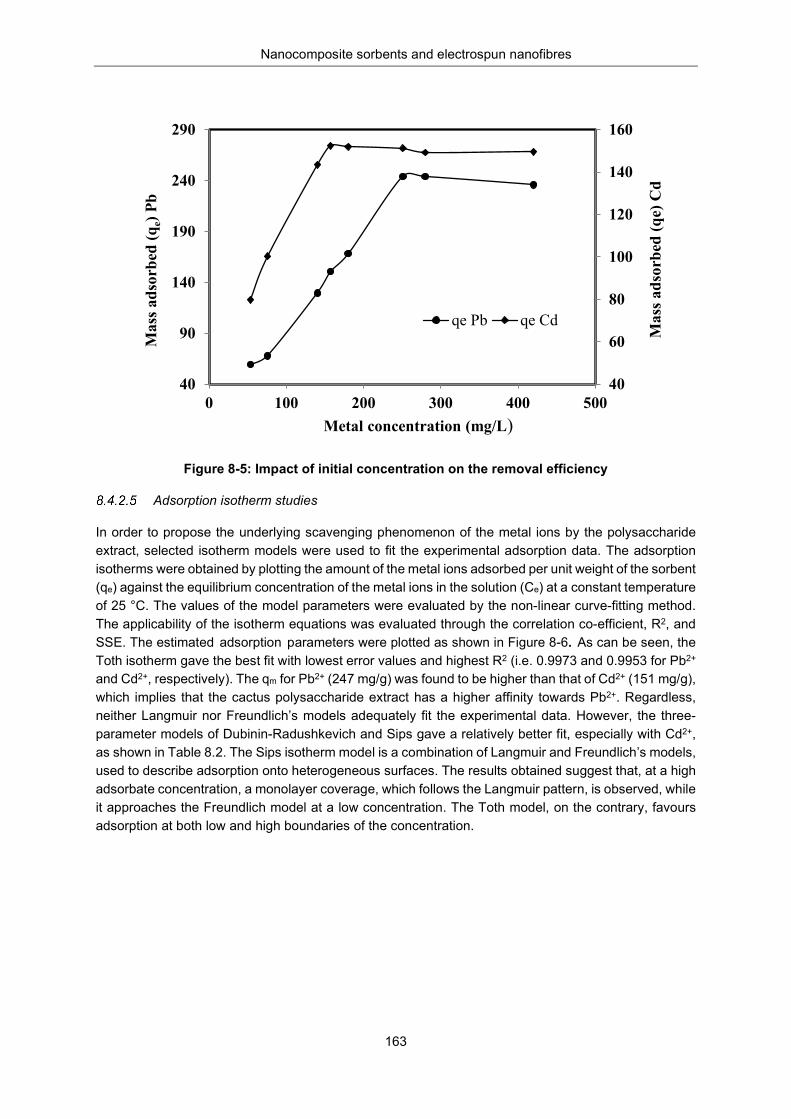
Nanocomposite sorbents and electrospun nanofibres
163
Figure 8-5: Impact of initial concentration on the removal efficiency
Adsorption isotherm studies
In order to propose the underlying scavenging phenomenon of the metal ions by the polysaccharide extract, selected isotherm models were used to fit the experimental adsorption data. The adsorption isotherms were obtained by plotting the amount of the metal ions adsorbed per unit weight of the sorbent (qe) against the equilibrium concentration of the metal ions in the solution (Ce) at a constant temperature of 25 °C. The values of the model parameters were evaluated by the non-linear curve-fitting method. The applicability of the isotherm equations was evaluated through the correlation co-efficient, R2, and SSE. The estimated adsorption parameters were plotted as shown in Figure 8-6. As can be seen, the Toth isotherm gave the best fit with lowest error values and highest R2 (i.e. 0.9973 and 0.9953 for Pb2+ and Cd2+, respectively). The qm for Pb2+ (247 mg/g) was found to be higher than that of Cd2+ (151 mg/g), which implies that the cactus polysaccharide extract has a higher affinity towards Pb2+. Regardless, neither Langmuir nor Freundlich’s models adequately fit the experimental data. However, the three-parameter models of Dubinin-Radushkevich and Sips gave a relatively better fit, especially with Cd2+, as shown in Table 8.2. The Sips isotherm model is a combination of Langmuir and Freundlich’s models, used to describe adsorption onto heterogeneous surfaces. The results obtained suggest that, at a high adsorbate concentration, a monolayer coverage, which follows the Langmuir pattern, is observed, while it approaches the Freundlich model at a low concentration. The Toth model, on the contrary, favours adsorption at both low and high boundaries of the concentration.
40
60
80
100
120
140
160
40
90
140
190
240
290
0 100 200 300 400 500
Mas
s ads
orbe
d (q
e) Pb
Metal concentration (mg/L)
qe Pb qe Cd
Mas
sads
orbe
d (q
e)C
d
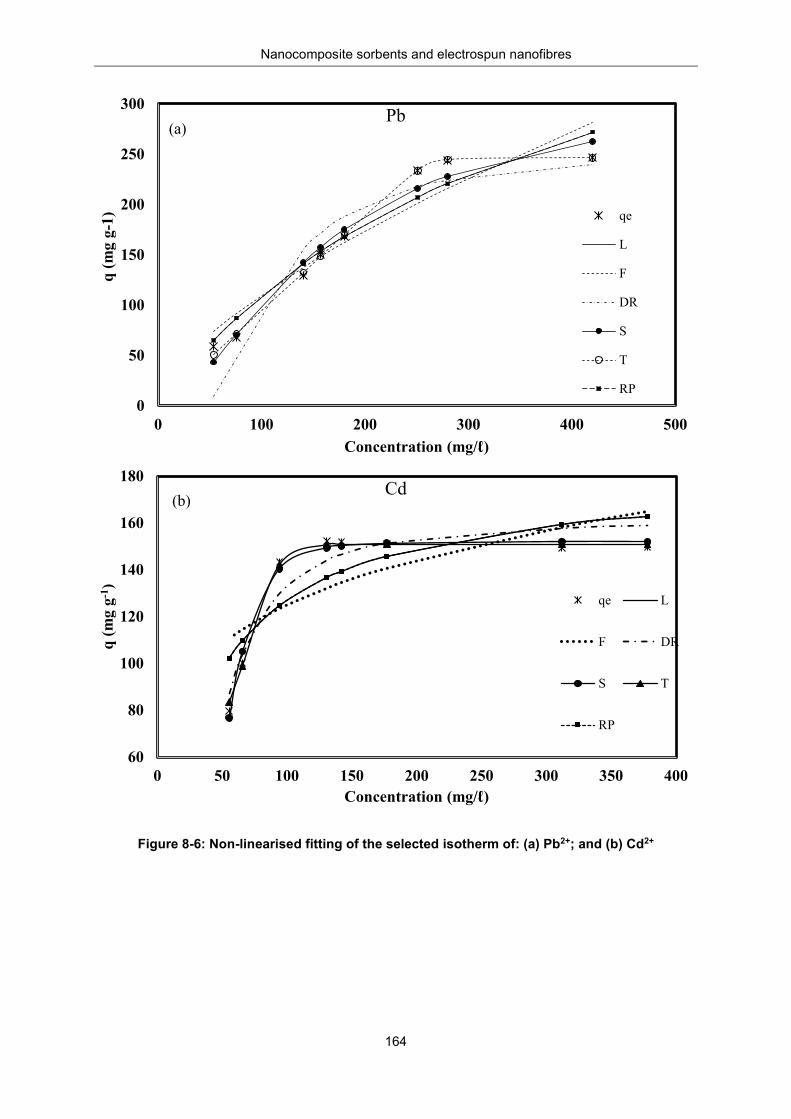
Nanocomposite sorbents and electrospun nanofibres
164
Figure 8-6: Non-linearised fitting of the selected isotherm of: (a) Pb2+; and (b) Cd2+
0
50
100
150
200
250
300
0 100 200 300 400 500
q (m
g g-
1)
Concentration (mg/ℓ)
Pb
qe
L
F
DR
S
T
RP
(a)
60
80
100
120
140
160
180
0 50 100 150 200 250 300 350 400
q (m
g g-1
)
Concentration (mg/ℓ)
Cd
qe L
F DR
S T
RP
(b)
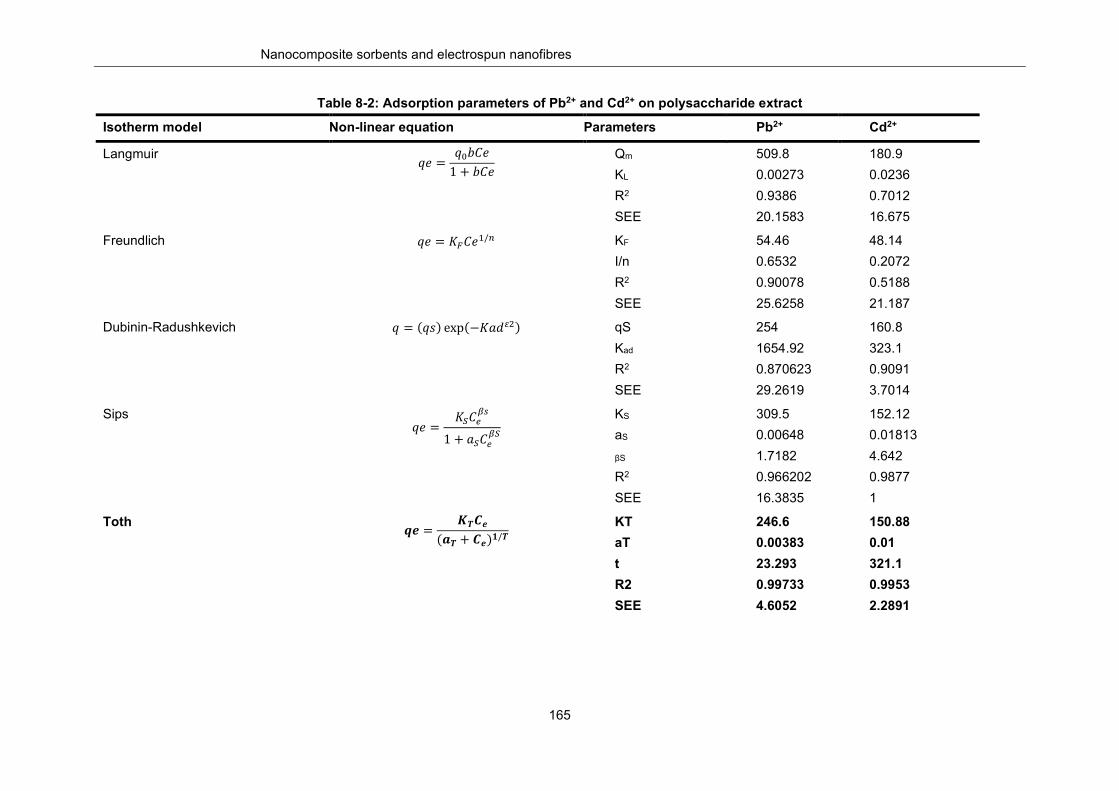
Nanocomposite sorbents and electrospun nanofibres
165
Table 8-2: Adsorption parameters of Pb2+ and Cd2+ on polysaccharide extract
Isotherm model Non-linear equation Parameters Pb2+ Cd2+
Langmuir 𝑞𝑞𝑞𝑞 =𝑞𝑞0𝑏𝑏𝑀𝑀𝑞𝑞
1 + 𝑏𝑏𝑀𝑀𝑞𝑞
Qm KL R2 SEE
509.8 0.00273 0.9386 20.1583
180.9 0.0236 0.7012 16.675
Freundlich 𝑞𝑞𝑞𝑞 = 𝐾𝐾𝐹𝐹𝑀𝑀𝑞𝑞1/𝑛𝑛
KF
I/n R2 SEE
54.46 0.6532 0.90078 25.6258
48.14 0.2072 0.5188 21.187
Dubinin-Radushkevich 𝑞𝑞 = (𝑞𝑞𝑞𝑞) exp(−𝐾𝐾𝐾𝐾𝐾𝐾𝜀𝜀2)
qS Kad R2 SEE
254 1654.92 0.870623 29.2619
160.8 323.1 0.9091 3.7014
Sips 𝑞𝑞𝑞𝑞 =
𝐾𝐾𝑆𝑆𝑀𝑀𝐶𝐶𝛽𝛽𝛽𝛽
1 + 𝐾𝐾𝑆𝑆𝑀𝑀𝐶𝐶𝛽𝛽𝑆𝑆
KS aS
βS R2 SEE
309.5 0.00648 1.7182 0.966202 16.3835
152.12 0.01813 4.642 0.9877 1
Toth
𝒒𝒒𝑭𝑭 =𝑲𝑲𝑻𝑻𝑪𝑪𝑭𝑭
(𝒂𝒂𝑻𝑻 + 𝑪𝑪𝑭𝑭)𝟏𝟏/𝑻𝑻
KT aT t R2 SEE
246.6 0.00383 23.293 0.99733 4.6052
150.88 0.01 321.1 0.9953 2.2891
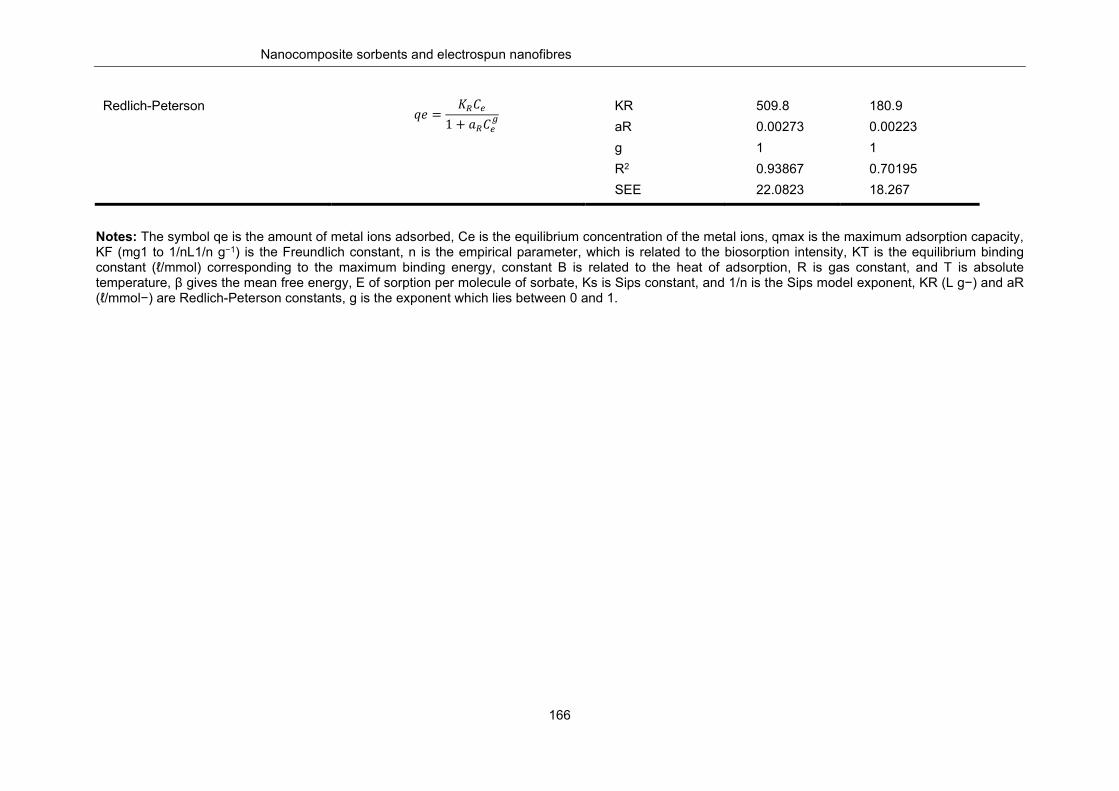
Nanocomposite sorbents and electrospun nanofibres
166
Redlich-Peterson 𝑞𝑞𝑞𝑞 =𝐾𝐾𝑅𝑅𝑀𝑀𝐶𝐶
1 + 𝐾𝐾𝑅𝑅𝑀𝑀𝐶𝐶𝑔𝑔
KR aR g R2
SEE
509.8 0.00273 1 0.93867 22.0823
180.9 0.00223 1 0.70195 18.267
Notes: The symbol qe is the amount of metal ions adsorbed, Ce is the equilibrium concentration of the metal ions, qmax is the maximum adsorption capacity, KF (mg1 to 1/nL1/n g−1) is the Freundlich constant, n is the empirical parameter, which is related to the biosorption intensity, KT is the equilibrium binding constant (ℓ/mmol) corresponding to the maximum binding energy, constant B is related to the heat of adsorption, R is gas constant, and T is absolute temperature, β gives the mean free energy, E of sorption per molecule of sorbate, Ks is Sips constant, and 1/n is the Sips model exponent, KR (L g−) and aR (ℓ/mmol−) are Redlich-Peterson constants, g is the exponent which lies between 0 and 1.
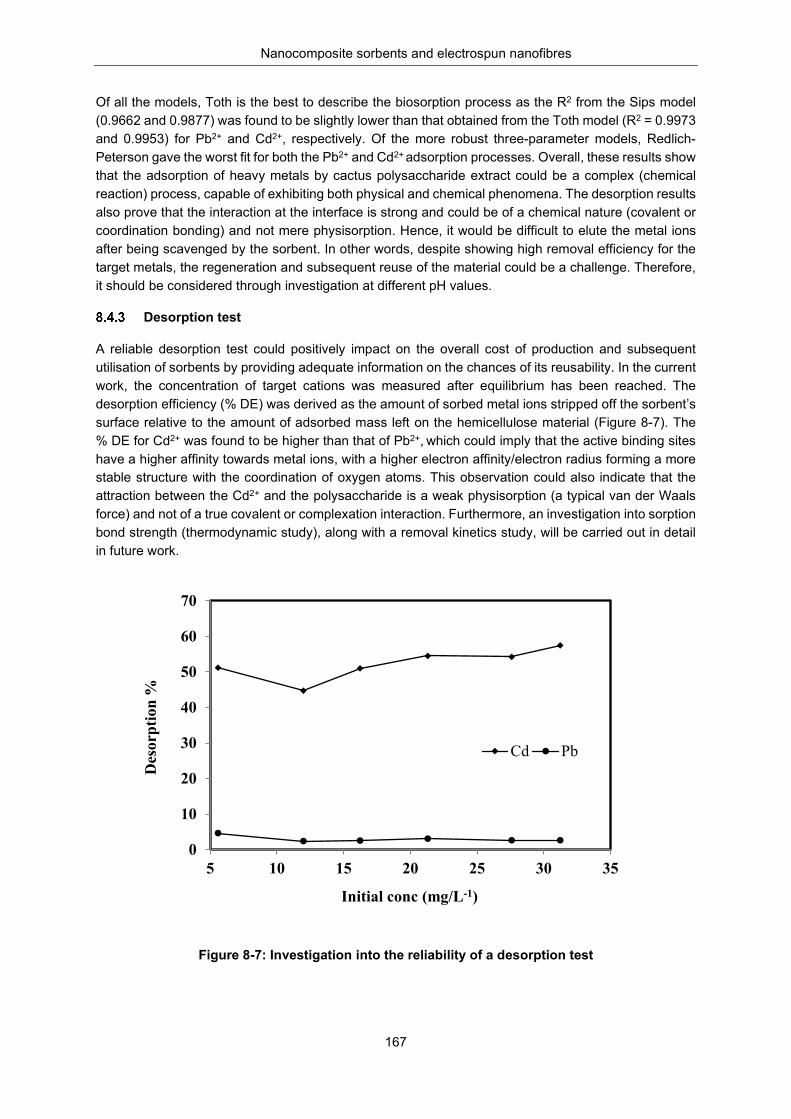
Nanocomposite sorbents and electrospun nanofibres
167
Of all the models, Toth is the best to describe the biosorption process as the R2 from the Sips model (0.9662 and 0.9877) was found to be slightly lower than that obtained from the Toth model (R2 = 0.9973 and 0.9953) for Pb2+ and Cd2+, respectively. Of the more robust three-parameter models, Redlich-Peterson gave the worst fit for both the Pb2+ and Cd2+ adsorption processes. Overall, these results show that the adsorption of heavy metals by cactus polysaccharide extract could be a complex (chemical reaction) process, capable of exhibiting both physical and chemical phenomena. The desorption results also prove that the interaction at the interface is strong and could be of a chemical nature (covalent or coordination bonding) and not mere physisorption. Hence, it would be difficult to elute the metal ions after being scavenged by the sorbent. In other words, despite showing high removal efficiency for the target metals, the regeneration and subsequent reuse of the material could be a challenge. Therefore, it should be considered through investigation at different pH values.
Desorption test
A reliable desorption test could positively impact on the overall cost of production and subsequent utilisation of sorbents by providing adequate information on the chances of its reusability. In the current work, the concentration of target cations was measured after equilibrium has been reached. The desorption efficiency (% DE) was derived as the amount of sorbed metal ions stripped off the sorbent’s surface relative to the amount of adsorbed mass left on the hemicellulose material (Figure 8-7). The % DE for Cd2+ was found to be higher than that of Pb2+, which could imply that the active binding sites have a higher affinity towards metal ions, with a higher electron affinity/electron radius forming a more stable structure with the coordination of oxygen atoms. This observation could also indicate that the attraction between the Cd2+ and the polysaccharide is a weak physisorption (a typical van der Waals force) and not of a true covalent or complexation interaction. Furthermore, an investigation into sorption bond strength (thermodynamic study), along with a removal kinetics study, will be carried out in detail in future work.
Figure 8-7: Investigation into the reliability of a desorption test
0
10
20
30
40
50
60
70
5 10 15 20 25 30 35
Cd Pb
Initial conc (mg/L-1)
Des
orpt
ion
%
Nanocomposite sorbents and electrospun nanofibres
168
SUMMARY
In this work, the use of the hemicellulose extract from cactus for the removal of Pb2+ and Cd2+ from simulated water showed a high removal capacity. The maximum adsorption capacities of the Pb2+ and Cd2+ were found to be 256 and 151 mg/ℓ, respectively. These values are relatively high compared to literature values observed for natural biosorbents. The various factors investigated showed distinct changes in the adsorption capacities. The equilibrium data obtained showed the best fit for the Toth isotherm, suggesting that the interaction at the adsorption and removal interface was due to the presence of some heterogeneously dispersed chemical processes. Generally, these results show that the adsorption of trace metals by cactus polysaccharide extract could be a complex chemical process, capable of exhibiting both physical and chemical phenomena. The results obtained provide important information for exploring further utilisation of the cactus and, more importantly, its polysaccharide constituent in future studies.
Nanocomposite sorbents and electrospun nanofibres
169
CHAPTER 9: ANTI-BACTERIAL ACTIVITY OF HEMICELLULOSE AND PECTIN-BASED SILVER
NANOCOMPOSITES
INTRODUCTION
Microbial contamination and pathogenic infections are the most common causes of death, as highlighted by the WHO (2002). As a result, there has been incredible interest in the pursuit of antibacterial disinfectants for water treatment. The use of uniform nanometre-sized particles, particularly metal nanoparticles, is well documented in literature (Wei et al., 2011). These materials have been intensively used in many fields, including medicine, electronics and catalysts (Kim et al., 2007). Metal nanoparticles possess unique properties that could not possibly be achieved by their bulky counterpart materials (Eustis and El-Sayed, 2006).
Silver nanoparticles have shown bioactivity towards disease-causing water-borne bacteria (Wang and Xia, 2004; Xia et al., 2011). However, the release of silver nanoparticles into the environment while in use should be contained by embedding them into either organic or inorganic matrices (Mueller and Nowack., 2008). Nanocomposites might be the simplest way to mitigate the mobility of metal nanoparticles and consequently their safety (Leszczynska and Pielichowski, 2008; Khanna et al., 2005). Polymer materials are used in preparation of metal nanocomposites either through in-situ or ex-situ techniques (Nikolaidis et al., 2010).
In the ex situ approach, nanoparticles are first produced by classical routes and then dispersed into polymeric matrices. However, re-aggregation of the nanoparticles may occur, thus reducing their surface area, or the formed metal nanoparticles may leach from their polymer support.
In in-situ techniques, metal nanoparticles are produced inside a polymer matrix by decomposition or by the chemical reduction of a metallic precursor within the polymer (Mishra et al., 2011). Due to their technological advantages, in-situ approaches are currently used for the production of polymer-stabilised metal nanoparticles (Hebbalalu et al., 2013).
This study is based on the successive loading of aqueous silver metal ions on the surfaces of HEM-based nanofibres and pectin extract to form metallic nanocomposites. The resulting metal nanoparticles are believed to be strongly captured inside the polymer matrix, minimising their escape into the medium under treatment (Alonso et al., 2011).
Furthermore, surface distribution of metal nanoparticles within the material eliminates their contact with target pollutants. The antibacterial activity of nanocomposites was evaluated on different types of microorganisms, including E. coli, Pseudomonas, Klebsiella, S. aureus and Enterococci. The blend of the antibacterial merits of silver nanoparticles and the biodegradability of the nanocomposites form some ideal antibacterial water disinfection products.
SYNTHESIS AND CHARACTERISATION OF THE NANOCOMPOSITES
Materials
The reagents used in the experiment include Mueller Hinton agar, Mueller Hinton broth, bacteriological agar, agarose gel, sim plate media, distilled water, iodonitrotetrazolium chloride (INT) dye, saline solution, silver nitrate, HEM-based nanofibres and pectins.
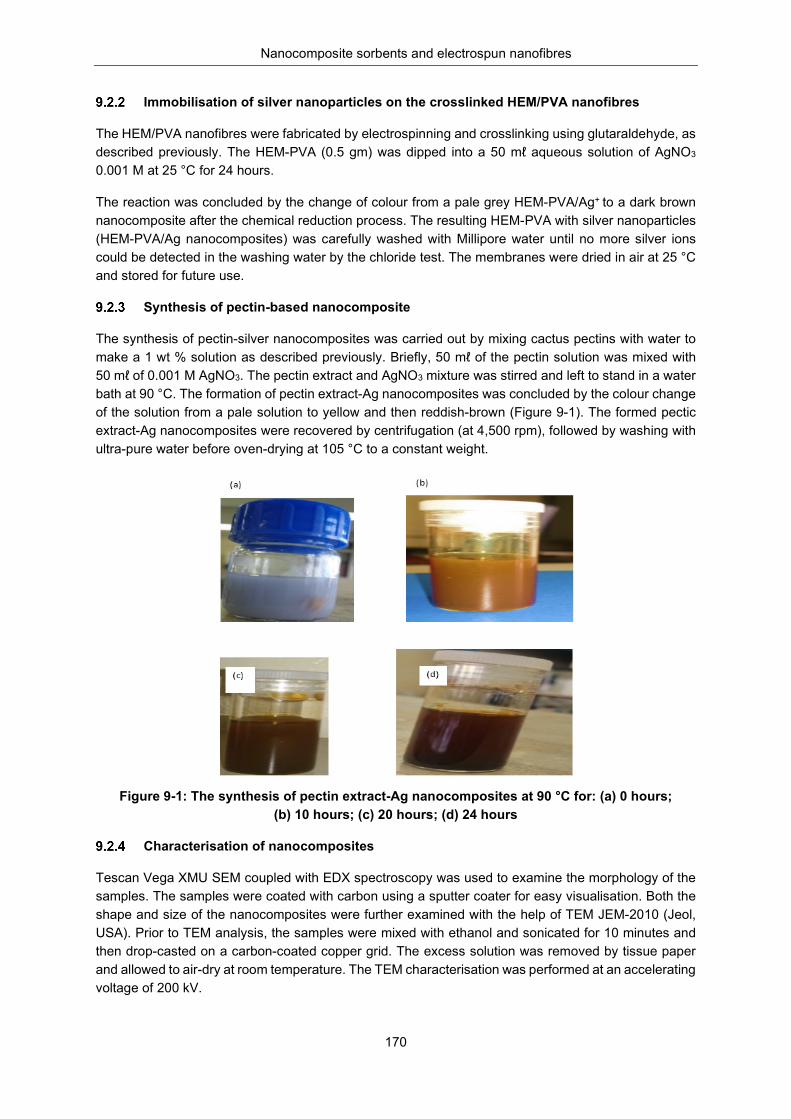
Nanocomposite sorbents and electrospun nanofibres
170
Immobilisation of silver nanoparticles on the crosslinked HEM/PVA nanofibres
The HEM/PVA nanofibres were fabricated by electrospinning and crosslinking using glutaraldehyde, as described previously. The HEM-PVA (0.5 gm) was dipped into a 50 mℓ aqueous solution of AgNO3 0.001 M at 25 °C for 24 hours.
The reaction was concluded by the change of colour from a pale grey HEM-PVA/Ag+ to a dark brown nanocomposite after the chemical reduction process. The resulting HEM-PVA with silver nanoparticles (HEM-PVA/Ag nanocomposites) was carefully washed with Millipore water until no more silver ions could be detected in the washing water by the chloride test. The membranes were dried in air at 25 °C and stored for future use.
Synthesis of pectin-based nanocomposite
The synthesis of pectin-silver nanocomposites was carried out by mixing cactus pectins with water to make a 1 wt % solution as described previously. Briefly, 50 mℓ of the pectin solution was mixed with 50 mℓ of 0.001 M AgNO3. The pectin extract and AgNO3 mixture was stirred and left to stand in a water bath at 90 °C. The formation of pectin extract-Ag nanocomposites was concluded by the colour change of the solution from a pale solution to yellow and then reddish-brown (Figure 9-1). The formed pectic extract-Ag nanocomposites were recovered by centrifugation (at 4,500 rpm), followed by washing with ultra-pure water before oven-drying at 105 °C to a constant weight.
Figure 9-1: The synthesis of pectin extract-Ag nanocomposites at 90 °C for: (a) 0 hours;
(b) 10 hours; (c) 20 hours; (d) 24 hours
Characterisation of nanocomposites
Tescan Vega XMU SEM coupled with EDX spectroscopy was used to examine the morphology of the samples. The samples were coated with carbon using a sputter coater for easy visualisation. Both the shape and size of the nanocomposites were further examined with the help of TEM JEM-2010 (Jeol, USA). Prior to TEM analysis, the samples were mixed with ethanol and sonicated for 10 minutes and then drop-casted on a carbon-coated copper grid. The excess solution was removed by tissue paper and allowed to air-dry at room temperature. The TEM characterisation was performed at an accelerating voltage of 200 kV.
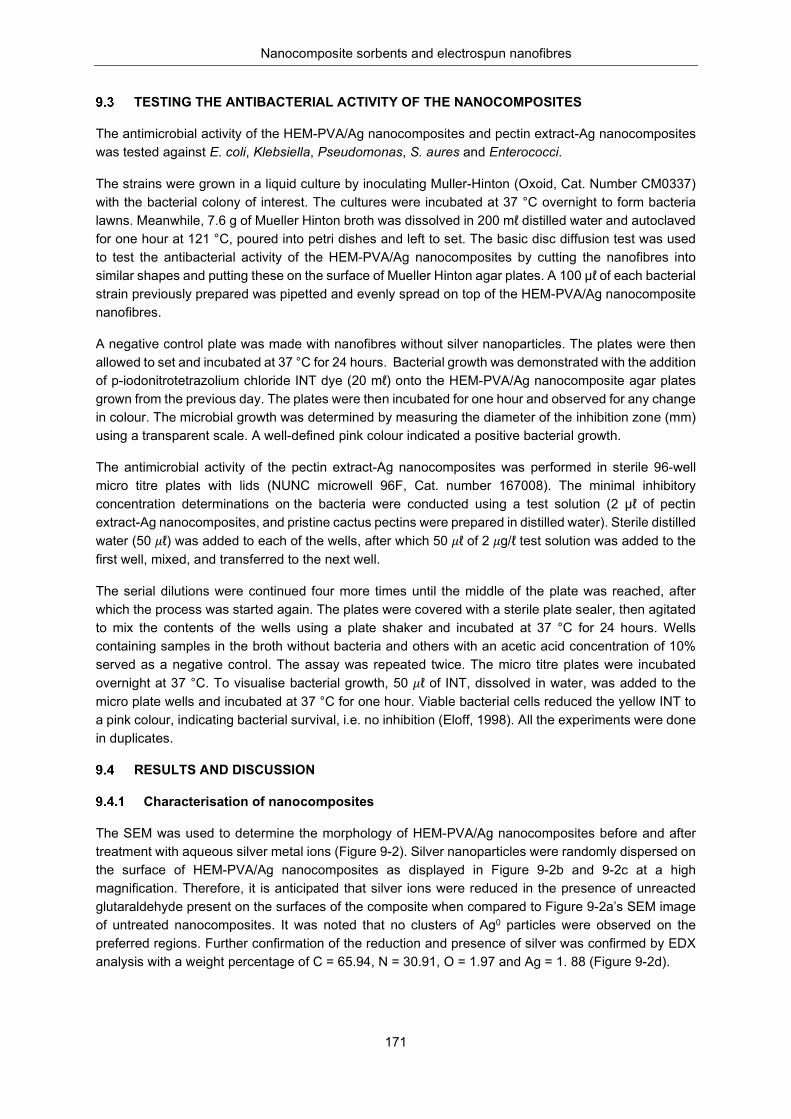
Nanocomposite sorbents and electrospun nanofibres
171
TESTING THE ANTIBACTERIAL ACTIVITY OF THE NANOCOMPOSITES
The antimicrobial activity of the HEM-PVA/Ag nanocomposites and pectin extract-Ag nanocomposites was tested against E. coli, Klebsiella, Pseudomonas, S. aures and Enterococci.
The strains were grown in a liquid culture by inoculating Muller-Hinton (Oxoid, Cat. Number CM0337) with the bacterial colony of interest. The cultures were incubated at 37 °C overnight to form bacteria lawns. Meanwhile, 7.6 g of Mueller Hinton broth was dissolved in 200 mℓ distilled water and autoclaved for one hour at 121 °C, poured into petri dishes and left to set. The basic disc diffusion test was used to test the antibacterial activity of the HEM-PVA/Ag nanocomposites by cutting the nanofibres into similar shapes and putting these on the surface of Mueller Hinton agar plates. A 100 µℓ of each bacterial strain previously prepared was pipetted and evenly spread on top of the HEM-PVA/Ag nanocomposite nanofibres.
A negative control plate was made with nanofibres without silver nanoparticles. The plates were then allowed to set and incubated at 37 °C for 24 hours. Bacterial growth was demonstrated with the addition of p-iodonitrotetrazolium chloride INT dye (20 mℓ) onto the HEM-PVA/Ag nanocomposite agar plates grown from the previous day. The plates were then incubated for one hour and observed for any change in colour. The microbial growth was determined by measuring the diameter of the inhibition zone (mm) using a transparent scale. A well-defined pink colour indicated a positive bacterial growth.
The antimicrobial activity of the pectin extract-Ag nanocomposites was performed in sterile 96-well micro titre plates with lids (NUNC microwell 96F, Cat. number 167008). The minimal inhibitory concentration determinations on the bacteria were conducted using a test solution (2 µℓ of pectin extract-Ag nanocomposites, and pristine cactus pectins were prepared in distilled water). Sterile distilled water (50 𝜇𝜇ℓ) was added to each of the wells, after which 50 𝜇𝜇ℓ of 2 𝜇𝜇g/ℓ test solution was added to the first well, mixed, and transferred to the next well.
The serial dilutions were continued four more times until the middle of the plate was reached, after which the process was started again. The plates were covered with a sterile plate sealer, then agitated to mix the contents of the wells using a plate shaker and incubated at 37 °C for 24 hours. Wells containing samples in the broth without bacteria and others with an acetic acid concentration of 10% served as a negative control. The assay was repeated twice. The micro titre plates were incubated overnight at 37 °C. To visualise bacterial growth, 50 𝜇𝜇ℓ of INT, dissolved in water, was added to the micro plate wells and incubated at 37 °C for one hour. Viable bacterial cells reduced the yellow INT to a pink colour, indicating bacterial survival, i.e. no inhibition (Eloff, 1998). All the experiments were done in duplicates.
RESULTS AND DISCUSSION
Characterisation of nanocomposites
The SEM was used to determine the morphology of HEM-PVA/Ag nanocomposites before and after treatment with aqueous silver metal ions (Figure 9-2). Silver nanoparticles were randomly dispersed on the surface of HEM-PVA/Ag nanocomposites as displayed in Figure 9-2b and 9-2c at a high magnification. Therefore, it is anticipated that silver ions were reduced in the presence of unreacted glutaraldehyde present on the surfaces of the composite when compared to Figure 9-2a’s SEM image of untreated nanocomposites. It was noted that no clusters of Ag0 particles were observed on the preferred regions. Further confirmation of the reduction and presence of silver was confirmed by EDX analysis with a weight percentage of C = 65.94, N = 30.91, O = 1.97 and Ag = 1. 88 (Figure 9-2d).
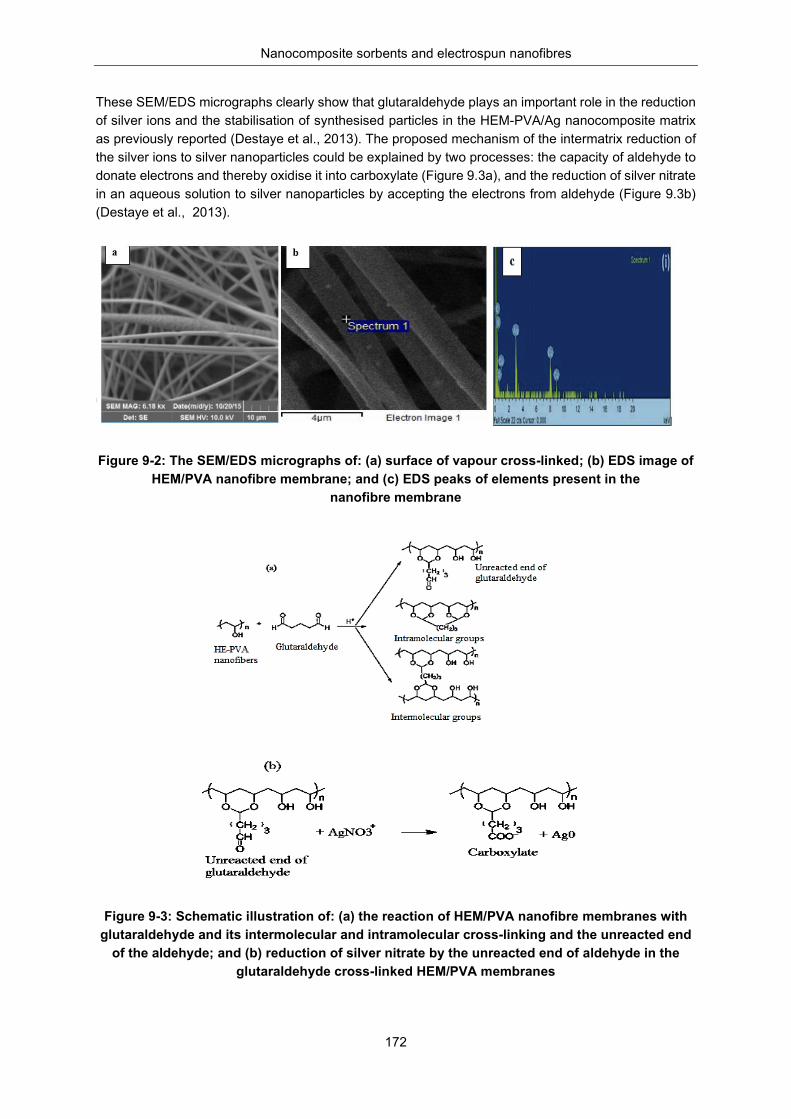
Nanocomposite sorbents and electrospun nanofibres
172
These SEM/EDS micrographs clearly show that glutaraldehyde plays an important role in the reduction of silver ions and the stabilisation of synthesised particles in the HEM-PVA/Ag nanocomposite matrix as previously reported (Destaye et al., 2013). The proposed mechanism of the intermatrix reduction of the silver ions to silver nanoparticles could be explained by two processes: the capacity of aldehyde to donate electrons and thereby oxidise it into carboxylate (Figure 9.3a), and the reduction of silver nitrate in an aqueous solution to silver nanoparticles by accepting the electrons from aldehyde (Figure 9.3b) (Destaye et al., 2013).
Figure 9-2: The SEM/EDS micrographs of: (a) surface of vapour cross-linked; (b) EDS image of HEM/PVA nanofibre membrane; and (c) EDS peaks of elements present in the
nanofibre membrane
Figure 9-3: Schematic illustration of: (a) the reaction of HEM/PVA nanofibre membranes with
glutaraldehyde and its intermolecular and intramolecular cross-linking and the unreacted end of the aldehyde; and (b) reduction of silver nitrate by the unreacted end of aldehyde in the
glutaraldehyde cross-linked HEM/PVA membranes
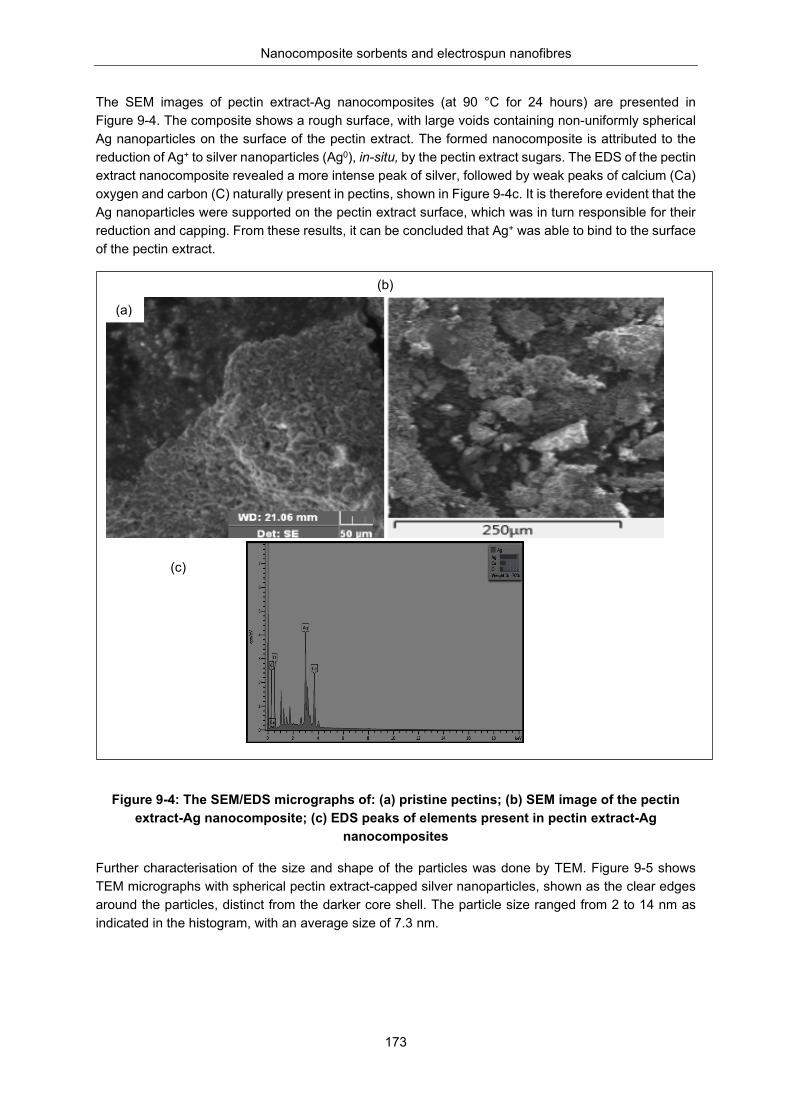
Nanocomposite sorbents and electrospun nanofibres
173
The SEM images of pectin extract-Ag nanocomposites (at 90 °C for 24 hours) are presented in Figure 9-4. The composite shows a rough surface, with large voids containing non-uniformly spherical Ag nanoparticles on the surface of the pectin extract. The formed nanocomposite is attributed to the reduction of Ag+ to silver nanoparticles (Ag0), in-situ, by the pectin extract sugars. The EDS of the pectin extract nanocomposite revealed a more intense peak of silver, followed by weak peaks of calcium (Ca) oxygen and carbon (C) naturally present in pectins, shown in Figure 9-4c. It is therefore evident that the Ag nanoparticles were supported on the pectin extract surface, which was in turn responsible for their reduction and capping. From these results, it can be concluded that Ag+ was able to bind to the surface of the pectin extract.
Figure 9-4: The SEM/EDS micrographs of: (a) pristine pectins; (b) SEM image of the pectin extract-Ag nanocomposite; (c) EDS peaks of elements present in pectin extract-Ag
nanocomposites
Further characterisation of the size and shape of the particles was done by TEM. Figure 9-5 shows TEM micrographs with spherical pectin extract-capped silver nanoparticles, shown as the clear edges around the particles, distinct from the darker core shell. The particle size ranged from 2 to 14 nm as indicated in the histogram, with an average size of 7.3 nm.
(b)
(a)
(c)
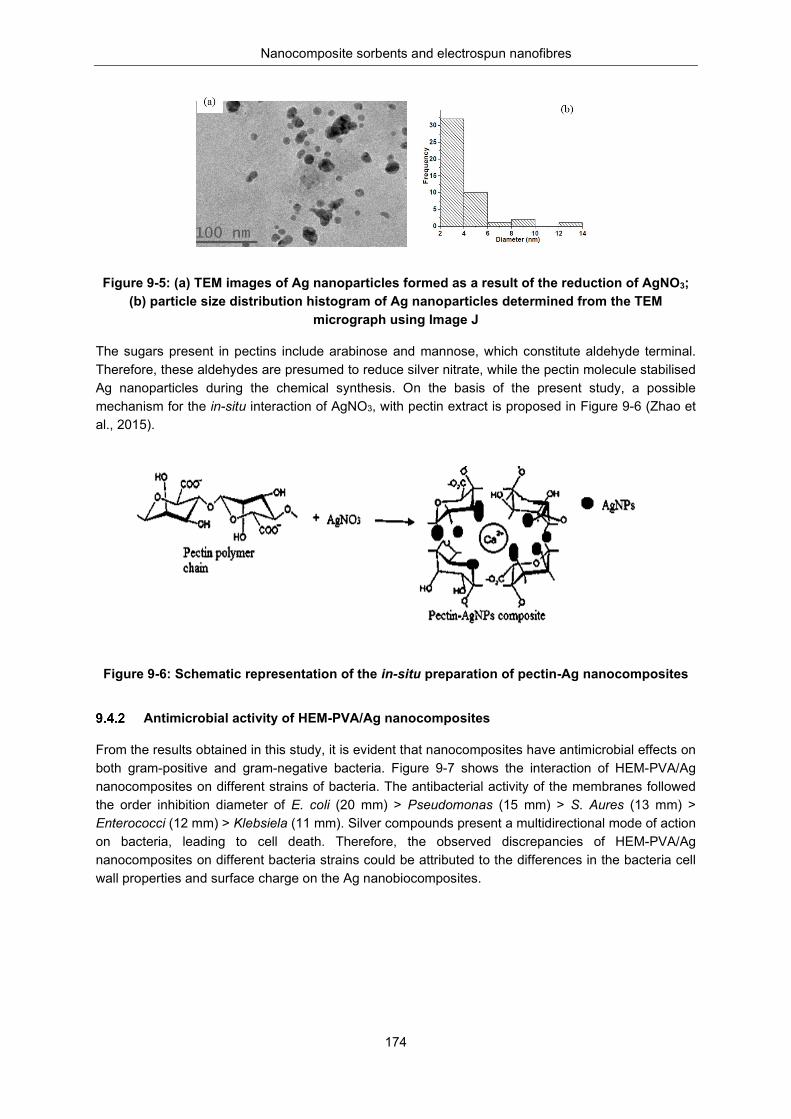
Nanocomposite sorbents and electrospun nanofibres
174
Figure 9-5: (a) TEM images of Ag nanoparticles formed as a result of the reduction of AgNO3; (b) particle size distribution histogram of Ag nanoparticles determined from the TEM
micrograph using Image J
The sugars present in pectins include arabinose and mannose, which constitute aldehyde terminal. Therefore, these aldehydes are presumed to reduce silver nitrate, while the pectin molecule stabilised Ag nanoparticles during the chemical synthesis. On the basis of the present study, a possible mechanism for the in-situ interaction of AgNO3, with pectin extract is proposed in Figure 9-6 (Zhao et al., 2015).
Figure 9-6: Schematic representation of the in-situ preparation of pectin-Ag nanocomposites
Antimicrobial activity of HEM-PVA/Ag nanocomposites
From the results obtained in this study, it is evident that nanocomposites have antimicrobial effects on both gram-positive and gram-negative bacteria. Figure 9-7 shows the interaction of HEM-PVA/Ag nanocomposites on different strains of bacteria. The antibacterial activity of the membranes followed the order inhibition diameter of E. coli (20 mm) > Pseudomonas (15 mm) > S. Aures (13 mm) > Enterococci (12 mm) > Klebsiela (11 mm). Silver compounds present a multidirectional mode of action on bacteria, leading to cell death. Therefore, the observed discrepancies of HEM-PVA/Ag nanocomposites on different bacteria strains could be attributed to the differences in the bacteria cell wall properties and surface charge on the Ag nanobiocomposites.

Nanocomposite sorbents and electrospun nanofibres
175
Figure 9-7: Bacterial lawn plates with HEM-based nanofibre biocomposite membrane visualised with INT dye: (a) control plate nanofibres without bacteria; (b) Enterococci;
(c) Klebsiela; (d) S. Aures; (e) Pseudomonas; and (f) E. coli
For example, the cell wall of gram-negative bacteria is usually made of a thin peptidoglycan layer of plasma membrane (2 nm) and an additional outer membrane composed of phospholipids and lipopolysaccharides around the peptidoglycan, while the gram-positive bacteria cell wall constitutes a thick peptidoglycan layer (15-18 nm), a polymer consisting of sugars and amino acids enclosing the plasma membrane and teichoic acids, and poly-alcohols to stabilise the cell wall. The HEM-PVA/Ag nanocomposites act as a silver ion reservoir, which, on contact with the cell membranes, causes lysis of the cellular interior. This effect is usually high in gram-negative bacteria due to the thin layer of peptidoglycan compared to gram-positive bacteria. On the contrary, the thick layer of peptidoglycan is harder to penetrate on gram-positive bacteria; thus, there is a limited number of anchoring sites of Ag nanocomposites, making their destruction more difficult. Furthermore, the surface charge of Ag nanocomposites could be positively charged, hence it is attracted to the negatively charged lipopolysaccharides present in the outer membrane of the gram-negative bacteria. This interaction of Ag nanocomposites with the plasma membrane could enhance the high microbial effect of Ag nanocomposites towards the gram-negative compared to gram-positive bacteria.
Microbial activity of pectin extract-Ag nanocomposites
The effect of pectin extract-Ag nanocomposites on bacteria using the minimal inhibitory concentration method is shown in Figure 9-8. The red wells show the presence of bacteria after treating it with the pectin extract-Ag nanocomposites. The observed inhibition activity is lower compared to that of membranes, possibly due to the differences in the application method used, their morphology, amount, surface area and the capping agent. For example, the surface area per unit mass of nanofibres is large compared to that of pectin extract-Ag nanocomposites. The HEM-PVA/Ag nanocompites are therefore expected to provide a high contact area, which allows a higher silver ion release and hence an easier interaction with bacteria compared to pectin extract-aqueous Ag nanocomposites.
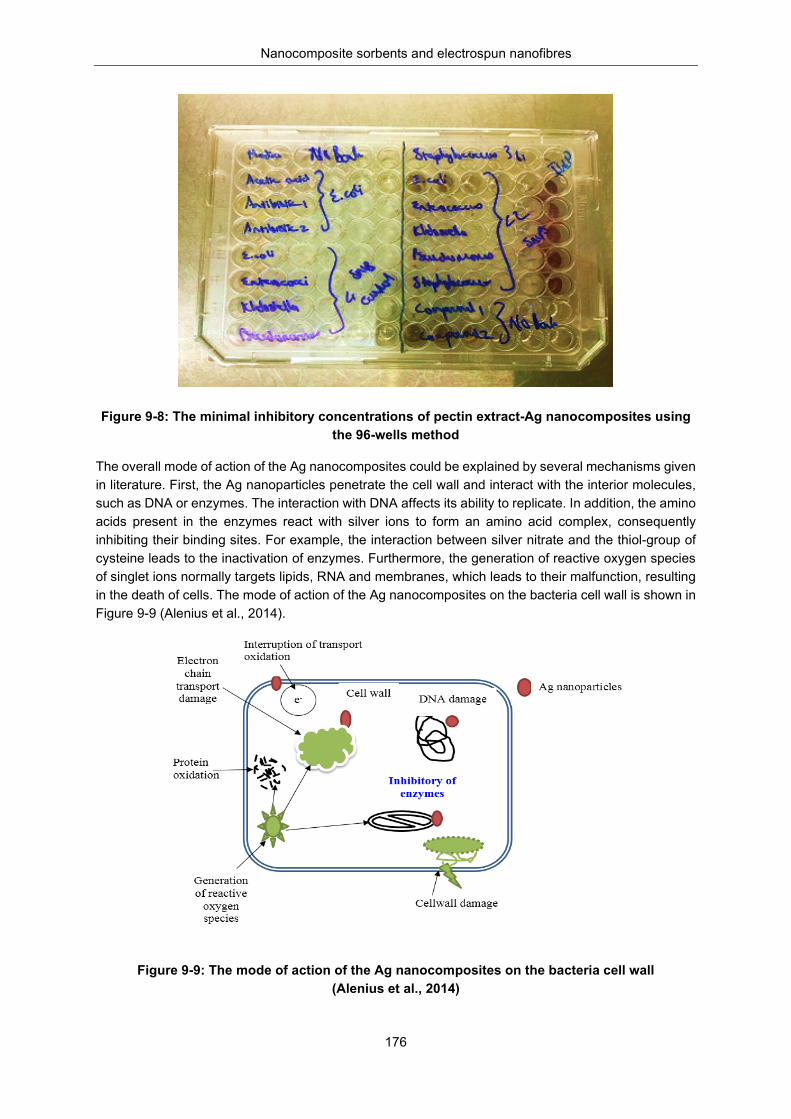
Nanocomposite sorbents and electrospun nanofibres
176
Figure 9-8: The minimal inhibitory concentrations of pectin extract-Ag nanocomposites using the 96-wells method
The overall mode of action of the Ag nanocomposites could be explained by several mechanisms given in literature. First, the Ag nanoparticles penetrate the cell wall and interact with the interior molecules, such as DNA or enzymes. The interaction with DNA affects its ability to replicate. In addition, the amino acids present in the enzymes react with silver ions to form an amino acid complex, consequently inhibiting their binding sites. For example, the interaction between silver nitrate and the thiol-group of cysteine leads to the inactivation of enzymes. Furthermore, the generation of reactive oxygen species of singlet ions normally targets lipids, RNA and membranes, which leads to their malfunction, resulting in the death of cells. The mode of action of the Ag nanocomposites on the bacteria cell wall is shown in Figure 9-9 (Alenius et al., 2014).
Figure 9-9: The mode of action of the Ag nanocomposites on the bacteria cell wall (Alenius et al., 2014)
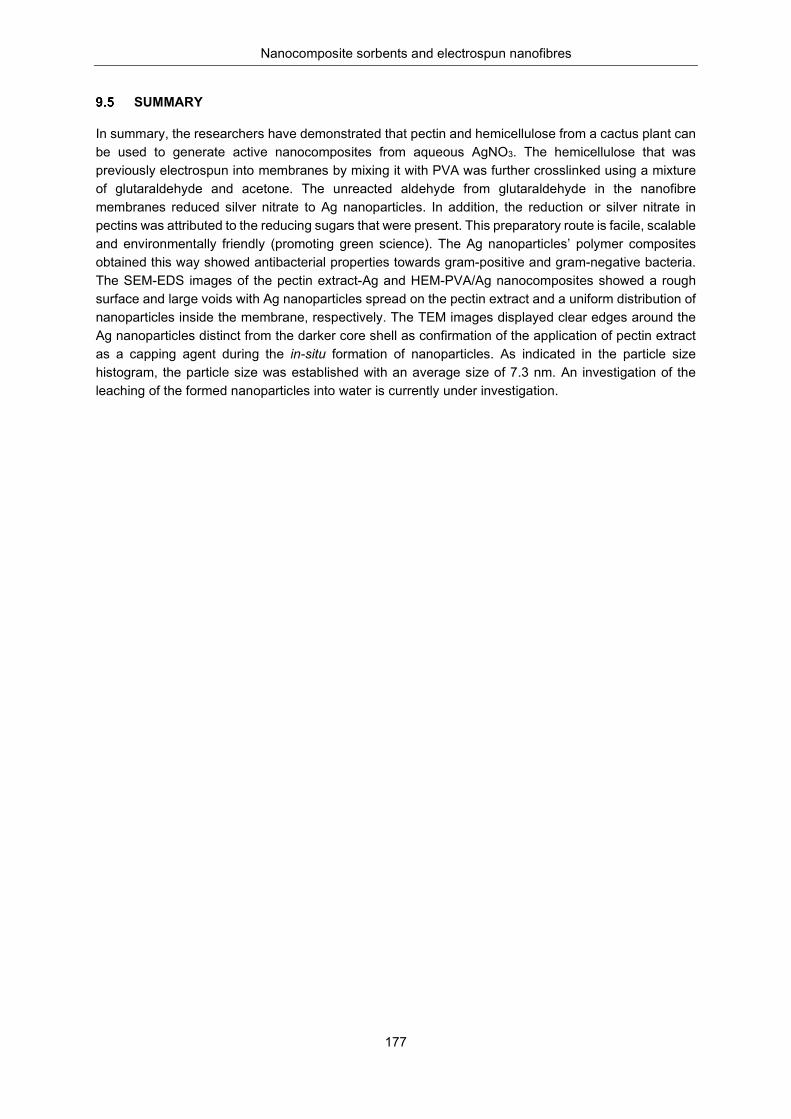
Nanocomposite sorbents and electrospun nanofibres
177
SUMMARY
In summary, the researchers have demonstrated that pectin and hemicellulose from a cactus plant can be used to generate active nanocomposites from aqueous AgNO3. The hemicellulose that was previously electrospun into membranes by mixing it with PVA was further crosslinked using a mixture of glutaraldehyde and acetone. The unreacted aldehyde from glutaraldehyde in the nanofibre membranes reduced silver nitrate to Ag nanoparticles. In addition, the reduction or silver nitrate in pectins was attributed to the reducing sugars that were present. This preparatory route is facile, scalable and environmentally friendly (promoting green science). The Ag nanoparticles’ polymer composites obtained this way showed antibacterial properties towards gram-positive and gram-negative bacteria. The SEM-EDS images of the pectin extract-Ag and HEM-PVA/Ag nanocomposites showed a rough surface and large voids with Ag nanoparticles spread on the pectin extract and a uniform distribution of nanoparticles inside the membrane, respectively. The TEM images displayed clear edges around the Ag nanoparticles distinct from the darker core shell as confirmation of the application of pectin extract as a capping agent during the in-situ formation of nanoparticles. As indicated in the particle size histogram, the particle size was established with an average size of 7.3 nm. An investigation of the leaching of the formed nanoparticles into water is currently under investigation.
Nanocomposite sorbents and electrospun nanofibres
178
CHAPTER 10: REMOVAL OF NATURAL ORGANIC MATTER IN WASTEWATER USING ELECTROSPUN
HEMICELLULOSE/PVA NANOFIBRES
INTRODUCTION
Natural organic matter occurs in most water systems, such as surface waters, soil pore waters and shallow groundwater (Matilainen et al., 2002). It is composed of a complex matrix of compounds, such as humic compounds, hydrophilic acids, proteins, lipids, carbohydrates, carboxylic acids, amino acids and hydrocarbons (Peiris et al., 2008; De la Rubia et al., 2008). Normally, NOM in aquatic resources may not be directly harmful to human beings. However, crises arise when drinking water containing NOM is treated with halogens in the disinfection step (Singer, 1999). For example, chlorination and bromination processes are the most popular disinfectants used in water treatment for combatting waterborne diseases prior to distribution. Unfortunately, reactions between NOM compounds with the halogens produce various disinfection by-products (DBP), such as trihalomethane (THM) and haloacetic acid (HAA) (Singer, 1994). These DBP are associated with health conditions, including cancer, reproductive and developmental effects, and immune-toxic and neurotoxic properties (Steve, 2009; Dotson et al., 2009; Bove et al., 1995; Källén and Robert, 2000). Furthermore, NOM negatively affects the performance of granular activated carbon, the fouling of membrane filtration (Matsui et al., 2002), pipeline corrosion (Broo et al., 1999) and bacterial regrowth in water distribution systems (Jacangelo et al., 1995).
Various methods are employed for the removal of NOM in water, such as, aluminium- and iron-based coagulants (Zeng et al., 2002). However, these coagulants increase volumes of metal-based sludge, change the water pH and may introduce metal residues into water, making them unfit for treatment (Chen et al., 2016). In addition, they are not effective in the removal of organic nitrogen compounds, hydrophilic compounds, neutral compounds and low molecular weight compounds (Chen et al., 2016). Therefore, there is a need for the development of a low-cost system for the removal of NOM during water treatment processes. A very promising material is the HEM-based fibre mat. Hemicellulose is an environmentally friendly compound that can act as a coagulant, flocculant and adsorbent (Dax et al., 2014). However, the use of HEM powder can introduce other soluble organics into the water being treated. This phenomenon is known as secondary pollution. For this reason, HEM was electrospun into nanofibre mats, packed in the empty cartridges and used for the filtration media of NOM in wastewater. The results were compared with HEM powder, conventional Strata-X and silica solid phase extraction.
Natural organic matter in water can be measured as dissolved organic carbon (DOC) or dissolved organic matter (DOM). The latter is more difficult to remove from water. It is also important to recognise that NOM can be divided into two fractions: hydrophobic and hydrophilic fractions (Kennedy et al., 2005). The hydrophobic or humic fraction of high aromaticity is less soluble in water. It has a high molecular weight and is poor in nitrogen (Sharp et al., 2006). The hydrophilic or non-humic fraction, on the other hand, is less reactive and rich in nitrogen, and made of carbohydrates, lipids, hydrophilic acids and amino acids (Aiken et al., 1992). Due to the complex character of the NOM, it is measured through surrogate parameters such as TOC, DOC, specific UV absorbance (SUVA) at 254 nm, colour and UV absorbance at 254 nm (UV-254). The SUVA parameter is linked to the aromaticity and the hydrophobicity of the organic carbon (Leenheer and Croué, 2003).
Various methods are available for NOM characterisation. Recently, LC-OCD and FEEM have been widely accepted as NOM characterisation techniques (Hallé et al., 2009; Peiris et al., 2010).
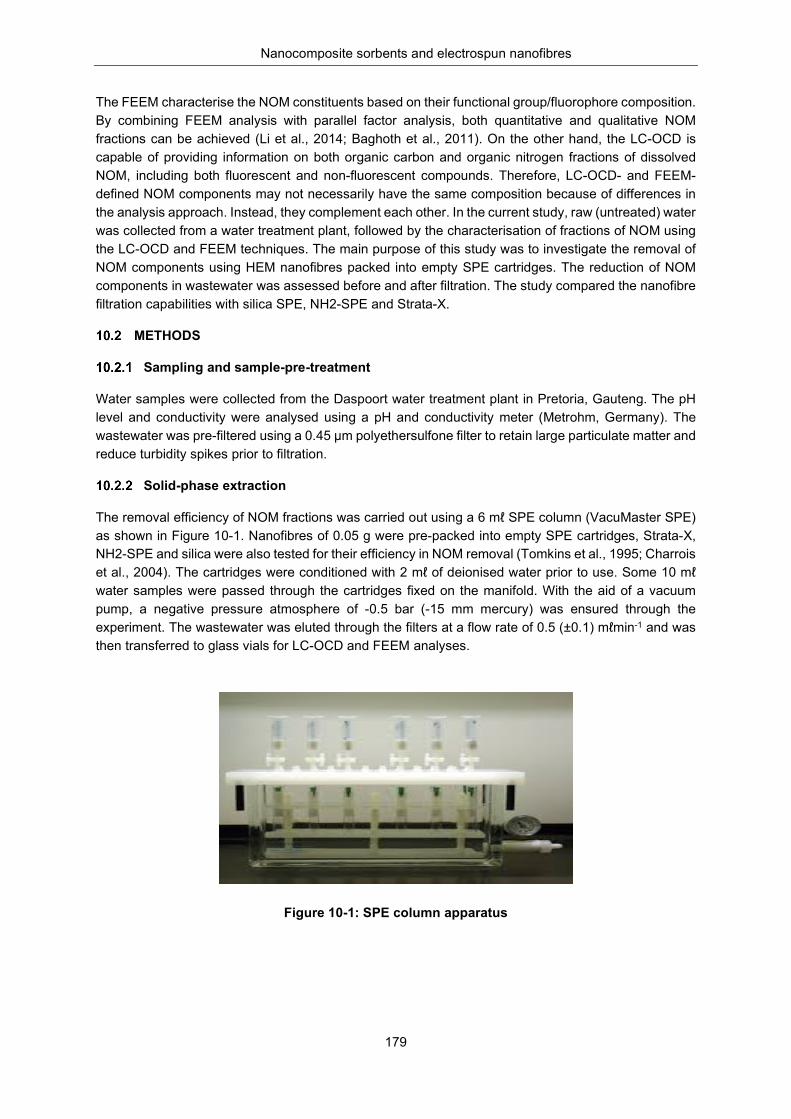
Nanocomposite sorbents and electrospun nanofibres
179
The FEEM characterise the NOM constituents based on their functional group/fluorophore composition. By combining FEEM analysis with parallel factor analysis, both quantitative and qualitative NOM fractions can be achieved (Li et al., 2014; Baghoth et al., 2011). On the other hand, the LC-OCD is capable of providing information on both organic carbon and organic nitrogen fractions of dissolved NOM, including both fluorescent and non-fluorescent compounds. Therefore, LC-OCD- and FEEM-defined NOM components may not necessarily have the same composition because of differences in the analysis approach. Instead, they complement each other. In the current study, raw (untreated) water was collected from a water treatment plant, followed by the characterisation of fractions of NOM using the LC-OCD and FEEM techniques. The main purpose of this study was to investigate the removal of NOM components using HEM nanofibres packed into empty SPE cartridges. The reduction of NOM components in wastewater was assessed before and after filtration. The study compared the nanofibre filtration capabilities with silica SPE, NH2-SPE and Strata-X.
METHODS
Sampling and sample-pre-treatment
Water samples were collected from the Daspoort water treatment plant in Pretoria, Gauteng. The pH level and conductivity were analysed using a pH and conductivity meter (Metrohm, Germany). The wastewater was pre-filtered using a 0.45 µm polyethersulfone filter to retain large particulate matter and reduce turbidity spikes prior to filtration.
Solid-phase extraction
The removal efficiency of NOM fractions was carried out using a 6 mℓ SPE column (VacuMaster SPE) as shown in Figure 10-1. Nanofibres of 0.05 g were pre-packed into empty SPE cartridges, Strata-X, NH2-SPE and silica were also tested for their efficiency in NOM removal (Tomkins et al., 1995; Charrois et al., 2004). The cartridges were conditioned with 2 mℓ of deionised water prior to use. Some 10 mℓ water samples were passed through the cartridges fixed on the manifold. With the aid of a vacuum pump, a negative pressure atmosphere of -0.5 bar (-15 mm mercury) was ensured through the experiment. The wastewater was eluted through the filters at a flow rate of 0.5 (±0.1) mℓmin-1 and was then transferred to glass vials for LC-OCD and FEEM analyses.
Figure 10-1: SPE column apparatus
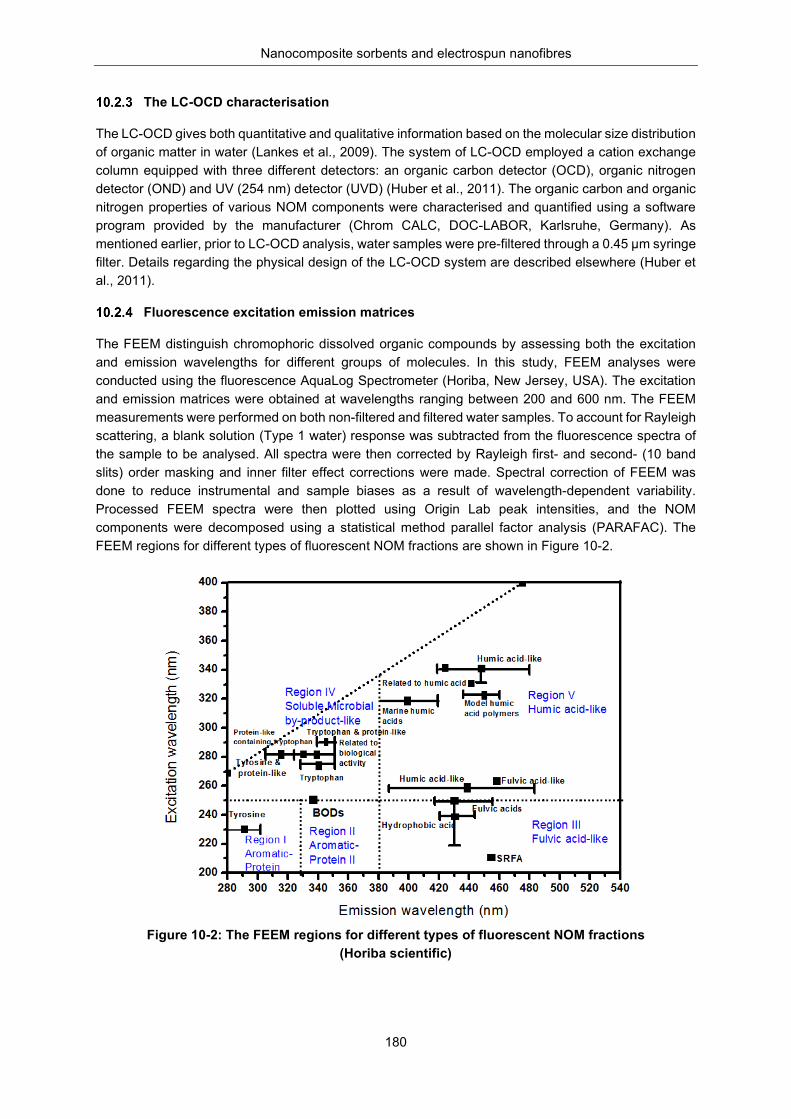
Nanocomposite sorbents and electrospun nanofibres
180
The LC-OCD characterisation
The LC-OCD gives both quantitative and qualitative information based on the molecular size distribution of organic matter in water (Lankes et al., 2009). The system of LC-OCD employed a cation exchange column equipped with three different detectors: an organic carbon detector (OCD), organic nitrogen detector (OND) and UV (254 nm) detector (UVD) (Huber et al., 2011). The organic carbon and organic nitrogen properties of various NOM components were characterised and quantified using a software program provided by the manufacturer (Chrom CALC, DOC-LABOR, Karlsruhe, Germany). As mentioned earlier, prior to LC-OCD analysis, water samples were pre-filtered through a 0.45 µm syringe filter. Details regarding the physical design of the LC-OCD system are described elsewhere (Huber et al., 2011).
Fluorescence excitation emission matrices
The FEEM distinguish chromophoric dissolved organic compounds by assessing both the excitation and emission wavelengths for different groups of molecules. In this study, FEEM analyses were conducted using the fluorescence AquaLog Spectrometer (Horiba, New Jersey, USA). The excitation and emission matrices were obtained at wavelengths ranging between 200 and 600 nm. The FEEM measurements were performed on both non-filtered and filtered water samples. To account for Rayleigh scattering, a blank solution (Type 1 water) response was subtracted from the fluorescence spectra of the sample to be analysed. All spectra were then corrected by Rayleigh first- and second- (10 band slits) order masking and inner filter effect corrections were made. Spectral correction of FEEM was done to reduce instrumental and sample biases as a result of wavelength-dependent variability. Processed FEEM spectra were then plotted using Origin Lab peak intensities, and the NOM components were decomposed using a statistical method parallel factor analysis (PARAFAC). The FEEM regions for different types of fluorescent NOM fractions are shown in Figure 10-2.
Figure 10-2: The FEEM regions for different types of fluorescent NOM fractions
(Horiba scientific)
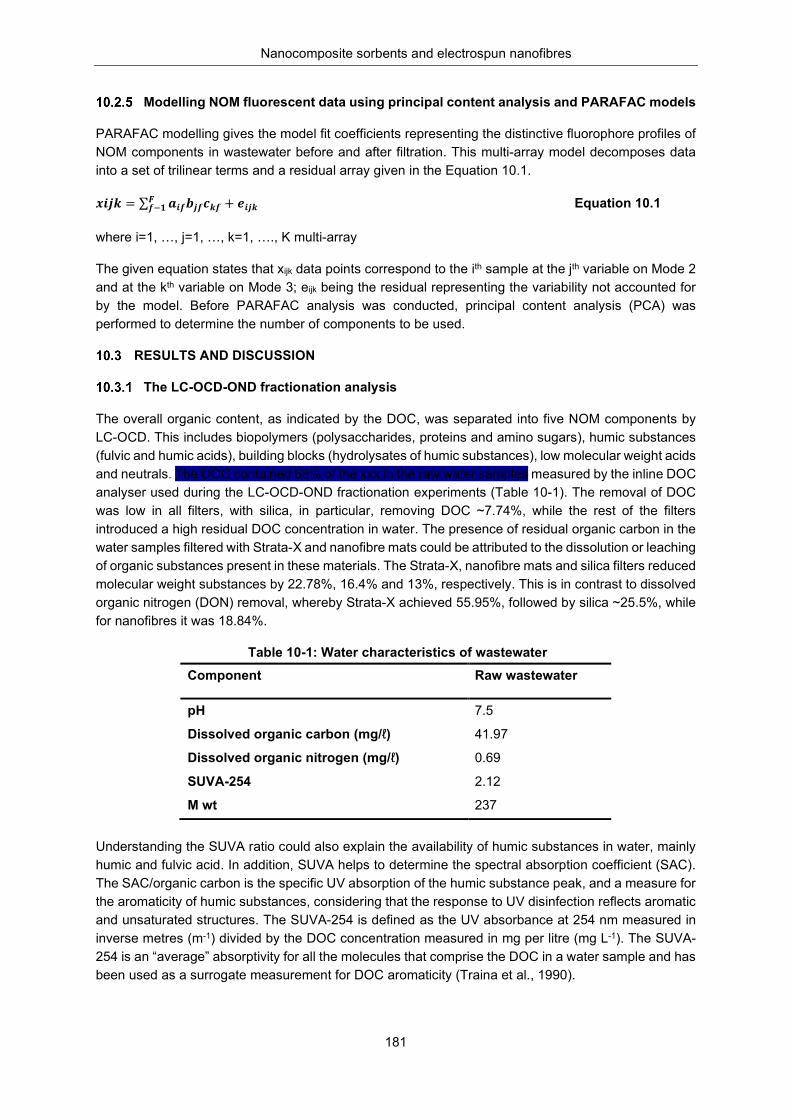
Nanocomposite sorbents and electrospun nanofibres
181
Modelling NOM fluorescent data using principal content analysis and PARAFAC models
PARAFAC modelling gives the model fit coefficients representing the distinctive fluorophore profiles of NOM components in wastewater before and after filtration. This multi-array model decomposes data into a set of trilinear terms and a residual array given in the Equation 10.1.
𝒙𝒙𝒙𝒙𝒙𝒙𝒙𝒙 = ∑ 𝒂𝒂𝒙𝒙𝒊𝒊𝒃𝒃𝒙𝒙𝒊𝒊𝒄𝒄𝒙𝒙𝒊𝒊 + 𝑭𝑭𝒙𝒙𝒙𝒙𝒙𝒙𝑭𝑭𝒊𝒊−𝟏𝟏 Equation 10.1
where i=1, …, j=1, …, k=1, …., K multi-array
The given equation states that xijk data points correspond to the ith sample at the jth variable on Mode 2 and at the kth variable on Mode 3; eijk being the residual representing the variability not accounted for by the model. Before PARAFAC analysis was conducted, principal content analysis (PCA) was performed to determine the number of components to be used.
RESULTS AND DISCUSSION
The LC-OCD-OND fractionation analysis
The overall organic content, as indicated by the DOC, was separated into five NOM components by LC-OCD. This includes biopolymers (polysaccharides, proteins and amino sugars), humic substances (fulvic and humic acids), building blocks (hydrolysates of humic substances), low molecular weight acids and neutrals. The DOC contained 68% of the xxx in the raw water samples measured by the inline DOC analyser used during the LC-OCD-OND fractionation experiments (Table 10-1). The removal of DOC was low in all filters, with silica, in particular, removing DOC ~7.74%, while the rest of the filters introduced a high residual DOC concentration in water. The presence of residual organic carbon in the water samples filtered with Strata-X and nanofibre mats could be attributed to the dissolution or leaching of organic substances present in these materials. The Strata-X, nanofibre mats and silica filters reduced molecular weight substances by 22.78%, 16.4% and 13%, respectively. This is in contrast to dissolved organic nitrogen (DON) removal, whereby Strata-X achieved 55.95%, followed by silica ~25.5%, while for nanofibres it was 18.84%.
Table 10-1: Water characteristics of wastewater Component Raw wastewater
pH 7.5
Dissolved organic carbon (mg/ℓ) 41.97
Dissolved organic nitrogen (mg/ℓ) 0.69
SUVA-254 2.12
M wt 237
Understanding the SUVA ratio could also explain the availability of humic substances in water, mainly humic and fulvic acid. In addition, SUVA helps to determine the spectral absorption coefficient (SAC). The SAC/organic carbon is the specific UV absorption of the humic substance peak, and a measure for the aromaticity of humic substances, considering that the response to UV disinfection reflects aromatic and unsaturated structures. The SUVA-254 is defined as the UV absorbance at 254 nm measured in inverse metres (m-1) divided by the DOC concentration measured in mg per litre (mg L-1). The SUVA-254 is an “average” absorptivity for all the molecules that comprise the DOC in a water sample and has been used as a surrogate measurement for DOC aromaticity (Traina et al., 1990).
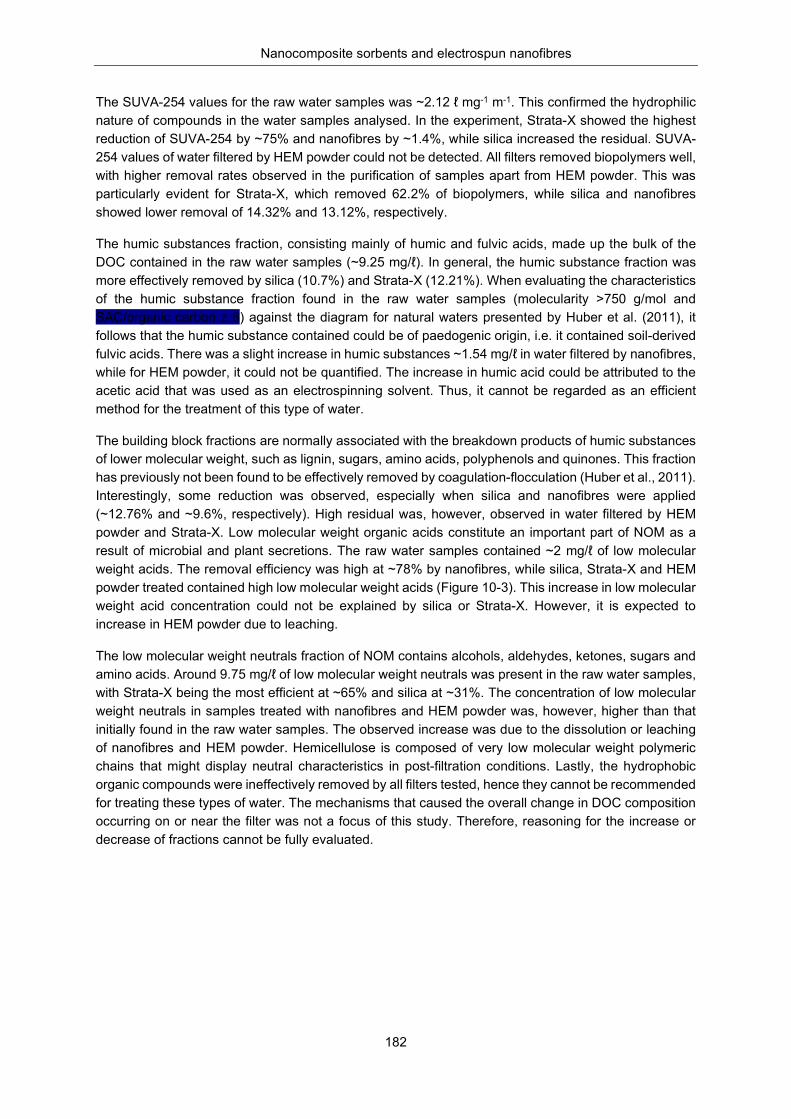
Nanocomposite sorbents and electrospun nanofibres
182
The SUVA-254 values for the raw water samples was ~2.12 ℓ mg-1 m-1. This confirmed the hydrophilic nature of compounds in the water samples analysed. In the experiment, Strata-X showed the highest reduction of SUVA-254 by ~75% and nanofibres by ~1.4%, while silica increased the residual. SUVA-254 values of water filtered by HEM powder could not be detected. All filters removed biopolymers well, with higher removal rates observed in the purification of samples apart from HEM powder. This was particularly evident for Strata-X, which removed 62.2% of biopolymers, while silica and nanofibres showed lower removal of 14.32% and 13.12%, respectively.
The humic substances fraction, consisting mainly of humic and fulvic acids, made up the bulk of the DOC contained in the raw water samples (~9.25 mg/ℓ). In general, the humic substance fraction was more effectively removed by silica (10.7%) and Strata-X (12.21%). When evaluating the characteristics of the humic substance fraction found in the raw water samples (molecularity >750 g/mol and SAC/organic carbon z 6) against the diagram for natural waters presented by Huber et al. (2011), it follows that the humic substance contained could be of paedogenic origin, i.e. it contained soil-derived fulvic acids. There was a slight increase in humic substances ~1.54 mg/ℓ in water filtered by nanofibres, while for HEM powder, it could not be quantified. The increase in humic acid could be attributed to the acetic acid that was used as an electrospinning solvent. Thus, it cannot be regarded as an efficient method for the treatment of this type of water.
The building block fractions are normally associated with the breakdown products of humic substances of lower molecular weight, such as lignin, sugars, amino acids, polyphenols and quinones. This fraction has previously not been found to be effectively removed by coagulation-flocculation (Huber et al., 2011). Interestingly, some reduction was observed, especially when silica and nanofibres were applied (~12.76% and ~9.6%, respectively). High residual was, however, observed in water filtered by HEM powder and Strata-X. Low molecular weight organic acids constitute an important part of NOM as a result of microbial and plant secretions. The raw water samples contained ~2 mg/ℓ of low molecular weight acids. The removal efficiency was high at ~78% by nanofibres, while silica, Strata-X and HEM powder treated contained high low molecular weight acids (Figure 10-3). This increase in low molecular weight acid concentration could not be explained by silica or Strata-X. However, it is expected to increase in HEM powder due to leaching.
The low molecular weight neutrals fraction of NOM contains alcohols, aldehydes, ketones, sugars and amino acids. Around 9.75 mg/ℓ of low molecular weight neutrals was present in the raw water samples, with Strata-X being the most efficient at ~65% and silica at ~31%. The concentration of low molecular weight neutrals in samples treated with nanofibres and HEM powder was, however, higher than that initially found in the raw water samples. The observed increase was due to the dissolution or leaching of nanofibres and HEM powder. Hemicellulose is composed of very low molecular weight polymeric chains that might display neutral characteristics in post-filtration conditions. Lastly, the hydrophobic organic compounds were ineffectively removed by all filters tested, hence they cannot be recommended for treating these types of water. The mechanisms that caused the overall change in DOC composition occurring on or near the filter was not a focus of this study. Therefore, reasoning for the increase or decrease of fractions cannot be fully evaluated.
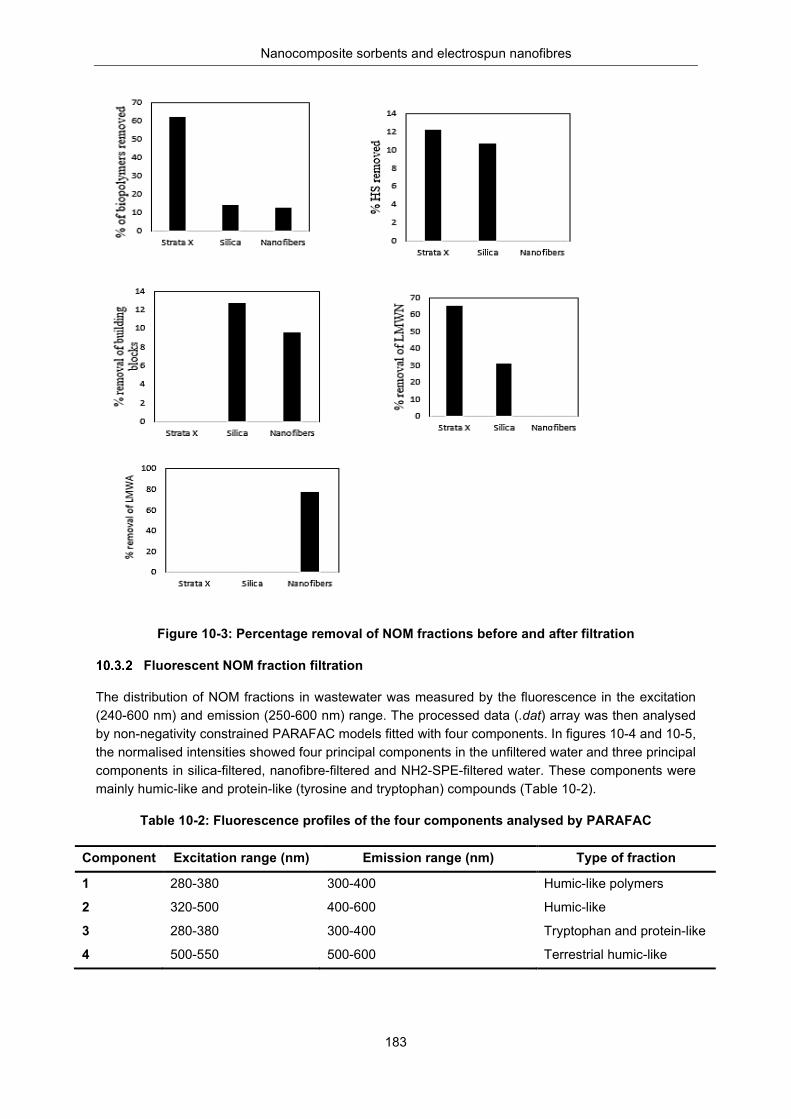
Nanocomposite sorbents and electrospun nanofibres
183
Figure 10-3: Percentage removal of NOM fractions before and after filtration
Fluorescent NOM fraction filtration
The distribution of NOM fractions in wastewater was measured by the fluorescence in the excitation (240-600 nm) and emission (250-600 nm) range. The processed data (.dat) array was then analysed by non-negativity constrained PARAFAC models fitted with four components. In figures 10-4 and 10-5, the normalised intensities showed four principal components in the unfiltered water and three principal components in silica-filtered, nanofibre-filtered and NH2-SPE-filtered water. These components were mainly humic-like and protein-like (tyrosine and tryptophan) compounds (Table 10-2).
Table 10-2: Fluorescence profiles of the four components analysed by PARAFAC
Component Excitation range (nm) Emission range (nm) Type of fraction
1 280-380 300-400 Humic-like polymers
2 320-500 400-600 Humic-like
3 280-380 300-400 Tryptophan and protein-like
4 500-550 500-600 Terrestrial humic-like
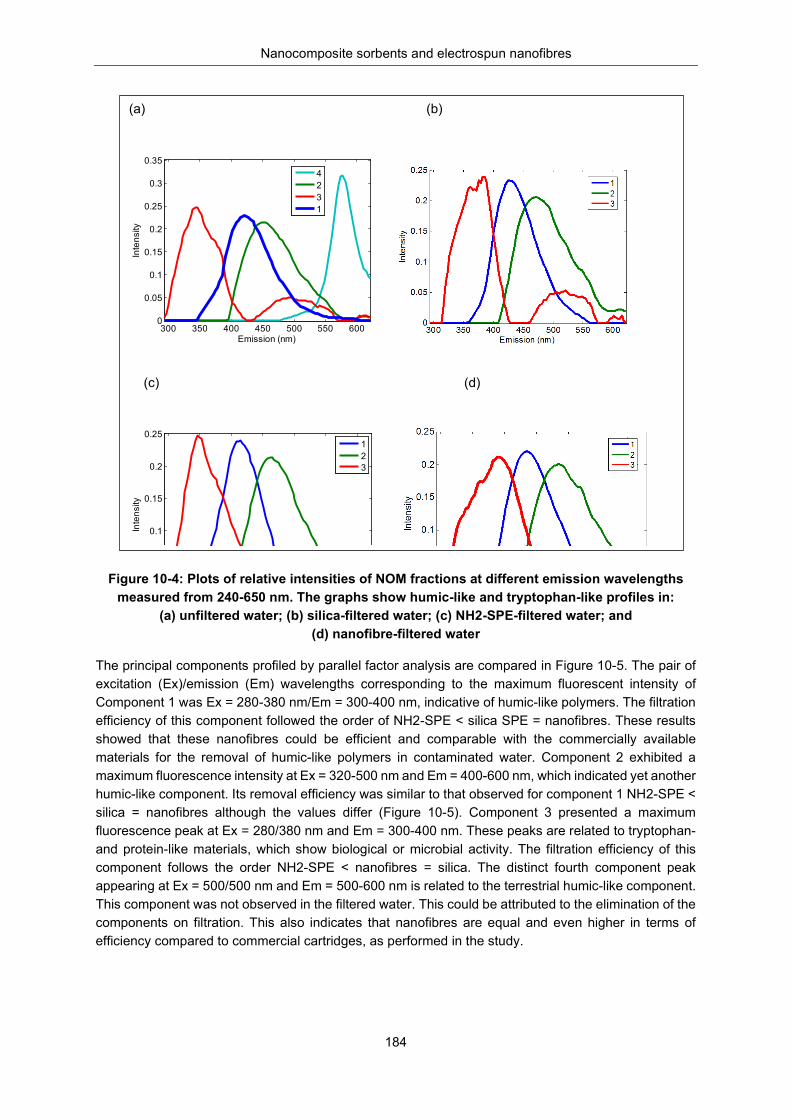
Nanocomposite sorbents and electrospun nanofibres
184
Figure 10-4: Plots of relative intensities of NOM fractions at different emission wavelengths
measured from 240-650 nm. The graphs show humic-like and tryptophan-like profiles in: (a) unfiltered water; (b) silica-filtered water; (c) NH2-SPE-filtered water; and
(d) nanofibre-filtered water
The principal components profiled by parallel factor analysis are compared in Figure 10-5. The pair of excitation (Ex)/emission (Em) wavelengths corresponding to the maximum fluorescent intensity of Component 1 was Ex = 280-380 nm/Em = 300-400 nm, indicative of humic-like polymers. The filtration efficiency of this component followed the order of NH2-SPE < silica SPE = nanofibres. These results showed that these nanofibres could be efficient and comparable with the commercially available materials for the removal of humic-like polymers in contaminated water. Component 2 exhibited a maximum fluorescence intensity at Ex = 320-500 nm and Em = 400-600 nm, which indicated yet another humic-like component. Its removal efficiency was similar to that observed for component 1 NH2-SPE < silica = nanofibres although the values differ (Figure 10-5). Component 3 presented a maximum fluorescence peak at Ex = 280/380 nm and Em = 300-400 nm. These peaks are related to tryptophan- and protein-like materials, which show biological or microbial activity. The filtration efficiency of this component follows the order NH2-SPE < nanofibres = silica. The distinct fourth component peak appearing at Ex = 500/500 nm and Em = 500-600 nm is related to the terrestrial humic-like component. This component was not observed in the filtered water. This could be attributed to the elimination of the components on filtration. This also indicates that nanofibres are equal and even higher in terms of efficiency compared to commercial cartridges, as performed in the study.
(a) (b)
(c) (d)
300 350 400 450 500 550 6000
0.05
0.1
0.15
0.2
0.25
0.3
0.35
Emission (nm)
Inte
nsity
4231
0.1
0.15
0.2
0.25
Inte
nsity
123
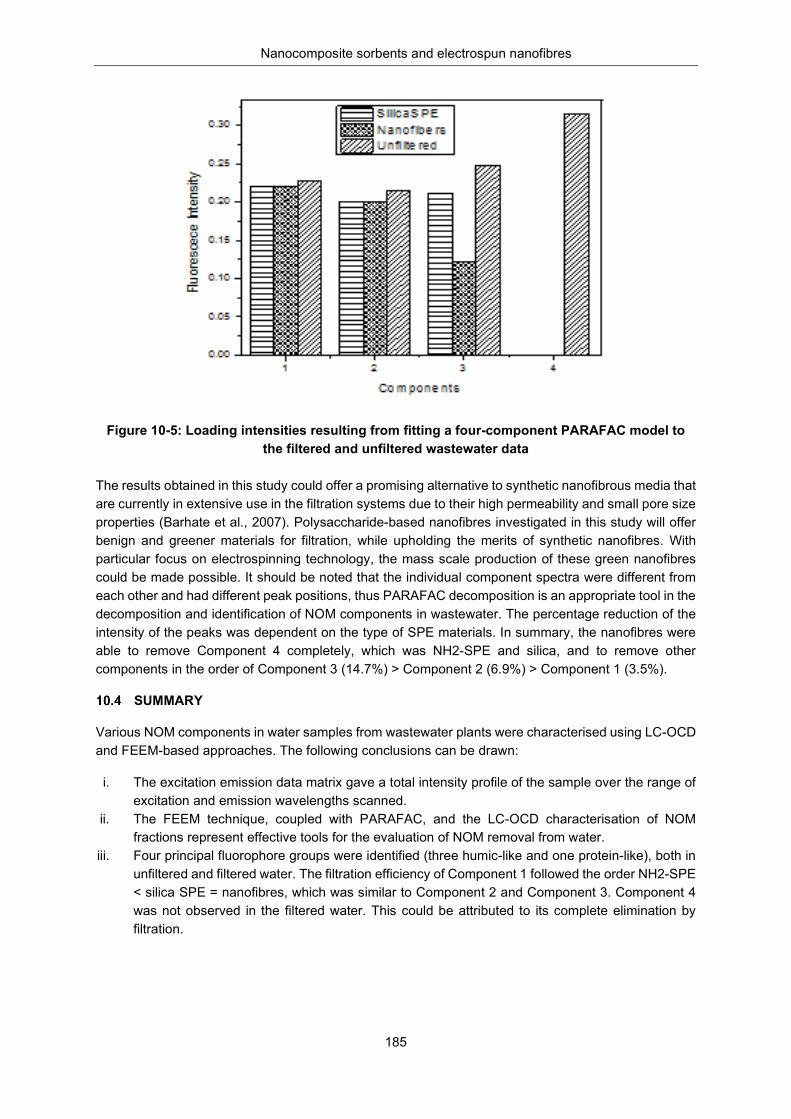
Nanocomposite sorbents and electrospun nanofibres
185
Figure 10-5: Loading intensities resulting from fitting a four-component PARAFAC model to the filtered and unfiltered wastewater data
The results obtained in this study could offer a promising alternative to synthetic nanofibrous media that are currently in extensive use in the filtration systems due to their high permeability and small pore size properties (Barhate et al., 2007). Polysaccharide-based nanofibres investigated in this study will offer benign and greener materials for filtration, while upholding the merits of synthetic nanofibres. With particular focus on electrospinning technology, the mass scale production of these green nanofibres could be made possible. It should be noted that the individual component spectra were different from each other and had different peak positions, thus PARAFAC decomposition is an appropriate tool in the decomposition and identification of NOM components in wastewater. The percentage reduction of the intensity of the peaks was dependent on the type of SPE materials. In summary, the nanofibres were able to remove Component 4 completely, which was NH2-SPE and silica, and to remove other components in the order of Component 3 (14.7%) > Component 2 (6.9%) > Component 1 (3.5%).
SUMMARY
Various NOM components in water samples from wastewater plants were characterised using LC-OCD and FEEM-based approaches. The following conclusions can be drawn:
i. The excitation emission data matrix gave a total intensity profile of the sample over the range of excitation and emission wavelengths scanned.
ii. The FEEM technique, coupled with PARAFAC, and the LC-OCD characterisation of NOM fractions represent effective tools for the evaluation of NOM removal from water.
iii. Four principal fluorophore groups were identified (three humic-like and one protein-like), both in unfiltered and filtered water. The filtration efficiency of Component 1 followed the order NH2-SPE < silica SPE = nanofibres, which was similar to Component 2 and Component 3. Component 4 was not observed in the filtered water. This could be attributed to its complete elimination by filtration.
Nanocomposite sorbents and electrospun nanofibres
186
CHAPTER 11: CONCLUSIONS AND RECOMMENDATIONS
GENERAL CONCLUSIONS
The formulated aims and objectives of the study were achieved fairly well, as discussed in the results presented in chapters 4 to 10.
Commercial electrospun synthetic polymers
The highlights from this study can be summarised as follows:
i. Synthesis of MgAlO, PAN/PVDF-g-PAA, and MS-g-PAA as inert supports and Fe-Pd, TiO2 and Ag as catalytic nanoparticles and their subsequent anchoring/immobilisation and dispersal was achieved. In addition, the anchoring sites on the inert support matrix, including the nanoparticle size distributions using TEM micrographs were shown.
ii. Electrospinning of PAN/PVDF (2:12 wt %) loaded with catalytic nanoparticles into nanofibres using DMF as solvent was achieved. The researchers also electrospun the PAN/PVDF when the nanoparticles were loaded, anchored/immobilised and dispersed in the inert support. In addition, they electrospun these using LBL electrospinning to form multifunctional “sandwich” nanofibre mats.
iii. Simultaneous dechlorination and catalytic photodegradation of mixed pesticides (diuron, fipronil, dieldrin and chlorpyrifos) and their mineralisation to 99% was achieved in a one-step process. Mineralisation was evidenced by the transformation products where CO2 and NH3 formed. In addition, the sequestration of any leaching metal by the PAN/PVDF-g-PAA was addressed. This was supported by kinetic and adsorption thermodynamic data, confirming a one-step process. This was not only novel, but added to the body of new knowledge.
iv. The synthesised, dispersed, anchored and immobilised nanoparticles were further spread on a functionalised PAN/PVDF-g-PAA polymer matrix and electrospun into nanofibres layer by layer. This was clearly shown on the SEM/EDS micrographs.
v. Using simultaneous dechloriantion and catalytic photodegradation, the researchers were able to degrade pesticides (diuron, fipronil, dieldrin and chlorpyrifos) to mineralise them to 99%. Furthermore, they demonstrated the kinetics and suggested a reaction pathway.
vi. This study has shown a reaction pathway that is equally supported by literature and explains why reductive dechlorination may take place at ambient temperature, while hydrodechlorination would require a temperature of about 400 °C.
vii. The researchers have been able to show that Fe-Pd exists in its zero valent state and that the loaded catalysts Fe-Pd, TiO2 and Ag anchor by chelation through the carboxylate group (brushes) from grafted PAA.
The novelty and new knowledge in this study is in the simultaneous one-step process of dechlorination and catalytic photodegradation, which was non-selective to the compounds in the sample. The mineralisation was also evidenced by some of the transformation products identified by the GC × GC-TOF-MS analysis. The costly post-treatment processes and filtration associated with the use of powdered nanocatalysts, such as TiO2 powder, can be eliminated. In addition, any metal ions leaching from the system can be trapped by the carboxylate brush in the PAN/PVDF-g-PAA. This can be achieved in one step as shown, and supported by the thermodynamic parameters discussed.
Nanocomposite sorbents and electrospun nanofibres
187
Natural electrosupn biopolymers
The focus of the second part of the study, covered in chapters 7 to 9, was to fabricate cheaper water filtration materials from polysaccharides using cactus (Opuntia ficus indica) pads. The polysaccharides were blended with co-polymers (PVA) and subsequently electrospun to produce nanofibres. Based on the findings of this part of the project, the main conclusions derived from the key aspects of the project (isolation, characterisation and the application of cactus-based filters) have been achieved, as summarised below:
i. Two polysaccharides (pectin and HEM sugar monomers) were successfully isolated from cactus pads.
ii. The results obtained showed that HEM extract could be electrospun to nanofibres under optimised conditions. The electrospinning of HEM and cross-linking of its nanofibres was carried out successfully. Uniform and continuous nanofibres were obtained as a consequence of increasing the concentration of PVA in the solution blends. The influence of pectin extract and its composite on fluorescent dyes was also carried out in situ. In particular, pectin extract decorated with Ag nanoparticles was generated by mixing pectins and silver nitrate. The pectin extract-Ag nanocomposites reduced the fluorescent intensity of RhB. This phenomenon has important applications in managing dyes discharged from industrial effluents into the environment.
iii. Both polysaccharide extracts were applied in water treatment in powdered form, as well as in nanofibres. The constituents of the polysaccharide extract (rich in HEM) were used as adsorbents to remove Pb2+ and Cd2+ from water. The maximum adsorption capacities of polysaccharides for the removal of Pb2+ and Cd2+ as 256 and 151 mg/ℓ, respectively, were obtained. These values are relatively high compared to the literature report on natural biosorbents.
iv. The capability of the HEM/pectin nanofibres to remove NOM fractions from wastewater was carried out. Using relatively novel technologies (LC-OCD and FEEM), together with modelling, the distributions of NOM in the raw water and after filtration were assessed. Silver nanoparticles immobilised on nanofibres were applied to remove bacteria from raw wastewater. The Ag nanocomposites and polymer composites obtained in this study showed antibacterial properties towards gram-positive and gram-negative bacteria.
RECOMMENDATIONS FOR FURTHER STUDIES
• The identification and quantification of the degradation products during the degradation of COCs should be carried out. The study could extend to cover brominated pesticides and selected fire retardants. Electrospun and functionalised composites could then be applied to the removal or degradation of brominated pesticides and halogenated compounds, especially those containing the benzene ring.
• The application of nanocomposites could be extended to be applied to the removal of inorganic, organic and biological contaminants (bacteria such as E coli and Vibrio cholerae). Thus, further studies will investigate the application of the LBL design. A photocatalyst with a lined flow bed could be applied to the treatment and remediation of contaminated water and the regeneration of sorbents to recycle the materials.
• A number of optimisation experiments could not be accomplished due to time constraints. Further research focusing on the influence of different physicochemical characteristics ought to be conducted. Furthermore, it will be important to carry out studies on the interaction of RhB and pectin extract nanocomposites and nanofibres, and the fouling possibilities of electrospun nanofibres.
Nanocomposite sorbents and electrospun nanofibres
188
REFERENCES ABBASIZADEH S, KESHTKAR AR and MOUSAVIAN MA (2013) Preparation of a novel electrospun
polyvinylalcohol/titanium oxide nanofiber adsorbent modified with mercapto groups for uranium(VI) and thorium(IV) removal from aqueous solution. Chemical Engineering Journal 220 (161) 171.
ABELSOHN A, GIBSON BL, SANBORN MD and WEIR E (2002) Identifying and managing adverse environmental health effects: 5. Persistent organic pollutants. Canadian Medical Association Journal 166 1549–1554.
ADELODUN AA, LIM YH and JO YM (2014) Surface oxidation of activated carbon pellets by hydrogen peroxide for preparation of CO2 adsorbent. Journal of Industrial and Engineering Chemistry 20 2130–2137.
AGENCY FOR TOXIC SUBSTANCES AND DISEASES REGISTRY (ATSDR)/US PUBLIC HEALTH SERVICE (1994) Toxicological profile for 4,4'-DDT, 4,4'-DDE, 4, 4'-DDD (Update), ATSDR, Atlanta, GA.
AIKEN GR, THORN KA and THURMAN EM (1992) Isolation of hydrophilic organic acids from water using nonionic macroporous resins. Organic Geochemistry 18 (4) 567–573.
AKBAYRAK S, KARAT M, VOLKAN M and OZKAR S (2014) Palladium (0) nanoparticles supported on silica-coated cobalt ferrite: A highly active, magnetically isolable and reusable catalyst for hydrolytic dehydrogenation of ammonia borane. Applied Catalysis B: Environmental 147 3879–393.
AKKAYA R and ULUSOY U (2008) Adsorptive features of chitosan entrapped in polyacrylamide hydrogel for Pb2+, UO22+, and Th4+. Journal of Hazardous Materials 151 380–388.
AKSU Z and KUTSAL T (1998) Determination of kinetic parameters in the bio sorption of copper (II) on Cladophora sp, in a packed bed column reactor. Process Biochemistry 33 7–13.
ALCANTAR N (2007) Use of cactus mucilage to clean dirty water.
ALENIUS H, CATALÁN J, LINDBERG H, NORPPA H, PALOMÄKI J and SAVOLAINEN K (2014) Nanomaterials and human health. In: Handbook of nanosafety: Measurement, exposure and toxicology, VOGEL U, SAVOLAINEN K, WU Q, VAN TONGEREN M, BROUWER D and BERGES M, Academic Press: San Diego, CA.
ALONSO A, MACANÁS J, DAVIES GL, GUN’KO YK, MUÑOZ M, MURAVIEV, DN (2011) Environmentally-safe polymer-metal nanocomposites with most favorable distribution of catalytically active and biocide nanoparticles. In: Advances in nanocomposite technology, HASHIM AA, IntechOpen.
AMARASINGHE, B. M. W. P. K., & WILLIAMS, R. A. (2007). Tea waste as a low-cost adsorbent for the removal of Cu and Pb from wastewater. Chemical Engineering Journal, 132(1-3) 299-309.
Nanocomposite sorbents and electrospun nanofibres
189
AMATO E, DIAZ-FERNANDEZ YA, TAGLIETTI A (2011) Synthesis, characterization and antibacterial activity against gram positive and gram-negative bacteria of biomimetically coated silver nanoparticles. Langmuir 27 9165–9173.
AN J, ZHANG H, ZHANG J, ZHAO Y and YUAN X (2009) Preparation and antibacterial activity of electrospun chitosan/poly (ethylene oxide) membranes containing silver nanoparticles. Colloid and Polymer Science 287 (12) 1425–1434.
AW TG, GIN KYH, GOH SG and TE SH (2012) 3.36 - Sample preparation of microbial contaminants in water. In: Comprehensive sampling and sample preparation, PAWLISZYN J, Academic Press, Oxford.
AYGUN A and YILMAZ T (2010) Improvement of coagulation-flocculation process for treatment of detergent wastewaters using coagulant aids. International Journal of Chemical and Environmental Engineering 1 (2) 97–101.
AYOUB A,VENDITTI R, PAWLAK J, SALAM, A and HUBBE M (2013) Novel hemicellulose–chitosan biosorbent for water desalination and heavy metal removal. ACS Sustainable Chemistry and Engineering 1 (9) 1102–1109.
BAGHERIAN H, ASHTIANI FZ, FOULADITAJAR A and MOHTASHAMY M (2011) Comparisons between conventional, microwave-and ultrasound-assisted methods for extraction of pectin from grapefruit. Chemical Engineering and Processing: Process Intensification 50 (11) 1237–1243.
BAGHOTH S, SHARMA S and AMY G (2011) Tracking natural organic matter (NOM) in a drinking water treatment plant using fluorescence excitation – emission matrices and PARAFAC. Water Research 45 (2) 797–809.
BARAKAT, M. A. (2011). New trends in removing heavy metals from industrial wastewater. Arabian journal of chemistry 4(4) 361-377.
BARHATE RS and RAMAKRISHNA S (2007) Nanofibrous filtering media: filtration problems and solutions from tiny materials. Journal of Membrane Science 296 (1) 1–8.
BARNHOORN IEJ, VAN DYK JC, GENTHE B, HARDING WR, WAGENAAR GM and BORNMAN MS (2015) Organochlorine pesticide levels in Clarias gariepinus from polluted freshwater impoundments in South Africa and associated human health risks. Chemosphere 120 391–397.
BENITO P, LABOJAS FM and RIVES V (2009) Microwaves layered double hydroxides: A smooth understanding. Journal of Pure and Applied Chemistry 81 8 1459–1471.
BERRY D, XI C and RASKIN L (2006) Microbial ecology of drinking water distribution systems. Current Opinion in Biotechnology 17 297–302.
BETATACHE H, AOUABED A, DROUICHE N and LOUNICI H (2014) Conditioning of sewage sludge by prickly pear cactus (Opuntia ficus Indica) juice. Ecological Engineering 70 465-469.
BHATTACHARYA A, RAWLINS JW and RAY P (2009) Polymer grafting and crosslinking, BHATTACHARYA A and JAMES W, Wiley, Canada.
Nanocomposite sorbents and electrospun nanofibres
190
BLAAK H, DE KRUIJF P, HAMIDJAJA RA, VAN HOEK AHAM, DE RODA HUSMAN AM and SCHETS FM (2014) Prevalence and characteristics of ESBL-producing E. coli in Dutch recreational waters influenced by wastewater treatment plants. Veterinary Microbiology 171 (3–4) 448–459
BOVE FJ, FULCOMER MC, KLOTZ JB, ESMART J, DUFFICY EM and SAVRIN JE (1995) Public drinking water contamination and birth outcomes. American Journal of Epidemiology 141 (9) 850–862.
BRANDÃO PC, SOUZA TC, FERREIRA CA, HORI CE and ROMANIELO LL (2010) Removal of petroleum hydrocarbons from aqueous solution using sugarcane bagasse as adsorbent. Journal of Hazardous Materials 175 (1) 1106–1112.
BROO AE, BERGHULT B and HEDBERG T (1999) Drinking water distribution-the effect of natural organic matter (NOM) on the corrosion of iron and copper. Water Science and Technology 40 (9) 17–24.
BROWN LR (2011) World on the edge: How to prevent environmental and economic collapse, Earth Policy Institute, New York, NY, London.
BRUNAUER S, EMMETT PH and TELLER E (1938) Adsorption of gases in multimolecular layers. Journal of American Chememical Society 60 309–319.
BUELL S, VAN VLIET K and RUTLEDGE, GC (2009) Mechanical properties of glassy polyethylene nanofibers via molecular dynamics simulations. Macromolecules 42 (13) 4887–4895.
BULUT, Y., and BAYSAL, Z. (2006). Removal of Pb (II) from wastewater using wheat bran. Journal of environmental management 78(2) 107-113.
CAFFALL KH and MOHNEN D (2009) The structure, function, and biosynthesis of plant cell wall pectic polysaccharides. Carbohydrate Research 344 (14) 1879–1900.
CAMPBELL, C. G., BORGLIN, S. E., GREEN, F. B., GRAYSON, A., WOZEI, E., and STRINGFELLOW, W. T. (2006). Biologically directed environmental monitoring, fate, and transport of estrogenic endocrine disrupting compounds in water: a review. Chemosphere, 65(8), 1265-1280.
CAO Y, SKAUG MA, ANDERSEN O and AASETH J (2015) Chelation therapy in intoxication with mercury, lead and copper. Journal of Trace Elements in Medicine and Biology 31 188–192.
CÁRDENAS A, GOYCOOLEA FM and RINAUDO M (2008) On the gelling behaviour of ‘nopal’ (Opuntia ficus indica) low methoxyl pectin. Carbohydrate Polymers 73 (2) 212–222.
CARTER CB (1996) Transmission electron microscopy: A textbook for materials science. Plenum, New York, NY.
CAVANI F, TRIFIRO F and VACCARI A (1991) Hydrotalcite-type anionic clays: preparation, properties and applications. Catalysis Today 11 173–301.
CHARROIS JW, AREND MW, FROESE KL and HRUDEY SE (2004) Detecting N-nitrosamines in drinking water at nanogram per liter levels using ammonia positive chemical ionization. Environmental Science and Technology 38 (18) 4835–4841.
CHARY NS, KAMALA CT and RAJ DSS (2008) Assessing risk of heavy metals from consuming food grown on sewage irrigated soils and food chain transfer. Ecotoxicology and Environmental Safety 69 513–524.
Nanocomposite sorbents and electrospun nanofibres
191
CHAUHAN GS, KUMARI S and SHARMA R (2007) Pectin and acrylamide based hydrogels for environment management technologies: Synthesis, characterization, and metal ions sorption. Journal of Applied Polymer Science 106 (4) 2158–2168.
CHEN F, PELDSZUS S, ELHADIDY AM, LEGGE RL, VAN DYKE MI and HUCK PM (2016) Kinetics of natural organic matter (NOM) removal during drinking water biofiltration using different NOM characterization approaches. Water Research 104 361–370.CHEN H, ABDULLA HAN, SANDERS RL, MYNENI SCB, MOPPER K and HATCHER PG (2004) Production of black carbon-like and aliphatic molecules from terrestrial dissolved organic matter in the presence of sunlight and iron. Environmental Science and Technology Letters 1 (10) 399–404.
CHEN JP, HONG, L, WU, S and WANG L (2002) Elucidation of interactions between metal ions and Ca alginate-based ion-exchange resin by spectroscopic analysis and modeling simulation. Langmuir 18 (24) 9413–9421.
CHEN JP, CHANG GY and CHEN JK (2008) Electrospun collagen/chitosan nanofibrous membrane as wound dressing. Colloids and Surfaces A: Physicochemical and Engineering Aspects 313 183–188.
CHEN X and MAO S (2007) Titanium dioxide nanomaterials: Synthesis, properties, modifications, and applications. Chemical Reviews 107 2891–2959.
CHEN XC, WANG YP, LIN Q, SHI JY, WU WX and CHEN YX (2005) Biosorption of copper (II) and zinc (II) from aqueous solution by Pseudomonas putida CZ1. Colloids and Surfaces B: Biointerfaces 46 (2) 101–107.
CHEN Y, DONG BZ, GAO NY, FAN JC (2007) Effect of coagulation pretreatment on fouling of an ultrafiltration membrane. Desalination 204 (1) 181–188.
CHEN, X., SHI, J., CHEN, Y., XU, X., XU, S., and WANG, Y. (2006). Tolerance and biosorption of copper and zinc by Pseudomonas putida CZ1 isolated from metal-polluted soil. Canadian journal of microbiology 52(4) 308-316.
CHEN, B., YUAN, M., and LIU, H. (2011). Removal of polycyclic aromatic hydrocarbons from aqueous solution using plant residue materials as a biosorbent. Journal of hazardous materials 188(1-3) 436-442.
CHENG W, DASTGHEIB SA and KARANFIL T (2005) Adsorption of dissolved natural organic matter by modified activated carbons. Water Research 39 2281–2290.
CHERYAN M and RAJAGOPALAN N (1998) Membrane processing of oil streams: Wastewater treatment and waste reduction. Journal of Membrane Science 151 (1) 13–28.
CHIRON S, FERNANDEZ-ALBA A, RODRIGUEZ A and GARCIA-CALVO E (2000) Pesticide chemical oxidation: State-of-the-art. Water Research 343 (2) 366–377.
CHITUMA S, VOLRALUCK P and NARUPOL I (2011) The potential use of nanosilver-decorated titanium dioxide nanofibers for toxin decomposition with antimicrobial and self-cleaning properties. Applied Surface Science 257 8850–8856.
Nanocomposite sorbents and electrospun nanofibres
192
CHRYSIKOU L, GEMENETZIS P, KOURAS A, MANOLI E, TERZI E and SAMARA C (2008) Distribution of persistent organic pollutants, polycyclic aromatic hydrocarbons and trace elements in soil and vegetation following a large-scale landfill fire in northern Greece. Environment International 34 210–225.
CHUTIMA S, VORALUCK P and NARUPOL I (2011) The potential use of nano silver-decorated titanium dioxide nanofibers for toxin decomposition with antimicrobial and self-cleaning properties. Applied Surface Science 257 8850–8856.
CIESZYNSKA A and WISNIEWSSKI M (2011) Selective extraction of palladium from hydrochloric acid solutions with phosphonium extractants. Separation and Purification Technology 80 385–389
CLARK A, TURNER T, DOROTHY KP, GOUTHAM J, KALAVATI C and RAJANNA B (2003) Health hazards due to pollution of waters along the coast of Visakhapatnam, east coast of India. Ecotoxicology and Environmental Safety 56 390–397.
COLBORN T, DUMANOSKI D and MYERS JP (1996) Wide spread pollutants with endocrine disrupting effects. http://www.ourstolenfuture.org/Basics/chemlist.htm. (Accessed 7 May 2010).
COTTRELL TL (1958) The strengths of chemical bonds, 2nd ed., Butterworth, London.
CRINI G (2005) Recent developments in polysaccharide-based materials used as adsorbents in wastewater treatment. Progress in Polymer Science 30 38–70.
CROOKS J (2004) Rand water publication, research and script: Johann Crooks – Emeritus Professor of Geomorphology. Contributions by Rand Water specialists.
CROSS HE and BROWN DR (2010) Entrained sodium in mixed metal oxides derived from layered double hydroxides. Catalysis Communications 12 243–245.
DANESHVAR N, AYAZLOO M, KHATAEE AR and POURHASSAN M (2007) Biological decolorization of dye solution containing Malachite Green by microalgae Cosmarium sp. Bioresource Technology 98 (6) 1176–1182.
DAOUD WA, XIN JH, ZHANG Y-H (2005) Surface functionalization of cellulose fibers with titanium dioxide nanoparticles and their combined bactericidal activities. Surface Science 599 69–75.
DAX D, CHÁVEZ MS, XU C, WILLFÖR SM, MENDONÇA RT, SÁNCHEZ J (2014) Cationic hemicellulose-based hydrogels for arsenic and chromium removal from aqueous solutions. Carbohydrate Polymers 111 797–805.
DE LA RUBIA A RODRÍGUEZ M, LEÓN VM and PRATS D (2008) Removal of natural organic matter and THM formation potential by ultra-and nanofiltration of surface water. Water Research 42 (3) 714–722.
DELGADO LF, CHARLES P, GLUCINA K and MORLAY C (2012) The removal of endocrine disrupting compounds, pharmaceutically activated compounds and cyanobacterial toxins during drinking water preparation using activated carbon – A review. Science of The Total Environment 435–436 509–525.
DELVAL F, VEBREL J, PONT P, MORCELLET M, JANUS L and GRÉGORIO C (2000) Sorption properties toward aromatic compounds of insoluble crosslinked polymers containing starch derivatives. Polymer Recycling 5 (3) 137–144.
Nanocomposite sorbents and electrospun nanofibres
193
DEMIRBAS, A. (2004). Combustion characteristics of different biomass fuels. Progress in energy and combustion science 30(2) 219-230.
DENG, S., BAI, R., and CHEN, J. P. (2003). Aminated polyacrylonitrile fibers for lead and copper removal. Langmuir 19(12) 5058-5064.
DENG A, CHEN J, LI H, REN J, SUN and ZHAO L (2014) Photo-degradation of Methyl Orange by Polysaccharides/LaFe0. 8Cu0. 2O3 Composite Films. BioResources 9 (2) 2717–2726.
DENIZ A, CELEBIOGLU A, KAYACI F and UYAR T (2011) Electrospun polymeric composites containing TiO2 short nanofibers. Materials Chemistry and Physics 129 701–704.
DESAI K and KIT K (2008) Effect of spinning temperature and blend ratios on electrospun chitosan/Poly (acrylamide) blends fibers. Polymer 49 4046–4050.
DESTAYE AG, LIN CK and LEE CK (2013) Glutaraldehyde vapor cross-linked nanofibrous PVA mat with in situ formed silver nanoparticles. ACS Applied Materials and Interfaces 5 (11) 4745–4752.
DICKERT H, MACHKA DK and BRAVENY I (1981) The uses and limitations of disc diffusion in the antibiotic sensitivity testing of bacteria. Infection 9 (1) 18–24.
DOBRETSOV S, DAHMS, HU and QIAN PY (2006) Inhibition of biofouling by marine microorganisms and their metabolites. Biofouling 22 43–54.
DOONG R-A, LEE S-H, LEE C-C, SUN Y-C and WU S-C (2008) Characterization and composition of heavy metals and persistent organic pollutants in water and estuarine sediments from Gao-ping River, Taiwan. Marine Pollution Bulletin 57 846–857.
DOREA C (2009) Coagulant-based emergency water treatment. Desalination 248 (1) 83–90.
DOTSON A, WESTERHOFF P and KRASNER SW (2009) Nitrogen enriched dissolved organic matter (DOM) isolates and their affinity to form emerging disinfection by-products. Water Science and Technology 60 (1) 135–143.
DRONNET VM, RENARD CMGC, AXELOS MAV and THIBAULT J-F (1996) Heavy metals binding by pectins: selectivity, quantification and characterisation. Progress in Biotechnology 14 535–540.
DUBININ MM and RADUSHKEVICH LV (1947) Equation of the characteristic curve of activated charcoal. Chem. Zentr. 1 (1) 875.
DUGAN, N. R., and WILLIAMS, D. J. (2006). Cyanobacteria passage through drinking water filters during perturbation episodes as a function of cell morphology, coagulant and initial filter loading rate. Harmful algae 5(1) 26-35.
DURAND J, TEUMA E and GOMEZ M (2008) An overview of palladium nanocatalysts: Surface and molecular reactivity. European Journal of Inorganic Chemistry 2 3577–3586.
DURUIBE JO, OGWUEGBU MOC and EGWURUGWU JN (2007) Heavy metal pollution and human biotoxic effects. International Journal of Physical Sciences 2 (5) 112–118.
Nanocomposite sorbents and electrospun nanofibres
194
EBRINGEROVA A and HEINZE T (2000) Xylan and xylan derivatives – biopolymers with valuable properties, 1. Naturally occurring xylans structures, isolation procedures and properties. Macromolecular Rapid Communications 21 (9) 542–556.
EBRINGEROVÁ A (2005) Structural diversity and application potential of hemicelluloses. In: Macromolecular Symposia, Wiley Online Library.
ELOFF JN (1998) A sensitive and quick microplate method to determine the minimal inhibitory concentration of plant extracts for bacteria. Planta Medica 64 (8) 711–713.
ELLIOTT, M. (2003). Biological pollutants and biological pollution––an increasing cause for concern. Marine Pollution Bulletin 46(3) 275-280.
ERDEM B, HUNSICKER RA, SIMMONS GW, SUDOL ED, DIMONIE VL and EL-AASSER MS (2001) XPS and FTIR Surface Characterization of TiO2 particles used in polymer encapsulation. Langmuir 17 2664–2669.
ERDEM M, UCAR S, KARAGÖZ S and TAY T (2013) Removal of lead (II) ions from aqueous solutions onto activated carbon derived from waste biomass. The Scientific World Journal 2013.
ESCOBAR IC, RANDALL AA and TAYLOR JS (2001) Bacterial growth in distribution systems: Effect of assimilable organic carbon and biodegradable dissolved organic carbon. Environmental Science and Technology 35 3442–3447.
EUSTIS, S., and EL-SAYED, M. A. (2006). Why gold nanoparticles are more precious than pretty gold: noble metal surface plasmon resonance and its enhancement of the radiative and nonradiative properties of nanocrystals of different shapes. Chemical society reviews 35(3) 209-217.
FATOKI OS and AWOFOLU RO (2003) Methods for selective determination of persistent organochlorine pesticide residues in water and sediments by capillary gas chromatography and electron-capture detection. Journal of Chromatography A 983 225–236.
FEBRIANTO J, KOSASIH A, SUNARSO J, JUA Y, INDRASWATI N and ISMADJI S (2009) Equilibrium and kinetic studies in adsorption of heavy metals using biosorbent: A summary of recent studies. Journal of Hazardous Materials 162 616–645.
FEDALA N, LOUNICI H, DROUICHE N, MAMERI N and DROUICHE M (2015) Physical parameters affecting coagulation of turbid water with Opuntia ficus-indica cactus. Ecological Engineering 77 33–36.
FENGEL D and WEGENER G (1984) Wood: chemistry, ultrastructure, reactions. Walter de Gruyter 613 1960–1982.
FIGUEIRA V, SERRA E and MANAIA CM (2011) Differential patterns of antimicrobial resistance in population subsets of Escherichia coli isolated from waste- and surface waters. Science of The Total Environment 409 1017–1023.
FIOL N and VILLAESCUSA I (2009) Determination of sorbent point zero charge: Usefulness in sorption studies. Environmental Chemistry Letters 7 (1) 79–84.
FISCHER, A., KWAPULIŃSKI, J., WIECHUŁA, D., FISCHER, T., and LOSKA, M. (2008). The occurrence of copper in deciduous teeth of girls and boys living in Upper Silesian Industry Region (Southern Poland). Science of the total environment 389(2-3) 315-319.
Nanocomposite sorbents and electrospun nanofibres
195
FLORA S and PACHAURI V (2010) Chelation in metal intoxication. International Journal of Environmental Research and Public Health. 7 2745–2788.
FOO KY and HAMEED BH (2010) Insights into the modeling of adsorption isotherm systems. Chemical Engineering Journal 156 (1) 2–10.FOX D, PICHLER T, YEH DH and ALCANTAR NA (2012) Removing heavy metals in water: The interaction of cactus mucilage and arsenate. Environmental Science and Technology 46 4553–4559.
FREUNDLICH HMF (1906) Over the adsorption in solution. Journal of Physical Chemistry 57 355–471.
GARTI N (1999) Hydrocolloids as emulsifying agents for oil-in-water emulsions. Journal of Dispersion Science and Technology 20 (1–2) 327–355.
GEISE GM, LEE, HS, MILLER J, FREEMAN BD, MCGRATH JE and PAUL DR (2010) Water purification by membranes: The role of polymer science. Journal of Polymer Science Part B: Polymer Physics 48 (15) 1685–1718.
GHEBREMICHAEL KA, GUNARATNA KR, HENRIKSSON H, BRUMER H and DALHAMMAR G (2005) A simple purification and activity assay of the coagulant protein from Moringa oleifera seed. Water Research 39 (11) 2338–2344.
GILMORE AM and COHEN SM (2013) Analysis of the chromophoric dissolved organic matter in water by EEMs with Horiba-Jobin Yvon fluorescence instrument called Aqualog. Readout 41 19–24.
GODT J, SCHEIDIG F, GROSSE-SIESTRUP C, ESCHE V, BRANDENBURG P, REICH A and GRONEBERG DA (2006) The toxicity of cadmium and resulting hazards for human health. Journal of Occupational Medicine and Toxicology 1 1–6.
GOOD RJ (1992) Contact angle, wetting, and adhesion: A critical review. Journal of Adhesion Science and Technology 6 1269–1302.
GOPALAKRISHNAN S, THILAGAM H and RAJA PV (2008) Comparison of heavy metal toxicity in life stages (spermiotoxicity, egg toxicity, embryotoxicity and larval toxicity) of Hydroides elegans. Chemosphere 71 (3) 515–528.
GRIFFITHS H (2012) Layered double hydroxides: Structure, synthesis and catalytic applications. Doctoral thesis, University of Huddersfield.
GUAN X, SUN Y, QIN H, LI J, LO IMC, HE D and DONG H (2015) The limitations of applying zero-valent iron technology in contaminants sequestration and the corresponding countermeasures: The development in zero-valent iron technology in the last two decades (1994–2014). Water Research 75 224–248.
GUPTA VK, CARROTT PJM, RIBEIRO CARROTT MML and SUHAS (2009) Low-cost adsorbents: Growing approach to wastewater treatment – A review. Critical Reviews in Environmental Science and Technology 39 (10) 783–842.
GUPTA VK, AGARWAL S, PATHANIA D, KOTHIYAL NC and SHARMA G (2013) Use of pectin-thorium (IV) tungstomolybdate nanocomposite for photocatalytic degradation of methylene blue. Carbohydrate Polymers 96 (1) 277–283.
HAIDER S, AL-ZEGHAYER Y, ALI FA, HAIDER A, MAHMOOD A, AL-MASRY WA, IMRAN M and AIJAZ MO (2013) Highly aligned narrow diameter chitosan electrospun nanofibers. Journal of Polymer Research 20 105.
Nanocomposite sorbents and electrospun nanofibres
196
HAIDER S, PARK S-Y (2009) Preparation of the electrospun chitosan nanofibers and their applications to the adsorption of Cu(II) and Pb(II) ions from an aqueous solution. Journal of Membrane Science 328 90–96.
HAIDER S, AL-ZEGHAYER Y, ALI FA, HAIDER A, MAHMOOD A, AL-MASRY WA, IMRAN M and AIJAZ MO (2013) Highly aligned narrow diameter chitosan electrospun nanofibers. Journal of Polymer Research 20 105.
HAN Q, WANG Z, MA R, QIU X-X, XU P, ZHOU Z-Q, LIU D-H (2014) Enantioselective toxicity, bioaccumulation and degradation of the chiral insecticide fipronil in earthworms (Eisenia feotida). Science of the Total Environment 485–486 415–420.
HAN H and BAI R (2010) Highly effective buoyant photocatalyst prepared with a novel layered-TiO2 configuration on polypropylene fabric and the degradation performance for methyl orange dye under UV–Vis and Vis lights. Separation Purification Technology 73 142–150.
HAN Y, ZHOU J, WANG W, WAN H, XU Z, ZHENG S and ZHU D (2012) Enhanced selective hydrodechlorination of 1, 2-dichloroethane to ethylene on Pt-Ag/TiO2 catalysts prepared by sequential photodeposition. Applied Catalysis B: Environmental 125 172–179.
HE W, ZHANG Y and FATEHI P (2016) Sulfomethylated kraft lignin as a flocculant for cationic dye. Colloids and Surfaces A: Physicochemical and Engineering Aspects 503 19–27.
HEBBALALU D, LALLEY J, NADAGOUDA MN and VARMA RS (2013) Greener techniques for the synthesis of silver nanoparticles using plant extracts, enzymes, bacteria, biodegradable polymers, and microwaves. ACS Sustainable Chemistry and Engineering 1 (7) 703–712.
HILDEBRAND H, MACKENZIE K and KOPINKE F (2009) Pd/Fe3O4 nano-catalysts for selective dehalogenation in wastewater treatment processes – Influence of water constituents. Applied Catalysis B: Environmental 91 389–396.
HO YS, PORTER JF and MCKAY G (2002) Equilibrium isotherm studies for the sorption of divalent metal ions onto peat: Copper, nickel and lead single component systems. Water, Air and Soil Pollution 141 1-33.
HOFBAUER D and ANDREWS S (2004) Innovations in NOM research, characterisation techniques-Influence of UV irradiation and UV/hydrogen peroxide oxidation process on natural organic matter fluorescence characteristics. Water Science and Technology-Water Supply 4 (4) 41–46.
HOJJATI B, SUI P, and CHARPENTIER PA (2007) Synthesis of TiO2/PAA nanocomposite by RAFT polymerization. Polymer 5850–5858
HOLVOET K, DE KEUCKELAERE A, SAMPERS I, VAN HAUTE S, STALS A and UYTTENDAELE M (2014) Quantitative study of cross-contamination with Escherichia coli, E. coli O157, MS2 phage and murine norovirus in a simulated fresh-cut lettuce wash process. Food Control 37 218–227.
HOMAYONI H, RAVANDI SAH and VALIZADEH M (2009) Electrospinning of chitosan nanofibers: processing optimization. Carbohydrate Polymers 77 659–661.
HONG S and ELIMELECH M (1997) Chemical and physical aspects of natural organic matter (NOM) fouling of nanofiltration membranes. Journal of Membrane Science 132 (2) 159–181.
Nanocomposite sorbents and electrospun nanofibres
197
HORVATH AL (2006) Solubility of structurally complicated materials: I. Wood. Journal of Physical and Chemical Reference Data 35 (1) 77–92.
HU G, HUANG S, CHEN H and WANG F (2010) Binding of four heavy metals to hemicelluloses from rice bran. Food Research International 43 (1) 203–206.
HUANG FL, WANG QQ, WEI QF, GAO WD, SHOU HY and JIANG SD (2010) Dynamic wettability and contact angles of poly(vinylidene fluoride) nanofiber membranes grafted with acrylic acid. eXPRESS Polymer Letters 4 (9) 551–558.
HUANG SS, LIAO QL, HUA M, WU XM, Bi KS, YAN CY, CHEN B and ZHANG XY (2007) Survey of heavy metal pollution and assessment of agricultural soil in Yangzhong district, Jiangsu Province, China. Chemosphere 67 2148–2155.
HUANG Y, LIU S, LIN Z, LI W, LI X and CAO R (2012) Facile synthesis of palladium nanoparticles encapsulated in amine functionalized mesoporous metal – organic frameworks and catalytic for dehalogenation of aryl chlorides. Journal of Catalysis 292 111–117.
HUBER SA, BALZ A, ABERT M and PRONK W (2011) Characterisation of aquatic humic and non-humic matter with size-exclusion chromatography – organic carbon detection–organic nitrogen detection (LC-OCD-OND). Water Research 45 (2) 879–885.
HALLÉ C, HUCK PM, PELDSZUS S, HABERKAMP J and JEKEL M (2009) Assessing the performance of biological filtration as pretreatment to low pressure membranes for drinking water. Environmental Science and Technology 43 (10) 3878–3884.IGNATOVA M, STARBOVA K, MARKOVA N, MANOLOVA N and RASHKOV I (2006) Electrospun nanofiber mats with antibacterial properties from quaternised chitosan and polyvinylalcohol. Carbohydrate Research 341 2098–2107.
IM JS, KIM MI and LEE YS (2008) Preparation of PAN based electrospun nanofiber web containing TiO2 for photocatalytic degradation. Material Letters 62 3652–3655. https://www.google.co.za/search?q=vacumaster+images+for+solid+phase+extraction. (Accessed 25 August 2015).
JACANGELO JG, DE MARCO J, OWEN DM and RANDTKE SJ (1995) Selected processes for removing NOM: An overview: Natural organic matter. Journal of the American Water Works Association 87 (1) 64–77.
JAGUARIBE EF, MEDEIROS LL, BARRETO, M and ARAUJO LP (2005) The performance of activated carbons from sugarcane bagasse, babassu, and coconut shells in removing residual chlorine. Brazilian Journal of Chemical Engineering 22 (1) 41–47.
JARUP L (2003) Hazards of heavy metal contamination. British Medical Bulletin 68 167–182.
JAWOREK A, KRUPA A, LACKOWSKI M, SOBCZYK AT, CZECH T, RAMAKRISHNA S, SUNDARRAJAN S and PLISZKA D (2009). Nanocomposite fabric formation by electrospinning and electrospraying technologies. Journal of Electrostatics 67 435–438.
JIANG Z, TIJING LD, AMARJARGAL A, PARK CH, AN KJ, SHON HK and KIM CS (2015) Removal of oil from water using magnetic bicomponent composite nanofibers fabricated by electrospinning. Composites Part B 77 311–318.
Nanocomposite sorbents and electrospun nanofibres
198
JOHNS MM, MARSHALL WE and TOLES CA (1998) Agricultural by‐products as granular activated carbons for adsorbing dissolved metals and organics. Journal of Chemical Technology and Biotechnology 71 (2) 131–140.
JUANG R-S and SHAO H-J (2002) A simplified equilibrium model for sorption of heavy metal ions from aqueous solutions on chitosan. Water Research 36 (12) 2999–3008.
KAČURÁKOVÁ M and Wilson RH (2001) Developments in mid-infrared FT-IR spectroscopy of selected carbohydrates. Carbohydrate Polymers 44 (4) 291–303.
KADIRVELU K, KAVIPRIYA M, KARTHIKA C, RADHIKA M, VENNILAMANI N and PATTABHI S (2003) Utilization of various agricultural wastes for activated carbon preparation and application for the removal of dyes and metal ions from aqueous solutions. Bioresource Technology 87 (1) 129–132.
KÄLLÉN BAJ and ROBERT E (2000) Drinking water chlorination and delivery outcome – A registry-based study in Sweden. Reproductive Toxicology 14 (4) 303–309.
KANG, G. D., and CAO, Y. M. (2014). Application and modification of poly (vinylidene fluoride)(PVDF) membranes–a review. Journal of Membrane Science 463 145-165.
KANG R, OUYANG X, HAN J and ZHEH X (2001) A novel silica-polyglycol supported polymer anchored bimetallic palladium-based catalyst for dechlorination of aromatic chlorides in water. Journal of Molecular Catalysis B: Enzymatic: Chemical 175 (1–2).
KANGO S, KALIA S, CELLI A, NJUGUNA J, HABIBI Y and KUMAR R (2013) Surface modification of inorganic nanoparticles for development of organic – inorganic nanocomposites – A review. Progress Polymer Science 38 1232–1261.
KARTEL MT, KUPCHIK LA and VEISOV BK (1999) Evaluation of pectin binding of heavy metal ions in aqueous solutions. Chemosphere 38 (11) 2591–2596.
KARTHIKEYAN S, SIKKANTHAR S, SELVASEKARAPANDIAN S, ARUNKUMAR D, NITHYA H and KAWAMURA J (2016) Structural, electrical and electrochemical properties of polyacrylonitrile-ammonium hexaflurophosphate polymer electrolyte system. Journal of Polymer Research 23 (51). DOI: 10.1007/s10965-016-0952-2.
KEDZIORA A, STREK W, KEPINSKI L, BUGLA-PLOSNSKA G and DOROSZKIEWICZ W (2012) Synthesis and antibacterial activity of novel titanium dioxide doped with silver. Journal of Sol-Gel Science and Technology 62 79 –86.
KENNEDY MD, CHUN HK, QUINTANILLA VY and HEIJMAN BGJ (2005) Natural organic matter (NOM) fouling of ultrafiltration membranes: fractionation of NOM in surface water and characterisation by LC-OCD. Desalination 178 (1) 73–83.
KHAN NA, IBRAHIM S and SUBRAMANIAM P (2004) Elimination of heavy metals from wastewater using agricultural wastes as adsorbents. Malaysian Journal of Science 23 (1) 43–51.
KHANNA PK, SINGH N, CHARAN S, UBBARAO VVVS, GOKHALE R and MULIK UP (2005) Synthesis and characterization of Ag/PVA nanocomposite by chemical reduction method. Materials Chemistry and Physics 93 (1) 117–121.
KIM JS, KUK E, YU KN, KIM JH, PARK SJ, LEE HJ, KIM SH, PARK YK, PARK YH, HWANG CY, KIM YK, LEE YS, JEONG DH and CHO MH (2007) Antimicrobial effects of silver nanoparticles. Nanomedicine: Nanotechnology, Biology and Medicine 3 (1) 95–101.
Nanocomposite sorbents and electrospun nanofibres
199
KOKORI H, GIANNAKOPOULOU CH, HATZIDAKI E, ATHANASELIS S, TSATSAKIS A and SBYRAKIS S (1999) An unusual case of lead poisoning in an infant: Nursing-associated plumbism. Med. J Lab C 1999.
KRAJEWSKA B (2001) Diffusion of metal ions through gel chitosan membranes. Reactive and Functional Polymers 47 (1) 37–47.
KRATOCHVIL D, PIMENTEL P and VOLESKY B (1998) Removal of trivalent and hexavalent chromium by seaweed biosorbent. Environmental Science and Technology 32 18 2693–2698.
KRZESŁOWSKA M (2011) The cell wall in plant cell response to trace metals: Polysaccharide remodeling and its role in defense strategy. Acta Physiologiae Plantarum 33 (1) 35–51.
KUMAR KV (2006) Comparative analysis of linear and non-linear method of estimating the sorption isotherm parameters for malachite green onto activated carbon. Journal of Hazardous Materials 136 (2) 197–202.
LABSPACE. http://labspace.open.ac.uk/mod/oucontent/view.php?id=453726§ion=1.4.3. (Accessed 23 May 2014).
LAGERGREN S (1898) The theory of so-called adsorption of soluble substances. Handlingar.
LANGMUIR I (1918) The adsorption of gases on plane surfaces of glass, mica and platinum. Journal of American Chemical Society 40 1361–1403.
LANGMUIR I (1916) The constitution and fundamental properties of solids and liquids. Journal of American Chemical Society 38 (11) 2221–2295.
LANKES U, MÜLLER MB, WEBER M and FRIMMEL FH (2009) Reconsidering the quantitative analysis of organic carbon concentrations in size exclusion chromatography. Water Research 43 (4) 915–924.
LAVONEN EE, KOTHAWALA DN, TRANVIK LJ, GONSIOR M, SCHMITT-KOPPLIN P and KÖHLER SJ (2015) Tracking changes in the optical properties and molecular composition of dissolved organic matter during drinking water production. Water Research 85 286–294
LAWTHER JM, SUN R and BANKS WB (1996) Effects of extraction conditions and alkali type on yield and composition of wheat straw hemicellulose. Journal of Applied Polymer Science 60 (11) 1827–1837.
LAWTHER JM, Sun R and BANKS WB (1995) Extraction, fractionation, and characterization of structural polysaccharides from wheat straw. Journal of Agricultural and Food Chemistry 43 (3) 667–675.
LAZZERI M, VITTADINI A and SELLONI A (2002) Structure and energetics of stoichiometric TiO2 anatase surfaces: Erratum. Physical Reviews B 65 119901.
LEA M (2010) Bioremediation of turbid surface water using seed extract from Moringa oleifera Lam.(drumstick) tree. Current Protocols in Microbiology 1G. 2.1–1G. 2.14.
LEE MY, HONG K-J, SHIN-YA Y and KAJIUCHI T (2005) Adsorption of hexavalent chromium by chitosan‐based polymeric surfactants. Journal of Applied Polymer Science 96 (1) 44–50.
LEE N. AMY G, CROUE J-P and BUISSON H (2004) Identification and understanding of fouling in low-pressure membrane (MF/UF) filtration by natural organic matter (NOM). Water Research 38 4511–4523.
Nanocomposite sorbents and electrospun nanofibres
200
LEE SJ, MULAY P, DIEBOLT-BROWN B, LACKOVIC MJ, MEHLER LN, BECKMAN J, WALTZ J, PRADO JB, MITCHELL YA, HIGGINS SA, SCHWARTZ A and CALVERT GM (2010) Acute illnesses associated with exposure to fipronil – surveillance data from states in the United States, 2001–2007. Clinical Toxicology 48 737–744.
LEENHEER JA and CROUÉ JP (2003) Peer reviewed: Characterizing aquatic dissolved organic matter. Environmental Science and Technology 37 (1) 18A–26A.
LESMANA SO, FEBRIANA N, SOETAREDJO FE, SUNARSO J and ISMADJI S (2009) Studies on potential applications of biomass for the separation of heavy metals from water and wastewater. Biochemical Engineering Journal 44 19–41.
LESZCZYNSKA A and PIELICHOWSKI K (2008) Application of thermal analysis methods for characterization of polymer/montmorillonite nanocomposites. Journal of Thermal Analysis and Calorimetry 93 (3) 677–687.
LIU, H., RU, J., QU, J., DAI, R., WANG, Z., and HU, C. (2009). Removal of persistent organic pollutants from micro-polluted drinking water by triolein embedded absorbent. Bioresource technology 100(12) 2995-3002.
LI JH, SHAO X-S, ZHOU Q, LI M-Z and ZHANG QQ (2013) The double effects of silver nanoparticles on the PVDF membrane: Surface hydrophilicity and antifouling performance. Applied Surface Science 265 (15) 663–670.
LI D and XIA Y (2004) Electrospinning of nanofibers: Reinventing the wheel. Advanced Materials 16 (14) 1151–1170.
LI MZ, LI JH, SHAO XS, MIAO J, WANG JB, ZHANG QQ and XUA XP (2012) Grafting zwitterionic brush on the surface of PVDF membrane using physisorbed free radical grafting technique. Journal of Membrane Science 405–406 141–148.
LI W-T, CHEN S-Y, XU Z-X, LI Y, SHUANG C and LI W (2014) Characterization of dissolved organic matter in municipal wastewater using fluorescence PARAFAC analysis and chromatography multi-excitation/emission scan: A comparative study. Environmental Science and Technology.
LIM H-S, LEE J-S, CHON H-T and SAGER M (2008) Heavy metal contamination and health risk assessment in the vicinity of the abandoned Songcheon Au–Ag mine in Korea. Journal of Geochemical Exploration 96 223–230.
LODEIRO P, BARRIADA J, HERRERO R and SASTRE DE VICENTE M (2006) The marine macroalgae Cystoseira baccata as biosorbent for cadmium (II) and lead (II) removal: Kinetic and equilibrium studies. Environmental Pollution 142 264–273.
LOUKIDOU MX, KARAPANTSIOS TD, KARAPANTSIOS A and MATIS KA (2004) Diffusion kinetic study of cadmium (II) biosorption by Aeromonas caviae. Journal of Chemical Technology and Biotechnology 79 (7) 711–719.
MADHAVI V and MADHAVI G (2012) Remediation of chlorpyrifos contaminated soils by laboratory synthesized zero valent nano iron (ZVNI) particles: Effect of pH and aluminium salt. International Journal of Chemistry Research 3 (2) 1
MAIGA D, MSAGATI T, KILULYA K and MAMBA B (2014) Preparation of SPE hybrid mesoporous silica sorbents for the analysis and removal of organic pollutants in water. Physics and Chemistry of the Earth: Parts A/B/C 72–75.
Nanocomposite sorbents and electrospun nanofibres
201
MAIL & GUARDIAN. http://mg.co.za/article/2015-03-05-cases-of-cholera-found-on-zim-sa-border.
MAJSTEREK, I., SICINSKA, P., TARCZYNSKA, M., ZALEWSKI, M., & WALTER, Z. (2004). Toxicity of microcystin from cyanobacteria growing in a source of drinking water. Comparative Biochemistry and Physiology Part C: Toxicology & Pharmacology 139(1-3) 175-179.
MAMERI N, BOUDRIES N, ADDOUR L, BELHOCINE D, LOUNICI H, GRIB H and PAUSS A (1999) Batch zinc biosorption by a bacterial nonliving Streptomyces rimosus biomass. Water Research 33 (6) 1347–1354.
MANDALARI G, BENNETT RN, KIRBY AR, LO CURTO RB, BISIGNANO G, WALDRON KW and FAULDS CB (2006) Enzymatic hydrolysis of flavonoids and pectic oligosaccharides from bergamot (Citrus bergamia Risso) peel. Journal of Agricultural and Food Chemistry 54 (21) 8307–8313.
MARTIN T, GALARNEAU A, DI RENZO F, BRUNEL D, FAJULA F, HEINISCH S, CRETIER G and ROCCA J-L (2004) Great improvement of chromatographic performance using MCM-41 spheres as stationary phase in HPLC. Chemical Materials 16 1727–1731.
MATA YN, BLÁZQUEZ ML, BALLESTER A, GONZÁLEZ F and MUÑOZ JA (2010) Studies on sorption, desorption, regeneration and reuse of sugar-beet pectin gels for heavy metal removal. Journal of Hazardous Materials 178 (1) 243–248.
MATHUR N, BHATNAGAR P and BAKRE P (2006) Assessing mutagenicity of textile dyes from Pali(Rajasthan) using Ames bioassay. Applied Ecology and Environmental Research 4 (1) 111–118.
MATILAINEN A, LINDQVIST N, KORHONEN S and TUHKANEN T (2002) Removal of NOM in the different stages of the water treatment process. Environment International 28 (6) 457–465.
MATILAINEN A, VIENO N and TUHKANEN T (2006) Efficiency of the activated carbon filtration in the natural organic matter removal. Environment International 32 324–331.
MATSUI Y, KNAPPE DR and TAKAGI R (2002) Pesticide adsorption by granular activated carbon adsorbers. 1. Effect of natural organic matter preloading on removal rates and model simplification. Environmental Science and Technology 36 (15) 3426–3431.
MAY CD (1990) Industrial pectins: Sources, production and applications. Carbohydrate Polymers 12 (1) 79–99.
MCNICOL C, KEMMITT C and GOLOVKO V (2014) Hydrothermal, rutile to antase reverse phase transformation. International Journal of Nanotechnology 11 493–501.
MDLULI PS and REVAPRASADU N (2009). Time dependant evolution of silver nanodendrites. Materials Letters 63 (3) 447–450
MEENA AK, MISHRA GK, RAI PK, RAJAGOPAL C and NAGAR PN (2005) Removal of heavy metal ions from aqueous solutions using carbon aerogel as an adsorbent. Journal of Hazardous Materials B 122 161–170
MENEGHEL AP, GONÇALVES JR AC, STREY L, RUBIO F, SCHWANTES D and CASARIN J (2013) Biosorption and removal of chromium from water by using moringa seed cake (Moringa oleifera Lam.). Química Nova 36 (8) 1104–1110.
Nanocomposite sorbents and electrospun nanofibres
202
MENG W, LI F, EVANS DG and DUAN X (2004) Preparation of magnetic material containing MgFe2O4 spinel ferrite from a Mg–Fe(III) layered double hydroxide intercalated by hexacyanoferrate(III) ions. Materials Chemistry and Physics 86 1–4.
MESHESHA T (2009) Catalytic hydrodechlorination of 1, 2, 4-trichlorobenzene over Pd/Mg (Al)O catalysts. Applied Catalysis B: Environmental 87 (1) 70–77.
MESHESHA BT (2011) Hydrodechlorination of chlorinated organic wastes over Pd supported mixed oxide catalysts of aryl chlorides. Journal of Catalysis 292 111–117.
MESHESHA BT (2011) Performance of alkali modified Pd/Mg (Al) O catalysts for hydrodechlorination of 1, 2, 4-trichlorobenzene. Applied Catalysis B: Environmental 105 (3) 361–372.
MESHESHA, B. T., BARRABÉS, N., LLORCA, J., DAFINOV, A., MEDINA, F., and FÖTTINGER, K. (2013). PdCu alloy nanoparticles on alumina as selective catalysts for trichloroethylene hydrodechlorination to ethylene. Applied Catalysis A: General, 453, 130-141.
MESHESHA B, CHIMENTÃO R, MEDINA F, SUEIRAS J, JESTEROS Y, SALAGRE P and FIGUERAS F (2009) Catalytic hydrodechlorination of 1, 2, 4-trichlorobenzene over Pd/Mg (Al) O catalysts. Applied Catalysis B: Environmental 87 70–77.
MIN, B. M., LEE, S. W., LIM, J. N., YOU, Y., LEE, T. S., KANG, P. H., & PARK, W. H. (2004). Chitin and chitosan nanofibers: electrospinning of chitin and deacetylation of chitin nanofibers. Polymer 45(21) 7137-7142.
MIN K-S, UEDA H and TANAKA K (2008) Involvement of intestinal calcium transporter 1 and metallothionein in cadmium accumulation in the liver and kidney of mice fed a low-calcium diet. Toxicology Letters 176 85–92.
MISHRA AK, CHATTOPADHYAY S, RAJAMOHANAN PR and NANDO GB (2011) Effect of tethering on the structure-property relationship of TPU-dual modified Laponite clay nanocomposites prepared by ex-situ and in-situ techniques. Polymer 52 (4) 1071–1083.
MISHRA PR, SHAAL LA, MÜLLER RH and KECK CM (2009) Production and characterization Hesperetin nanosuspensions for dermal delivery. International Journal of Pharmaceutics 371 182–189.
MITTAL KL (2006) Contact angle, wettability and adhesion, Volume 4, CRC Press.
MOHAN D and Singh KP (2002) Single- and multi-component adsorption of cadmium and zinc using activated carbon derived from bagasse - an agricultural waste. Water Research 36 2304–2318.
MOHAN D, PITTMAN JR CU and STEELE PH (2006) Single, binary and multi-component adsorption of copper and cadmium from aqueous solutions on Kraft lignin – A biosorbent. Journal of Colloid and Interface Science 297 489–504.
MOHNEN D (2008) Pectin structure and biosynthesis. Current Opinion in Plant Biology 11 (3) 266–277.
MUELLER NC and NOWACK B (2008) Exposure modeling of engineered nanoparticles in the environment. Environmental Science and Technology 42 (12) 4447–4453.
MUFTIKIAN R, NEBESNY K, FERNANDO Q and KORTE N (1996) X-ray potoelectron spectra of the palladium-iron bimetallic surface used for the rapid dechlorination of chlorinated organic environmental contaminants. Environmental Science and Technology 30 3593 –3596.
Nanocomposite sorbents and electrospun nanofibres
203
MURUGESAN GS, SATHISHKUMAR M and SWAMINATHAN K (2006) Arsenic removal from groundwater by pretreated waste tea fungal biomass. Bioresource Technology 97 (3) 483–487.
MUSYOKA SM, NGILA JC, MOODLEY B, PETRIK L and KINDNESS A (2011) Synthesis, characterization, and adsorption kinetic studies of ethylenediamine modified cellulose for removal of Cd and Pb. Analytical Letters 44 (11) 1925–1936.
MUSYOKA, N. M., PETRIK, L. F., FATOBA, O. O. and HUMS, E. (2013). Synthesis of zeolites from coal fly ash using mine waters. Minerals Engineering 53 9-15.
MWANGI IW, NGILA JC, NDUNGU P, KAMAU JN and MSAGATI TAM (2013) Immobilized Fe (III)-doped titanium dioxide for photodegradation of dissolved organic compounds in water. Environmental Science Pollution Research 20 6028–6038.
NAVARRO NH, GONZÁLEZ VG, MORENO-CORTEZ IE and GARZA-NAVARRO MA (2016) Electrospun polyvinylidene fluoride nanofibers by bubble electrospinning technique. Materials Letters 167 34–37.
NG JCY, CHEUNG WH and MCKAY G (2003) Equilibrium studies for the sorption of lead from effluents using chitosan. Chemosphere 52 1021–1030.
NGAH WSW, ENDUD CS and Mayanar R (2002) Removal of copper (II) ions from aqueous solution onto chitosan and cross-linked chitosan beads. Reactive and Functional Polymers 50 181–190.
NGUYEN HL, LEERMAKERS M, OSAN J, TOROK S and BAEYENS W (2005) Heavy metals in Lake Balaton: Water column, suspended matter, sediment and biota. Science of the Total Environment 340 213–230.
NGUYEN HQ and DENG B (2012) Electrospinning and in situ nitrogen doping of TiO2/PAN nanofibers with photocatalytic activation in visible light. Material Letters 82 102–104
NIKOLAIDIS AK, ACHILIAS DS and KARAYANNIDIS GP (2010) Synthesis and characterization of PMMA/organomodified montmorillonite nanocomposites prepared by in situ bulk polymerization. Industrial and Engineering Chemistry Research 50 (2) 571–579.
NOMNGONGO PN, NGILA JC, MSAGATI TAM and MOODLEY B (2013) Preconcentration of trace multielements in water samples using Dowex 50W-x8 and Chelex-100 resins prior to their determination using inductively coupled plasma atomic emission spectrometry (ICP-OES). Physics and Chemistry of the Earth, Parts A/B/C 66 83–88.
NORTON L, BASKARAN K and MCKENZIE T (2004) Biosorption of zinc from aqueous solutions using biosolids. Advances in Environmental Research 8 (3) 629–635.
NTHUMBI RM, NGILA JC, MOODLEY B and PETRIK L (2011) Method development for flow adsorption and removal of lead and copper in contaminated water using electrospun nanofibers of chitosan blend. Analytical Letters 44 (11) 1937–1955.
NTHUMBI RM, NGILA JC, MOODLEY B, KINDNESS A and PETRIK L (2012) Application chitosan /polyacrylamide nanofibres for removal of chromate and phosphate in water. Physics and Chemistry of the Earth 50–52 243–251.
O’CONNELL DW, BIRKINSHAW C and O’DWYER TF (2008) Heavy metal adsorbents prepared from the modification of cellulose: A review. Bioresource Technology 99 6709–6724
Nanocomposite sorbents and electrospun nanofibres
204
OBAID M, BARAKAT NAM, FADALI OA, MOTLAK M, ALMAJID AA and KHALIL KA (2015) Effective and reusable oil/water separation membranes based on modified polysulfone electrospun nanofiber mats. Chemical Engineering Journal 259 449–4562.
OCHOA-VILLARREAL M, AISPURO-HERNÁNDEZ E, VARGAS-ARISPURO I and MARTÍNEZ-TÉLLEZ MÁ (2012) Plant cell wall polymers: function, structure and biological activity of their derivatives. Polymerization 4 63–86.
ORELLANA F, PECCHI G and REYES P (2005) Selective hydrodechlorination of 1,2-Dichloroethane over Pd-Sn/SiO2 Catalysts. Journal of the Chilean Chemical Societ 50 (1) 431–434.
OSHIMA T, KONDO K OHTO K, INOUE K and BABA Y (2008) Preparation of phosphorylated bacterial cellulose as an adsorbent for metal ions. Reactive and Functional Polymers 68 376–383.
OSTWALD, W. (1896). Lehrbuch der allgem. Chem., W. Engelmann, LeipzigΠ (1896-1902).
PACKTER, N. M. (1994). The organic chem lab survival manual—A student's guide to techniques: By JW Zubrick, John Wiley & Sons, New York, 1992. pp 366. Biochemical Education 22(3) 169-169.
PALLAVICINI P, TAGLIETTI A and DACARRO G (2010) Self-assembled monolayers of silver nanoparticles firmly grafted on glass surfaces: Low Ag+ release for an efficient antibacterial activity. Journal of Colloid and Interface Science 350 (1) 110–116.
PAPPALARDO L, JUMEAN F and ABDO N (2010) Removal of cadmium, copper, lead and nicke from aqueous solution by white, yellow and red United Arab Emirates sand. American Journal of Environmental Science 6 41–44.
PARK SH, WEI S, MIZAIKOFF B, TAYLOR AE, FAVERO CD and HUANG CH (2009) Degradation of amine-based water treatment polymers during chloramination as N-nitrosodimethylamine (NDMA) precursors. Environmental Science and Technology 43 1360–1366.
PARK H, PARK Y, KIM W and CHOI W (2013) Surface modification of TiO2 photocatalyst for environmental applications. Journal of Photochemistry and photobiology C: Photochemistry Reviews 15 1–20.
PAULY M and KEEGSTRA K (2008) Cell‐wall carbohydrates and their modification as a resource for biofuels. The Plant Journal 54 (4) 559–568.
PEIRIS BRH, HALLÉ C, HABERKAMP J, LEGGE RL, PELDSZUS S, MORESOLI C, BUDMAN H, AMY G, JEKEL M and HUCK PM (2008) Assessing nanofiltration fouling in drinking water treatment using fluorescence fingerprinting and LC-OCD analyses. Water Science and Technology: Water Supply 8 (4) 459–465.
PEIRIS BRH, HALLÉ C, BUDMAN H, MORESOLI C, PELDSZUS S, HUCK PM and LEGGE RL (2010) Identifying fouling events in a membrane-based drinking water treatment process using principal component analysis of fluorescence excitation-emission matrices. Water Research 44 (1) 185–194.
PELLERIN P and O'NEILL MA (1998) The interaction of the pectic polysaccharide Rhamnogalacturonan II with heavy metals and lanthanides in wines and fruit juices. Analysis 26 (6) 32–36.
Nanocomposite sorbents and electrospun nanofibres
205
PELLOUX J, RUSTERUCCI C and MELLEROWICZ EJ (2007) New insights into pectin methylesterase structure and function. Trends in Plant Science 12 (6) 267–277.
PENG P and SHE D (2014) Isolation, structural characterization, and potential applications of hemicelluloses from bamboo: A review. Carbohydrate Polymers 112 701–720.
PERRONE PA, REUTER WM, NEUBAUER KR BOSNAK CP, HALL GA and GROSSER ZA (2005) Bromine speciation by HPLC/ICP-MS (application note), PerkinElmer, Inc.Pradeep T. Anshup 2009. Noble metal nanoparticles for water purification: A critical review. Thin Solid Films 517 6441–6478.
PICHLER T, YOUNG KA and ALCANTAR NA (2012) Eliminating turbidity in drinking water using the mucilage of a common cactus. Water Science and Technology: Water Supply 12 (2) 179–186.
PIRLOT C, MEKHALIF Z, FONSECA A, NAGY JB, DEMORTIER G and DELHALLE J (2003) Surface modifications of carbon nanotube/polyacrylonitrile composite films by proton beams. Chemical Physics Letters 372 595–602.
PRADEEP T and ANSHUP A (2009) Noble metal nanoparticles for water purification: A critical review. Thin Solid Films 51 6441–6478.
PRANEETH K, JAMES T and SRIDHAR S. (2014) Design of novel ultrafiltration systems based on robust polyphenylsulfone hollow fiber membranes for treatment of contaminated surface water. Chemical Engineering Journal 248 297–306.
PRIETO A, ZULOAGA O, USOBIAGA A, ETXEBARRIA N and FERNÁNDEZ LA (2007) Development of a stir bar sorptive extraction and thermal desorption – gas chromatography – mass spectrometry method for the simultaneous determination of several persistent organic pollutants in water samples. Journal of Chromatography A 1174 40–49.
RAI M, YADAV A and GADE A (2009) Silver nanoparticles as a new generation of antimicrobials. Biotechnology Advances 27 (1) 76–83.
RAIKWAR MK, KUMAR P, SINGH M and SING A (2008) Toxic effect of heavy metals in livestock health. Veterinary World 1 28–30.
RAO, M. M., RAO, G. C., SESHAIAH, K., CHOUDARY, N. V., and WANG, M. C. (2008). Activated carbon from Ceiba pentandra hulls, an agricultural waste, as an adsorbent in the removal of lead and zinc from aqueous solutions. Waste Management 28(5) 849-858.
RASHID, M. U., BHUIYAN, M. K. H., and QUAYUM, M. E. (2013). Synthesis of silver nano particles (Ag-NPs) and their uses for quantitative analysis of vitamin C tablets. Dhaka University Journal of Pharmaceutical Sciences 12(1) 29-33.
RATKE, L., and VOORHEES, P. W. (2002). Growth and Coarsening: Ostwald Ripening in Engineering Materials.
REDLICH OJ and PETERSON DL (1959) A useful adsorption isotherm. Journal of Physical Chemistry 63 (6) 1024–1024.
RENAULT F, SANCEY B, BADOT PM and CRINI G (2009) Chitosan for coagulation/flocculation processes – An eco-friendly approach. European Polymer Journal 45 (5) 1337–1348.
REPUBLIC OF SOUTH AFRICA (1996) Bill of Rights, Article 19.
Nanocomposite sorbents and electrospun nanofibres
206
REZAEI, F., BIDARI, A., BIRJANDI, A. P., HOSSEINI, M. R. M., and ASSADI, Y. (2008). Development of a dispersive liquid–liquid microextraction method for the determination of polychlorinated biphenyls in water. Journal of Hazardous Materials 158(2-3) 621-627.
RITCHIE JM, VIAL SL, and FUORTES LJ (2003) Organochlorines and risk of prostate cancer. Journal of Occupational and Environmental Medicine 45 692–702.
RODDE RH, EINBU A and VARUM KM (2008) A seasonal study of the chemical composition and chitin quality of shrimp shells obtained from northern shrimp (Pandalus borealis). Carbohydrate Polymers 71 388–393.
ROONEY JK (2007) The role of thiols, dithiols, nutritional factors and interacting ligands in the toxicology of mercury. Toxicology 234 (3) 145–156.
ROTZINGER FP, KESSELMAN-TRUTTMANN JM, HUG SJ, SHKLOVER V and GRATZEL M (2004) Structure and vibrational spectrum of formate and acetate adsorbed from aqueous solutions onto TiO2 rutile (110) surface. Journal of Physical Chemistry B 108 (16) 5004–5017.
SAKELLARIOU D, LE GOFF G and JACQUINOT J-F (2007) High-resolution, high-sensitivity NMR of nanolitre anisotropic samples by coil spinning. Nature 447 (7145) 694–697.
SAKKAYAWONG N, THIRAVETYAN P and NAKBANPOTE W (2005) Adsorption mechanism of synthetic reactive dye wastewater by chitosan. Journal of Colloid and Interface Science 286 (1) 36–42.
SALEHIZADEH H and SHOJAOSADATI SA (2003) Removal of metal ions from aqueous solution by polysaccharide produced from Bacillus firmus. Water Research 37 (17) 4231–4235.
SAMART C, PRAWINGWONG P, AMNUAYPANICH S, ZHANG H, KAJIYOSHI K, REBROYCHAROEN P (2014) Preparation of poly acrylic acid grafted mesoporous silica as pH responsive releasing material. Journal of Industrial Engineering Chemistry 20 2153–2158.
SÁNCHEZ-AVILA J, QUINTANA J, VENTURA F, TAULER R, DUARTE CM and LACORTE S (2010) Stir bar sorptive extraction-thermal desorption-gas chromatography – mass spectrometry: An effective tool for determining persistent organic pollutants and nonylphenol in coastal waters in compliance with existing Directives. Marine Pollution Bulletin 60 103–112.
SANCHEZ-RAMOS J (1998) Toxicity of Dieldrin for Dopaminergic Neurons in Mesencephalic Cultures. Experimental Neurology 150 (2) 263–271.
SANGHI R, BHATTACHARYA B and SINGH V (2006) Use of Cassia javahikai seed gum and gum-g-polyacrylamide as coagulant aid for the decolorization of textile dye solutions. Bioresource Technology 97 (10) 1259–1264.
SANJINES R, TANG H, BERGER F, GOZZO F, MARGARITONTO G and LEVY F (1994) Electronic structure of anatase TiO2 oxide. Journal of Applied Physics 75 (6) 2945.
SARKAR P, BOSNEAGA E and AUER M (2009) Plant cell walls throughout evolution: Towards a molecular understanding of their design principles. Journal of Experimental Botany 60 (13) 3615–3635.
SAVAGE, N., & DIALLO, M. S. (2005). Nanomaterials and water purification: opportunities and challenges. Journal of Nanoparticle research, 7(4-5) 331-342.
Nanocomposite sorbents and electrospun nanofibres
207
SCHIEBER A, HILT P, STREKER P, ENDRESS H-U, RENTSCHLER C and CARLE R (2003) A new process for the combined recovery of pectin and phenolic compounds from apple pomace. Innovative Food Science and Emerging Technologies 4 (1) 99–107.
SCHOLS HA and VORAGEN AJ (1994) Occurrence of pectic hairy regions in various plant cell wall materials and their degradability by rhamnogalacturonase. Carbohydrate Research 256 (1) 83–95.
SCHUTH C and REINHARD M (1998) Hydrodechlorination and hydrogenation of aromatic compounds over palladium on alumina in hydrogen-saturated water. Applied Catalysis B 18 215–221.
SCHUTTE CF and FOCKE CW (2007) WRC evaluation of nanotechnology for application in water and wastewater treatment and related aspects in South Africa No. KV/07.
SELATNIA A, BAKHTI MZ, MADANI A, KERTOUS L and MANSOURI Y (2004) Biosorption of Cd2+ from aqueous solution by a NaOH-treated bacterial dead Streptomyces rimosus biomass. Hydrometallurgy 75 (1) 11–24.
SERIO D, TESSER M, DIMICCOLI R and CAMMAROTA M (2006) Heterogeneous catalysts for biodiesel production. Industrial Engineering and Chemistry Research 45 3009–3014.
SHAN AY, GHAZI TIM and RASHID SA (2010) Immobilization of titanium dioxide. Applied Catalysis Gen. A 389 (1–2) 1–8
SHARP EL, JARVIS P, PARSONS SA and JEFFERSON B (2006). Impact of fractional character on the coagulation of NOM. Colloids and Surfaces A: Physicochemical and Engineering Aspects 286 104–111. 10.1016/j.colsurfa.2006.03.009.
SHEN L, BIAN X, LU X, SHI L, LIU Z, CHEN L, HOU Z and FAN K (2012) Preparation and characterization of ZNO/polyethersulfone (PES) hybrid membranes. Desalination 293 21–29.
SHENG Z and LIU Y (2011) Effects of silver nanoparticles on wastewater biofilms. Water Research 45 (18) 6039–6050
SHOJAIE-BAHAABAD M and TAHERI-NASSAJ E (2008) Economical synthesis of nanoalumina powder using an aqueous sol–gel method. Materials Letters 62 3364–3366.
SING KSW, EVERETT DH, HAUL RAW and MOSCOU L (1985) Reporting physisorption data for gas/solid systems – with special reference to the determination of surface area and porosity. Journal of Pure Applied Chemistry 57 603–619.
SINGER PC (1994) Control of disinfection by-products in drinking water. Journal of Environmental Engineering 120 (4) 727–744.
SINGER PC (1999) Humic substances as precursors for potentially harmful disinfection by-products. Water Science and Technology 40 (9) 25–30.
SING, K. S. (1985). Reporting physisorption data for gas/solid systems with special reference to the determination of surface area and porosity (Recommendations 1984). Pure and applied chemistry, 57(4), 603-619.
SINGH KK, SINGH AK and HASAN SH (2006) Low cost bio-sorbent ‘wheat bran’ for the removal of cadmium from wastewater Kinetic and equilibrium studies. Bioresource Technology 97 994–1001.
SINGH S, MAHALINGAM H and SINGH PK (2013) Polymer-supported titanium dioxide photocatalysts for environmental remediation: A review. Applied Catalysis A: General 462– 463 178–195.
Nanocomposite sorbents and electrospun nanofibres
208
SIPS R (1948) Combined form of Langmuir and Freundlich equations. Journal of Chemical Physics 16 (5) 490–495.
SIVAKUMAR B and SINGH VP (2012) Hydrologic system complexity and nonlinear dynamic concepts for a catchment classification framework. Hydrology and Earth System Sciences 16 4119–4131.
SMITH A (2006) Global dialogue on nanotechnology and the poor: Opportunities and risks. Chemistry International 31 (4).
SOMMER E, FETTER G and BOSCH P (2009) Fibrillar templating of hydrotalcites. The Open Process Chemistry Journal 2 6–11
SONDI I and SONDI B (2004) Silver nanoparticles as antimicrobial agent: A case study on E. coli as a model for Gram-negative bacteria. Journal of Colloid and Interface Science 275 177–182.
SONG ST, HAU YF, SAMAN N, JOHARI K, CHEU SC, KONG H and MAT HB (2016) Process analysis of mercury adsorption onto chemically modified rice straw in a fixed-bed adsorber. Journal of Environmental Chemical Engineering 4 (2) 1685–1697.
SPOSITO G (2004) The surface chemistry of natural particles. Oxford, Oxford University Press.
SRINIVASAN, G., & RENEKER, D. H. (1995). Structure and morphology of small diameter electrospun aramid fibers. Polymer international 36(2) 195-201.
STAESSEN JA, ROELS HA, EMELIANOV D, KUZNETSOVA T, THIJS L, VANGRONSVELD J and FAGARD R (1999) Environmental exposure to cadmium, forearm bone density, and risk of fractures: Prospective population study. Lancet 353 1140–1144.
STECHEMESSER H and DOBIAS B (2005) Coagulation and flocculation, 2nd ed., Boca Ratan, FL, CRC Press.
STEFAN MI and WILLIAMSON CT (2004) UV light-based applications. In: Advanced oxidation processes for water and wastewater treatment, London, IWA Publishing.
STEVE EH (2009) Chlorination disinfection by-products, public health risk tradeoffs and me. Water Research 43 2057–2092.
SU C and PULS RW (1999) Kinetics of trichloroethene reduction by zerovalent iron and tin: Pretreatment effect, apparent activation energy, and intermediate products. Environmental Science and Technology 33 163–168.
SUD D, MAHAJAN G and KAUR MP (2008) Agricultural waste material as potential adsorbent for sequestering heavy metal ions from aqueous solutions – A review. Bioresource Technology 99 6017–6027.
SUN, R., LAWTHER, J. M., and BANKS, W. B. (1998). Isolation and characterization of hemicellulose B and cellulose from pressure refined wheat straw. Industrial Crops and products 7(2-3) 121-128.
SUN JX, SUN XF, SUN RC and SU YQ (2004) Fractional extraction and structural characterization of sugarcane bagasse hemicelluloses. Carbohydrate Polymers 56 (2) 195–204.
SUN RC, TOMKINSON J, MA PL and LIANG SF (2000) Comparative study of hemicelluloses from rice straw by alkali and hydrogen peroxide treatments. Carbohydrate Polymers 42 (2) 111–122.
Nanocomposite sorbents and electrospun nanofibres
209
SWARUP D, NARESH R, VARSHNEY VP BALAGANGATHARATHILAGAR M, KUMAR P, NANDI D and PATRA RC (2007) Changes in plasma hormones profile and liver function in cows naturally exposed to lead and cadmium around different industrial areas. Research in Veterinary Science 82 16–21.
TANADA S, KABAYAMA M, KAWASAKI N, SAKIYAMA T, NAKAMURA T, ARAKI M and TAMURA T (2003) Removal of phosphate by aluminum oxide hydroxide. Journal of Colloid and Interface Science 257 135–140.
TANDON S, CHATTERJEE M, BHARGAVA A, SHUKLA V and BIHARI V (2001) Lead poisoning in Indian silver refiners. The Science of the Total Environment 281 177–182.
THATAI S, KHURANA P, BOKEN J, PRASAD S and KUMAR D (2014) Nanoparticles and core-shell nanocomposite based new generation water remediation materials and analytical techniques: A review. Microchemical Journal 116 62–76
TIAN B, WANG XY, ZHANG LN, SHI FN, ZHANG Y and LI SX (2016) Preparation of PVDF anionic exchange membrane by chemical grafting of GMA onto PVDF macromolecule. Solid State Ionics. 293 56–63.
TOMKINS BA, GRIEST WH and HIGGINS CE (1995) Determination of N-nitrosodimethylamine at part-per-trillion levels in drinking waters and contaminated groundwaters. Analytical chemistry 67 (23) 4387–4395.
TOTH J (1971) State equations of the solid-gas interface layers. Acta Chim Acad Sci Hungar 69 (3) 311–328.
TRAINA SJ, NOVAK J and SMECK NE (1990) An ultraviolet absorbance method of estimating the percent aromatic carbon content of humic acids. Journal of Environmental Quality 19 (1) 151–153.
TRIPATHI PN, CHAUDHURI N and BOKIL SD (1976) Nirmali seed a naturally occurring coagulant. Indian Journal of Environmental Health 18 (4).
TUNALI S, CABUK A and AKAR T (2006) Removal of lead and copper ions from aqueous solutions by bacterial strain isolated from soil. Chemical Engineering Journal 115 (3) 203–211.
UPADHYAYULA VKK, DENG S, MITCHELL MC and SMITH GB (2009) Application of carbon nanotube technology for removal of contaminants in drinking water: A review. Science of The Total Environment 408 1–13.
UNITED STATES ENVIRONMENTAL PROTECTION AGENCY (USEPA) (2002) Persistent Organic Pollutants: A Global Issue, A Global Response. http://www.epa.gov/international/toxics/pop.htm. (Accessed 7 May 2009).
UNITED STATES ENVIRONMENTAL PROTECTION AGENCY (USEPA) (2010) Fact Sheets on New Active Ingredients. http://www.epa.gov/opprd001/factsheets. (Accessed 1 August 2010).
UNITED STATES ENVIRONMENTAL PROTECTION AGENCY (USEPA) (1999) Office of Pesticide Programs, Health Effects Division, Tox Oneliners, EPA chem code 035505 – diuron, 12 March 2003 update.
VALENTE JS, SANCHEZ-CANTU M, LIMA E and FIGUERAS F (2009) Method for large scale production of multimetallic layered double hydroxides formation mechanism discernment. Chemistry of Materials 21 5809–5818.
Nanocomposite sorbents and electrospun nanofibres
210
VAN DER BRUGGEN B, VANDECASTEELE C, VAN GESTEL T, DOYEN W and LEYSEN R (2003) A review of pressure driven membrane processes in waste water treatment and drinking water production. Environmental Progress 22 (1) 45–56.
VATSHA B, NGILA JC, MSAGATI TM and MOUTLOALI R (2012) Synthesis and characterization of ultrafiltration PES membrane embedded with Ag decorated MgO nanocomposite. Procedia Engineering 44 2102–2103.
VIJAYA A, MADHAVI V and MADHAVI G (2012) Remediation of chlorpyrifos contaminated soils by laboratory synthesized zero valent nano iron (ZVNI) particles: Effect of pH and aluminium salt. International Journal of Chemistry Research 3 (2).
VIJAYARAGHAVAN G, SIVAKUMAR T and VIMAL KUMAR A (2011) Application of plant based coagulants for waste water treatment. International Journal of Advanced Engineering Research and Studies 1 (1) 88–92.
VIJAYARAGHAVAN K and YUN Y-S (2008) Bacterial biosorbents and biosorption. Biotechnology Advances 26 266–291.
VITTADINI, A., and SELLONI, A. (2002). Small gold clusters on stoichiometric and defected TiO 2 anatase (101) and their interaction with CO: a density functional study. The Journal of chemical physics 117(1) 353-361.
VITTADINI A, CASARIN M and SELLONI A (2007) Chemistry of and on TiO2-anatase surfaces by DFT calculations: A partial review. Theoretical Chemistry Accounts 117 (5) 663–671.
VOLESKY B (2001) Detoxification of metal-bearing effluents: Biosorption for the next century. Hydrometallurgy 59 (2) 203–216.
VORKAMP K and RIGET FF (2014) A review of new and current-use contaminants in the Arctic environment: Evidence of long-range transport and indications of bioaccumulation. Chemosphere 111 379–395.
WALTON KS and SNURR RQ (2007) Applicability of the BET method for determining surface areas of microporous metal-organic frameworks. Journal of the American Chemical Society 129 (27) 8552–8556.
WAN NGAH W, ENDUD C and MAYANAR R (2002) Removal of copper (II) ions from aqueous solution onto chitosan and cross-linked chitosan beads. Reactive and Functional Polymers 50 181–190.
WAN Y and ZHAO D (2007) On the controllable soft-templating approach to mesoporous silicates. Chemical Reviews 107 2821.
WANG H, WANG C, WU W, MO Z and WANG Z (2003) Persistent organic pollutants in water and surface sediments of Taihu Lake, China and risk assessment. Chemosphere 50 557–562.
WANG J and CHEN C (2009) Biosorbents for heavy metals removal and their future. Biotechnology Advances 27 (2) 195-–226.
WANG JA, NOVARO O, BHOKIMI X, LOPEZ T, GOMEZ R, NAVARRETE J, LLANOS ME and LOPEZ-SALINAS E (1998) Characterizations of the thermal decomposition of brucite prepared by sol-gel technique for synthesis of nanocrystalline MgO. Materials Letters 35 (5–6) 317–323.
WANG S, CHEN F, WU J, WANG Z, LIAO X and HU X (2007) Optimization of pectin extraction assisted by microwave from apple pomace using response surface methodology. Journal of Food Engineering 78 (2) 693–700.
Nanocomposite sorbents and electrospun nanofibres
211
WANG Y and XIA Y (2004) Bottom-up and top-down approaches to the synthesis of monodispersed spherical colloids of low melting-point metals. Nano Letters 4 (10) 2047–2050.
WEI J, XU X, LIU Y and WANG D (2006) Catalytic hydrodechlorination of 2,4-dichlorophenol over nanoscale Pd/Fe: reaction pathway and some experimental parameters. Water Research 40 348–354.
WEI H, INSIN N, LEE J, HAN HS, CORDERO JM, LIU W and BAWENDI MG (2011) Compact zwitterion-coated iron oxide nanoparticles for biological applications. Nano Letters 12 (1) 22–25.
WOO K, HONG J, CHOI S, LEE H-W, AHN J-P, KIM CS and LEE SW (2004) Easy synthesis and magnetic properties of iron oxide nanoparticles. Chemistry of Materials 16 2814–2818.
WORLD HEALTH ORGANIZATION (WHO) (2002) The world health report 2002: reducing risks, promoting healthy life.
WORLD HEALTH ORGANIZATION (WHO) (2008) Guideline for Drinking: Water Quality, 2nd ed., Vol. 1, World Health Organization, Geneva.
WU Y, CUI SW, TANG J and GU X (2007) Optimization of extraction process of crude polysaccharides from boat-fruited sterculia seeds by response surface methodology. Food Chemistry 105 (4) 1599–1605.
WU RSS, CHAN AKY, RICHARDSON BJ, AU DWT, FANG JKH, LAM PKS, GIESY JP (2008) Measuring and monitoring persistent organic pollutants in the context of risk assessment. Marine Pollution Bulletin 57 (6–12) 236-244.
XIA BY, WU HB, WANG X and LOU XW (2012) One-pot synthesis of cubic PtCu3 nanocages with enhanced electrocatalytic activity for the methanol oxidation reaction. Journal of the American Chemical Society 134 (34) 13934–13937.
XIAO B, SUN X and SUN R (2001) Chemical, structural, and thermal characterizations of alkali-soluble lignins and hemicelluloses, and cellulose from maize stems, rye straw, and rice straw. Polymer Degradation and Stability 74 (2) 307–319.
XIE M (2006) Integrated Water Resources Management– Introduction to Principles and Practices, World Bank Institute October 13, 2006.
XU J and BHATTACHARYA D (2007) Fe/Pd nanoparticle immobilization in microfiltration pores: synthesis, characterization and application in dechlorination of poly chlorinated biphenyls. Industrial Engineering Chemistry Research 46 2348–2359
XU J, ZHANG J, GAO W, LIANG H, WANG, H and LI J (2009) Preparation of chitosan /PLAblend micro/nanofibers by electrospinning. Materials Letters 63 658–660.
XU X, LI D, SONG J, LIN Y, LV Z, WEI M and DUAN X (2010) Synthesis of Mg-Al-carbonate layered double hydroxide by an atom economic reaction. Particuology 8 198–201.
YANG RT (1987) Gas separation by adsorption process. Butterworths, Boston, MA.
YANG, T., CHEN, M. L., and WANG, J. H. (2015). Genetic and chemical modification of cells for selective separation and analysis of heavy metals of biological or environmental significance. TrAC Trends in Analytical Chemistry 66 90-102.
Nanocomposite sorbents and electrospun nanofibres
212
YANTASEE W, LIN Y, HONGSIRIKARN K, FRYXELL GE, ADDLEMAN R and TIMCHALK C (2007) Electrochemical sensors for the detection of lead and other toxic heavy metals: The next generation of personal exposure biomonitors. Environmental Health Perspectives 115 1683–1690.
YAPO BM, ROBERT C, ETIENNE I, WATHELET B and PAQUOT M (2007) Effect of extraction conditions on the yield, purity and surface properties of sugar beet pulp pectin extracts. Food Chemistry 100 (4) 1356–1364.
YE, G., DUAN, X., ZHU, K., ZHOU, X., COPPENS, M. O., and YUAN, W. (2015). Optimizing spatial pore-size and porosity distributions of adsorbents for enhanced adsorption and desorption performance. Chemical Engineering Science 132 108-117.
YOUNG K (2006) The mucilage of opuntia ficus indica: A natural, sustainable and viable water treatment technology for use in rural Mexico for reducing turbidity and arsenic contamination in drinking water, University of South Florida, Tampa, FL.
YU D, BAI J, LIANG H, MA T and LI C (2016) AgI-modified TiO2 supported by PAN nanofibers: A heterostructured composite with enhanced visible-light catalytic activity in degrading. Chemical Dyes and Pigments 133 51–59.
YUAN TQ, XU F, HE J and SUN RC (2010) Structural and physico-chemical characterization of hemicelluloses from ultrasound-assisted extractions of partially delignified fast-growing poplar wood through organic solvent and alkaline solutions. Biotechnology Advances 28 (5) 583–593.
ZABAR R, KOMEL T, FABJAN J, KRALJ M and TREBSE P (2012) Photocatalytic degradation with immobilised TiO2 of three selected neonicotinoid insecticides: Imidacloprid, thiamethoxam and clothianidin. Chemosphere 89 293–301.
ZENG D, WU J and KENNEDY JF (2008) Application of a chitosan flocculant to water treatment. Carbohydrate Polymers 71 (1) 135–139.
ZENILDA C, SOUZA, G and AMORIM, L (2011) Analytical methods for performing pesticide degradation studies in environmental samples. In: Pesticides – Formulations, effects, fate, STOYTCHEVA M (ed.).
ZHANG G, YI L, DENG H and SUN P (2014) Dyes adsorption using a synthetic carboxymethyl cellulose-acrylic acid adsorbent. Journal of Environmental Sciences 26 (5) 1203–1211.
ZHANG L, ARNOLD WA, HOZALSKI, RM (2004) Kinetics of haloacetic acid reactions with Fe (0). Environmental Science and Technology 38 6881– 6889.
ZHANG P, MCBRIDE MB, XIA H, LI N and LI Z (2009) Health risk from heavy metals via consumption of food crops in the vicinity of Dabaoshan mine, South China. Science of the Total Environment 407 1551–1561.
ZHANG P, SHAO C, ZHANG Z, ZHANG M, MU J, GUO Z and LIU Y (2011) In situ assembly of well-dispersed Ag nanoparticles (AgNPs) on electrospun carbon nanofibers (CNFs) for catalytic reduction of 4-nitrophenol. Nanoscale 3 (8) 3357–3363.
ZHANG Y, RILEY LK, LIN M and HU Z (2012) Determination of low-density Escherichia coli and Helicobacter pylori suspensions in water. Water Research 46 2140–2148.
Nanocomposite sorbents and electrospun nanofibres
213
ZHANG ZL, HONG HS, ZHOU JL, HUANG J and YU G (2003). Fate and assessment of persistent organic pollutants in water and sediment from Minjiang River Estuary, Southeast China. Chemosphere 52 1423–1430.
ZHAO XH, LI Q, MA XM, XIONG Z, QUANAC FY and XIA YZ (2015) Alginate fibers embedded with silver nanoparticles as efficient catalysts for reduction of 4-nitrophenol. RSC Advances 5 (61) 49534–49540.
ZHAO Z-P, LI J, ZHANG D-X and CHEN C-X (2004) Nanofiltration membrane prepared from polyacrylonitrile ultrafiltration membrane by low-temperature plasma I. Graft of acrylic acid in gas. Journal of Membrane Science 232 1–8.
ZHOU J and HAN Y (2013) Reductive removal of chloroacetic acids by catalytic hydrodechlorination over Pd/ZrO2 catalysts. Applied Catalysis B: Environmental 134–135 222–230.
ZHU BW and LIM TT (2007) Catalytic reduction of chlorobenzenes with Pd/Fe nanoparticles: Reactive sites, catalyst stability, particle aging, and regeneration. Environmental Science and Technology 41 (21) 7523–7529
ZHU N and CHEN X (2013) Biofabrication of tissue scaffolds. Biomaterials 52 1051–1054.
ZHUANG, P., MCBRIDE, M. B., XIA, H., LI, N., and LI, Z. (2009). Health risk from heavy metals via consumption of food crops in the vicinity of Dabaoshan mine, South China. Science of the total environment 407(5) 1551-1561.
ZIAGOVA M, DIMITRIADIS G, ASLANIDOU D, PAPAIOANNOU X, LITOPOULOU TZANNETAKI E and LIAKOPOULOU-KYRIAKIDES M (2007) Comparative study of Cd (II) and Cr (VI) biosorption on Staphylococcus xylosus and Pseudomonas sp. in single and binary mixtures. Bioresource Technology 98 (15) 2859–2865.


