Embed Size (px)
Citation preview
General Disclaimer
One or more of the Following Statements may affect this Document
This document has been reproduced from the best copy furnished by the
organizational source. It is being released in the interest of making available as
much information as possible.
This document may contain data, which exceeds the sheet parameters. It was
furnished in this condition by the organizational source and is the best copy
available.
This document may contain tone-on-tone or color graphs, charts and/or pictures,
which have been reproduced in black and white.
This document is paginated as submitted by the original source.
Portions of this document are not fully legible due to the historical nature of some
of the material. However, it is the best reproduction available from the original
submission.
Produced by the NASA Center for Aerospace Information (CASI)
^ ^^_^^,
x-sae-^^--^.^.ZPREPRINT
f^.^:
^:.
,.^.
f
ELECTROSTATIC EMISSIONS BETWEEN ELECTRON
GYROHARMONICS IN THE OUTER MAGNETOSPHERE
Richaxd F. Hubbaxd*
Thomas ^'. Birrnangham
May 1927
}:;,
*NAS/NRC Resident Research Associate
GflDDARD SPACE FLIGHT CENTERGreenbelt, Maryland
is,
S'^i -^- ....
_1 J T.
ELECTROSTATIC EM€SSIONS BETWEEN ELECTRON
GYROHARMONSCS IN THE OUTER MAGNETOSPHERE
by
Richard F. Hubbard
Thomas ^. Birmingham
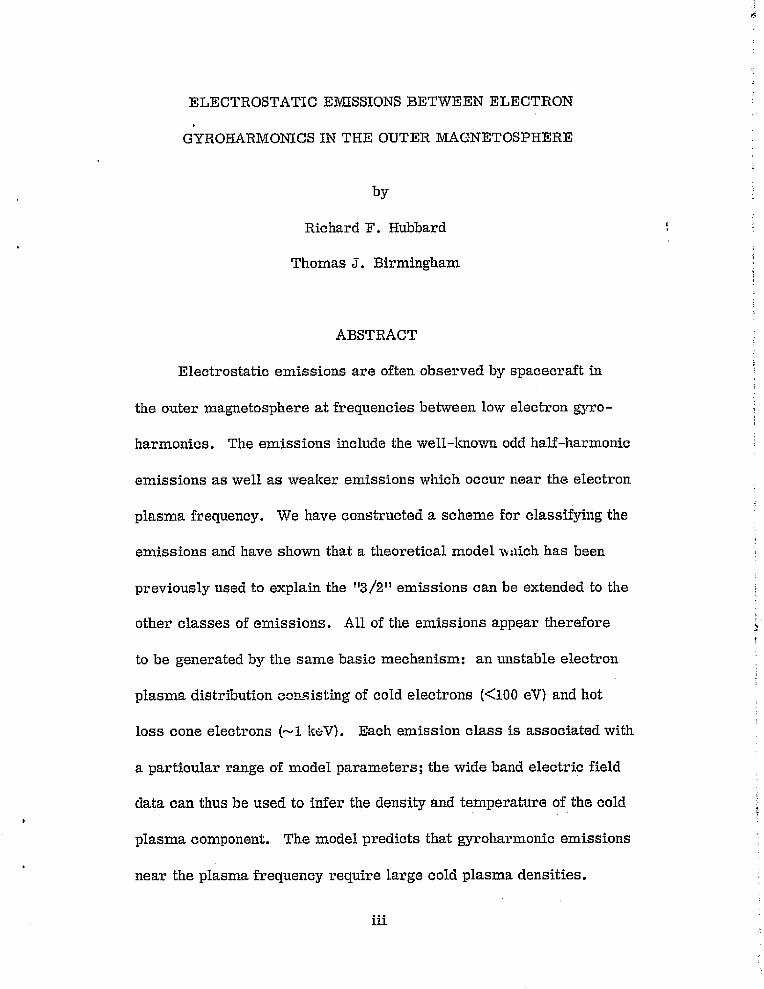
ABSTRACT
Electrostatic emissions axe often observed by spacecraft in
the outer magnetosphere at frequencies between low electron gyro-
harmonics. The emissions include the well-l^nown odd half-haxmonic
emissions as well as wea[^er emissions which occur near the electron.
plasma frequency. We have constructed a scheme for classifyiizg the
emissions and have shown that a theoretical model w:^ich has been
previously used to explain the "3/2" emissions can be extended to the
other classes of emissions. All of the emissions appear therefore
to be generated by the same basic mechanism: an unstable electron
plasma distribution ;,^resisting of cold electrons (<3.00 eV} and hot
Loss cone electrons (^-1 l^eV). Each emission class is associated with
a particular range of model parameters; . the wide band electric field
data can thus be used to infer the density and temperature of the cold
plasma component. The model predicts that gyrohaxmonic emissions
near the plasma frequency require Large cold plasma densities.
iii.
_ .. _ _
yt
_.
i
`^° Page^1.
_ ABSTRACT iii
I. INTRODUCTION ^
II. TYPICAL ELECTRIC FIELD OBSERVATIONS 5^... 3
III. THEORY . . ^Q ` i
- IV, SOLUTIONS OF THE PLASMA DISPERSION RELATION . J.8 a
V. PLASMA MUDELS FOR EACH EMISSION CLA55 23i
. VI. THE DIAGNOSTIC USE OF OUR PLASMA MODEL 28 1
VII CONCLUSIONS 33 ^. .
ACI^NOWLEDGMENTS , 34
REFERENCES 35
;.
i4'
EI
..^, .. __
vi
^'^^;
^.
/ ^^
a
ILLUSTRATIONS
Figare Page
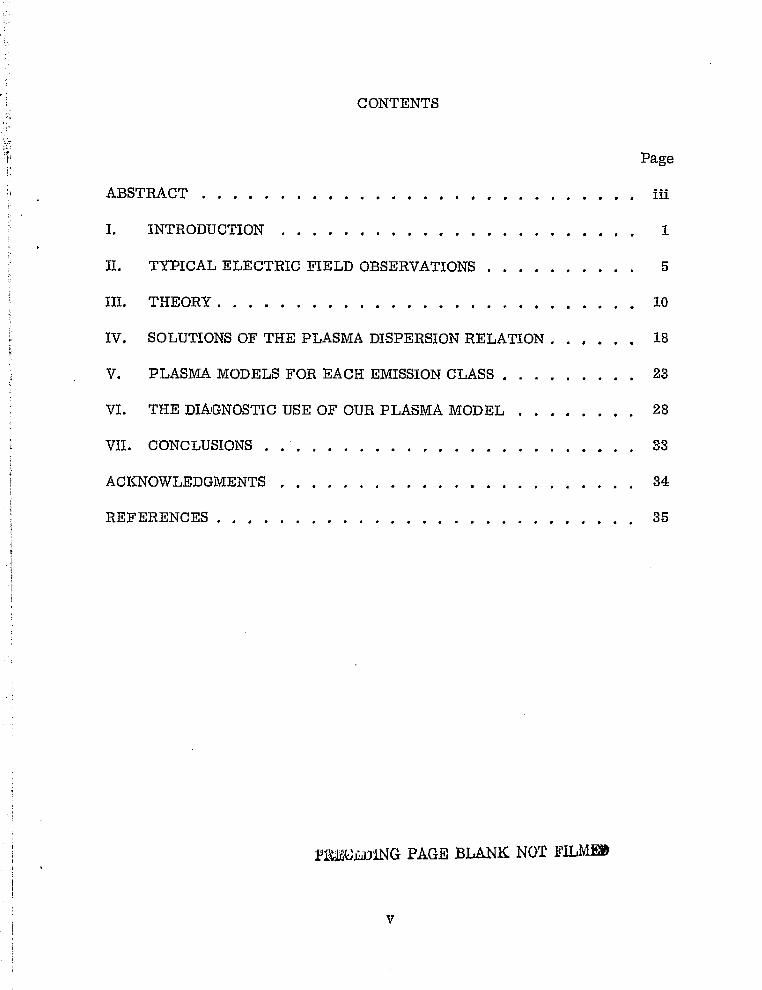
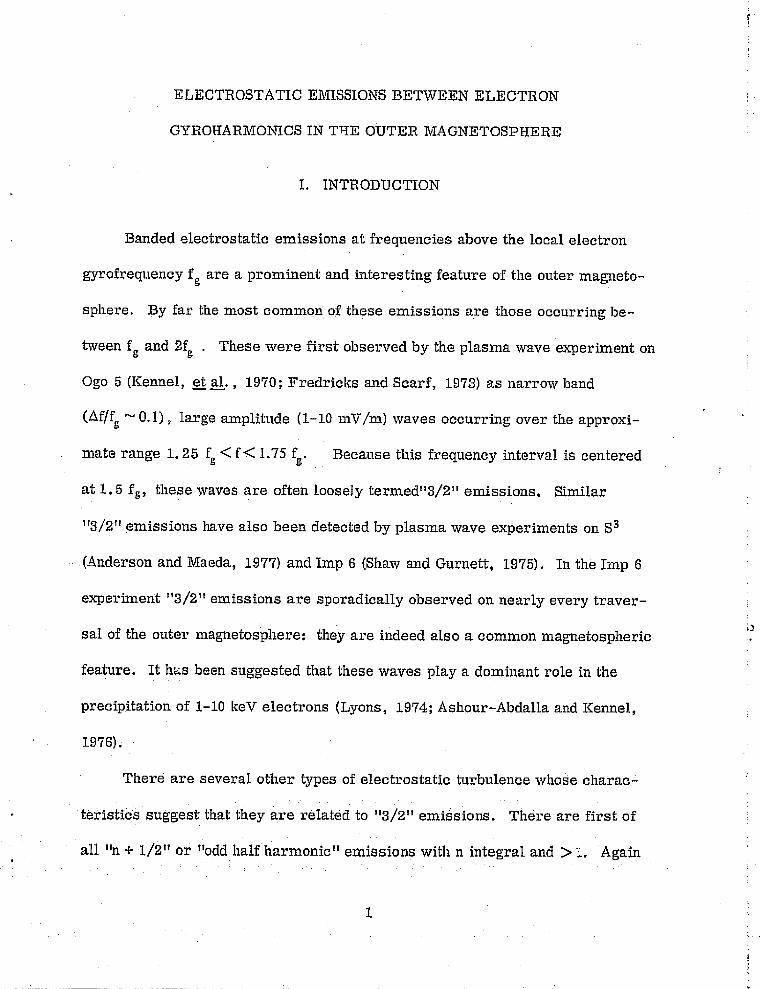
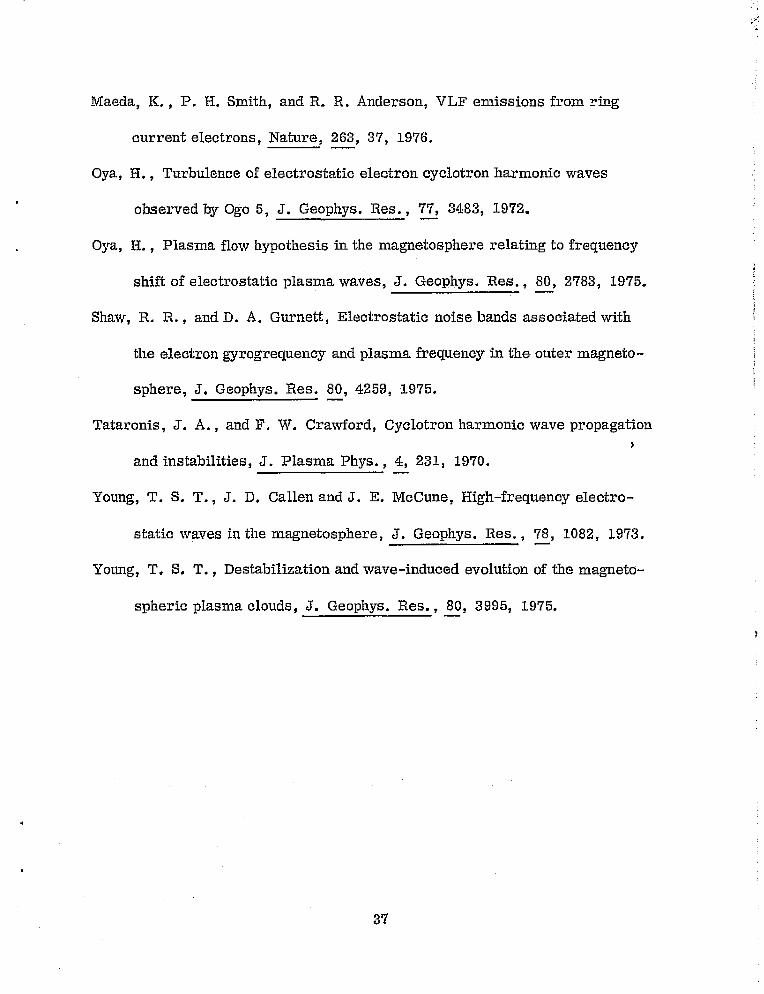
^. An ea^alr^pie of multiple hai£ harmonic emissions observed by Imp 6 l^^at R =9R^ on the day side a£ the magnetosphere. As many as ^'_seven gyro^rarmonic bands are simultaneously observed. The in--tense ^'8/2" enz9.ssion which occurs between I and 2 kHz at O'l00 isalmost continuously observed from 0500 to 0800. The emissionsbelow 1 kHz are electromagnetic and are oat considered in this A
paper . ........................................ 38 ""' i
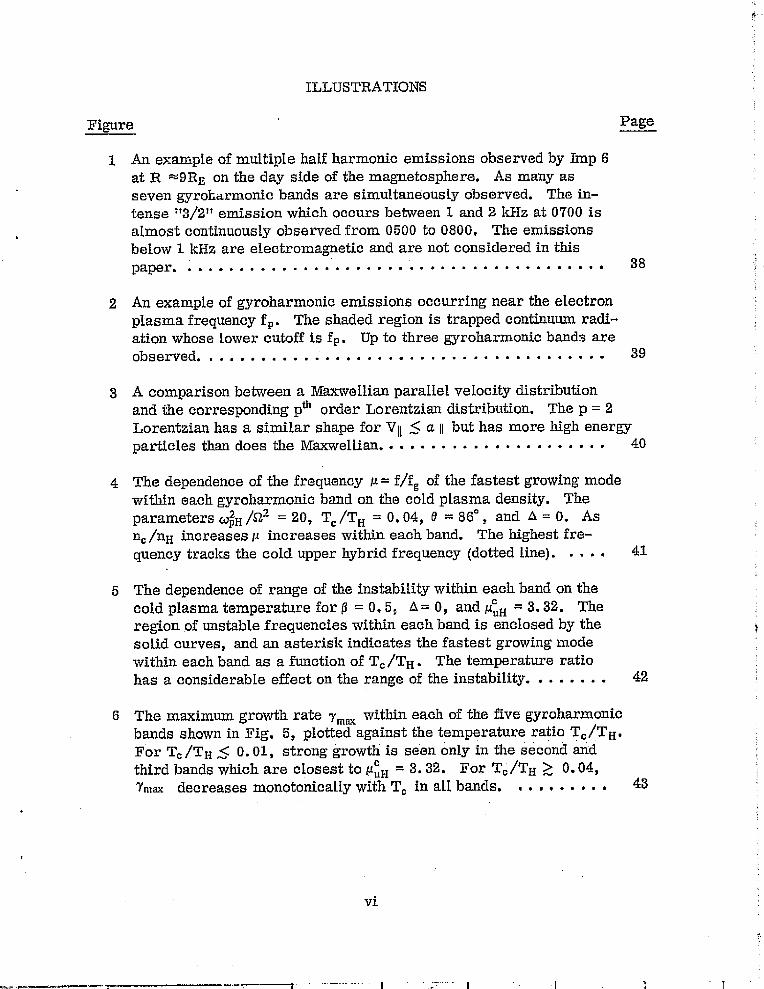
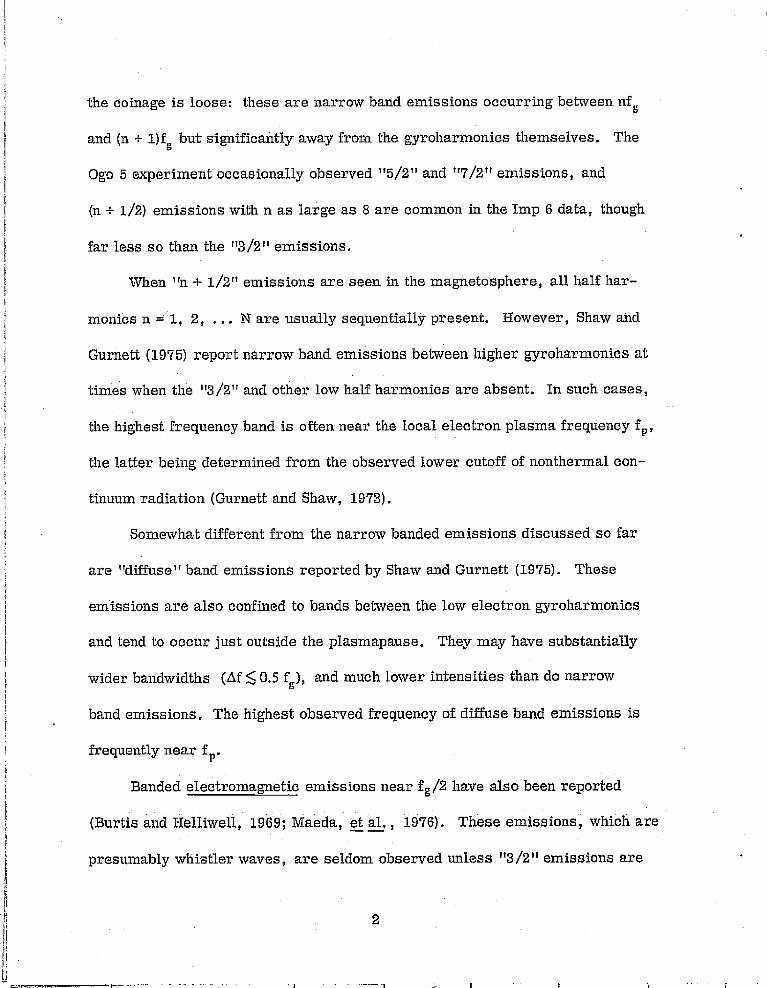
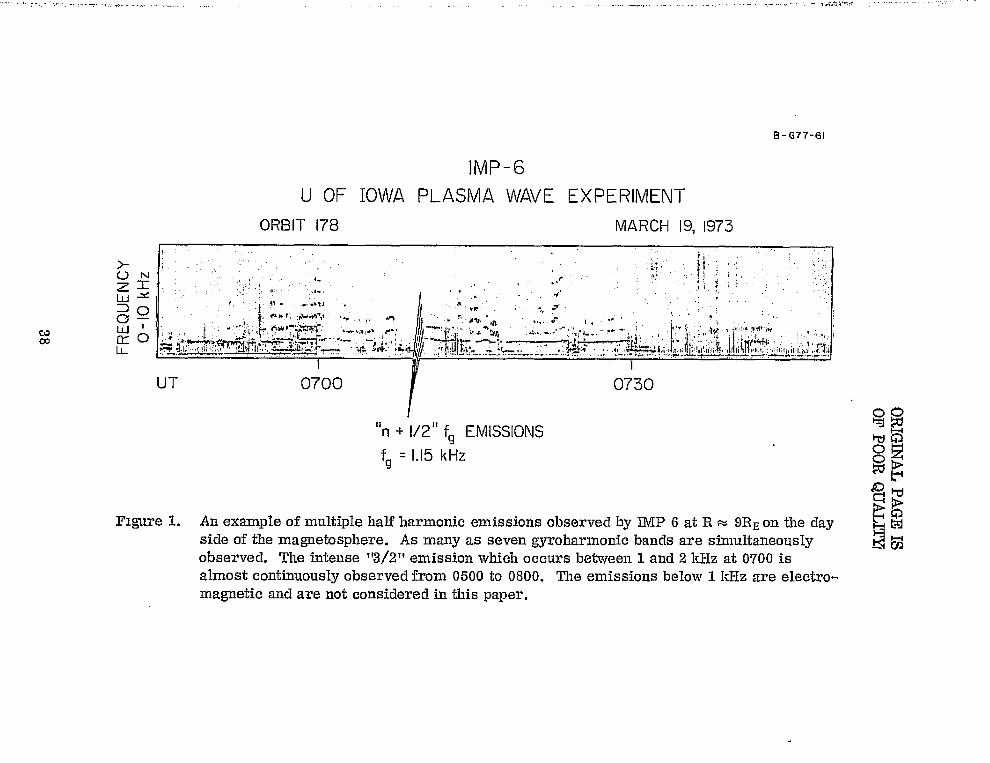
i2 An example o£ gyroharmonic emissions occurring near the electron '
plasma frequency f^. The shaded region is trapped continuu^cn radi--atian whose lower cutoff is fp, Up to three gyroharmonic band.; areobserved. .................. . ................... 39 ^
3 A comparison between a Ma^rcveilian parallel velocity distribution
a and the corresponding p^' order Lorentzian distribution. The p = 2 ^Lorentzian has a similar shape for V^^ C a p but has mare high energy
'particles than does the Maxweliian. • • • • • • ............. 40 ##;
^ i
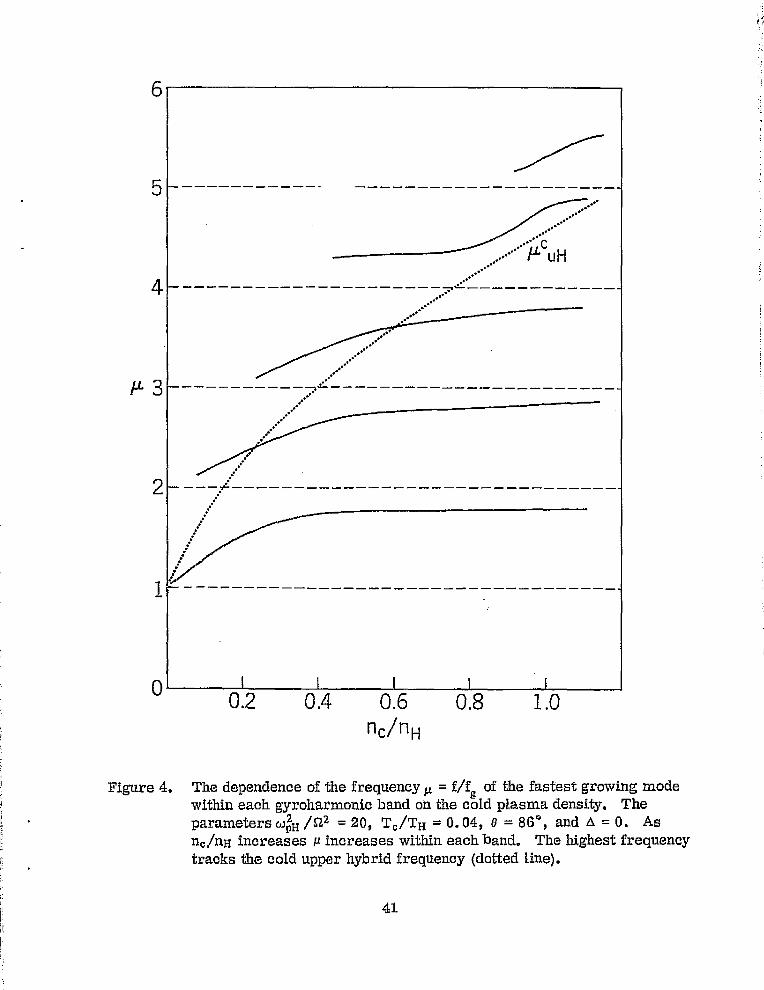
^ The dependence o£ the frequency ^ = f/fg of the fastest growing modewithin each gyroharmonic band on the cold plasma density. The 'jparameters wpx /SLz = 20, T^ /Tx = 0.0^, 8 - 86° , and 4 = 0, As
nc /nx increases F^ increases within each band. The- highest £re--quency tracks the void upper hybrid frequency (dotted line}. .... 'i^ '
5 The dependence of range of the instability within each band on the ^'' cold plasma temperature for Q = 0.5, 4 W 0, and dux = 3.32. The
region of unstable frequencies within each band is enciosed by thesolid curves, and an asterisk indicates the fastest growing modewithin each band as a function o£ TG /Tx , The temperature ratiohas a considerable effect an the range o£ the instability. ....... 42
6 The- maximum growth rate ym^ within each of the five gyroharmonicbands shown in rig. 5, plotted against the temperature ratio T^/Tx.For T^ /Tx < 0, 01, strong growth is seen only in the second andthird bands which are closest to unx = 3.32. For T^/Tx ] 0.0^,7max decreases monatonicaiiy with T^ in all bands. .... _ `i3
i i 4 '.
^.
ILLUSTRATIONS
Figure
Page
7 The effect of the hot plasma density on the range of unstable fre-quencies. The mast unstable frequency is plotted vs. n^/nn withT^/Tn = 0. I0, D = 0, and nC fixed (^cuH = ^). The "error bars"estimate the bandwidth based an the frequency range for which themaximum growth rate '? '^,^ < 2 7(u )• The solid, dashed, and dottedcurves correspond toy m^x >0.01, 0 . 041 <7m^<0.01, and7m^ < 0, 001 respectively. Increasing n^-^ tends to increase 7m^
while leaving frequencies relatively unaffected . ............ 44
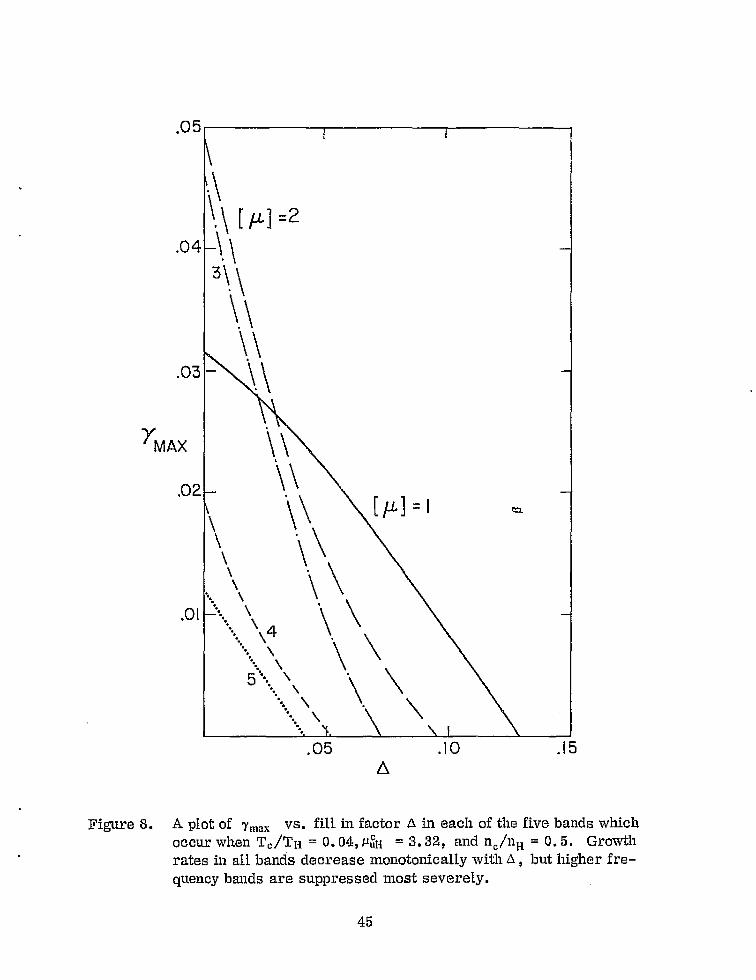
8 A plot of 7max vs. fill in factor o in each of the five bands whichoccur when T^/Tn = 0.04., ^^^ = 3.32, and n^ /na = 0.5. Growthrates in all bands decrease manotonicalLy wath a , but higher fre-quency bands are suppressed most severely . .............. 45
9 Growth rate y vs. frequency ^ for uua = 1.34, Q = 0.1 (Curve 1) and
^uH = 1.73, Q = 0.2 (Curve 2) with T^/T^= 0.10 and 4 = 0. Unstable.waves above ^ - 2 can be suppressed by setting Toss cone fill infactor d = 0.10 {Curves 3 and 4). Hence Curves 3 and ^ reproducethe features of Class 1 (low 3i2) and Class 2 (3/2) emissions. 46
10 ^ vs. ^ for ^uH = 3.32, d = 0, F = 0.5, and T^/TH = 0.10. Thefrequencies and bandwidths are characteristic of Class 3 (multiplehalf harmonic) emissions. ......................... 4'T
1.1 An example of gyroharmonic emissions near the plasma frequency,,' Fig. Ile gives y vs. u for ^ = 10, a = 0, d ux = 4.58, f /f = 4.69,
and T /Try = 0.01. The dominant feature is a single strong emissionnear f^,. In Fig. 11b, T^/TH = 0.02, and an enti.ssion band above5fg would be seen. Class 5 emissions include bath single band andmultiple band emissions near fn, ...................... 48
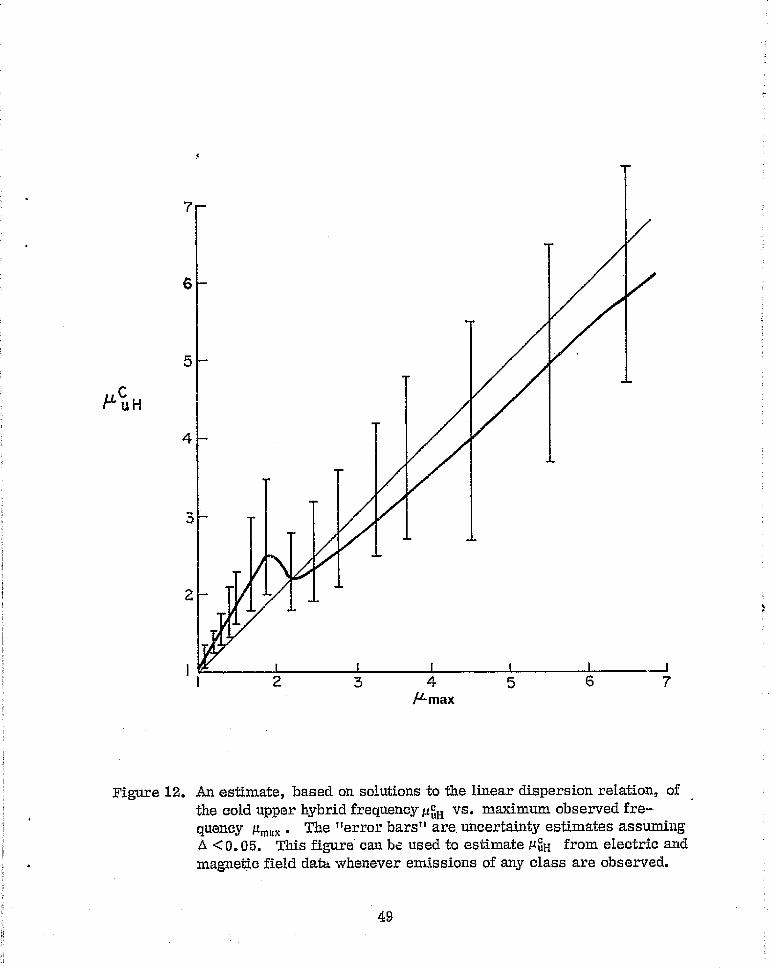
12 An estimate, based an solutions to the linear dispersion relation, ofthe cold upper hybrid frequency u^ vs. maximum observed fre-queney ^m^ . The "error bars'° are uncertainty estimates assumingaGO.05. This figure can be used to estimate 1^u^. from electric
} and magnetic field data whenever emissions of any class areobserved. .......... . . . ........................ 49
___ ..
.r 1
i ^_ ^^^^ ^ ;
ILLUSTRATIONS g
i{ Figure Pag_ e^' -;,{`
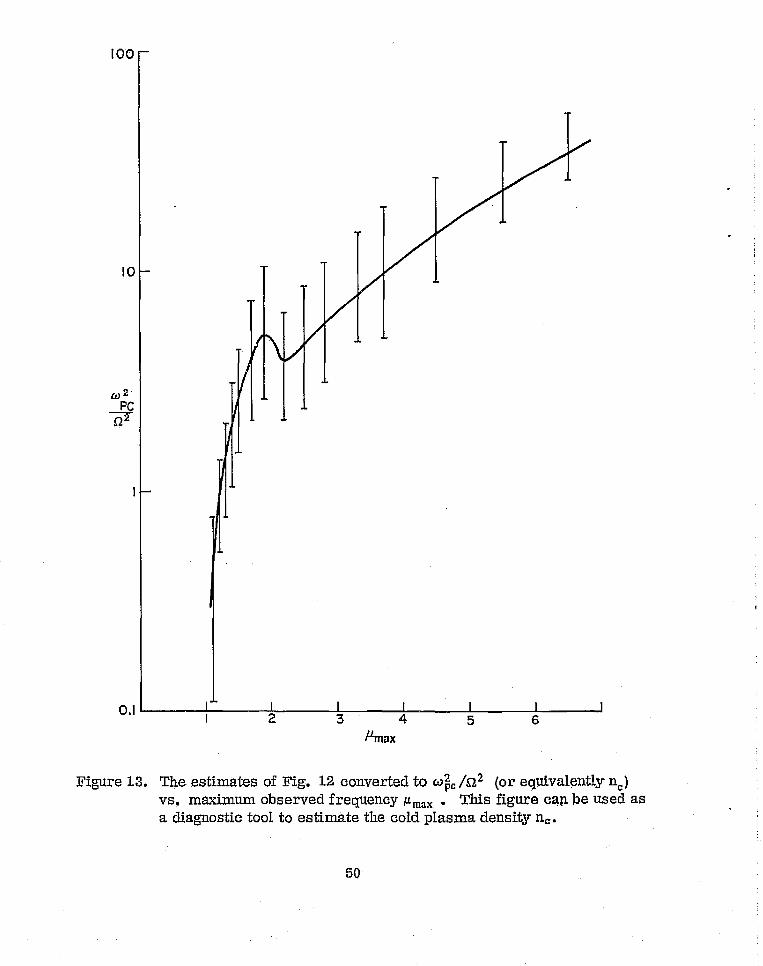
1.3 The estimates of Fig. 12 converted to ^^ /52 2.(or equivalently nC) ^>^
vs. maximum observed frequency ^ma^ . This figure can be used as ^ fit;
^. a diagnostic tool to estimate the cold plasma. density n^. ...... 50 ^ is<°
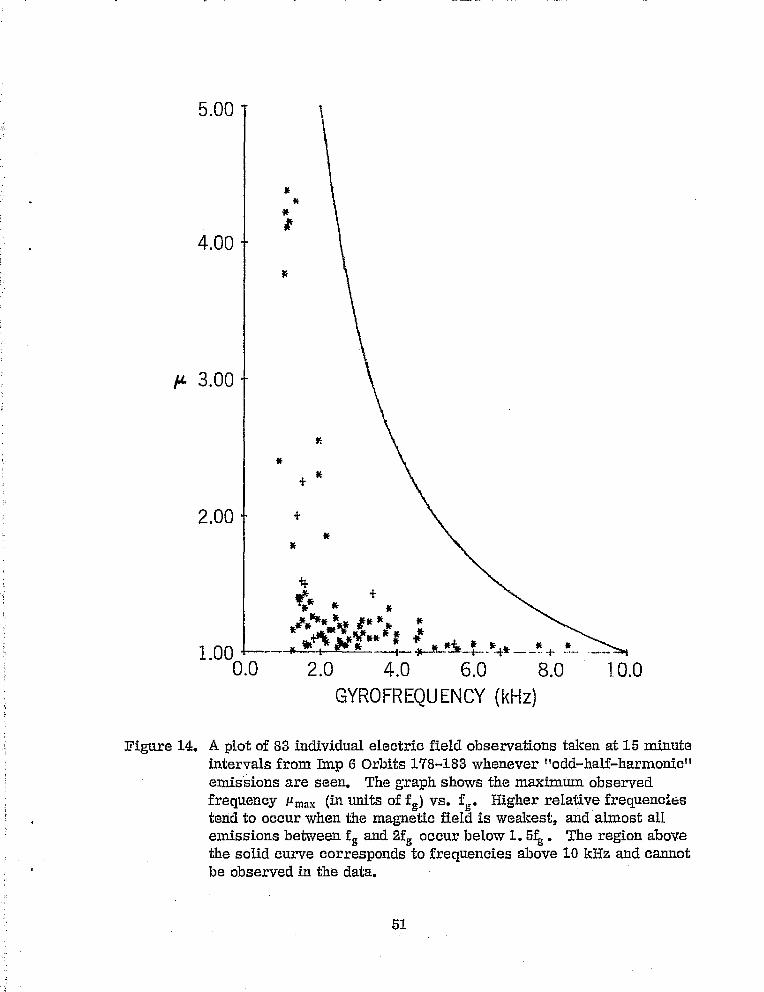
^^ A plot of 83 individual electric field observations taken at 15 minute - '^ ^.intervals from Imp fi Orbits 1.78-183 whenever t 'odd-half-harmonic" `^ ^.emissions are seen. The graph shows the maximum observedfrequency ^m^x (in units of fg) vs. f^. Higher relative frequenciestend to occur when the magnetic field is weakest, and almost alIemissions between fg and 2fs occur below 1.5f^. The region abovethe solid curie corresponds to :Frequencies above 1.0 kHz and cannot
^; be observed in the data . . . .......................... 51
^'
.! j
s ^. ^
.
^
_ ^ ;
t
i
_.._.. _ . _ Vii.
4- - ;
I
i
9
Ef,ECTROSTATIC EMISSIONS BETWEEN ELECTRON
GYROHARMONICS IN THE OUTER NTAGNETOSPHERE
I. INTRODUCTION
Banded electrostatic emissions at frequencies above the local electron
gyrafregttency f^ are a prominent and interesting feature of the outer mag^ieta--
sphere. By far the most common of these emissions are those occurring be-
tween fs and 2fs These were first observed by the plasma- wave experiment on
Ogo 5 (Kennel, et al. , I970; Fredricl^s and Scarf, 1973) as narrow band
(Aft & ^^ 0.1} , large am}^litttde (^.-10 tnV/m) waves accur^ring aver the approxi-
mate range 1.25 f^ C f C 1.75 f^. Because this frequency interval is centered
at I.5 f& , these waves are often loosely termed"3/2" emissions. Similar
" 3/2" emissions have also been detected by plasma wave experiments on 53
(Anderson and Maeda, 1977) and Ixnp 6 {Shaw and Gurnett, 1975). In the Imp 6
experiment "3/2" emissions are sporadically observed on nearly every traver-
sal of the outer magnetosphere: they are indeed also a common magnetospheric
feature. It h^:s been suggested that these waves play a domiatant role in the
precipitation of I-10 [^eV electrons (Lyons, 1974; Ashour-Abdalla and Kennel,
1976)
There_ are several other types of electrostatic turbulence whose charac^-
• teristics suggest that they are related to " 3/2" ern:issions. Tb.ere are first of
.all "n -^ 1/2" er "add half ` harrnonic" emissions with n integral and >':,. -Again
{^^
I^=
,^'^ ^.. ,
,;,,; ..i
,,
.. ^'
F ^'
E I I I 4 P
the . coinage is loose: these are narrow band emissions occurring between. nf^
and (n ^- 1)fg but significantly away from the gyroharmonics themselves, The
Ogo 5 experiment occasionally observed "5/2" and "7/2" emissions, and
(n + 1/2) emissions with n as Iarge as 8 are common in the lmp G data, though
far Iess so than the "3/2" emissions.
Nhen "n + 1/2" emissions are seen in the magnetosphere, all half har-
monies n = 1, 2, ... N are usually sequentially present. However, Shaw and1
Garnett (1975) report narrow band emissions between higher gyroharmonics at
times whEn the " 3 /2" and other loGV half laarmonics are absent. In such cases,i
.^
the highest frequency band is often near the local electron plasma frequency fP,
the latter being determined from the observed lower cutoff of nonthermal con--
tinuuna radiation (Garnett and Shaw, 1973).
^
Somewhat different from the narrow banded emissions discussed so far
are "diffuse" band emissions reported by Shaw and Garnett (1.975). These
emissions are also confined to bands between the low electron gyroharmonics
and tend to occur just outside the plasmapause. They may have substantially
wider bandwidths (^f < 0.5 f^}, and much lower intensities than do narrow
band emissions. The highest observed frequency of diffuse band emissions is
frequently near fn.
Banded electromagnetic emissions near fg/2 have also been reported
{Burtis and Helliwell, 1969; Maeda, et aI. , 1976). These emissions, which are
presumably wYii^otter waves, are seldom observed unless "3 /2" emissions are
2
^^.
3 Y
i^` 1
^... ` ^
i
{
i
,. ^
"^ 3^ ^
j
si^nultaneousl;^ present, a_nd a causal Link between the two may exist. We shall Y
not be concerned, lrowever, with electromagnetic emissions in this paper.
Ems'Part of our task has been to develop a classification scheme for the emir- ^^
5
sions discussed iZZ the previous paragraphs. Five separate categories of waves^,.,.
have been identified. More importantly, we have developed a parameterized,^..,.
model of a linearly unstable plasma. By suitable choices of the parameters
in the model, it is possible to duplicate in a more or less unique fashion the
emissions in each category.
The plasma model is essentially the nne investigated previously by several
other authors (I'redricks, 1971; Young, et al. , 7.973; Young, 1975; Ashour--
Ahdalla, et al., 19'75; Ashour--Abdalla and Kennel, 7.9'76) . Because of the high
frequency of the waves involved, we consider only electron dynamics. There
are two electron populations: a "hot" (^-1 ke^T} Toss cone component, with den-
sity n^ and parallel and perpendicular temperatures T^^^ and T1^, is the source
of free energy for the uYStability. Tn addition, there are "cold" (C7.OD eV) elec-
Irons of density n^ and temperature T^ . The cold electrons, which originate
from the ionosphere, facilitate the propagation of the instability. As mzgl^t be
expected far electrostatic emissions whose frequency is related to f^ , the waves
which we consider propagate nearly perpendicular to B, i, e. the perpendic^.xlar
and. parallel wavenumbers k1 and ^^f satisfy k17^ ^q .
1n this paper, we extend the Iin^ar analysis to investigate aII types of
narrow band electrostatic turbulence observed in the outer magnetosphere. ^V'e
3
^^^ ^ ^
.i _. ..
IiIC
feel that diffuse band emissions can also be explained by this model, but our
worm here is as yet tentative and will be reported later. The theoretical analy-
sis of narrow band emissions is coupled to specific Ixnp G electric field observa-
tions. The plasma conditions which. give rise to emissions in each of the pro-
posed categories are theoretically investigated. We summarize the effects of
varying each of the many free parax^neters in the problem on the morphology of
each category of eznissian. This leads us to a "best estimate" as to local plasma
conditions when a given type of emission occurs and: hence a predictive or diag-
nostic capability. Yn particular, we are able to estimate the local cold plasma
density, a parameter which is dffficult to measure by direct plasma observations.
f
^'
;.
:,^
1
:'^
^ I { I I 1_ ! r
II. TYPICAL ELECTRIC FIELD OBSER^IATIONS
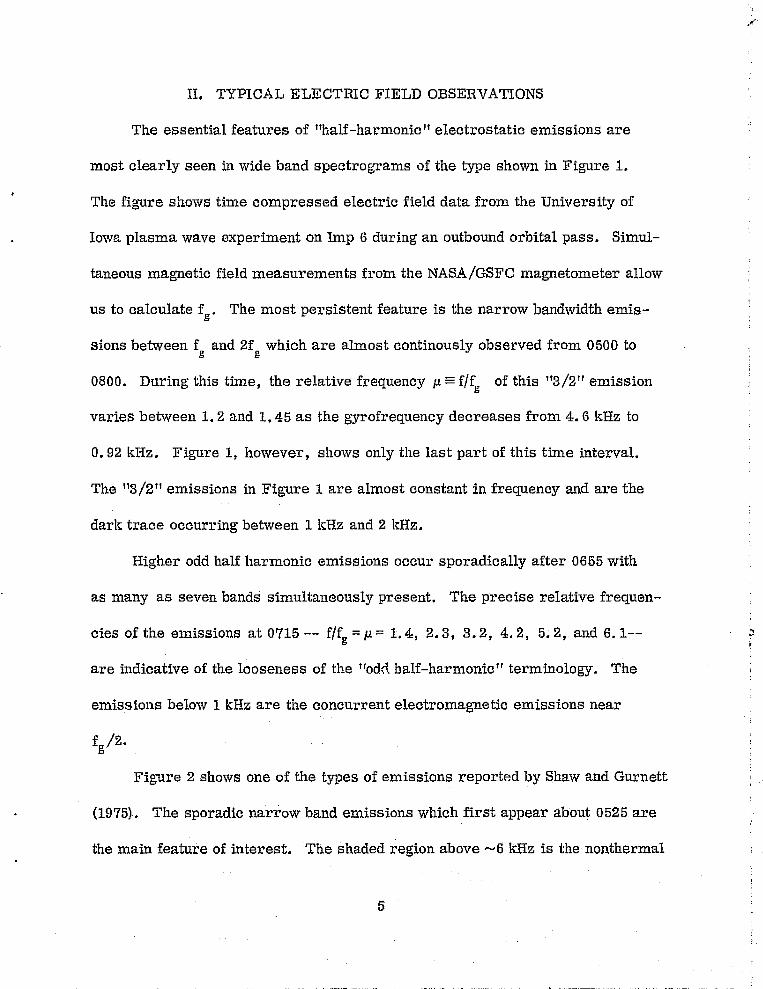
The essential features of "half-harmonic" electrostatic emissions are
most clearly seen in wide band spectrograms of the tyre shown in Figure ^.
The figure shows three compressed electric field data from the University of
Iowa plasma wave experiment on Imp 6 during an outbound orbital pass. Simul-
taneous magnetic field measurements from the NASA/GSFC rxiagnetometer allow
us to calculate f^. The most persistent feature is the narrow bandwidth emir--
sions between f$ and 2f^ which are almost continously observed from 0500 to
0800. During this tame, the relative frequency u = f^f^ of this "3/2" emission
varies between 1.2 and 1.45 as the gyrofrequency decreases from 4.6 kHz to
0.92 kHz. Figure 1, however, shows only the last part of this time interval.
The "3/2" emissions in Figure 1 are almost constant in frequency and are the
dark trace occurring between 1 kHz and 2 kHz.
Higher odd half harmonic emissions occur sporadically after 0655 with
as many as seven bands simultaneously present. The precise relative frequen--
ties of the emissions at 0715 ---- f/fg = u ^ 1.4, 2.3, 3. ^, 4.2, 5.2, and. 6. 1-- ^ ^^a^
are indicative of the looseness of the "odd half-harmonic" terminology. The
emissions below 1 kHz are file concurrent electromagnetic emissions near
f /2.^1
g'
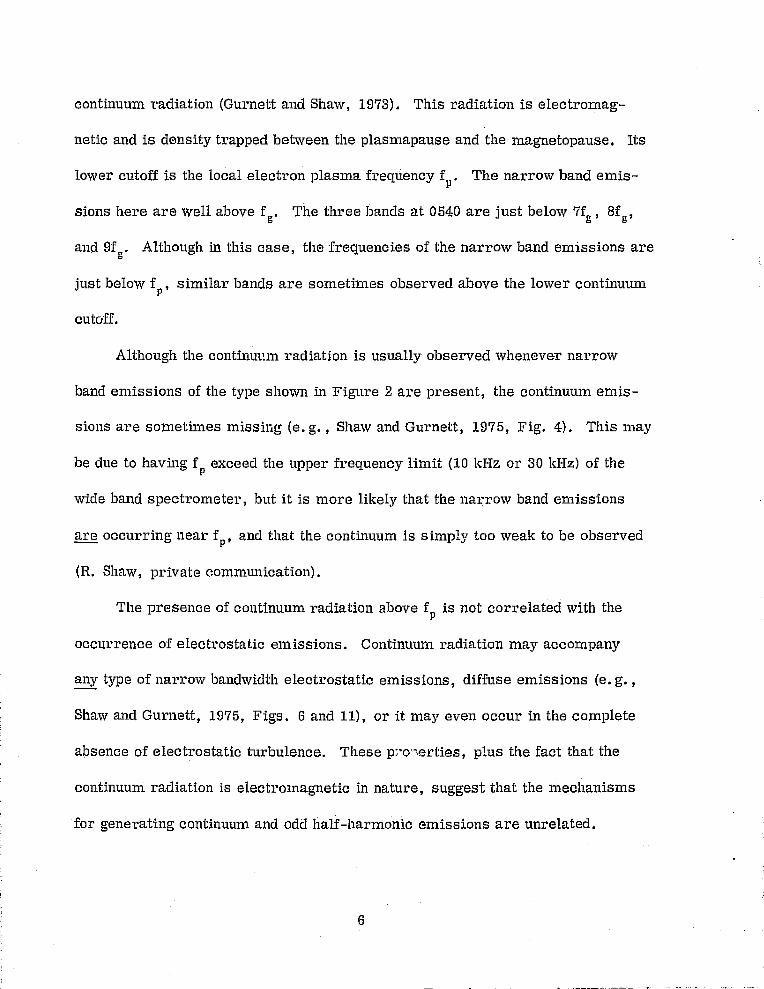
Figure 2 shows ane of the tyres of emissions reported by Shaw and Gurnett '^
(1975} . The. sporadic narrow band emissions which. first. appear about 052.5 : 'are i-
the main feature of interest. The shaded region above ^'6 kHz is the nonthermai
l _..._ ,.._. _ _ . _ .,^^ ^ ^ .^.
^__ ^_ ^ ^:
5
}^^ ^ ^
^^^ I I i I I! i t
continuum radiation {Gurnett and Shaw, 1973). This radiation is electromag-
netic and is density trapped between the plasmapause and the magnetopause. lts
lower cutoff is the local electron plasma frequency f p . The narrow band exnis-
sions here are well above f^. The three bands at 0540 are just below 7f^ , 8f^,
and 9f^. Although in this case, the frequencies of the narrow hand emissions are
just below f^, similar bands are sarnetirnes observed above the lower continuum
cutoff.
Although the continu^un radiation is usually observed whenever narrow
band emissions of the type shovv^i in Figure 2 are present, the continuum emis-
sions are sometimes missing (e, g. , Shaw and Gurnett, 1975, Fig. 4}. This may
be due to havuig f P exceed the upper frequency limit {7,0 kHz or 30 kHz) of the
wide band spectrometer, but it is mare lil^ely that the na^.,row band emissions
are occurring near f^, and that the continuum is simpl;T too weak to be observed
(R. Shaw, private cornmunieation},
The presence of continuum. radiatian above f P is not correlated with the
occurrence of electrostatic emissions. Continuum radiation may accompany
any type of narrow bandwidth electrostatic emissions, diffuse emissions (e. g. ,
Shaw and Gurnett, 1975, figs. 6 and 11), nr it may even occur in the complete
absence of electrostatic turbulence. These p,•o^^^:rties, plus the fact that the
continuum radiation is electromagnetic in nature, suggest that the mechanisms
for generating continuum and odd Half-Harmonic emissions are unrelated.
6
r ^.
^'^.
f
";I
.^.
:,
:`
^..... ^.^.^ - - ^-._,----------- ^. ^ __ ----._.. - - - ..1
_ ...... _ .
l ^ __ f^ -- /.
Based an the work of Shaw and Gurnett {1975) and our own survey of
Imp 6 U-19 1sHz broadband data, we propose the classification scheme shown
in Table 1. With the exception of Classes 1 and 2, the distinction between
separate categories is an observationally natuxal one, and as we shall see, each
class corresponds to a different configuration of our plasma model The origi-
a observations were primarily low latitude measurements and found
requencies f ^^ 1. 5 f^, i. e. , Class 2 emissions. Our analyses of sev--
its of Imp 6 data, however, suggest that fg < f < 2f^ waves axe coneen--
Crated below 1.2 '£g : for example, BO% of the narrow band emissions observed
:^` in Orbits 178-183 were Class X as apposed to Class 2 emissions. Our theare-
tical work suggests that this difference in frequency distributions between the
Ogo 5 and Imp 6 observations is a latitudinal effect. At the same radial distance
from the Forth, the ratio f p /fg , upon which the frequency f of narrow emissions
depends strongly, is smaller at the higher latitudes traversed by Inzp 6 {if f n
is constant or decreases w-^th latitude). Thus, the plasma characteristics off
Class ^. and Class 2 events are also different.i
Class 3 emissions are multiple "(n ^- 1/2)" emissions of the type shown
in Figure ^.. Class 4 emissions are the diffuse electrostatic emissions describedI
^ by Shaw and Gurnett (1975). Finally, Class 5 emissions are narrow band emis-
sions such as those in Figure 2 between cyclotron harmonics near fP.f
Vie have assumed that a1I Class 5 events have frequencies controlled by
cyclotron harmonics even when only a single band near f is observed. It is
i P
I
t'7
^ f.^
,.
".:^..
a
^,'.
possible that some of these emissions are in fact electron plasma oscillations.
We shall see that it is theoretically possible to produce gyroharmonic emissions
which occur in a narrow band right at f p . In principle one should be able to dis-
tinguish between electron plasma oscillations and gyroharmonic emissions from
the location in time of iaitensity nulls associated with the spin period of the
spacecraft svace 1<; is predominantly perpendicular to B fnr gyreharmonic emis-
lions and parallel to B for electron plasma oscillations. Unfortunately, the
Class 5 emissions don't usually show spin modulation (Shaw and Gur^ett, 3.J'75).
Emissions occurring in two or more bands near f P , such as i+igure 2, can
safely be considered gyroharmonic emissions, while emissions which occur in
a single narrow band near the continuum cutoff could be electron plasma oscilla-
bons or gyroharmonic emissions. It may be possible to distinguish the two by
analyzing electron particle spectra.
^; f:^';a
^`=
. ^. ;
^, .^,.
,^
8
__^ ^ ^ I^;^ I ^ ^ I__ _ . ^_ ,,
.^r
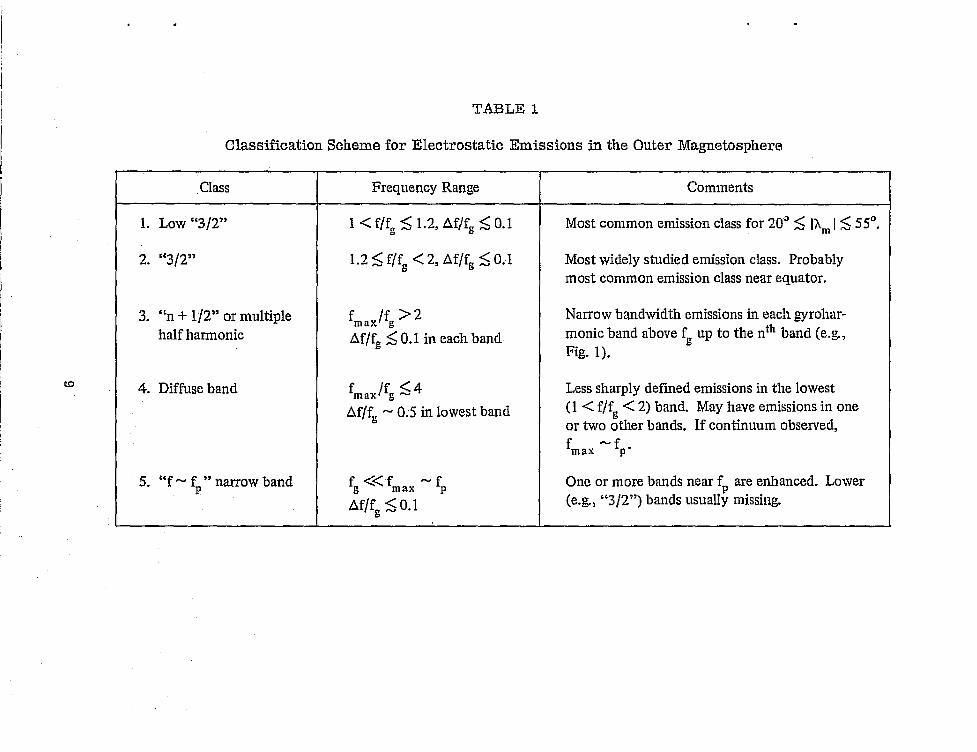
.Class Frequency Range Comments
1. Low "3/2" 1 C fjf^ < 1.2, pff fs < d.I Most common emission class far 20'' < ^A m ^ < 55°
2. "3/2" I.2 G f/fg < 2, elf/f^ < 0:1 Most widely studied emission class, Probablymast common emission class near equator.
3. "n + lJ2" or multiple max /fg > 2 Narrow bandwidth emissions In each gyrahar-half harmonic pf/f^ < O.I in each band- monk band above f^ up to the n th band {e.g.,
Fig. 1 },
4. Diffuse band fm ax f fg C 4 Less sharply defined emissions in the lowest
pf/f^ ~ O.S in lowest band {1 G fJf^ C 2) band. May have emissions in oneor two other bands. If continuum observed,
fmax ~ fg'
S. "f ~ fp"narrow band fs « max ~ fP One or more bands near fp are enhanced. Lower
pfJfg < 0 1 (e.g., " 3 f 2") bands usually missing.
^.
iI
ii---I
c^
.,I. t
i.^'
='',i
1
^" 13
^:.r...
__^
r I_I _i I3
3
__
f
i
^..^ .. ^i
9
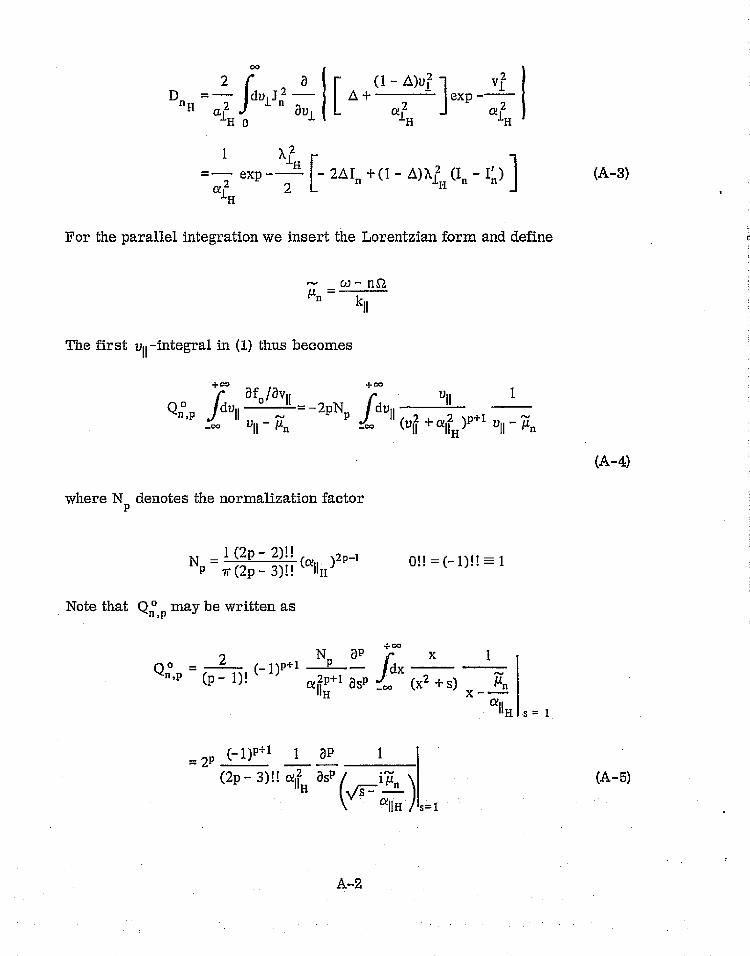
III.. THZ;ORY
The dispersion relation for electrostatic waves in a magnetized electron
plasma, where ions form only a fixed neutralizing background, is in cylindrical
coordinates, with the z-axis along B (Harris, 2959),
2n ^ }^ ^'°° Jn (k^Ul ^S^) 8f nSZ ofQ = l - kz w^ clulaZ ,^dvll ^ -^ SZ -- w ^kll 8v ^ u 8v ^
{1)o -- °° n k il Ull n II 1 1
Here wp = (4^rne2 ^m) i and 2 = ^ e E B /mc = 2 ^rf ^ are the angular electron plasma
and gyrofrequencies respectively and the electron distribution f(v^ , Ull) is
normalized to unity
+^
2^r ^dvlvl fBall f(u^, Uil ) = 1o
Two different classes of f (VZ , V ii ) which lead to unstable solutions (y
Im w ] 0) to Eq. (1} with ky » kli have been widely studied. The first type is
characterized by an anisotropy in which the temperature Tl associated with
the electronic motion perpendicular to B exceeds the equivalent parallel tempera--
tore Tll. While Tj > 2T ll is sufficient for instability in the "3/2" band, the
instability is restricted to the region 3/2 f^ < f C 2f^ (Young et al. , 1973), and
in order to account for observations below 3/2 f^ a oo^nplicated non--linear
coupling must be invpked (Oya, 2972; 1975).
Instability at higher odd half harmonics requires a still more pronounced
temperature anisotropy. It is primarily because such. anisotropic distributions
^',
i
r^
'1- --
LO
r
-: is r t__
are not observed in the magnetosphere that we analyze this type of distribution
function no further.
The second. category of distribution functions is one in which af^8vl > 0
} over soma region{s} of vi , Only this class of distribution is unstable to strictly
flute made {k ll ^ 4} propagation {Baldwin et al. , 1969}, Pioneering work with
thia type of distribution was done by Tataronis and Cr^awfard {1970} who investi-
gated the stability of the distribution
fr 2 v ^{v1-- ^1}s(vll}1
,•` iii an attempt to explain add half harmonic emissions observed in laboratory
devices.
Shortly after the Ogo- -5 xnagnetospheric observations, Fxedericl^s (197Z)
seized upon the distribution Eq, (^) {with a thermal spread in the perpendicular
distribution} aaad was able to show the existence of unstable " 3 /2" ^vaves propa-
gating within 10° of perpendicularity to the field far large but realistic values
of wP /5^^, The electrons involved were thought to be "hot" plasma sheet eiec-
txons: there vvas indication that " 3 /2" emissions are most prevalent during
substorm. periods when the flux of plasma -sheet -like electrons at Ogo-5 alti-^
fades is enhanced.
Attempts to extent this work to more realistic (loss cone) distribution.
functions met in failure. Thus Toss cone distributions of the Dory--Guest-Hai ris
(UGH) (Dory et al. , 1965} type
1,1
,^ ^f
^- t
(^)
,)
I
d
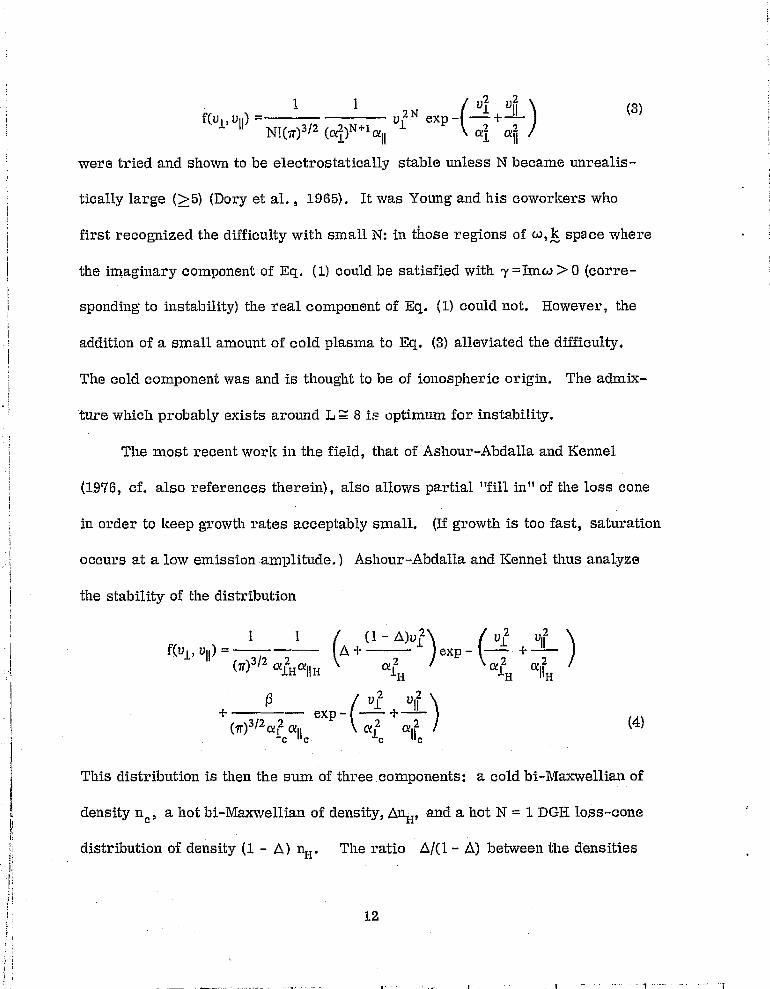
E! f(Uy, U ll ) ^
1 1*vl N exp - vl ^- U ll (^)
N^ ^ 3/2 a2 N 1 a ^ ^2 ^2r ^ (} ( .l) p s 1i
i were tried and shown to be electrostatically stable unless N became unrealis-- ^.^^;^'}
I{
ticalIy Iarge {>5) (Dory et al. , 19G5). It was Young and his coworl^ers who
^,first recognized the difficulty with small N: in those regions of ^, k space where ,^
^ the ina.aginary component of Eq. (1) could be satisfied with 7 = Tama > 0 {corre-! .r..
^` ^ sponding to instability) the real component of Eq. (1) could not. However, thei.
E addition of a small amount of cold plasma to Eq. (3) alleviated the difficulty.i
The cold component was and is thought to be of ionospheric origin. The admiX-^E
i
tore which probably exists around L= 8 is uptimun^. for instability.
The mast recent worm in the field, that of Ashour-Abdalla and Kennel =^i ^
(1976, ef. also references therein}, also allows partial "fill in" of the loss coneI
in order to beep growth rates acceptably small. (If growth is too fast, saturation1
occurs at a low emission an3plitude.) Ashour--Abdalla and Kennel thus analyze
the stability of the distribution
^ i 1 (1 - ©}u^ ul ul^ ' ^ ^^
! {^r)^1^^IlIi ^lx ^lx aHx
(
2^vl
Ul!
() c^ Ik e ^.^ lip
This distribution is tlxen the suxn of three .components: a cold bi-•Maxwellian of
^ density nC , a hot bi-Maxwellian of density, ^Ei, and ahot N = 1 DGH Ions--coneo
distribution of density (1 - d) n The ratio 0^(1 - d} between the densities^'
H'
j'.^:
I3
12
;.,
t
s
.,
i ^ ^ ! __ ,,,_^ _^ 1__ t
:`.^':
of hot A^a yurellian and Iris-cone plasma is referred to as the "fill--in:" factor.
The ratio (l is n^/na so that in Eq. (^.) wP is calculated using the hot plasma
density nH (w^ is then properly w p ). The Ashour-Abdalla and Kennel paper
reports on a detailed parameter search for conditions which can produce " 3/2"
emissions and axz analysis of the convective properties of the instabilities. It also
contains a somewhat more detailed history of the evolution of theoretical ideas.
Our work e^stends the plasma parameters search to the frequency regime
f > 2f^. Since we are concerned with characterizing all categories of odd--half-^
harmonic emission discussed in Section Yf, we shall also be considering "3/2"
emissions. Our results in this regime generally support the findings of Ashour--
Abdalla and Kennel.
We differ from previous warp in one major respect: our hot electron dis-
tribution parallel to B is a Lorentzian of order p; thus the distribution function
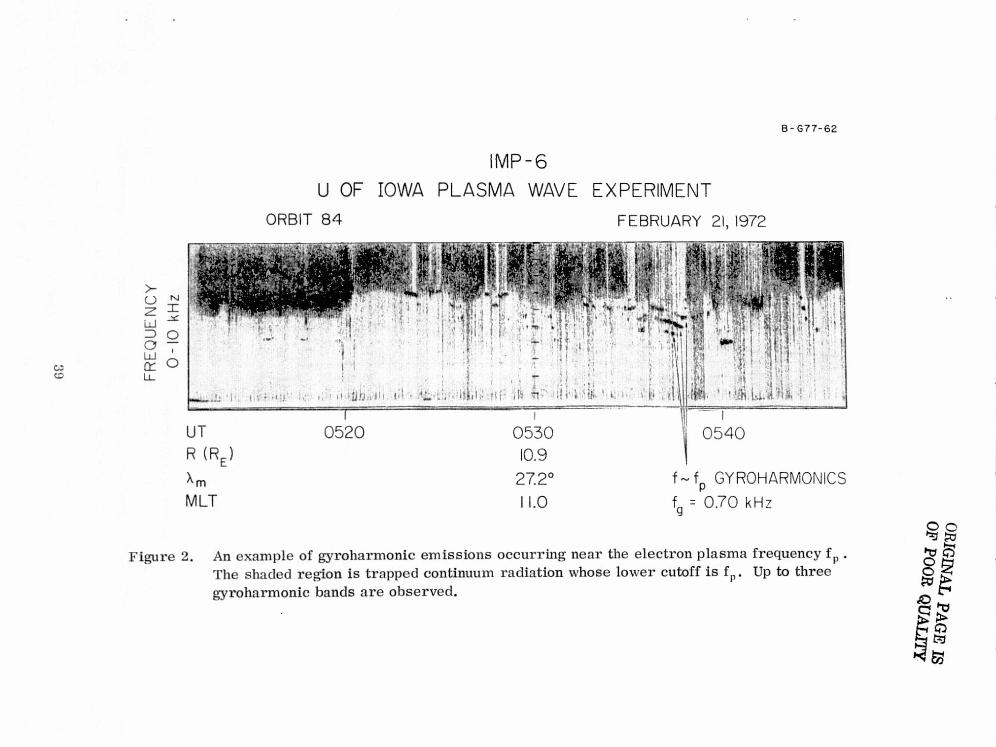
which we analyze is that given by Eq. (4) with the substitution
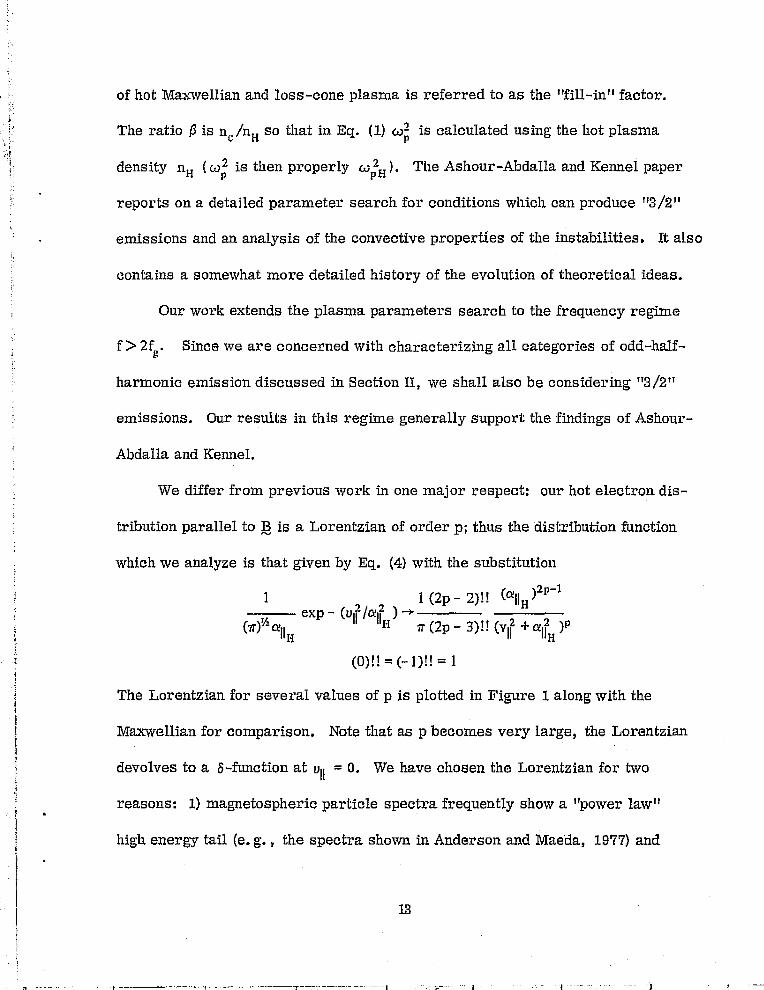
2p-11 1 {2p - 2) E ! {a il x ^
{^}^^ ^f I exp - {UI ^ '^Iln, ^'^ (2p - ^} T E {v^^ + ^^^ }p^ x
The Lorentzian for several values of p is plotted in Figure 1 along with the
Maxwellian for comparison. Nate that as p becomes very Iarge, the Lorentzian
devolves to a S^funetion at U!f = 0. We have chosen the Lorentzian for two
reasons; 1} magnetaspheric particle spectra. frequently show a "power law"
high energy tail (e. g. , the spectra shown in Anderson and Maeda, 7.977} and
i 3
,^
^-
13
l.__^. __
^'^ + r
. ^ 2) the ensuing cample^ity of the hot contribution to Eq. (1) (ef Appendices) is
greatly reduced when a Lorentzian is used,
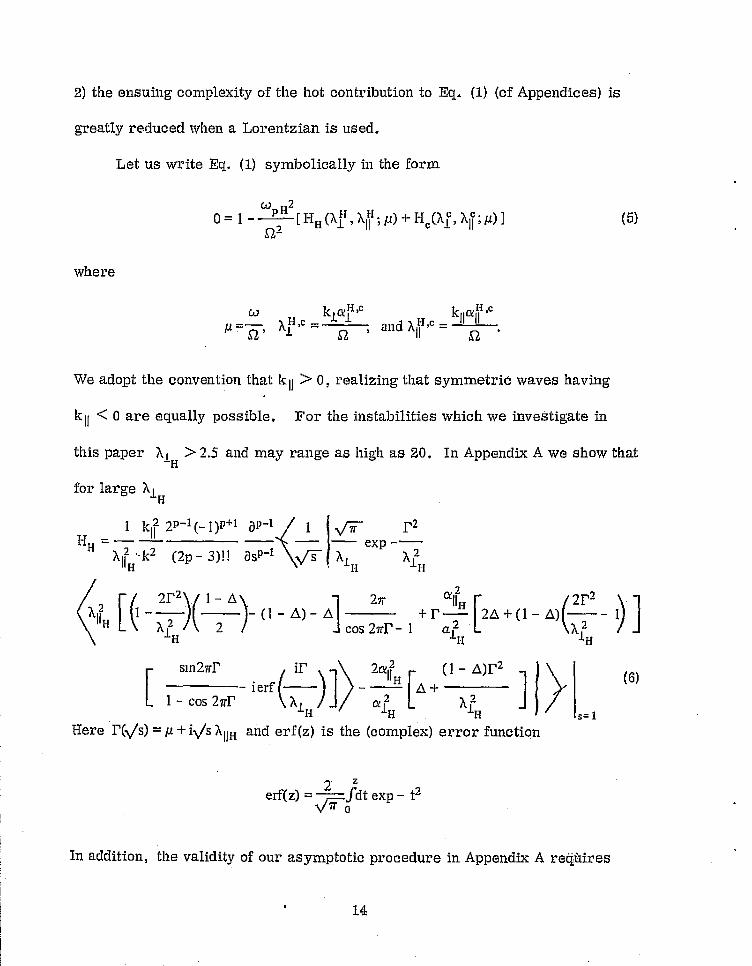
,i.` Let us write Eq. (I) symbolically in the form
W 2
where
^ W k GY H '^ k IXli,c
f p = ^ , A^ ^ , and A^^ ^
We adopt the convention that 1^^^ ^ 0, realizing that symmetric waves having
k^f C 0 are equally passible, ror the instabilities which we investigate in
this paper Al ^ 2.5 and may range as high as 20, In Appendix A we show thatH
far large A^H
1 k^^ 2p_I (- 1 }^+^ a P -t 1 ^ PzHH `
^IiH~k2 (2p - 3)I1 asp—I _ ^ ^iH exp Alit
r / 2P^ / 1 - Q 2rr ^III.^ 2P2A^^ H I ( - 2 ^I ` (1 - !1} - Q - + P Z 2Q + (1 - Q) 2 - I^j
LL \ A 1 2 ^ ^ cos 2rrP 1 a ^ ^ r^ r.L H 1H ^H
s^n2rrP iP 2a:^^^ (1 - Q)P2 (^)-- i erf - Q +
l -cos 2^r1' ^ ]^ ^ ^ ^ 2 ^ ^ z1H ^H ^'I3 s=1
Here P(^/s} = µ + i^/s HUH and erf(z) is the (complex) error function
erf(z) = ^.af dt exp - t2
In addition, the validity of our asymptotic procedure in Appendix A requixes
' 1^
_^,t_ .... F'
{{
I
3
^^. ..
__I l._ I ^1__. 1
{ _
r
3
^{A
-^
i
I
^',
-
l
1
B'{All y) ^ A^^ ande'(^r} ^ Ali , these canditzons k^eing axnpTy satisfied in all aux
carrxputation^. {Nate that we can txeat ^ ^^ h ll ^ ^^ ^1x firovided all axe cozrApaxably
l^.rge.)
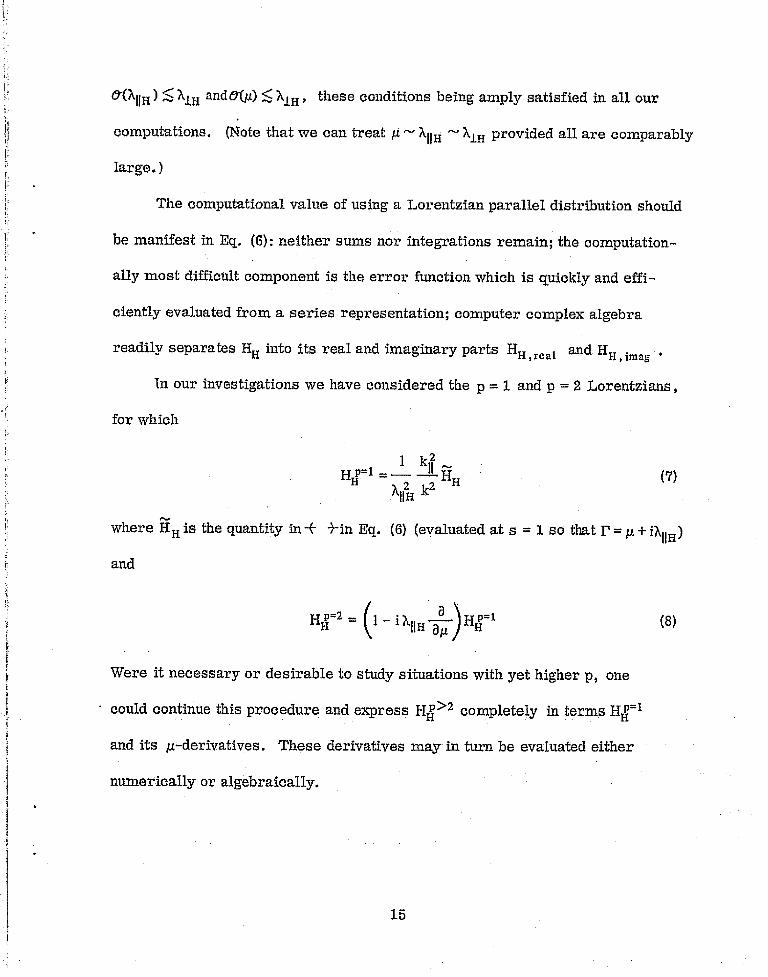
The computational value of using a Lorentzian paxallel distribution should l;.be manifest in Eq. (6): neither Sums nor integrations xemain; the ca^rnputation-^
t .,,.,,
ally most difficult campanent is the error function which is quickly and effi-
ciently evaluated from a series representation; computer complex algebra
readily separates H^ into its real and imaginary parts H H ^ x^ai and. HH ^;ma^
Zn our investigations we have considered the p = ^ and p W 2 Larentzians,
far which
2H p= 1 ^ l kll
H(^^
^ ^II^ k2 ^
where H H is the quantity in-^ -3-ixz Eq. (6) (evaluated at s = i so that P = u + i^IIH)
and
^^
_.
^.
^^ ^
\\ au
($^
Were it necessary ax desirable to study situations with yet higher p, one
could continue this procedure and empress H^^ z completely in teams HH-i
and its ^c-derivatives. These derivatives x^a.ay in turn be evaluated either
numerically ox algebraically.
15
j - I ,. ^,
I I I V^ 4
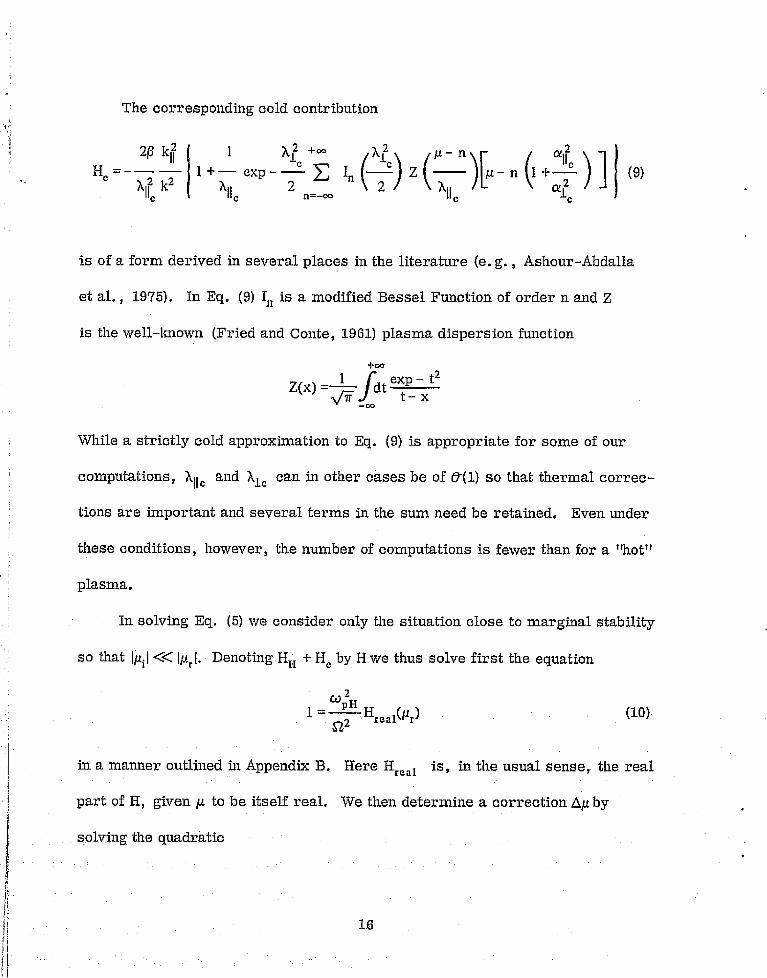
The corresponding cold contribution,:.
^^ III ^ 1 h^C +°° hoc Ic - n ^I^cH^ ^ _ 2 2 1 + — exp - __.. ^ I^ ( ^ Z ^
J ^^ - n l + x ^ ^ { 9}h k A 2 \ 2 h a[h ^ I I I n=-^ II ^ 1c
is of a form derived in setreral places in the literature (e. g. , Ashour--Abdalla
et aI. , 1975). In. Eq. (9) I31 is a modified Bessel Function of order n and Z
is the well-l^rlown (Fried and Conte, 19G1) plasma dispersion function
+^
Z(x) _ ^ f dt c p Xt2
-^
While a strictly cold approximation to Eq. (9} is appropriate for some of our
computations, hll ^ and hl^ can in other cases be of ^(1) so that thermal correc-
tions are important and several terms in the sum dead be retained. Even under
these conditions, however , the number of computations is fewer than fora "hot"
plasma.
In solving Eq. (5) we consider .only the situation close. to marginal stability
so that I^.^ I « lµr ^. I]enoting HH + H^ Uy H vre thus solve first the equation
W2AH (p) (IO}I
^ SZ2 Hreal r
in a manner outlined in Appendix B. Here Hreat is, in the usual sense,: ,the. real
part of I-i, given ^ to be itself real. We then- determine a correction Q^t by
—.7—_^ _ 1L _ _^--- ^'—_ 1'1 _
d
^i
^:
::^
{.^F+
^'
i
f'
F.
b'
2
(a2 ^ Hre al(^r^ ^ ^^ Hrea l{pCr} + 1 Him ag (F,tr} ^- ^
where in Eq. (XI) the prime notation is used for differentiation and ^r is that
value determined from Eq. (Z4}, Solutions to (^.].) are complex and thus pro-
vide both ui and a correction to flr . The quadratic term in Eq. {^.I} is ixx,.^,or--
tart only when HFeat(^tr) ^ p ; when H^eai(f^r) = 1, Eq. (i^) reduces to the common-
ly used prescription for calculating weak growth or damping. Having thus
salved Eqs. (YO) and (1^.) we check ^. posteriori that terms in (I^.) are in fact
smaller than those in (10) and that other neglected terms are yet smaller. If
this test of smallness fails, the roots are rejected.
(I1}
`, '.
6 9
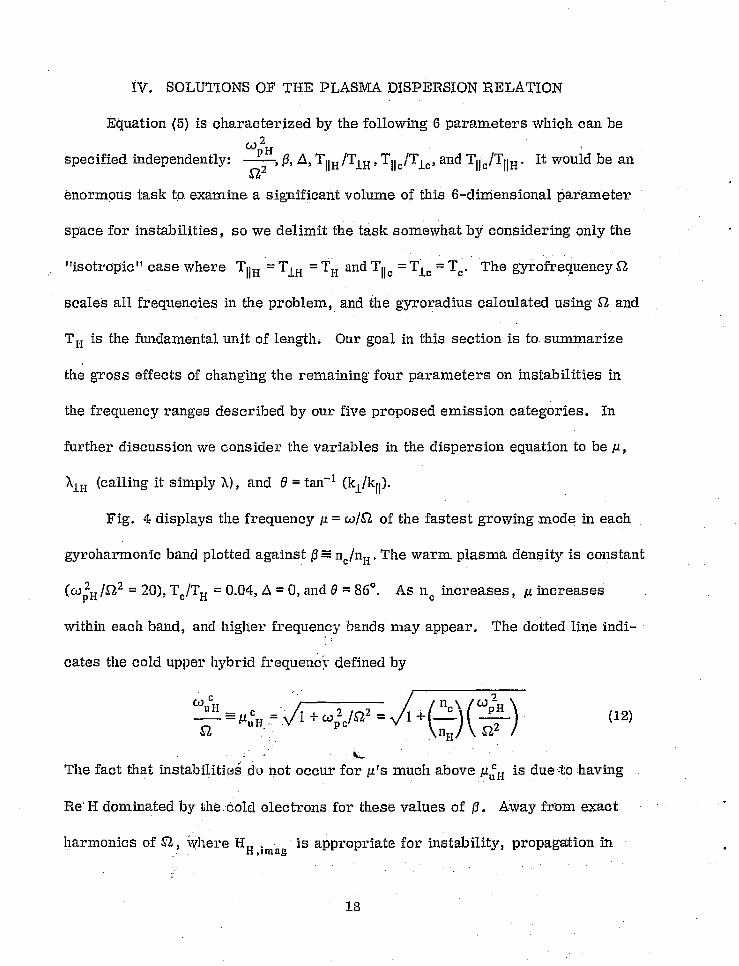
IV. SOLIITIONS OF TIDE PLASMA DISPERSION RELATION1 ,.^ Equation (5) is characterized by the following 6 parameters which, can be ^ ir z ,.
W p H^ ^-, ^
specified. independently: , ^i, d, T JT , T JT , and T /T^^ H . It would be an ;. ^^^z pH ,LH III l^ III ,.^,
enormous tasl^ to examine. a significant volume of this 6-dirriensional parameter ^f
space for instabilities, so we delimit the tasE; somewhat by considering only -the
"isotropic" case where T " T - T and T - T = T . The rofre^Iuene SZ ^^II H 1H FI Ilc !.0 o ^ q Y i
3
j
scales all frequencies in the problem, and the gyroradius calculated using SL andr
T^ is the fundamental unit of length. Our goal in this section is to summarize I a
the grass effects of changing the remaining four parameters on instabilities in
the frequency ranges described by our five proposed emission categories. In
further discussion we consider the variables in the dispersion equation to be u,
AfH (calling it simply ^), and B = tan" 1 {k^Jk^l).
Fig. 4 displays the frequency u = c.^JSZ of the fastest growing mode in each
gyroharmonic hand plotted against Ji = n^Jn Ei .The warm. plasma density is constant
{w^H JSZZ = 2d), T^JTH = q .a4, D = 0, and 8 = SG°. As n^ increases, ^ increases
within each band, and higher frequency I^ands may appear. The dotted li^ie indi-
cafes the cold upper hybrid frequeuc^^ defined by
W c n , /
tJz
'^FI
=^[^H = I + c,^pa /,SZz = l ^- nc 1 ^
Z ^ {12)
i H^`^.
The fact that instabilities do not occur for dc's much above ^uu H is due to :having
Re' H dominated by the cold electrons for these values of {^. Away from exact
harmonics of SZ, ivliei^e H is appropriate for instability, propagation in;^ H,imag
fi^
..
^s
^^ l '^^
^..,._
3 `^
i
^^=.
.^(.{?
;`
^^
^.,,r
v
the limit T^ --^ 0 is possible only at tax = µup . This role of the cold upper hybrid ^ a
frequency has been investigated by Ashour^Abdalla and Kennel. (1976) and Gaffeyi.^
^-,r,
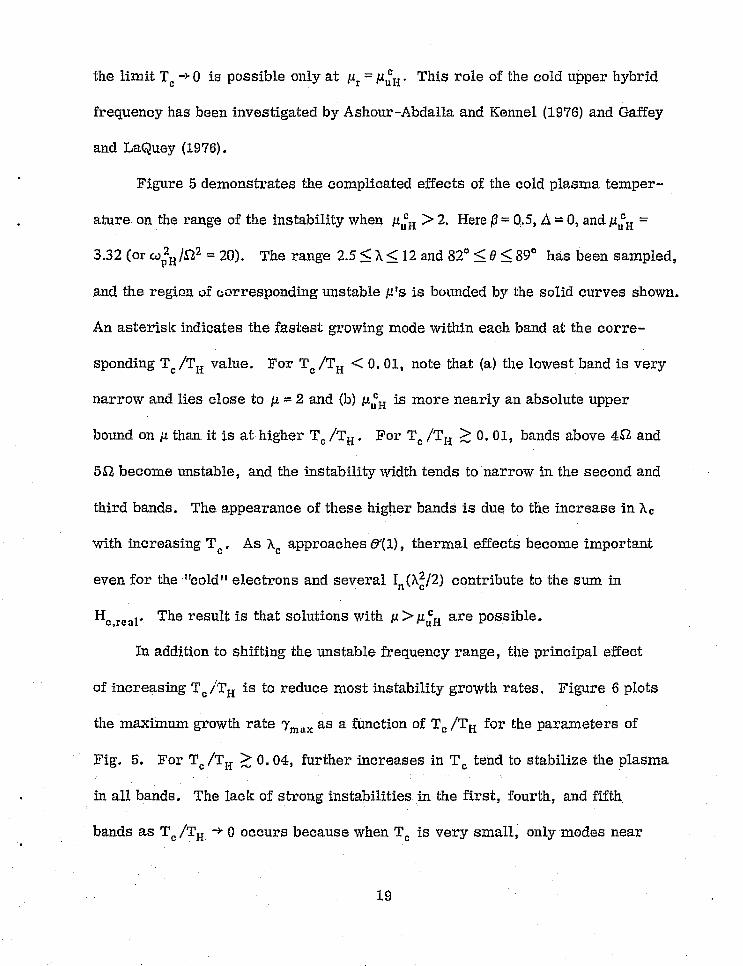
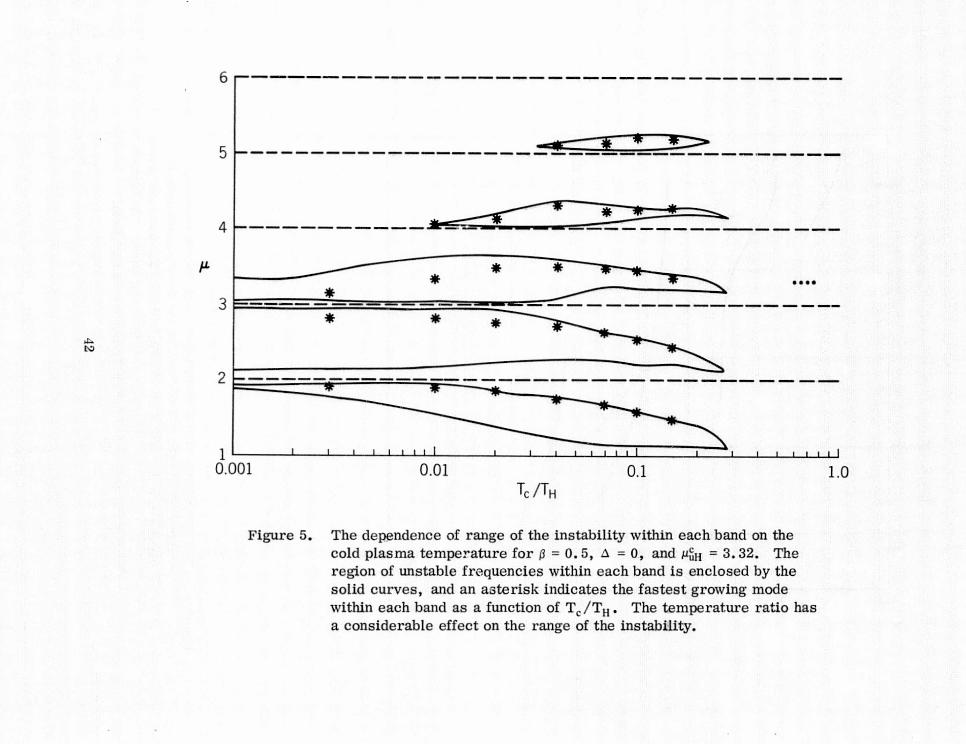
^{Figure 5 demonstrates the complicated effects of the cold plasma temper- '__
afore on the range of the instability when ku x > 2. Here ^ = 0.5, ^ = 0, and µk ^ = -,= .
3.32 (or w^ ^ f Sze = ^0}. The range 2,S ^ ^ ^' 12 and. 82° C $ C S9° has been sa^xapled, ' ^"^" ^
and the regi.nn of corresponding unstable oz's is bounded by the solid curves shown.
.An asterisk indicates the fastest: growing mode within each band at the corre-
sponding T^ /T^ value. For T^ /T^ G 0.01, note that (a) the lowest band is very
narrow and lies close to ^. = 2 and (b} ^^x is more nearly an absolute upper
_..._ -^__.___.^_-^...^....^._._a..^..'^
^°r-
/`Y;
and LaQuey (1976).
bound on µ thaa it is at higher T^ /T^t , For T^ /T^ ? O.O z, bands above 4SZ and
5S^ becorne unstable, and the instability width tends to narrow in the second and
third bannds. The. appearance of these higher bands is duct to the increase in A^
with increasing T^, As A^ approaches B'(1), thermal affects become important
even far the "cold" electrons and several in{A^/2) contribute to the sum in
HG,^.^ at . The result is that solutions with ^ 7^uu^ are possible.
In addition to shifting the. unstable frequency range, the principal effect.
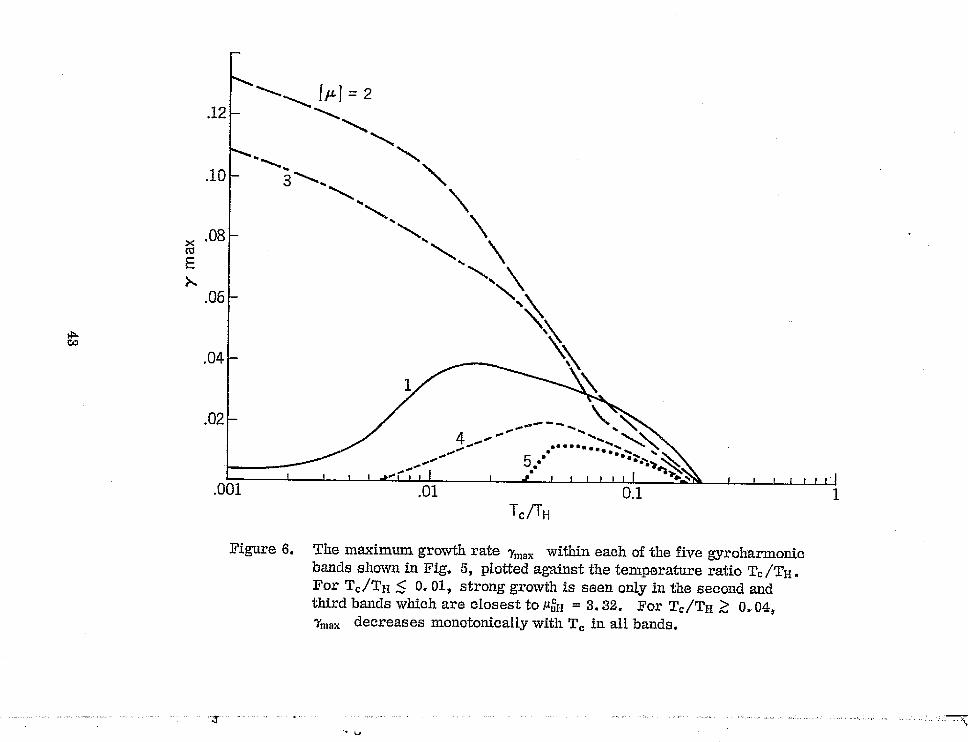
of increasing T^ j`T'^ is to reduce most instability growth rates. Figure Q plots
the maxi.inuxn growth rate 7mmx as a function of T C /T^ for the parameters of
Fig. 5. For TG /Ttt > 0, 0^, further increases in T^ ten.d to stabilize the plasma
• in all bands. The lack of strong instabilities. in the first, fourth, and fifth_
bands as T^ /T^ -^ 0 occurs because when T C is very small, only modes near
I9
^;,.31
'. ^.{L.
_. ..^ F
4 `^ _ -
^,
20
^ ^-^z..^w—..__._.,. _ _ --- _ _.r h
i
:; dux can have Iarge growth rates, The stabilizing effect of the cold plasma
^:vmperature arises primarily from the fact that Hc,ima^ (^) ^ 0 always. This
gives a Landau damping effect which opposes the HH ,^raag (µ) > 0 contribution
which drives the instability.
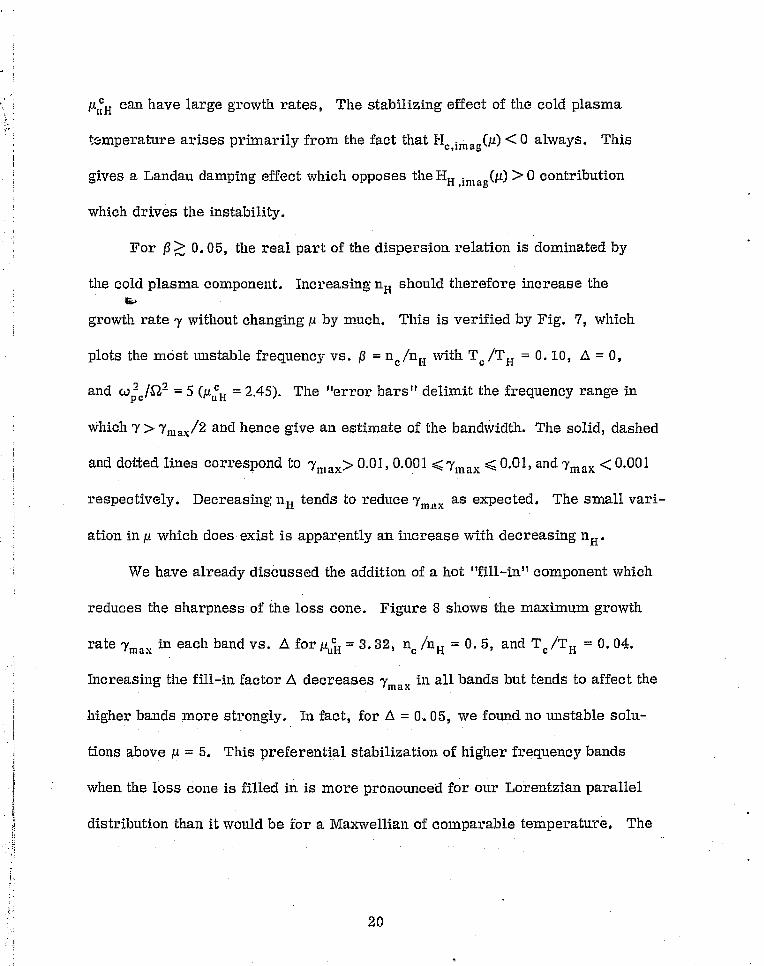
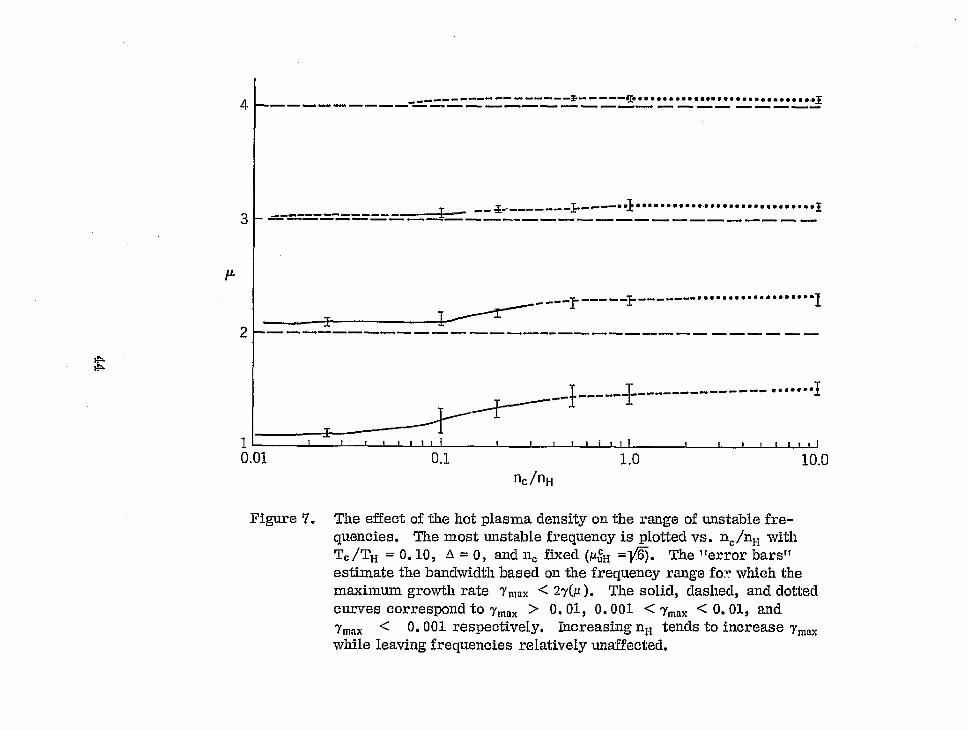
For /3 > D. D 5, the real part of the dispersion relation is dominated by
the cold plasma component. Increasing n^ should therefore increase the^:•
growth rate y without changing µ by much. This is verified by Fig, r, which
plots the most unstable frequency vs. R = n^ /n^ with T^ /T f^ = 0. T.O, d = 0,
and wP^^SZ2 = 5 (^cuH = 2.45}. The "error bars" delimit the frequency range in
^hi.ch 7 > 7m ax /2 and hence give an estimate of the bandwidth. The solid, dashed
and dotEed lines correspond to yniax^ 0.01, 0.001 C 7max ^ 0.01, and ymax < 0.001
respectively. Decreasing n^ tends to reduce ^rr^nx as expected.. The small vari--
ation in !^ which does exist is apparently an increase with decreasing nx .
We have already discussed the addition of a hot "fill-in" component which
reduces the sharpness of the loss cone. Figure 8 shows the maximum growth
rate 7max in each band vs. ^ for ^uH = 3.32, n^ /n H = D. 5, and T^ /T^ = 0. D4.
Increasing the fill-in factor d decreases 7max in all bands but tends to affect the
higher bands more strongly. In fact, for d = 0, 05, we found no unstable solu-
tions above p = 5. Tlxis preferential stabilization of higher frequency bands
urban the Ioss cone is filled in is more pronounced for our Lorentzian parallel
distribution than it would be ror a Max^vellian of comparable temperature. The
i
t
^,,^
^ ^^
' ^
^.►.. °^
i
I
-^.:^ ^.,;
^z .1
;i
^.
^:
^1
^..^_ : _^_._______ _^, _. _ _ . _. _ 1 __ _ ^._^_ _^.
fill-in component reduces growth rates because its contribution to H^ ^ lm ^ g (^) is^5
^^ always negative.,a
I`igures ^-8 reveal some of tlae complexities of the dispersion relation.
' The grass effects of changing each of the major plasma parameters are surn--
^`' _ marized below based on these rigures and an investigation of a much wider
1 range of parameters,
Cold plasma density. The cold plasma density n^ primarily determines
the cold upper hybrid frequencyuuH and hence governs the number of unstable
frequency bands. The highest unstable frequency Amax always lies below dux
. t'S'hen Amax C 2, but it may be slightly above µ^^I if Amax ^2. Zf a particular band
is unstable at some value of ^uH , the frequencies within that band will increase
i.f n G is raised further.
trot plasma density. The hot plasma provides the free energy to drive
the instability. Growth rates tend to increase with nH , but the unstable fre--
quency range is largely independent of n^^.
Cold plasxo.a texnperature. The role of T^ /T^ is a complex one. As
'' T^ /T^ -^ 0, large growth rates occur in the one or two bands closest to dux
;'while other bands have much smaller growth rates. Low frequency bands
^:;: {whose frequencies ^ satisfy (^cu x - ^^c]) ^ 1) occur near the top of the. band analt
have small bandwidths. For T c /TH > 0.01., one or t=NO bands above uux may
^ become unstable. At high cold plasma temperatures (0.05 < T^ /T^ C 0.2), the^^
,I
_ ^t^ i !
+
/'
, unstable frequency range in each band is shifted downward s and alI growth. rates ;^
are reduced. Al.l instabilities disappear for T /T > U. 2. '^^ ^ ^Y'=
a
Loss cane fill-in. Reducing the slope of f^ (v^) reduces growth rates in all - ^
frequency bands but tends to suppress higher frequency bands much more ^ ^'i
^• '^
severely than Lower ones. ^ ^ {
^.
T -'.
,^ In the previous section, we examined the effects of changing variousn
^^ plasma parameters in our model on the solutions to the dispersion relation. We
ir now proceed to use this information to i^afer plasma conditions which produceL
instaE^ilities in the appLupriate frequency ranges for each category of emission
defined in Section I.I. The fact that we are successful in achieving this goal byr
variations in a single plasma model strongly supports the validity of the model.
This single plasma model hypothesis is also suggested by the fact that there
often seems to be a smooth transition in the imp 6 data from one emission cate-
gory to anot?^+er {Shaw and Gurnett, 1975}, We feel that the model is sufficiently
successful that it can be used in a predictive fasl^.on to ix^.fer the unlmown cold
plasma density and to a lesser extent the cold plasma temperature and loss cone
! fill-in factor whenever gyroharmonic emissions are obsexved.
IIsing Section IV as a guide, we picE^ for each class of emissions acam-z
bination of parameters w 2H , n^^na , Te^T^, and A which produces frequencies andSZ
bandwidths characteristic of that category. Sy varying A and @, we determine
the largest 7 corresponding to each unstable ^. and thus construct curves of
maximum growth rate as a function of frequency. These curves should repro-
duce the features of the emission class while having realistically small. growth
rates. Using Ashaur-Abdaila and Fennel (1978} as a guide, we require temporal
growth rates to satisfy y c 0.01. Although we have not systematically calculated
convective growth rates as was done by Asliour-Abdalla and Kennel, such low
23
^^^ ^__ `__ ''^.
^^:
^:.
i
^_
^.:
1,
l ^t^; ! ^ 1
.. ___
i ^.
i
temporal growth rates usually produce realistically small convective growth ^
rates (klaiJSZ ^ 1 where 6^^ is the spatial growth rate}. ''t^'
From Figures 4 and 5 and from Ashaur-Abdalla and Kennel (1976), the ^}
first two classes of emissions ("low 3/2" and "3/2") definitely requirer>
^mnx <µux• With somewhat less certainty we also infer that µu H C 2 and ,^..
0.05 <TG JTa C 0.2 when these Class 1. or Class 2 emissions are observed.
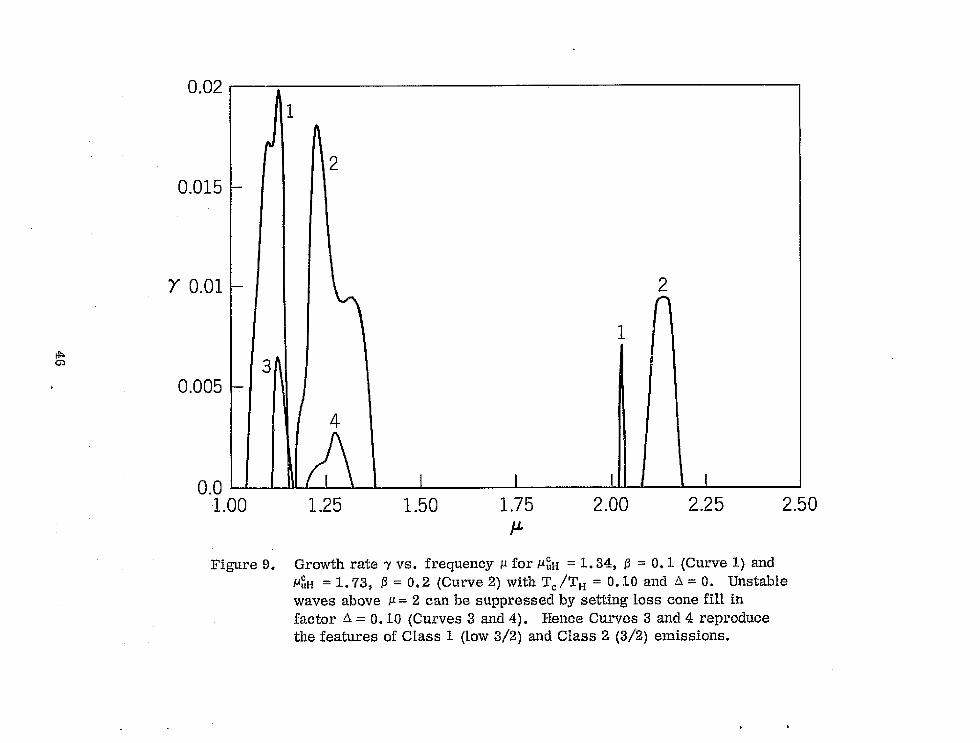
Figure 9 represents 7 vs, µfar µ^^ = Z, 34 (Curve I.} and F.t^ i^ = 7.. 73 (Curve 2) '
with 'I'C /TH = 0. YO and 4 = 0. Both curves show substantial growth rates above
u = 2 which can be suppressed completely by filling in the loss cone. The small ^
curves (3 and 4} within the growth rate profiles represent the same parameter`
i_^ ,'
set with the fill in factor d = 0. 1. Hence, curve 3 represents the growth rate { i
profile for a typical Class Y { max < 1.2) emission while curve 4 represents a -^
Class 2 (1.2 < µ < 2) emission. Bath curves have small growth rates and ^^^ mix —
narrow bandwidths. The Class 2 or "3 /2" emission could be shifted closer to
µ = Y, 5 by decreasing T^ /TFi or increasing µup .J
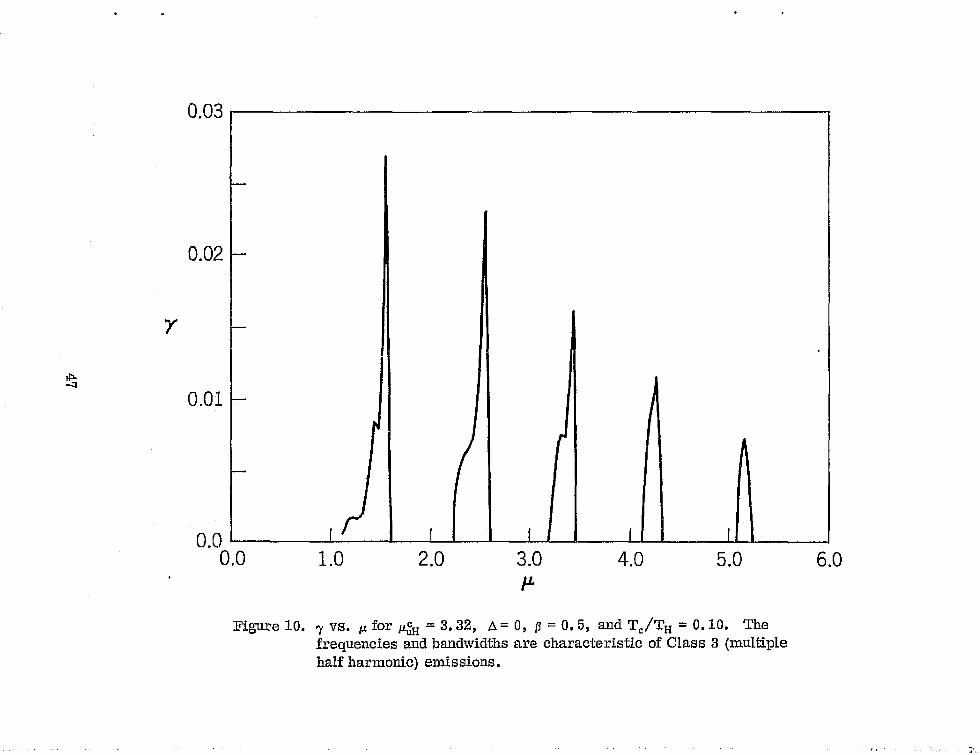
Figure IO represents an attempt to replicate the features of "multiple '
half harmonic" or Class 3 emissions. The cold upper hybrid frequency µux
3.32, D = 0, n^ JnH = 0.50, and T^/ T^ = 0.10. Higher cold plasma densities are re-
quired than for "3 /2" emissions, and large fill in, which preferentially sup-
'f
presses the higher frequency modes, cannot be tolerated. The frequencies and
bandwidths agree well with those shown in Fig. I, and the successively smaller
growth rates as one goes to higher bands axe in accord with the apparent mono--
tonic decrease in intensity of the bands in Fig. ^,. The unstable anodes which
occur just above u = 5 propagate at a more nearly perpendicular angle to B
{8 > ^^°) ^s^rhile lower frequency modes tend to propagate most strongly in the
' range 8Q° ^ 8 < 85°. Modes with B -^ 90° have small A^^n and have frequencies
very near the gyroharmonics. Instabilities in such modes tend to be stronger
with our Larentzian parallel distribution than with a Ma^wellian.
Since Class ^ o.^ diffuse band emissions almost always occur above 10 l^Hz,
and since we have not yet ez^amined any data above ZO kHz, we have not presented
a detailed parameterization of such emissions. kiawever, preliminary calcula-
Lions suggest that diffuse band :missions can also be explained by this same
basic electron model, and we are continuing to investigate this possibility.
Class 5 or f ^• fp narrow band gyroharmonic emissions can be achieved by
this model only if n^ ^> na . This condition arises because the model cannot pro-
duce instabilities witla frequencies much above feu ^ ,and for wp c = w^ to + w^ ° ?^ SL 2 ,
dux C wPt/^2 -^ 1 -- wPt /SL. In fact, i.f the cold upper hybrid frequency is
exactly equal to t[^.e total plasma frequency (^cun = wpt/SZ), one can easily Shaw2
that (^ - ^2 -- 1. It is w^ t which is deteran9xx.ed frarn the lower cutoff of the
trapped enntinuunz radiation. ^ Amax ^
Sufi ha r+'ig. 2, then. the model requires
n C /n^ ^ ^0 since f^ ^ 9f^. However, we have seen that if T G ^ d, frequencies
somewhat above the cold upper hybrid can be generated and hence a smaller
n° /n^ ratio would be permitted. In same cases, gyraharmonic bands similar
25
_- . ^ ._...r:..- ^.
26
l .. ^ .:.. _., ... .^, _, _ T .. ^__
-r
^ C__ i ^.
to those in Fig. ^ are displaced just above f p ; this situation requires a larger
^; ^ n^ /nfi than the one with gyraharmonic emissions at or just below f ^,
figure 1J. shows that gyraharznanic emissions at or above f p can be pra-
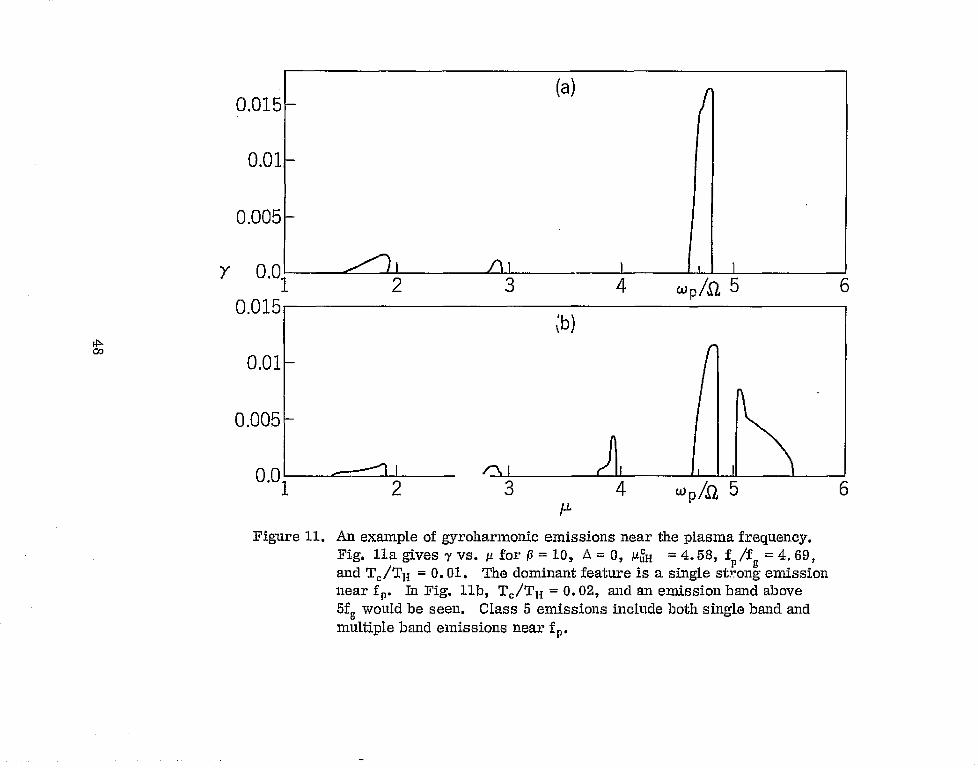
doted if n^ /n^ is sufficiently Iarge. Since there is Less free energy available
from hat electrons to heat the cold plasma and since large cold plasma densities
tend to reduce growth rates, the ratio T^ fT H is probably smaller far f ^- fn
emissions than far "8 /2" emissions. In Fig, IIa, in which n^ /n^ = 10, T^ JTH =
0, 01, ^ = 0 and dux = ^f 21 = 4.58, a single narrow band emission near
fp = x/22 fg = 4.G9 f^ is the dominant feature. In F?g. I1b, the cold plasma tezn-
perattzre has been raised to T^ /TH = 0, U^. An emission band appears above
,^ = 5, the band just below ^ = 4 might also be observable, while the band nearest
f^ has a lower growth rate than in Fig. 11a, This I`igure suggests that (a)
emissions which axe clearly above and separated fxom f p , such as those in Shaw
and Gurnett (1975, I'ig. 4) are possible with this model and (Ia) the appearance of
ts^vo or three bands Haar f ^ requires a higher T^ iTa than a single emission band.
Multiple bands just below f p , such as those shown in Fig. 2, require a somewhat
smaller n^/n^ than the value used in Fig. 11 (e. g. , n^ /n^ w 3 instead of ].0).
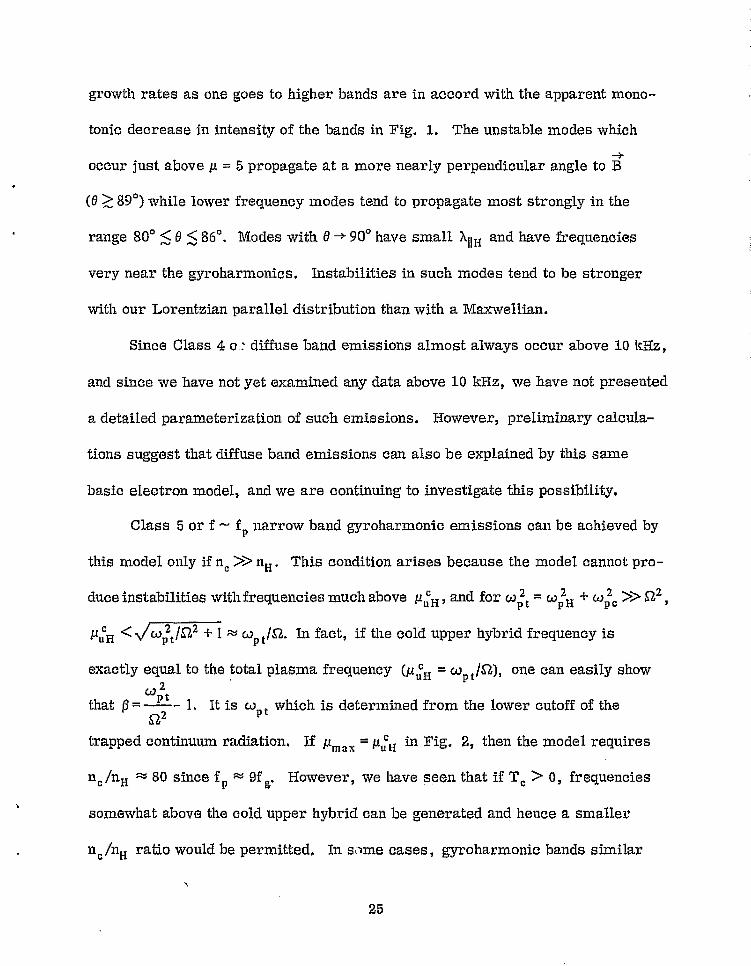
The results of this section are stmnmarized in Table 2, which gives a
reasonable estimate of the plasma conditions which we believe produce each
type of emission, The "3 /2" model is in essential , a^;'reexnent with Ashour-
Abdalla and Fennel (1976). -This 'fable can be - used as a crude diagnostic tool
whenever gyroharznonic emissions are observed on a particrzlar spacecraft.
R
Class Frequency Range !^^ ^ = I + c^^ JS^^^ Comments
1. Lou+ " 3 J2" 1 < f/f^ < 1.2 f ^ ax n^ Jn u CC 1 (typically 0.1 }^^ < µ^ H ^ 1.5
0.05 < TG JTx < 0.15
^ < 0.1 (some fill in of loss canedistril^utian}
2. "3 J2" 1.2 < fJ g C 2 fm ax Jf^ < ^u ^ < 3 Essentially same as Class 1 l^ttt ^vithlarger cold plasma density
3. "n+lJ2"multiple fmax /g>2 fmaxJfg^^uH llcJnr^<1,0.05<T^JTH<0.15half harmonics ^ ,.; 0
^. "Diffuse Band" 1.5 < fmax lf^ <^' fmax Jfs `" uux n^JnH > 1 (?}
fmax ." fp (?} TeJ^;E "' 0.01 {?)
Requires fttrtlier study
fi. "f ,,, fp" narrow band fa <C fmax "' P ^c ^ ^" fp n^ Jnr.^ > I (» I (?)}
T^JTH < 0.02, d -- 0
^^'.
,.
i
f
1
-.,`
^
g$1
VI. THE DIAGNOSTIC USE OF OUR PLASMA MODEL ^
We have shown in the last section that each of our 5 categaraes of odd-
half-harmonic waves can be explained by suitable variations of parameters in a
single plasma model, Table 2 surz^.marizes the specific values or narrow ranges
of nG /nH , T^/T^, and D characteristic of each class of emission. We suggest
here that g^yroharmonic wave observations be used in con^unetion with Table 2
and magnetometer measurements of the steady B-field as a diagnostic tool for
determining local plasma parameters. We respond to the potential axgument
that the observed waves are not generated locally by pointing out that electro-
static oscillations, unli6ce electromagnetic radiation, are rapidly damped as
they propagate into regions which are not at Ieast marginally stable to their
growth.
The plasma parameter which is mast definitively determined by observing
odd-half-harmonic emissions is ^uI.i In this section we shall develop further
its relationship to emission frequencies, first by presenting in more detail re-
suits of our theory and second by applying these theoretical results to observa-
tions, bath individual and statistical, made by the Imp--G experiments. These
observations are all consistent with our theory.
'While it is sometimes possible to deduce n^ by measuring n t from the
continuum cut-off and subtracting the warm plasma density as measured by
particle detection experiments (Garnett and rrai^It, 19?^), this method ;becomes
inaccurate when n^ « nx, The results of our calculations, previop,s .
^^^:}
^^
F,j
2^
s^
L,.,,.
{
^^
^;
1^
theoretical work {^.roung et al, , 1973; Ashour-Abdalia and Kennel, 1 g76), and
the one observation presented by Gurnett and Frank {1974) all suggest that
n^ /nF! « 1 is a necessary condition for 1 '3/2" emission to occur, ^zrther- ;l;^';a^z
mare, the appearance of these "3/2" waves is very common in the outer mag-
netosphere. ^Te conclude therefore that the use of the subtraction technique to r:-
.^.,.calculate n^ is frequently a suspect one.
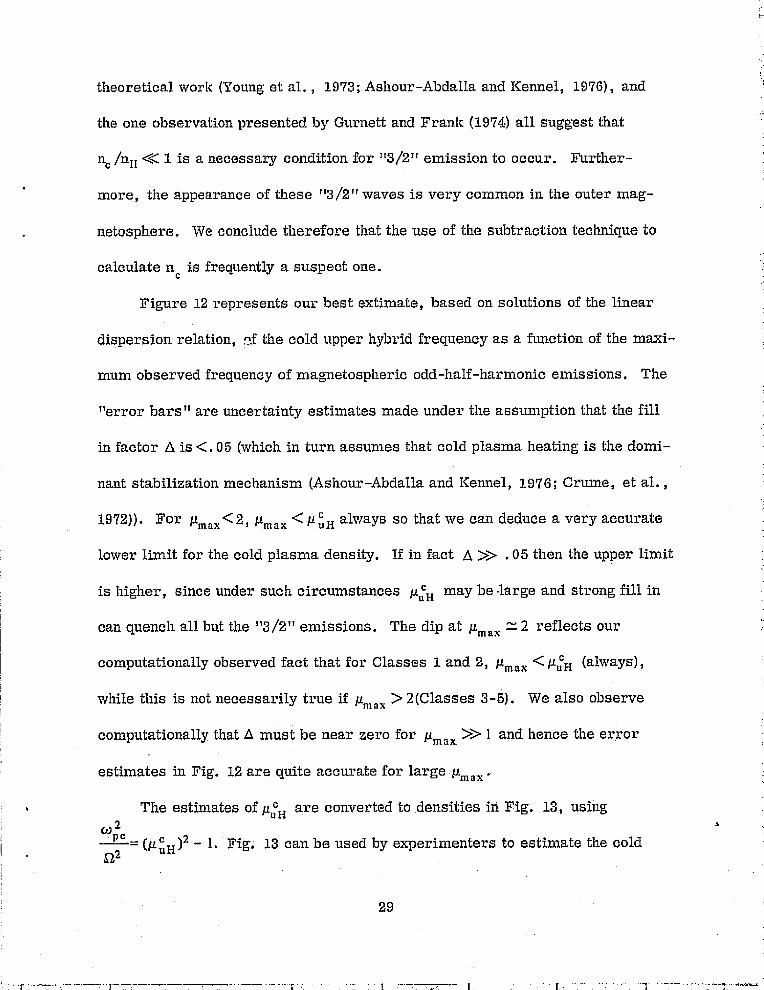
Figure 12 represents our best extimate, based on solutions of the linear
dispersion relation, ^f the cold upper hybrid frequency as a function of the maxi•- ^
mum observed frequency of magnetospheric odd-half-harmonic emissions. The
"error bars" are uncertainty estimates made under the assumption that the fill
in factor ^ is C. 05 (which in turn assumes that cold plasma heating is the domi- ` '`^
nant stabilization mechanism (Ashour Abdalia and fennel, 1976; Crume, et al. ,
^.97^)). For 1'^max C2 ^ 'ma x C^'uIi always so that we can deduce a very accurate _^
lower limit for the cold plasma density. If in fact Q » . 05 then the upper limiti
is higher, since under such circumstances ^'ux
may be •large and strong fill in
can quench all but the "3/2°' exiaissions. The dip at 'max =2 reflects our
1
computationally observed fact that for Classes 1 and 2, Amax <µu^ {always), {
while this is not necessarily true if Amax > 2(Classes 3-5). WE also observe ^r
computationally that D must be near zero far ^ttmaX » 1 and hence the error
estimates in Fig. 12 are quite accurate for large u ^maa'
J_ _J fi N
plasma density whenever gyroharmonic bands are observed. When the con-..
s,,
?' tinuurn cutoff is simultaneously observed, one can estimate n^ = nt -' nc • It is
usually possible to estimate Amax to within 5% using the electric field data and
the measured local magnetic field strength.
We have previously stated. that Class 5 (f ^' f p gyroharrnonic) emissions
with f p » f^ probably require n^ » n H . Whereas Classes 1-3 emission tend
to occur during geomagnetically disturbed tunes when n^ /n^ is expected to be
small in the outer magnetosphere (ef. Anderson & Niaeda, 1977}, Classes 4
and 5 are most common during quiet times (Shaw and Garnett, 1.975) when this
ratio is more likely to be large, as predicted by our theory. We predict that when---.
ever f ^^ fp gyroharmonics are observed, n^ is anomalously high. At such times
ione would expect that particle detection experiments which measure particles only
above some ^nzni.anlun energy tlzreshold can give a significantly Iower electron
density thazi the density measured from the trapped continuum lower cut-off. We
are currently investigating tlae data for verification of this hypothesis.
Our discussion of the variation of n^/n^ from class to class is pretty much
independent of the precise form of the electron distribution function, so long as
it has s. cold component and is 3.oss cone unstable. Such is not the case with T G /TH
and Table 2 should be used ^^ • :th accordzng caution. The hot distribution function,
which we have used for our calculations has a loss cone which is unrealistically
large for the real outer magnetosphere. Amore plausible distribution vuith a
peak in f^^ at a much smaller value of a 1 (relative to d1H } can. likewise be
^^ ^
-
i
^,
i
ss ,
i^.
unstable {Young et al, , x.973}. The characteristics of the instability depend
_ , N strongly on the positive slope (8f^/8v! > 0) portion of the distribution function
-'' and are virtuall ande endent of the tail 8f av C 0 so lan as it is "
...^ y ' p { lj ^ ) g gentle.
^^ In applying Table 2, T^ should he interpreted as the effective temperature
^ ^v z
^' Tx eFf "" kmax corresponding to the speed at which f^ ma_ximizes, since theB
important Iow v^ region can generally be fit by a DGH distribution of the type
we use. An important consequence is that given a hot electron component with
a Z [^eV thermal spread typical of the plasma sheet, Tx eft can be 100 eV or
smaller, and hence from Table 2 T^ ^^ ZO eV, a realistic value for plasma of
plasmaspheric or ionospheric origin.
i±
1
i
ii
S•F
,'
)^'.
ii ^{
F ^ ^^^...
i
ia
The use of Fig. Z3 and. Table 2 as a diagnostic taal can be illustrated using
Figures ^. and 2. The emissions at 07J . 5 of Fig. 1 are Class 3 (multiple half
harmonic emissions) with umaY = 6.1 and fg = Z. i5 i^Hz. (All B values are
obtained from the GSFC magnetometer data.) Hence, we estimate
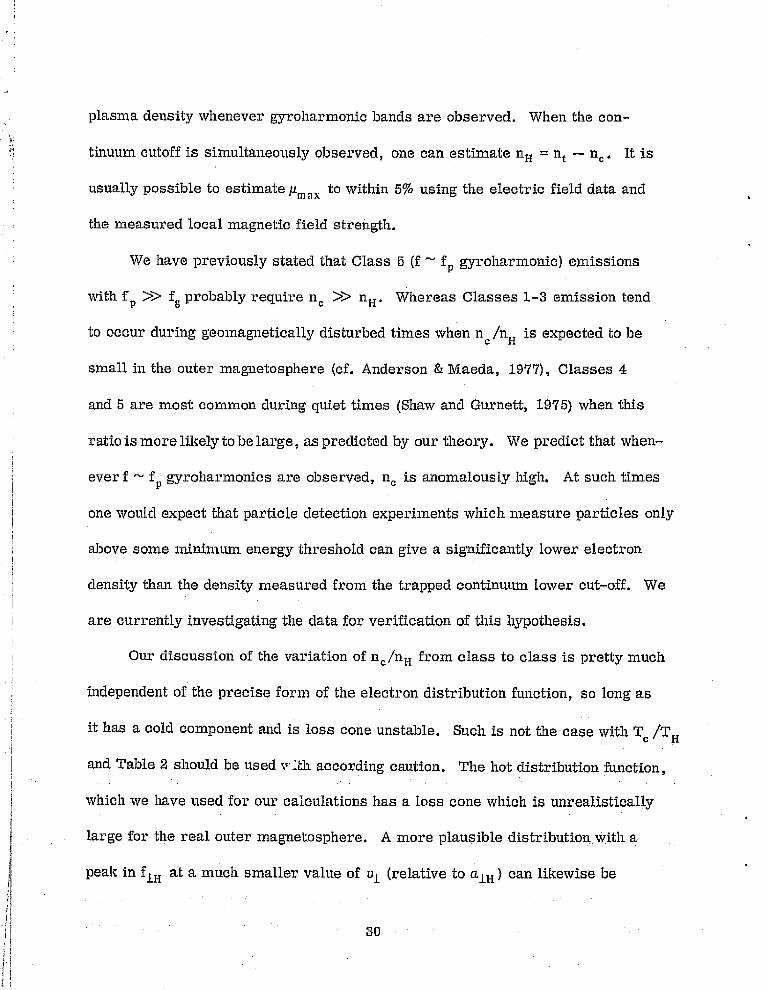
wp^/S^ z ~ 30 from Fig, i3, and therefore n^ ti 0.5 cm^3 . From Table 2, D - 0
and 0.05 < T^ /T H < 0.2. Trapped continuum radiation is not observed, so the
total electron density is not available. Figure 2 is a Class 5 emission with
Amax ^ S. 7, fg = . 70 [MHz, and f P = S.4 I{Hz = 9. 1 f^ at 0537. Using Fig. 12 as
a guide, we estimate u^ x - $, so n^ ^- 0.38 cm"s . Since the total plasma density .
(fiom £n ) is 0.50 cm_3 , the ratio n^ /nH ^ 0.380.12 ^ 3 .2. When n^ » n^, the den-
, sity .ratio predicted by this method zs quite sensitive to the estimate of dux .
tram Table 2, we estimate. T^/TH ^^ 0:02 and d = 0.
3I.
^_ -_ _..-- -
_ ^, ^ .. r
^ I _ I I 1--^ - ^,^
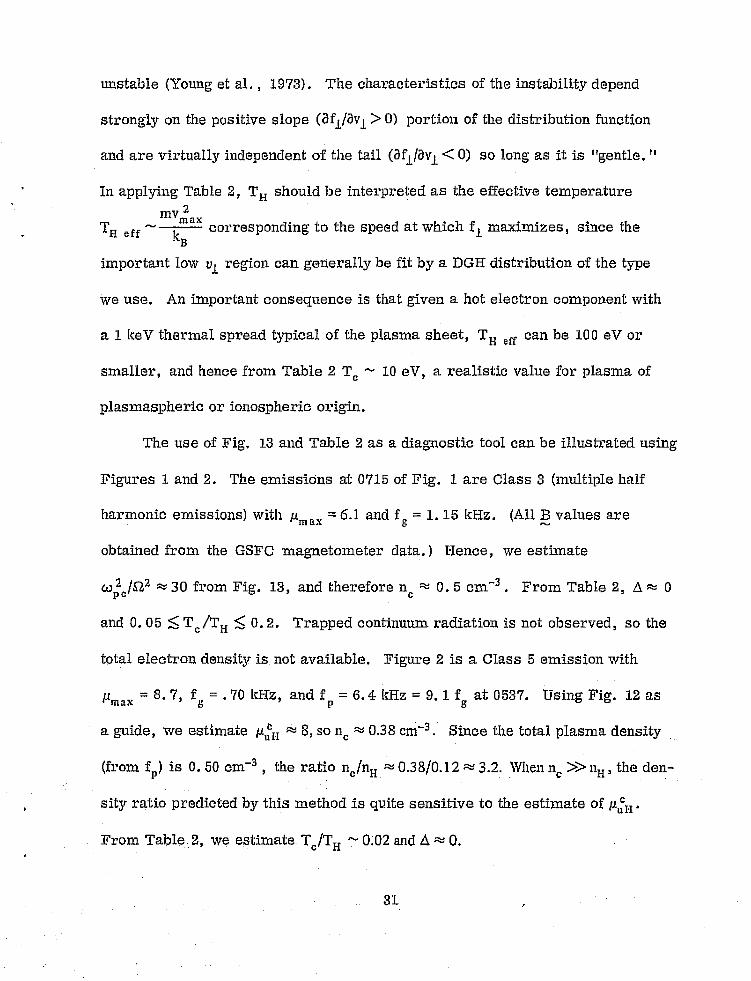
.gFigures 12 and 13 are also supported by a statistical survey of the data ^
taken from a number of orbits. Figure X4 shows as a function of f g the ^iighest ,^.
s value of f/fa observed during 15 minute intervals from orbits 178 through 183 ^^'
1of Imp_6 whenever odd-half-harmonic waves are present. The data were all -,Y
f A
^tal^en on the day side of tl^.e outer magnetosphere at moderate magnetic latitudes i"""i
(20° C IAm I C 55°}. The tendency to see higher relative frequencies when the gyro- IE
frequency is low can be understood if the cold plasma density changes much more
slowly than fg once the spacecraft- is more than. --aJ.R^ beyond the r^lasmapause.{
` 1 In that case, wp° JSZ^' and hence µum will tend to increase as f g decreases, and the ^"}
theory predicts that higher values of µ (and hence more bands) maybe observed.^^ ^
^ The data used ili Fig. 14 also suggests tllatµmax decreases at high magnetic.,
', latitudes ^m . We divided the data into high {^A m I > 40°} and iow {^^m I <40°} rnag-
netic latitude cases. 82% C28 of 28} of the Iaigh latitude observations were Class
1 (µmax C 1.2) emissions. However, only 53% C^9 of 55} of the low latitude ob-
servations were Class 1, and all of the Class 3 (µmax ^' ^} observations were at
low latitudes. This effect can be theoretically interpreted using our model. At
constant radial distance li/H^ , f^ increases and n^ is probably constant or de--
creasing at high latitudes. Hence µui.^ and thus µmax would tend to decrease.
This probably accounts far the preponderance of Class 1 (µmax < 1,2) observa-
'^ tions in the Imp-6 data. Explorex 45, which always remains at low latitudes,
' observed more of the traditionalµ~. 3/2 emissions (R. R. Anderson; private ^ '.
communication}. ^ ^
I^
I^ k
32
^:,^i'^,^
tI^^_ __..... _^^ . . ^ ^ ^^
. ^; ! ^ ^ , ^
z
f;
:j
33
---^ ^---
j F ^ 1.
VII. CONCLIISIONS
We have conducted a theoretical analysis of the banded electrostatic
emissions which occur between consecutive harmonics of f^ in the outer mag-
' netosphere and have compared our theoretical predictions with Imp 6 electric
and magnetic field data. Our results are summarized below.
First, we have constructed a scheme for classifying these emissions
(Table 1) . Our fig►e categories include the widely studied add-half--har^rnonic
emissions as yell as the waves reported by Shaw and Gurnett (1975). Second,
we have extended successfully the linear plasma model of Young, et al. (1973)
and Ashour-Abdalla, and Kennel (197?, which can explain "3/2" emissions, to
the other categories of emissions. Our results indicate that a single plasma
model consisting of a hot loss cone electron distribution and a cold electron
component can generate instabilities in the frequency ranges appxop^°late to
each category. Hence, all of these emissions appear to arise from the same
physical mechanism. Figure 13 and Table 2 can be used as diagl^ostic guides
for estimating the cold plasma density and temperature whenever banded electro-
static emissions are detected. Finally, our results indicate that certain types
of emissions require the cold plasma density n G to exceed the hot plasma density
nH . Hence, although the hot loss cone component usually dominates the density
in the outer magnetosphere, there are times when n^ » n^.
^,...
^ ^ i ^^^,.
3^
^ I_ I .^^ __^
,^t
ACKNOWLEDGMENTS
We have made ample use of Imp 6 results from tine VLF electric field
and magnetoxxa.eter experiments, and we thank the principal investigators, D. A.
Gurnei:t and N. F. Ness respectively, lc. addition, we would. like to acl^n.owledge
useful discussions, advice,. and assistance from R. R. Shaw and R. R. Anderson
of Iowa, and P. Rodriguez and D. H. Fairfield of GSFC. Qne of us (R. F. H.
was supported in part by the Atmospheric Research Section, National ScienceY
Foundation.
3
y ^ .... ^.
35
^,^^_ Anderson, R. R. , and I^. Maeda, VLI' emissions associated with enhanced 1
c magnetospheric eiectrans, J. Geophys. Res. , 82, 135, 1977. ^^^•^
w ^.^i
',
Ashaur-Abdalla, M. , G. Chantetlr and R. Pellat, A contribution to the theory ^r;
6 }
;.. of the electrostatic half--harmonic electron gyrofrequency waves in the
,,.,:magnetosphere, J. Geophys. Res. , 80, 2775, 1975.
f_ ^.
^ ^
Asl^.our-Abdalla, M, , and C. F. Fennel, Convective electron loss cone insta-
bilities, U. C. L.A. Report PPG-263, 1976. y
Baldwin, D. E. , I. B. Bernstein, and M. P. H. Weenink, l^inetic Theory of
• Plasma Waves in a Magnetic rield, in Advances in Plasma Physics,i
^ ^Vol. 3 (ed. A. Simon and W, B. Thompson}, Interscience, New Yarn, ,
3
1969. l
Burtis, W. J. , and R. A. Helliwell,. Banded chorus: Anew type of VLF radia-
tion observed in thrY magnetosphere by Ogo 1 and Ogo 3, ^7. Geophys. Res. ,
74, 3002, 1969,
Crump , E. C. , H. K. ll^f Bier, and O. Eldridge, Nonlinear stabilization of
single, resanar^t, loss--cone flute instabilities, Phys. Fluids, 15, 1811,
1072.
Dory, R. A. , G. E. Guest and E. G. Harris,. Unstable electrostatic plasma
waves propagating perpendicular to a magnetic field, Phys, Rev, Lett, ,
14, 131, 106 5. J
t
s
sti
is
I
field emissions about the electron gyrafrequency, J. Geophys. Res. , 78,
310, 1973.
Gaffey, J. D. , Jr. , and R. La Quey, Upper hybrid resonance in the magneto-
sphere, J. Geophys, Res,, 81, 595, 1976.
Garnett, D, A. , and L. A. Franl^, Thermal and suprathermal plasma densities
in the outer naagnetospliere, ^^, Geophys. Res. , 79, 2355, 1974.
Garnett, D. A, and R. R. Shaw, Electromagnetic radiation trapped in the
magnetosphere above the plasma frequency, J. Geophys. Res. , 78,
8136, 1973.
Harris, E, G. , Unstable plasma oscillations in a magnetic field, Phys, Rev,
Lett. , 2, 34, 1959.
1^ennel, C. F. , F. L. Scarf, R. W, Fredricks, J. H. McGehee and F. V,
Coroniti, 1970, VLF electric field observations in the magnetosphere,
J. Geophys. Res. , 75, 6136, 1970.
Lyons, L. R., , 1974, Electron diffusion driven by magnetospheric electrostatic
waves, J. Geophys. Res. , 79, 575, 19'74.
i
._ _. -:
^R^
^ _ -
;.
;,
A:
c.
3G
^r '^ ^ r
'^:
Fried, B. D. , and S. D. Conte, The Plasma Dispersion Function, Academic, ¢ i
- i
New YorEi, 1961. _f ,,:-^^
Fredricks, R, W. , Plasma instability at (n + 1/2}f ^ and its relationship to ^ ^`'
some satellite observations, J. Geophys. Res. , 76, 5344, 1971.. ^^`
Fredricks, R. W. and F. L, Scarf, Recent studies of magnetospheric electric '.u.
Maeda, K. , P. H. Smith, and R. R. Anderson, VLF emissions from ring
current electrons, Nature, 263, 37, 1.976.
Oya, H. , Turbulence of electrostatic electron cyciotxon harmonic waves
observed b3' Ogo 5, J. Geophys. Res. , 77, 383, 19'72.
Oya, H. , Plasma flaw hypothesis i.n. the magnetosphere reiat9ng to frequency
shift of electrostatic plasma waves, ^'. Geophys. Res. , 8D, 2753, 1975.
Shaw, R. R. , and D. A. Garnett, Electrostatic noise bands associated with
the electron gyregrequeney and piasms. frequency in the outer magneto-
sphere, J. Geophys. Res. 84, 4259, 1975.
Tataronis, J. A. , and F. W. Crawford, Cyclotron harmonic wave propagationf
and instabilities, J. Plasma Phys. , 4, 231, 1970.
Young, T. S. T. , J. D, Callen and J. E. McCune, High-frequency electro-
static waves in the magnetosphere, J. Geophys. Res. , 7S, 1082, ].973.
Young, T. S. T. , Destabilization and wave-induced evolution of the: magneto-
spheric plasma clouds, J. Geophys. Res. , 80, 3995, 1975,
3?
_.
,,
t
Iir
t^:.;^^
^: ,..,
.w..
--
8 - G77-61
1MP-6_...: U OF IOWA PLASMA WAVE EXPERIMENT
ORBIT [78 MARCH 19, 1973
^-- 4 ,
4^.
V t 4 v ^ 1
W^.3..^
Q
^ r : E r- rtW^.. ^"'^.^ tii+" t" ,. r"" 3 ' .t^"11e ^ l^ ^+
_. 1'ir . ^4+ ^r _. -.,^^,
!^ .1 ^I , ^ ^t $^'.N^v1 C!-....^ ^ hl(^' YMI+ - ^ ^^'^^./ `r.r. U'1 ^1
^ [d^F+^.+^-+^1'^n ^ li t_,ri i^^ illur S n l^ +S r-+ I ^ -I^^ i1 l ^ 1 I Ir ^y.^,1^^-' -^^ 1 -^ .^f.
uT o7ao 0730
1 00"r^ -^ I/2" fg EMISS[oNS bfg =1.15 kHz ^^
^ro^^.. ^
r^.gure ^.. An e^ampie of multiple half harmonic emissions observed by IlVIP G at R z 9R^ on the day H
side of the magnetosphere. As many as seven gyxoharmanic bands are simultaneously ^ ^observed. The intense T '3/2" emission which occurs }aetween I and 2 kHz at 0700 isalmost continuously observed from 0500 to 0800. The emissions below 1 kHz are electro--magx^etic and are not considered in this paper.
w,.r.^„^.•wi
...
•,.., ^^1
.^'
---
^.,
Nz =
d QW'^ oL.L4^.
UTR (RE)
a^
M LT
1MP-6U OF IQWA PLASMA WAI/E EXPERIMENT
ORBIT 84 FEBRUARY 21, 1972
r^_^_ ^`t ^ k4^.y^,^ ^' ^ ^ ^_ 2,^Tk^i' gip' ^ ` F ^^' [[ s^"'7^'i l
^ ^ A
E n ^ _ ja.. G i,:^ tf
aa iS:.^,
^.
^^' ^`^ ^"^fil + ^ irk :,,,_ ^ , .p ,4,
_ I , ^, ^
u.l
0520 0530 0540
10.9
27.2° f-^ f^ GYROHARMONICS
I I.0 f9 = 0.70 kHz
o^figure 2. An example of gyroharmonic emissions occurring near the electron plasrria frequency f^ . o
The shaded region is trapped continuum radiation «hose lo^t•er cutoff is f^,. Up to three o
gyroharmonic bands are observed. ^ tom''
^ ^^^
4 .^
...^,^::,;^;^.>;.^,,,;^ ^ ^:: .,gin.:. ,::^;
.^ .^,,.
_.._ . ^- x^ ..,_ ..,^
^-*^^
^ ^ _ i:^I ^_
---^ MAXWELLIAN ------ P=2 LORENTZIAN
----- P = 1 LORENTZIAN ------- P = 5 LORENTZIAN
1.2D
1.00
0.00
^_
^ 0.60^-
0.40
0.20
0.00 ^ -' • -. .^ . - r.^
-4.00 -3.00 -2.00 -1.00 U.O^ 1.00 2.00 3.00 4.00
II I all
Figure 3. A comparison between a Maxwellian parallel velocitydistribution and the corresponding p t}' order Lorentziandistribution. The p = 2 Lorentzian has a similar shapefor Va l < a^^ but has more i;igh energy particles thandoes the Ma^-tvellian.
1
Y;9
^^
40
1
^ ^_ r r
J
4
^3.;
2
r ^
00.2 0.4 0.6 0.8 ^..0 ^
nc/n H ^
riguxe 4. The dependence of the frequency ^, = f/f^ of ^e fastesi growzng modewithin each gyroharmanic ]nand on the cold plasma density. Theparameters W /SLZ = 2Q, T^/T^3 = 0.04, e = SG°, and ^ = D. Asn^/n^ increases !^ increases within each band. The highest frequencytracks the cold upper hybrid frequency {dotted lire}.
4x
^^
1- ! ^ ,^1 ^^ ^.
^;
^^
5 -------------------------------•-----
q—_.—.---------^^ --------- -----
3 — -- — --^ ^
µ
3
^~
......,>.._.^>.,^,.^.^,^.,..,Y....^.,.^..^..... . _^^—
6 r----------------------------------------
2 ^---- --
I
1 --t i i i t i l t i i i i t t t l^-- .^^
o.00^ a.ol o.l I.o3
T^ /TH
Figure 5. The dependence of range of the instability within each band on thecold plasma temperature for a = 0. 5, D = 0, and ,^„ f ^ = 3.32. The
region of unstable fr, quencies within each band is enclosed by thesolid curves, and an asterisl: indicates the fastest growing mode }tivitlun each band as a function of T^ /T H . The temperature ratio has ^a considerable effect on the range of the instability. e
;, ^•--,,
3`
^^ ^1^^ - ^.32 ^,^
.^ ^
^ ^`^ ^ a
^ ^, ^^ ^^
.o^ ^,^
^^-^--- ^ .Q4 ^^
1
.fl2 -__-__^^- ^ .
4 -- ^-. \^^^ ^ ^?^
.UV^ .V1 Q.^ ^ {
Tc/^H
4f
Figure 6. The maximum growth rate 7max within each of the Niue gyroharnaoxucbands shown in Ii'ig, 5, platted against the temperatcare ratio Tc /Tx .r`or T^jT^ < 0< 0^, strong growth is seen only in the second andthird bands which are closest to ^nx = 3.32. Far Tc/T^ > 0.04,
.,,,,^ 7max decreases monotonically with T C in all bands. ^'"'"`r.
.^
.„
'^ ;^:
,^.',^
,. ^ ,
^.
,i _--^--- ^----w- .......................^
rP
10.^1 0.1 1.0 10.0
nc /^M
-- Figure 7. The effect of the hot plasma density on the range of unstable ire-quencies. The most unstable frequency is plotted vs. n^/nH withT^ /T^ = 0.10, .^ = 0, anal nG fixed (µuu =^. The "error bars"estimate the bandwidth based on the frequency range for ^vluch themaximum growth rate 7max < Zy(!^ ). The soiid, dashed, and dottedcurves correspond to ym^x > D. DI, 0.401 < 7mux < 0.01, and
ymax < 0.001 respectiveiy. increasing n E^ tends to Increase ymaxwhile Ieavi.z^g frequencies reiatively unaffected.
'^ .x...
.04
.03
AMAX
.oz
.ol
^^^µ^=Z
-3 ^^
^^- ^^
^^^^^^ ^µ^=^
^^- ^ ^\
^^ ^.^
=^
^.
.05 .10 .!5d
Figure S. A plot of 7^ax vs. fill. in factor O in each of the five bands wluclaoccur when T^ /T IC = 0.04, ^uii = 3.32, acid n^/n H = 0.5. Growthrates in all bands decrease monotonically with ^, but higher fre-quency bands are suppressed most severely.
45
:^, ^;, ^. :_ ^ ...
Y 0.03. 2
I3_
^ 0.005
4
0.01.00 3..25 ^ .50 1.75 2.00 2.25 2.50
Figure 9. Growth rate 7 vs. frequency u for 1^ ;^-^ = 1.3^, Q = 0. ^. (Curve 1) and :Tu{ ^i = 1.73, !3 = 0, 2 (Curve 2) with T^ /T^^ = 0.10 and A = 0. Unstablewaves above ^ = 2 can be suppressed by setting Ions cone fill infactor d = 0. IO (Curves 3 and ^4). I^ence Curves 3 and ^ reproducethe features of Class 1 (low 3/2) and Ciass 2 (3/^) emissions.^_.
^-- - -
,_...._.. .... _-. _.., ..__.._ _....... _. ., r ._
1^ - - - - -
^^.^.-w
'^ ;r r
r.v _
XIJ ^-....^.^...^-_...-...«.......mac...-.^.....^ .___._.._,..^...._._. .`..-^.»-....-«..^...y^^.`a.t.--...,...__.....a.v. .....a-^..`.. _... _...._ i.., ...___...^
i
^^?.. ^r,
... ^„
^, 0.0 1.0 2.0 3A 4.0 5.0 6.0 -. ^
^,.: Figure ^.0. 7 vs. ^. for unx = 3.32, p= 0, Q ^ 0.5, and T^/T^ = 0.10. Thefrequenefes and i^andzvidfhs are charac^;eristic of Class 3 (multiple '`'^"'^`'^"'half harmonic) e^ni,ssions.
^.w^._ .... _, ..
•^ ,^ ;
^ ^ ^.. ,.^ ^, ,
I
^.,
-.7^a^
--tO.OI5
i
^ 0.0 ^.
0.005
Y 0.0^2 3 4 w /^ 5 6
'^ n n ^t ^ ^V.V^..J
`^l
rP fW0.0I
0.005
0.01. 2 3 4 w^ /^ 5 6
rigure 1].. An example of gyroharmonic emissions near the plasma frequency.Fig. 1.1.a gives y vs. ^ for' R = ^.4, ^ W 0, tux = 4.5$, fp /f^ = 4. BJ,and T^ /T IC = 4.41, The domuiant feature is a single strong emissionnear f^,. In I'ig. 11b, T^/T^^ = 4.42, and an emission band above5fg would be seen. Class 5 emissions include both single band andmultiple band emissions near fp.
,^--
"^ ^ :'
..^;
R
Z
^^
t^. Ef.
_ .. ., _
[t^'.
/
7
/'
^v
l
f
#^
^' i
5
6i
^ ^ ^ ^
a/4• ^
_
^ ^
j
y
! uH
^^4 !^ ^
a.,
^ T
1
2 3 $ 5 6 ^Is max
Figcre 12. An estimate, based on solutions to the linear dispersion relation, ofthe. cold upper hybrid frequency uuH vs. maximum observed fre-quency ^ The TOerror bars" are. uncertainty estimates assumingmaxd C 0.45.. 'i.'Iv.s figure - ca^a be used to estimate uax from electric andmagnetic field data •whenever en^.issians of any class are observed.
49
.^.. : .
^ tiao
^o
W ^.PC
O,i
^rnax
Tigu.re 13. The- estimates of Fig. 1.2 converted to wp^ /SZ 2 for eq^ivaiex^tly n^)vs, maximum observed frequency Amax . This figure can be used asa diagnostic tool to estimate the cold plasma density nC,.
50
E I I ^ J_ ^
5.ao
4.00
µ 3.,00 ^
^^
2.00 ^
0.0 2.0 4.0 6.0 8.0 1 0.0
GYROFREQUENCY kHz}
figure 14. A plot of 83 indiv9.dua1 electric field observations taken at 15 mir^Eite
intervals from ^Snp 6 orbits ].78--183 whenever "odd-half-haixnoni.et'ezx^issions are seen. The graph shows the maximum observedfrequency ^^,^,^ (in units of f^) vs. f^. Higher relative frequenciestend to occur when the magnetic field is weakest, and almost aiIex^.v.ssians between f^ and 2fg occur below ^.. 5f^ . The region abovethe soiid curve earresponds to frequencies above 3.8 kHz and cannotbe observed in the data.
51.
__ - --__.__.....I
r
^.^^ ;
^.
/. .,
i
f
!^1
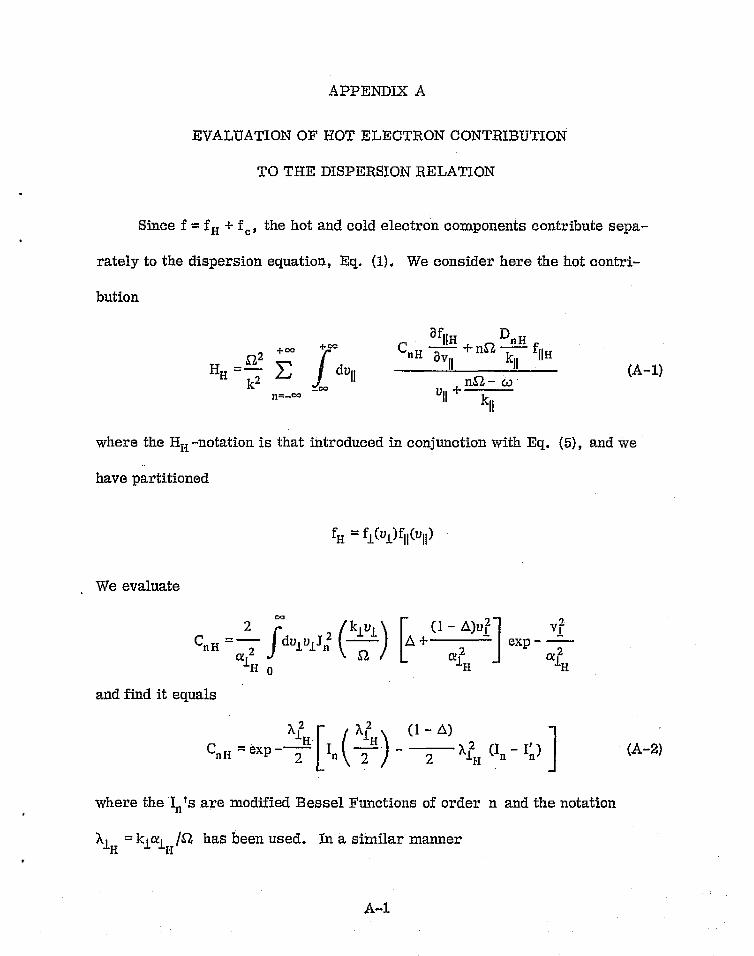
APPENDIX Ai
EVALUATION OF HOT ELECTRON CONTRIBUTIONYz3
TO THE DISPERSION RELATION^,
..^_. ^
ince f = fx + f^, the hot and cold electron cazxxponents contribute sepa- ^. {
to the dispersion equation, Eq. (I}. Vfie oansider here the hot contri-3
1J
_ ++7
9
^-ov ^'DQ CnFi
^fl^^
+nSLD"x ^ ^
SZ23v k flHx ^ k2 ^ ^ dv^l fl 11 (A^1)
j
_^ .^ nSZ - ^n=-^ Ulf k ^.
IE
where the Hx-^notatifln is that introduced in conjunction with Eq. (5}, and we
have partitioned
' ;^
fx = fj (al)f^E(u^^)
We evaluate
2 ^ I klv^ { 1 - 0)u.^ v^
Cnx = z f cFv^ulr^? [ ^ d -E- Z exp - ^al J \\ ^ aI ^I
1
^ 4x
^ I
and find it equalsi
C^, x ^ exp - 2x In ^ Z x ^ -- 2
A!x {In - Xn) (A--2)
where the In 's are modified Wessel Functions of order n and the natation
?i^x = kic lx JSL has been used. zn a similar manner
A«^
iE
' E
^ I,
2 a (^ -- a}^^ ^^
D = — dv .i 2 -- ^ a ^- ^ exp -
n H ¢^ .L n a
Ul«! a^
H p H H ^^,'
1 A^ ^^'
= a 22 exp -- ^H - 2aIn -E- {1 - a}1^ x (In - In} ^ (A-3} .
^H J ,:
^.Tor the parallel integration we insert the Lorentzian form. and define
^n -w -- n52
k^^^
The first U!^
-integral in (1} thus becomes
+p of /av^^ _+^
v!^ I
Qn^P fdv^^ _ -2pNP J dv ! ^ ::-O° ^^^ - ^n ..^ (11!i ^- «I^H }pal
LT,I '., un1'
(A-4} ,
where N denotes the normalization factor !P
_ 1 (2p - 2} T
N^ _ ^ (2p .. 3}!! (af^E^}
2p-i pr! - (^ I}!! -1 3
Note that Qn,P may he written as1
P
+^ ^
Q o _ 2 _ i P^-1 N^ a dx X ^ ^ ^n ,P (n - 111 ( } 'IT-F-1 h ., ^ „ 1
_^ ._ ._ .
{
i•F'
E ^1 ^
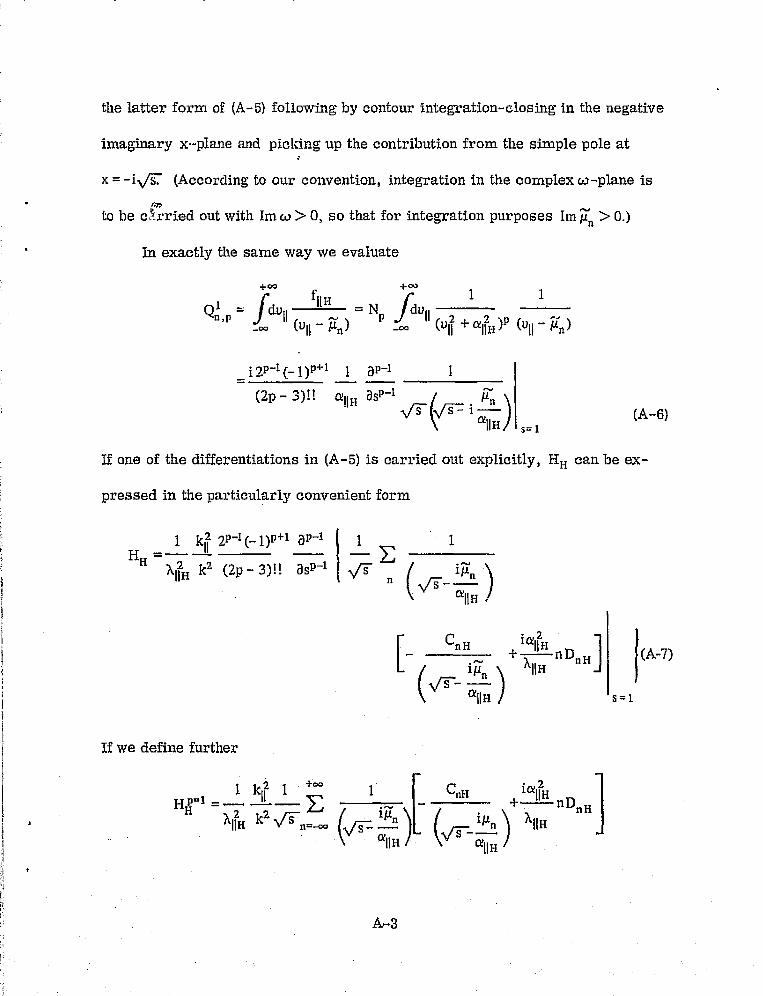
the latter form of {A-5) following by contour integration-closing in the negative
imaginary x-plane and picUin; up the contri^aution from the simple pole at
x ^ -i^ (According to our convention, integration in the complex w-plane is
to be c^z^ried out with Im w ^ 0, so that for integration purposes Im f^fl 7 4.)
In exactly the same way we evaluate
+^ +^_ ^ fll^ ^ 1 1Q^,p dull _ W N^ dnll
z -_°° (UIl - 1.^n ) _°° (ulf + ^Il^ )^ (Ull `- Fin)
i?p–^(–I)p+1 I ap-1 I
{Zp- g)^1 «lIH asp-1 ^n
^ ^^ 1 ill ^ (A-^)H s=1
If one of the differentiations in {A-5) is carried out explicitly, Hs i can be ex-
pressed in the particularly convenient form
I IG Ii 2p–^ {-- I )p+I ^p-1 ^ ^ IH^ =
^ liH g2 (gyp_ ^)ii a5p–I ^ innn ^ ^– ^
H^
2 ll^- CnH +icxll^ nDn ^
J (A 7)
iiin AII^
^^ ally ! s =^
If we define further
I k l^ I f^ I C zH^=1 =._... — ^
nH ^iallH
TIIH kz ^n_.-^ r/- ^ l n 11^^n 1 ^IIH nDnx
ll ll H
^..
.^..
a
r
^.: ^ l;
A-4
i
^.IF , . i
a
' so that3
H — 2p`I {- I )p+ 1 ap-1
H I3
^I ^^'.^H _ I T ^ p--i
H ^ '^i.y{2p 3}.. ^s s 1
(A--8)
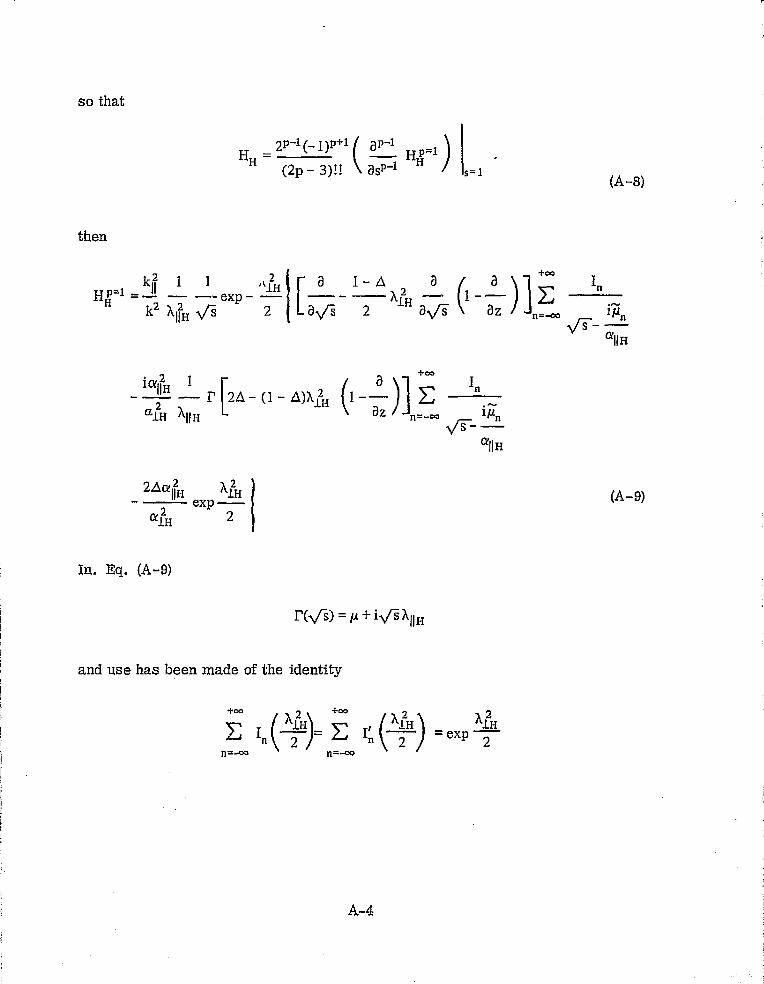
then
^ kll1 1 ,^^H a- 1 -- O z 8 ^
+^In
HH^ - -- exp - ^lx --^ ^I ^---kz z 2 ^ a ss 2 a_ rs az _ i.,.
^11x V ^ ^J Y n-...o0 11n^_
a^1H
ia11H I ^ ^^ In- az --- I~ ^2a- {1 ° ^)^iH ^
I ^ ^^
1H ^i1HL... Z n__oo l^n^_
^1^ H
2^a11^ exp ^1H (A-9)
2alx 2
Zn. Eq. (A-9)
^r{.fs}
^µ^i^Af1xiand use has Veen z^nade of the identity
iI ^lH S, ^'lx
= ex ^'lH
i^ n^2 ^ n ^2} p 2n=-^ n=-^
I3
f.^-x
A-5
f
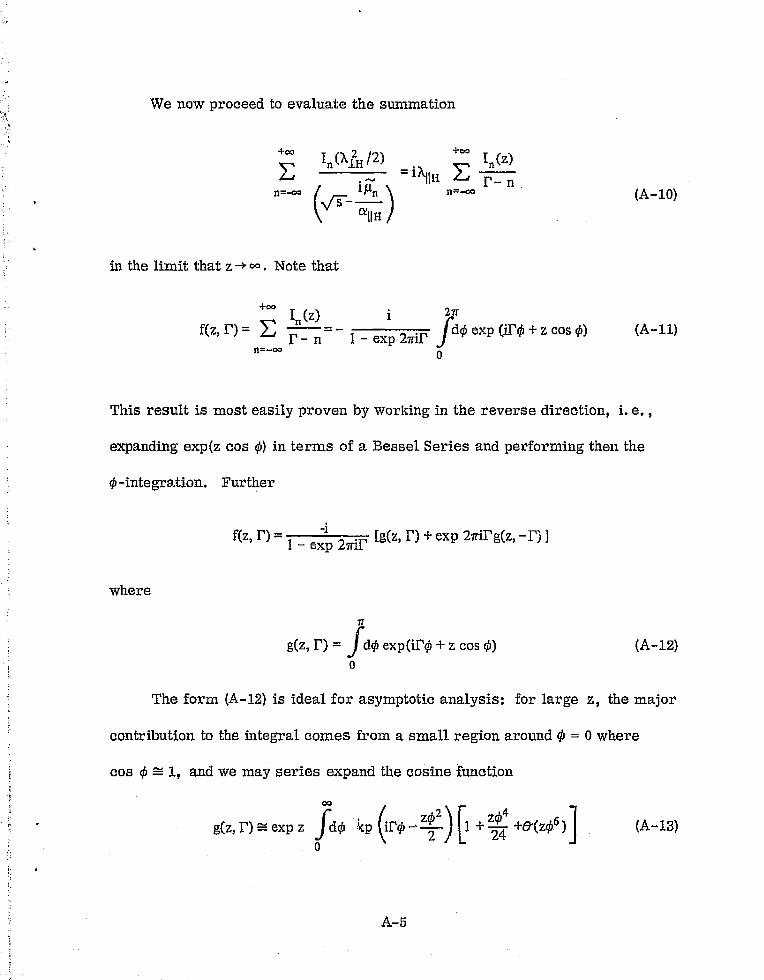
We now proceed to evaluate the summation`:r'",
40o
In {^^H fZ) ^-^ I
n (z}^_^
• (^
s 's
ill x ^,
in the limit that z -} ^ . Nate that
+^ In {z} i 27r
f(z, r) = ^ - - rd^i exp (i^'^i + z cas ^i} {A-1.1)P- n r 1- axp Z^riP J ^
n=--^ ^
This result is most easily proven by working in the reverse direction, i. e. ,
expanding exp(z cas r^) in terms of a Bessel Series and perfar^ning then the
r^-integration. Further
f{z' r) 1 -exp 2^P ^g{z, P) +exp Z^riP g(z, - P) j
where
n
g(z, P} _ ^d^i exp(iPr^ + z cos ^) {A- 12)a
The farm {A-12) is idea], for asymptotic analysis: for large z, the major
contribution to the integral. comes from a small region around ^ = 0 where
cos ^ = 7., and we may series expand the cosine function
z ^-' g{z, r) ^ exp z ^d^ -,kp ^lr^ ^ zZ ^ Cl + Z4 +e'(z^6) ^ (A-13)
o L
2+ exp z P 5 - ^
24z2z{A--IG)
^, a
- ^, f^. ,
7F -
s'_ / I
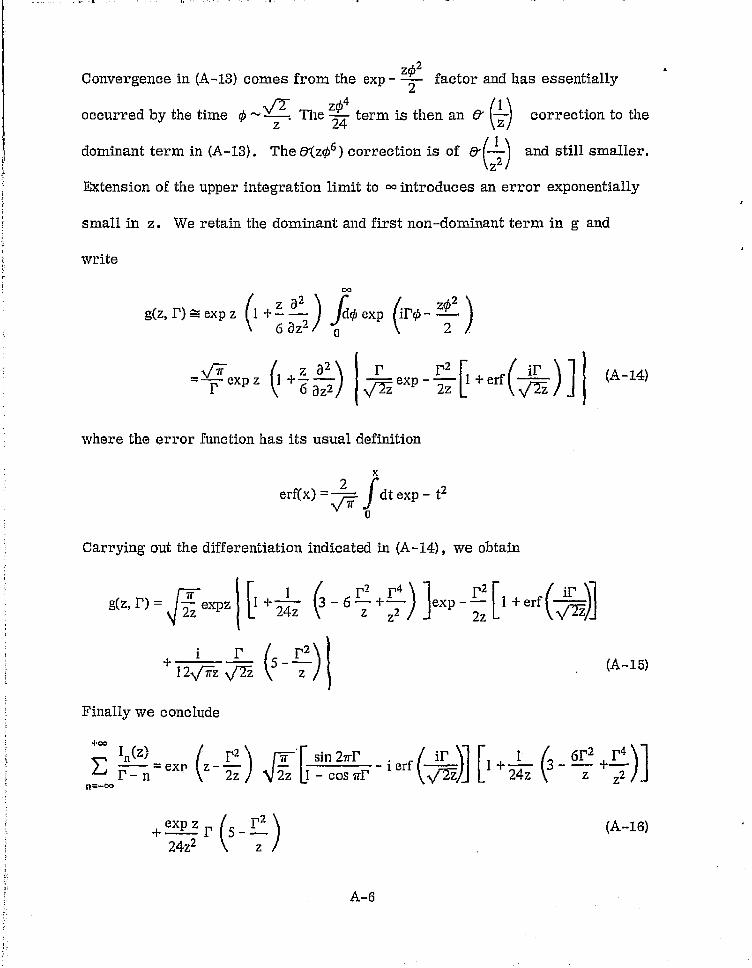
Convergence in (A-13) comes from the exp - zZ factor and has essentially
occurred by the time rp ^'^ The 24
term is then an B' 1Z^
correction to the
dominant terxn in {A-Z3). The 1e{z^6 }correction is of H^( z ^ and still smaller.lz
Extension of the upper integration limit to ^ introduces an error exponentially
small in z. We retain the dominant and first non-dominant term in g and
write
^',
^'^
5j1
'1 ^ ^
}
^^...
a
2 J' ^2
g(z, P} ^ exp z 1 + ^- — d^ exp iP^ -- ^--za z
^ azz o z
z 2= P exp z l 1 + ^ Wiz ) ^ exp - 2z ^I +erf ^ ^ ] {A-^.4)
where the error function has its usual definition
x
erf(x} =^ ^dt exp - t20
Carrying out the differentiation indicated in {A-14), we obtain
z a z
g{z' r} - 2z expz I + 24z \3 - ^' z + z ^ exp - r ^1 +erf \^^^z 2z
+ ^ ^ CS r2
^{A-^5)
I2 nz z z
Finally we conclude
^^ln (z} _ j rz ^ ,1 ^ sin 2^rP / iP 1^ ^ I ( 6l'^ I'4 ^^
^_,^^ P - n ^ err 1z ` 2z 2z ^1 -cos ^r - i erf ( ^ J 1 + ¢z `3 - z + Z2
A--G
'I ^ ,
f4 E°i^:^. ,.
}
The leading order term. is the one of order ^. The asymptotic smallness of
^, 2 ^ ,corrections dep^:nds on P f z remaini^ig of B^(a.) or smaller as z ^ ^.^^'
For P2 /z ^'8'(1} all correction terms in (A..^6? are of comparable magnitude ^^:^7
and are small compared to ^;he dominant by the anticipated 1/z.
.
We now incorporate the leading order term of Eq. {A-1fi) into Eq. {A-9). ^„
While it would appear that terms in (A-9) having A^ as a multiplicative factorH
are asymptotically dominant, operation by 1 - az drops their magnitude bya
one compensating order in A^ We are justified in retaining only the lowestH
order term in {A-IB) because neither the operations a^
nor ^1 - 8z changes\\\\\\
the relative ordering of the dominant and correction terms. Our final result is .;
1 _ k!f 1 l ^ P2
z2Pz 1- D 2^r a
HY PHz i ^' ex z ^^ll ^ l- a ^ ^^
k ?^!!^ ^ ^1H
ASH H ASH 2 cos 2^rP - 1
22 P sin 2nP iP
-^ P 2D ^- (I -- D) 1 i erf
^^ Al 1 cos 2^rP h!H
H H
2rxl H (1 -. d)PZ
1H .LH
(A-1'7)
E ^
^,
^^':Y=
rT
r
I I I^^l J r ^
APP)aNDIX B
OUTLINE OF COMPUTIJR SOLUTION TO THB DISPERSION RELATION
We here discuss computational detail briefly beginning with a summary of
our treatment of H^ . We choose initially values of ^^^ , aIH Ja^ lt^ , and the propa-
gation direction 8 ^ tan^i k^. Our work thus far has concentrated on the "iso-kq
tropic" case alb _ ^p H and we discuss only these results. Given the values of
these three chasers parameters, ^iix is determined. We next vary ^cr , typically
between ^r = I.02 and ur = 5. 98, in steps of . 0^, evaluating HH,reat and HH, imag
using the computer to sort real and imaginary parts. In the process we also
compute the first three ur derivatives of both the real and imaginary parts at
each ^r value. We stare these values of H^ and its derivatives on tape, tabu-
lating separately the contributions of the "loss cone" and "filled in" components,
which are uharacteri.zed respectively by the multiplicative factors {1 - n) and
d in Eq, (G). This table is then repeated for various pairs of Ase and 8, A!H
typically varying between 2.5 and 16 in a variable step size (.5 S A^ S 2) and 9
taping on the values 89. 5°, 88°, $6°, 82°, and 76°.
We combine each tabulation of H IS , charactierized by fixed AI^^, 8, and ftr,
with several "realizations'° of cold plasma. In characterizing the cold plasma
we still have the freedom to choose ^ and «^J« a . {Again, we have as yet con-
sidered only a^^^ _ aI^). Once these parameters are chosen Ha,rcal and Hc,imag
B-z
E:
..^.__- ---_.
i _ ^ _ ;._ ^ ^ is .
i ^..
are calculated from Eq. {9}. This procedure is a standaxd one, and further
discussion of it will be omitted.
`^ ^ Finally wp^/S2^ is evaluated from Eq. {Xfl} and µ^ and (Qµ) r are deter-
mined from Eq. (11}, [4µr is typically <Q.02 for accepted results.]
While the sequential events of coxnputation are as detailed above, Para-
- metric dependencies axe ultimately determined by cross referencing, For
example, one would determine the dependence of µr and p; on Ali (and hence
Flo }for fixed 8, ^i, and cx^/aH by first generating several tables each character-
ized by a different value of A^^ . Each table would have as "output" the values
of wPx /SZZ , µ^, and (Dµ) r as a function of the "input" µr . One would then further
search from table to table at fixed wP^/SZZ to determine, usually by interpola-
tion µ^ and µr -^ (Dµ) r as functions of Ai .
r^,^+qr = "i
'^, :i
B-2


