Embed Size (px)
Citation preview

Atmosphere 2011, 2, 182-200; doi:10.3390/atmos2020182
atmosphereISSN 2073-4433
www.mdpi.com/journal/atmosphere
Article
Emissions from Ethanol-Gasoline Blends: A Single Particle
Perspective
Dabrina D. Dutcher 1, Mark R. Stolzenburg
1, Samantha L. Thompson
2, Juan M. Medrano
2,
Deborah S. Gross 2, David B. Kittelson
1 and Peter H. McMurry
1,*
1 Department of Mechanical Engineering, University of Minnesota,
111 Church St. SE, Minneapolis,
MN 55455, USA; E-Mails: [email protected] (D.D.D.); [email protected] (M.R.S.);
[email protected] (D.B.K.) 2 Department of Chemistry, Carleton College, One North College Street, Northfield, MN 55057,
USA; E-Mails: [email protected] (S.L.T.); [email protected] (J.M.M.);
[email protected] (D.S.G.)
* Author to whom correspondence should be addressed; E-Mail: [email protected];
Tel.: +1-612-624-2817; Fax: +1-612-626-1854.
Received: 8 May 2011; in revised form: 29 May 2011 / Accepted: 13 June 2011 /
Published: 22 June 2011
Abstract: Due to its agricultural origin and function as a fuel oxygenate, ethanol is being
promoted as an alternative biomass-based fuel for use in spark ignition engines, with
mandates for its use at state and regional levels. While it has been established that the
addition of ethanol to a fuel reduces the particulate mass concentration in the exhaust, little
attention has been paid to changes in the physicochemical properties of the emitted
particles. In this work, a dynamometer-mounted GM Quad-4 spark ignition engine run
without aftertreatment at 1,500 RPM and 100% load was used with four different fuel
blends, containing 0, 20, 40 and 85 percent ethanol in gasoline. This allowed the effects of
the fuel composition to be isolated from other effects. Instrumentation employed included
two Aerosol Time-of-Flight Mass Spectrometers covering different size ranges for analysis
of single particle composition, an Aethalometer for black carbon, a Scanning Mobility
Particle Sizer for particle size distributions, a Photoelectric Aerosol Sensor for
particle-bound polycyclic aromatic hydrocarbon (PAH) species and gravimetric filter
measurements for particulate mass concentrations. It was found that, under the conditions
investigated here, additional ethanol content in the fuel changes the particle size
distribution, especially in the accumulation mode, and decreases the black carbon and total
OPEN ACCESS

Atmosphere 2011, 2
183
particulate mass concentrations. The molecular weight distribution of the PAHs was found
to decrease with added ethanol. However, PAHs produced from higher ethanol-content
fuels are associated with NO2− (m/z—46) in the single-particle mass spectra, indicating the
presence of nitro-PAHs. Compounds associated with the gasoline (e.g., sulfur-containing
species) are diminished due to dilution as ethanol is added to the fuel relative to those
associated with the lubricating oil (e.g., calcium, zinc, phosphate) in the single particle
spectra. These changes have potential implications for the health effect impacts of
particulate emissions from biofuel blends.
Keywords: ethanol; bio-fuels; aerosol time-of-flight mass spectrometer (ATOFMS);
combustion aerosols
1. Introduction/Motivation
The use of ethanol to fuel motor vehicles dates back to at least Henry Ford’s time [1]. Ethanol fell
in and out of favor as an internal combustion fuel until the 1970’s fuel crisis. At that time, ethanol,
which can be manufactured from biomass, was reintroduced as a volume extender [2]. Recently
ethanol has regained national interest due to its non-petroleum origin, its strength as a fuel oxygenate,
and its octane-boosting properties. There is ongoing debate about its environmental benefits [3].
According to the Renewable Fuels Association [4], the volume of ethanol produced in the US
(primarily for fuel) increased 22 fold between 1980 and 2005.
Several states currently mandate the use of ethanol in concentrations up to 10% in their fuels and
some states have mandated 20% fleet average ethanol blends [5,6]. Additionally, flexible fuel vehicles
are being sold that can run on ethanol gasoline blends from 0–85% ethanol. Flexible fuel vehicles
allow car manufacturers to meet Corporate Average Fuel Economy (CAFE) standards more readily,
which is a significant incentive for their manufacture [7].
Ethanol/gasoline mixtures have been extensively studied for their effects on gas-phase emissions
from spark ignition (SI) engines [1,8-16]. Emissions of several important gas-phase species are known
to be reduced as ethanol is added to gasoline; these include carbon monoxide and many hydrocarbon
species, including benzene, toluene, and butadiene. Emissions of other gas-phase species may actually
be increased; these include unburned ethanol, methane, total hydrocarbons, some aldehyde species and
ethylene. Particle mass and number emissions have been shown to decrease with the addition of
ethanol [17-20]. The effect of ethanol fuels on additional air quality parameters has also been
examined [21].
Several different chemical markers have been identified that distinguish spark ignition engine
exhaust from other aerosol sources. For example, Schauer and coworkers [22] were able to use a
receptor-based source apportionment technique based largely on organic compounds analyzed by
GC/MS to identify the contributions from gasoline powered engines in Los Angeles. Kim and
coworkers [23] were able to use carbon fractions resolved by temperature in a positive matrix
factorization technique to distinguish between diesel and gasoline emissions. Miguel et al. [24] found
that diesel trucks emitted lower molecular weight PAHs than gasoline powered vehicles. Prather and

Atmosphere 2011, 2
184
coworkers [25-28] have used single particle signatures as determined by Adaptive Resonance Theory
2-A (ART-2a) to separate contributions from combustion in Heavy-Duty Diesel Vehicle, Light-Duty
Vehicles, and other combustion sources. The stability of the ratio of measured components is critical to
the success of these methodologies.
Gasoline is a complex mixture of hundreds of different species [29,30]. When alcohols and gasoline
are mixed, the concentration of aromatics in the fuel is typically reduced, as these are no longer
required to maintain the octane rating [13,29]. Reducing aromatics also enhances the solubility of the
ethanol in the gasoline [31]. Simultaneously, components of gasoline such as sulfur-containing
compounds are proportionately diluted as ethanol is added. Given the dependence of particle formation
processes on their synthesis conditions [32], these changes in fuel composition may result in exhaust
particles with different physical and chemical properties.
Although particle mass concentrations are known to be reduced as ethanol is added [15-19], there is
a dearth of information on the properties of particulate emissions. In this paper, measurements of the
chemical and physical properties of exhaust particles produced from combustion of a systematic
progression of ethanol-gasoline blends in a spark-ignition engine are described. The primary focus of
the discussion is on chemical measurements obtained using single particle mass spectrometers.
Complementary information on aerosol physical properties including mass concentrations, black
carbon concentrations, and size distributions is also included.
2. Methods and Models
The effect of ethanol concentration in the fuel of a spark ignition engine on the composition of the
exhaust particles was studied using an engine dynamometer system. The primary instrument used in
this test was the single particle mass spectrometer [33], with several other aerosol instruments used for
additional information. All instruments sampled directly from an ejector-diluter system. A schematic
of the experiment is shown in Figure 1. The engine operating conditions and the primary dilution
parameters were constant through all fuel tests, effectively isolating the effects of the fuel.
2.1. Fuels
Four different fuel blends, E00, E20, E40, and E85, were studied (where EX indicates that the fuel
contains X percent ethanol, by volume). E00, E10 and E85 were obtained from a supplier and used as
supplied. The E20 and E40 were mixed from the E10 and E85, to ensure that the appropriate gasoline
blend was used in all experiments. Each fuel type was tested multiple times and particle size
distributions were monitored during all runs to ensure repeatability.

Atmosphere 2011, 2
185
Figure 1. Schematic diagram of the experimental set-up. Appropriate transport flows were
provided for all the instruments and secondary dilution was performed for the ATOFMS
with the lens inlet to keep concentrations within the operating parameters.
2.2. Apparatus
The engine used in these studies was a Quad-4, the first production, four-valve, Dual OverHead
Cam (DOHC) four-cylinder engine built by General Motors. Its total displacement capacity is
2.3 liters [34]. Although this engine is no longer in production, it was a very common engine in the
GM line, and was standard in car models such as the Grand Am and Cutlass. The engine used in our
study was manufactured in 1994 and had 500–600 hours of run time. During this experiment, all
measurements were carried out on an engine-dynamometer at 1,500 RPM and 100% load without
aftertreatment. Particle emissions from spark ignition engines are extremely load-dependent with
dramatic increases under high load [35-37]. These increases are associated with several factors but the
main ones are fuel enrichment and loss of catalyst effectiveness [35,36]. Under most operating
conditions, PM emissions from gasoline vehicles are extremely low. The main sources of PM are
worn, high emitting vehicles, and vehicles operating under off cycle conditions that lead to very high
emission rates and potential local emission hotspots. High load conditions like those used here are
associated with hot spots such as some intersections and freeway on-ramps. The engine was operated
without its normal 3-way catalyst after-treatment system because it was necessary to operate for
relatively long time periods to collect ATOFMS data and continuous high load operation may damage
Ejector-Diluter
ATOFMS w/ lens *
ATOFMS w/ nozzle
n-SMPS†
r-SMPS‡
Quad-4
S.I.
Engine ~17:1
Critical Orifice
& Vacuum Filter
Aethalometer
PAS
* utilized “leaky-filter” style diluter as required
† nano-scanning mobility particle sizer
‡ regular-scanning mobility particle sizer

Atmosphere 2011, 2
186
catalysts. The particle signature should not be dramatically changed by the absence of the catalyst
because PM (mainly elemental and organic carbon) removal by a catalyst designed to remove
relatively low molecular weight gas phase species is marginal at best, especially under high power
conditions. The results are only applicable to other high-load conditions and should not necessarily be
extrapolated to engines with after-treatment operating at light load and cruise conditions. Given that
high load conditions produce disproportionate amounts of particulate emissions, it is essential to fully
characterize emissions from this engine condition. Only one static condition was tested so that the
effects of the changes in fuel composition could readily be isolated from other changes. Engine
operating conditions used in this study are based on load, not on fuel consumption rates. The volume
of fuel used per unit of time, for identical engine conditions, increases as ethanol is added because
ethanol contains 34% less chemical energy per unit volume than gasoline [38].
2.3. Aerosol Sampling and Measurement
The engine exhaust was diluted with a primary dilution system capable of simulating particle
formation and growth that would occur under initial atmospheric dilution conditions. The dilution
system is capable of controlling aerosol bulk residence time, dilution ratio, relative humidity and
dilution temperature [39,40]. Particle-free air with a very low relative humidity (<5%) was used for
dilution. A 17:1 primary dilution ratio, as determined by pre and post dilution NOx measurement, was
maintained for all data presented in this work. The post dilution temperature was maintained below
40 °C. It should be noted that the results then are most applicable to similar temperature conditions.
Ejector dilutors are an effective way to mimic the dilution and quenching that occurs downstream of
the tailpipe under real operating conditions [39]. The residence time was held at a nominal 1 s. One of
the single-particle mass spectrometers required secondary dilution, accomplished with a leaky
filter-style diluter, to obtain particle concentrations within its operating range.
Two TSI 3800 Aerosol Time-of-Flight Mass Spectrometers (ATOFMS, TSI Incorporated,
Shoreview, MN ) were used to measure particle composition. One of these instruments was equipped
with an aerodynamic lens inlet [41-43] optimized for the 50–500 nm aerodynamic diameter size range.
The second ATOFMS was equipped with a nozzle inlet for larger particles (150–3,000 nm with a
size-dependent efficiency). The laser used in the desorption/ionization step in both instruments has a
wavelength of 266 nm, enabling detection of a wide variety of chemical components, and resulting in a
high sensitivity to species which have a high absorptivity at that wavelength.
Black carbon concentration was measured using an Aethalometer (Magee Scientific, Berkeley,
CA) [44]. This instrument uses the absorption of 880 nm light by filtered particles to assess the mass
concentration of black carbon. Although this instrument allows for the application of source specific
calibrations, the default calibration was used due to the magnitude of the range of potential results.
A Photoelectric Aerosol Sensor [45] 2000 CE (PAS, EcoChem Analytics, League City, TX) was
used to monitor qualitative trends in particle-bound PAHs. This instrument measures particle-bound
PAHs by ionizing the aerosol with UV radiation and measuring the resultant electric charge. The
particle size distribution, the presence of other volatile species, black carbon concentrations and the
PAH molecular weight distribution can create bias in the measurement [46-48]. Thus, the signal is
reported here in arbitrary units and is only used as an indicator of overall trends in PAH concentration.

Atmosphere 2011, 2
187
Particle size distributions from 4.5–830 nm mobility diameter were measured after neutralization
using a Po210
using a nano-DMA (TSI 3085, TSI Incorporated, Shoreview, MN) [49] coupled with an
ultrafine condensation particle counter (CPC, TSI 3025, TSI Incorporated, Shoreview, MN) [50] and a
long column (regular) DMA similar in design to the instrument described by Knutson and Whitby [51]
coupled with a CPC (TSI 3760, TSI Incorporated, Shoreview, MN) [52]. The nano-SMPS (n-SMPS)
system was used to measure the particle size distribution from 4.5–50 nm, while the long column
system (R-SMPS) was used to measure from 35–830 nm.
Mass concentrations were determined by collecting particles on 47 mm Pall Teflo filters (2 µm pore
size with polyolefin support rings) after primary dilution. These filters were weighed using a CAHN
C-31 microbalance (Cahn Instruments, Inc., Cerritos, CA) before and after sampling and equilibration.
Sampling volumes were ~3.6 m3.
3. Results and Discussion
3.1. Mass and Black Carbon
Mass concentration results for the two extreme fuel conditions are shown in Table 1, which shows
that exhaust particle mass concentrations drop significantly as ethanol is added to the fuel. A 60% drop
in mass concentration is seen for the E85 fuel experiment compared to E00. This drop is likely due to
ethanol’s property as a fuel oxygenate. A similar trend is seen in the concentration of black carbon as
measured by the aethalometer. While black carbon concentrations fall rapidly with the addition of 20%
ethanol, there appear to be diminishing reductions with the E40 and E85 fuels, though the lack of a
source-specific calibration and the presence of known interferences such as PAHs add uncertainty to
these measurements. Black carbon concentration is an operationally defined quantity that corresponds
to the extent to which particles deposited on a filter absorb light [53], and it is generally formed
through incomplete combustion. The reduction of mass and black carbon is likely associated with the
decreased tendency to form soot associated with oxygenated fuels like ethanol.
Table 1. Mass and black carbon concentrations and PAS readings. Note that the mass and
black carbon co-vary while the PAS readings fall faster as ethanol content is increased. PAS
response is known to be suppressed by the presence of volatile material on the particle
surface leading to UV attenuation and increased likelihood recapture of photoelectrons. The
error in mass concentration is estimated from propagation of error calculations while the
error in black carbon (BC) concentration and PAS signal represents a standard deviation
in measurements.
Fuel Mass Concentration
(µg/m3)
BC ** Concentration
(µg/m3)
PAS Signal (mV)
E00 150 ± 22 150 ± 22 1940 ± 117
E20 * 78 ± 18 1472 ± 183
E40 * 74 ± 13 235 ± 52
E85 60 ± 22 71 ± 10 92 ± 40
* data not obtained; ** The BC data should only be used as an indicator of trend and not an absolute
concentration, due to the presence of interfering species and lack of a source-specific calibration.

Atmosphere 2011, 2
188
Mass concentrations of semi-volatile matter may be affected by the temperatures at which the
primary dilution was performed and by the temperatures at which particle collection was done. Thus,
in cooler winter conditions, the partitioning of semi-volatile compounds from the gas phase to the
particles might increase, increasing the mass, although the solid elemental carbon component of the
mass would be unchanged by dilution conditions.
3.2. Mobility Distributions
Figure 2 shows that the addition of ethanol leads to a systematic decrease in concentrations of
particles larger than 10 nm. Below 10 nm, number distributions of the ethanol blends rise sharply with
decreasing size to values that equal or exceed those measured for E00. In all cases, the sub 10-nm
particles are likely produced by nucleation when the hot exhaust gases mix with the cool dilution air.
Nucleation of semi-volatile materials becomes more likely as the concentration of particles in the
accumulation mode and thus surface area available for adsorption decreases.
Figure 2. Particle mobility size (Dm) distributions measured with the SMPS system
(~40 C) as a function of fuel ethanol content. Error bars (±1 standard deviation) were
calculated based on repeated runs. Error bars are shown only for E00 and E85 fuels, for
ease of visualization, and are of comparable magnitude for E20 and E40 fuels.

Atmosphere 2011, 2
189
3.3. ATOFMS Measurements
The average composition of the particles produced through the combustion of each fuel mixture is
shown in Figure 3. This figure shows the average composition of particles produced by each fuel as
measured by the ATOFMSs. These arithmetic averages each represent between 5,000 and 20,000
particles. No scaling factors to correct for particle detection efficiency have been applied, given the
similarity in the sample sources and thus the particle matrices. A few trends are particularly relevant
and are illustrated in the associated bar graphs. The most obvious is the systematic reduction in the
relative area of the peak associated with sulfate (HSO4−, m/z—97) as a function of ethanol content.
Given that the most significant source of sulfur is as a contaminant in the gasoline, the trend in this
peak represents the dilution of sulfur in the gasoline by the ethanol. Though it was not measured in this
work, other research has confirmed that gas-phase oxides of sulfur are also reduced [54,55]. A
reduction in the average relative area of peaks associated with elemental carbon (Cn±, m/z ± 12 × n,
where n = 1, 2, 3, …) is also seen as a function of increasing fuel ethanol content, consistent with the
decrease in black carbon mass determined with the aethalometer with increasing fuel ethanol content.
The rate of decrease of the average relative area of elemental carbon peaks is dependent on the choice
of peaks used to represent elemental carbon. Here C4±–C8
± are used, to equally represent peaks
observed in the positive and negative spectra and to utilize peaks with minimal interferences. A
relative increase in species associated with the lubricating oil (calcium, phosphate, zinc, etc.) [56] is
observed as fuel ethanol content increases. This does not indicate that more oil-associated species are
being emitted; just that these are proportionately increased in the particle mass spectra as products of
incomplete combustion are reduced. These species are associated with the larger nucleation or coarse
particle modes. This shift in particle composition and size distribution has implications for both health
impacts and source apportionment.
In order to investigate detailed chemical changes upon the addition of ethanol to the fuel, we have
paid careful attention to the PAH region, given their known health effects and utilization in source
apportionment techniques. Species other than PAHs contribute little signal in the mass spectral region
from +154–+300, so we have made the approximation that the signal in this range is due PAH ions.
Thus, we use the summation to represent the total peak area due to PAH ions. Trends in the PAH
region of the mass spectra (m/z 154–300) as a function of fuel ethanol content are also illustrated in
Figure 3. The average molecular weight of the ions detected in the PAH region (indicated by
arrowheads in the figure) decreases with increasing fuel ethanol content. Although the ATOFMS
cannot distinguish between different PAH congeners [57], these data show clearly that the distribution
of observed PAH species is changing with fuel composition. de Abrantes and coworkers [58] observed
a similar trend when analyzing emissions for 16 specific PAH species from spark ignition vehicles
burning various ratios of ethanol and gasoline. As shown in the PAS data in Table 1, the
concentrations of particle bound PAHs also decrease sharply with added ethanol.

Atmosphere 2011, 2
190
Figure 3. Average single-particle mass spectra for each fuel type. The PAH region is
magnified. The arrows in the magnified PAH region show the arithmetic average molecular
weight of observed PAHs. Trends in the relative peak areas of certain key species as a
function of fuel ethanol content are shown in bar graphs, and labeled by fuel type.
In order to delve more deeply into the chemical nature of the detected PAH species, the
single-particle data was examined to elucidate relationships between PAH species and nitrate ions. In
Figure 4 each data point represents the intensity due to NO2− (m/z—46) or NO3
− (m/z—62) versus the
summed intensities from the entire PAH region (m/z 154–300) from the spectrum of a single particle.
Data is shown for E00 and E85 fuel conditions, although the trend is consistent across all fuel types. It
can be seen that the particles that contain significant PAH peak area frequently contain peaks due to
NO2−, but not NO3
−. This trend suggests that either the PAHs are associated with nitrate in the
particles, which in turn is the source of the NO2− ion, or that there are nitro-PAHs present. Given the
lack of signal due to the NO3− ion, which is routinely observed in combination with signal from the
NO2− ion in spectra from particles known to contain nitrate, the most likely explanation is the presence
of nitro-PAHs, which contain an NO2 group covalently bound to a ring carbon, but which do not
contain an NO3 group. ATOFMSs are not currently capable of being fully quantitative given the
variety of particle types and matrices, and nitro-PAHs are notoriously difficult to sample and analyze

Atmosphere 2011, 2
191
accurately. These results should not be interpreted to indicate that the mass concentration of
nitro-PAHs is necessarily increasing in emissions from high ethanol fuels, but rather that the PAHs
that do result from high ethanol fuels maybe more nitrogenated.
Figure 4. NO2−, NO3
− and PAH relative peak area scatter plots. Each point represents data
from the mass spectrum of a single particle detected in the E00 and E85 experiments, as
indicated below.
E00 E85
Figure 5 shows the average particle composition as a function of aerodynamic particle size for the
E85 fuel. Similar trends are observed for the other fuels examined. The data from both ATOFMS
instruments have been combined, to show results over the whole size range. The ATOFMS measures
aerodynamic size by measuring size-dependent particle velocities [59,60]. The relationship between
size and velocity is typically obtained by calibrating with polystyrene latex (PSL) spheres. The lasers
used to measure these velocities cannot detect PSL spheres smaller than ~100 nm. Our measurements
of particle velocities indicated that significant numbers of particles smaller than 100 nm were present.
Because calibrations are not possible below 100 nm, a model [42] was used to extend the calibration to
lower sizes. Therefore, it is likely that there are significant sizing uncertainties below 100 nm, but the
trends with size are correct. It is clear from these data that low aerodynamic particle sizes are
associated with elemental carbon (note the relatively simple spectral pattern corresponding to carbon
cluster ions at low aerodynamic sizes), which is consistent with its low effective density [61]. In

Atmosphere 2011, 2
192
contrast, PAHs are more strongly associated with larger aerodynamic particle sizes (which are found in
the region indicated with shading). Incomplete combustion is known to be the dominant source for
both elemental carbon and PAHs; it is possible that they are found in different size particles because
they are formed and condense at different points in the combustion and exhaust cycles. In all the fuels
tested, the average molecular weight of the ions detected in both the positive and negative mass spectra
decreases as the aerodynamic size decreases. The contribution of species known to originate from
lubricating oil (e.g., calcium, zinc, phosphate) is more significant in aerodynamically larger particles.
The inclusion of these species adds complexity to the spectra at mid and high aerodynamic sizes.
Figure 5. Average single particle mass spectra as a function of aerodynamic size for E85.
The average relative intensity of the ions is indicated on the color-scale. Specific ions or
regions of interest are indicated at the top of the figure.
3.4. Clustering Results
In order to investigate the particle population on a number basis, all spectra detected from all the
fuel types obtained with the two mass spectrometers were combined and then the data were clustered
using the K-means algorithm implemented in Enchilada [62]. Eight clusters were found to be sufficient
to represent the most prevalent particle types, based on composition, in all fuel types. These are shown
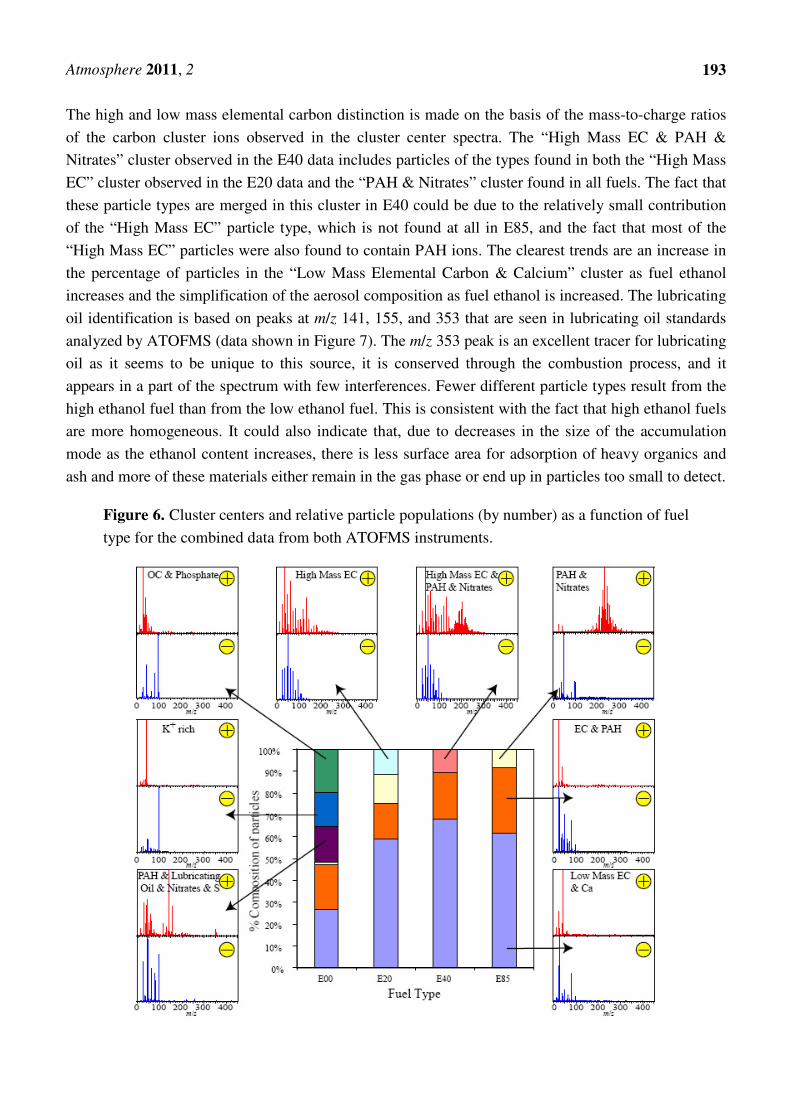
along with the distribution of particles among these clusters for each fuel type in Table 2 and Figure 6.
These clusters contain 100% of the particles analyzed. The eight cluster centers are described as (1)
PAHs & Lubricating Oil & Nitrates, (2) Potassium, (3) Organic Carbon & Phosphate, (4) High Mass
Elemental Carbon, (5) High Mass EC & PAHs & nitrates, (6) PAHs & Nitrates, (7) Elemental Carbon
& PAHs, and (8) Low Mass Elemental Carbon & Calcium. The relative distribution of these particle
types may be affected by the test conditions and may be slightly different in cooler winter conditions.
Atmosphere 2011, 2
193
The high and low mass elemental carbon distinction is made on the basis of the mass-to-charge ratios
of the carbon cluster ions observed in the cluster center spectra. The “High Mass EC & PAH &
Nitrates” cluster observed in the E40 data includes particles of the types found in both the “High Mass
EC” cluster observed in the E20 data and the “PAH & Nitrates” cluster found in all fuels. The fact that
these particle types are merged in this cluster in E40 could be due to the relatively small contribution
of the “High Mass EC” particle type, which is not found at all in E85, and the fact that most of the
“High Mass EC” particles were also found to contain PAH ions. The clearest trends are an increase in
the percentage of particles in the “Low Mass Elemental Carbon & Calcium” cluster as fuel ethanol
increases and the simplification of the aerosol composition as fuel ethanol is increased. The lubricating
oil identification is based on peaks at m/z 141, 155, and 353 that are seen in lubricating oil standards
analyzed by ATOFMS (data shown in Figure 7). The m/z 353 peak is an excellent tracer for lubricating
oil as it seems to be unique to this source, it is conserved through the combustion process, and it
appears in a part of the spectrum with few interferences. Fewer different particle types result from the
high ethanol fuel than from the low ethanol fuel. This is consistent with the fact that high ethanol fuels
are more homogeneous. It could also indicate that, due to decreases in the size of the accumulation
mode as the ethanol content increases, there is less surface area for adsorption of heavy organics and
ash and more of these materials either remain in the gas phase or end up in particles too small to detect.
Figure 6. Cluster centers and relative particle populations (by number) as a function of fuel
type for the combined data from both ATOFMS instruments.

Atmosphere 2011, 2
194
Figure 7. Average mass spectrum from a lubricating oil standard diluted in methyl ethyl
ketone and atomized directly into the ATOFMS. Specific peaks that are conserved through
combustion and used as lubricating oil tracers are identified with a ‘*’.
0.10
0.08
0.06
0.04
0.02
0.00
rela
tive
in
ten
sity
-400 -350 -300 -250 -200 -150 -100 -50 0 50 100 150 200 250 300 350 400
m/z
-256
-222
-165
-95
PO4
-
-63
PO2
-
-26
CN-
-298
-33
*+141
*+353
*+155
+169
+115
+128
napth
+63
Cu+
+43
AlO+/ C
2H
3O
+
+39
K+
+27
Al+/C
2H
3
+
+347
-79
PO3
-
These clustering results reflect particle types within the data set and indicate results on a number
basis, unlike Figure 3 in which results are based on average relative intensities of peaks within the
mass spectra. Thus, the combined results from Figures 3 and 6 indicate that, while a greater number of
E00 particles have a simple lubricating oil signature, the average intensity of that signature is lower
than in particles generated from fuel with a high ethanol content, which is again indicative that more
homogeneous fuels produce more homogeneous particles.
3.5. Source Apportionment Implications
The changes in the physical and chemical properties of the exhaust aerosols will have a significant
impact on source apportionment profiles used previously to identify spark ignition contributions when
high ethanol fuels are utilized. For example, the shift in PAH molecular weight distributions could
potentially lead to high ethanol fuel exhaust being misidentified as diesel exhaust [24] and the change
in both EC and OC fractions along with probable change in their thermal profile could change the
results from techniques that rely on those markers [23]. Eiguren-Fernandez and Miguel [63]
successfully used the ratio of specific PAHs to EC to identify spark ignition sources. We showed a
significant shift in the molecular weight distribution of emitted PAHs with added ethanol. We also
showed a reduction in EC concentration, further complicating the application of this or similar
techniques. These and other similar methods would require substantial refinement in order to be

Atmosphere 2011, 2
195
applicable to SI sources burning high ethanol fuels. Markers and chemical ratios that have been
reliably used to identify spark ignition vehicles burning gasoline will not be applicable to the same
vehicles burning high ethanol fuels.
3.6. Health Effect Implications
Changing the ethanol content of the fuel is shown to change several exhaust aerosol properties that
are known to have health effect implications. Particulate mass concentration emissions were reduced
with added ethanol. Particle mass and number concentrations are known to positively correlate with
deleterious human health effects including increased morbidity and mortality [64-66]. In addition to
the change in particle mass and number concentration, the composition of the particles also changed.
The concentration of black carbon and PAHs dropped nonlinearly, with the greatest decreases resulting
from the change from E00 to E20 and lesser changes from further additions of ethanol. Black carbon
and PAHs are associated with particles of significant mobility but low aerodynamic sizes [67-69].
Thus, these particles are likely to deposit deeply into the respiratory tracts when inhaled [70]. Given
the carcinogenic properties of many PAH species [71], increases in ethanol fuel concentration may
result in the deposition of fewer carcinogenic particles into the lungs. Since the deleterious health
effects of PAHs are more strongly associated with larger molecular weight PAHs [72], the PAHs
associated with the higher ethanol content fuel may be less significant from a health standpoint.
However, this is potentially counteracted by the increased proportion of nitrogenated PAHs. This class
of compounds is known to be associated with very strong genotoxic, mutagenic and carcinogenic
properties [73], and thus, further exploration of ethanol-gasoline fuel mixtures as a source of nitro-
PAHs would be appropriate. Without further tests to establish how the mass concentration and
speciation of the nitro-PAHs changes and/or direct in vivo or in vitro tests, it is impossible to be certain
about the potential health implications of ethanol-containing fuel emissions. This work points to a
potentially important research direction.
4. Conclusions
Two ATOFMSs, two SMPSs and additional supporting instrumentation were used to examine the
physical and chemical properties of combustion aerosol produced by a spark ignition engine burning
fuels that ranged from no ethanol to 85% ethanol. Our results show that mass and black carbon
concentrations drop significantly, which is consistent with less elemental carbon formation with the
oxygenated fuel. The mobility distribution measurements are also consistent with this result, showing
sharp decreases in particle number concentrations in the accumulation mode with added fuel ethanol.
Single particle mass spectra show that species known to originate from gasoline, such as sulfur,
decrease as ethanol is added to the fuel, while species known to originate from lubricating oil are
accentuated. This suggests that as we move to cleaner fuels and combustion systems, emission from
lubricating oil species, mainly metallic ash and certain heavy hydrocarbons will be become relatively
more important. A decrease in the molecular weight of PAH species is observed with added ethanol as
well, and PAH containing particles are more likely to be associated with NO2 but not NO3, strongly
indicative of nitro-PAHs. Further study of this possibility, in a variety of engines operating at a range
of conditions, with a sensitive technique capable of speciating these compounds would be appropriate,

Atmosphere 2011, 2
196
given the potential health-implications of these compounds. The ATOFMS results also demonstrate the
potential pitfalls of relying on signatures from spark ignition engines burning little or no ethanol in
future source apportionment work, as the fuel burned by the vehicle fleet changes to include a higher
fraction of ethanol.
Acknowledgements
The authors wish to thank Marcus Drayton for his advice, expertise and assistance during the
experiments. DDD was funded by the Graduate Research for the Environment Fellowship, Global
Change Education Program, Department of Energy. DSG was supported by a Bush Fellowship,
Faculty Development Grant from Carleton College. JMM was supported by a summer fellowship from
the Howard Hughes Medical Institute through Carleton College. Additional support was provided by
NSF Grant No. NSF/ATM-00 96555 to the University of Minnesota.
References
1. Al-Hasan, M. Effect of ethanol–unleaded gasoline blends on engine performance and exhaust
emission. Energy Convers. Manage. 2003, 44, 1547-1561.
2. Cummins, C.L. Internal Fire: The Internal Combustion Engine 1673–1900 Revised Edition, 3rd
ed.; Carnot Press: Lake Oswego, OR, USA, 1976; p. 356.
3. Niven, R.K. Ethanol in gasoline: Environmental impacts and sustainability review article. Renew.
Sustain. Energy Rev. 2005, 9, 535-555.
4. Renewable Fuels Association (RFA). The Industry—Statistics; RFA: Washington, DC, USA, 2008.
5. Boyle, A. How Regulation Fuels Consumption of Ethanol: A Spatial Analysis of Pro-Ethanol
Policies in the USA. Ph.D. Thesis, Wilkes Honors College of Florida Atlantic University: Jupiter,
FL, USA, 2006.
6. Mosey, G.; Kreycik, C. State Clean Energy Practices: Renewable Fuel Standards; Technical
Report NREL/TP-670-43513; NREL: Golden, CO, USA, 2008.
7. Leiby, P.; Rubin, J. Effectiveness and efficiency of policies to promote alternative fuel vehicles.
Transp. Res. Rec. 2001, 1750, 84-91.
8. Rice, R.; Sanyal, A.; Elrod, A.; BATA, R. Exhaust gas emissions of butanol, ethanol, and
methanol-gasoline blends. J. Eng. Gas Turbines Power 1991, 113, 377-381.
9. Huang, Z.; Miao, H.; Zhou, L.; Jiang, D. Combustion characteristics and hydrocarbon emissions
of a spark ignition engine fuelled with gasoline-oxygenate blends. Proc. Inst. Mech. Eng. Part D
2000, 214, 341-346.
10. Poulopoulos, S.; Samaras, D.; Philippopoulos, C. Regulated and unregulated emissions from an
internal combustion engine operating on ethanol-containing fuels. Atmos. Environ. 2001, 35,
4399-4406.
11. Schifter, I.; Vera, M.; Diaz, L.; Guzman, E.; Ramos, F.; Lopez-Salinas, E. Environmental
implications on the oxygenation of gasoline with ethanol in the metropolitan area of Mexico city.
Environ. Sci. Technol. 2001, 35, 1893-1901.
12. Hsieh, W.D.; Chen, R.H.; Wu, T.L.; Lin, T.H. Engine performance and pollutant emission of an
engine using ethanol-gasoline blended fuels. Atmos. Environ. 2002, 36, 403-410.

Atmosphere 2011, 2
197
13. Yüksel, F.; Yüksel, B. The use of ethanol–gasoline blend as a fuel in an SI engine. Renew. Energy
2004, 29, 1181-1191.
14. Jia, L.W.; Shen, M.Q.; Wang, J.; Lin, M.Q. Influence of ethanol-gasoline blended fuel on
emission characteristics from a four-stroke motorcycle engine. J. Hazard. Mater. 2005, 123, 29-34.
15. Graham, L.A.; Belisle, S.L.; Baas, C.L. Emissions from light duty gasoline vehicles operating on
low blend ethanol gasoline and E85. Atmos. Environ. 2008, 42, 4498-4516.
16. Yanowitz, J.; McCormick, R.L. Effect of E85 on tailpipe emissions from light-duty vehicles.
J. Air Waste Manage. Assoc. 2009, 59, 172-182.
17. Mulawa, P.A.; Cadle, S.H.; Knapp, K.; Zweidinger, R.; Snow, R.; Lucas, R.; Goldbach, J. Effect
of ambient temperature and E-10 fuel on primary exhaust particulate matter emissions from
light-duty vehicles. Environ. Sci. Technol. 1997, 31, 1302-1307.
18. Ragazzi, R.; Nelson, K. The Impact of a 10% Ethanol Blended Fuel on the Exhaust Emissions of
Tier 0 and Tier 1 Light Duty Gasoline Vehicles at 35F; Technical Report for Colorado
Department of Public Health and Environment: Denver, CO, USA, 1999.
19. Hubbard, C.; Shane, M.; Maricq, M. A Study of FTP Emissions on a 06MY TIER2 Bin5 Light
Duty Flex Fuel Vehicle Running on e85 Fuel. In Proceedings of 17th CRC on-Road Vehicle
Emissions Workshop, San Diego, CA, USA, 26–28 March 2007.
20. Zhang, M.; Vo, T.; Fuentes, M.; Dzhema, I.; Hou, D.; Ling, R.; and Rieger, P. A Comparison of
Total Mass, Particle Size Distribution and Particle Number Emissions of Light-Duty Vehicles
Tested at Haagen-Smit Laboratory from 2009 to 2010. In Proceedings of 21st CRC Real World
Emissions Workshop, San Diego, CA, USA, 20–23 March 2011.
21. Jacobson, M.Z. Effects of ethanol (E85) versus gasoline vehicles on cancer and mortality in the
United States. Environ. Sci. Technol. 2007, 41, 4150-4157.
22. Schauer, J.J.; Rogge, W.F.; Hildemann, L.M.; Mazurek, M.A.; Cass, G.R.; Simoneit, B.R.T.
Source apportionment of airborne particulate matter using organic compounds as tracers. Atmos.
Environ. 1996, 41, 241-259.
23. Kim, E.; Hopke, P.K.; Edgerton, E.S. Improving source identification of Atlanta aerosol using
temperature resolved carbon fractions in positive matrix factorization. Atmos. Environ. 2004, 38,
3349-3362.
24. Miguel, A.H.; Kirchstetter, T.W.; Harley, R.A.; Hering, S.V. On-road emissions of particulate
polycyclic aromatic hydrocarbons and black carbon from gasoline and diesel vehicles. Environ.
Sci. Technol. 1998, 32, 450-455.
25. Sodeman, D.A.; Toner, S.M.; Prather, K.A. Determination of single particle mass spectral
signatures from light-duty vehicle emissions. Environ. Sci. Technol. 2005, 39, 4569-4580.
26. Spencer, M.T.; Shields, L.G.; Sodeman, D.A.; Toner, S.M.; Prather, K.A. Comparison of oil and
fuel particle chemical signatures with particle emissions from heavy and light duty vehicles.
Atmos. Environ. 2006, 40, 5224-5235.
27. Shields, L.G.; Suess, D.T.; Prather, K.A. Determination of single particle mass spectral signatures
from heavy-duty diesel vehicle emissions for PM2. 5 source apportionment. Atmos. Environ.
2007, 41, 3841-3852.

Atmosphere 2011, 2
198
28. Toner, S.M.; Shields, L.G.; Sodeman, D.A.; Prather, K.A. Using mass spectral source signatures
to apportion exhaust particles from gasoline and diesel powered vehicles in a freeway study using
UF-ATOFMS. Atmos. Environ. 2007, 42, 568-581.
29. Myers, M.E., Jr.; Stollsteimer, J.; Wims, A.M. Determination of gasoline octane numbers from
chemical composition. Anal. Chem. 1975, 47, 2301-2304.
30. Burri, J.; Crockett, R.; Hany, R.; Rentsch, D. Gasoline composition determined by 1 H NMR
spectroscopy. Fuel 2004, 83, 187-193.
31. Bayraktar, H. Experimental and theoretical investigation of using gasoline–ethanol blends in
spark-ignition engines. Renew. Energy 2005, 30, 1733-1747.
32. Vander Wal, R.L.; Tomasek, A.J. Soot nanostructure: Dependence upon synthesis conditions.
combust. Flame 2004, 136, 129-140.
33. Gard, E.; Mayer, J.E.; Morrical, B.D.; Dienes, T.; Fergenson, D.P.; Prather, K.A. Real-time
analysis of individual atmospheric aerosol particles: Design and performance of a portable
ATOFMS. Anal. Chem. 1997, 69, 4083-4091.
34. Thomson, M.W.; Frelund, A.R.; Pallas, M.; Miller, K.D. General motors 2.3 L quad 4 engine.
SAE Trans. 1987, 96, 330-348.
35. Graskow, B.R.; Kittelson, D.B.; Ahmadi, M.R.; Morris, J.E. Exhaust Particulate Emissions from
Two Port Fuel Injected Spark Ignition Engines; SAE Technical Paper No. 1999-01-1144, SAE
International: Warrendale, PA, USA, 1999.
36. Johnson, J.E.; Kittelson, D.B. Deposition, diffusion and adsorption in the diesel oxidation catalyst.
Appl. Catal. B 1996, 10, 117-137.
37. Kittelson, D.; Watts, W.; Johnson, J.; Schauer, J.; Lawson, D. On-road and laboratory evaluation
of combustion aerosols—Part 2: Summary of spark ignition engine results. J. Aerosol Sci. 2006,
37, 931-949.
38. Pimentel, D. Ethanol fuels: Energy security, economics, and the environment. J. Agric. Environ.
Ethics 1991, 4, 1-13.
39. Abdul-Khalek, I.; Kittleson, D.; Brear, F. The Influence of Dilution Conditions on Diesel Exhaust
Particle Size Distribution Measurements; SAE Technical Paper Series 1999-01-1142, SAE
International: Warrendale, PA, USA, 1999.
40. Wei, Q.; Kittelson, D.; Watts, W. Single-Stage Dilution Tunnel Performance; SAE Technical
Paper Series 2001-01-0201, SAE International: Warrendale, PA, USA, 2001..
41. Liu, P.; Ziemann, P.J.; Kittelson, D.B.; McMurry, P.H. Generating particle beams of controlled
dimensions and divergence: I. theory of particle motion in aerodynamic lenses and nozzle
expansions. Aerosol Sci. Technol. 1995, 22, 293-313.
42. Liu, P.; Ziemann, P.J.; Kittelson, D.B.; McMurry, P.H. Generating particle beams of controlled
dimensions and divergence: II. experimental evaluation of particle motion in aerodynamic lenses
and nozzle expansions. Aerosol Sci. Technol. 1995, 22, 314-324.
43. Zhang, X. A numerical characterization of particle beam collimation by an aerodynamic
lens-nozzle system: Part I. an individual lens or nozzle. Aerosol Sci. Technol. 2002, 36, 617-631.
44. Hansen, A.D.A.; Rosen, H.; Novakov, T. Real-time measurement of the absorption coefficient of
aerosol particles. Appl. Opt. 1982, 21, 3060-3062.

Atmosphere 2011, 2
199
45. Burtscher, H.; Scherrer, L.; Siegmann, H.C.; Schmidt-Ott, A.; Federer, B. Probing aerosols by
photoelectric charging. J. Appl. Phys. 1982, 53, 3787-3791.
46. Wilson N.K.; Barbour, R.K.; Chuang, J.C.; Mukind, R. Evaluation of a real-time monitor for
fine-particle-bound PAH in air. Polycycl. Aromat. Compd. 1995, 5, 167-174.
47. Maisels, A.; Jordan, F.; Fissan, H. Dynamics of the aerosol particle photocharging process. J.
Appl. Phys. 2002, 91, 3377.
48. Jung, H.; Kittelson, D.B. Characterization of aerosol surface instruments in transition regime.
Aerosol Sci. Technol. 2005, 39, 902-911.
49. Chen, D.R.; Pui, D.; Hummes, D.; Fissan, H.; Quant, F.; Sem, G. Design and evaluation of a
nanometer aerosol differential mobility analyzer (Nano-DMA). J. Aerosol Sci. 1998, 29, 497-509.
50. Stolzenburg, M.; McMurry, P. An ultrafine aerosol condensation nucleus counter. Aerosol Sci.
Technol. 1991, 14, 48-65.
51. Knutson, E.O.; Whitby, K.T. Aerosol classification by electric mobility: Apparatus, theory, and
applications. J. Aerosol Sci. 1975, 6, 443-451.
52. Keady, B.; Quant, F.; Sem, J. A small, high-flow condensation nucleus counter for clean room
particle monitoring. Poster presented at the 2nd International Conference AAAR-GAeF,
West-Berlin, Germany, 22–26 September 1986; pp. 22-26.
53. Snyder, D.C.; Schauer, J.J. An inter-comparison of two black carbon aerosol instruments and a
semi-continuous elemental carbon instrument in the urban environment. Aerosol Sci. Technol.
2007, 41, 463-474.
54. Szwarc, A. Use of Bio-Fuels in Brazil. In Proceedings of Session Workshop on Mitigation, SBSTA
21 / COP 10, Buenos Aires, Argentina, 9 December 2004.
55. Tan, R. Life-cycle environmental benefits of using bioethanol as a gasoline additive. Philipp. Eng.
J. (Philippines) 2002, 23, 45-58.
56. Mosey, N.J.; Muser, M.H.; Woo, T.K. Molecular mechanisms for the functionality of lubricant
additives. Science 2005, 307, 1612-1615.
57. Zimmermann, R.; Ferge, T.; Gälli, M.; Karlsson, R. Application of Single-particle laser
desorption/ionization time-of-flight mass spectrometry for detection of polycyclic aromatic
hydrocarbons from soot particles originating from an industrial combustion process. Rapid
Commun. Mass Spectrom. 2003, 17, 851-859.
58. De Abrantes, R.; Vicente de Assunção, J.; Pesquero, C.R.; Bruns, R.E.; Nóbrega, R.P. Emission
of polycyclic aromatic hydrocarbons from gasohol and ethanol vehicles. Atmos. Environ. 2009,
43, 648-654.
59. Noble, C.A.; Prather, K.A. Real-time measurement of correlated size and composition profiles of
individual atmospheric aerosol particles. Environ. Sci. Technol. 1996, 30, 2667-2680.
60. Allen, J.O.; Fergenson, D.P.; Gard, E.E.; Hughes, L.S.; Morrical, B.D.; Kleeman, M.J.;
Gross, D.S.; Galli, M.E.; Prather, K.A.; Cass, G.R. Particle detection efficiencies of aerosol time
of flight mass spectrometers under ambient sampling conditions. Environ. Sci. Technol. 2000, 34,
211-217.
61. Park, K.; Kittelson, D.; McMurry, P. Structural properties of diesel exhaust particles measured by
transmission electron microscopy (TEM): Relationships to particle mass and mobility. Aerosol
Sci. Technol. 2004, 38, 881-889.
Atmosphere 2011, 2
200
62. Gross, D.S.; Atlas, R.; Rzeszotarski, J.; Turetsky, E.; Christensen, J.; Benzaid, S.; Olson, J.;
Smith, T.; Steinberg, L.; Sulman, J.; et al. Environmental chemistry through intelligent
atmospheric data analysis. Environ. Model. Softw. 2010, 25, 760-769.
63. Eiguren-Fernandez, A.; Miguel, A.H. Spark ignition vehicle contributions to atmospheric fine
elemental carbon concentrations in coastal, rural and urban communities using polycyclic
aromatic hydrocarbon tracers in the cmb model modified for reactivity. J. Braz. Chem. Soc. 2009,
20, 1358-1364.
64. Dockery, D.W.; Pope, C.A.; Xu, X.; Spengler, J.D.; Ware, J.H.; Fay, M.E.; Ferris, B.G.;
Speizer, F.E. An association between air pollution and mortality in six US cities. N. Engl. J. Med.
1993, 329, 1753.
65. Zanobetti, A.; Franklin, M.; Koutrakis, P.; Schwartz, J. Fine particulate air pollution and its
components in association with cause-specific emergency admissions. Environ. Health 2009, 8, 58.
66. Pearson, J.F.; Bachireddy, C.; Shyamprasad, S.; Goldfine, A.B.; Brownstein, J.S. Association
between fine particulate matter and diabetes prevalence in the US. Diabetes Care 2010, 33, 2196.
67. Venkataraman, C.; Lyons, J.M.; Friedlander, S.K. Size distributions of polycyclic aromatic
hydrocarbons and elemental carbon. 1. sampling, measurement methods, and source
characterization. Environ. Sci. Technol. 1994, 28, 555-562.
68. DeCarlo, P.; Slowik, J.G.; Worsnop, D.R.; Davidovits, P.; Jimenez, J.L. Particle morphology and
density characterization by combined mobility and aerodynamic diameter measurements. Part 1:
Theory. Aerosol Sci.Technol. 2004, 38, 1185-1205.
69. Slowik, J.; Stainken, K.; Davidovits, P.; Williams, L.; Jayne, J.; Kolb, C.; Worsnop, D.;
Rudich, Y.; DeCarlo, P.; Jimenez, J. Particle morphology and density characterization by
combined mobility and aerodynamic diameter measurements. Part 2: application to
combustion-generated soot aerosols as a function of fuel equivalence ratio. Aerosol Sci. Technol.
2004, 38, 1206-1222.
70. Heyder, J.; Gebhart, J.; Rudolf, G.; Schiller, C.F.; Stahlhofen, W. Deposition of particles in the
human respiratory tract in the size range 0.005-15 [Mu] m. J. Aerosol Sci. 1986, 17, 811-825.
71. Falk, H.L.; Kotin, P.; Mehler, A. Polycyclic hydrocarbons as carcinogens for man. Arch. Environ.
Health 1964, 8, 721-730.
72. Cerniglia, C.E. Biodegradation of polycyclic aromatic hydrocarbons. Biodegradation 1992, 3,
351-368.
73. Collins, J.; Brown, J.; Alexeeff, G.; Salmon, A. Potency equivalency factors for some polycyclic
aromatic hydrocarbons and polycyclic aromatic hydrocarbon derivatives. Regul. Toxicol.
Pharmacol. 1998, 28, 45-54.
© 2011 by the authors; licensee MDPI, Basel, Switzerland. This article is an open access article
distributed under the terms and conditions of the Creative Commons Attribution license
(http://creativecommons.org/licenses/by/3.0/).