Embed Size (px)
Citation preview

Bioresource Technology 104 (2012) 451–458
Contents lists available at SciVerse ScienceDirect
Bioresource Technology
journal homepage: www.elsevier .com/locate /bior tech
Empirical characterisation and mathematical modelling of settlementin composting batch reactors
Josep Illa a,⇑, Francesc X. Prenafeta-Boldú b,c, August Bonmatí b, Xavier Flotats b,d
a Dept. of Computing and Industrial Engineering, Universitat de Lleida, Avgda. Jaume II 69, E-25001 Lleida, Spainb GIRO Technological Centre, Rambla Pompeu Fabra 1, E-08100 Mollet del Vallés, Barcelona, Spainc IRTA, Passeig de Gràcia, 44-3, 08007 Barcelona, Spaind Dept. of Agrifood Engineering and Biotechnology, Universitat Politècnica de Catalunya (UPC), Parc Mediterrani de la Tecnologia D-4, E-08860 Castelldefels, Barcelona, Spain
a r t i c l e i n f o a b s t r a c t
Article history:Received 30 July 2011Received in revised form 3 October 2011Accepted 11 October 2011Available online 28 October 2011
Keywords:CompostingNumerical modellingPile settlementRespiratory quotient
0960-8524/$ - see front matter � 2011 Elsevier Ltd. Adoi:10.1016/j.biortech.2011.10.031
⇑ Corresponding author.E-mail address: [email protected] (J. Illa).
The settlement of organic matter during composting was measured at different levels during the activebiodegradation phase in forced-aerated static reactors loaded with different mixtures of organic wastes.The temperature evolution and the concentration of oxygen and carbon dioxide were also recorded in theexhaust gases. Two two-parameter equations and their generalised three-parameter form were fitted tothe experimental data and their capability to predict settlement as a function of time was discussed. Thesettlement field inside the reactors was successfully described with a linear profile. At any given time andvertical position, mass settlement was proportional to the initial height after reactor loading. Further-more, a relationship linking settlement to biological activity was also proposed. Under all tested exper-imental conditions, settlement showed a clear correlation with the cumulative oxygen consumption thatwas modelled with a three parameter equation.
� 2011 Elsevier Ltd. All rights reserved.
1. Introduction
An important mass and volume reduction of the organic mat-ter occurs during the composting process. In composting wind-row piles and aerated batch reactors this phenomenon can bedirectly observed as a progressive settlement of the whole mass,but quantitative data on this phenomenon has seldom been re-ported. A few studies have described pile height reductions from15% to 30% (Trémier et al., 2009; Van Lier et al., 1994; Yue et al.,2008). Conversely, there is abundant information in the literatureabout settlement in landfills (Chia-Nan Liu et al., 2006; Gourcet al., 2010; Hettiarachchi et al., 2007, 2009; Wall and Zeiss,1995), and some numerical models have been proposed for itsdescription. Landfill settlement is a long term phenomenon, andits accurate prediction is needed for the design of covers and pip-ing systems used to recover the produced biogas. Landfill settle-ment models distinguish between immediate settlement due tothe mechanical compression caused by the overlying materialcolumn, primary settlement originated by the dissipation of gasand leachates from the porous matrix, which would be accom-plished within months or years, and secondary settlement causedby the particles reorientation and biodegradation (Wall and Zeiss,1995; Gourc et al., 2010). A simplified two-parameter model was
ll rights reserved.
proposed by Elagroudy et al. (2008) in order to describe thebiodegradation induced settlement in landfills. This model, basedon a first order degradation kinetics, is represented by Eq. (5),and satisfactorily described the measured settlement (d) as afunction of time (t) in lab-scale bioreactors loaded with differentmixtures of municipal solid waste and incubated under anaerobicconditions.
The use of landfill settlement models in compost piles is com-promised by the fact that there are fundamental differences be-tween the two processes. In relation to the temporal and spatialscales, settlement in landfills extends over a period of years or dec-ades, in contrast to weeks or months for the composting process,and the depths of piled material in landfills can reach 30–40 m(Gourc et al., 2010) while composting piles height rarely exceeds3–4 m (McCartney and Chen, 2001). On the other hand, concerningphysical and biochemical phenomena, composting is an aerobicprocess in contrast to the anaerobic conditions that prevail in land-fills. Also, the interstitial pressure of gas and lixiviates in landfillsare important factors determining settlement because of the lowpermeability of the material, while in composting a bulking agentis added in order to keep a high permeability and facilitate the airflow through the material. Air permeability values in the range10�14–10�10 m2 are common in landfill studies (Stoltz et al.,2010; Tinet and Oxarango, 2010) while permeability measure-ments in compost lays in the range 10�10–10�7 m2 (Das andKeener, 1997; Richard et al., 2004).

Fig. 1. Experimental reactor setup with settlement (d) monitoring device: (1) PVCreactor vessel, (2) reactor lid, (3) temperature sensor rod, (4) metallic rigid grid, (5)semi rigid plastic movable grids, (6) wood rods, (7) straight wires, (8) static support,(9) springs, (10) reference position, (11) bottom plenum, (12) air inlet, (13) topplenum, (14) gases outlet, (15) thermocouples, (16) flow metre, and (17) off gasanalyser.
452 J. Illa et al. / Bioresource Technology 104 (2012) 451–458
To our knowledge, only few authors have attempted to quantifythe settlement phenomenon in the composting process (Van Lieret al., 1994; Yue et al., 2008). Van Lier et al. (1994) used Eq. (5)to describe the height reduction in a composting container and ad-justed parameter a as a function of the initial moisture content ofthe mixture. Yue et al. (2008) measured the settlement at differentdepths in lab-scale compost reactors filled with various mixtures oforganic substrates, and described the process as being composedby two main stages: a physical compressive settlement that oc-curred in the first two days of composting, and the mass loss set-tlement that was attributed to the organic matter degradationand moisture evaporation. The measured settlement velocity wasused to fit a three-parameter equation (Eq. (1)). Relatively good fitswere obtained during the measured period (r2 > 0.98, t = 23 days).However, Eq. (1) lacks physical sense as it predicts a constant set-tlement velocity (parameter b) in the long term:
dddt¼ ae
�tc þ b ð1Þ
Settlement induces changes in the mass physical properties thathave an important role in the development of the process, such asfree air space, air permeability, thermal conductivity, specific heatcapacity, and bulk density. Those changes might affect the pressureloss of air through the pile and, consequently, the required aerationpressure (McCartney and Chen, 2001; Schaub-Szabo and Leonard,1999).
Deterministic composting models are based on the principles ofheat and mass transfer and on the biochemical and microbiologicalkinetics, and can be formulated as a set of ordinary differentialequations in which time is the independent variable (Kaiser,1996; Sole-Mauri et al., 2007; Tremier et al., 2005). Upon a set ofinitial values for the model state variables, the evolution of the sys-tem can be obtained by numerical integration. In order to intro-duce the settlement phenomenon in such models, a relationlinking settlement to the independent variable (time) or to someof the state variables (i.e. temperature, or oxygen consumption)is required.
In the present study, settlement was measured at different lev-els of the composting mass in lab-scale composting reactors oper-ated under continuous aeration and static conditions. Theexperimental data were used to explore the goodness of fit of anumber of equations designed to predict settlement as a functionof time. Moreover, correlations between settlement and biologicalactivity were also explored with the aim of enabling the integra-tion of the mass settlement phenomenon into general compostingmodels.
2. Methods
2.1. Experimental setup
Three identical vertical reactors (R1, R2 and R3) of 70 L volumeeach were simultaneously operated with forced aeration and staticconditions (Fig. 1). The reactors were constructed with PVC pipeelements of 300 mm diameter, insulated with a 35 mm thick layerof mineral wool. The top and bottom surfaces were closed with50 mm of rigid insulation plate (Roofmate, Spain). The thermalinsulation of each reactor, determined by the analysis of the heat-ing–cooling curves of the water filled reactor, corresponds to a glo-bal heat transfer coefficient between 1.03 and 1.13 W m�2 K�1. Arigid metallic grid (6 � 6 mm) placed 90 mm above the bottomseparated the composting mass from the bottom plenum, whichcontained the air inlet and a valve to manually remove the leach-ate. Air from a pressurised pipe was flowed through a pressurereduction valve and a thermal flow metre (M + W Instruments,
Germany) to the bottom plenum at a rate of 0.24 m3 h�1 (at298 K, 105 Pa). Two consecutive experimental runs (r1 and r2)were performed on the three reactors which, for each run, wereoperated in parallel and loaded with different mixtures of organicmatter.
2.2. Organic substrates
Fresh cow manure, organic fraction of municipal solid waste,and non-digested sludge from a municipal wastewater treatmentplant were used as composting substrates, and wood chips of30 � 10 � 5 mm maximum size were added as bulking agent. Dif-ferent mixtures of these basic components were used in the com-posting experiments (Table 1). The non-digested sludge had aliquid texture and was added once the solids had been mixed.Moisture, dry matter content and fats were determined accordingto the Standard Methods for the examination of Water and Waste-water (APHA, AWWA, WEF, 1995).
2.3. Process monitoring
Temperature was monitored with seven J type thermocouples(RHS, United Kingdom) distributed along each reactor, held by a ri-gid vertical PVC central rod (Fig. 1). A scan of all temperature sen-sors was programmed each 15 min by means of a HP-34970A datalogger system (Agilent, USA). Samples of the outflow gases wereautomatically pumped out of the top plenum for 3 min to a mult-isensor gas analyser system (Sensotrans, S.L., Spain) equipped withan electrochemical sensor and an IR sensor for measuring the con-centration of oxygen and CO2, respectively, which were then regis-tered in the data logger. This operation was repeated every 45 min.The instantaneous oxygen uptake at time ti(h), mO2,i (g O2 h�1), and

Table 1Total mass, bulk density, and initial composition of the mixtures used in the different composting experiments.
Run Reactor Total mass(kg)
Bulk density(kg/m3)
Moisture content(% wba)
Volatile solids(% dba)
Fat content(% dba)
Volumetric mixture(WS:CM:OF:NS)b
r1 R1 36.60 502.7 64.7 85.9 1.6 1:1:0:0R2 42.15 578.9 64.8 81.5 4.7 1:2:1:0R3 30.90 553.3 70.6 85.8 1.8 1:1:0:0.37
r2 R1 34.26 466.0 72.4 83.1 2.3 1:3:0:0R2 36.05 492.7 46.1 77.7 9.0 1:1:6:0R3 45.65 627.0 69.7 85.8 1.7 1:1:0:0.30
a wb: wet basis; db: dry basis.b WS: Wood ships; CM: Cow manure; OF: Organic fraction of municipal solid waste; NS: Non digested sludge.
J. Illa et al. / Bioresource Technology 104 (2012) 451–458 453
the cumulative oxygen consumption, cO2,i+1 (g O2), up to timeti+1(h), were calculated with Eqs. (2) and (3), respectively,
mO2 ;i ¼Pa �MO2
R � TaQ oðhO2o � hO2 iÞ ð2Þ
cO2 ;iþ1 ¼ cO2 ;i þPa �MO2 � Q o
R � TahO2o �
hO2 i þ hO2 iþ1
2
� �ðtiþ1 � tiÞ ð3Þ
where Pa is the atmospheric pressure (105 Pa), MO2 the molecularmass of oxygen (32 g mol�1), R the ideal gas constant(8.314 J mol�1 K�1), Ta the absolute room temperature (298 K), Qo
the total air inflow (0.24 m3 h�1), hO2o the dimensionless in air oxy-gen concentration (0.209 v/v) and hO2i the measured oxygen con-centration (v/v) at time ti. The respiratory quotient RQi at time ti,representing the instantaneous molar relation between CO2 pro-duced and O2 consumed, was computed according to Eq. (4), beinghCO2i (v/v) the measured CO2 concentration in exhaust gas at time ti:
RQi ¼hCO2 i
hO2o � hO2 ið4Þ
Settlement was monitored by placing four semi-rigid circularplastic grids during the reactor mass loading, which delimited fivelayers of 20 cm thick (N1, N2, . . ., N5 in Fig. 1). A hole was perfo-rated at the centre of each grid in order to allow free downwardsmovement when the material settled. The distance from the reac-tor top edge to each grid was measured during the reactor loadingand unloading, at the start and the end of experiments, respec-tively. Settlement was also measured continuously by placing awire attached to a wood rod placed diametrically underneath thegrids that transferred the settlement movement to an externalspring, through a small hole in the lid, where the downward dis-placement (d) could be regularly measured. In order to keep thewires straight during the reactors loading, a thin iron pipe wasused as a sheath and was pulled out when the reactor was filled.
2.4. Numerical settlement description
Goodness of fit from different equations establishing a relation-ship between settlement (d) and time (t) was checked againstexperimental data generated from different settlement processes.In Eqs. (5) and (6), d(t) is predicted by adjusting two parameters,a and b, where a represents the time when settlement reaches63.2% and 50%, respectively, of the maximum attainable settle-ment, which is represented by parameter b. Eqs. (7) and (8) aregeneralised forms of Eqs. (5) and (6), where parameter c introducesan inflexion point in the settlement curve when c > 1:
dðtÞ ¼ bð1� e�ta Þ ð5Þ
dðtÞ ¼ bðtaÞ
1þ ðtaÞð6Þ
dðtÞ ¼ bð1� e�ðtaÞ
c Þ ð7Þ
dðtÞ ¼ bðta Þ
c
1þ ðta Þc ð8Þ
The hypothesis of proportionality between settlement curvesmeasured at different levels within one reactor and run was tested.This premise implies parameters a and c must have a constant va-lue in all settlement series from one reactor experiment.
2.5. Parameter estimation
The least square sum of errors criterion was used in the fittingof the selected equations to the single series of experimental set-tlement data. Eq. (9) represents the objective function used inthe simultaneous fitting of the settlement series of one reactor,where the i index refers to settlement points in one series, nij rep-resents the number of measurements i contained in series j, nj isthe number of settlement series in one reactor, each series corre-sponding to an initially different level, d�ij is the measured settle-ment at time i and level j, and dij is the predicted settlement attime i level j:
fobjða; b1; . . . ; bnj; cÞ ¼
Xnj
j¼1
Pnij
i¼1ðdij � d�ijÞ2
nijðmaxifd�ijg �minifd�ijgÞ2
" #ð9Þ
The Monte Carlo method was used to establish the 95% confi-dence intervals on the estimated parameter values (Hauser,2009). In summary, the method consists in generating additionalsynthetic data sets, each one being then processed with the sameoptimisation routine as the experimental data set and, thus,obtaining a new set of parameters. From the generation and anal-ysis of the synthetic data sets, the distribution of parameter valuesis then used to generate confidence intervals. The method is basedon the assumption that the synthetic data sets deviate from thedata predicted by the model in the same way as the measured datadoes. This was accomplished by generating synthetic data (1000iterations) with the same standard deviation as the original dataset. All routines for parameter estimation and Monte Carlo analysiswere run in MatLab (The Mathworks, USA).
3. Results and discussion
The temperature evolution measured inside the reactors andthe corresponding oxygen concentration in the exhaust gases pre-sented a similar profile in all experiments, as exemplified in Fig. 2for run r2. Temperature reached its maximum within 1–2 daysupon the experiment start and then slowly decreased, sometimeswith the occurrence of secondary temperature peaks. Interestingly,stages of rapid temperature increase (maximal temperature slope)coincided with local minimum values in the oxygen concentrationcurves. This indicates a high biological activity, manifested both bythe generation of metabolic heat and by a high respiration rate. Yet,differences on the length of the thermophilic phase were observedamong the different experiments. The high temperature plateau

0
10
20
30
40
50
0
10
20
30
40
50
60
70
80
0 50 100 150 200 250 300 350 400
Oxygen
concentration(%
)TeTT
mpe
ratu
re(º
C)
0,5
0,8
1,0
1,3
1,5
0 50 100 150 200 250 300 350 400
Res
pira
tory
quot
ient
Time (h)
Fig. 2. Evolution of temperature and oxygen concentration during run r2 in reactors R1 (solid line), R2 (dashed line), and R3 (dotted line). The depicted temperature wasregistered by sensor S5 located at the centre of layer N4 (Fig. 1), and the oxygen concentration was monitored in the exhaust gas in the reactor top plenum. The respiratoryquotient (RQ) is depicted in the second graph, the asterisk marks the beginning of the increasing RQ trend.
0
25
50
75
100
125
150
0 50 100 150 200 250 300 350 4000
10
20
30
40
50
60
0 50 100 150 200 250 300 350
0
50
100
150
200
0 50 100 150 200 250 300 350
0
50
100
150
200
0 50 100 150 200 250 300 350
0
50
100
150
200
0 50 100 150 200 250 300 350 400
0
25
50
75
100
125
150
0 50 100 150 200 250 300 350 400
Time (h)
Set
tlem
ent(
mm
)
r1, R3 r2, R3
2R,2r2R,1r
r1, R3 r2, R3
Fig. 3. Time-course settlement measured curves (points) in relation to the fitted values predicted by Eq. (10) using the initial positions measured during the reactor loading(Z0; dashed lines) and the corrected initial positions (Zoc; solid lines) accounting for the preliminary mass settlement during reactor loading.
454 J. Illa et al. / Bioresource Technology 104 (2012) 451–458

J. Illa et al. / Bioresource Technology 104 (2012) 451–458 455
lasted for a longer in reactor R2, compared to the R1 and R3 (Fig. 2),possibly due to the higher fatty content in the organic fraction ofmunicipal solid waste (Table 1). The respiratory quotient (RQ) re-mained in the range 0.7–1.3, with the lowest values observed dur-ing the period 50–100 h (Fig. 2). In agreement with the reactionstoichiometrics, the aerobic biodegradation of lipids and proteinsresulted in lower RQ values (0.7–0.9) than the degradation of themore recalcitrant celluloses and lignins (RQ = 1). De Guardia et al.(2010) compared the RQ evolution in the composting of differentwastes and pointed out that, besides the biological activity, thehigh values observed during the first hours of the process(RQ > 2) could also be caused by factors governing CO2 accumula-
Table 2Estimated parameter values a, b and c and their corresponding 95% confidence intervals (c.i.determination coefficient.
Eq. Run Reactor Level a(h) c.i.
(5) r1 R1 2 37.26 33.45–41.331 38.29 33.56–43.20
R2 2 36.85 33.22–40.631 41.37 38.90–43.72
R3 1 28.14 25.10–31.25r2 R1 3 62.69 54.15–73.09
2 57.40 50.67–64.971 65.85 59.27–72.68
R2 3 113.75 104.35–123.652 129.29 104.54–157.701 109.55 89.64–132.93
R3 3 47.22 40.16–55.562 50.09 43.56–57.101 53.33 48.33–58.55
(6) r1 R1 2 29.18 25.65–33.211 30.41 26.11–35.51
R2 2 27.98 26.56–29.451 33.59 30.13–37.48
R3 1 20.28 17.34–23.42r2 R1 3 55.37 46.77–65.54
2 49.74 43.78–57.661 59.44 50.31–70.18
R2 3 126.92 103.57–155.592 159.53 112.32–235.681 126.68 88.05–190.88
R3 3 38.27 32.50–44.982 40.71 35.79–46.151 44.11 38.48–50.31
(7) r1 R1 2 38.44 34.39–43.481 40.02 34.79–47.28
R2 2 39.87 37.54–42.811 42.55 40.26–45.26
R3 1 28.64 25.31–32.98r2 R1 3 76.07 62.31–102.2
2 63.74 55.78–75.561 66.20 59.13–74.28
R2 3 103.88 98.49–109.482 108.42 103.84–113.051 96.67 93.74–99.92
R3 3 64.65 50.63–101.672 61.66 53.24–78.991 56.12 50.90–63.32
(8) r1 R1 2 26.53 24.21–29.341 27.59 24.38–32.10
R2 2 28.48 26.68–30.681 30.94 28.38–34.69
R3 1 19.65 17.62–21.85r2 R1 3 49.12 42.32–61.06
2 42.32 38.37–48.071 46.20 42.74–50.64
R2 3 79.35 76.41–82.702 84.05 81.98–86.611 74.76 71.77–77.87
R3 3 40.37 32.60–56.562 40.05 34.80–49.091 38.17 35.30–41.83
tion, such as temperature, pH and moisture. Other authors (Geaet al., 2004) have reported a RQ decrease from 0.95 to 0.87 whenfats and other low oxygen containing material were mixed withOFMSW. Hence, the higher fatty content in R2 might also explainthe lower RQ values observed in this reactor (Table 1).
The settlement time-course evolution followed a similar gen-eral trend in all experiments (Fig. 3). A fast settlement phase wasobserved during the first days, followed by a gradual decelerationof the process that progressed towards the stagnation. In certaincases (reactors R2 and R3 in run r2), an inflexion point was clearlyobserved during the first hours. Eqs. (5)–(8) were fitted to experi-mental settlement data and the obtained parameter estimates,
) when fitting Eqs. (5)–(8) to the measured individual settlement curves from Fig. 3; r2:
b(mm) c.i. c(–) c.i. r2
167.55 163.64–171.82 – – 0.98951.59 50.16–53.17 – – 0.984
181.51 177.78–185.58 – – 0.99071.29 70.26–72.22 – – 0.99752.18 50.93–53.41 – – 0.984
156.33 151.44–161.52 – – 0.965116.00 113.19–118.83 – – 0.976
77.11 75.44–78.96 – – 0.984129.33 125.72–133.10 – – 0.991
85.22 79.86–91.60 – – 0.96763.63 60.15–68.01 – – 0.963
117.52 114.08–121.43 – – 0.95089.10 86.68–91.36 – – 0.96661.21 60.12–62.30 – – 0.985
190.27 185.07–195.81 – – 0.99358.83 56.98–60.87 – – 0.990
205.02 202.86–207.23 – – 0.99981.98 80.01–84.10 – – 0.99557.69 56.24–59.43 – – 0.988
185.80 178.50–193.84 – – 0.981136.40 132.35–141.08 – – 0.985
92.31 88.44–96.41 – – 0.981170.53 158.86–183.78 – – 0.983117.47 103.19–139.41 – – 0.953
84.62 74.78–100.43 – – 0.942134.75 130.96–139.77 – – 0.979102.59 100.11–105.25 – – 0.988
70.95 69.05–72.95 – – 0.988
169.65 165.57–175.41 0.87 0.75–1.01 0.99152.43 50.75–54.92 0.85 0.70–1.02 0.987
187.66 184.88–191.06 0.74 0.69–0.80 0.99872.16 71.11–73.30 0.88 0.82–0.95 0.99852.83 51.44–54.57 0.82 0.66–0.98 0.987
166.93 157.62–183.45 0.76 0.62–0.91 0.974119.98 115.54–125.98 0.83 0.71–0.97 0.980
77.25 75.13–79.69 0.99 0.86–1.15 0.984123.30 121.25–125.82 1.21 1.13–1.29 0.996
76.94 75.82–78.20 1.63 1.51–1.75 0.99658.84 58.23–59.48 1.70 1.61–1.79 0.998
129.45 121.75–146.06 0.63 0.51–0.78 0.97495.35 91.62–102.34 0.70 0.59–0.81 0.98262.28 60.89–64.22 0.88 0.78–0.99 0.987
179.82 174.46–187.35 1.23 1.06–1.40 0.99555.76 53.33–59.48 1.20 0.99–1.45 0.992
206.97 201.77–212.72 0.97 0.90–1.05 0.99978.16 75.25–81.87 1.17 1.02–1.35 0.99654.76 53.10–57.23 1.31 1.05–1.60 0.991
175.83 165.30–191.34 1.15 0.94–1.41 0.982125.54 120.81–132.48 1.28 1.10–1.50 0.989
80.45 78.24–83.18 1.54 1.35–1.74 0.992132.58 130.09–135.43 1.65 1.55–1.73 0.998
80.11 79.07–81.24 2.33 2.21–2.45 0.99960.55 59.53–61.65 2.54 2.33–2.77 0.997
138.05 128.20–154.68 0.94 0.75–1.17 0.979101.80 96.61–110.44 1.02 0.85–1.22 0.988
65.38 63.60–67.68 1.32 1.17–1.49 0.993
456 J. Illa et al. / Bioresource Technology 104 (2012) 451–458
within a 95% confidence interval, and the determination coefficient(r2) are summarised in Table 2. The two parameter equations (Eqs.(5) and (6)) produced relatively good fits in most of the cases(r2 > 0.98), being the poorest fits (r2 = 0.94–0.97) obtained in runr2 for reactors R2 and R3. Eq. (6) generally resulted in better fitsthan Eq. (5). However, the inflexion on the settlement curvesobserved in experiment r2 could only be simulated with three-parameter equations, thus resulting in better fits to the experimen-tal data. Eq. (8) produced slightly higher r2 values than Eq. (7) and,thus, was selected for further studies. It is important to notice thatEqs. (5)–(8) are just simple models that adjust the measured dataas a function of time, and that they overlook the physical natureof the composting and settlement phenomena. Yet, other authorsused similar approaches to model different composting processes.Ponsà et al. (2011) used exponential (Eq. (5)) and linear-exponen-tial (Eq. (11)) models when describing the kinetics of CO2 produc-tion in the aerobic degradation of different wastes. Gil et al. (2011)also used these models, together with the hyperbolic model (Eq.(6)), to fit data on N mineralisation in soils amended with differenttypes of compost. It is interesting to mention that the method theyused to estimate the parameter confidence intervals resulted, insome cases, in negative lower limits which implied the rejectionof equations providing high r2 fit values. Here, such inconveniencewas avoided by using the Monte Carlo randomisation method,which provides meaningful estimates for the confidence intervals.
Within the same reactor and run, no significant differenceswere found among the values of parameter a and c obtained by fit-ting individual settling curves measured at different levels, regard-less of the used equation (Table 2). These points towards thevalidity of the hypothesis that there is a proportional relationshipamong the settlement curves measured at different depths withinthe same reactor. Such proportionality was also verified in binaryplots, within each reactor, of the upper levels settlement curvesversus the lower one (not shown), in which highly linear correla-tions were obtained (R2 > 0.993). On the other hand, the initial
Table 3Initial position of the measured composting mass level, referred to level 0 (Fig. 1), and ficorrespond to the fits of Eq. (8) under the proportionality hypothesis.
Run Reactor Level a Z0 (mm) Final settle
h1
r1 R1 NS 1030 220(2) 870 –(1) 390 –
R2 NS 1030 230(2) 870 –(1) 390 –
R3 NS 790 140(1) 390 –
r2 R1 N5 1040 230N4 (3) 820 190N3 (2) 620 160N2 (1) 430 110N1 220 50
R2 N5 1040 140 c
N4 (3) 820 180N3 (2) 610 160N2 (1) 420 90N1 220 40
R3 N5 1030 180 c
N4 (3) 810 190N3 (2) 630 150N2 (1) 490 100N1 220 20
a Positions N1, N2, N3, N4 and N5 correspond to the upper side of each layer (Fig. 1), anindicate the height of the wood rod underneath the plastic grids.
b Corrected initial positions accounting for the preliminary settling during reactor loac The measured settlement in the upper levels is lower than in the lower ones due to
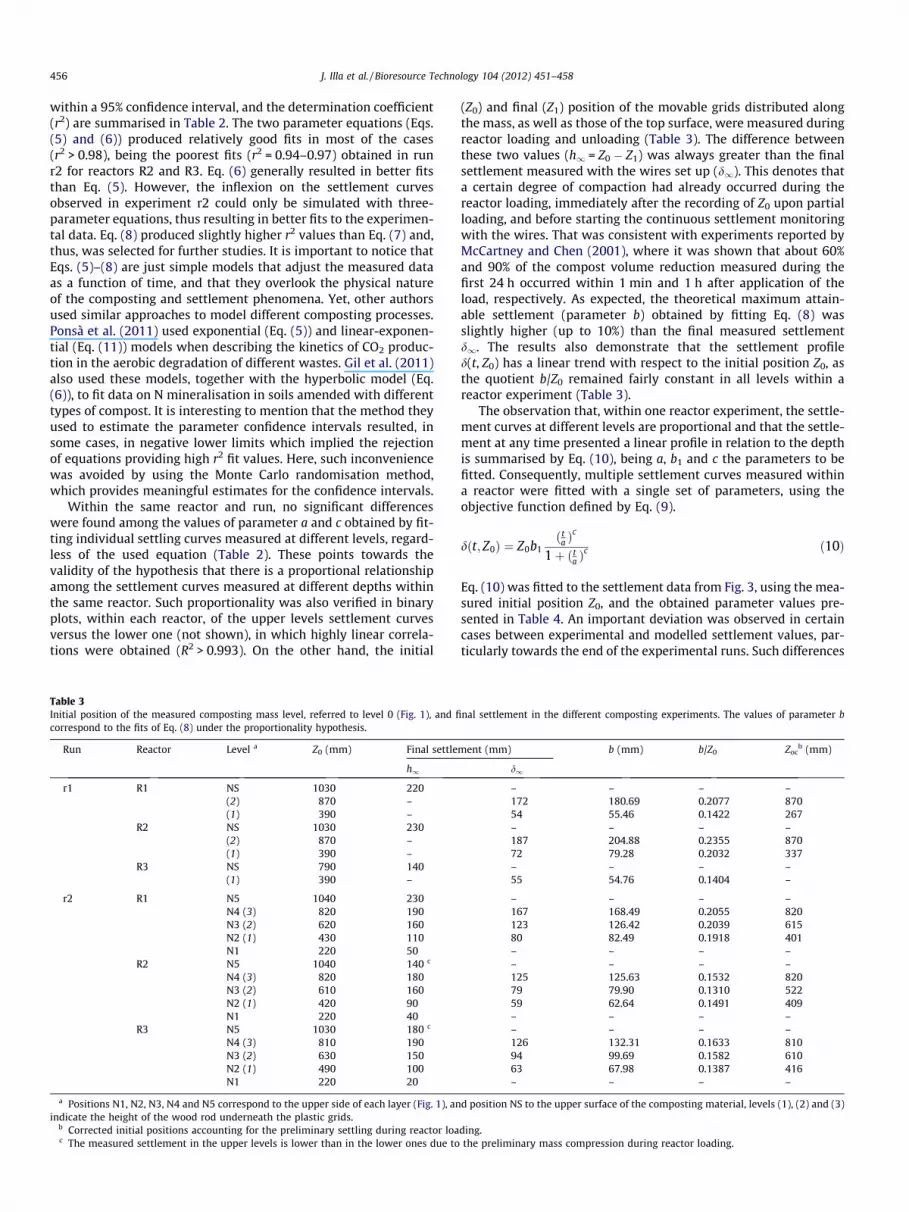
(Z0) and final (Z1) position of the movable grids distributed alongthe mass, as well as those of the top surface, were measured duringreactor loading and unloading (Table 3). The difference betweenthese two values (h1 = Z0 � Z1) was always greater than the finalsettlement measured with the wires set up (d1). This denotes thata certain degree of compaction had already occurred during thereactor loading, immediately after the recording of Z0 upon partialloading, and before starting the continuous settlement monitoringwith the wires. That was consistent with experiments reported byMcCartney and Chen (2001), where it was shown that about 60%and 90% of the compost volume reduction measured during thefirst 24 h occurred within 1 min and 1 h after application of theload, respectively. As expected, the theoretical maximum attain-able settlement (parameter b) obtained by fitting Eq. (8) wasslightly higher (up to 10%) than the final measured settlementd1. The results also demonstrate that the settlement profiled(t, Z0) has a linear trend with respect to the initial position Z0, asthe quotient b/Z0 remained fairly constant in all levels within areactor experiment (Table 3).
The observation that, within one reactor experiment, the settle-ment curves at different levels are proportional and that the settle-ment at any time presented a linear profile in relation to the depthis summarised by Eq. (10), being a, b1 and c the parameters to befitted. Consequently, multiple settlement curves measured withina reactor were fitted with a single set of parameters, using theobjective function defined by Eq. (9).
dðt; Z0Þ ¼ Z0b1ðta Þ
c
1þ ðta Þc ð10Þ
Eq. (10) was fitted to the settlement data from Fig. 3, using the mea-sured initial position Z0, and the obtained parameter values pre-sented in Table 4. An important deviation was observed in certaincases between experimental and modelled settlement values, par-ticularly towards the end of the experimental runs. Such differences
nal settlement in the different composting experiments. The values of parameter b
ment (mm) b (mm) b/Z0 Zocb (mm)
d1
– – – –172 180.69 0.2077 87054 55.46 0.1422 267– – – –187 204.88 0.2355 87072 79.28 0.2032 337– – – –55 54.76 0.1404 –
– – – –167 168.49 0.2055 820123 126.42 0.2039 61580 82.49 0.1918 401– – – –– – – –125 125.63 0.1532 82079 79.90 0.1310 52259 62.64 0.1491 409– – – –– – – –126 132.31 0.1633 81094 99.69 0.1582 61063 67.98 0.1387 416– – – –
d position NS to the upper surface of the composting material, levels (1), (2) and (3)
ding.the preliminary mass compression during reactor loading.

Table 4Best fitted values for parameters a, b1 and c from Eq. (10) using the measured initial position Z0 and the corrected value (Zoc) accounting for the preliminary mass compressionduring reactor loading (Table 3). Determination coefficient (r2) for each fit is also presented.
Run Reactor Level Equation fit with Z0 Equation fit with Zoc
a (h) b1 c r2 a0 (h) b01 c0 r2
r1 R1 2 27.13 0.16 1.21 0.685 27.03 0.21 1.22 0.9951 0.836 0.992
R2 2 29.88 0.22 1.06 0.957 29.80 0.24 1.06 0.9981 0.966 0.995
r2 R1 3 45.37 0.20 1.32 0.974 45.36 0.21 1.31 0.9812 0.984 0.9881 0.975 0.990
R2 3 78.58 0.14 2.16 0.966 78.32 0.15 2.15 0.9912 0.953 0.9961 0.986 0.995
R3 3 38.62 0.15 1.11 0.922 38.70 0.16 1.10 0.9772 0.969 0.9871 0.906 0.990
Fig. 4. Dimensionless settlement (d/Z0) of the composting mass top level versus thecumulated oxygen consumption (cO2), per unit of initial volatile solids (VSo), in runsr1 and r2 and reactors R1, R2, and R3. Points correspond to measured values andsolid lines to fits with Eq. (11). Arrows denote the point at which the respiratoryquotient shifts towards increasing values.
J. Illa et al. / Bioresource Technology 104 (2012) 451–458 457
were attributed to the error contained in the initial positions of theinternal movable grids (Z0) because of the early settlement duringreactor loading. Hence, the fitting with Eq. (10) was further im-proved by correcting the initial position values (Zoc), in order to ac-count for the early settling. For each reactor, the value of Zoc in levelj was estimated using the maximum value of the relation (b/Z0)j,this is Zocj = bj/(b/Z0)max, as shown in Table 3. The determinationcoefficients obtained for the simultaneous fitting of the settlementmultiple curves in one reactor with Eq. (10) decreased slightly whencompared with individual fits using Eq. (8), but are still generallybetter than those obtained with Eq. (7) (Tables 2 and 4).
To our knowledge, a correlation between settlement and thebiological activity of the composting mass has not been describedin the literature. From our data, such relationship between thesetwo phenomena was not apparent in a preliminary analysis. Reac-tors with different temperature evolution curves presented noclear differentiating trends in relation to the settlement profile.Some authors have also reported the non-correlation betweentemperature and settlement (McCartney and Chen, 2001; Yueet al., 2008) and suggested that settlement can only be describedas a function of time (Elagroudy et al., 2008; Van Lier et al.,1994). Here, the concept of biodegradation-induced settlementcould not be established as a simple correlation between settle-ment and temperature or exhaust gas oxygen concentration. Be-sides biological activity, the temperature evolution is affected byother physical factors, such as the thermal inertia of the bulk mass,the evaporation rate, the airflow, and the level of thermal insula-tion of the reactor. Hence, temperature is probably an inaccurateindicator of biological activity. On the other side, as an aerobic pro-cess, microbial activity in the composting process is directly linkedto carbon oxidation and, thus, to oxygen consumption and carbondioxide production rates. Oxygen concentration in the exhaustgases depends on the airflow rate and on the net oxygen consump-tion rate. Being the composting mass settlement measured at theupper level the effect of the cumulative strain of the underlyinglayers, it is reasonable to expect a relation with the biological activ-ity measured as cumulative oxygen consumption (cO2). Eq. (11)was eventually selected, which expresses the settlement (d) as afunction of the cumulative oxygen consumption (cO2):
d ¼ B 1� e�co2
A
� �þ C � co2 ð11Þ
The representation of the measured upper level settlement ver-sus cumulative oxygen consumption resulted in a series of plotsconsistently following a similar pattern (Fig. 4) that were success-fully fitted with Eq. (11) (Table 5). A sensibility analysis on thedimensionless settlement predicted by Eq. (11) at the reference
points x1 and x2 (x1, x2) = (150, 400) g O2 kg�1 VSo, has been carriedout by increasing the parameter values in ±5%, 10% and 20% aroundthe values A = 50 g O2 kg�1 VSo, B = 0.12, and C = 0.2 � 10�3
kg VSo g�1 O2. The greatest sensitivity corresponded to parameterB, with dimensionless settlement variation as high as 16% whenmodifying the parameters value up to 20%, parameter C causedan intermediate variation (up to 8%) and the influence of parame-ter A was less than 3%. No correlation between parameters A, B andC was found.
It is interesting to notice the long term linear correlation be-tween settlement and oxygen consumption. Such correlation wasalways observed after the respiratory quotient (RQ) reached itsminimum value. It appears that, regardless of the composition ofthe composting mass, there are two clearly differentiated stagesin the settlement process. A preliminary phase of fast settlementwould primarily be attributed to the mechanical mass compressionunder its own weight, and would start already during the reactorloading. This phenomenon has largely been reported in the litera-ture, being the load–strain relation often described with an expo-nential expression (Das and Keener, 1997). The biological-drivensettlement stage, instead, would correspond to a slower processpossibly dominated by de progressive biodegradation of the morerecalcitrant polymeric organic matter. Settlement would then be
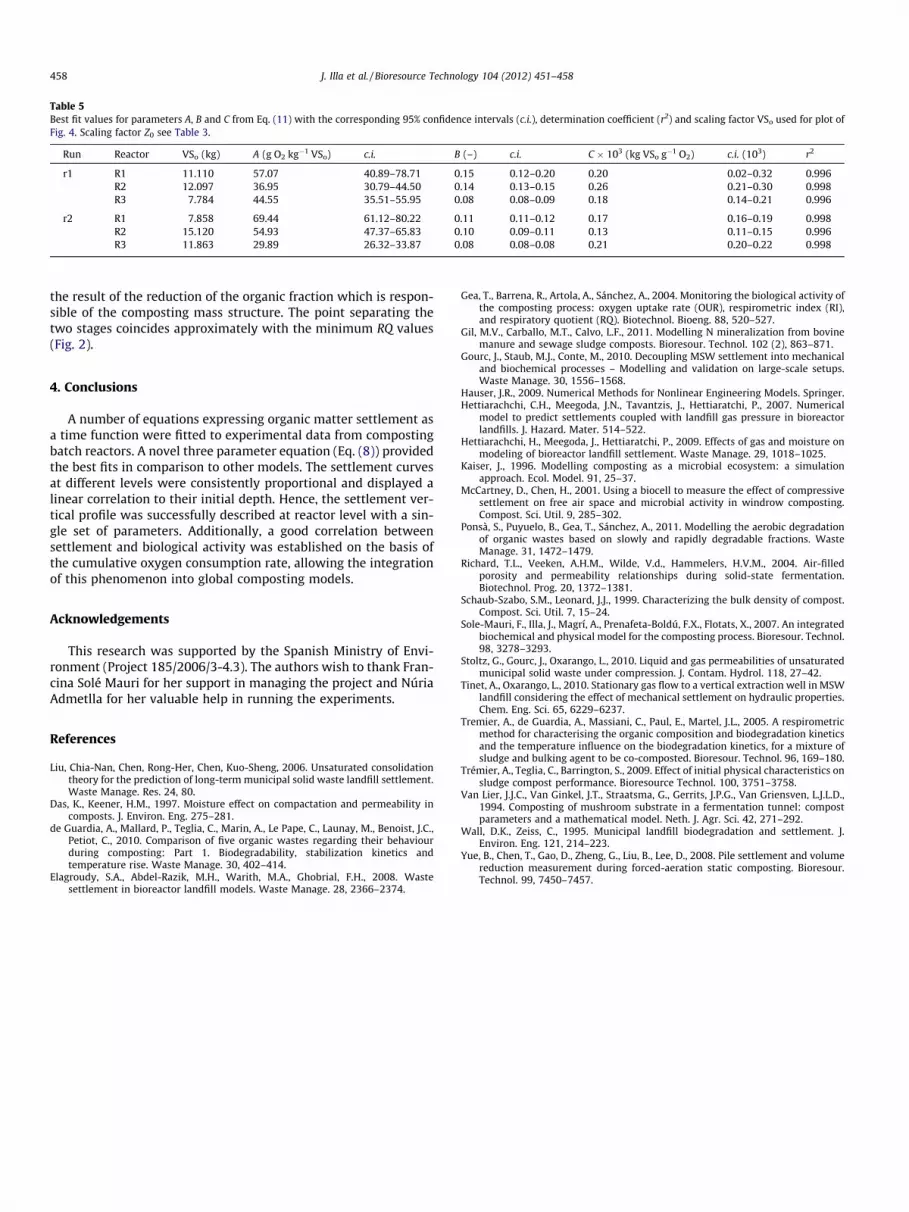
Table 5Best fit values for parameters A, B and C from Eq. (11) with the corresponding 95% confidence intervals (c.i.), determination coefficient (r2) and scaling factor VSo used for plot ofFig. 4. Scaling factor Z0 see Table 3.
Run Reactor VSo (kg) A (g O2 kg�1 VSo) c.i. B (–) c.i. C � 103 (kg VSo g�1 O2) c.i. (103) r2
r1 R1 11.110 57.07 40.89–78.71 0.15 0.12–0.20 0.20 0.02–0.32 0.996R2 12.097 36.95 30.79–44.50 0.14 0.13–0.15 0.26 0.21–0.30 0.998R3 7.784 44.55 35.51–55.95 0.08 0.08–0.09 0.18 0.14–0.21 0.996
r2 R1 7.858 69.44 61.12–80.22 0.11 0.11–0.12 0.17 0.16–0.19 0.998R2 15.120 54.93 47.37–65.83 0.10 0.09–0.11 0.13 0.11–0.15 0.996R3 11.863 29.89 26.32–33.87 0.08 0.08–0.08 0.21 0.20–0.22 0.998
458 J. Illa et al. / Bioresource Technology 104 (2012) 451–458
the result of the reduction of the organic fraction which is respon-sible of the composting mass structure. The point separating thetwo stages coincides approximately with the minimum RQ values(Fig. 2).
4. Conclusions
A number of equations expressing organic matter settlement asa time function were fitted to experimental data from compostingbatch reactors. A novel three parameter equation (Eq. (8)) providedthe best fits in comparison to other models. The settlement curvesat different levels were consistently proportional and displayed alinear correlation to their initial depth. Hence, the settlement ver-tical profile was successfully described at reactor level with a sin-gle set of parameters. Additionally, a good correlation betweensettlement and biological activity was established on the basis ofthe cumulative oxygen consumption rate, allowing the integrationof this phenomenon into global composting models.
Acknowledgements
This research was supported by the Spanish Ministry of Envi-ronment (Project 185/2006/3-4.3). The authors wish to thank Fran-cina Solé Mauri for her support in managing the project and NúriaAdmetlla for her valuable help in running the experiments.
References
Liu, Chia-Nan, Chen, Rong-Her, Chen, Kuo-Sheng, 2006. Unsaturated consolidationtheory for the prediction of long-term municipal solid waste landfill settlement.Waste Manage. Res. 24, 80.
Das, K., Keener, H.M., 1997. Moisture effect on compactation and permeability incomposts. J. Environ. Eng. 275–281.
de Guardia, A., Mallard, P., Teglia, C., Marin, A., Le Pape, C., Launay, M., Benoist, J.C.,Petiot, C., 2010. Comparison of five organic wastes regarding their behaviourduring composting: Part 1. Biodegradability, stabilization kinetics andtemperature rise. Waste Manage. 30, 402–414.
Elagroudy, S.A., Abdel-Razik, M.H., Warith, M.A., Ghobrial, F.H., 2008. Wastesettlement in bioreactor landfill models. Waste Manage. 28, 2366–2374.
Gea, T., Barrena, R., Artola, A., Sánchez, A., 2004. Monitoring the biological activity ofthe composting process: oxygen uptake rate (OUR), respirometric index (RI),and respiratory quotient (RQ). Biotechnol. Bioeng. 88, 520–527.
Gil, M.V., Carballo, M.T., Calvo, L.F., 2011. Modelling N mineralization from bovinemanure and sewage sludge composts. Bioresour. Technol. 102 (2), 863–871.
Gourc, J., Staub, M.J., Conte, M., 2010. Decoupling MSW settlement into mechanicaland biochemical processes – Modelling and validation on large-scale setups.Waste Manage. 30, 1556–1568.
Hauser, J.R., 2009. Numerical Methods for Nonlinear Engineering Models. Springer.Hettiarachchi, C.H., Meegoda, J.N., Tavantzis, J., Hettiaratchi, P., 2007. Numerical
model to predict settlements coupled with landfill gas pressure in bioreactorlandfills. J. Hazard. Mater. 514–522.
Hettiarachchi, H., Meegoda, J., Hettiaratchi, P., 2009. Effects of gas and moisture onmodeling of bioreactor landfill settlement. Waste Manage. 29, 1018–1025.
Kaiser, J., 1996. Modelling composting as a microbial ecosystem: a simulationapproach. Ecol. Model. 91, 25–37.
McCartney, D., Chen, H., 2001. Using a biocell to measure the effect of compressivesettlement on free air space and microbial activity in windrow composting.Compost. Sci. Util. 9, 285–302.
Ponsà, S., Puyuelo, B., Gea, T., Sánchez, A., 2011. Modelling the aerobic degradationof organic wastes based on slowly and rapidly degradable fractions. WasteManage. 31, 1472–1479.
Richard, T.L., Veeken, A.H.M., Wilde, V.d., Hammelers, H.V.M., 2004. Air-filledporosity and permeability relationships during solid-state fermentation.Biotechnol. Prog. 20, 1372–1381.
Schaub-Szabo, S.M., Leonard, J.J., 1999. Characterizing the bulk density of compost.Compost. Sci. Util. 7, 15–24.
Sole-Mauri, F., Illa, J., Magrí, A., Prenafeta-Boldú, F.X., Flotats, X., 2007. An integratedbiochemical and physical model for the composting process. Bioresour. Technol.98, 3278–3293.
Stoltz, G., Gourc, J., Oxarango, L., 2010. Liquid and gas permeabilities of unsaturatedmunicipal solid waste under compression. J. Contam. Hydrol. 118, 27–42.
Tinet, A., Oxarango, L., 2010. Stationary gas flow to a vertical extraction well in MSWlandfill considering the effect of mechanical settlement on hydraulic properties.Chem. Eng. Sci. 65, 6229–6237.
Tremier, A., de Guardia, A., Massiani, C., Paul, E., Martel, J.L., 2005. A respirometricmethod for characterising the organic composition and biodegradation kineticsand the temperature influence on the biodegradation kinetics, for a mixture ofsludge and bulking agent to be co-composted. Bioresour. Technol. 96, 169–180.
Trémier, A., Teglia, C., Barrington, S., 2009. Effect of initial physical characteristics onsludge compost performance. Bioresource Technol. 100, 3751–3758.
Van Lier, J.J.C., Van Ginkel, J.T., Straatsma, G., Gerrits, J.P.G., Van Griensven, L.J.L.D.,1994. Composting of mushroom substrate in a fermentation tunnel: compostparameters and a mathematical model. Neth. J. Agr. Sci. 42, 271–292.
Wall, D.K., Zeiss, C., 1995. Municipal landfill biodegradation and settlement. J.Environ. Eng. 121, 214–223.
Yue, B., Chen, T., Gao, D., Zheng, G., Liu, B., Lee, D., 2008. Pile settlement and volumereduction measurement during forced-aeration static composting. Bioresour.Technol. 99, 7450–7457.