Embed Size (px)
Citation preview
End-of-Module Assessment Task NYS COMMON CORE MATHEMATICS CURRICULUM 3•62•3
Module 6: Collecting and Displaying Data 134
This work is derived from Eureka Math ™ and licensed by Great Minds. ©2015 -Great Minds. eureka math.org This file derived from G3-M6-TE-1.3.0-06.2015
This work is licensed under a Creative Commons Attribution-NonCommercial-ShareAlike 3.0 Unported License.
Name Date
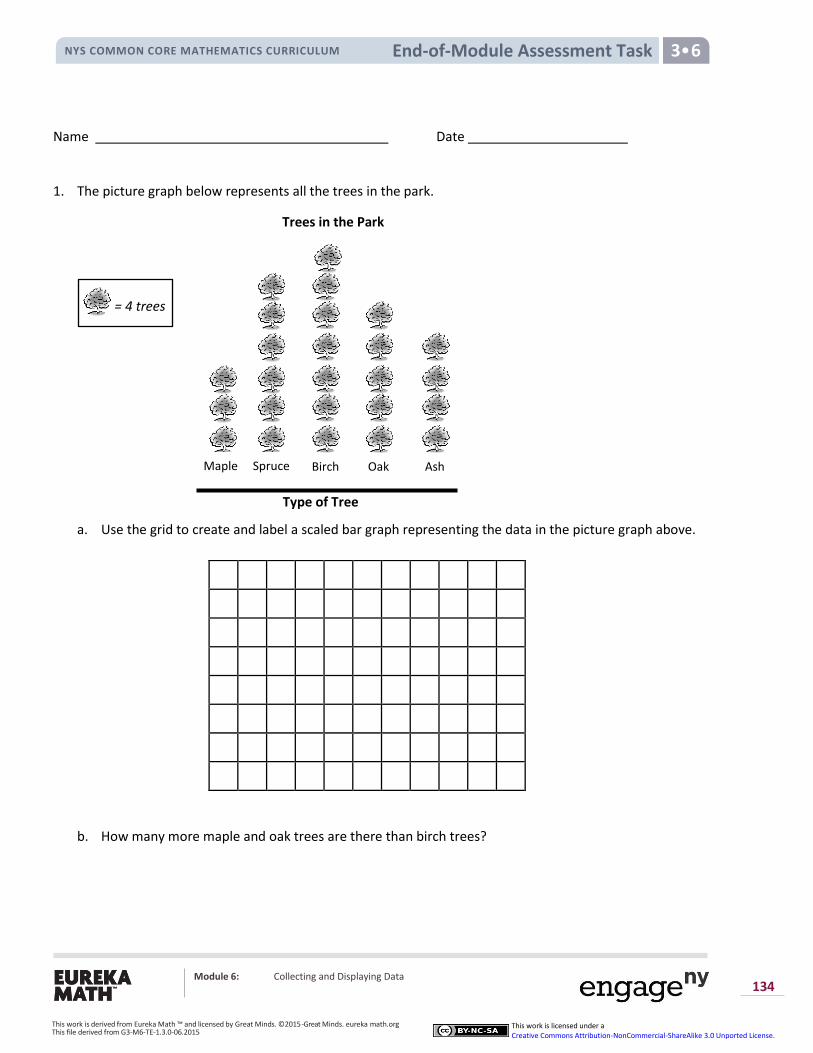
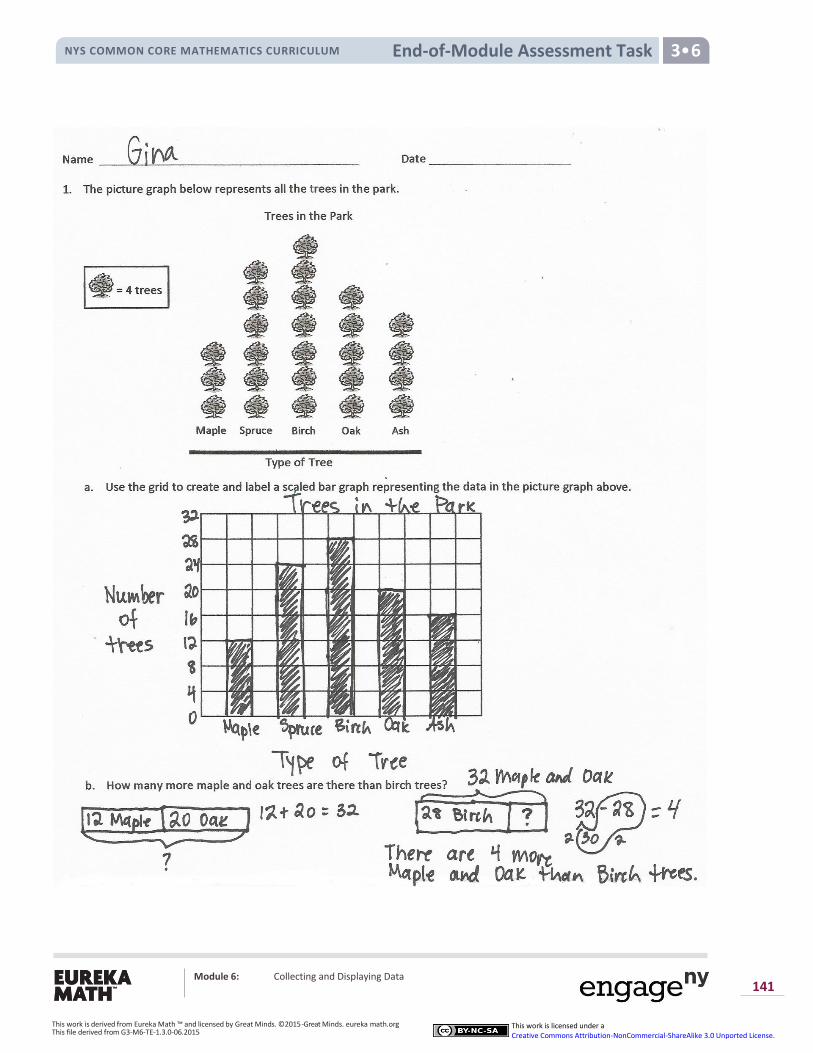
1. The picture graph below represents all the trees in the park.
a. Use the grid to create and label a scaled bar graph representing the data in the picture graph above.
b. How many more maple and oak trees are there than birch trees?
Maple Spruce Birch Oak Ash
= 4 trees
Type of Tree
Trees in the Park
End-of-Module Assessment Task NYS COMMON CORE MATHEMATICS CURRICULUM 3•62•3
Module 6: Collecting and Displaying Data 135
This work is derived from Eureka Math ™ and licensed by Great Minds. ©2015 -Great Minds. eureka math.org This file derived from G3-M6-TE-1.3.0-06.2015
This work is licensed under a Creative Commons Attribution-NonCommercial-ShareAlike 3.0 Unported License.
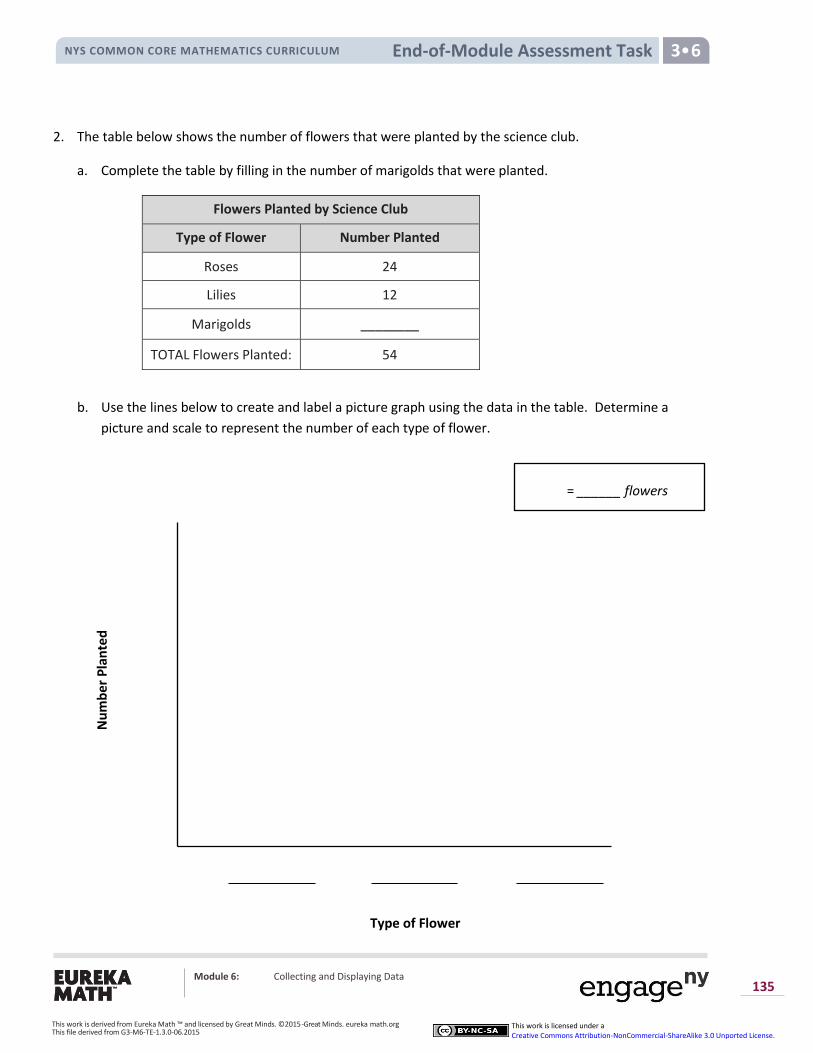
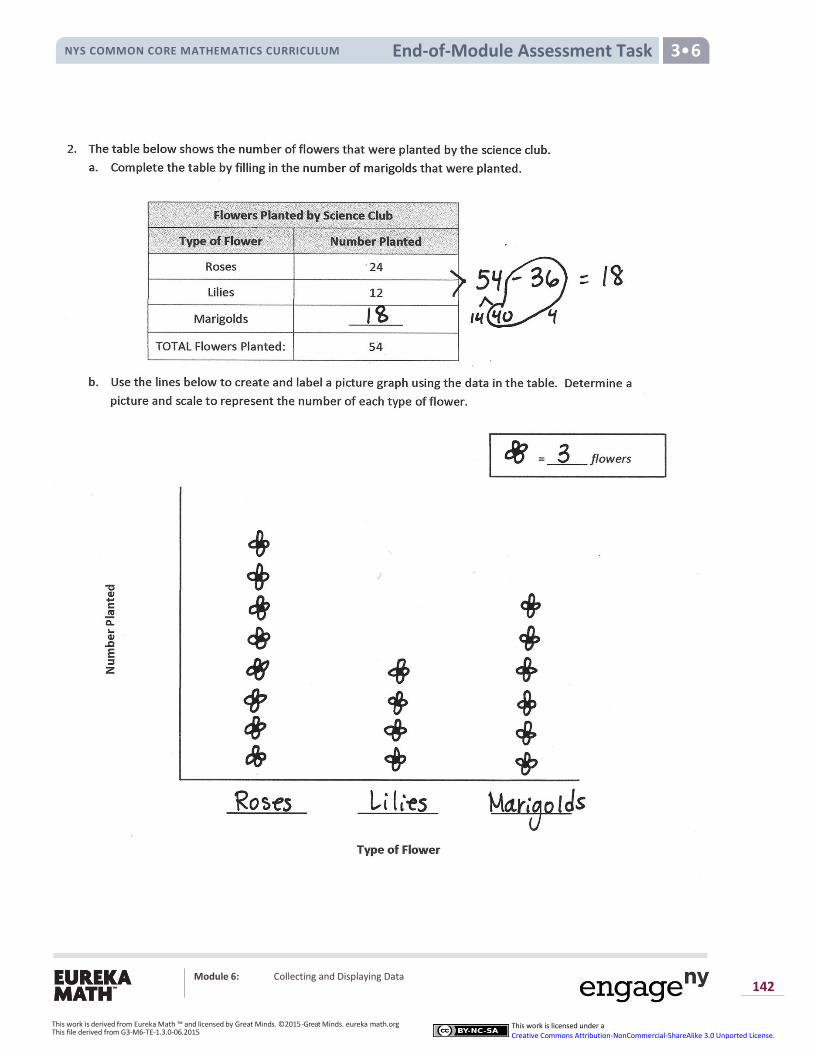
2. The table below shows the number of flowers that were planted by the science club.
a. Complete the table by filling in the number of marigolds that were planted.
b. Use the lines below to create and label a picture graph using the data in the table. Determine a
picture and scale to represent the number of each type of flower.
Flowers Planted by Science Club
Type of Flower Number Planted
Roses 24
Lilies 12
Marigolds ________
TOTAL Flowers Planted: 54
= ______ flowers
Type of Flower
Nu
mb
er P
lan
ted
End-of-Module Assessment Task NYS COMMON CORE MATHEMATICS CURRICULUM 3•62•3
Module 6: Collecting and Displaying Data 136
This work is derived from Eureka Math ™ and licensed by Great Minds. ©2015 -Great Minds. eureka math.org This file derived from G3-M6-TE-1.3.0-06.2015
This work is licensed under a Creative Commons Attribution-NonCommercial-ShareAlike 3.0 Unported License.
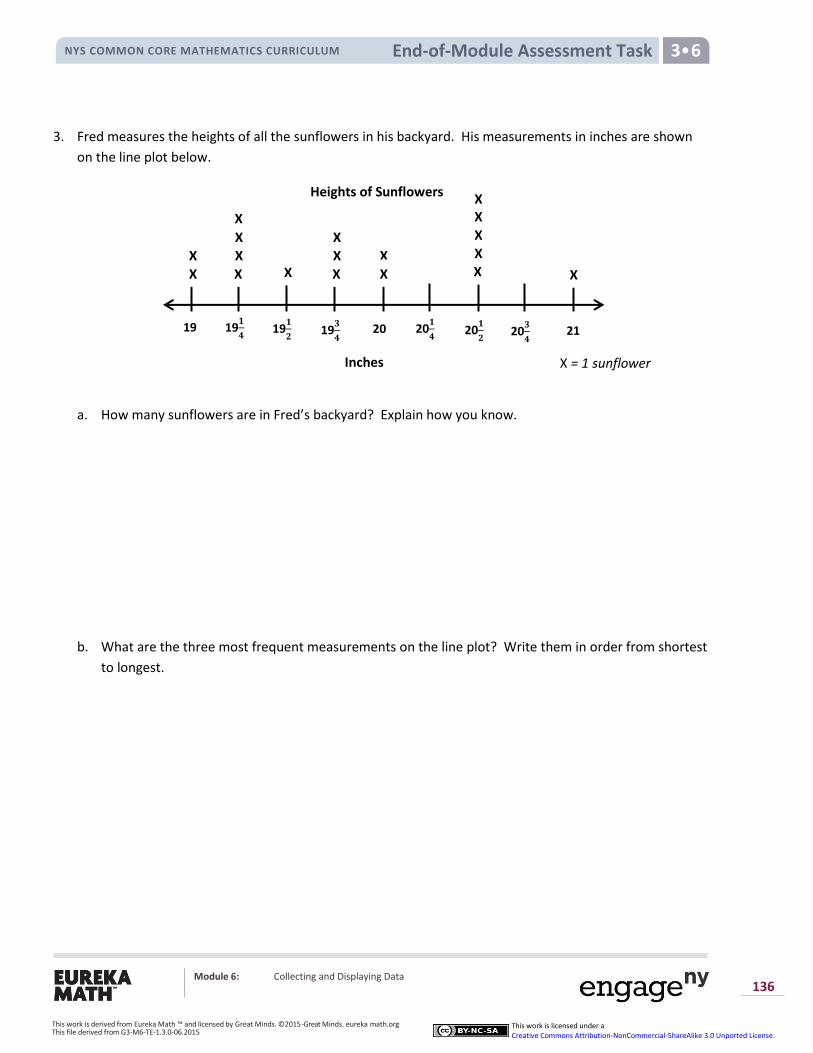
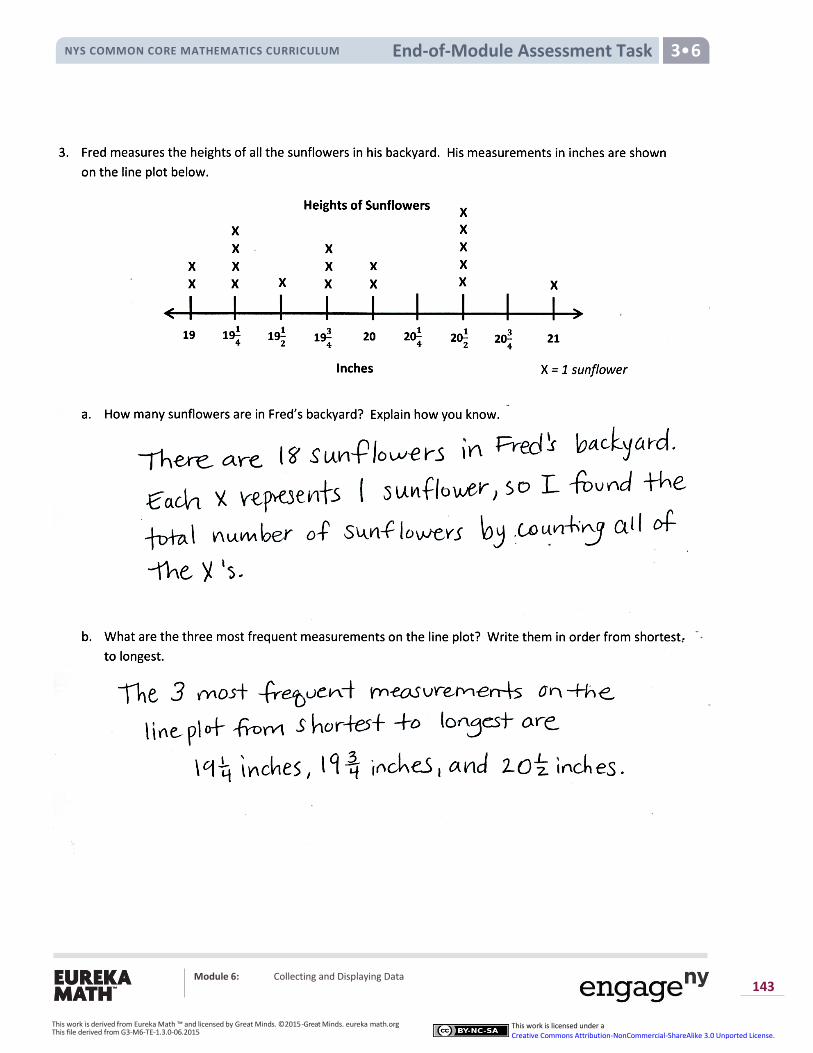
3. Fred measures the heights of all the sunflowers in his backyard. His measurements in inches are shown
on the line plot below.
a. How many sunflowers are in Fred’s backyard? Explain how you know.
b. What are the three most frequent measurements on the line plot? Write them in order from shortest
to longest.
19 19𝟏
𝟒 19
𝟏
𝟐 19
𝟑
𝟒 20 20
𝟏
𝟒 20
𝟏
𝟐 20
𝟑
𝟒 21
X
X
X
X X
X
X
X X
X
X X X X X X X
X
Heights of Sunflowers
Inches X = 1 sunflower
End-of-Module Assessment Task NYS COMMON CORE MATHEMATICS CURRICULUM 3•62•3
Module 6: Collecting and Displaying Data 137
This work is derived from Eureka Math ™ and licensed by Great Minds. ©2015 -Great Minds. eureka math.org This file derived from G3-M6-TE-1.3.0-06.2015
This work is licensed under a Creative Commons Attribution-NonCommercial-ShareAlike 3.0 Unported License.
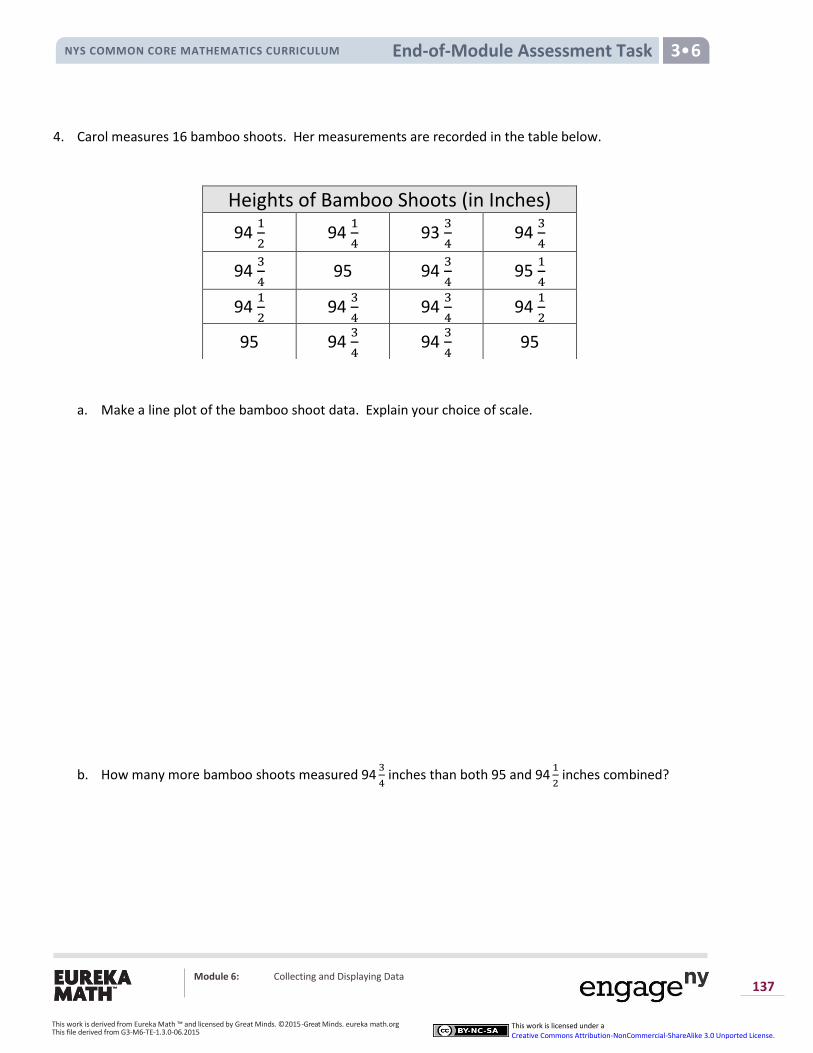
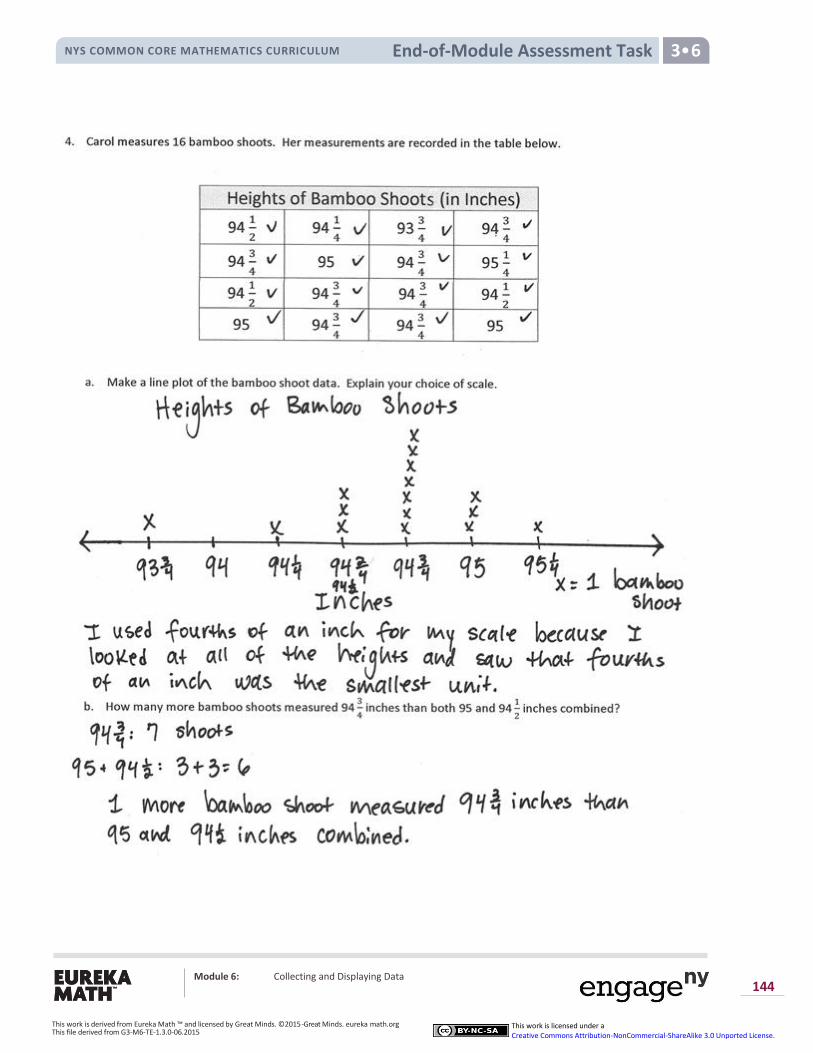
4. Carol measures 16 bamboo shoots. Her measurements are recorded in the table below.
a. Make a line plot of the bamboo shoot data. Explain your choice of scale.
b. How many more bamboo shoots measured 943
4 inches than both 95 and 94
1
2 inches combined?
Heights of Bamboo Shoots (in Inches)
94 1
2 94
1
4 93
3
4 94
3
4
94 3
4 95 94
3
4 95
1
4
94 1
2 94
3
4 94
3
4 94
1
2
95 94 3
4 94
3
4 95
End-of-Module Assessment Task NYS COMMON CORE MATHEMATICS CURRICULUM 3•62•3
Module 6: Collecting and Displaying Data 138
This work is derived from Eureka Math ™ and licensed by Great Minds. ©2015 -Great Minds. eureka math.org This file derived from G3-M6-TE-1.3.0-06.2015
This work is licensed under a Creative Commons Attribution-NonCommercial-ShareAlike 3.0 Unported License.
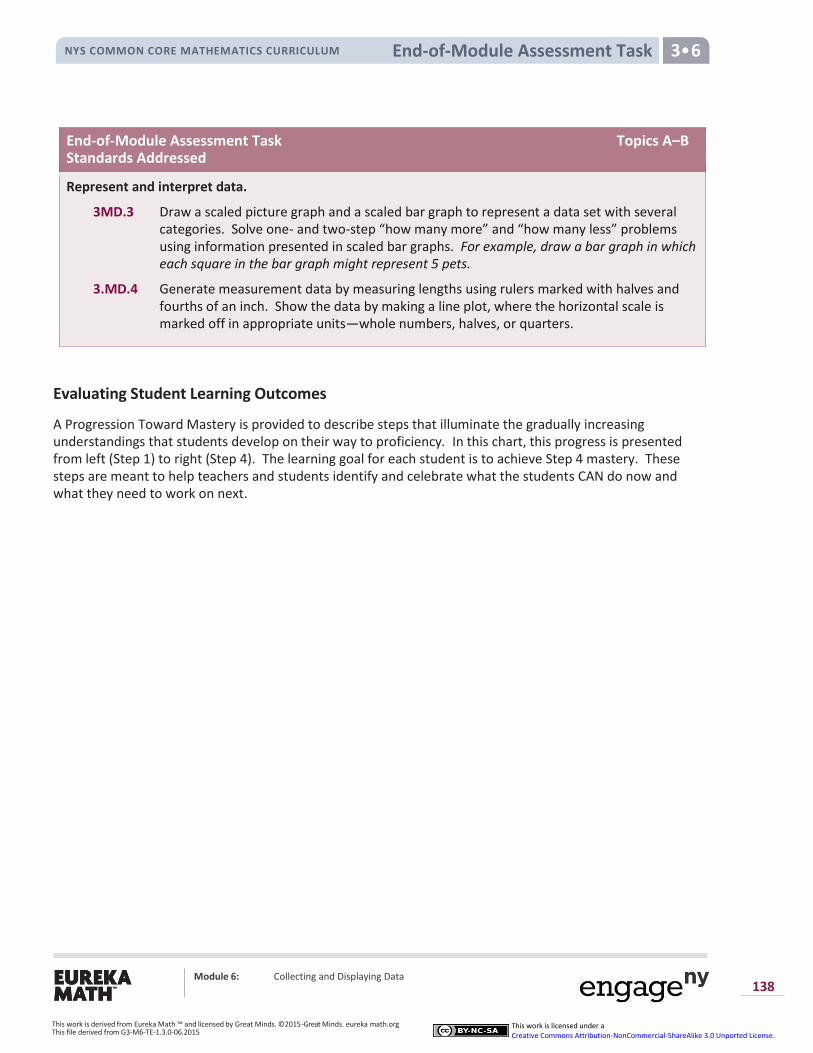
End-of-Module Assessment Task Topics A–B Standards Addressed
Represent and interpret data.
3MD.3 Draw a scaled picture graph and a scaled bar graph to represent a data set with several categories. Solve one- and two-step “how many more” and “how many less” problems using information presented in scaled bar graphs. For example, draw a bar graph in which each square in the bar graph might represent 5 pets.
3.MD.4 Generate measurement data by measuring lengths using rulers marked with halves and fourths of an inch. Show the data by making a line plot, where the horizontal scale is marked off in appropriate units—whole numbers, halves, or quarters.
Evaluating Student Learning Outcomes
A Progression Toward Mastery is provided to describe steps that illuminate the gradually increasing understandings that students develop on their way to proficiency. In this chart, this progress is presented from left (Step 1) to right (Step 4). The learning goal for each student is to achieve Step 4 mastery. These steps are meant to help teachers and students identify and celebrate what the students CAN do now and what they need to work on next.
End-of-Module Assessment Task NYS COMMON CORE MATHEMATICS CURRICULUM 3•62•3
Module 6: Collecting and Displaying Data 139
This work is derived from Eureka Math ™ and licensed by Great Minds. ©2015 -Great Minds. eureka math.org This file derived from G3-M6-TE-1.3.0-06.2015
This work is licensed under a Creative Commons Attribution-NonCommercial-ShareAlike 3.0 Unported License.
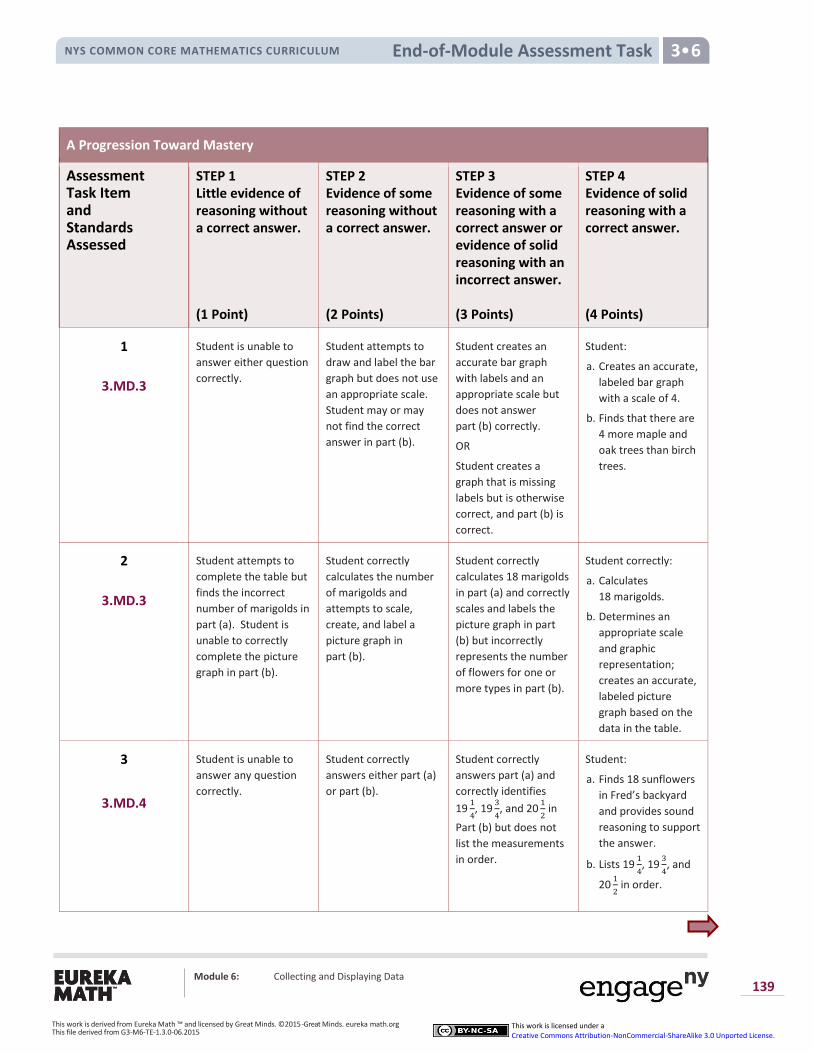
A Progression Toward Mastery
Assessment Task Item and Standards Assessed
STEP 1 Little evidence of reasoning without a correct answer. (1 Point)
STEP 2 Evidence of some reasoning without a correct answer. (2 Points)
STEP 3 Evidence of some reasoning with a correct answer or evidence of solid reasoning with an incorrect answer. (3 Points)
STEP 4 Evidence of solid reasoning with a correct answer. (4 Points)
1
3.MD.3
Student is unable to
answer either question
correctly.
Student attempts to
draw and label the bar
graph but does not use
an appropriate scale.
Student may or may
not find the correct
answer in part (b).
Student creates an
accurate bar graph
with labels and an
appropriate scale but
does not answer
part (b) correctly.
OR
Student creates a
graph that is missing
labels but is otherwise
correct, and part (b) is
correct.
Student:
a. Creates an accurate,
labeled bar graph
with a scale of 4.
b. Finds that there are
4 more maple and
oak trees than birch
trees.
2
3.MD.3
Student attempts to
complete the table but
finds the incorrect
number of marigolds in
part (a). Student is
unable to correctly
complete the picture
graph in part (b).
Student correctly
calculates the number
of marigolds and
attempts to scale,
create, and label a
picture graph in
part (b).
Student correctly
calculates 18 marigolds
in part (a) and correctly
scales and labels the
picture graph in part
(b) but incorrectly
represents the number
of flowers for one or
more types in part (b).
Student correctly:
a. Calculates
18 marigolds.
b. Determines an
appropriate scale
and graphic
representation;
creates an accurate,
labeled picture
graph based on the
data in the table.
3
3.MD.4
Student is unable to
answer any question
correctly.
Student correctly
answers either part (a)
or part (b).
Student correctly
answers part (a) and
correctly identifies
191
4, 19
3
4, and 20
1
2 in
Part (b) but does not
list the measurements
in order.
Student:
a. Finds 18 sunflowers
in Fred’s backyard
and provides sound
reasoning to support
the answer.
b. Lists 191
4, 19
3
4, and
201
2 in order.
End-of-Module Assessment Task NYS COMMON CORE MATHEMATICS CURRICULUM 3•62•3
Module 6: Collecting and Displaying Data 140
This work is derived from Eureka Math ™ and licensed by Great Minds. ©2015 -Great Minds. eureka math.org This file derived from G3-M6-TE-1.3.0-06.2015
This work is licensed under a Creative Commons Attribution-NonCommercial-ShareAlike 3.0 Unported License.
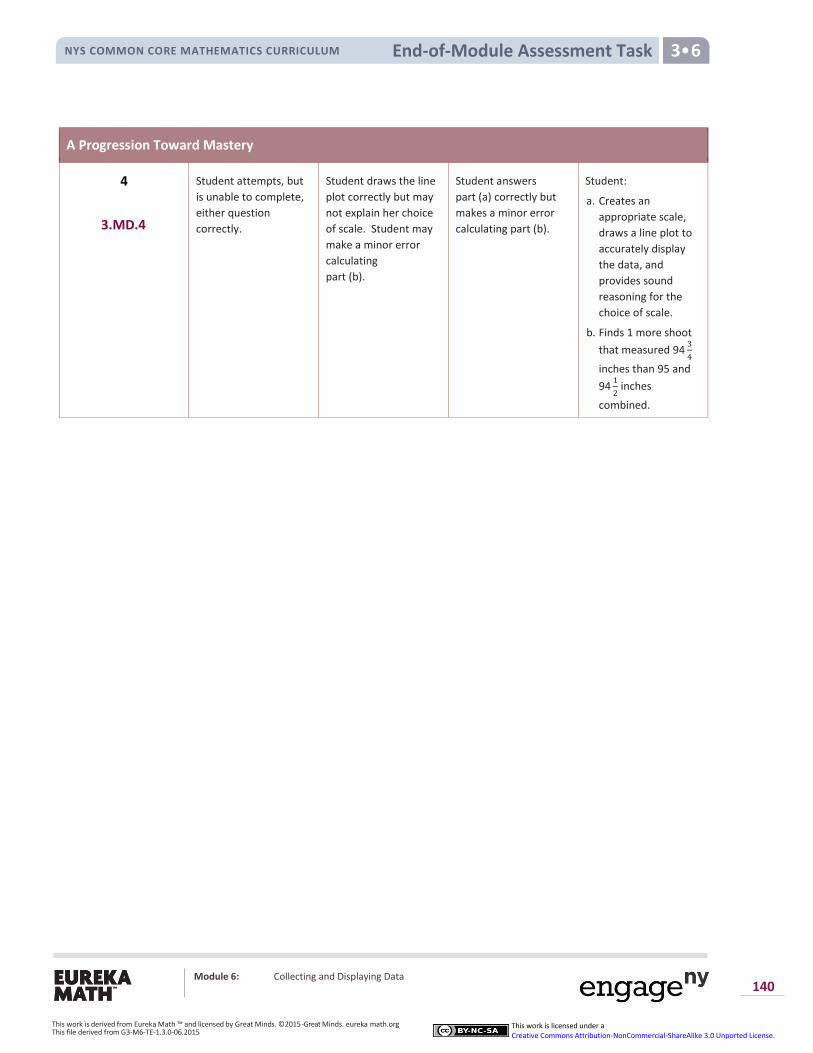
A Progression Toward Mastery
4
3.MD.4
Student attempts, but
is unable to complete,
either question
correctly.
Student draws the line
plot correctly but may
not explain her choice
of scale. Student may
make a minor error
calculating
part (b).
Student answers
part (a) correctly but
makes a minor error
calculating part (b).
Student:
a. Creates an
appropriate scale,
draws a line plot to
accurately display
the data, and
provides sound
reasoning for the
choice of scale.
b. Finds 1 more shoot
that measured 943
4
inches than 95 and
941
2 inches
combined.
End-of-Module Assessment Task NYS COMMON CORE MATHEMATICS CURRICULUM 3•62•3
Module 6: Collecting and Displaying Data 141
This work is derived from Eureka Math ™ and licensed by Great Minds. ©2015 -Great Minds. eureka math.org This file derived from G3-M6-TE-1.3.0-06.2015
This work is licensed under a Creative Commons Attribution-NonCommercial-ShareAlike 3.0 Unported License.
End-of-Module Assessment Task NYS COMMON CORE MATHEMATICS CURRICULUM 3•62•3
Module 6: Collecting and Displaying Data 142
This work is derived from Eureka Math ™ and licensed by Great Minds. ©2015 -Great Minds. eureka math.org This file derived from G3-M6-TE-1.3.0-06.2015
This work is licensed under a Creative Commons Attribution-NonCommercial-ShareAlike 3.0 Unported License.
End-of-Module Assessment Task NYS COMMON CORE MATHEMATICS CURRICULUM 3•62•3
Module 6: Collecting and Displaying Data 143
This work is derived from Eureka Math ™ and licensed by Great Minds. ©2015 -Great Minds. eureka math.org This file derived from G3-M6-TE-1.3.0-06.2015
This work is licensed under a Creative Commons Attribution-NonCommercial-ShareAlike 3.0 Unported License.
End-of-Module Assessment Task NYS COMMON CORE MATHEMATICS CURRICULUM 3•62•3
Module 6: Collecting and Displaying Data 144
This work is derived from Eureka Math ™ and licensed by Great Minds. ©2015 -Great Minds. eureka math.org This file derived from G3-M6-TE-1.3.0-06.2015
This work is licensed under a Creative Commons Attribution-NonCommercial-ShareAlike 3.0 Unported License.


