Embed Size (px)
Citation preview
Energetics of ion conduction through thegramicidin channelToby W. Allen*†, Olaf S. Andersen*, and Benoît Roux†‡
Departments of *Physiology and Biophysics and †Biochemistry, Weill Medical College of Cornell University, 1300 York Avenue, New York, NY 10021
Edited by Peter G. Wolynes, University of California at San Diego, La Jolla, CA, and approved October 22, 2003 (received for review August 19, 2003)
The free energy governing K! conduction through gramicidin Achannels is characterized by using over 0.1 "s of all-atom moleculardynamics simulations with explicit solvent and membrane. Theresults provide encouraging agreement with experiments andinsights into the permeation mechanism. The free energy surfaceof K!, as a function of both axial and radial coordinates, iscalculated. Correcting for simulation artifacts due to periodicityand the lack of hydrocarbon polarizability, the calculated single-channel conductance for K! ions is 0.8 pS, closer to experimentthan any previous calculation. In addition, the estimated single iondissociation constants are within the range of experimental de-terminations. The relatively small free energy barrier to ion trans-location arises from a balance of large opposing contributions fromprotein, single-file water, bulk electrolyte, and membrane. Meanforce decomposition reveals a remarkable ability of the single-filewater molecules to stabilize K! by #40 kcal!mol, roughly half thebulk solvation free energy. The importance of the single-file waterconfirms the conjecture of Mackay et al. [Mackay, D. H. J., Berens,P. H., Wilson, K. R. & Hagler, A. T. (1984) Biophys. J. 46, 229–248].Ion association with the channel involves gradual dehydrationfrom approximately six to seven water molecules in the first shell,to just two inside the narrow pore. Ion permeation is influenced bythe orientation of the single-file water column, which can presenta barrier to conduction and give rise to long-range coupling of ionson either side of the pore. Small changes in the potential function,including contributions from electronic polarization, are likely tobe sufficient to obtain quantitative agreement with experiments.
Molecular dynamics (MD) simulation has become an essen-tial tool for investigating a wide range of chemical and
biological systems. Greater computational resources, improve-ments in simulation methodologies, and refinement of interac-tion potentials have made it possible to model increasinglycomplex processes that previously were intractable (1). It isimportant that the approach be thoroughly tested on systems thatare small and yet possess the same ingredients and challenges asmuch larger and more complex biomolecular systems. Thesebenchmarks serve to set standards on which studies of morecomplex problems can find foundation. For example, a single keyprotein secondary structure, the ! hairpin, has been used as abenchmark test in protein-folding studies (2). In the presentstudy, we tackle the problem of ion permeation with a similarmindset. Ion permeation involves a seemingly straightforwardprocess of an ion passing across the membrane through amolecular pore. However, this process is difficult to modelbecause it entails the accurate representation of intermolecularinteractions in vastly different environments (aqueous solutionand narrow protein pore) for which there is little direct exper-imental data (3). As a rigorous examination of an all-atom forcefield to model ion permeation, we combine free energy methodswith fully atomistic, dynamical simulations on a benchmarksystem.
Atomic structures have been reported for many ion channels,but none is structurally and functionally as well characterized (4),or as amenable to computer simulation, as the gramicidin A (gA)channel. gA channels form by transmembrane dimerization ofsingle-stranded, right-handed !6.3-helices (5) with the sequence
(underlined residues are D-amino acids): formyl-Val-Gly-Ala-Leu-Ala-Val-Val-Val-Trp-Leu-Trp-Leu-Trp-Leu-Trp-ethanol-amine (6). High resolution structures have been obtained for gAembedded in detergent micelles by using liquid-state NMR (7, 8)and oriented dimyristoylphosphatidylcholine bilayers by usingsolid-state NMR (9), and refined with MD simulation (10). Thedepth of experimental knowledge and the simplicity of thisprotein also have lent it to numerous computational models (11)and make it the system of choice for investigating ion conduction.
Since the first MD simulations on a fully f lexible atomic modelof gA were carried out 20 yr ago (12), system sizes and simulationtimes have grown by orders of magnitude, yet quantitativeagreement with ion-flux experimental measurements has re-mained a difficult task (11, 13). A direct connection between theatomic structure and the observed conductance properties can-not easily be obtained via a ‘‘brute force’’ MD simulationapproach because ionic fluxes correspond to transit times of10–100 ns, such that statistically accurate conductance measure-ments are beyond the capabilities of present day computers. Abetter computational strategy is to first determine the equilib-rium free energy landscape, as described by the potential ofmean force (PMF), which governs the systematic forces acting onthe permeating ions in the system, and then invoke an appro-priate macroscopic or semimicroscopic formalism to calculatethe ionic current. Successful application of this computationalstrategy in calculating ion conductances in the KcsA potassiumchannel (14, 15) prompts us to return to the problem of ionpermeation through the gA channel and assess how close we areto obtaining quantitative agreement with experiment. Althoughthe microscopic force field still requires further refinements todescribe accurately the permeation of ions across the gA chan-nel, the current model does a surprisingly good job of predictingexperimental conductances.
Theory and MethodsTo focus our computational effort on the calculation of the freeenergy landscape governing ion conduction, we separate thesystem into ‘‘pore’’ and ‘‘bulk’’ regions (16). The equilibriumproperties of the system then can be reconstructed from ahierarchy of PMFs !(r1, . . . , rn), representing the pore regionoccupied by n ions. In the case of the gA channel, at moderatelylow alkali metal cation concentration (!100 mM), ion conduc-tion is governed primarily by the 1-ion PMF, !(r1), which canbe expressed in terms of the total potential energy U of thesystem as a function of ionic coordinates ri (i " 1, N) andremaining degrees of freedom X (water, protein, lipids)
e#!$r1%!kBT&"'dr2 ! ! ! "'
drN " dX e#U$r1, r2,! ! !rN;X%!kBT, [1]
This paper was submitted directly (Track II) to the PNAS office.
Abbreviations: gA, gramicidin A; MD, molecular dynamics; PMF, potential of mean force;NMR, nuclear magnetic resonance; FEP, free energy perturbation.‡To whom correspondence should be addressed at: Department of Biochemistry, WeillMedical College of Cornell University, Room W-201, 1300 York Avenue, New York, NY10021. E-mail: [email protected].
© 2003 by The National Academy of Sciences of the USA
www.pnas.org!cgi!doi!10.1073!pnas.2635314100 PNAS # January 6, 2004 # vol. 101 # no. 1 # 117–122
BIO
PHYS
ICS
where the primes indicate that ions 2 to N reside in the bulk, kBis Boltzmann’s constant, and T the temperature. Normalizationis chosen such that !(r'1) " 0 at any point r'1 far away in the bulk.By choosing a suitable pore region, we can calculate !(r1) thatwill provide a meaningful representation of single occupancy.Analysis of trajectories indicates that a sphere of radius 14 Å(relative to the center of mass of the dimer) best defines this poreregion. During the simulations used to calculate !(r1), otherions were excluded from this sphere.
The reaction coordinate for ion permeation is the z compo-nent (parallel to the membrane normal) of the distance of the ionto the center of mass of the gA dimer. A PMF also can be definedrelative to the instantaneous channel axis, but it is the absolutelab-frame z that is the most pertinent because ion conductioncorresponds to a displacement of charge parallel to an appliedtransmembrane electric field. The ion is confined in a narrowregion in the xy plane as it moves through the channel, and it maybe assumed that motions perpendicular to z reach equilibriumrapidly and thus may be integrated away (16),
e#W$z%!kBT & " dx dy e#!$x,y,z%!kBT. [2]
This 1D PMF W(z), or ‘‘free energy profile,’’ has limitedsignificance outside the channel because the lateral displace-ment in the xy plane is unbounded. In the present calculations,the lateral displacement of the ion was restricted to ensure goodsampling in a well defined region of configurational space byusing a flat-bottom cylindrical restraint with radius 8 Å (relativeto the center of mass of the dimer). The influence of thispotential can then be removed rigorously after the simulation.
We calculated the 1D PMF W(z), as well as a 2D PMF as afunction of axial and radial coordinates, W(z, r), with umbrellasampling (17), for a system that consists of a gA helical dimer[Protein Data Bank, PDB ID code 1JNO (8)] embedded in adimyristoylphosphatidylcholine bilayer solvated by 1 M KCl (Fig.1). The choice of starting structure is based on recent evidence(10) that dynamical trajectories based on the PDB:1JNO struc-ture reproduces experimental solid-state NMR measurements(18) better than the solid-state NMR PDB:1MAG structure (9).Specific simulation parameters are provided in Simulation De-tails, which is published in the supporting information on thePNAS web site.
Umbrella sampling entails simulations that generate distribu-tions of ion position, biased by a series of window functions wi(z)that hold the ion near regular positions along the z axis. A totalof 101 windows, defined by harmonic potential functions, posi-tioned in 0.5-Å increments from z " #20 to (30 Å, were carriedout concurrently on different CPUs with initial configurationsselected from an unbiased MD trajectory. To ensure conver-gence, 1 ns of trajectory generation was performed for eachwindow. Symmetrized ionic distributions were unbiased with theweighted histogram analysis method (19). An additional 4-nssimulation, in the absence of a window function, was used tocalculate the bulk limit Wbulk(z, r) " #kBTln()"bulk(z, r)*/"!),where "! is the K( density far from the channel. Wbulk(z, r) andW(z, r) were then matched far from the channel to set the correctbulk reference for the 2D PMF.
An independent check of the barrier height in W(z, r) wasobtained by free energy perturbation (FEP) calculations, wherean ion at the center of the channel was interchanged alchemicallywith a water in the bulk. The alchemical ion–water exchangeprocess carried out during the FEP calculation corresponds tothe total work required to move a K( from the bulk to the centerof the channel and, in addition, the work to move a watermolecule from the center of the channel to the bulk. The freeenergy for the complete exchange process is
+Gex " !(r) # !(r') ( kBT ln$"W(r)"!W
%, [3]
where "W is the mean water density far from the channel. Theweighted histogram analysis method was used to obtain the freeenergy change +Gex for the perturbation (20); the relative localdensity of water is obtained from the 80-ns MD trajectory.
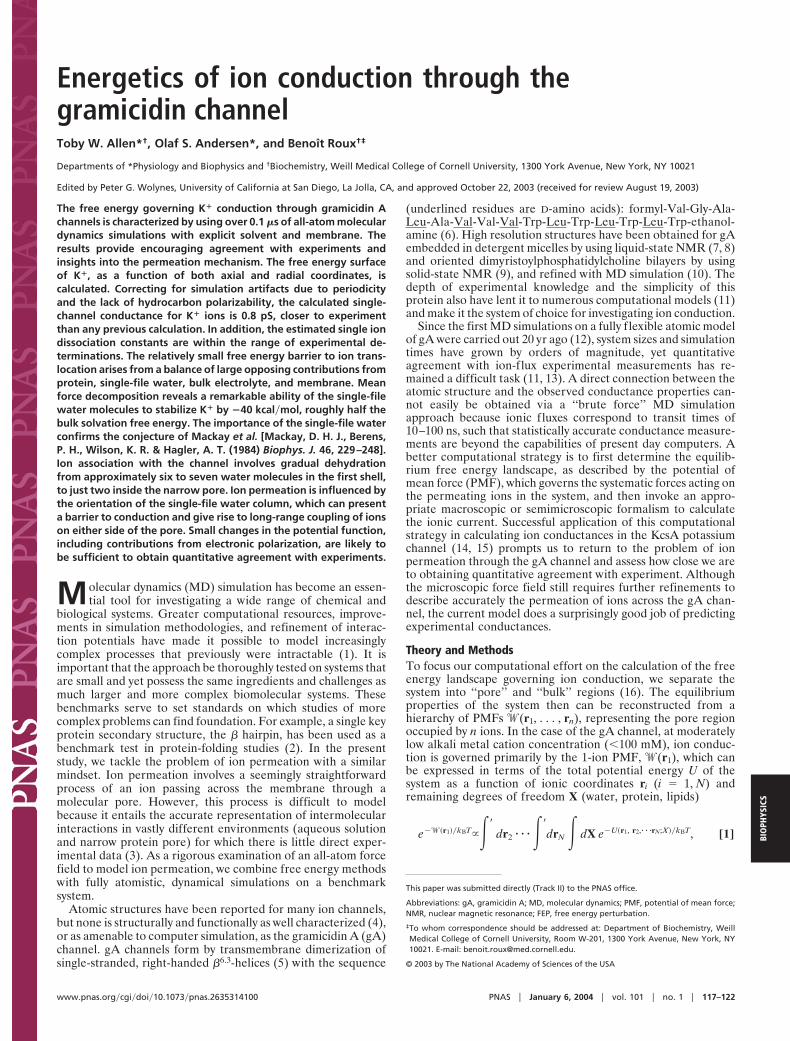
Results and DiscussionPotential of Mean Force. We begin with the 2D PMF, Fig. 1B,because it offers the most complete description of the freeenergy surface governing ion conduction. It reveals a flatlandscape in the bulk, the depth and position of binding sites atthe channel entrances, the scale of the free energy barrier thatmust be surmounted by the permeating ion, and the extent oflateral ion motion. The value of the 2D PMF far from thechannel is used to set the absolute reference for the free energysurface. Because the 2D PMF is determined in the laboratoryframe, lateral movement of the ion relative to the channel, andchannel tilting (12° on average) lead to fairly broad free en-ergy wells near the channel entrances. There is a well at z " 11.3Å (outer binding site), where the PMF drops to #3.2 kcal!molrelative to the bulk. In the narrowest part of the channel, an ionexperiences a barrier of 10.4 kcal!mol relative to the binding site(or 7.2 kcal!mol relative to the bulk). The independent estimateobtained from FEP calculations resulted in a barrier height!(r) # !(r') of Eq. 3 of 8.6 kcal!mol, consistent with the 2DPMF.
The 1D PMF W(z) of an ion along the channel axis, is afundamental concept in classical models of ion permeation (21).It is defined by integrating out the lateral motions of the ion (seeEq. 2). This assumption is reasonable for a narrow channel;however, the 2D PMF (Fig. 1B) shows that the ion is confined
Fig. 1. gA in the bilayer. (A) gA dimer (yellow); dimyristoylphosphatidyl-choline bilayer atoms C (gray), O (red), N (blue), and P (green); K( (greenspheres) and Cl# (gray spheres); water O (red) and H (white). Within thechannel, seven single-file water molecules are drawn as spheres adjacent to asingle K( ion at the channel entrance. (B) The 2D PMF of a single K( ion as afunction of axial (z) and radial (r) positions. Contours are drawn at 1-kcal!molintervals.
118 # www.pnas.org!cgi!doi!10.1073!pnas.2635314100 Allen et al.
laterally only in the range #15 to 15 Å. Outside this region, theion may be displaced to any extent in the xy plane, and theconcept of a free energy profile W(z) is not meaningful. To avoidthese problems, the 1D PMF was calculated with the cylindricalrestraint. The large effective width of the channel entrance nearthe binding site, relative to the center of the channel, leads to ahigher barrier of ,12 kcal!mol with respect to the binding site.There is a deep outer binding site at z " 11.3 Å and a less deepinner binding site at 9.7 Å that was not obvious in the 2D PMF.In addition there are three local free energy minima inside eachsubunit of the gA dimer. It should be stressed that, by virtue ofEq. 2, W(z) cannot be set with respect to some absolutereference; it is incorrect to assume that W(z) is equal to zero forlarge z. Consequently, the true depth of the binding sites relativeto the bulk can be defined only via the free energy surfaceprovide by the 2D PMF.
Maximum Conductance. To ascertain the magnitude of the currentthat can pass through the channel, the net stationary flux (J) ofions across the channel can be calculated by using a 1D Nernst–Planck equation (22)
J # #D$z%dP$z%
dz $ P$z%D$z%kBT
dWtot$z%dz , [4]
where D(z) is the K( diffusion coefficient as a function of z, andP(z) is the probability density per unit length of finding a K(. Wtotcan be expressed as a sum of the equilibrium PMF W, dominatedby local molecular interactions, and the interaction of atomiccharges with the transmembrane potential (23). As the potentialdifference increases, contributions from the coupling to thedipole moment of the system, dominated by the single file ofwater, become significant (Supporting Text). To gauge the abilityof MD to reproduce experiment, we consider only the maximumsingle channel conductance gmax. This analysis provides a roughestimate because we ignore changes in ion conduction that couldbe associated with multiple ion occupancy at high concentration.In addition, this model assumes that only the ionic z coordinateis a rate-determining coordinate. Later, we discuss the signifi-cance of this assumption when we examine the role of theflipping of the single-file water column. Under symmetric con-centration baths and low membrane potential, the maximumconductance is (24)
gmax "e2
kBTL2 )D(z)#1e(W(z)!kBT*#1)e#W(z)!kBT*#1, [5]
where the brackets signify spatial averaging over the length L ofthe pore region. L is equal to the diameter of the sphere definingthe single ion region (28 Å) and is within the range where the 1DPMF is meaningful (#z# ! 15 Å). The diffusion coefficient D(z)is extracted from the Laplace transform of the velocity autocor-relation function by using an analysis based on the generalizedLangevin equation for a harmonic oscillator (25). Such ananalysis is required to separate the local dissipative forces thatgive rise to random diffusional motion of the ions from theaverage systematic forces arising from the PMF. D(z) thusdetermined is ,2!3 of bulk diffusion coefficient within thechannel (Supporting Text). The maximum conductance, calcu-lated by using Eq. 5, is 4.7 - 10#3 pS, ,5 orders of magnitudeless than the experimental value of 21 pS [in DPhPC bilayers with1 M KCl at 100 mV (26)], indicating that the barrier is severalkcal!mol too high.
An artifact is introduced by the periodic boundary conditions,which cause a spurious destabilization of the ion in the mem-brane, caused by the finite size and the periodicity of the system.In addition, the hydrocarbon chains of the lipid molecules in thecurrent model are nonpolarizable, with an effective dielectric
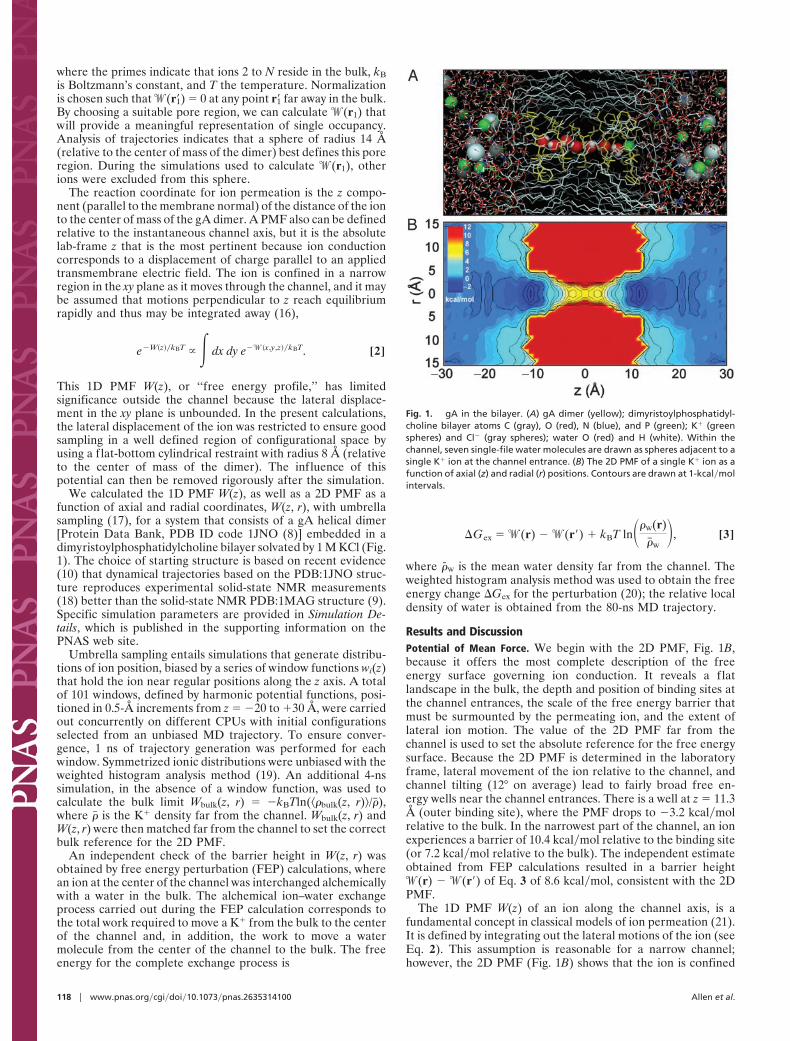
constant of 1 (27) that, in reality, should be closer to the valuefor bulk hydrocarbons of ,2 (28). These artifacts can becorrected by using a continuum electrostatic approximation (29)using trajectories to average over protein and single-file waterconfigurations. Estimates, obtained from 1-ns MD trajectoriesshow that correcting for the spurious destabilization leads to a#1.6 kcal!mol correction (at the channel center, relative to thebulk). Correcting for the effect of the dielectric constant of thehydrocarbon chains leads to a further #2.1 kcal!mol stabiliza-tion, in accord with calculations incorporating electronic polar-izability (Supporting Text). It is also possible to estimate theeffect of high electrolyte concentration (30) by approximatingthe effect of reducing it from 1 M to a more appropriate level of0.1 M. This result leads to a small additional stabilization of #0.2kcal!mol. When all of these corrections are made, the barrier inthe 1D PMF is reduced to just 8.1 kcal!mol with respect to thebinding site (dashed curve, Fig. 2A). This result leads to amaximum conductance of 0.8 pS, approaching the experimentalvalue better than any previous MD study of gA. The agreementis encouraging because the discrepancy can be accounted for byonly small changes to the PMF.
Equilibrium Dissociation ConstantsThe single ion dissociation constant, KD, can be calculated fromthe single ion equilibrium PMF !(r) (16)
KD#1 # "
site
dr e#.!$r% # !$r'%//kBT , [6]
Fig. 2. (A) One-dimensional PMF. Broken lines at #z# " 15 Å indicate that the1D PMF is not rigorously defined beyond those points. The dashed curve is thePMF corrected for simulation artifacts. (B) Mean force decomposition. Aver-age forces have been antisymmetrized before integration with Eq. 7.
Allen et al. PNAS # January 6, 2004 # vol. 101 # no. 1 # 119
BIO
PHYS
ICS
where r' is a reference position in the bulk. This quantity can alsobe conveniently expressed in terms of the 1D PMF calculatedwith a cylindrical restraint (Supporting Text). The dissociationconstant for the entire channel (#12.5 ! z ! 12.5 Å), obtainedfrom the corrected PMF, is 0.34 M. This result is within the rangeof experimental values determined from NMR and conductancestudies: 0.017 M (31) and 0.019–0.73 M (32). Integrals overindividual energy wells indicate that ions will bind only to theouter (10.2 ! z ! 12.5 Å) and inner (6.9 ! z ! 10.2 Å) sites withdissociation constants of 0.83 M and 3.6 M, respectively. At 1 M,the outer binding site is likely to be occupied whereas the innerbinding site is not. Experimentally, however, the major cationbinding site is the inner site (31, 33). The relative depth of theinner and outer cation-binding sites near the entrance of the gAchannel is very sensitive to the details of the potential function,previous studies finding alternatively that the inner (34, 35) orouter (36) binding site can be the most stable position. Oneimportant factor is clearly the choice of ion-carbonyl Lennard–Jones parameter (3). Data for liquid amides suggest that the freeenergy of solvation of K( in liquid n-methyl-acetymide (NMA)(a quantity not known experimentally) is similar to the freeenergy of hydration of K( in liquid water (37). The PARAM27force field gives a K(-bulk NMA free energy ,7 kcal!mol lessthan the K(-bulk water free energy (3). Instead, if the parameterwas chosen to reproduce the K(-single NMA molecule interac-tion energy in vacuum [28–32 kcal!mol experimentally (38)]more closely, the barrier in the 1D PMF would be considerablyreduced and depths of the binding sites increased (favoring theinner binding site due to increased solvation by protein).
Mean Force Decomposition. By virtue of the relationship betweenthe PMF and the thermodynamic reversible work, the contribu-tion from any microscopic force F% to the total free energyprofile can be computed independently (23),
W%$z% # W%$z0% $ "z0
z
dz' )F%$z'%*. [7]
The decomposition of the force can be accomplished in anynumber of ways, yet we consider the protein and water within thepore region (single-file) to be the most relevant to ion perme-ation. These contributions are shown in Fig. 2B. The relativelyflat PMF arises from the cancellation of very large opposingcontributions from protein, single-file water, and the remainingbulk electrolyte and membrane, and it is easy to understand howthe PMF can be in error by a few kcal!mol. The contributionfrom the membrane and bulk electrolyte is 67.4 kcal!mol asexpected for a Born energy barrier due to a low dielectricmembrane slab (39, 40). This barrier is eliminated, almostcompletely, by interactions with the protein and single-file water.The water column provides an attractive contribution thatcorresponds to a fairly constant force that vanishes near thechannel center as the water dipoles become symmetric aroundthe ion. Surprisingly, the single-file water itself accounts for#39.2 kcal!mol stabilization; i.e., nearly half the #80 kcal!molsolvation free energy of K( in bulk water (37) is obtained withjust two water molecules in contact with the ion. For comparison,a FEP calculation (with the same potential function) shows thatthe solvation free energy of K( surrounded by its first hydrationshell of eight water molecules is approximately #46 kcal!mol(41). This result is made possible by the large gas-phase inter-action of #18.9 kcal!mol (3) between K( and a TIP3P watermolecule, and the significantly anisotropic orientation of thesingle-file water, as conjectured 20 yr ago by Wilson andcoworkers (12).
The large stabilization arising from the single-file watermolecules raises questions about the ability of a nonpolarizable
force field to represent a strongly anisotropic system. To examinethe importance of induced polarization on the ability of single-file water molecules to solvate a cation, we calculated thecharging free energy of a K( at the center of a model systemcomprising only eight water molecules in single file by usingnonpolarizable TIP3P (42) as well as the recently developedpolarizable SWM4-DP (43) water model based on Drude oscil-lators (Supporting Text). For both water models, the cationparameters were previously optimized to reproduce the exper-imental solvation free energy of K( in bulk water. By usingnonpolarizable TIP3P, the charging free energy was #42.0kcal!mol, similar to the contribution of the single file to the PMFof K( in gA. The charging free energy with the polarizable watermodel is #41.5 kcal!mol, essentially the same as the nonpolar-izable result. Including the influence of a cavity reaction fieldrepresenting bulk water does not affect this conclusion; thecharging free energies become #52.2 and #52.3 kcal!mol, forTIP3P and SWM4-DP water, respectively. We conclude that thenonpolarizable TIP3P water model (42) adequately describesboth extremes in ion solvation, the bulk phase as well as thestrongly anisotropic single file.
The binding sites in the PMF arise from a delicate interplaybetween water and protein interactions. It has in the past beenassumed that the binding sites owe their existence to a superpositionof a long-range electrostatic image repulsion (‘‘Bulk ( Membrane’’in Fig. 2B) and a short-range attractive interaction (44). In contrast,Fig. 2B shows that the inner binding site (the dominant binding siteexperimentally) arises from the mean force exerted by the protein.There is a broad attractive free energy contribution from theprotein near the channel entrances, reaching a minimum of #34.6kcal!mol at #z# " 8.8 Å, responsible for this binding site. At z " 11.3Å, a small dip in the single-file water contribution corresponds tothe location of the outer binding site, which, as a consequence of thegreater role of water outside of the channel, is not determined solelyby protein interactions.
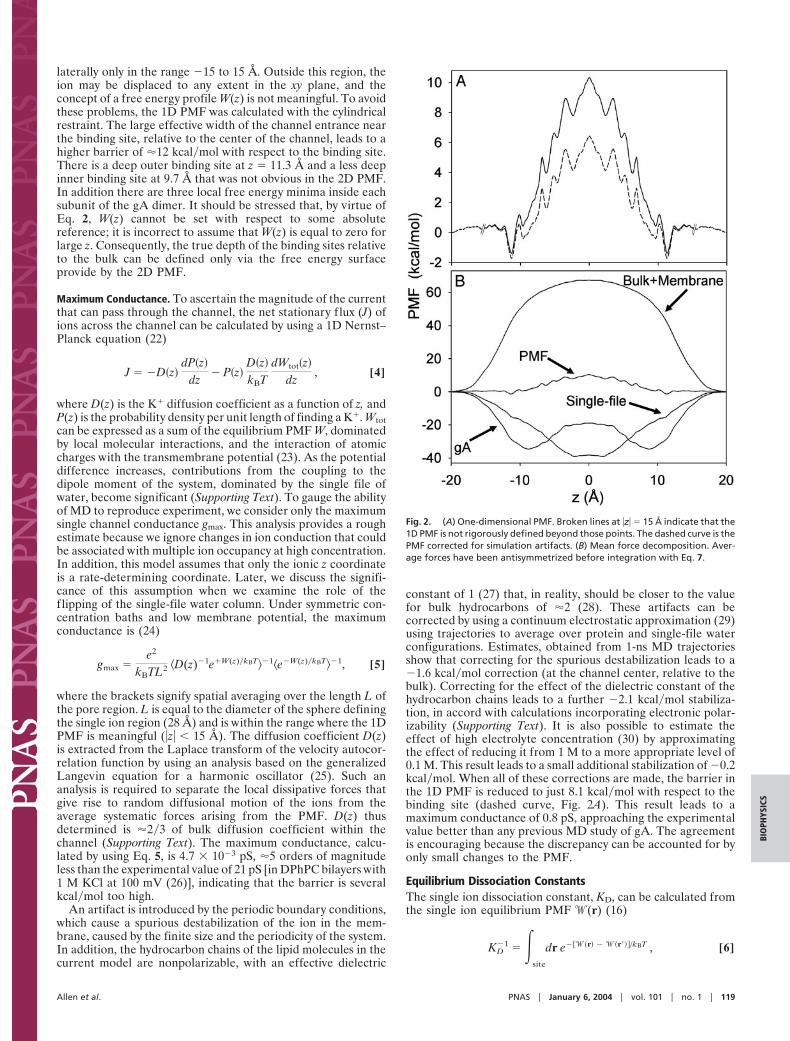
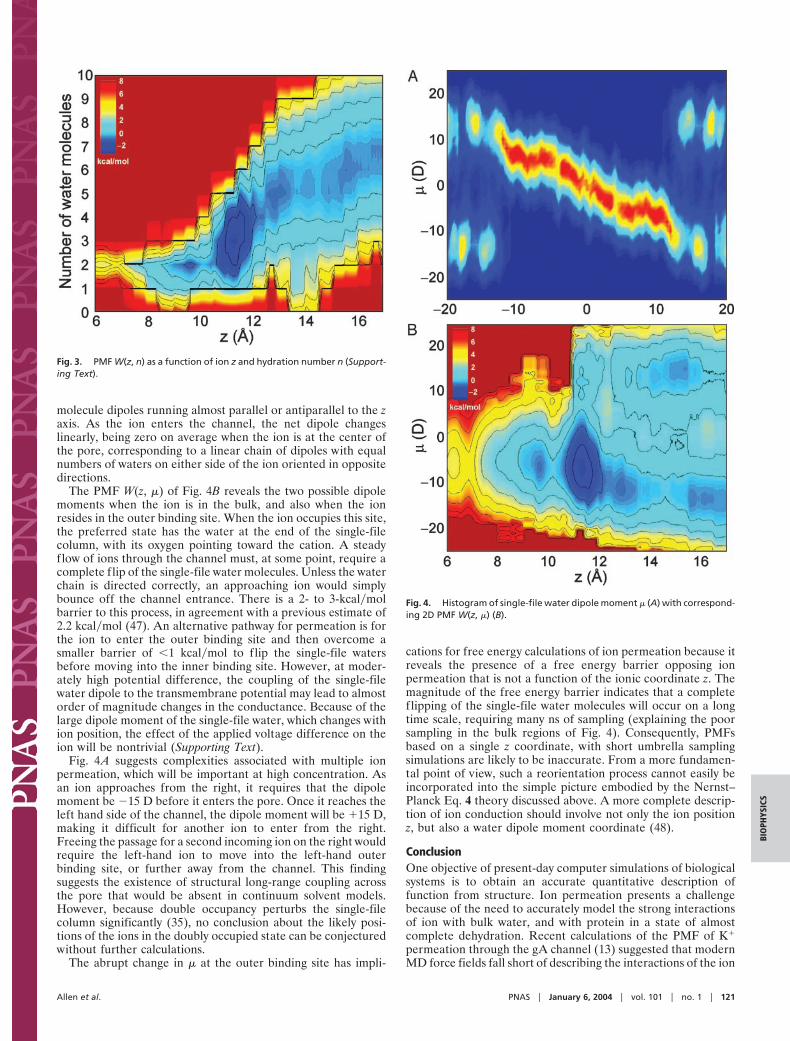
Energetics of Ion Dehydration. The importance of hydration in thesingle file observed in the mean force decomposition led us tostudy more closely the mechanism of ion dehydration on entryinto the channel. Sudden changes in solvation at a particularposition could cause difficulties in revealing the free energy ofion permeation as a function of a single coordinate z (45). The2D unbiasing of histograms (Supporting Text) leads to an ex-pression for the free energy as a function of ion position z anda secondary parameter n, the hydration number, such that wemay examine the role played by solvation in ion permeationacross the gA channel. The 2D PMF W(z,n) of Fig. 3 shows thefree energy of an ion at position z, hydrated by n water molecules,relative to an ion in the bulk with 6 to 7 solvating watermolecules. This bulk hydration number is in agreement with thenumber 6.46 obtained for bulk 1 M KCl in TIP3P water (46). Asnoted previously (34), dehydration occurs progressively over 6–7Å, and this number drops to just 2 inside the single-file columnwithin the channel. By focusing on the entry region, Fig. 3 showsthat an ion in the inner binding site is solvated predominantly bytwo water molecules whereas the outer binding site involvessolvation by three water molecules. Dehydration varies moreabruptly as the ion enters the narrow pore from the outer bindingsite but seems to remain a continuous function of z and is notopposed by a free energy barrier (34).
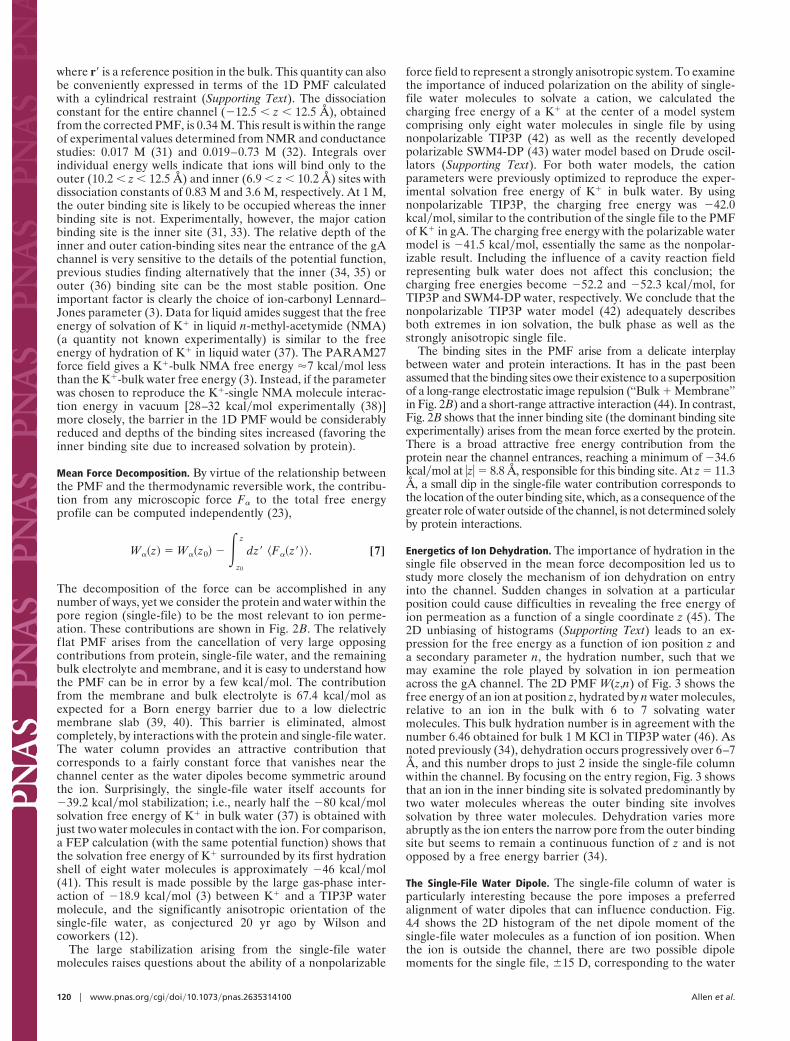
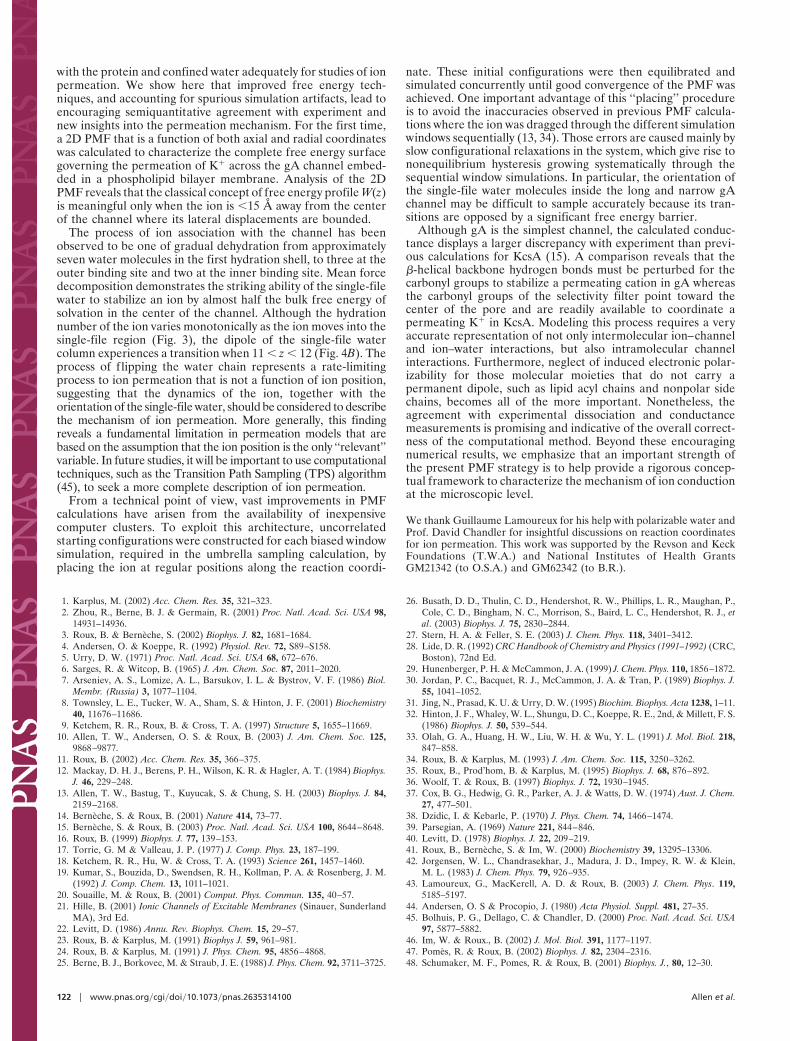
The Single-File Water Dipole. The single-file column of water isparticularly interesting because the pore imposes a preferredalignment of water dipoles that can influence conduction. Fig.4A shows the 2D histogram of the net dipole moment of thesingle-file water molecules as a function of ion position. Whenthe ion is outside the channel, there are two possible dipolemoments for the single file, 015 D, corresponding to the water
120 # www.pnas.org!cgi!doi!10.1073!pnas.2635314100 Allen et al.
molecule dipoles running almost parallel or antiparallel to the zaxis. As the ion enters the channel, the net dipole changeslinearly, being zero on average when the ion is at the center ofthe pore, corresponding to a linear chain of dipoles with equalnumbers of waters on either side of the ion oriented in oppositedirections.
The PMF W(z, &) of Fig. 4B reveals the two possible dipolemoments when the ion is in the bulk, and also when the ionresides in the outer binding site. When the ion occupies this site,the preferred state has the water at the end of the single-filecolumn, with its oxygen pointing toward the cation. A steadyflow of ions through the channel must, at some point, require acomplete flip of the single-file water molecules. Unless the waterchain is directed correctly, an approaching ion would simplybounce off the channel entrance. There is a 2- to 3-kcal!molbarrier to this process, in agreement with a previous estimate of2.2 kcal!mol (47). An alternative pathway for permeation is forthe ion to enter the outer binding site and then overcome asmaller barrier of !1 kcal!mol to flip the single-file watersbefore moving into the inner binding site. However, at moder-ately high potential difference, the coupling of the single-filewater dipole to the transmembrane potential may lead to almostorder of magnitude changes in the conductance. Because of thelarge dipole moment of the single-file water, which changes withion position, the effect of the applied voltage difference on theion will be nontrivial (Supporting Text).
Fig. 4A suggests complexities associated with multiple ionpermeation, which will be important at high concentration. Asan ion approaches from the right, it requires that the dipolemoment be #15 D before it enters the pore. Once it reaches theleft hand side of the channel, the dipole moment will be (15 D,making it difficult for another ion to enter from the right.Freeing the passage for a second incoming ion on the right wouldrequire the left-hand ion to move into the left-hand outerbinding site, or further away from the channel. This findingsuggests the existence of structural long-range coupling acrossthe pore that would be absent in continuum solvent models.However, because double occupancy perturbs the single-filecolumn significantly (35), no conclusion about the likely posi-tions of the ions in the doubly occupied state can be conjecturedwithout further calculations.
The abrupt change in & at the outer binding site has impli-
cations for free energy calculations of ion permeation because itreveals the presence of a free energy barrier opposing ionpermeation that is not a function of the ionic coordinate z. Themagnitude of the free energy barrier indicates that a completeflipping of the single-file water molecules will occur on a longtime scale, requiring many ns of sampling (explaining the poorsampling in the bulk regions of Fig. 4). Consequently, PMFsbased on a single z coordinate, with short umbrella samplingsimulations are likely to be inaccurate. From a more fundamen-tal point of view, such a reorientation process cannot easily beincorporated into the simple picture embodied by the Nernst–Planck Eq. 4 theory discussed above. A more complete descrip-tion of ion conduction should involve not only the ion positionz, but also a water dipole moment coordinate (48).
ConclusionOne objective of present-day computer simulations of biologicalsystems is to obtain an accurate quantitative description offunction from structure. Ion permeation presents a challengebecause of the need to accurately model the strong interactionsof ion with bulk water, and with protein in a state of almostcomplete dehydration. Recent calculations of the PMF of K(
permeation through the gA channel (13) suggested that modernMD force fields fall short of describing the interactions of the ion
Fig. 3. PMF W(z, n) as a function of ion z and hydration number n (Support-ing Text).
Fig. 4. Histogram of single-file water dipole moment & (A) with correspond-ing 2D PMF W(z, &) (B).
Allen et al. PNAS # January 6, 2004 # vol. 101 # no. 1 # 121
BIO
PHYS
ICS
with the protein and confined water adequately for studies of ionpermeation. We show here that improved free energy tech-niques, and accounting for spurious simulation artifacts, lead toencouraging semiquantitative agreement with experiment andnew insights into the permeation mechanism. For the first time,a 2D PMF that is a function of both axial and radial coordinateswas calculated to characterize the complete free energy surfacegoverning the permeation of K( across the gA channel embed-ded in a phospholipid bilayer membrane. Analysis of the 2DPMF reveals that the classical concept of free energy profile W(z)is meaningful only when the ion is !15 Å away from the centerof the channel where its lateral displacements are bounded.
The process of ion association with the channel has beenobserved to be one of gradual dehydration from approximatelyseven water molecules in the first hydration shell, to three at theouter binding site and two at the inner binding site. Mean forcedecomposition demonstrates the striking ability of the single-filewater to stabilize an ion by almost half the bulk free energy ofsolvation in the center of the channel. Although the hydrationnumber of the ion varies monotonically as the ion moves into thesingle-file region (Fig. 3), the dipole of the single-file watercolumn experiences a transition when 11 ! z ! 12 (Fig. 4B). Theprocess of flipping the water chain represents a rate-limitingprocess to ion permeation that is not a function of ion position,suggesting that the dynamics of the ion, together with theorientation of the single-file water, should be considered to describethe mechanism of ion permeation. More generally, this findingreveals a fundamental limitation in permeation models that arebased on the assumption that the ion position is the only ‘‘relevant’’variable. In future studies, it will be important to use computationaltechniques, such as the Transition Path Sampling (TPS) algorithm(45), to seek a more complete description of ion permeation.
From a technical point of view, vast improvements in PMFcalculations have arisen from the availability of inexpensivecomputer clusters. To exploit this architecture, uncorrelatedstarting configurations were constructed for each biased windowsimulation, required in the umbrella sampling calculation, byplacing the ion at regular positions along the reaction coordi-
nate. These initial configurations were then equilibrated andsimulated concurrently until good convergence of the PMF wasachieved. One important advantage of this ‘‘placing’’ procedureis to avoid the inaccuracies observed in previous PMF calcula-tions where the ion was dragged through the different simulationwindows sequentially (13, 34). Those errors are caused mainly byslow configurational relaxations in the system, which give rise tononequilibrium hysteresis growing systematically through thesequential window simulations. In particular, the orientation ofthe single-file water molecules inside the long and narrow gAchannel may be difficult to sample accurately because its tran-sitions are opposed by a significant free energy barrier.
Although gA is the simplest channel, the calculated conduc-tance displays a larger discrepancy with experiment than previ-ous calculations for KcsA (15). A comparison reveals that the!-helical backbone hydrogen bonds must be perturbed for thecarbonyl groups to stabilize a permeating cation in gA whereasthe carbonyl groups of the selectivity filter point toward thecenter of the pore and are readily available to coordinate apermeating K( in KcsA. Modeling this process requires a veryaccurate representation of not only intermolecular ion–channeland ion–water interactions, but also intramolecular channelinteractions. Furthermore, neglect of induced electronic polar-izability for those molecular moieties that do not carry apermanent dipole, such as lipid acyl chains and nonpolar sidechains, becomes all of the more important. Nonetheless, theagreement with experimental dissociation and conductancemeasurements is promising and indicative of the overall correct-ness of the computational method. Beyond these encouragingnumerical results, we emphasize that an important strength ofthe present PMF strategy is to help provide a rigorous concep-tual framework to characterize the mechanism of ion conductionat the microscopic level.
We thank Guillaume Lamoureux for his help with polarizable water andProf. David Chandler for insightful discussions on reaction coordinatesfor ion permeation. This work was supported by the Revson and KeckFoundations (T.W.A.) and National Institutes of Health GrantsGM21342 (to O.S.A.) and GM62342 (to B.R.).
1. Karplus, M. (2002) Acc. Chem. Res. 35, 321–323.2. Zhou, R., Berne, B. J. & Germain, R. (2001) Proc. Natl. Acad. Sci. USA 98,
14931–14936.3. Roux, B. & Berneche, S. (2002) Biophys. J. 82, 1681–1684.4. Andersen, O. & Koeppe, R. (1992) Physiol. Rev. 72, S89–S158.5. Urry, D. W. (1971) Proc. Natl. Acad. Sci. USA 68, 672–676.6. Sarges, R. & Witcop, B. (1965) J. Am. Chem. Soc. 87, 2011–2020.7. Arseniev, A. S., Lomize, A. L., Barsukov, I. L. & Bystrov, V. F. (1986) Biol.
Membr. (Russia) 3, 1077–1104.8. Townsley, L. E., Tucker, W. A., Sham, S. & Hinton, J. F. (2001) Biochemistry
40, 11676–11686.9. Ketchem, R. R., Roux, B. & Cross, T. A. (1997) Structure 5, 1655–11669.
10. Allen, T. W., Andersen, O. S. & Roux, B. (2003) J. Am. Chem. Soc. 125,9868–9877.
11. Roux, B. (2002) Acc. Chem. Res. 35, 366–375.12. Mackay, D. H. J., Berens, P. H., Wilson, K. R. & Hagler, A. T. (1984) Biophys.
J. 46, 229–248.13. Allen, T. W., Bastug, T., Kuyucak, S. & Chung, S. H. (2003) Biophys. J. 84,
2159–2168.14. Berneche, S. & Roux, B. (2001) Nature 414, 73–77.15. Berneche, S. & Roux, B. (2003) Proc. Natl. Acad. Sci. USA 100, 8644–8648.16. Roux, B. (1999) Biophys. J. 77, 139–153.17. Torrie, G. M & Valleau, J. P. (1977) J. Comp. Phys. 23, 187–199.18. Ketchem, R. R., Hu, W. & Cross, T. A. (1993) Science 261, 1457–1460.19. Kumar, S., Bouzida, D., Swendsen, R. H., Kollman, P. A. & Rosenberg, J. M.
(1992) J. Comp. Chem. 13, 1011–1021.20. Souaille, M. & Roux, B. (2001) Comput. Phys. Commun. 135, 40–57.21. Hille, B. (2001) Ionic Channels of Excitable Membranes (Sinauer, Sunderland
MA), 3rd Ed.22. Levitt, D. (1986) Annu. Rev. Biophys. Chem. 15, 29–57.23. Roux, B. & Karplus, M. (1991) Biophys J. 59, 961–981.24. Roux, B. & Karplus, M. (1991) J. Phys. Chem. 95, 4856–4868.25. Berne, B. J., Borkovec, M. & Straub, J. E. (1988) J. Phys. Chem. 92, 3711–3725.
26. Busath, D. D., Thulin, C. D., Hendershot, R. W., Phillips, L. R., Maughan, P.,Cole, C. D., Bingham, N. C., Morrison, S., Baird, L. C., Hendershot, R. J., etal. (2003) Biophys. J. 75, 2830–2844.
27. Stern, H. A. & Feller, S. E. (2003) J. Chem. Phys. 118, 3401–3412.28. Lide, D. R. (1992) CRC Handbook of Chemistry and Physics (1991–1992) (CRC,
Boston), 72nd Ed.29. Hunenberger, P. H. & McCammon, J. A. (1999) J. Chem. Phys. 110, 1856–1872.30. Jordan, P. C., Bacquet, R. J., McCammon, J. A. & Tran, P. (1989) Biophys. J.
55, 1041–1052.31. Jing, N., Prasad, K. U. & Urry, D. W. (1995) Biochim. Biophys. Acta 1238, 1–11.32. Hinton, J. F., Whaley, W. L., Shungu, D. C., Koeppe, R. E., 2nd, & Millett, F. S.
(1986) Biophys. J. 50, 539–544.33. Olah, G. A., Huang, H. W., Liu, W. H. & Wu, Y. L. (1991) J. Mol. Biol. 218,
847–858.34. Roux, B. & Karplus, M. (1993) J. Am. Chem. Soc. 115, 3250–3262.35. Roux, B., Prod’hom, B. & Karplus, M. (1995) Biophys. J. 68, 876–892.36. Woolf, T. & Roux, B. (1997) Biophys. J. 72, 1930–1945.37. Cox, B. G., Hedwig, G. R., Parker, A. J. & Watts, D. W. (1974) Aust. J. Chem.
27, 477–501.38. Dzidic, I. & Kebarle, P. (1970) J. Phys. Chem. 74, 1466–1474.39. Parsegian, A. (1969) Nature 221, 844–846.40. Levitt, D. (1978) Biophys. J. 22, 209–219.41. Roux, B., Berneche, S. & Im, W. (2000) Biochemistry 39, 13295–13306.42. Jorgensen, W. L., Chandrasekhar, J., Madura, J. D., Impey, R. W. & Klein,
M. L. (1983) J. Chem. Phys. 79, 926–935.43. Lamoureux, G., MacKerell, A. D. & Roux, B. (2003) J. Chem. Phys. 119,
5185–5197.44. Andersen, O. S & Procopio, J. (1980) Acta Physiol. Suppl. 481, 27–35.45. Bolhuis, P. G., Dellago, C. & Chandler, D. (2000) Proc. Natl. Acad. Sci. USA
97, 5877–5882.46. Im, W. & Roux., B. (2002) J. Mol. Biol. 391, 1177–1197.47. Pomes, R. & Roux, B. (2002) Biophys. J. 82, 2304–2316.48. Schumaker, M. F., Pomes, R. & Roux, B. (2001) Biophys. J., 80, 12–30.
122 # www.pnas.org!cgi!doi!10.1073!pnas.2635314100 Allen et al.
Supporting Text
Simulation Details. Simulations were carried out with the program charmm (1) using thePARAM27 force field with standard lipid (2), protein (3), and TIP3P water model (4) parame-ters. The use of particle-mesh Ewald (5), SHAKE (6), and constant pressure and temperaturealgorithms (7) in these simulations has been described elsewhere (8). The simulation systemconsists of a gramicidin A (gA) helical dimer [Protein Data Bank, PDB:1JNO (9)] embedded ina dimyristoylphosphatidylcholine (DMPC) bilayer (Fig. 1 of article), created using an extensionof existing membrane-building techniques (10). The lipid bilayer contains 20 DMPC molecules,hydrated with 1 M KCl electrolyte solutions consisting of 19 K+ and Cl! pairs and 1080 watermolecules. Hexagonal periodic boundaries, of side !31 A and initial length !74 A, were imposedon the protein-membrane system. The system was hydrated with a high electrolyte concentrationto ensure good sampling of the bulk electrolyte and to help shield ions from periodic images.
During the simulations used to calculate the single-ion potential of mean force (PMF), W(r1),other ions were excluded from the sphere of radius 14 A defining the pore region, using a repulsiveflat-bottom spherical harmonic restraint with force constant 5 kcal/mol. To limit the lateraldisplacement of the ion, and thus insure good sampling in a well defined region of configurationalspace, we used a flat-bottom cylindrical restraint with radius 8 A (relative to the center of massof the dimer) and force constant 10 kcal/mol/A2. The side-chain of Trp 9 was maintained in therotamer basin of PDB:1JNO (8) by imposing a flat-bottom harmonic potential with force constant100 kcal/mol/rad2.
For umbrella sampling calculations, harmonic potentials with force constant 10 kcal/mol/A2
were implemented for each of 101 windows, positioned in 0.5-A increments from "20 # z # +30 A.The initial configurations were selected from a 4-ns sample of unbiased molecular dynamics (MD)trajectory meeting the following criteria: correct Trp 9 rotameric state, a single ion inside 14 A,and a continuous chain of water molecules inside the channel. When no configuration was foundwith a K+ ion near the center of a window, a nearby water molecule was exchanged with theoutermost ion. For each window, equilibration was carried out for 80 ps prior to 1 ns of trajectorygeneration for the PMF. The 101 simulations were carried out concurrently on di!erent CPUs.The resulting biased ion density distribution was symmetrized by creating duplicate windows onopposite sides of the channel.
Ionic distributions were unbiased using the weighted histogram analysis method (WHAM) (11),with a bin size of 0.01 A and a stringent tolerance of 0.001 kcal/mol on every point in the PMF(tested by comparing PMFs obtained 100 iterations apart to ensure good convergence). Anadditional four 1-ns simulations were generated without a window function to calculate the bulklimit Wbulk(z, r) = "kBT ln ($!bulk(z, r)% /!), where ! is the K+ density far from the channel(30 < |z| < 35 A). Wbulk(z, r) and W (z, r) were matched in the range 25 < |z| < 29 A, forr < 8 A, to set the correct bulk reference for the complete 2D PMF.
To confirm the barrier height in the 2D-PMF with free energy perturbation (FEP), a totalof 11 windows with coupling parameter " ranging from 0 to 1 was used in the FEP calculation,with the ion and water (and their hybrids) held at their z values with a harmonic force constantof 10 kcal/mol, and held on axis by a flat-bottom potential acting outside 0.5 A with forceconstant 10 kcal/mol. WHAM was then used to give the total free energy change "Gex for theperturbation (12). The local density of water at the center of the channel (at z = 0), calculatedfrom an analysis of 80 ns of trajectory sampled with 0.5 and 1.0 A side boxes, is 7.5-fold largerthan in the bulk (at z = 30). The calculated free energy for exchanging an ion in the bulk witha water at the origin ("Gex of Eq. 3 of article) was 9.8 ± 0.1 kcal/mol, whereas the increase in
1
water density inside the channel corresponds to 1.2 ± 0.3 kcal/mol, leading to an estimated freeenergy W(r) !W(r!) of 8.6 ± 0.4 kcal/mol that can be compared to that obtained from the 2DPMF.
Calculations of the charging free energy of a K+ in a simple model single-file column of waterused a model where a K+ is fixed at the origin with four water molecules on each side heldinside a cylindrical tube created by a flat-bottom harmonic potential of radius 0.25 A and forceconstant 1000 kcal/mol/A2; planar restraints were placed at z = ±12.5 A with force constant100 kcal/mol/A2. The e!ect of a cavity reaction field arising from a continuum dielectric of 78.4(corresponding to bulk water) outside a radius 15.3 A was considered. The FEP calculations werecarried out with the non-polarizable TIP3P water model (4) as well as the recently developedpolarizable water model SWM4-DP (13) based on Drude oscillators. For all systems, the freeenergy for charging the K+ was calculated using forward and backward FEP simulations, for atotal of more than 2.2 ns.
To test the extent of the e!ect of polarizability of the phospholipid hydrocarbon tails on thestability of the ion, we carried out energy calculations on coordinates from a simulation of anenlarged fully atomic system with 96 DMPC molecules and a total of 24,037 atoms, following1 ns of simulation with a K+ ion held at the channel center (z = 0). The total energy of thenonpolarizable system was computed with particle mesh Ewald (PME) electrostatics with the ionat the center of the channel, relative to the bulk (z = 20 A). This was then repeated with Drudeoscillators on the carbon atoms of the lipid hydrocarbon chains, similar to the polarizable watersimulations with the SWM4-DP water model. The polarizability for the carbon atom was set to1.0 A3. The influence of induced polarizability was calculated according to a self-consistent field(SCF) procedure (i.e., by energy minimizing the position of the Drude oscillators while the realatoms are fixed). The change in the stabilization of the ion, due to lipid polarizability, was foundto be !3.6 ± 0.3 kcal/mol. This result can be compared with the value obtained by raising thedielectric constant from 1 to 2 with Poisson solutions (!2.1 kcal/mol). This finding demonstratesthat the continuum electrostatics approximation captures the e!ect of the polarizability but mayunderestimate its magnitude.
The Single-file Water Dipole and the Transmembrane Potential. The total PMF Wtot(z)used in the Nernst Planck equation of the paper can be expressed rigorously as a sum of theequilibrium PMF W (z), dominated by local molecular interactions in the absence of any trans-membrane potential, and the interaction of all atomic charges qi, at positions zi, in the pore regionwith the scalar potential !mp arising from a very small ionic charge imbalance widely distributedat the membrane solution interface (14)
Wtot(z) = W (z)! kBT ln!e"
"iqi!mp(zi)/kBT
#, [1]
where z is the location of the ion and the brackets represent an average over the equilibriumdistribution. Following a cumulant expansion this becomes (14)
Wtot(z) " W (z) + qion!mp(z) + #"µ(z)$ d
dz!mp !
1
2kBT
!"µ2(z)
# $d
dz!mp
%2
, [2]
where "µ(z) is the deviation from the mean value of the dipole moment of the pore system as afunction of the position of the ion. Thus, a conductance calculation is complicated by the couplingof the dipole to the membrane potential, with the linear term in "µ(z) influencing the flow of ionsand the quadratic term creating an additional barrier as a consequence of the bimodal nature ofthe dipole distribution in the bulk.
2
Poisson Boltzmann (PB) solutions, together with histograms of the dipole moment of thesingle-file water column (and assuming the protein dipole contribution is negligible as a firstapproximation), obtained from biased trajectories, are used to estimate these perturbations to theequilibrium PMF. The function !mp is calculated from the modified PB equation (14), given by
! · ["(r)!!mp(r)]" #2(r) [!mp(r)" VmpH(r)] = 0, [3]
where "(r) is the space-dependent dielectric constant, #(r) is the space-dependent Debye screeningfactor, Vmp is the potential di!erence applied across the membrane, H(r) is a step-function that is1 on one side of the membrane and 0 everywhere else. This equation is solved for an MD-averagedgA structure in a 25-A membrane slab of dielectric constant 2, using 1 M KCl salt in the bulkregions with dielectric constant 80. The charge distribution within the pore region is representedby the expansion in the dipole moment, dominated by the single-file water column, in Eq. 2, andthus the dielectric constant is set to 1 inside the protein and channel regions.
Figure 5A shows the membrane potential term qion!mp of Eq. 2, increasing linearly across thechannel. Figure 5B shows the first correction of Eq. 2 (due to the linear term in the dipole of thesingle file column), and Fig. 5C the second correction (due to the quadratic term in the dipolemoment). For example, when 100 mV is applied across the membrane (solid curves in Fig. 5),the linear and quadratic dipole corrections are of maximum amplitude 0.15 and 0.04 kcal/mol,respectively. For an applied voltage of 250 mV (dashed curves) these corrections are of maximumamplitude 0.35 and 0.25 kcal/mol, respectively. Therefore, as the voltage applied across themembrane is increased, these corrections can have considerable e!ect on the conductance.
Ion Di!usion Profile. The space-dependent di!usion coe"cient D(z) is extracted from theLaplace transform of the velocity correlation function of the velocity, using an analysis based onthe generalized Langevin equation for a harmonic oscillator. For each window simulation, wecalculate the following function (15)
D(z) = lims!0
"C(s; z) #$z2$(i) #z2$(i)C(s; z)
!s #$z2$(i) + #z2$(i) /s
"" #$z2$(i) #z2$(i)
, [4]
where C(t; z) is the velocity autocorrelation function for the ion at position z, and C(s; z) is theLaplace transform of this function. To estimate the value of the limit as s % 0, we linearlyextrapolate from the range 15& s &35. Figure 6 shows the axial ion di!usion coe"cient of theion as a function of its position.
Single Ion Dissociation Constant. The equilibrium single ion dissociation constant KD canbe expressed in terms of the three-dimensional single ion PMF, W(r), as (14)
K"1D =
#drHsite(r) e"W(r)/kBT
e"W(r!)/kBT. [5]
where r# is a chosen reference ion position, kB is the Boltzmann constant, T is the temperature andthe binding site is defined by the Heaviside step function Hsite(r), which is 1 inside the bindingsite and 0 outside. KD may also be expressed in terms of the 1D PMF, W (z), which can beobtained by integrating over the allowed lateral displacements in xy-space. Because we impose acylindrical restraint (a flat-bottom steep harmonic well of radius R) during simulations, such thatthe xy coordinates are always bounded, W (z) is given by
e"W (z)/kBT = C$
dx dy Hcyl(x, y) e"W(x,y,z)/kBT , [6]
3
where C is a constant and
Hcyl(x, y) =
!1;
!x2 + y2 " R
0;!
x2 + y2 > R. [7]
We define the 1D PMF to be zero in the bulk at z = 30 A, such that the constant C in Eq. 6 is
C =1
"dx dy Hcyl(x, y) e!W(x,y,30)/kBT
. [8]
Because W is independent of x and y at z = 30 A, W(x, y, 30) =W(0, 0, 30) and thus
C =e+W(0,0,30)/kBT
!R2. [9]
which can be inserted into Eq.6 to give
e!W (z)/kBT =1
!R2
#dx dy Hcyl(x, y) e![W(x,y,z)!W(0,0,30)]/kBT , [10]
Now, if we define the binding site within the range zmin " z " zmax in the axial direction
Hsite(r) = hsite(z) Hcyl(x, y), [11]
where
hsite(z) =
$%&
%'
1; zmin " z " zmax
0; z < zmin
0; z > zmax
, [12]
then Eq.5 becomes
K!1D =
#dx dy dzHsite(x, y, z) e![W(x,y,z)!W(0,0,30)]/kBT [13]
=#
dz hsite(z)#
dx dy Hcyl(x, y) e![W(x,y,z)!W(0,0,30)]/kBT . [14]
Using Eq. 10, the coe!cient in front of the integral for K!1D becomes the accessible cross sectional
area of the ion in the bulk region, equal to the area of the restraining cylinder !R2, applied duringsimulations (!82 = 201 A2)
K!1D = !R2
#dz hsite(z)e!W (z)/kBT [15]
= !R2# zmax
zmin
dz e!W (z)/kBT . [16]
Two-dimensional Histograms and PMFs. Distributions, biased in z, involving some sec-ondary variable s (such as solvation number or dipole moment of the single file water column),"bias(z, s), may be unbiased to produce additional 2D PMFs W (z, s). We obtained the conditionalprobability "(s; z) (the probability of having variable s, given the ion is at position z) from the his-togram of biased density. The unbiased distributions, which are related to the biased distributionsvia the WHAM equations, obey a similar relation and the 2D PMF becomes
W (z, s) = W (z)# kBT ln $"(s; z)%+ C, [17]
4
where C is a constant. Fig. 7 shows the 2D histogram of the ion hydration number (water oxygenatoms within 3.6 A) as a function of coordinate z, from which the 2D PMF W (z, n) shown inFig. 3 was calculated. The ion is solvated by 6–7 waters in the bulk electrolyte, as is also seenin the 2D PMF W (z, n). Dehydration occurs gradually as this number drops to just 2 inside thesingle-file column within the channel.
The 2D histogram P (z, n) of Fig. 7 was formed for |z| in 0.5 A blocks and 0 ! n ! 10, wheren is the discrete number of water molecules residing within 3.6 A of the K+ ion. This distributionwas then interpolated onto a 0.1 A grid. Before calculation of the 2D PMF W (z, n), the histogramP (z, n) was symmetrized with respect to the origin z = 0, and smoothed with a Gaussian filter inthe z direction only (with standard deviation 0.5 A).
The distribution of the dipole moment of the single-file water molecules (Fig. 4A of the article),as a function of ion position z, was calculated by considering the net dipole of all water moleculesinside a radius 14 A sphere, with respect to the center of mass of the gA dimer. The histogramwas calculated by interpolating onto a 0.1 A grid, and discretizing dipole moments on a 1 D grid.Before calculation of the 2D PMF W (z, µ) (Fig. 4B of the article) the histogram P (z, µ) wasantisymmetrized, with respect to the origin z = 0, and Gaussian smoothing was applied in the zdirection only (with standard deviation 0.5 A).
References
1. Brooks, B. R., Bruccoleri, R. E., Olafson, B. D., States, D. J., Swaminathan, S., & Karplus,M. (1983) J. Comput. Chem. 4, 187–217.
2. Schlenkrich, M., Brickmann, J., MacKerell, A. J., & Karplus, M. (1996) in Biological Mem-branes. A molecular perspective from computation and experiment, eds. Merz, K. & Roux, B.(Birkhauser, Boston), pp. 31–81.
3. MacKerell-Jr, A. D., Bashford, D., Bellot, M., Dunbrack, R. L., Evanseck, J. D., Field, M. J.,Fischer, S., Gao, J., Guo, H., Ha, S., Joseph-McCarthy, D., Kuchnir, L., Kuczera, K., Lau,F. T. K., Mattos, C., Michnick, S., Ngo, T., Nguyen, D. T., Prodhom, B., Reiher-III, W. E.,Roux, B., Schlenkrich, B., Smith, J., Stote, R., Straub, J., Watanabe, M., Wiorkiewicz-Kuczera, J., & Karplus, M. (1998) J. Phys. Chems. B 102, 3586–3616.
4. Jorgensen, W. L., Chandrasekhar, J., Madura, J. D., Impey, R. W., & Klein, M. L. (1983) J.Chem. Phys. 79, 926–935.
5. Darden, T., York, D., & Pedersen, L. (1993) J. Chem. Phys. 98, 10089–10092.
6. Ryckaert, J. P., Ciccotti, G., & Berendsen, H. J. C. (1977) J. Comp. Chem. 23, 327–341.
7. Feller, S. E., Zhang, Y. H., Pastor, R. W., & Brooks, B. R. (1995) Journal of ChemicalPhysics 103, 4613–4621.
8. Allen, T. W., Andersen, O. S., & Roux, B. (2003) J. Am. Chem. Soc. 125, 9868–9877.
9. Townsley, L. E., Tucker, W. A., Sham, S., & Hinton, J. F. (2001) Biochemistry 40, 11676–11686.
10. Woolf, T. & Roux, B. (1996) PROT. Struc. Funct. Gen. 24, 92–114.
5
11. Kumar, S., Bouzida, D., Swendsen, R. H., Kollman, P. A., & Rosenberg, J. M. (1992) J.Comp. Chem. 13, 1011–1021.
12. Souaille, M. & Roux, B. (2001) Comp. Phys. Comm.
13. Lamoureux, G., MacKerell, A. D., & Roux, B. (2003) J. Chem. Phys. 119, 5185-5197.
14. Roux, B. (1999) Biophysical Journal 77, 139–153.
15. Crouzy, S., Woolf, T., & Roux, B. (1994) Biophys. J. 67, 1370–1386.
6
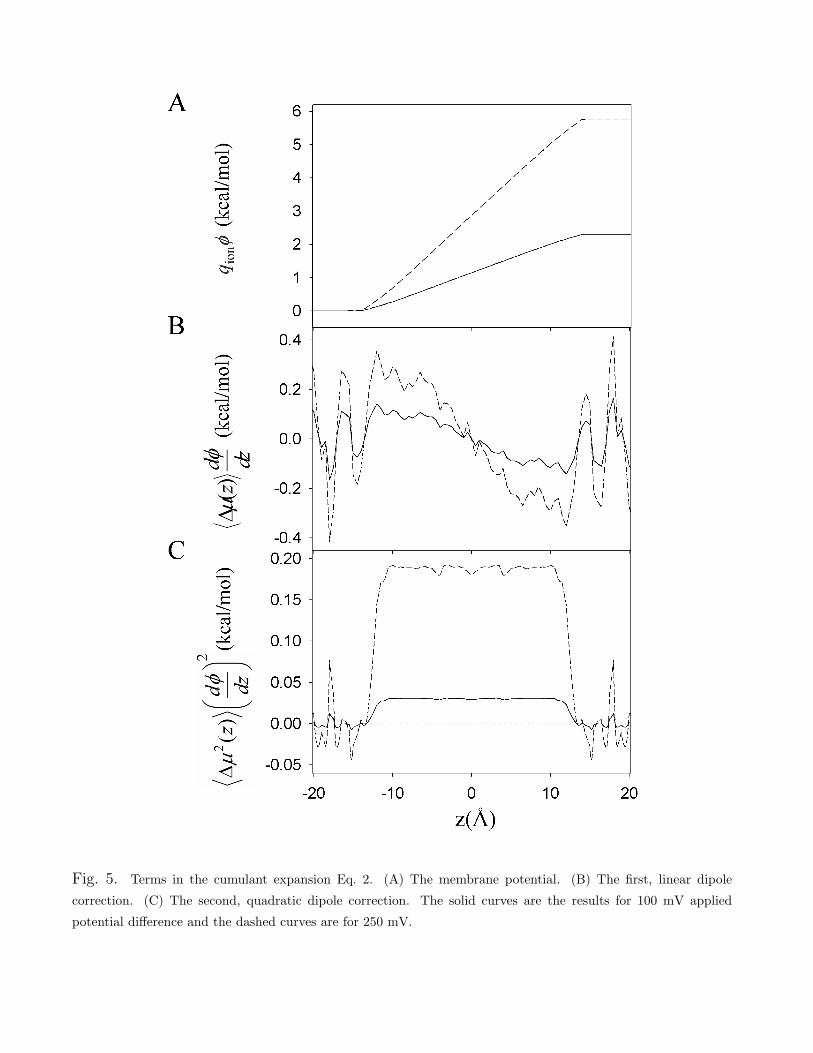
Fig. 5. Terms in the cumulant expansion Eq. 2. (A) The membrane potential. (B) The first, linear dipolecorrection. (C) The second, quadratic dipole correction. The solid curves are the results for 100 mV appliedpotential di!erence and the dashed curves are for 250 mV.
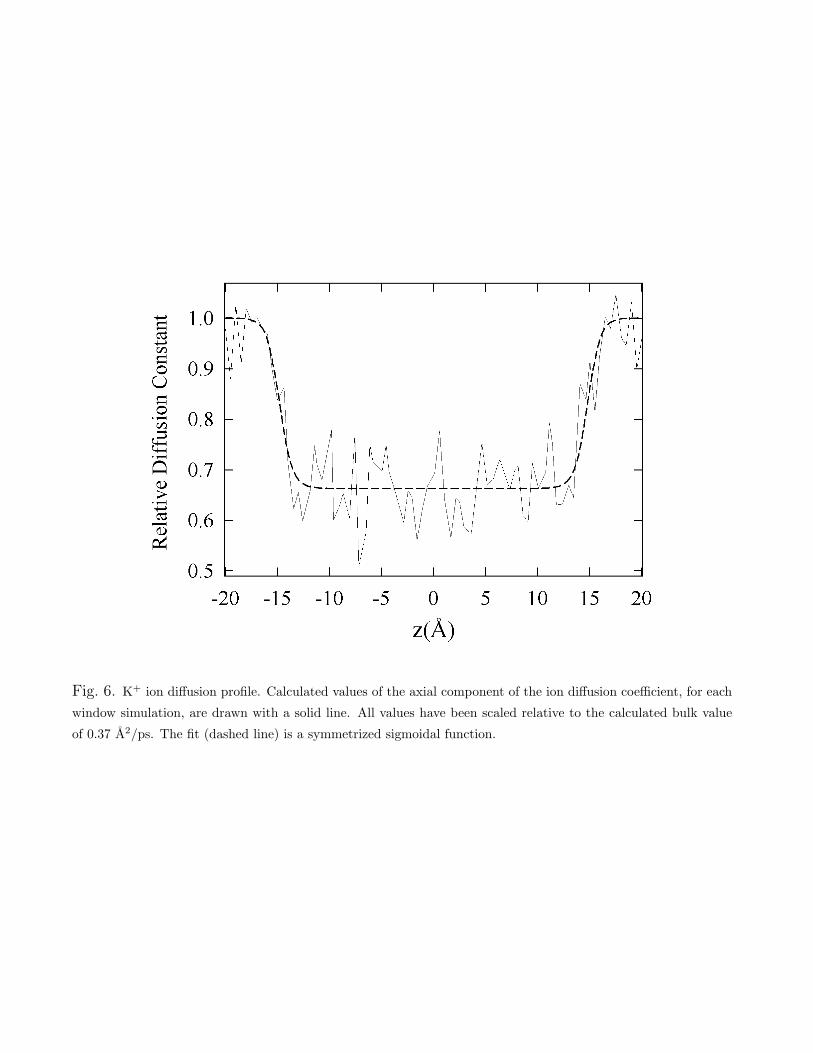
Fig. 6. K+ ion di!usion profile. Calculated values of the axial component of the ion di!usion coe"cient, for eachwindow simulation, are drawn with a solid line. All values have been scaled relative to the calculated bulk valueof 0.37 A2/ps. The fit (dashed line) is a symmetrized sigmoidal function.
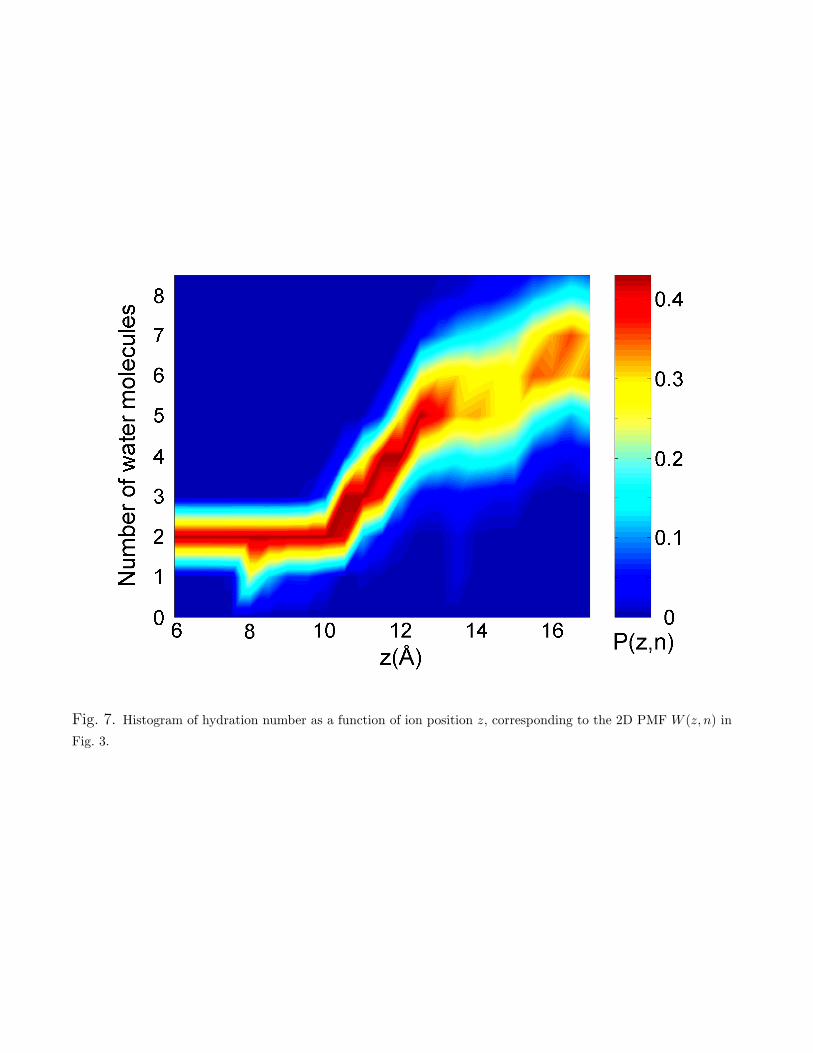
Fig. 7. Histogram of hydration number as a function of ion position z, corresponding to the 2D PMF W (z, n) inFig. 3.